Verdict : le Galaxy Book6 Pro est un bon ordinateur portable, mais aussi coûteux
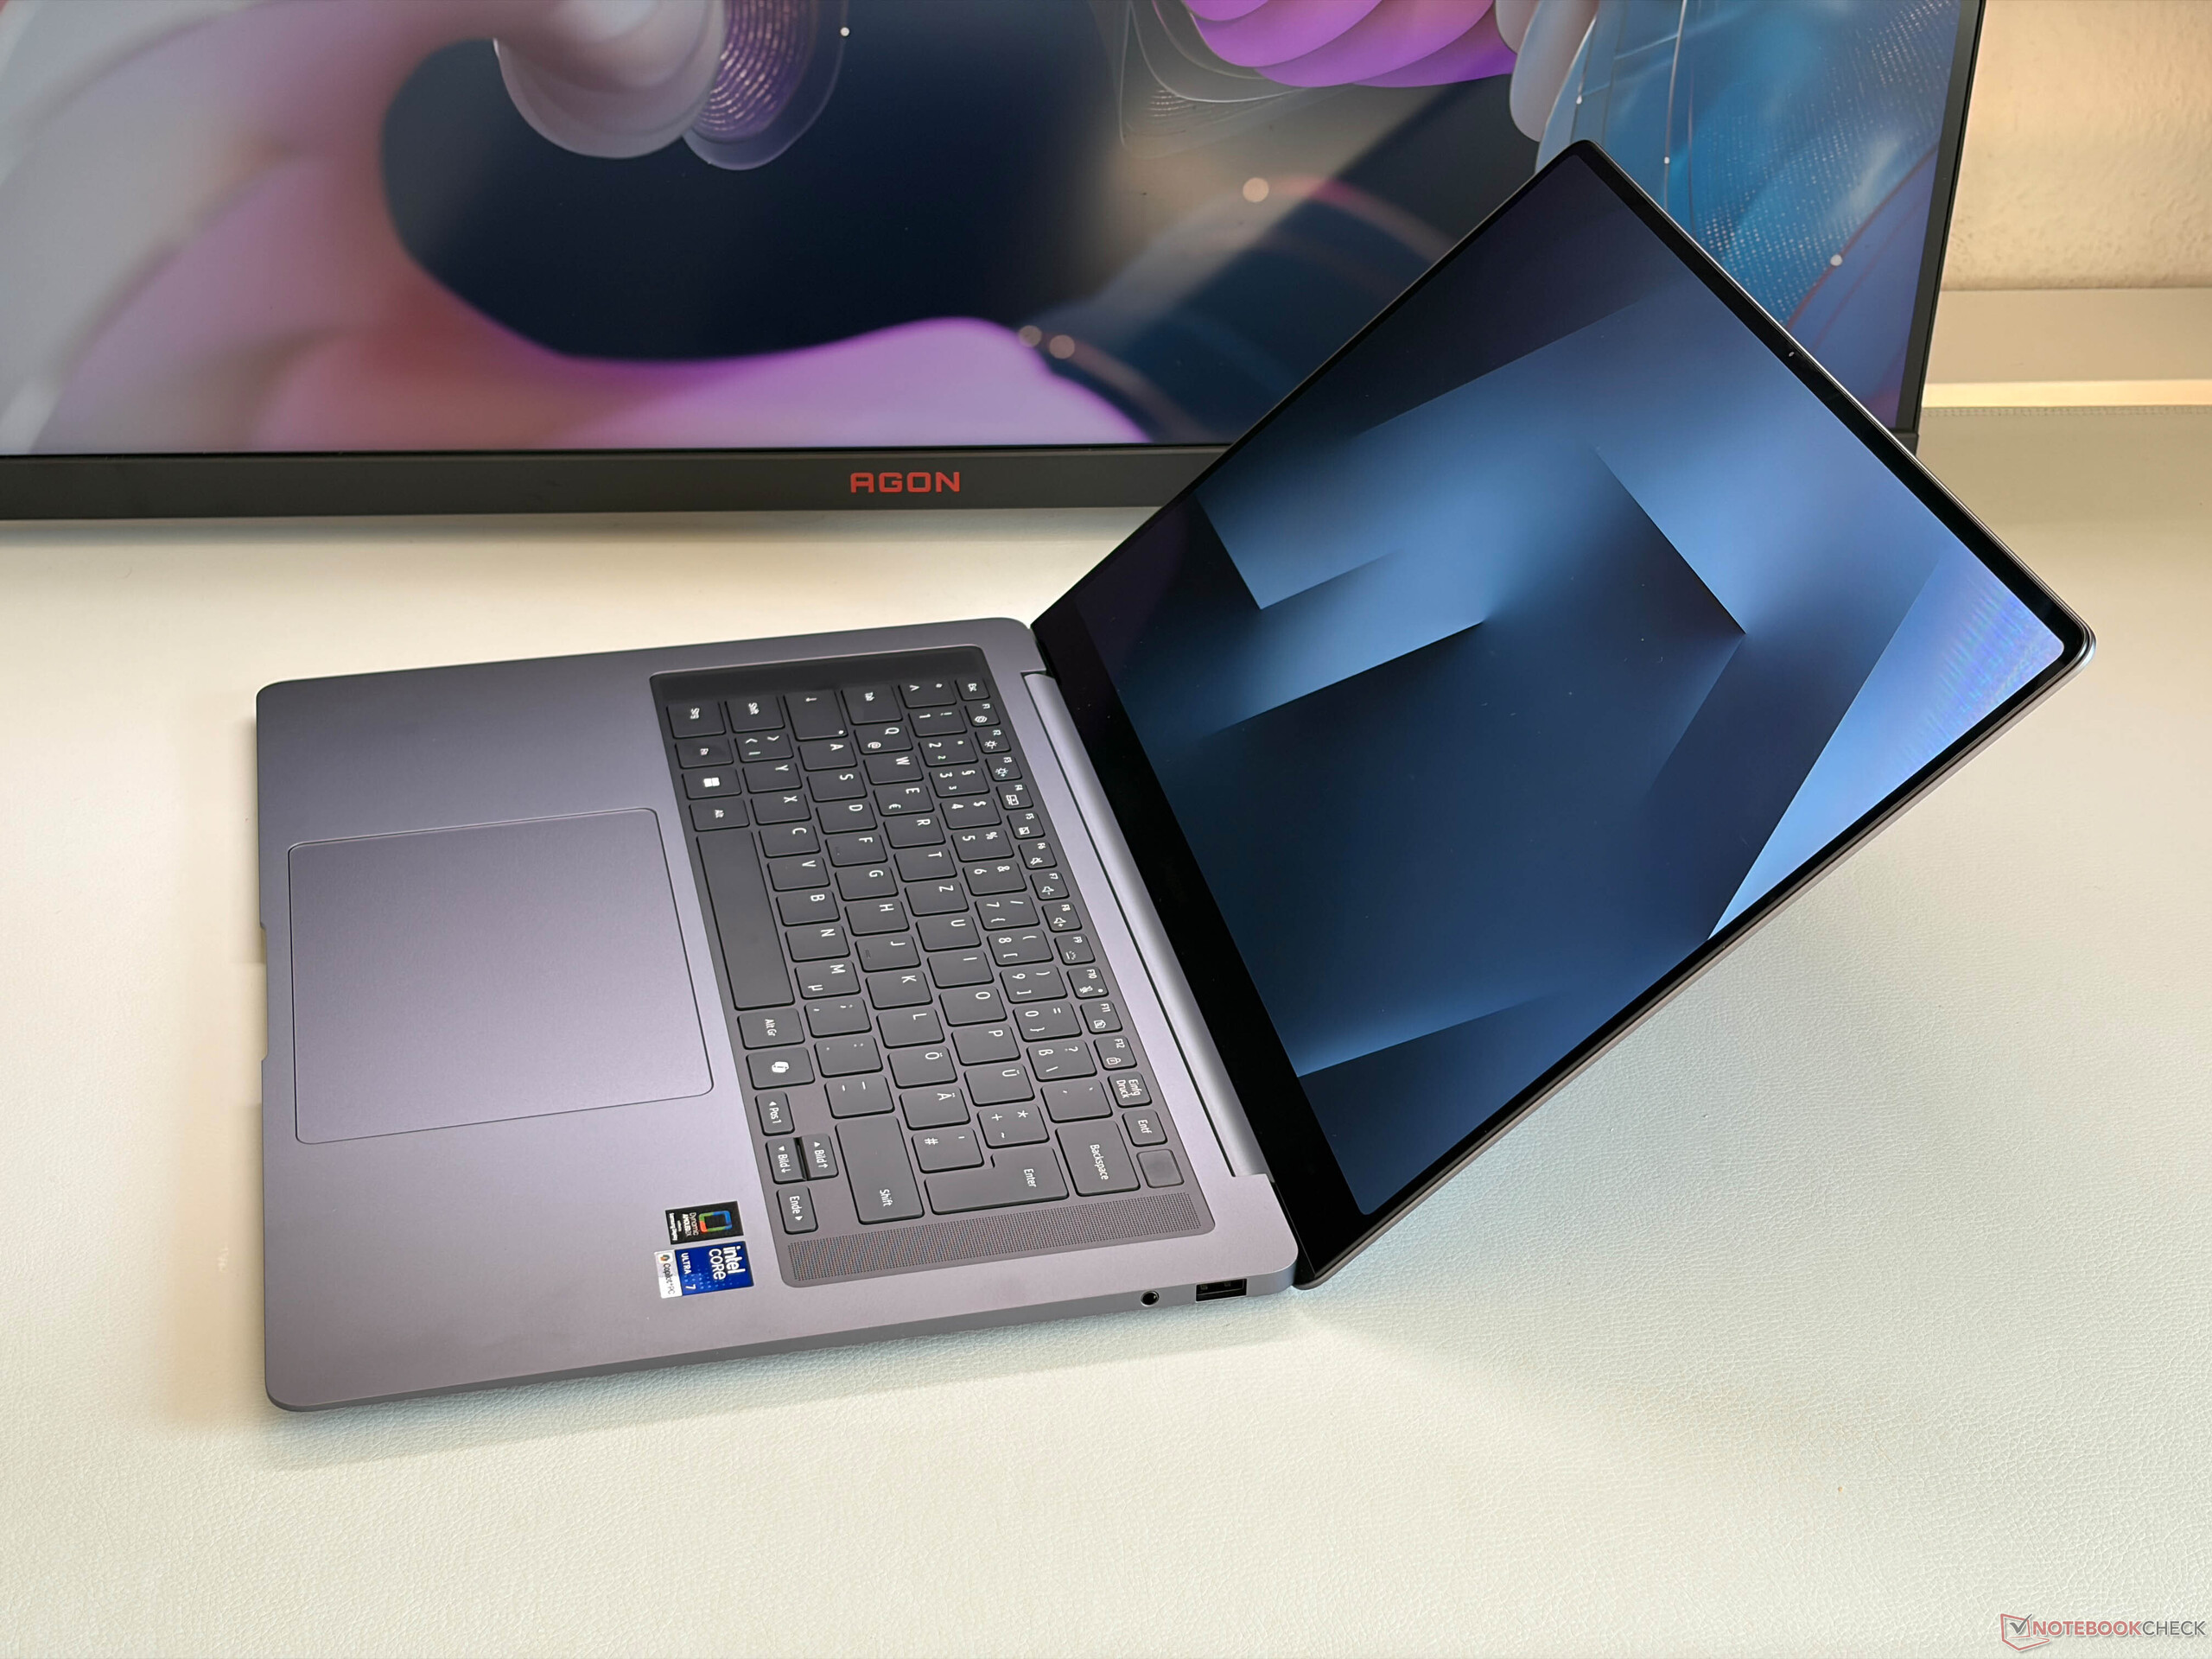
Samsung utilise enfin des écrans OLED plus lumineux pour le nouveau Galaxy Book6 Pro et le nouvel écran tactile 120 Hz avec une luminosité maximale de 1200 nits offre une superbe qualité d'image. Le seul inconvénient est le scintillement PWM constant, les utilisateurs sensibles devraient donc l'essayer d'abord. Vous bénéficiez également des nouveaux processeurs Panther Lake d'Intel, mais notre unité de test n'utilise que le Core Ultra 7 356H avec l'iGPU lent, ce qui est assez lent. Il est suffisant pour les tâches quotidiennes, y compris le streaming vidéo, mais si vous voulez jouer à des jeux, nous recommandons le SKU avec le Core Ultra X7.
Le châssis en aluminium est une fois de plus très élégant et stable et la sélection de ports est suffisante, mais Samsung a supprimé le lecteur de cartes. Les ventilateurs sont silencieux, les températures sont basses et l'autonomie de la batterie est très bonne, même si certains rivaux avec des écrans inférieurs, comme le Dell XPS 16 que nous avons testé, offrent plus d'endurance. Nous apprécions également les nouveaux dispositifs de saisie avec le trackpad haptique, mais Samsung a supprimé le pavé numérique dédié.
Le gros problème ici est le prix, car notre unité est vendue 2099 $, sans compter le processeur Core Ultra X7 plus rapide avec l'iGPU Arc B390 Arc B390 iGPU. Dans l'ensemble, le nouveau Galaxy Book6 Pro est un bon paquet global, mais cher, pour une utilisation quotidienne.
Points positifs
Points négatifs
Prix et disponibilité
Vous pouvez commander le nouveau Galaxy Book6 Pro directement auprès de Samsung à partir de 2099 $.
Table des matières
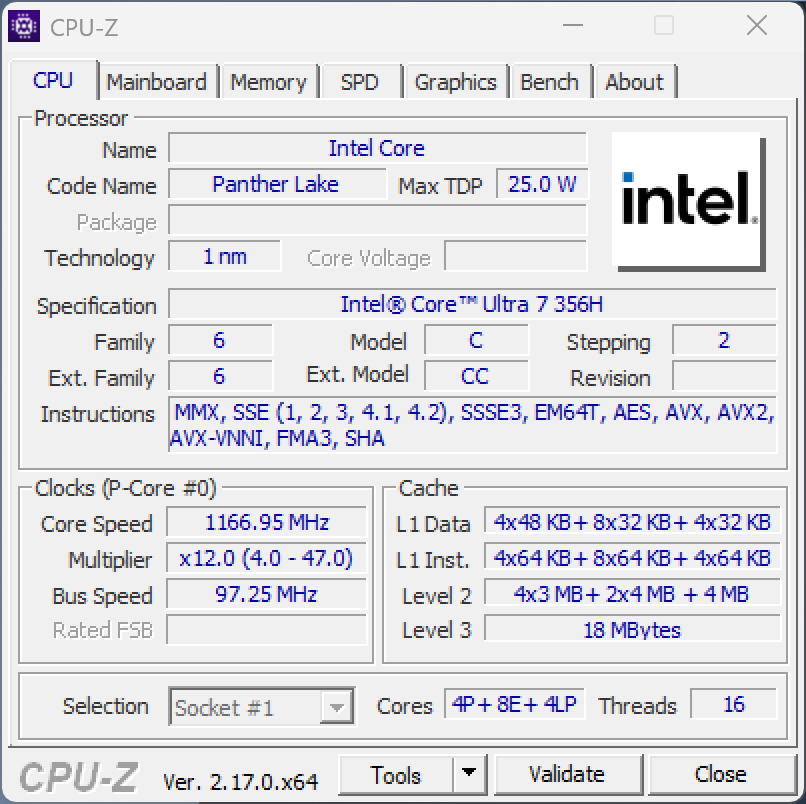
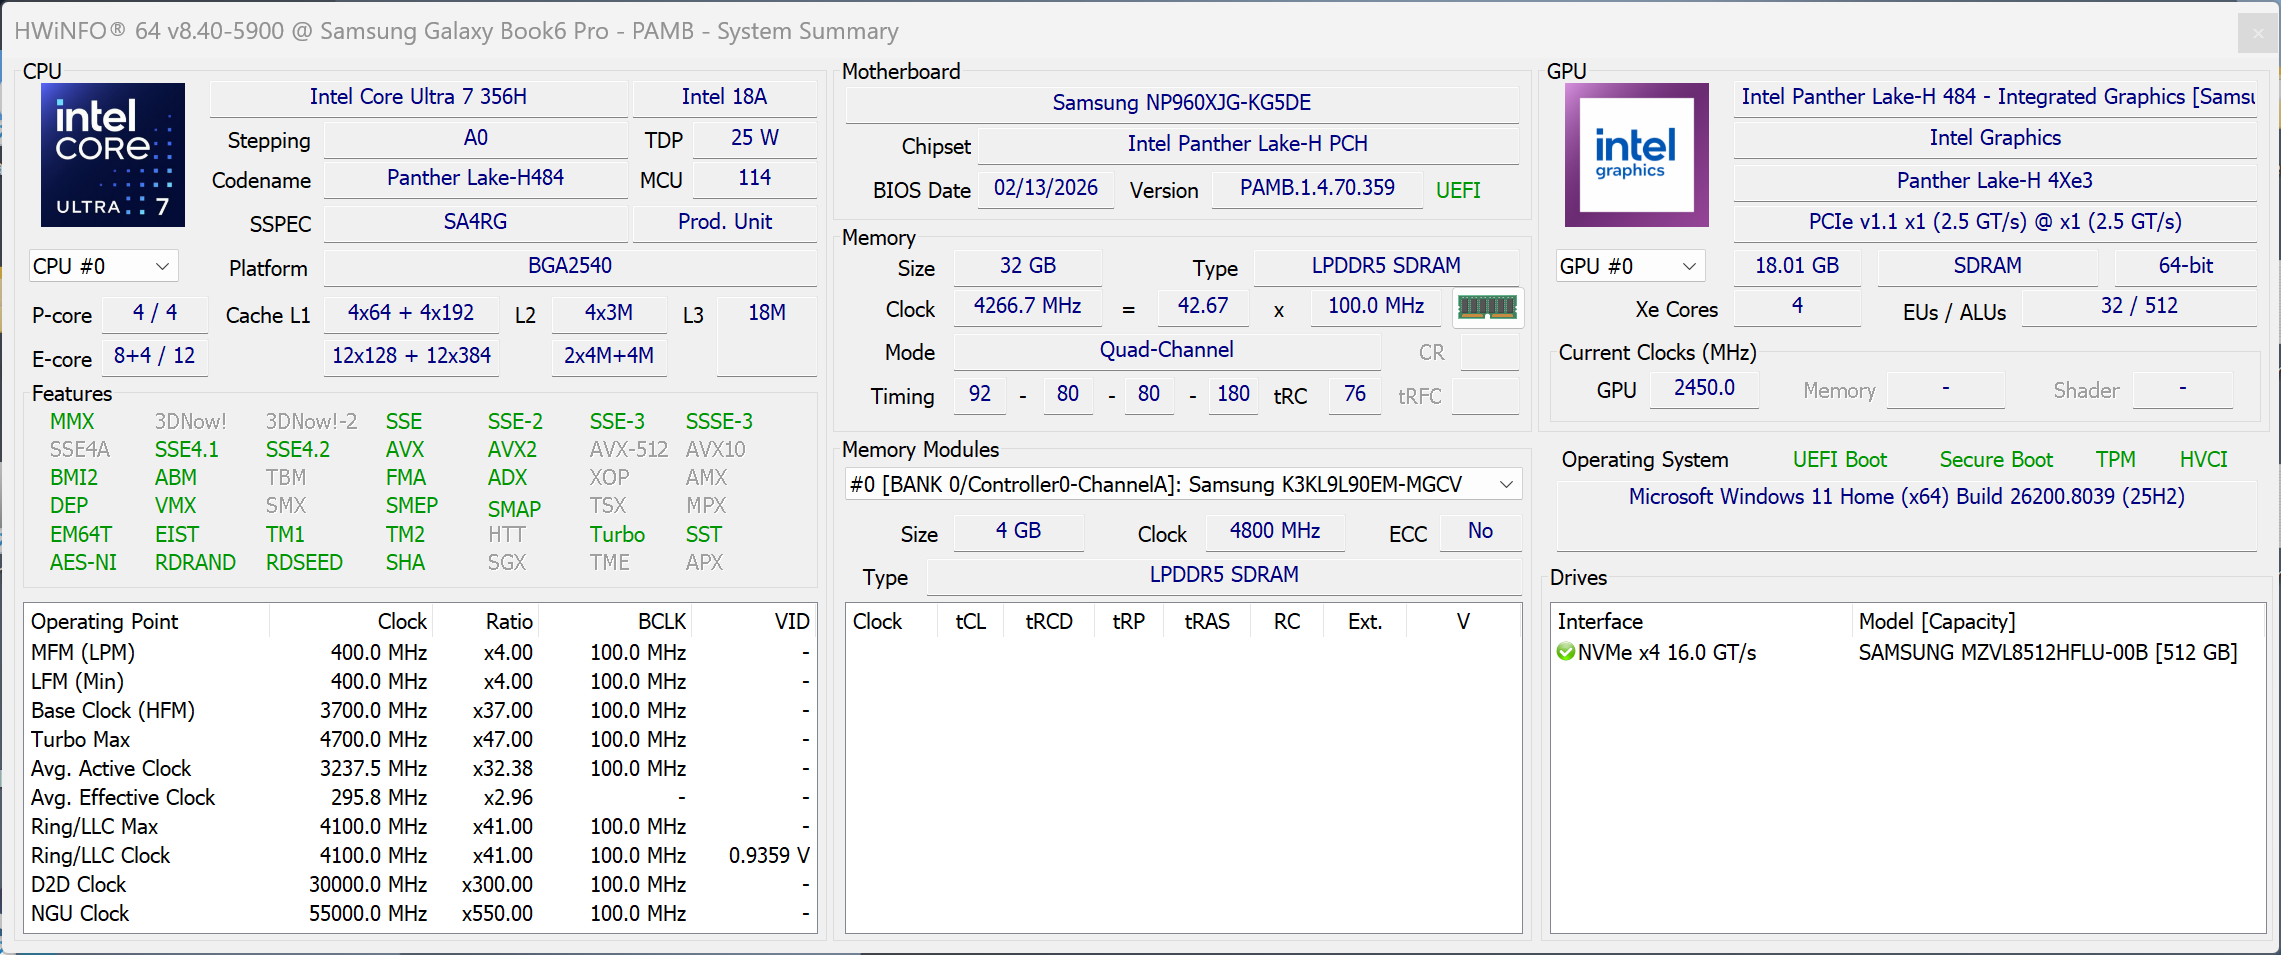
Samsung a rafraîchi ses modèles Galaxy Book6 Pro et utilise désormais la dernière génération de processeurs Panther Lake d'Intel ainsi que des écrans OLED mis à jour. Nous examinons le nouveau modèle 16 pouces avec le Core Ultra 7 356H associé à l'Intel Graphics iGPU standard (4 cœurs Xe ), 32 Go de RAM ainsi qu'un SSD de 512 Go. Le modèle de détail à 2049 $ dispose d'un SSD plus grand de 1 TB, les autres spécifications sont identiques à notre unité de test.
Spécifications
Boîtier et connectivité
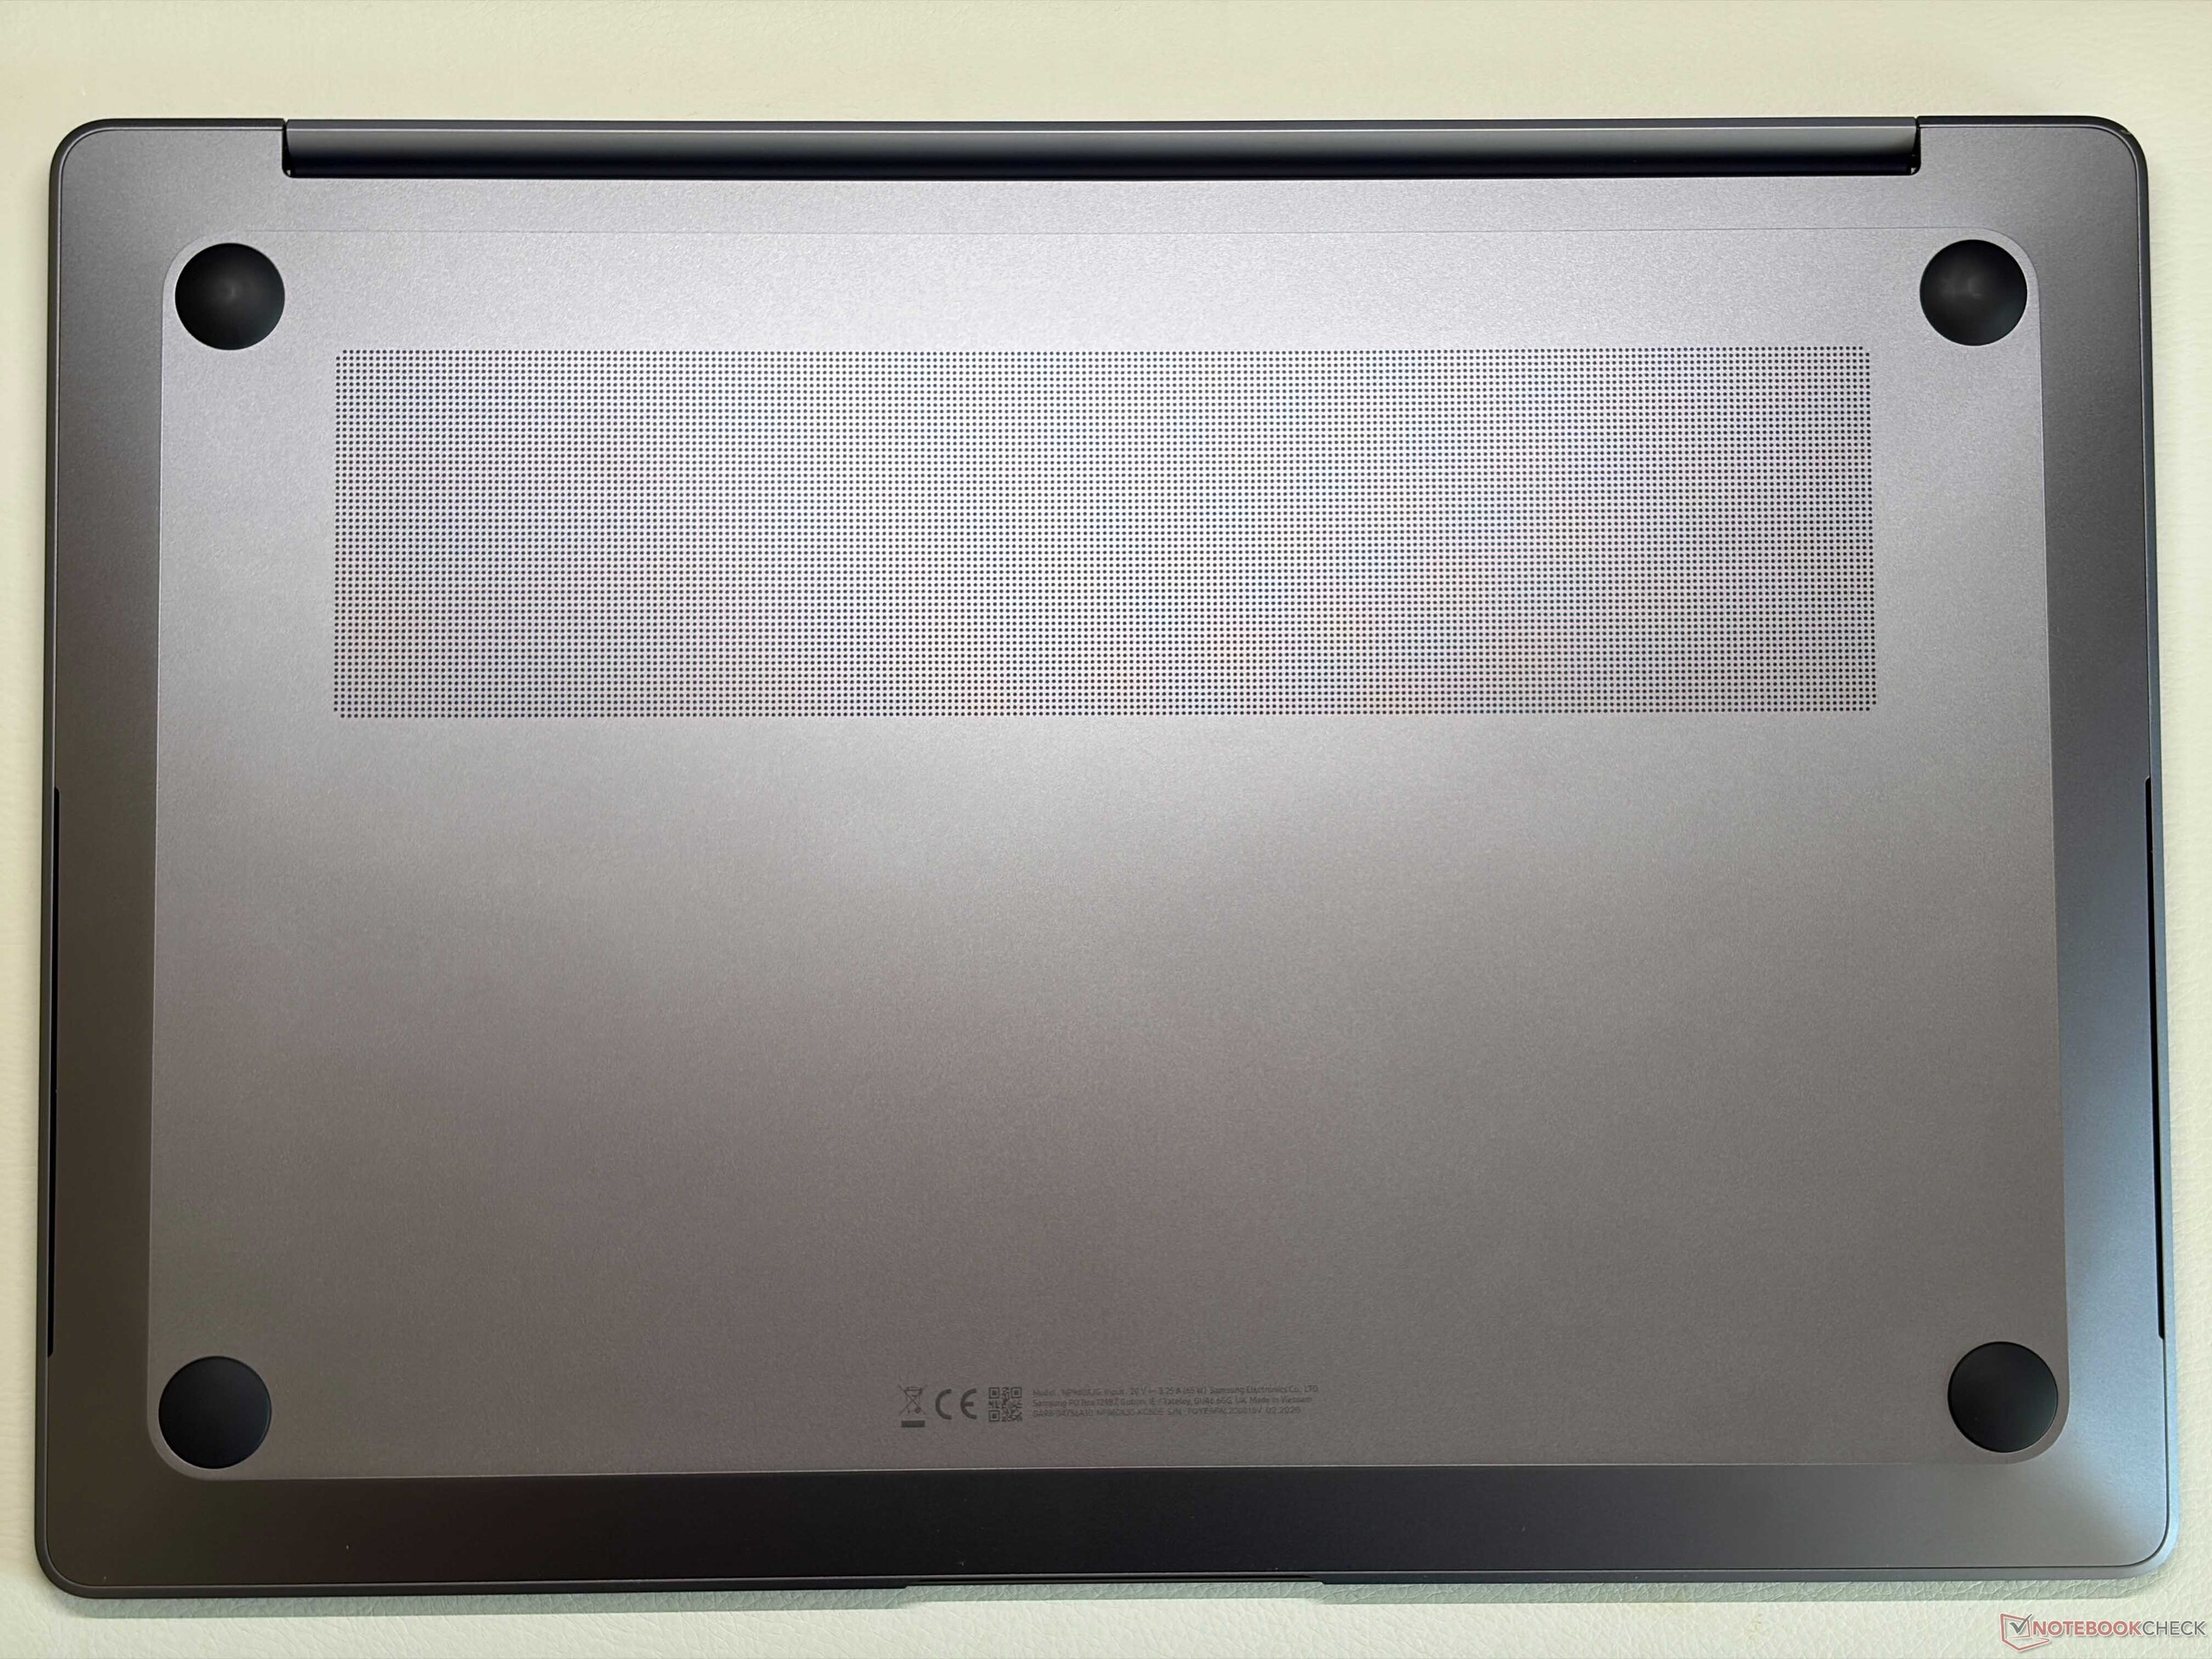
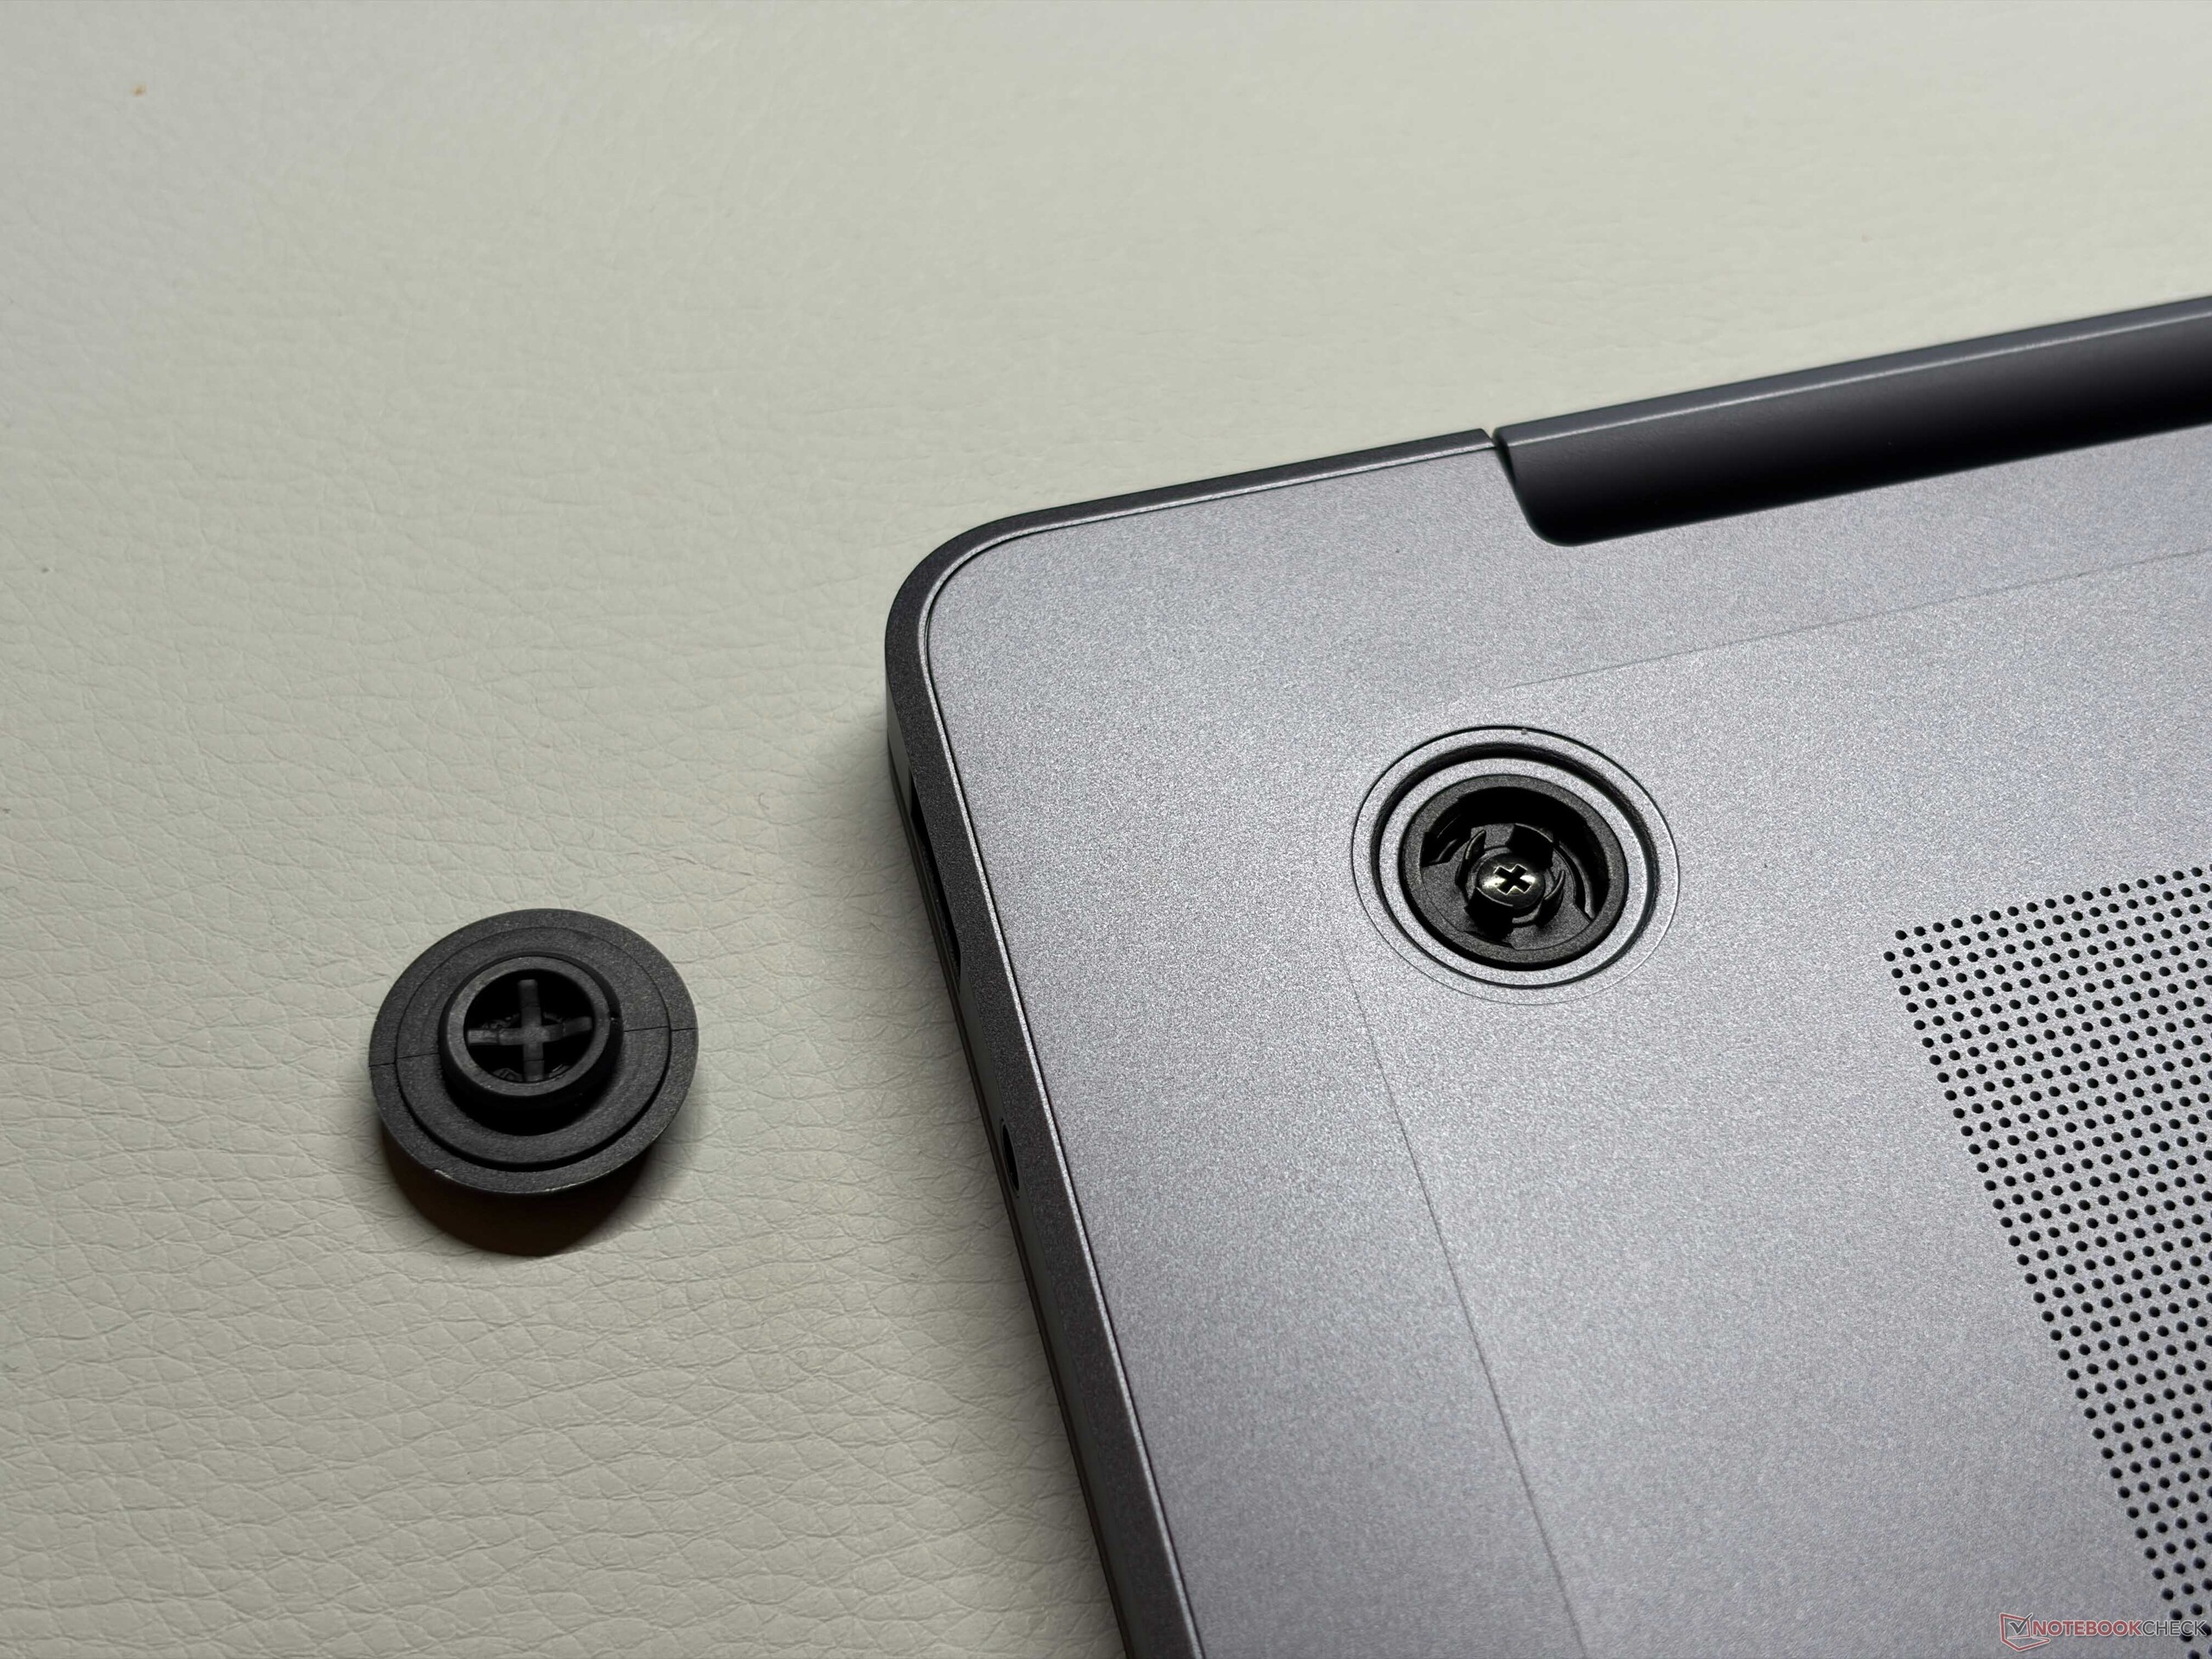
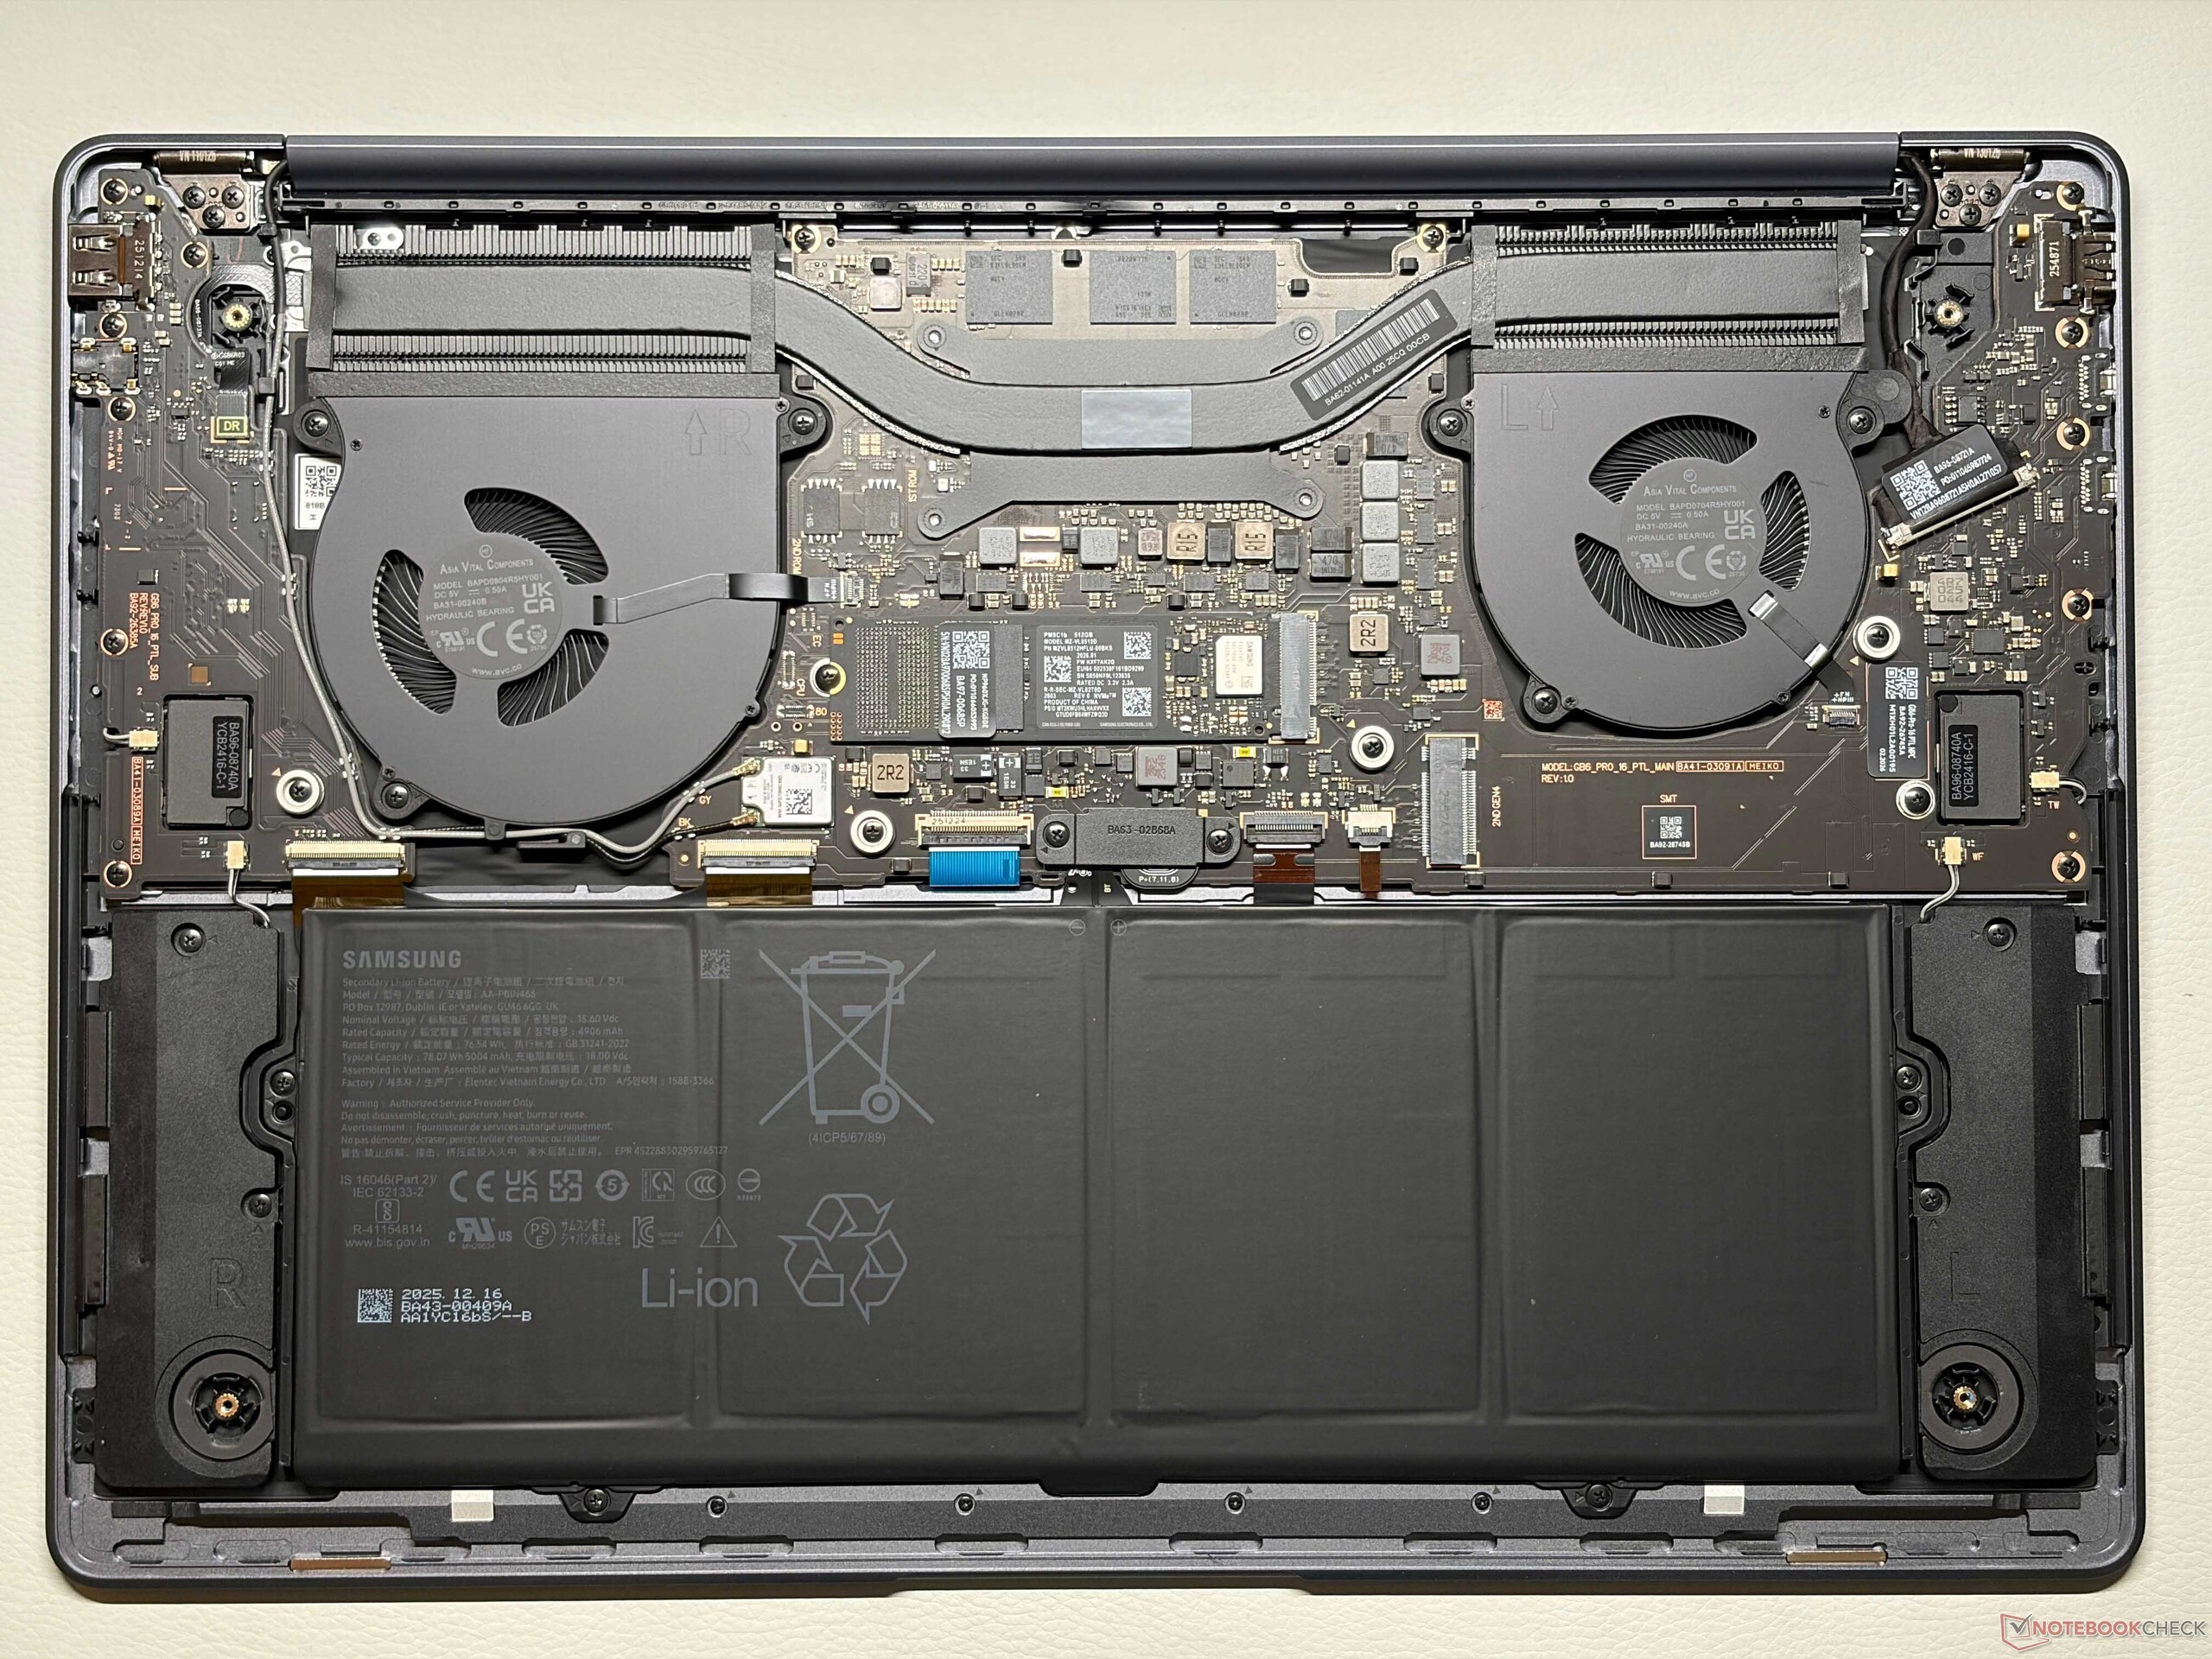
Le design du châssis est pratiquement identique à celui du modèle précédent, ce qui signifie que vous obtenez à nouveau un ordinateur portable 16 pouces élégant avec un châssis en aluminium de haute qualité. La couleur argentée n'attire pas vraiment les traces de doigts et la stabilité est excellente. Le cadre inférieur est à nouveau très épais et le nouveau design du clavier ainsi que le logo Samsung réorganisé sur le couvercle sont les deux seuls changements visibles. La disposition interne a également été légèrement modifiée, mais vous disposez toujours de deux emplacements pour SSD M.2-2280, tous les autres composants étant intégrés.
En termes de connectivité, vous disposez toujours du Thunderbolt 4 et d'un port USB-A classique, mais le lecteur de carte microSD a disparu. Le module Wi-Fi prend désormais en charge la nouvelle norme Wi-Fi 7 et nous avons déterminé des taux de transfert allant jusqu'à 4,5 Gbps. La webcam 1080p n'a pas changé.


| Networking | |
| Samsung Galaxy Book6 Pro | |
| iperf3 transmit AXE11000 | |
| iperf3 receive AXE11000 | |
| iperf3 transmit RT-BE96U WiFi7 | |
| iperf3 receive RT-BE96U WiFi7 | |
| Dell XPS 16 Core Ultra 5 325 | |
| iperf3 transmit AXE11000 | |
| iperf3 receive AXE11000 | |
| iperf3 transmit AXE11000 6GHz | |
| iperf3 receive AXE11000 6GHz | |
| Asus ZenBook S16 UM5606GA | |
| iperf3 transmit AXE11000 | |
| iperf3 receive AXE11000 | |
| Apple MacBook Air 15 M5 | |
| iperf3 transmit AXE11000 | |
| iperf3 receive AXE11000 | |
| Microsoft Surface Laptop 7 15 Lunar Lake | |
| iperf3 transmit AXE11000 | |
| iperf3 receive AXE11000 | |
| Lenovo ThinkPad X9-15 Aura Edition | |
| iperf3 transmit AXE11000 | |
| iperf3 receive AXE11000 | |


Périphériques d'entrée
Samsung a modifié les périphériques d'entrée et nous avons déjà fait l'expérience du nouveau clavier sur le Galaxy Book6 Ultra. Le pavé numérique dédié a disparu et des haut-parleurs ont été ajoutés à côté du clavier. L'expérience de frappe est correcte et bénéficie d'un retour d'information précis, mais la course des touches est assez faible. Le Zenbook S16 ainsi que le ThinkPad X9 15 offrent des claviers plus confortables. L'énorme trackpad haptique (15 x 10,5 cm) est quant à lui excellent et vous pouvez également utiliser l'écran tactile capacitif pour vos saisies.


Écran - OLED 120 Hz plus lumineux
Samsung utilise un écran tactile OLED plus lumineux pour le Galaxy Book6 Pro et il s'agit exactement du même panneau que celui du Galaxy Book6 Ultra. La qualité subjective de l'image est excellente, avec des couleurs riches et des images nettes, et même les contenus lumineux n'ont pas l'air granuleux. Les mouvements sont fluides grâce à la fréquence de 120 Hz (adaptative entre 30 et 120 Hz) et les temps de réponse sont très rapides, mais il y a un scintillement PWM à 240 Hz à chaque niveau de luminosité avec une grande amplitude, donc les utilisateurs sensibles devraient essayer le panneau d'abord.
Samsung a finalement amélioré la luminosité et nous mesurons 500 nits pour les contenus SDR et jusqu'à 1200 nits pour les contenus HDR (648 nits pour une image complètement blanche). Samsung implémente également des profils de couleurs précis pour P3 ainsi que sRGB dès la sortie de la boîte et notre analyse avec le logiciel professionnel CalMAN montre une excellente précision des couleurs dès la sortie de la boîte, de sorte que l'édition de l'image ne pose aucun problème. Nous n'avons pas pu améliorer davantage la précision avec notre propre étalonnage.
| |||||||||||||||||||||||||
Homogénéité de la luminosité: 97 %
Valeur mesurée au centre, sur batterie: 502 cd/m²
Contraste: ∞:1 (Valeurs des noirs: 0 cd/m²)
ΔE ColorChecker Calman: 1 | ∀{0.5-29.43 Ø4.73}
ΔE Greyscale Calman: 1.8 | ∀{0.09-98 Ø4.98}
85.9% AdobeRGB 1998 (Argyll 3D)
99.9% sRGB (Argyll 3D)
98.3% Display P3 (Argyll 3D)
Gamma: 2.24
CCT: 6435 K
| Samsung Galaxy Book6 Pro ATNA60HR05-0, OLED, 2880x1800, 16", 120 Hz | Dell XPS 16 Core Ultra 5 325 LG Philips 160WUX, IPS, 1920x1200, 16", 120 Hz | Asus ZenBook S16 UM5606GA ATNA60HR07-0, OLED, 2880x1800, 16", 120 Hz | Apple MacBook Air 15 M5 IPS, 2880x1864, 15.3", 60 Hz | Microsoft Surface Laptop 7 15 Lunar Lake LQ150P1JX61, IPS, 2496x1664, 15", 120 Hz | Lenovo ThinkPad X9-15 Aura Edition ATNA53JB01-0, OLED, 2880x1800, 15.3", 120 Hz | Samsung Galaxy Book4 Pro 16 ATNA60CL07-0, OLED, 2880x1800, 16", 120 Hz | |
|---|---|---|---|---|---|---|---|
| Display | -19% | 4% | -1% | 1% | 4% | 5% | |
| Display P3 Coverage (%) | 98.3 | 66.2 -33% | 99.8 2% | 97.5 -1% | 98.1 0% | 100 2% | 99.5 1% |
| sRGB Coverage (%) | 99.9 | 97.4 -3% | 100 0% | 98.3 -2% | 100 0% | 100 0% | 100 0% |
| AdobeRGB 1998 Coverage (%) | 85.9 | 67.7 -21% | 94 9% | 86.3 0% | 87.2 2% | 94.6 10% | 97.5 14% |
| Response Times | -6924% | -37% | -4477% | -4967% | -38% | -46% | |
| Response Time Grey 50% / Grey 80% * (ms) | 0.51 ? | 39.3 ? -7606% | 1.27 ? -149% | 26.9 ? -5175% | 33.4 ? -6449% | 1.46 ? -186% | 0.64 ? -25% |
| Response Time Black / White * (ms) | 0.41 ? | 26 ? -6241% | 0.43 ? -5% | 15.9 ? -3778% | 14.7 ? -3485% | 0.44 ? -7% | 0.68 ? -66% |
| PWM Frequency (Hz) | 240 ? | 960 ? | 1200 ? | 240 ? | |||
| PWM Amplitude * (%) | 100 | 56 44% | 22 78% | ||||
| Screen | -48% | -7% | -42% | 35% | 1% | -2% | |
| Brightness middle (cd/m²) | 502 | 534.6 6% | 465 -7% | 538 7% | 599 19% | 509 1% | 385 -23% |
| Brightness (cd/m²) | 507 | 515 2% | 466 -8% | 521 3% | 590 16% | 508 0% | 391 -23% |
| Brightness Distribution (%) | 97 | 92 -5% | 99 2% | 90 -7% | 93 -4% | 97 0% | 97 0% |
| Black Level * (cd/m²) | 0.26 | 0.44 | 0.4 | 0.01 | |||
| Colorchecker dE 2000 * | 1 | 2.53 -153% | 1 -0% | 2.1 -110% | 0.5 50% | 1.1 -10% | 1.1 -10% |
| Colorchecker dE 2000 max. * | 2.4 | 4.57 -90% | 3 -25% | 4.1 -71% | 0.9 62% | 2.5 -4% | 1.8 25% |
| Greyscale dE 2000 * | 1.8 | 2.7 -50% | 1.9 -6% | 3.1 -72% | 0.6 67% | 1.5 17% | 1.4 22% |
| Gamma | 2.24 98% | 2.32 95% | 2.19 100% | 2.19 100% | 2.16 102% | 2.28 96% | 2.24 98% |
| CCT | 6435 101% | 6860 95% | 6458 101% | 7075 92% | 6543 99% | 6294 103% | 6444 101% |
| Contrast (:1) | 2056 | 1223 | 1498 | 50900 | |||
| Colorchecker dE 2000 calibrated * | 1.26 | 0.7 | |||||
| Moyenne finale (programmes/paramètres) | -2330% /
-1290% | -13% /
-12% | -1507% /
-837% | -1644% /
-884% | -11% /
-8% | -14% /
-8% |
* ... Moindre est la valeur, meilleures sont les performances


Temps de réponse de l'écran
| ↔ Temps de réponse noir à blanc | ||
|---|---|---|
| 0.41 ms ... hausse ↗ et chute ↘ combinées | ↗ 0.2 ms hausse | 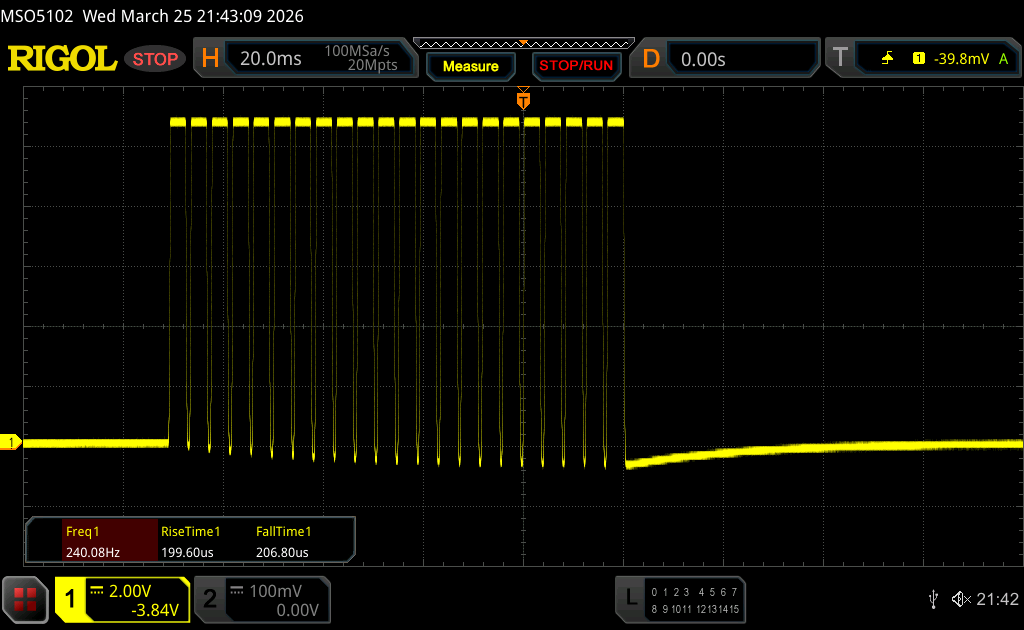 |
| ↘ 0.21 ms chute | ||
| L'écran montre de très faibles temps de réponse, parfait pour le jeu. En comparaison, tous les appareils testés affichent entre 0.1 (minimum) et 240 (maximum) ms. » 0 % des appareils testés affichent de meilleures performances. Cela signifie que les latences relevées sont meilleures que la moyenne (19.9 ms) de tous les appareils testés. | ||
| ↔ Temps de réponse gris 50% à gris 80% | ||
| 0.51 ms ... hausse ↗ et chute ↘ combinées | ↗ 0.25 ms hausse | 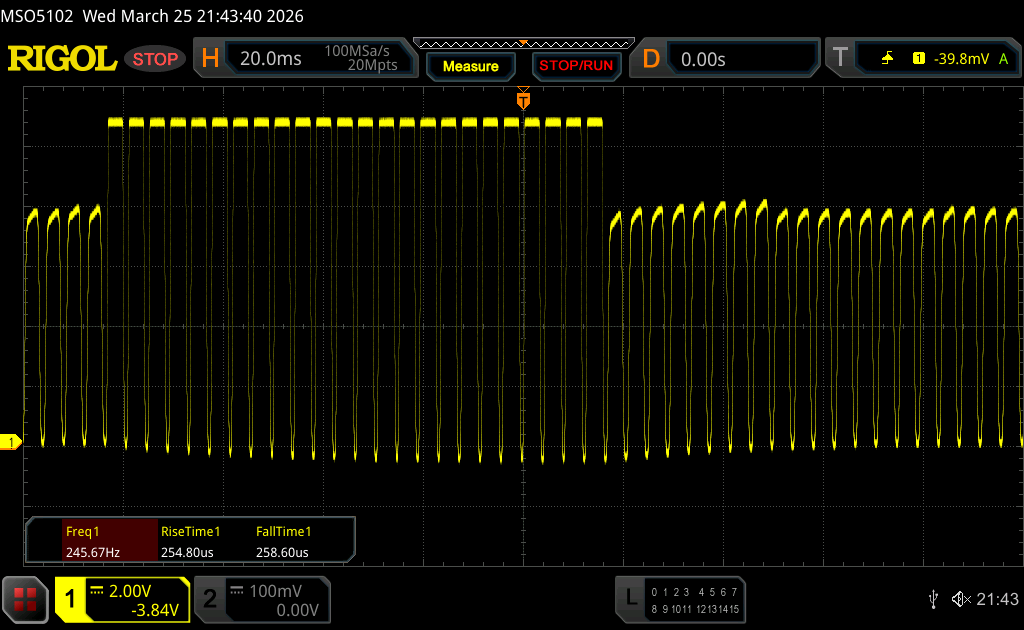 |
| ↘ 0.26 ms chute | ||
| L'écran montre de très faibles temps de réponse, parfait pour le jeu. En comparaison, tous les appareils testés affichent entre 0.165 (minimum) et 636 (maximum) ms. » 1 % des appareils testés affichent de meilleures performances. Cela signifie que les latences relevées sont meilleures que la moyenne (31.2 ms) de tous les appareils testés. | ||
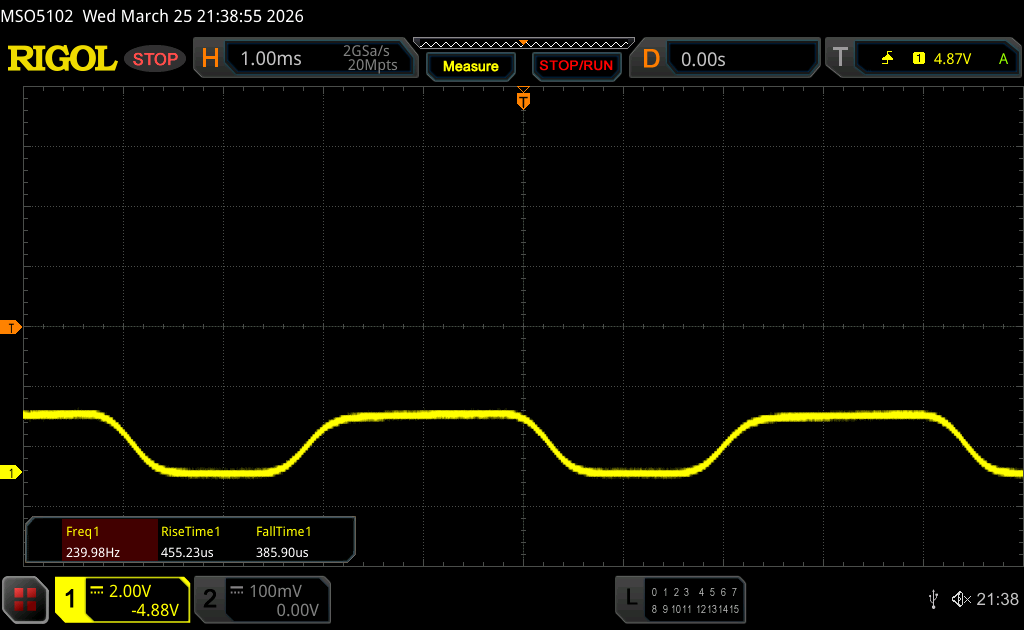
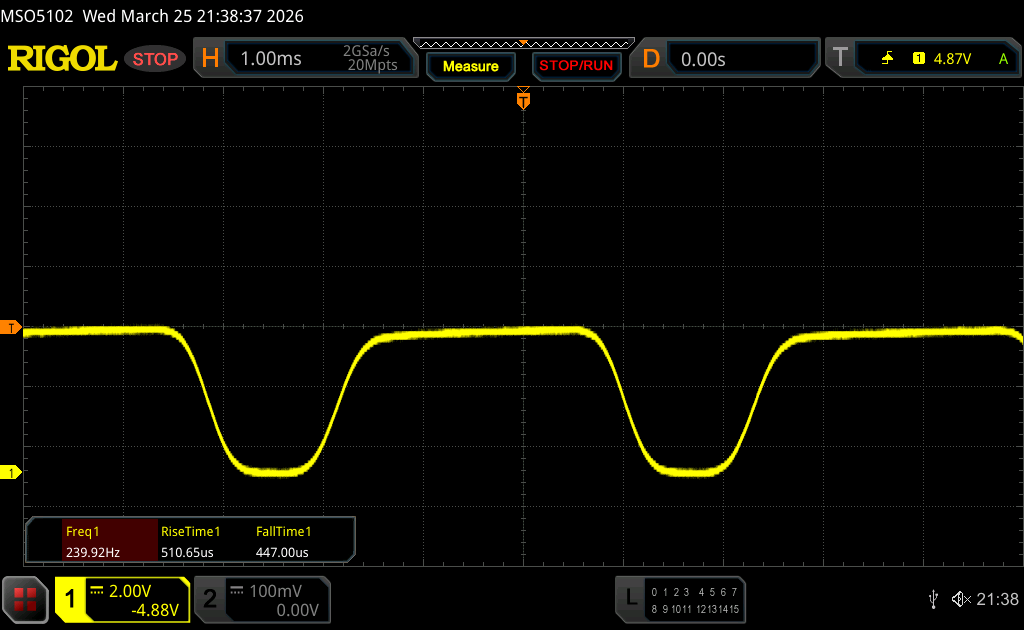
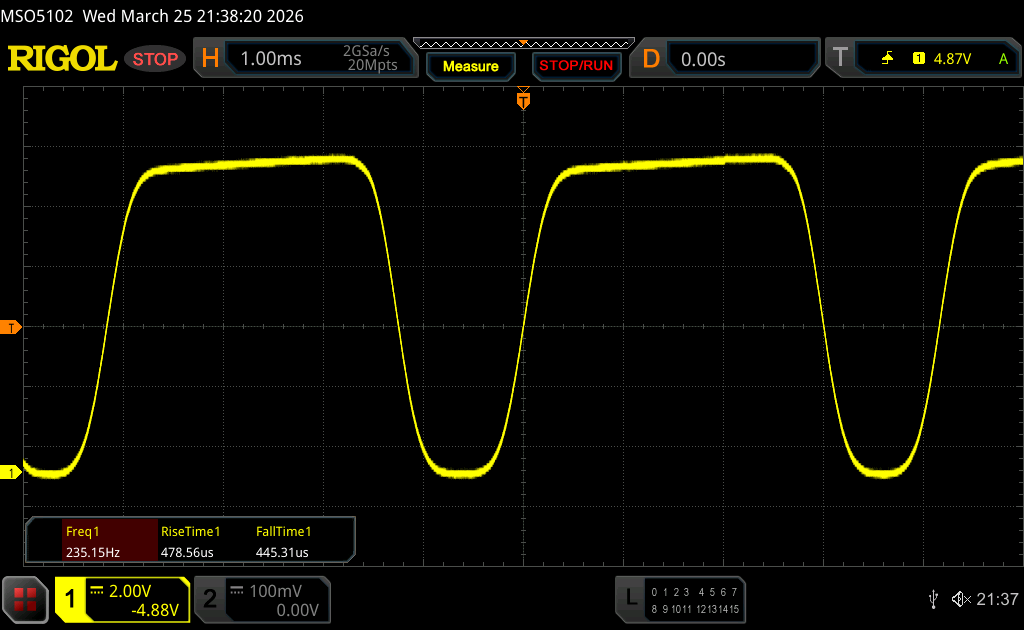
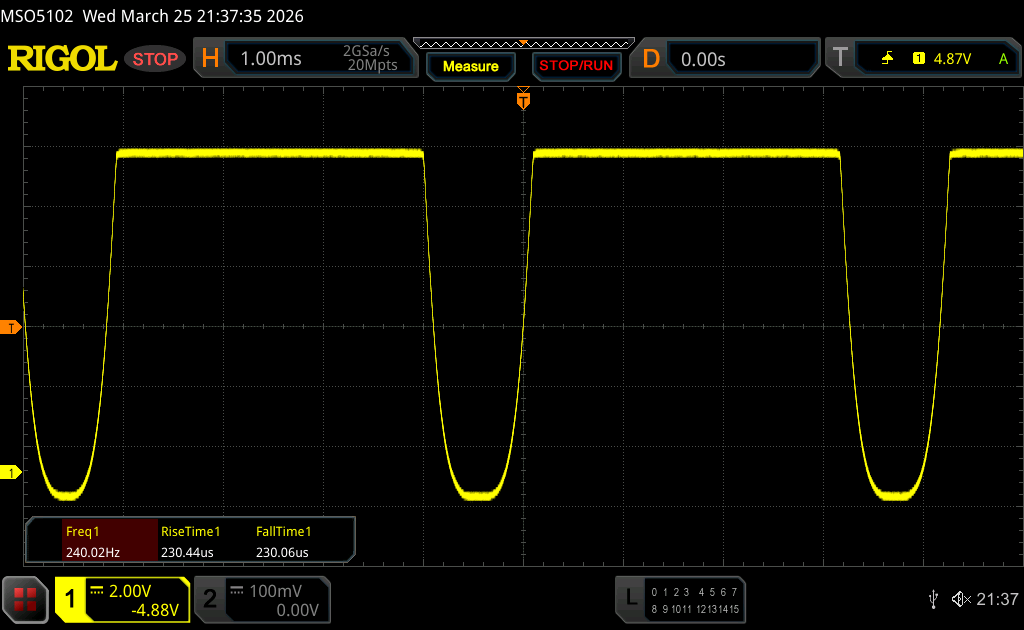
Scintillement / MLI (Modulation de largeur d'impulsion)
| Scintillement / MLI (Modulation de largeur d'impulsion) décelé | 240 Hz Amplitude: 100 % | ≤ 100 Niveau de luminosité | 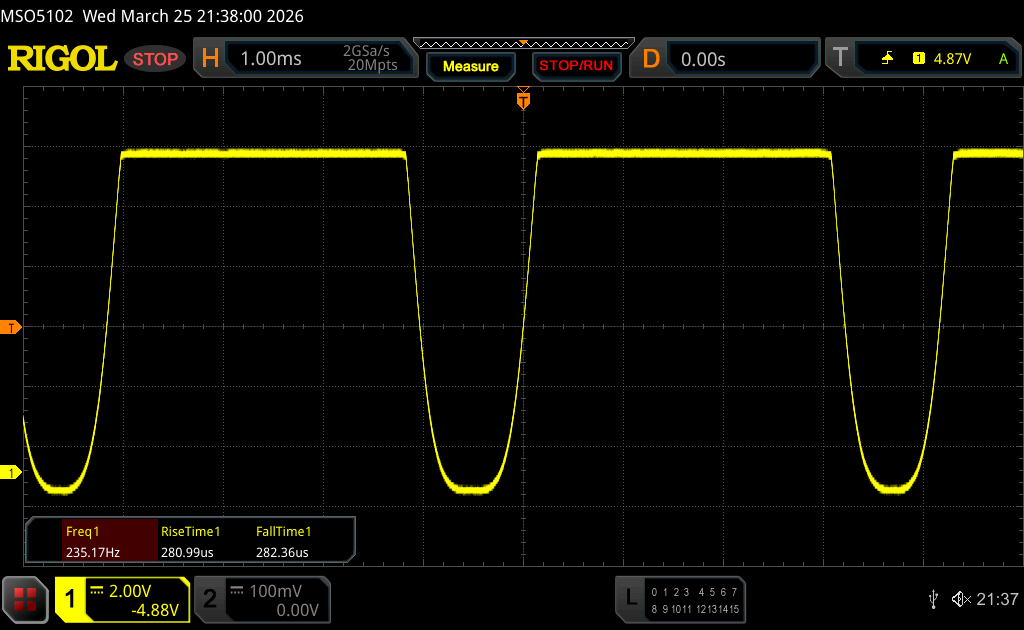 |
Le rétroéclairage de l'écran scintille à la fréquence de 240 Hz (certainement du fait de l'utilisation d'une MDI - Modulation de largeur d'impulsion) à un niveau de luminosité inférieur ou égal à 100 % . Aucun scintillement ne devrait être perceptible au-dessus de cette valeur. La fréquence de rafraîchissement de 240 Hz est relativement faible, les personnes les plus sensibles devraient percevoir un scintillement et être sujettes à une fatigue oculaire accrue (avec le niveau de luminosité indiqué) En comparaison, 52 % des appareils testés n'emploient pas MDI pour assombrir leur écran. Nous avons relevé une moyenne à 7857 (minimum : 5 - maximum : 343500) Hz dans le cas où une MDI était active. | |||


Performance - Panther Lake
Samsung ne propose actuellement que le nouveau Galaxy Book6 Pro avec le Core Ultra 7 356H en combinaison avec la RAM soudée et l'iGPU lent avec 4 cœurs Xe. Samsung a également annoncé une SKU avec le Core Ultra X7 358H et l'iGPU Arc B390 plus rapide.
Conditions d'essai
Samsung inclut plusieurs profils d'alimentation et les synchronise avec les paramètres de Windows. Pour notre unité de test, il n'est pas judicieux d'utiliser le mode Haute performance, car les gains de performance sont quasiment inexistants et limités au CPU, mais les ventilateurs seront beaucoup plus bruyants. Nous avons utilisé le mode Optimisé pour nos benchmarks.
Processeur
Samsung utilise le nouveau Core Ultra 7 356H (Panther Lake) avec un total de 16 cœurs. La limite de puissance à court terme est très élevée (80 watts), mais elle chute rapidement à seulement 30 watts. Cela signifie que les performances dans les scénarios de charge de pointe à court terme sont bonnes, mais qu'elles chutent d'environ 25 % dans les charges de travail soutenues. Les performances de l'unité centrale ne baissent que marginalement sur batterie (- 5 %, 60/30 W).
Cinebench R15 Multi Loop
Cinebench 2024: CPU Multi Core | CPU Single Core
Cinebench R23: Multi Core | Single Core
Cinebench R20: CPU (Multi Core) | CPU (Single Core)
Cinebench R15: CPU Multi 64Bit | CPU Single 64Bit
Blender: v2.79 BMW27 CPU
7-Zip 18.03: 7z b 4 | 7z b 4 -mmt1
Geekbench 6.6: Multi-Core | Single-Core
Geekbench 5.5: Multi-Core | Single-Core
HWBOT x265 Benchmark v2.2: 4k Preset
LibreOffice : 20 Documents To PDF
R Benchmark 2.5: Overall mean
| CPU Performance rating | |
| Apple MacBook Air 15 M5 -14! | |
| Moyenne Intel Core Ultra 7 356H | |
| Samsung Galaxy Book6 Pro | |
| Asus ZenBook S16 UM5606GA | |
| Moyenne de la classe Multimedia | |
| Samsung Galaxy Book4 Pro 16 -2! | |
| Microsoft Surface Laptop 7 15 Lunar Lake | |
| Dell XPS 16 Core Ultra 5 325 | |
| Lenovo ThinkPad X9-15 Aura Edition | |
| Cinebench 2024 / CPU Multi Core | |
| Moyenne Intel Core Ultra 7 356H (1006 - 1232, n=2) | |
| Moyenne de la classe Multimedia (281 - 2437, n=84, 2 dernières années) | |
| Samsung Galaxy Book6 Pro | |
| Apple MacBook Air 15 M5 | |
| Asus ZenBook S16 UM5606GA | |
| Dell XPS 16 Core Ultra 5 325 | |
| Microsoft Surface Laptop 7 15 Lunar Lake | |
| Lenovo ThinkPad X9-15 Aura Edition | |
| Cinebench 2024 / CPU Single Core | |
| Apple MacBook Air 15 M5 | |
| Moyenne de la classe Multimedia (60 - 201, n=62, 2 dernières années) | |
| Microsoft Surface Laptop 7 15 Lunar Lake | |
| Moyenne Intel Core Ultra 7 356H (121.8 - 122.4, n=2) | |
| Samsung Galaxy Book6 Pro | |
| Lenovo ThinkPad X9-15 Aura Edition | |
| Asus ZenBook S16 UM5606GA | |
| Dell XPS 16 Core Ultra 5 325 | |
| Cinebench R23 / Multi Core | |
| Moyenne Intel Core Ultra 7 356H (18395 - 20650, n=2) | |
| Samsung Galaxy Book6 Pro | |
| Asus ZenBook S16 UM5606GA | |
| Moyenne de la classe Multimedia (4841 - 33362, n=82, 2 dernières années) | |
| Samsung Galaxy Book4 Pro 16 | |
| Dell XPS 16 Core Ultra 5 325 | |
| Microsoft Surface Laptop 7 15 Lunar Lake | |
| Lenovo ThinkPad X9-15 Aura Edition | |
| Cinebench R23 / Single Core | |
| Moyenne Intel Core Ultra 7 356H (2040 - 2045, n=2) | |
| Samsung Galaxy Book6 Pro | |
| Asus ZenBook S16 UM5606GA | |
| Microsoft Surface Laptop 7 15 Lunar Lake | |
| Moyenne de la classe Multimedia (1128 - 2459, n=74, 2 dernières années) | |
| Lenovo ThinkPad X9-15 Aura Edition | |
| Dell XPS 16 Core Ultra 5 325 | |
| Samsung Galaxy Book4 Pro 16 | |
| Cinebench R20 / CPU (Multi Core) | |
| Moyenne Intel Core Ultra 7 356H (7180 - 8074, n=2) | |
| Samsung Galaxy Book6 Pro | |
| Asus ZenBook S16 UM5606GA | |
| Moyenne de la classe Multimedia (1860 - 12912, n=65, 2 dernières années) | |
| Samsung Galaxy Book4 Pro 16 | |
| Dell XPS 16 Core Ultra 5 325 | |
| Microsoft Surface Laptop 7 15 Lunar Lake | |
| Lenovo ThinkPad X9-15 Aura Edition | |
| Cinebench R20 / CPU (Single Core) | |
| Asus ZenBook S16 UM5606GA | |
| Samsung Galaxy Book6 Pro | |
| Moyenne Intel Core Ultra 7 356H (773 - 774, n=2) | |
| Microsoft Surface Laptop 7 15 Lunar Lake | |
| Lenovo ThinkPad X9-15 Aura Edition | |
| Moyenne de la classe Multimedia (420 - 853, n=65, 2 dernières années) | |
| Dell XPS 16 Core Ultra 5 325 | |
| Samsung Galaxy Book4 Pro 16 | |
| Cinebench R15 / CPU Multi 64Bit | |
| Moyenne Intel Core Ultra 7 356H (2937 - 3201, n=2) | |
| Samsung Galaxy Book6 Pro | |
| Asus ZenBook S16 UM5606GA | |
| Moyenne de la classe Multimedia (790 - 5224, n=69, 2 dernières années) | |
| Samsung Galaxy Book4 Pro 16 | |
| Dell XPS 16 Core Ultra 5 325 | |
| Microsoft Surface Laptop 7 15 Lunar Lake | |
| Lenovo ThinkPad X9-15 Aura Edition | |
| Cinebench R15 / CPU Single 64Bit | |
| Moyenne Intel Core Ultra 7 356H (303 - 306, n=2) | |
| Samsung Galaxy Book6 Pro | |
| Lenovo ThinkPad X9-15 Aura Edition | |
| Microsoft Surface Laptop 7 15 Lunar Lake | |
| Moyenne de la classe Multimedia (165.5 - 326, n=67, 2 dernières années) | |
| Dell XPS 16 Core Ultra 5 325 | |
| Samsung Galaxy Book4 Pro 16 | |
| Asus ZenBook S16 UM5606GA | |
| Blender / v2.79 BMW27 CPU | |
| Lenovo ThinkPad X9-15 Aura Edition | |
| Microsoft Surface Laptop 7 15 Lunar Lake | |
| Dell XPS 16 Core Ultra 5 325 | |
| Moyenne de la classe Multimedia (100 - 616, n=66, 2 dernières années) | |
| Samsung Galaxy Book4 Pro 16 | |
| Samsung Galaxy Book6 Pro | |
| Asus ZenBook S16 UM5606GA | |
| Moyenne Intel Core Ultra 7 356H (163 - 196, n=2) | |
| 7-Zip 18.03 / 7z b 4 | |
| Moyenne Intel Core Ultra 7 356H (65579 - 69785, n=2) | |
| Asus ZenBook S16 UM5606GA | |
| Samsung Galaxy Book6 Pro | |
| Samsung Galaxy Book4 Pro 16 | |
| Moyenne de la classe Multimedia (23586 - 130368, n=63, 2 dernières années) | |
| Dell XPS 16 Core Ultra 5 325 | |
| Microsoft Surface Laptop 7 15 Lunar Lake | |
| Lenovo ThinkPad X9-15 Aura Edition | |
| 7-Zip 18.03 / 7z b 4 -mmt1 | |
| Samsung Galaxy Book6 Pro | |
| Moyenne Intel Core Ultra 7 356H (6305 - 6375, n=2) | |
| Asus ZenBook S16 UM5606GA | |
| Microsoft Surface Laptop 7 15 Lunar Lake | |
| Moyenne de la classe Multimedia (3666 - 7545, n=64, 2 dernières années) | |
| Lenovo ThinkPad X9-15 Aura Edition | |
| Dell XPS 16 Core Ultra 5 325 | |
| Samsung Galaxy Book4 Pro 16 | |
| Geekbench 6.6 / Multi-Core | |
| Apple MacBook Air 15 M5 | |
| Samsung Galaxy Book6 Pro | |
| Moyenne Intel Core Ultra 7 356H (15578 - 16676, n=3) | |
| Moyenne de la classe Multimedia (4503 - 29415, n=80, 2 dernières années) | |
| Asus ZenBook S16 UM5606GA | |
| Samsung Galaxy Book4 Pro 16 | |
| Microsoft Surface Laptop 7 15 Lunar Lake | |
| Dell XPS 16 Core Ultra 5 325 | |
| Lenovo ThinkPad X9-15 Aura Edition | |
| Geekbench 6.6 / Single-Core | |
| Apple MacBook Air 15 M5 | |
| Microsoft Surface Laptop 7 15 Lunar Lake | |
| Moyenne de la classe Multimedia (1405 - 4335, n=76, 2 dernières années) | |
| Samsung Galaxy Book6 Pro | |
| Asus ZenBook S16 UM5606GA | |
| Lenovo ThinkPad X9-15 Aura Edition | |
| Moyenne Intel Core Ultra 7 356H (2532 - 2851, n=3) | |
| Dell XPS 16 Core Ultra 5 325 | |
| Samsung Galaxy Book4 Pro 16 | |
| Geekbench 5.5 / Multi-Core | |
| Moyenne Intel Core Ultra 7 356H (16721 - 16761, n=2) | |
| Samsung Galaxy Book6 Pro | |
| Asus ZenBook S16 UM5606GA | |
| Moyenne de la classe Multimedia (3970 - 20422, n=63, 2 dernières années) | |
| Samsung Galaxy Book4 Pro 16 | |
| Dell XPS 16 Core Ultra 5 325 | |
| Microsoft Surface Laptop 7 15 Lunar Lake | |
| Lenovo ThinkPad X9-15 Aura Edition | |
| Geekbench 5.5 / Single-Core | |
| Asus ZenBook S16 UM5606GA | |
| Samsung Galaxy Book6 Pro | |
| Moyenne Intel Core Ultra 7 356H (2086 - 2098, n=2) | |
| Microsoft Surface Laptop 7 15 Lunar Lake | |
| Lenovo ThinkPad X9-15 Aura Edition | |
| Dell XPS 16 Core Ultra 5 325 | |
| Moyenne de la classe Multimedia (805 - 2974, n=63, 2 dernières années) | |
| Samsung Galaxy Book4 Pro 16 | |
| HWBOT x265 Benchmark v2.2 / 4k Preset | |
| Moyenne Intel Core Ultra 7 356H (20 - 25.1, n=2) | |
| Asus ZenBook S16 UM5606GA | |
| Samsung Galaxy Book6 Pro | |
| Moyenne de la classe Multimedia (5.26 - 36.1, n=64, 2 dernières années) | |
| Samsung Galaxy Book4 Pro 16 | |
| Dell XPS 16 Core Ultra 5 325 | |
| Microsoft Surface Laptop 7 15 Lunar Lake | |
| Lenovo ThinkPad X9-15 Aura Edition | |
| LibreOffice / 20 Documents To PDF | |
| Samsung Galaxy Book6 Pro | |
| Asus ZenBook S16 UM5606GA | |
| Moyenne Intel Core Ultra 7 356H (47.3 - 57.8, n=2) | |
| Moyenne de la classe Multimedia (23.9 - 146.7, n=65, 2 dernières années) | |
| Dell XPS 16 Core Ultra 5 325 | |
| Microsoft Surface Laptop 7 15 Lunar Lake | |
| Lenovo ThinkPad X9-15 Aura Edition | |
| Samsung Galaxy Book4 Pro 16 | |
| R Benchmark 2.5 / Overall mean | |
| Moyenne de la classe Multimedia (0.3604 - 0.947, n=64, 2 dernières années) | |
| Lenovo ThinkPad X9-15 Aura Edition | |
| Samsung Galaxy Book4 Pro 16 | |
| Samsung Galaxy Book6 Pro | |
| Dell XPS 16 Core Ultra 5 325 | |
| Microsoft Surface Laptop 7 15 Lunar Lake | |
| Moyenne Intel Core Ultra 7 356H (0.4268 - 0.459, n=2) | |
| Asus ZenBook S16 UM5606GA | |
* ... Moindre est la valeur, meilleures sont les performances
AIDA64: FP32 Ray-Trace | FPU Julia | CPU SHA3 | CPU Queen | FPU SinJulia | FPU Mandel | CPU AES | CPU ZLib | FP64 Ray-Trace | CPU PhotoWorxx | CPU CheckMate
| Performance rating | |
| Asus ZenBook S16 UM5606GA -1! | |
| Moyenne Intel Core Ultra 7 356H -1! | |
| Samsung Galaxy Book6 Pro -1! | |
| Moyenne de la classe Multimedia | |
| Samsung Galaxy Book4 Pro 16 -1! | |
| Dell XPS 16 Core Ultra 5 325 -1! | |
| Lenovo ThinkPad X9-15 Aura Edition | |
| Microsoft Surface Laptop 7 15 Lunar Lake -1! | |
| AIDA64 / FP32 Ray-Trace | |
| Asus ZenBook S16 UM5606GA (v6.92.6600) | |
| Moyenne Intel Core Ultra 7 356H (16303 - 20528, n=2) | |
| Moyenne de la classe Multimedia (2214 - 50388, n=61, 2 dernières années) | |
| Samsung Galaxy Book6 Pro (v8.20.8100) | |
| Samsung Galaxy Book4 Pro 16 (v6.92.6600) | |
| Lenovo ThinkPad X9-15 Aura Edition (v6.92.6600) | |
| Lenovo ThinkPad X9-15 Aura Edition (v6.92.6600) | |
| Lenovo ThinkPad X9-15 Aura Edition (v8.20.8100) | |
| Dell XPS 16 Core Ultra 5 325 (v8.20.8100) | |
| Microsoft Surface Laptop 7 15 Lunar Lake (v6.92.6600) | |
| AIDA64 / FPU Julia | |
| Asus ZenBook S16 UM5606GA (v6.92.6600) | |
| Moyenne Intel Core Ultra 7 356H (81236 - 108092, n=2) | |
| Samsung Galaxy Book6 Pro (v8.20.8100) | |
| Moyenne de la classe Multimedia (12867 - 201874, n=62, 2 dernières années) | |
| Samsung Galaxy Book4 Pro 16 (v6.92.6600) | |
| Dell XPS 16 Core Ultra 5 325 (v8.20.8100) | |
| Lenovo ThinkPad X9-15 Aura Edition (v6.92.6600) | |
| Lenovo ThinkPad X9-15 Aura Edition (v8.20.8100) | |
| Lenovo ThinkPad X9-15 Aura Edition (v6.92.6600) | |
| Microsoft Surface Laptop 7 15 Lunar Lake (v6.92.6600) | |
| AIDA64 / CPU SHA3 | |
| Moyenne Intel Core Ultra 7 356H (4141 - 5284, n=2) | |
| Asus ZenBook S16 UM5606GA (v6.92.6600) | |
| Samsung Galaxy Book6 Pro (v8.20.8100) | |
| Moyenne de la classe Multimedia (653 - 8623, n=62, 2 dernières années) | |
| Samsung Galaxy Book4 Pro 16 (v6.92.6600) | |
| Dell XPS 16 Core Ultra 5 325 (v8.20.8100) | |
| Lenovo ThinkPad X9-15 Aura Edition (v6.92.6600) | |
| Lenovo ThinkPad X9-15 Aura Edition (v8.20.8100) | |
| Lenovo ThinkPad X9-15 Aura Edition (v6.92.6600) | |
| Microsoft Surface Laptop 7 15 Lunar Lake (v6.92.6600) | |
| AIDA64 / CPU Queen | |
| Asus ZenBook S16 UM5606GA (v6.92.6600) | |
| Samsung Galaxy Book4 Pro 16 (v6.92.6600) | |
| Moyenne de la classe Multimedia (13483 - 181505, n=51, 2 dernières années) | |
| Lenovo ThinkPad X9-15 Aura Edition (v6.92.6600) | |
| Lenovo ThinkPad X9-15 Aura Edition (v6.92.6600) | |
| Microsoft Surface Laptop 7 15 Lunar Lake (v6.92.6600) | |
| AIDA64 / FPU SinJulia | |
| Asus ZenBook S16 UM5606GA (v6.92.6600) | |
| Samsung Galaxy Book4 Pro 16 (v6.92.6600) | |
| Moyenne de la classe Multimedia (1240 - 28794, n=62, 2 dernières années) | |
| Samsung Galaxy Book6 Pro (v8.20.8100) | |
| Moyenne Intel Core Ultra 7 356H (6960 - 6965, n=2) | |
| Lenovo ThinkPad X9-15 Aura Edition (v8.20.8100) | |
| Lenovo ThinkPad X9-15 Aura Edition (v6.92.6600) | |
| Lenovo ThinkPad X9-15 Aura Edition (v6.92.6600) | |
| Microsoft Surface Laptop 7 15 Lunar Lake (v6.92.6600) | |
| Dell XPS 16 Core Ultra 5 325 (v8.20.8100) | |
| AIDA64 / FPU Mandel | |
| Asus ZenBook S16 UM5606GA (v6.92.6600) | |
| Moyenne Intel Core Ultra 7 356H (44538 - 58505, n=2) | |
| Samsung Galaxy Book6 Pro (v8.20.8100) | |
| Moyenne de la classe Multimedia (6395 - 105740, n=61, 2 dernières années) | |
| Samsung Galaxy Book4 Pro 16 (v6.92.6600) | |
| Dell XPS 16 Core Ultra 5 325 (v8.20.8100) | |
| Lenovo ThinkPad X9-15 Aura Edition (v6.92.6600) | |
| Lenovo ThinkPad X9-15 Aura Edition (v6.92.6600) | |
| Lenovo ThinkPad X9-15 Aura Edition (v8.20.8100) | |
| Microsoft Surface Laptop 7 15 Lunar Lake (v6.92.6600) | |
| AIDA64 / CPU AES | |
| Asus ZenBook S16 UM5606GA (v6.92.6600) | |
| Samsung Galaxy Book4 Pro 16 (v6.92.6600) | |
| Moyenne de la classe Multimedia (13243 - 126790, n=62, 2 dernières années) | |
| Moyenne Intel Core Ultra 7 356H (64920 - 67037, n=2) | |
| Samsung Galaxy Book6 Pro (v8.20.8100) | |
| Lenovo ThinkPad X9-15 Aura Edition (v8.20.8100) | |
| Lenovo ThinkPad X9-15 Aura Edition (v6.92.6600) | |
| Lenovo ThinkPad X9-15 Aura Edition (v6.92.6600) | |
| Microsoft Surface Laptop 7 15 Lunar Lake (v6.92.6600) | |
| Dell XPS 16 Core Ultra 5 325 (v8.20.8100) | |
| AIDA64 / CPU ZLib | |
| Asus ZenBook S16 UM5606GA (v6.92.6600) | |
| Moyenne Intel Core Ultra 7 356H (1086 - 1199, n=2) | |
| Samsung Galaxy Book6 Pro (v8.20.8100) | |
| Moyenne de la classe Multimedia (167.2 - 2022, n=62, 2 dernières années) | |
| Samsung Galaxy Book4 Pro 16 (v6.92.6600) | |
| Dell XPS 16 Core Ultra 5 325 (v8.20.8100) | |
| Lenovo ThinkPad X9-15 Aura Edition (v6.92.6600) | |
| Lenovo ThinkPad X9-15 Aura Edition (v8.20.8100) | |
| Lenovo ThinkPad X9-15 Aura Edition (v6.92.6600) | |
| Microsoft Surface Laptop 7 15 Lunar Lake (v6.92.6600) | |
| AIDA64 / FP64 Ray-Trace | |
| Asus ZenBook S16 UM5606GA (v6.92.6600) | |
| Moyenne Intel Core Ultra 7 356H (8201 - 11057, n=2) | |
| Moyenne de la classe Multimedia (1014 - 26875, n=62, 2 dernières années) | |
| Samsung Galaxy Book6 Pro (v8.20.8100) | |
| Samsung Galaxy Book4 Pro 16 (v6.92.6600) | |
| Lenovo ThinkPad X9-15 Aura Edition (v6.92.6600) | |
| Lenovo ThinkPad X9-15 Aura Edition (v6.92.6600) | |
| Lenovo ThinkPad X9-15 Aura Edition (v8.20.8100) | |
| Dell XPS 16 Core Ultra 5 325 (v8.20.8100) | |
| Microsoft Surface Laptop 7 15 Lunar Lake (v6.92.6600) | |
| AIDA64 / CPU PhotoWorxx | |
| Samsung Galaxy Book6 Pro (v8.20.8100) | |
| Moyenne Intel Core Ultra 7 356H (83099 - 83163, n=2) | |
| Lenovo ThinkPad X9-15 Aura Edition (v8.20.8100) | |
| Lenovo ThinkPad X9-15 Aura Edition (v6.92.6600) | |
| Lenovo ThinkPad X9-15 Aura Edition (v6.92.6600) | |
| Dell XPS 16 Core Ultra 5 325 (v8.20.8100) | |
| Microsoft Surface Laptop 7 15 Lunar Lake (v6.92.6600) | |
| Asus ZenBook S16 UM5606GA (v6.92.6600) | |
| Samsung Galaxy Book4 Pro 16 (v6.92.6600) | |
| Moyenne de la classe Multimedia (12860 - 88154, n=62, 2 dernières années) | |
| AIDA64 / CPU CheckMate | |
| Moyenne Intel Core Ultra 7 356H (4196 - 4629, n=2) | |
| Samsung Galaxy Book6 Pro (v8.20.8100) | |
| Moyenne de la classe Multimedia (927 - 4689, n=14, 2 dernières années) | |
| Dell XPS 16 Core Ultra 5 325 (v8.20.8100) | |
| Lenovo ThinkPad X9-15 Aura Edition (v8.20.8100) | |
Performance du système
L'impression subjective de performance est excellente et nous n'avons pas remarqué de bégaiements ou de problèmes de stabilité.
PCMark 10: Score | Essentials | Productivity | Digital Content Creation
CrossMark: Overall | Productivity | Creativity | Responsiveness
WebXPRT 3: Overall
WebXPRT 4: Overall
Mozilla Kraken 1.1: Total
| Performance rating | |
| Apple MacBook Air 15 M5 -4! | |
| Samsung Galaxy Book6 Pro | |
| Moyenne Intel Core Ultra 7 356H, Intel Graphics 4 Xe3 Panther Lake iGPU | |
| Moyenne de la classe Multimedia | |
| Asus ZenBook S16 UM5606GA | |
| Microsoft Surface Laptop 7 15 Lunar Lake | |
| Dell XPS 16 Core Ultra 5 325 | |
| Lenovo ThinkPad X9-15 Aura Edition | |
| Samsung Galaxy Book4 Pro 16 | |
| PCMark 10 / Score | |
| Samsung Galaxy Book6 Pro | |
| Moyenne Intel Core Ultra 7 356H, Intel Graphics 4 Xe3 Panther Lake iGPU (n=1) | |
| Asus ZenBook S16 UM5606GA | |
| Dell XPS 16 Core Ultra 5 325 | |
| Moyenne de la classe Multimedia (4140 - 10386, n=58, 2 dernières années) | |
| Microsoft Surface Laptop 7 15 Lunar Lake | |
| Lenovo ThinkPad X9-15 Aura Edition | |
| Samsung Galaxy Book4 Pro 16 | |
| PCMark 10 / Essentials | |
| Samsung Galaxy Book4 Pro 16 | |
| Microsoft Surface Laptop 7 15 Lunar Lake | |
| Lenovo ThinkPad X9-15 Aura Edition | |
| Asus ZenBook S16 UM5606GA | |
| Moyenne de la classe Multimedia (7295 - 11664, n=57, 2 dernières années) | |
| Samsung Galaxy Book6 Pro | |
| Moyenne Intel Core Ultra 7 356H, Intel Graphics 4 Xe3 Panther Lake iGPU (n=1) | |
| Dell XPS 16 Core Ultra 5 325 | |
| PCMark 10 / Productivity | |
| Samsung Galaxy Book6 Pro | |
| Moyenne Intel Core Ultra 7 356H, Intel Graphics 4 Xe3 Panther Lake iGPU (n=1) | |
| Asus ZenBook S16 UM5606GA | |
| Dell XPS 16 Core Ultra 5 325 | |
| Moyenne de la classe Multimedia (7323 - 18233, n=57, 2 dernières années) | |
| Microsoft Surface Laptop 7 15 Lunar Lake | |
| Lenovo ThinkPad X9-15 Aura Edition | |
| Samsung Galaxy Book4 Pro 16 | |
| PCMark 10 / Digital Content Creation | |
| Microsoft Surface Laptop 7 15 Lunar Lake | |
| Samsung Galaxy Book6 Pro | |
| Moyenne Intel Core Ultra 7 356H, Intel Graphics 4 Xe3 Panther Lake iGPU (n=1) | |
| Moyenne de la classe Multimedia (3542 - 16240, n=57, 2 dernières années) | |
| Asus ZenBook S16 UM5606GA | |
| Lenovo ThinkPad X9-15 Aura Edition | |
| Dell XPS 16 Core Ultra 5 325 | |
| Samsung Galaxy Book4 Pro 16 | |
| CrossMark / Overall | |
| Apple MacBook Air 15 M5 | |
| Samsung Galaxy Book6 Pro | |
| Moyenne Intel Core Ultra 7 356H, Intel Graphics 4 Xe3 Panther Lake iGPU (n=1) | |
| Moyenne de la classe Multimedia (862 - 2728, n=68, 2 dernières années) | |
| Samsung Galaxy Book4 Pro 16 | |
| Lenovo ThinkPad X9-15 Aura Edition | |
| Microsoft Surface Laptop 7 15 Lunar Lake | |
| Dell XPS 16 Core Ultra 5 325 | |
| Asus ZenBook S16 UM5606GA | |
| CrossMark / Productivity | |
| Apple MacBook Air 15 M5 | |
| Samsung Galaxy Book6 Pro | |
| Moyenne Intel Core Ultra 7 356H, Intel Graphics 4 Xe3 Panther Lake iGPU (n=1) | |
| Moyenne de la classe Multimedia (913 - 2489, n=68, 2 dernières années) | |
| Samsung Galaxy Book4 Pro 16 | |
| Lenovo ThinkPad X9-15 Aura Edition | |
| Microsoft Surface Laptop 7 15 Lunar Lake | |
| Asus ZenBook S16 UM5606GA | |
| Dell XPS 16 Core Ultra 5 325 | |
| CrossMark / Creativity | |
| Apple MacBook Air 15 M5 | |
| Samsung Galaxy Book6 Pro | |
| Moyenne Intel Core Ultra 7 356H, Intel Graphics 4 Xe3 Panther Lake iGPU (n=1) | |
| Moyenne de la classe Multimedia (851 - 3465, n=68, 2 dernières années) | |
| Lenovo ThinkPad X9-15 Aura Edition | |
| Microsoft Surface Laptop 7 15 Lunar Lake | |
| Samsung Galaxy Book4 Pro 16 | |
| Asus ZenBook S16 UM5606GA | |
| Dell XPS 16 Core Ultra 5 325 | |
| CrossMark / Responsiveness | |
| Apple MacBook Air 15 M5 | |
| Samsung Galaxy Book6 Pro | |
| Moyenne Intel Core Ultra 7 356H, Intel Graphics 4 Xe3 Panther Lake iGPU (n=1) | |
| Samsung Galaxy Book4 Pro 16 | |
| Moyenne de la classe Multimedia (605 - 2024, n=68, 2 dernières années) | |
| Asus ZenBook S16 UM5606GA | |
| Dell XPS 16 Core Ultra 5 325 | |
| Lenovo ThinkPad X9-15 Aura Edition | |
| Microsoft Surface Laptop 7 15 Lunar Lake | |
| WebXPRT 3 / Overall | |
| Apple MacBook Air 15 M5 | |
| Moyenne de la classe Multimedia (136.4 - 596, n=70, 2 dernières années) | |
| Microsoft Surface Laptop 7 15 Lunar Lake | |
| Asus ZenBook S16 UM5606GA | |
| Lenovo ThinkPad X9-15 Aura Edition | |
| Samsung Galaxy Book6 Pro | |
| Moyenne Intel Core Ultra 7 356H, Intel Graphics 4 Xe3 Panther Lake iGPU (n=1) | |
| Dell XPS 16 Core Ultra 5 325 | |
| Samsung Galaxy Book4 Pro 16 | |
| WebXPRT 4 / Overall | |
| Apple MacBook Air 15 M5 | |
| Microsoft Surface Laptop 7 15 Lunar Lake | |
| Moyenne de la classe Multimedia (141 - 402, n=72, 2 dernières années) | |
| Lenovo ThinkPad X9-15 Aura Edition | |
| Samsung Galaxy Book6 Pro | |
| Moyenne Intel Core Ultra 7 356H, Intel Graphics 4 Xe3 Panther Lake iGPU (n=1) | |
| Dell XPS 16 Core Ultra 5 325 | |
| Samsung Galaxy Book4 Pro 16 | |
| Asus ZenBook S16 UM5606GA | |
| Mozilla Kraken 1.1 / Total | |
| Samsung Galaxy Book4 Pro 16 | |
| Dell XPS 16 Core Ultra 5 325 | |
| Asus ZenBook S16 UM5606GA | |
| Microsoft Surface Laptop 7 15 Lunar Lake | |
| Lenovo ThinkPad X9-15 Aura Edition | |
| Moyenne de la classe Multimedia (228 - 855, n=75, 2 dernières années) | |
| Samsung Galaxy Book6 Pro | |
| Moyenne Intel Core Ultra 7 356H, Intel Graphics 4 Xe3 Panther Lake iGPU (n=1) | |
| Apple MacBook Air 15 M5 | |
* ... Moindre est la valeur, meilleures sont les performances
| PCMark 10 Score | 8644 points | |
Aide | ||
| AIDA64 / Memory Copy | |
| Samsung Galaxy Book6 Pro | |
| Moyenne Intel Core Ultra 7 356H (116043 - 121055, n=2) | |
| Lenovo ThinkPad X9-15 Aura Edition | |
| Microsoft Surface Laptop 7 15 Lunar Lake | |
| Dell XPS 16 Core Ultra 5 325 | |
| Asus ZenBook S16 UM5606GA | |
| Samsung Galaxy Book4 Pro 16 | |
| Moyenne de la classe Multimedia (21158 - 132135, n=62, 2 dernières années) | |
| AIDA64 / Memory Read | |
| Samsung Galaxy Book6 Pro | |
| Moyenne Intel Core Ultra 7 356H (107881 - 112376, n=2) | |
| Asus ZenBook S16 UM5606GA | |
| Samsung Galaxy Book4 Pro 16 | |
| Microsoft Surface Laptop 7 15 Lunar Lake | |
| Lenovo ThinkPad X9-15 Aura Edition | |
| Dell XPS 16 Core Ultra 5 325 | |
| Moyenne de la classe Multimedia (19699 - 174586, n=62, 2 dernières années) | |
| AIDA64 / Memory Write | |
| Samsung Galaxy Book6 Pro | |
| Moyenne Intel Core Ultra 7 356H (120431 - 120449, n=2) | |
| Microsoft Surface Laptop 7 15 Lunar Lake | |
| Lenovo ThinkPad X9-15 Aura Edition | |
| Asus ZenBook S16 UM5606GA | |
| Dell XPS 16 Core Ultra 5 325 | |
| Moyenne de la classe Multimedia (17733 - 134998, n=62, 2 dernières années) | |
| Samsung Galaxy Book4 Pro 16 | |
| AIDA64 / Memory Latency | |
| Samsung Galaxy Book4 Pro 16 | |
| Moyenne de la classe Multimedia (7 - 535, n=61, 2 dernières années) | |
| Asus ZenBook S16 UM5606GA | |
| Dell XPS 16 Core Ultra 5 325 | |
| Microsoft Surface Laptop 7 15 Lunar Lake | |
| Lenovo ThinkPad X9-15 Aura Edition | |
| Moyenne Intel Core Ultra 7 356H (88.6 - 90, n=2) | |
| Samsung Galaxy Book6 Pro | |
* ... Moindre est la valeur, meilleures sont les performances
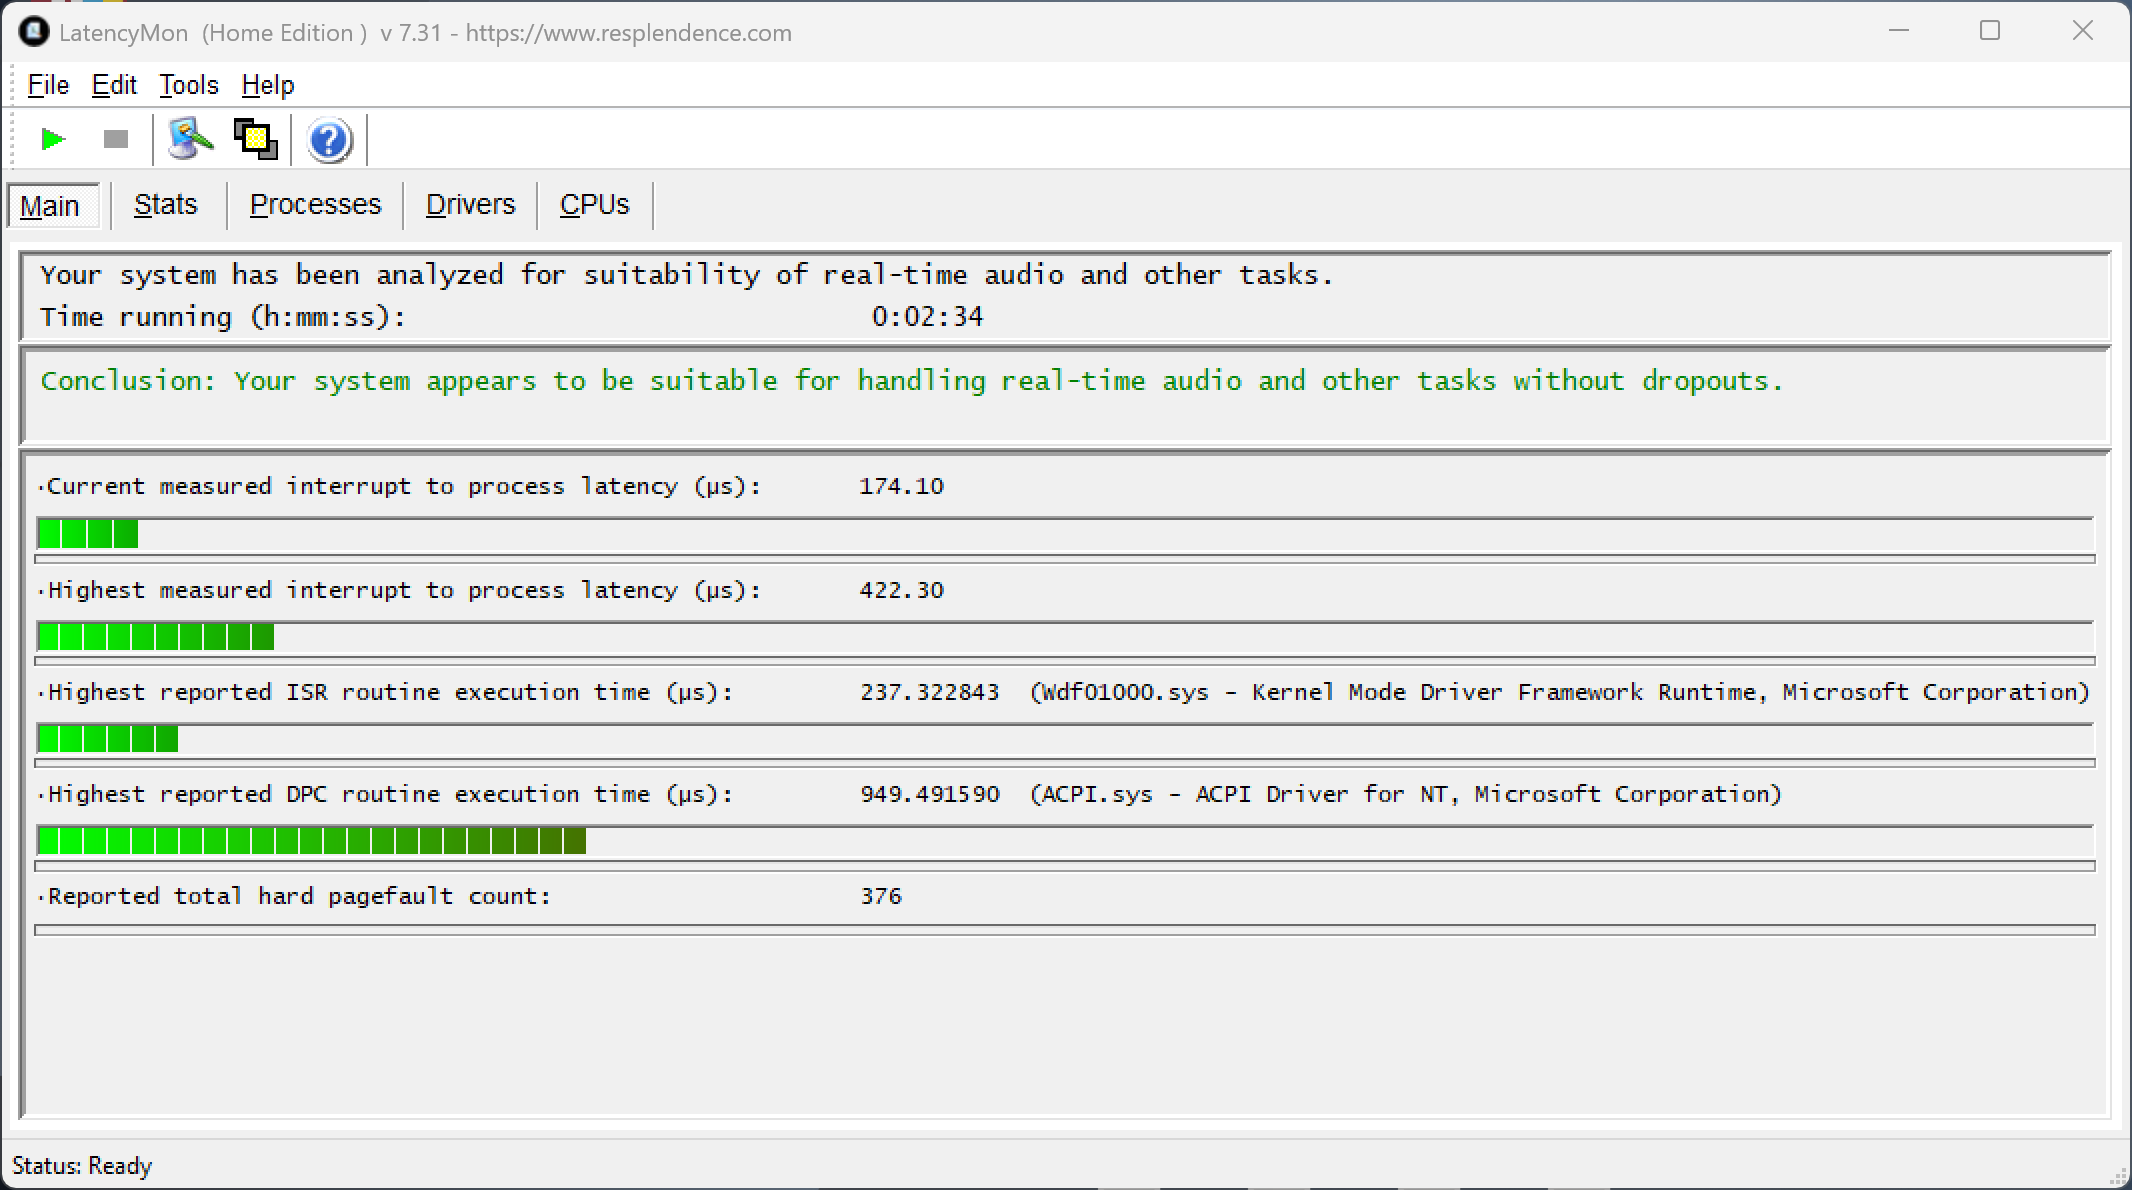
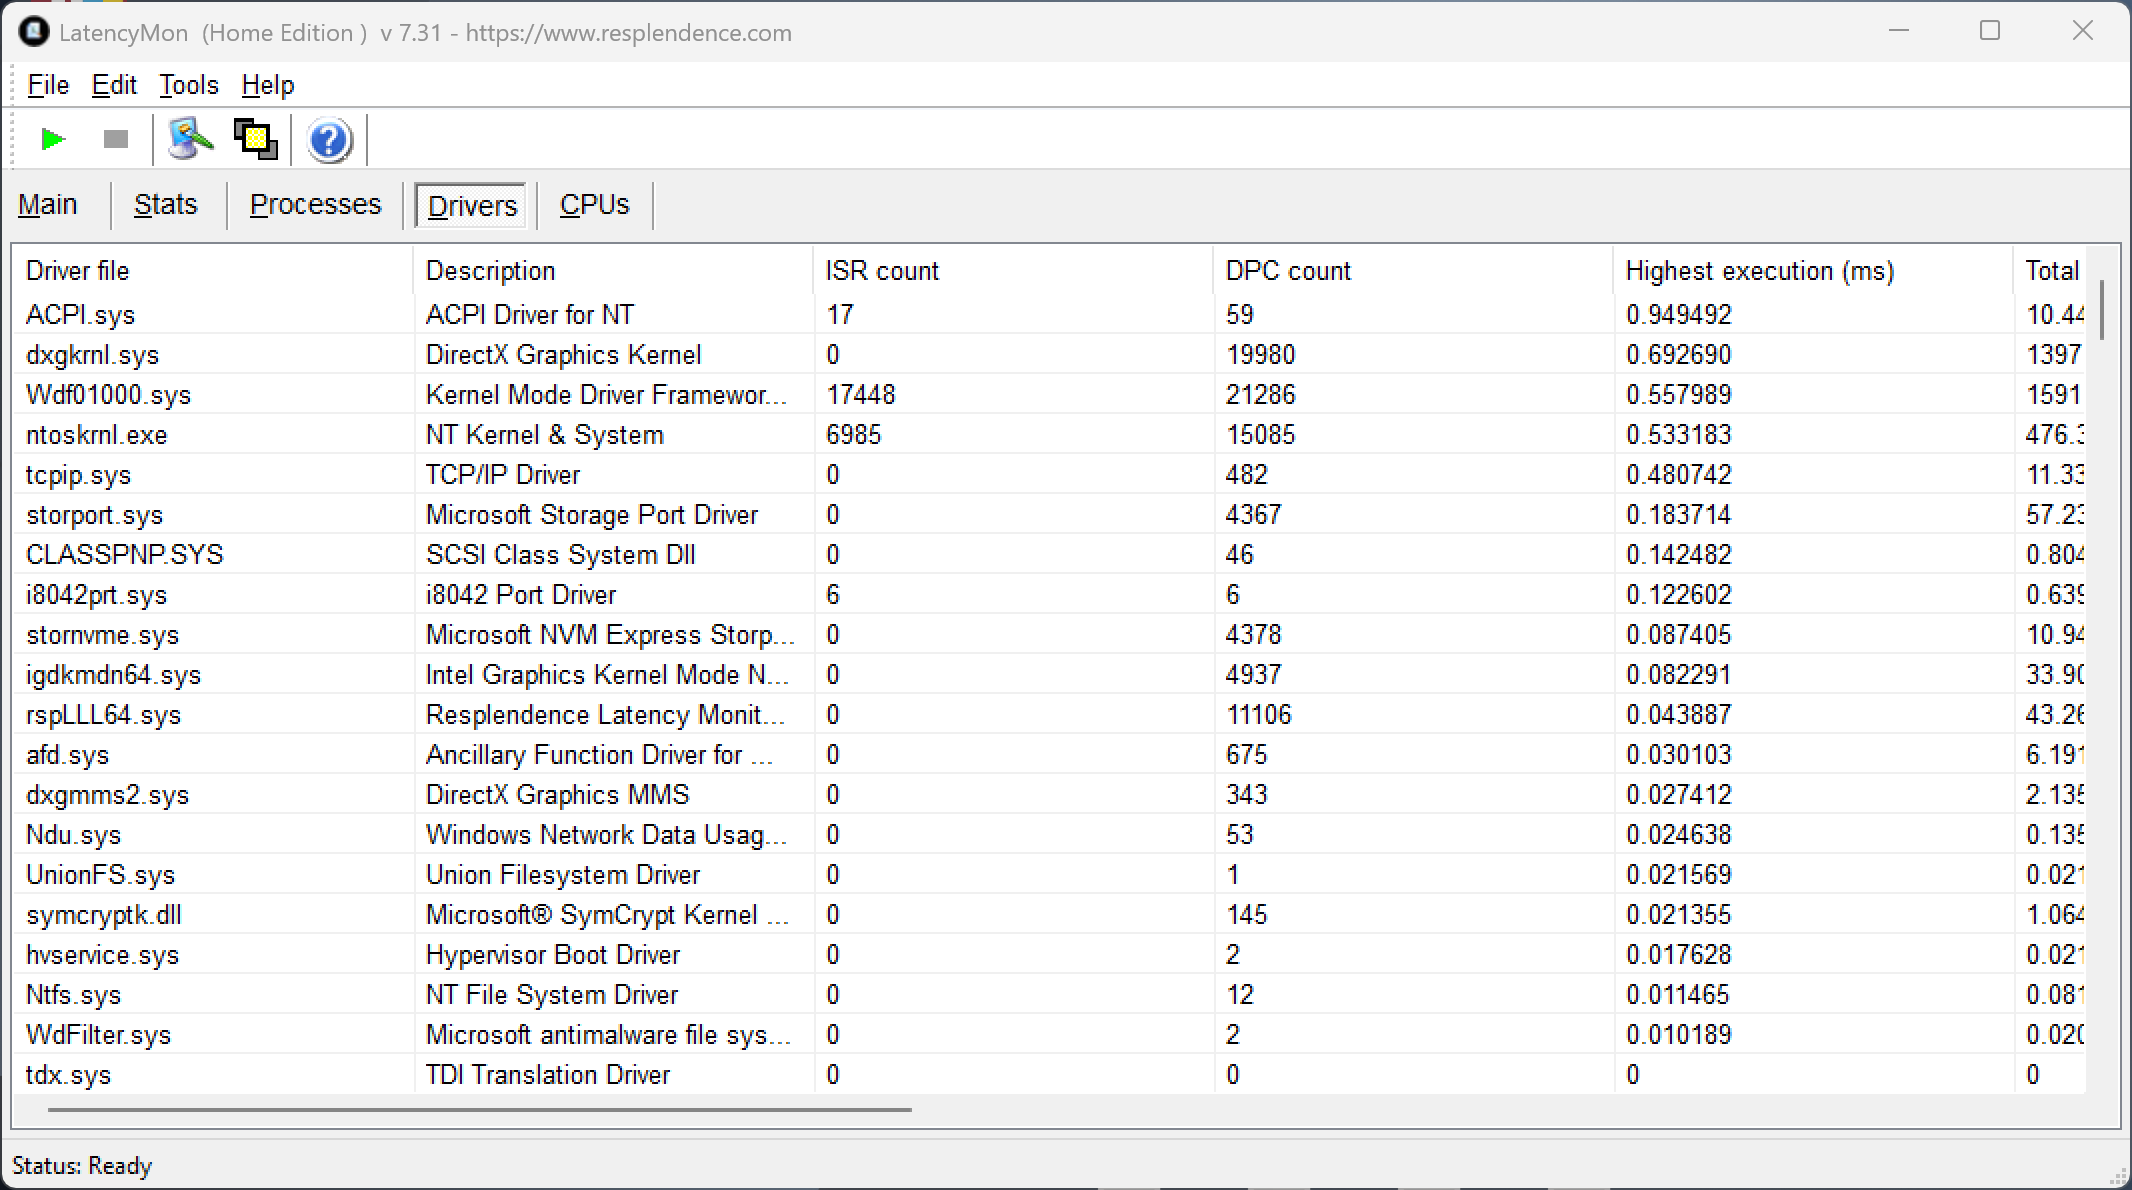
Latence DPC
Notre test de latence standardisé ne montre aucune limite pour le Galaxy Book6 Pro.
| DPC Latencies / LatencyMon - interrupt to process latency (max), Web, Youtube, Prime95 | |
| Dell XPS 16 Core Ultra 5 325 | |
| Samsung Galaxy Book4 Pro 16 | |
| Lenovo ThinkPad X9-15 Aura Edition | |
| Microsoft Surface Laptop 7 15 Lunar Lake | |
| Asus ZenBook S16 UM5606GA | |
| Samsung Galaxy Book6 Pro | |
* ... Moindre est la valeur, meilleures sont les performances
Dispositifs de stockage
Notre appareil est équipé d'un disque de 512 Go (369 Go libres, Samsung PM9C1b) et les taux de transfert du SSD PCIe 4.0 sont bons et stables. Grâce à l'emplacement M.2-2280 supplémentaire, il n'est pas difficile d'ajouter de la capacité de stockage.

* ... Moindre est la valeur, meilleures sont les performances
Throttoir de disque : Boucle de lecture DiskSpd, profondeur de la file d'attente 8
Performance du GPU
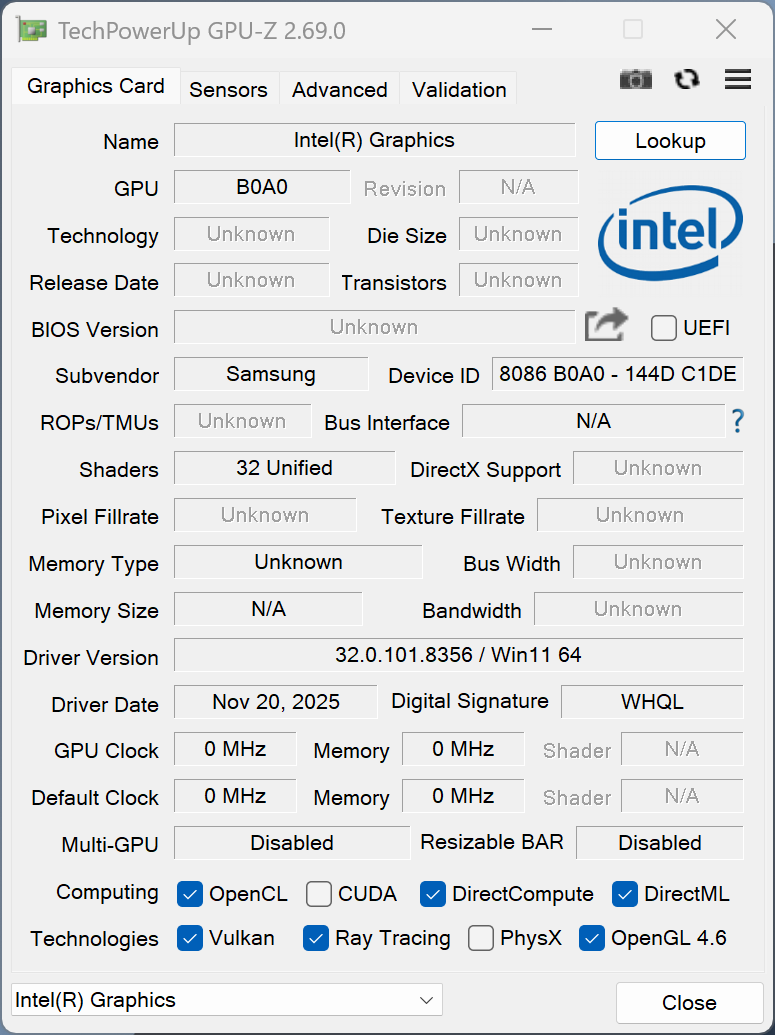
Certaines des puces Panther Lake sont équipées de puissants iGPU appelés Arc B370/B390, mais le Core Ultra 7 356H ne dispose que de l'Arc Graphics plus lent avec 4 cœurs Xe. Le GPU peut gérer les tâches quotidiennes, y compris le streaming de vidéos haute définition, avec facilité, mais les performances brutes sont encore pires par rapport à l'ancien iGPU Arc à 8 cœurs de la génération Meteor Lake dans l'ancien Galaxy Book4 Pro. Si vous voulez jouer à des jeux, nous vous recommandons sans hésiter le Galaxy Book6 Pro avec le Core Ultra X7 358H et le GPU Arc B390.
| 3DMark 11 Performance | 8078 points | |
| 3DMark Fire Strike Score | 6513 points | |
| 3DMark Time Spy Score | 3395 points | |
| 3DMark Steel Nomad Score | 622 points | |
| 3DMark Steel Nomad Light Score | 2501 points | |
Aide | ||
| Blender / v3.3 Classroom CPU | |
| Lenovo ThinkPad X9-15 Aura Edition | |
| Microsoft Surface Laptop 7 15 Lunar Lake | |
| Dell XPS 16 Core Ultra 5 325 | |
| Moyenne Intel Graphics 4 Xe3 Panther Lake iGPU (332 - 569, n=5) | |
| Samsung Galaxy Book4 Pro 16 | |
| Moyenne de la classe Multimedia (134.5 - 1073, n=69, 2 dernières années) | |
| Apple MacBook Air 15 M5 | |
| Samsung Galaxy Book6 Pro | |
| Asus ZenBook S16 UM5606GA | |
| Blender / v3.3 Classroom oneAPI/Intel | |
| Moyenne Intel Graphics 4 Xe3 Panther Lake iGPU (237 - 257, n=3) | |
| Dell XPS 16 Core Ultra 5 325 | |
| Moyenne de la classe Multimedia (105 - 401, n=17, 2 dernières années) | |
| Blender / v3.3 Classroom METAL | |
| Apple MacBook Air 15 M5 | |
| Moyenne de la classe Multimedia (17.8 - 68, n=5, 2 dernières années) | |
* ... Moindre est la valeur, meilleures sont les performances
Cyberpunk 2077 ultra FPS Chart
| Bas | Moyen | Élevé | Ultra | |
|---|---|---|---|---|
| GTA V (2015) | 180.8 | 174.7 | 58.2 | 23.8 |
| Dota 2 Reborn (2015) | 109.6 | 91.5 | 81.8 | 77.4 |
| Final Fantasy XV Benchmark (2018) | 72.3 | 36.7 | 26.1 | |
| X-Plane 11.11 (2018) | 45.1 | 33 | 32.4 | |
| Strange Brigade (2018) | 197 | 70.5 | 59.1 | 51.1 |
| Baldur's Gate 3 (2023) | 31.5 | 23.9 | 21 | 20.3 |
| Cyberpunk 2077 (2023) | 36.8 | 28.2 | 24.4 | 20.5 |
| F1 24 (2024) | 66.8 | 64.3 | 46.5 | 14.8 |
Émissions et consommation d'énergie
Bruit du système

Le Galaxy Book6 Pro est généralement un compagnon très silencieux ou silencieux dans les scénarios quotidiens avec des charges de travail légères. Les premiers niveaux de ventilation sont également assez silencieux, avec environ 27-32 dB(A), et seule la charge maximale ou les jeux atteignent 38,4 dB(A), ce qui en fait l'un des modèles les plus silencieux de notre groupe de comparaison (à l'exception du silencieux MacBook Air). En mode haute performance, nous mesurons jusqu'à 43,9 dB(A) et seulement 29,1 dB(A) en mode silencieux. Nous n'avons remarqué aucun bruit électronique sur notre appareil.
Degré de la nuisance sonore
| Au repos |
| 25.3 / 25.3 / 25.3 dB(A) |
| Fortement sollicité |
| 31.8 / 38.4 dB(A) |
 | ||
30 dB silencieux 40 dB(A) audible 50 dB(A) bruyant |
||
min: | ||
| Samsung Galaxy Book6 Pro Ultra 7 356H, Intel Graphics 4 Xe3 PTL | Dell XPS 16 Core Ultra 5 325 Ultra 5 325, Intel Graphics 4 Xe3 PTL | Asus ZenBook S16 UM5606GA Ryzen AI 9 465, Radeon 880M | Apple MacBook Air 15 M5 M5 10-Core, M5 10-Core GPU | Microsoft Surface Laptop 7 15 Lunar Lake Core Ultra 7 268V, Arc 140V | Lenovo ThinkPad X9-15 Aura Edition Core Ultra 7 258V, Arc 140V | Samsung Galaxy Book4 Pro 16 Ultra 7 155H, Arc 8-Core | |
|---|---|---|---|---|---|---|---|
| Noise | 2% | -14% | 2% | -2% | -4% | ||
| arrêt / environnement * (dB) | 25.3 | 22.8 10% | 24.9 2% | 23.9 6% | 24.4 4% | 24.6 3% | |
| Idle Minimum * (dB) | 25.3 | 22.9 9% | 24.9 2% | 23.9 6% | 24.4 4% | 24.6 3% | |
| Idle Average * (dB) | 25.3 | 22.9 9% | 24.9 2% | 23.9 6% | 24.4 4% | 24.6 3% | |
| Idle Maximum * (dB) | 25.3 | 23.9 6% | 24.9 2% | 23.9 6% | 24.4 4% | 26.4 -4% | |
| Load Average * (dB) | 31.8 | 34.8 -9% | 45.7 -44% | 31.8 -0% | 35.8 -13% | 40 -26% | |
| Cyberpunk 2077 ultra * (dB) | 38.4 | 38 1% | 49 -28% | 38 1% | 39.4 -3% | ||
| Load Maximum * (dB) | 38.4 | 43.3 -13% | 50.4 -31% | 41.9 -9% | 45 -17% | 40 -4% | |
| Witcher 3 ultra * (dB) | 40 |
* ... Moindre est la valeur, meilleures sont les performances
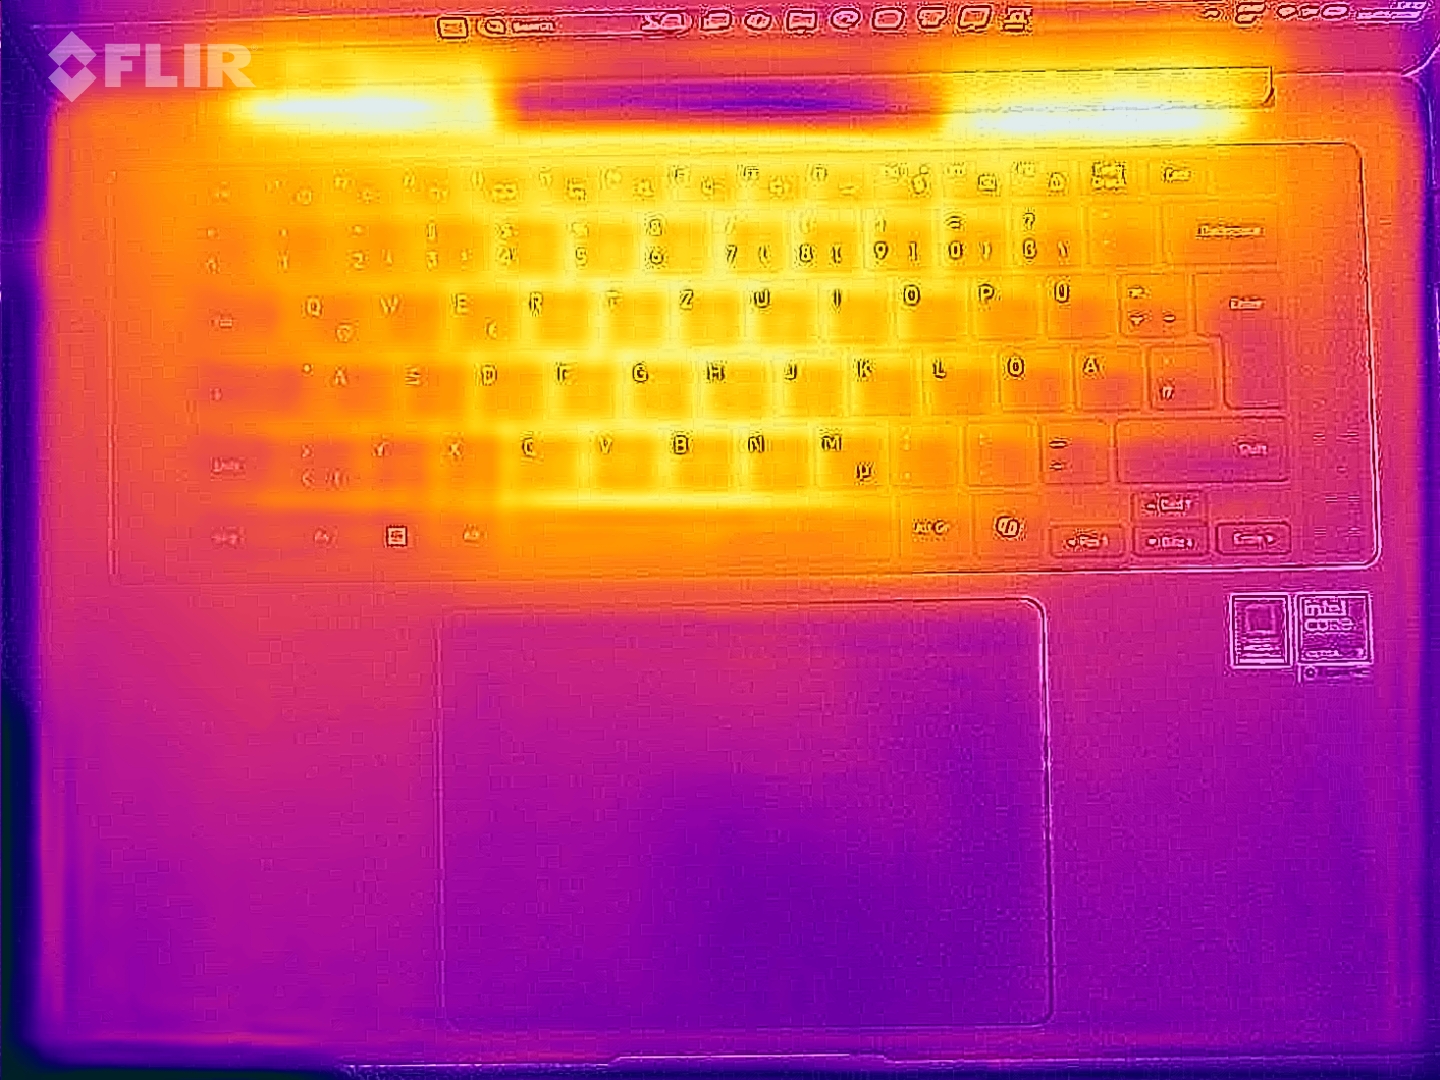
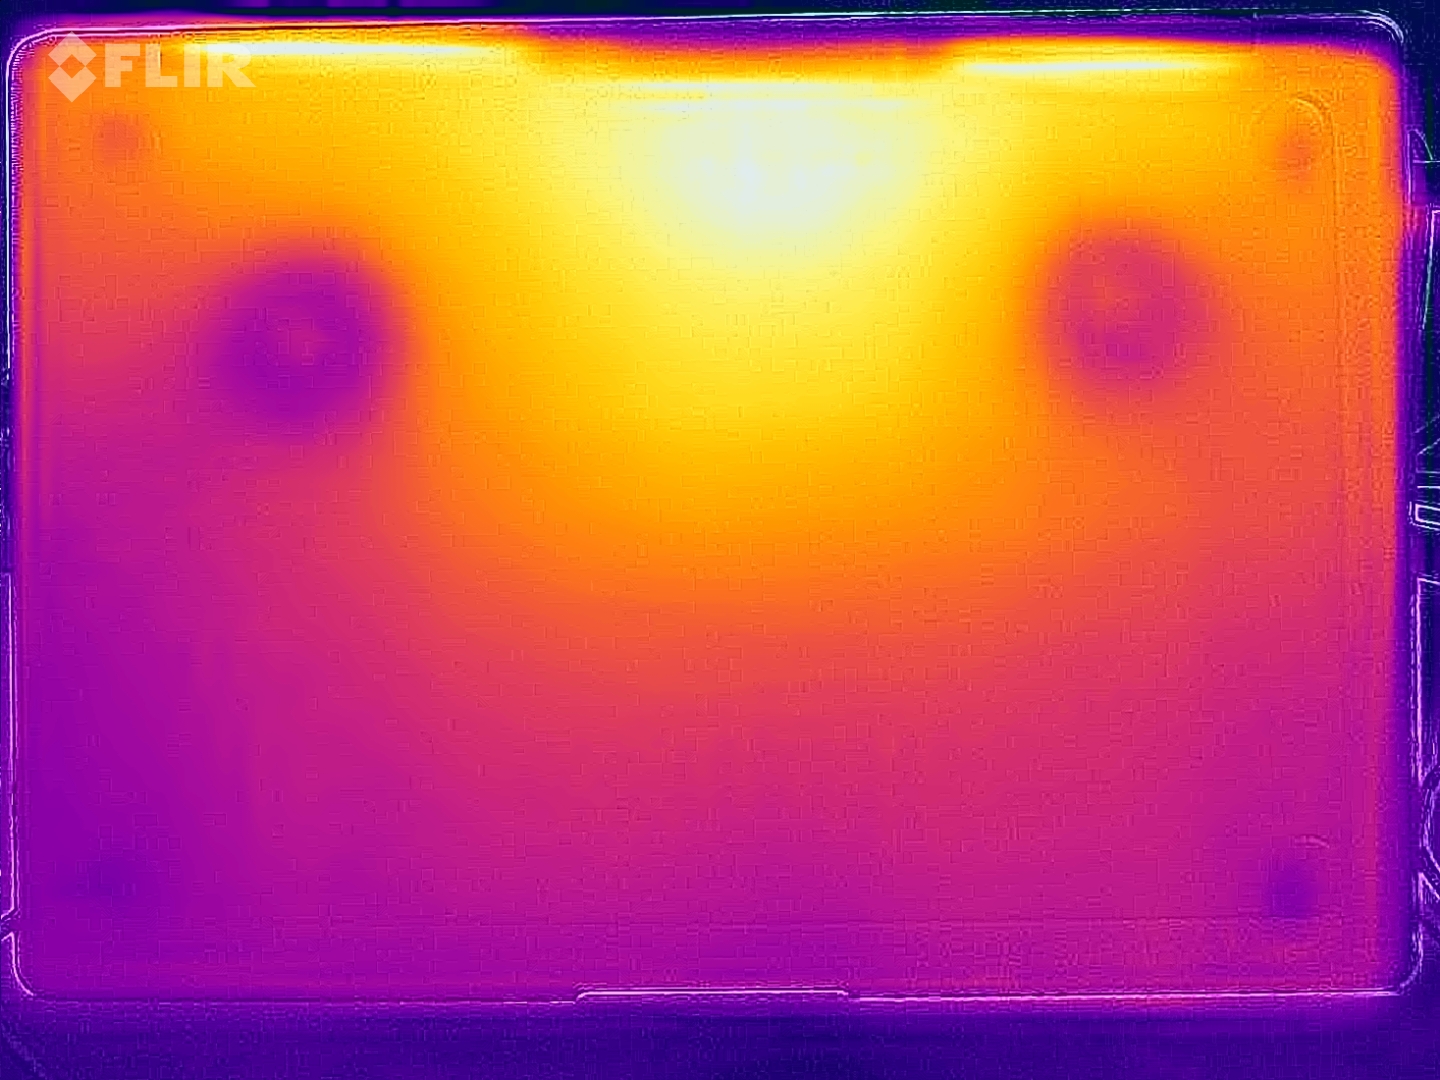
Température
Les surfaces restent très froides dans les scénarios de tous les jours et nous n'avons pu mesurer plus de 40 °C sous charge qu'à un seul endroit, il n'y a donc absolument aucune limitation. Lors de notre test de stress, la consommation du CPU s'est stabilisée à ~27 Watts.

(+) La température maximale du côté supérieur est de 37.8 °C / 100 F, par rapport à la moyenne de 36.8 °C / 98 F, allant de 21 à 71 °C pour la classe Multimedia.
(±) Le fond chauffe jusqu'à un maximum de 40.1 °C / 104 F, contre une moyenne de 39.1 °C / 102 F
(+) En utilisation inactive, la température moyenne du côté supérieur est de 22.4 °C / 72 F, par rapport à la moyenne du dispositif de 31.3 °C / 88 F.
(±) 3: The average temperature for the upper side is 32.8 °C / 91 F, compared to the average of 31.3 °C / 88 F for the class Multimedia.
(+) Les repose-poignets et le pavé tactile sont plus froids que la température de la peau avec un maximum de 28.4 °C / 83.1 F et sont donc froids au toucher.
(±) La température moyenne de la zone de l'appui-paume de dispositifs similaires était de 28.7 °C / 83.7 F (+0.3 °C / #0.6 F).
| Samsung Galaxy Book6 Pro Ultra 7 356H, Intel Graphics 4 Xe3 PTL | Dell XPS 16 Core Ultra 5 325 Ultra 5 325, Intel Graphics 4 Xe3 PTL | Asus ZenBook S16 UM5606GA Ryzen AI 9 465, Radeon 880M | Apple MacBook Air 15 M5 M5 10-Core, M5 10-Core GPU | Microsoft Surface Laptop 7 15 Lunar Lake Core Ultra 7 268V, Arc 140V | Lenovo ThinkPad X9-15 Aura Edition Core Ultra 7 258V, Arc 140V | |
|---|---|---|---|---|---|---|
| Heat | -7% | -16% | -9% | -8% | -6% | |
| Maximum Upper Side * (°C) | 37.8 | 43.8 -16% | 43.4 -15% | 44.1 -17% | 45.7 -21% | 42.1 -11% |
| Maximum Bottom * (°C) | 40.1 | 42 -5% | 46.2 -15% | 43.1 -7% | 42.9 -7% | 39.5 1% |
| Idle Upper Side * (°C) | 22.6 | 23.2 -3% | 26.5 -17% | 24 -6% | 23.6 -4% | 24.5 -8% |
| Idle Bottom * (°C) | 22.8 | 23.6 -4% | 27 -18% | 23.9 -5% | 23.1 -1% | 24.4 -7% |
* ... Moindre est la valeur, meilleures sont les performances
Intervenants
Le système à quatre haut-parleurs offre une qualité sonore décente, mais la concurrence propose des systèmes sonores encore meilleurs. Les modules du Galaxy Book6 Pro manquent tout simplement de punch, ce qui est perceptible.
Samsung Galaxy Book6 Pro analyse audio
(±) | le niveau sonore du haut-parleur est moyen mais bon (81.1# dB)
Basses 100 - 315 Hz
(±) | basse réduite - en moyenne 13.7% inférieure à la médiane
(±) | la linéarité des basses est moyenne (8.9% delta à la fréquence précédente)
Médiums 400 - 2000 Hz
(+) | médiane équilibrée - seulement 3.1% de la médiane
(+) | les médiums sont linéaires (3.5% delta à la fréquence précédente)
Aiguës 2 - 16 kHz
(+) | des sommets équilibrés - à seulement 1.3% de la médiane
(+) | les aigus sont linéaires (2.7% delta à la fréquence précédente)
Globalement 100 - 16 000 Hz
(+) | le son global est linéaire (11% différence à la médiane)
Par rapport à la même classe
» 16% de tous les appareils testés de cette catégorie étaient meilleurs, 3% similaires, 81% pires
» Le meilleur avait un delta de 5%, la moyenne était de 17%, le pire était de 45%.
Par rapport à tous les appareils testés
» 6% de tous les appareils testés étaient meilleurs, 2% similaires, 92% pires
» Le meilleur avait un delta de 4%, la moyenne était de 24%, le pire était de 134%.
Dell XPS 16 Core Ultra 5 325 analyse audio
(+) | les haut-parleurs peuvent jouer relativement fort (85.3# dB)
Basses 100 - 315 Hz
(±) | basse réduite - en moyenne 6.1% inférieure à la médiane
(+) | les basses sont linéaires (5.6% delta à la fréquence précédente)
Médiums 400 - 2000 Hz
(+) | médiane équilibrée - seulement 3.2% de la médiane
(+) | les médiums sont linéaires (4.6% delta à la fréquence précédente)
Aiguës 2 - 16 kHz
(+) | des sommets équilibrés - à seulement 2.4% de la médiane
(+) | les aigus sont linéaires (3.3% delta à la fréquence précédente)
Globalement 100 - 16 000 Hz
(+) | le son global est linéaire (7% différence à la médiane)
Par rapport à la même classe
» 5% de tous les appareils testés de cette catégorie étaient meilleurs, 1% similaires, 94% pires
» Le meilleur avait un delta de 5%, la moyenne était de 17%, le pire était de 45%.
Par rapport à tous les appareils testés
» 1% de tous les appareils testés étaient meilleurs, 0% similaires, 99% pires
» Le meilleur avait un delta de 4%, la moyenne était de 24%, le pire était de 134%.
Asus ZenBook S16 UM5606GA analyse audio
(±) | le niveau sonore du haut-parleur est moyen mais bon (78.2# dB)
Basses 100 - 315 Hz
(+) | bonne basse - seulement 4.6% loin de la médiane
(+) | les basses sont linéaires (6.2% delta à la fréquence précédente)
Médiums 400 - 2000 Hz
(+) | médiane équilibrée - seulement 1.9% de la médiane
(+) | les médiums sont linéaires (5% delta à la fréquence précédente)
Aiguës 2 - 16 kHz
(+) | des sommets équilibrés - à seulement 2.1% de la médiane
(+) | les aigus sont linéaires (4.9% delta à la fréquence précédente)
Globalement 100 - 16 000 Hz
(+) | le son global est linéaire (7.6% différence à la médiane)
Par rapport à la même classe
» 7% de tous les appareils testés de cette catégorie étaient meilleurs, 2% similaires, 92% pires
» Le meilleur avait un delta de 5%, la moyenne était de 17%, le pire était de 45%.
Par rapport à tous les appareils testés
» 1% de tous les appareils testés étaient meilleurs, 0% similaires, 98% pires
» Le meilleur avait un delta de 4%, la moyenne était de 24%, le pire était de 134%.
Apple MacBook Air 15 M5 analyse audio
(+) | les haut-parleurs peuvent jouer relativement fort (84.8# dB)
Basses 100 - 315 Hz
(±) | basse réduite - en moyenne 6.8% inférieure à la médiane
(+) | les basses sont linéaires (6.6% delta à la fréquence précédente)
Médiums 400 - 2000 Hz
(+) | médiane équilibrée - seulement 2% de la médiane
(+) | les médiums sont linéaires (3.3% delta à la fréquence précédente)
Aiguës 2 - 16 kHz
(+) | des sommets équilibrés - à seulement 3.6% de la médiane
(+) | les aigus sont linéaires (3.2% delta à la fréquence précédente)
Globalement 100 - 16 000 Hz
(+) | le son global est linéaire (7.7% différence à la médiane)
Par rapport à la même classe
» 2% de tous les appareils testés de cette catégorie étaient meilleurs, 0% similaires, 98% pires
» Le meilleur avait un delta de 5%, la moyenne était de 18%, le pire était de 53%.
Par rapport à tous les appareils testés
» 1% de tous les appareils testés étaient meilleurs, 0% similaires, 98% pires
» Le meilleur avait un delta de 4%, la moyenne était de 24%, le pire était de 134%.
Microsoft Surface Laptop 7 15 Lunar Lake analyse audio
(±) | le niveau sonore du haut-parleur est moyen mais bon (78.8# dB)
Basses 100 - 315 Hz
(±) | basse réduite - en moyenne 9.3% inférieure à la médiane
(±) | la linéarité des basses est moyenne (8.4% delta à la fréquence précédente)
Médiums 400 - 2000 Hz
(+) | médiane équilibrée - seulement 4.4% de la médiane
(+) | les médiums sont linéaires (3% delta à la fréquence précédente)
Aiguës 2 - 16 kHz
(+) | des sommets équilibrés - à seulement 2.4% de la médiane
(+) | les aigus sont linéaires (4.1% delta à la fréquence précédente)
Globalement 100 - 16 000 Hz
(+) | le son global est linéaire (11.4% différence à la médiane)
Par rapport à la même classe
» 3% de tous les appareils testés de cette catégorie étaient meilleurs, 2% similaires, 95% pires
» Le meilleur avait un delta de 7%, la moyenne était de 21%, le pire était de 53%.
Par rapport à tous les appareils testés
» 7% de tous les appareils testés étaient meilleurs, 2% similaires, 91% pires
» Le meilleur avait un delta de 4%, la moyenne était de 24%, le pire était de 134%.
Lenovo ThinkPad X9-15 Aura Edition analyse audio
(+) | les haut-parleurs peuvent jouer relativement fort (87.5# dB)
Basses 100 - 315 Hz
(±) | basse réduite - en moyenne 12.5% inférieure à la médiane
(+) | les basses sont linéaires (6.8% delta à la fréquence précédente)
Médiums 400 - 2000 Hz
(+) | médiane équilibrée - seulement 3.1% de la médiane
(+) | les médiums sont linéaires (5.3% delta à la fréquence précédente)
Aiguës 2 - 16 kHz
(+) | des sommets équilibrés - à seulement 2.4% de la médiane
(+) | les aigus sont linéaires (3.3% delta à la fréquence précédente)
Globalement 100 - 16 000 Hz
(+) | le son global est linéaire (9.5% différence à la médiane)
Par rapport à la même classe
» 1% de tous les appareils testés de cette catégorie étaient meilleurs, 0% similaires, 99% pires
» Le meilleur avait un delta de 7%, la moyenne était de 21%, le pire était de 53%.
Par rapport à tous les appareils testés
» 4% de tous les appareils testés étaient meilleurs, 1% similaires, 96% pires
» Le meilleur avait un delta de 4%, la moyenne était de 24%, le pire était de 134%.
Consommation électrique
Le nouvel écran OLED (2.8K, 120 Hz) est extrêmement efficace et la consommation maximale en veille n'est que de 4.6 Watts, ce qui est identique au nouveau XPS 16 avec la dalle FHD inférieure à 60 Hz. En charge, nous pouvons mesurer jusqu'à 71 Watts, bien que nous ayons utilisé un PSU de 180W puisque notre unité a été livrée sans PSU. Il semble qu'il y ait une limitation, car la consommation à court terme devrait être plus élevée si l'on considère la consommation à court terme du CPU de 80 Watts. La consommation se stabilise rapidement à ~54W.
| Éteint/en veille | |
| Au repos | |
| Fortement sollicité |
|
Légende:
min: | |
| Samsung Galaxy Book6 Pro Ultra 7 356H, Intel Graphics 4 Xe3 PTL, Samsung PM9C1b MZVL8512HFLU-00BLL, OLED, 2880x1800, 16" | Dell XPS 16 Core Ultra 5 325 Ultra 5 325, Intel Graphics 4 Xe3 PTL, SK hynix PVC10 HFS512GEM4X182N, IPS, 1920x1200, 16" | Asus ZenBook S16 UM5606GA Ryzen AI 9 465, Radeon 880M, SanDisk PC SN5100S, OLED, 2880x1800, 16" | Apple MacBook Air 15 M5 M5 10-Core, M5 10-Core GPU, Apple SSD AP2048Z, IPS, 2880x1864, 15.3" | Microsoft Surface Laptop 7 15 Lunar Lake Core Ultra 7 268V, Arc 140V, Samsung PM9C1a MZ9L81T0HDLB, IPS, 2496x1664, 15" | Lenovo ThinkPad X9-15 Aura Edition Core Ultra 7 258V, Arc 140V, WD PC SN740 SDDQMQD-1T00, OLED, 2880x1800, 15.3" | Samsung Galaxy Book4 Pro 16 Ultra 7 155H, Arc 8-Core, Samsung PM9B1 512GB MZVL4512HBLU, OLED, 2880x1800, 16" | Moyenne Intel Graphics 4 Xe3 Panther Lake iGPU | Moyenne de la classe Multimedia | |
|---|---|---|---|---|---|---|---|---|---|
| Power Consumption | 5% | -47% | -23% | -35% | 4% | -26% | -4% | -111% | |
| Idle Minimum * (Watt) | 2.5 | 1.3 48% | 3.7 -48% | 2.2 12% | 3.2 -28% | 2.4 4% | 3.6 -44% | 2.15 ? 14% | 5.7 ? -128% |
| Idle Average * (Watt) | 4.2 | 4.5 -7% | 7.4 -76% | 11.7 -179% | 8.7 -107% | 3.9 7% | 5.7 -36% | 4.07 ? 3% | 10.1 ? -140% |
| Idle Maximum * (Watt) | 4.6 | 4.6 -0% | 9.5 -107% | 11.8 -157% | 9 -96% | 5.1 -11% | 6.1 -33% | 6.35 ? -38% | 12.5 ? -172% |
| Load Average * (Watt) | 42.2 | 36.5 14% | 57.9 -37% | 36.2 14% | 44.7 -6% | 42.5 -1% | 52.5 -24% | 37.8 ? 10% | 64.8 ? -54% |
| Cyberpunk 2077 ultra external monitor * (Watt) | 40.6 | 45.4 -12% | 57 -40% | 21.7 47% | 49.3 -21% | 40.2 1% | |||
| Cyberpunk 2077 ultra * (Watt) | 52.7 | 47.9 9% | 58.5 -11% | 23.5 55% | 51.1 3% | 43.5 17% | |||
| Load Maximum * (Watt) | 70.8 | 82.8 -17% | 76.9 -9% | 37.4 47% | 64.6 9% | 64.4 9% | 64.7 9% | 75.7 ? -7% | 112.3 ? -59% |
| Witcher 3 ultra * (Watt) | 46.6 |
* ... Moindre est la valeur, meilleures sont les performances
Consommation électrique Cyberpunk / Stress Test
Consommation électrique du moniteur externe
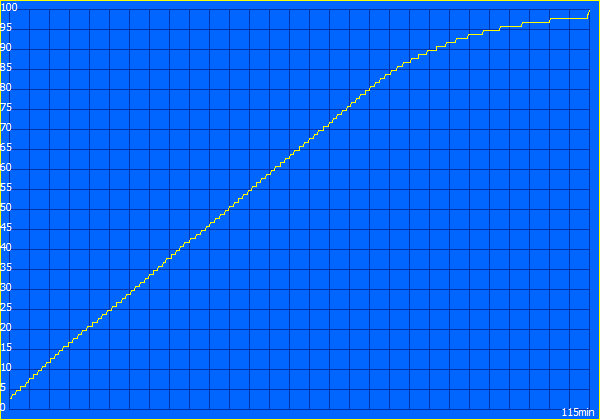
Autonomie de la batterie
La batterie de 80 Wh offre une bonne autonomie, mais gardez à l'esprit que notre test Wi-Fi utilise principalement des sites web lumineux, ce qui désavantage les écrans OLED par rapport aux panneaux IPS. Nous avons déterminé plus de 16 heures dans notre test Wi-Fi et encore près de 9 heures à pleine luminosité. Les concurrents parviennent à des durées d'utilisation encore plus longues, mais ils utilisent généralement des écrans de qualité inférieure. L'exception est le ThinkPad X9 15tandis que le Zenbook S16 ne dure pas aussi longtemps.

| Samsung Galaxy Book6 Pro Ultra 7 356H, Intel Graphics 4 Xe3 PTL, 78 Wh | Dell XPS 16 Core Ultra 5 325 Ultra 5 325, Intel Graphics 4 Xe3 PTL, 70 Wh | Asus ZenBook S16 UM5606GA Ryzen AI 9 465, Radeon 880M, 83 Wh | Apple MacBook Air 15 M5 M5 10-Core, M5 10-Core GPU, 66.5 Wh | Microsoft Surface Laptop 7 15 Lunar Lake Core Ultra 7 268V, Arc 140V, 64 Wh | Lenovo ThinkPad X9-15 Aura Edition Core Ultra 7 258V, Arc 140V, 80 Wh | Samsung Galaxy Book4 Pro 16 Ultra 7 155H, Arc 8-Core, 76 Wh | Moyenne de la classe Multimedia | |
|---|---|---|---|---|---|---|---|---|
| Battery Runtime | 63% | -16% | -9% | 5% | 8% | -25% | -24% | |
| WiFi Websurfing (h) | 16.3 | 26.6 63% | 13.1 -20% | 17.2 6% | 17.7 9% | 17.5 7% | 10.7 -34% | 12 ? -26% |
| WiFi Websurfing max. Brightness (h) | 8.8 | 7.8 -11% | 6.7 -24% | 8.8 0% | 9.5 8% | 7.5 -15% | 6.95 ? -21% |
Notebookcheck Rating
Samsung Galaxy Book6 Pro
- 03/31/2026 v8
Andreas Osthoff
 Total Sustainability Score:
 Comparaison avec des concurrents potentiels
Image | Modèle | Prix | Poids | Épaisseur | Écran |
|---|---|---|---|---|---|
1. 86.3% 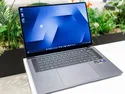 | Samsung Galaxy Book6 Pro Intel Core Ultra 7 356H ⎘ Intel Graphics 4 Xe3 Panther Lake iGPU ⎘ 32 Go Mémoire, 512 Go SSD | Amazon: Prix de liste: 2199€ | 1.6 kg | 11.9 mm | 16.00" 2880x1800 212 PPI OLED |
2. 84.2% 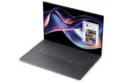 | Dell XPS 16 Core Ultra 5 325 Intel Core Ultra 5 325 ⎘ Intel Graphics 4 Xe3 Panther Lake iGPU ⎘ 16 Go Mémoire, 512 Go SSD | Amazon: 1. $2,999.00 Dell Premium 16 (XPS 16 2025... 2. $2,699.99 Dell XPS 16 9640 Laptop | In... 3. $1,998.99 Dell Premium 16 (Previously ... Prix de liste: 1600 USD | 1.7 kg | 15.4 mm | 16.00" 1920x1200 142 PPI IPS |
3. 86.6% 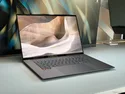 | Asus ZenBook S16 UM5606GA AMD Ryzen AI 9 465 ⎘ AMD Radeon 880M ⎘ 32 Go Mémoire, 1024 Go SSD | Amazon: 1. $1,299.99 ASUS Zenbook S 16 AI Laptop ... 2. $1,299.99 ASUS Zenbook S 16 Touchscree... 3. $1,229.99 ASUS Zenbook S 16 Laptop, AM... Prix de liste: 1799€ | 1.5 kg | 12.9 mm | 16.00" 2880x1800 212 PPI OLED |
4. 91.6% 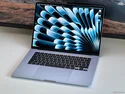 | Apple MacBook Air 15 M5 Apple M5 10-Core ⎘ Apple M5 10-Core GPU ⎘ 32 Go Mémoire, 2048 Go SSD | Amazon: | 1.5 kg | 11.5 mm | 15.30" 2880x1864 224 PPI IPS |
5. 87.4% 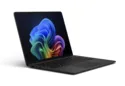 | Microsoft Surface Laptop 7 15 Lunar Lake Intel Core Ultra 7 268V ⎘ Intel Arc Graphics 140V ⎘ 32 Go Mémoire, 1024 Go SSD | Amazon: Prix de liste: 2760€ | 1.7 kg | 18.3 mm | 15.00" 2496x1664 200 PPI IPS |
6. 90.1% 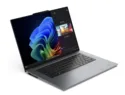 | Lenovo ThinkPad X9-15 Aura Edition Intel Core Ultra 7 258V ⎘ Intel Arc Graphics 140V ⎘ 32 Go Mémoire, 1024 Go SSD | Amazon: Prix de liste: 1989€ | 1.4 kg | 17.7 mm | 15.30" 2880x1800 222 PPI OLED |
Transparency
La sélection des appareils à examiner est effectuée par notre équipe éditoriale. L'échantillon de test a été prêté à l'auteur par le fabricant ou le détaillant pour les besoins de cet examen. Le prêteur n'a pas eu d'influence sur cette évaluation et le fabricant n'a pas reçu de copie de cette évaluation avant sa publication. Il n'y avait aucune obligation de publier cet article. En tant que média indépendant, Notebookcheck n'est pas soumis à l'autorité des fabricants, des détaillants ou des éditeurs.
Voici comment Notebookcheck teste
Chaque année, Notebookcheck examine de manière indépendante des centaines d'ordinateurs portables et de smartphones en utilisant des procédures standardisées afin de garantir que tous les résultats sont comparables. Nous avons continuellement développé nos méthodes de test depuis environ 20 ans et avons établi des normes industrielles dans le processus. Dans nos laboratoires de test, des équipements de mesure de haute qualité sont utilisés par des techniciens et des rédacteurs expérimentés. Ces tests impliquent un processus de validation en plusieurs étapes. Notre système d'évaluation complexe repose sur des centaines de mesures et de points de référence bien fondés, ce qui garantit l'objectivité.
