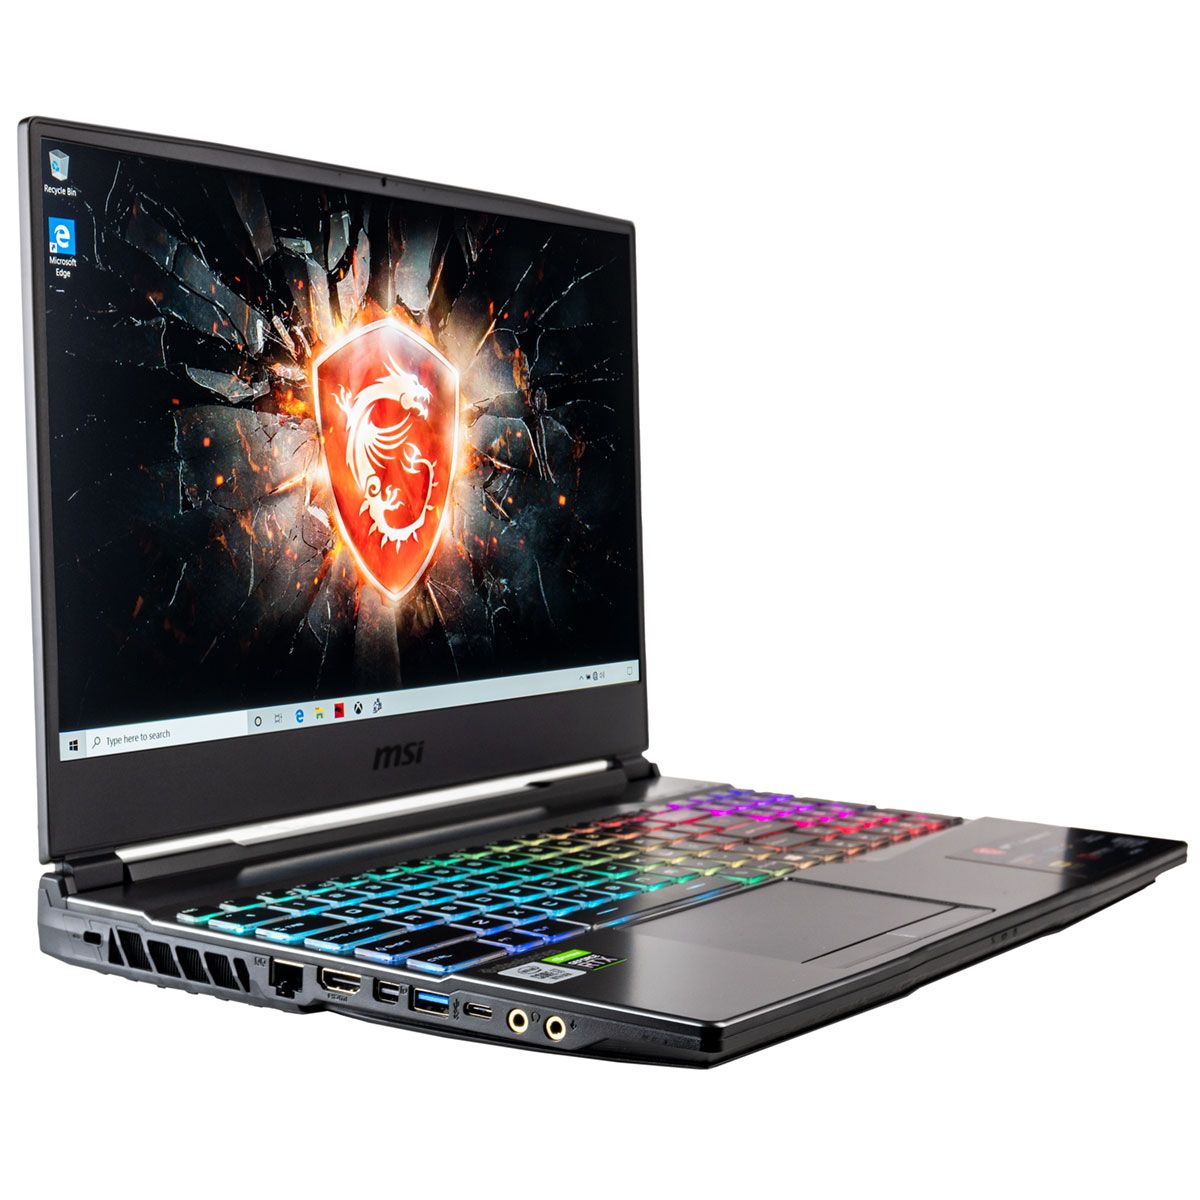
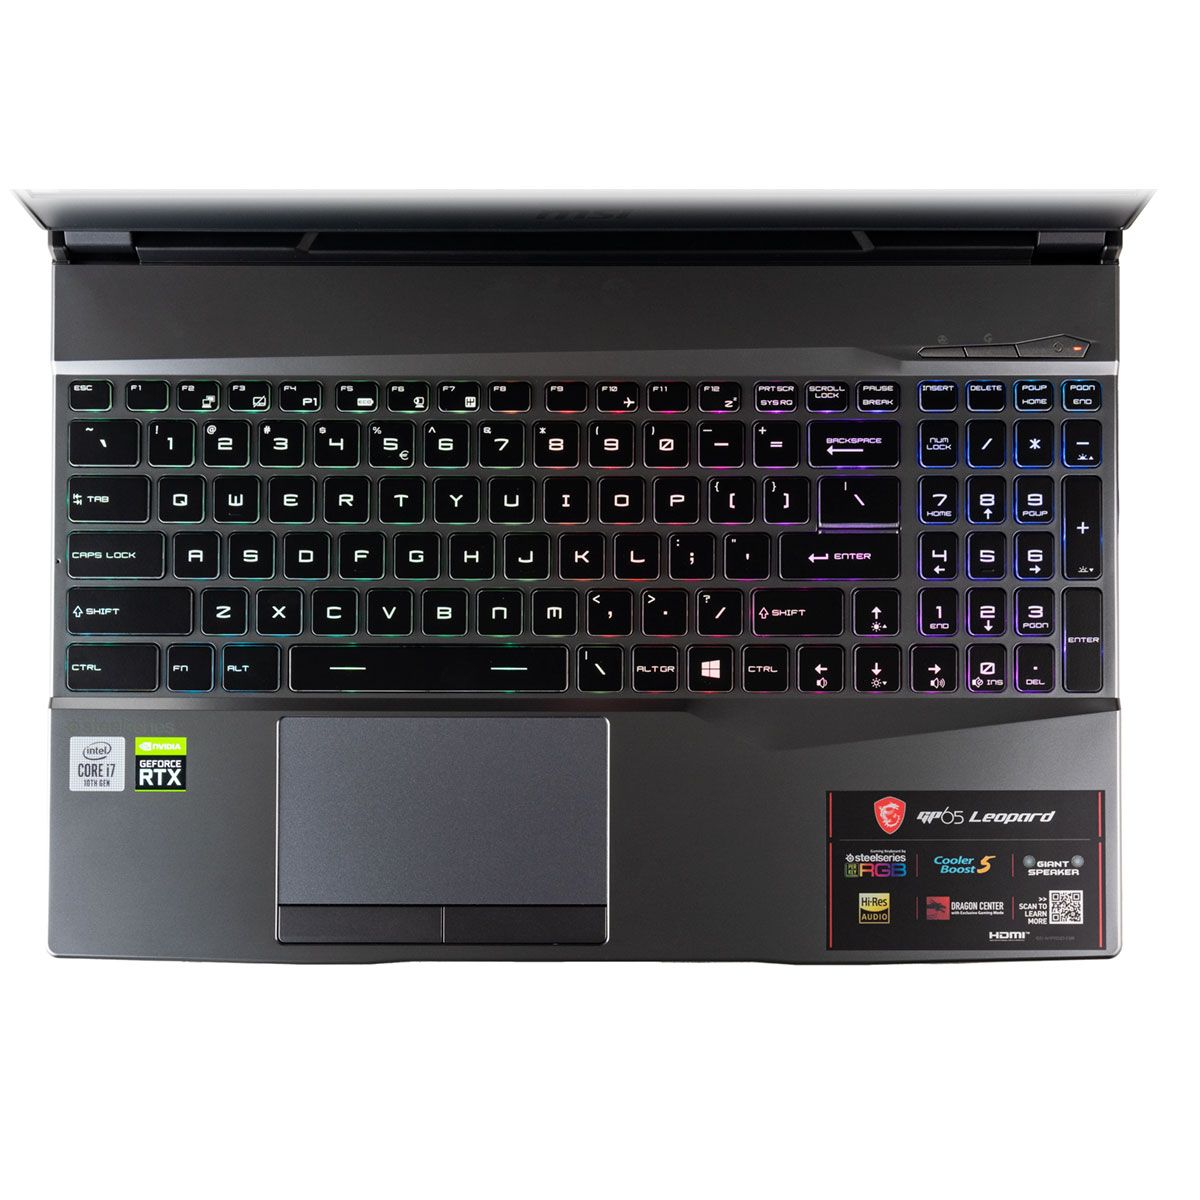
MSI GP65 10SFK (i7-10750H, RTX 2070, FHD)
Note | Date | Modèle | Poids | Épaisseur | Taille | Résolution | Prix |
|---|---|---|---|---|---|---|---|
| 83.2 % v7 (old) | 06/20 | MSI GP65 10SFK-047US i7-10750H, GeForce RTX 2070 Mobile | 2.3 kg | 27.5 mm | 15.60" | 1920x1080 | |
| 82.1 % v7 (old) | 10/19 | Asus Strix Scar III G531GW-AZ062T i7-9750H, GeForce RTX 2070 Mobile | 2.4 kg | 25 mm | 15.60" | 1920x1080 | |
| 80.4 % v6 (old) | 08/19 | Asus TUF FX505DT-EB73 R7 3750H, GeForce GTX 1650 Mobile | 2.2 kg | 26.8 mm | 15.60" | 1920x1080 | |
| 86.2 % v6 (old) | 06/19 | HP Omen 15-dc1303ng i7-8750H, GeForce RTX 2070 Max-Q | 2.4 kg | 25 mm | 15.60" | 1920x1080 | |
| 85.5 % v6 (old) | 08/19 | Aorus 15-SA i7-9750H, GeForce GTX 1660 Ti Mobile | 2.1 kg | 24.4 mm | 15.60" | 1920x1080 |
| SD Card Reader | |
| average JPG Copy Test (av. of 3 runs) | |
| HP Omen 15-dc1303ng (Toshiba Exceria Pro SDXC 64 GB UHS-II) | |
| MSI GP65 10SFK-047US (Toshiba Exceria Pro SDXC 64 GB UHS-II) | |
| MSI GP65 Leopard 9SE-225US | |
| MSI GP62 7REX-1045US (Toshiba Exceria Pro SDXC 64 GB UHS-II) | |
| maximum AS SSD Seq Read Test (1GB) | |
| HP Omen 15-dc1303ng (Toshiba Exceria Pro SDXC 64 GB UHS-II) | |
| MSI GP65 10SFK-047US (Toshiba Exceria Pro SDXC 64 GB UHS-II) | |
| MSI GP65 Leopard 9SE-225US | |
| MSI GP62 7REX-1045US (Toshiba Exceria Pro SDXC 64 GB UHS-II) | |


| |||||||||||||||||||||||||
Homogénéité de la luminosité: 87 %
Valeur mesurée au centre, sur batterie: 384.9 cd/m²
Contraste: 574:1 (Valeurs des noirs: 0.67 cd/m²)
ΔE ColorChecker Calman: 2.43 | ∀{0.5-29.43 Ø4.73}
calibrated: 2.03
ΔE Greyscale Calman: 2.6 | ∀{0.09-98 Ø4.97}
93.9% sRGB (Argyll 1.6.3 3D)
59.7% AdobeRGB 1998 (Argyll 1.6.3 3D)
65.1% AdobeRGB 1998 (Argyll 3D)
94.4% sRGB (Argyll 3D)
63.5% Display P3 (Argyll 3D)
Gamma: 2.2
CCT: 6981 K
| MSI GP65 10SFK-047US LG Philips LP156WFG-SPB3, IPS, 15.6", 1920x1080 | MSI GP65 Leopard 9SE-225US LG Philips LGD0625, IPS, 15.6", 1920x1080 | Asus Strix Scar III G531GW-AZ062T Sharp LQ156M1JW09 (SHP14D3), IPS, 15.6", 1920x1080 | Asus TUF FX505DT-EB73 Panda LM156LF-GL, IPS, 15.6", 1920x1080 | HP Omen 15-dc1303ng LG Philips LGD05C0, IPS, 15.6", 1920x1080 | MSI GP62 7REX-1045US CMN N156HGE-EAL, TN LED, 15.6", 1920x1080 | |
|---|---|---|---|---|---|---|
| Display | 2% | 4% | -37% | -0% | 23% | |
| Display P3 Coverage (%) | 63.5 | 64.8 2% | 66.2 4% | 39.56 -38% | 63.8 0% | 85.8 35% |
| sRGB Coverage (%) | 94.4 | 96.2 2% | 97.1 3% | 59.5 -37% | 93.4 -1% | 100 6% |
| AdobeRGB 1998 Coverage (%) | 65.1 | 66.3 2% | 67.6 4% | 40.91 -37% | 65 0% | 84.2 29% |
| Response Times | 11% | -10% | -161% | -14% | -174% | |
| Response Time Grey 50% / Grey 80% * (ms) | 10.4 ? | 9.6 ? 8% | 15 ? -44% | 30.4 ? -192% | 14 ? -35% | 34.4 ? -231% |
| Response Time Black / White * (ms) | 12 ? | 10.4 ? 13% | 9 ? 25% | 27.6 ? -130% | 11 ? 8% | 26 ? -117% |
| PWM Frequency (Hz) | 250 ? | 200 ? | ||||
| Screen | 15% | -16% | -61% | 2% | -104% | |
| Brightness middle (cd/m²) | 384.9 | 348.3 -10% | 309 -20% | 286.2 -26% | 316 -18% | 265.7 -31% |
| Brightness (cd/m²) | 358 | 327 -9% | 284 -21% | 267 -25% | 295 -18% | 243 -32% |
| Brightness Distribution (%) | 87 | 85 -2% | 88 1% | 84 -3% | 84 -3% | 87 0% |
| Black Level * (cd/m²) | 0.67 | 0.4 40% | 0.42 37% | 0.33 51% | 0.42 37% | 0.63 6% |
| Contrast (:1) | 574 | 871 52% | 736 28% | 867 51% | 752 31% | 422 -26% |
| Colorchecker dE 2000 * | 2.43 | 1.6 34% | 3.99 -64% | 5.45 -124% | 2.7 -11% | 9.6 -295% |
| Colorchecker dE 2000 max. * | 4.58 | 5.07 -11% | 8.3 -81% | 18.08 -295% | 5.65 -23% | 18.5 -304% |
| Colorchecker dE 2000 calibrated * | 2.03 | 1 51% | 1.12 45% | 4.47 -120% | 1.58 22% | |
| Greyscale dE 2000 * | 2.6 | 2.3 12% | 5.43 -109% | 5.3 -104% | 2.35 10% | 12.7 -388% |
| Gamma | 2.2 100% | 2.203 100% | 2.57 86% | 2.1 105% | 2.41 91% | 2.01 109% |
| CCT | 6981 93% | 6707 97% | 7767 84% | 7679 85% | 6904 94% | 13654 48% |
| Color Space (Percent of AdobeRGB 1998) (%) | 59.7 | 61 2% | 63 6% | 37.6 -37% | 60 1% | 76 27% |
| Color Space (Percent of sRGB) (%) | 93.9 | 96 2% | 97 3% | 59.1 -37% | 93 -1% | 100 6% |
| Moyenne finale (programmes/paramètres) | 9% /
12% | -7% /
-11% | -86% /
-69% | -4% /
-0% | -85% /
-88% |
* ... Moindre est la valeur, meilleures sont les performances
Temps de réponse de l'écran
| ↔ Temps de réponse noir à blanc | ||
|---|---|---|
| 12 ms ... hausse ↗ et chute ↘ combinées | ↗ 6.8 ms hausse | 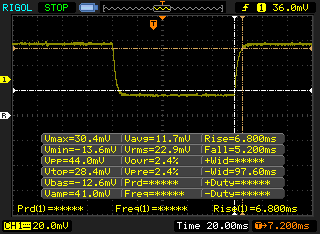 |
| ↘ 5.2 ms chute | ||
| L'écran montre de bons temps de réponse, mais insuffisant pour du jeu compétitif. En comparaison, tous les appareils testés affichent entre 0.1 (minimum) et 240 (maximum) ms. » 31 % des appareils testés affichent de meilleures performances. Cela signifie que les latences relevées sont meilleures que la moyenne (19.9 ms) de tous les appareils testés. | ||
| ↔ Temps de réponse gris 50% à gris 80% | ||
| 10.4 ms ... hausse ↗ et chute ↘ combinées | ↗ 6.4 ms hausse | 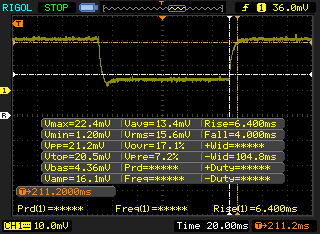 |
| ↘ 4 ms chute | ||
| L'écran montre de bons temps de réponse, mais insuffisant pour du jeu compétitif. En comparaison, tous les appareils testés affichent entre 0.165 (minimum) et 636 (maximum) ms. » 24 % des appareils testés affichent de meilleures performances. Cela signifie que les latences relevées sont meilleures que la moyenne (31.1 ms) de tous les appareils testés. | ||
Scintillement / MLI (Modulation de largeur d'impulsion)
| Scintillement / MLI (Modulation de largeur d'impulsion) non décelé |  | ||
En comparaison, 52 % des appareils testés n'emploient pas MDI pour assombrir leur écran. Nous avons relevé une moyenne à 7794 (minimum : 5 - maximum : 343500) Hz dans le cas où une MDI était active. | |||
Cinebench R15: CPU Single 64Bit | CPU Multi 64Bit
Blender: v2.79 BMW27 CPU
7-Zip 18.03: 7z b 4 -mmt1 | 7z b 4
Geekbench 5.5: Single-Core | Multi-Core
HWBOT x265 Benchmark v2.2: 4k Preset
LibreOffice : 20 Documents To PDF
R Benchmark 2.5: Overall mean
| Cinebench R20 / CPU (Multi Core) | |
| Asus Zephyrus G14 GA401IV | |
| Eurocom Nightsky RX15 | |
| AMD Ryzen 1800X - Asus Crosshair VI Hero | |
| MSI GE65 Raider 9SF-049US | |
| Gigabyte Aero 17 HDR XB | |
| MSI GP65 10SFK-047US | |
| Moyenne Intel Core i7-9750H (2017 - 3133, n=55) | |
| Schenker Key 16 | |
| MSI GF75 Thin 10SCXR | |
| MSI GF63 Thin 9SC | |
| MSI Alpha 15 A3DDK-034 | |
| Cinebench R20 / CPU (Single Core) | |
| Gigabyte Aero 17 HDR XB | |
| Asus Zephyrus G14 GA401IV | |
| Eurocom Nightsky RX15 | |
| MSI GE65 Raider 9SF-049US | |
| MSI GP65 10SFK-047US | |
| Moyenne Intel Core i7-9750H (416 - 486, n=55) | |
| MSI GF75 Thin 10SCXR | |
| MSI GF63 Thin 9SC | |
| Schenker Key 16 | |
| AMD Ryzen 1800X - Asus Crosshair VI Hero | |
| MSI Alpha 15 A3DDK-034 | |
| Cinebench R15 / CPU Single 64Bit | |
| Gigabyte Aero 17 HDR XB | |
| Eurocom Nightsky RX15 | |
| MSI GE65 Raider 9SF-049US | |
| MSI GP65 Leopard 9SE-225US | |
| Asus Zephyrus G14 GA401IV | |
| MSI GP65 10SFK-047US | |
| Moyenne Intel Core i7-9750H (170 - 194, n=82) | |
| MSI GF75 Thin 10SCXR | |
| MSI GF63 Thin 9SC | |
| Schenker Key 16 | |
| AMD Ryzen 1800X - Asus Crosshair VI Hero | |
| MSI Alpha 15 A3DDK-034 | |
| Cinebench R15 / CPU Multi 64Bit | |
| Asus Zephyrus G14 GA401IV | |
| Eurocom Nightsky RX15 | |
| Gigabyte Aero 17 HDR XB | |
| MSI GE65 Raider 9SF-049US | |
| AMD Ryzen 1800X - Asus Crosshair VI Hero | |
| MSI GP65 10SFK-047US | |
| MSI GP65 Leopard 9SE-225US | |
| Moyenne Intel Core i7-9750H (952 - 1306, n=85) | |
| Schenker Key 16 | |
| MSI GF75 Thin 10SCXR | |
| MSI GF63 Thin 9SC | |
| MSI Alpha 15 A3DDK-034 | |
| Blender / v2.79 BMW27 CPU | |
| MSI GF75 Thin 10SCXR | |
| Eurocom Nightsky RX15 | |
| Moyenne Intel Core i7-9750H (342 - 495, n=21) | |
| MSI GP65 10SFK-047US | |
| Gigabyte Aero 17 HDR XB | |
| Asus Zephyrus G14 GA401IV | |
| AMD Ryzen 1800X - Asus Crosshair VI Hero | |
| 7-Zip 18.03 / 7z b 4 -mmt1 | |
| Gigabyte Aero 17 HDR XB | |
| Eurocom Nightsky RX15 | |
| MSI GP65 10SFK-047US | |
| Moyenne Intel Core i7-9750H (4580 - 5090, n=21) | |
| MSI GF75 Thin 10SCXR | |
| Asus Zephyrus G14 GA401IV | |
| 7-Zip 18.03 / 7z b 4 | |
| Asus Zephyrus G14 GA401IV | |
| Gigabyte Aero 17 HDR XB | |
| Eurocom Nightsky RX15 | |
| MSI GP65 10SFK-047US | |
| Moyenne Intel Core i7-9750H (28512 - 35174, n=21) | |
| MSI GF75 Thin 10SCXR | |
| Geekbench 5.5 / Single-Core | |
| Gigabyte Aero 17 HDR XB | |
| Asus Zephyrus G14 GA401IV | |
| MSI GP65 10SFK-047US | |
| Moyenne Intel Core i7-9750H (1117 - 1251, n=13) | |
| MSI GF75 Thin 10SCXR | |
| MSI Alpha 15 A3DDK-034 | |
| Geekbench 5.5 / Multi-Core | |
| Asus Zephyrus G14 GA401IV | |
| Gigabyte Aero 17 HDR XB | |
| MSI GP65 10SFK-047US | |
| Moyenne Intel Core i7-9750H (4859 - 6262, n=13) | |
| MSI GF75 Thin 10SCXR | |
| MSI Alpha 15 A3DDK-034 | |
| HWBOT x265 Benchmark v2.2 / 4k Preset | |
| Eurocom Nightsky RX15 | |
| Asus Zephyrus G14 GA401IV | |
| Gigabyte Aero 17 HDR XB | |
| MSI GP65 10SFK-047US | |
| Moyenne Intel Core i7-9750H (7.1 - 10.7, n=21) | |
| MSI GF75 Thin 10SCXR | |
| LibreOffice / 20 Documents To PDF | |
| MSI GP65 10SFK-047US | |
| Gigabyte Aero 17 HDR XB | |
| Moyenne Intel Core i7-9750H (54.5 - 64.7, n=9) | |
| MSI GF75 Thin 10SCXR | |
| R Benchmark 2.5 / Overall mean | |
| MSI GF75 Thin 10SCXR | |
| Moyenne Intel Core i7-9750H (0.608 - 0.695, n=14) | |
| MSI GP65 10SFK-047US | |
| Gigabyte Aero 17 HDR XB | |
* ... Moindre est la valeur, meilleures sont les performances
| PCMark 8 Home Score Accelerated v2 | 4516 points | |
| PCMark 8 Work Score Accelerated v2 | 5894 points | |
| PCMark 10 Score | 6254 points | |
Aide | ||
| DPC Latencies / LatencyMon - interrupt to process latency (max), Web, Youtube, Prime95 | |
| MSI GP65 10SFK-047US | |
* ... Moindre est la valeur, meilleures sont les performances
| MSI GP65 10SFK-047US Samsung SSD PM981 MZVLB1T0HALR | Asus Strix Scar III G531GW-AZ062T Intel SSD 660p SSDPEKNW512G8 | Asus TUF FX505DT-EB73 Intel SSD 660p SSDPEKNW512G8 | HP Omen 15-dc1303ng Samsung SSD PM981 MZVLB256HAHQ | MSI GP62 7REX-1045US Toshiba NVMe THNSN5128GP | MSI GP65 Leopard 9SE-225US Toshiba KBG30ZMT512G | |
|---|---|---|---|---|---|---|
| AS SSD | -79% | -46% | -19% | -49% | -94% | |
| Seq Read (MB/s) | 2066 | 1163 -44% | 1019 -51% | 2485 20% | 1848 -11% | 1307 -37% |
| Seq Write (MB/s) | 2418 | 919 -62% | 889 -63% | 1575 -35% | 601 -75% | 730 -70% |
| 4K Read (MB/s) | 54.2 | 48.88 -10% | 48.22 -11% | 53.4 -1% | 35.84 -34% | 27.58 -49% |
| 4K Write (MB/s) | 129 | 90.1 -30% | 115.5 -10% | 113.5 -12% | 112 -13% | 80.3 -38% |
| 4K-64 Read (MB/s) | 1865 | 323.8 -83% | 321.5 -83% | 725 -61% | 628 -66% | 878 -53% |
| 4K-64 Write (MB/s) | 1878 | 403.8 -78% | 787 -58% | 1371 -27% | 428.2 -77% | 246.8 -87% |
| Access Time Read * (ms) | 0.042 | 0.24 -471% | 0.065 -55% | 0.059 -40% | 0.079 -88% | 0.231 -450% |
| Access Time Write * (ms) | 0.091 | 0.046 49% | 0.047 48% | 0.032 65% | 0.034 63% | 0.223 -145% |
| Score Read (Points) | 2126 | 489 -77% | 472 -78% | 1027 -52% | 849 -60% | 1036 -51% |
| Score Write (Points) | 2249 | 586 -74% | 992 -56% | 1642 -27% | 600 -73% | 400 -82% |
| Score Total (Points) | 5482 | 1332 -76% | 1717 -69% | 3163 -42% | 1829 -67% | 1940 -65% |
| Copy ISO MB/s (MB/s) | 2927 | 1269 -57% | 942 -68% | 1128 -61% | 993 -66% | |
| Copy Program MB/s (MB/s) | 728 | 452.8 -38% | 444.5 -39% | 326.3 -55% | 309.5 -57% | |
| Copy Game MB/s (MB/s) | 1614 | 755 -53% | 867 -46% | 442.8 -73% | 582 -64% | |
| CrystalDiskMark 5.2 / 6 | -34% | -33% | -27% | -25% | -33% | |
| Write 4K (MB/s) | 145 | 133.3 -8% | 137.5 -5% | 50.2 -65% | 158.4 9% | 99.3 -32% |
| Read 4K (MB/s) | 46.84 | 55.3 18% | 57 22% | 35.32 -25% | 45.04 -4% | 46.96 0% |
| Write Seq (MB/s) | 2377 | 980 -59% | 984 -59% | 991 -58% | 622 -74% | |
| Read Seq (MB/s) | 2185 | 1406 -36% | 1564 -28% | 1526 -30% | 1592 -27% | |
| Write 4K Q32T1 (MB/s) | 463.5 | 286.3 -38% | 237.4 -49% | 445.1 -4% | 434.2 -6% | 240.1 -48% |
| Read 4K Q32T1 (MB/s) | 527 | 331.5 -37% | 340.7 -35% | 526 0% | 590 12% | 581 10% |
| Write Seq Q32T1 (MB/s) | 2395 | 976 -59% | 959 -60% | 1647 -31% | 630 -74% | 686 -71% |
| Read Seq Q32T1 (MB/s) | 3470 | 1520 -56% | 1732 -50% | 3427 -1% | 2108 -39% | 1581 -54% |
| Write 4K Q8T8 (MB/s) | 748 | 268.1 | ||||
| Read 4K Q8T8 (MB/s) | 344.6 | 977 | ||||
| Moyenne finale (programmes/paramètres) | -57% /
-63% | -40% /
-41% | -23% /
-22% | -37% /
-41% | -64% /
-75% |
* ... Moindre est la valeur, meilleures sont les performances

| 3DMark 06 Standard Score | 39513 points | |
| 3DMark 11 Performance | 21386 points | |
| 3DMark Cloud Gate Standard Score | 39359 points | |
| 3DMark Fire Strike Score | 17768 points | |
| 3DMark Time Spy Score | 7404 points | |
Aide | ||
| Shadow of the Tomb Raider | |
| 1280x720 Lowest Preset | |
| Eurocom Sky X4C i9-9900KS | |
| MSI GF65 9SD | |
| MSI GP65 10SFK-047US | |
| Walmart EVOO Gaming 17 | |
| MSI RTX 2080 Gaming X Trio | |
| Moyenne NVIDIA GeForce RTX 2070 Mobile (91.3 - 160, n=9) | |
| Asus G752VS | |
| Alienware 17 R4 | |
| 1920x1080 Medium Preset | |
| Eurocom Sky X4C i9-9900KS | |
| MSI RTX 2080 Gaming X Trio | |
| MSI GP65 10SFK-047US | |
| Moyenne NVIDIA GeForce RTX 2070 Mobile (86 - 114, n=10) | |
| Walmart EVOO Gaming 17 | |
| Asus G752VS | |
| Alienware 17 R4 | |
| MSI GF65 9SD | |
| 1920x1080 Highest Preset AA:T | |
| Eurocom Sky X4C i9-9900KS | |
| MSI RTX 2080 Gaming X Trio | |
| MSI GP65 10SFK-047US | |
| Moyenne NVIDIA GeForce RTX 2070 Mobile (74.2 - 97, n=11) | |
| Walmart EVOO Gaming 17 | |
| Alienware 17 R4 | |
| Asus G752VS | |
| MSI GF65 9SD | |
| The Witcher 3 | |
| 1024x768 Low Graphics & Postprocessing | |
| Eurocom Sky X4C i9-9900KS | |
| MSI GP65 10SFK-047US | |
| MSI RTX 2080 Gaming X Trio | |
| Walmart EVOO Gaming 17 | |
| Moyenne NVIDIA GeForce RTX 2070 Mobile (193.9 - 357, n=12) | |
| MSI GF65 9SD | |
| 1366x768 Medium Graphics & Postprocessing | |
| Eurocom Sky X4C i9-9900KS | |
| MSI RTX 2080 Gaming X Trio | |
| MSI GP65 10SFK-047US | |
| Moyenne NVIDIA GeForce RTX 2070 Mobile (154 - 250, n=12) | |
| Walmart EVOO Gaming 17 | |
| MSI GF65 9SD | |
| 1920x1080 High Graphics & Postprocessing (Nvidia HairWorks Off) | |
| MSI RTX 2080 Gaming X Trio | |
| Eurocom Sky X4C i9-9900KS | |
| MSI GP65 10SFK-047US | |
| Moyenne NVIDIA GeForce RTX 2070 Mobile (115.7 - 160.8, n=17) | |
| Walmart EVOO Gaming 17 | |
| MSI GF65 9SD | |
| 1920x1080 Ultra Graphics & Postprocessing (HBAO+) | |
| MSI RTX 2080 Gaming X Trio | |
| Eurocom Sky X4C i9-9900KS | |
| MSI GP65 10SFK-047US | |
| Moyenne NVIDIA GeForce RTX 2070 Mobile (64 - 82.1, n=21) | |
| Walmart EVOO Gaming 17 | |
| MSI GF65 9SD | |
| Bas | Moyen | Élevé | Ultra | |
|---|---|---|---|---|
| BioShock Infinite (2013) | 352 | 316 | 288.9 | 164.6 |
| The Witcher 3 (2015) | 326.4 | 244.5 | 160.8 | 82.1 |
| Dota 2 Reborn (2015) | 152 | 139 | 128 | 120 |
| X-Plane 11.11 (2018) | 102 | 91.7 | 77.5 | |
| Shadow of the Tomb Raider (2018) | 135 | 107 | 102 | 93 |
| MSI GP65 10SFK-047US GeForce RTX 2070 Mobile, i7-10750H, Samsung SSD PM981 MZVLB1T0HALR | Asus Strix Scar III G531GW-AZ062T GeForce RTX 2070 Mobile, i7-9750H, Intel SSD 660p SSDPEKNW512G8 | Asus TUF FX505DT-EB73 GeForce GTX 1650 Mobile, R7 3750H, Intel SSD 660p SSDPEKNW512G8 | HP Omen 15-dc1303ng GeForce RTX 2070 Max-Q, i7-8750H, Samsung SSD PM981 MZVLB256HAHQ | MSI GP62 7REX-1045US GeForce GTX 1050 Ti Mobile, i7-7700HQ, Toshiba NVMe THNSN5128GP | MSI GP65 Leopard 9SE-225US GeForce RTX 2060 Mobile, i7-9750H, Toshiba KBG30ZMT512G | |
|---|---|---|---|---|---|---|
| Noise | 5% | 10% | 3% | 7% | 12% | |
| arrêt / environnement * (dB) | 29.3 | 30 -2% | 28.2 4% | 30.5 -4% | 28 4% | 28.2 4% |
| Idle Minimum * (dB) | 31.9 | 30.6 4% | 28.2 12% | 32.8 -3% | 32.2 -1% | 29.5 8% |
| Idle Average * (dB) | 31.9 | 30.6 4% | 28.2 12% | 32.8 -3% | 32.2 -1% | 29.6 7% |
| Idle Maximum * (dB) | 33.5 | 37.7 -13% | 31.4 6% | 32.8 2% | 32.2 4% | 29.6 12% |
| Load Average * (dB) | 47 | 36.5 22% | 39.8 15% | 42.5 10% | 40.9 13% | 33 30% |
| Witcher 3 ultra * (dB) | 53.8 | 52.1 3% | 47 13% | 45.4 16% | 47.2 12% | |
| Load Maximum * (dB) | 56.7 | 48.1 15% | 50.2 11% | 47.5 16% | 48.6 14% | 52 8% |
* ... Moindre est la valeur, meilleures sont les performances
Degré de la nuisance sonore
| Au repos |
| 31.9 / 31.9 / 33.5 dB(A) |
| Fortement sollicité |
| 47 / 56.7 dB(A) |
 | ||
30 dB silencieux 40 dB(A) audible 50 dB(A) bruyant |
||
min: | ||
(-) La température maximale du côté supérieur est de 49.4 °C / 121 F, par rapport à la moyenne de 40.4 °C / 105 F, allant de 21.2 à 68.8 °C pour la classe Gaming.
(-) Le fond chauffe jusqu'à un maximum de 57.2 °C / 135 F, contre une moyenne de 43.2 °C / 110 F
(+) En utilisation inactive, la température moyenne du côté supérieur est de 30.6 °C / 87 F, par rapport à la moyenne du dispositif de 33.9 °C / 93 F.
(±) En jouant à The Witcher 3, la température moyenne du côté supérieur est de 34.3 °C / 94 F, alors que la moyenne de l'appareil est de 33.9 °C / 93 F.
(+) Les repose-poignets et le pavé tactile sont plus froids que la température de la peau avec un maximum de 30.8 °C / 87.4 F et sont donc froids au toucher.
(±) La température moyenne de la zone de l'appui-paume de dispositifs similaires était de 28.8 °C / 83.8 F (-2 °C / #-3.6 F).
MSI GP65 10SFK-047US analyse audio
(+) | les haut-parleurs peuvent jouer relativement fort (90.3# dB)
Basses 100 - 315 Hz
(-) | presque aucune basse - en moyenne 28.5% plus bas que la médiane
(+) | les basses sont linéaires (6.2% delta à la fréquence précédente)
Médiums 400 - 2000 Hz
(±) | médiane réduite - en moyenne 8.2% inférieure à la médiane
(±) | la linéarité des médiums est moyenne (9.1% delta à la fréquence précédente)
Aiguës 2 - 16 kHz
(+) | des sommets équilibrés - à seulement 1.8% de la médiane
(+) | les aigus sont linéaires (4% delta à la fréquence précédente)
Globalement 100 - 16 000 Hz
(±) | la linéarité du son global est moyenne (23.5% de différence avec la médiane)
Par rapport à la même classe
» 85% de tous les appareils testés de cette catégorie étaient meilleurs, 5% similaires, 10% pires
» Le meilleur avait un delta de 6%, la moyenne était de 18%, le pire était de 132%.
Par rapport à tous les appareils testés
» 70% de tous les appareils testés étaient meilleurs, 6% similaires, 24% pires
» Le meilleur avait un delta de 4%, la moyenne était de 24%, le pire était de 134%.
Apple MacBook 12 (Early 2016) 1.1 GHz analyse audio
(+) | les haut-parleurs peuvent jouer relativement fort (83.6# dB)
Basses 100 - 315 Hz
(±) | basse réduite - en moyenne 11.3% inférieure à la médiane
(±) | la linéarité des basses est moyenne (14.2% delta à la fréquence précédente)
Médiums 400 - 2000 Hz
(+) | médiane équilibrée - seulement 2.4% de la médiane
(+) | les médiums sont linéaires (5.5% delta à la fréquence précédente)
Aiguës 2 - 16 kHz
(+) | des sommets équilibrés - à seulement 2% de la médiane
(+) | les aigus sont linéaires (4.5% delta à la fréquence précédente)
Globalement 100 - 16 000 Hz
(+) | le son global est linéaire (10.2% différence à la médiane)
Par rapport à la même classe
» 7% de tous les appareils testés de cette catégorie étaient meilleurs, 2% similaires, 91% pires
» Le meilleur avait un delta de 5%, la moyenne était de 18%, le pire était de 53%.
Par rapport à tous les appareils testés
» 5% de tous les appareils testés étaient meilleurs, 1% similaires, 94% pires
» Le meilleur avait un delta de 4%, la moyenne était de 24%, le pire était de 134%.
| Éteint/en veille | |
| Au repos | |
| Fortement sollicité |
|
Légende:
min: | |
| MSI GP65 10SFK-047US i7-10750H, GeForce RTX 2070 Mobile, Samsung SSD PM981 MZVLB1T0HALR, IPS, 1920x1080, 15.6" | Asus Strix Scar III G531GW-AZ062T i7-9750H, GeForce RTX 2070 Mobile, Intel SSD 660p SSDPEKNW512G8, IPS, 1920x1080, 15.6" | HP Omen 15-dc1303ng i7-8750H, GeForce RTX 2070 Max-Q, Samsung SSD PM981 MZVLB256HAHQ, IPS, 1920x1080, 15.6" | MSI GP62 7REX-1045US i7-7700HQ, GeForce GTX 1050 Ti Mobile, Toshiba NVMe THNSN5128GP, TN LED, 1920x1080, 15.6" | Aorus 15-SA i7-9750H, GeForce GTX 1660 Ti Mobile, Intel SSD 760p SSDPEKKW512G8, IPS, 1920x1080, 15.6" | MSI GP65 Leopard 9SE-225US i7-9750H, GeForce RTX 2060 Mobile, Toshiba KBG30ZMT512G, IPS, 1920x1080, 15.6" | Schenker XMG Pro 15 i7-9750H, GeForce RTX 2070 Mobile, Samsung SSD 970 EVO Plus 500GB, IPS, 1920x1080, 15.6" | |
|---|---|---|---|---|---|---|---|
| Power Consumption | 11% | 12% | 22% | -4% | 8% | -4% | |
| Idle Minimum * (Watt) | 14.2 | 11.4 20% | 14.7 -4% | 14.6 -3% | 20 -41% | 13.6 4% | 15 -6% |
| Idle Average * (Watt) | 18.8 | 13.5 28% | 18.6 1% | 17.2 9% | 23 -22% | 17.9 5% | 19 -1% |
| Idle Maximum * (Watt) | 23.9 | 21.6 10% | 22.6 5% | 17.3 28% | 29 -21% | 20.6 14% | 26 -9% |
| Load Average * (Watt) | 96.9 | 106 -9% | 90 7% | 82.7 15% | 87 10% | 96 1% | 101 -4% |
| Witcher 3 ultra * (Watt) | 185 | 186 -1% | 107 42% | 136 26% | 154.6 16% | 177 4% | |
| Load Maximum * (Watt) | 233.4 | 196 16% | 120 49% | 136.7 41% | 173 26% | 218.6 6% | 245 -5% |
* ... Moindre est la valeur, meilleures sont les performances
| MSI GP65 10SFK-047US i7-10750H, GeForce RTX 2070 Mobile, 51 Wh | Asus Strix Scar III G531GW-AZ062T i7-9750H, GeForce RTX 2070 Mobile, 66 Wh | Asus TUF FX505DT-EB73 R7 3750H, GeForce GTX 1650 Mobile, 48 Wh | HP Omen 15-dc1303ng i7-8750H, GeForce RTX 2070 Max-Q, 70 Wh | MSI GP62 7REX-1045US i7-7700HQ, GeForce GTX 1050 Ti Mobile, 41 Wh | Aorus 15-SA i7-9750H, GeForce GTX 1660 Ti Mobile, 62 Wh | MSI GP65 Leopard 9SE-225US i7-9750H, GeForce RTX 2060 Mobile, 51 Wh | |
|---|---|---|---|---|---|---|---|
| Autonomie de la batterie | 51% | 30% | -11% | -22% | -24% | 5% | |
| WiFi v1.3 (h) | 3.7 | 5.6 51% | 4.8 30% | 3.3 -11% | 2.9 -22% | 2.8 -24% | 3.9 5% |
| Reader / Idle (h) | 7.8 | 5 | 4.3 | 3.5 | 6 | ||
| Load (h) | 1.5 | 1.2 | 0.7 | 2 | 1.1 |
Points positifs
Points négatifs

On the Comet Lake-U series, the gen-to-gen performance differences between it and the outgoing Whiskey Lake-U series is minimal unless if you opt for the high-end Comet Lake-U Core i7-10710U. Otherwise, lesser options like the Core i7-10510U will perform nearly the same as the older Core i7-8565U.
The same can be said for the Comet Lake-H series. The Core i7-10750H performs very closely to the Core i7-9750H to the point where any differences would be unnoticeable especially if gaming where games are more likely to be GPU bound than CPU bound. Instead, users will have to consider the higher-end Core i7-10875H option for any significant raw performance gains over the Core i7-9750H.
While not the news most enthusiasts like to hear, it's nonetheless good news for gamers looking to upgrade their old laptops. The fact that 10th gen Comet Lake-H is only marginally faster than 9th gen Coffee Lake-H at the mid-range SKU level means you can upgrade to a 9th gen Intel gaming laptop and still get essentially the same gaming experience as a more expensive 10th gen Intel model. The money saved could be used to upgrade other more tangible aspects of the laptop like display or RAM or even a better model altogether like the MSI GS65, GE65, or GS65.
The MSI GP65 10SFK is the same laptop as last year's GP65 9SE but with a slightly faster and newer processor. Users won't be missing any exciting features or enormous performance advantages by sticking with a Coffee Lake-H CPU.
MSI GP65 10SFK-047US
- 05/06/2020 v7 (old)
Allen Ngo
Price comparison
