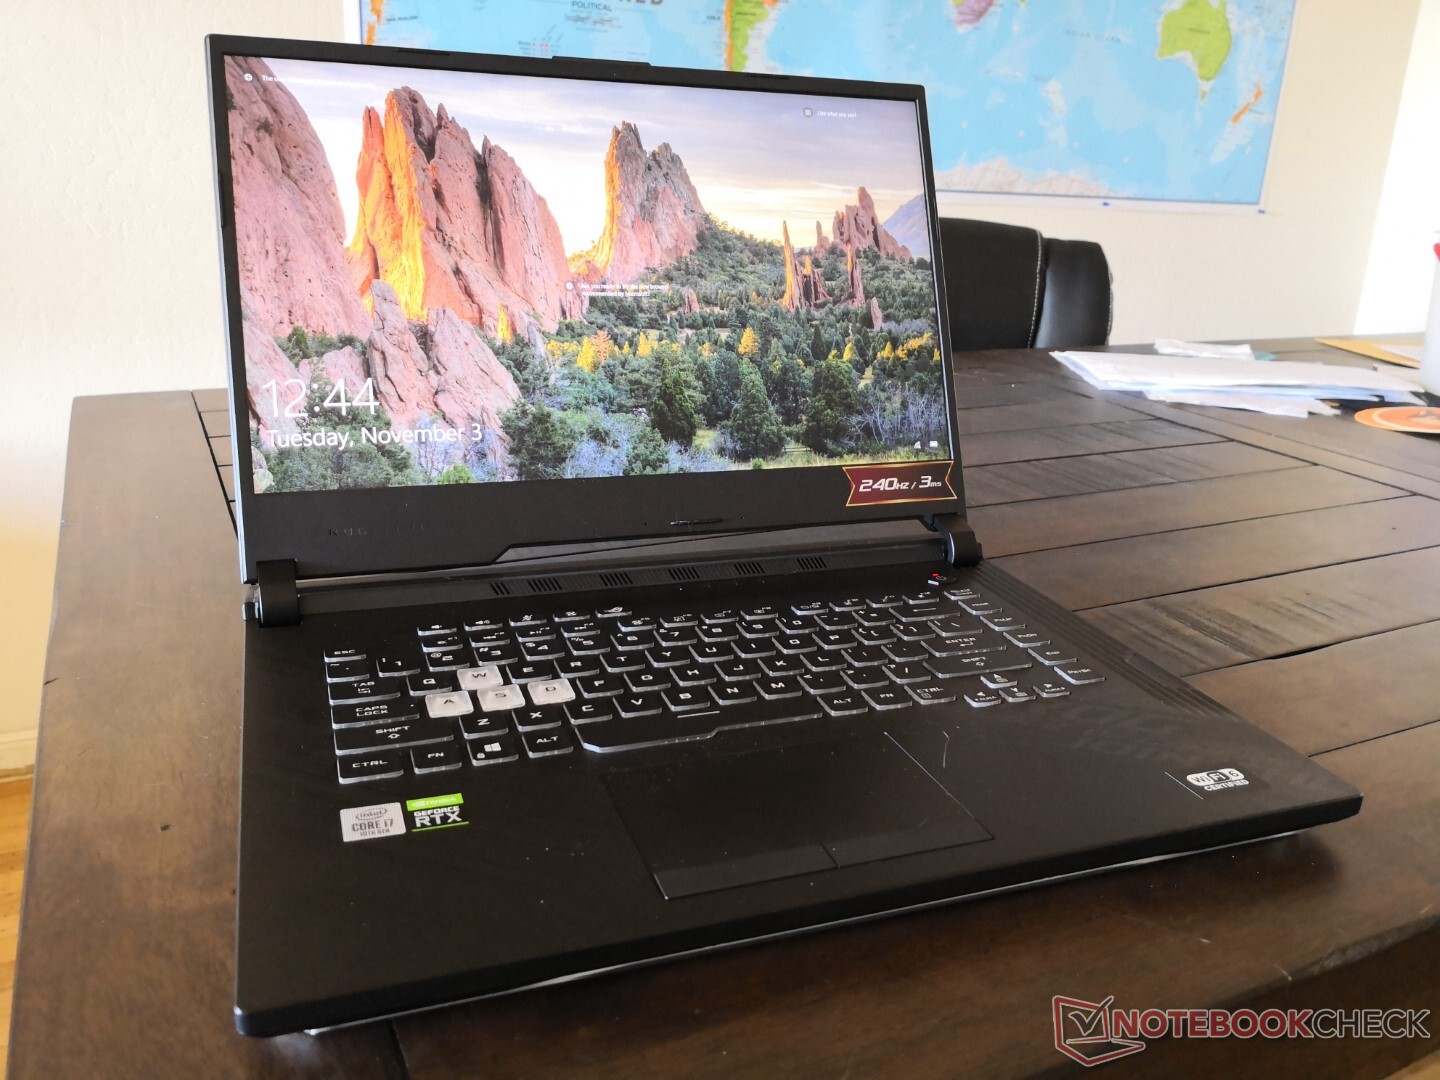
Test de l'Asus ROG Strix G15 G512LW (i7-10750H, RTX 2070, FHD, 240 Hz) : bien meilleur que le G512LI
Note | Date | Modèle | Poids | Épaisseur | Taille | Résolution | Prix |
|---|---|---|---|---|---|---|---|
| 83.4 % v7 (old) | 11/20 | Asus ROG Strix G15 G512LW i7-10750H, GeForce RTX 2070 Mobile | 2.3 kg | 25.8 mm | 15.60" | 1920x1080 | |
| 80.8 % v7 (old) | 08/20 | Asus ROG Strix G15 G512LI i7-10750H, GeForce GTX 1650 Ti Mobile | 2.3 kg | 25.8 mm | 15.60" | 1920x1080 | |
| 86.9 % v7 (old) | 09/20 | Razer Blade 15 RTX 2070 Super Max-Q i7-10875H, GeForce RTX 2070 Super Max-Q | 2.1 kg | 17.8 mm | 15.60" | 1920x1080 | |
| 83.2 % v7 (old) | 06/20 | MSI GP65 10SFK-047US i7-10750H, GeForce RTX 2070 Mobile | 2.3 kg | 27.5 mm | 15.60" | 1920x1080 | |
| 84.4 % v7 (old) | 08/20 | Asus ROG Strix Scar 15 G532LWS i9-10980HK, GeForce RTX 2070 Super Mobile | 2.4 kg | 24.9 mm | 15.60" | 1920x1080 | |
| 84.8 % v7 (old) | 09/20 | Alienware m15 R3 P87F i7-10750H, GeForce RTX 2070 Mobile | 2.3 kg | 19.9 mm | 15.60" | 1920x1080 |
| |||||||||||||||||||||||||
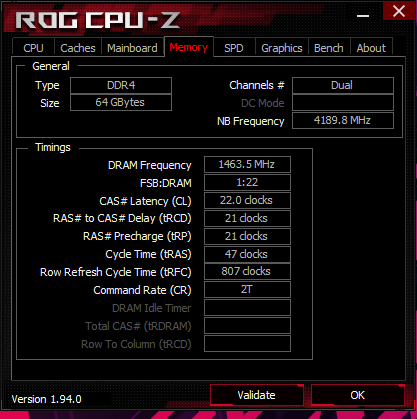
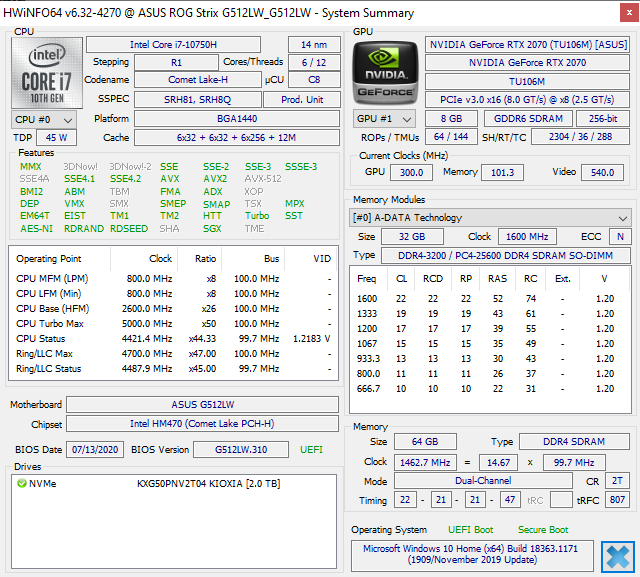
Homogénéité de la luminosité: 92 %
Valeur mesurée au centre, sur batterie: 300.9 cd/m²
Contraste: 971:1 (Valeurs des noirs: 0.31 cd/m²)
ΔE ColorChecker Calman: 3.54 | ∀{0.5-29.43 Ø4.71}
calibrated: 1
ΔE Greyscale Calman: 5.9 | ∀{0.09-98 Ø4.96}
98.3% sRGB (Argyll 1.6.3 3D)
63.3% AdobeRGB 1998 (Argyll 1.6.3 3D)
68.5% AdobeRGB 1998 (Argyll 3D)
98.3% sRGB (Argyll 3D)
67.8% Display P3 (Argyll 3D)
Gamma: 2.37
CCT: 7456 K
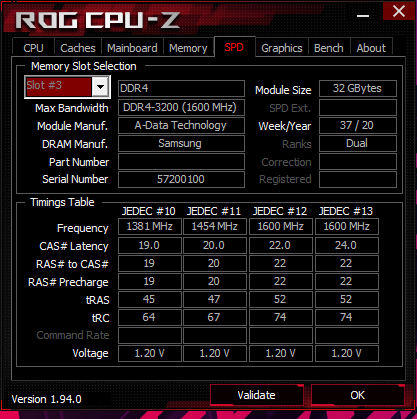
| Asus ROG Strix G15 G512LW Sharp LQ156M1JW09, IPS, 15.6", 1920x1080 | Asus ROG Strix G15 G512LI Panda LM156LF-2F01, IPS, 15.6", 1920x1080 | Razer Blade 15 RTX 2070 Super Max-Q AU Optronics B156HAN12.0, IPS, 15.6", 1920x1080 | MSI GP65 10SFK-047US LG Philips LP156WFG-SPB3, IPS, 15.6", 1920x1080 | Asus ROG Strix Scar 15 G532LWS AU Optronics B156HAN12.0, IPS, 15.6", 1920x1080 | Alienware m15 R3 P87F AU Optronics B156HAN, IPS, 15.6", 1920x1080 | |
|---|---|---|---|---|---|---|
| Display | -40% | 2% | -5% | 3% | 1% | |
| Display P3 Coverage (%) | 67.8 | 39.73 -41% | 69.4 2% | 63.5 -6% | 69.9 3% | 68.6 1% |
| sRGB Coverage (%) | 98.3 | 59.8 -39% | 98.8 1% | 94.4 -4% | 99.6 1% | 98.9 1% |
| AdobeRGB 1998 Coverage (%) | 68.5 | 41.06 -40% | 70.5 3% | 65.1 -5% | 71.4 4% | 69.8 2% |
| Response Times | -138% | 52% | 10% | 11% | 36% | |
| Response Time Grey 50% / Grey 80% * (ms) | 16 ? | 33.6 ? -110% | 3.2 ? 80% | 10.4 ? 35% | 14.4 ? 10% | 4 ? 75% |
| Response Time Black / White * (ms) | 10.4 ? | 27.6 ? -165% | 8 ? 23% | 12 ? -15% | 9.2 ? 12% | 10.8 ? -4% |
| PWM Frequency (Hz) | 23580 ? | |||||
| Screen | -57% | 3% | -8% | 22% | 7% | |
| Brightness middle (cd/m²) | 300.9 | 271.2 -10% | 345.4 15% | 384.9 28% | 307.2 2% | 326.7 9% |
| Brightness (cd/m²) | 289 | 252 -13% | 342 18% | 358 24% | 301 4% | 316 9% |
| Brightness Distribution (%) | 92 | 79 -14% | 90 -2% | 87 -5% | 91 -1% | 87 -5% |
| Black Level * (cd/m²) | 0.31 | 0.53 -71% | 0.34 -10% | 0.67 -116% | 0.21 32% | 0.33 -6% |
| Contrast (:1) | 971 | 512 -47% | 1016 5% | 574 -41% | 1463 51% | 990 2% |
| Colorchecker dE 2000 * | 3.54 | 5.04 -42% | 3.18 10% | 2.43 31% | 1.85 48% | 2.4 32% |
| Colorchecker dE 2000 max. * | 9.82 | 16.07 -64% | 6.57 33% | 4.58 53% | 3.92 60% | 6.06 38% |
| Colorchecker dE 2000 calibrated * | 1 | 4.26 -326% | 1.77 -77% | 2.03 -103% | 1.26 -26% | 1.51 -51% |
| Greyscale dE 2000 * | 5.9 | 3.4 42% | 3.8 36% | 2.6 56% | 2 66% | 3.2 46% |
| Gamma | 2.37 93% | 2.09 105% | 2.15 102% | 2.2 100% | 2.15 102% | 2.13 103% |
| CCT | 7456 87% | 7079 92% | 7109 91% | 6981 93% | 6479 100% | 7129 91% |
| Color Space (Percent of AdobeRGB 1998) (%) | 63.3 | 37.8 -40% | 64.3 2% | 59.7 -6% | 65 3% | 63.7 1% |
| Color Space (Percent of sRGB) (%) | 98.3 | 59.5 -39% | 99 1% | 93.9 -4% | 99.7 1% | 99.2 1% |
| Moyenne finale (programmes/paramètres) | -78% /
-64% | 19% /
9% | -1% /
-5% | 12% /
17% | 15% /
9% |
* ... Moindre est la valeur, meilleures sont les performances
Temps de réponse de l'écran
| ↔ Temps de réponse noir à blanc | ||
|---|---|---|
| 10.4 ms ... hausse ↗ et chute ↘ combinées | ↗ 5.2 ms hausse | 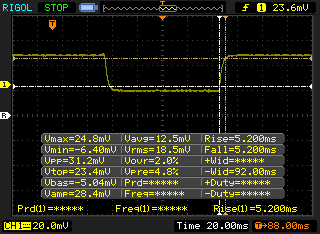 |
| ↘ 5.2 ms chute | ||
| L'écran montre de bons temps de réponse, mais insuffisant pour du jeu compétitif. En comparaison, tous les appareils testés affichent entre 0.1 (minimum) et 240 (maximum) ms. » 28 % des appareils testés affichent de meilleures performances. Cela signifie que les latences relevées sont meilleures que la moyenne (19.8 ms) de tous les appareils testés. | ||
| ↔ Temps de réponse gris 50% à gris 80% | ||
| 16 ms ... hausse ↗ et chute ↘ combinées | ↗ 8.4 ms hausse | 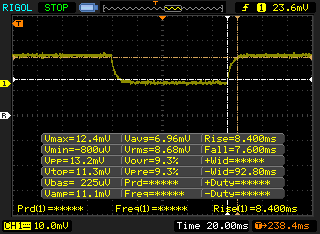 |
| ↘ 7.6 ms chute | ||
| L'écran montre de bons temps de réponse, mais insuffisant pour du jeu compétitif. En comparaison, tous les appareils testés affichent entre 0.165 (minimum) et 636 (maximum) ms. » 30 % des appareils testés affichent de meilleures performances. Cela signifie que les latences relevées sont meilleures que la moyenne (30.9 ms) de tous les appareils testés. | ||
Scintillement / MLI (Modulation de largeur d'impulsion)
| Scintillement / MLI (Modulation de largeur d'impulsion) décelé | 23580 Hz | ≤ 29 Niveau de luminosité | 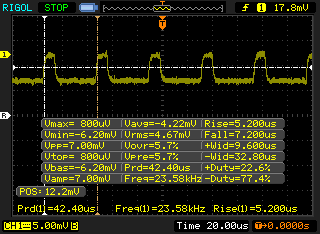 |
Le rétroéclairage de l'écran scintille à la fréquence de 23580 Hz (certainement du fait de l'utilisation d'une MDI - Modulation de largeur d'impulsion) à un niveau de luminosité inférieur ou égal à 29 % . Aucun scintillement ne devrait être perceptible au-dessus de cette valeur. La fréquence de rafraîchissement de 23580 Hz est élevée, la grande majorité des utilisateurs ne devrait pas percevoir de scintillements et être sujette à une fatigue oculaire accrue. En comparaison, 52 % des appareils testés n'emploient pas MDI pour assombrir leur écran. Nous avons relevé une moyenne à 7741 (minimum : 5 - maximum : 343500) Hz dans le cas où une MDI était active. | |||
Cinebench R15: CPU Multi 64Bit | CPU Single 64Bit
Blender: v2.79 BMW27 CPU
7-Zip 18.03: 7z b 4 -mmt1 | 7z b 4
Geekbench 5.5: Single-Core | Multi-Core
HWBOT x265 Benchmark v2.2: 4k Preset
LibreOffice : 20 Documents To PDF
R Benchmark 2.5: Overall mean
| HWBOT x265 Benchmark v2.2 / 4k Preset | |
| Asus Zephyrus S15 GX502L | |
| Asus ROG Strix Scar 15 G532LWS | |
| Eurocom Nightsky RX15 | |
| Asus ROG Zephyrus G15 GA502IU-ES76 | |
| MSI Bravo 15 A4DCR | |
| Asus ROG Strix G15 G512LW | |
| Asus ROG Strix G15 G512LI | |
| Moyenne Intel Core i7-10750H (5.54 - 11.6, n=43) | |
| Acer Nitro 5 AN515-44-R5FT | |
| Gateway Creator Series 15.6 GWTN156-3BK | |
| LibreOffice / 20 Documents To PDF | |
| MSI Bravo 15 A4DCR | |
| Acer Nitro 5 AN515-44-R5FT | |
| Asus ROG Zephyrus G15 GA502IU-ES76 | |
| Gateway Creator Series 15.6 GWTN156-3BK | |
| Moyenne Intel Core i7-10750H (43.1 - 99.2, n=43) | |
| Asus ROG Strix G15 G512LI | |
| Asus ROG Strix Scar 15 G532LWS | |
| Asus Zephyrus S15 GX502L | |
| Asus ROG Strix G15 G512LW | |
| R Benchmark 2.5 / Overall mean | |
| Gateway Creator Series 15.6 GWTN156-3BK | |
| Acer Nitro 5 AN515-44-R5FT | |
| Asus ROG Strix G15 G512LI | |
| Moyenne Intel Core i7-10750H (0.578 - 0.708, n=42) | |
| Asus ROG Strix G15 G512LW | |
| MSI Bravo 15 A4DCR | |
| Asus Zephyrus S15 GX502L | |
| Asus ROG Zephyrus G15 GA502IU-ES76 | |
| Asus ROG Strix Scar 15 G532LWS | |
Cinebench R15: CPU Multi 64Bit | CPU Single 64Bit
Blender: v2.79 BMW27 CPU
7-Zip 18.03: 7z b 4 -mmt1 | 7z b 4
Geekbench 5.5: Single-Core | Multi-Core
HWBOT x265 Benchmark v2.2: 4k Preset
LibreOffice : 20 Documents To PDF
R Benchmark 2.5: Overall mean
* ... Moindre est la valeur, meilleures sont les performances
| PCMark 8 Home Score Accelerated v2 | 4589 points | |
| PCMark 8 Work Score Accelerated v2 | 5964 points | |
| PCMark 10 Score | 5479 points | |
Aide | ||
| DPC Latencies / LatencyMon - interrupt to process latency (max), Web, Youtube, Prime95 | |
| Asus ROG Strix G15 G512LW | |
| Razer Blade 15 RTX 2070 Super Max-Q | |
| Asus ROG Strix Scar 15 G532LWS | |
| Asus ROG Strix G15 G512LI | |
| Alienware m15 R3 P87F | |
| MSI GP65 10SFK-047US | |
* ... Moindre est la valeur, meilleures sont les performances
| Asus ROG Strix G15 G512LW Toshiba XG5-P KXG50PNV2T04 | Asus ROG Strix G15 G512LI Intel SSD 660p SSDPEKNW512G8 | Razer Blade 15 RTX 2070 Super Max-Q Samsung SSD PM981a MZVLB512HBJQ | Asus ROG Strix Scar 15 G532LWS 2x Intel SSD 660p 1TB SSDPEKNW010T8 (RAID 0) | Alienware m15 R3 P87F 2x Micron 2200S 512 GB (RAID 0) | |
|---|---|---|---|---|---|
| AS SSD | -24% | 46% | 29% | 14% | |
| Seq Read (MB/s) | 1933 | 1157 -40% | 1957 1% | 1982 3% | 2058 6% |
| Seq Write (MB/s) | 787 | 675 -14% | 2092 166% | 1444 83% | 2316 194% |
| 4K Read (MB/s) | 26.4 | 49.99 89% | 50.2 90% | 50.3 91% | 39.72 50% |
| 4K Write (MB/s) | 109.8 | 114 4% | 96.5 -12% | 120.1 9% | 62.9 -43% |
| 4K-64 Read (MB/s) | 848 | 322.2 -62% | 1594 88% | 1016 20% | 1334 57% |
| 4K-64 Write (MB/s) | 923 | 759 -18% | 2005 117% | 1351 46% | 1271 38% |
| Access Time Read * (ms) | 0.044 | 0.07 -59% | 0.057 -30% | 0.044 -0% | 0.062 -41% |
| Access Time Write * (ms) | 0.158 | 0.137 13% | 0.112 29% | 0.109 31% | 0.388 -146% |
| Score Read (Points) | 1067 | 488 -54% | 1840 72% | 1264 18% | 1580 48% |
| Score Write (Points) | 1112 | 940 -15% | 2310 108% | 1615 45% | 1565 41% |
| Score Total (Points) | 2669 | 1673 -37% | 5103 91% | 3510 32% | 3968 49% |
| Copy ISO MB/s (MB/s) | 3210 | 939 -71% | 1793 -44% | 3474 8% | 1685 -48% |
| Copy Program MB/s (MB/s) | 728 | 489.9 -33% | 573 -21% | 751 3% | 669 -8% |
| Copy Game MB/s (MB/s) | 1499 | 895 -40% | 1418 -5% | 1684 12% | 1493 0% |
| CrystalDiskMark 5.2 / 6 | 1% | 62% | 51% | 46% | |
| Write 4K (MB/s) | 116.5 | 125.4 8% | 139.8 20% | 128.4 10% | 67.3 -42% |
| Read 4K (MB/s) | 27.6 | 52.7 91% | 48.62 76% | 53.7 95% | 41.47 50% |
| Write Seq (MB/s) | 1020 | 943 -8% | 2260 122% | 1875 84% | 2239 120% |
| Read Seq (MB/s) | 1999 | 1383 -31% | 2135 7% | 2315 16% | 2112 6% |
| Write 4K Q32T1 (MB/s) | 375.9 | 437.9 16% | 499.3 33% | 427.2 14% | 488.9 30% |
| Read 4K Q32T1 (MB/s) | 398.5 | 334.9 -16% | 552 39% | 440.7 11% | 557 40% |
| Write Seq Q32T1 (MB/s) | 1015 | 960 -5% | 2960 192% | 2793 175% | 2654 161% |
| Read Seq Q32T1 (MB/s) | 3049 | 1530 -50% | 3269 7% | 3101 2% | 3137 3% |
| Moyenne finale (programmes/paramètres) | -12% /
-15% | 54% /
52% | 40% /
37% | 30% /
26% |
* ... Moindre est la valeur, meilleures sont les performances

Disk Throttling: DiskSpd Read Loop, Queue Depth 8
| 3DMark 11 Performance | 20976 points | |
| 3DMark Cloud Gate Standard Score | 39474 points | |
| 3DMark Fire Strike Score | 18021 points | |
| 3DMark Time Spy Score | 7718 points | |
Aide | ||
| Bas | Moyen | Élevé | Ultra | |
|---|---|---|---|---|
| GTA V (2015) | 178 | 170 | 148 | 82 |
| The Witcher 3 (2015) | 303.3 | 227.2 | 144.5 | 78.2 |
| Dota 2 Reborn (2015) | 149 | 130 | 124 | 117 |
| Final Fantasy XV Benchmark (2018) | 151 | 106 | 80.6 | |
| X-Plane 11.11 (2018) | 105 | 90.5 | 77.5 | |
| Strange Brigade (2018) | 313 | 183 | 149 | 125 |
| Asus ROG Strix G15 G512LW GeForce RTX 2070 Mobile, i7-10750H, Toshiba XG5-P KXG50PNV2T04 | Asus ROG Strix G15 G512LI GeForce GTX 1650 Ti Mobile, i7-10750H, Intel SSD 660p SSDPEKNW512G8 | Razer Blade 15 RTX 2070 Super Max-Q GeForce RTX 2070 Super Max-Q, i7-10875H, Samsung SSD PM981a MZVLB512HBJQ | MSI GP65 10SFK-047US GeForce RTX 2070 Mobile, i7-10750H, Samsung SSD PM981 MZVLB1T0HALR | Asus ROG Strix Scar 15 G532LWS GeForce RTX 2070 Super Mobile, i9-10980HK, 2x Intel SSD 660p 1TB SSDPEKNW010T8 (RAID 0) | Alienware m15 R3 P87F GeForce RTX 2070 Mobile, i7-10750H, 2x Micron 2200S 512 GB (RAID 0) | |
|---|---|---|---|---|---|---|
| Noise | -8% | 2% | -9% | -8% | 2% | |
| arrêt / environnement * (dB) | 25.7 | 27.7 -8% | 27 -5% | 29.3 -14% | 26.5 -3% | 26.3 -2% |
| Idle Minimum * (dB) | 25.7 | 34.2 -33% | 27 -5% | 31.9 -24% | 27.1 -5% | 26.7 -4% |
| Idle Average * (dB) | 29.7 | 36 -21% | 27 9% | 31.9 -7% | 32.2 -8% | 26.7 10% |
| Idle Maximum * (dB) | 34 | 36.6 -8% | 27 21% | 33.5 1% | 34 -0% | 30.7 10% |
| Load Average * (dB) | 38.9 | 44.3 -14% | 44.7 -15% | 47 -21% | 52.4 -35% | 40.2 -3% |
| Witcher 3 ultra * (dB) | 54.1 | 47.9 11% | 51.2 5% | 53.8 1% | 57.5 -6% | 51 6% |
| Load Maximum * (dB) | 57.4 | 49.3 14% | 54 6% | 56.7 1% | 57.5 -0% | 59.7 -4% |
* ... Moindre est la valeur, meilleures sont les performances
Degré de la nuisance sonore
| Au repos |
| 25.7 / 29.7 / 34 dB(A) |
| Fortement sollicité |
| 38.9 / 57.4 dB(A) |
 | ||
30 dB silencieux 40 dB(A) audible 50 dB(A) bruyant |
||
min: | ||
(-) La température maximale du côté supérieur est de 53.4 °C / 128 F, par rapport à la moyenne de 40.4 °C / 105 F, allant de 21.2 à 68.8 °C pour la classe Gaming.
(-) Le fond chauffe jusqu'à un maximum de 49 °C / 120 F, contre une moyenne de 43.2 °C / 110 F
(+) En utilisation inactive, la température moyenne du côté supérieur est de 28.4 °C / 83 F, par rapport à la moyenne du dispositif de 33.9 °C / 93 F.
(±) En jouant à The Witcher 3, la température moyenne du côté supérieur est de 34.1 °C / 93 F, alors que la moyenne de l'appareil est de 33.9 °C / 93 F.
(+) Les repose-poignets et le pavé tactile sont plus froids que la température de la peau avec un maximum de 27.6 °C / 81.7 F et sont donc froids au toucher.
(±) La température moyenne de la zone de l'appui-paume de dispositifs similaires était de 28.8 °C / 83.8 F (+1.2 °C / #2.1 F).
Asus ROG Strix G15 G512LW analyse audio
(+) | les haut-parleurs peuvent jouer relativement fort (83.8# dB)
Basses 100 - 315 Hz
(±) | basse réduite - en moyenne 8.8% inférieure à la médiane
(±) | la linéarité des basses est moyenne (7.8% delta à la fréquence précédente)
Médiums 400 - 2000 Hz
(±) | médiane supérieure - en moyenne 7.5% supérieure à la médiane
(+) | les médiums sont linéaires (6.2% delta à la fréquence précédente)
Aiguës 2 - 16 kHz
(+) | des sommets équilibrés - à seulement 2.4% de la médiane
(+) | les aigus sont linéaires (6% delta à la fréquence précédente)
Globalement 100 - 16 000 Hz
(±) | la linéarité du son global est moyenne (16.4% de différence avec la médiane)
Par rapport à la même classe
» 42% de tous les appareils testés de cette catégorie étaient meilleurs, 6% similaires, 52% pires
» Le meilleur avait un delta de 6%, la moyenne était de 18%, le pire était de 132%.
Par rapport à tous les appareils testés
» 27% de tous les appareils testés étaient meilleurs, 6% similaires, 67% pires
» Le meilleur avait un delta de 4%, la moyenne était de 23%, le pire était de 134%.
Apple MacBook 12 (Early 2016) 1.1 GHz analyse audio
(+) | les haut-parleurs peuvent jouer relativement fort (83.6# dB)
Basses 100 - 315 Hz
(±) | basse réduite - en moyenne 11.3% inférieure à la médiane
(±) | la linéarité des basses est moyenne (14.2% delta à la fréquence précédente)
Médiums 400 - 2000 Hz
(+) | médiane équilibrée - seulement 2.4% de la médiane
(+) | les médiums sont linéaires (5.5% delta à la fréquence précédente)
Aiguës 2 - 16 kHz
(+) | des sommets équilibrés - à seulement 2% de la médiane
(+) | les aigus sont linéaires (4.5% delta à la fréquence précédente)
Globalement 100 - 16 000 Hz
(+) | le son global est linéaire (10.2% différence à la médiane)
Par rapport à la même classe
» 7% de tous les appareils testés de cette catégorie étaient meilleurs, 2% similaires, 90% pires
» Le meilleur avait un delta de 5%, la moyenne était de 18%, le pire était de 53%.
Par rapport à tous les appareils testés
» 5% de tous les appareils testés étaient meilleurs, 1% similaires, 94% pires
» Le meilleur avait un delta de 4%, la moyenne était de 23%, le pire était de 134%.
| Éteint/en veille | |
| Au repos | |
| Fortement sollicité |
|
Légende:
min: | |
| Asus ROG Strix G15 G512LW i7-10750H, GeForce RTX 2070 Mobile, Toshiba XG5-P KXG50PNV2T04, IPS, 1920x1080, 15.6" | Asus ROG Strix G15 G512LI i7-10750H, GeForce GTX 1650 Ti Mobile, Intel SSD 660p SSDPEKNW512G8, IPS, 1920x1080, 15.6" | Razer Blade 15 RTX 2070 Super Max-Q i7-10875H, GeForce RTX 2070 Super Max-Q, Samsung SSD PM981a MZVLB512HBJQ, IPS, 1920x1080, 15.6" | MSI GP65 10SFK-047US i7-10750H, GeForce RTX 2070 Mobile, Samsung SSD PM981 MZVLB1T0HALR, IPS, 1920x1080, 15.6" | Asus ROG Strix Scar 15 G532LWS i9-10980HK, GeForce RTX 2070 Super Mobile, 2x Intel SSD 660p 1TB SSDPEKNW010T8 (RAID 0), IPS, 1920x1080, 15.6" | |
|---|---|---|---|---|---|
| Power Consumption | 43% | 5% | 14% | 12% | |
| Idle Minimum * (Watt) | 16.2 | 5.7 65% | 14.3 12% | 14.2 12% | 8 51% |
| Idle Average * (Watt) | 24.1 | 9.3 61% | 22.3 7% | 18.8 22% | 9.8 59% |
| Idle Maximum * (Watt) | 30.8 | 20.9 32% | 36.9 -20% | 23.9 22% | 25.8 16% |
| Load Average * (Watt) | 127.6 | 105.1 18% | 118.4 7% | 96.9 24% | 169 -32% |
| Witcher 3 ultra * (Watt) | 187.5 | 94.5 50% | 153.7 18% | 185 1% | 201 -7% |
| Load Maximum * (Watt) | 239 | 160.8 33% | 220.8 8% | 233.4 2% | 271.6 -14% |
* ... Moindre est la valeur, meilleures sont les performances
| Asus ROG Strix G15 G512LW i7-10750H, GeForce RTX 2070 Mobile, 66 Wh | Asus ROG Strix G15 G512LI i7-10750H, GeForce GTX 1650 Ti Mobile, 48 Wh | Razer Blade 15 RTX 2070 Super Max-Q i7-10875H, GeForce RTX 2070 Super Max-Q, 80 Wh | MSI GP65 10SFK-047US i7-10750H, GeForce RTX 2070 Mobile, 51 Wh | Asus ROG Strix Scar 15 G532LWS i9-10980HK, GeForce RTX 2070 Super Mobile, 66 Wh | Alienware m15 R3 P87F i7-10750H, GeForce RTX 2070 Mobile, 86 Wh | |
|---|---|---|---|---|---|---|
| Autonomie de la batterie | -30% | -2% | -42% | -23% | -56% | |
| WiFi v1.3 (h) | 6.4 | 4.5 -30% | 6.3 -2% | 3.7 -42% | 4.9 -23% | 2.8 -56% |
| Reader / Idle (h) | 13.3 | 8.1 | 5 | |||
| Load (h) | 1.4 | 1.5 | 0.7 |
Points positifs
Points négatifs

Un mauvais écran peut gâcher ce qui est par ailleurs un bon PC portable de jeu. Alors que le ROG Strix G15 G512LI moins cher est performant, les mauvais temps de réponse de son écran et ses couleurs peu fidèles débouchent sur une expérience de jeu décevante. Heureusement, le G512LW utilise un écran totalement différent, plus adapté aux joueurs accrocs.
Les défauts principaux de la série restent. Les profils d'alimentation d'Armoury Crate continuent à se télescoper avec ceux de Windows. Le mode Turbo en particulier devra être choisi pour tirer le plus de performances possibles du G512, si bien que les joueurs se verront imposer un niveau sonore élevé. Par ailleurs, l'appareil est trop grand à cause de son arrière protubérant. Le Thunderbolt 3, la webcam, le lecteur de carte SD et même l'Asus Keystone sont absents, ce qui pourrait irriter les utilisateurs qui comptent sur ces fonctionnalités. Mais il est indéniable que l'appareil est puissant et peut être amélioré, pourvu que l'on puisse accepter sa taille, les petites touches des flèches et les ventilateurs bruyants.
Des performances excellentes pour une chauffe maîtrisée, surtout avec une GeForce RTX 2070 pour PC de bureau à l'intérieur. Les utilisateurs apprécieront l'écran 240 Hz, ainsi que la RAM et le stockage extensibles, mais les ventilateurs bruyants en gêneront plus d'un en l'absence d'écouteurs.
L’intégralité de cette critique est disponible en anglais en suivant ce lien.
Asus ROG Strix G15 G512LW
- 11/04/2020 v7 (old)
Allen Ngo
Price comparison
