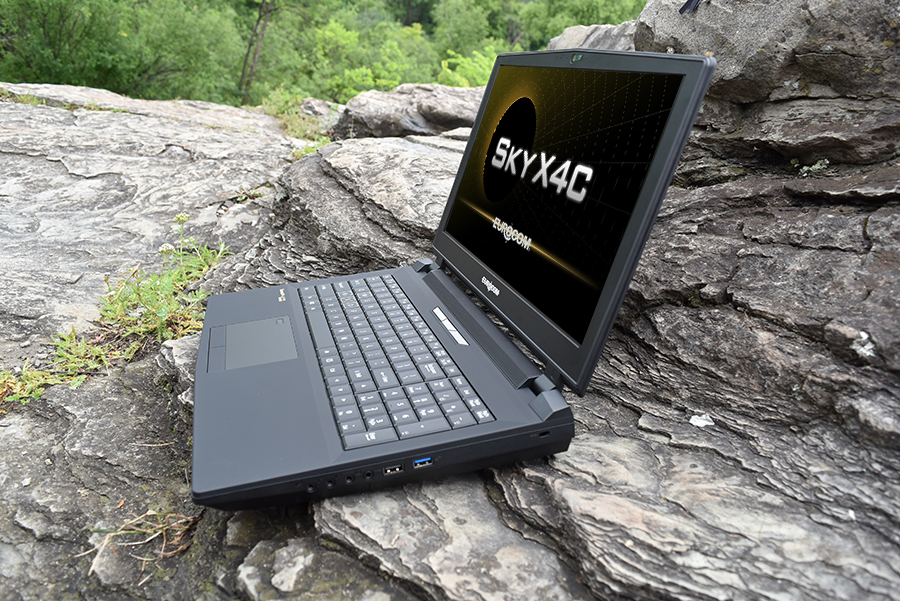
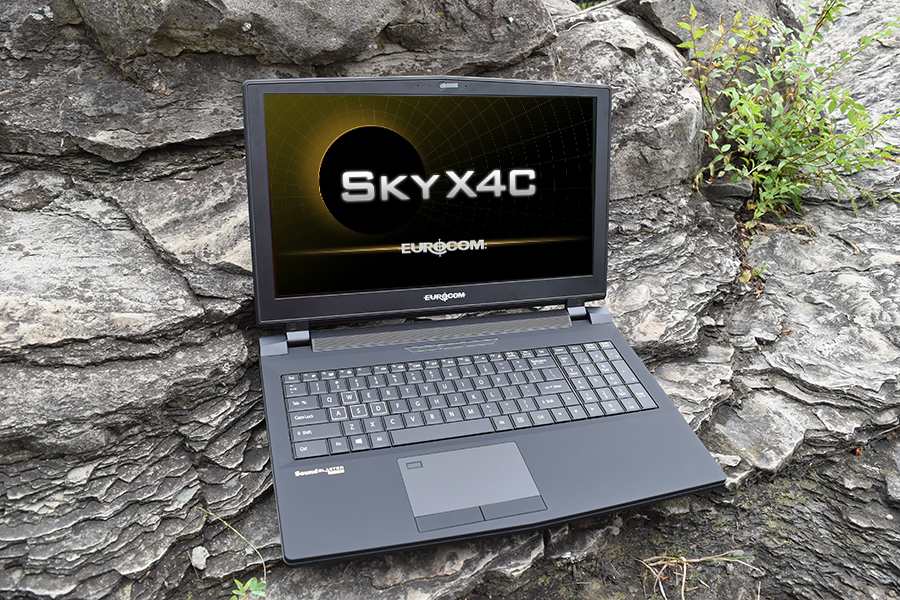
Test de l'Eurocom Sky X4C (i9-9900KS, RTX 2080, FHD) : un processeur de bureau non bridé dans un portable
Note | Date | Modèle | Poids | Épaisseur | Taille | Résolution | Prix |
|---|---|---|---|---|---|---|---|
| 84.6 % v7 (old) | 12/19 | Eurocom Sky X4C i9-9900KS i9-9900KS, GeForce RTX 2080 Mobile | 3.6 kg | 38 mm | 15.60" | 1920x1080 | |
| 87.3 % v6 (old) | 10/18 | MSI GT63 Titan 8RG-046 i7-8750H, GeForce GTX 1080 Mobile | 2.9 kg | 40 mm | 15.60" | 1920x1080 | |
| 86.1 % v7 (old) | 05/19 | MSI GE75 9SG i9-9880H, GeForce RTX 2080 Mobile | 2.7 kg | 27.5 mm | 17.30" | 1920x1080 | |
| 88.3 % v6 (old) | 03/19 | Eurocom Sky X7C i9-9900K i9-9900K, GeForce RTX 2080 Mobile | 4.3 kg | 41 mm | 17.30" | 1920x1080 | |
| 85.8 % v7 (old) | 04/19 | Alienware Area-51m i9-9900K RTX 2080 i9-9900K, GeForce RTX 2080 Mobile | 3.9 kg | 42 mm | 17.30" | 1920x1080 |
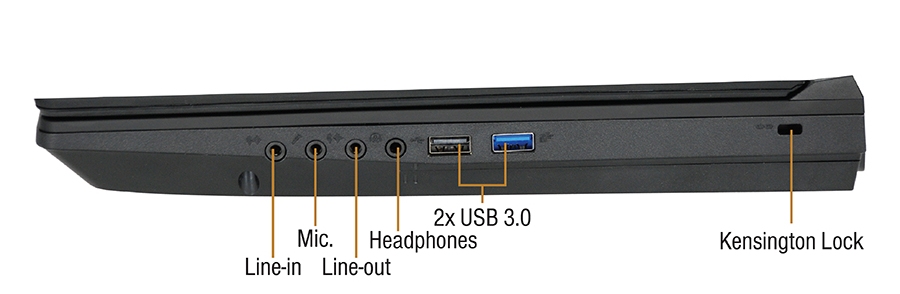
| SD Card Reader | |
| average JPG Copy Test (av. of 3 runs) | |
| Eurocom Sky X4C i9-9900KS (Toshiba Exceria Pro SDXC 64 GB UHS-II) | |
| Razer Blade Pro 17 4K UHD 120 Hz (Toshiba Exceria Pro SDXC 64 GB UHS-II) | |
| MSI GE63VR 7RF Raider (Toshiba Exceria Pro SDXC 64 GB UHS-II) | |
| MSI Prestige 15 A10SC (Toshiba Exceria Pro M501 UHS-II) | |
| MSI GT63 Titan 8RG-046 (Toshiba Exceria Pro SDXC 64 GB UHS-II) | |
| maximum AS SSD Seq Read Test (1GB) | |
| Eurocom Sky X4C i9-9900KS (Toshiba Exceria Pro SDXC 64 GB UHS-II) | |
| MSI GE63VR 7RF Raider (Toshiba Exceria Pro SDXC 64 GB UHS-II) | |
| Razer Blade Pro 17 4K UHD 120 Hz (Toshiba Exceria Pro SDXC 64 GB UHS-II) | |
| MSI Prestige 15 A10SC (Toshiba Exceria Pro M501 UHS-II) | |
| MSI GT63 Titan 8RG-046 (Toshiba Exceria Pro SDXC 64 GB UHS-II) | |
| |||||||||||||||||||||||||
Homogénéité de la luminosité: 82 %
Valeur mesurée au centre, sur batterie: 258.8 cd/m²
Contraste: 924:1 (Valeurs des noirs: 0.28 cd/m²)
ΔE ColorChecker Calman: 4.45 | ∀{0.5-29.43 Ø4.72}
calibrated: 3
ΔE Greyscale Calman: 5.8 | ∀{0.09-98 Ø4.97}
90.5% sRGB (Argyll 1.6.3 3D)
58.8% AdobeRGB 1998 (Argyll 1.6.3 3D)
64.7% AdobeRGB 1998 (Argyll 3D)
90.9% sRGB (Argyll 3D)
63.6% Display P3 (Argyll 3D)
Gamma: 2.36
CCT: 7651 K
| Eurocom Sky X4C i9-9900KS AU Optronics B156HAN07.0, IPS, 15.6", 1920x1080 | MSI GE63VR 7RF Raider Chi Mei N156HHE-GA1 (CMN15F4), TN LED, 15.6", 1920x1080 | Asus Strix Scar III G531GW-AZ062T Sharp LQ156M1JW09 (SHP14D3), IPS, 15.6", 1920x1080 | Lenovo Legion Y740-15ICHg BOE NV156FHM-N4J, IPS, 15.6", 1920x1080 | MSI GT63 Titan 8RG-046 N156HHE-GA1, TN, 15.6", 1920x1080 | Eurocom Sky X4C ID: SHP142A, Name: LQ156D1JX01B, IPS, 15.6", 3840x2160 | |
|---|---|---|---|---|---|---|
| Display | 29% | 5% | 4% | 29% | 4% | |
| Display P3 Coverage (%) | 63.6 | 91.3 44% | 66.2 4% | 67.7 6% | 91.3 44% | 65.1 2% |
| sRGB Coverage (%) | 90.9 | 100 10% | 97.1 7% | 91.6 1% | 99.9 10% | 96.5 6% |
| AdobeRGB 1998 Coverage (%) | 64.7 | 86.7 34% | 67.6 4% | 67.1 4% | 85.7 32% | 67.2 4% |
| Response Times | 38% | 14% | -3% | 48% | -154% | |
| Response Time Grey 50% / Grey 80% * (ms) | 16.8 ? | 9.6 ? 43% | 15 ? 11% | 19 ? -13% | 8.4 ? 50% | 33.6 ? -100% |
| Response Time Black / White * (ms) | 10.8 ? | 7.2 ? 33% | 9 ? 17% | 10 ? 7% | 5.8 ? 46% | 33.2 ? -207% |
| PWM Frequency (Hz) | 26000 ? | 250 ? | 25510 ? | 1000 ? | ||
| Screen | 22% | 7% | 44% | 18% | 11% | |
| Brightness middle (cd/m²) | 258.8 | 285 10% | 309 19% | 477 84% | 307.1 19% | 324.7 25% |
| Brightness (cd/m²) | 258 | 273 6% | 284 10% | 431 67% | 276 7% | 318 23% |
| Brightness Distribution (%) | 82 | 84 2% | 88 7% | 84 2% | 80 -2% | 81 -1% |
| Black Level * (cd/m²) | 0.28 | 0.23 18% | 0.42 -50% | 0.175 38% | 0.37 -32% | 0.26 7% |
| Contrast (:1) | 924 | 1239 34% | 736 -20% | 2726 195% | 830 -10% | 1249 35% |
| Colorchecker dE 2000 * | 4.45 | 3.52 21% | 3.99 10% | 4.17 6% | 2.53 43% | 4.67 -5% |
| Colorchecker dE 2000 max. * | 9.85 | 5.18 47% | 8.3 16% | 6.97 29% | 4.66 53% | 8.16 17% |
| Colorchecker dE 2000 calibrated * | 3 | 1.12 63% | 2.51 16% | 2.82 6% | ||
| Greyscale dE 2000 * | 5.8 | 3.41 41% | 5.43 6% | 3.49 40% | 1.7 71% | 5.9 -2% |
| Gamma | 2.36 93% | 2.05 107% | 2.57 86% | 2.5 88% | 2.194 100% | 2.14 103% |
| CCT | 7651 85% | 7077 92% | 7767 84% | 7076 92% | 6893 94% | 7176 91% |
| Color Space (Percent of AdobeRGB 1998) (%) | 58.8 | 77 31% | 63 7% | 60 2% | 76 29% | 61.1 4% |
| Color Space (Percent of sRGB) (%) | 90.5 | 100 10% | 97 7% | 91 1% | 100 10% | 96.1 6% |
| Moyenne finale (programmes/paramètres) | 30% /
26% | 9% /
7% | 15% /
30% | 32% /
24% | -46% /
-12% |
* ... Moindre est la valeur, meilleures sont les performances
Temps de réponse de l'écran
| ↔ Temps de réponse noir à blanc | ||
|---|---|---|
| 10.8 ms ... hausse ↗ et chute ↘ combinées | ↗ 5.2 ms hausse | 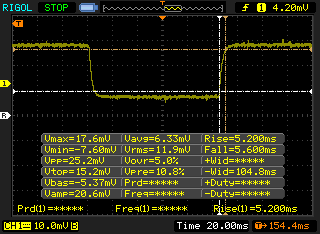 |
| ↘ 5.6 ms chute | ||
| L'écran montre de bons temps de réponse, mais insuffisant pour du jeu compétitif. En comparaison, tous les appareils testés affichent entre 0.1 (minimum) et 240 (maximum) ms. » 29 % des appareils testés affichent de meilleures performances. Cela signifie que les latences relevées sont meilleures que la moyenne (19.8 ms) de tous les appareils testés. | ||
| ↔ Temps de réponse gris 50% à gris 80% | ||
| 16.8 ms ... hausse ↗ et chute ↘ combinées | ↗ 9.2 ms hausse | 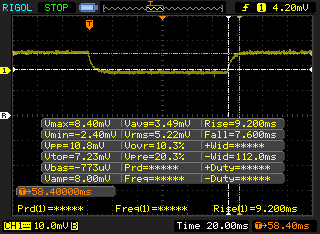 |
| ↘ 7.6 ms chute | ||
| L'écran montre de bons temps de réponse, mais insuffisant pour du jeu compétitif. En comparaison, tous les appareils testés affichent entre 0.165 (minimum) et 636 (maximum) ms. » 31 % des appareils testés affichent de meilleures performances. Cela signifie que les latences relevées sont meilleures que la moyenne (31 ms) de tous les appareils testés. | ||
Scintillement / MLI (Modulation de largeur d'impulsion)
| Scintillement / MLI (Modulation de largeur d'impulsion) non décelé | 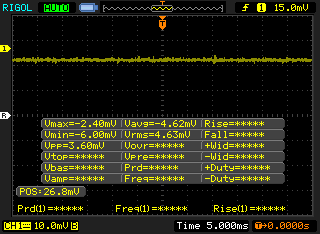 | ||
En comparaison, 52 % des appareils testés n'emploient pas MDI pour assombrir leur écran. Nous avons relevé une moyenne à 7772 (minimum : 5 - maximum : 343500) Hz dans le cas où une MDI était active. | |||
| Cinebench R20 | |
| CPU (Single Core) | |
| AMD Radeon RX Vega 64 | |
| Eurocom Sky X4C i9-9900KS | |
| Medion Erazer X15805 | |
| Apple MacBook Pro 15 2019 i9 Vega 20 | |
| MSI Prestige 15 A10SC | |
| MSI GE75 9SG | |
| Schenker Key 16 | |
| Eurocom Nightsky Ti15 | |
| AMD Ryzen 1800X - Asus Crosshair VI Hero | |
| Razer Blade Stealth i7-1065G7 Iris Plus | |
| MSI GL62M 7RD-077 | |
| CPU (Multi Core) | |
| AMD Radeon RX Vega 64 | |
| Eurocom Sky X4C i9-9900KS | |
| MSI GE75 9SG | |
| AMD Ryzen 1800X - Asus Crosshair VI Hero | |
| Apple MacBook Pro 15 2019 i9 Vega 20 | |
| Medion Erazer X15805 | |
| Eurocom Nightsky Ti15 | |
| MSI Prestige 15 A10SC | |
| Schenker Key 16 | |
| MSI GL62M 7RD-077 | |
| Razer Blade Stealth i7-1065G7 Iris Plus | |
| Cinebench R11.5 | |
| CPU Single 64Bit | |
| Eurocom Sky X4C i9-9900KS | |
| AMD Radeon RX Vega 64 | |
| Eurocom Sky X4C | |
| MSI GE75 9SG | |
| Eurocom Nightsky Ti15 | |
| AMD Ryzen 1800X - Asus Crosshair VI Hero | |
| MSI GL62M 7RD-077 | |
| Asus GL702ZC-GC104T | |
| CPU Multi 64Bit | |
| AMD Radeon RX Vega 64 | |
| Eurocom Sky X4C i9-9900KS | |
| MSI GE75 9SG | |
| AMD Ryzen 1800X - Asus Crosshair VI Hero | |
| Asus GL702ZC-GC104T | |
| Eurocom Sky X4C | |
| Eurocom Nightsky Ti15 | |
| MSI GL62M 7RD-077 | |
| Cinebench R10 | |
| Rendering Multiple CPUs 32Bit | |
| Eurocom Sky X4C i9-9900KS | |
| AMD Radeon RX Vega 64 | |
| MSI GE75 9SG | |
| Eurocom Sky X4C | |
| Medion Erazer X15805 | |
| Schenker Key 16 | |
| AMD Ryzen 1800X - Asus Crosshair VI Hero | |
| Asus GL702ZC-GC104T | |
| MSI GL62M 7RD-077 | |
| Rendering Single 32Bit | |
| Eurocom Sky X4C i9-9900KS | |
| Medion Erazer X15805 | |
| Eurocom Sky X4C | |
| MSI GE75 9SG | |
| Schenker Key 16 | |
| AMD Radeon RX Vega 64 | |
| MSI GL62M 7RD-077 | |
| AMD Ryzen 1800X - Asus Crosshair VI Hero | |
| Asus GL702ZC-GC104T | |
| wPrime 2.10 - 1024m | |
| Eurocom Sky X4C | |
| MSI GE75 9SG | |
| AMD Ryzen 1800X - Asus Crosshair VI Hero | |
| Eurocom Sky X4C i9-9900KS | |
| AMD Radeon RX Vega 64 | |
| X264 HD Benchmark 4.0 | |
| Pass 2 | |
| AMD Radeon RX Vega 64 | |
| Eurocom Sky X4C i9-9900KS | |
| MSI GE75 9SG | |
| Asus GL702ZC-GC104T | |
| AMD Ryzen 1800X - Asus Crosshair VI Hero | |
| Pass 1 | |
| Eurocom Sky X4C i9-9900KS | |
| AMD Radeon RX Vega 64 | |
| MSI GE75 9SG | |
| AMD Ryzen 1800X - Asus Crosshair VI Hero | |
| Asus GL702ZC-GC104T | |
| WinRAR - Result | |
| Eurocom Sky X4C i9-9900KS | |
| AMD Radeon RX Vega 64 | |
| MSI GE75 9SG | |
| AMD Ryzen 1800X - Asus Crosshair VI Hero | |
| Asus GL702ZC-GC104T | |
| TrueCrypt | |
| Serpent Mean 100MB | |
| AMD Radeon RX Vega 64 | |
| Eurocom Sky X4C i9-9900KS | |
| Asus GL702ZC-GC104T | |
| Eurocom Sky X4C | |
| MSI GE75 9SG | |
| Twofish Mean 100MB | |
| AMD Radeon RX Vega 64 | |
| Eurocom Sky X4C i9-9900KS | |
| AMD Ryzen 1800X - Asus Crosshair VI Hero | |
| Asus GL702ZC-GC104T | |
| Eurocom Sky X4C | |
| MSI GE75 9SG | |
| AES Mean 100MB | |
| Eurocom Sky X4C i9-9900KS | |
| AMD Radeon RX Vega 64 | |
| AMD Ryzen 1800X - Asus Crosshair VI Hero | |
| MSI GE75 9SG | |
| Eurocom Sky X4C | |
| Asus GL702ZC-GC104T | |
| Geekbench 4.0 | |
| Compute OpenCL Score | |
| Eurocom Sky X4C i9-9900KS | |
| MSI GL62M 7RD-077 | |
| 64 Bit Multi-Core Score | |
| Eurocom Sky X4C i9-9900KS | |
| AMD Ryzen 1800X - Asus Crosshair VI Hero | |
| MSI GL62M 7RD-077 | |
| 64 Bit Single-Core Score | |
| Eurocom Sky X4C i9-9900KS | |
| AMD Ryzen 1800X - Asus Crosshair VI Hero | |
| MSI GL62M 7RD-077 | |
| Blender - v2.79 BMW27 CPU | |
| MSI GE75 9SG | |
| AMD Ryzen 1800X - Asus Crosshair VI Hero | |
| Eurocom Sky X4C i9-9900KS | |
| AMD Radeon RX Vega 64 | |
| 7-Zip 18.03 | |
| 7z b 4 | |
| AMD Radeon RX Vega 64 | |
| Eurocom Sky X4C i9-9900KS | |
| MSI GE75 9SG | |
| 7z b 4 -mmt1 | |
| Eurocom Sky X4C i9-9900KS | |
| AMD Radeon RX Vega 64 | |
| MSI GE75 9SG | |
| HWBOT x265 Benchmark v2.2 - 4k Preset | |
| AMD Radeon RX Vega 64 | |
| Eurocom Sky X4C i9-9900KS | |
| MSI GE75 9SG | |
| MSI GL62M 7RD-077 | |
* ... Moindre est la valeur, meilleures sont les performances
| PCMark 8 | |
| Home Score Accelerated v2 | |
| Eurocom Sky X4C i9-9900KS | |
| Eurocom Sky X7C i9-9900K | |
| Alienware Area-51m i9-9900K RTX 2080 | |
| Asus GL702ZC-GC104T | |
| Work Score Accelerated v2 | |
| Eurocom Sky X4C i9-9900KS | |
| Eurocom Sky X7C i9-9900K | |
| Alienware Area-51m i9-9900K RTX 2080 | |
| Asus GL702ZC-GC104T | |
| PCMark 8 Home Score Accelerated v2 | 5744 points | |
| PCMark 8 Work Score Accelerated v2 | 6464 points | |
| PCMark 10 Score | 7511 points | |
Aide | ||
| Eurocom Sky X4C i9-9900KS Samsung SSD 970 Pro 512GB | MSI GE63VR 7RF Raider Toshiba HG6 THNSNJ256G8NY | Asus Strix Scar III G531GW-AZ062T Intel SSD 660p SSDPEKNW512G8 | Lenovo Legion Y740-15ICHg WDC PC SN520 SDAPMUW-128G | MSI GT63 Titan 8RG-046 CUK Cyclone 500GB M.2 NVMe | Eurocom Sky X4C Samsung SSD 960 Pro 1TB m.2 NVMe | |
|---|---|---|---|---|---|---|
| AS SSD | -64% | -54% | -50% | -8% | 3% | |
| Seq Read (MB/s) | 2280 | 506 -78% | 1163 -49% | 1372 -40% | 2399 5% | 2541 11% |
| Seq Write (MB/s) | 2198 | 447 -80% | 919 -58% | 746 -66% | 1665 -24% | 1989 -10% |
| 4K Read (MB/s) | 31.67 | 19.55 -38% | 48.88 54% | 35.42 12% | 49.17 55% | 44.83 42% |
| 4K Write (MB/s) | 127.3 | 77.3 -39% | 90.1 -29% | 99.9 -22% | 87.7 -31% | 129.6 2% |
| 4K-64 Read (MB/s) | 1293 | 350.3 -73% | 323.8 -75% | 302.1 -77% | 1144 -12% | 1646 27% |
| 4K-64 Write (MB/s) | 2124 | 170.6 -92% | 403.8 -81% | 191.4 -91% | 648 -69% | 1375 -35% |
| Access Time Read * (ms) | 0.078 | 0.168 -115% | 0.24 -208% | 0.132 -69% | 0.05 36% | 0.032 59% |
| Access Time Write * (ms) | 0.098 | 0.045 54% | 0.046 53% | 0.037 62% | 0.042 57% | 0.03 69% |
| Score Read (Points) | 1552 | 420 -73% | 489 -68% | 475 -69% | 1433 -8% | 1945 25% |
| Score Write (Points) | 2471 | 293 -88% | 586 -76% | 366 -85% | 902 -63% | 1703 -31% |
| Score Total (Points) | 4811 | 930 -81% | 1332 -72% | 1065 -78% | 3040 -37% | 4615 -4% |
| Copy ISO MB/s (MB/s) | 3007 | 1269 -58% | 1062 -65% | 1908 -37% | ||
| Copy Program MB/s (MB/s) | 731 | 452.8 -38% | 426 -42% | 467.2 -36% | ||
| Copy Game MB/s (MB/s) | 1756 | 755 -57% | 650 -63% | 1055 -40% |
* ... Moindre est la valeur, meilleures sont les performances

| 3DMark 06 Standard Score | 47829 points | |
| 3DMark 11 Performance | 28993 points | |
| 3DMark Cloud Gate Standard Score | 60073 points | |
| 3DMark Fire Strike Score | 22556 points | |
| 3DMark Time Spy Score | 10012 points | |
Aide | ||
| Bas | Moyen | Élevé | Ultra | |
|---|---|---|---|---|
| BioShock Infinite (2013) | 528 | 443.5 | 408.6 | 208.2 |
| The Witcher 3 (2015) | 414.3 | 284.2 | 175.9 | 95.5 |
| Shadow of the Tomb Raider (2018) | 178 | 141 | 134 | 124 |
| Eurocom Sky X4C i9-9900KS GeForce RTX 2080 Mobile, i9-9900KS, Samsung SSD 970 Pro 512GB | Eurocom Sky X7C i9-9900K GeForce RTX 2080 Mobile, i9-9900K, 2x Samsung SSD 970 Pro 512GB (RAID 0) | MSI GT76 Titan DT 9SG GeForce RTX 2080 Mobile, i9-9900K, 2x Samsung PM961 MZVLW256HEHP (RAID 0) | Alienware Area-51m i9-9900K RTX 2080 GeForce RTX 2080 Mobile, i9-9900K, 2x SK Hynix PC400 512GB (RAID 0) | Asus GL702ZC-GC104T Radeon RX 580 (Laptop), R7 1700, SanDisk SD8SN8U256G1002 | Asus Strix Scar III G531GW-AZ062T GeForce RTX 2070 Mobile, i7-9750H, Intel SSD 660p SSDPEKNW512G8 | |
|---|---|---|---|---|---|---|
| Noise | -2% | -19% | -16% | -17% | -6% | |
| arrêt / environnement * (dB) | 28.1 | 28.9 -3% | 30 -7% | 28.1 -0% | 31 -10% | 30 -7% |
| Idle Minimum * (dB) | 28.5 | 29.7 -4% | 33 -16% | 28.1 1% | 32 -12% | 30.6 -7% |
| Idle Average * (dB) | 28.7 | 29.7 -3% | 34 -18% | 28.6 -0% | 38 -32% | 30.6 -7% |
| Idle Maximum * (dB) | 29.5 | 30 -2% | 44 -49% | 51 -73% | 40 -36% | 37.7 -28% |
| Load Average * (dB) | 31.2 | 36.5 -17% | 47 -51% | 51 -63% | 42 -35% | 36.5 -17% |
| Witcher 3 ultra * (dB) | 55.1 | 49 11% | 53 4% | 51 7% | 54 2% | 52.1 5% |
| Load Maximum * (dB) | 59.3 | 57 4% | 59 1% | 51 14% | 57 4% | 48.1 19% |
* ... Moindre est la valeur, meilleures sont les performances
Degré de la nuisance sonore
| Au repos |
| 28.5 / 28.7 / 29.5 dB(A) |
| Fortement sollicité |
| 31.2 / 59.3 dB(A) |
 | ||
30 dB silencieux 40 dB(A) audible 50 dB(A) bruyant |
||
min: | ||
(-) La température maximale du côté supérieur est de 51.6 °C / 125 F, par rapport à la moyenne de 40.4 °C / 105 F, allant de 21.2 à 68.8 °C pour la classe Gaming.
(-) Le fond chauffe jusqu'à un maximum de 54.6 °C / 130 F, contre une moyenne de 43.2 °C / 110 F
(+) En utilisation inactive, la température moyenne du côté supérieur est de 27.7 °C / 82 F, par rapport à la moyenne du dispositif de 33.9 °C / 93 F.
(±) En jouant à The Witcher 3, la température moyenne du côté supérieur est de 33.1 °C / 92 F, alors que la moyenne de l'appareil est de 33.9 °C / 93 F.
(+) Les repose-poignets et le pavé tactile sont plus froids que la température de la peau avec un maximum de 28.8 °C / 83.8 F et sont donc froids au toucher.
(±) La température moyenne de la zone de l'appui-paume de dispositifs similaires était de 28.8 °C / 83.8 F (0 °C / #0 F).
Eurocom Sky X4C i9-9900KS analyse audio
(±) | le niveau sonore du haut-parleur est moyen mais bon (77.6# dB)
Basses 100 - 315 Hz
(-) | presque aucune basse - en moyenne 15.7% plus bas que la médiane
(±) | la linéarité des basses est moyenne (10.3% delta à la fréquence précédente)
Médiums 400 - 2000 Hz
(±) | médiane supérieure - en moyenne 7.1% supérieure à la médiane
(±) | la linéarité des médiums est moyenne (11.6% delta à la fréquence précédente)
Aiguës 2 - 16 kHz
(+) | des sommets équilibrés - à seulement 3.9% de la médiane
(±) | la linéarité des aigus est moyenne (10.6% delta à la fréquence précédente)
Globalement 100 - 16 000 Hz
(-) | le son global n'est pas linéaire (30.7% de différence à la médiane)
Par rapport à la même classe
» 96% de tous les appareils testés de cette catégorie étaient meilleurs, 2% similaires, 2% pires
» Le meilleur avait un delta de 6%, la moyenne était de 18%, le pire était de 132%.
Par rapport à tous les appareils testés
» 89% de tous les appareils testés étaient meilleurs, 3% similaires, 8% pires
» Le meilleur avait un delta de 4%, la moyenne était de 24%, le pire était de 134%.
Apple MacBook 12 (Early 2016) 1.1 GHz analyse audio
(+) | les haut-parleurs peuvent jouer relativement fort (83.6# dB)
Basses 100 - 315 Hz
(±) | basse réduite - en moyenne 11.3% inférieure à la médiane
(±) | la linéarité des basses est moyenne (14.2% delta à la fréquence précédente)
Médiums 400 - 2000 Hz
(+) | médiane équilibrée - seulement 2.4% de la médiane
(+) | les médiums sont linéaires (5.5% delta à la fréquence précédente)
Aiguës 2 - 16 kHz
(+) | des sommets équilibrés - à seulement 2% de la médiane
(+) | les aigus sont linéaires (4.5% delta à la fréquence précédente)
Globalement 100 - 16 000 Hz
(+) | le son global est linéaire (10.2% différence à la médiane)
Par rapport à la même classe
» 7% de tous les appareils testés de cette catégorie étaient meilleurs, 2% similaires, 91% pires
» Le meilleur avait un delta de 5%, la moyenne était de 18%, le pire était de 53%.
Par rapport à tous les appareils testés
» 5% de tous les appareils testés étaient meilleurs, 1% similaires, 94% pires
» Le meilleur avait un delta de 4%, la moyenne était de 24%, le pire était de 134%.
| Éteint/en veille | |
| Au repos | |
| Fortement sollicité |
|
Légende:
min: | |
| Eurocom Sky X4C i9-9900KS i9-9900KS, GeForce RTX 2080 Mobile, Samsung SSD 970 Pro 512GB, IPS, 1920x1080, 15.6" | Alienware Area-51m i9-9900K RTX 2080 i9-9900K, GeForce RTX 2080 Mobile, 2x SK Hynix PC400 512GB (RAID 0), IPS, 1920x1080, 17.3" | MSI GT63 Titan 8RG-046 i7-8750H, GeForce GTX 1080 Mobile, CUK Cyclone 500GB M.2 NVMe, TN, 1920x1080, 15.6" | Asus GL702ZC-GC104T R7 1700, Radeon RX 580 (Laptop), SanDisk SD8SN8U256G1002, IPS, 1920x1080, 17.3" | MSI GE63VR 7RF Raider i7-7700HQ, GeForce GTX 1070 Mobile, Toshiba HG6 THNSNJ256G8NY, TN LED, 1920x1080, 15.6" | Eurocom Sky X4C i7-8700K, GeForce GTX 1080 Mobile, Samsung SSD 960 Pro 1TB m.2 NVMe, IPS, 3840x2160, 15.6" | |
|---|---|---|---|---|---|---|
| Power Consumption | 2% | 25% | -3% | 46% | 18% | |
| Idle Minimum * (Watt) | 33.4 | 23.3 30% | 26.4 21% | 43 -29% | 11 67% | 30.2 10% |
| Idle Average * (Watt) | 40.5 | 33.5 17% | 30 26% | 50 -23% | 16 60% | 34.7 14% |
| Idle Maximum * (Watt) | 44 | 38.4 13% | 30.6 30% | 57 -30% | 21 52% | 37.8 14% |
| Load Average * (Watt) | 121.9 | 114.1 6% | 90.4 26% | 125 -3% | 92 25% | 130.3 -7% |
| Witcher 3 ultra * (Watt) | 258.2 | 339.5 -31% | 255.6 1% | 180 30% | 185 28% | 172.2 33% |
| Load Maximum * (Watt) | 397.6 | 485.1 -22% | 224.4 44% | 240 40% | 224 44% | 217.7 45% |
* ... Moindre est la valeur, meilleures sont les performances
| Eurocom Sky X4C i9-9900KS i9-9900KS, GeForce RTX 2080 Mobile, 82 Wh | Lenovo Legion Y740-15ICHg i7-9750H, GeForce RTX 2070 Max-Q, 57 Wh | Alienware Area-51m i9-9900K RTX 2080 i9-9900K, GeForce RTX 2080 Mobile, 90 Wh | MSI GT76 Titan DT 9SG i9-9900K, GeForce RTX 2080 Mobile, 90 Wh | Asus Strix Scar III G531GW-AZ062T i7-9750H, GeForce RTX 2070 Mobile, 66 Wh | Eurocom Sky X4C i7-8700K, GeForce GTX 1080 Mobile, 82 Wh | |
|---|---|---|---|---|---|---|
| Autonomie de la batterie | 7% | -25% | 79% | 100% | -7% | |
| WiFi v1.3 (h) | 2.8 | 3 7% | 2.1 -25% | 5 79% | 5.6 100% | 2.6 -7% |
| Reader / Idle (h) | 2.6 | 6.8 | 3 | |||
| Load (h) | 1.1 | 0.9 | 1.4 |
Points positifs
Points négatifs
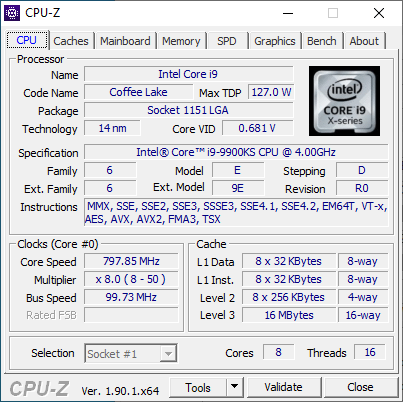
Le Core i9-9900K originel n’avait pas beaucoup de marges d’overclocking, et c’est sans surprise qu’il en va de même du Core i9-9900KS. Par défaut, le Core i9-9900KS du Sky X4C se stabilise à 4,4 GHz et 88 °C, soit juste 400 MHz au-dessus de la fréquence de base du processeur. De plus gros portables, comme l’Alienware Area-51m et le MSI GT76 avec i9-9900K, sont capables de faire aussi bien ou même mieux que le i9-9900KS de notre Eurocom. Aussi polyvalent que soit ce châssis Clevo de trois ans d’âge, la série Core i9 le pousse dans ses retranchements. Il est temps que Clevo mette à jour son système pour mieux exploiter les potentiels élevés de Turbo Boost des CPU Core i9.
D’une génération à l’autre, les i9-9900K et 9900KS sont de 35 à 45 % plus rapide que les i7-8700K et 9700K. L’on bénéficiera toujours d’un passage au Core i9, mais n’en attendez pas trop de l’overclocking du Sky X4C.
Ultra puissant, mais également ultra chaud. Intégrer un Core i9-9900KS dans un portable est plus pour le show, d’autant que le Core i9-9900K est à peu près aussi performant. L’Eurocom Sky X4C est capable de faire tourner le i9-9900KS de façon stable à une fréquence supérieure de 10 % à sa fréquence de base, même si ce processeur est capable de faire mieux sur un PC de bureau classique.
L’intégralité de cette critique est disponible en anglais en suivant ce lien.
Eurocom Sky X4C i9-9900KS
- 11/28/2019 v7 (old)
Allen Ngo
Price comparison
