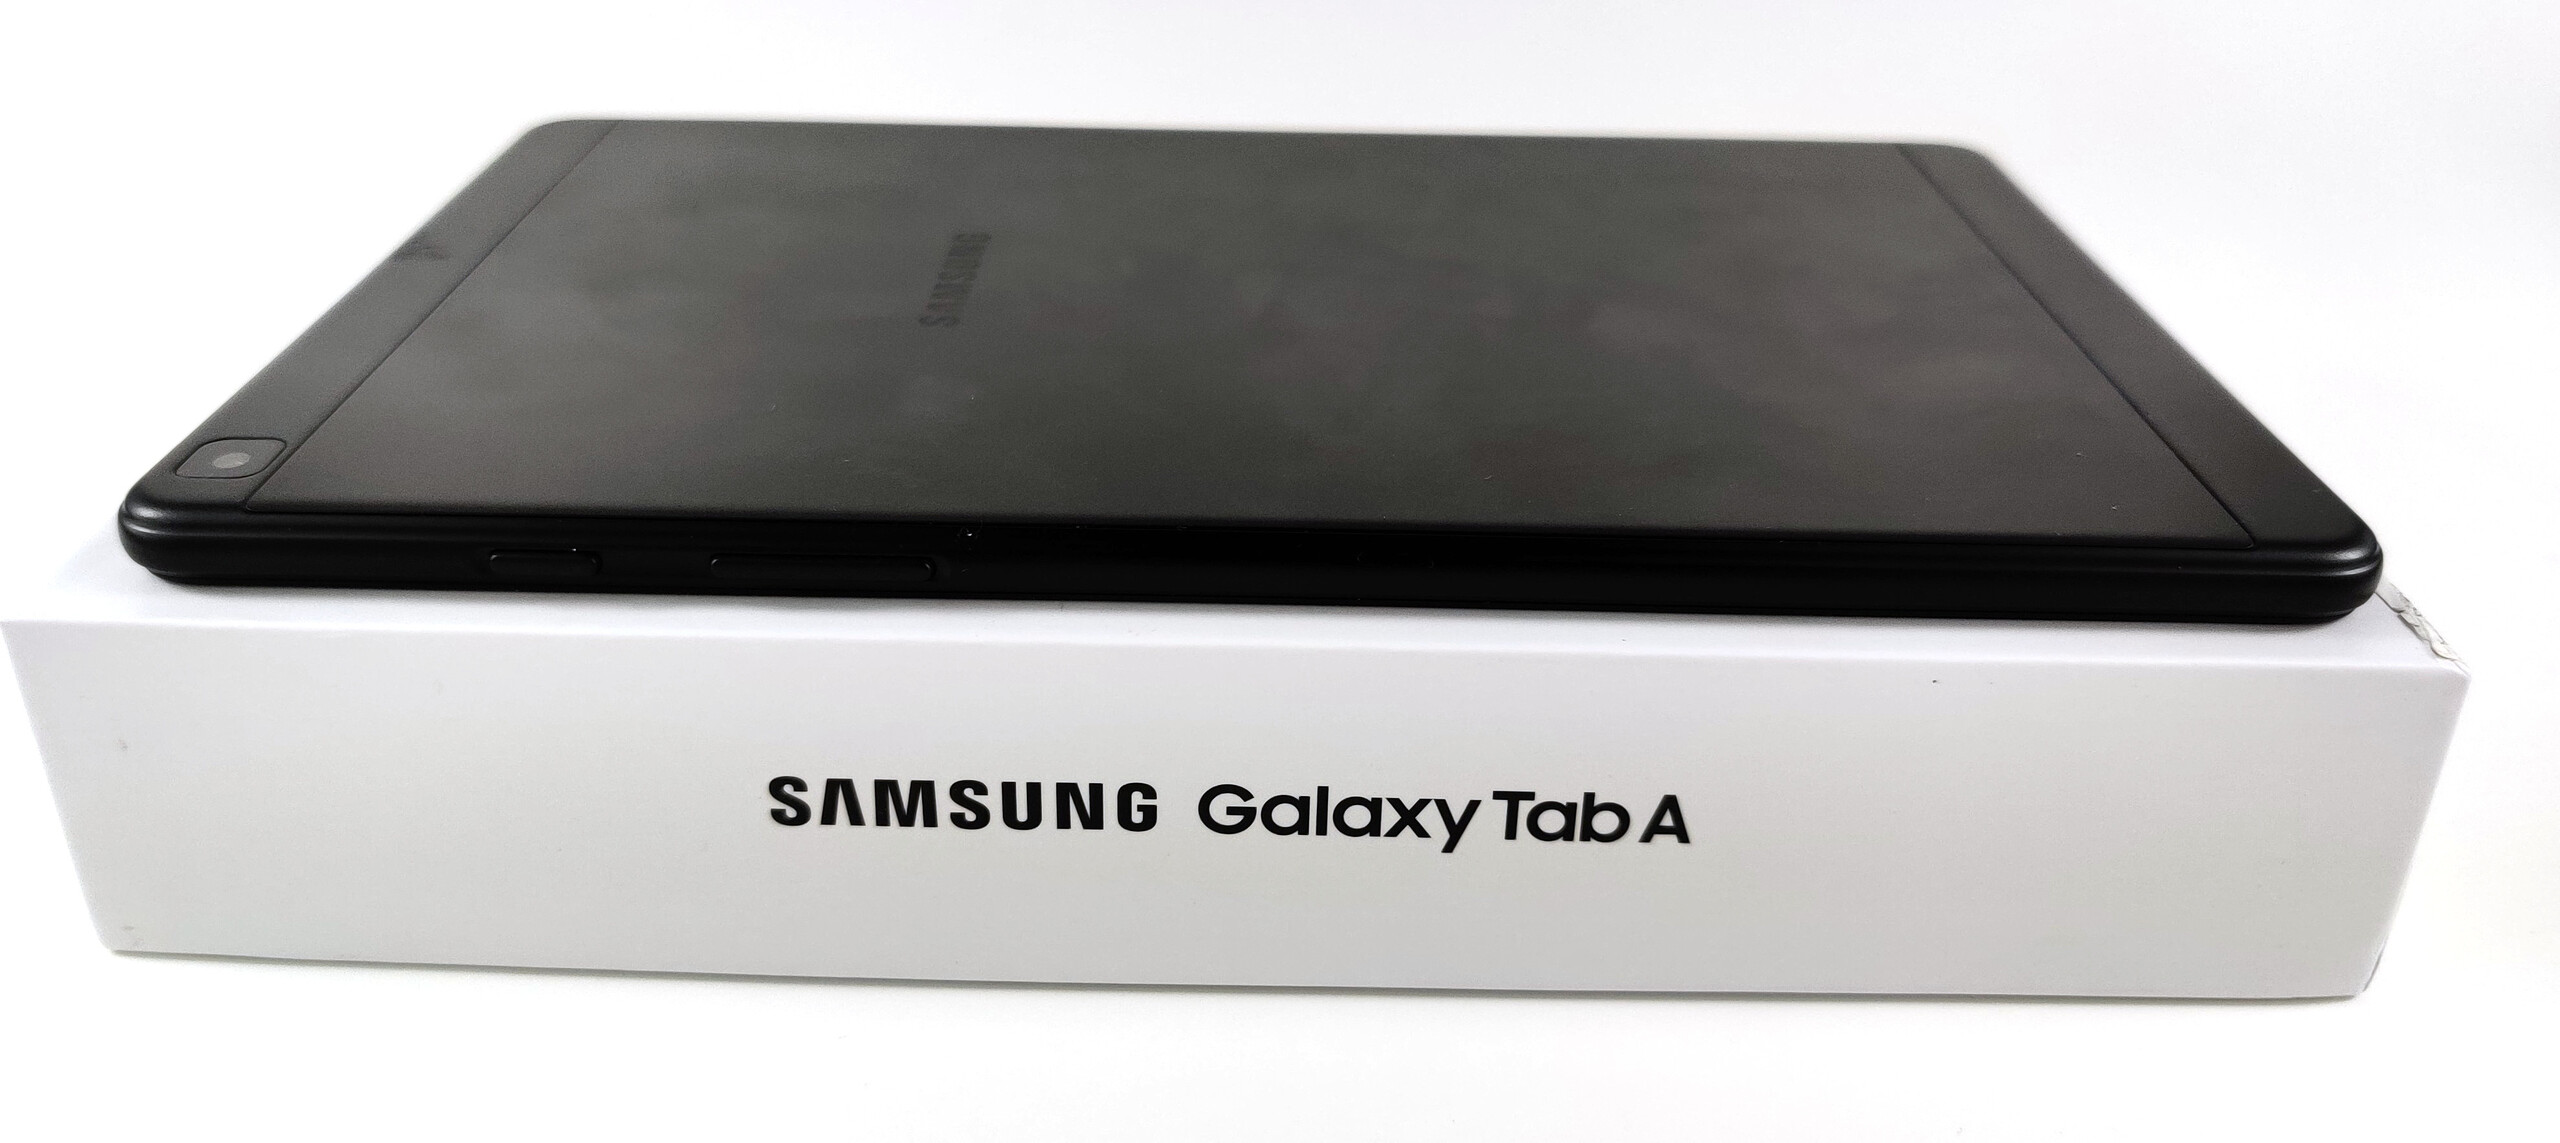
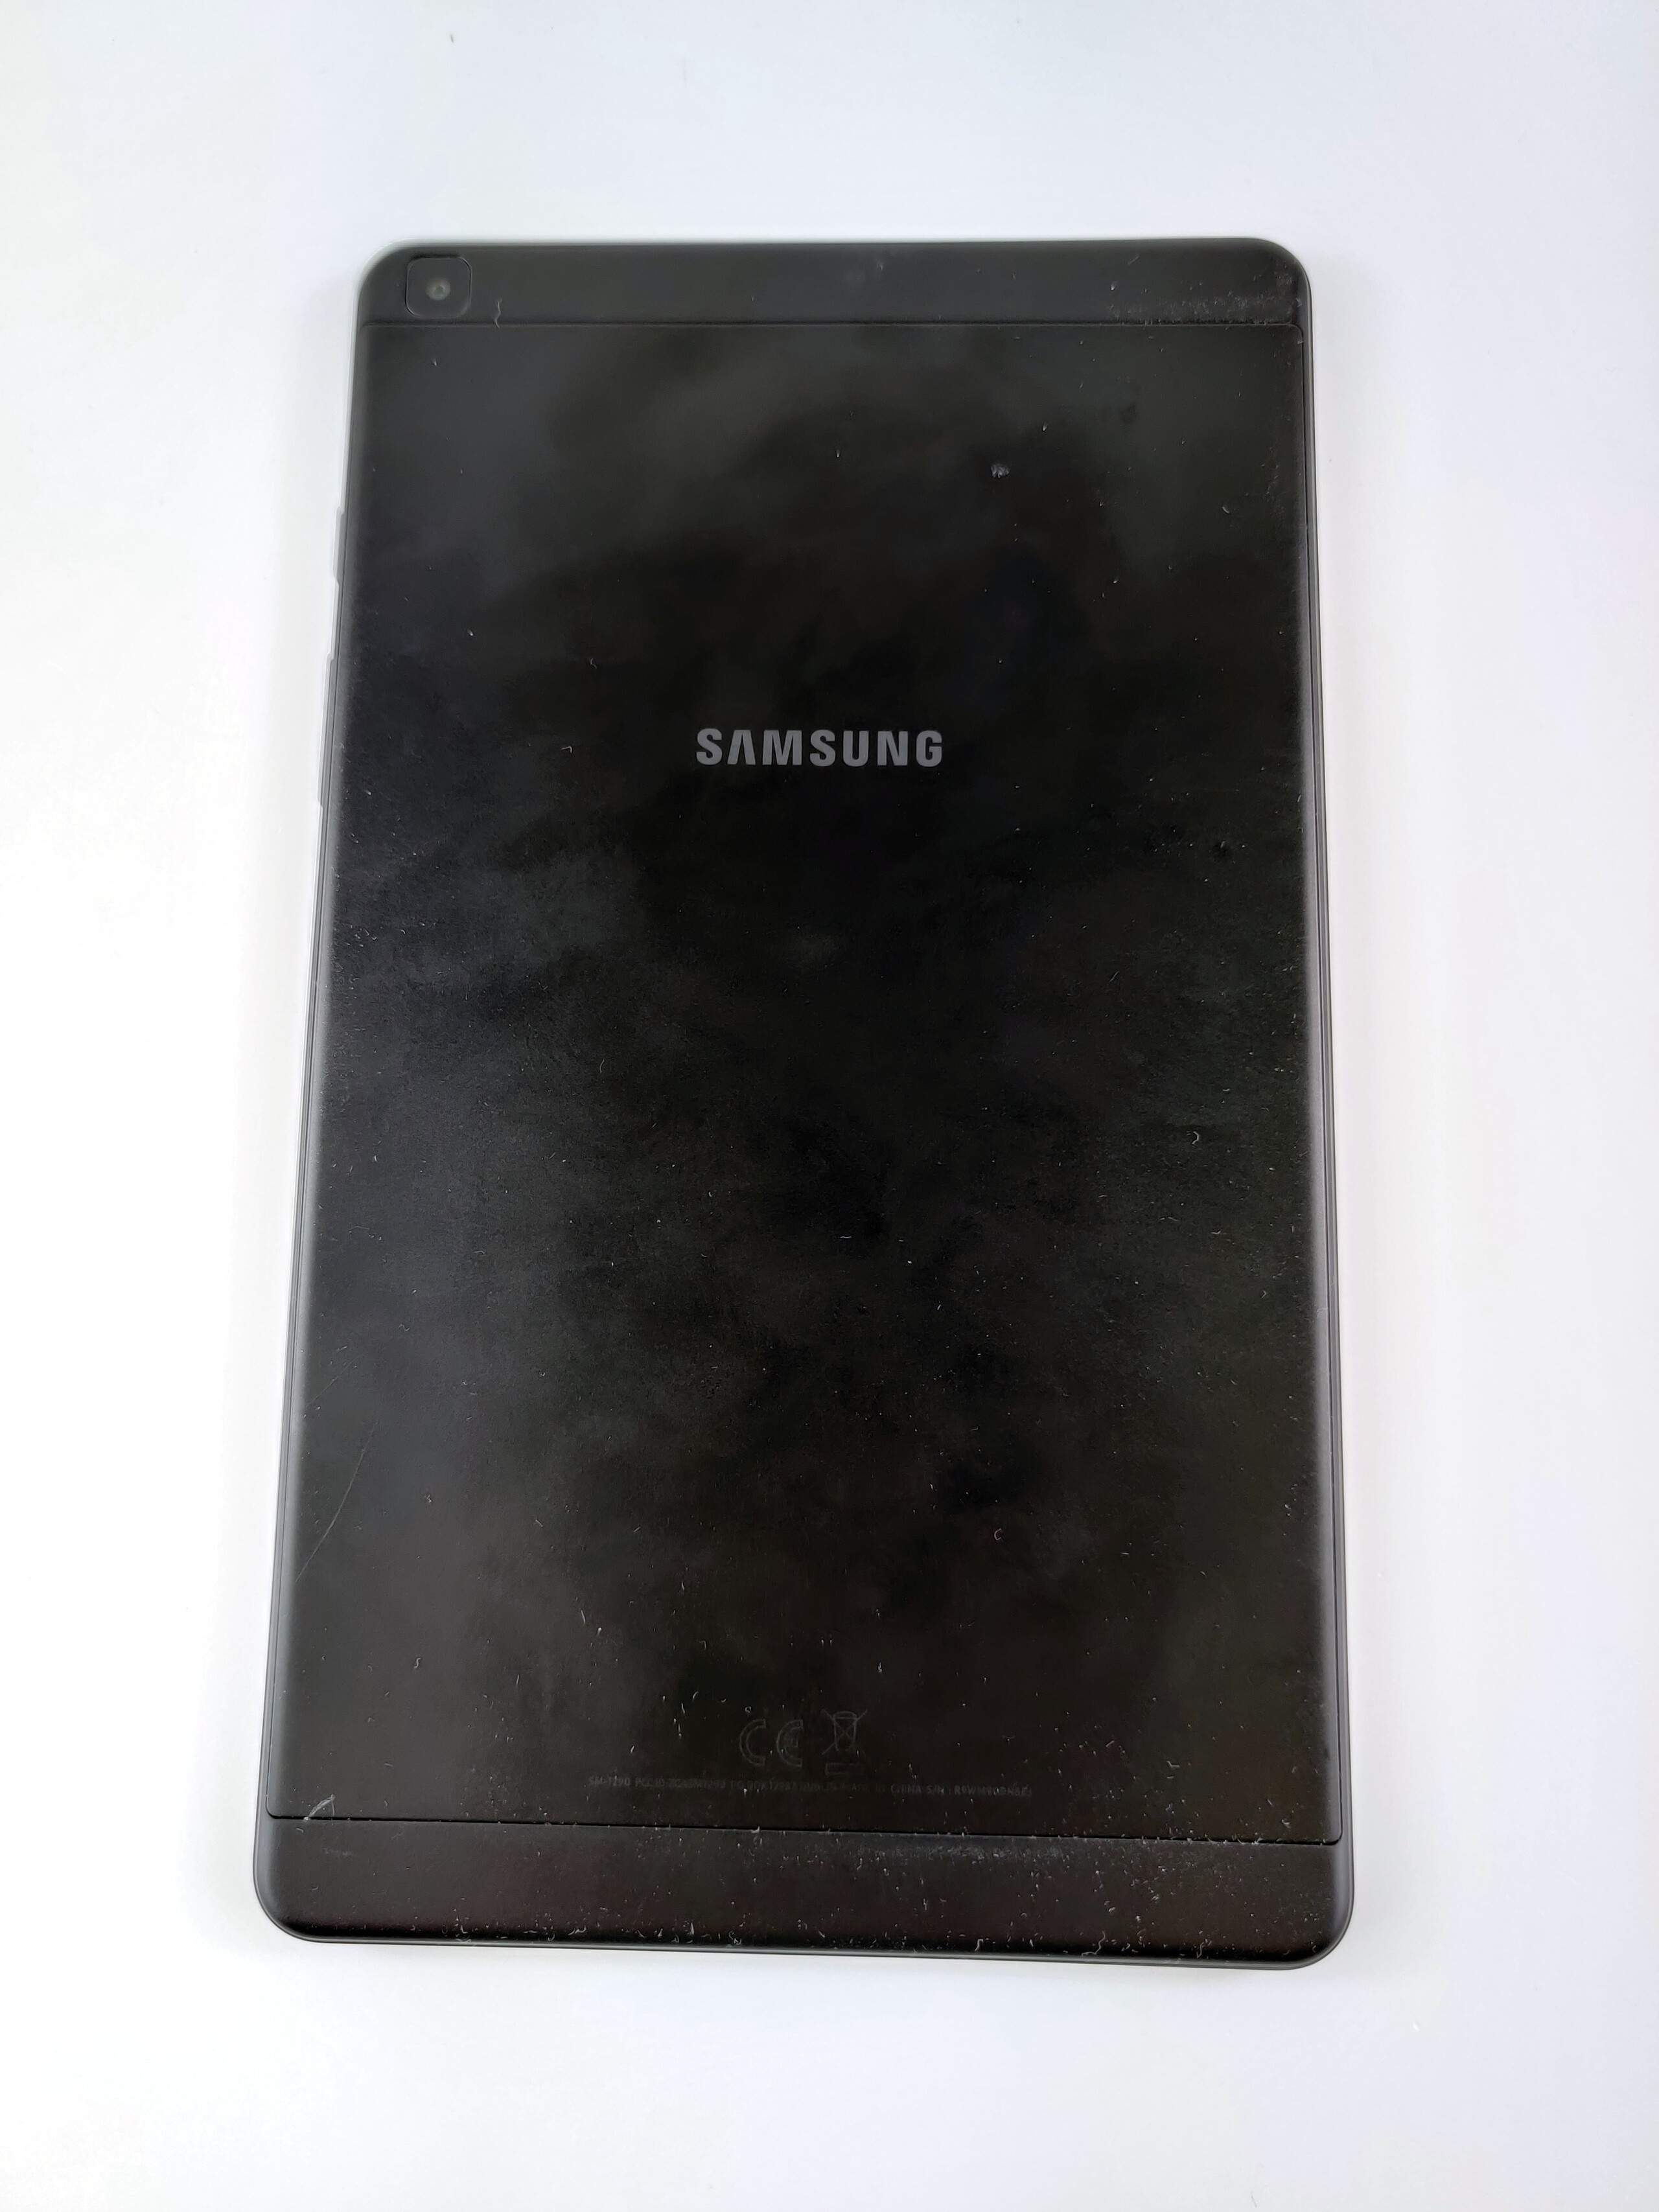
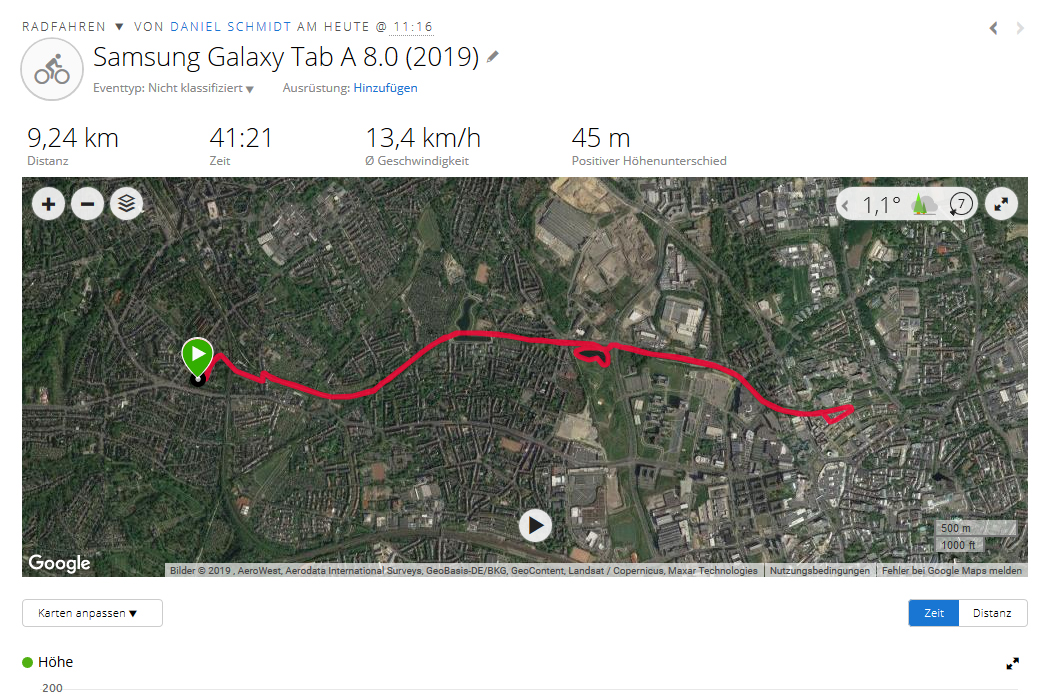
Test de la Samsung Galaxy Tab A 8.0 (2019) : une tablette Samsung à petit prix avec de gros défauts
Note | Date | Modèle | Poids | Épaisseur | Taille | Résolution | Prix |
|---|---|---|---|---|---|---|---|
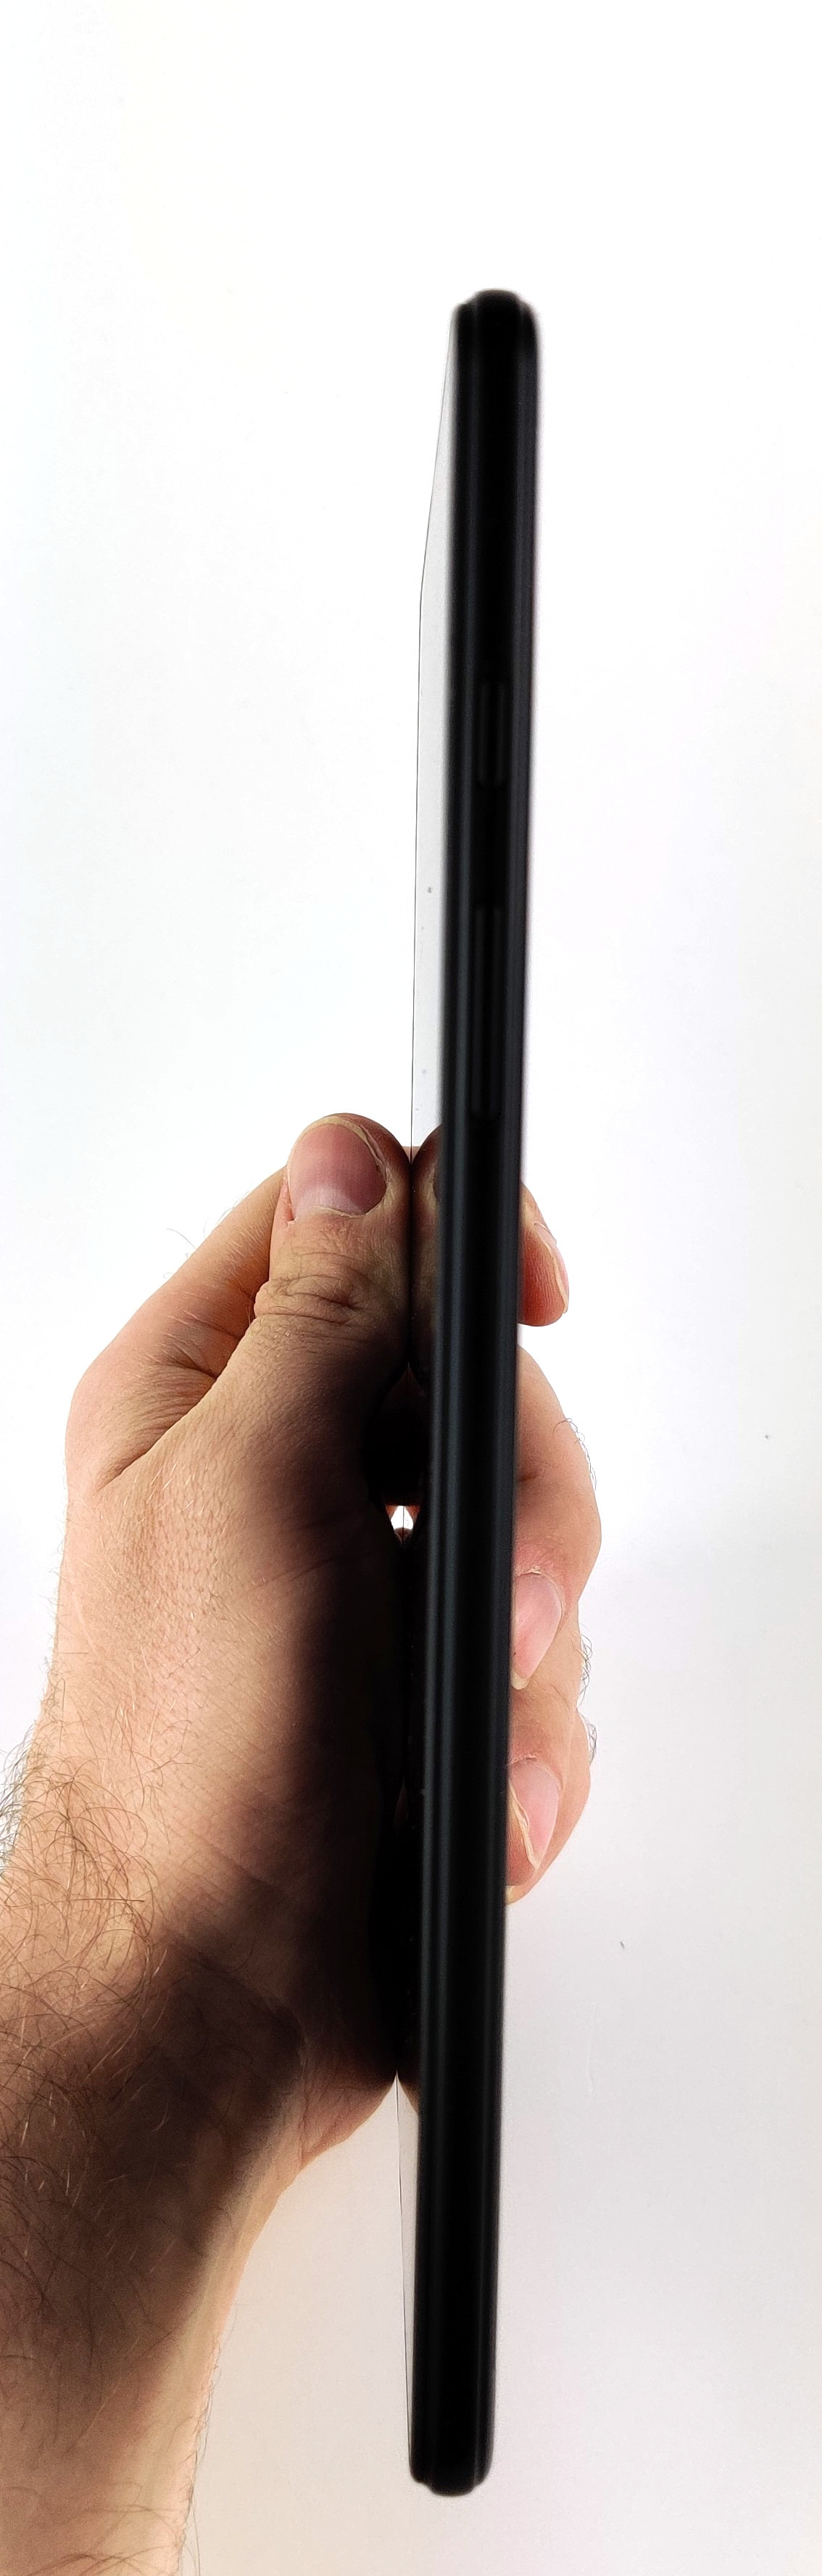
| 79.6 % v7 (old) | 01/20 | Samsung Galaxy Tab A 8.0 2019 Wifi SM-T290 SD 429, Adreno 504 | 345 g | 8 mm | 8.00" | 1280x800 | |
| 81 % v7 (old) | 02/20 | Lenovo Tab M8 HD Helio A22 MT6762M, PowerVR GE8320 | 305 g | 8.2 mm | 8.00" | 1280x800 | |
| 78.7 % v6 (old) | 03/19 | Alldocube M8 T801 MT6797X, Mali-T880 MP4 | 345 g | 8.48 mm | 8.00" | 1920x1200 | |
| 77.7 % v6 (old) | 08/19 | Amazon Fire 7 2019 MT8163 V/B 1.3 GHz, Mali-T720 MP2 | 286 g | 9.6 mm | 7.00" | 1024x600 | |
| 78.9 % v7 (old) | 12/19 | Amazon Fire HD 10 2019 MT8183, Mali-G72 MP3 | 504 g | 9.8 mm | 10.10" | 1920x1200 | |
| 80.8 % v7 (old) | 09/18 | Huawei MediaPad M5 lite Kirin 659, Mali-T830 MP2 | 475 g | 7.7 mm | 10.10" | 1920x1200 | |
| 73.7 % v6 (old) | 03/19 | Trekstor SurfTab B10 MT8163 V/A 1.5 GHz, Mali-T720 MP2 | 505 g | 9.8 mm | 10.10" | 1280x800 | |
| 75.4 % v7 (old) | 01/20 | Lenovo Tab M7 MT8321, Mali-400 MP2 | 236 g | 8.2 mm | 7.00" | 1024x600 |

Comparaison des images
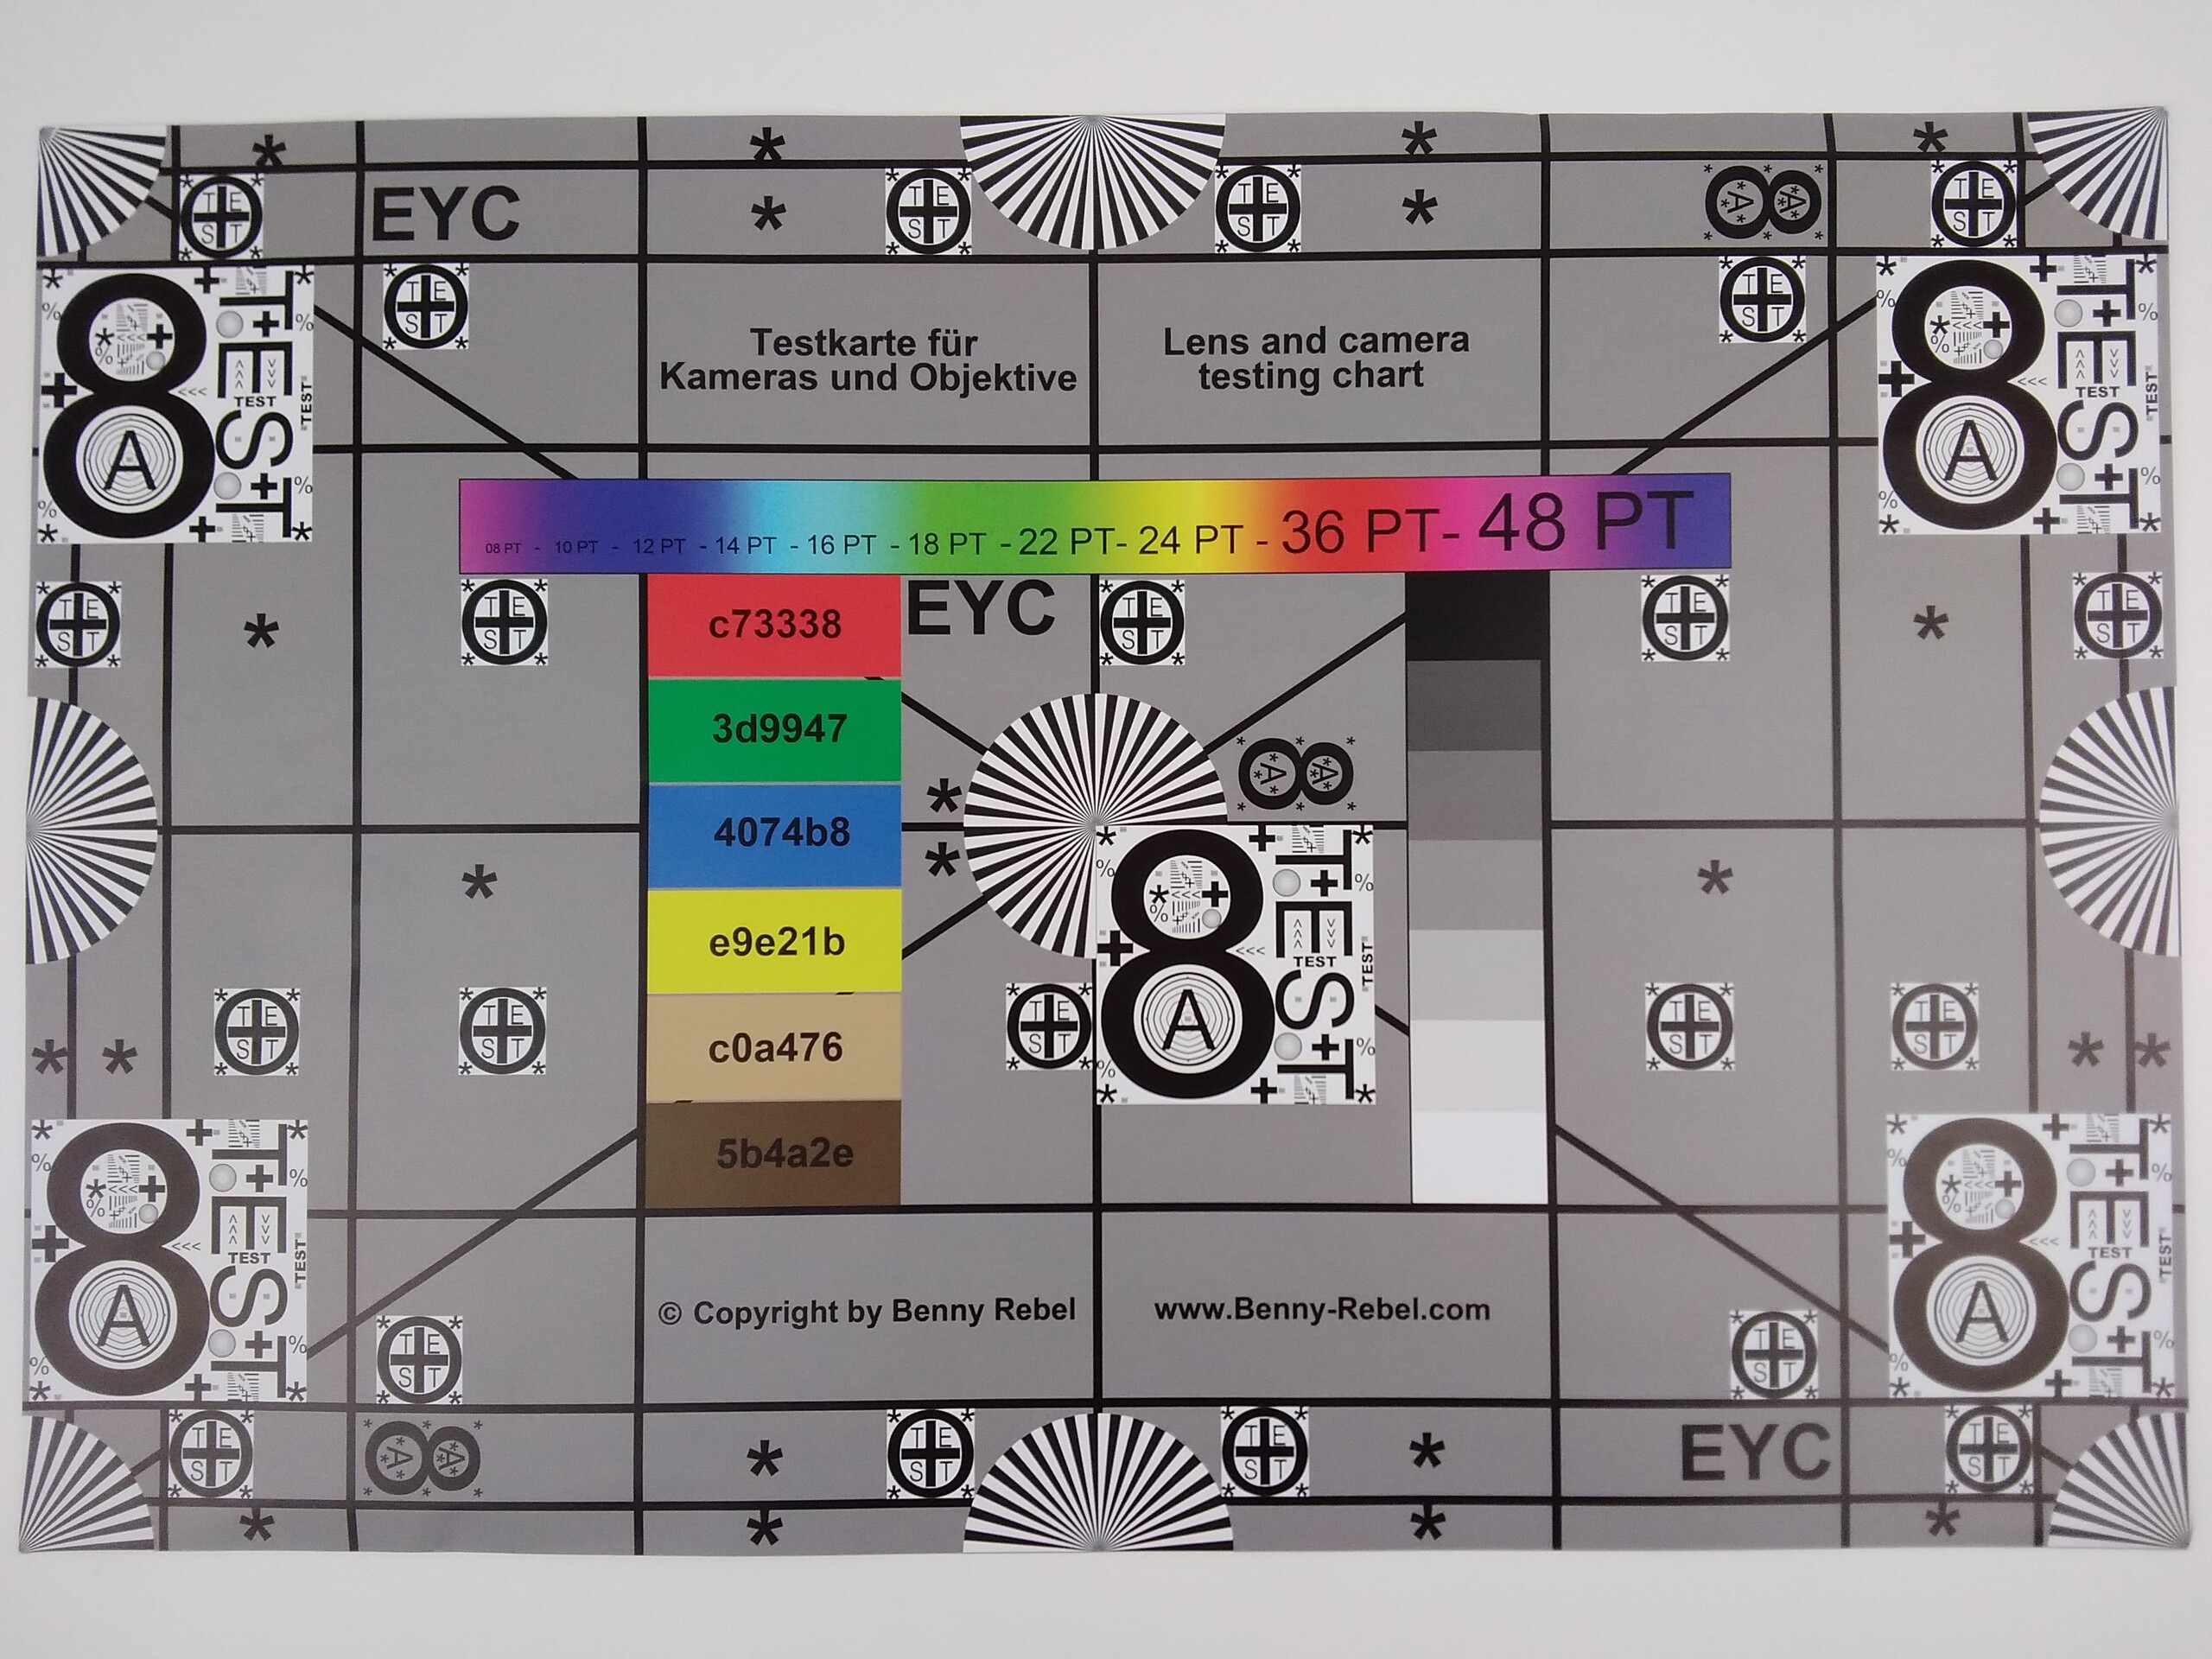
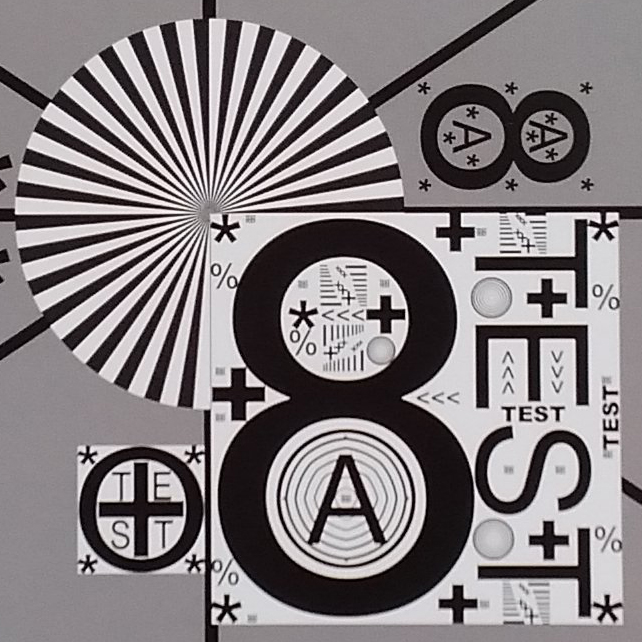
Choisir une scène pour naviguer dans la première image. Un clic permet de changer le niveau de zoom, un autre clic permet de revenir à l'image originale dans une nouvelle fenêtre. La première image montre l'original pris par l'appareil testé.
Scene 1Scene 2Scene 3


| |||||||||||||||||||||||||
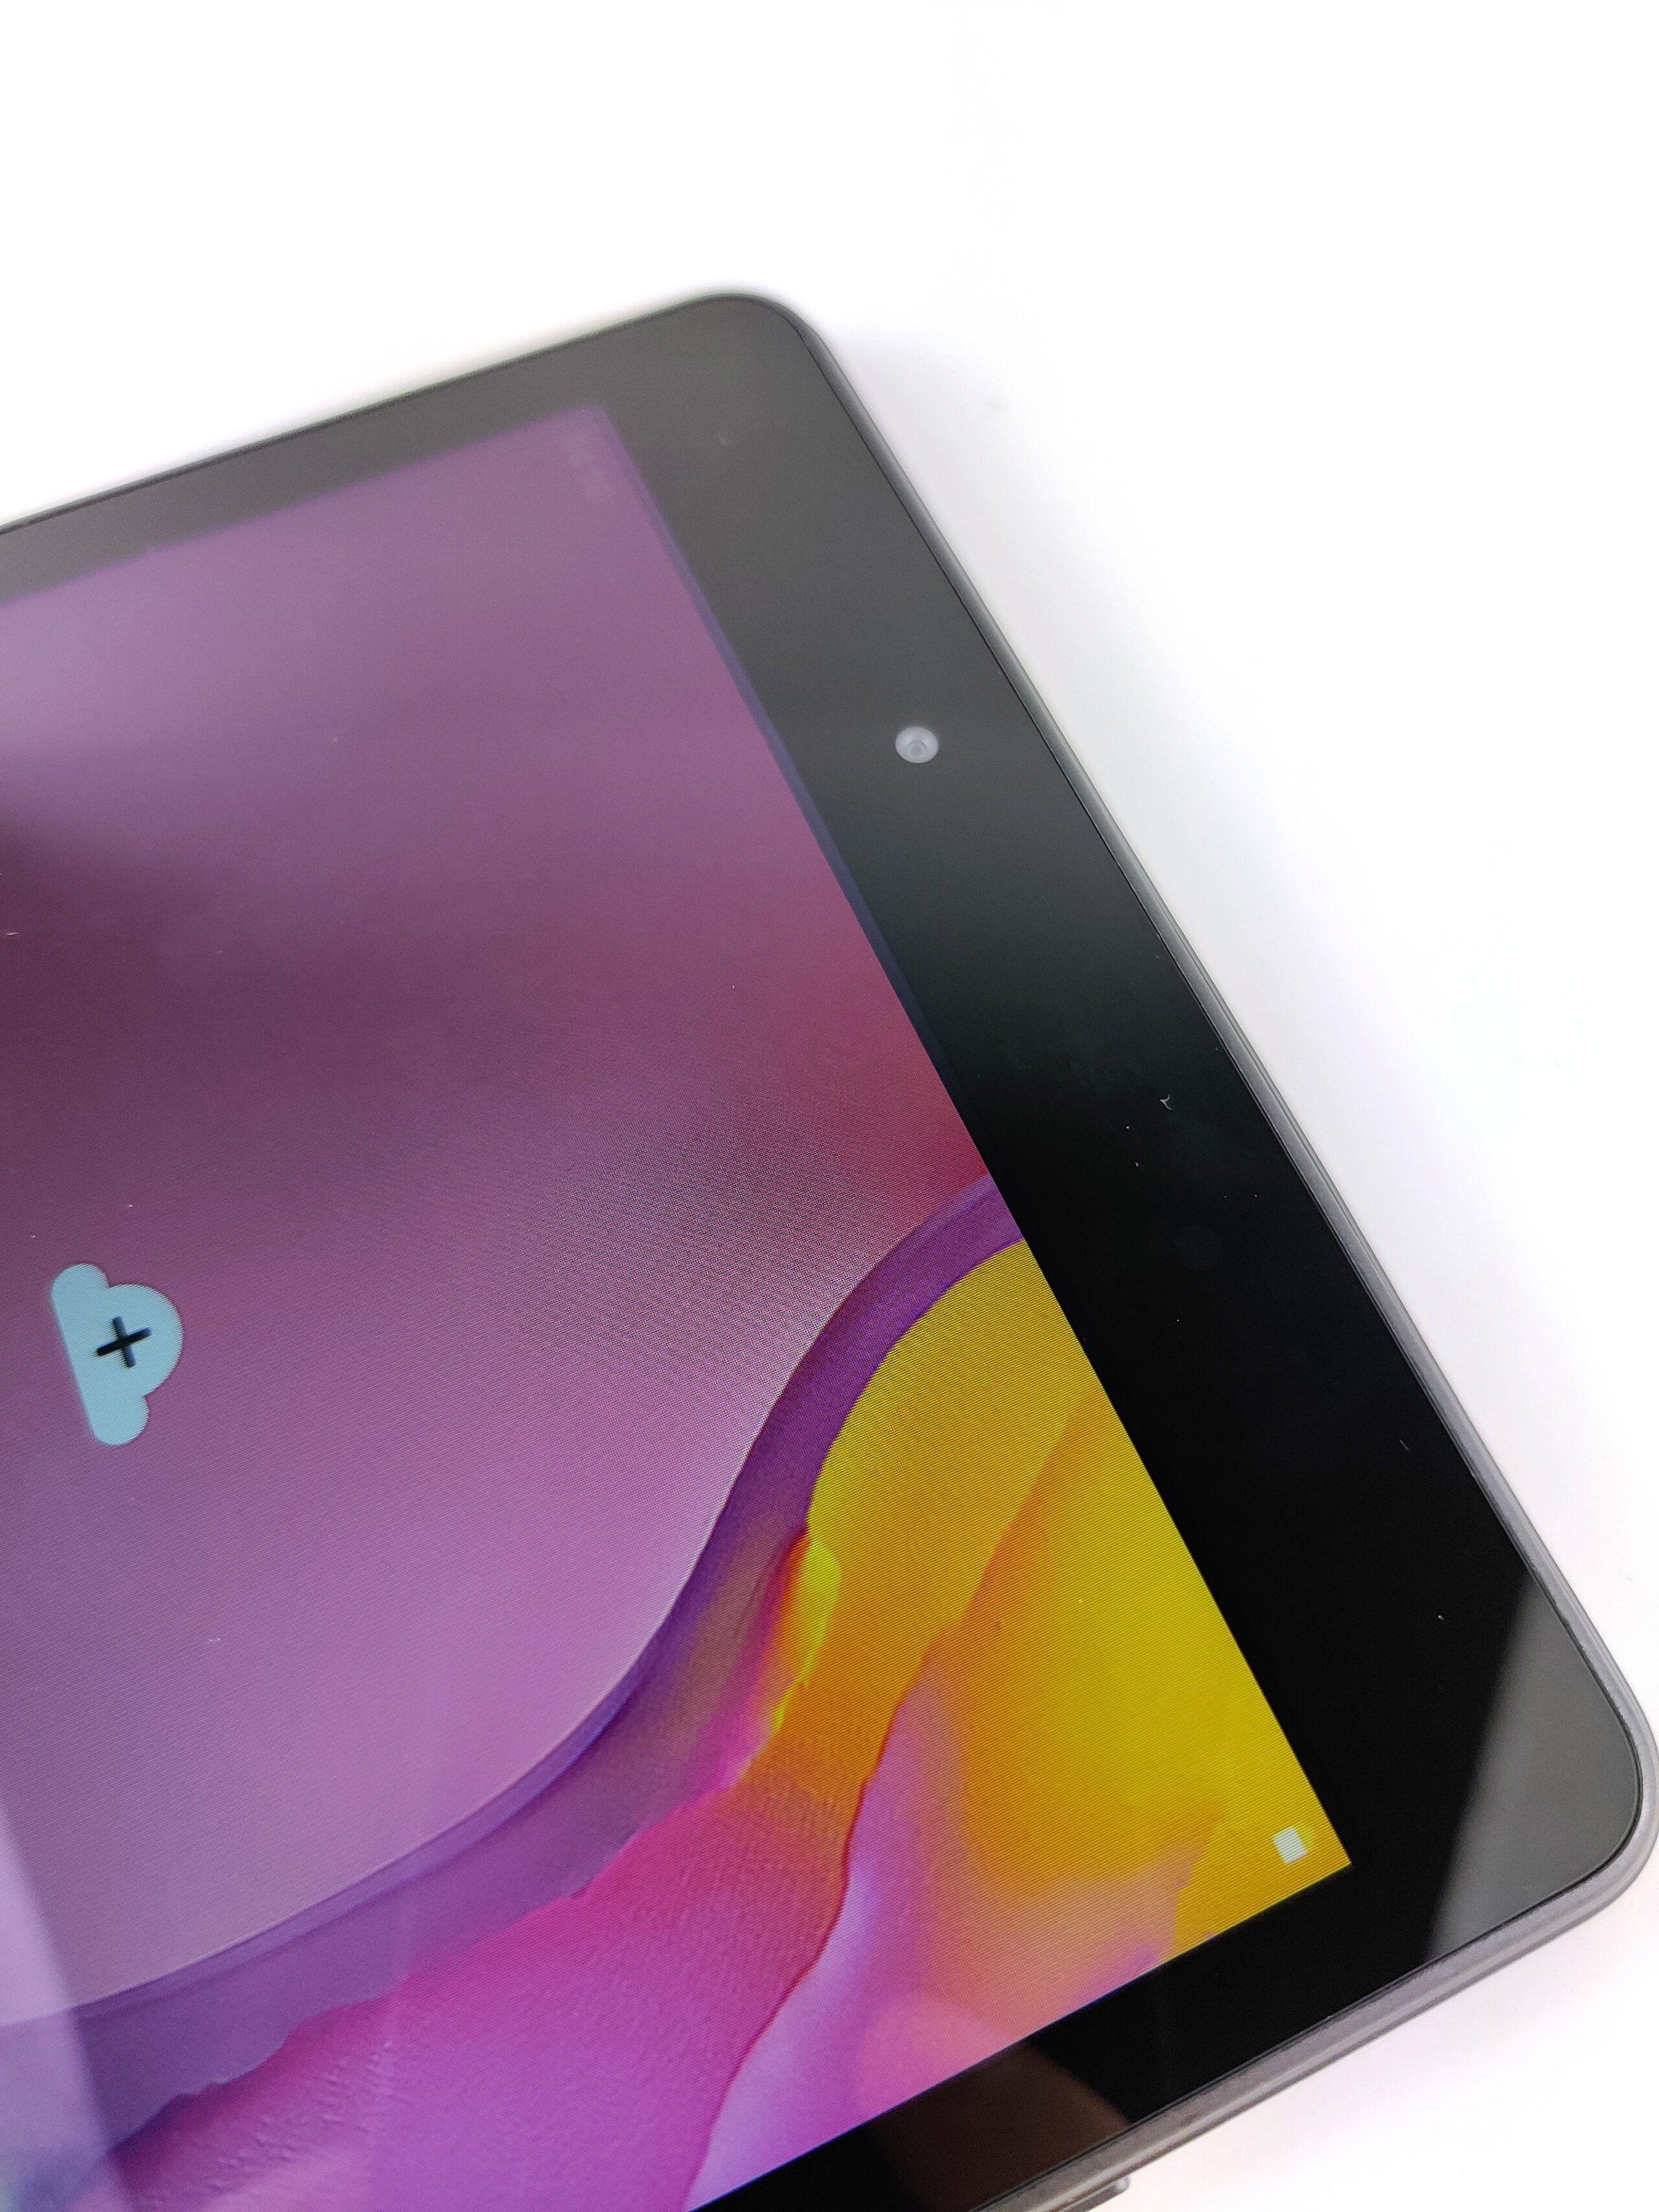
Homogénéité de la luminosité: 87 %
Valeur mesurée au centre, sur batterie: 377 cd/m²
Contraste: 1300:1 (Valeurs des noirs: 0.29 cd/m²)
ΔE ColorChecker Calman: 6.1 | ∀{0.5-29.43 Ø4.73}
ΔE Greyscale Calman: 6.6 | ∀{0.09-98 Ø4.97}
85.3% sRGB (Calman 2D)
Gamma: 2.13
CCT: 7861 K
| Samsung Galaxy Tab A 8.0 2019 Wifi SM-T290 TFT, 1280x800, 8" | Lenovo Tab M8 HD IPS, 1280x800, 8" | Alldocube M8 T801 IPS, 1920x1200, 8" | Amazon Fire 7 2019 IPS, 1024x600, 7" | Amazon Fire HD 10 2019 IPS, 1920x1200, 10.1" | Huawei MediaPad M5 lite IPS, 1920x1200, 10.1" | Trekstor SurfTab B10 IPS, 1280x800, 10.1" | Lenovo Tab M7 IPS, 1024x600, 7" | |
|---|---|---|---|---|---|---|---|---|
| Screen | 19% | -20% | 9% | 2% | -26% | -13% | -5% | |
| Brightness middle (cd/m²) | 377 | 379 1% | 317.5 -16% | 391 4% | 449 19% | 514 36% | 223 -41% | 447 19% |
| Brightness (cd/m²) | 372 | 346 -7% | 320 -14% | 385 3% | 425 14% | 492 32% | 211 -43% | 449 21% |
| Brightness Distribution (%) | 87 | 88 1% | 94 8% | 75 -14% | 89 2% | 80 -8% | 81 -7% | 86 -1% |
| Black Level * (cd/m²) | 0.29 | 0.21 28% | 0.5 -72% | 0.15 48% | 0.6 -107% | 0.96 -231% | 0.22 24% | 0.25 14% |
| Contrast (:1) | 1300 | 1805 39% | 635 -51% | 2607 101% | 748 -42% | 535 -59% | 1014 -22% | 1788 38% |
| Colorchecker dE 2000 * | 6.1 | 3.8 38% | 6.12 -0% | 6.3 -3% | 3.1 49% | 5.42 11% | 6.2 -2% | 7.1 -16% |
| Colorchecker dE 2000 max. * | 10.9 | 7.5 31% | 13.72 -26% | 19.3 -77% | 6.4 41% | 9.84 10% | 13 -19% | 20.6 -89% |
| Greyscale dE 2000 * | 6.6 | 5 24% | 5.8 12% | 6.1 8% | 3.8 42% | 6.5 2% | 6.2 6% | 8.1 -23% |
| Gamma | 2.13 103% | 2.23 99% | 2.12 104% | 2.22 99% | 2.09 105% | 2.216 99% | 2.17 101% | 2.07 106% |
| CCT | 7861 83% | 7514 87% | 7633 85% | 8069 81% | 7202 90% | 6780 96% | 7022 93% | 8255 79% |
* ... Moindre est la valeur, meilleures sont les performances
Scintillement / MLI (Modulation de largeur d'impulsion)
| Scintillement / MLI (Modulation de largeur d'impulsion) non décelé | 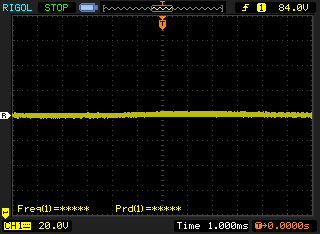 | ||
En comparaison, 52 % des appareils testés n'emploient pas MDI pour assombrir leur écran. Nous avons relevé une moyenne à 7801 (minimum : 5 - maximum : 343500) Hz dans le cas où une MDI était active. | |||
Temps de réponse de l'écran
| ↔ Temps de réponse noir à blanc | ||
|---|---|---|
| 28.8 ms ... hausse ↗ et chute ↘ combinées | ↗ 14 ms hausse | 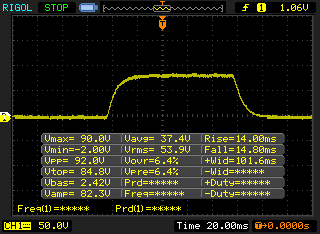 |
| ↘ 14.8 ms chute | ||
| L'écran souffre de latences relativement élevées, insuffisant pour le jeu. En comparaison, tous les appareils testés affichent entre 0.1 (minimum) et 240 (maximum) ms. » 76 % des appareils testés affichent de meilleures performances. Cela signifie que les latences relevées sont moins bonnes que la moyenne (19.9 ms) de tous les appareils testés. | ||
| ↔ Temps de réponse gris 50% à gris 80% | ||
| 44.8 ms ... hausse ↗ et chute ↘ combinées | ↗ 20.4 ms hausse | 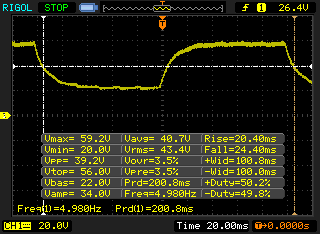 |
| ↘ 24.4 ms chute | ||
| L'écran souffre de latences très élevées, à éviter pour le jeu. En comparaison, tous les appareils testés affichent entre 0.165 (minimum) et 636 (maximum) ms. » 76 % des appareils testés affichent de meilleures performances. Cela signifie que les latences relevées sont moins bonnes que la moyenne (31.1 ms) de tous les appareils testés. | ||
| Jetstream 2 - 2.0 Total | |
| Moyenne de la classe Tablet (35.8 - 395, n=60, 2 dernières années) | |
| Amazon Fire HD 10 2019 (Silk Browser 75.3.60) | |
| Samsung Galaxy Tab A 8.0 2019 Wifi SM-T290 (Chrome 79) | |
| Moyenne Qualcomm Snapdragon 429 (14.6 - 16.1, n=2) | |
| Amazon Fire 7 2019 (Silk Browser 70.3.1) | |
| Lenovo Tab M8 HD | |
| JetStream 1.1 - 1.1 Total | |
| Amazon Fire HD 10 2019 (Silk Browser 75.3.60) | |
| Alldocube M8 T801 (Chrome 72.0.3626.105) | |
| Huawei MediaPad M5 lite (Chrome 67) | |
| Lenovo Tab M8 HD (Chrome 79) | |
| Moyenne Qualcomm Snapdragon 429 (25.1 - 25.1, n=2) | |
| Samsung Galaxy Tab A 8.0 2019 Wifi SM-T290 (Chrome 79) | |
| Trekstor SurfTab B10 (Chrome 72) | |
| Amazon Fire 7 2019 (Silk Browser 70.3.1) | |
| Lenovo Tab M7 (Chrome 79) | |
| WebXPRT 3 - Overall | |
| Moyenne de la classe Tablet (108 - 480, n=11, 2 dernières années) | |
| Amazon Fire HD 10 2019 (Silk Browser 75.3.60) | |
| Huawei MediaPad M5 lite (Chrome 67) | |
| Lenovo Tab M8 HD (Chrome 79) | |
| Moyenne Qualcomm Snapdragon 429 (32 - 36, n=2) | |
| Samsung Galaxy Tab A 8.0 2019 Wifi SM-T290 (Chrome 79) | |
| Amazon Fire 7 2019 | |
| Lenovo Tab M7 (Chrome 79) | |
| Speedometer 2.0 - Result 2.0 | |
| Moyenne de la classe Tablet (2.59 - 790, n=39, 2 dernières années) | |
| Amazon Fire HD 10 2019 (Silk Browser 75.3.60) | |
| Lenovo Tab M8 HD (Chrome 79) | |
| Moyenne Qualcomm Snapdragon 429 (13.5 - 15.6, n=2) | |
| Samsung Galaxy Tab A 8.0 2019 Wifi SM-T290 (Chrome 79) | |
| Amazon Fire 7 2019 (Silk Browser 70.3.1) | |
| Lenovo Tab M7 (Chrome 79) | |
| Octane V2 - Total Score | |
| Moyenne de la classe Tablet (763 - 138481, n=75, 2 dernières années) | |
| Amazon Fire HD 10 2019 (Silk Browser 75.3.60) | |
| Alldocube M8 T801 (Chrome 72.0.3626.105) | |
| Huawei MediaPad M5 lite (Chrome 67) | |
| Lenovo Tab M8 HD (Chrome 79) | |
| Moyenne Qualcomm Snapdragon 429 (4297 - 4392, n=2) | |
| Samsung Galaxy Tab A 8.0 2019 Wifi SM-T290 (Chrome 79) | |
| Trekstor SurfTab B10 (Chrome 72) | |
| Amazon Fire 7 2019 (Silk Browser 70.3.1) | |
| Lenovo Tab M7 (Chrome 79) | |
| Mozilla Kraken 1.1 - Total | |
| Lenovo Tab M7 (Chrome 79) | |
| Trekstor SurfTab B10 (Chrome 72) | |
| Amazon Fire 7 2019 (Silk Browser 70.3.1) | |
| Lenovo Tab M8 HD (Chrome 79) | |
| Samsung Galaxy Tab A 8.0 2019 Wifi SM-T290 (Chrome 79) | |
| Moyenne Qualcomm Snapdragon 429 (10433 - 10655, n=2) | |
| Huawei MediaPad M5 lite (Chrome 67) | |
| Alldocube M8 T801 (Chrome 72.0.3626.105) | |
| Amazon Fire HD 10 2019 (Silk Browser 75.3.60) | |
| Moyenne de la classe Tablet (243 - 27101, n=68, 2 dernières années) | |
* ... Moindre est la valeur, meilleures sont les performances
| Samsung Galaxy Tab A 8.0 2019 Wifi SM-T290 | Lenovo Tab M8 HD | Alldocube M8 T801 | Amazon Fire 7 2019 | Amazon Fire HD 10 2019 | Huawei MediaPad M5 lite | Trekstor SurfTab B10 | Lenovo Tab M7 | Moyenne 32 GB eMMC Flash | Moyenne de la classe Tablet | |
|---|---|---|---|---|---|---|---|---|---|---|
| AndroBench 3-5 | -2% | -41% | -47% | 15% | 61% | -39% | -46% | -10% | 1012% | |
| Sequential Read 256KB (MB/s) | 291.9 | 297.1 2% | 142.8 -51% | 164.9 -44% | 266.2 -9% | 308.1 6% | 109 -63% | 155.7 -47% | 242 ? -17% | 1987 ? 581% |
| Sequential Write 256KB (MB/s) | 108.5 | 79.6 -27% | 103 -5% | 77.3 -29% | 180.1 66% | 82.6 -24% | 70.5 -35% | 53.1 -51% | 100.5 ? -7% | 1580 ? 1356% |
| Random Read 4KB (MB/s) | 57.8 | 77.4 34% | 19.5 -66% | 24.98 -57% | 75 30% | 73.5 27% | 16.96 -71% | 31.39 -46% | 43.1 ? -25% | 268 ? 364% |
| Random Write 4KB (MB/s) | 16.89 | 15.84 -6% | 10.01 -41% | 5.83 -65% | 23.28 38% | 77.3 358% | 8.43 -50% | 11.96 -29% | 22.3 ? 32% | 312 ? 1747% |
| Sequential Read 256KB SDCard (MB/s) | 87.1 ? | 83.8 ? -4% | 59.2 ? -32% | 77.2 ? -11% | 83.7 ? -4% | 83.2 ? -4% | 38.97 ? -55% | 71.8 ? -18% | ||
| Sequential Write 256KB SDCard (MB/s) | 69.9 ? | 64.3 ? -8% | 32.05 ? -54% | 52 ? -26% | 72.8 ? 4% | 62.5 ? -11% | 35.21 ? -50% | 52.9 ? -24% |
PUBG Mobile
Asphalt 9: Legends
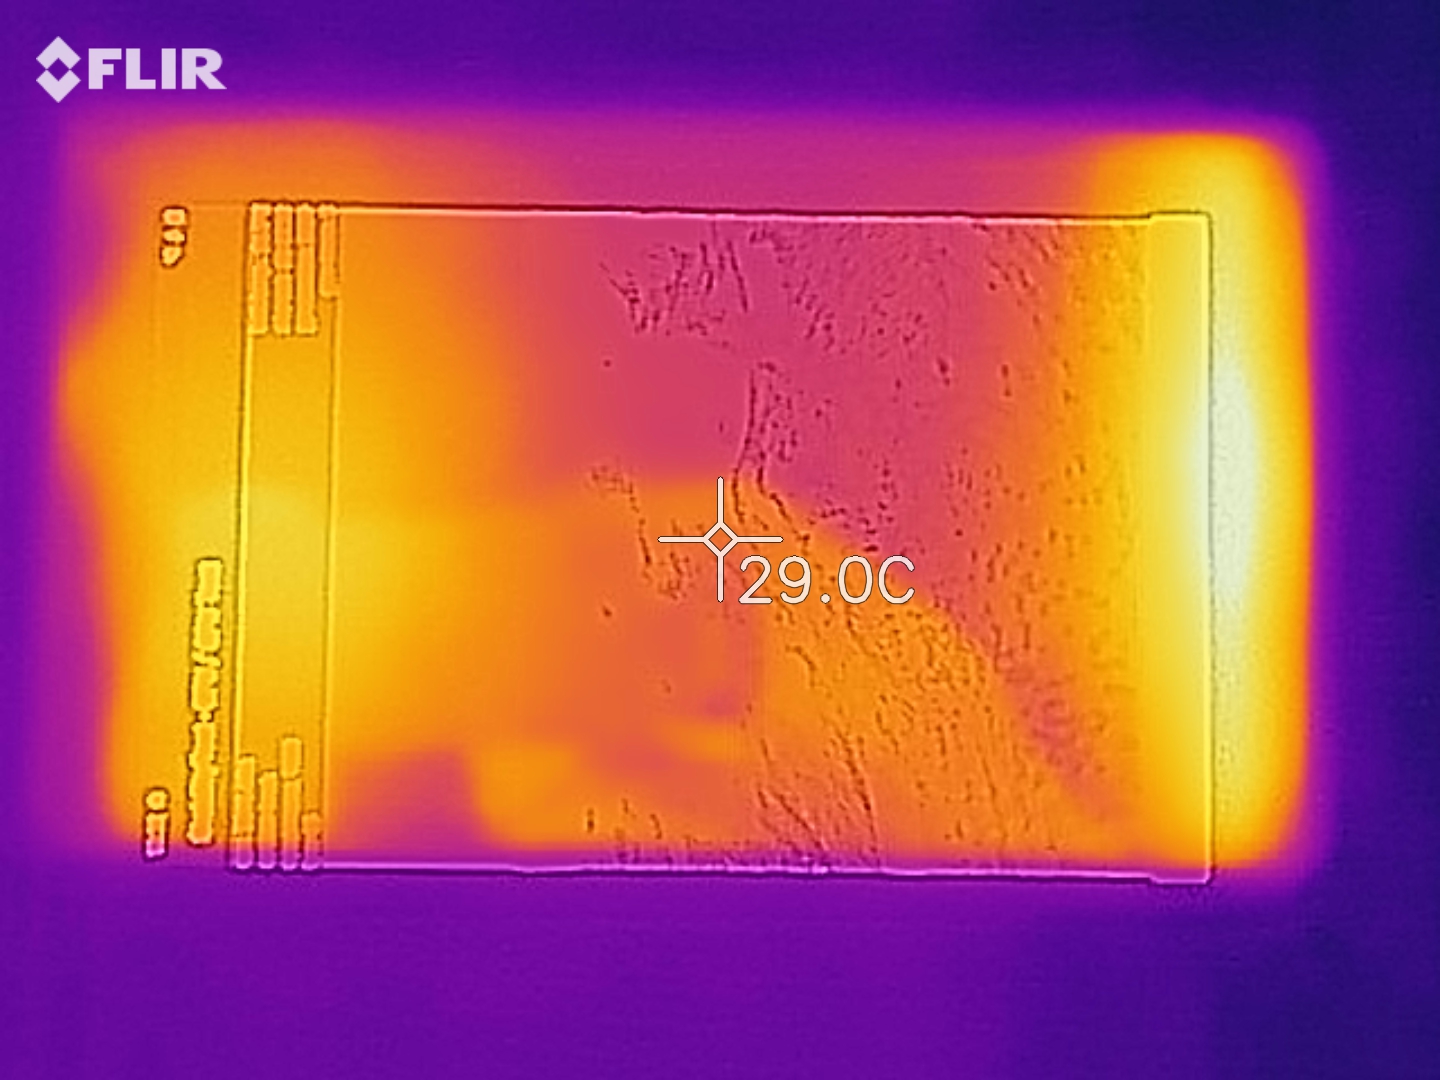
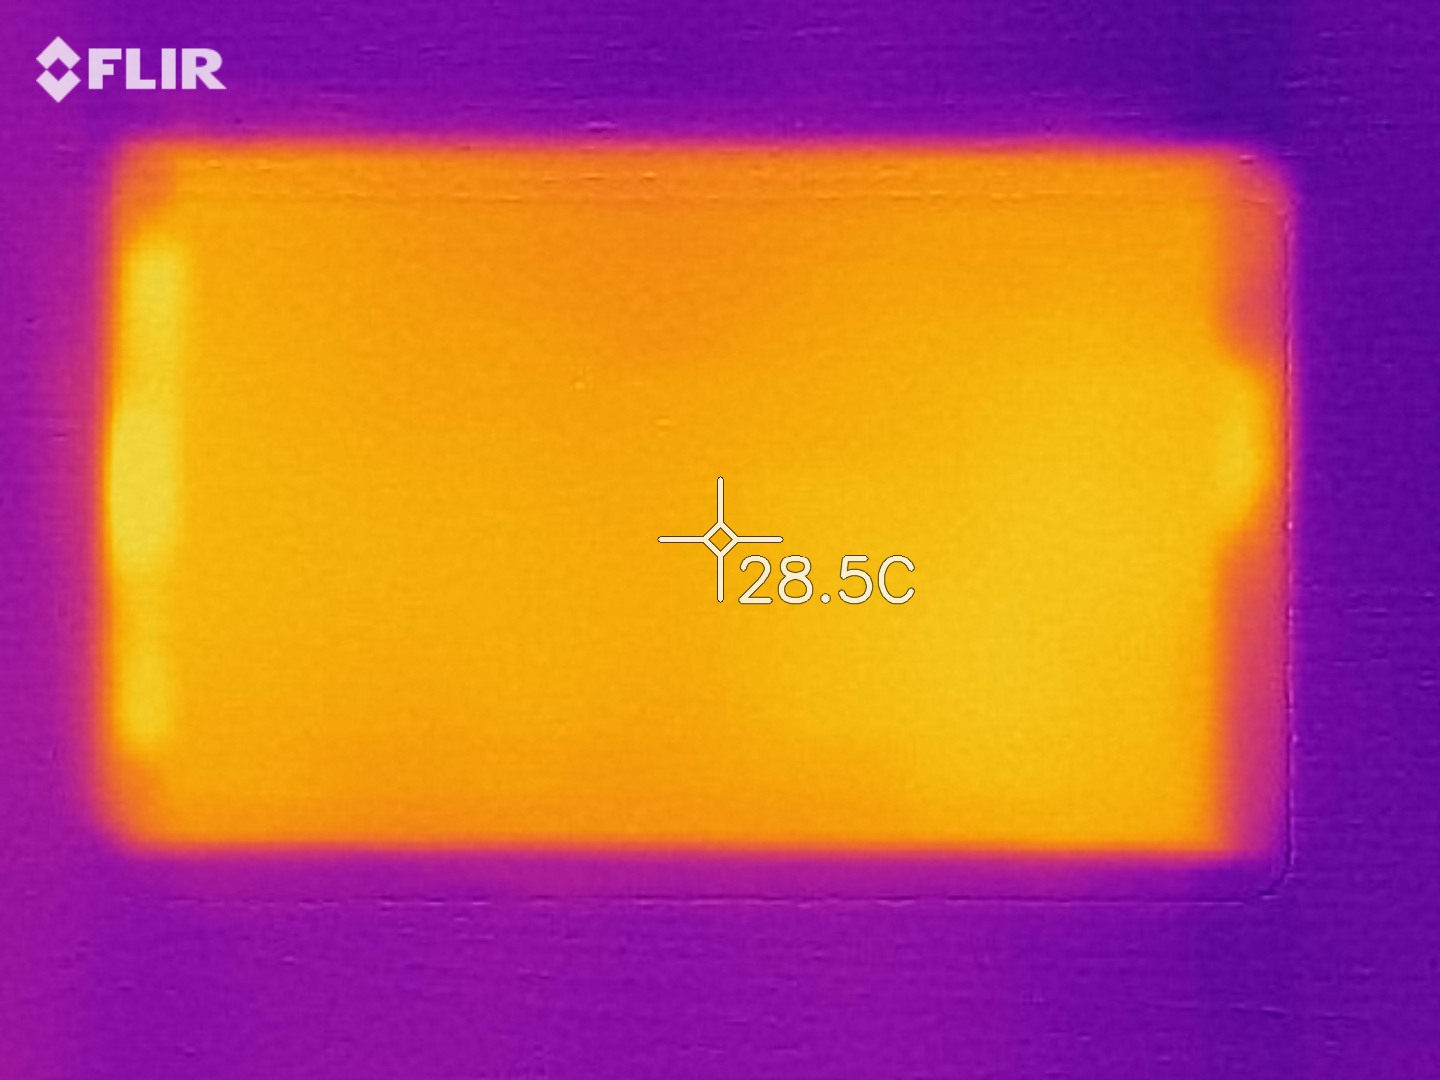
(+) La température maximale du côté supérieur est de 33.3 °C / 92 F, par rapport à la moyenne de 33.6 °C / 92 F, allant de 20.7 à 53.2 °C pour la classe Tablet.
(+) Le fond chauffe jusqu'à un maximum de 26.9 °C / 80 F, contre une moyenne de 33.2 °C / 92 F
(+) En utilisation inactive, la température moyenne du côté supérieur est de 27.3 °C / 81 F, par rapport à la moyenne du dispositif de 30 °C / 86 F.
Samsung Galaxy Tab A 8.0 2019 Wifi SM-T290 analyse audio
(+) | les haut-parleurs peuvent jouer relativement fort (90.4# dB)
Basses 100 - 315 Hz
(-) | presque aucune basse - en moyenne 23.4% plus bas que la médiane
(±) | la linéarité des basses est moyenne (10.1% delta à la fréquence précédente)
Médiums 400 - 2000 Hz
(+) | médiane équilibrée - seulement 2.8% de la médiane
(+) | les médiums sont linéaires (3.8% delta à la fréquence précédente)
Aiguës 2 - 16 kHz
(±) | sommets plus élevés - en moyenne 7.9% plus élevés que la médiane
(+) | les aigus sont linéaires (4% delta à la fréquence précédente)
Globalement 100 - 16 000 Hz
(±) | la linéarité du son global est moyenne (18.8% de différence avec la médiane)
Par rapport à la même classe
» 50% de tous les appareils testés de cette catégorie étaient meilleurs, 6% similaires, 44% pires
» Le meilleur avait un delta de 7%, la moyenne était de 20%, le pire était de 129%.
Par rapport à tous les appareils testés
» 43% de tous les appareils testés étaient meilleurs, 8% similaires, 49% pires
» Le meilleur avait un delta de 4%, la moyenne était de 24%, le pire était de 134%.
Lenovo Tab M8 HD analyse audio
(+) | les haut-parleurs peuvent jouer relativement fort (86# dB)
Basses 100 - 315 Hz
(-) | presque aucune basse - en moyenne 24.5% plus bas que la médiane
(±) | la linéarité des basses est moyenne (8.7% delta à la fréquence précédente)
Médiums 400 - 2000 Hz
(±) | médiane supérieure - en moyenne 6.9% supérieure à la médiane
(+) | les médiums sont linéaires (6.1% delta à la fréquence précédente)
Aiguës 2 - 16 kHz
(±) | sommets plus élevés - en moyenne 12.3% plus élevés que la médiane
(+) | les aigus sont linéaires (3.3% delta à la fréquence précédente)
Globalement 100 - 16 000 Hz
(±) | la linéarité du son global est moyenne (27.7% de différence avec la médiane)
Par rapport à la même classe
» 87% de tous les appareils testés de cette catégorie étaient meilleurs, 3% similaires, 11% pires
» Le meilleur avait un delta de 7%, la moyenne était de 20%, le pire était de 129%.
Par rapport à tous les appareils testés
» 84% de tous les appareils testés étaient meilleurs, 3% similaires, 13% pires
» Le meilleur avait un delta de 4%, la moyenne était de 24%, le pire était de 134%.
| Éteint/en veille | |
| Au repos | |
| Fortement sollicité |
|
Légende:
min: | |
| Samsung Galaxy Tab A 8.0 2019 Wifi SM-T290 5100 mAh | Lenovo Tab M8 HD 5100 mAh | Alldocube M8 T801 5500 mAh | Amazon Fire 7 2019 2980 mAh | Amazon Fire HD 10 2019 6300 mAh | Huawei MediaPad M5 lite 7500 mAh | Trekstor SurfTab B10 6000 mAh | Lenovo Tab M7 3500 mAh | |
|---|---|---|---|---|---|---|---|---|
| Power Consumption | 15% | -178% | -30% | -60% | -109% | -136% | 1% | |
| Idle Minimum * (Watt) | 0.62 | 0.66 -6% | 3.4 -448% | 1.1 -77% | 1.14 -84% | 2.8 -352% | 2.2 -255% | 0.85 -37% |
| Idle Average * (Watt) | 2.68 | 2.15 20% | 5.1 -90% | 2.77 -3% | 3.71 -38% | 3.3 -23% | 3.94 -47% | 2.4 10% |
| Idle Maximum * (Watt) | 2.7 | 2.18 19% | 5.3 -96% | 2.79 -3% | 3.74 -39% | 3.9 -44% | 4 -48% | 2.42 10% |
| Load Average * (Watt) | 3.61 | 2.48 31% | 6 -66% | 4.5 -25% | 5.26 -46% | 5.2 -44% | 9.35 -159% | 3.17 12% |
| Load Maximum * (Watt) | 4 | 3.49 13% | 11.5 -188% | 5.61 -40% | 7.68 -92% | 7.2 -80% | 10.92 -173% | 3.69 8% |
* ... Moindre est la valeur, meilleures sont les performances
| Samsung Galaxy Tab A 8.0 2019 Wifi SM-T290 5100 mAh | Lenovo Tab M8 HD 5100 mAh | Alldocube M8 T801 5500 mAh | Amazon Fire 7 2019 2980 mAh | Amazon Fire HD 10 2019 6300 mAh | Huawei MediaPad M5 lite 7500 mAh | Trekstor SurfTab B10 6000 mAh | Lenovo Tab M7 3500 mAh | |
|---|---|---|---|---|---|---|---|---|
| Autonomie de la batterie | 35% | -50% | -52% | -2% | -10% | -38% | -52% | |
| Reader / Idle (h) | 52.2 | 59.7 14% | 16.8 -68% | 28.2 -46% | 36 -31% | |||
| H.264 (h) | 15.6 | 28.3 81% | 8.9 -43% | 24.7 58% | 15.6 0% | |||
| WiFi v1.3 (h) | 13.9 | 18.7 35% | 7 -50% | 7.7 -45% | 15.8 14% | 14.2 2% | 8.6 -38% | 6.7 -52% |
| Load (h) | 5.7 | 6.2 9% | 2.8 -51% | 3.8 -33% | 5 -12% |
Points positifs
Points négatifs
Verdict
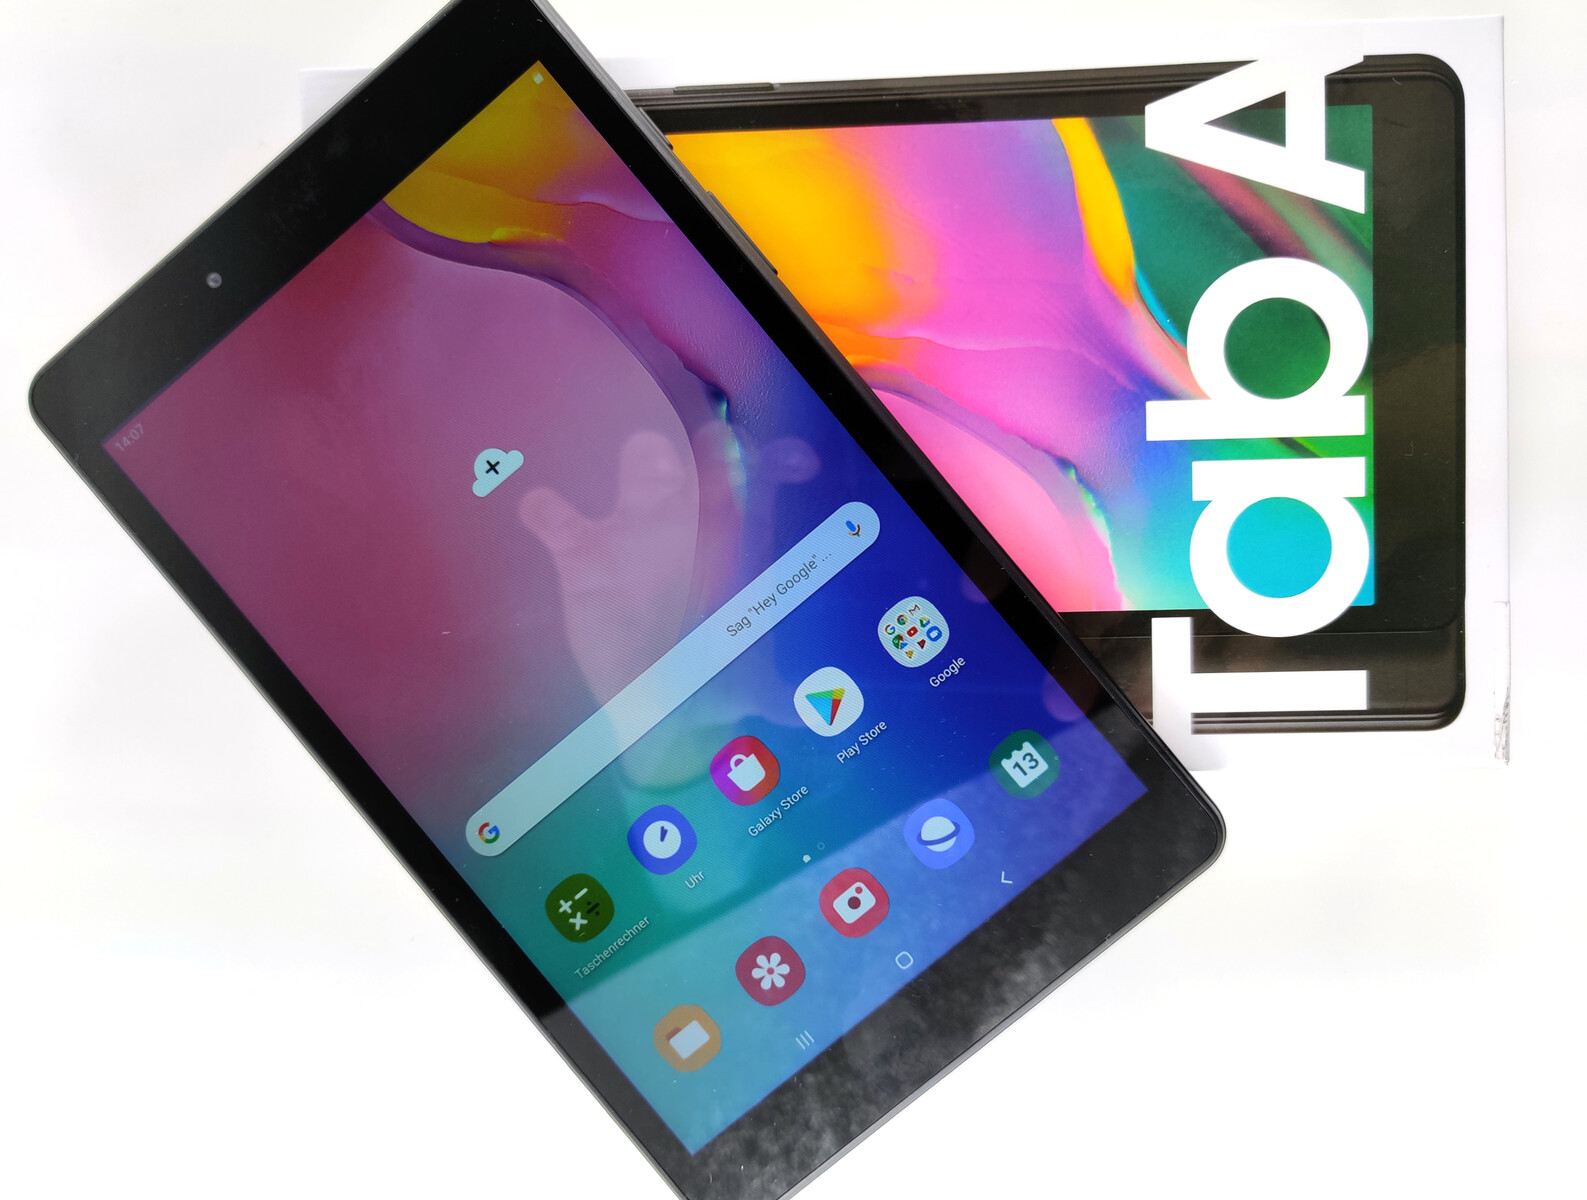
La Samsung Galaxy Tab A 8.0 (2019) est une solide tablette qui offre un bel ensemble pour son prix d’environ 150 €. Elle possède une autonomie correcte, des haut-parleurs impressionnants, et un écran TFT convaincant.
La Galaxy Tab A 8.0 (2019) abordable ne sera pas le bon choix pour les utilisateurs exigeants.
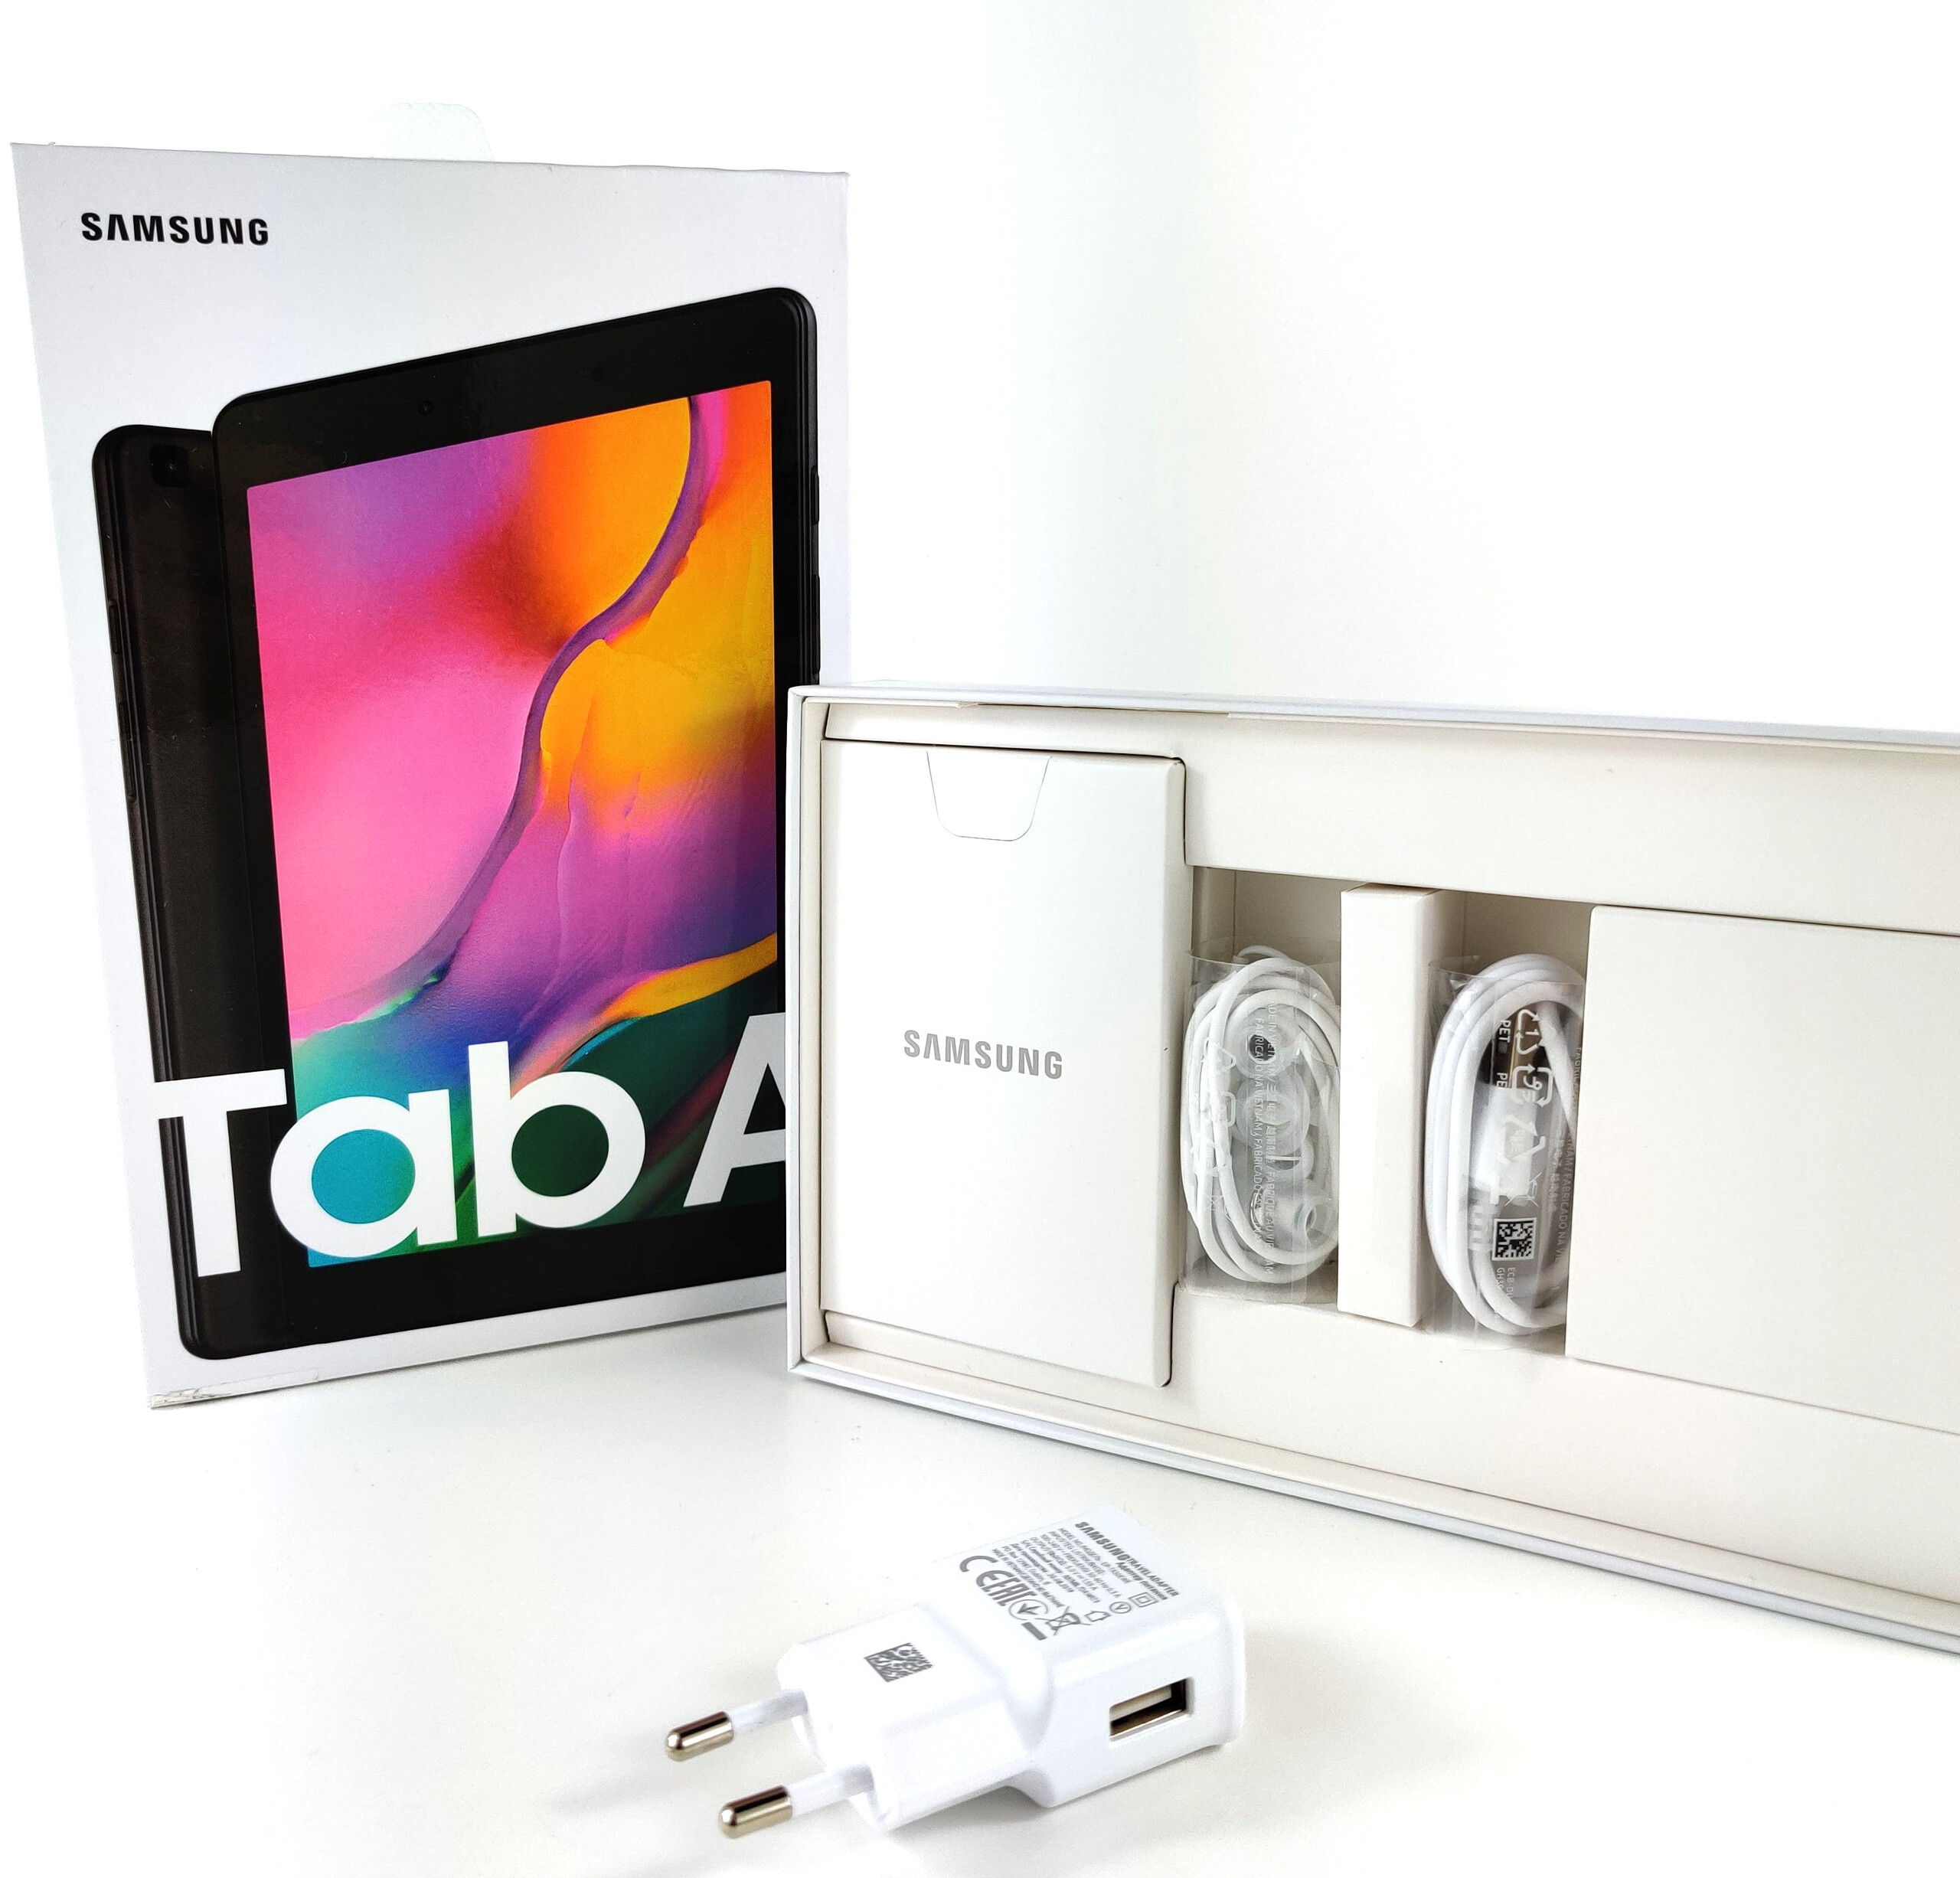
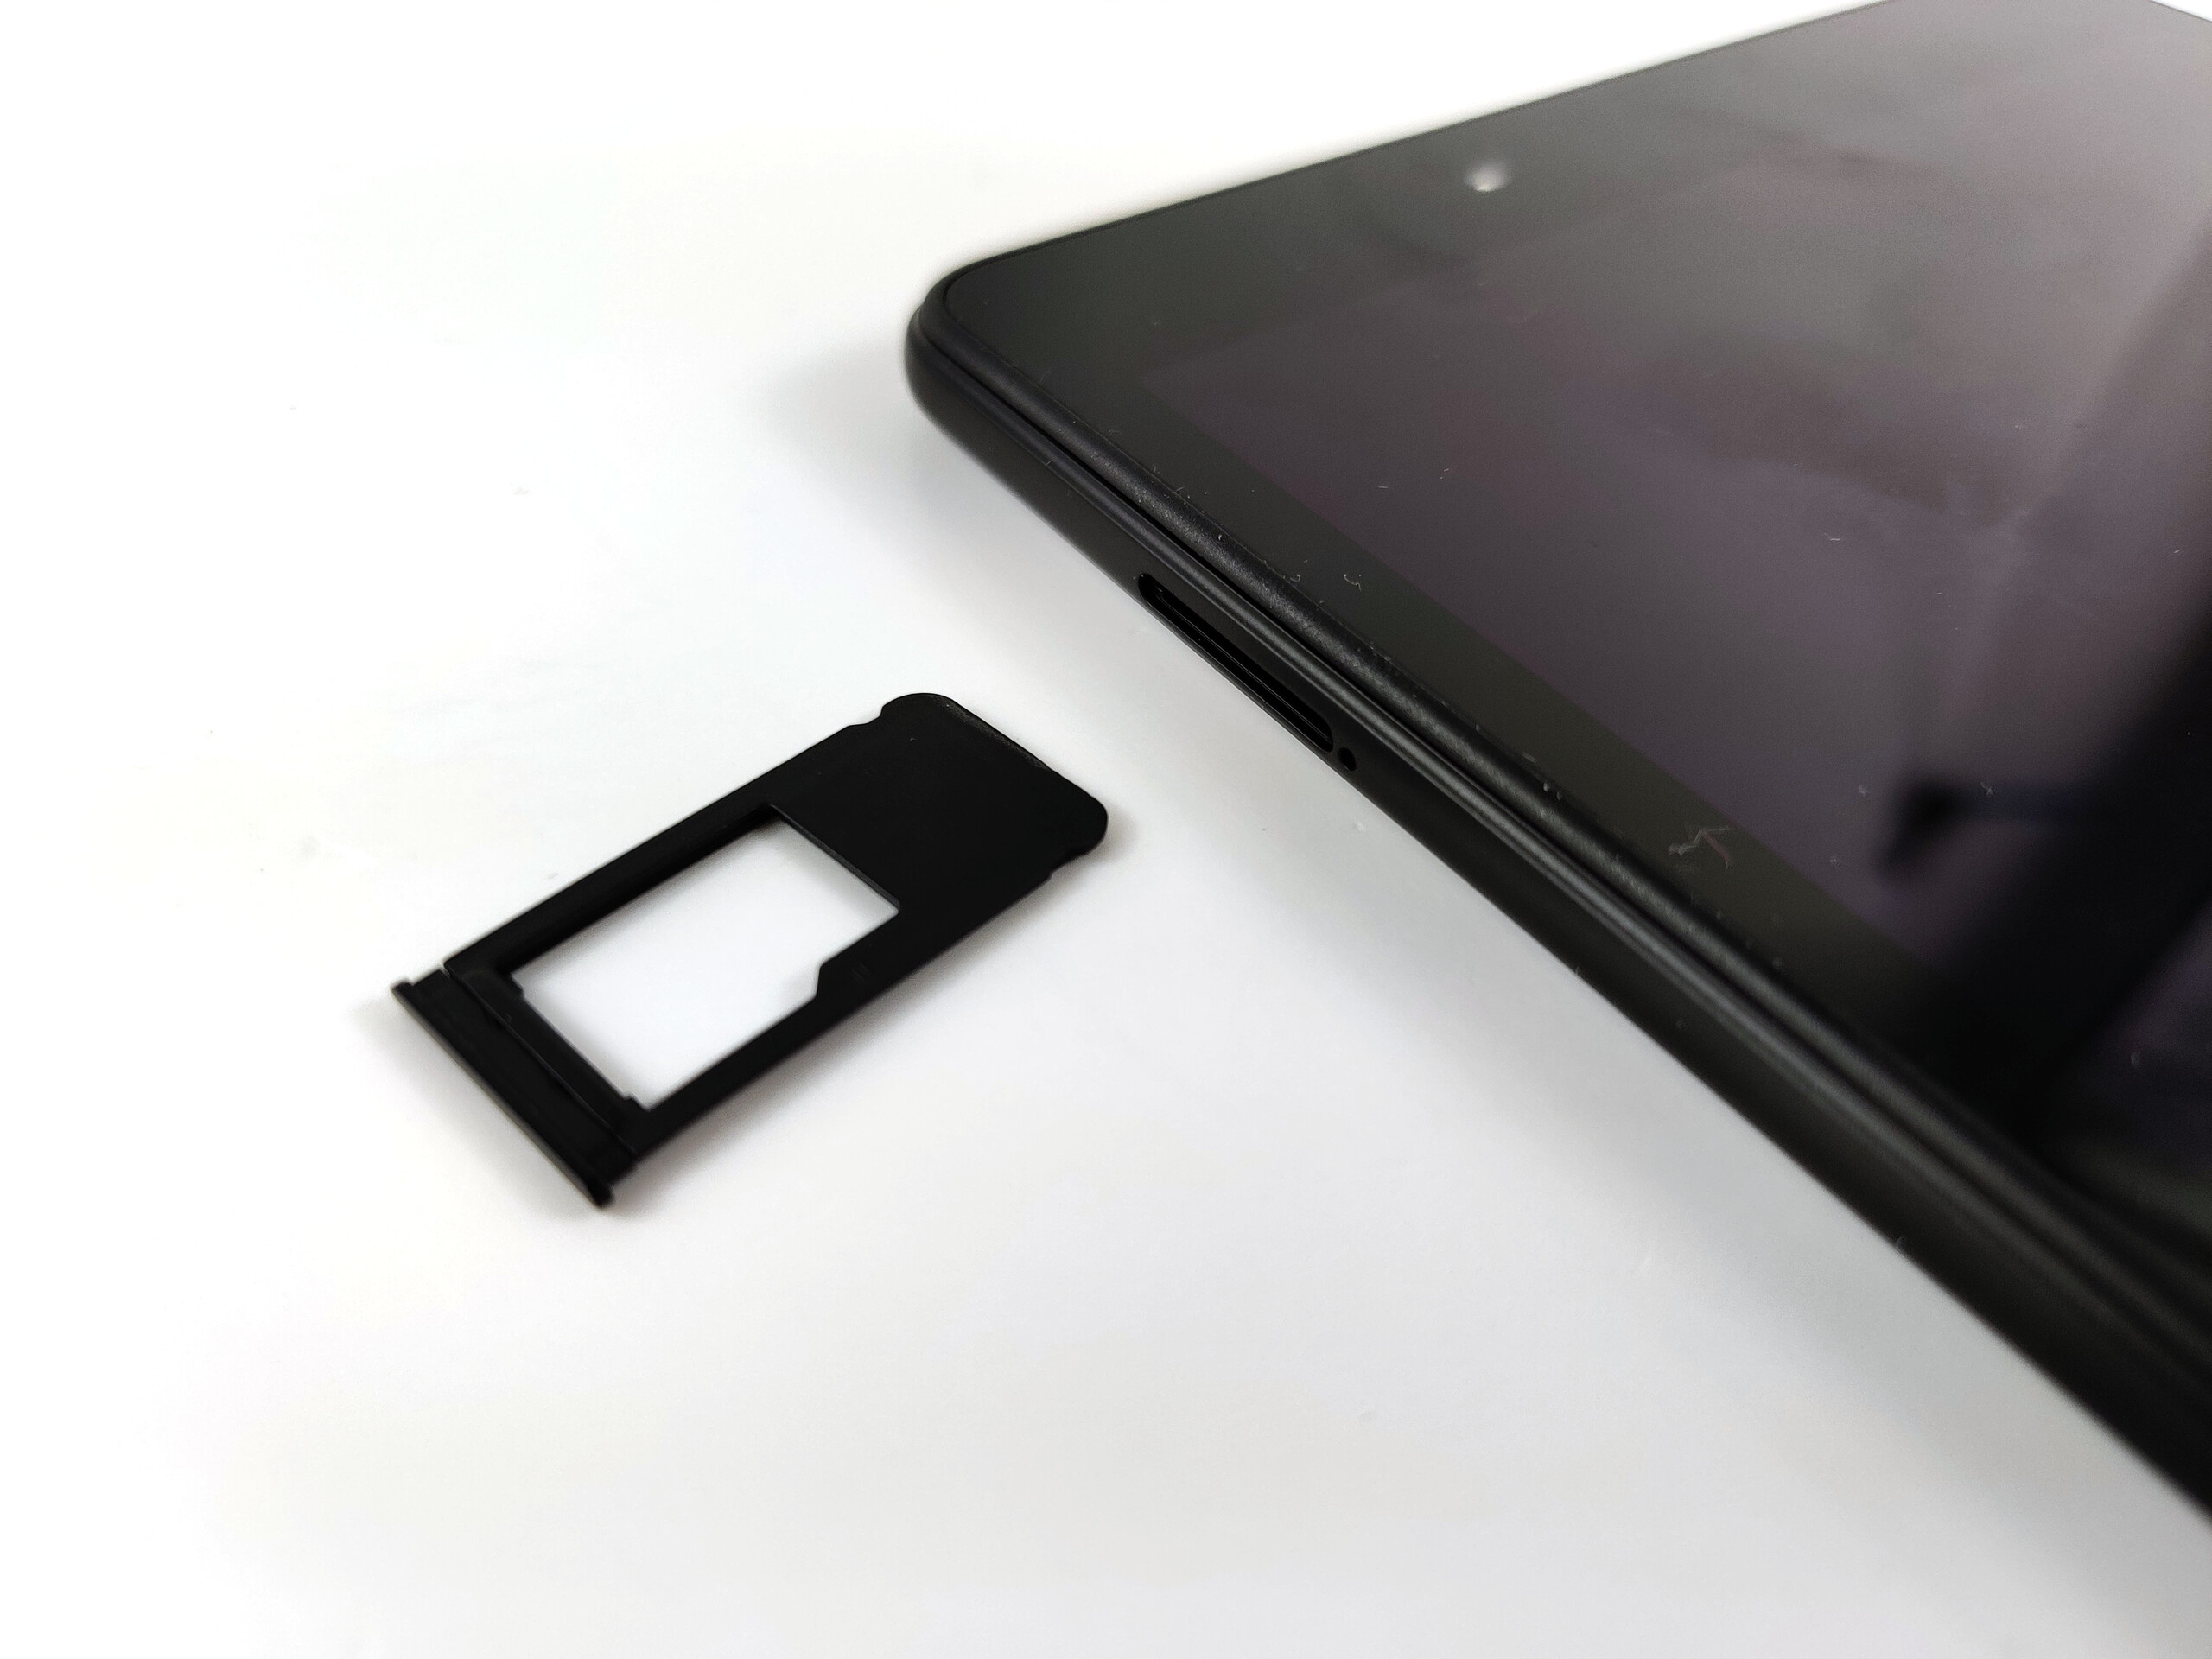
En effet, nos tests révèlent des défauts. Par exemple, les patchs de sécurité de notre modèle ne sont pas à jour, et le Wifi est lent. La RAM et le stockage sont un peu juste - même si on peut ajouter une carte micro SD. Samsung a intégré un port micro USB dépassé sur sa tablette de 8 pouces.
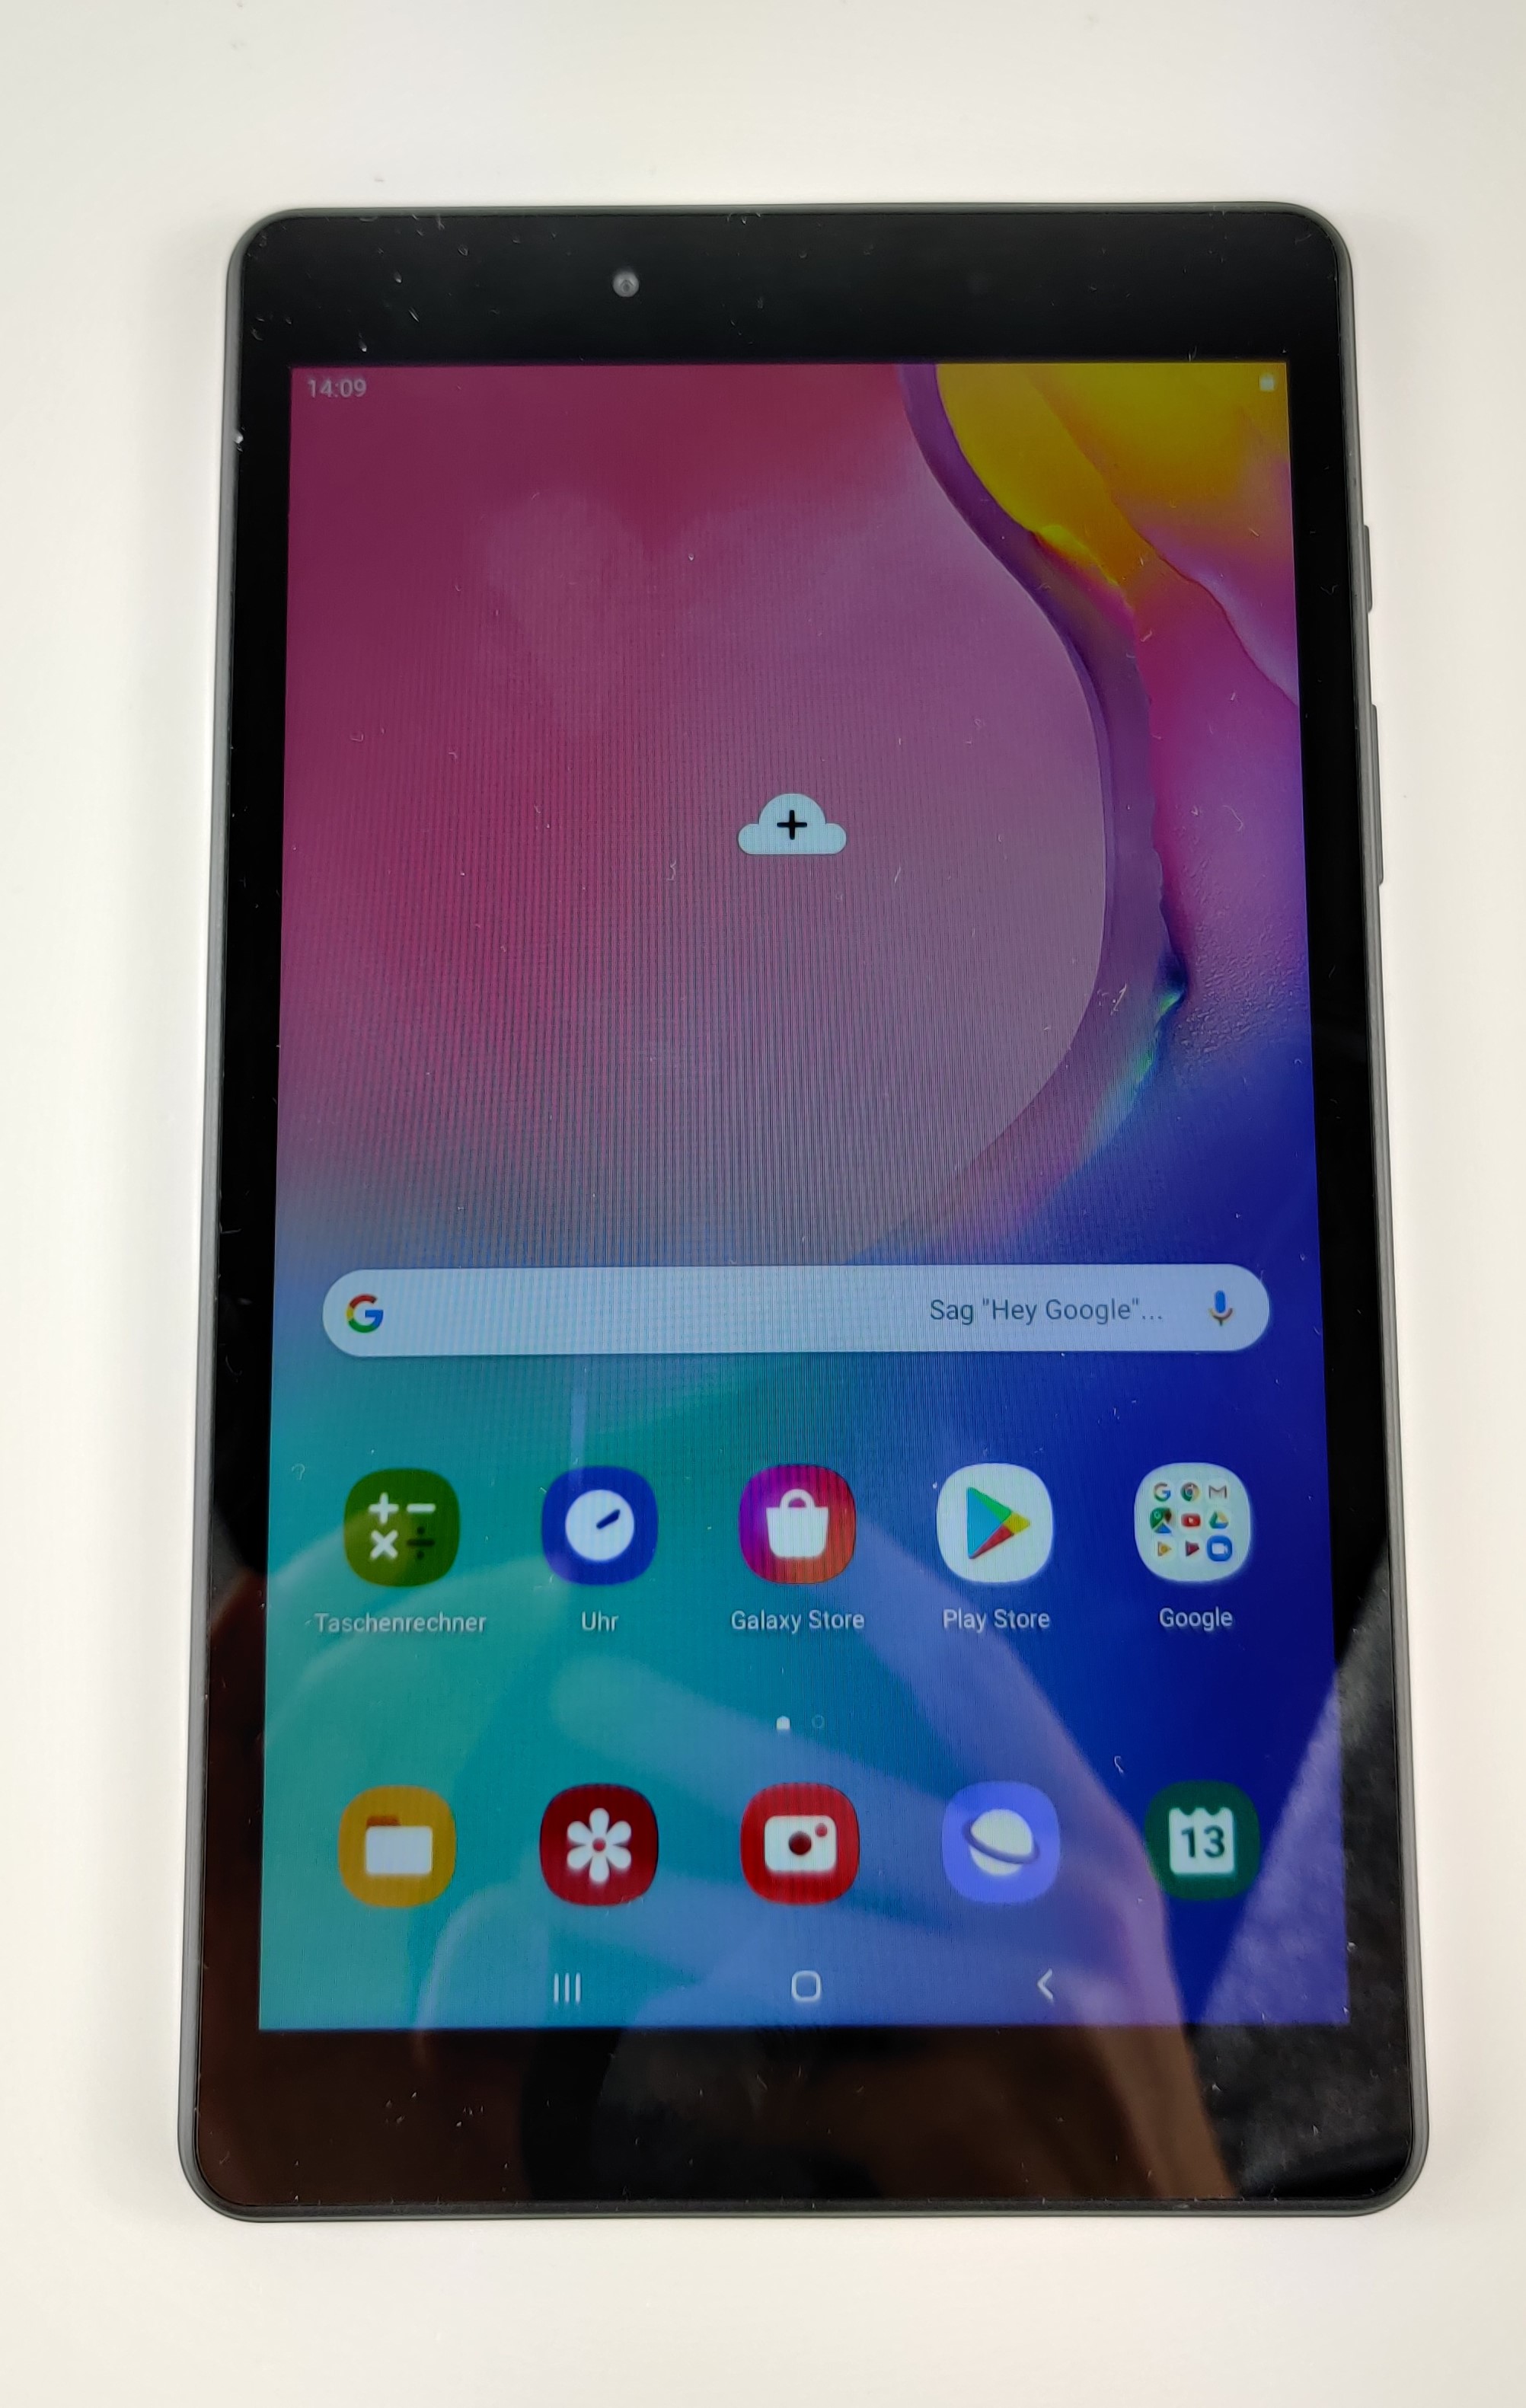
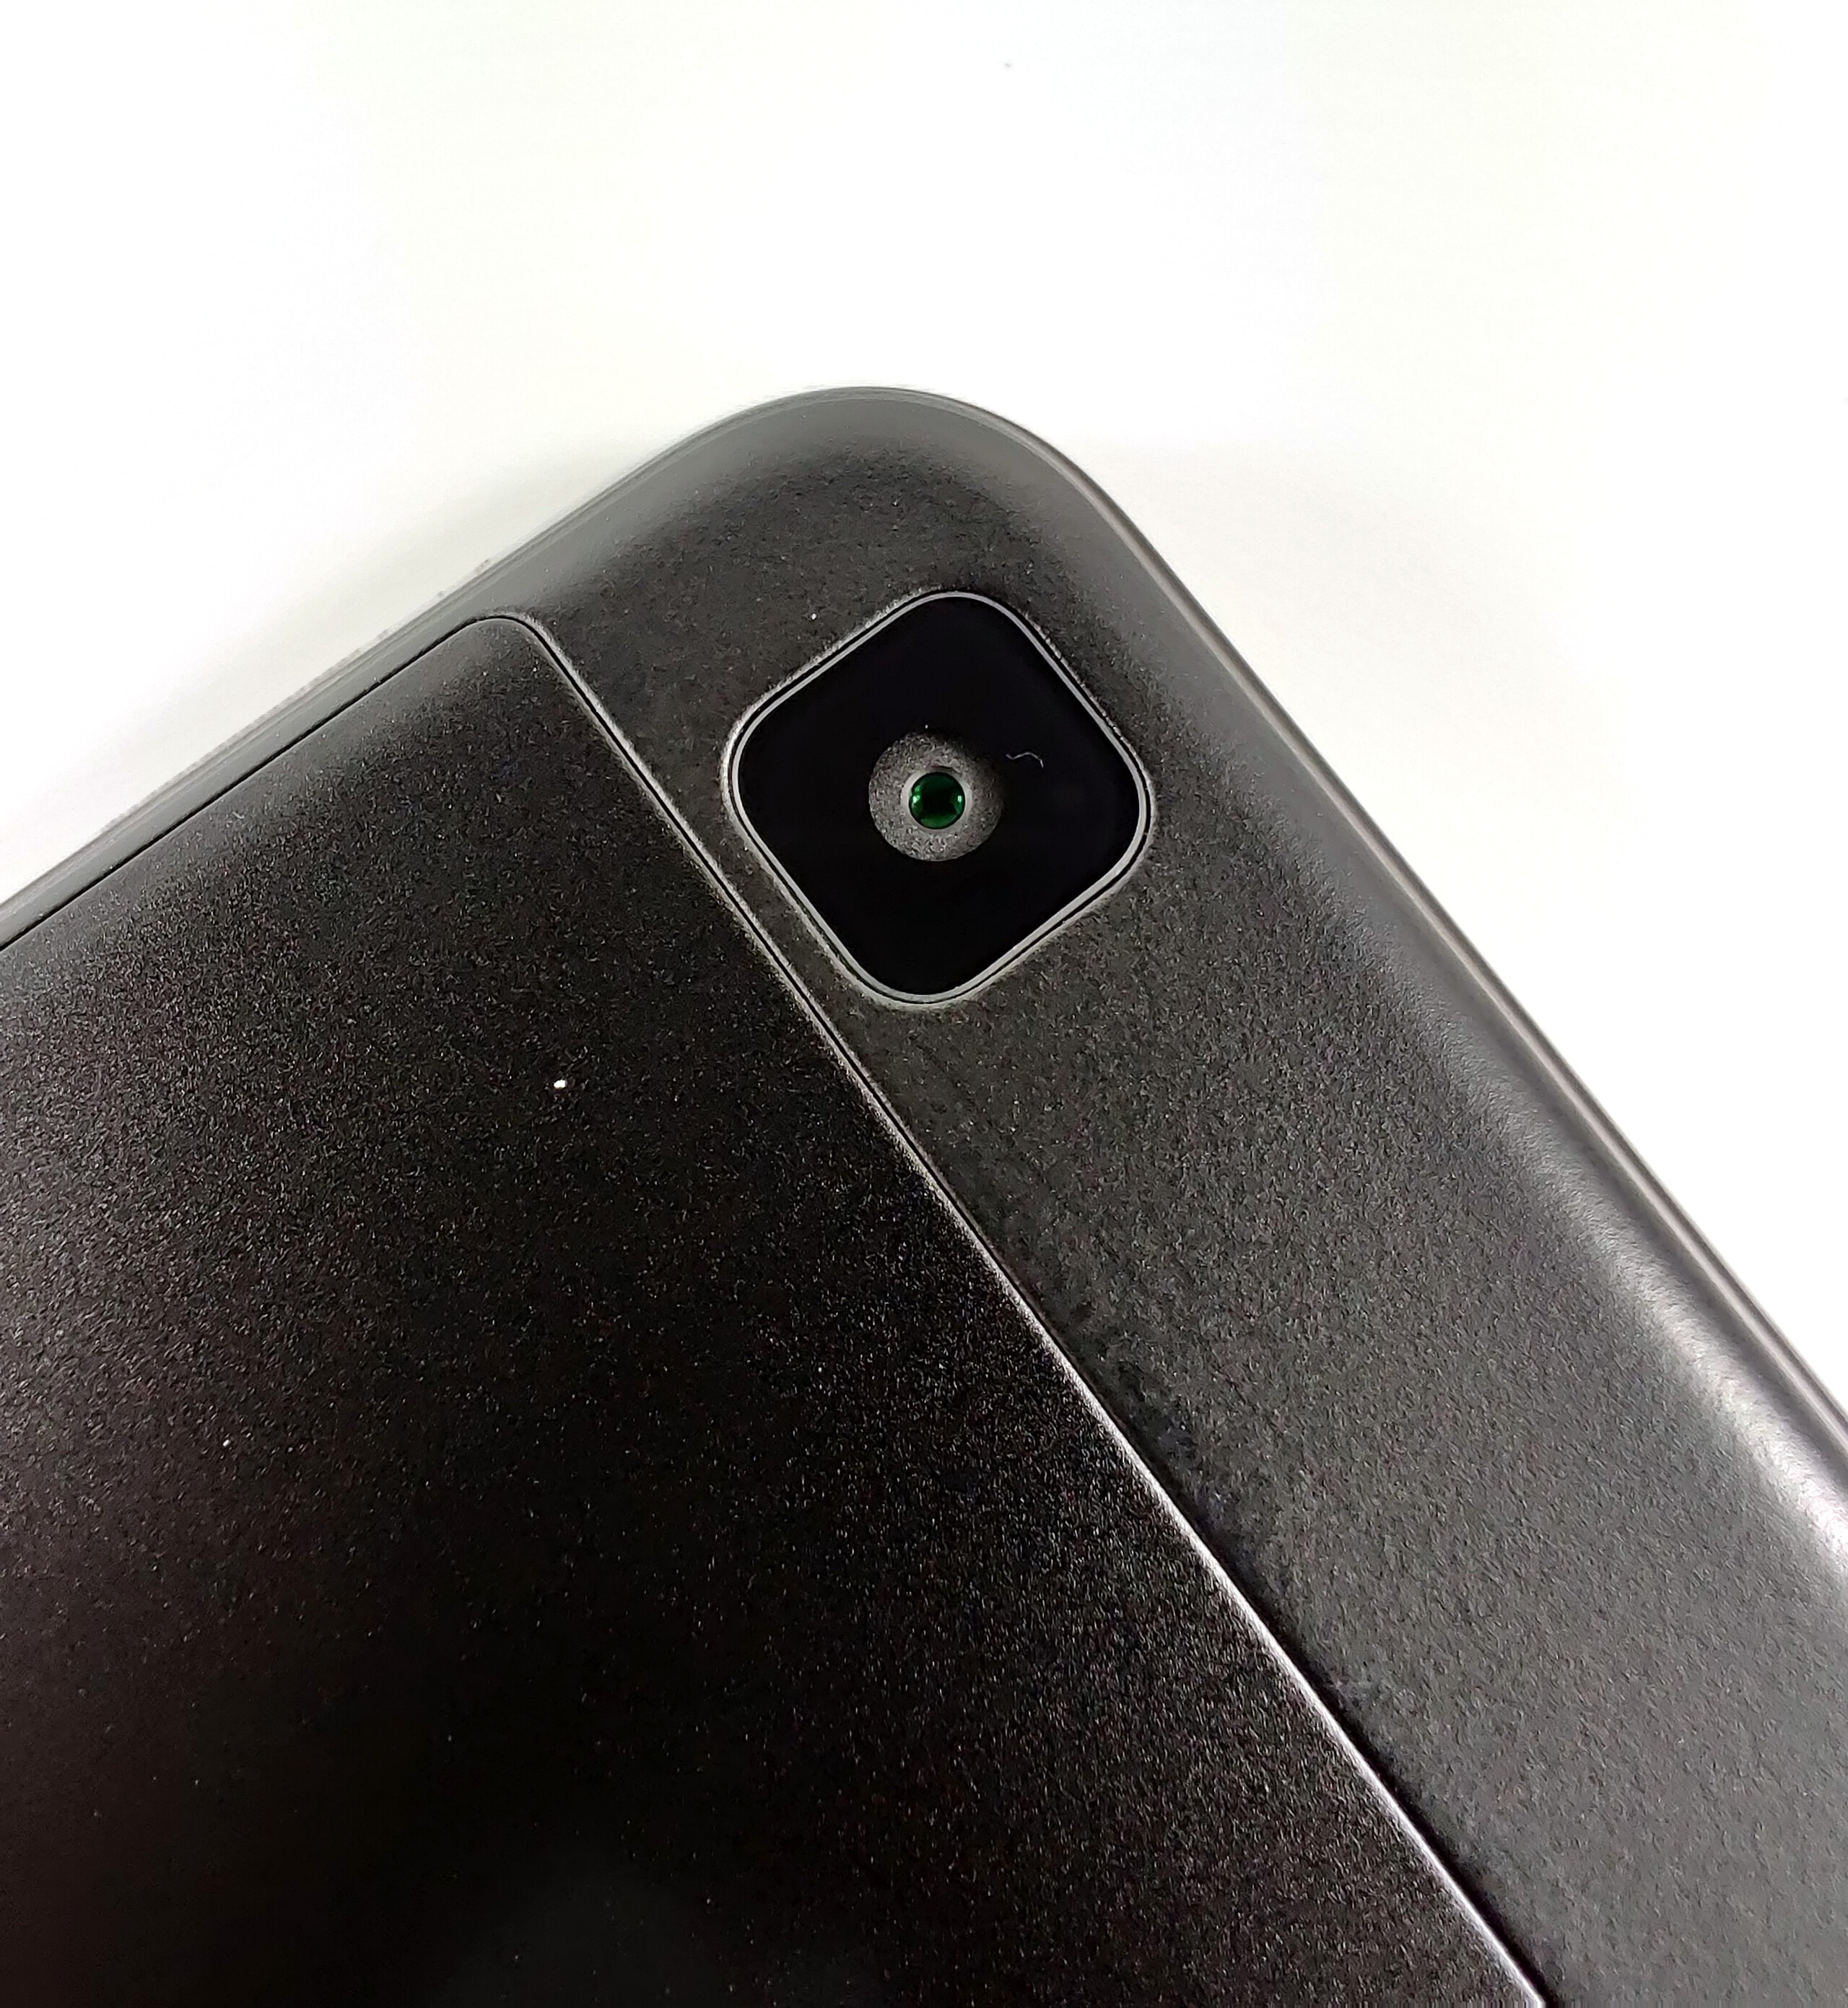
Enfin, les performances sont un vrai défaut au quotidien. Le SoC Snapdragon 429 combiné à 2 Go de RAM n’est pas à la hauteur de la plupart des tâches, ce qui n’est pas vraiment étonnant vu les nécessités de One UI. L’omission d’une authentification biométrique sur un appareil lancé en 2019 est également incompréhensible. Samsung ne propose même pas de reconnaissance faciale 2D toute simple couplée au capteur photo avant de la Galaxy Tab 1 8.0 (2019). Nous ne comprenons pas non plus pourquoi l’appareil ne possède pas de certification Widevine Level 3.
L’intégralité de cette critique est disponible en anglais en suivant ce lien.
Samsung Galaxy Tab A 8.0 2019 Wifi SM-T290
- 12/30/2019 v7 (old)
Marcus Herbrich
Price comparison
