Courte critique de la tablette Alldocube M8 T801
| |||||||||||||||||||||||||
Homogénéité de la luminosité: 94 %
Valeur mesurée au centre, sur batterie: 317.5 cd/m²
Contraste: 635:1 (Valeurs des noirs: 0.5 cd/m²)
ΔE ColorChecker Calman: 6.12 | ∀{0.5-29.43 Ø4.73}
ΔE Greyscale Calman: 5.8 | ∀{0.09-98 Ø4.97}
Gamma: 2.12
CCT: 7633 K
| Alldocube M8 T801 IPS, 8", 1920x1200 | Amazon Fire HD 8 2018 IPS, 8", 1280x800 | Asus ZenPad 3 8.0 Z581KL-1A001A IPS, 7.9", 2048x1536 | Huawei MediaPad M5 8.4 IPS, 8.4", 2560x1600 | Xiaomi Mi Pad 4 IPS LCD, 8", 1920x1200 | Chuwi HiPad IPS, 10.1", 1920x1200 | |
|---|---|---|---|---|---|---|
| Response Times | -41% | -4% | 44% | 7% | -24% | |
| Response Time Grey 50% / Grey 80% * (ms) | 32 ? | 48 ? -50% | 31 ? 3% | 13 ? 59% | 42 ? -31% | 33.2 ? -4% |
| Response Time Black / White * (ms) | 28.8 ? | 38 ? -32% | 32 ? -11% | 20.5 ? 29% | 16 ? 44% | 41.2 ? -43% |
| PWM Frequency (Hz) | 2451 ? | 2358 ? | ||||
| Screen | -19% | 24% | 3% | 11% | 21% | |
| Brightness middle (cd/m²) | 317.5 | 359 13% | 386 22% | 405 28% | 454 43% | 408.7 29% |
| Brightness (cd/m²) | 320 | 358 12% | 364 14% | 392 23% | 411 28% | 396 24% |
| Brightness Distribution (%) | 94 | 89 -5% | 88 -6% | 92 -2% | 83 -12% | 85 -10% |
| Black Level * (cd/m²) | 0.5 | 0.85 -70% | 0.57 -14% | 0.67 -34% | 0.73 -46% | 0.51 -2% |
| Contrast (:1) | 635 | 422 -34% | 677 7% | 604 -5% | 622 -2% | 801 26% |
| Colorchecker dE 2000 * | 6.12 | 6.8 -11% | 3.3 46% | 5.78 6% | 5.2 15% | 4.13 33% |
| Colorchecker dE 2000 max. * | 13.72 | 17.3 -26% | 7.1 48% | 9.82 28% | 8.36 39% | 7.34 47% |
| Greyscale dE 2000 * | 5.8 | 7.6 -31% | 1.7 71% | 7.2 -24% | 4.7 19% | 4.4 24% |
| Gamma | 2.12 104% | 2.19 100% | 2.42 91% | 2.278 97% | 2.271 97% | 2.24 98% |
| CCT | 7633 85% | 7160 91% | 6397 102% | 8405 77% | 7361 88% | 7389 88% |
| Moyenne finale (programmes/paramètres) | -30% /
-23% | 10% /
18% | 24% /
11% | 9% /
10% | -2% /
12% |
* ... Moindre est la valeur, meilleures sont les performances
Temps de réponse de l'écran
| ↔ Temps de réponse noir à blanc | ||
|---|---|---|
| 28.8 ms ... hausse ↗ et chute ↘ combinées | ↗ 14.8 ms hausse | 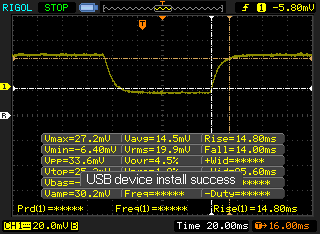 |
| ↘ 14 ms chute | ||
| L'écran souffre de latences relativement élevées, insuffisant pour le jeu. En comparaison, tous les appareils testés affichent entre 0.1 (minimum) et 240 (maximum) ms. » 76 % des appareils testés affichent de meilleures performances. Cela signifie que les latences relevées sont moins bonnes que la moyenne (19.9 ms) de tous les appareils testés. | ||
| ↔ Temps de réponse gris 50% à gris 80% | ||
| 32 ms ... hausse ↗ et chute ↘ combinées | ↗ 13.2 ms hausse | 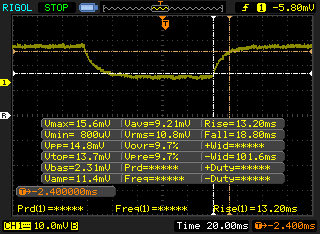 |
| ↘ 18.8 ms chute | ||
| L'écran souffre de latences très élevées, à éviter pour le jeu. En comparaison, tous les appareils testés affichent entre 0.165 (minimum) et 636 (maximum) ms. » 43 % des appareils testés affichent de meilleures performances. Cela signifie que les latences relevées sont similaires à la moyenne (31.1 ms) de tous les appareils testés. | ||
Scintillement / MLI (Modulation de largeur d'impulsion)
| Scintillement / MLI (Modulation de largeur d'impulsion) non décelé | 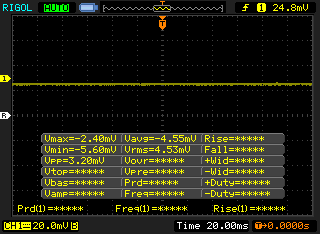 | ||
En comparaison, 52 % des appareils testés n'emploient pas MDI pour assombrir leur écran. Nous avons relevé une moyenne à 7801 (minimum : 5 - maximum : 343500) Hz dans le cas où une MDI était active. | |||
| Basemark GPU 1.1 | |
| 1920x1080 Vulkan Medium Offscreen | |
| Samsung Galaxy Tab S4 | |
| Vulkan Medium Native | |
| Samsung Galaxy Tab S4 | |
| 1920x1080 OpenGL Medium Offscreen | |
| Samsung Galaxy Tab S4 | |
| Moyenne MediaTek Helio X27 MT6797X (n=1) | |
* ... Moindre est la valeur, meilleures sont les performances
| Alldocube M8 T801 32 GB eMMC Flash | Acer Iconia Tab 10 A3-A50 64 GB eMMC Flash | Alldocube Alldocube X 64 GB eMMC Flash | Huawei MediaPad M5 10.8 Pro 64 GB eMMC Flash | Samsung Galaxy Tab S4 64 GB UFS 2.1 Flash | |
|---|---|---|---|---|---|
| AndroBench 3-5 | -8% | 17% | 45% | 320% | |
| Sequential Write 256KB SDCard (MB/s) | 56.8 | 66.1 | 73.1 | 59.1 | |
| Sequential Read 256KB SDCard (MB/s) | 80.4 | 87.2 | 84.9 | 80.1 | |
| Random Write 4KB (MB/s) | 10.01 | 8.77 -12% | 11.62 16% | 15.35 53% | 24.43 144% |
| Random Read 4KB (MB/s) | 19.5 | 13.7 -30% | 14.62 -25% | 27.41 41% | 142 628% |
| Sequential Write 256KB (MB/s) | 103 | 92.4 -10% | 101.1 -2% | 94.1 -9% | 195.8 90% |
| Sequential Read 256KB (MB/s) | 142.8 | 173.7 22% | 255.4 79% | 278.6 95% | 741 419% |
| 3DMark Sling Shot Extreme (ES 3.1) Unlimited | 1157 points | |
Aide | ||
(+) La température maximale du côté supérieur est de 39.8 °C / 104 F, par rapport à la moyenne de 33.6 °C / 92 F, allant de 20.7 à 53.2 °C pour la classe Tablet.
(±) Le fond chauffe jusqu'à un maximum de 41.2 °C / 106 F, contre une moyenne de 33.2 °C / 92 F
(+) En utilisation inactive, la température moyenne du côté supérieur est de 24.7 °C / 76 F, par rapport à la moyenne du dispositif de 30 °C / 86 F.
Alldocube M8 T801 analyse audio
(+) | les haut-parleurs peuvent jouer relativement fort (83.3# dB)
Basses 100 - 315 Hz
(-) | presque aucune basse - en moyenne 38% plus bas que la médiane
(+) | les basses sont linéaires (4.9% delta à la fréquence précédente)
Médiums 400 - 2000 Hz
(±) | médiane réduite - en moyenne 7.8% inférieure à la médiane
(±) | la linéarité des médiums est moyenne (13% delta à la fréquence précédente)
Aiguës 2 - 16 kHz
(±) | sommets plus élevés - en moyenne 6% plus élevés que la médiane
(±) | la linéarité des aigus est moyenne (8.3% delta à la fréquence précédente)
Globalement 100 - 16 000 Hz
(-) | le son global n'est pas linéaire (34.6% de différence à la médiane)
Par rapport à la même classe
» 94% de tous les appareils testés de cette catégorie étaient meilleurs, 2% similaires, 4% pires
» Le meilleur avait un delta de 7%, la moyenne était de 20%, le pire était de 129%.
Par rapport à tous les appareils testés
» 93% de tous les appareils testés étaient meilleurs, 1% similaires, 6% pires
» Le meilleur avait un delta de 4%, la moyenne était de 24%, le pire était de 134%.
Apple MacBook 12 (Early 2016) 1.1 GHz analyse audio
(+) | les haut-parleurs peuvent jouer relativement fort (83.6# dB)
Basses 100 - 315 Hz
(±) | basse réduite - en moyenne 11.3% inférieure à la médiane
(±) | la linéarité des basses est moyenne (14.2% delta à la fréquence précédente)
Médiums 400 - 2000 Hz
(+) | médiane équilibrée - seulement 2.4% de la médiane
(+) | les médiums sont linéaires (5.5% delta à la fréquence précédente)
Aiguës 2 - 16 kHz
(+) | des sommets équilibrés - à seulement 2% de la médiane
(+) | les aigus sont linéaires (4.5% delta à la fréquence précédente)
Globalement 100 - 16 000 Hz
(+) | le son global est linéaire (10.2% différence à la médiane)
Par rapport à la même classe
» 7% de tous les appareils testés de cette catégorie étaient meilleurs, 2% similaires, 91% pires
» Le meilleur avait un delta de 5%, la moyenne était de 18%, le pire était de 53%.
Par rapport à tous les appareils testés
» 5% de tous les appareils testés étaient meilleurs, 1% similaires, 94% pires
» Le meilleur avait un delta de 4%, la moyenne était de 24%, le pire était de 134%.
| Éteint/en veille | |
| Au repos | |
| Fortement sollicité |
|
Légende:
min: | |
| Alldocube M8 T801 MT6797X, Mali-T880 MP4, 32 GB eMMC Flash, IPS, 1920x1200, 8" | Amazon Fire HD 8 2018 MT8163 V/B 1.3 GHz, Mali-T720, 16 GB eMMC Flash, IPS, 1280x800, 8" | Lenovo Tab 4 8 425, Adreno 308, 16 GB eMMC Flash, IPS, 1280x800, 8" | Huawei MediaPad M5 8.4 Kirin 960, Mali-G71 MP8, 32 GB eMMC Flash, IPS, 2560x1600, 8.4" | Xiaomi Mi Pad 4 SD 660, Adreno 512, 64 GB eMMC Flash, IPS LCD, 1920x1200, 8" | Asus ZenPad 3 8.0 Z581KL-1A001A 650 MSM8956, Adreno 510, 32 GB eMMC Flash, IPS, 2048x1536, 7.9" | |
|---|---|---|---|---|---|---|
| Power Consumption | 39% | 37% | 20% | 20% | 31% | |
| Idle Minimum * (Watt) | 3.4 | 0.97 71% | 1.1 68% | 2.1 38% | 1.2 65% | 1.01 70% |
| Idle Average * (Watt) | 5.1 | 3.26 36% | 3.51 31% | 3.74 27% | 2.2 57% | 2.71 47% |
| Idle Maximum * (Watt) | 5.3 | 3.37 36% | 4.14 22% | 4.33 18% | 4.1 23% | 2.75 48% |
| Load Average * (Watt) | 6 | 5.68 5% | 4.86 19% | 6.32 -5% | 8.2 -37% | 7.28 -21% |
| Load Maximum * (Watt) | 11.5 | 6.21 46% | 6.13 47% | 9.13 21% | 12.2 -6% | 10.02 13% |
* ... Moindre est la valeur, meilleures sont les performances
| Alldocube M8 T801 5500 mAh | Lenovo Tab 4 8 4850 mAh | Amazon Fire HD 8 2018 4750 mAh | Huawei MediaPad M5 8.4 5100 mAh | Xiaomi Mi Pad 4 6000 mAh | Asus ZenPad 3 8.0 Z581KL-1A001A 4680 mAh | |
|---|---|---|---|---|---|---|
| Autonomie de la batterie | 7% | 17% | 50% | 97% | 11% | |
| WiFi v1.3 (h) | 7 | 7.5 7% | 8.2 17% | 10.5 50% | 13.8 97% | 7.8 11% |
| Reader / Idle (h) | 20.1 | 19.5 | 19.2 | 22.7 | 19.1 | |
| Load (h) | 4.6 | 5.3 | 5 | 3.7 | 4.4 |
Points positifs
Points négatifs
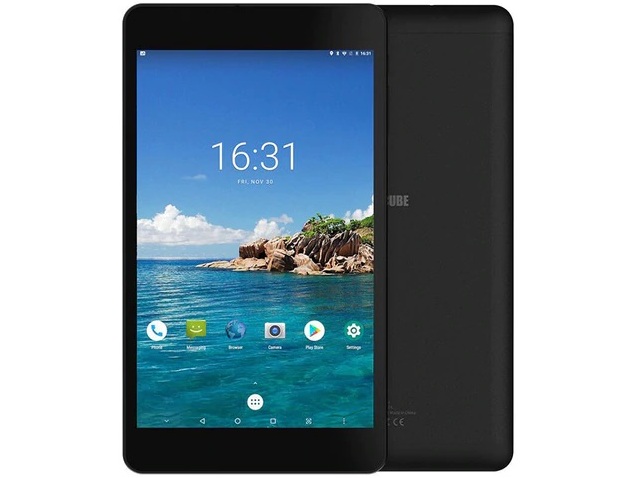
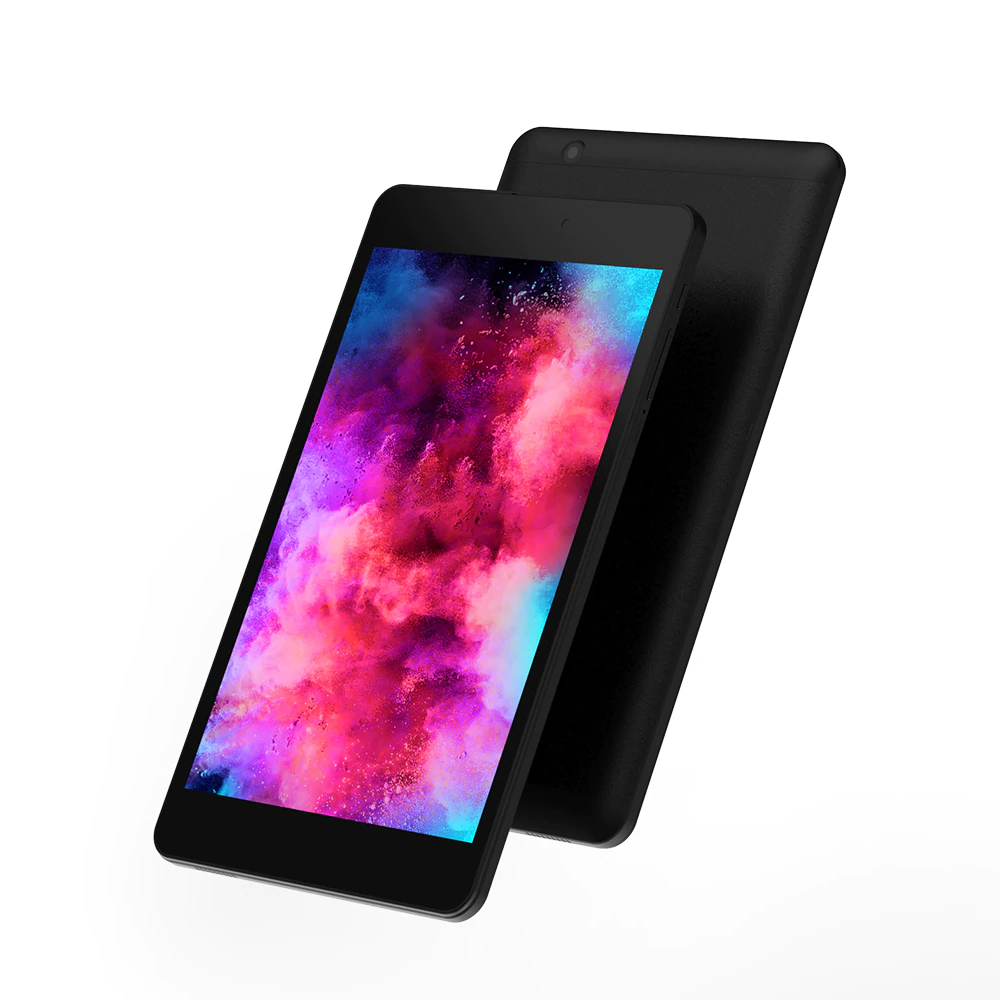
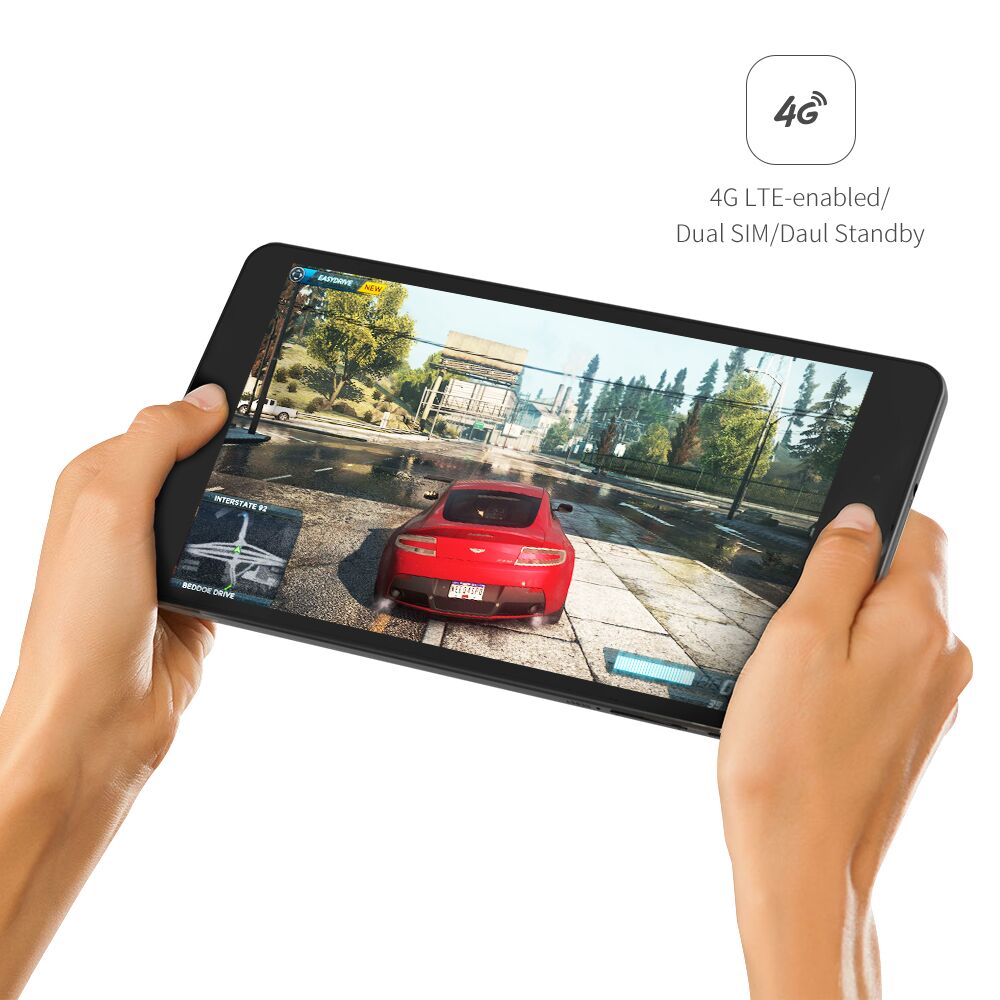
Les points forts de l’Alldocube M8 sont sa construction plutôt robuste et la 4G LTE en option. Elle paraît plus solide que beaucoup dans cette gamme de prix, parce qu’elle est légèrement plus épaisse. Nous sommes à peu près à l’aise pour la recommander à des enfants ou à un usage familial, parce qu’elle semble pouvoir survivre aux inévitables chocs qu’une telle utilisation entraîne, plus facilement que des alternatives plus fines ou plus légères.
Pour le reste, la tablette reflète son prix. L’écran est plus sombre que la moyenne, l’autonomie peu impressionnante, les appareils photo sans relief, et les performances en retrait. Le NFC, l’infrarouge, le capteur de luminosité et l’USB C sont absents.
L’Alldocube M8 peut faire l’affaire comme tablette familiale à la maison ou comme tablette secondaire en déplacement. Même si elle fait à peu près correctement son travail, elle n’a pas les performances, la luminosité, le stockage, les appareils photo, la longévité ou les fonctionnalités qui permettraient de remplacer une alternative du milieu de gamme ou un smartphone.
L’intégralité de cette critique est disponible en anglais en suivant ce lien.
Alldocube M8 T801
- 03/15/2019 v6 (old)
Allen Ngo
Price comparison
