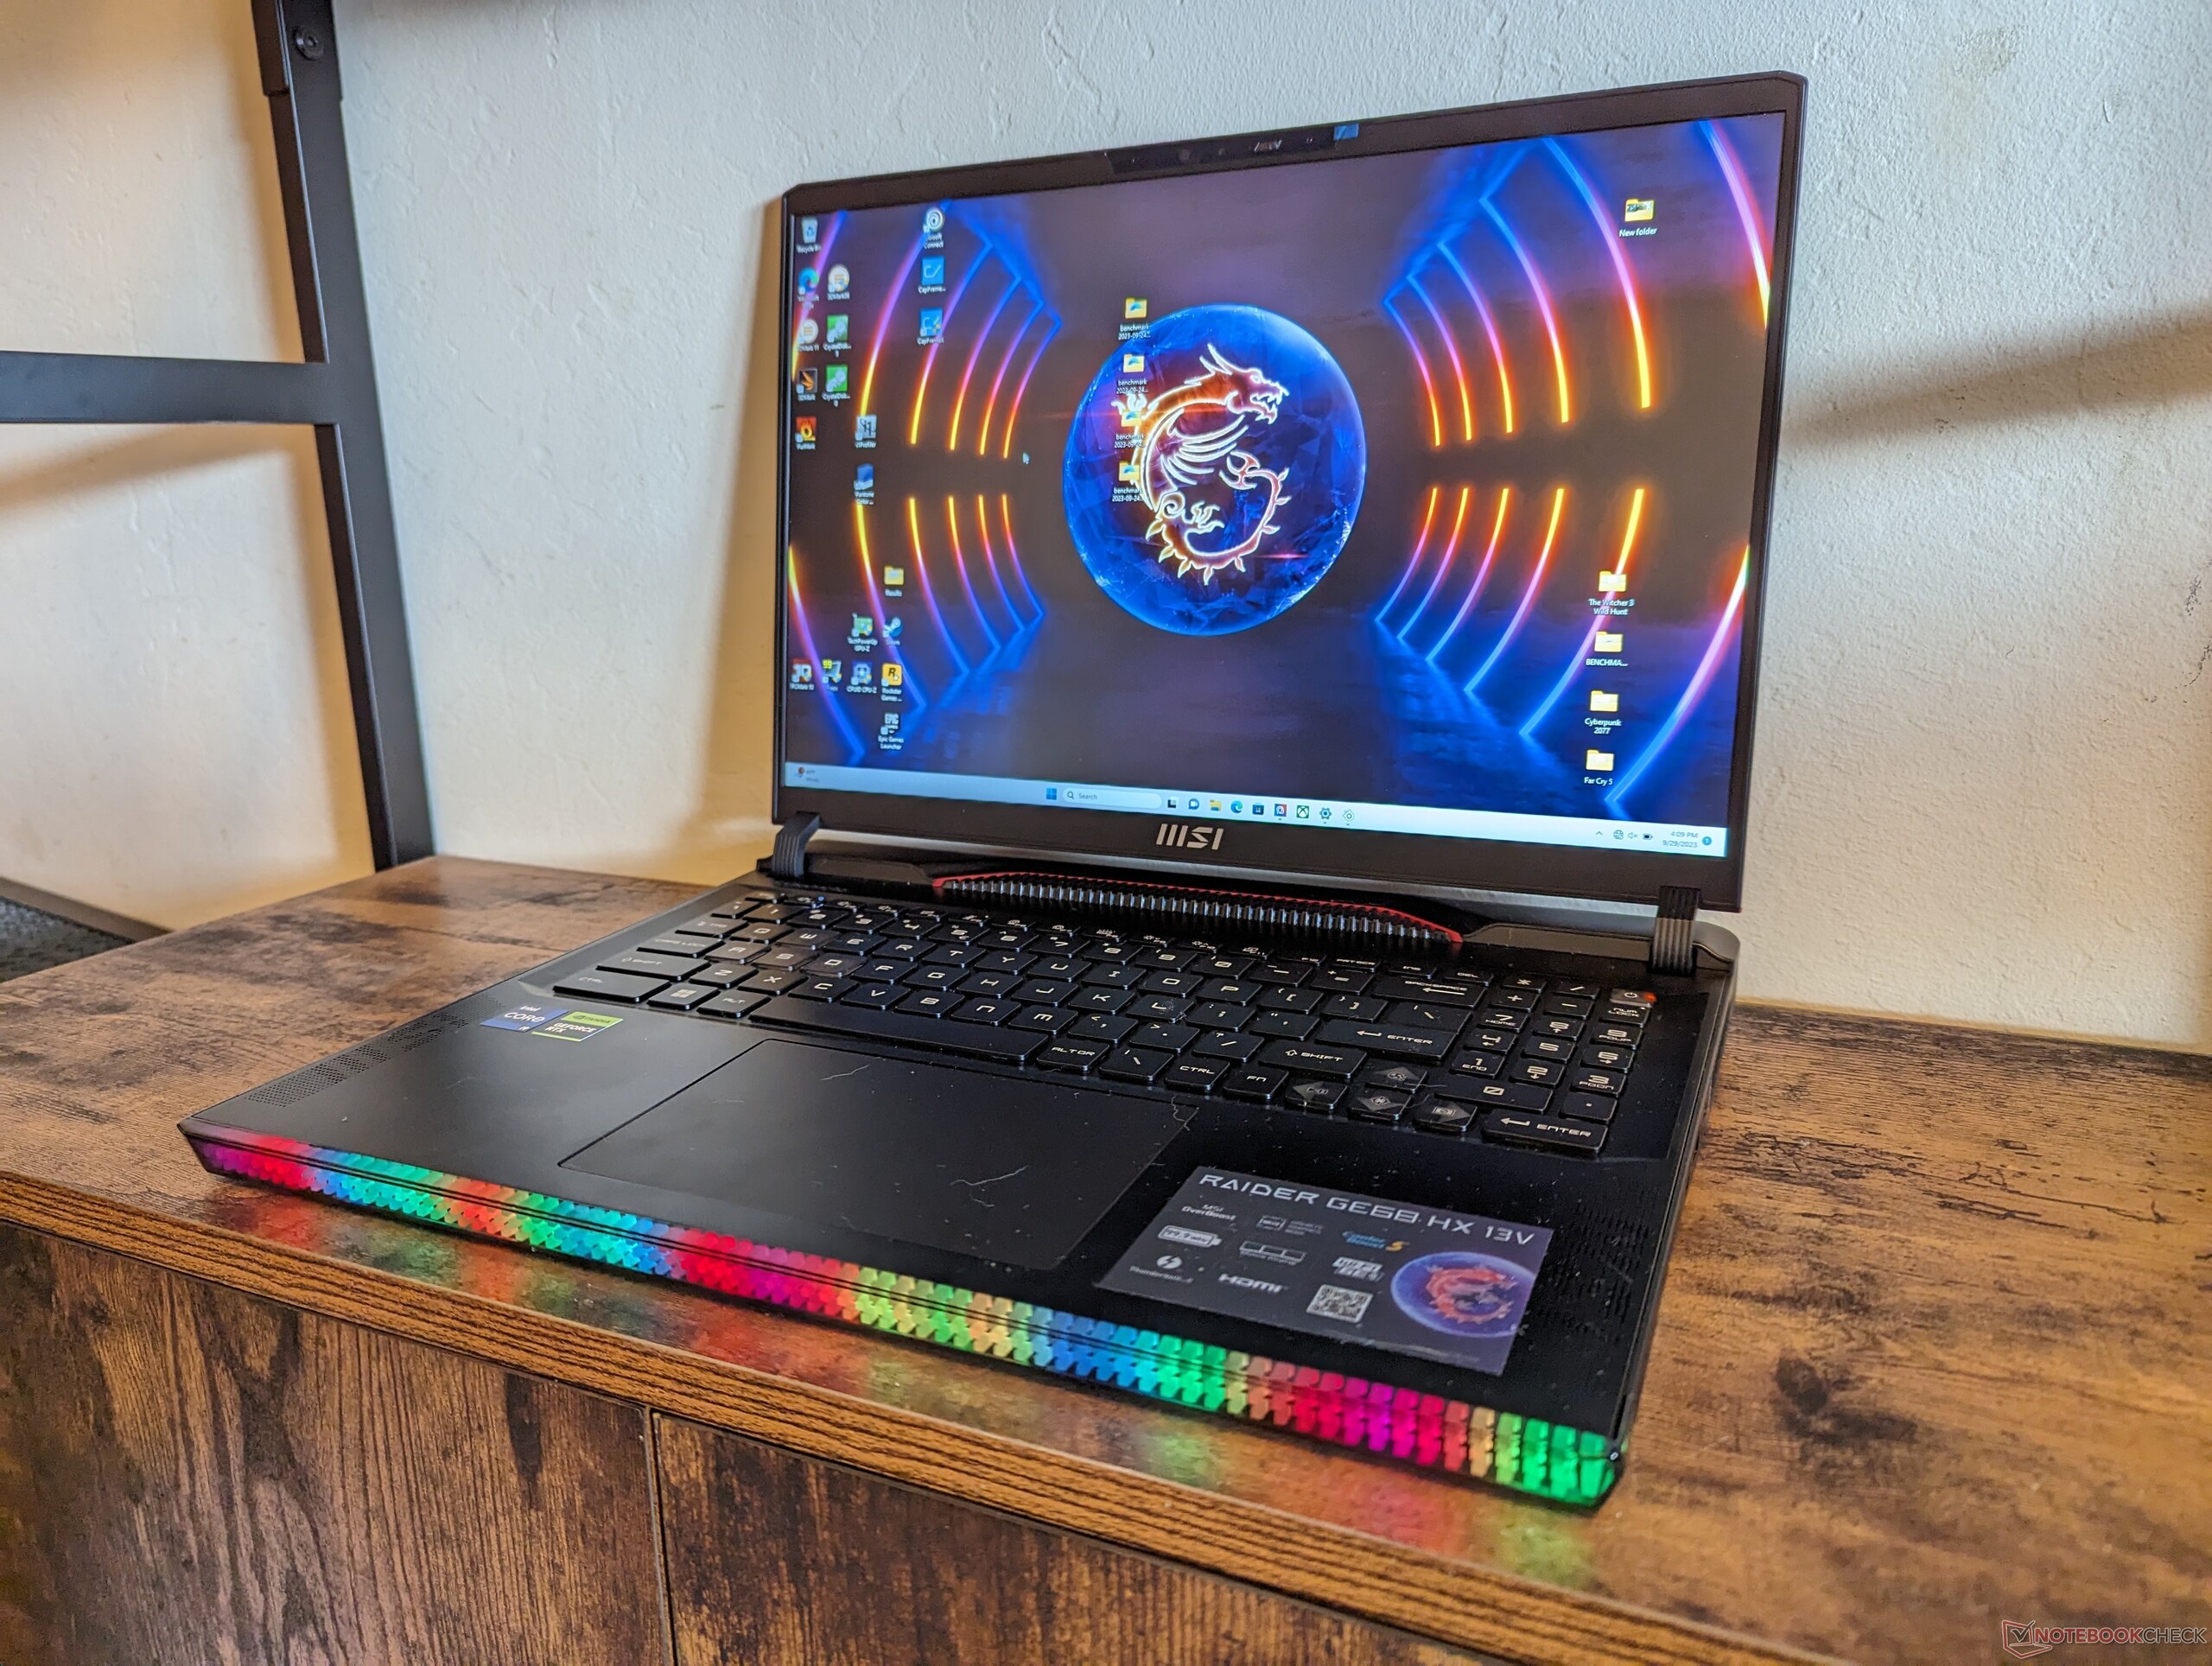
Test du MSI Raider GE68 HX 13VF : un changement complet de design

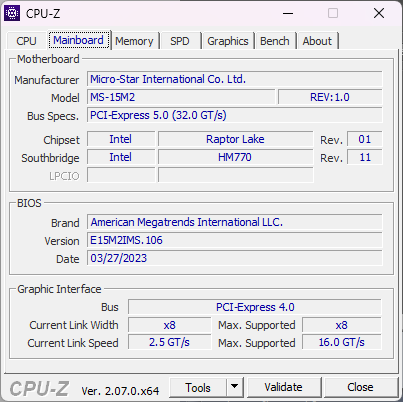
Le GE68HX succède directement au GE67HX de l'année dernière avec des composants internes rafraîchis et un nouveau design de châssis. Outre les CPU Raptor Lake-HX de 13e génération et les GPU Nvidia Ada Lovelace qui remplacent les options Alder Lake-HX et Ampere de 12e génération, le nouveau modèle offre également un écran 16:10 de 16 pouces plus grand que le format 16:9 de 15,6 pouces en déclin.
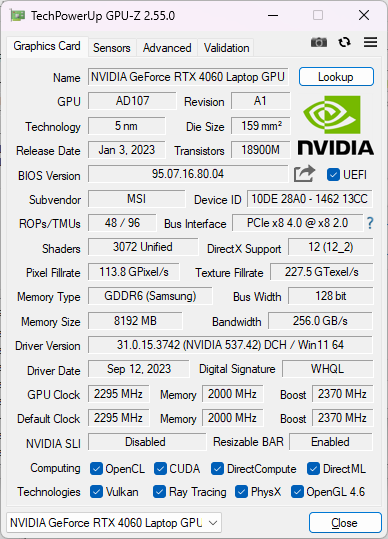
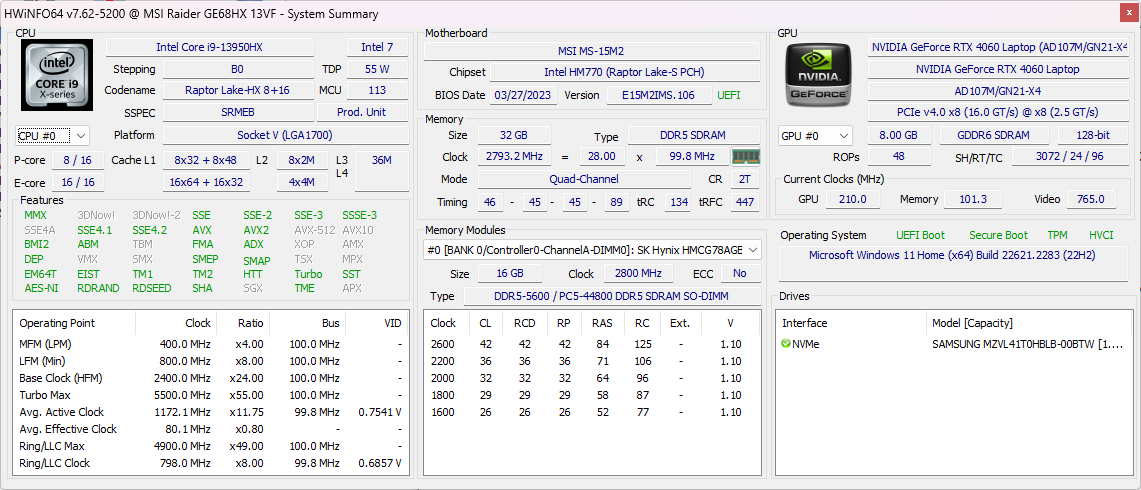
Notre modèle est la configuration de base avec le Core i7-13950HX, 140 W GeForce RTX 4060, et un écran IPS 1080p 144 Hz, pour un prix de détail d'environ $1700 USD ou $1300 en cas de vente. Les SKUs plus haut de gamme incluent le Core i9-13980HX, la RTX 4090, et un écran 1440p 240 Hz pour plus de $3500.
Parmi les concurrents du GE68HX, on trouve d'autres ordinateurs portables de jeu haut de gamme de 16 pouces, tels que le HP Omen 16,Alienware m16 R1, Lenovo Legion Slim 7i 16 Gen 8ou le Asus ROG Zephyrus M16.
Plus d'avis sur MSI :
Comparaison avec les concurrents potentiels
Note | Date | Modèle | Poids | Épaisseur | Taille | Résolution | Prix |
|---|---|---|---|---|---|---|---|
| 86.9 % v7 (old) | 10/23 | MSI Raider GE68HX 13VF i9-13950HX, GeForce RTX 4060 Laptop GPU | 2.7 kg | 27.9 mm | 16.00" | 1900x1200 | |
| 87.7 % v7 (old) | 07/22 | MSI GE67 HX 12UGS i7-12800HX, GeForce RTX 3070 Ti Laptop GPU | 2.5 kg | 23.4 mm | 15.60" | 1920x1080 | |
| 86.6 % v7 (old) | 09/23 | HP Omen 16-xf0376ng R7 7840HS, GeForce RTX 4070 Laptop GPU | 2.4 kg | 23.5 mm | 16.10" | 1920x1080 | |
| 89.2 % v7 (old) | 08/23 | Alienware m16 R1 AMD R9 7845HX, GeForce RTX 4080 Laptop GPU | 3.1 kg | 25.4 mm | 16.00" | 2560x1600 | |
| 90 % v7 (old) | 07/23 | Lenovo Legion Slim 7i 16 Gen 8 i9-13900H, GeForce RTX 4070 Laptop GPU | 2.1 kg | 19.9 mm | 16.00" | 2560x1600 | |
| 89.4 % v7 (old) | 03/23 | Asus ROG Zephyrus M16 GU604VY-NM042X i9-13900H, GeForce RTX 4090 Laptop GPU | 2.3 kg | 22.9 mm | 16.00" | 2560x1600 |
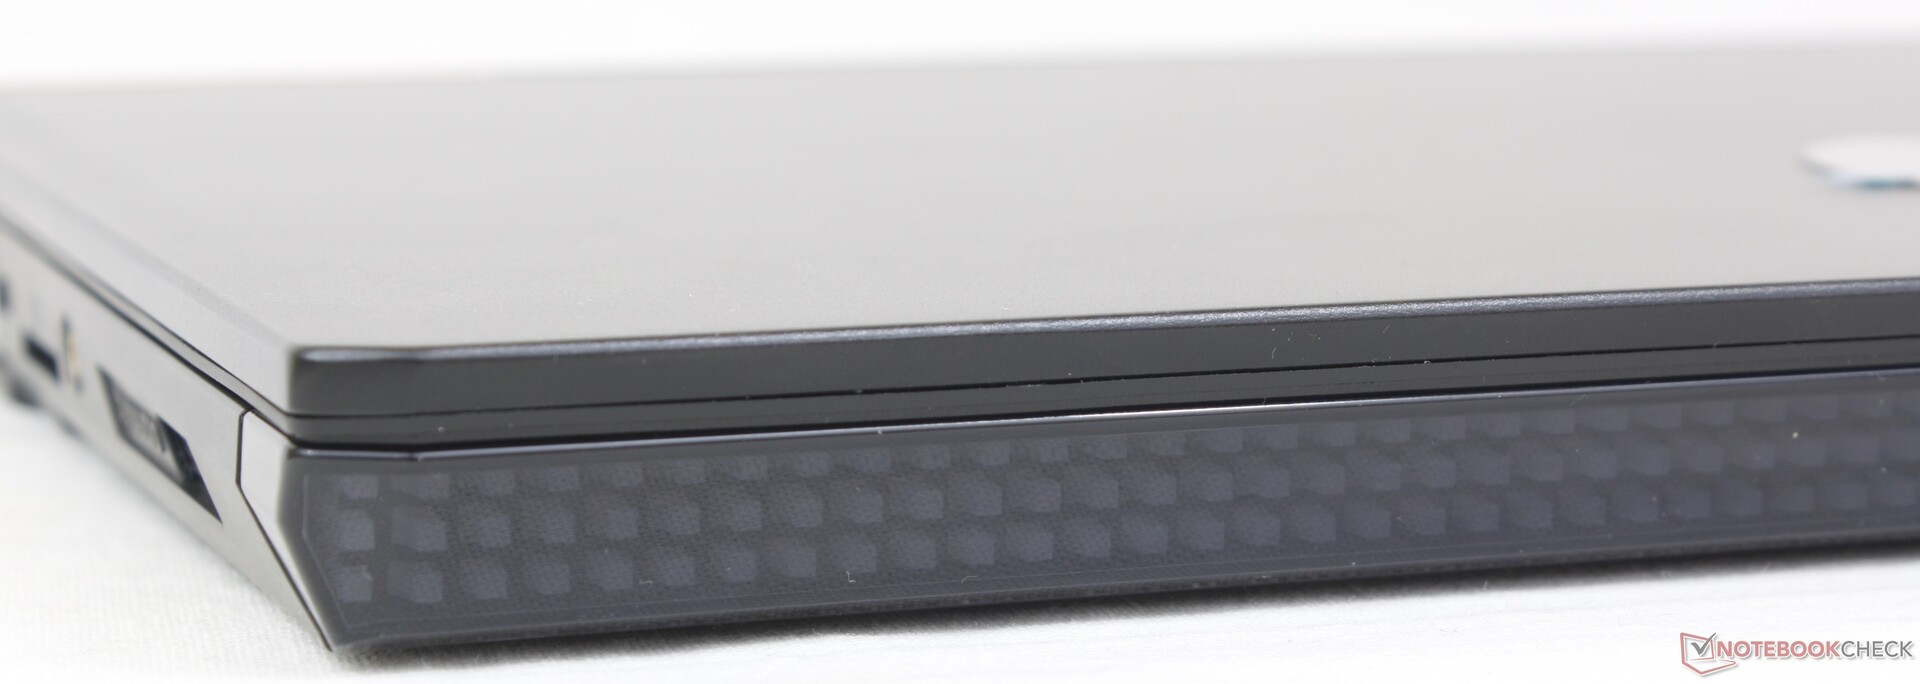
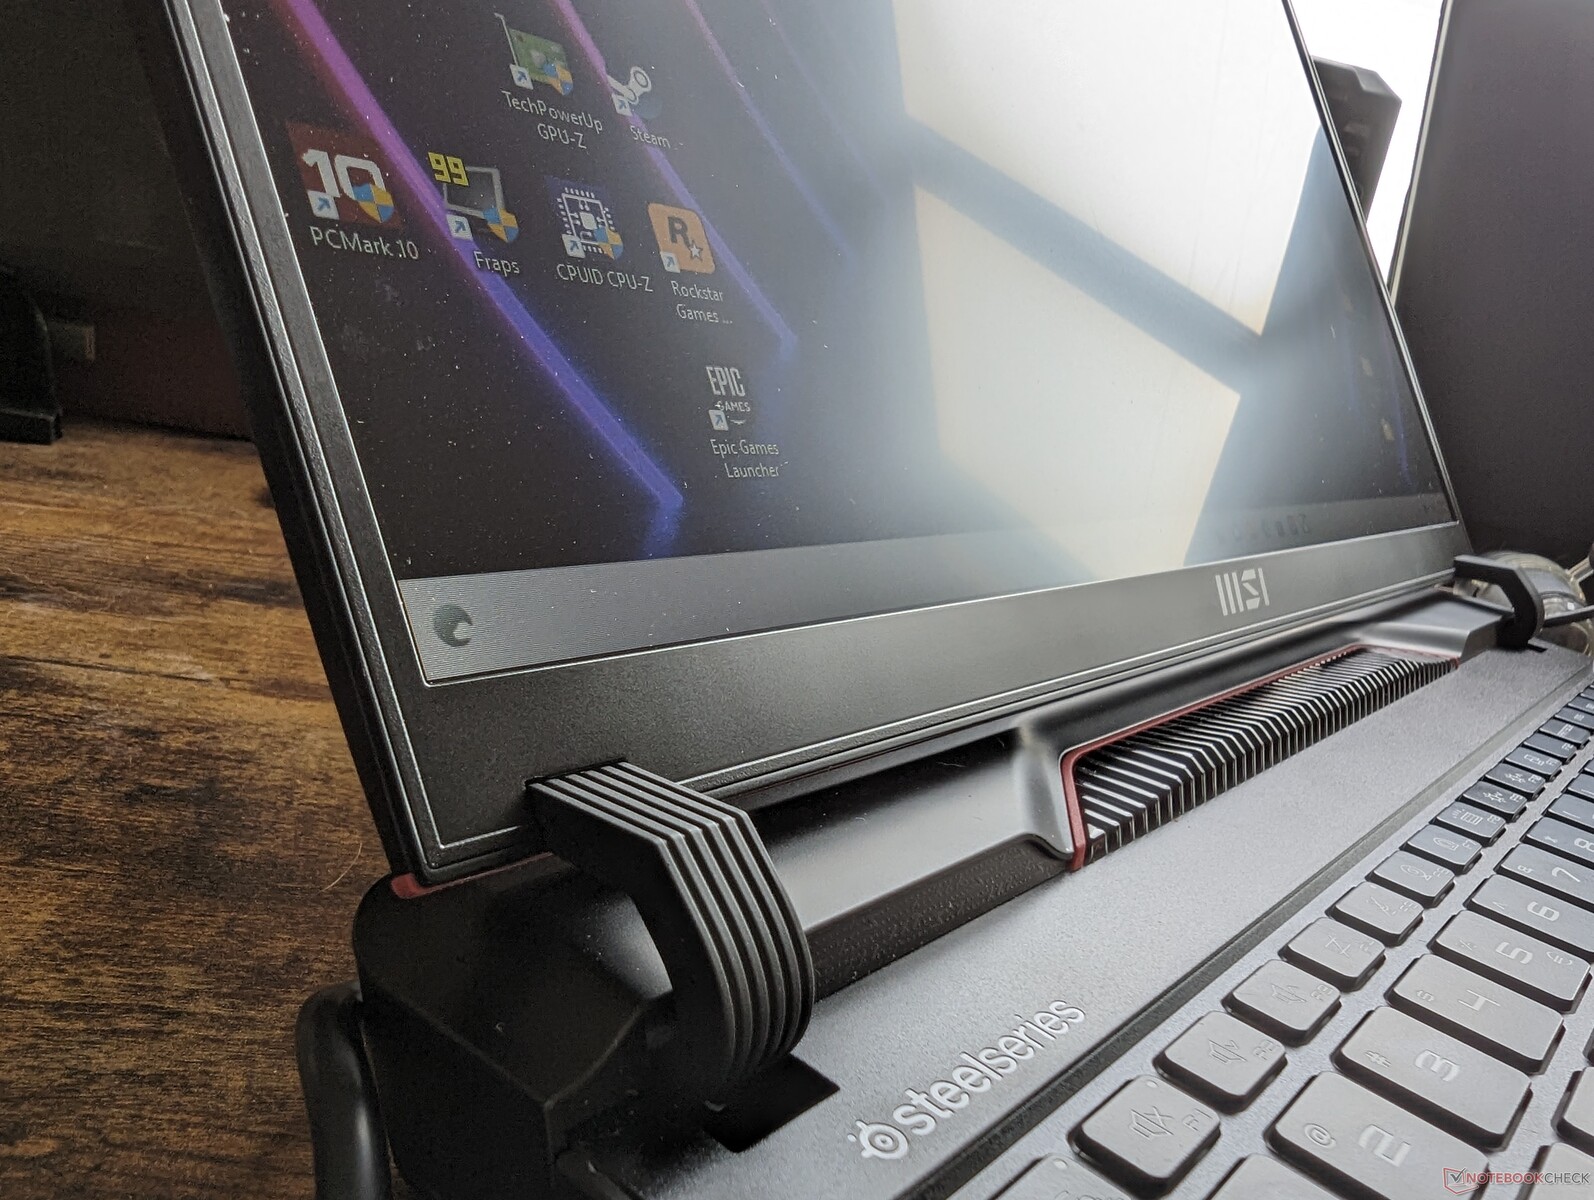
Cas - Plus grand qu'avant
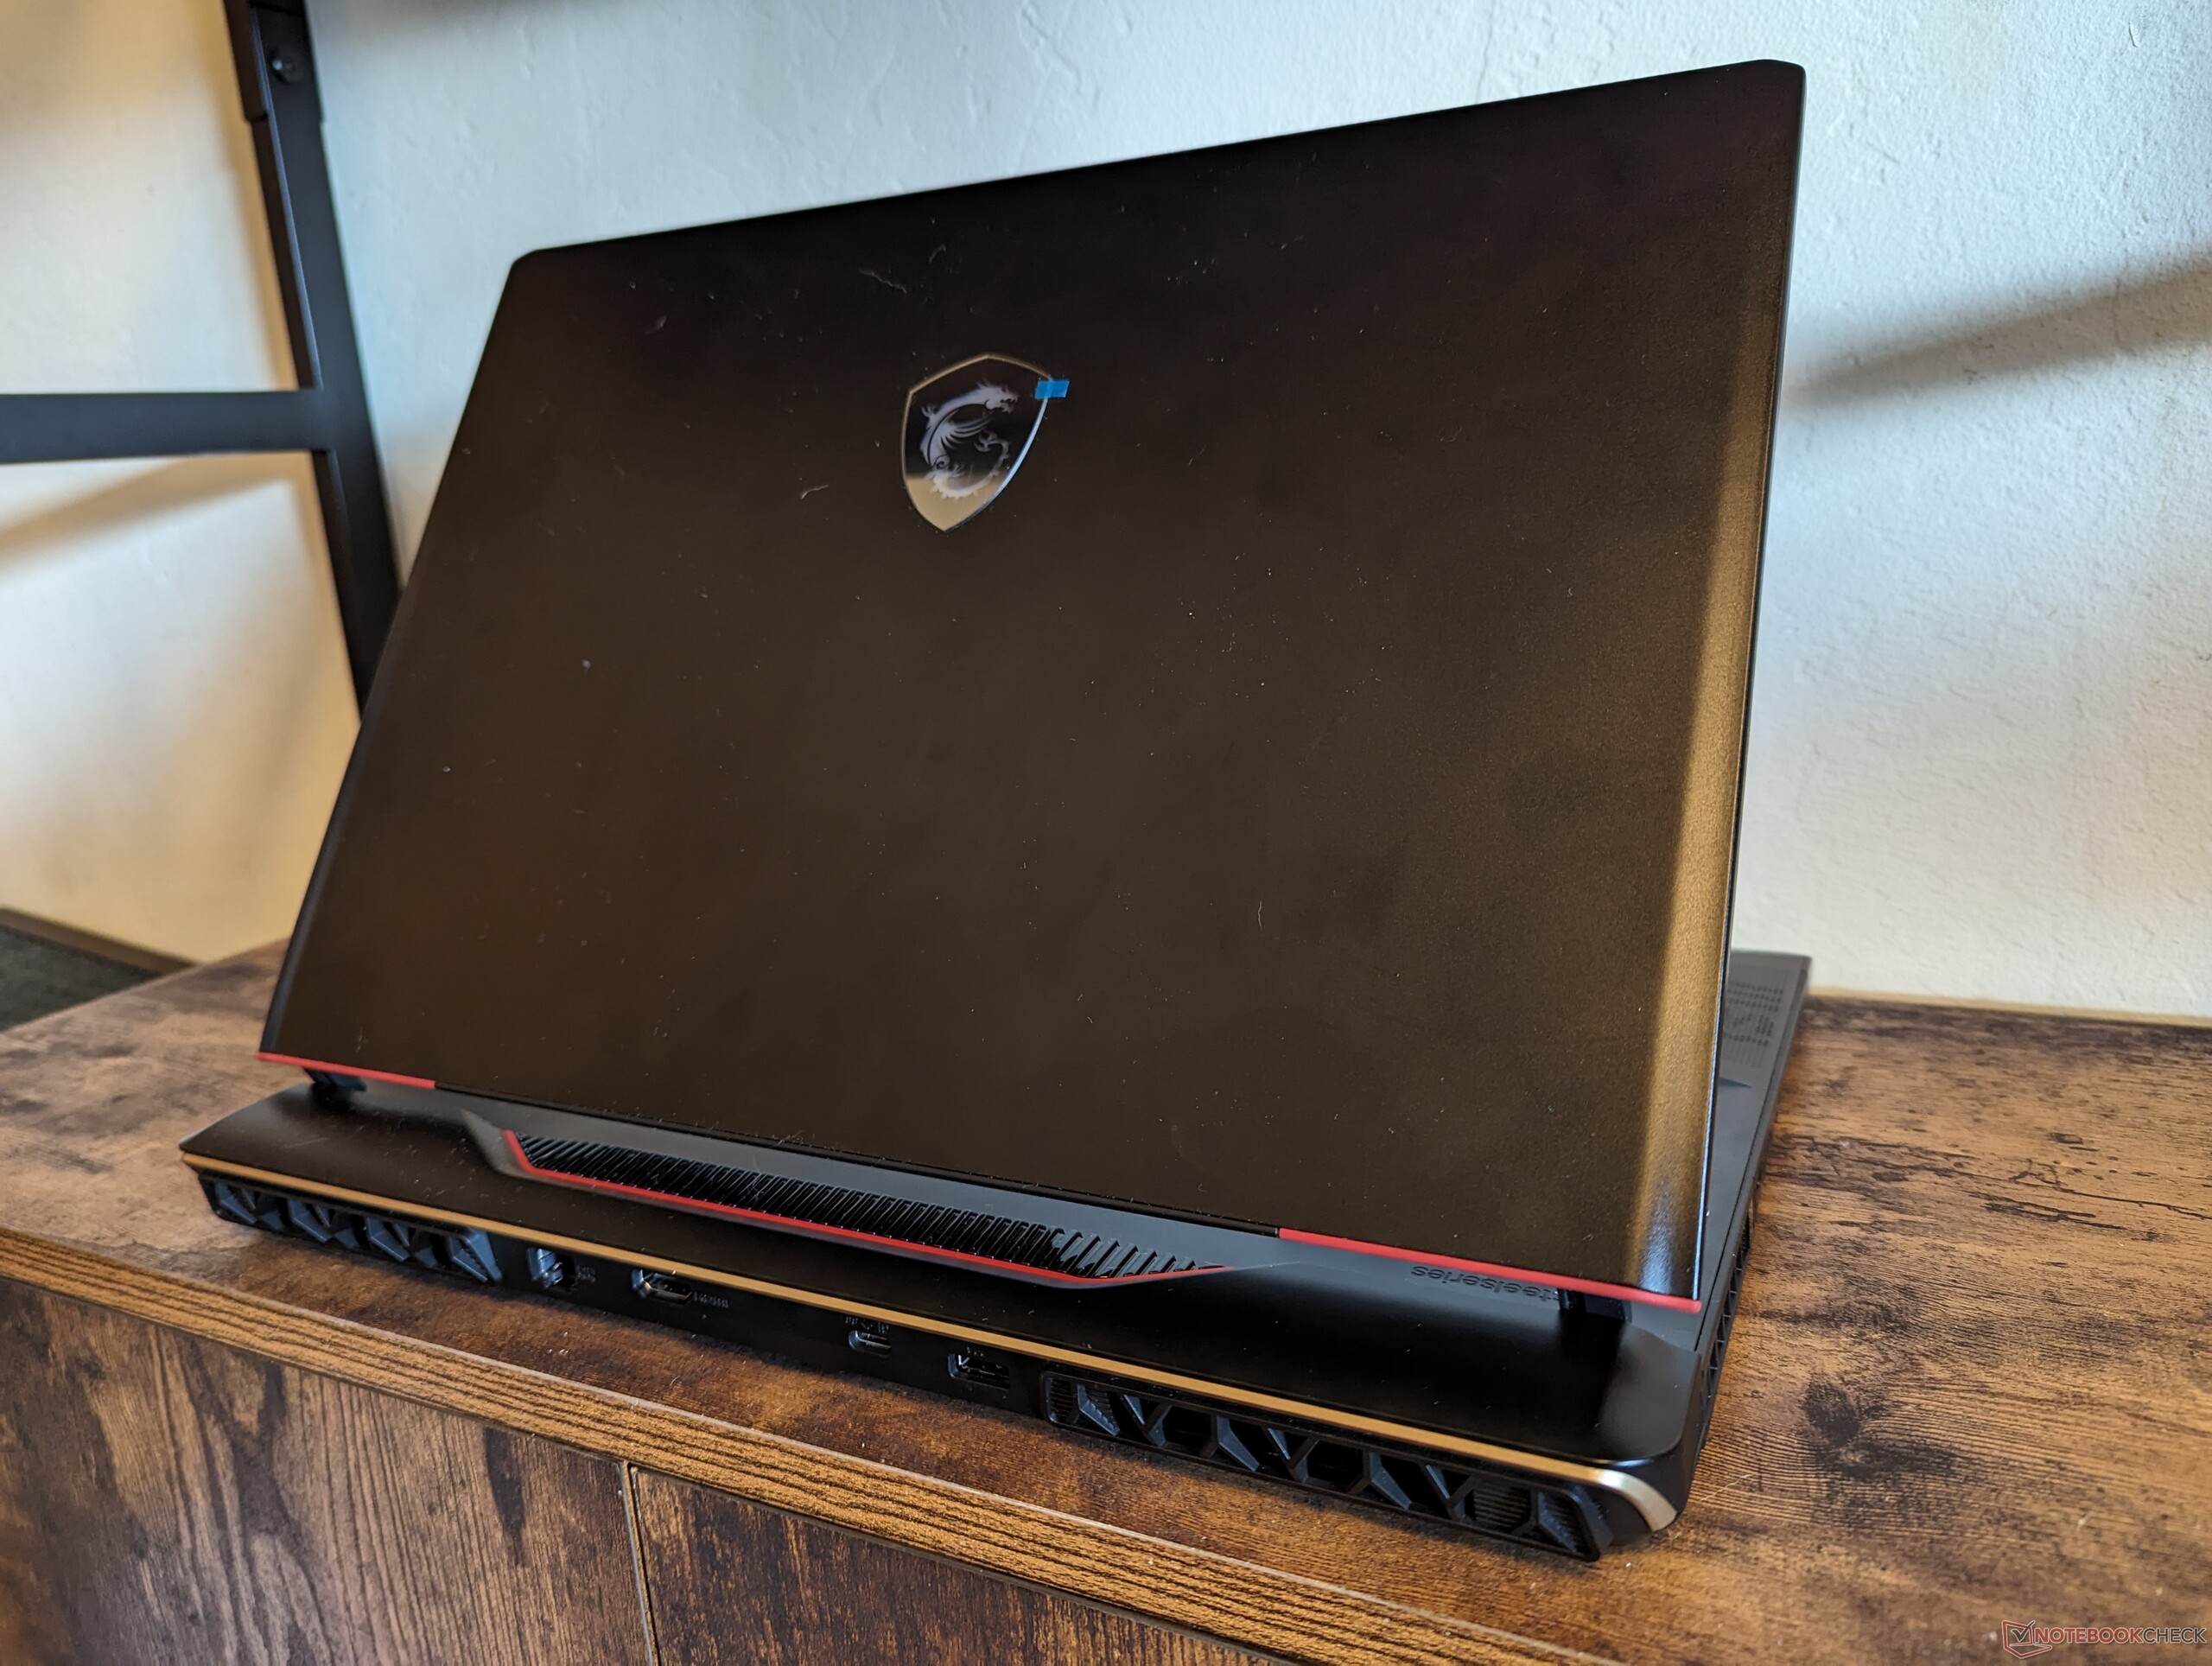
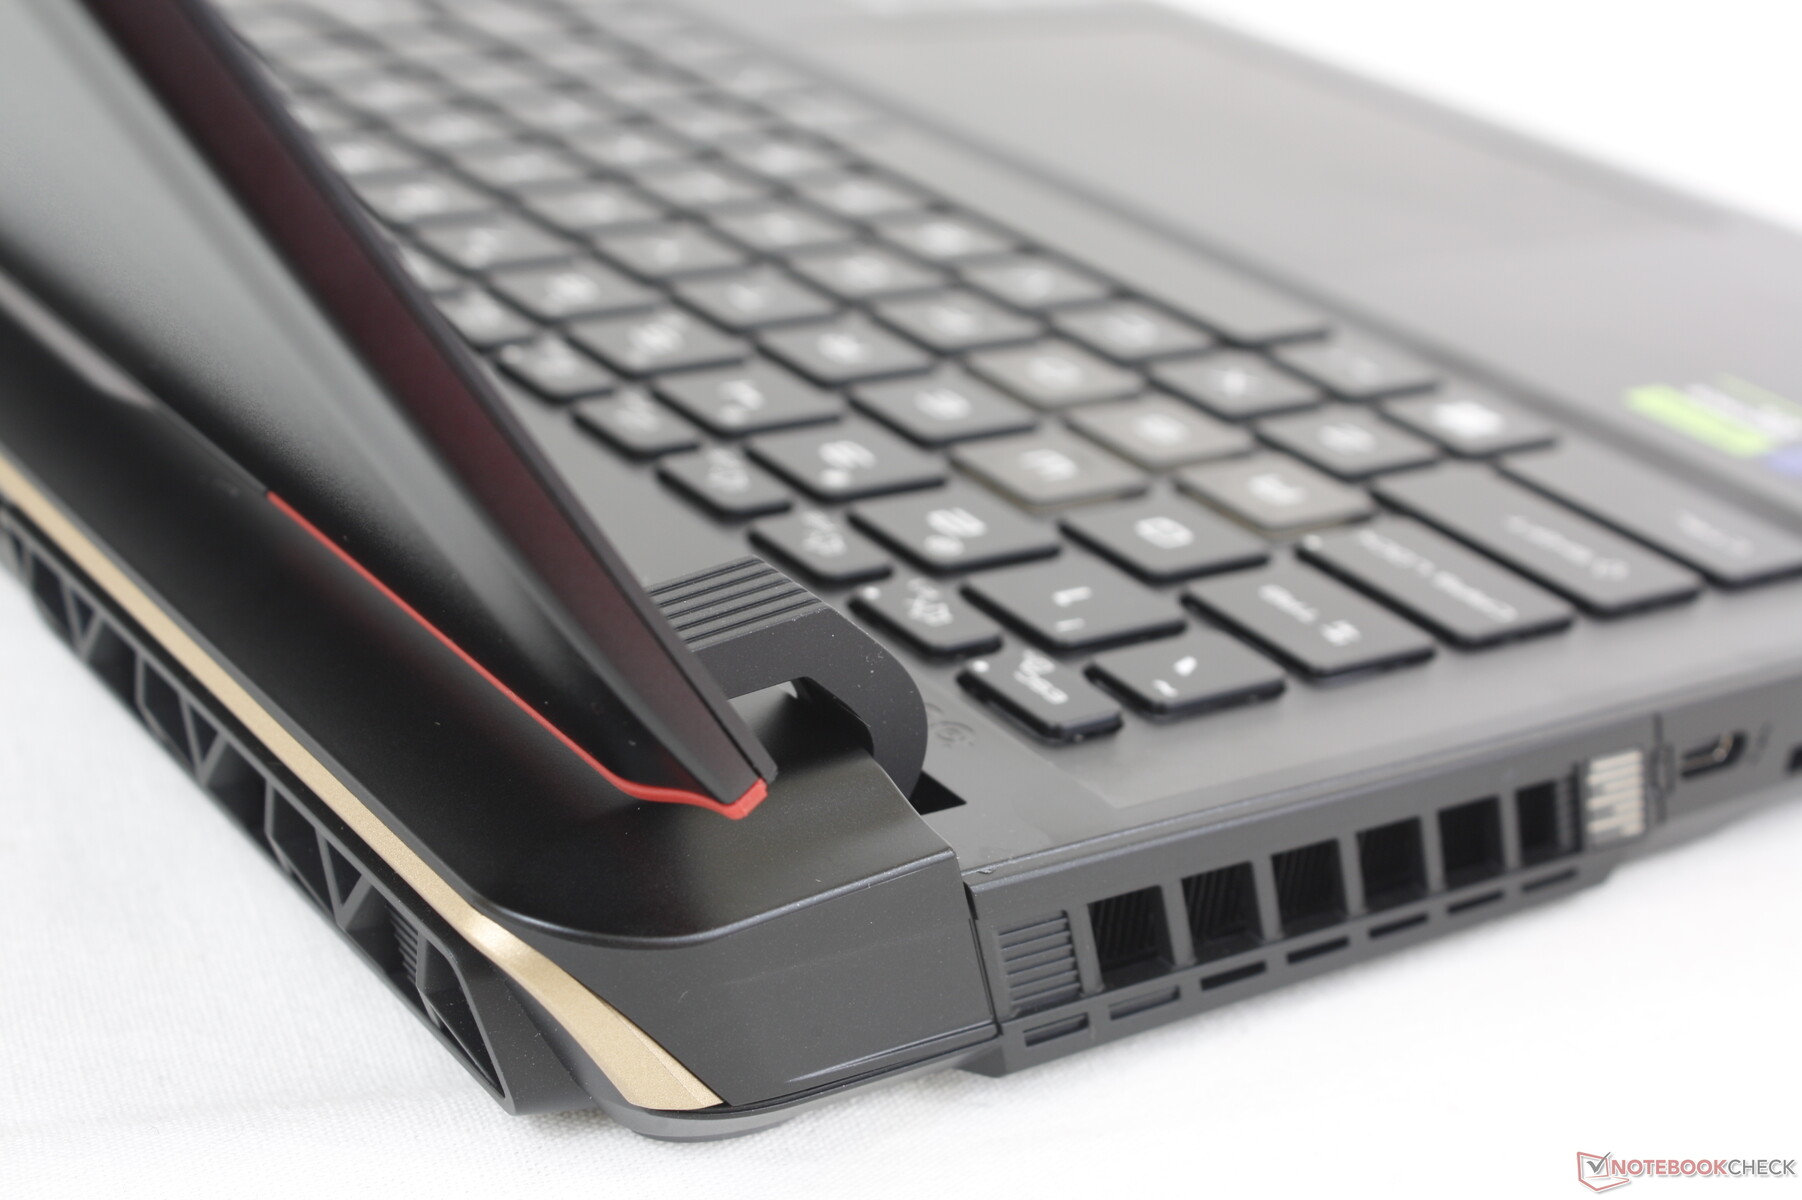
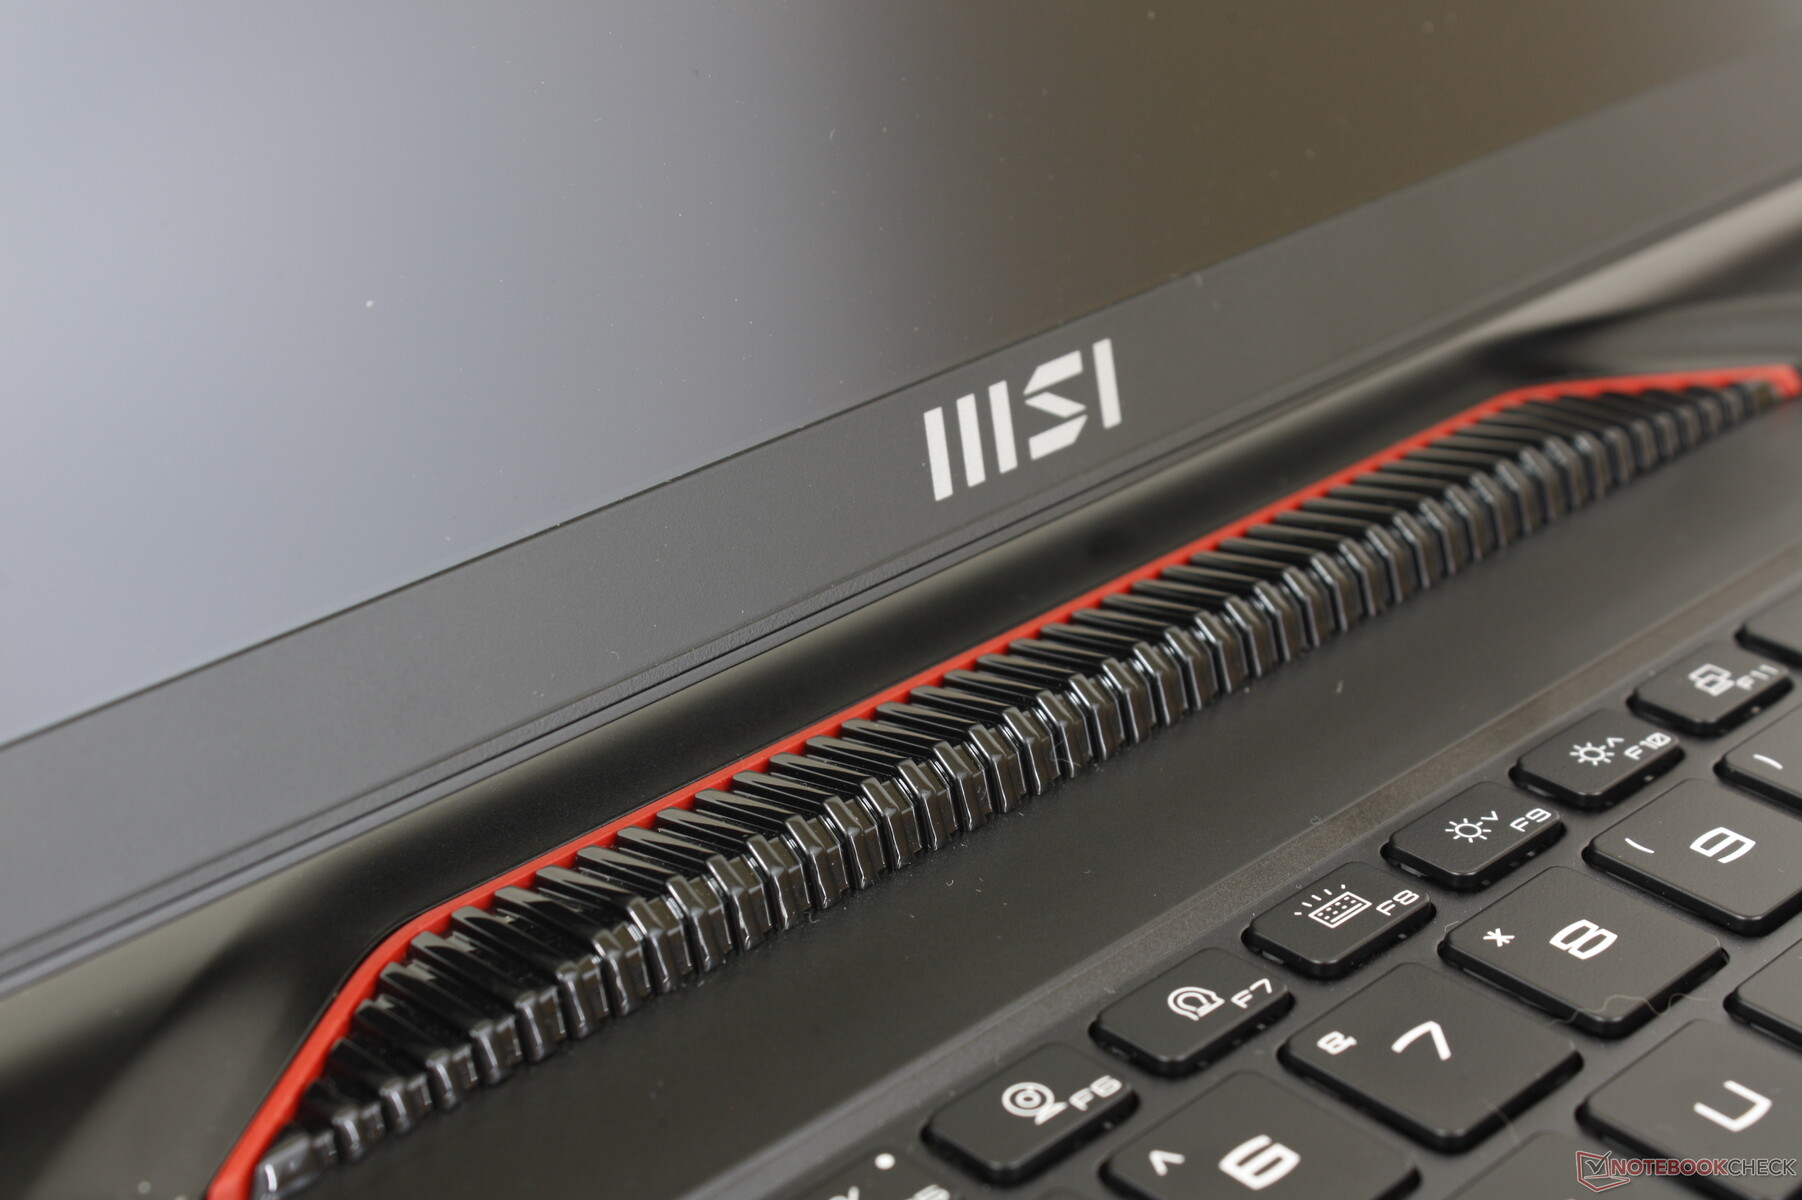
Le châssis peut être décrit comme une version plus petite du modèle 17 pouces Raider GE78HX. La barre de pixels LED à l'avant remplace l'éclairage continu du modèle de l'année dernière, tandis que l'arrière est désormais plus stylisé avec des garnitures dorées, rouges et brillantes. L'un des objectifs de MSI cette année était de créer des ordinateurs portables plus intéressants sur le plan visuel, plutôt que de se contenter du noir de jais et de l'esthétique minimaliste de plus en plus courants. Le fabricant a réussi son pari puisque le design du GE68HX est sans conteste reconnaissable et très différent des autres ordinateurs portables gaming de la concurrence.
La rigidité du châssis est excellente malgré toutes les courbes et les pièces qui composent le squelette non unibody. En appliquant une pression au centre du clavier ou en essayant de tordre les coins, il n'y a que très peu de flexion et aucun grincement n'est audible. Nous apprécions particulièrement les charnières plus grandes et plus robustes par rapport au GE67HX de l'année dernière pour une meilleure sensation de longévité.
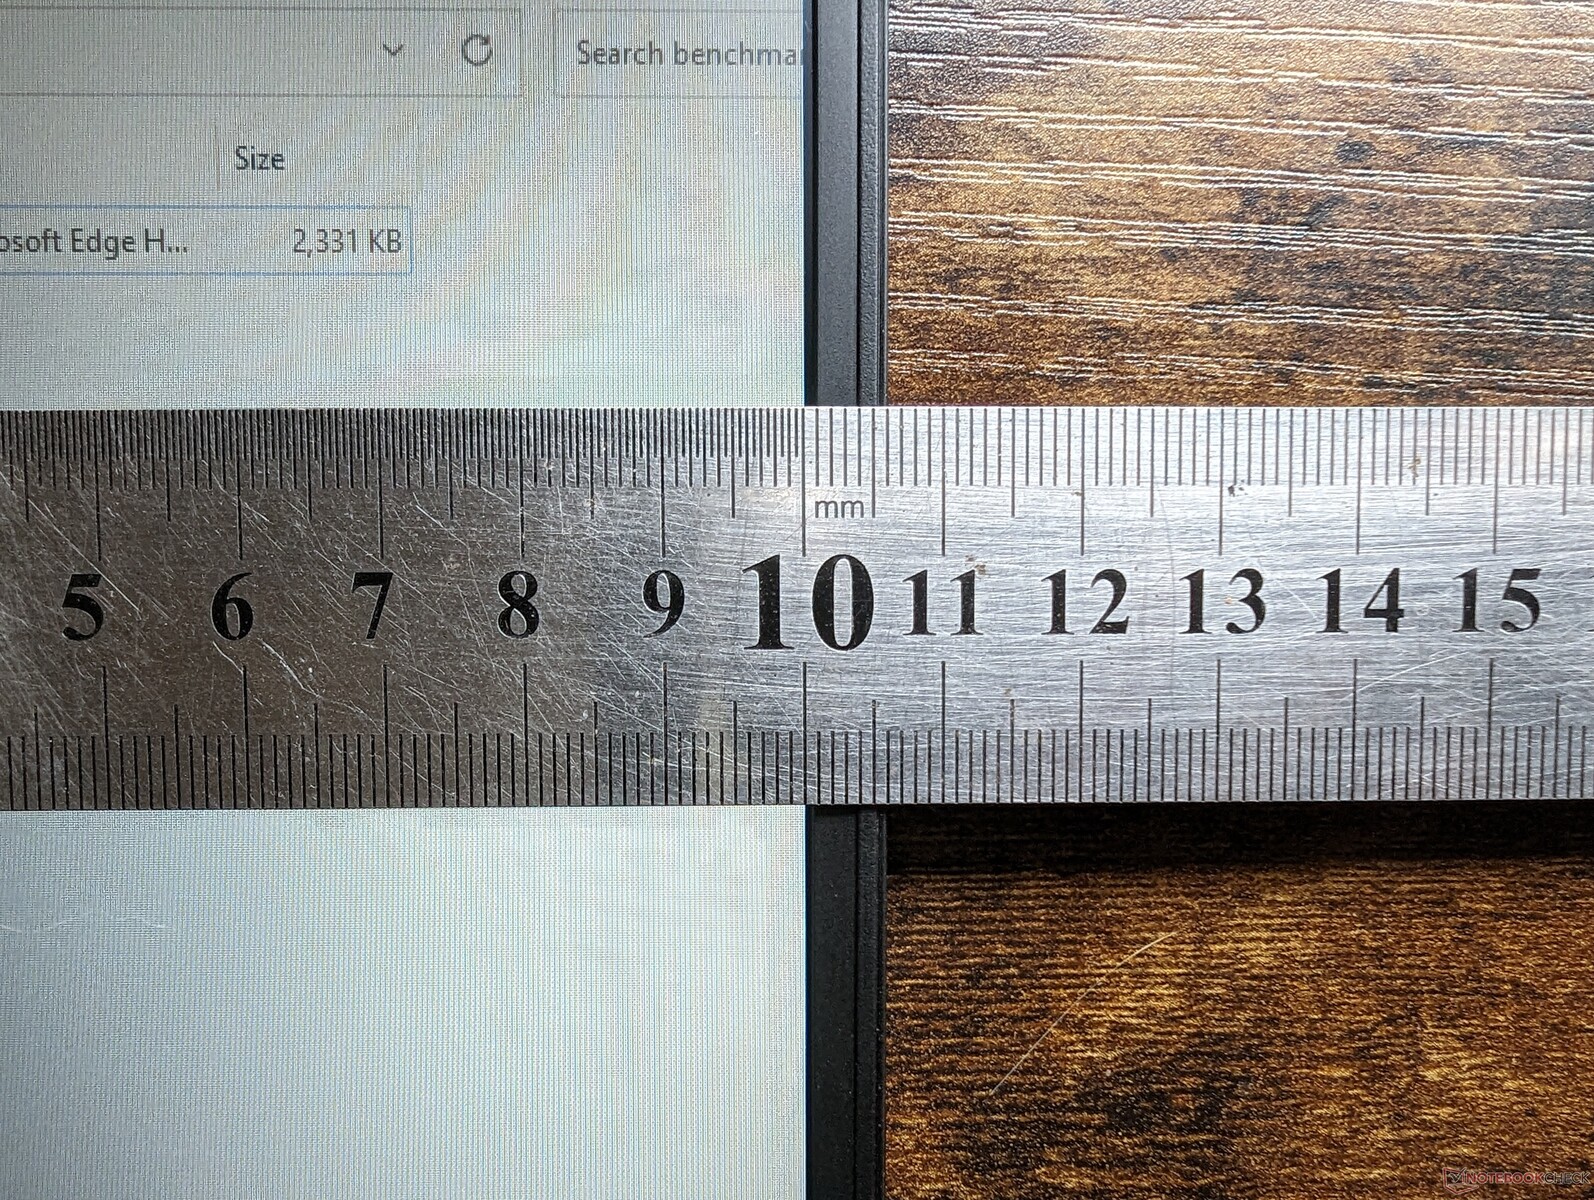
Le nouveau modèle est à la fois plus grand et plus lourd que le GE67HX sortant, avec des marges notables, comme le montre notre tableau de comparaison des tailles ci-dessous. En fait, le GE68HX est l'un des ordinateurs portables de jeu de 16 pouces les plus grands et les plus lourds disponibles sur le marché.
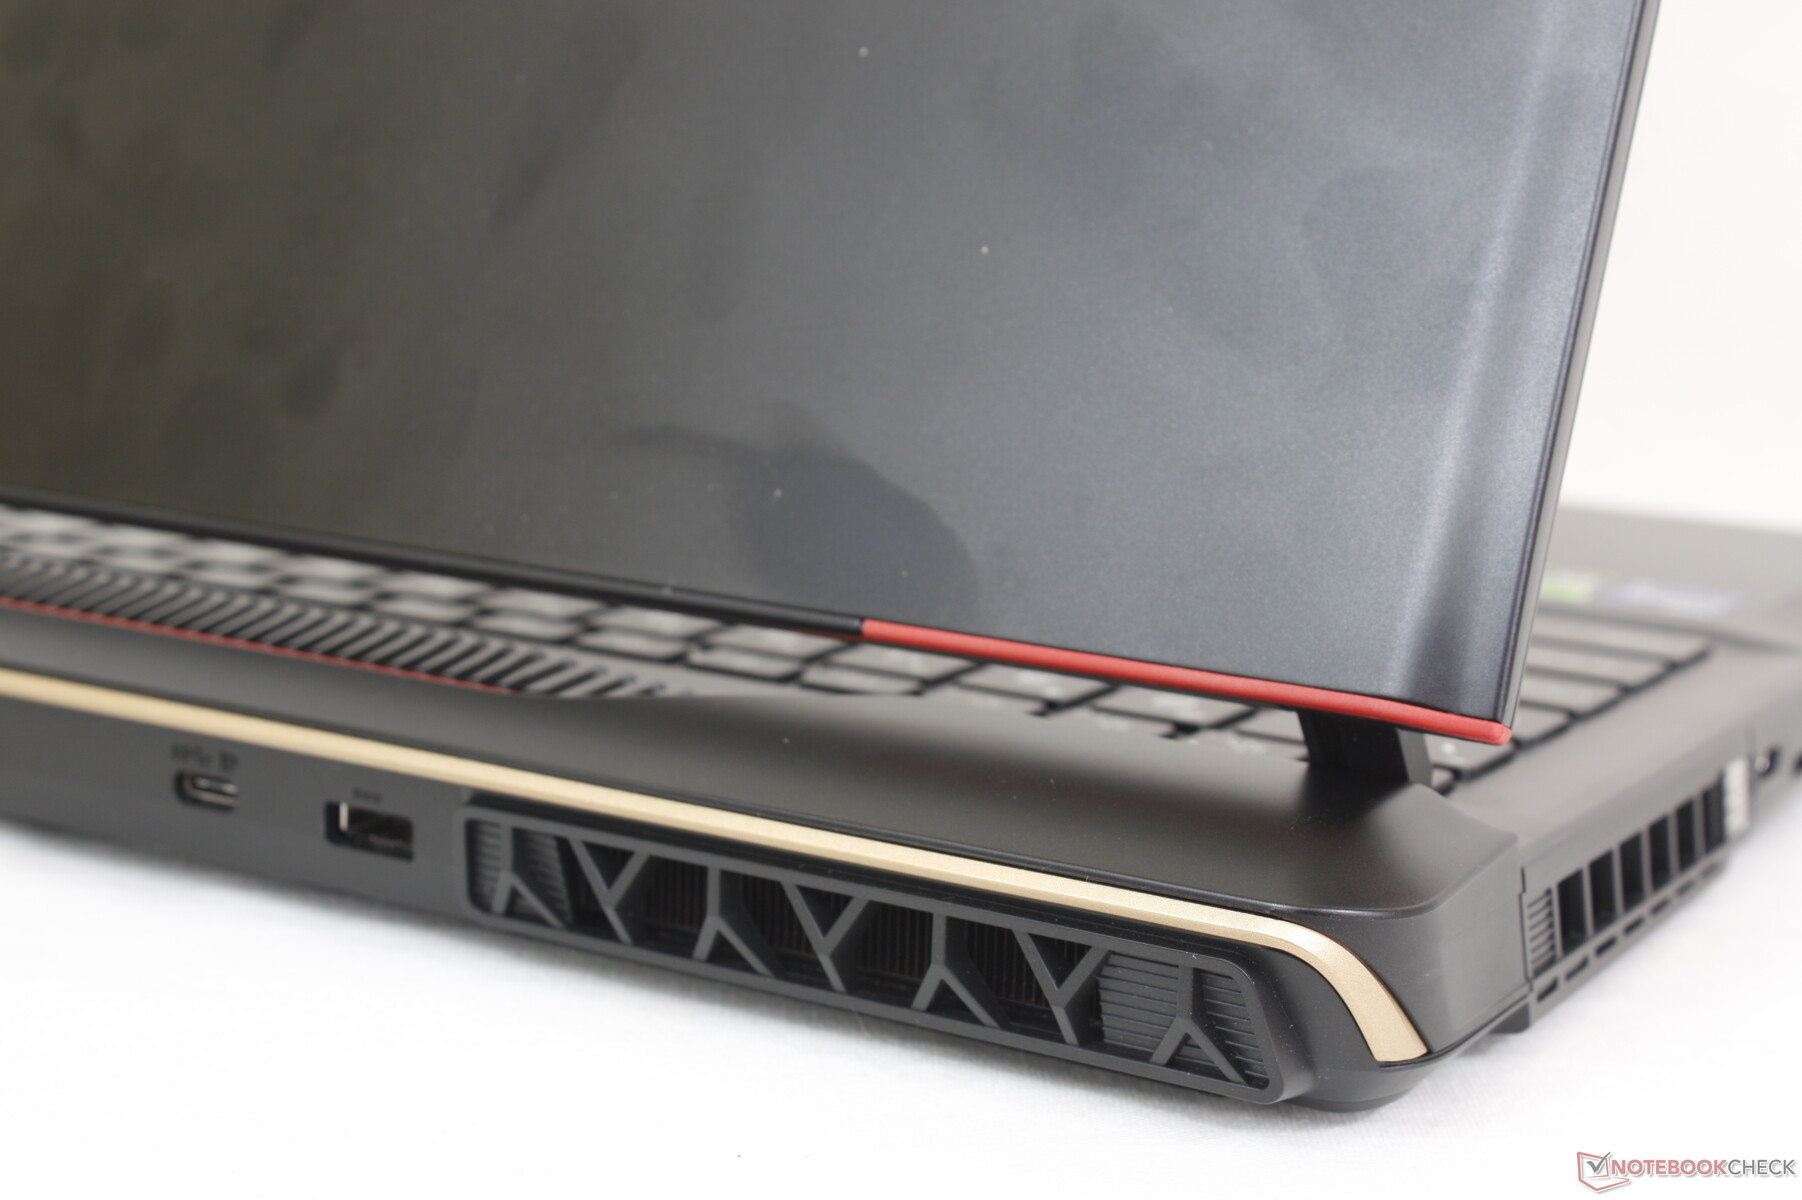
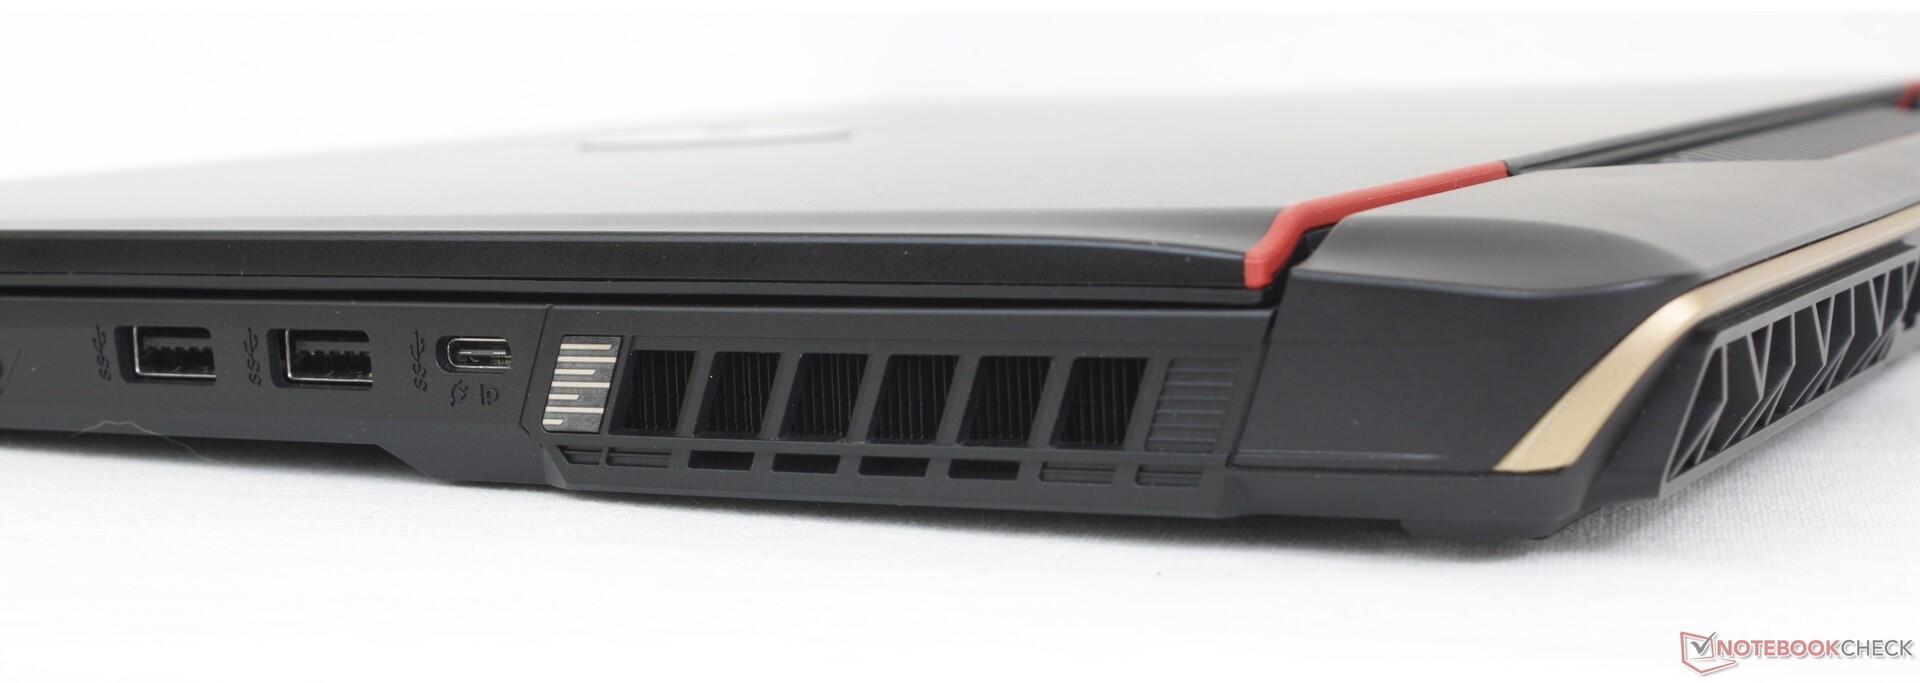
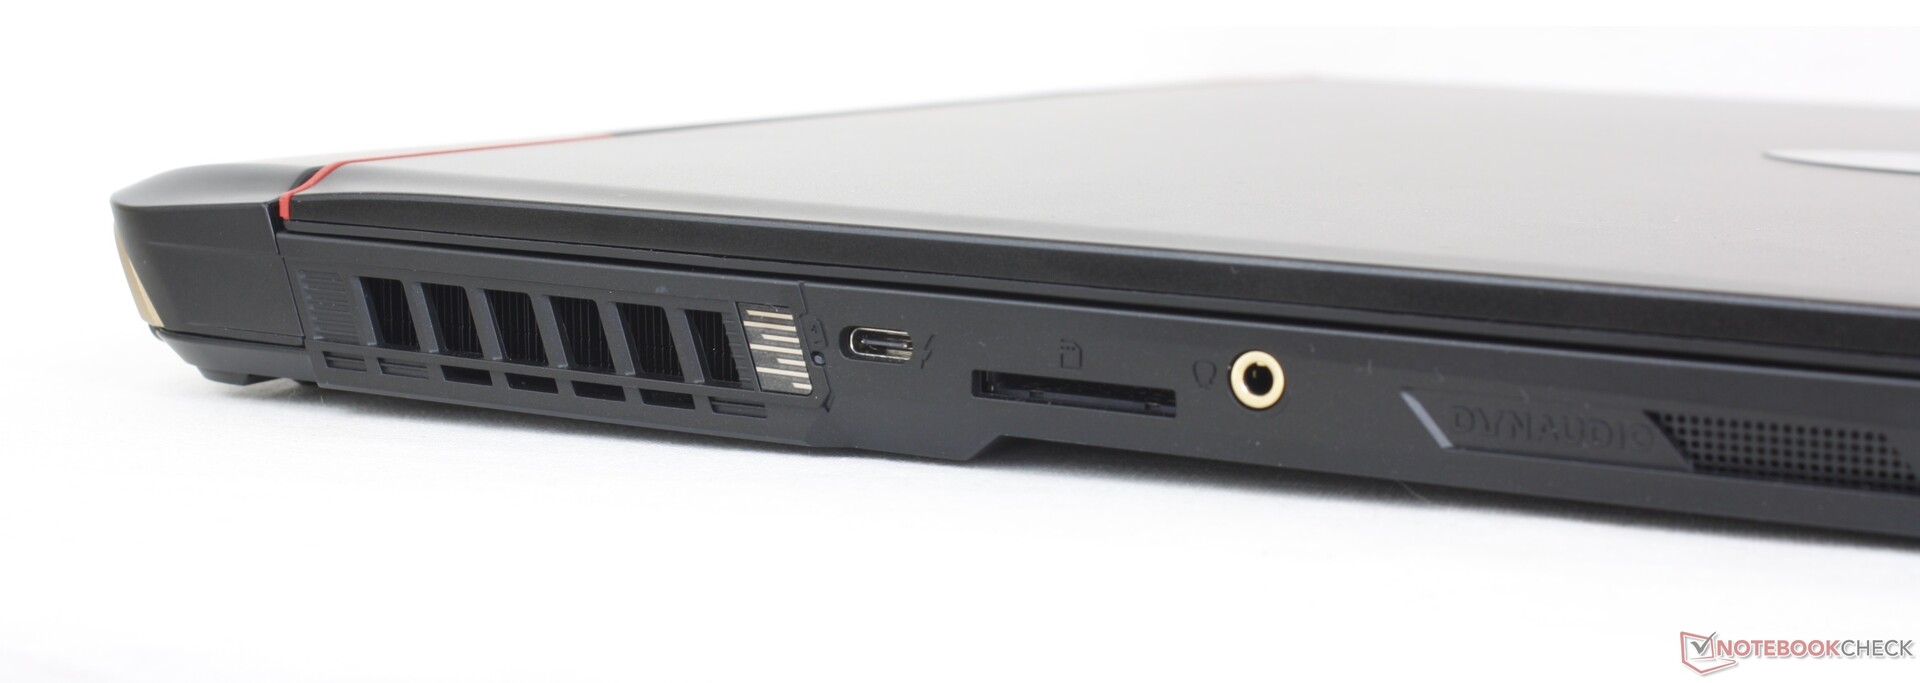
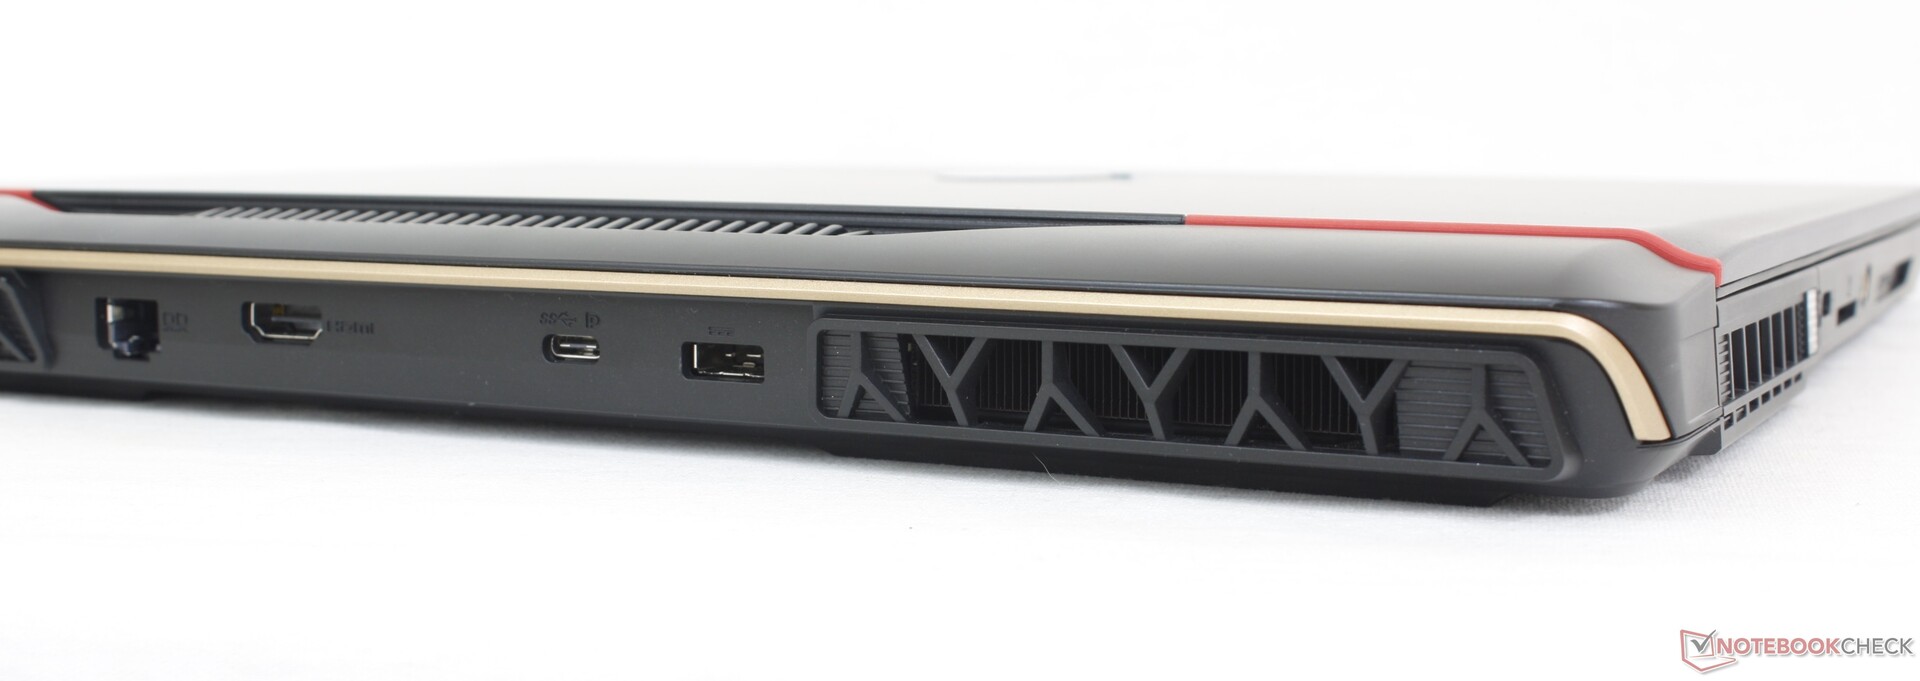
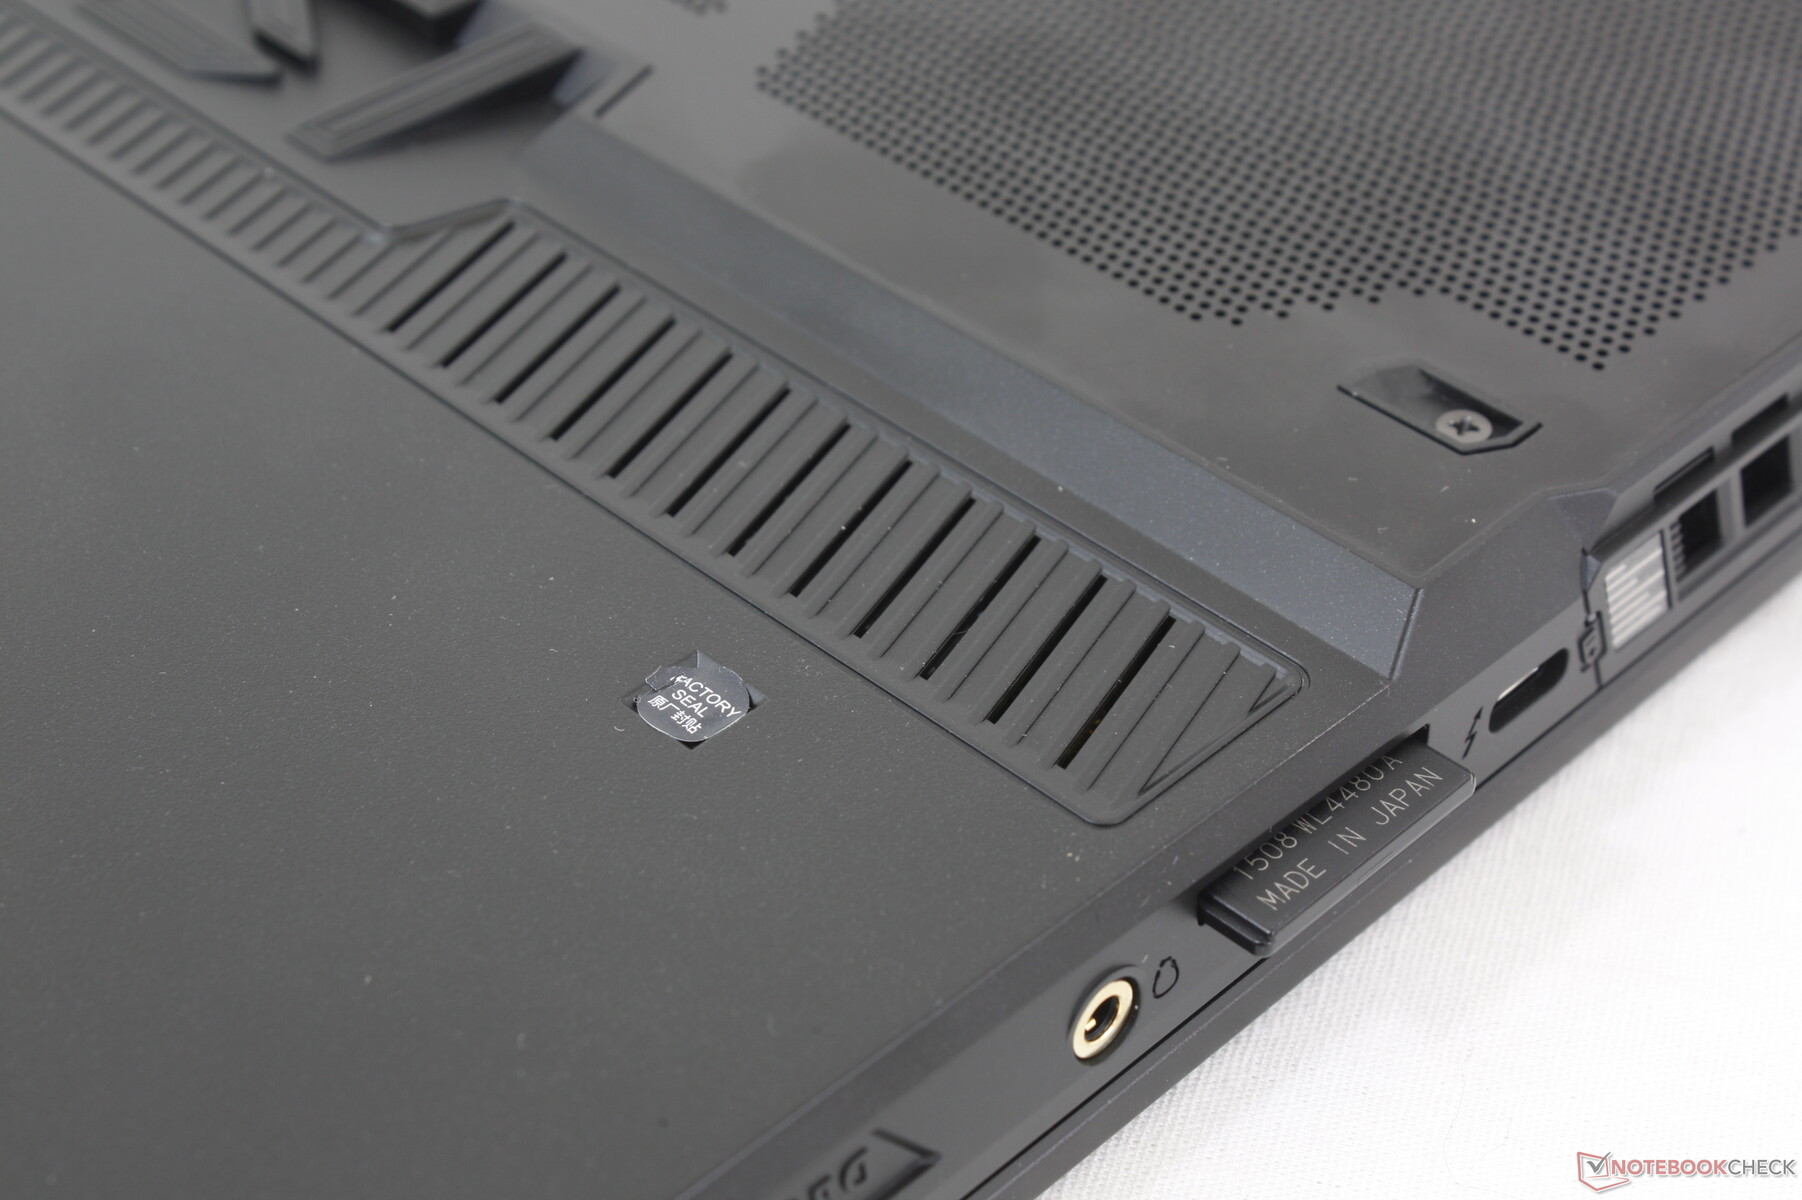
Connectivité
Les options de port ont été légèrement modifiées par rapport à l'année dernière GE67HX. Alors que le GE67HX disposait de 3x ports USB-A et de 2x ports USB-C, le GE68HX est livré avec 2x ports USB-A et 3x ports USB-C. Les trois ports USB-C prennent en charge Displayport, mais seul celui situé sur le bord gauche est compatible avec Thunderbolt 4. Les trois ports USB-C prennent en charge Displayport, mais seul celui situé le long du bord gauche est compatible avec Thunderbolt 4.
Curieusement, MSI a choisi d'abandonner le verrou Kensington sur le design de cette année. Il n'y a pas non plus de mini-DisplayPort, contrairement auAlienware m16 R1.
Lecteur de carte SD
Le lecteur de carte SD intégré est un peu lent pour ce qui est censé être un modèle de jeu de milieu de gamme supérieur. Le transfert de 1 Go de photos depuis notre carte de test UHS-II vers le bureau prend un peu plus de 12 secondes, alors que le même test sur la carte SD de l Alienware m16 R1 serait deux fois plus rapide.
| SD Card Reader | |
| average JPG Copy Test (av. of 3 runs) | |
| Alienware m16 R1 AMD (Toshiba Exceria Pro SDXC 64 GB UHS-II) | |
| Asus ROG Zephyrus M16 GU604VY-NM042X | |
| Lenovo Legion Slim 7i 16 Gen 8 (Toshiba Exceria Pro SDXC 64 GB UHS-II) | |
| MSI GE67 HX 12UGS (Toshiba Exceria Pro SDXC 64 GB UHS-II) | |
| MSI Raider GE68HX 13VF (Toshiba Exceria Pro SDXC 64 GB UHS-II) | |
| maximum AS SSD Seq Read Test (1GB) | |
| Alienware m16 R1 AMD (Toshiba Exceria Pro SDXC 64 GB UHS-II) | |
| Asus ROG Zephyrus M16 GU604VY-NM042X | |
| Lenovo Legion Slim 7i 16 Gen 8 (Toshiba Exceria Pro SDXC 64 GB UHS-II) | |
| MSI Raider GE68HX 13VF (Toshiba Exceria Pro SDXC 64 GB UHS-II) | |
| MSI GE67 HX 12UGS (Toshiba Exceria Pro SDXC 64 GB UHS-II) | |
Communication
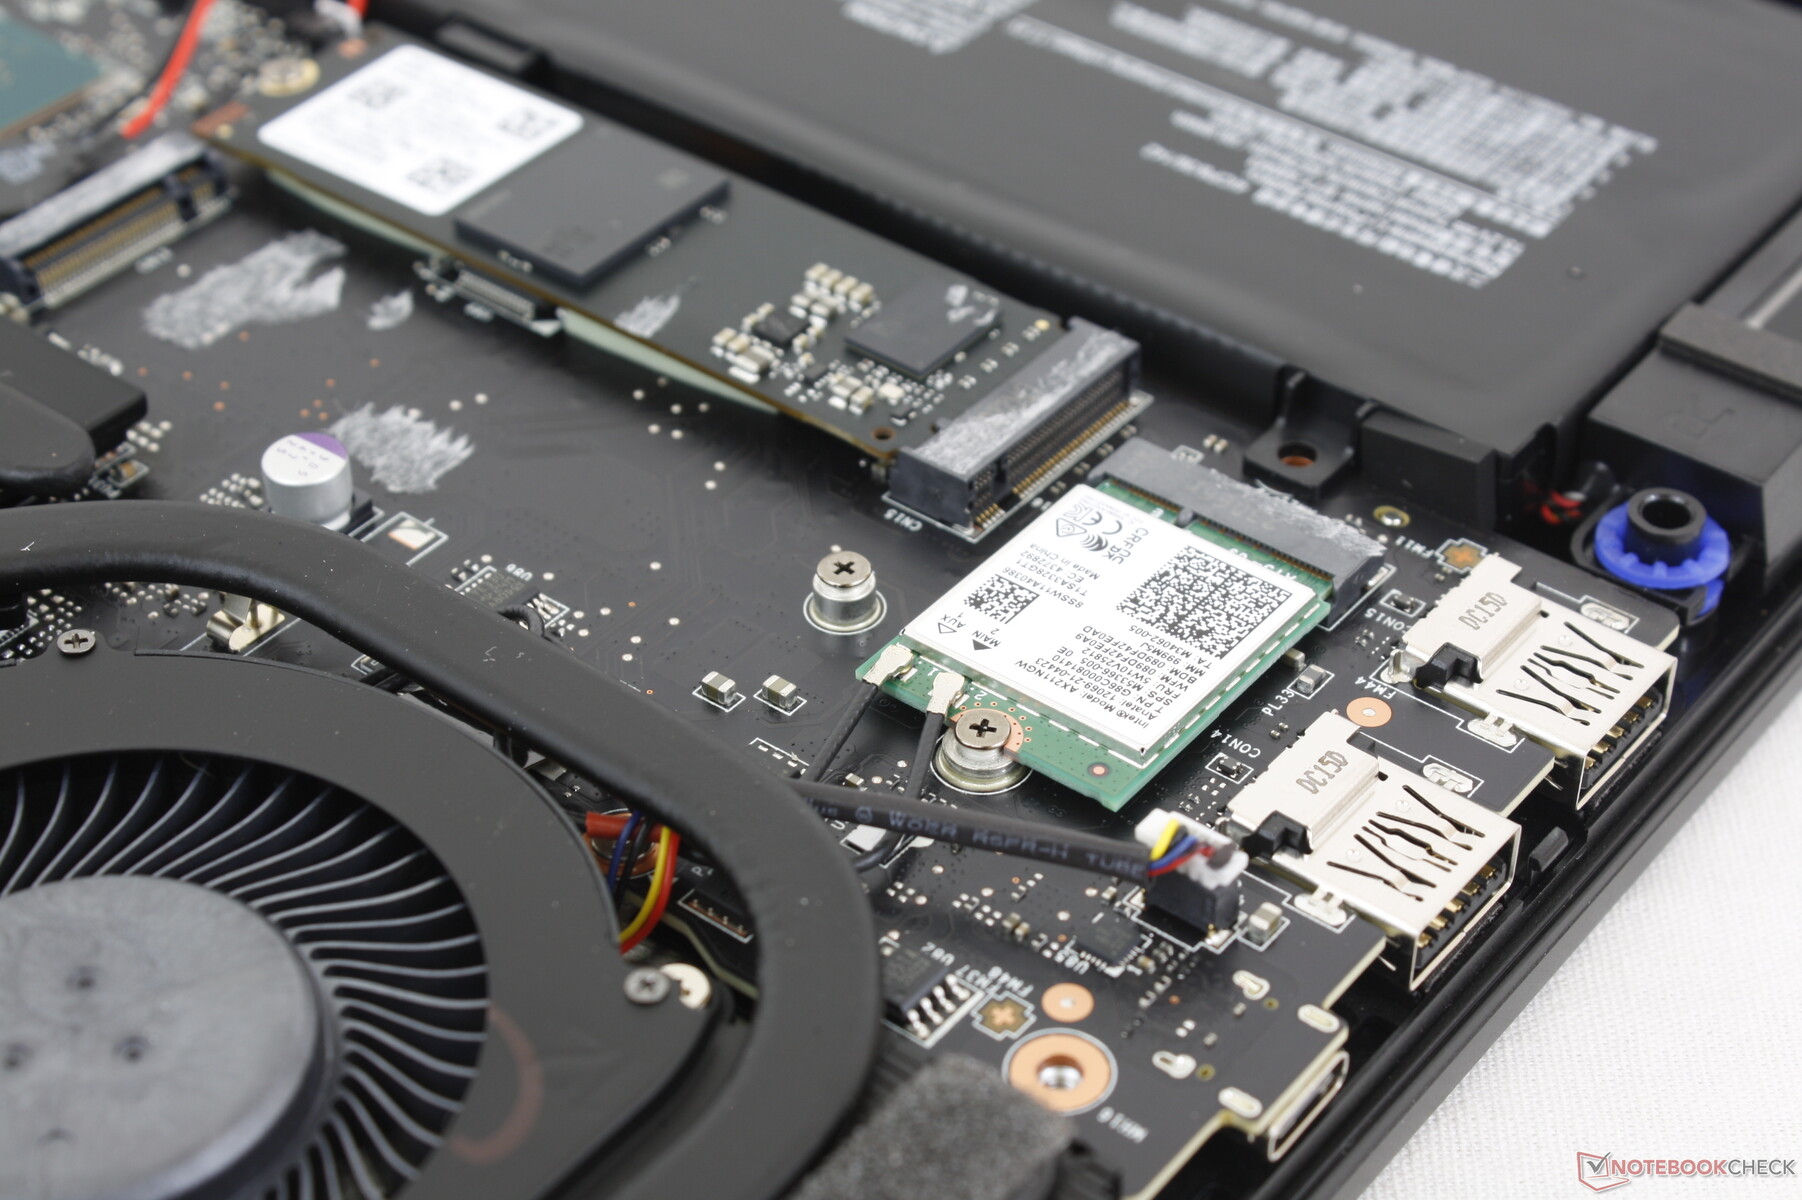
Un Intel AX211 est livré en standard pour le Wi-Fi 6E et le Bluetooth 5.3. Nous n'avons rencontré aucun problème de connectivité lorsque nous l'avons couplé à notre réseau de test AXE11000 6 GHz.
| Networking | |
| iperf3 transmit AXE11000 | |
| Alienware m16 R1 AMD | |
| MSI Raider GE68HX 13VF | |
| HP Omen 16-xf0376ng | |
| Lenovo Legion Slim 7i 16 Gen 8 | |
| iperf3 receive AXE11000 | |
| HP Omen 16-xf0376ng | |
| Alienware m16 R1 AMD | |
| Lenovo Legion Slim 7i 16 Gen 8 | |
| MSI Raider GE68HX 13VF | |
| iperf3 transmit AXE11000 6GHz | |
| Alienware m16 R1 AMD | |
| Asus ROG Zephyrus M16 GU604VY-NM042X | |
| Lenovo Legion Slim 7i 16 Gen 8 | |
| MSI Raider GE68HX 13VF | |
| MSI GE67 HX 12UGS | |
| iperf3 receive AXE11000 6GHz | |
| Asus ROG Zephyrus M16 GU604VY-NM042X | |
| Alienware m16 R1 AMD | |
| Lenovo Legion Slim 7i 16 Gen 8 | |
| MSI Raider GE68HX 13VF | |
| MSI GE67 HX 12UGS | |
Webcam
Si la qualité de 2 MP n'a pas changé, la webcam présente quelques différences. L'obturateur, par exemple, est maintenant un curseur physique à côté de l'objectif au lieu d'un interrupteur électronique sur le clavier. Par ailleurs, un capteur IR est désormais intégré pour la prise en charge de Hello.


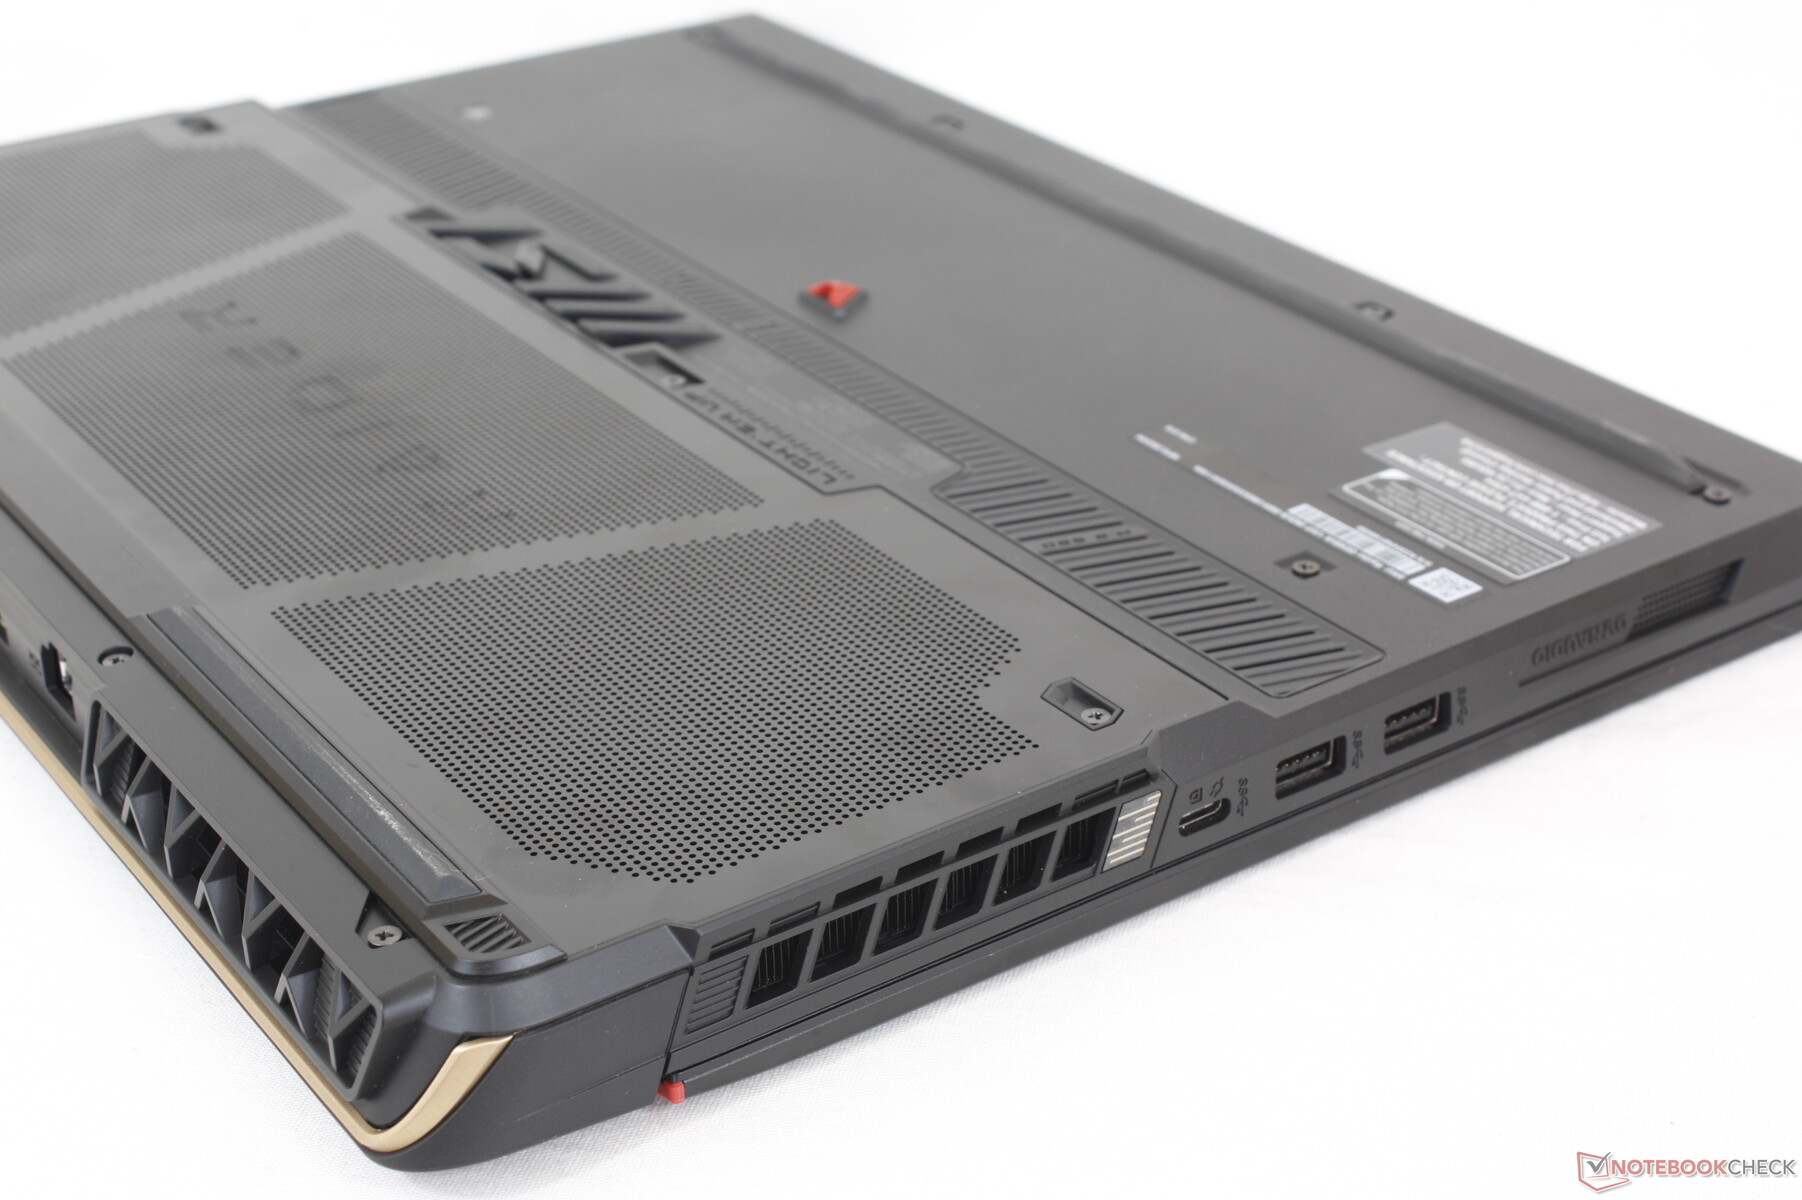
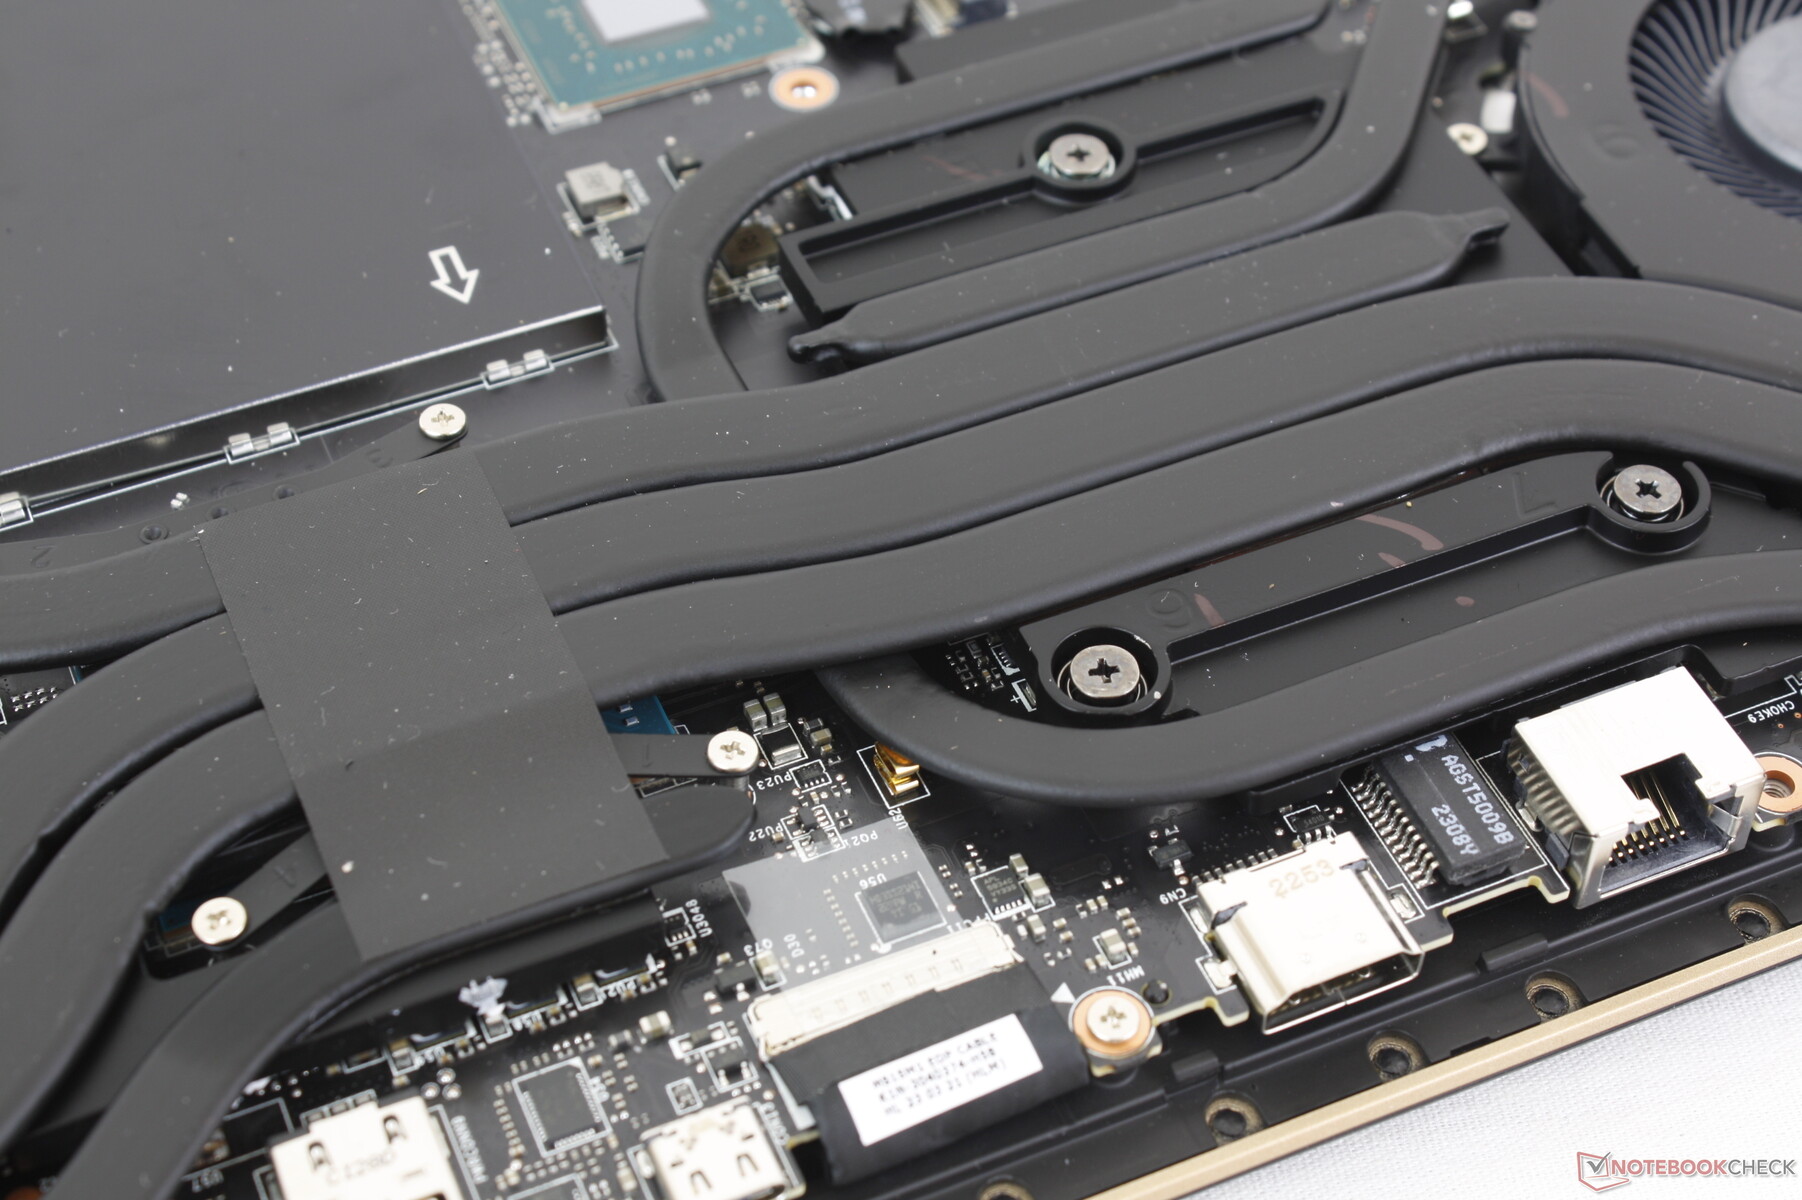
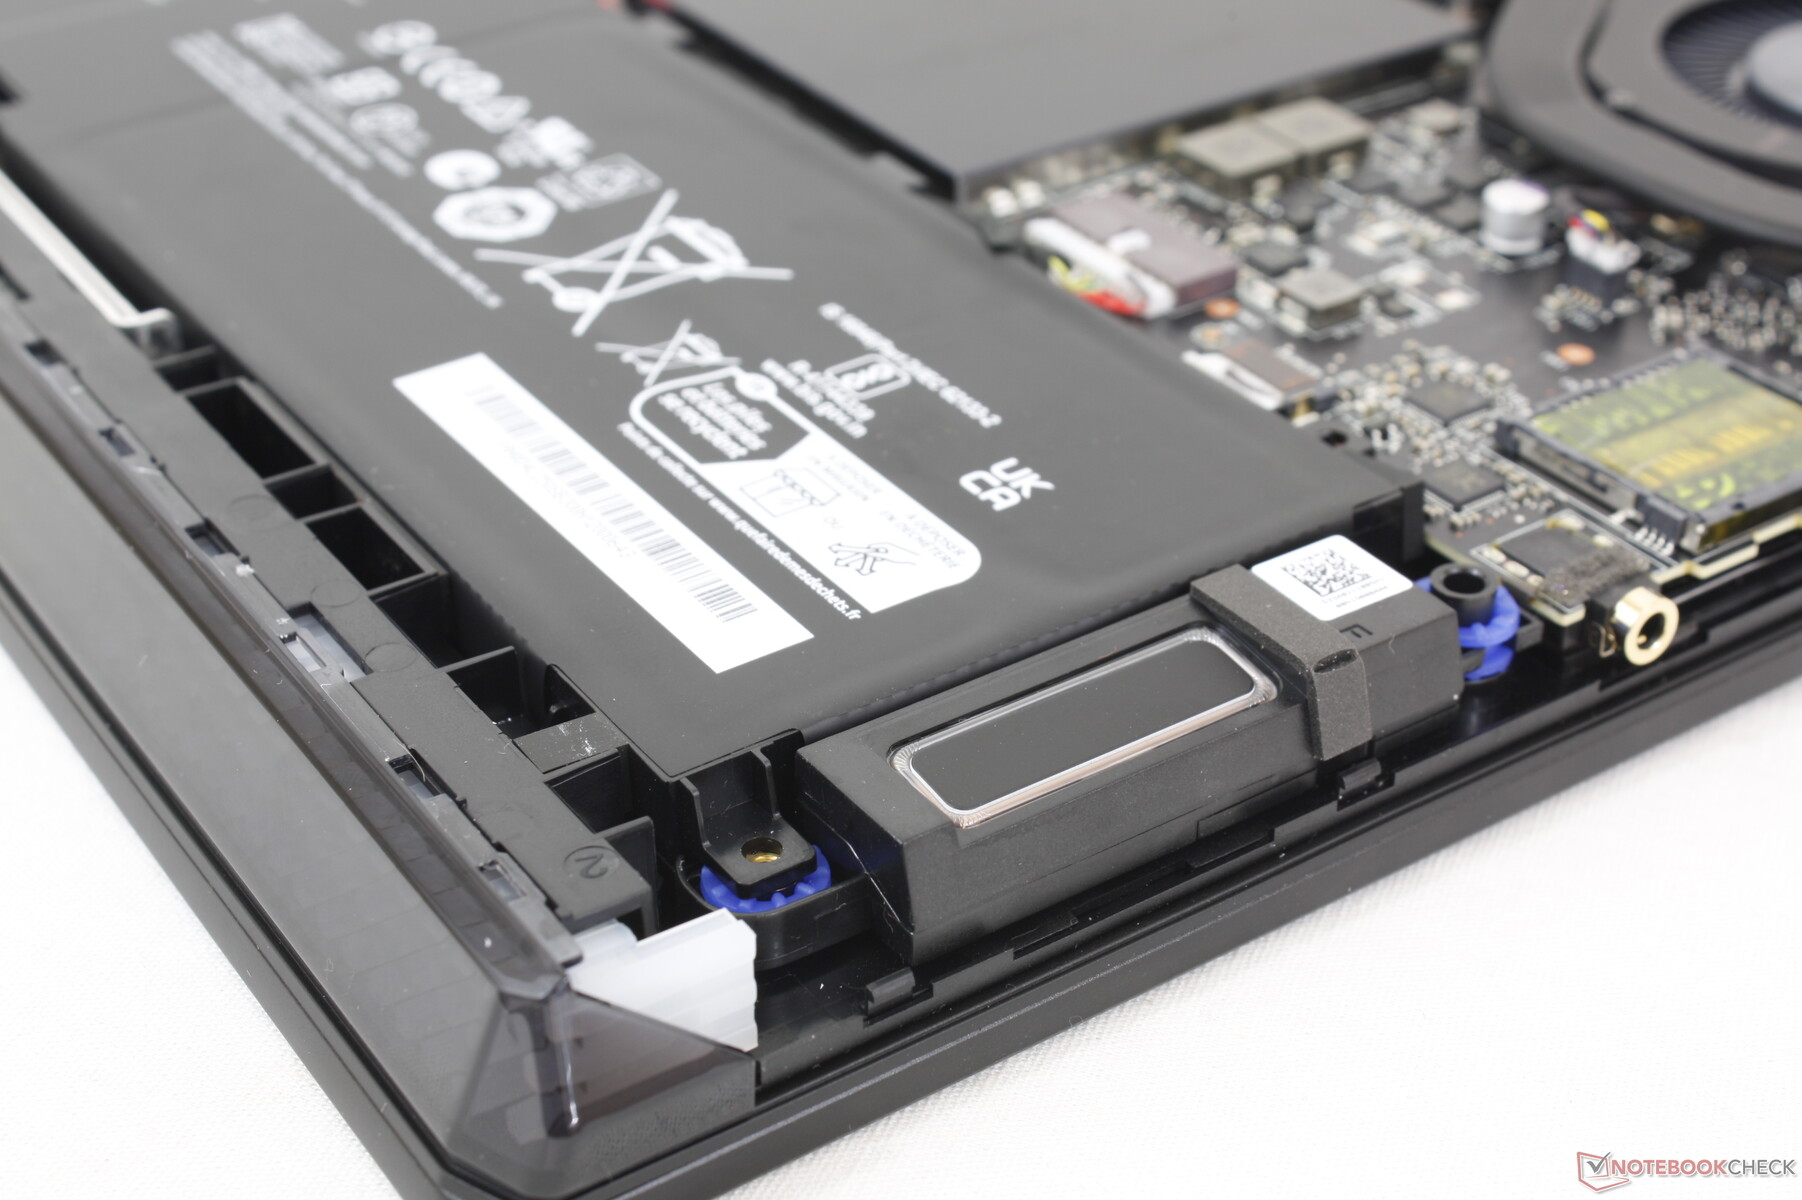
Maintenance
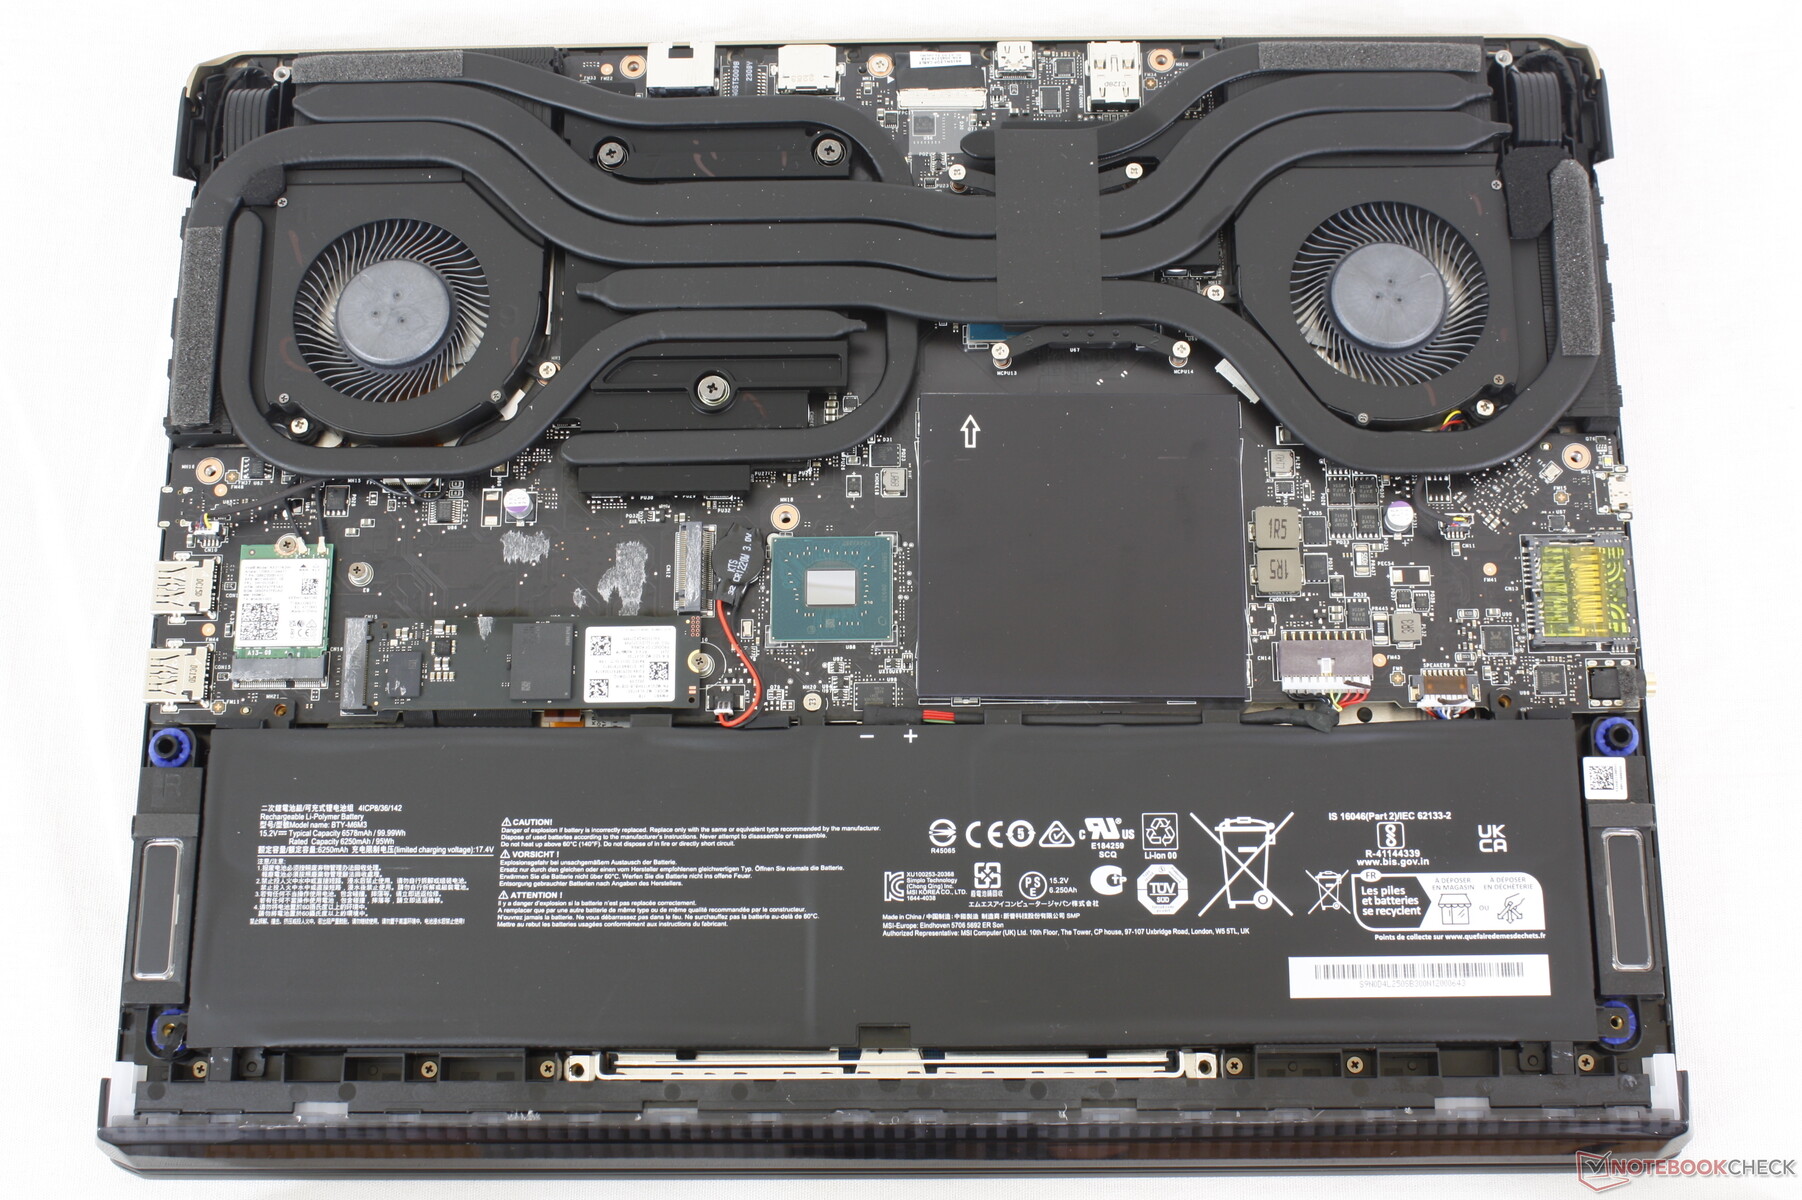
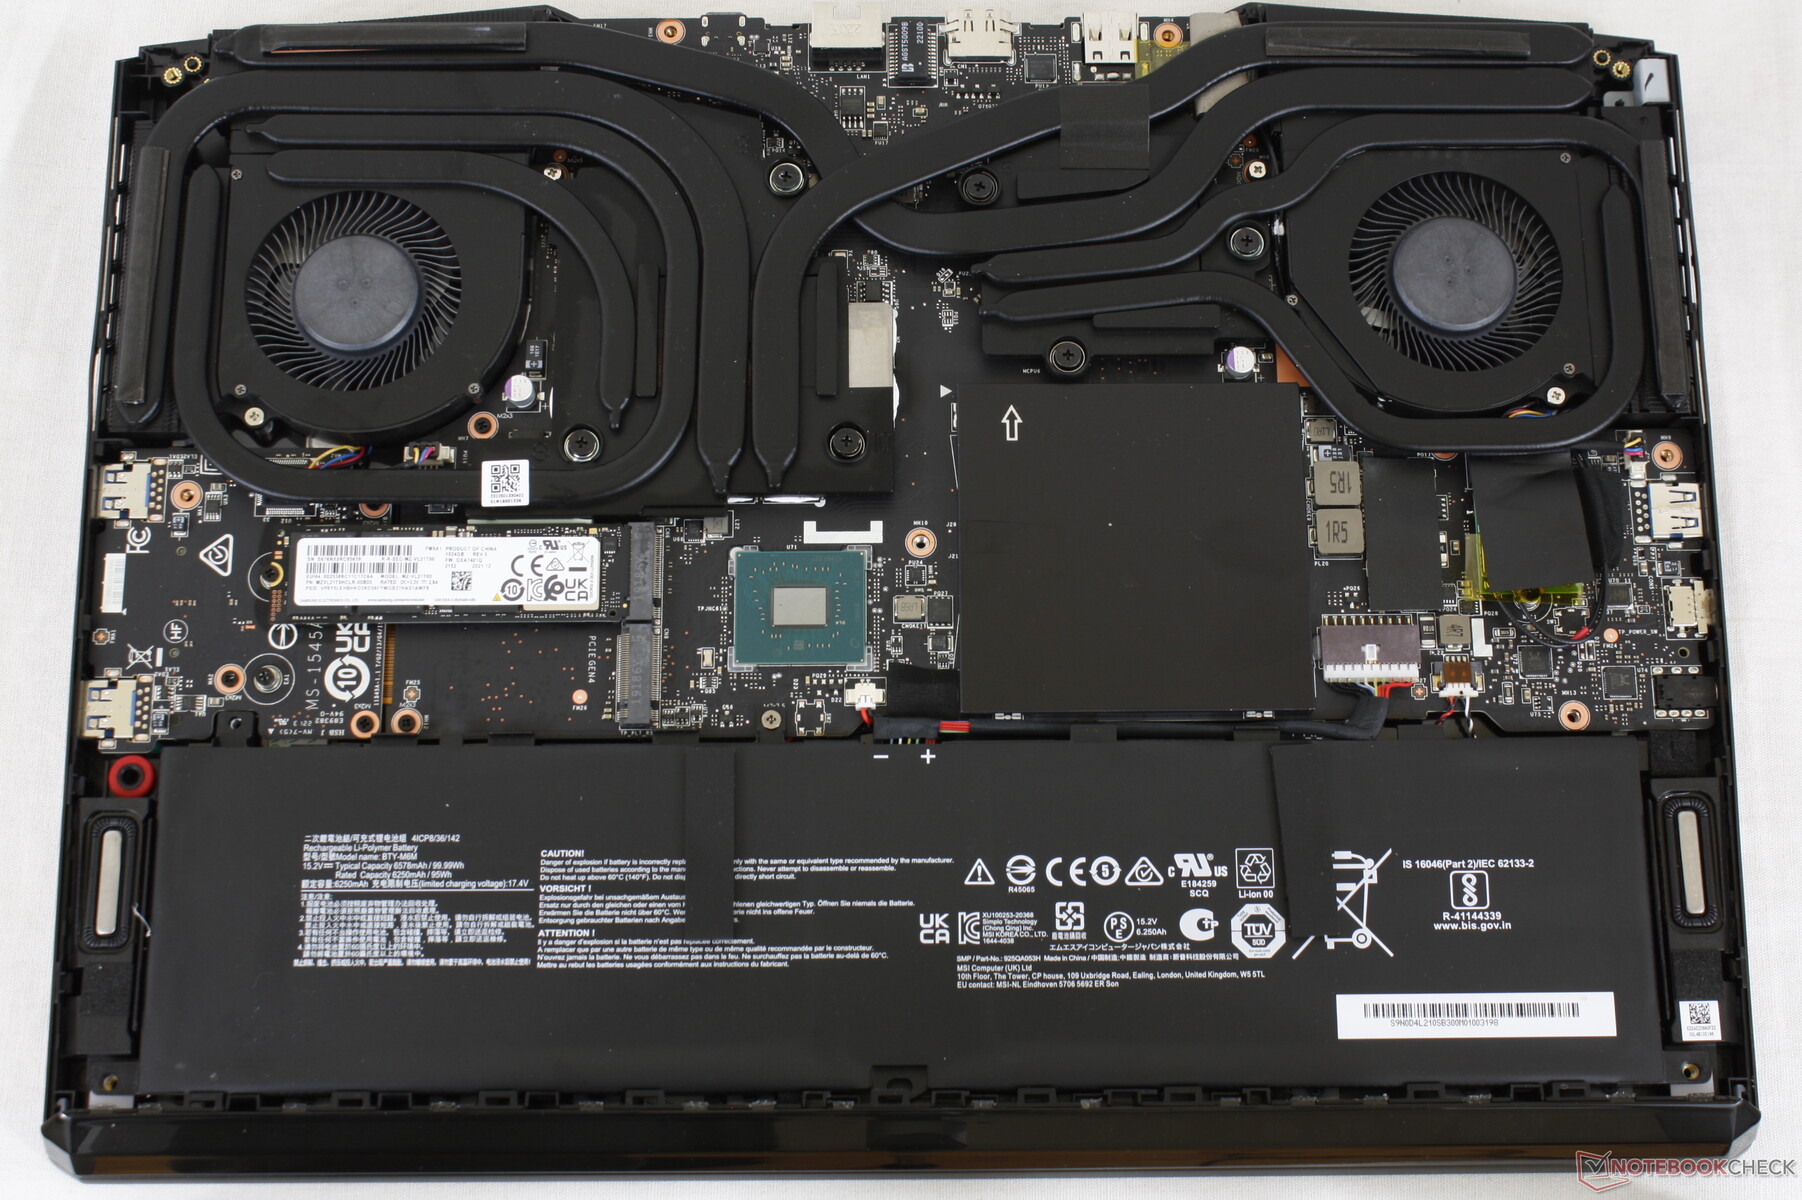
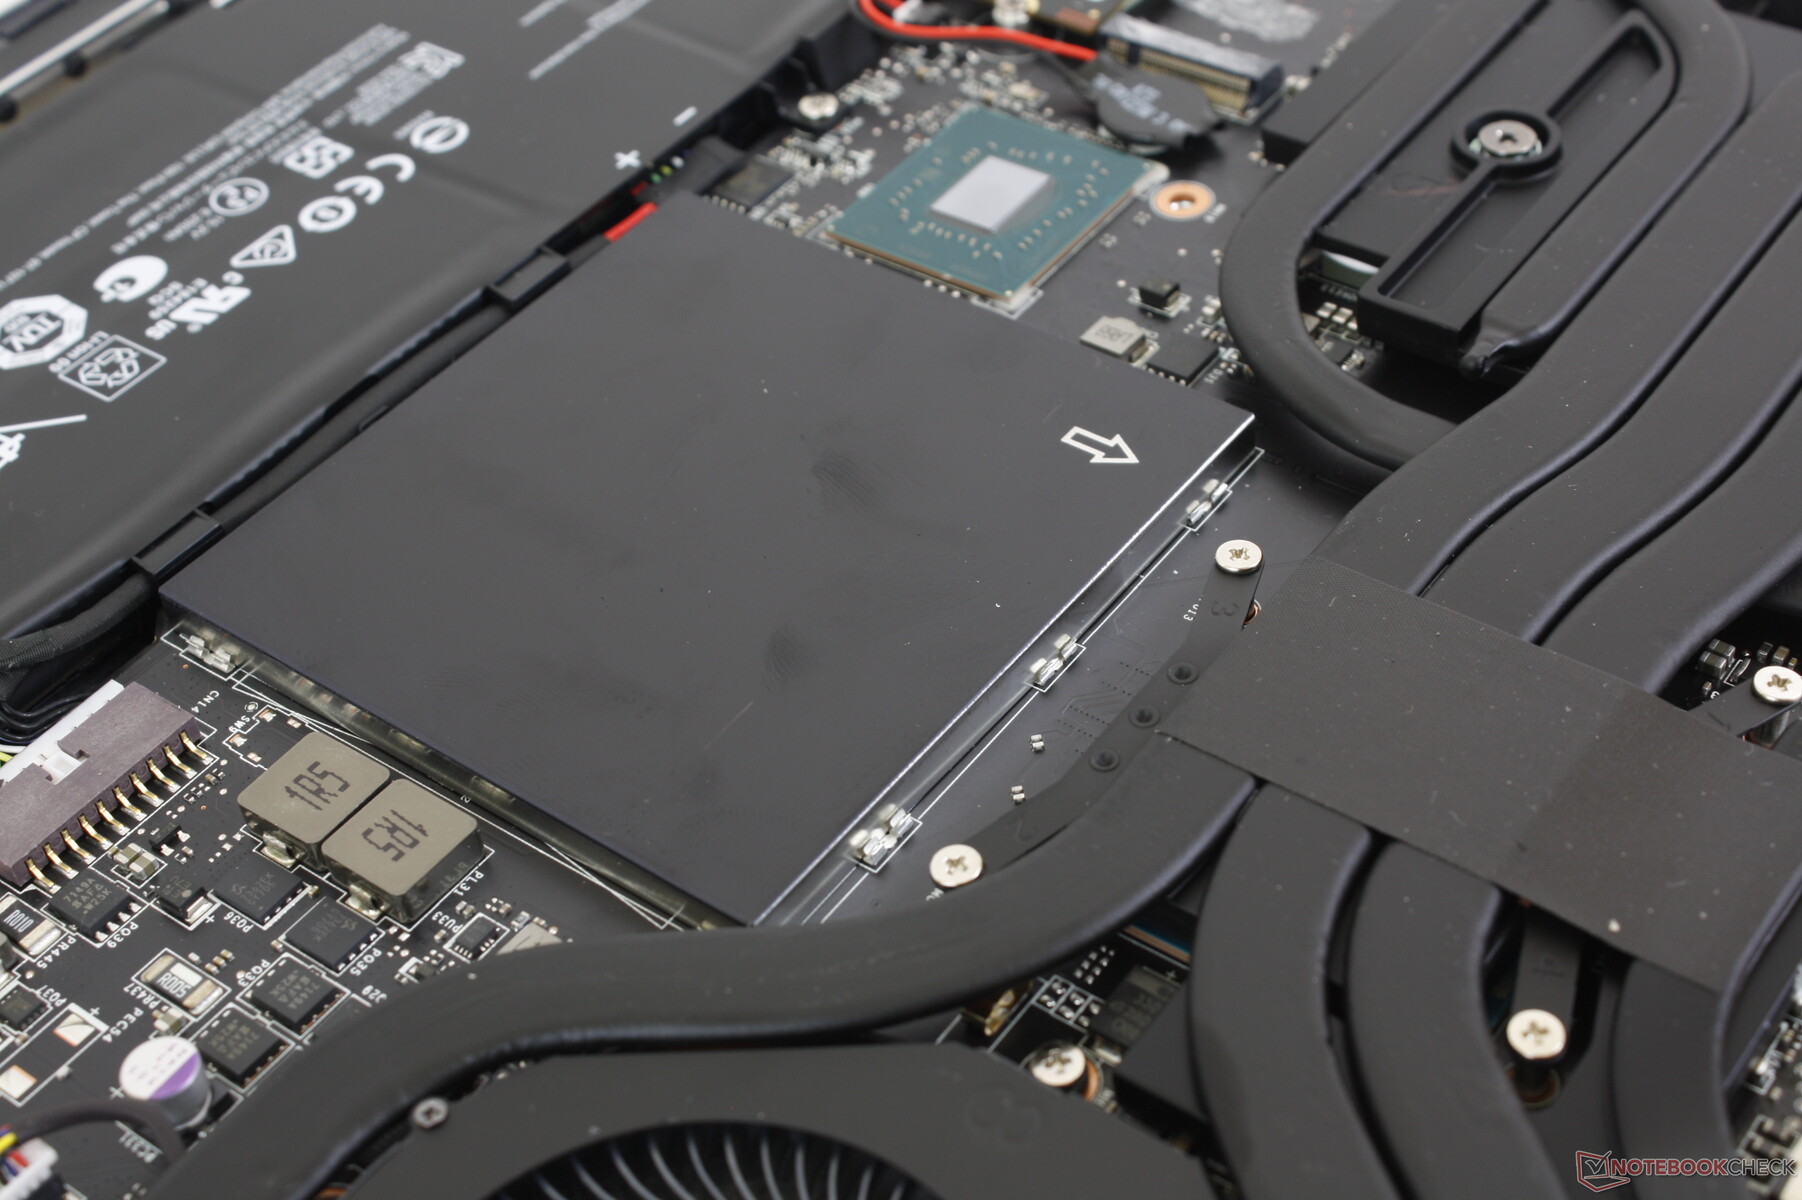
Malheureusement, les ordinateurs portables MSI sont de plus en plus difficiles à réparer de nos jours. Le panneau inférieur est fixé par 13 vis Phillips, dont l'une se trouve derrière un autocollant autocollant anti-sabotage afin de décourager les utilisateurs finaux d'effectuer des réparations. Le problème principal est que les crochets en plastique le long des bords du panneau sont inclinés et solidement fixés à la base, en particulier à l'arrière. Ces crochets sont difficiles à détacher et encore plus difficiles à réinstaller.
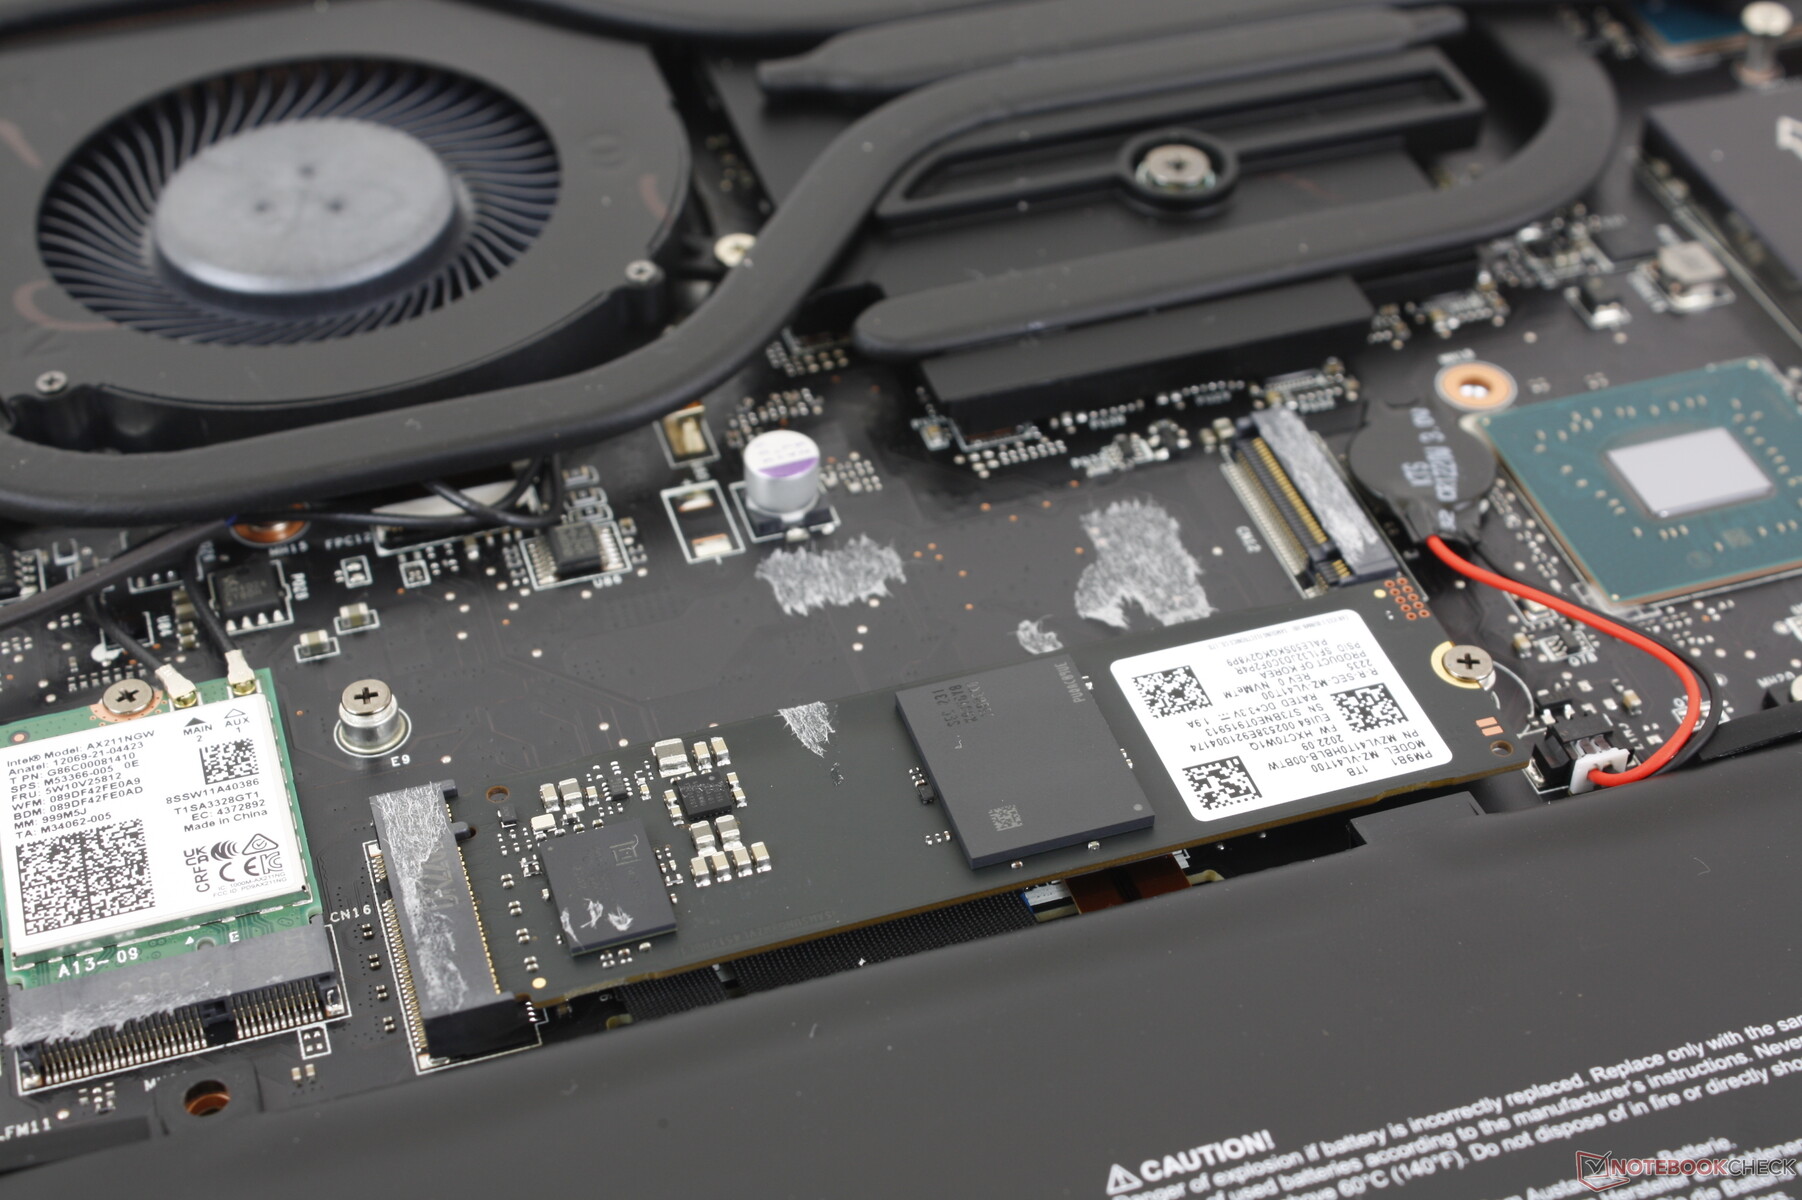
Les utilisateurs ont un accès direct aux deux baies de stockage M.2 2280, aux deux emplacements SODIMM DDR5, au module WLAN et à la batterie une fois à l'intérieur.
Accessoires et garantie
La boîte contient un chiffon de nettoyage en plus de l'adaptateur secteur et de la documentation. Une garantie limitée du fabricant d'un an s'applique si l'appareil est acheté aux États-Unis.
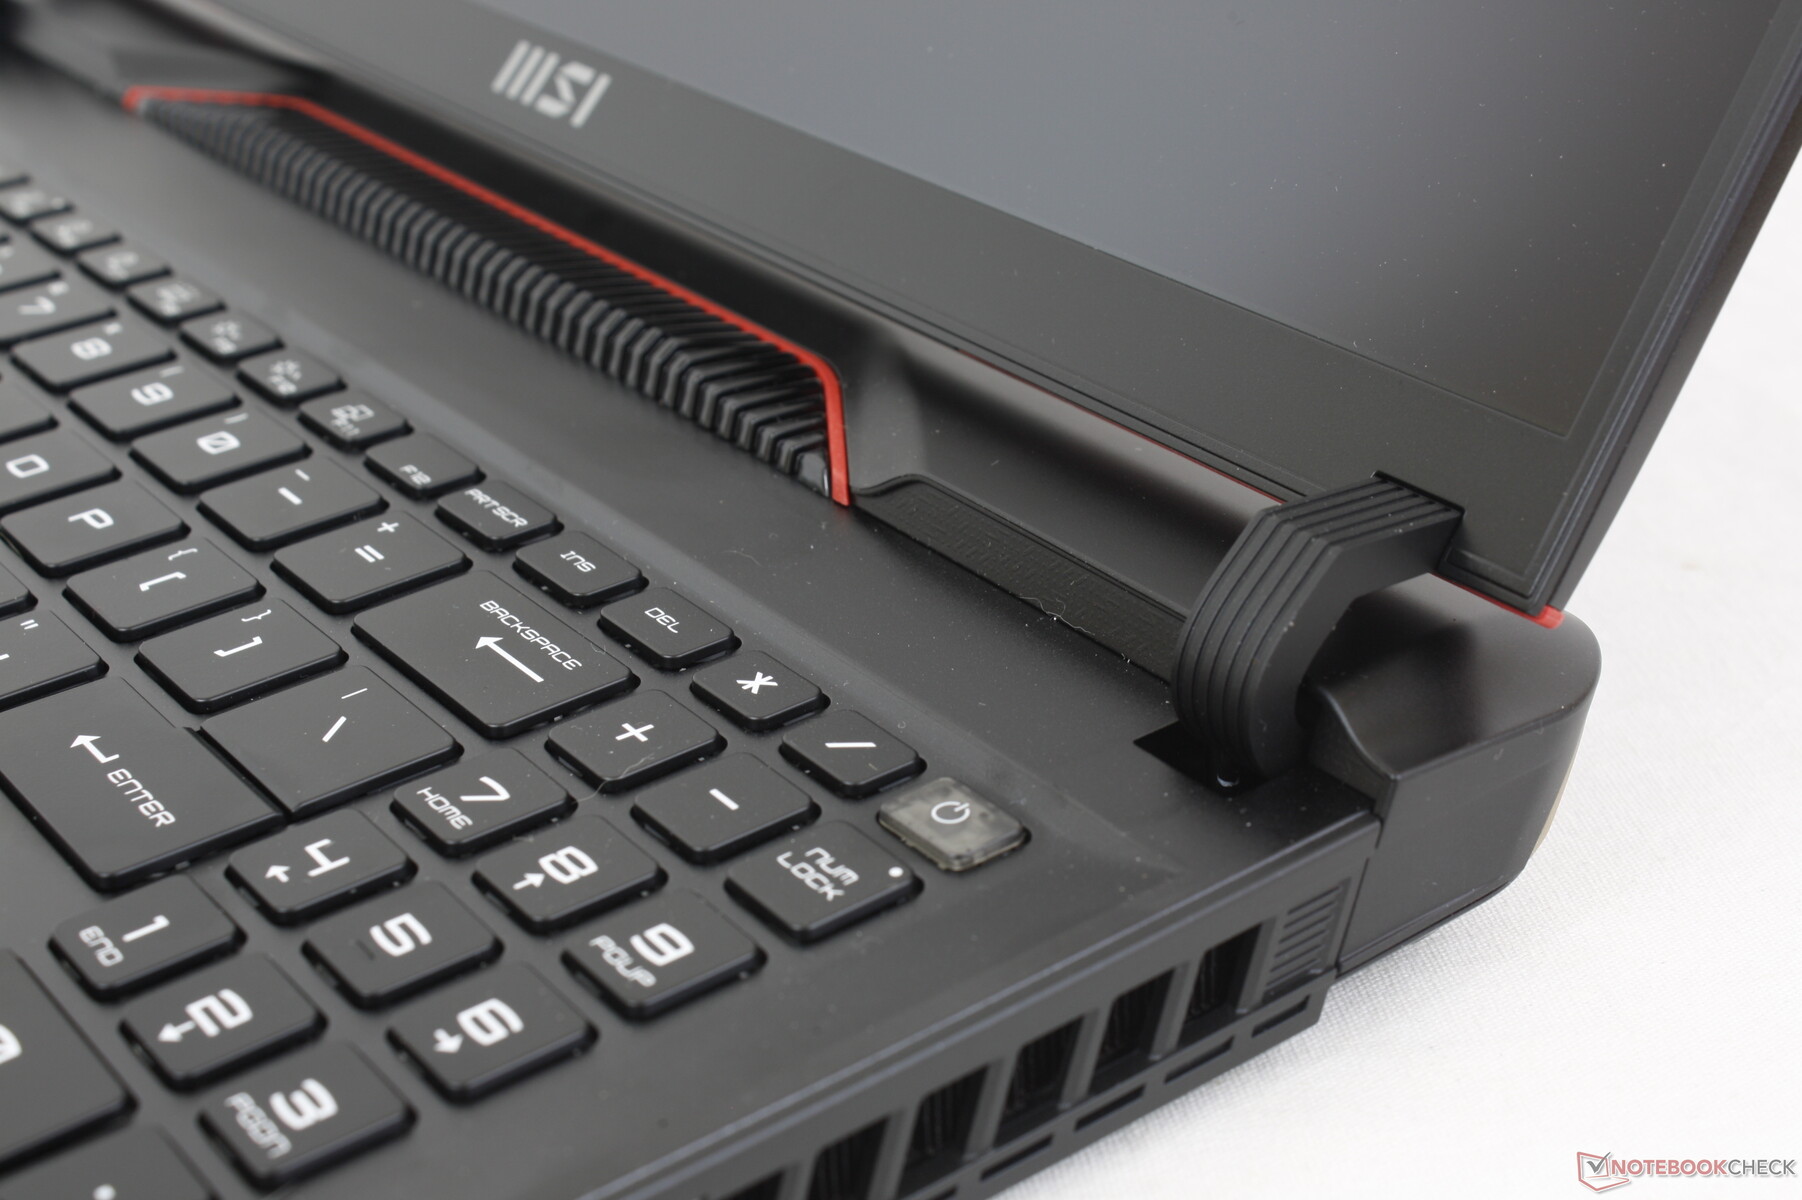
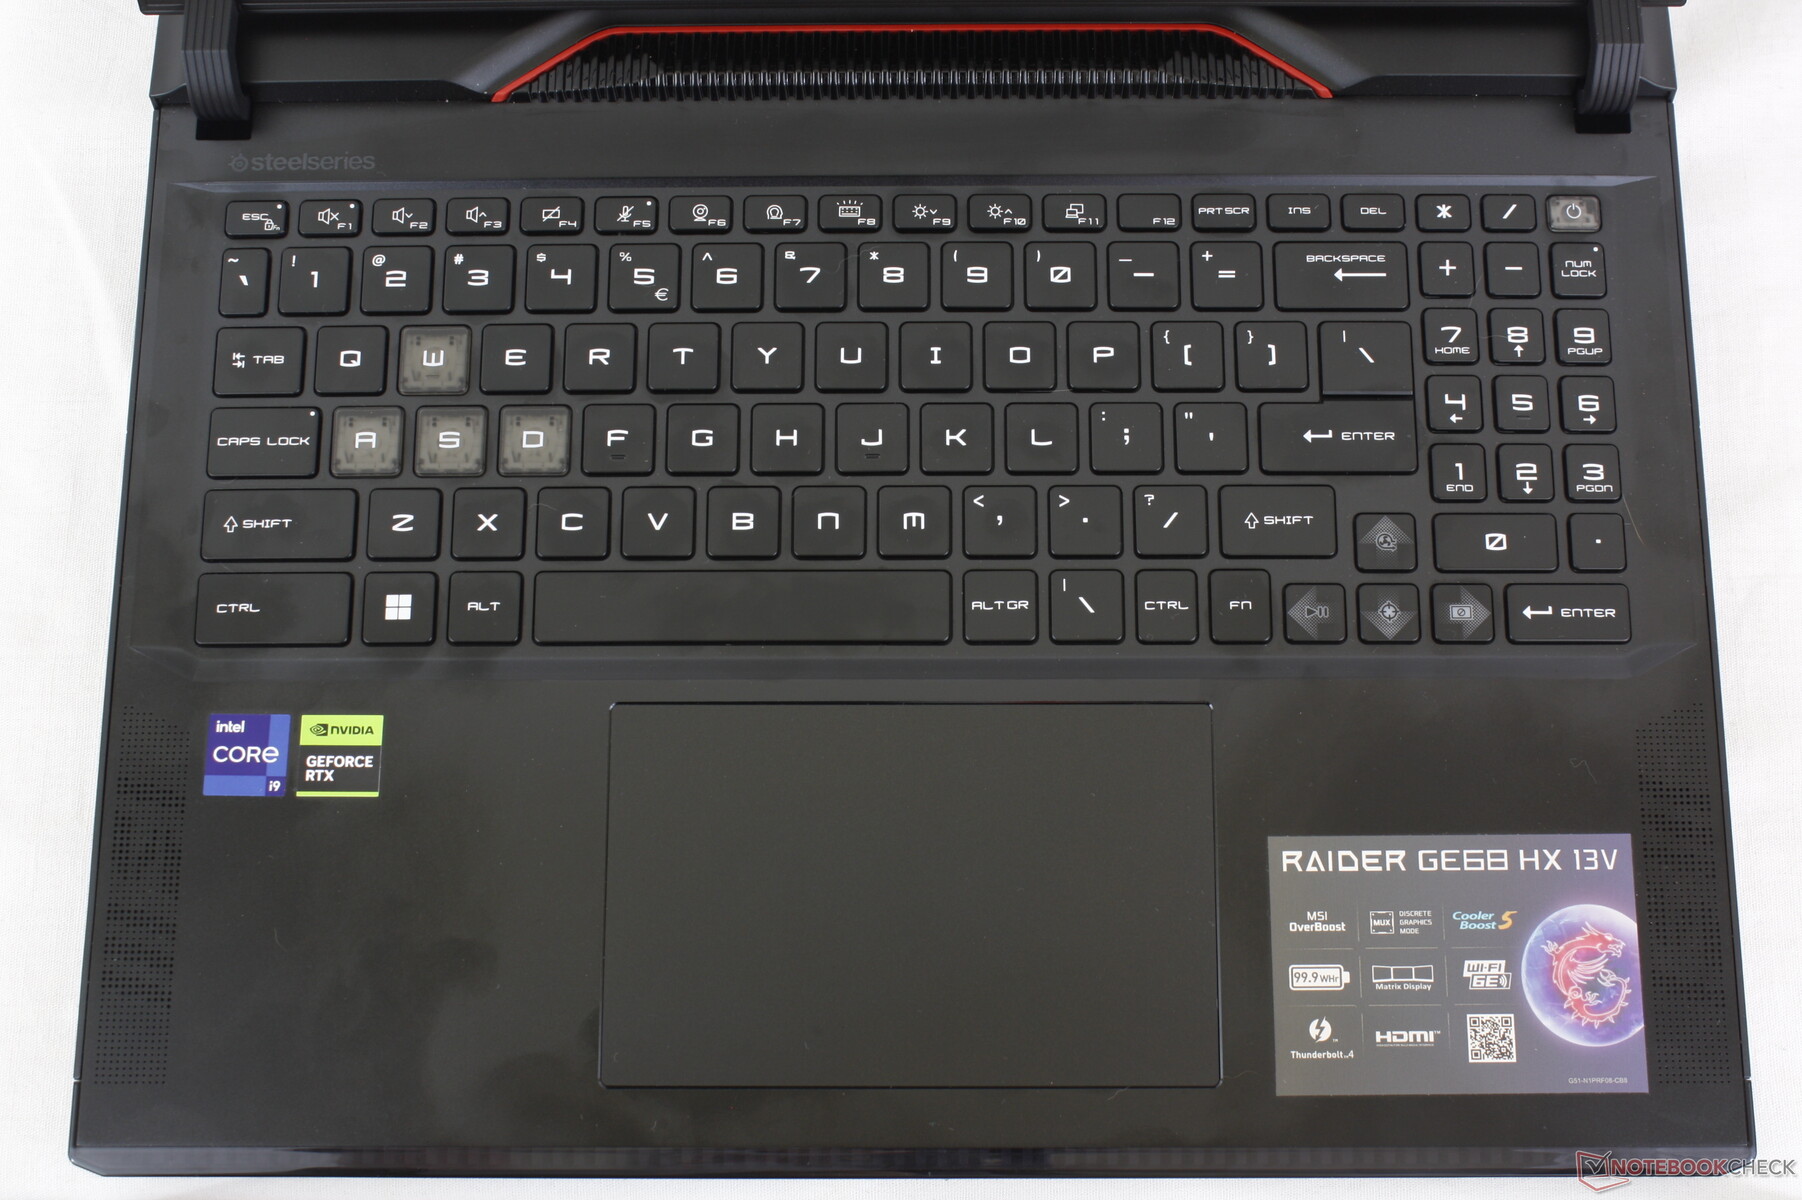
Périphériques d'entrée - Clickpad plus grand et nouveau Numpad
Clavier
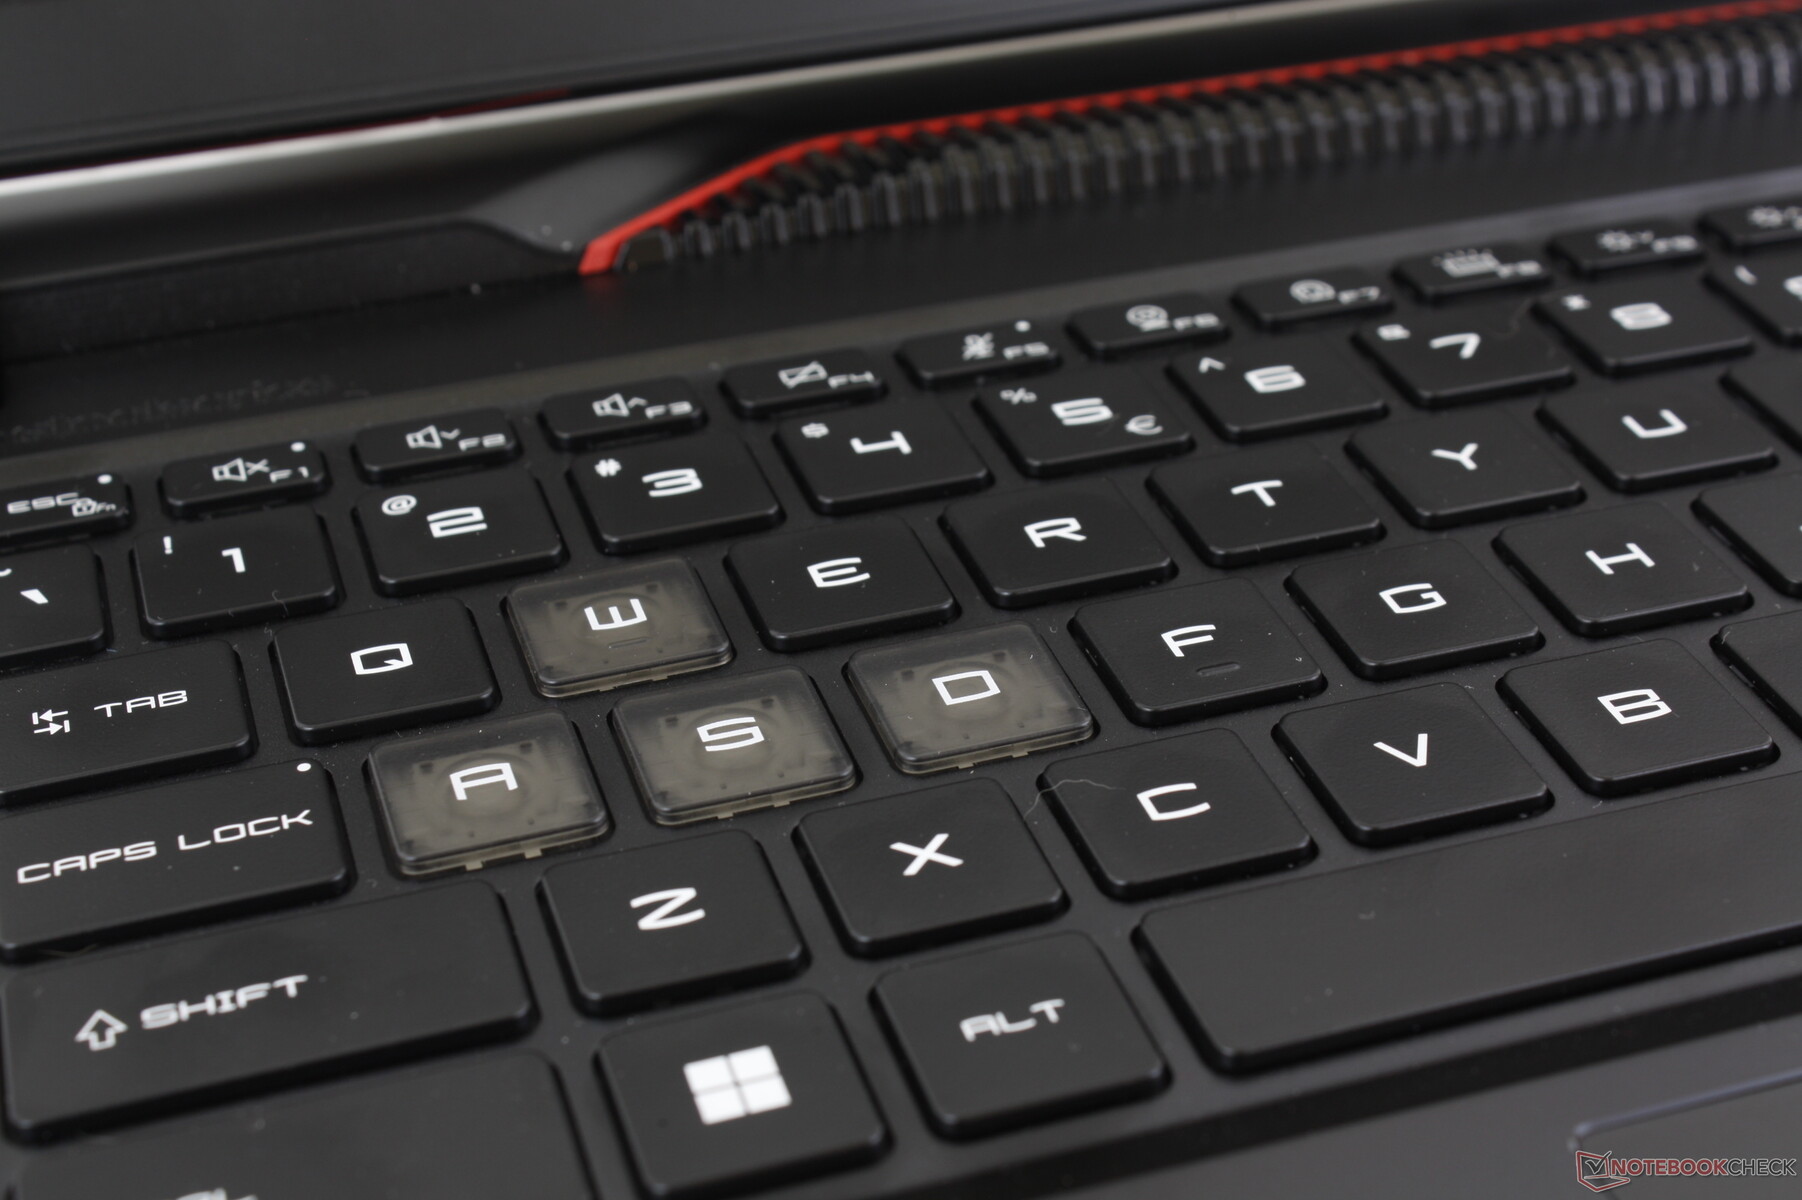
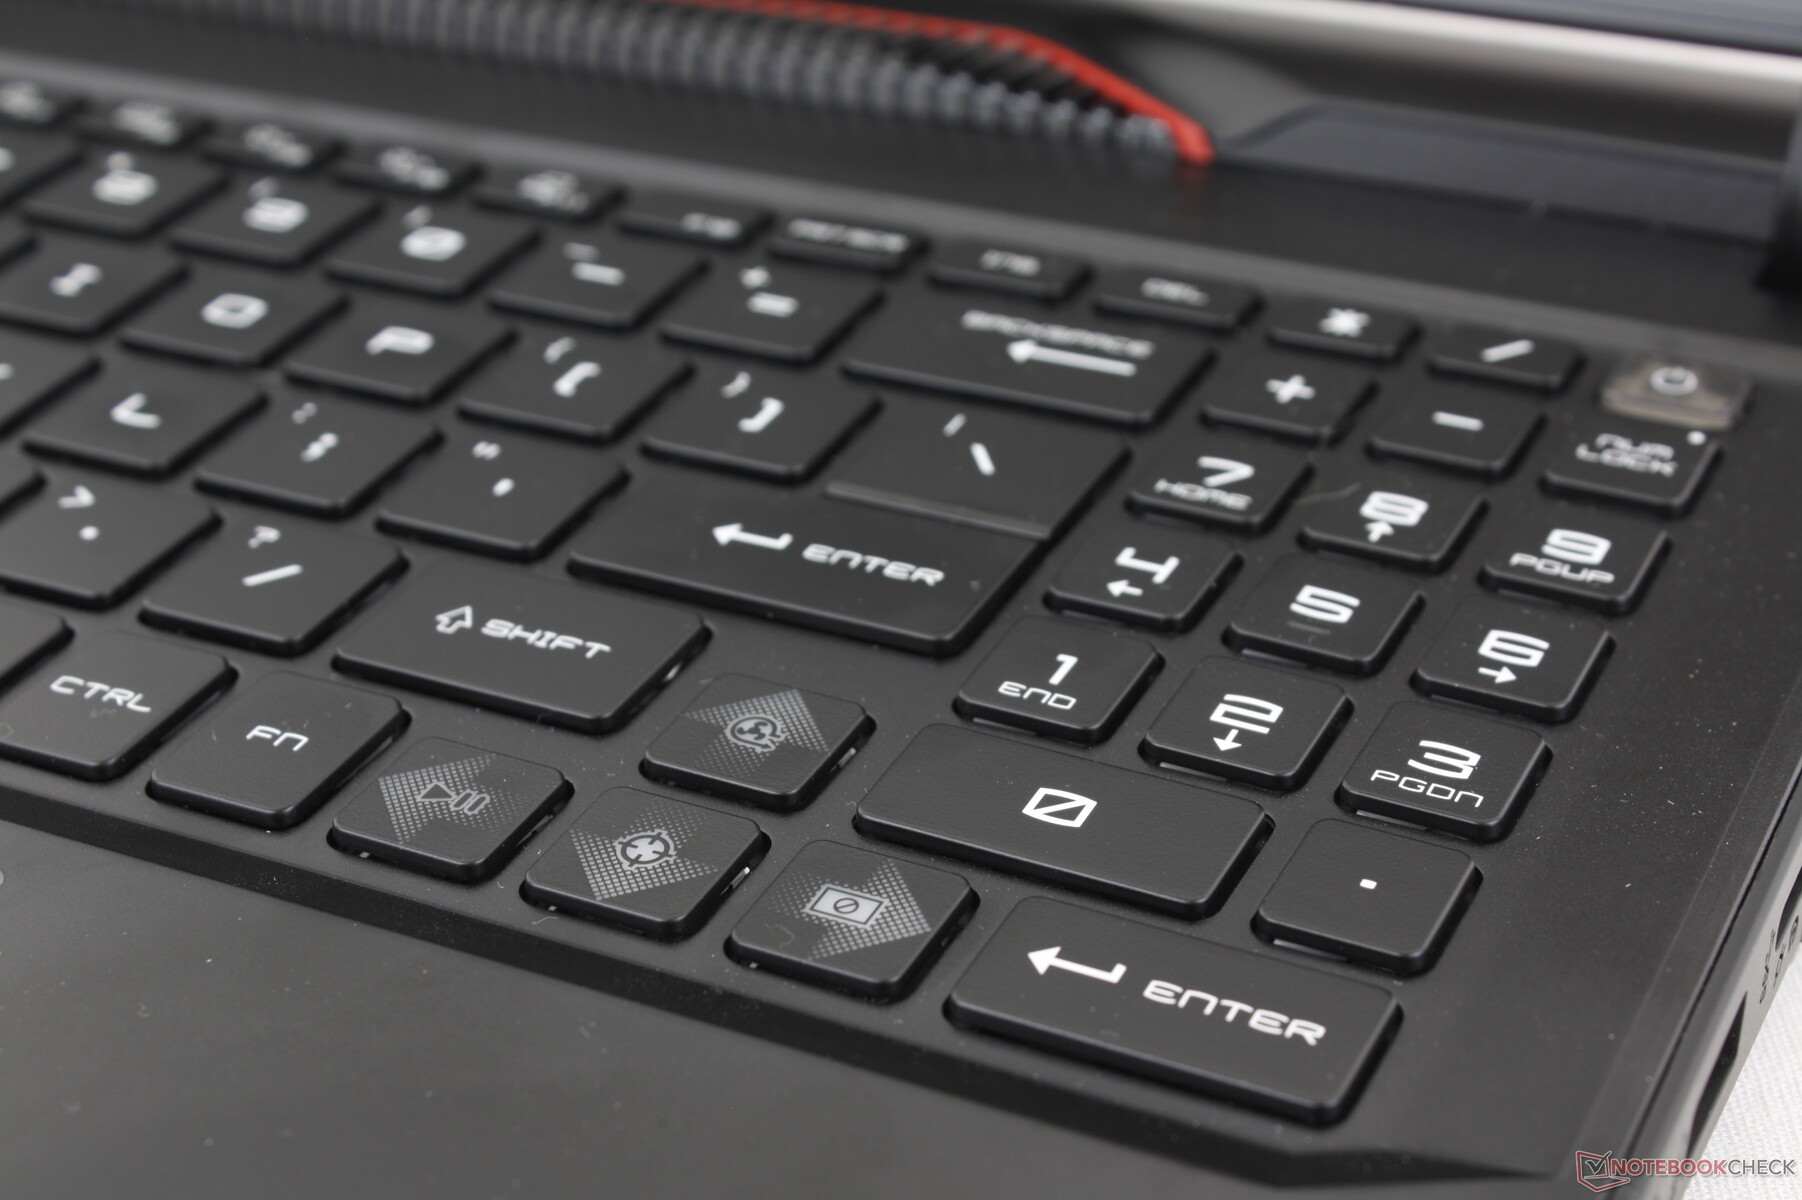
MSI a revu la disposition du clavier par rapport au GE67HX. Il y a maintenant un pavé numérique intégré, tandis que les touches Ctrl et Fn ne sont plus maladroitement serrées l'une contre l'autre. Malheureusement, les touches fléchées ont été réduites pour faire de la place au nouveau pavé numérique.
Le feedback des touches est par ailleurs excellent, avec un feedback ferme et uniforme entre les principales touches QWERTY. Les touches Espace et Entrée, en particulier, sont nettement plus bruyantes pour une sensation plus satisfaisante.
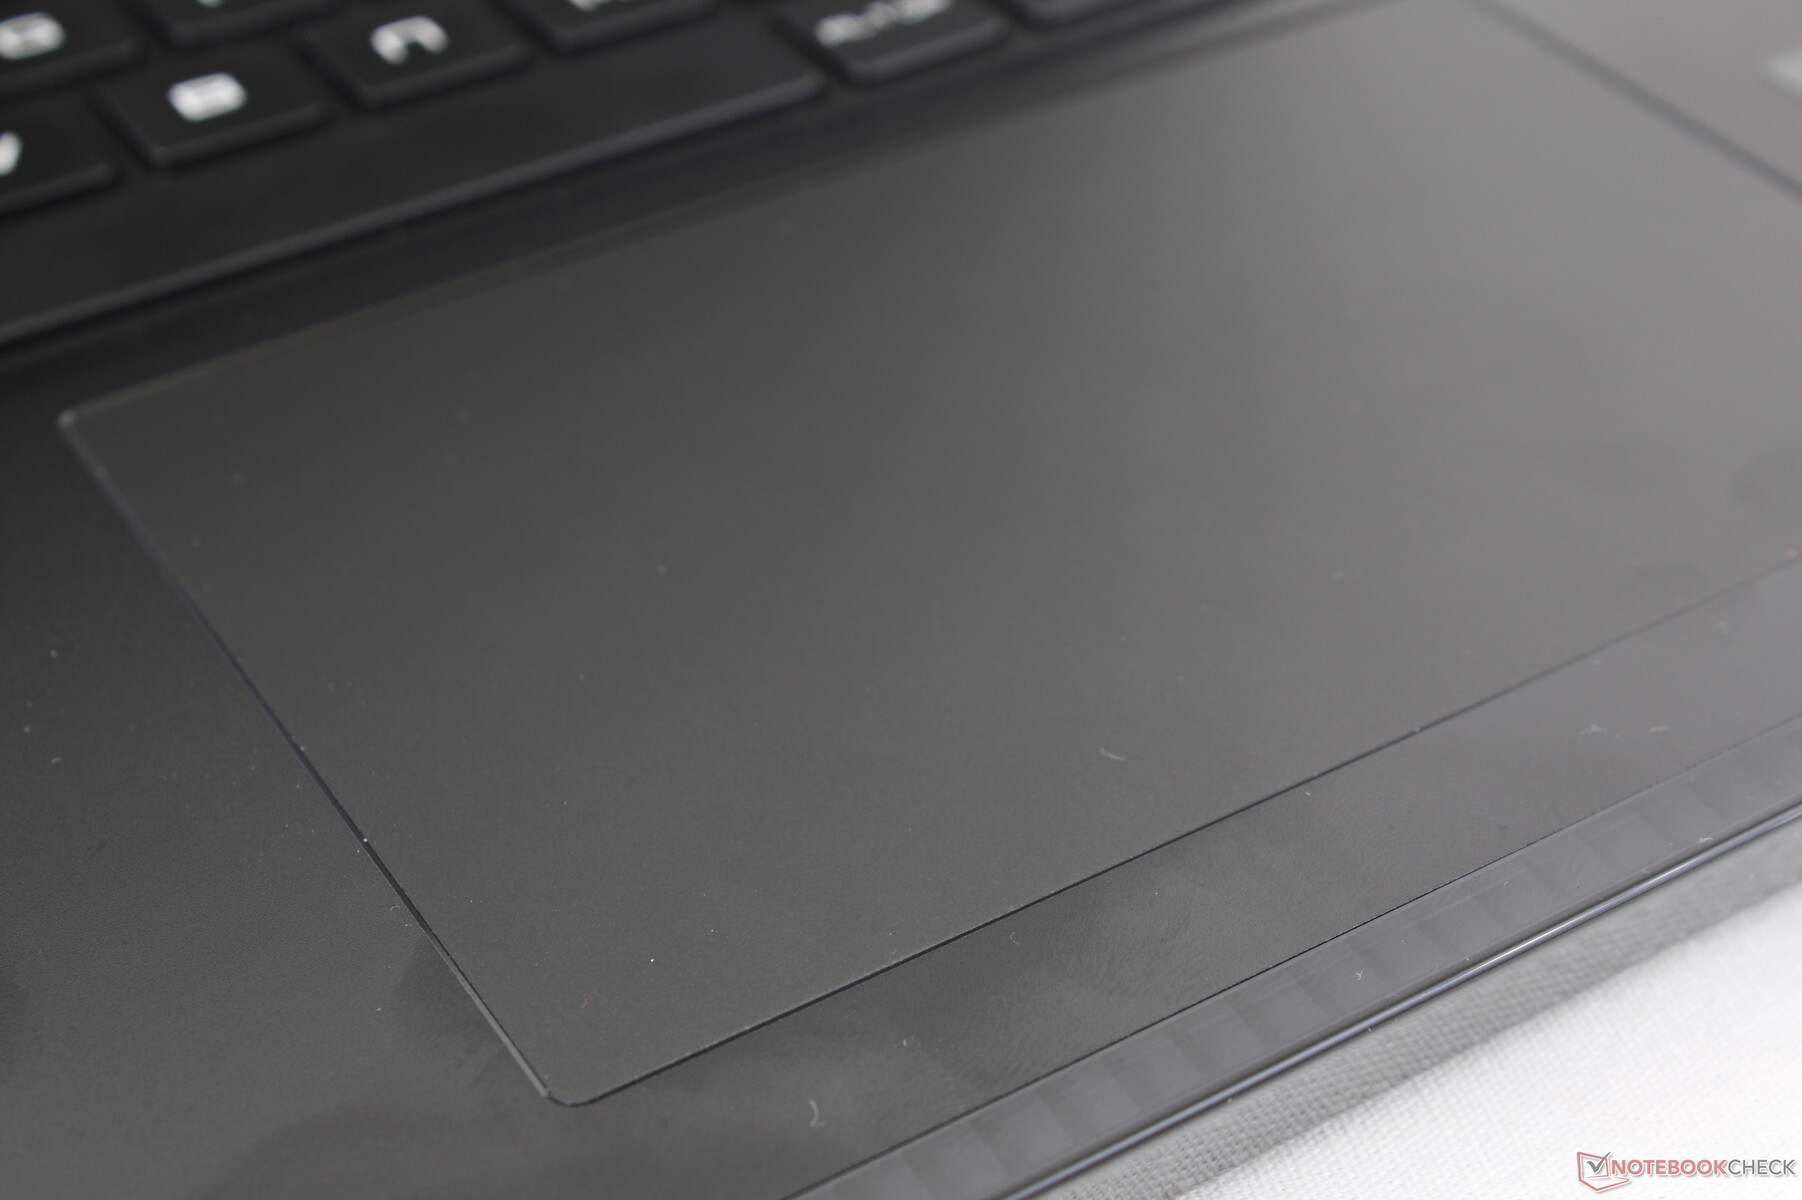
Pavé tactile
La taille du pavé numérique a considérablement augmenté, passant de 10,5 x 6,5 cm sur le GE67HX à 13 x 8,3 cm sur le GE68HX. La glisse est très fluide et réactive, et il n'y a pratiquement pas d'adhérence, même lorsque l'on se déplace à faible vitesse. Le clic est également satisfaisant, mais le retour d'information n'est pas parfaitement uniforme : le clic est plus prononcé lorsque l'on appuie au centre, tandis que les coins inférieurs sont plus souples.
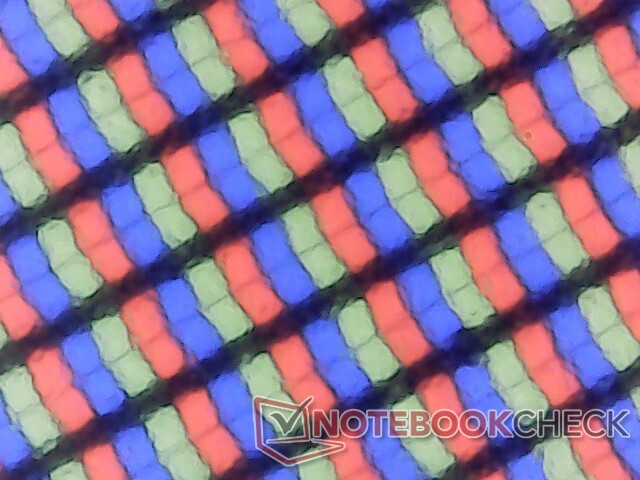
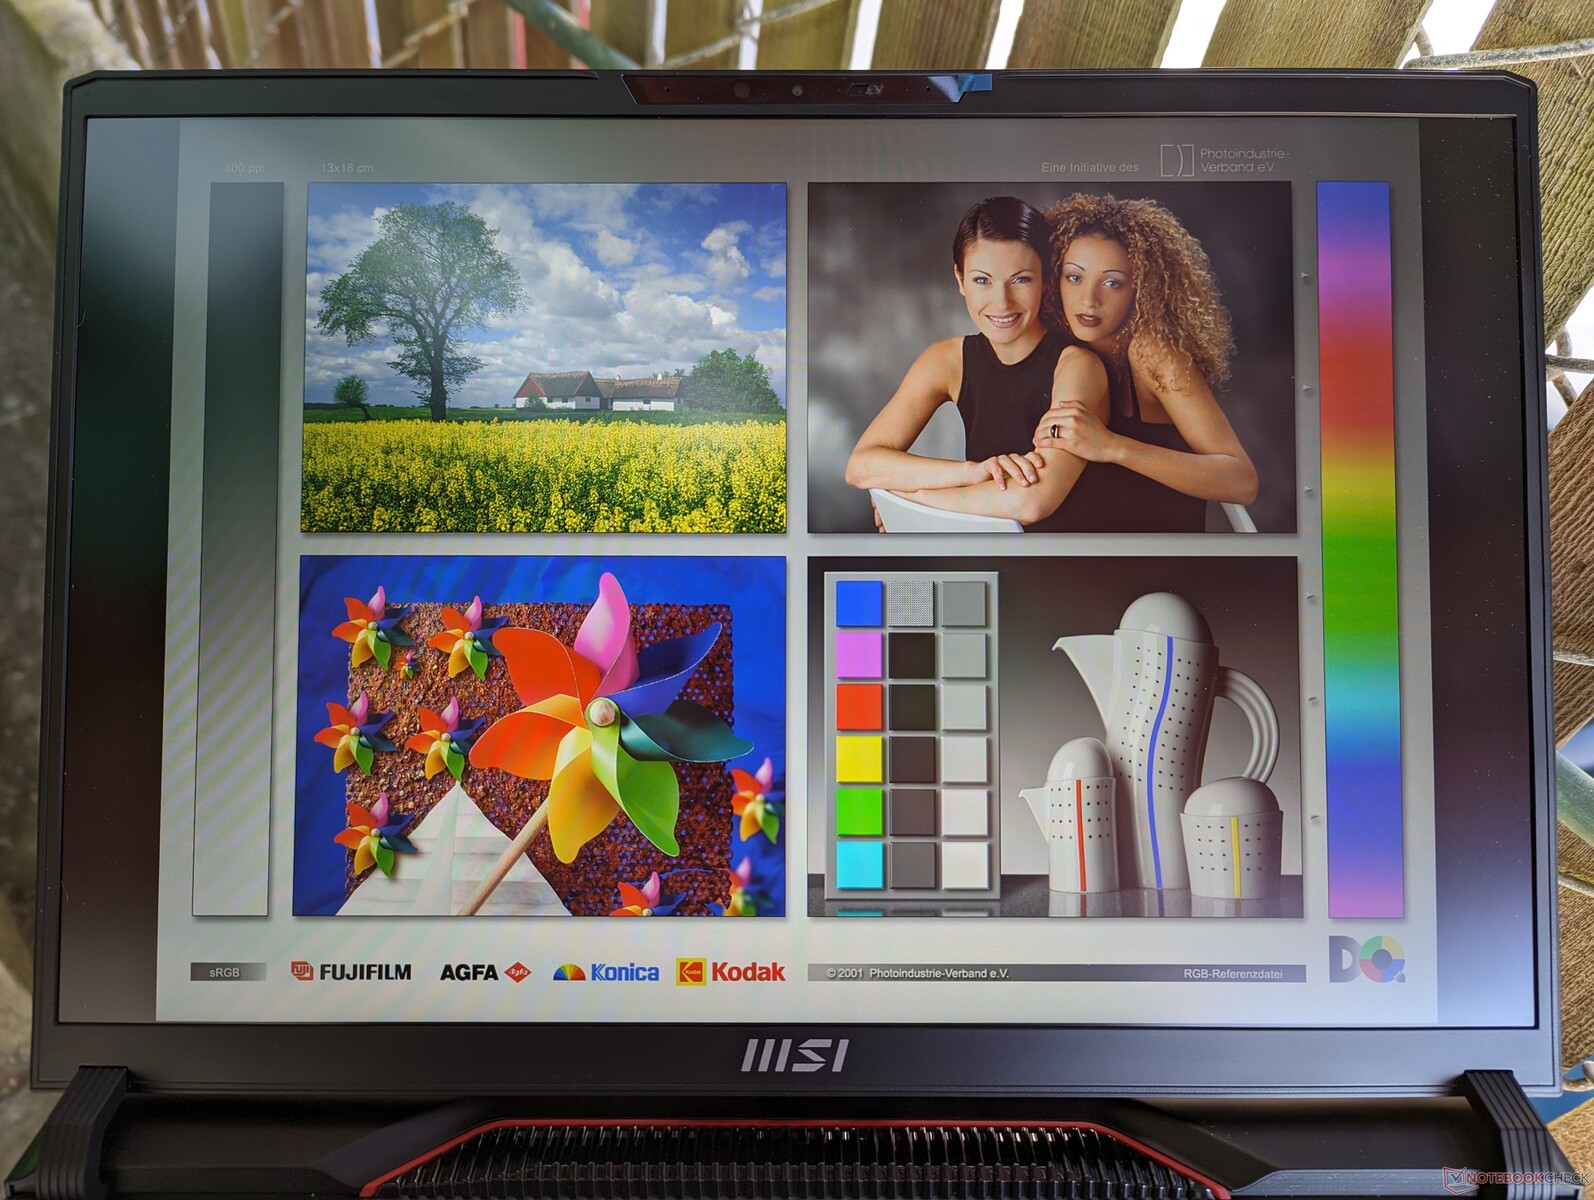
Affichage - Couleurs médiocres
Le Raider GE68HX est livré avec deux panneaux différents. Notre unité d'évaluation spécifique est livrée avec l'option en gras ci-dessous :
- 2560 x 1600, 240 Hz, 100 % DCI-P3, 3 ms, IPS
- 1920 x 1200, 144 Hz, 60% sRGB, 11 ms, IPS
L'option 144 Hz, moins chère, n'est pas recommandée en raison de sa couverture colorimétrique plus étroite et de ses temps de réponse plus lents, qui entraînent des images fantômes plus visibles. Les couleurs moins profondes sont difficiles à ignorer même si vous ne faites pas beaucoup d'édition graphique. Cette dalle est plus adaptée aux ordinateurs portables de jeu moins chers tels que le MSI Pulse 17 où les gammes de couleurs étroites sont courantes.
La technologie G-Sync est absente de toutes les configurations actuelles du GE68HX.
| |||||||||||||||||||||||||
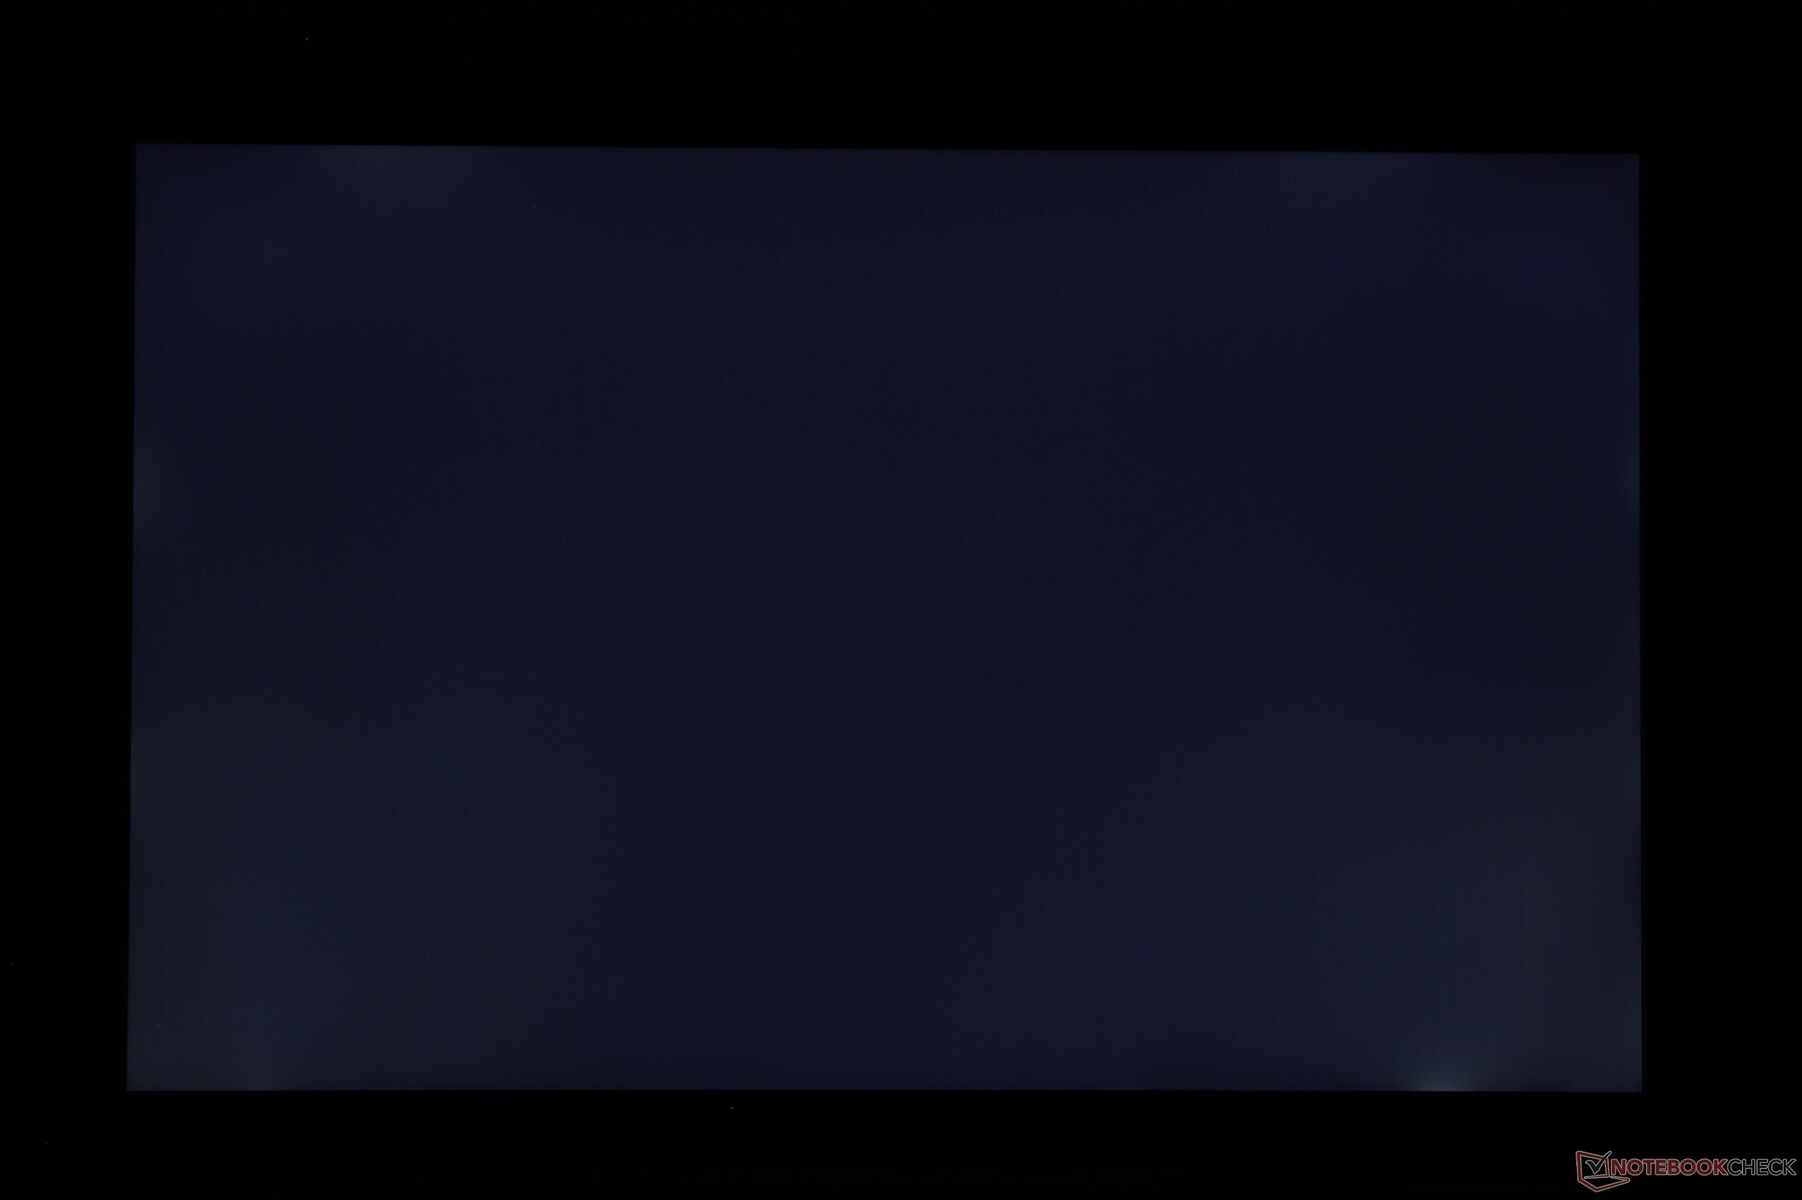
Homogénéité de la luminosité: 93 %
Valeur mesurée au centre, sur batterie: 300.9 cd/m²
Contraste: 971:1 (Valeurs des noirs: 0.31 cd/m²)
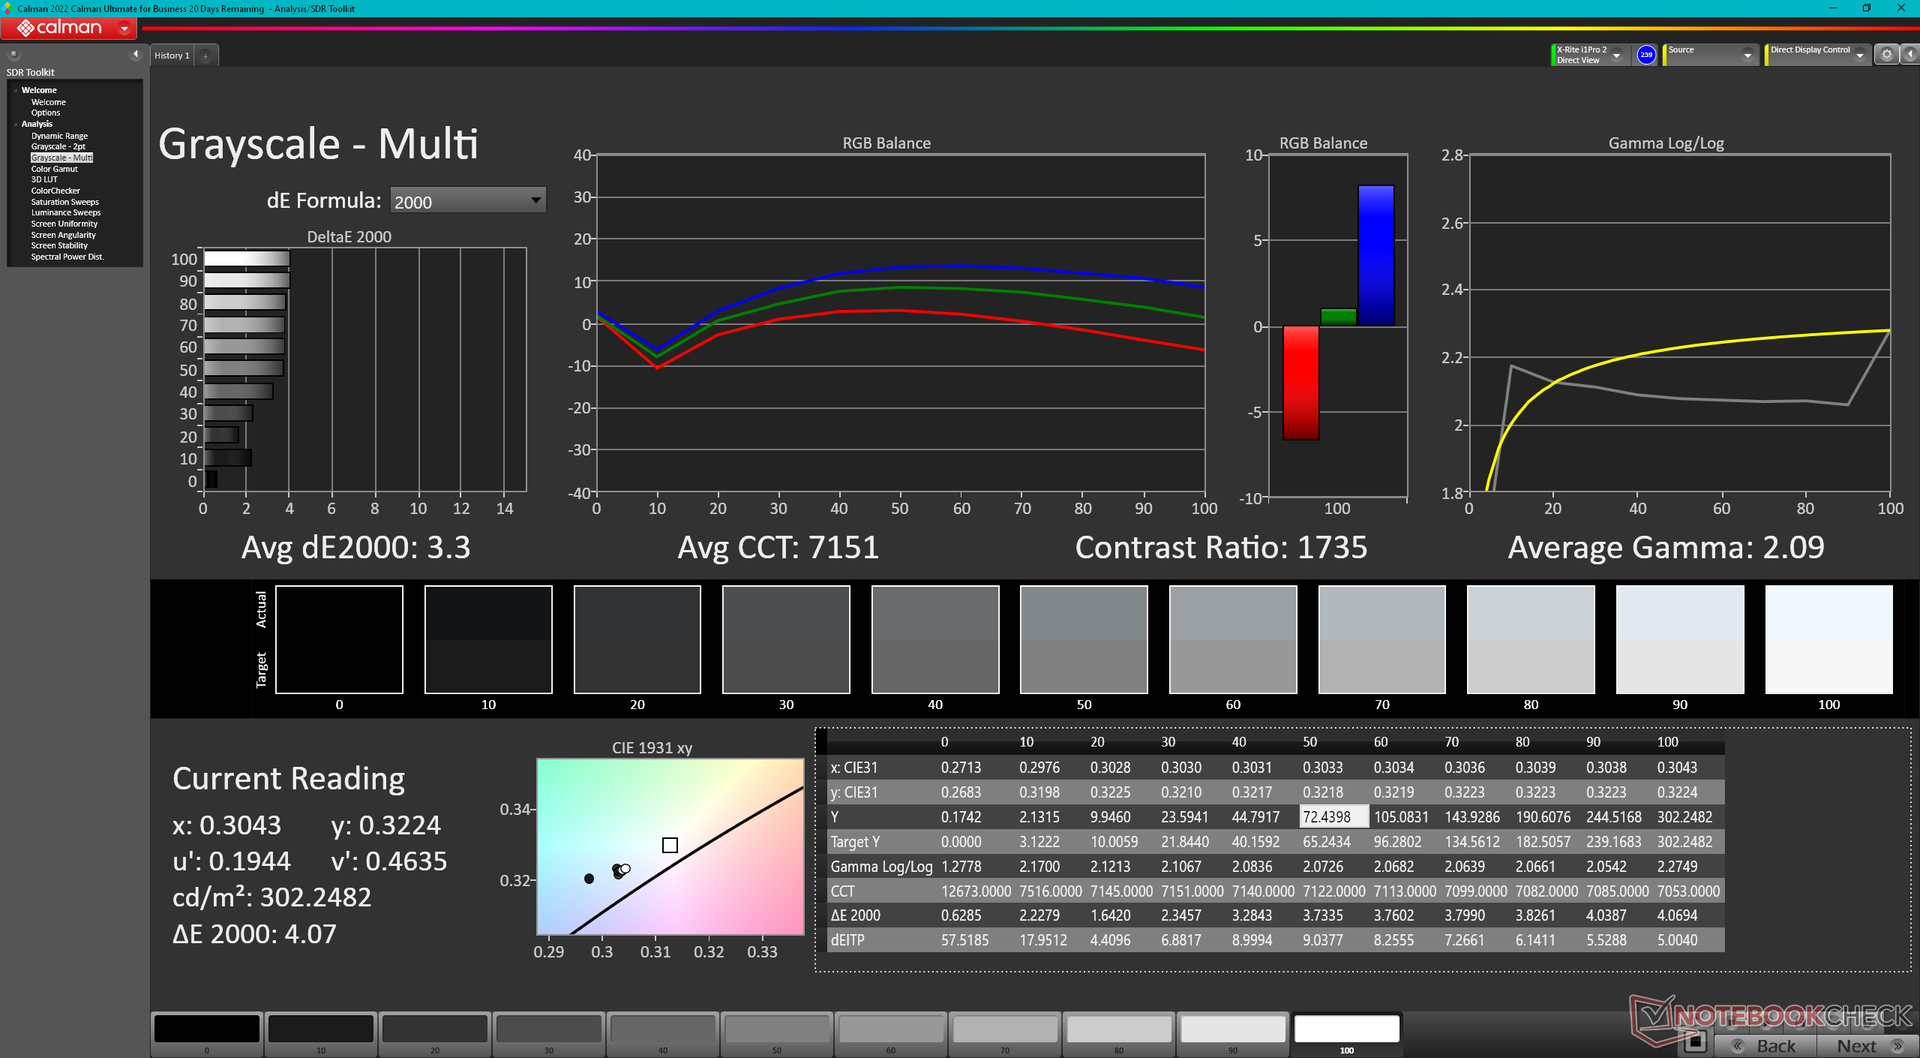
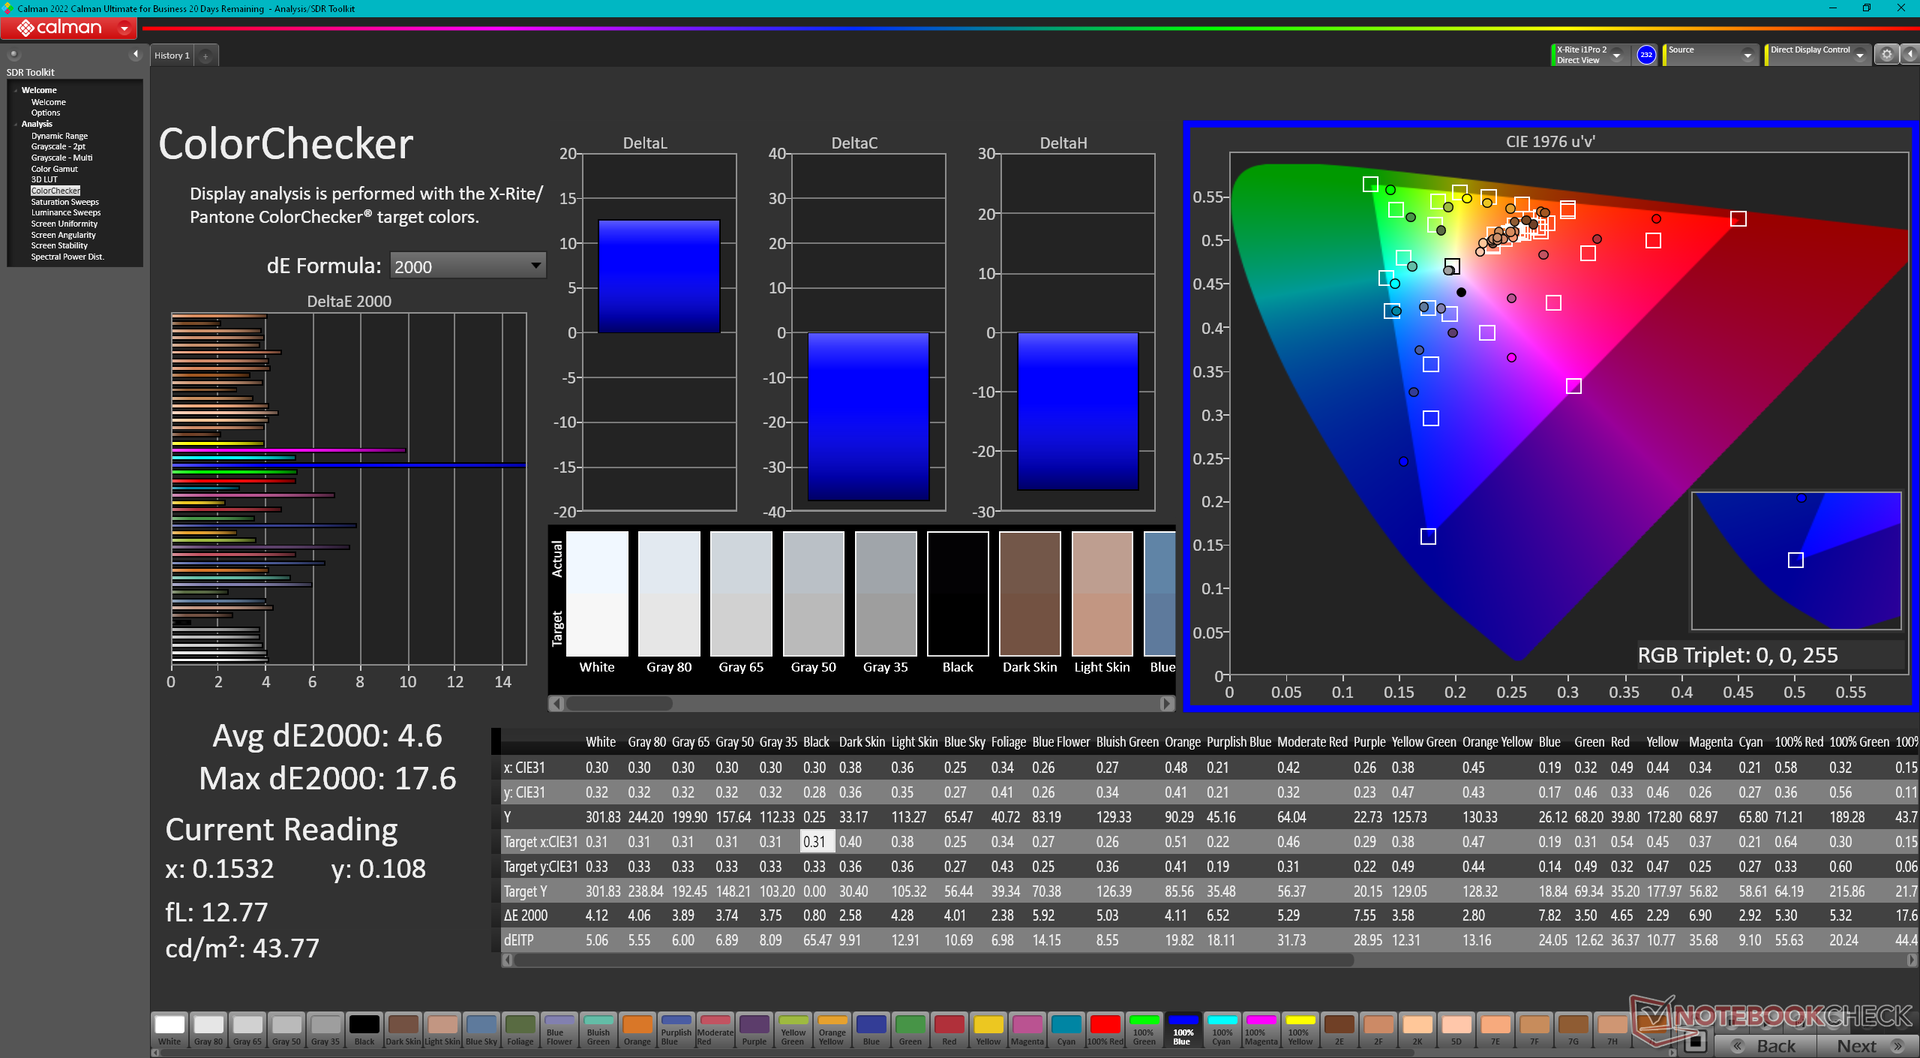
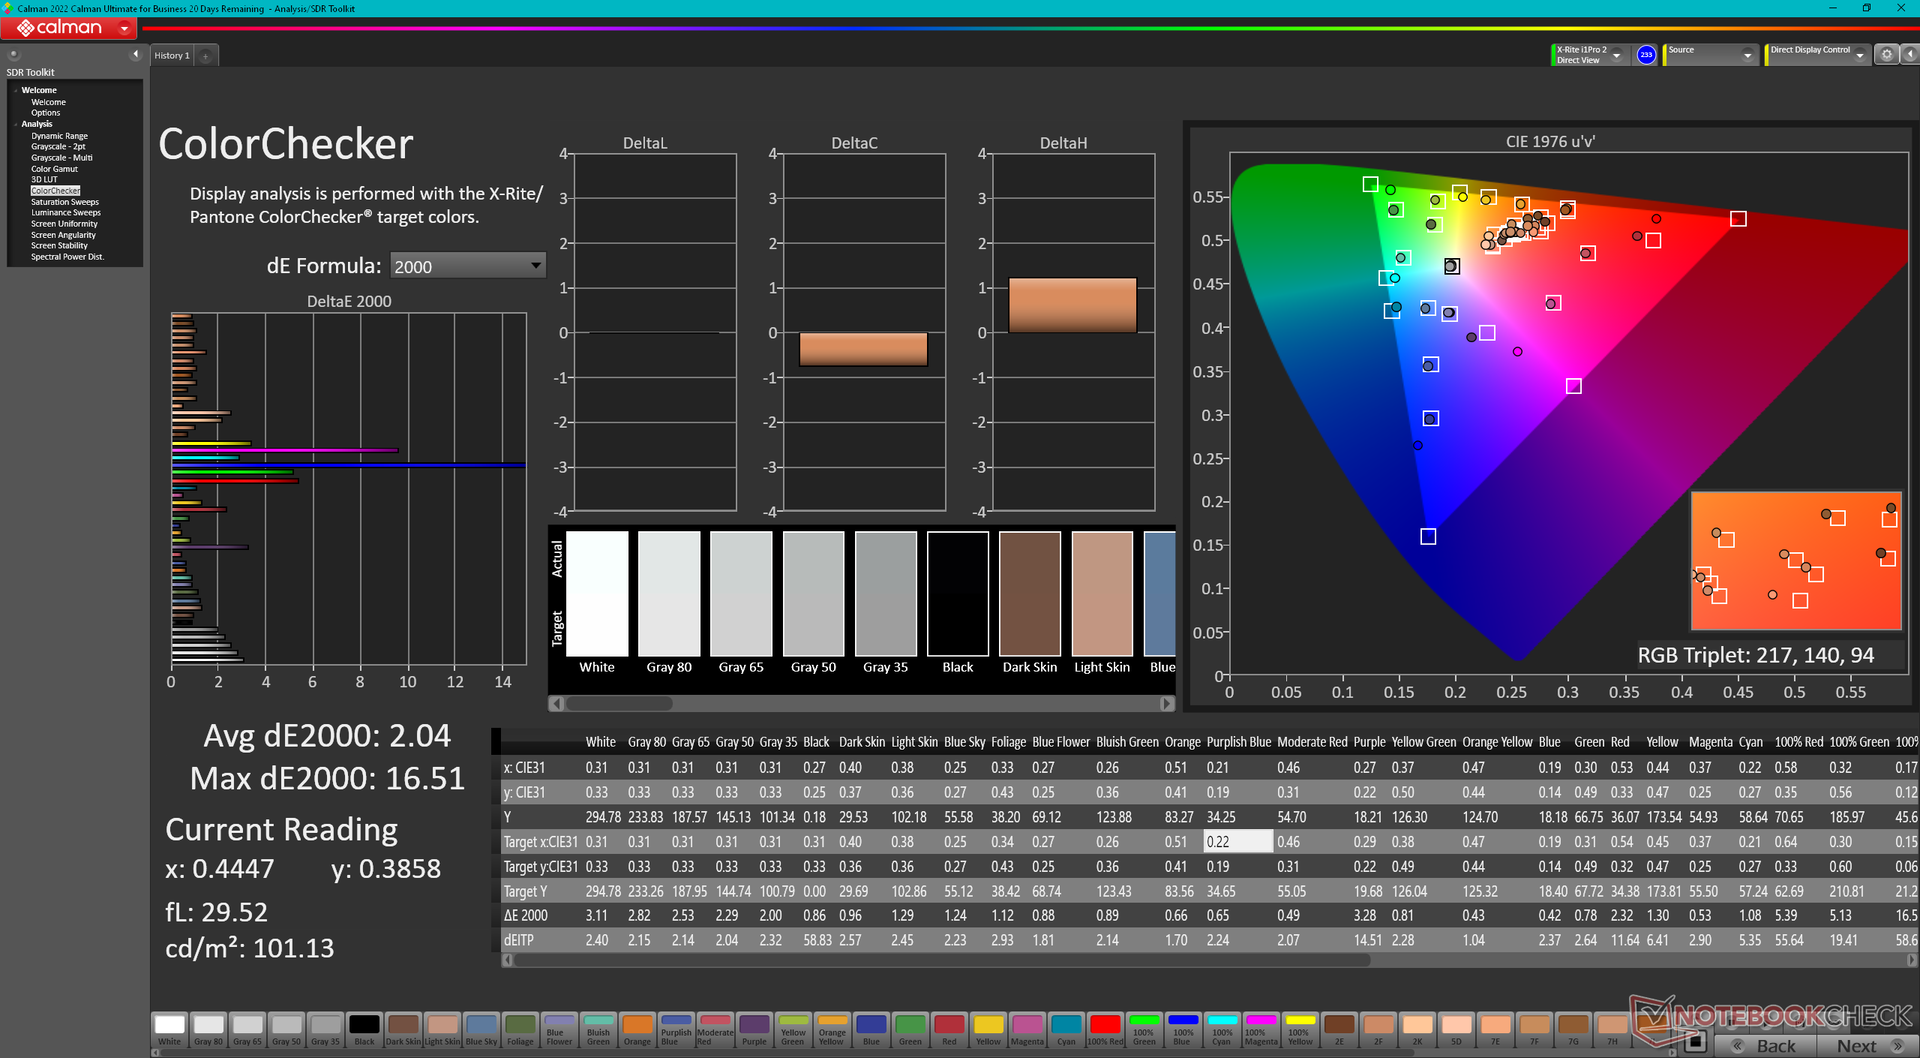
ΔE ColorChecker Calman: 4.6 | ∀{0.5-29.43 Ø4.73}
calibrated: 2.04
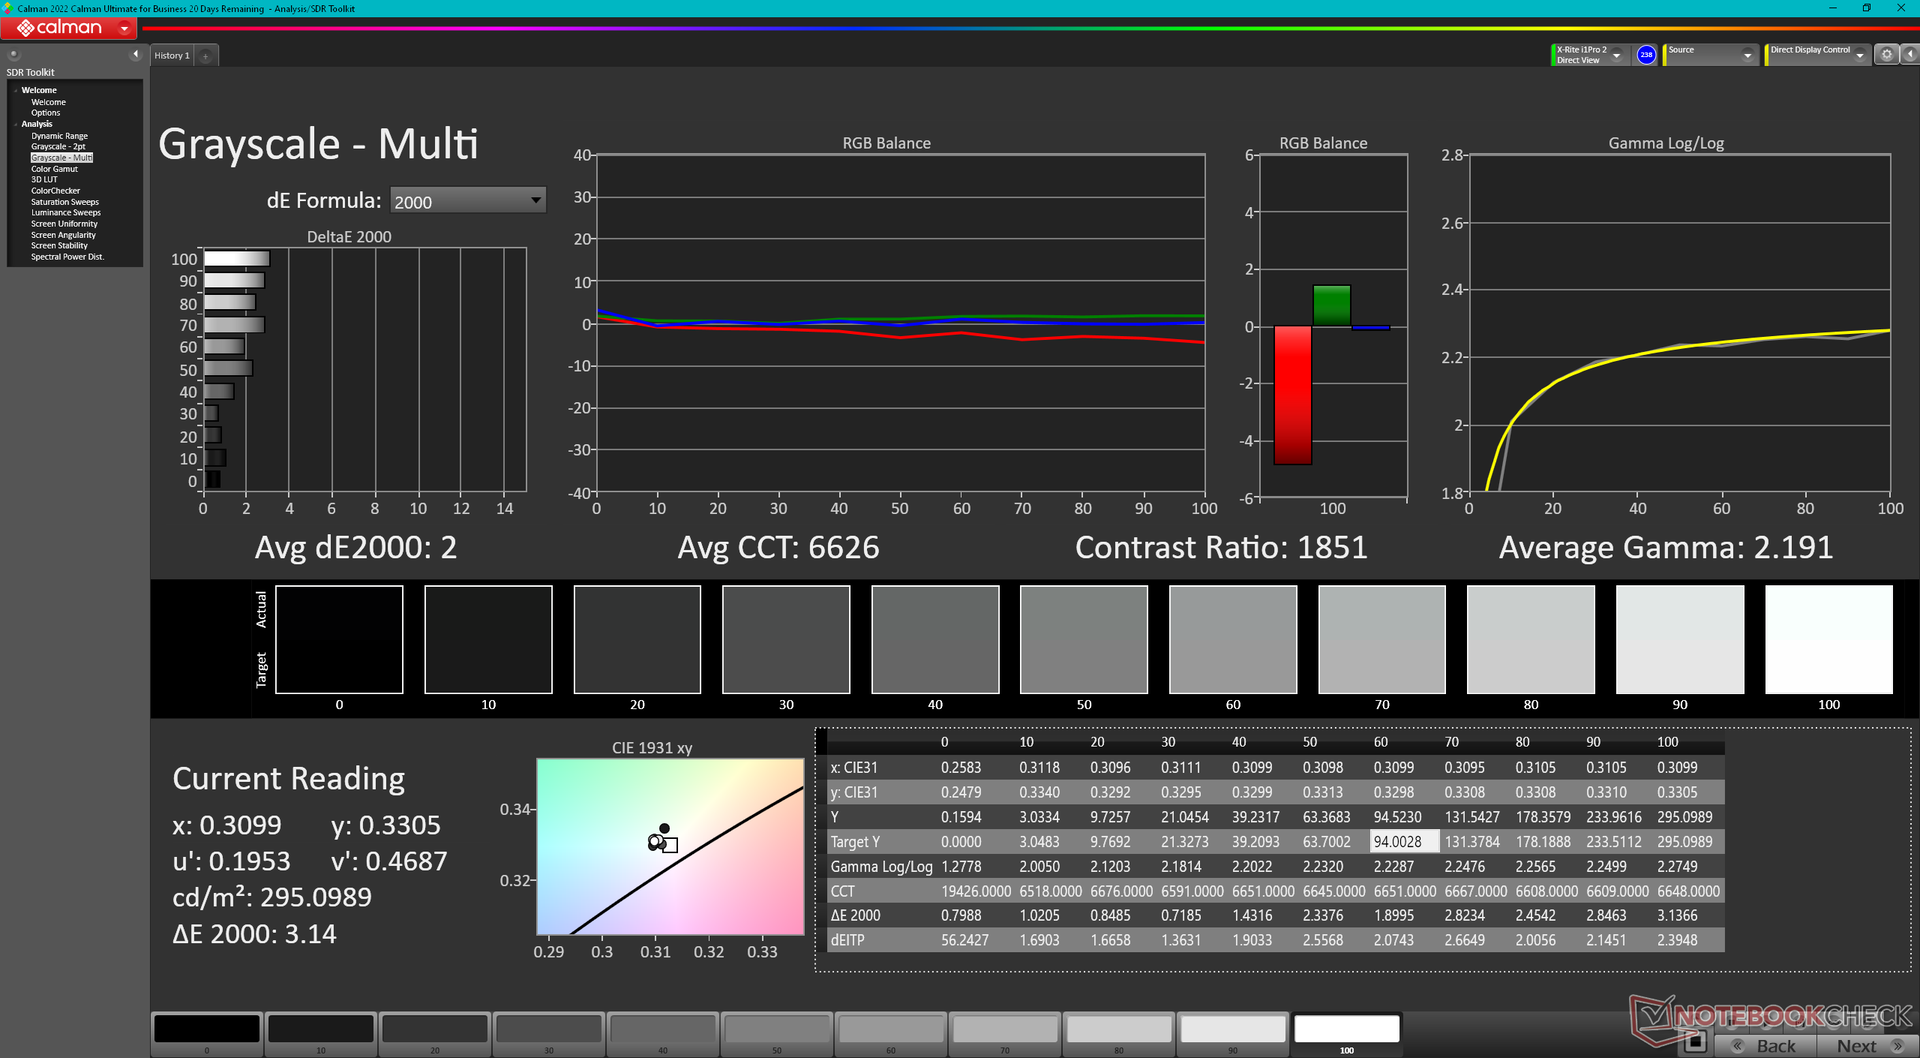
ΔE Greyscale Calman: 3.3 | ∀{0.09-98 Ø4.97}
43% AdobeRGB 1998 (Argyll 3D)
62.2% sRGB (Argyll 3D)
41.6% Display P3 (Argyll 3D)
Gamma: 2.09
CCT: 7151 K
| MSI Raider GE68HX 13VF Chi Mei N160JME-GTK, IPS, 1900x1200, 16" | MSI GE67 HX 12UGS Samsung ATNA562P02-0, OLED, 1920x1080, 15.6" | HP Omen 16-xf0376ng BOE0B81, IPS, 1920x1080, 16.1" | Alienware m16 R1 AMD BOE NE16NZ4, IPS, 2560x1600, 16" | Lenovo Legion Slim 7i 16 Gen 8 CSOT T3 MNG007DA2-3, IPS, 2560x1600, 16" | Asus ROG Zephyrus M16 GU604VY-NM042X BOE0B74 (NE160QDM-NM4, IPS, 2560x1600, 16" | |
|---|---|---|---|---|---|---|
| Display | 64% | 67% | 102% | 66% | 103% | |
| Display P3 Coverage (%) | 41.6 | 71.7 72% | 72.1 73% | 98.6 137% | 70.4 69% | 99.33 139% |
| sRGB Coverage (%) | 62.2 | 89.7 44% | 99.6 60% | 99.9 61% | 99.4 60% | 99.9 61% |
| AdobeRGB 1998 Coverage (%) | 43 | 75.2 75% | 72.3 68% | 88.9 107% | 72.5 69% | 90.01 109% |
| Response Times | 99% | 50% | 67% | 47% | -108% | |
| Response Time Grey 50% / Grey 80% * (ms) | 17.3 ? | 0.25 ? 99% | 12.3 ? 29% | 5.1 ? 71% | 12 ? 31% | 50.8 ? -194% |
| Response Time Black / White * (ms) | 24.2 ? | 0.4 ? 98% | 7.2 ? 70% | 9 ? 63% | 8.9 ? 63% | 29.6 ? -22% |
| PWM Frequency (Hz) | 480.4 ? | 12000 | ||||
| Screen | 17% | 10% | 10% | 34% | 297% | |
| Brightness middle (cd/m²) | 300.9 | 356.1 18% | 350 16% | 329 9% | 474.6 58% | 634 111% |
| Brightness (cd/m²) | 302 | 358 19% | 338 12% | 317 5% | 445 47% | 627 108% |
| Brightness Distribution (%) | 93 | 99 6% | 91 -2% | 89 -4% | 86 -8% | 92 -1% |
| Black Level * (cd/m²) | 0.31 | 0.35 -13% | 0.32 -3% | 0.39 -26% | 0.03 90% | |
| Contrast (:1) | 971 | 1000 3% | 1028 6% | 1217 25% | 21133 2076% | |
| Colorchecker dE 2000 * | 4.6 | 4.83 -5% | 3.29 28% | 3.71 19% | 2.12 54% | 0.89 81% |
| Colorchecker dE 2000 max. * | 17.6 | 7.94 55% | 8.47 52% | 7.23 59% | 4.73 73% | 1.79 90% |
| Colorchecker dE 2000 calibrated * | 2.04 | 2.23 -9% | 2.82 -38% | 0.57 72% | 0.91 55% | |
| Greyscale dE 2000 * | 3.3 | 3.1 6% | 3.2 3% | 2.2 33% | 2.8 15% | 1.13 66% |
| Gamma | 2.09 105% | 2.2 100% | 2.131 103% | 2.3 96% | 2.22 99% | 2.47 89% |
| CCT | 7151 91% | 5938 109% | 6317 103% | 6270 104% | 6542 99% | 6497 100% |
| Moyenne finale (programmes/paramètres) | 60% /
44% | 42% /
28% | 60% /
38% | 49% /
43% | 97% /
198% |
* ... Moindre est la valeur, meilleures sont les performances
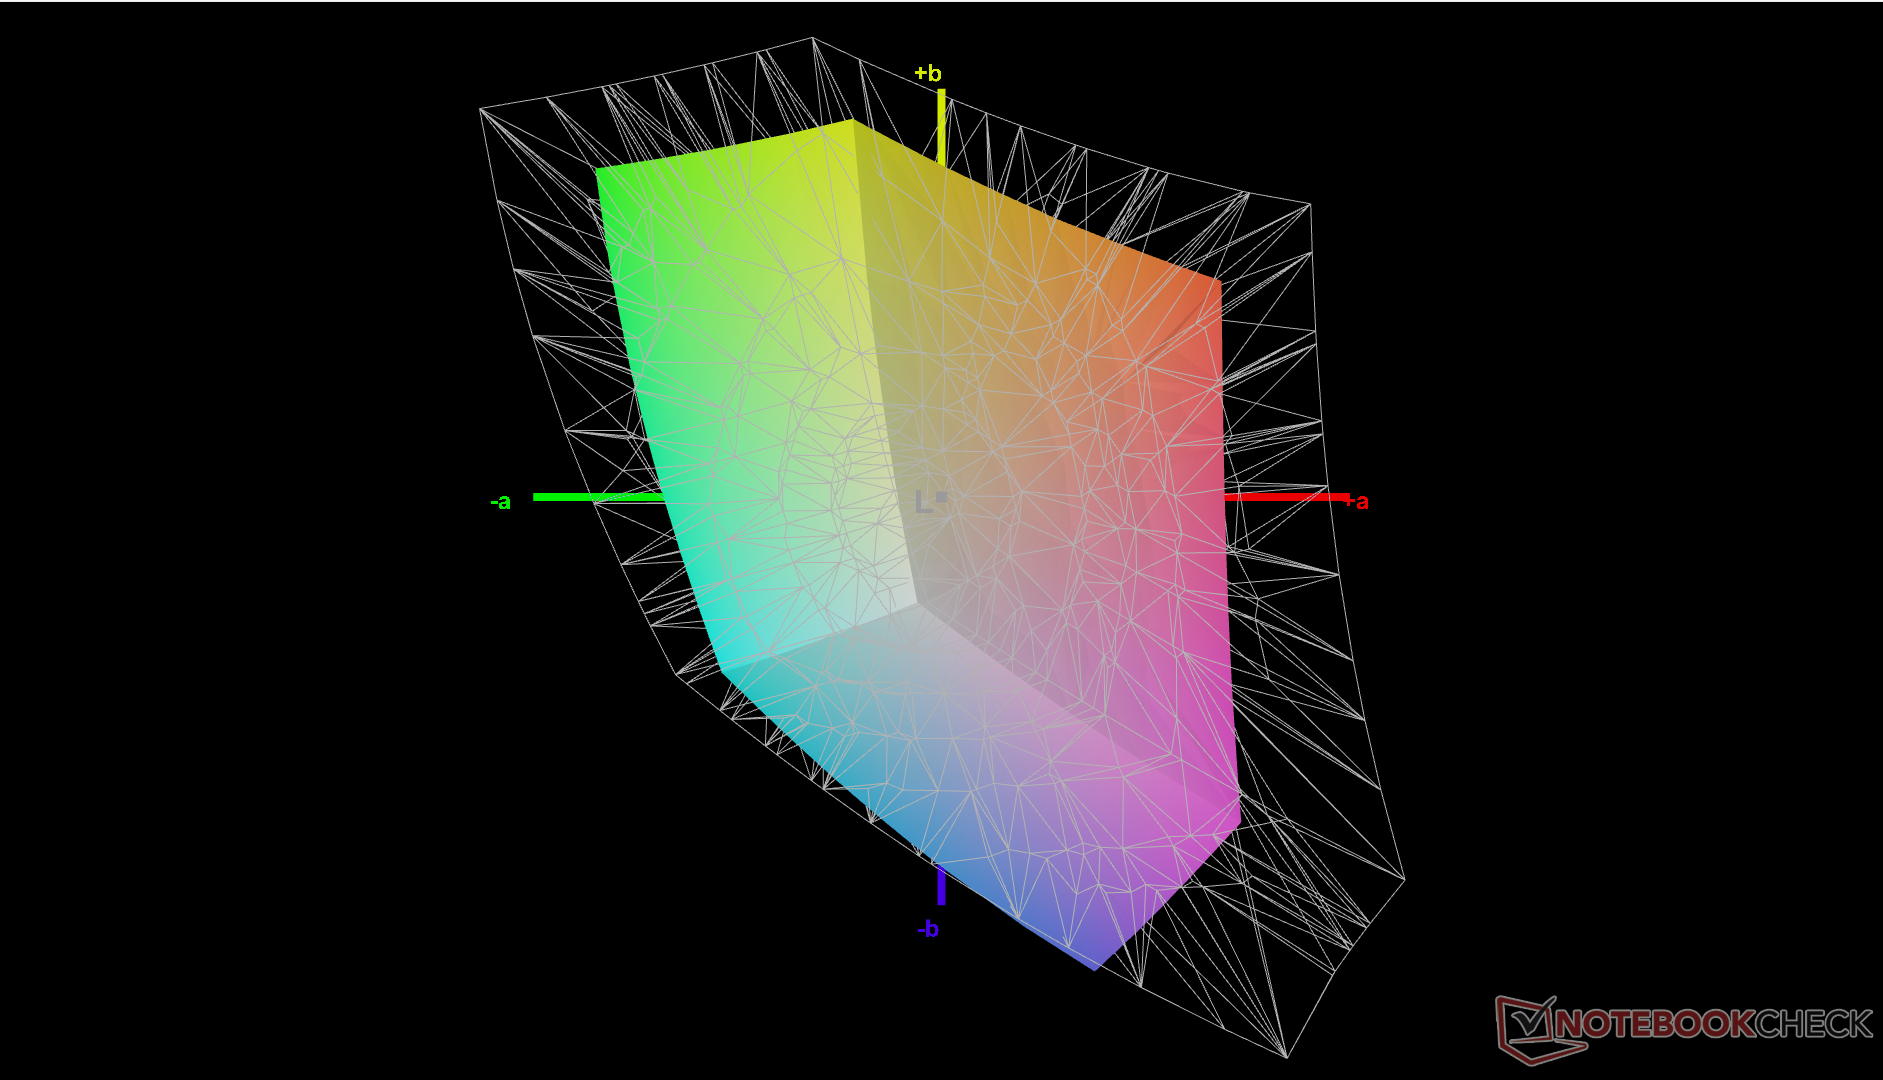
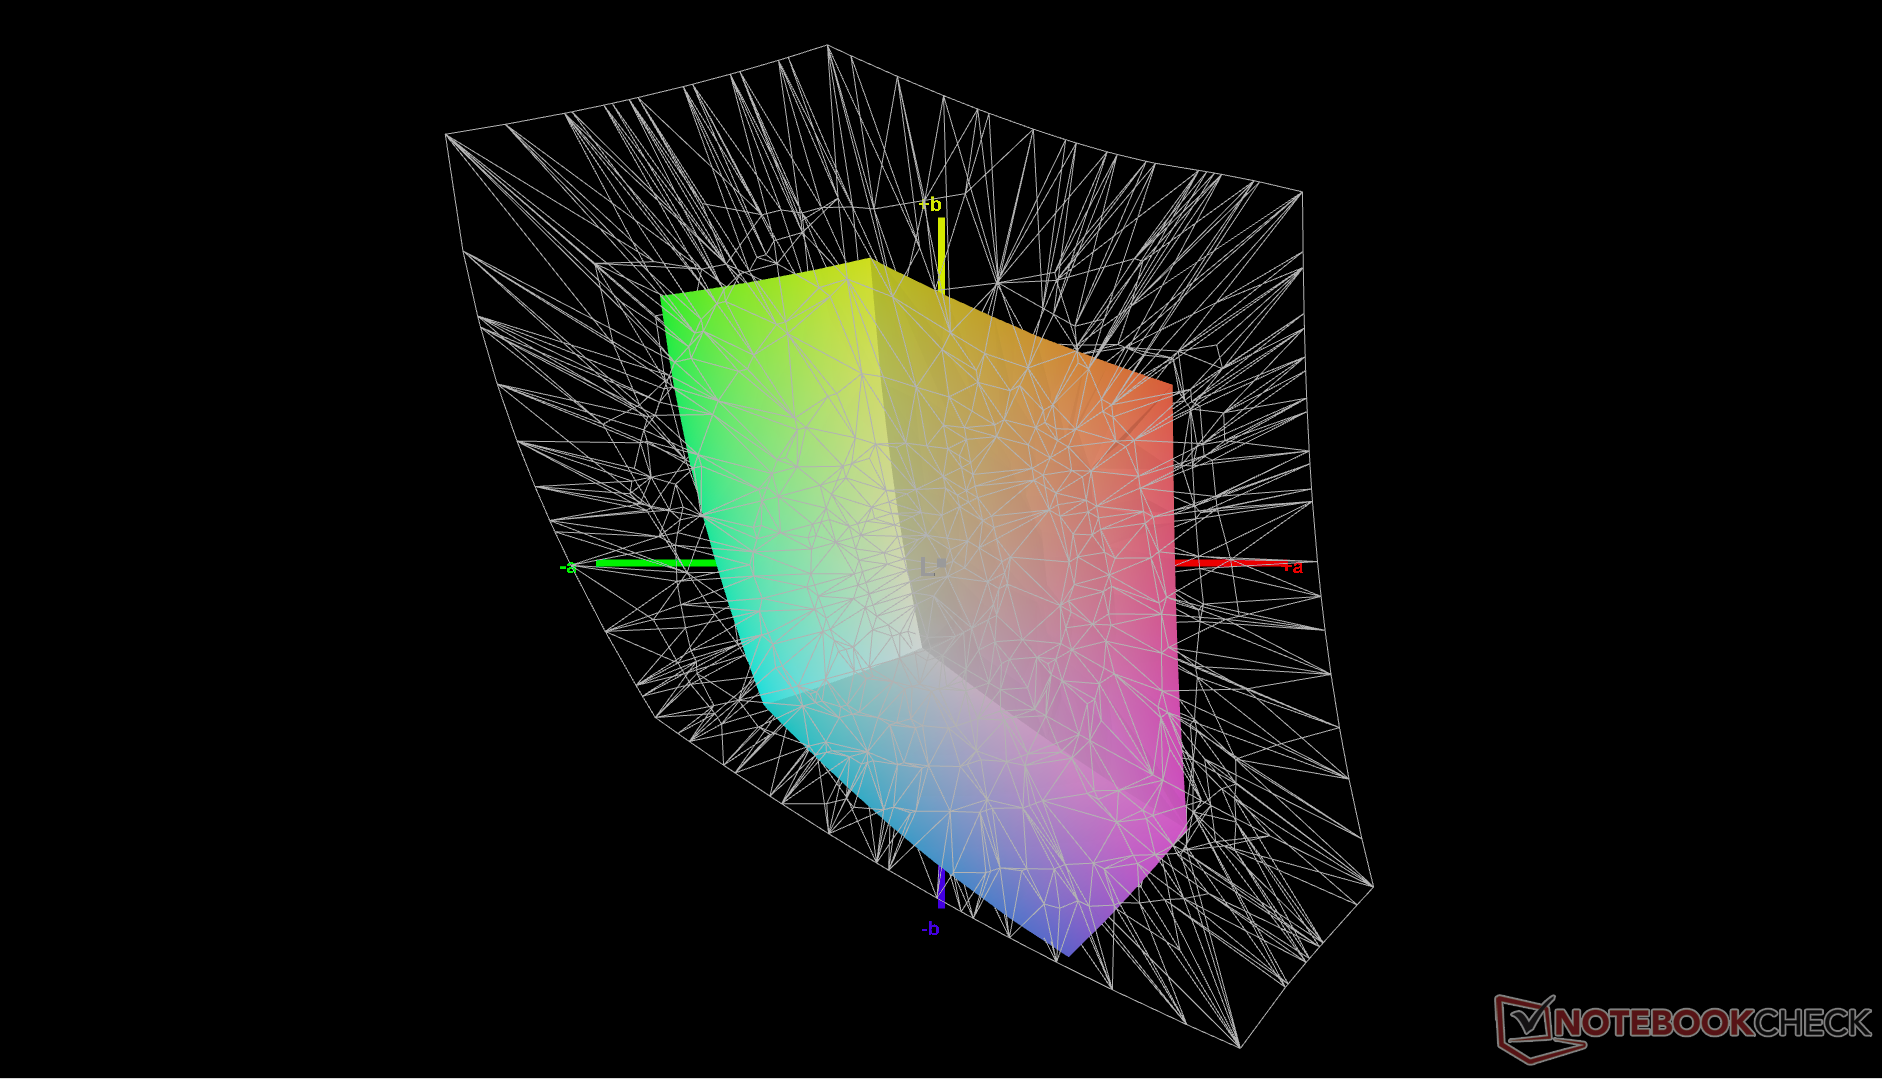
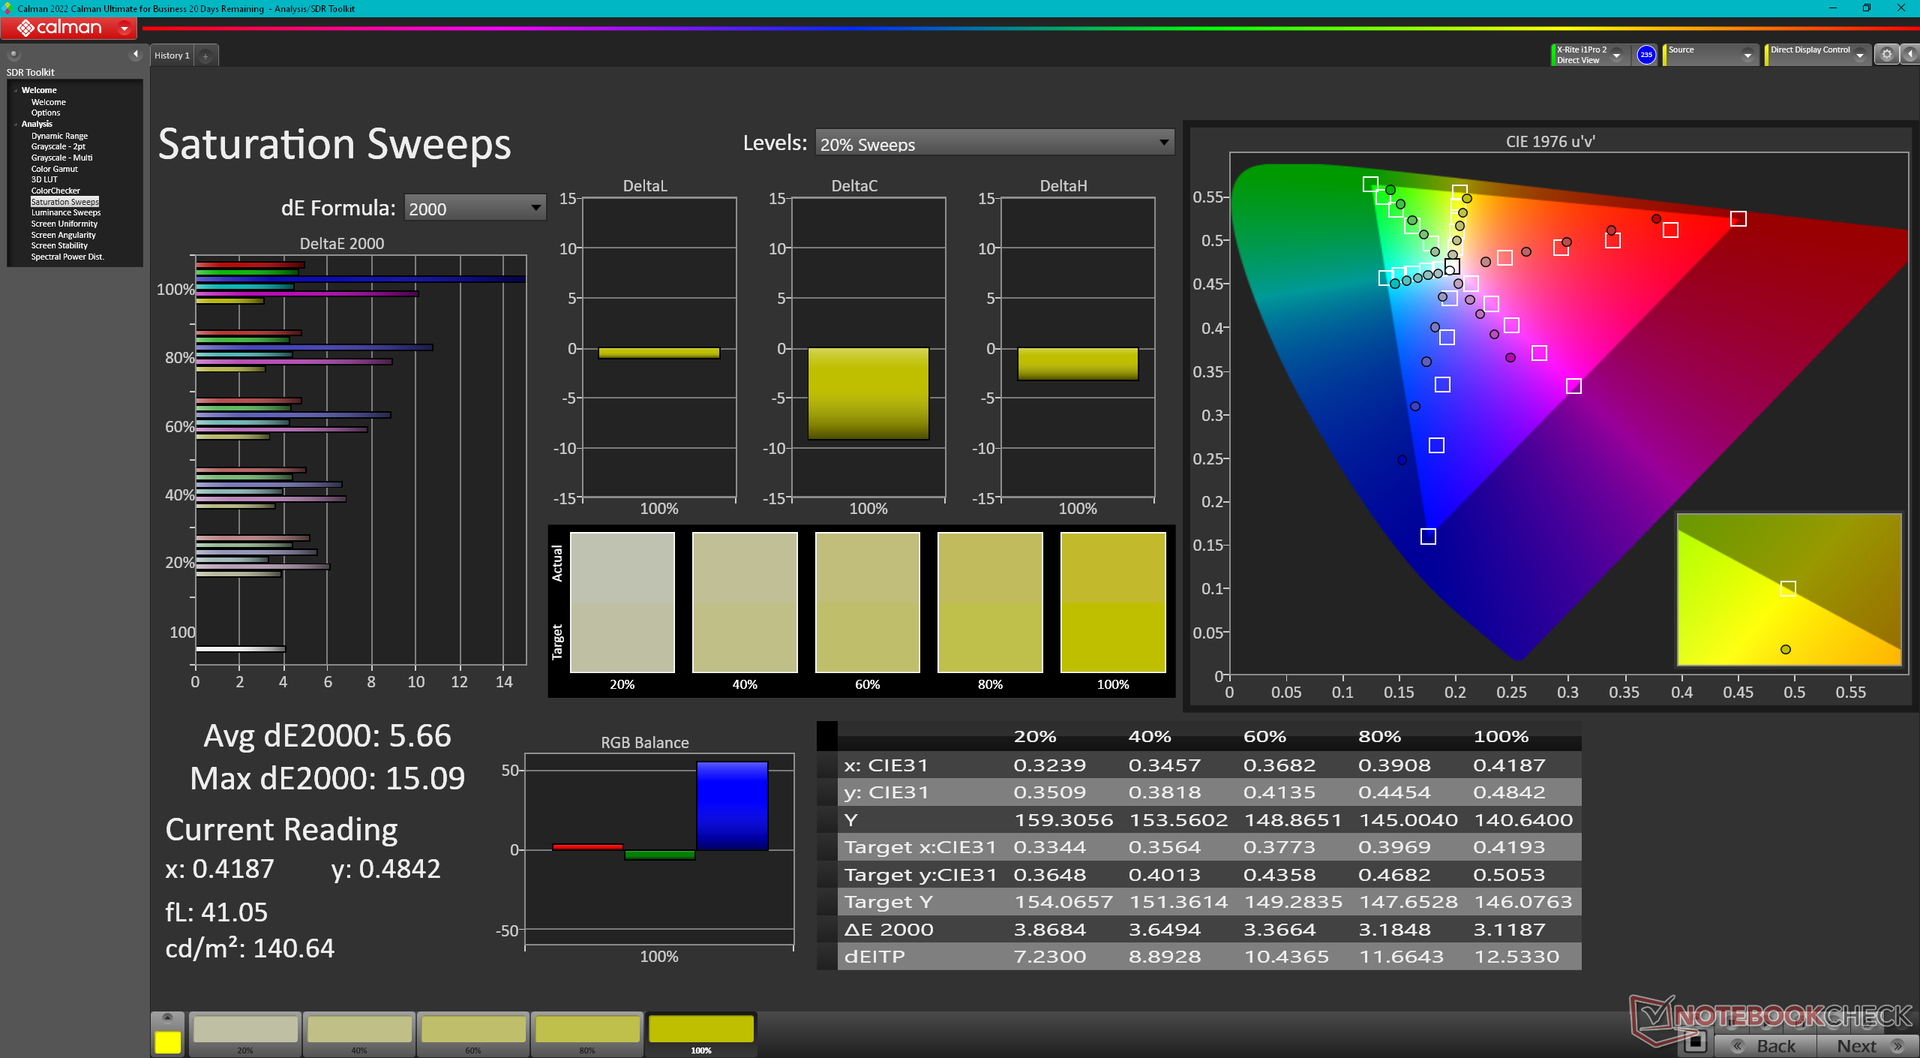
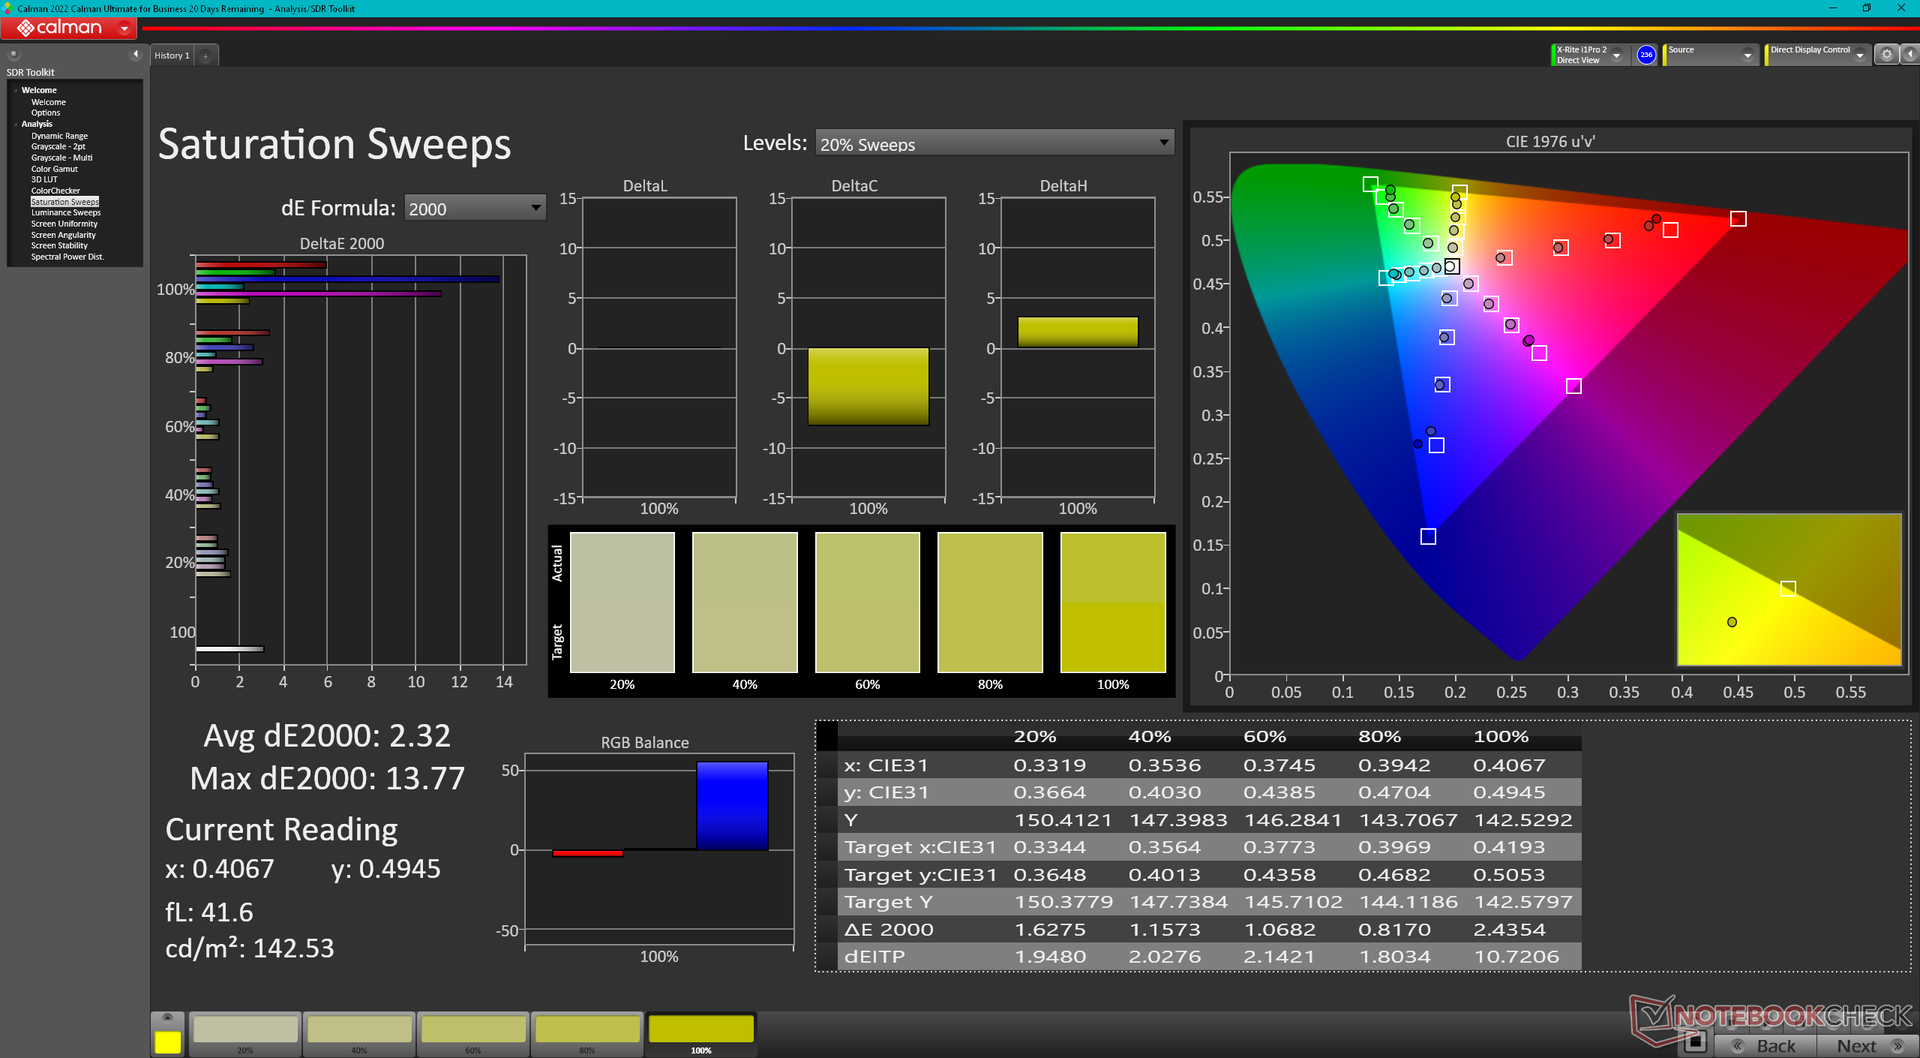
L'écran n'est pas pré-calibré, mais la précision moyenne des couleurs n'est pas si mauvaise que cela. En calibrant nous-mêmes l'écran à l'aide d'un colorimètre X-Rite, les valeurs moyennes de DeltaE en niveaux de gris et en couleurs sont passées de 3,3 et 4,6 à seulement 2 et 2,04, respectivement. Les couleurs deviennent de plus en plus imprécises à des niveaux de saturation plus élevés, quel que soit le degré d'étalonnage, en raison de l'espace colorimétrique limité de l'écran. Le bleu est peut-être le pire des contrevenants, puisqu'il apparaît légèrement violet. Notre profil ICM est disponible ci-dessus et peut être téléchargé gratuitement.
Temps de réponse de l'écran
| ↔ Temps de réponse noir à blanc | ||
|---|---|---|
| 24.2 ms ... hausse ↗ et chute ↘ combinées | ↗ 10.6 ms hausse | 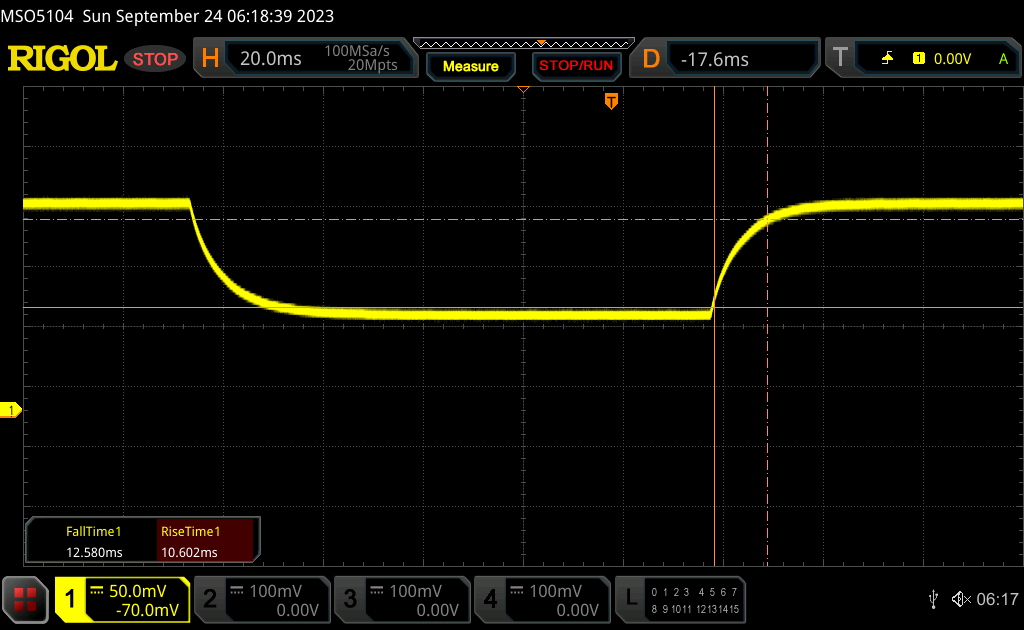 |
| ↘ 12.6 ms chute | ||
| L'écran montre de bons temps de réponse, mais insuffisant pour du jeu compétitif. En comparaison, tous les appareils testés affichent entre 0.1 (minimum) et 240 (maximum) ms. » 57 % des appareils testés affichent de meilleures performances. Cela signifie que les latences relevées sont moins bonnes que la moyenne (19.9 ms) de tous les appareils testés. | ||
| ↔ Temps de réponse gris 50% à gris 80% | ||
| 17.3 ms ... hausse ↗ et chute ↘ combinées | ↗ 9.4 ms hausse | 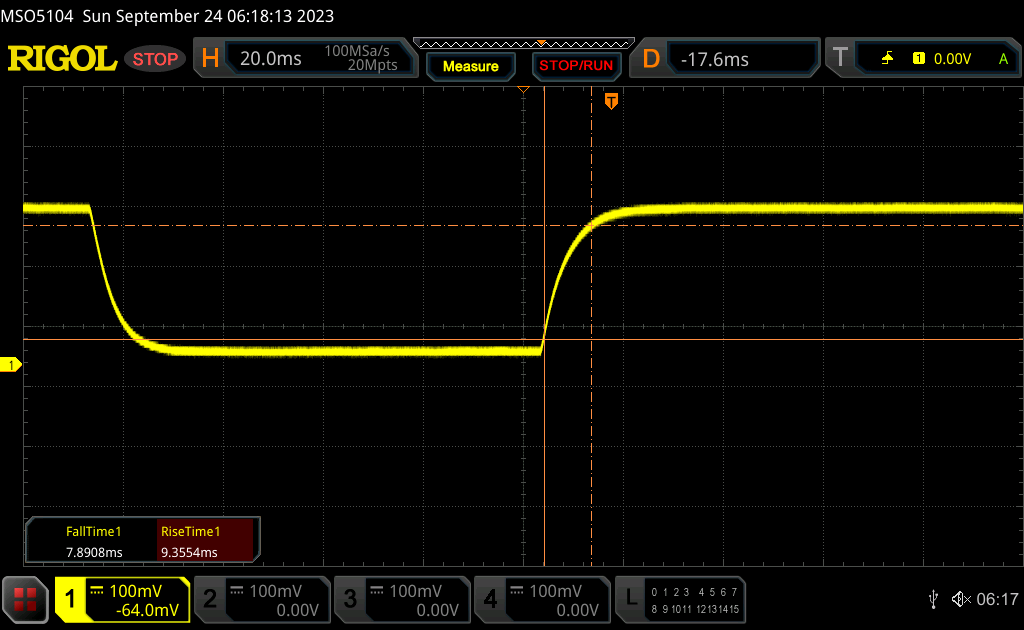 |
| ↘ 7.9 ms chute | ||
| L'écran montre de bons temps de réponse, mais insuffisant pour du jeu compétitif. En comparaison, tous les appareils testés affichent entre 0.165 (minimum) et 636 (maximum) ms. » 31 % des appareils testés affichent de meilleures performances. Cela signifie que les latences relevées sont meilleures que la moyenne (31.1 ms) de tous les appareils testés. | ||
Scintillement / MLI (Modulation de largeur d'impulsion)
| Scintillement / MLI (Modulation de largeur d'impulsion) non décelé |  | ||
En comparaison, 52 % des appareils testés n'emploient pas MDI pour assombrir leur écran. Nous avons relevé une moyenne à 7798 (minimum : 5 - maximum : 343500) Hz dans le cas où une MDI était active. | |||
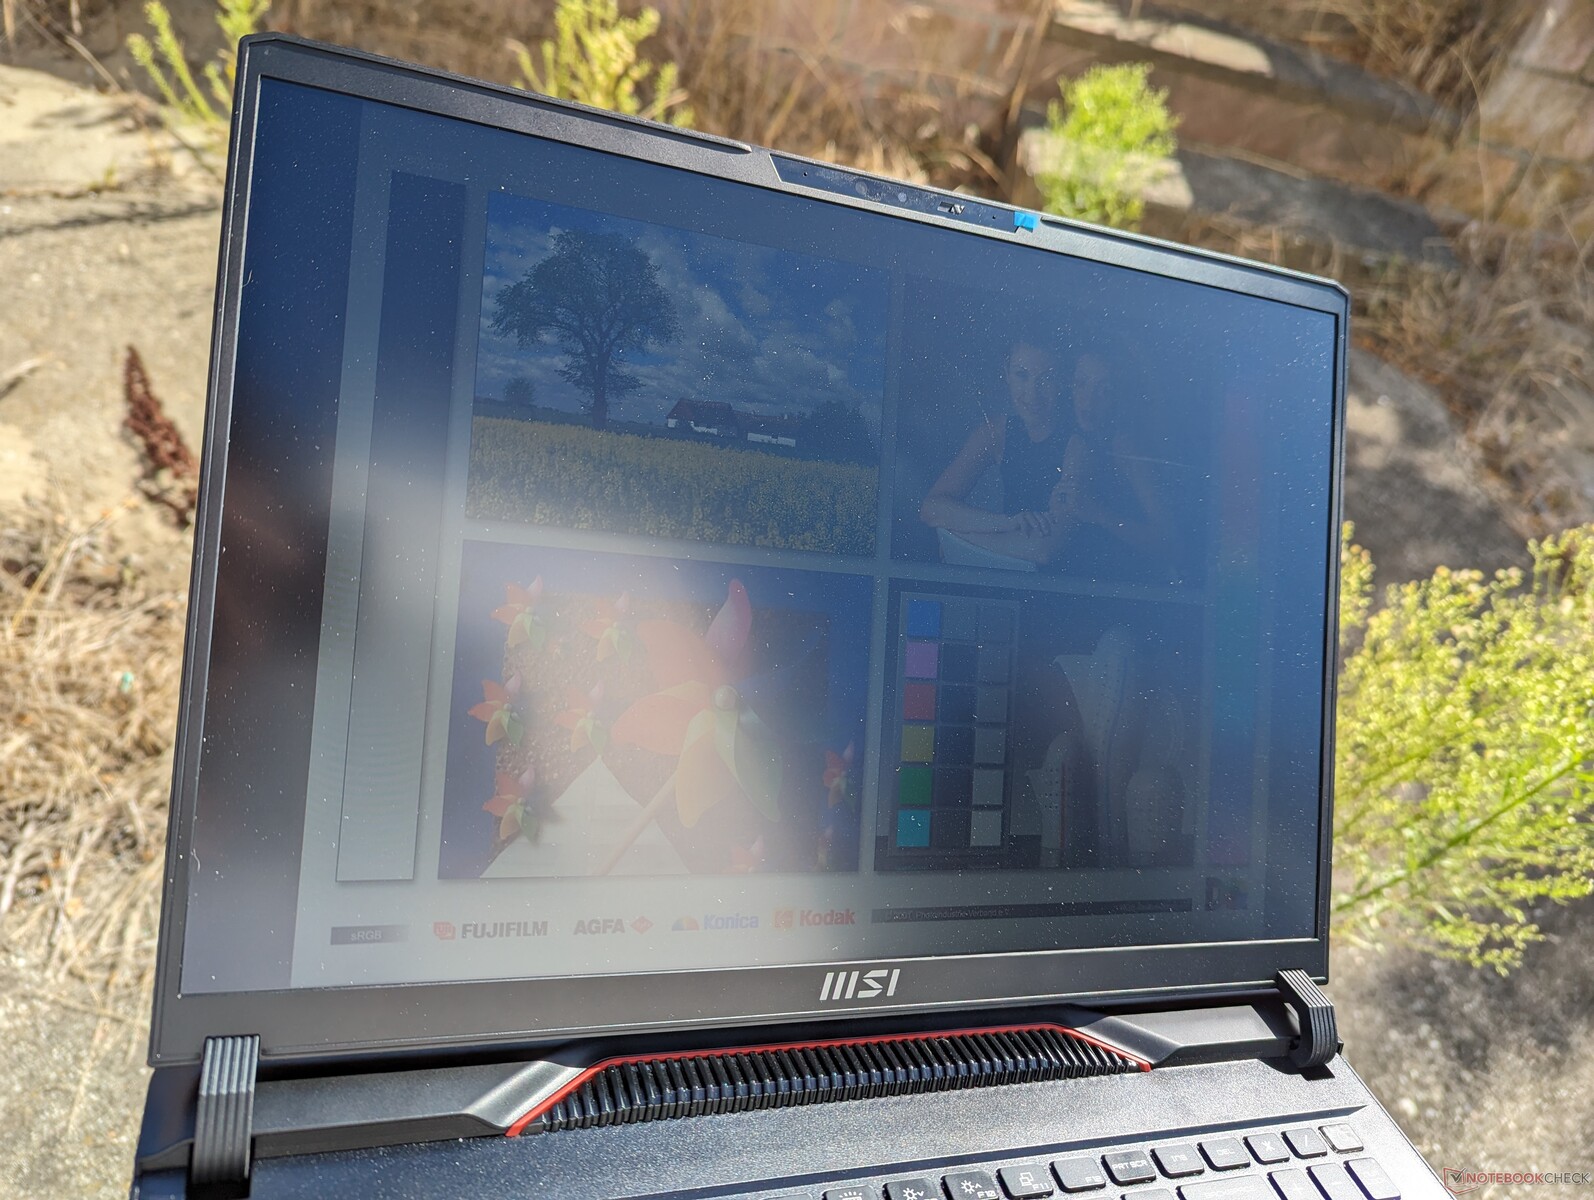
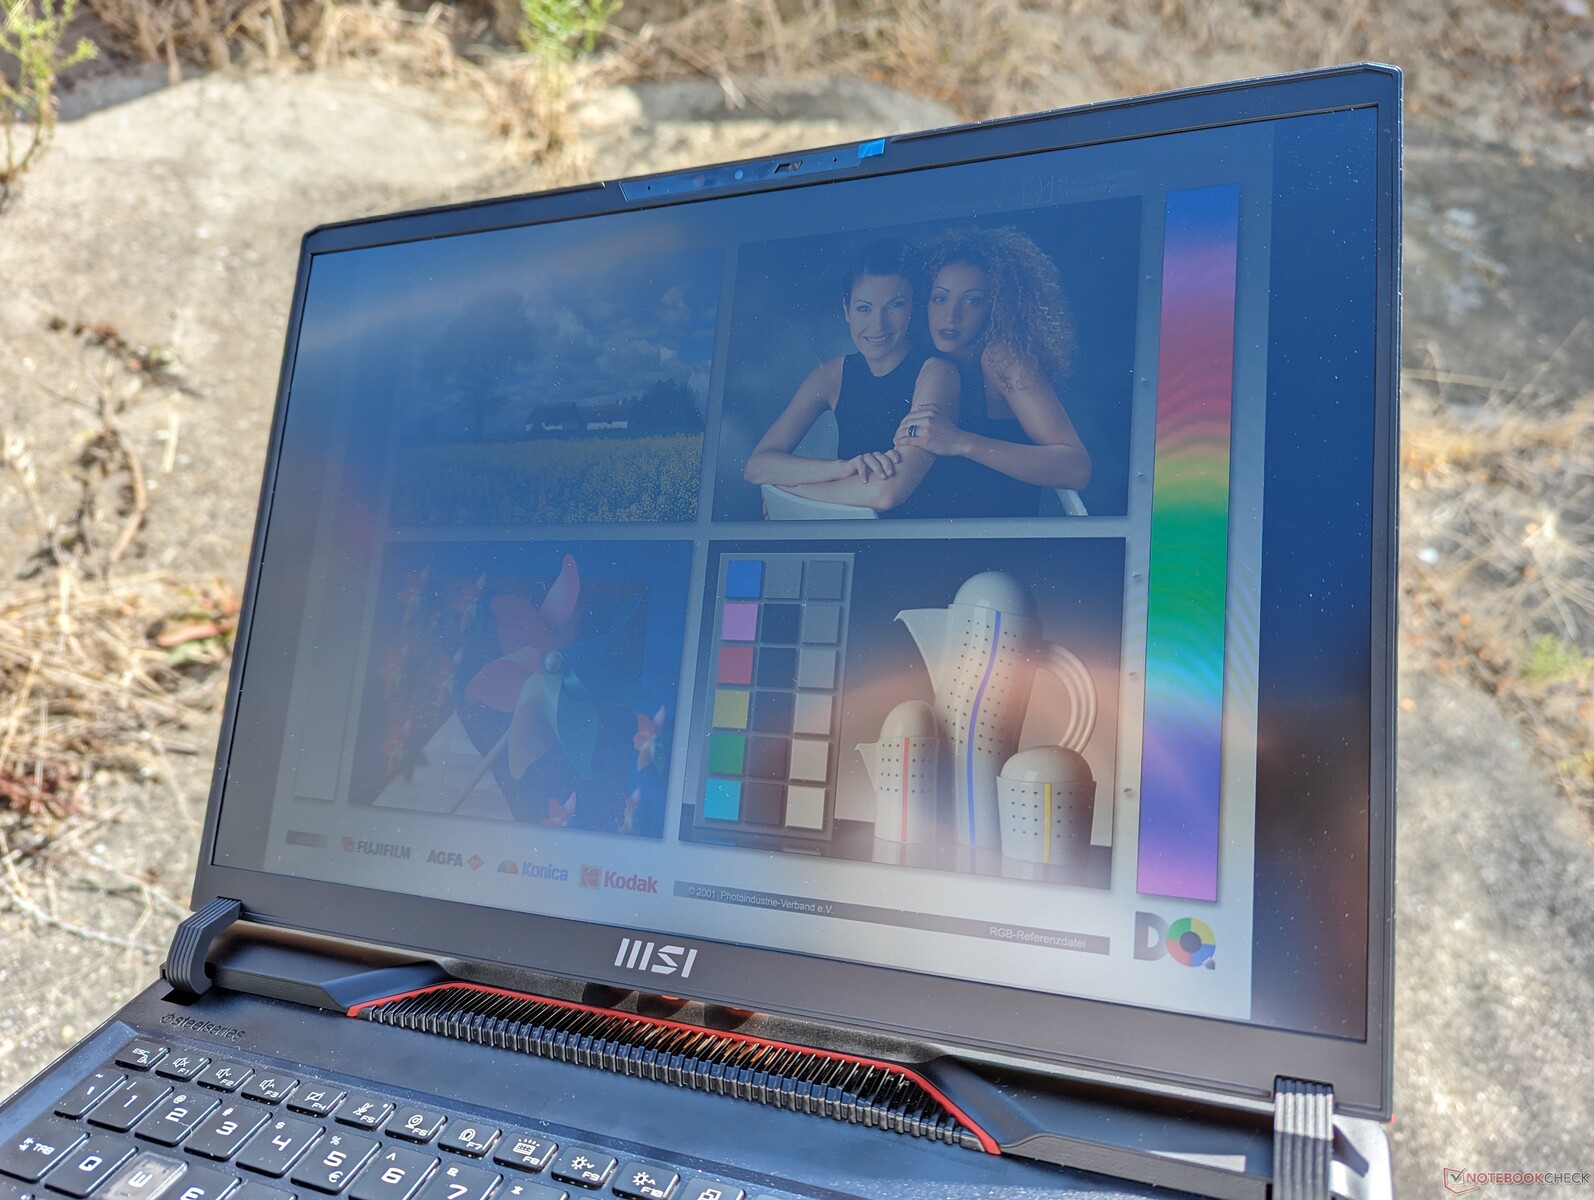
La luminosité maximale de 300 nits est typique de la plupart des ordinateurs portables de jeu. La lumière directe du soleil doit être évitée, sinon les couleurs seront délavées. Pour une meilleure visibilité en extérieur, les utilisateurs peuvent opter pour le Zephyrus M16 et son écran deux fois plus lumineux.
Performance - Une progression impressionnante d'une année sur l'autre
Conditions d'essai
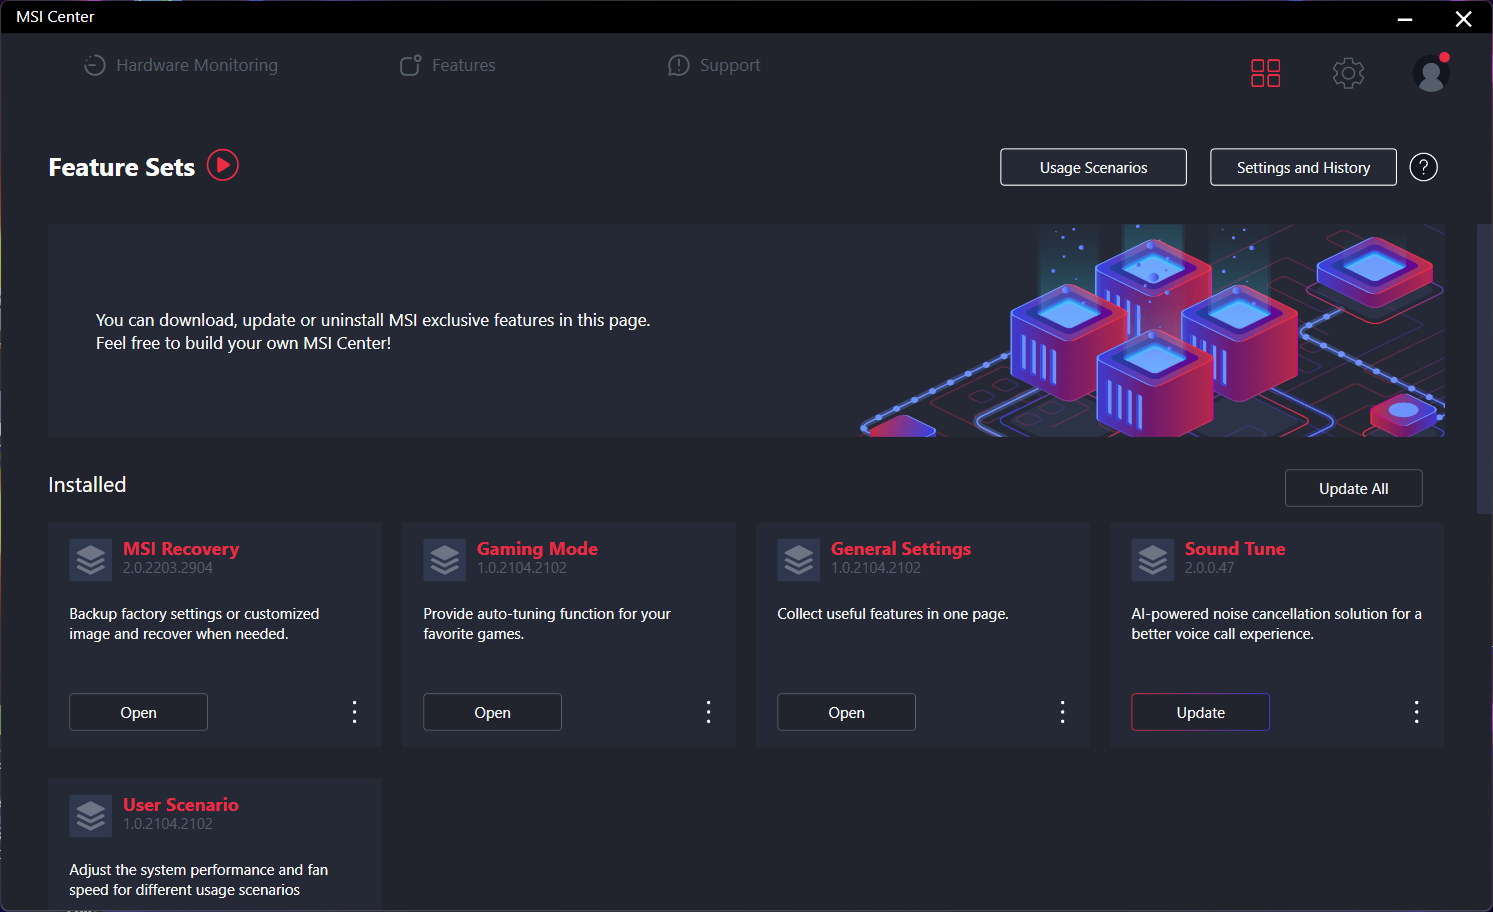
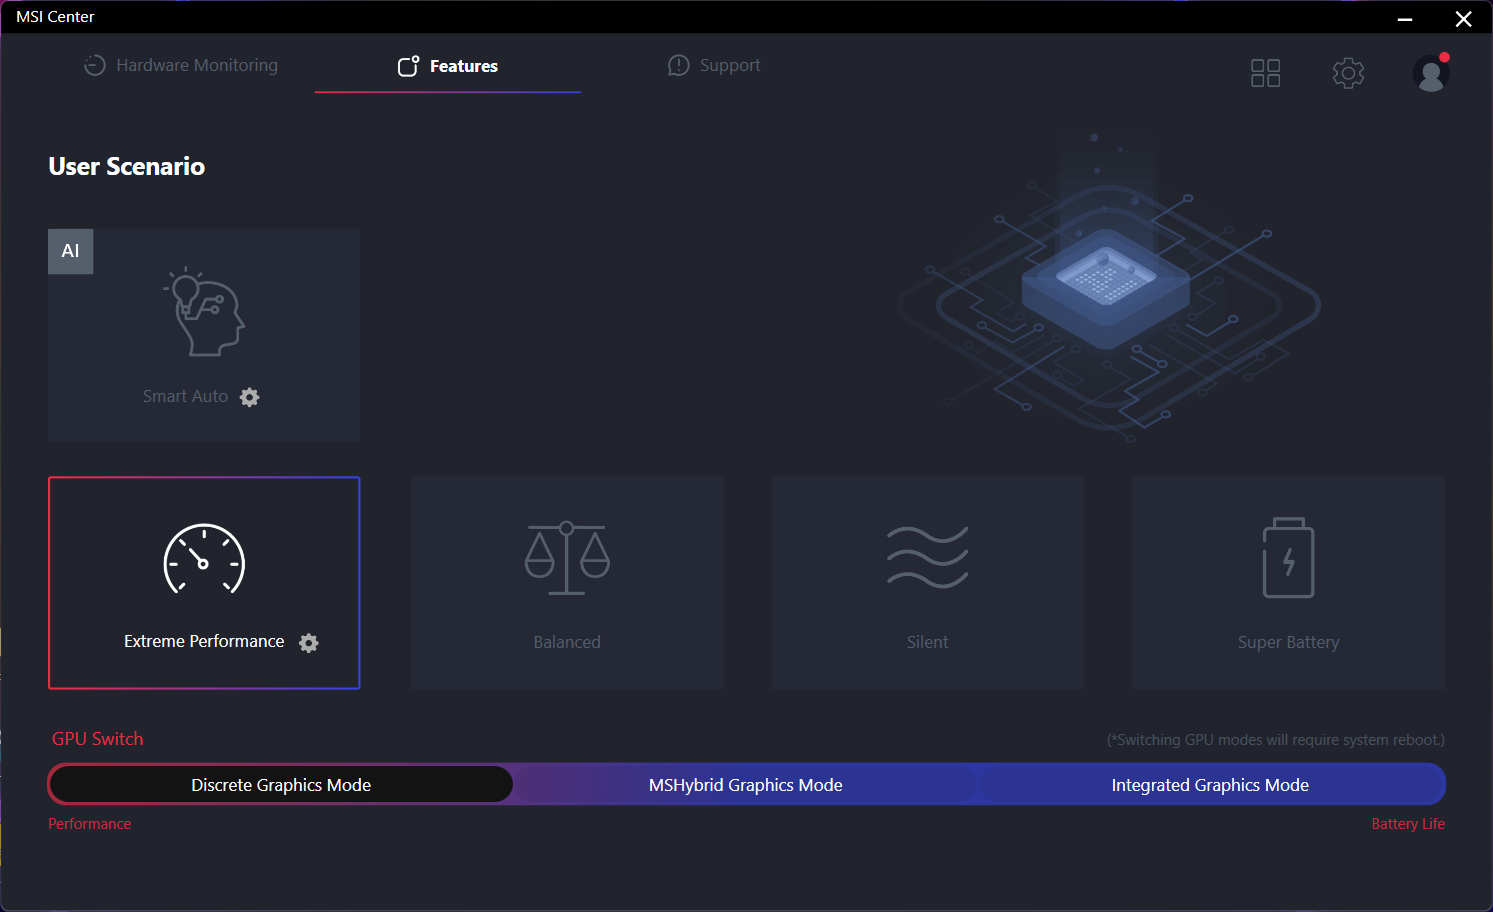
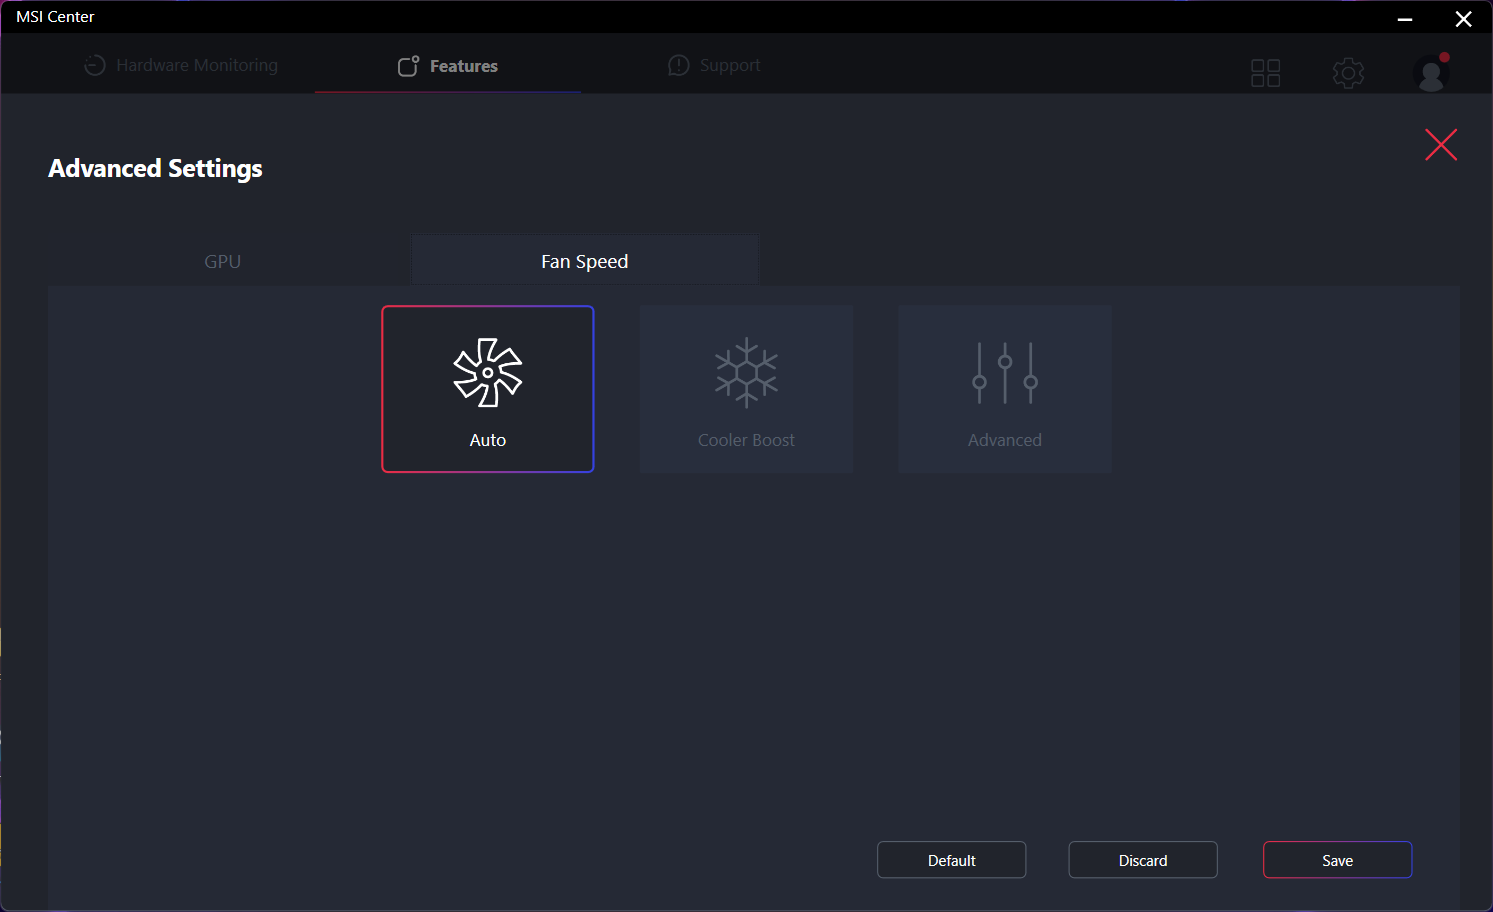
Nous avons réglé Windows sur le mode Performance et MSI Center sur le mode Performance extrême et le mode dGPU avant d'exécuter les benchmarks ci-dessous. Le MSI Center est le centre de contrôle pour les mises à jour du système, les données vitales, les profils d'alimentation, les modes GPU, etc. Cependant, les paramètres RGB sont gérés par une application distincte appelée SteelSeries GG.
Cooler Boost est un paramètre de sous-menu dans le mode Extreme Performance. En l'activant, les ventilateurs internes tourneront à leur vitesse maximale, quelle que soit la charge à l'écran.
La configuration RTX 4060 supporte MUX mais pas Advanced Optimus, ce qui signifie qu'un redémarrage est nécessaire pour basculer entre les modes dGPU, MSHybrid, et iGPU.
Processeur
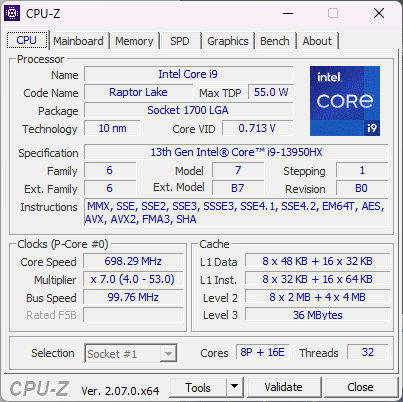
Les performances du processeur et la stabilité de la fréquence d'horloge sont excellentes, avec des résultats 5 à 10 % plus rapides que la moyenne des processeursCore i9-13950HX moyen de notre base de données ou presque deux fois plus rapide que le Core i7-13700H que l'on trouve généralement sur la plupart des autres ordinateurs portables de jeu. Il s'agit de l'un des processeurs mobiles les plus rapides du marché à l'heure actuelle et il est en concurrence avec les processeurs Zen 4 Ryzen 9 7945HX pour les trois premières places.
Passer à un processeur plus onéreux Core i9-13980HX ne devrait améliorer les performances que d'environ 5 %, d'après notre expérience avec l'Alienware m18 R1. Les avantages sont tellement marginaux que nous recommandons de s'en tenir au Core i9-13950HX pour économiser quelques centaines d'euros.
Cinebench R15 Multi Loop
Cinebench R23: Multi Core | Single Core
Cinebench R20: CPU (Multi Core) | CPU (Single Core)
Cinebench R15: CPU Multi 64Bit | CPU Single 64Bit
Blender: v2.79 BMW27 CPU
7-Zip 18.03: 7z b 4 | 7z b 4 -mmt1
Geekbench 5.5: Multi-Core | Single-Core
HWBOT x265 Benchmark v2.2: 4k Preset
LibreOffice : 20 Documents To PDF
R Benchmark 2.5: Overall mean
* ... Moindre est la valeur, meilleures sont les performances
AIDA64: FP32 Ray-Trace | FPU Julia | CPU SHA3 | CPU Queen | FPU SinJulia | FPU Mandel | CPU AES | CPU ZLib | FP64 Ray-Trace | CPU PhotoWorxx
| Performance rating | |
| Alienware m16 R1 AMD | |
| MSI Raider GE68HX 13VF | |
| Moyenne Intel Core i9-13950HX | |
| HP Omen 16-xf0376ng | |
| Asus ROG Zephyrus M16 GU604VY-NM042X | |
| Lenovo Legion Slim 7i 16 Gen 8 | |
| MSI GE67 HX 12UGS | |
| AIDA64 / FP32 Ray-Trace | |
| Alienware m16 R1 AMD | |
| MSI Raider GE68HX 13VF | |
| HP Omen 16-xf0376ng | |
| Moyenne Intel Core i9-13950HX (17993 - 28957, n=9) | |
| Asus ROG Zephyrus M16 GU604VY-NM042X | |
| Lenovo Legion Slim 7i 16 Gen 8 | |
| MSI GE67 HX 12UGS | |
| AIDA64 / FPU Julia | |
| Alienware m16 R1 AMD | |
| MSI Raider GE68HX 13VF | |
| Moyenne Intel Core i9-13950HX (89362 - 144303, n=9) | |
| HP Omen 16-xf0376ng | |
| Asus ROG Zephyrus M16 GU604VY-NM042X | |
| Lenovo Legion Slim 7i 16 Gen 8 | |
| MSI GE67 HX 12UGS | |
| AIDA64 / CPU SHA3 | |
| Alienware m16 R1 AMD | |
| MSI Raider GE68HX 13VF | |
| Moyenne Intel Core i9-13950HX (4518 - 7093, n=9) | |
| HP Omen 16-xf0376ng | |
| Asus ROG Zephyrus M16 GU604VY-NM042X | |
| MSI GE67 HX 12UGS | |
| Lenovo Legion Slim 7i 16 Gen 8 | |
| AIDA64 / CPU Queen | |
| Alienware m16 R1 AMD | |
| MSI Raider GE68HX 13VF | |
| Moyenne Intel Core i9-13950HX (131931 - 140103, n=8) | |
| Lenovo Legion Slim 7i 16 Gen 8 | |
| Asus ROG Zephyrus M16 GU604VY-NM042X | |
| HP Omen 16-xf0376ng | |
| MSI GE67 HX 12UGS | |
| AIDA64 / FPU SinJulia | |
| Alienware m16 R1 AMD | |
| MSI Raider GE68HX 13VF | |
| HP Omen 16-xf0376ng | |
| Moyenne Intel Core i9-13950HX (12318 - 17057, n=9) | |
| MSI GE67 HX 12UGS | |
| Asus ROG Zephyrus M16 GU604VY-NM042X | |
| Lenovo Legion Slim 7i 16 Gen 8 | |
| AIDA64 / FPU Mandel | |
| Alienware m16 R1 AMD | |
| MSI Raider GE68HX 13VF | |
| HP Omen 16-xf0376ng | |
| Moyenne Intel Core i9-13950HX (44372 - 71038, n=9) | |
| Asus ROG Zephyrus M16 GU604VY-NM042X | |
| Lenovo Legion Slim 7i 16 Gen 8 | |
| MSI GE67 HX 12UGS | |
| AIDA64 / CPU AES | |
| Moyenne Intel Core i9-13950HX (99981 - 204491, n=9) | |
| MSI Raider GE68HX 13VF | |
| MSI GE67 HX 12UGS | |
| Alienware m16 R1 AMD | |
| Asus ROG Zephyrus M16 GU604VY-NM042X | |
| Lenovo Legion Slim 7i 16 Gen 8 | |
| HP Omen 16-xf0376ng | |
| AIDA64 / CPU ZLib | |
| MSI Raider GE68HX 13VF | |
| Alienware m16 R1 AMD | |
| Moyenne Intel Core i9-13950HX (1263 - 2069, n=9) | |
| MSI GE67 HX 12UGS | |
| Lenovo Legion Slim 7i 16 Gen 8 | |
| Asus ROG Zephyrus M16 GU604VY-NM042X | |
| HP Omen 16-xf0376ng | |
| AIDA64 / FP64 Ray-Trace | |
| Alienware m16 R1 AMD | |
| MSI Raider GE68HX 13VF | |
| HP Omen 16-xf0376ng | |
| Moyenne Intel Core i9-13950HX (9649 - 15573, n=9) | |
| Asus ROG Zephyrus M16 GU604VY-NM042X | |
| Lenovo Legion Slim 7i 16 Gen 8 | |
| MSI GE67 HX 12UGS | |
| AIDA64 / CPU PhotoWorxx | |
| MSI Raider GE68HX 13VF | |
| Asus ROG Zephyrus M16 GU604VY-NM042X | |
| Moyenne Intel Core i9-13950HX (40233 - 50864, n=9) | |
| HP Omen 16-xf0376ng | |
| MSI GE67 HX 12UGS | |
| Alienware m16 R1 AMD | |
| Lenovo Legion Slim 7i 16 Gen 8 | |
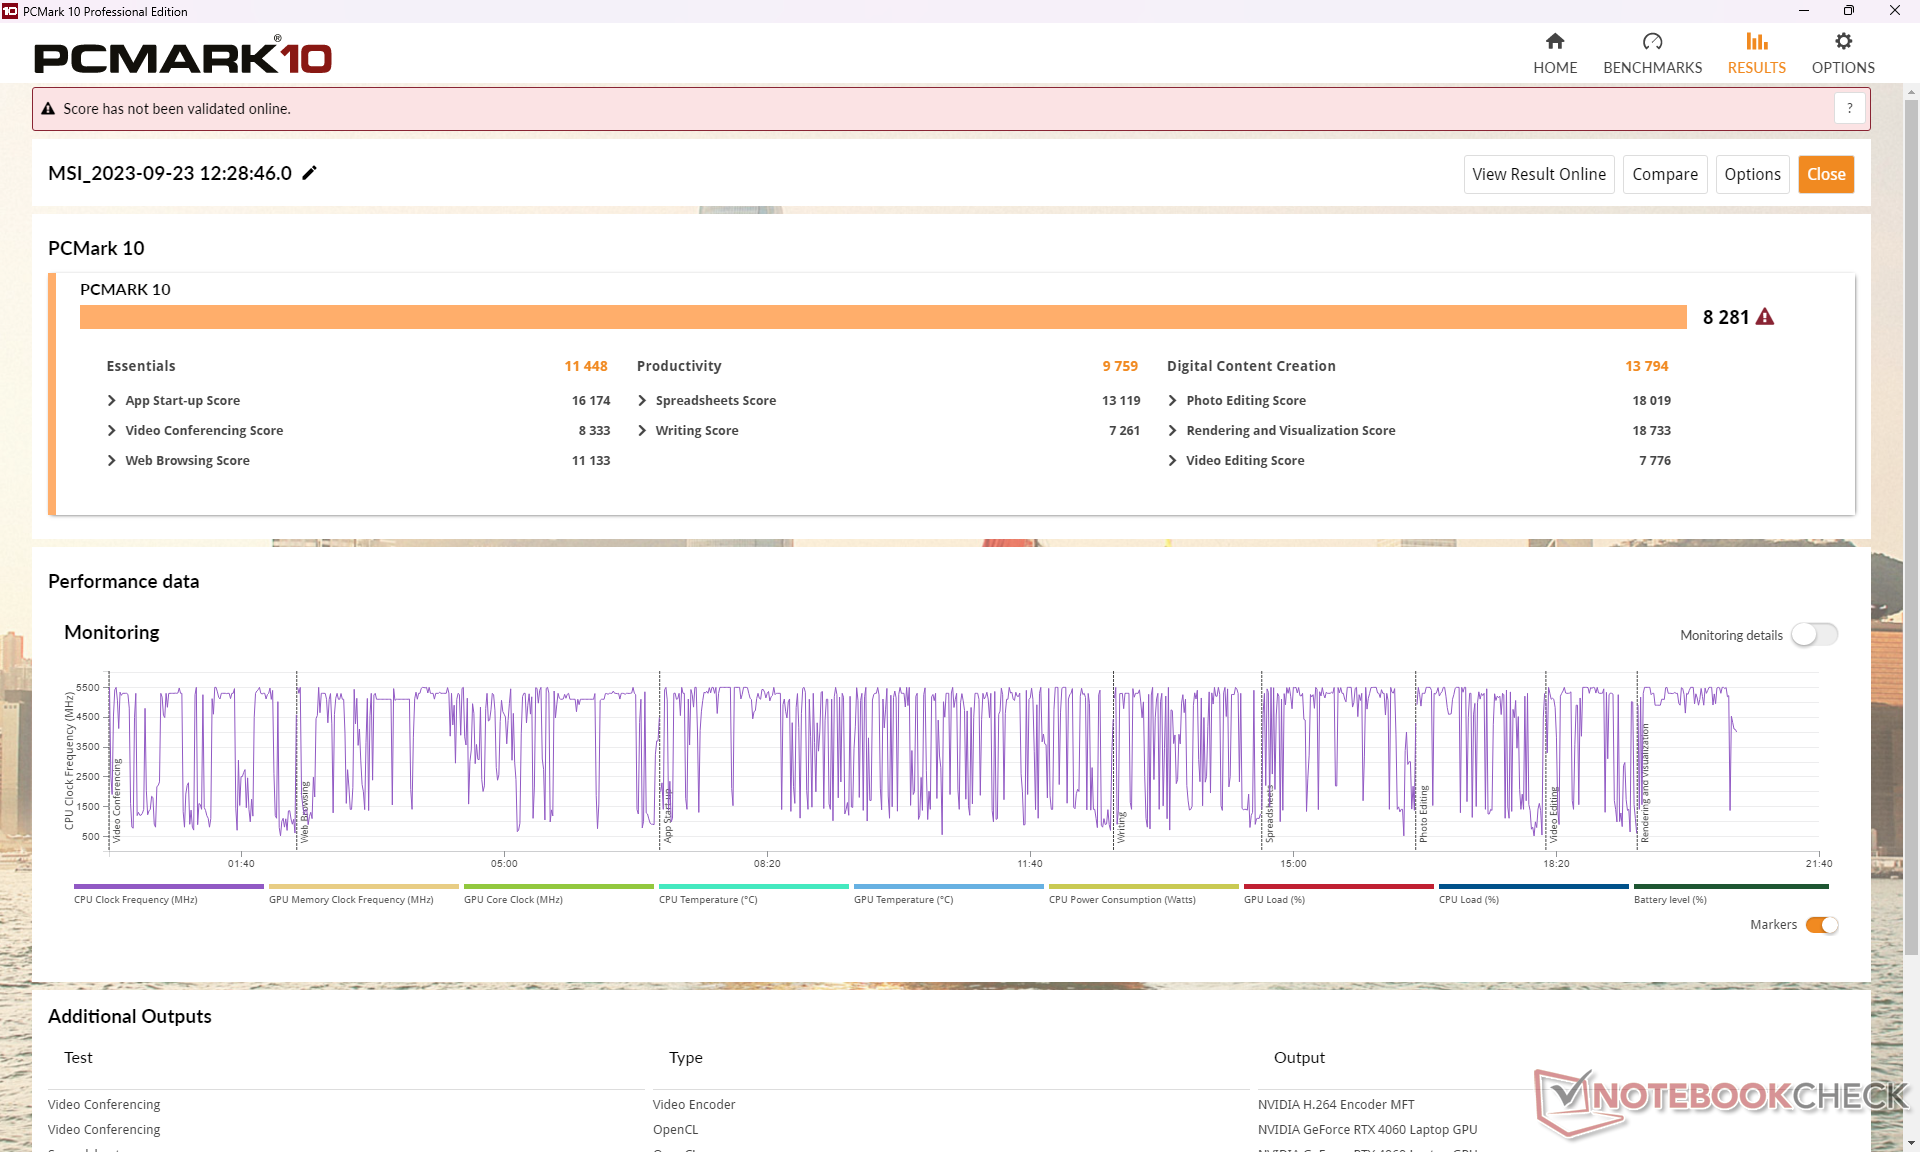
Performance du système
Les benchmarks PCMark sont comparables à ceux d'autres ordinateurs portables de jeu de 16 pouces, comme l'Alienware m16 R1 ou le Lenovo Legion Slim 7i 16 à quelques points de pourcentage près. Nous n'avons pas rencontré de problèmes de réveil ou d'autres problèmes notables avec notre unité de test pendant les tests.
CrossMark: Overall | Productivity | Creativity | Responsiveness
| PCMark 10 / Score | |
| Alienware m16 R1 AMD | |
| Lenovo Legion Slim 7i 16 Gen 8 | |
| MSI Raider GE68HX 13VF | |
| Moyenne Intel Core i9-13950HX, NVIDIA GeForce RTX 4060 Laptop GPU (n=1) | |
| Asus ROG Zephyrus M16 GU604VY-NM042X | |
| HP Omen 16-xf0376ng | |
| MSI GE67 HX 12UGS | |
| PCMark 10 / Essentials | |
| Asus ROG Zephyrus M16 GU604VY-NM042X | |
| Alienware m16 R1 AMD | |
| MSI Raider GE68HX 13VF | |
| Moyenne Intel Core i9-13950HX, NVIDIA GeForce RTX 4060 Laptop GPU (n=1) | |
| Lenovo Legion Slim 7i 16 Gen 8 | |
| HP Omen 16-xf0376ng | |
| MSI GE67 HX 12UGS | |
| PCMark 10 / Productivity | |
| Asus ROG Zephyrus M16 GU604VY-NM042X | |
| Lenovo Legion Slim 7i 16 Gen 8 | |
| Alienware m16 R1 AMD | |
| HP Omen 16-xf0376ng | |
| MSI GE67 HX 12UGS | |
| MSI Raider GE68HX 13VF | |
| Moyenne Intel Core i9-13950HX, NVIDIA GeForce RTX 4060 Laptop GPU (n=1) | |
| PCMark 10 / Digital Content Creation | |
| Alienware m16 R1 AMD | |
| MSI Raider GE68HX 13VF | |
| Moyenne Intel Core i9-13950HX, NVIDIA GeForce RTX 4060 Laptop GPU (n=1) | |
| Lenovo Legion Slim 7i 16 Gen 8 | |
| HP Omen 16-xf0376ng | |
| MSI GE67 HX 12UGS | |
| Asus ROG Zephyrus M16 GU604VY-NM042X | |
| CrossMark / Overall | |
| Alienware m16 R1 AMD | |
| Lenovo Legion Slim 7i 16 Gen 8 | |
| MSI GE67 HX 12UGS | |
| Asus ROG Zephyrus M16 GU604VY-NM042X | |
| MSI Raider GE68HX 13VF | |
| Moyenne Intel Core i9-13950HX, NVIDIA GeForce RTX 4060 Laptop GPU (n=1) | |
| CrossMark / Productivity | |
| Lenovo Legion Slim 7i 16 Gen 8 | |
| Alienware m16 R1 AMD | |
| MSI GE67 HX 12UGS | |
| Asus ROG Zephyrus M16 GU604VY-NM042X | |
| MSI Raider GE68HX 13VF | |
| Moyenne Intel Core i9-13950HX, NVIDIA GeForce RTX 4060 Laptop GPU (n=1) | |
| CrossMark / Creativity | |
| MSI Raider GE68HX 13VF | |
| Moyenne Intel Core i9-13950HX, NVIDIA GeForce RTX 4060 Laptop GPU (n=1) | |
| Asus ROG Zephyrus M16 GU604VY-NM042X | |
| Alienware m16 R1 AMD | |
| MSI GE67 HX 12UGS | |
| Lenovo Legion Slim 7i 16 Gen 8 | |
| CrossMark / Responsiveness | |
| MSI GE67 HX 12UGS | |
| Lenovo Legion Slim 7i 16 Gen 8 | |
| Alienware m16 R1 AMD | |
| Asus ROG Zephyrus M16 GU604VY-NM042X | |
| MSI Raider GE68HX 13VF | |
| Moyenne Intel Core i9-13950HX, NVIDIA GeForce RTX 4060 Laptop GPU (n=1) | |
| PCMark 10 Score | 8281 points | |
Aide | ||
| AIDA64 / Memory Copy | |
| MSI Raider GE68HX 13VF | |
| Moyenne Intel Core i9-13950HX (61938 - 78813, n=9) | |
| Asus ROG Zephyrus M16 GU604VY-NM042X | |
| HP Omen 16-xf0376ng | |
| MSI GE67 HX 12UGS | |
| Alienware m16 R1 AMD | |
| Lenovo Legion Slim 7i 16 Gen 8 | |
| AIDA64 / Memory Read | |
| MSI Raider GE68HX 13VF | |
| Moyenne Intel Core i9-13950HX (62368 - 86831, n=9) | |
| Asus ROG Zephyrus M16 GU604VY-NM042X | |
| HP Omen 16-xf0376ng | |
| MSI GE67 HX 12UGS | |
| Alienware m16 R1 AMD | |
| Lenovo Legion Slim 7i 16 Gen 8 | |
| AIDA64 / Memory Write | |
| HP Omen 16-xf0376ng | |
| MSI Raider GE68HX 13VF | |
| Moyenne Intel Core i9-13950HX (59501 - 80441, n=9) | |
| Asus ROG Zephyrus M16 GU604VY-NM042X | |
| MSI GE67 HX 12UGS | |
| Alienware m16 R1 AMD | |
| Lenovo Legion Slim 7i 16 Gen 8 | |
| AIDA64 / Memory Latency | |
| MSI GE67 HX 12UGS | |
| Alienware m16 R1 AMD | |
| HP Omen 16-xf0376ng | |
| Moyenne Intel Core i9-13950HX (84.4 - 99.5, n=9) | |
| Asus ROG Zephyrus M16 GU604VY-NM042X | |
| MSI Raider GE68HX 13VF | |
| Lenovo Legion Slim 7i 16 Gen 8 | |
* ... Moindre est la valeur, meilleures sont les performances
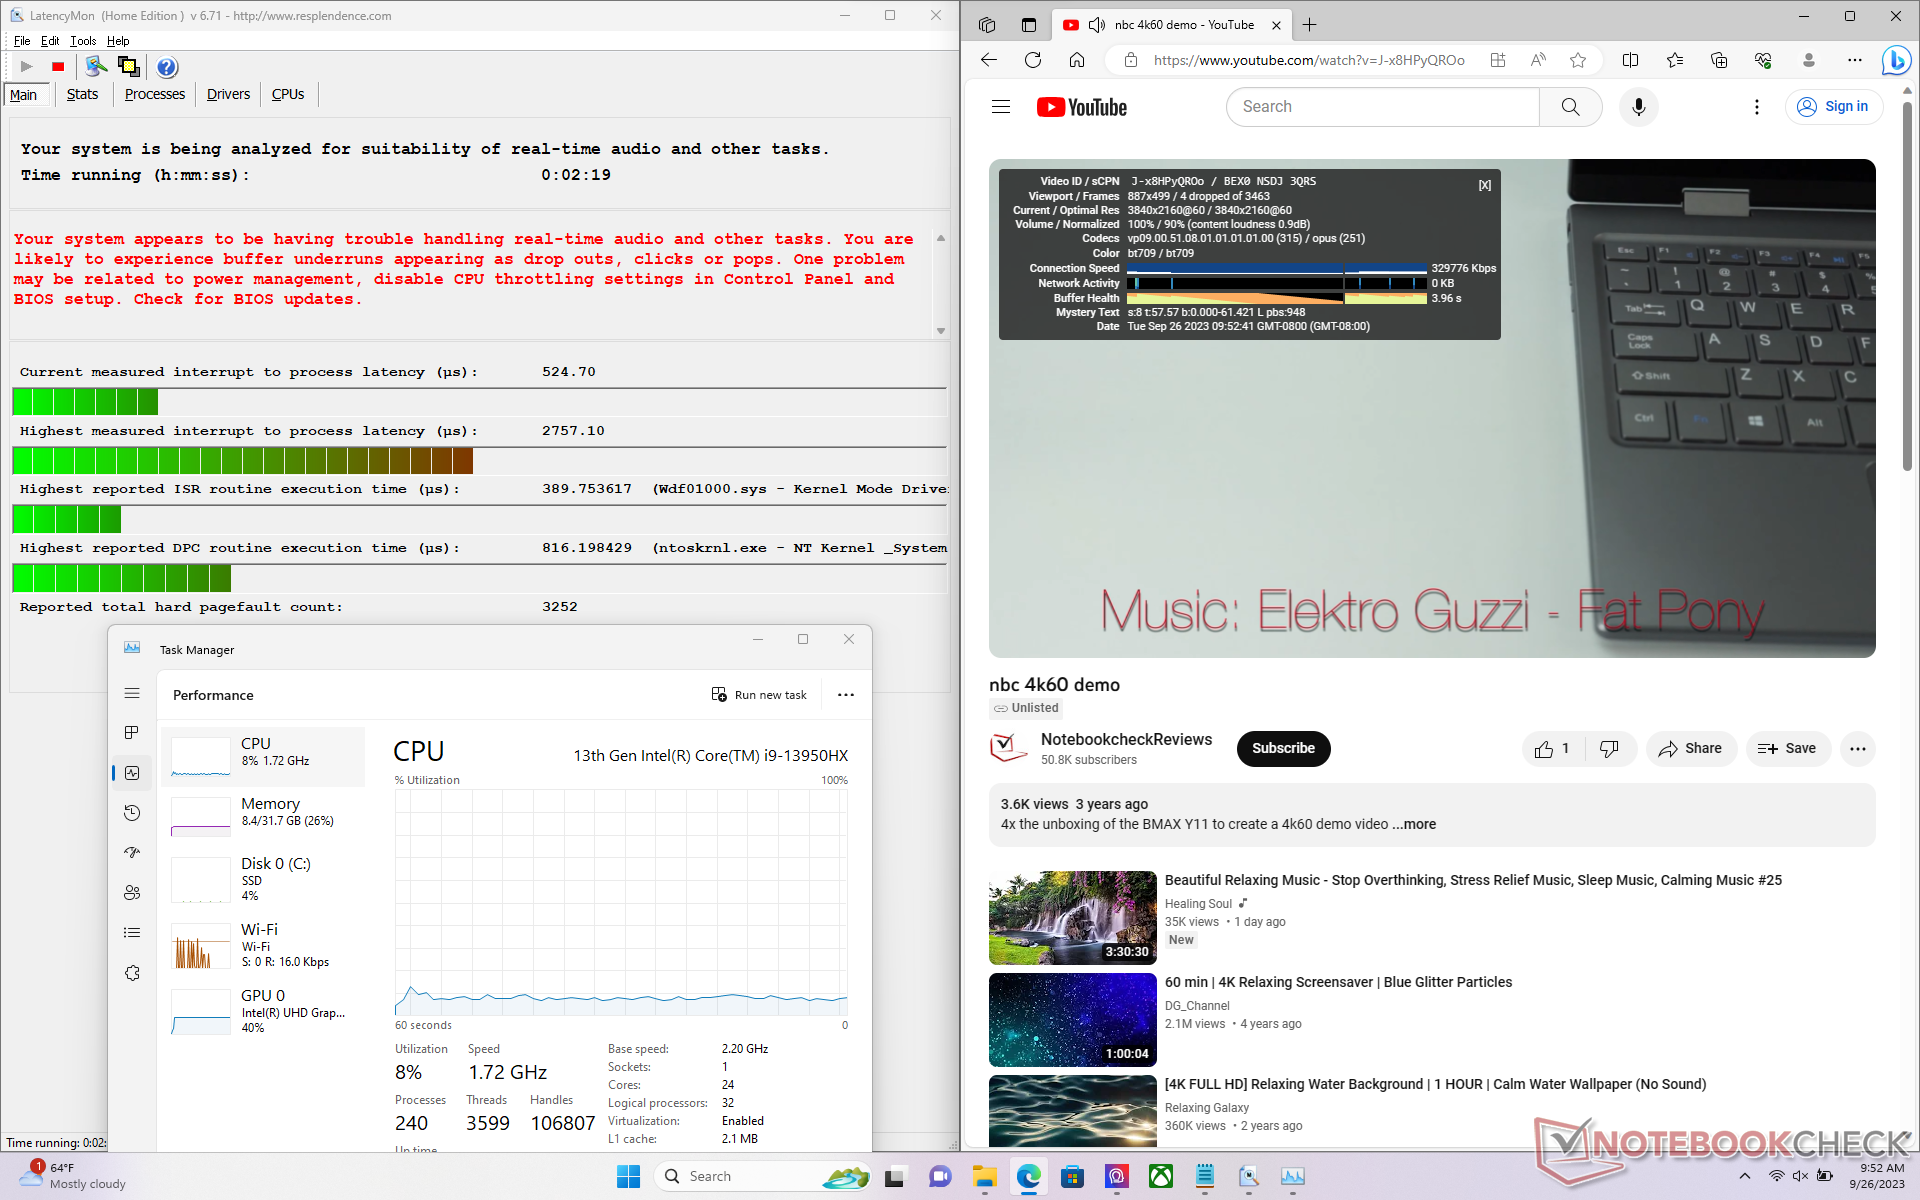
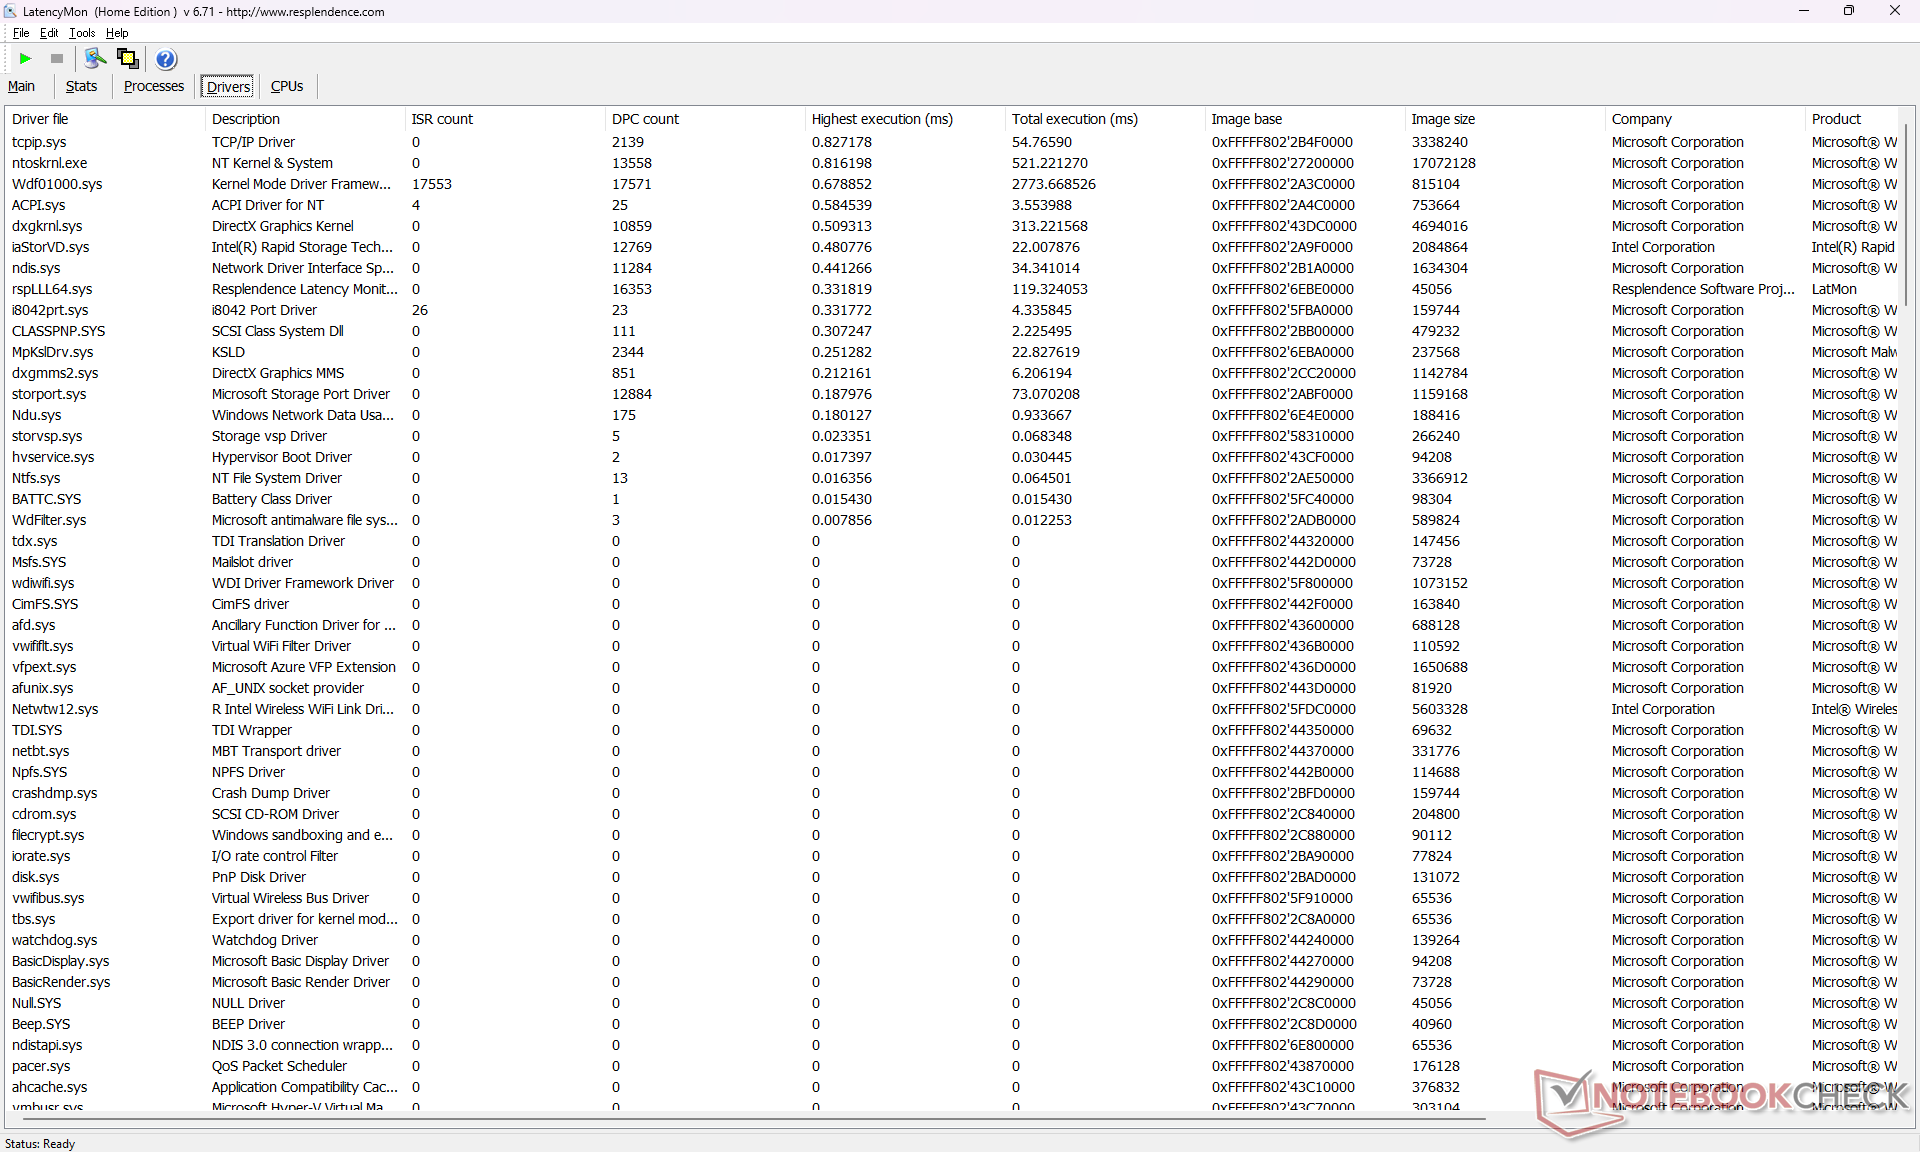
Latence DPC
LatencyMon révèle des problèmes de DPC lors de l'ouverture de plusieurs onglets de notre page d'accueil. la lecture de vidéos 4K à 60 FPS est imparfaite avec 4 images perdues enregistrées pendant une fenêtre de 60 secondes.
| DPC Latencies / LatencyMon - interrupt to process latency (max), Web, Youtube, Prime95 | |
| Lenovo Legion Slim 7i 16 Gen 8 | |
| Asus ROG Zephyrus M16 GU604VY-NM042X | |
| MSI Raider GE68HX 13VF | |
| HP Omen 16-xf0376ng | |
| Alienware m16 R1 AMD | |
| MSI GE67 HX 12UGS | |
* ... Moindre est la valeur, meilleures sont les performances
Dispositifs de stockage
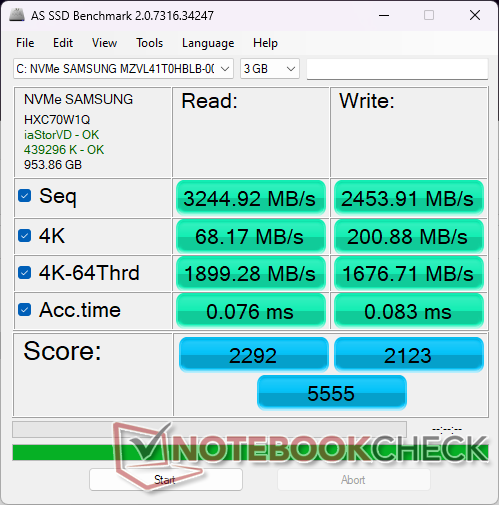
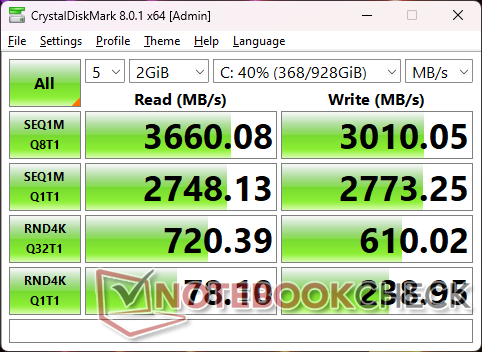
Notre appareil est livré avec le modèle moins cher de 1 TB Samsung PM9B1 au lieu du Samsung PM9A1, plus cher, probablement pour réduire les coûts. Le PM9B1 est presque deux fois moins rapide que le PM9A1, avec des taux de lecture séquentielle maximum d'environ 3600 Mo/s contre ~7000 Mo/s pour le PM9A1. Les performances du SSD sont néanmoins stables, sans ralentissement.

| Drive Performance rating - Percent | |
| MSI GE67 HX 12UGS | |
| Lenovo Legion Slim 7i 16 Gen 8 | |
| Alienware m16 R1 AMD | |
| Asus ROG Zephyrus M16 GU604VY-NM042X | |
| HP Omen 16-xf0376ng | |
| MSI Raider GE68HX 13VF -11! | |
* ... Moindre est la valeur, meilleures sont les performances
Disk Throttling: DiskSpd Read Loop, Queue Depth 8
Performance du GPU
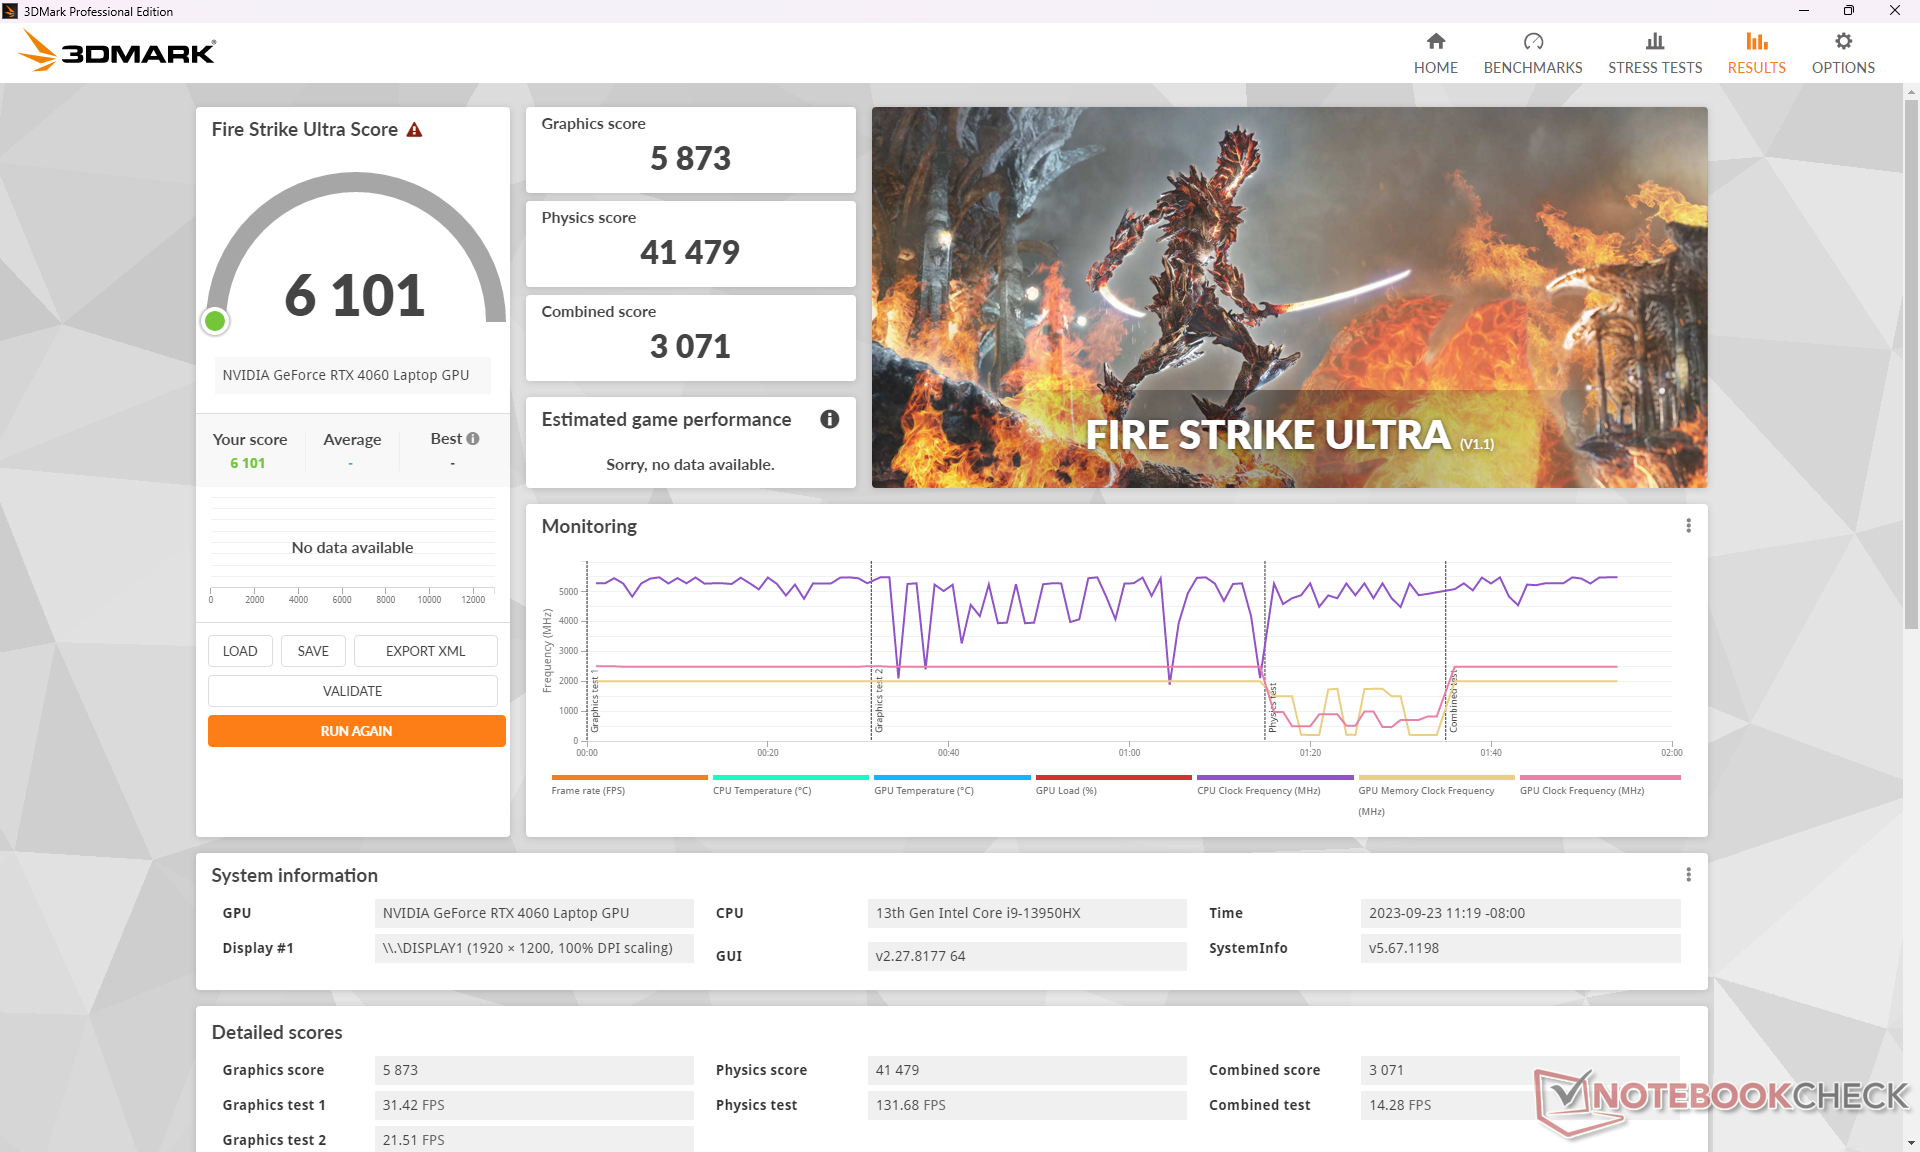
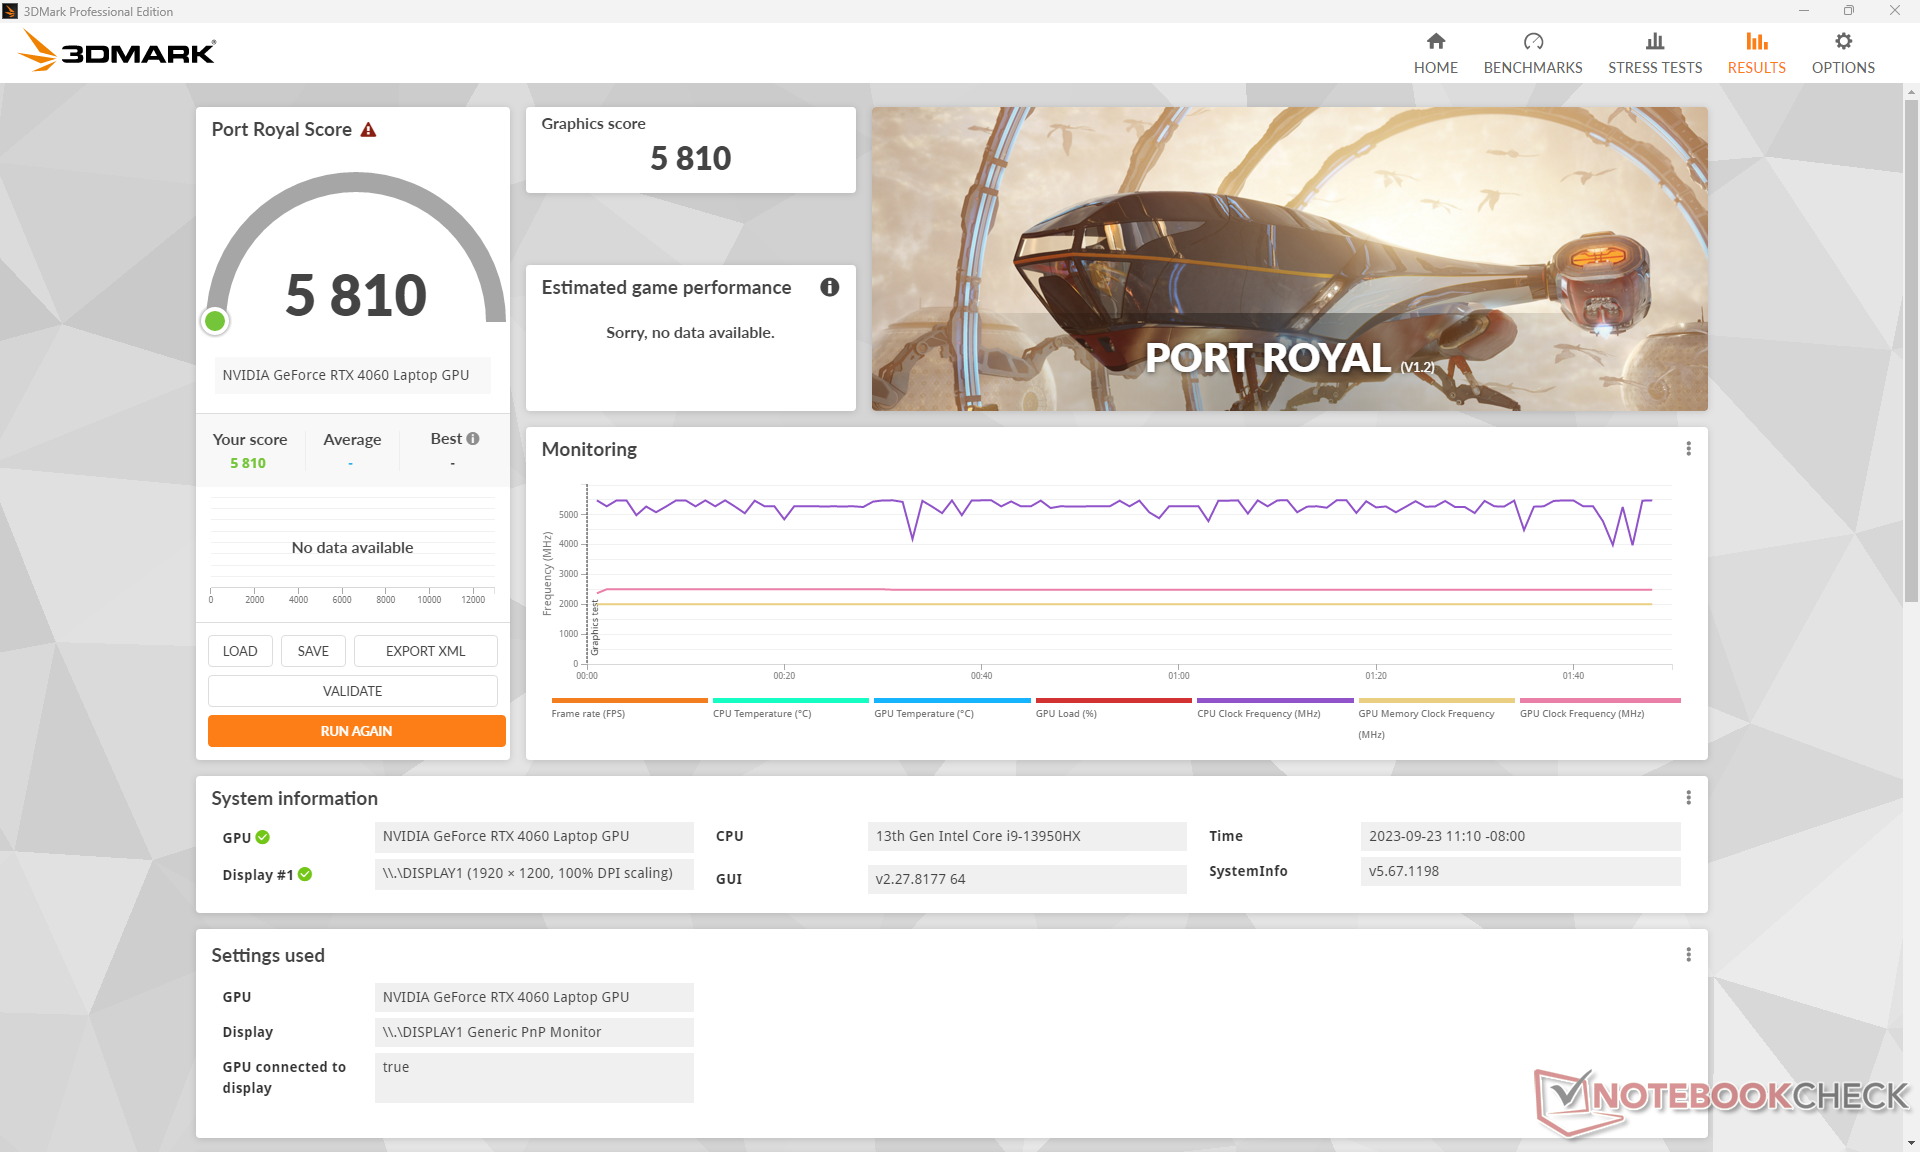
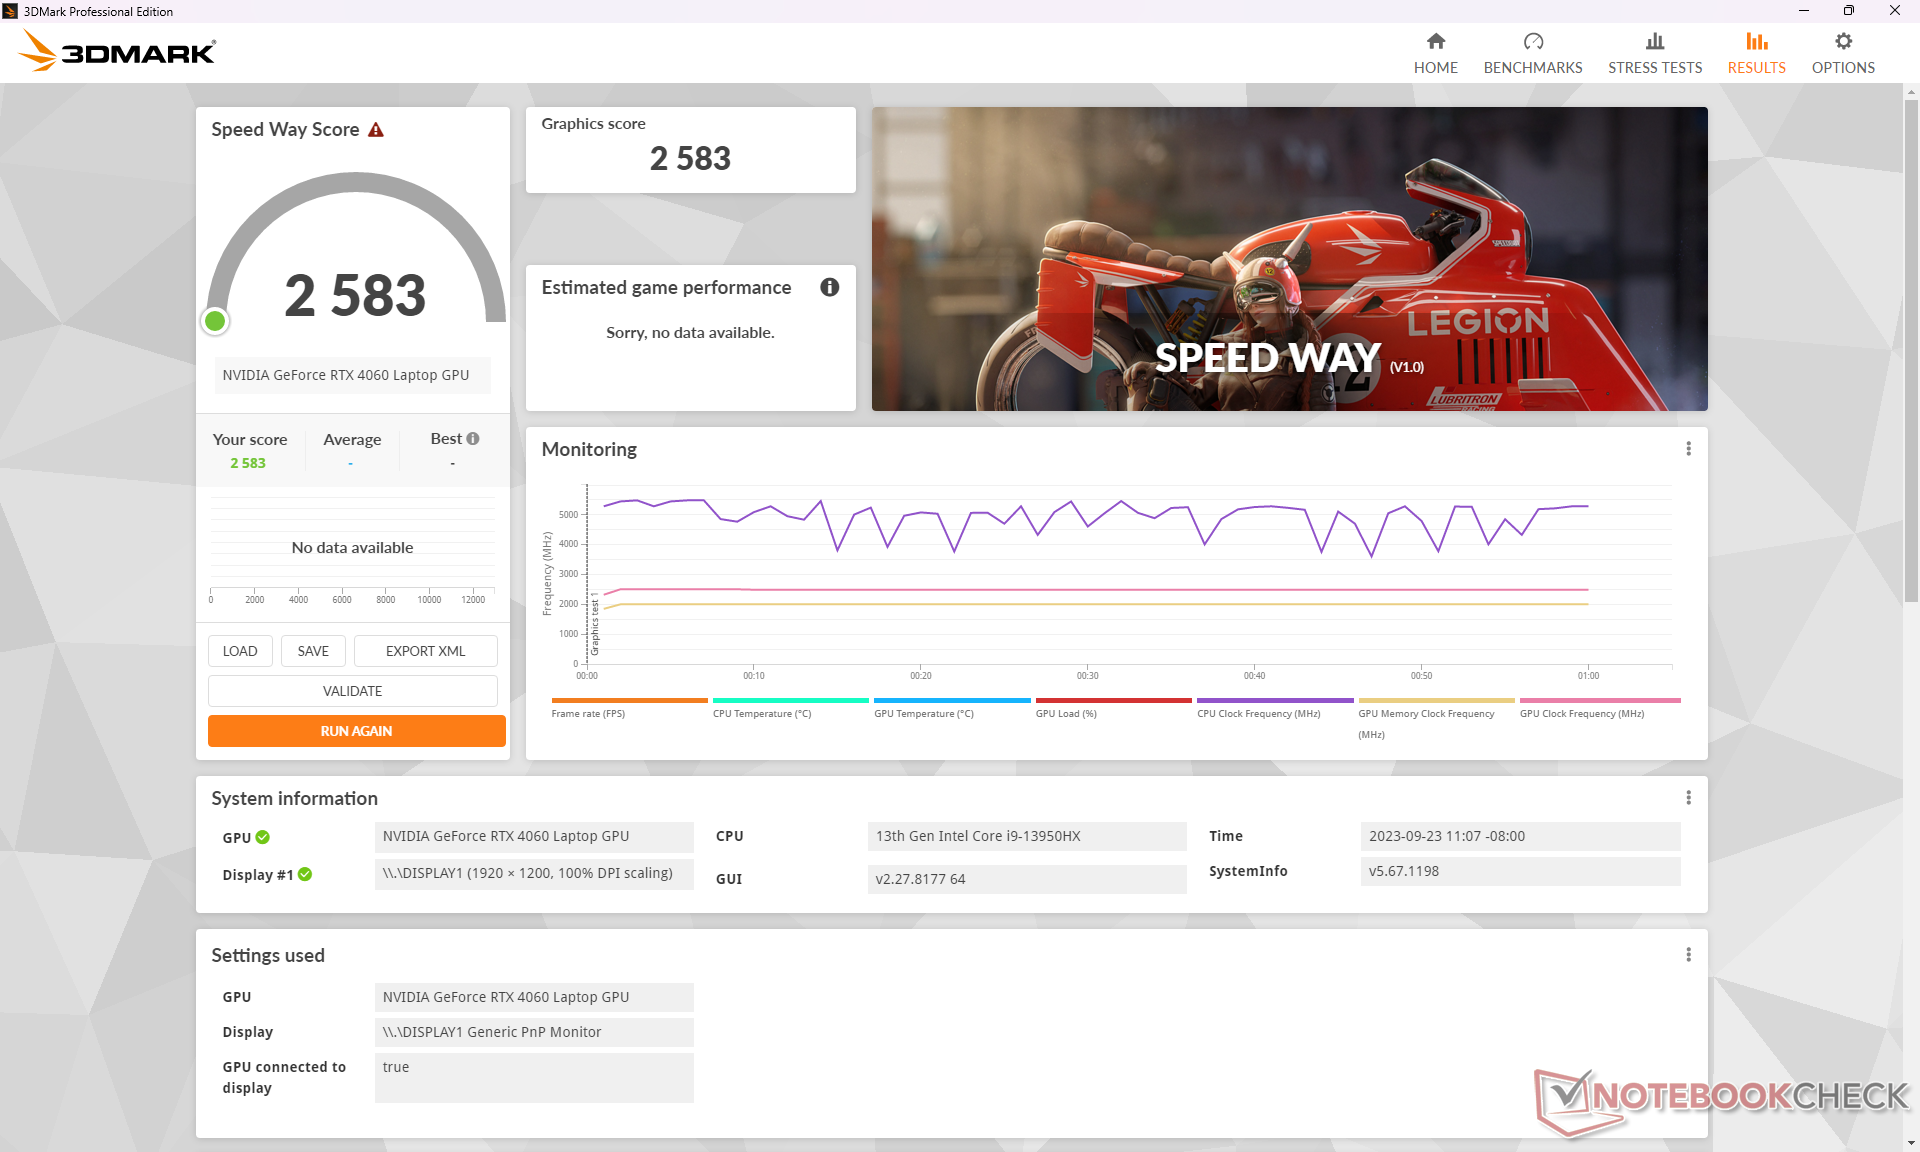
Notre RTX 4060 se comporte bien avec des résultats légèrement supérieurs à la moyenne des ordinateurs portables de jeu de notre base de données équipés du même GPU. En passant à la RTX 4070, 4080 ou 4090 devrait améliorer les performances de 10 à 20 %, 60 à 80 % et 80 à 100 %, respectivement, par rapport à la RTX 4060. L'écart de performance est le plus important entre les RTX 4070 et 4080.
MSI a programmé le MSI Center pour qu'il passe automatiquement en mode Extreme Performance dès qu'il détecte que 3DMark est en cours d'exécution et il n'y a malheureusement pas de moyen facile de désactiver ce mode. Nous trouvons cela frustrant car cela enlève le contrôle à l'utilisateur final. La commutation automatique ne se produit pas lorsque des jeux sont en cours d'exécution.
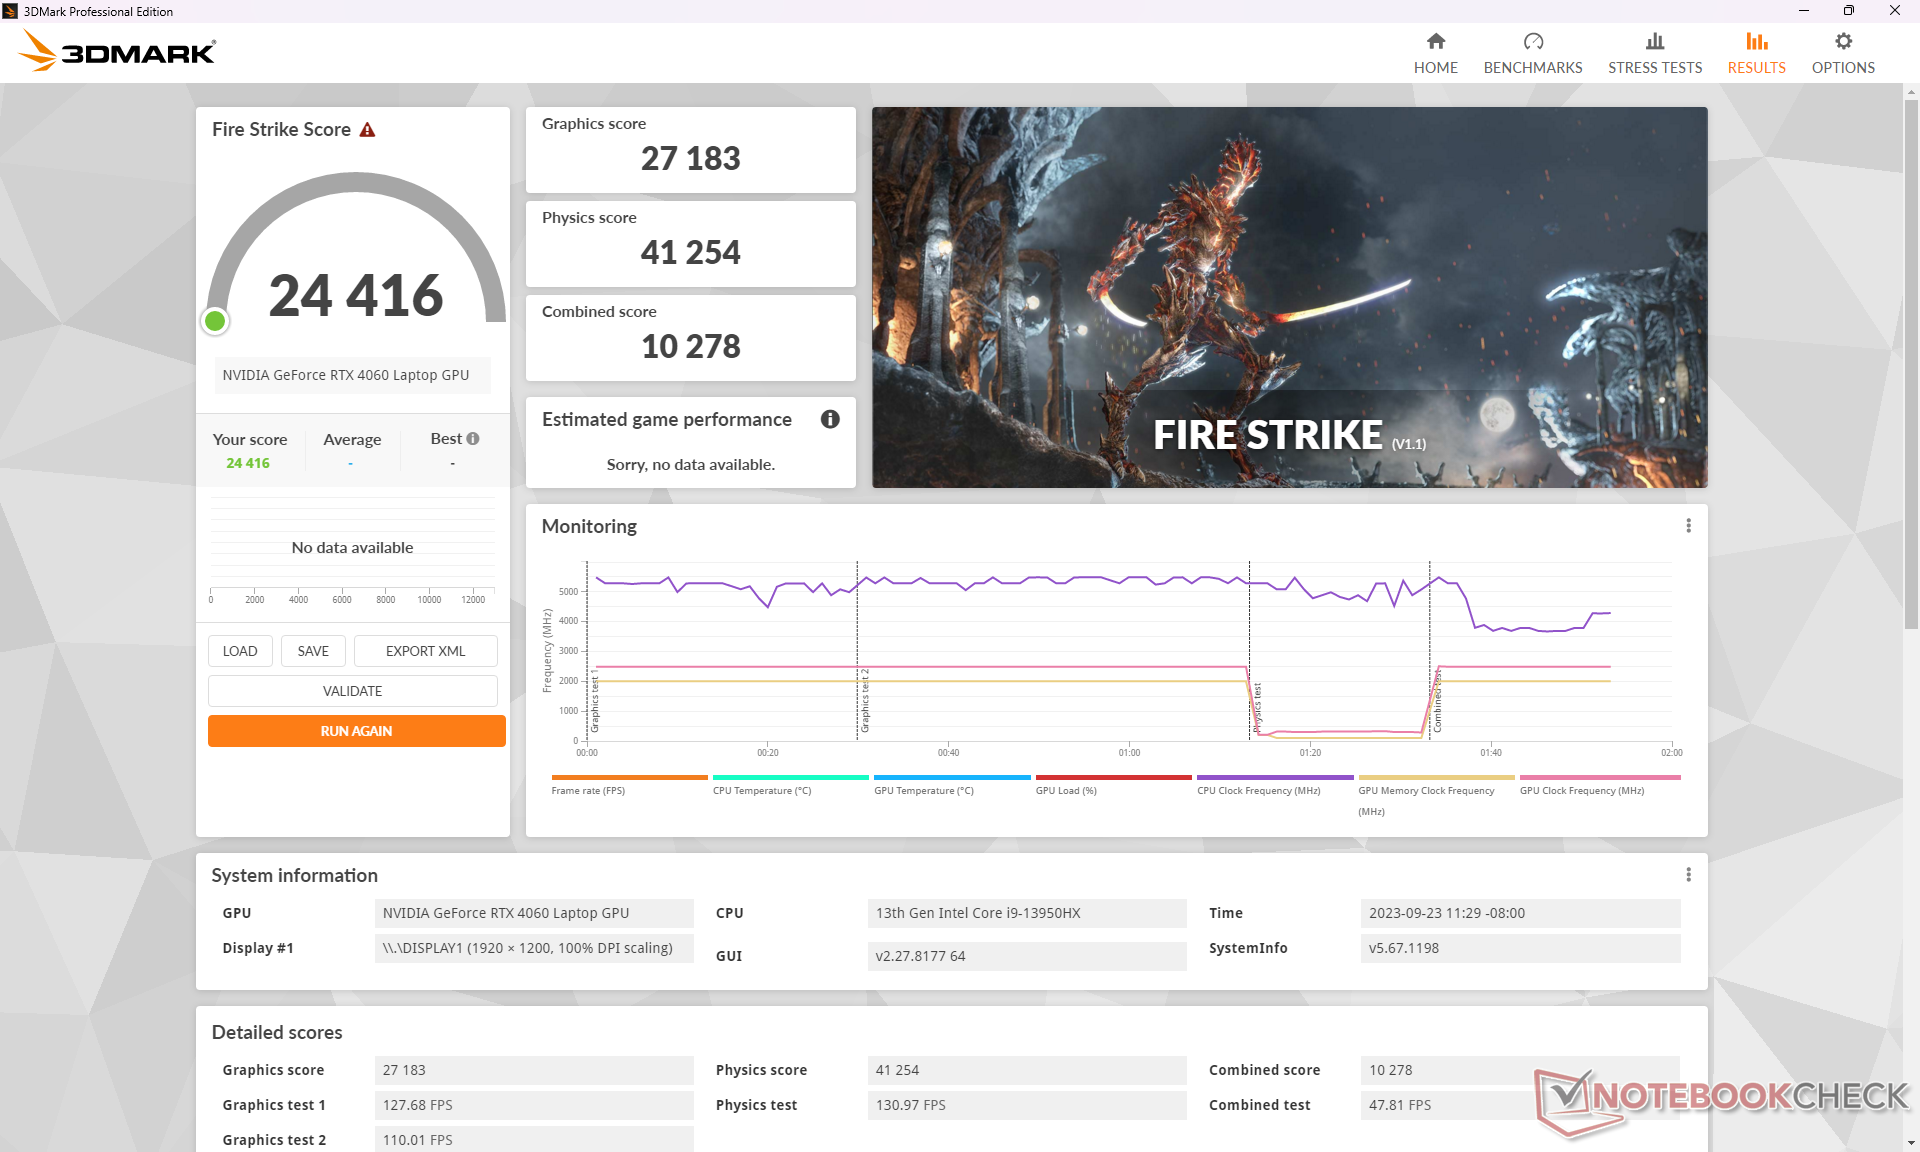
L'activation de Cooler Boost ne semble pas avoir d'impact significatif sur les performances du CPU ou du GPU, comme le montrent les résultats de notre site Fire Strike ci-dessous. Cette fonction n'est donc pas indispensable pour obtenir des performances maximales et n'est recommandée que si l'on souhaite obtenir des températures de fonctionnement plus basses.
| Profil de puissance | Fire Strike Graphique | Fire Strike Physique | Score combiné |
| Mode Performance extrême (Cooler Boost activé) | 27127 | 41525 | 11480 |
| Mode performances extrêmes (Cooler Boost désactivé) | 27183 (0%) | 41254 (-1%) | 10278 (-10%) |
| Puissance de la batterie | 19528 (-28%) | 18623 (-55%) | 5986 (-48%) |
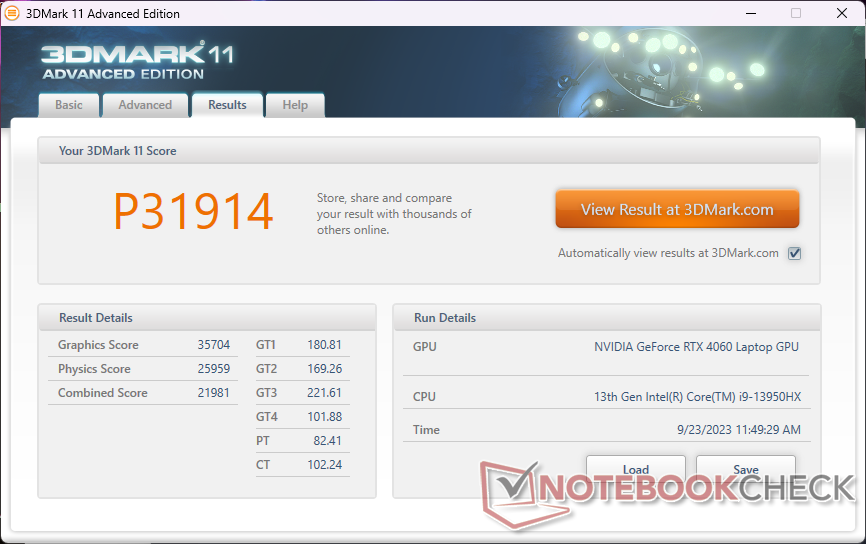
| 3DMark 11 Performance | 31914 points | |
| 3DMark Fire Strike Score | 24416 points | |
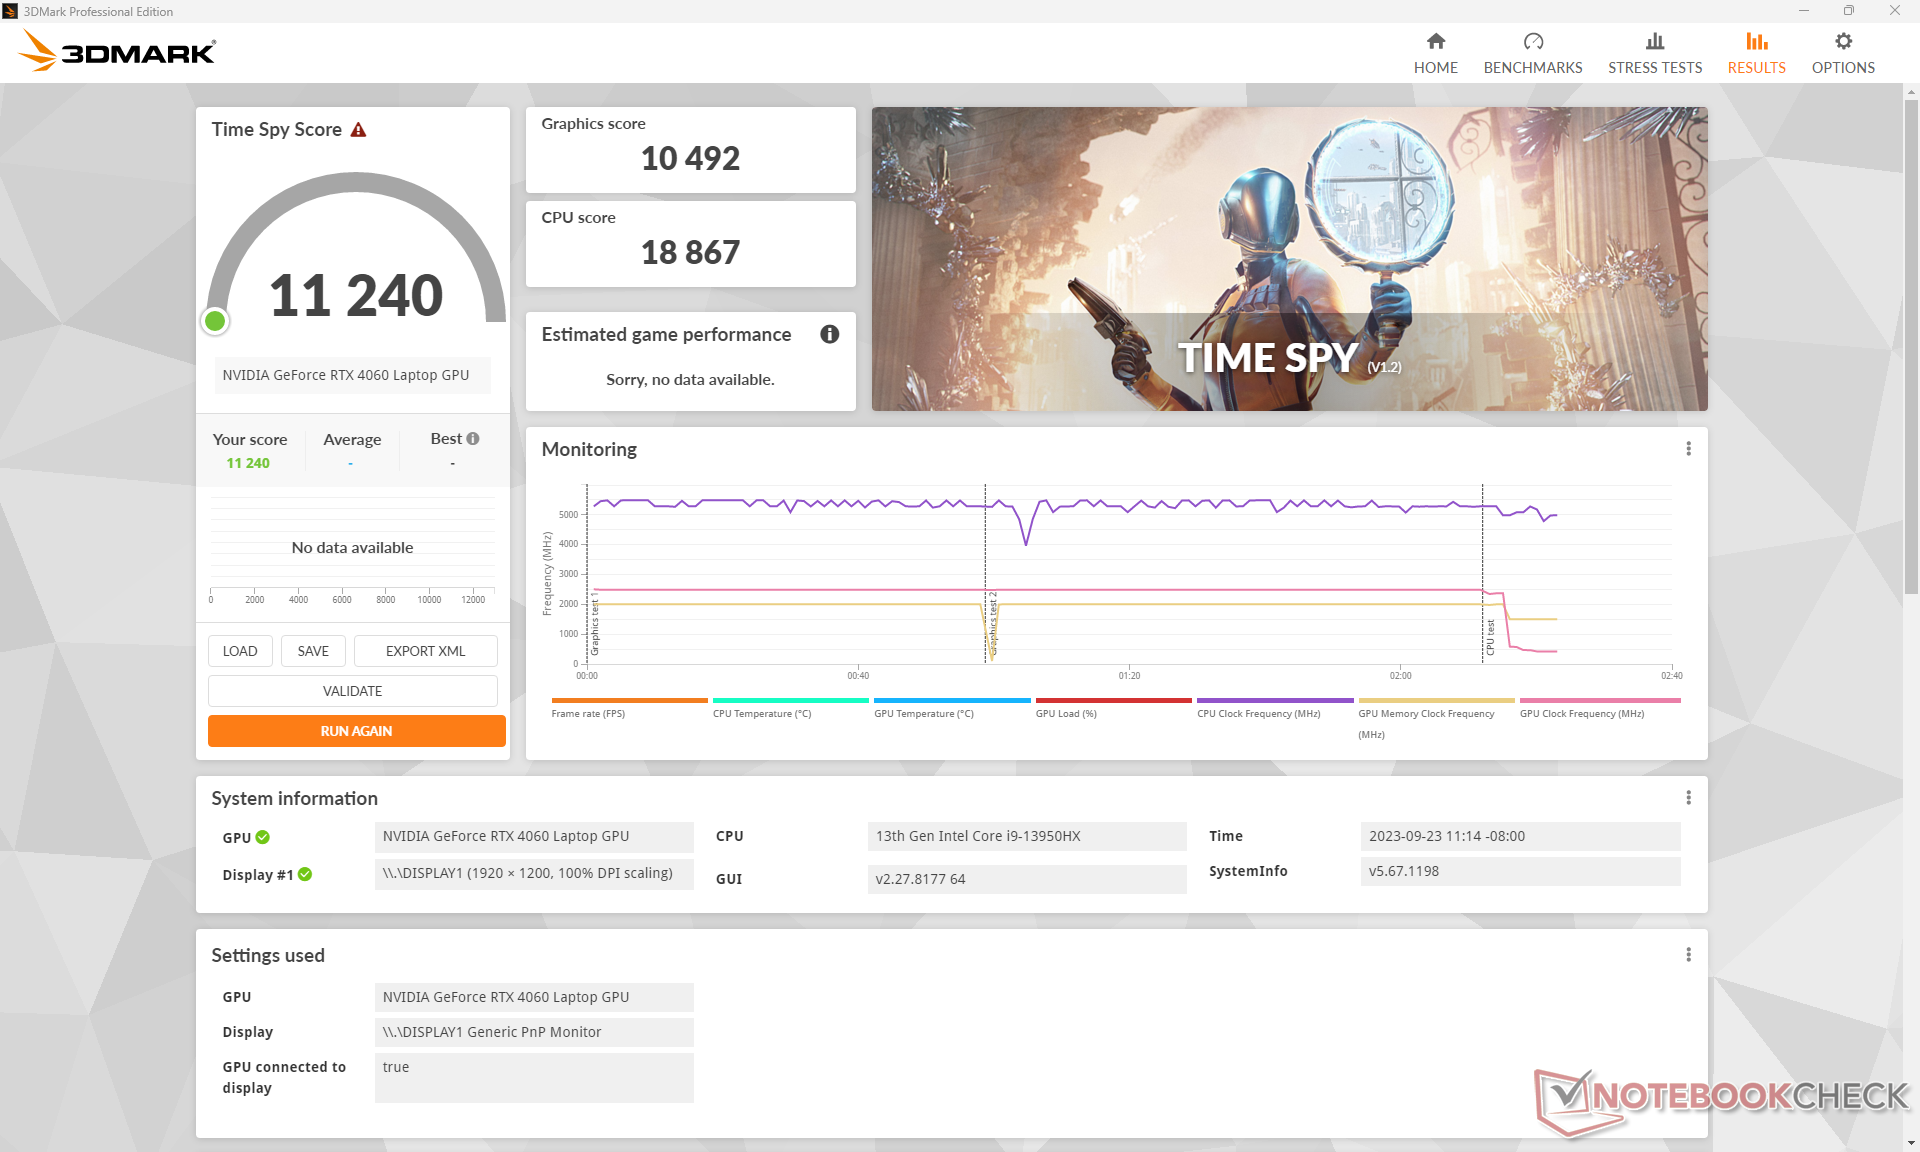
| 3DMark Time Spy Score | 11240 points | |
Aide | ||
* ... Moindre est la valeur, meilleures sont les performances
Performance des jeux
Tout comme la RTX 2060 et la RTX 3060 avant elle, la RTX 4060 est parfaite pour les jeux en 1080p60. Tous les jeux testés tournent très bien en 1080p, mais les jeux plus récents et plus exigeants comme Ratchet and Clank Rift Apart ont tendance à descendre en dessous de 60 FPS. Des paramètres plus bas ou le DLSS sont recommandés dans de tels cas, d'autant plus que l'écran principal ne supporte pas le G-Sync.
| Tiny Tina's Wonderlands | |
| 1920x1080 Low Preset (DX12) | |
| Alienware m16 R1 AMD | |
| Lenovo Legion Slim 7i 16 Gen 8 | |
| MSI Raider GE68HX 13VF | |
| Moyenne NVIDIA GeForce RTX 4060 Laptop GPU (164.4 - 235, n=9) | |
| 1920x1080 Medium Preset (DX12) | |
| Alienware m16 R1 AMD | |
| Lenovo Legion Slim 7i 16 Gen 8 | |
| MSI Raider GE68HX 13VF | |
| Moyenne NVIDIA GeForce RTX 4060 Laptop GPU (116 - 192.3, n=9) | |
| 1920x1080 High Preset (DX12) | |
| Alienware m16 R1 AMD | |
| Lenovo Legion Slim 7i 16 Gen 8 | |
| MSI Raider GE68HX 13VF | |
| Moyenne NVIDIA GeForce RTX 4060 Laptop GPU (86.6 - 121.2, n=10) | |
| 1920x1080 Badass Preset (DX12) | |
| Asus Zephyrus Duo 16 GX650PY-NM006W | |
| Alienware m16 R1 AMD | |
| Lenovo Legion Slim 7i 16 Gen 8 | |
| MSI Raider GE68HX 13VF | |
| Moyenne NVIDIA GeForce RTX 4060 Laptop GPU (67.5 - 92.7, n=11) | |
| Ratchet & Clank Rift Apart | |
| 1920x1080 Low Preset | |
| Moyenne NVIDIA GeForce RTX 4060 Laptop GPU (84.7 - 86, n=3) | |
| MSI Raider GE68HX 13VF | |
| 1920x1080 Medium Preset AA:T | |
| MSI Raider GE68HX 13VF | |
| Moyenne NVIDIA GeForce RTX 4060 Laptop GPU (73.4 - 75, n=4) | |
| 1920x1080 High Preset AA:T | |
| Moyenne NVIDIA GeForce RTX 4060 Laptop GPU (59 - 60.6, n=4) | |
| MSI Raider GE68HX 13VF | |
| 1920x1080 Very High Preset AA:T | |
| Moyenne NVIDIA GeForce RTX 4060 Laptop GPU (51.6 - 54.8, n=4) | |
| MSI Raider GE68HX 13VF | |
Witcher 3 FPS Chart
| Bas | Moyen | Élevé | Ultra | |
|---|---|---|---|---|
| The Witcher 3 (2015) | 556.3 | 364.9 | 213.1 | 103.5 |
| Dota 2 Reborn (2015) | 232 | 207 | 199 | 182.2 |
| Final Fantasy XV Benchmark (2018) | 223 | 151.3 | 103.2 | |
| X-Plane 11.11 (2018) | 209 | 184 | 141.1 | |
| Far Cry 5 (2018) | 191 | 158 | 147 | 138 |
| Strange Brigade (2018) | 487 | 291 | 232 | 194 |
| Cyberpunk 2077 1.6 (2022) | 129.1 | 103 | 88.3 | 80.4 |
| Tiny Tina's Wonderlands (2022) | 233.9 | 184.6 | 116.5 | 88.3 |
| F1 22 (2022) | 288 | 271 | 206 | 65.5 |
| Ratchet & Clank Rift Apart (2023) | 84.7 | 75 | 59 | 51.6 |
Émissions
Bruit du système - Le mode équilibré est recommandé dans la plupart des cas
Le bruit du ventilateur est mitigé. Les deux ventilateurs sont très sensibles aux charges à l'écran, ce qui signifie qu'ils monteront en puissance rapidement et brusquement lors du lancement d'applications ou de la navigation sur Internet, même en mode équilibré. Le bruit du ventilateur est également audible en mode silencieux, mais les pulsations sont beaucoup moins fréquentes. En général, les utilisateurs peuvent s'attendre à un niveau sonore compris entre 25 et 38 dB(A) lorsqu'ils naviguent ou regardent des vidéos en streaming, même en mode silencieux.
Le bruit du ventilateur lors des jeux peut varier considérablement en fonction du profil d'alimentation sélectionné. En mode équilibré ou performance extrême, le bruit du ventilateur peut varier considérablement Witcher 3 en mode équilibré ou performance extrême, le niveau sonore est respectivement de 46,2 dB(A) et 57 dB(A). Si le mode Cooler Boost est activé, le niveau sonore maximal grimpe à 60,1 dB(A), ce qui en fait l'un des ordinateurs portables de jeu de 16 pouces les plus bruyants. Heureusement, la perte de performance graphique en mode équilibré est très marginale et les paramètres Extreme Performance et Cooler Boost ne sont donc recommandés que si vous souhaitez des températures de fonctionnement plus basses ou si vous overclockez manuellement le GPU.
Degré de la nuisance sonore
| Au repos |
| 25 / 31.3 / 37.5 dB(A) |
| Fortement sollicité |
| 44 / 60.1 dB(A) |
 | ||
30 dB silencieux 40 dB(A) audible 50 dB(A) bruyant |
||
min: | ||
| MSI Raider GE68HX 13VF GeForce RTX 4060 Laptop GPU, i9-13950HX, Samsung PM9B1 1024GB MZVL41T0HBLB | MSI GE67 HX 12UGS GeForce RTX 3070 Ti Laptop GPU, i7-12800HX, Samsung PM9A1 MZVL21T0HCLR | HP Omen 16-xf0376ng GeForce RTX 4070 Laptop GPU, R7 7840HS, WDC PC SN810 512GB | Alienware m16 R1 AMD GeForce RTX 4080 Laptop GPU, R9 7845HX, Kioxia XG8 KXG80ZNV1T02 | Lenovo Legion Slim 7i 16 Gen 8 GeForce RTX 4070 Laptop GPU, i9-13900H, Samsung PM9A1 MZVL21T0HCLR | Asus ROG Zephyrus M16 GU604VY-NM042X GeForce RTX 4090 Laptop GPU, i9-13900H, Samsung PM9A1 MZVL22T0HBLB | |
|---|---|---|---|---|---|---|
| Noise | 12% | 9% | 12% | 16% | 5% | |
| arrêt / environnement * (dB) | 23.3 | 22.7 3% | 24 -3% | 22.9 2% | 22.8 2% | 24 -3% |
| Idle Minimum * (dB) | 25 | 22.9 8% | 25 -0% | 22.9 8% | 23.6 6% | 24 4% |
| Idle Average * (dB) | 31.3 | 22.9 27% | 29 7% | 29.7 5% | 23.6 25% | 29.96 4% |
| Idle Maximum * (dB) | 37.5 | 22.9 39% | 32 15% | 29.7 21% | 25.7 31% | 34.27 9% |
| Load Average * (dB) | 44 | 44.4 -1% | 44 -0% | 29.8 32% | 27.6 37% | 35.89 18% |
| Witcher 3 ultra * (dB) | 57 | 55.7 2% | 44 23% | 54.7 4% | 54.4 5% | 57.5 -1% |
| Load Maximum * (dB) | 60.1 | 57.4 4% | 46 23% | 54.7 9% | 54.4 9% | 57.54 4% |
* ... Moindre est la valeur, meilleures sont les performances
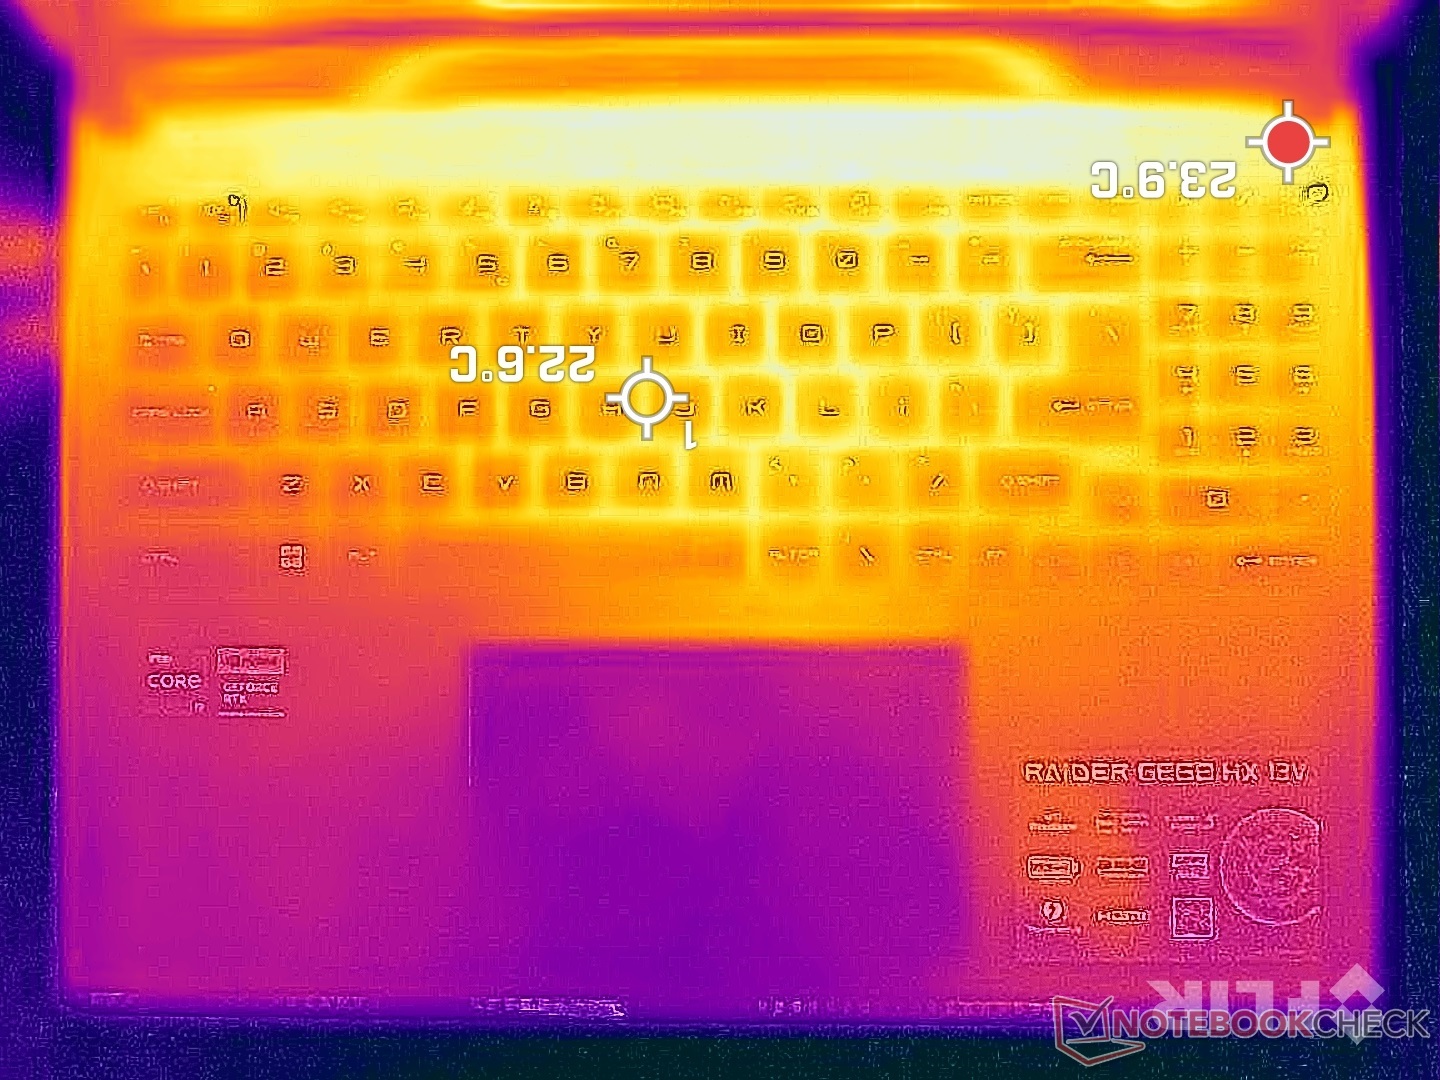
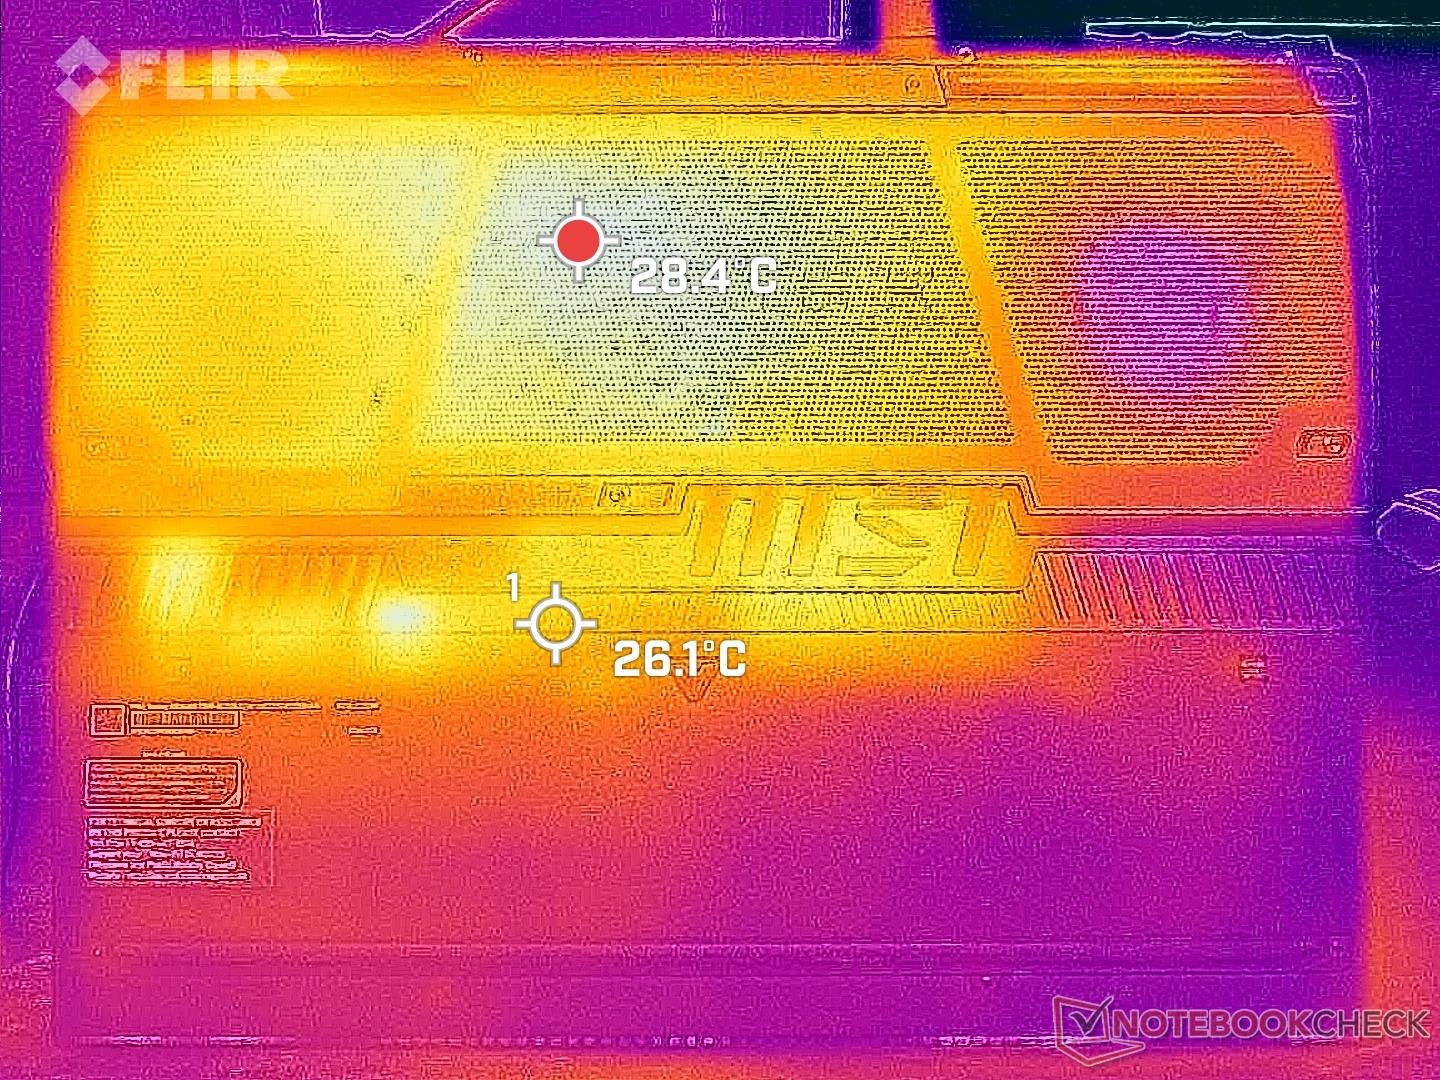
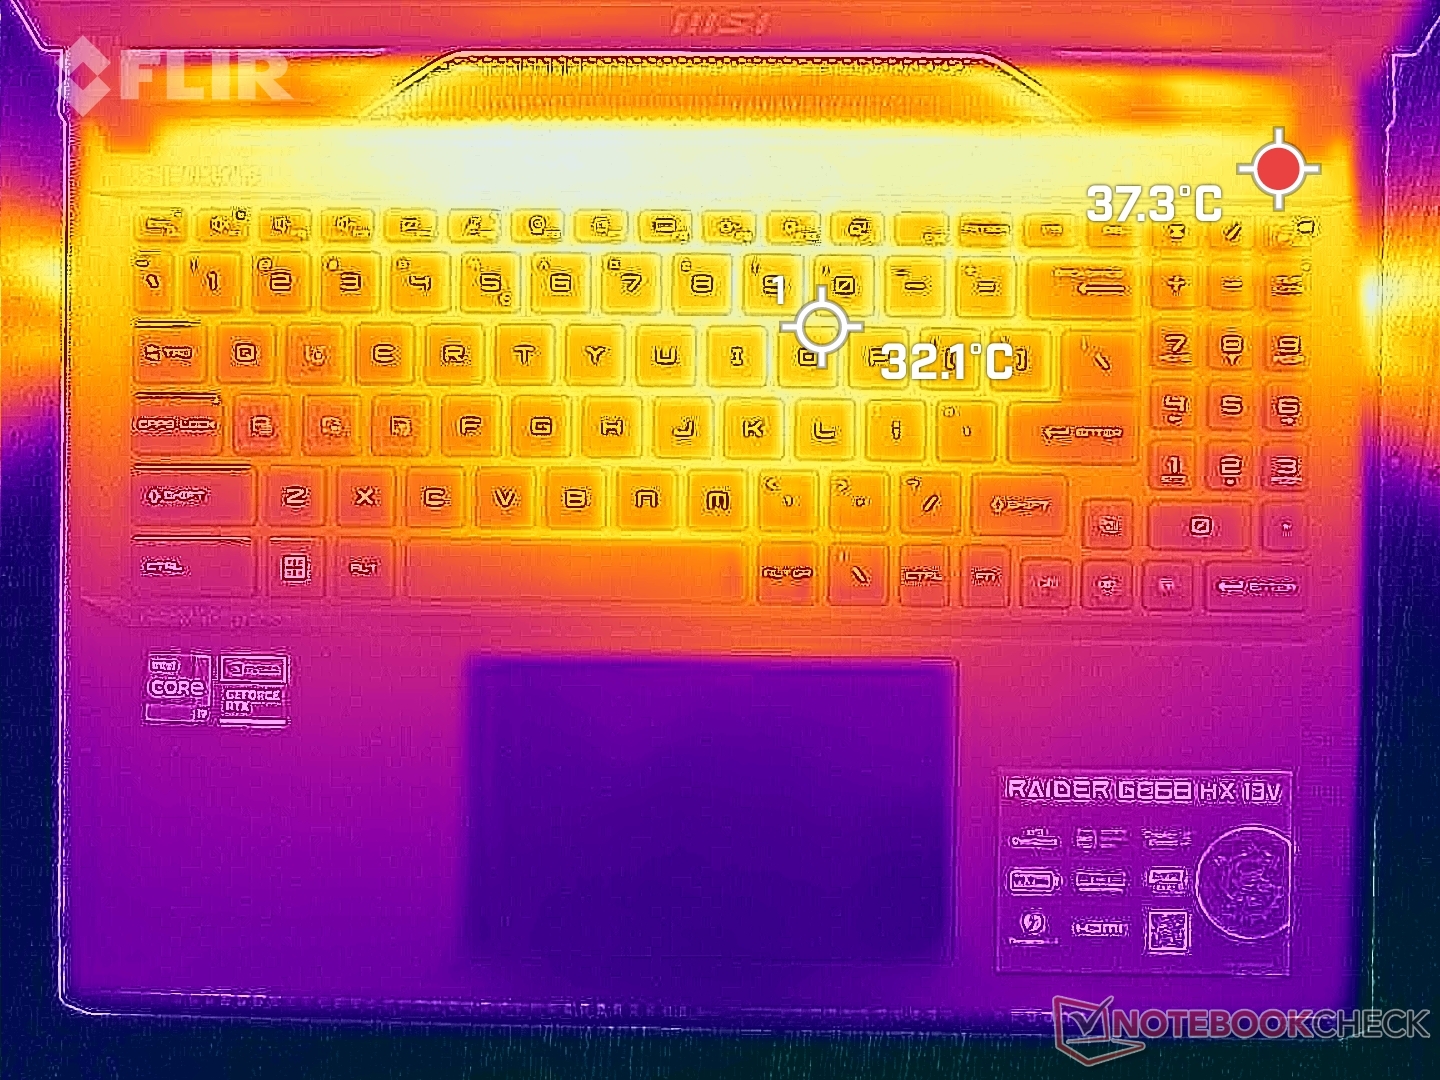
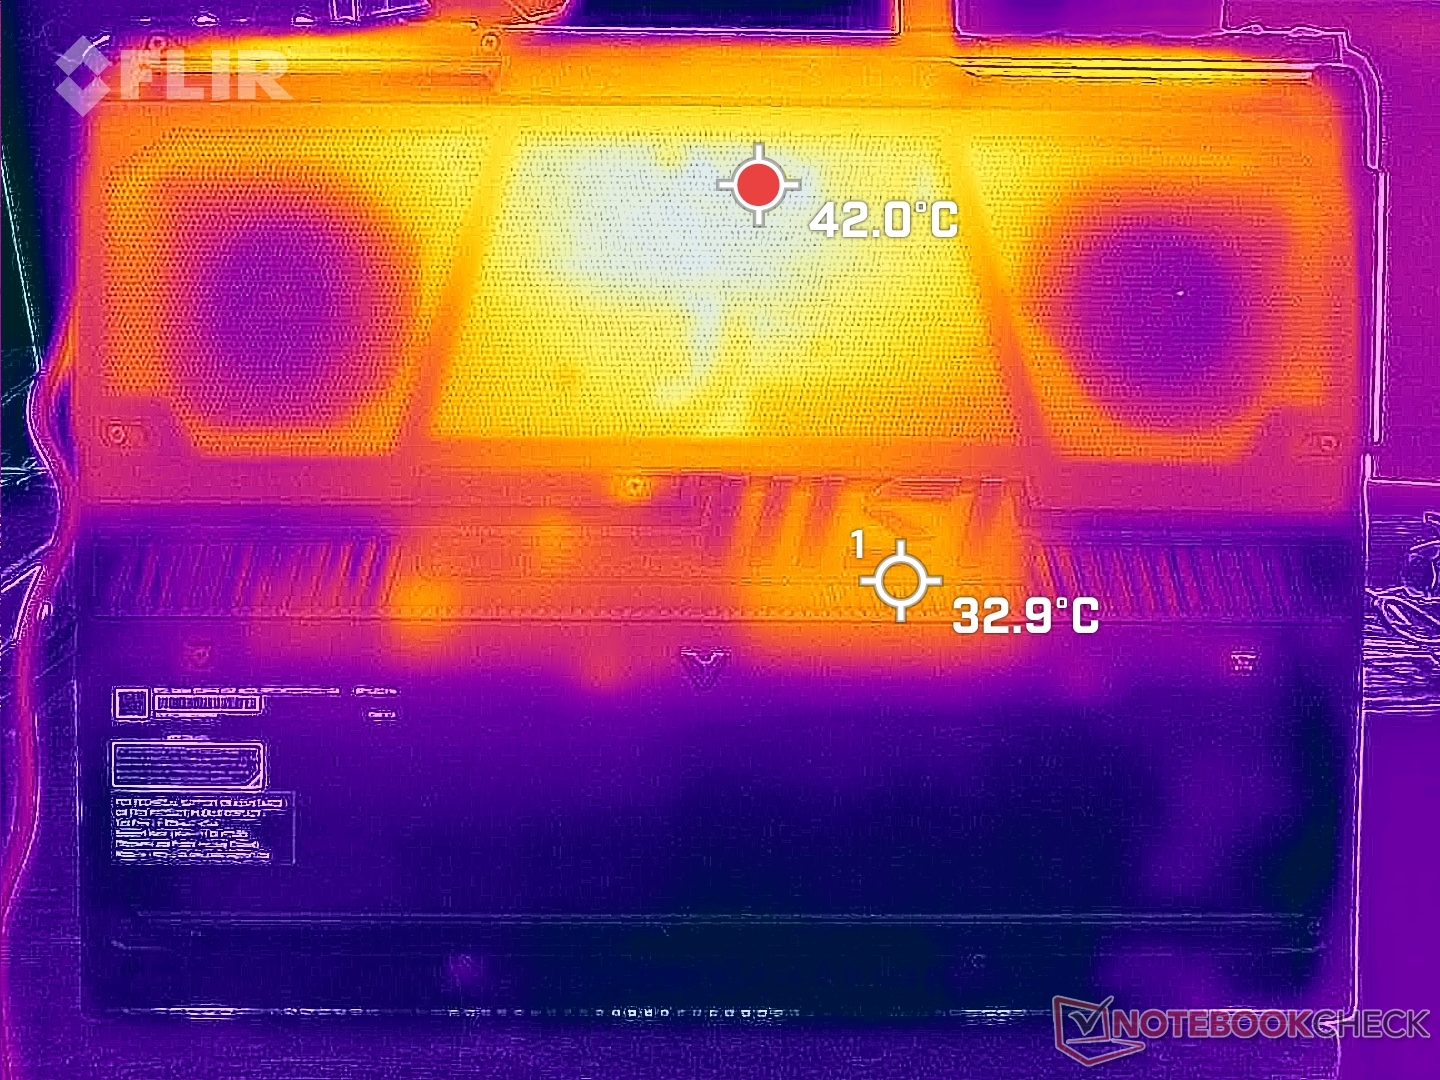
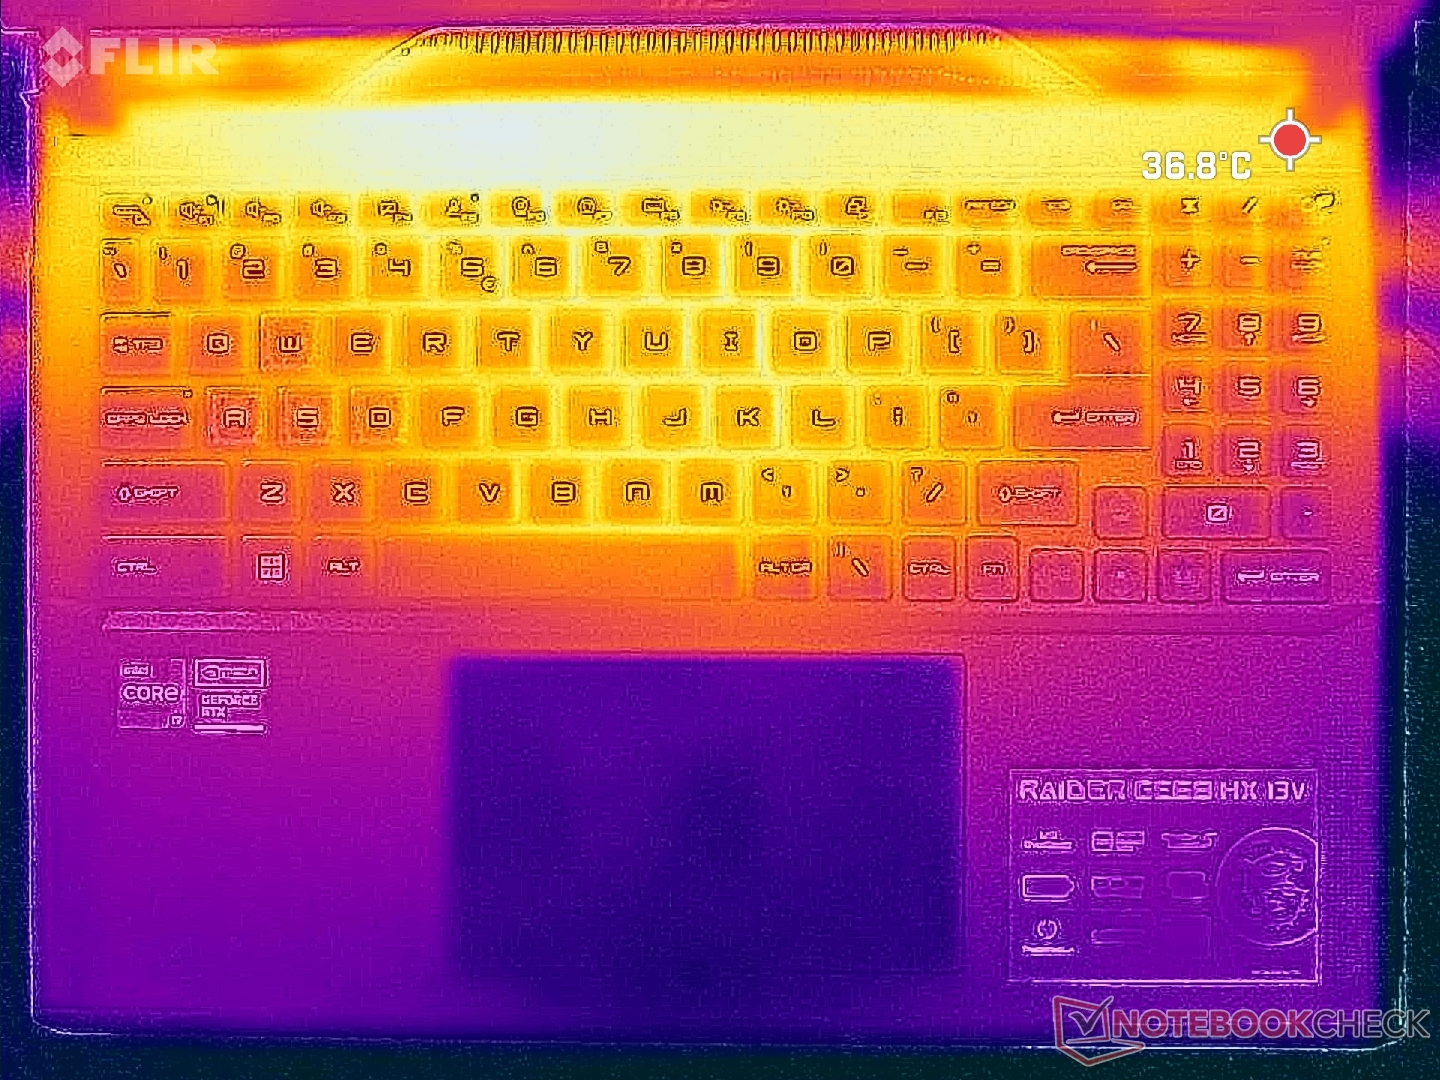
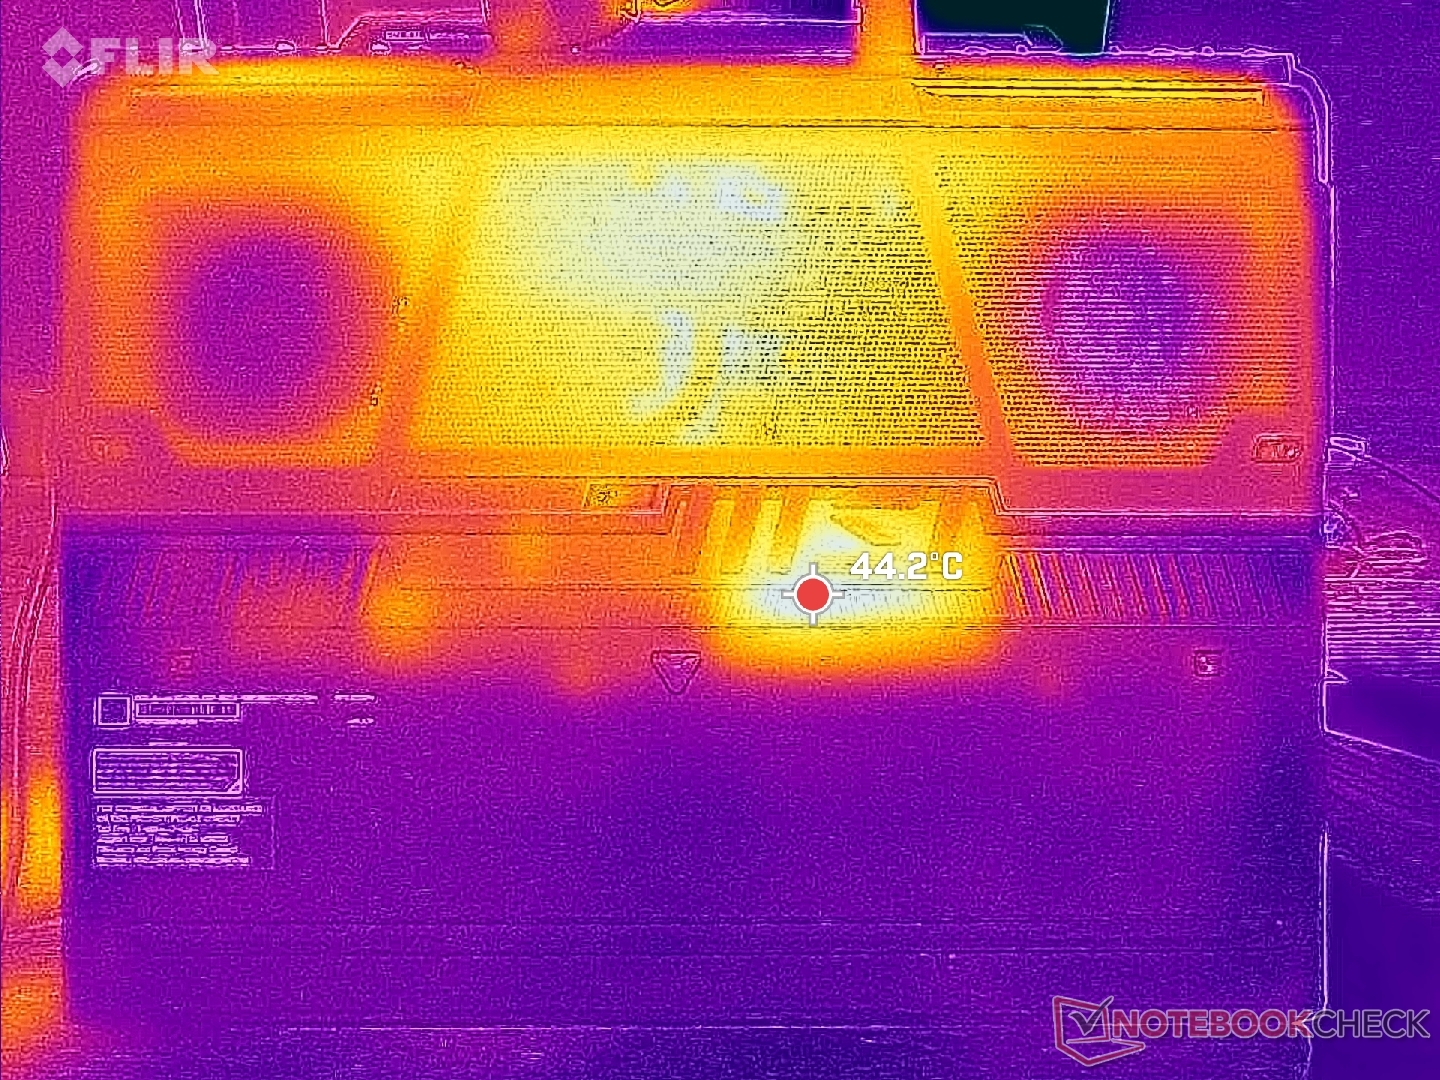
Température
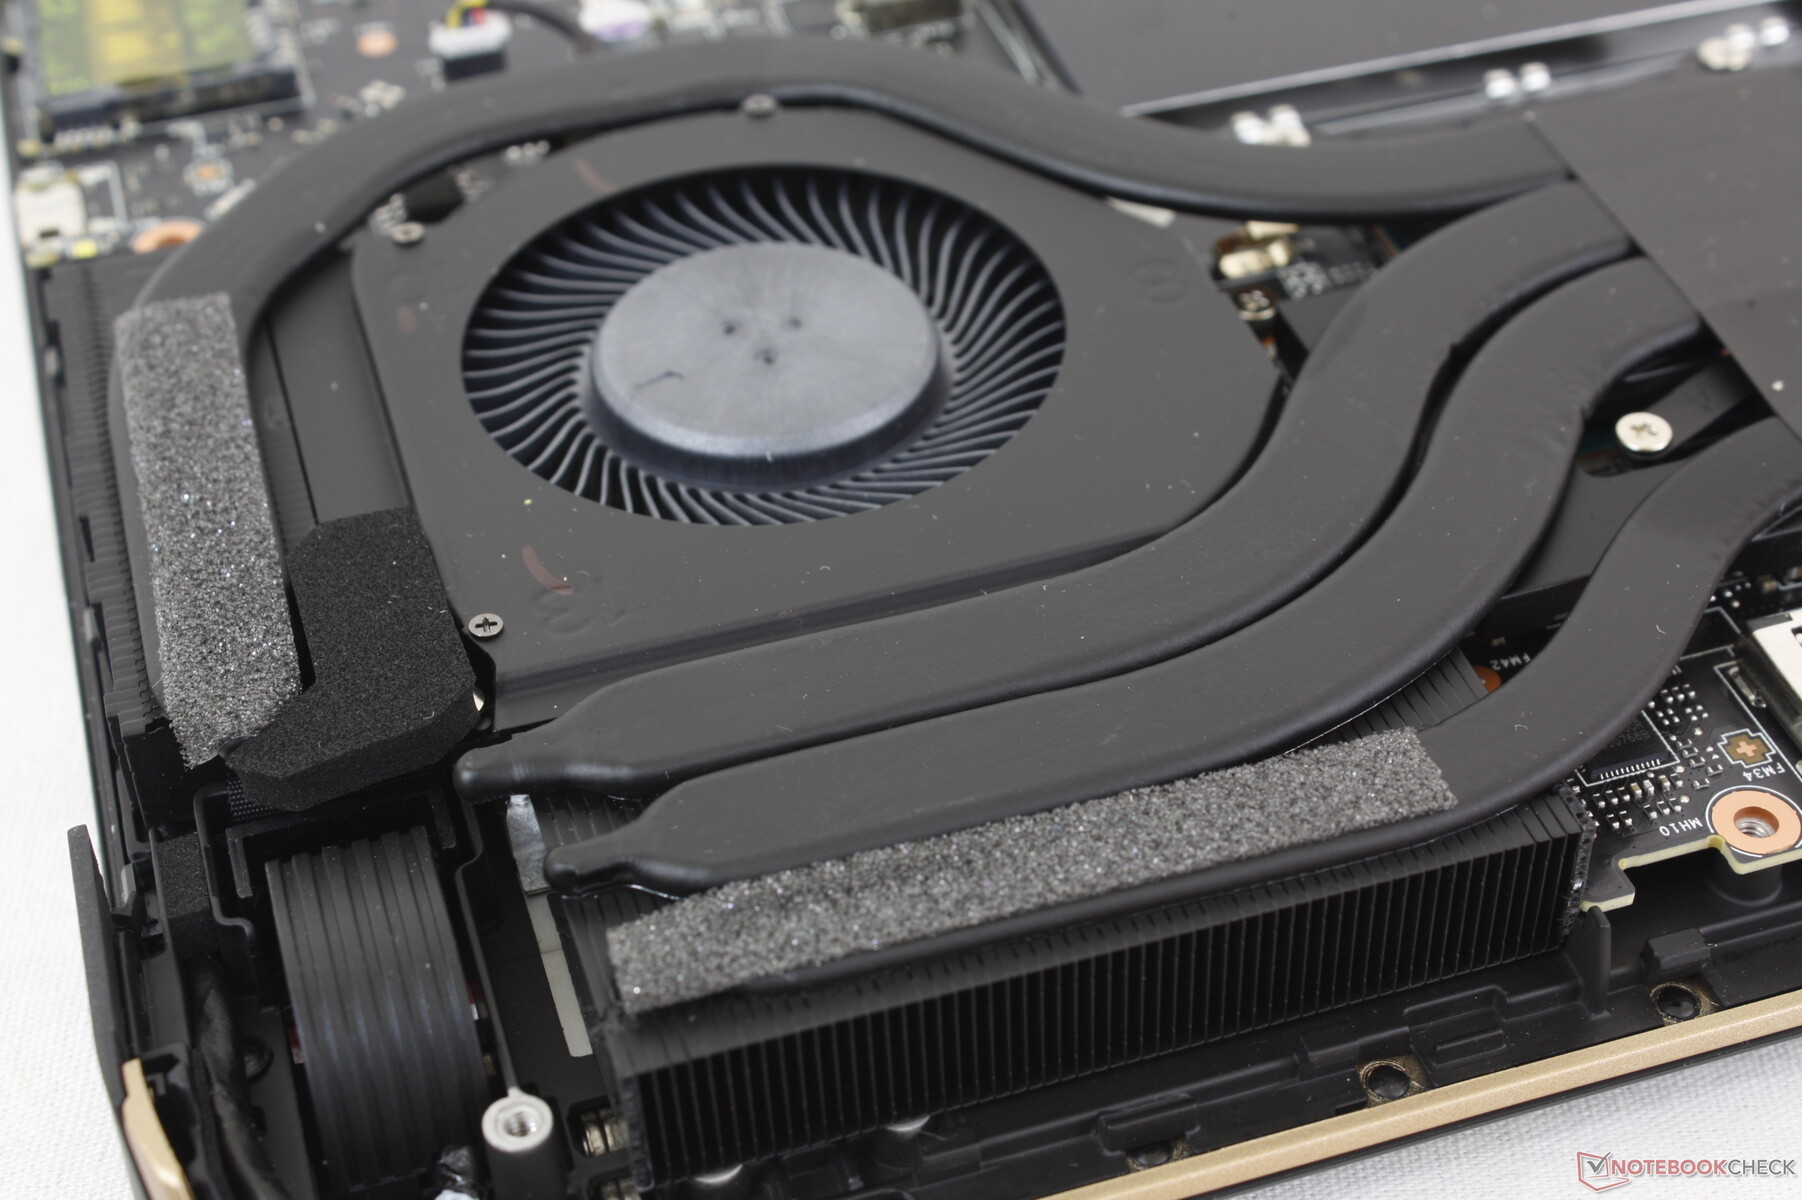
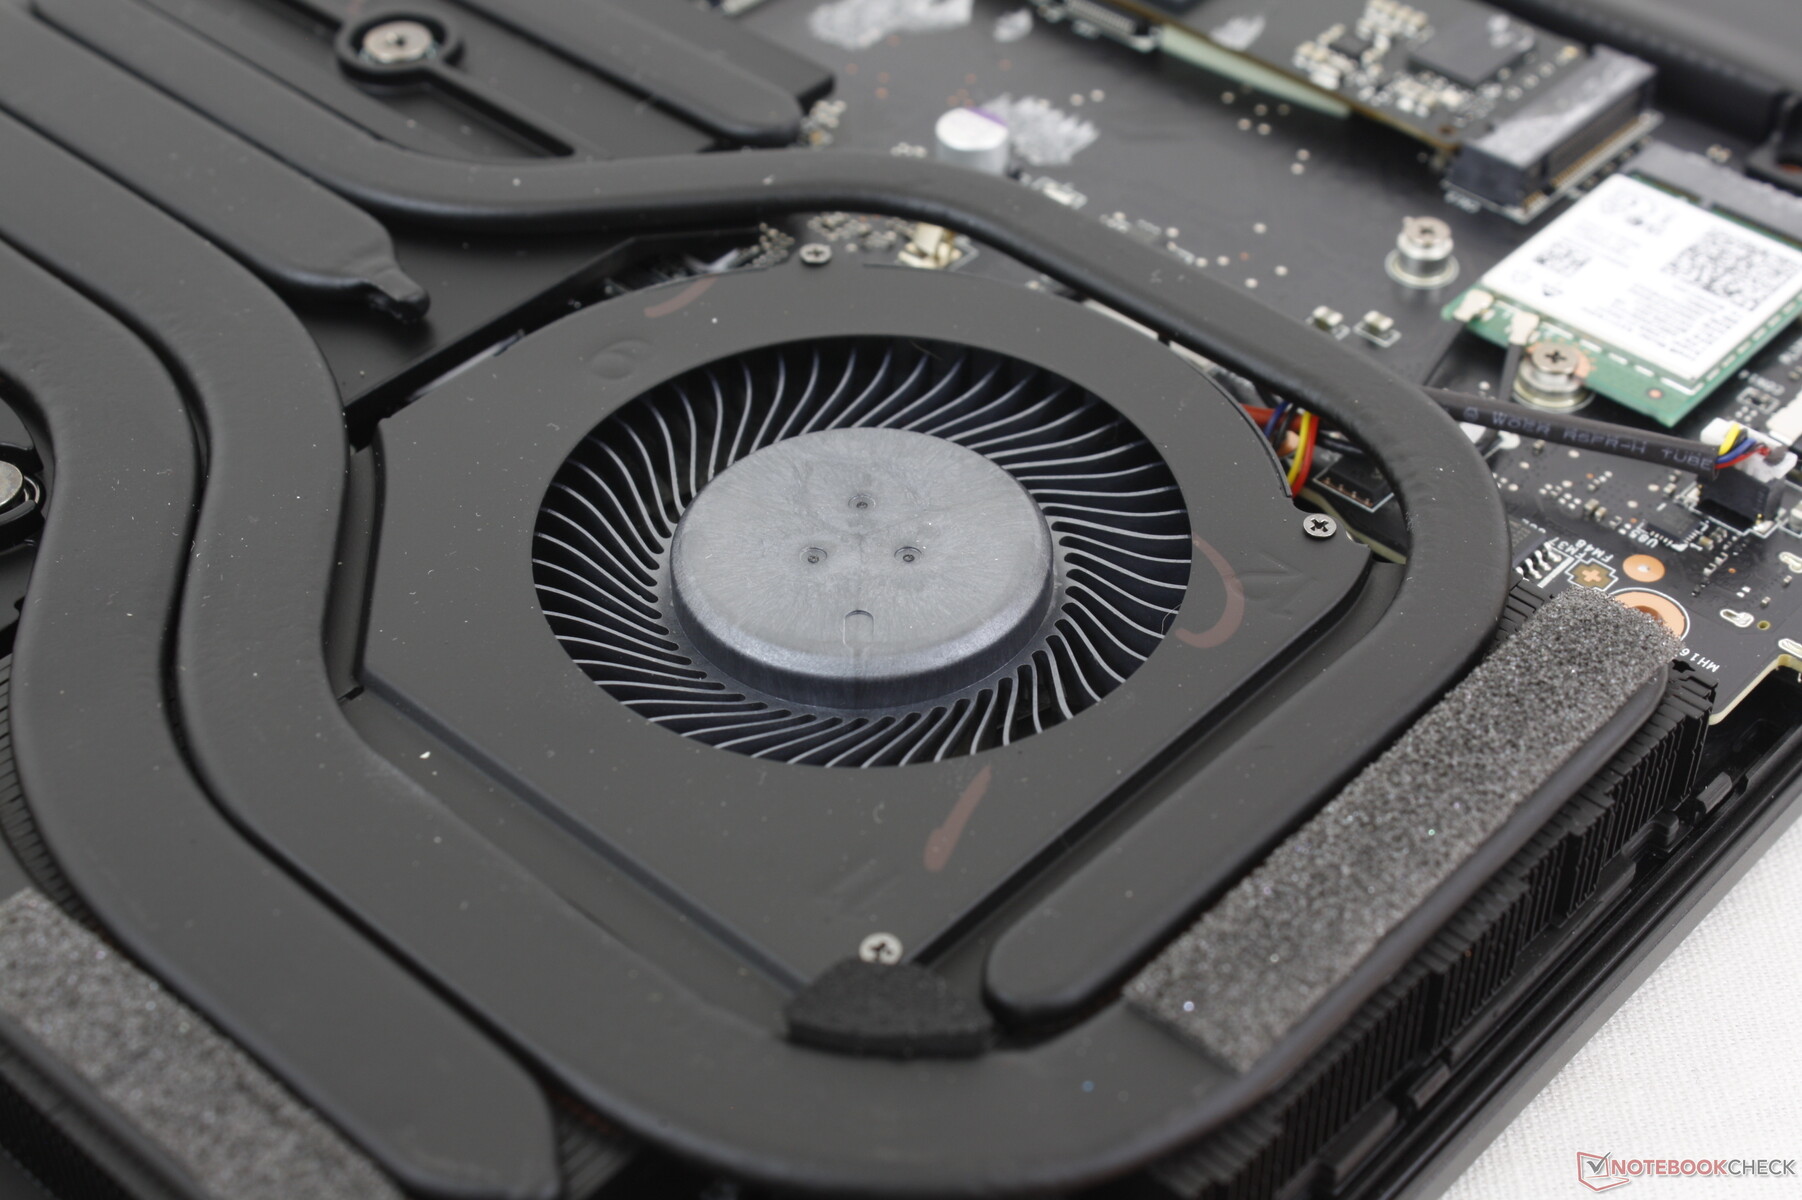
L'évolution de la température de surface est symétrique en raison de la conception de la solution de refroidissement. Le centre du clavier peut atteindre jusqu'à 40°C, ce qui est beaucoup plus froid que ce que nous avons enregistré sur les HP Omen 16 ou Legion Slim 7i 16 G8 où les points chauds peuvent atteindre 45 à 50°C chacun. Les ventilateurs généralement plus bruyants et la construction plus épaisse du GE68HX jouent en faveur de MSI de ce point de vue.
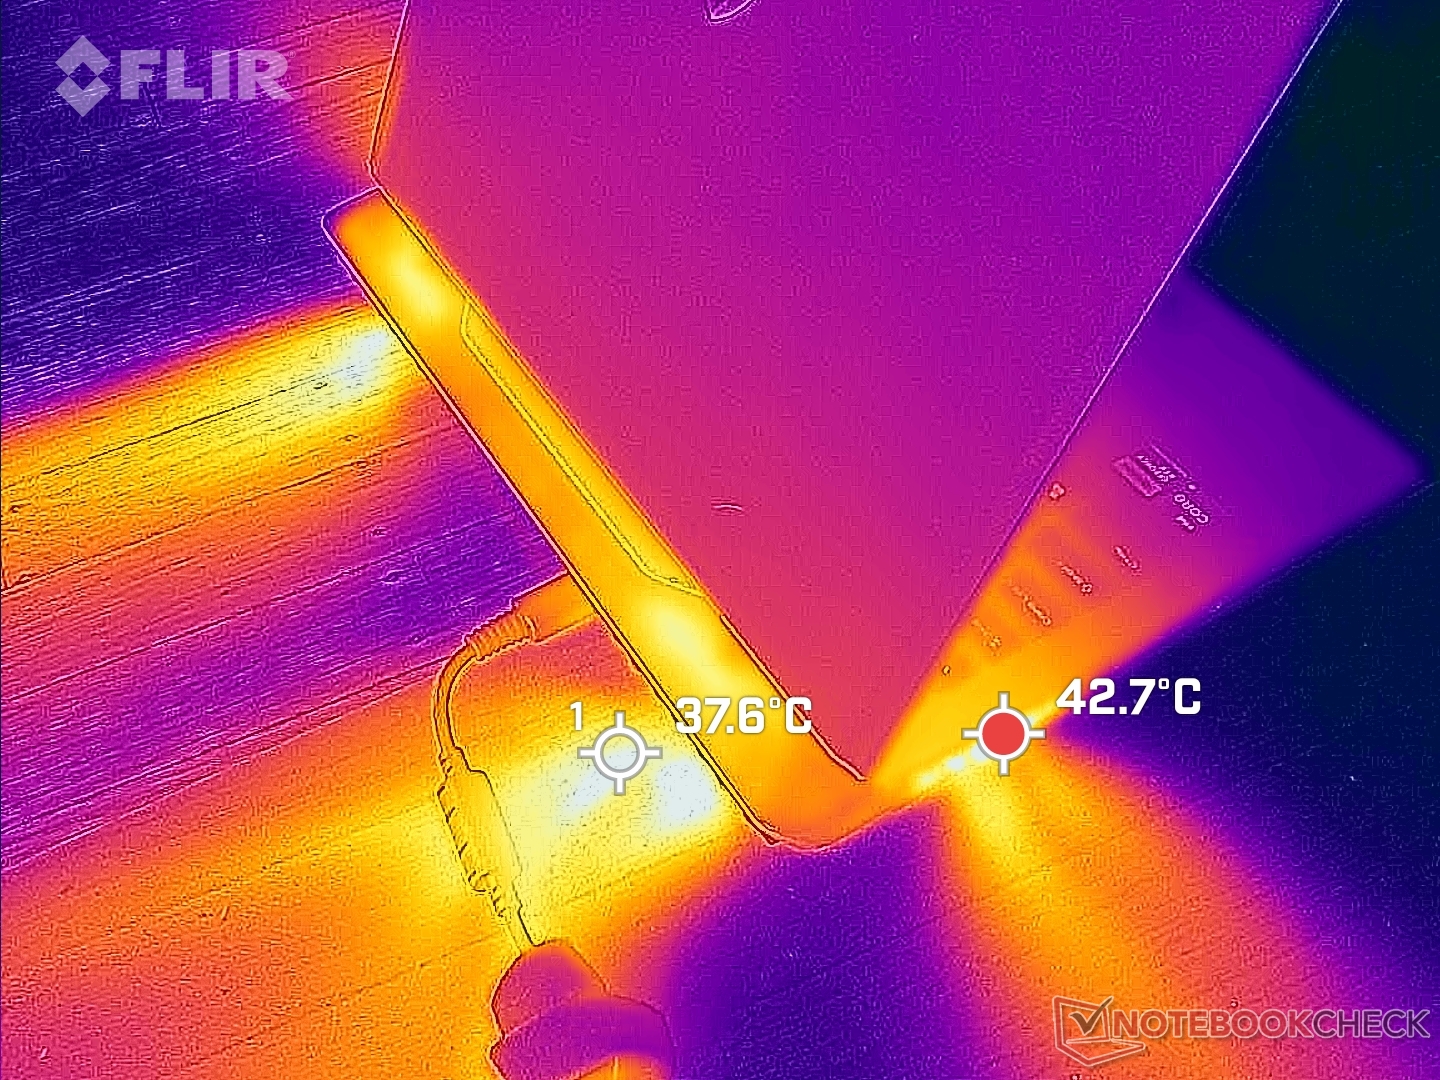
(±) La température maximale du côté supérieur est de 41.4 °C / 107 F, par rapport à la moyenne de 40.4 °C / 105 F, allant de 21.2 à 68.8 °C pour la classe Gaming.
(-) Le fond chauffe jusqu'à un maximum de 45.4 °C / 114 F, contre une moyenne de 43.2 °C / 110 F
(+) En utilisation inactive, la température moyenne du côté supérieur est de 27.7 °C / 82 F, par rapport à la moyenne du dispositif de 33.9 °C / 93 F.
(±) En jouant à The Witcher 3, la température moyenne du côté supérieur est de 34 °C / 93 F, alors que la moyenne de l'appareil est de 33.9 °C / 93 F.
(+) Les repose-poignets et le pavé tactile sont plus froids que la température de la peau avec un maximum de 29.6 °C / 85.3 F et sont donc froids au toucher.
(±) La température moyenne de la zone de l'appui-paume de dispositifs similaires était de 28.8 °C / 83.8 F (-0.8 °C / #-1.5 F).
| MSI Raider GE68HX 13VF Intel Core i9-13950HX, NVIDIA GeForce RTX 4060 Laptop GPU | MSI GE67 HX 12UGS Intel Core i7-12800HX, NVIDIA GeForce RTX 3070 Ti Laptop GPU | HP Omen 16-xf0376ng AMD Ryzen 7 7840HS, NVIDIA GeForce RTX 4070 Laptop GPU | Alienware m16 R1 AMD AMD Ryzen 9 7845HX, NVIDIA GeForce RTX 4080 Laptop GPU | Lenovo Legion Slim 7i 16 Gen 8 Intel Core i9-13900H, NVIDIA GeForce RTX 4070 Laptop GPU | Asus ROG Zephyrus M16 GU604VY-NM042X Intel Core i9-13900H, NVIDIA GeForce RTX 4090 Laptop GPU | |
|---|---|---|---|---|---|---|
| Heat | 9% | -12% | -10% | -6% | -6% | |
| Maximum Upper Side * (°C) | 41.4 | 34.4 17% | 49 -18% | 48 -16% | 49.8 -20% | 50 -21% |
| Maximum Bottom * (°C) | 45.4 | 42 7% | 57 -26% | 39 14% | 48.8 -7% | 58 -28% |
| Idle Upper Side * (°C) | 29.8 | 24 19% | 31 -4% | 37 -24% | 29.4 1% | 26 13% |
| Idle Bottom * (°C) | 31.4 | 33.2 -6% | 31 1% | 36.2 -15% | 30 4% | 28 11% |
* ... Moindre est la valeur, meilleures sont les performances
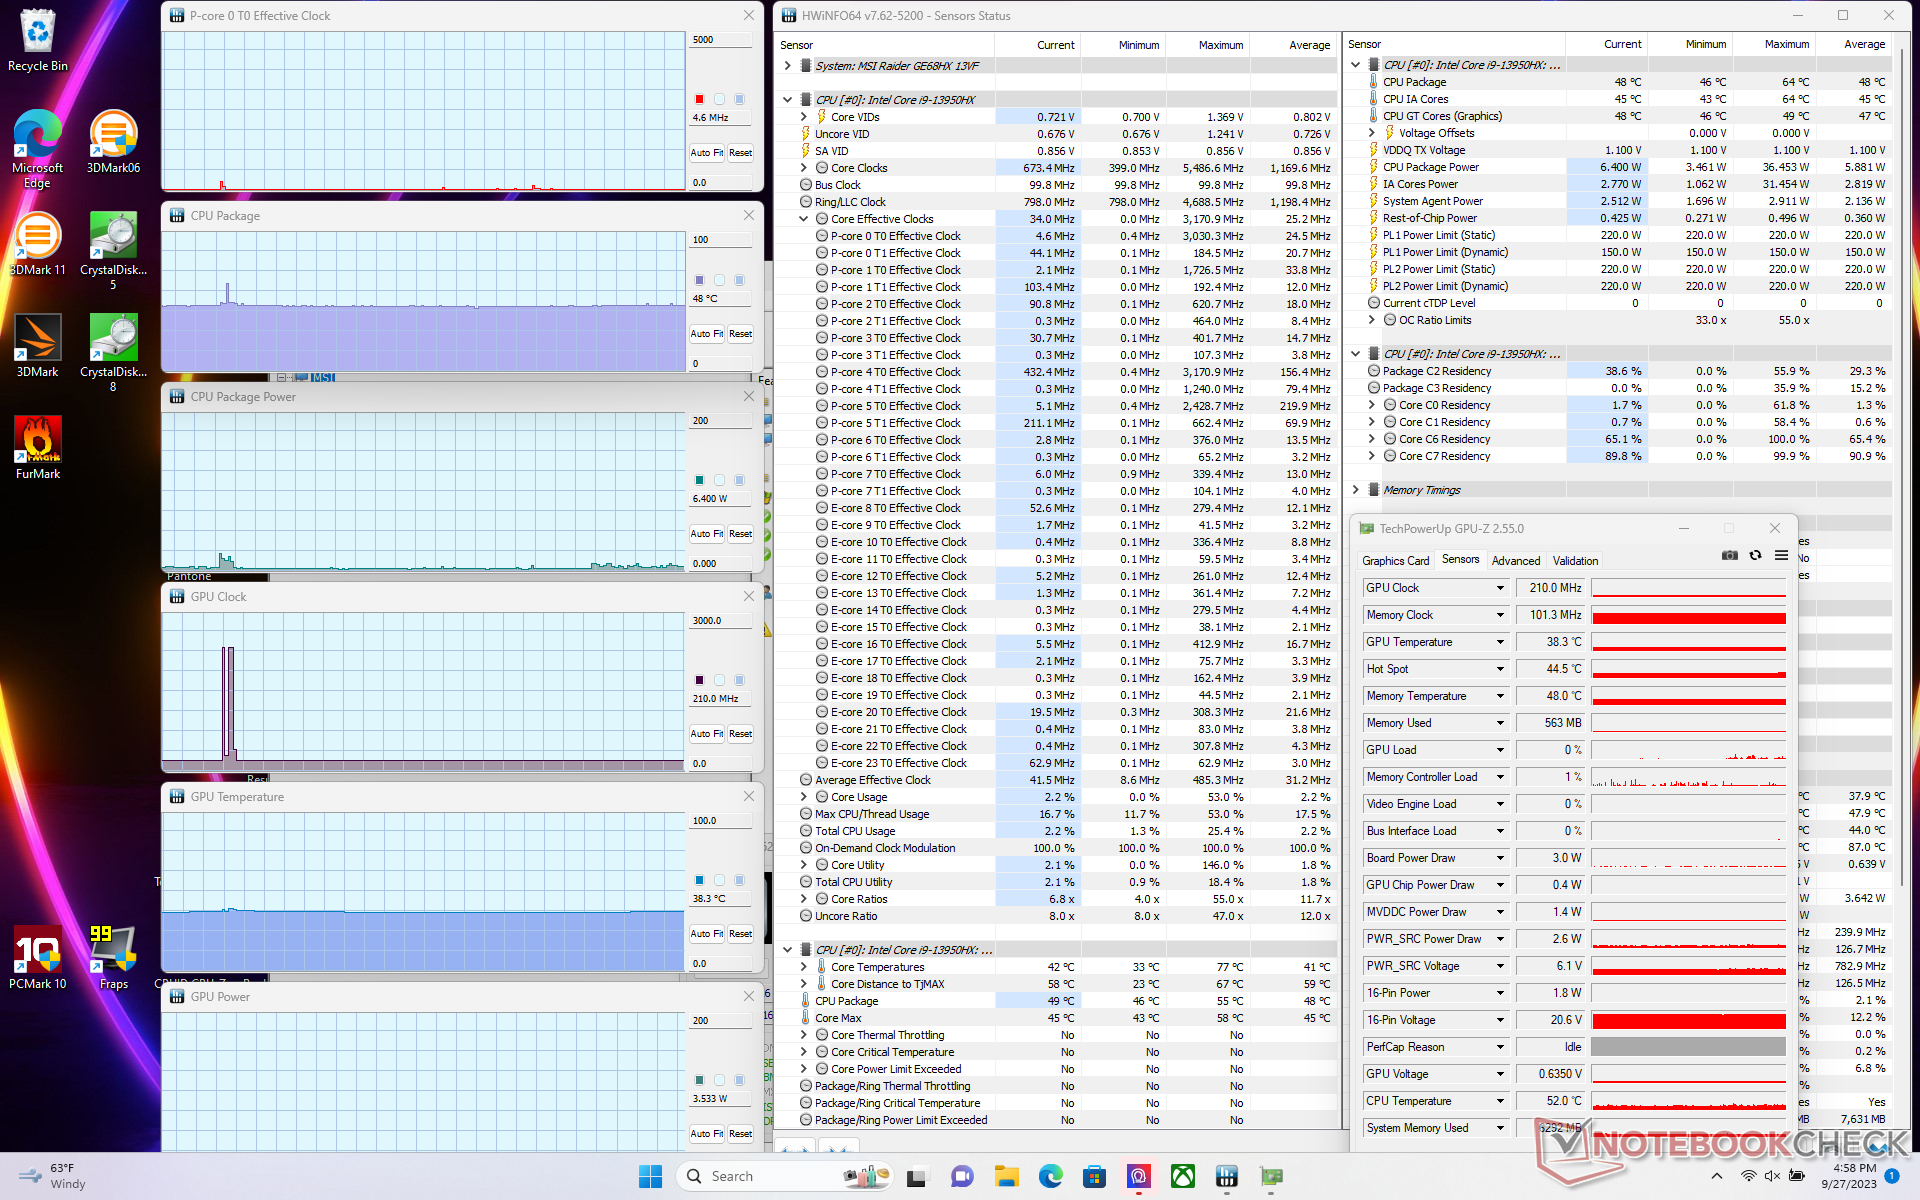
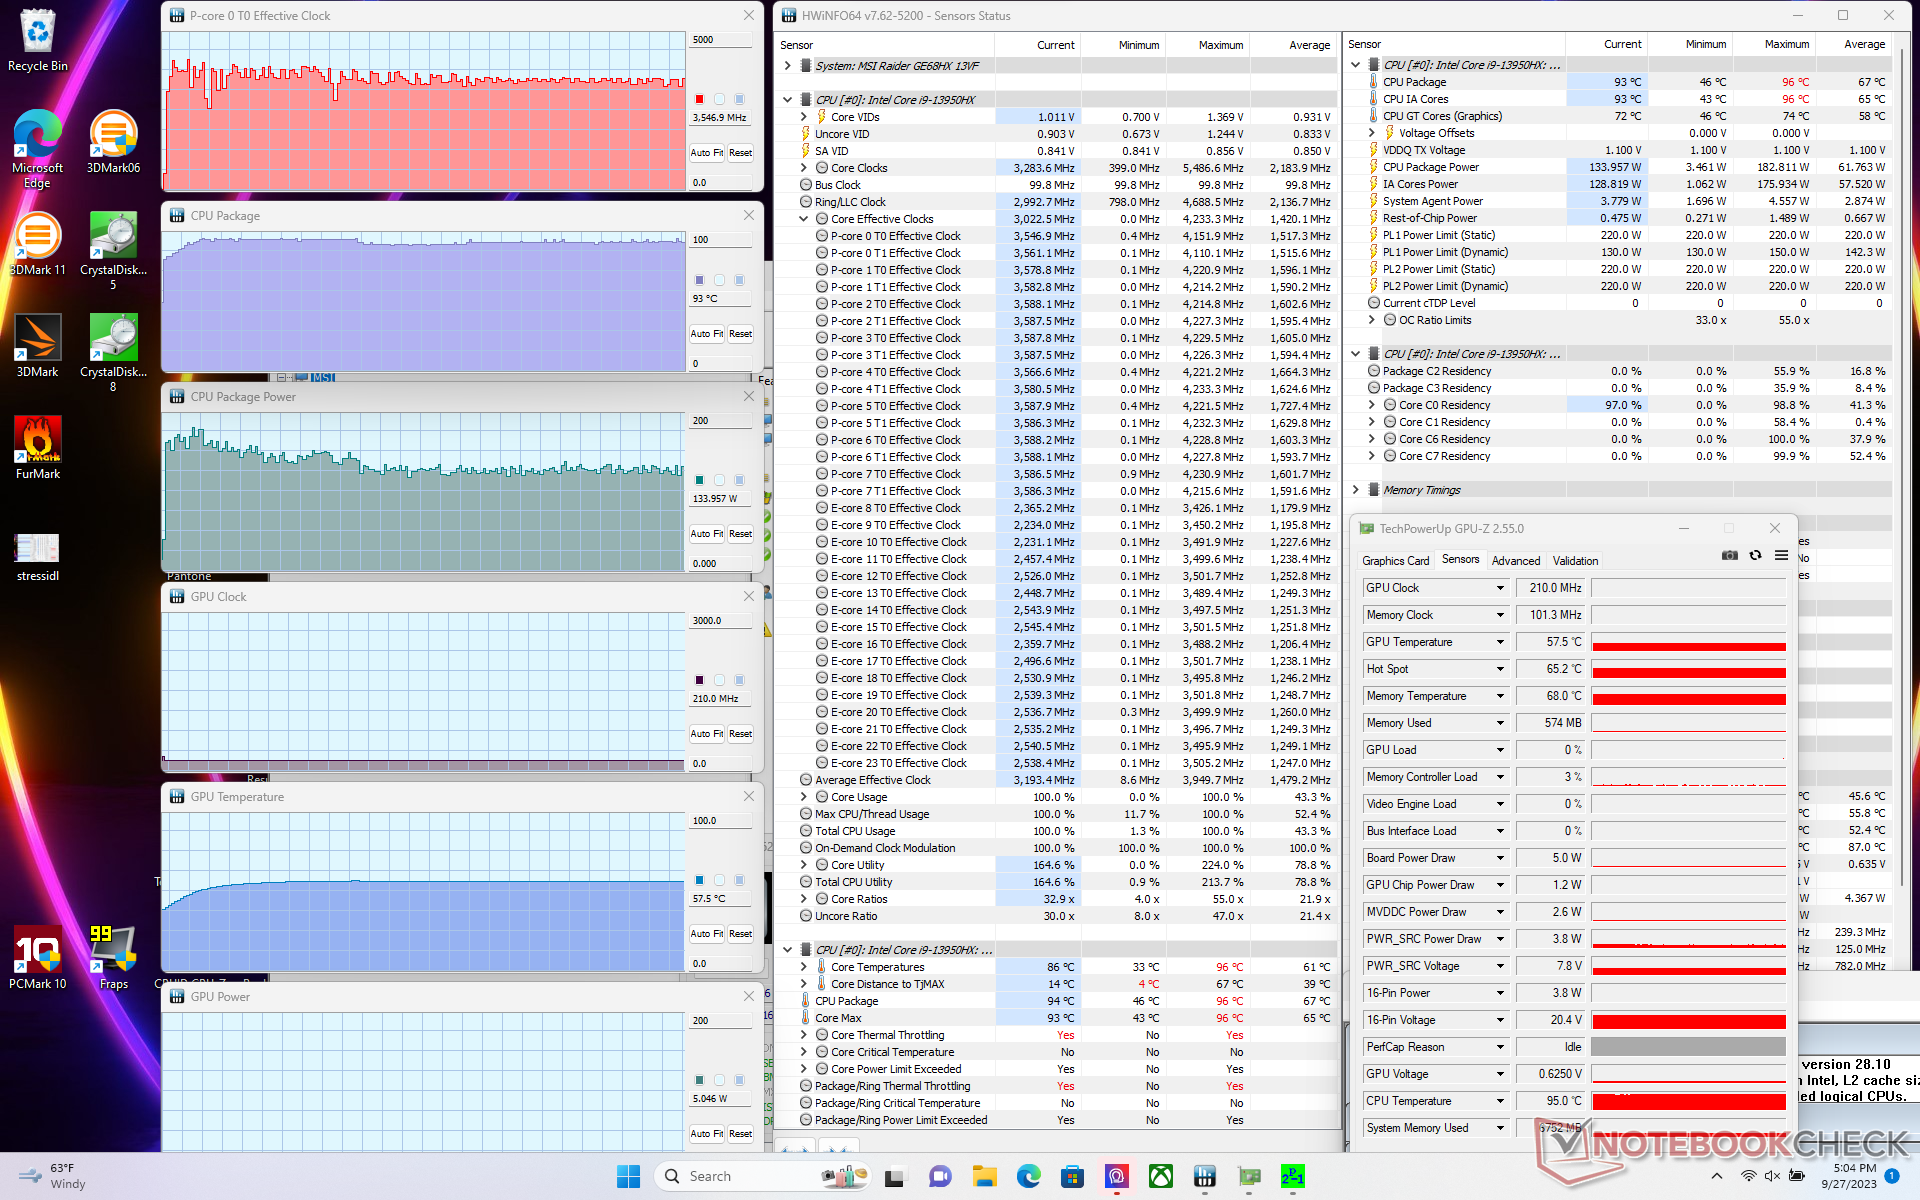
Test de stress
Le CPU a atteint 4,1 GHz et 183 W lors du lancement du test Prime95 avant de se stabiliser à 3,6 GHz, 134 W et 93 C quelques secondes plus tard. En répétant ce test sur le modèle de l'année dernière avec l'ancien Core i7-12800HX de 12ème génération, la puissance du processeur aurait été beaucoup plus faible, à savoir 55 W, ce qui montre à quel point le nouveau CPU de 13ème génération peut être plus exigeant.
La fréquence d'horloge et la température du GPU se stabiliseraient à 2475 MHz et 84 C en mode équilibré Witcher 3 en mode équilibré. Il est intéressant de noter que la fréquence d'horloge augmente légèrement à 2490 MHz en mode Extreme Performance, tandis que la température du GPU diminue de manière significative à 70°C ou même 63°C si Cooler Boost est activé, comme le montrent les captures d'écran et le tableau ci-dessous. La plupart des autres ordinateurs portables de jeu MSI affichent des résultats similaires. Il est donc recommandé de jouer en mode équilibré car l'impact sur les performances du GPU est très marginal par rapport aux énormes différences de bruit des ventilateurs entre les profils d'alimentation prédéfinis. Les différences de performances entre les modes Balanced et Performance sont généralement plus importantes sur d'autres ordinateurs portables de jeu tels que ceux de la série Zephyrus d'Asus.
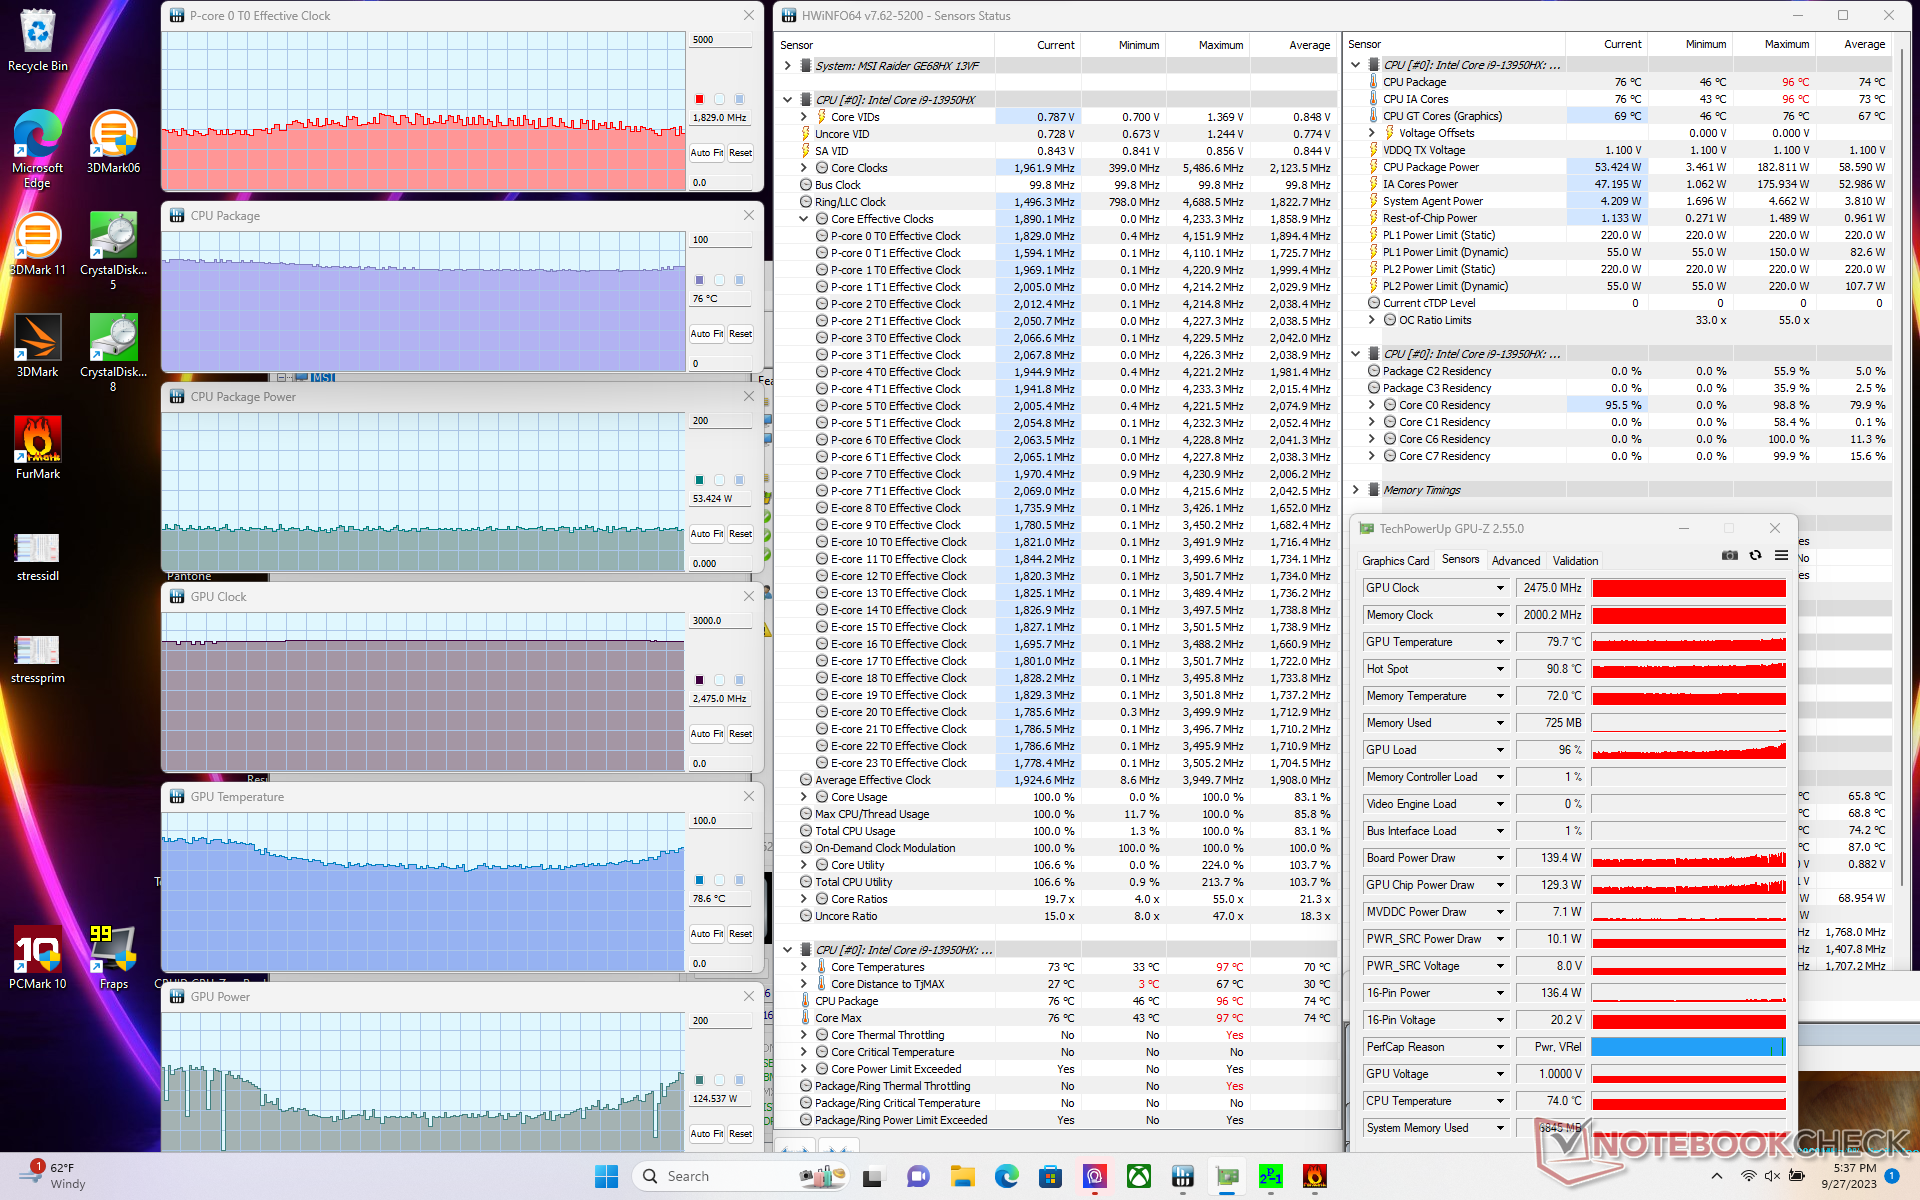
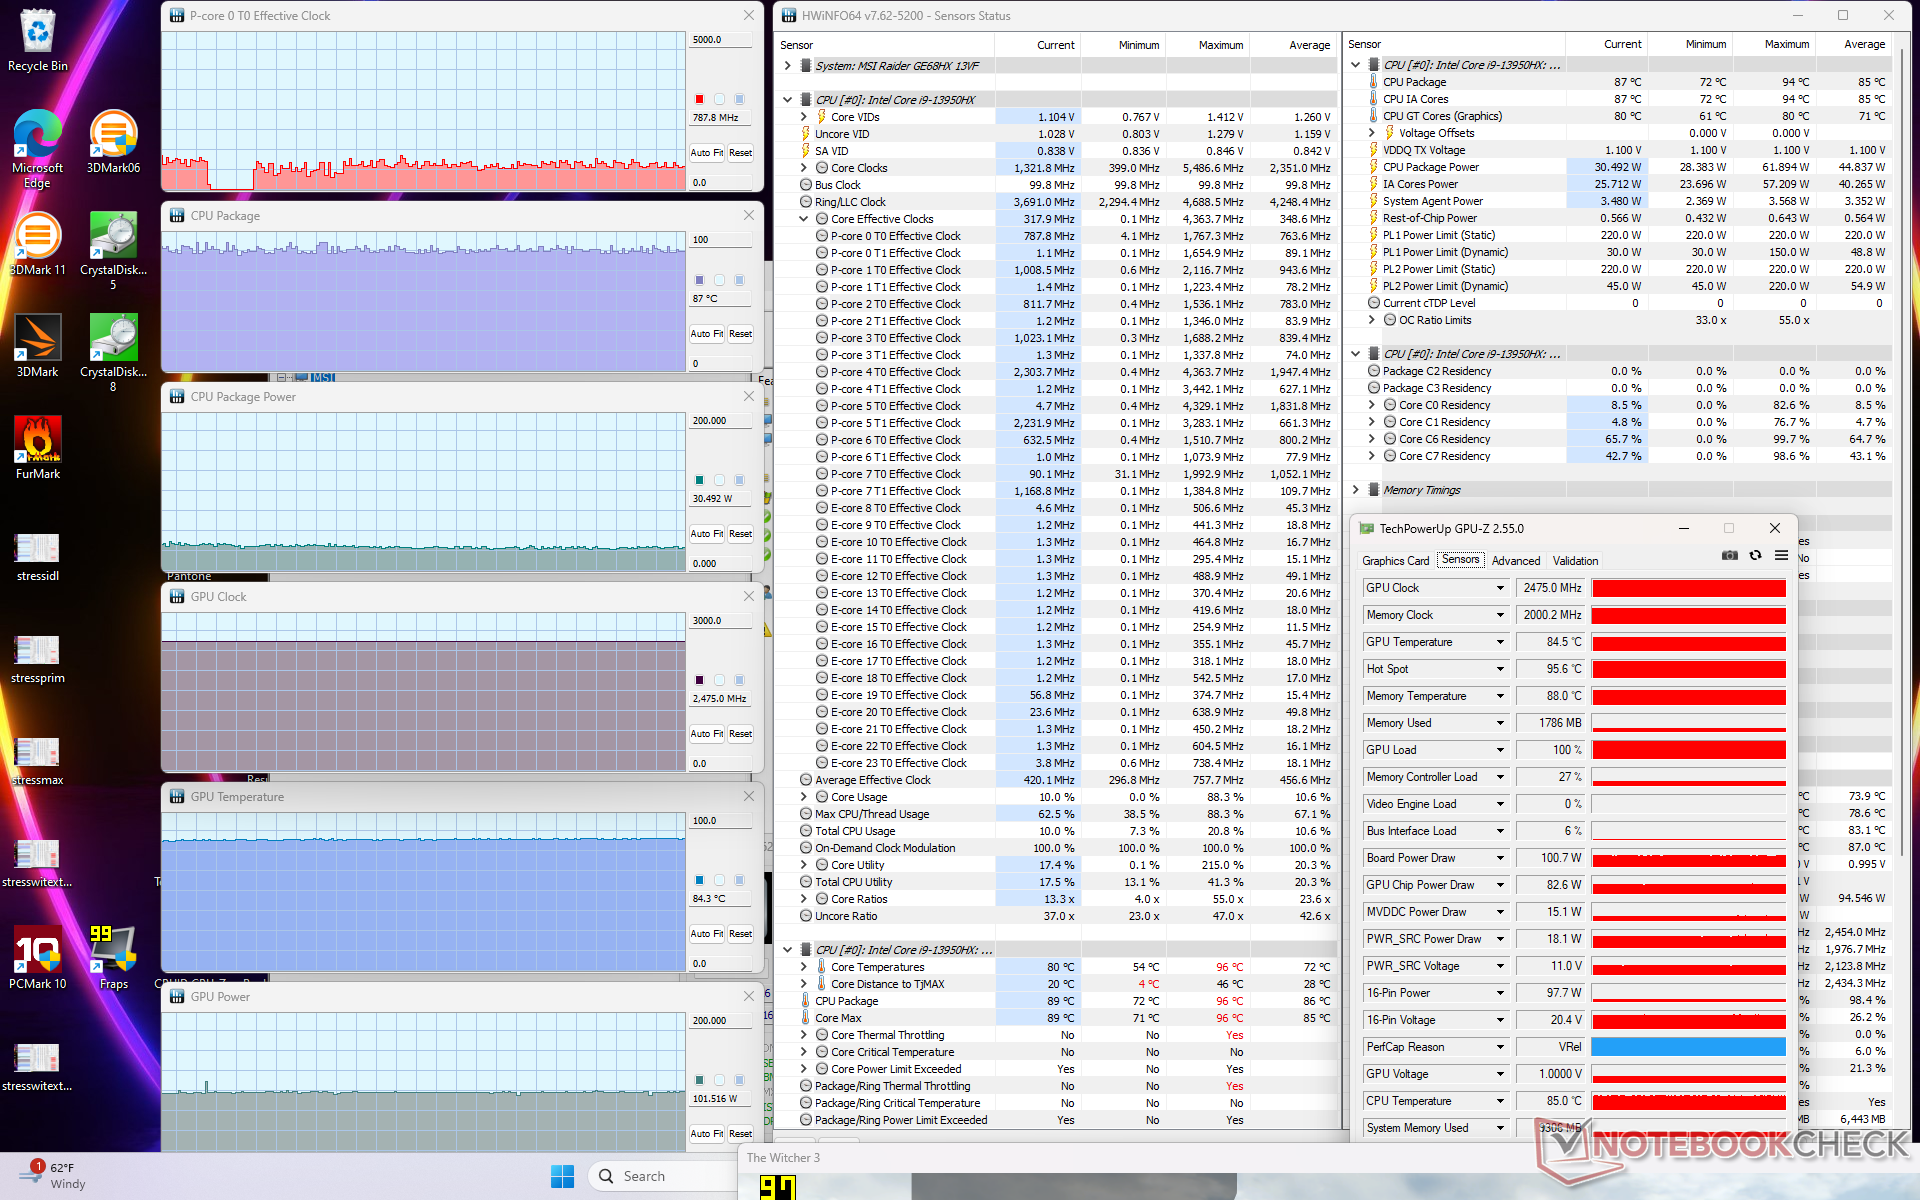
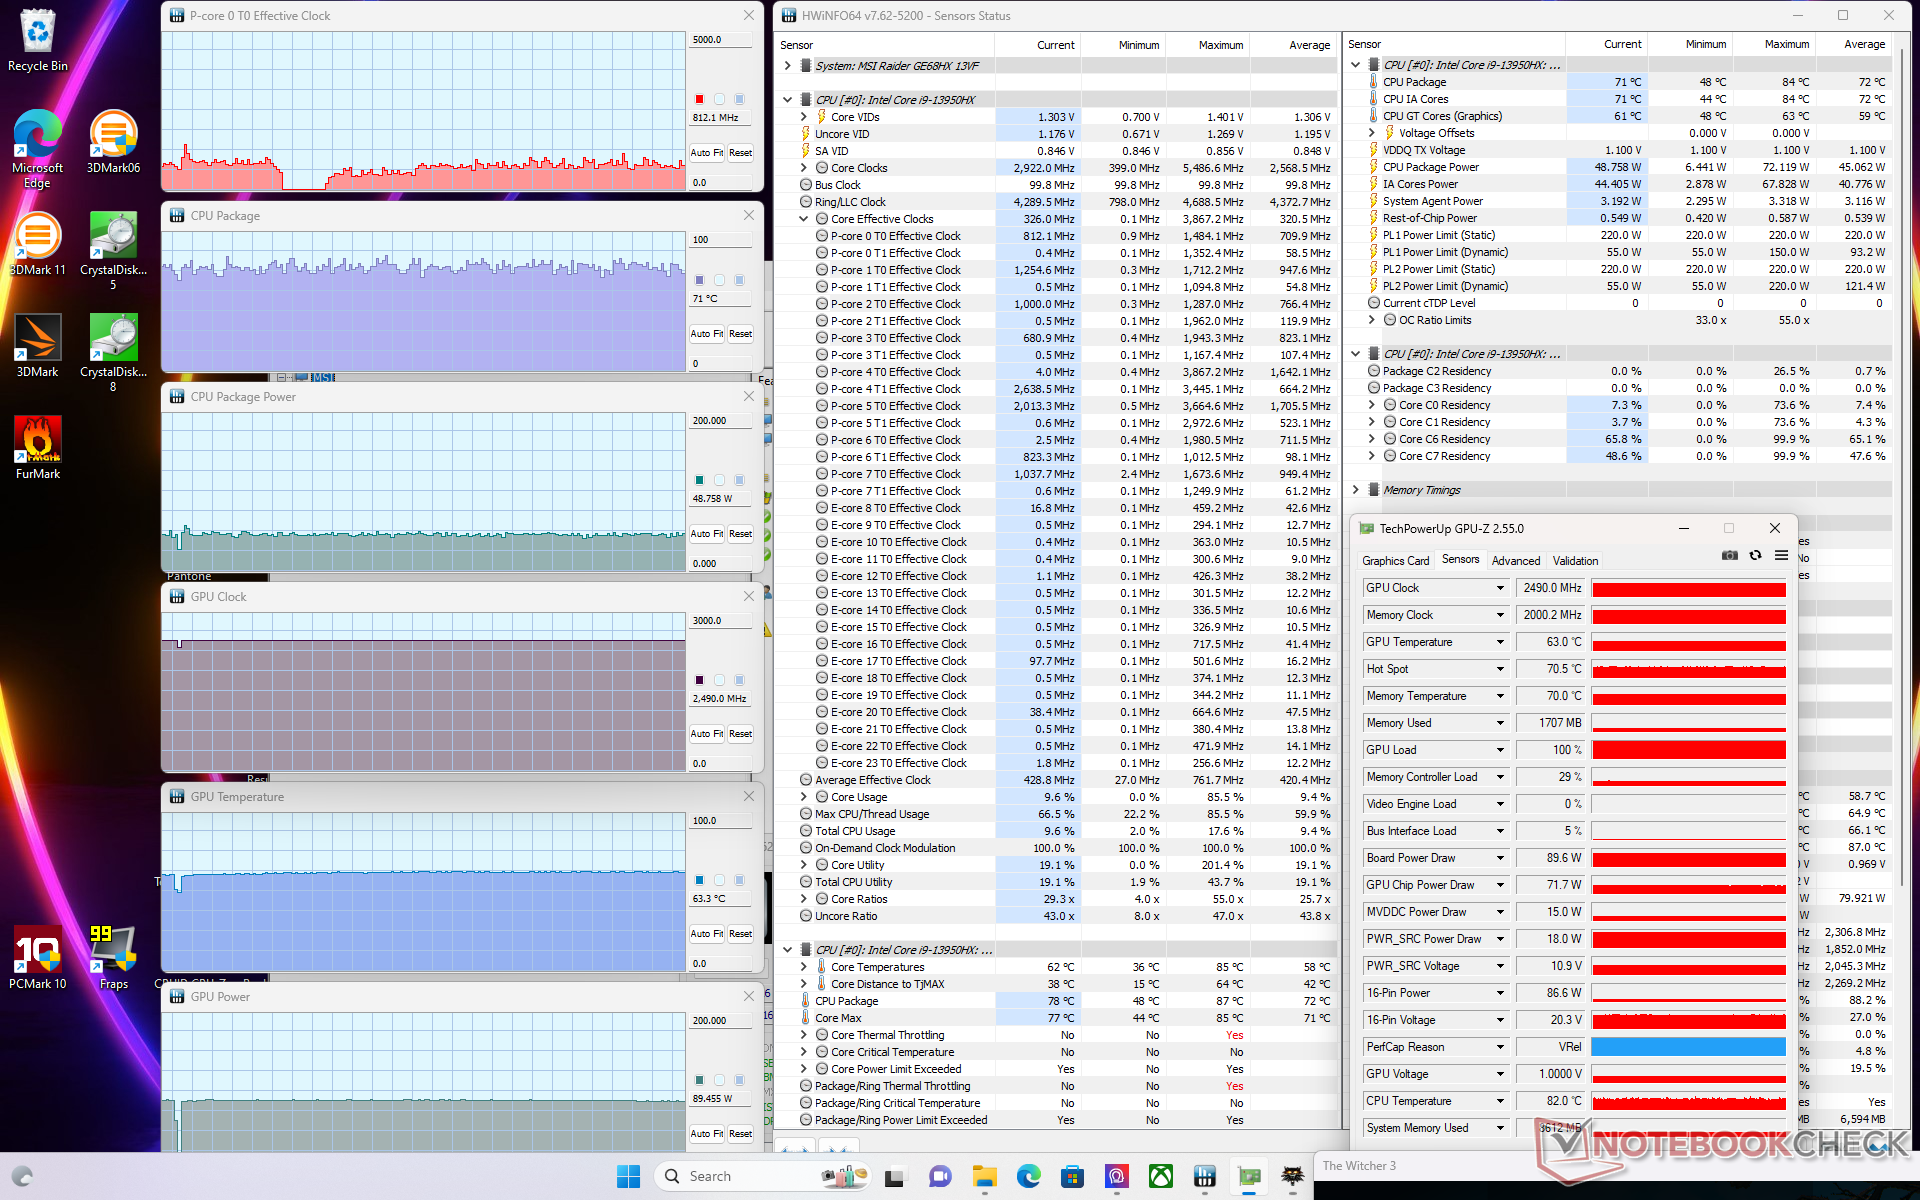
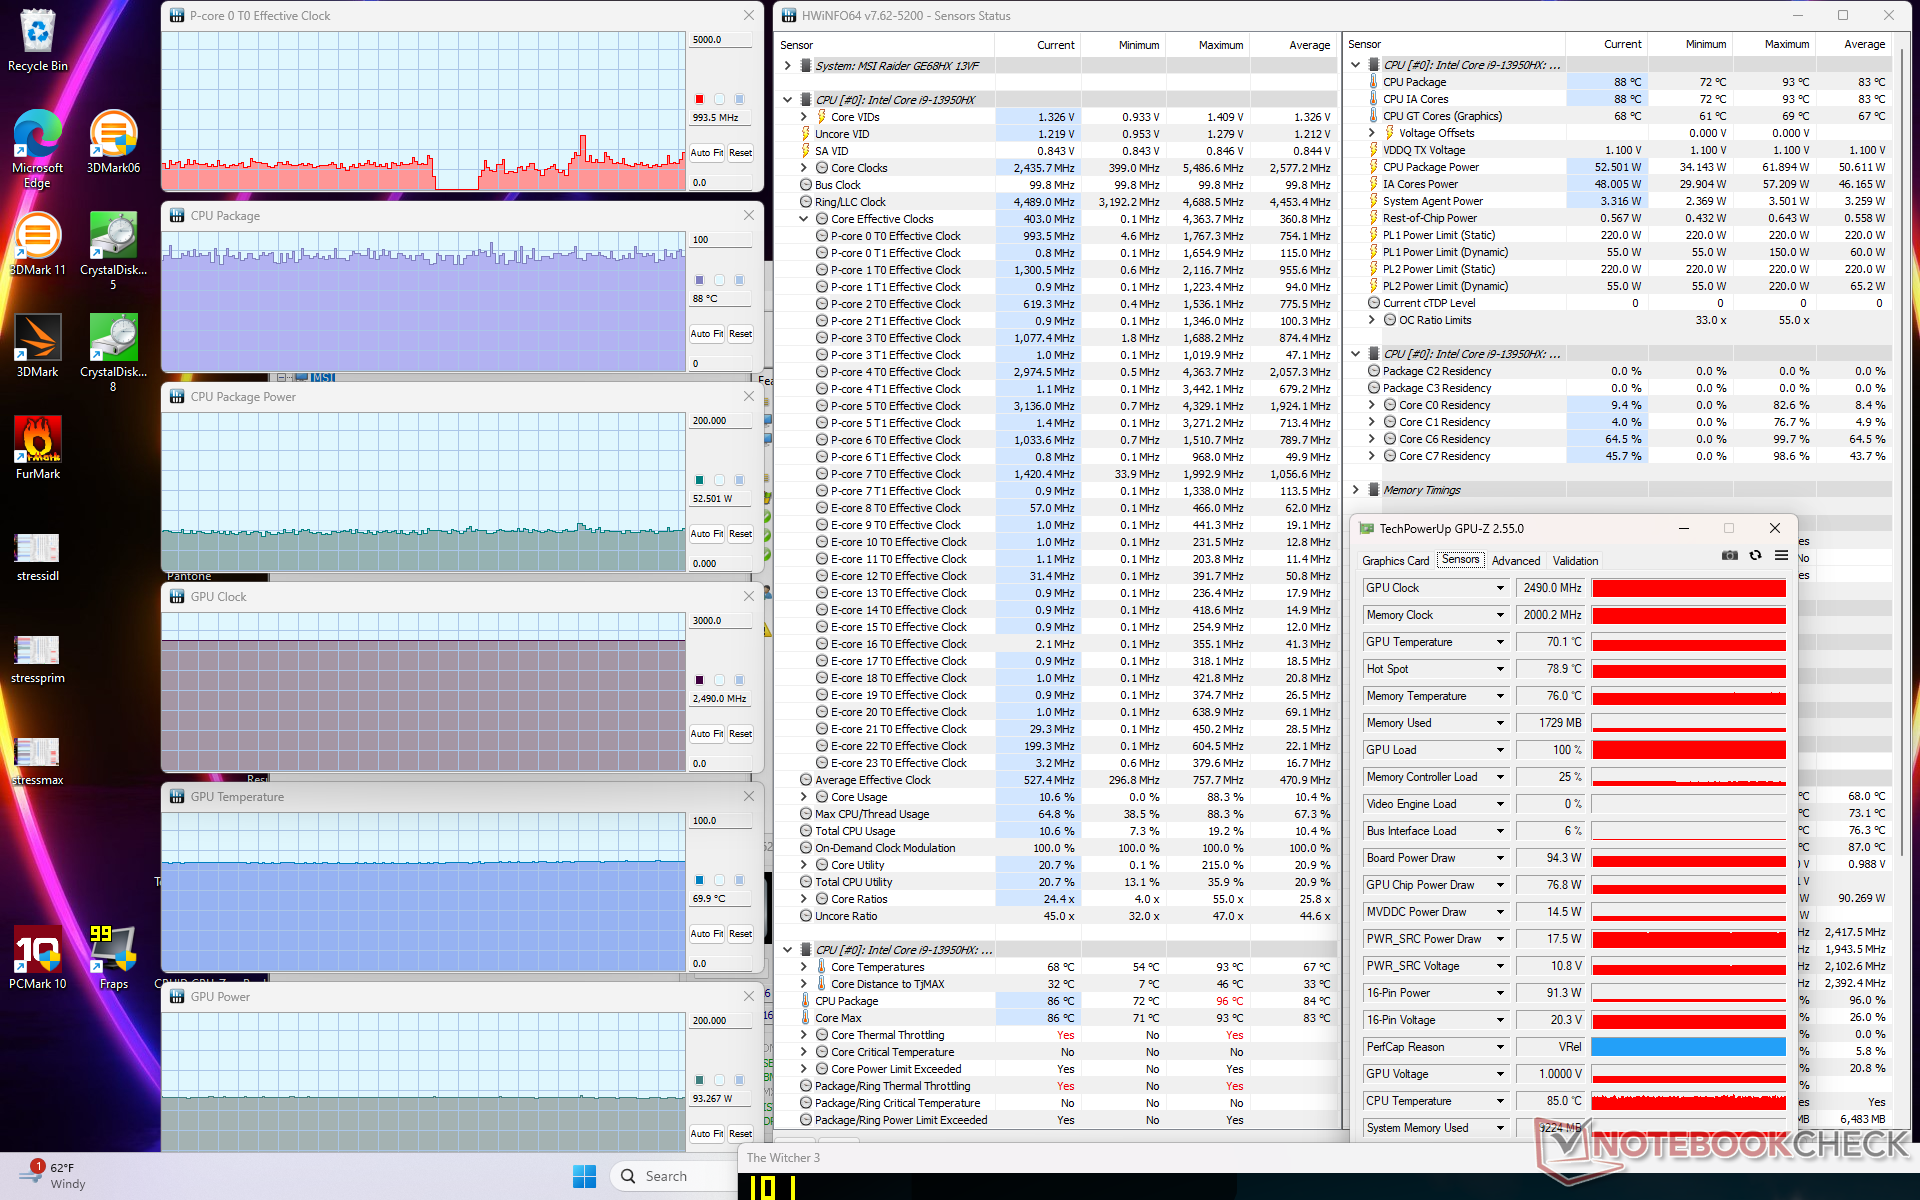
| Horloge du CPU (GHz) | Horloge du GPU (MHz) | Température moyenne du CPU (°C) | Température moyenne du GPU (°C) | |
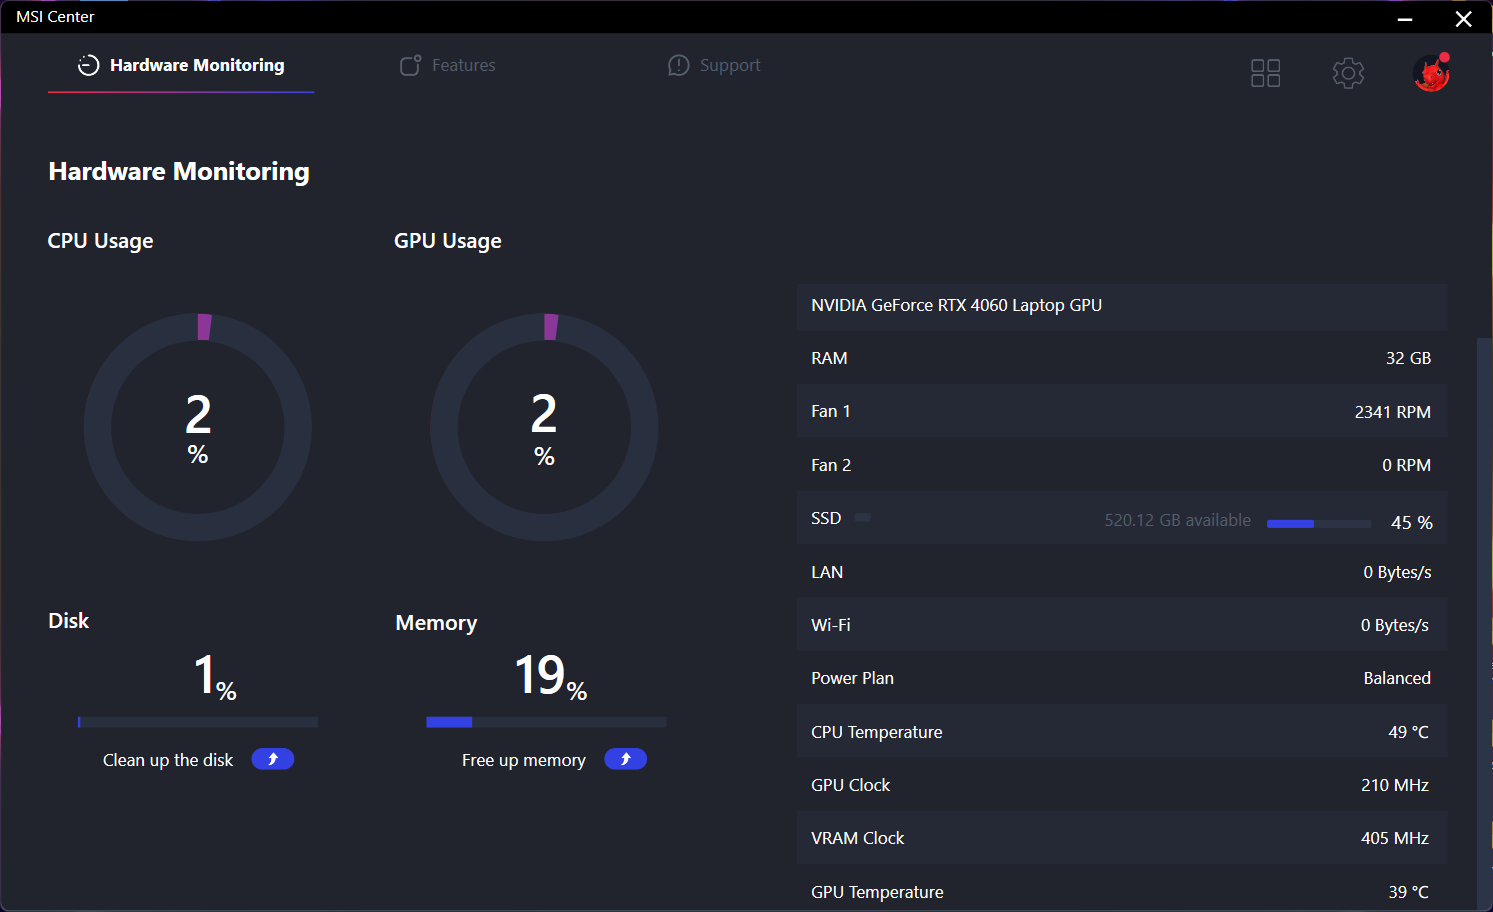
| Système au repos | -- | -- | 48 | 38 |
| Prime95 Stress (mode Performance extrême avec Cooler Boost désactivé) | ~3.6 | -- | 93 | 58 |
| Prime95 + FurMark Stress (mode performance extrême avec Cooler Boost désactivé) | ~1.9 | 2475 | 73 - 78 | 63 - 81 |
| Witcher 3 Stress(mode équilibré) | ~0.8 | 2475 | 87 | 84 |
| Witcher 3 Stress(mode Performance extrême avec Cooler Boost désactivé) | ~0,8 | 2490 | 88 | 70 |
| Witcher 3 Stress(mode Performance extrême avec Cooler Boost activé) | ~0.8 | 2490 | 71 | 63 |
Intervenants
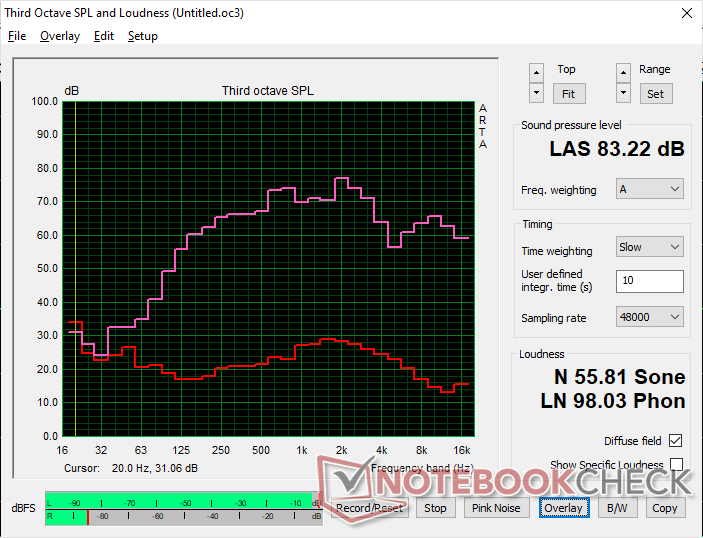
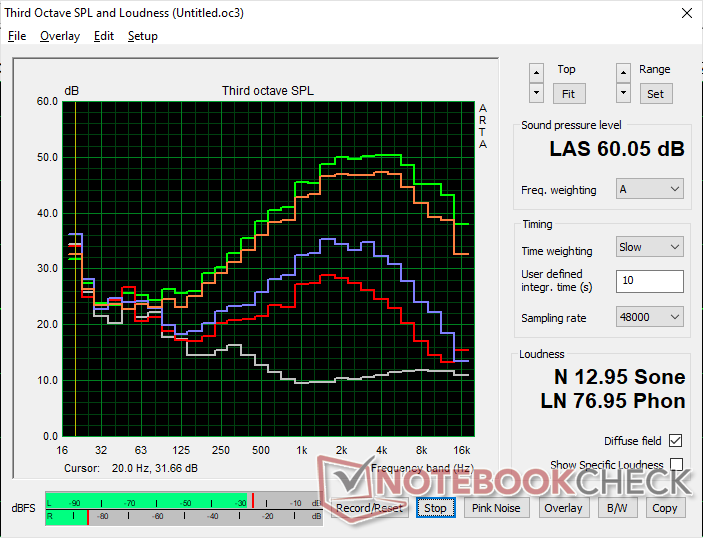
MSI Raider GE68HX 13VF analyse audio
(+) | les haut-parleurs peuvent jouer relativement fort (83.2# dB)
Basses 100 - 315 Hz
(±) | basse réduite - en moyenne 6% inférieure à la médiane
(±) | la linéarité des basses est moyenne (9.5% delta à la fréquence précédente)
Médiums 400 - 2000 Hz
(±) | médiane supérieure - en moyenne 5.6% supérieure à la médiane
(+) | les médiums sont linéaires (5.8% delta à la fréquence précédente)
Aiguës 2 - 16 kHz
(+) | des sommets équilibrés - à seulement 4.5% de la médiane
(±) | la linéarité des aigus est moyenne (9.5% delta à la fréquence précédente)
Globalement 100 - 16 000 Hz
(+) | le son global est linéaire (13.3% différence à la médiane)
Par rapport à la même classe
» 19% de tous les appareils testés de cette catégorie étaient meilleurs, 5% similaires, 76% pires
» Le meilleur avait un delta de 6%, la moyenne était de 18%, le pire était de 132%.
Par rapport à tous les appareils testés
» 14% de tous les appareils testés étaient meilleurs, 3% similaires, 83% pires
» Le meilleur avait un delta de 4%, la moyenne était de 24%, le pire était de 134%.
Apple MacBook Pro 16 2021 M1 Pro analyse audio
(+) | les haut-parleurs peuvent jouer relativement fort (84.7# dB)
Basses 100 - 315 Hz
(+) | bonne basse - seulement 3.8% loin de la médiane
(+) | les basses sont linéaires (5.2% delta à la fréquence précédente)
Médiums 400 - 2000 Hz
(+) | médiane équilibrée - seulement 1.3% de la médiane
(+) | les médiums sont linéaires (2.1% delta à la fréquence précédente)
Aiguës 2 - 16 kHz
(+) | des sommets équilibrés - à seulement 1.9% de la médiane
(+) | les aigus sont linéaires (2.7% delta à la fréquence précédente)
Globalement 100 - 16 000 Hz
(+) | le son global est linéaire (4.6% différence à la médiane)
Par rapport à la même classe
» 0% de tous les appareils testés de cette catégorie étaient meilleurs, 0% similaires, 100% pires
» Le meilleur avait un delta de 5%, la moyenne était de 17%, le pire était de 45%.
Par rapport à tous les appareils testés
» 0% de tous les appareils testés étaient meilleurs, 0% similaires, 100% pires
» Le meilleur avait un delta de 4%, la moyenne était de 24%, le pire était de 134%.
Gestion de l'énergie - Plus de performance, plus de consommation
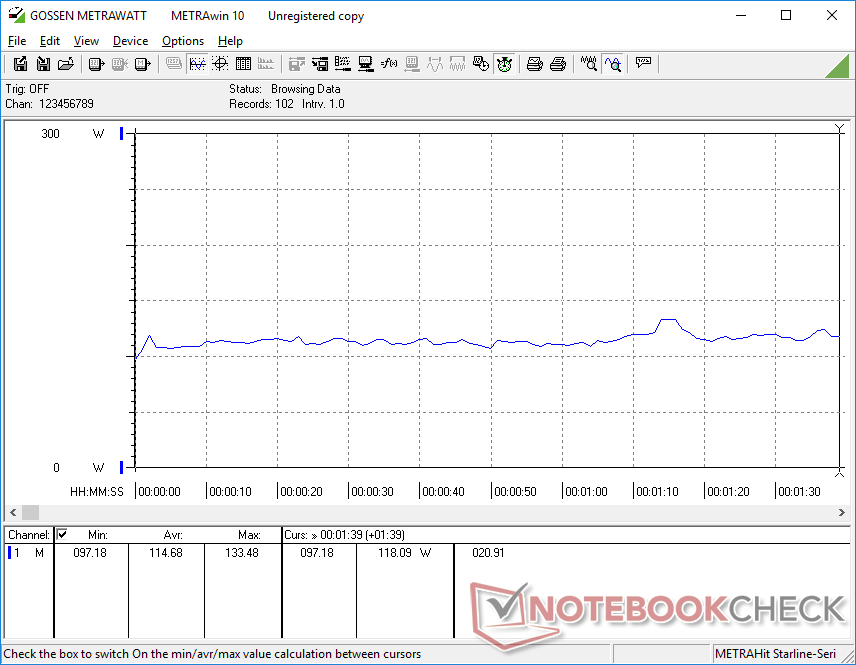
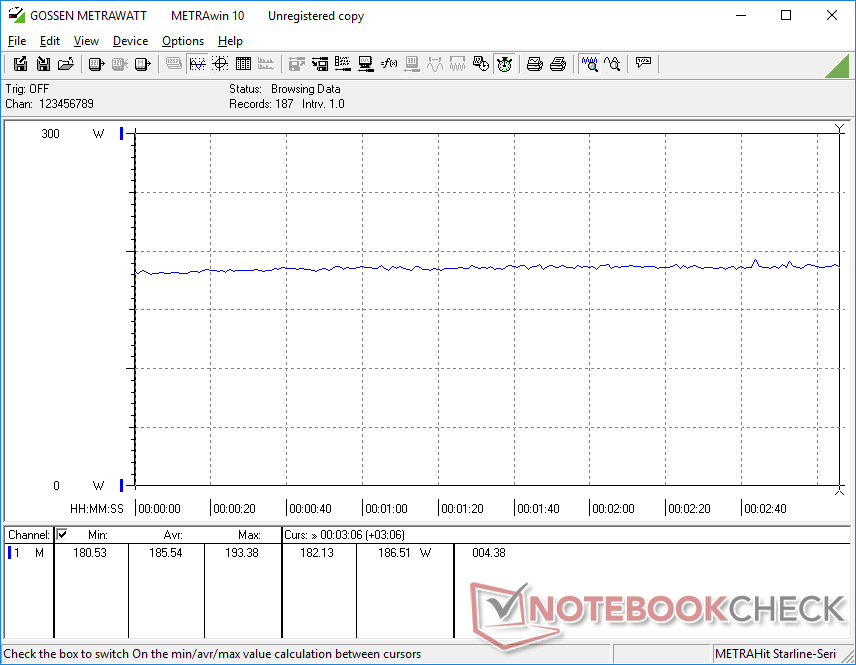
Consommation électrique
La consommation d'énergie en mode ralenti sur le bureau est à peu près la même que sur le modèle de l'année dernière. La marche au ralenti en mode iGPU avec les LED éteintes permettrait d'économiser jusqu'à 8 W par rapport à la marche au ralenti en mode dGPU avec les LED frontales actives.
En mode Witcher 3 demande 22% d'énergie en moins que le GE67HX équipé de la RTX 3070 Ti de l'année dernière, ce qui correspond aux performances graphiques brutes de notre RTX 4060, inférieures de 10 à 15%. A l'inverse, l'exécution de Prime95 demanderait 21% de puissance en plus qu'auparavant pour une augmentation de 35 à 40% de la performance multithread.
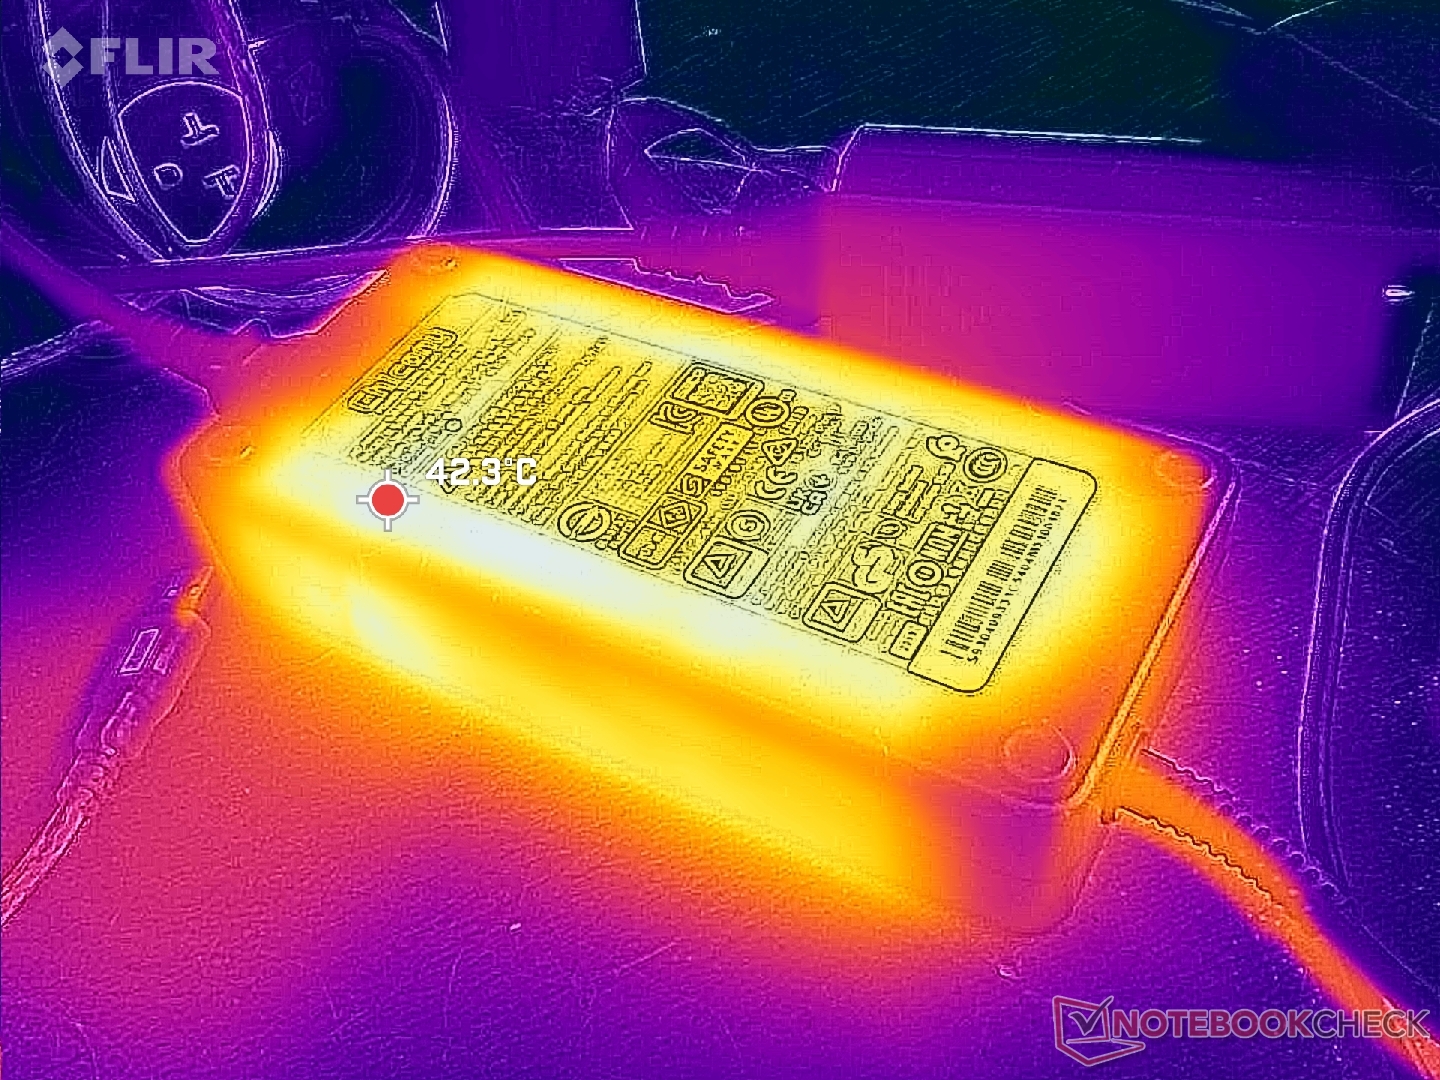
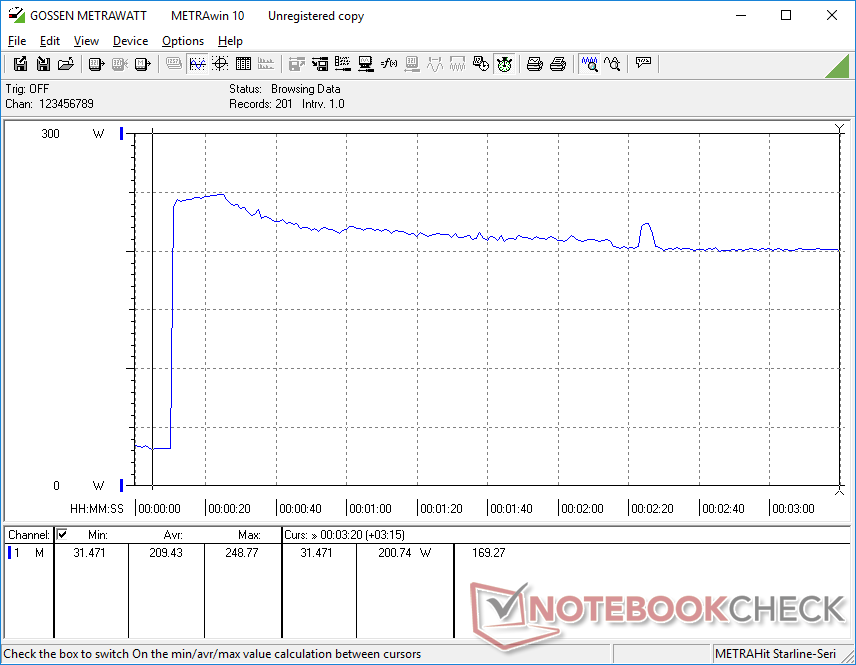
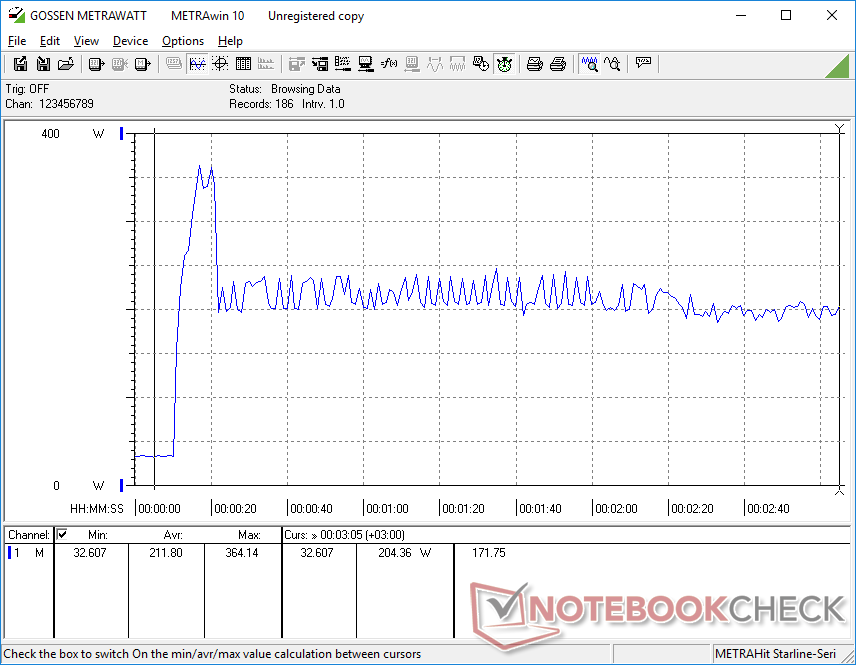
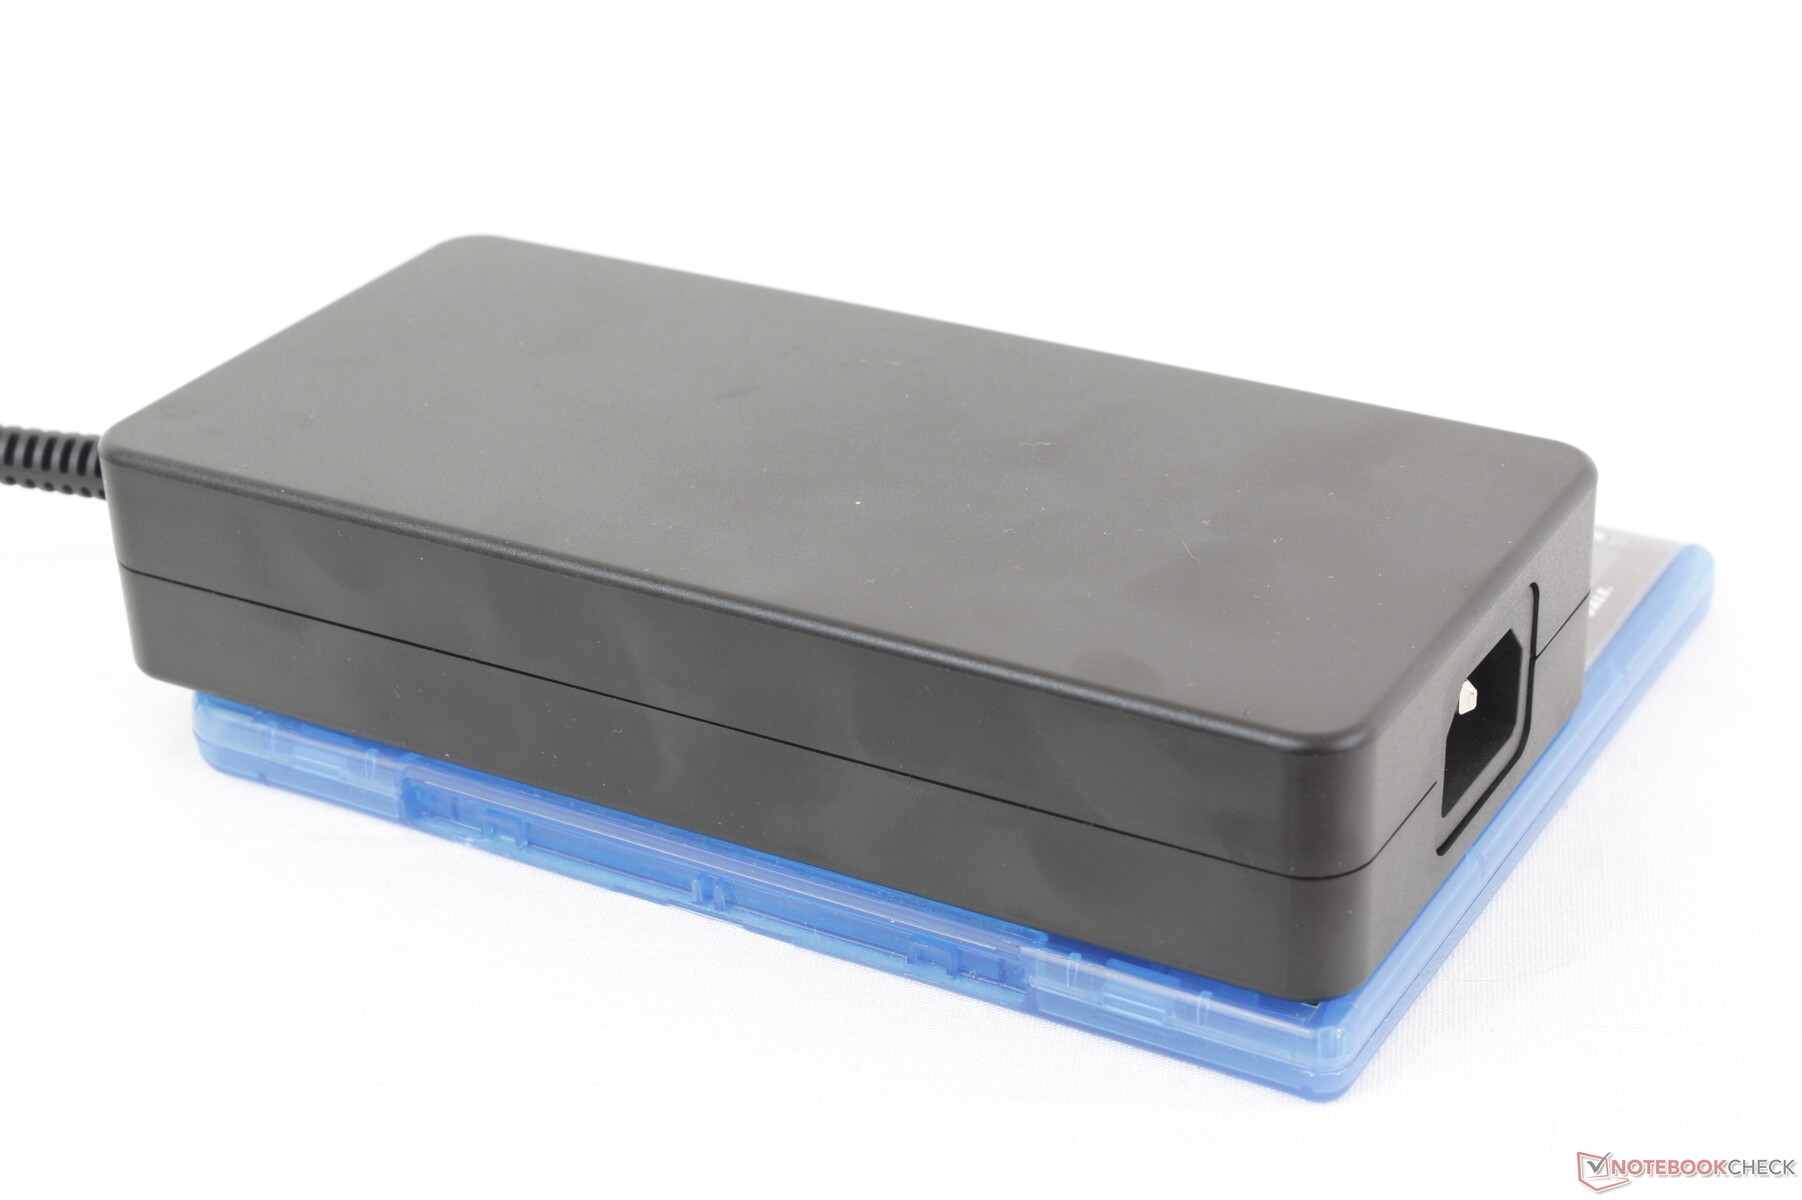
Nous avons pu enregistrer une consommation maximale temporaire de 365 W sur le grand adaptateur secteur (~18 x 8,5 x 3,5 cm) de 280 W lorsque nous avons lancé les tests Prime95 et FurMark. Ce taux diminuait et se stabilisait à environ 204 W après seulement quelques secondes, comme le montrent les graphiques ci-dessous. MSI n'a pas encore adopté la charge GaN, contrairement aux derniers portables Razer Blade.
| Éteint/en veille | |
| Au repos | |
| Fortement sollicité |
|
Légende:
min: | |
| MSI Raider GE68HX 13VF i9-13950HX, GeForce RTX 4060 Laptop GPU, Samsung PM9B1 1024GB MZVL41T0HBLB, IPS, 1900x1200, 16" | MSI GE67 HX 12UGS i7-12800HX, GeForce RTX 3070 Ti Laptop GPU, Samsung PM9A1 MZVL21T0HCLR, OLED, 1920x1080, 15.6" | HP Omen 16-xf0376ng R7 7840HS, GeForce RTX 4070 Laptop GPU, WDC PC SN810 512GB, IPS, 1920x1080, 16.1" | Alienware m16 R1 AMD R9 7845HX, GeForce RTX 4080 Laptop GPU, Kioxia XG8 KXG80ZNV1T02, IPS, 2560x1600, 16" | Lenovo Legion Slim 7i 16 Gen 8 i9-13900H, GeForce RTX 4070 Laptop GPU, Samsung PM9A1 MZVL21T0HCLR, IPS, 2560x1600, 16" | Asus ROG Zephyrus M16 GU604VY-NM042X i9-13900H, GeForce RTX 4090 Laptop GPU, Samsung PM9A1 MZVL22T0HBLB, IPS, 2560x1600, 16" | |
|---|---|---|---|---|---|---|
| Power Consumption | 1% | 34% | -81% | -12% | -4% | |
| Idle Minimum * (Watt) | 15.8 | 16.1 -2% | 9 43% | 39 -147% | 22 -39% | 20 -27% |
| Idle Average * (Watt) | 19.4 | 17.1 12% | 14 28% | 44.6 -130% | 29 -49% | 24 -24% |
| Idle Maximum * (Watt) | 27.3 | 26.6 3% | 20 27% | 68.1 -149% | 39.5 -45% | 25 8% |
| Load Average * (Watt) | 114.7 | 116.3 -1% | 84 27% | 129.8 -13% | 98.7 14% | 107 7% |
| Witcher 3 ultra * (Watt) | 185.5 | 237 -28% | 140.9 24% | 285 -54% | 171.8 7% | 208 -12% |
| Load Maximum * (Watt) | 364.2 | 291.1 20% | 176 52% | 327.3 10% | 213.2 41% | 267 27% |
* ... Moindre est la valeur, meilleures sont les performances
Power Consumption Witcher 3 / Stresstest
Power Consumption external Monitor
Autonomie de la batterie
La capacité de la batterie est aussi élevée qu'elle peut l'être légalement, à 99,9 Wh. Les durées d'utilisation sont très bonnes pour un portable de jeu de 16 pouces, avec un peu plus de 6,5 heures de navigation WLAN dans le monde réel sur le profil d'alimentation équilibré avec l'iGPU actif. C'est l'un des ordinateurs portables de jeu de 16 pouces les plus endurants que nous ayons testés à ce jour.
Malheureusement, le chargement de la batterie vide à sa pleine capacité est relativement lent : 2,5 heures, contre 1,5 heure pour la plupart des autres ordinateurs portables. De plus, aucun de nos adaptateurs secteur USB-C n'a pu recharger l'ordinateur via l'un des trois ports USB-C, même si MSI annonce Power Delivery.
| MSI Raider GE68HX 13VF i9-13950HX, GeForce RTX 4060 Laptop GPU, 99.9 Wh | MSI GE67 HX 12UGS i7-12800HX, GeForce RTX 3070 Ti Laptop GPU, 99.9 Wh | HP Omen 16-xf0376ng R7 7840HS, GeForce RTX 4070 Laptop GPU, 83 Wh | Alienware m16 R1 AMD R9 7845HX, GeForce RTX 4080 Laptop GPU, 86 Wh | Lenovo Legion Slim 7i 16 Gen 8 i9-13900H, GeForce RTX 4070 Laptop GPU, 99.9 Wh | Asus ROG Zephyrus M16 GU604VY-NM042X i9-13900H, GeForce RTX 4090 Laptop GPU, 90 Wh | |
|---|---|---|---|---|---|---|
| Autonomie de la batterie | -2% | -16% | -52% | -42% | 12% | |
| Reader / Idle (h) | 8.8 | 8.4 -5% | 4 -55% | 5.1 -42% | ||
| WiFi v1.3 (h) | 6.8 | 5.6 -18% | 5.7 -16% | 3.7 -46% | 4.4 -35% | 4.3 -37% |
| Load (h) | 1.8 | 2.1 17% | 0.8 -56% | 0.9 -50% | 2.9 61% | |
| H.264 (h) | 4.8 |
Points positifs
Points négatifs
Verdict - Pas mal, mais pas assez
Bien que nous apprécions que le fabricant prenne une direction différente avec ses ordinateurs portables de jeu, nous croyons fermement que les changements ne doivent pas se faire au détriment de la facilité d'entretien pour l'utilisateur final. Le GE68HX est plus difficile à ouvrir que le modèle de l'année dernière, ce qui peut être particulièrement problématique sur un ordinateur portable de jeu où les propriétaires sont plus susceptibles d'ajouter eux-mêmes de la mémoire vive et du stockage. Deuxièmement, le nouveau design est sensiblement plus épais et plus lourd que l'aspect plus "propre" du GE67HX, ce qui risque de ne pas plaire à beaucoup d'utilisateurs.
Le nouveau châssis présente tout de même quelques avantages. Tout d'abord, les charnières semblent plus robustes qu'auparavant, tandis que le reste du châssis est tout aussi solide. Deuxièmement, les températures du cœur sont plus basses que sur le GE67HX, ce qui permet d'améliorer le potentiel d'overclocking. Les performances sont même légèrement plus rapides que prévu avec le profil d'alimentation et les paramètres par défaut. Enfin, certains utilisateurs pourraient apprécier le clickpad plus grand et le nouveau pavé numérique pour des applications autres que le jeu.
Les performances et les températures bénéficient de la conception plus épaisse du châssis, mais tout le monde ne sera pas satisfait du poids plus élevé, de l'entretien plus difficile et des options d'affichage bas de gamme, compte tenu du prix de départ élevé.
A partir de 1700 dollars, les compromis sur les couleurs d'affichage, la G-Sync et les performances du SSD semblent inutiles pour un modèle de la série GE haut de gamme. De tels compromis sont plutôt attendus pour les modèles des séries MSI Sword ou Katana, plus bas de gamme. Le fabricant est également à la traîne en matière de technologie de charge ; les chargeurs GaN de Razer, plus petits et plus portables, peuvent fournir autant d'énergie, tandis que la prise en charge de la charge USB-C sur le GE68HX ne semble pas fiable.
Des alternatives comme leLenovo Legion Slim 7i 16 Gen 8, Asus ROG Zephyrus M16ou Razer Blade 16 n'offrent pas toujours des processeurs Core-HX, mais ils sont beaucoup plus portables tout en offrant des options graphiques similaires et de meilleurs écrans.
Prix et disponibilité
MSI Raider GE68HX 13VF
- 09/30/2023 v7 (old)
Allen Ngo
Transparency
La sélection des appareils à examiner est effectuée par notre équipe éditoriale. L'échantillon de test a été acheté gratuitement par l'auteur, à ses propres frais. Le prêteur n'a eu aucune influence sur cette évaluation et le fabricant n'a pas reçu de copie de cette évaluation avant sa publication. Il n'y avait aucune obligation de publier cet article. En tant que média indépendant, Notebookcheck n'est pas soumis à l'autorité des fabricants, des détaillants ou des éditeurs.
Voici comment Notebookcheck teste
Chaque année, Notebookcheck examine de manière indépendante des centaines d'ordinateurs portables et de smartphones en utilisant des procédures standardisées afin de garantir que tous les résultats sont comparables. Nous avons continuellement développé nos méthodes de test depuis environ 20 ans et avons établi des normes industrielles dans le processus. Dans nos laboratoires de test, des équipements de mesure de haute qualité sont utilisés par des techniciens et des rédacteurs expérimentés. Ces tests impliquent un processus de validation en plusieurs étapes. Notre système d'évaluation complexe repose sur des centaines de mesures et de points de référence bien fondés, ce qui garantit l'objectivité.Price comparison

