Test du Lenovo Yoga C940-15IRH (i7-9750H, GTX 1650 Max-Q, FHD) : le XPS 15 2-en-1 que Dell aurait dû faire
Note | Date | Modèle | Poids | Épaisseur | Taille | Résolution | Prix |
|---|---|---|---|---|---|---|---|
| 86 % v7 (old) | 12/19 | Lenovo Yoga C940-15IRH i7-9750H, GeForce GTX 1650 Max-Q | 2 kg | 19.7 mm | 15.60" | 1920x1080 | |
| 87.8 % v7 (old) | 10/19 | Dell XPS 15 7590 9980HK GTX 1650 i9-9980HK, GeForce GTX 1650 Mobile | 2 kg | 17 mm | 15.60" | 3840x2160 | |
| 83.1 % v7 (old) | 12/19 | Asus ZenBook 15 UX534FT-DB77 i7-8565U, GeForce GTX 1650 Max-Q | 1.7 kg | 18.9 mm | 15.60" | 1920x1080 | |
| 83.9 % v7 (old) | 08/19 | HP Gaming Pavilion 15-dk0009ng i7-9750H, GeForce GTX 1660 Ti Max-Q | 2.4 kg | 23.4 mm | 15.60" | 1920x1080 | |
| 85.2 % v7 (old) | 11/19 | MSI Prestige 15 A10SC i7-10710U, GeForce GTX 1650 Max-Q | 1.7 kg | 16 mm | 15.60" | 3840x2160 |
| Networking | |
| iperf3 transmit AX12 | |
| MSI Prestige 15 A10SC | |
| Dell XPS 15 7590 9980HK GTX 1650 | |
| Asus ZenBook 15 UX534FT-DB77 | |
| iperf3 receive AX12 | |
| MSI Prestige 15 A10SC | |
| Asus ZenBook 15 UX534FT-DB77 | |
| Dell XPS 15 7590 9980HK GTX 1650 | |
| |||||||||||||||||||||||||
Homogénéité de la luminosité: 82 %
Valeur mesurée au centre, sur batterie: 484.8 cd/m²
Contraste: 1865:1 (Valeurs des noirs: 0.26 cd/m²)
ΔE ColorChecker Calman: 4.5 | ∀{0.5-29.43 Ø4.73}
calibrated: 1.19
ΔE Greyscale Calman: 5.7 | ∀{0.09-98 Ø4.97}
92.8% sRGB (Argyll 1.6.3 3D)
58.7% AdobeRGB 1998 (Argyll 1.6.3 3D)
63.6% AdobeRGB 1998 (Argyll 3D)
92.7% sRGB (Argyll 3D)
61.5% Display P3 (Argyll 3D)
Gamma: 2.45
CCT: 6101 K
| Lenovo Yoga C940-15IRH LG Philips LP156WFC-SPU1, IPS, 15.6", 1920x1080 | Dell XPS 15 7590 9980HK GTX 1650 Samsung 156WR04, SDCA029, OLED, 15.6", 3840x2160 | Asus ZenBook 15 UX534FT-DB77 BOE NV156FHM-N63, IPS, 15.6", 1920x1080 | Lenovo Ideapad 720S-15IKB 81AC001AGE Chi Mei CMN15E8 / N156HCE-EN1 CMN, IPS, 15.6", 1920x1080 | HP Gaming Pavilion 15-dk0009ng LG Philips LGD05FE, IPS, 15.6", 1920x1080 | MSI GP65 Leopard 9SE-225US LG Philips LGD0625, IPS, 15.6", 1920x1080 | HP Spectre x360 15-df0126ng AU Optronics AUO30EB, IPS, 15.6", 3840x2160 | |
|---|---|---|---|---|---|---|---|
| Display | 31% | 1% | 0% | 3% | 4% | 7% | |
| Display P3 Coverage (%) | 61.5 | 88.1 43% | 66.6 8% | 63.6 3% | 64.2 4% | 64.8 5% | 68.1 11% |
| sRGB Coverage (%) | 92.7 | 99.6 7% | 87.7 -5% | 89.4 -4% | 95.1 3% | 96.2 4% | 94.2 2% |
| AdobeRGB 1998 Coverage (%) | 63.6 | 91.8 44% | 64.1 1% | 64.3 1% | 65.8 3% | 66.3 4% | 68.4 8% |
| Response Times | 94% | 12% | 31% | 69% | 76% | -2% | |
| Response Time Grey 50% / Grey 80% * (ms) | 48.4 ? | 2.3 ? 95% | 41.2 ? 15% | 34 ? 30% | 16.4 ? 66% | 9.6 ? 80% | 57 ? -18% |
| Response Time Black / White * (ms) | 36.4 ? | 2.4 ? 93% | 33.2 ? 9% | 25 ? 31% | 10.4 ? 71% | 10.4 ? 71% | 31 ? 15% |
| PWM Frequency (Hz) | 59.5 ? | 25000 ? | |||||
| Screen | -1% | -36% | -12% | 5% | 2% | -16% | |
| Brightness middle (cd/m²) | 484.8 | 421.2 -13% | 312.6 -36% | 332 -32% | 345 -29% | 348.3 -28% | 330 -32% |
| Brightness (cd/m²) | 463 | 417 -10% | 290 -37% | 301 -35% | 324 -30% | 327 -29% | 310 -33% |
| Brightness Distribution (%) | 82 | 94 15% | 85 4% | 83 1% | 86 5% | 85 4% | 87 6% |
| Black Level * (cd/m²) | 0.26 | 0.31 -19% | 0.29 -12% | 0.42 -62% | 0.4 -54% | 0.37 -42% | |
| Contrast (:1) | 1865 | 1008 -46% | 1145 -39% | 821 -56% | 871 -53% | 892 -52% | |
| Colorchecker dE 2000 * | 4.5 | 6.06 -35% | 5.78 -28% | 3.73 17% | 1.3 71% | 1.6 64% | 4.03 10% |
| Colorchecker dE 2000 max. * | 7.55 | 11.89 -57% | 8.86 -17% | 6.6 13% | 2.8 63% | 5.07 33% | 6.74 11% |
| Colorchecker dE 2000 calibrated * | 1.19 | 3.78 -218% | 2 -68% | 1.1 8% | 1 16% | 1.96 -65% | |
| Greyscale dE 2000 * | 5.7 | 2.8 51% | 5.4 5% | 3.96 31% | 1.2 79% | 2.3 60% | 4.49 21% |
| Gamma | 2.45 90% | 2.15 102% | 2.21 100% | 2.4 92% | 2.31 95% | 2.203 100% | 2.57 86% |
| CCT | 6101 107% | 6235 104% | 7864 83% | 6921 94% | 6476 100% | 6707 97% | 6744 96% |
| Color Space (Percent of AdobeRGB 1998) (%) | 58.7 | 81 38% | 57.1 -3% | 58 -1% | 60.5 3% | 61 4% | 61 4% |
| Color Space (Percent of sRGB) (%) | 92.8 | 99.6 7% | 87.4 -6% | 89 -4% | 94.9 2% | 96 3% | 94 1% |
| Moyenne finale (programmes/paramètres) | 41% /
21% | -8% /
-23% | 6% /
-4% | 26% /
13% | 27% /
12% | -4% /
-10% |
* ... Moindre est la valeur, meilleures sont les performances
Temps de réponse de l'écran
| ↔ Temps de réponse noir à blanc | ||
|---|---|---|
| 36.4 ms ... hausse ↗ et chute ↘ combinées | ↗ 21.2 ms hausse | 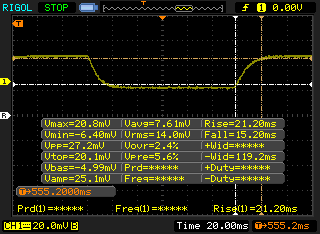 |
| ↘ 15.2 ms chute | ||
| L'écran souffre de latences très élevées, à éviter pour le jeu. En comparaison, tous les appareils testés affichent entre 0.1 (minimum) et 240 (maximum) ms. » 95 % des appareils testés affichent de meilleures performances. Cela signifie que les latences relevées sont moins bonnes que la moyenne (19.9 ms) de tous les appareils testés. | ||
| ↔ Temps de réponse gris 50% à gris 80% | ||
| 48.4 ms ... hausse ↗ et chute ↘ combinées | ↗ 24.4 ms hausse | 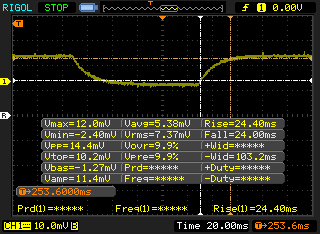 |
| ↘ 24 ms chute | ||
| L'écran souffre de latences très élevées, à éviter pour le jeu. En comparaison, tous les appareils testés affichent entre 0.165 (minimum) et 636 (maximum) ms. » 84 % des appareils testés affichent de meilleures performances. Cela signifie que les latences relevées sont moins bonnes que la moyenne (31.1 ms) de tous les appareils testés. | ||
Scintillement / MLI (Modulation de largeur d'impulsion)
| Scintillement / MLI (Modulation de largeur d'impulsion) non décelé | 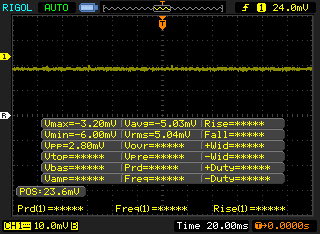 | ||
En comparaison, 52 % des appareils testés n'emploient pas MDI pour assombrir leur écran. Nous avons relevé une moyenne à 7798 (minimum : 5 - maximum : 343500) Hz dans le cas où une MDI était active. | |||
| PCMark 8 Home Score Accelerated v2 | 4069 points | |
| PCMark 8 Work Score Accelerated v2 | 5359 points | |
| PCMark 10 Score | 4887 points | |
Aide | ||
| Lenovo Yoga C940-15IRH Intel Optane Memory H10 with Solid State Storage 32GB + 512GB HBRPEKNX0202A(L/H) | Dell XPS 15 7590 9980HK GTX 1650 Toshiba XG6 KXG60ZNV1T02 | Asus ZenBook 15 UX534FT-DB77 Samsung SSD PM981 MZVLB1T0HALR | Lenovo Ideapad 720S-15IKB 81AC001AGE Samsung SSD PM981 MZVLB512HAJQ | HP Gaming Pavilion 15-dk0009ng Samsung SSD PM981 MZVLB256HAHQ | MSI GP65 Leopard 9SE-225US Toshiba KBG30ZMT512G | |
|---|---|---|---|---|---|---|
| AS SSD | 99% | 75% | 139% | 27% | -17% | |
| Seq Read (MB/s) | 769 | 1723 124% | 1887 145% | 2469 221% | 2088 172% | 1307 70% |
| Seq Write (MB/s) | 351.1 | 1386 295% | 1432 308% | 1991 467% | 1347 284% | 730 108% |
| 4K Read (MB/s) | 69.1 | 43.25 -37% | 52.3 -24% | 54.3 -21% | 36.14 -48% | 27.58 -60% |
| 4K Write (MB/s) | 100.9 | 98.3 -3% | 146 45% | 99.8 -1% | 96.5 -4% | 80.3 -20% |
| 4K-64 Read (MB/s) | 472 | 1078 128% | 969 105% | 1823 286% | 565 20% | 878 86% |
| 4K-64 Write (MB/s) | 948 | 1456 54% | 1375 45% | 1282 35% | 588 -38% | 246.8 -74% |
| Access Time Read * (ms) | 0.071 | 0.05 30% | 0.034 52% | 0.042 41% | 0.093 -31% | 0.231 -225% |
| Access Time Write * (ms) | 0.137 | 0.039 72% | 0.075 45% | 0.039 72% | 0.038 72% | 0.223 -63% |
| Score Read (Points) | 618 | 1294 109% | 1210 96% | 2125 244% | 810 31% | 1036 68% |
| Score Write (Points) | 1084 | 1693 56% | 1664 54% | 1581 46% | 819 -24% | 400 -63% |
| Score Total (Points) | 2024 | 3638 80% | 3483 72% | 4771 136% | 2014 0% | 1940 -4% |
| Copy ISO MB/s (MB/s) | 839 | 3182 279% | 1375 64% | 1043 24% | 993 18% | |
| Copy Program MB/s (MB/s) | 455.8 | 984 116% | 468 3% | 371.7 -18% | 309.5 -32% | |
| Copy Game MB/s (MB/s) | 969 | 1824 88% | 1287 33% | 399.9 -59% | 582 -40% | |
| CrystalDiskMark 5.2 / 6 | 50% | 63% | 59% | 14% | -26% | |
| Write 4K (MB/s) | 102.2 | 104.3 2% | 141.6 39% | 139.3 36% | 100 -2% | 99.3 -3% |
| Read 4K (MB/s) | 114.3 | 45.23 -60% | 45.28 -60% | 46.78 -59% | 31.39 -73% | 46.96 -59% |
| Write Seq (MB/s) | 468.3 | 1729 269% | 1975 322% | 2125 354% | 1308 179% | |
| Read Seq (MB/s) | 1236 | 1861 51% | 2272 84% | 2354 90% | 1083 -12% | |
| Write 4K Q32T1 (MB/s) | 556 | 509 -8% | 458.6 -18% | 298.4 -46% | 362.9 -35% | 240.1 -57% |
| Read 4K Q32T1 (MB/s) | 421.6 | 388.5 -8% | 391.4 -7% | 355.8 -16% | 425.7 1% | 581 38% |
| Write Seq Q32T1 (MB/s) | 1264 | 2813 123% | 2393 89% | 2128 68% | 1411 12% | 686 -46% |
| Read Seq Q32T1 (MB/s) | 2239 | 2906 30% | 3464 55% | 3324 48% | 3240 45% | 1581 -29% |
| Write 4K Q8T8 (MB/s) | 268.1 | |||||
| Read 4K Q8T8 (MB/s) | 977 | |||||
| Moyenne finale (programmes/paramètres) | 75% /
81% | 69% /
70% | 99% /
105% | 21% /
23% | -22% /
-19% |
* ... Moindre est la valeur, meilleures sont les performances

| 3DMark 11 Performance | 11952 points | |
| 3DMark Cloud Gate Standard Score | 29013 points | |
| 3DMark Fire Strike Score | 7717 points | |
| 3DMark Time Spy Score | 3494 points | |
Aide | ||
| Bas | Moyen | Élevé | Ultra | |
|---|---|---|---|---|
| BioShock Infinite (2013) | 317.2 | 231.2 | 215.2 | 84.3 |
| The Witcher 3 (2015) | 196 | 119.8 | 65.1 | 36.5 |
| Rocket League (2017) | 247.2 | 222.4 | 145.6 | |
| Shadow of the Tomb Raider (2018) | 105 | 58 | 51 | 45 |
| Lenovo Yoga C940-15IRH GeForce GTX 1650 Max-Q, i7-9750H, Intel Optane Memory H10 with Solid State Storage 32GB + 512GB HBRPEKNX0202A(L/H) | Dell XPS 15 7590 9980HK GTX 1650 GeForce GTX 1650 Mobile, i9-9980HK, Toshiba XG6 KXG60ZNV1T02 | Asus ZenBook 15 UX534FT-DB77 GeForce GTX 1650 Max-Q, i7-8565U, Samsung SSD PM981 MZVLB1T0HALR | Lenovo Ideapad 720S-15IKB 81AC001AGE GeForce GTX 1050 Ti Max-Q, i7-7700HQ, Samsung SSD PM981 MZVLB512HAJQ | HP Gaming Pavilion 15-dk0009ng GeForce GTX 1660 Ti Max-Q, i7-9750H, Samsung SSD PM981 MZVLB256HAHQ | MSI GP65 Leopard 9SE-225US GeForce RTX 2060 Mobile, i7-9750H, Toshiba KBG30ZMT512G | |
|---|---|---|---|---|---|---|
| Noise | -1% | 7% | 0% | 8% | -0% | |
| arrêt / environnement * (dB) | 28.7 | 28.2 2% | 28.4 1% | 30.3 -6% | 28.2 2% | 28.2 2% |
| Idle Minimum * (dB) | 28.7 | 28.2 2% | 28.4 1% | 30.3 -6% | 29.3 -2% | 29.5 -3% |
| Idle Average * (dB) | 28.8 | 28.2 2% | 28.4 1% | 30.3 -5% | 29.3 -2% | 29.6 -3% |
| Idle Maximum * (dB) | 28.8 | 30.4 -6% | 28.4 1% | 30.3 -5% | 29.3 -2% | 29.6 -3% |
| Load Average * (dB) | 45 | 43.8 3% | 33.9 25% | 39.3 13% | 32.3 28% | 33 27% |
| Witcher 3 ultra * (dB) | 44.7 | 47.2 -6% | 39.8 11% | 34 24% | 47.2 -6% | |
| Load Maximum * (dB) | 44.7 | 47.2 -6% | 40.2 10% | 39.6 11% | 41.2 8% | 52 -16% |
* ... Moindre est la valeur, meilleures sont les performances
Degré de la nuisance sonore
| Au repos |
| 28.7 / 28.8 / 28.8 dB(A) |
| Fortement sollicité |
| 45 / 44.7 dB(A) |
 | ||
30 dB silencieux 40 dB(A) audible 50 dB(A) bruyant |
||
min: | ||
(-) La température maximale du côté supérieur est de 46.2 °C / 115 F, par rapport à la moyenne de 36.8 °C / 98 F, allant de 21 à 71 °C pour la classe Multimedia.
(±) Le fond chauffe jusqu'à un maximum de 45 °C / 113 F, contre une moyenne de 39.1 °C / 102 F
(+) En utilisation inactive, la température moyenne du côté supérieur est de 23.9 °C / 75 F, par rapport à la moyenne du dispositif de 31.3 °C / 88 F.
(±) En jouant à The Witcher 3, la température moyenne du côté supérieur est de 32 °C / 90 F, alors que la moyenne de l'appareil est de 31.3 °C / 88 F.
(+) Les repose-poignets et le pavé tactile sont plus froids que la température de la peau avec un maximum de 31 °C / 87.8 F et sont donc froids au toucher.
(-) La température moyenne de la zone de l'appui-paume de dispositifs similaires était de 28.7 °C / 83.7 F (-2.3 °C / #-4.1 F).
Lenovo Yoga C940-15IRH analyse audio
(+) | les haut-parleurs peuvent jouer relativement fort (85.3# dB)
Basses 100 - 315 Hz
(±) | basse réduite - en moyenne 9.8% inférieure à la médiane
(±) | la linéarité des basses est moyenne (14% delta à la fréquence précédente)
Médiums 400 - 2000 Hz
(±) | médiane supérieure - en moyenne 6.5% supérieure à la médiane
(+) | les médiums sont linéaires (5.1% delta à la fréquence précédente)
Aiguës 2 - 16 kHz
(+) | des sommets équilibrés - à seulement 3.4% de la médiane
(±) | la linéarité des aigus est moyenne (8.5% delta à la fréquence précédente)
Globalement 100 - 16 000 Hz
(±) | la linéarité du son global est moyenne (17.8% de différence avec la médiane)
Par rapport à la même classe
» 52% de tous les appareils testés de cette catégorie étaient meilleurs, 7% similaires, 41% pires
» Le meilleur avait un delta de 5%, la moyenne était de 17%, le pire était de 45%.
Par rapport à tous les appareils testés
» 36% de tous les appareils testés étaient meilleurs, 8% similaires, 56% pires
» Le meilleur avait un delta de 4%, la moyenne était de 24%, le pire était de 134%.
Apple MacBook 12 (Early 2016) 1.1 GHz analyse audio
(+) | les haut-parleurs peuvent jouer relativement fort (83.6# dB)
Basses 100 - 315 Hz
(±) | basse réduite - en moyenne 11.3% inférieure à la médiane
(±) | la linéarité des basses est moyenne (14.2% delta à la fréquence précédente)
Médiums 400 - 2000 Hz
(+) | médiane équilibrée - seulement 2.4% de la médiane
(+) | les médiums sont linéaires (5.5% delta à la fréquence précédente)
Aiguës 2 - 16 kHz
(+) | des sommets équilibrés - à seulement 2% de la médiane
(+) | les aigus sont linéaires (4.5% delta à la fréquence précédente)
Globalement 100 - 16 000 Hz
(+) | le son global est linéaire (10.2% différence à la médiane)
Par rapport à la même classe
» 7% de tous les appareils testés de cette catégorie étaient meilleurs, 2% similaires, 91% pires
» Le meilleur avait un delta de 5%, la moyenne était de 18%, le pire était de 53%.
Par rapport à tous les appareils testés
» 5% de tous les appareils testés étaient meilleurs, 1% similaires, 94% pires
» Le meilleur avait un delta de 4%, la moyenne était de 24%, le pire était de 134%.
| Éteint/en veille | |
| Au repos | |
| Fortement sollicité |
|
Légende:
min: | |
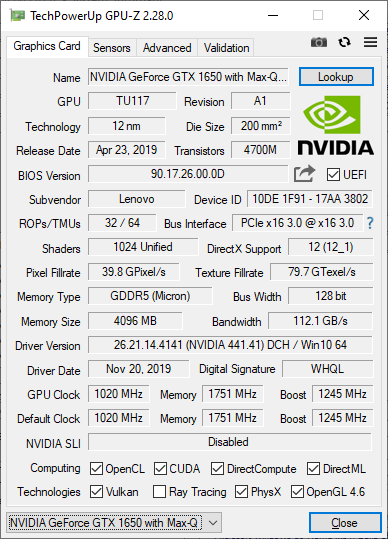
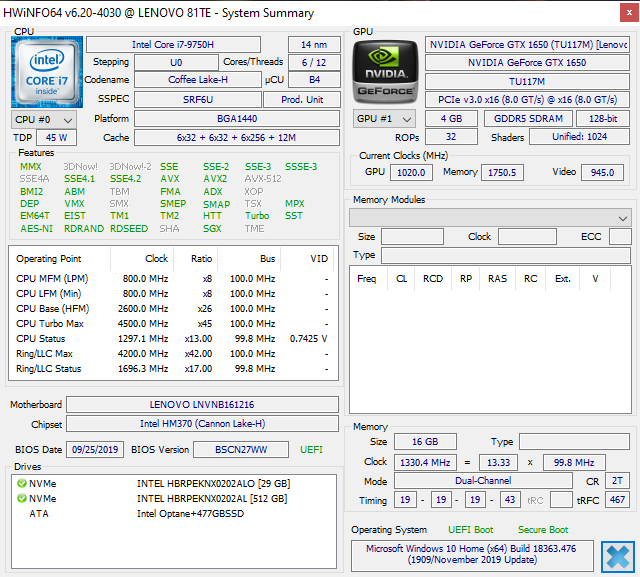
| Lenovo Yoga C940-15IRH i7-9750H, GeForce GTX 1650 Max-Q, Intel Optane Memory H10 with Solid State Storage 32GB + 512GB HBRPEKNX0202A(L/H), IPS, 1920x1080, 15.6" | Dell XPS 15 7590 9980HK GTX 1650 i9-9980HK, GeForce GTX 1650 Mobile, Toshiba XG6 KXG60ZNV1T02, OLED, 3840x2160, 15.6" | Asus ZenBook 15 UX534FT-DB77 i7-8565U, GeForce GTX 1650 Max-Q, Samsung SSD PM981 MZVLB1T0HALR, IPS, 1920x1080, 15.6" | HP Gaming Pavilion 15-dk0009ng i7-9750H, GeForce GTX 1660 Ti Max-Q, Samsung SSD PM981 MZVLB256HAHQ, IPS, 1920x1080, 15.6" | MSI GP65 Leopard 9SE-225US i7-9750H, GeForce RTX 2060 Mobile, Toshiba KBG30ZMT512G, IPS, 1920x1080, 15.6" | HP Pavilion Gaming 15-cx0003ng i7-8750H, GeForce GTX 1050 Ti Mobile, Intel Optane 16 GB MEMPEK1J016GAH + HGST HTS721010A9E630 1 TB HDD, IPS, 1920x1080, 15.6" | |
|---|---|---|---|---|---|---|
| Power Consumption | -4% | 7% | -11% | -61% | 9% | |
| Idle Minimum * (Watt) | 5.2 | 6.2 -19% | 5 4% | 6.8 -31% | 13.6 -162% | 5.5 -6% |
| Idle Average * (Watt) | 10.7 | 9.6 10% | 13.2 -23% | 10.7 -0% | 17.9 -67% | 8.5 21% |
| Idle Maximum * (Watt) | 24.3 | 21.2 13% | 24 1% | 12.5 49% | 20.6 15% | 11.9 51% |
| Load Average * (Watt) | 84.4 | 104.3 -24% | 70 17% | 87.2 -3% | 96 -14% | 94 -11% |
| Witcher 3 ultra * (Watt) | 83.9 | 91.7 -9% | 63.3 25% | 121 -44% | 154.6 -84% | 86 -3% |
| Load Maximum * (Watt) | 142.8 | 135.3 5% | 114 20% | 191.4 -34% | 218.6 -53% | 144 -1% |
* ... Moindre est la valeur, meilleures sont les performances
| Lenovo Yoga C940-15IRH i7-9750H, GeForce GTX 1650 Max-Q, 69 Wh | Dell XPS 15 7590 9980HK GTX 1650 i9-9980HK, GeForce GTX 1650 Mobile, 97 Wh | Asus ZenBook 15 UX534FT-DB77 i7-8565U, GeForce GTX 1650 Max-Q, 71 Wh | Lenovo Ideapad 720S-15IKB 81AC001AGE i7-7700HQ, GeForce GTX 1050 Ti Max-Q, 79 Wh | HP Gaming Pavilion 15-dk0009ng i7-9750H, GeForce GTX 1660 Ti Max-Q, 52.5 Wh | MSI GP65 Leopard 9SE-225US i7-9750H, GeForce RTX 2060 Mobile, 51 Wh | Dell XPS 15 9575 i7-8705G i7-8705G, Vega M GL / 870, 75 Wh | |
|---|---|---|---|---|---|---|---|
| Autonomie de la batterie | 65% | 65% | 32% | -24% | -39% | -19% | |
| Reader / Idle (h) | 18.2 | 15.2 -16% | 21.5 18% | 22.6 24% | 8.7 -52% | 6 -67% | 11.2 -38% |
| WiFi v1.3 (h) | 9.7 | 7.8 -20% | 8.4 -13% | 9.8 1% | 4.8 -51% | 3.9 -60% | 7 -28% |
| Load (h) | 1 | 3.3 230% | 2.9 190% | 1.7 70% | 1.3 30% | 1.1 10% | 1.1 10% |
| Witcher 3 ultra (h) | 1 |
Points positifs
Points négatifs
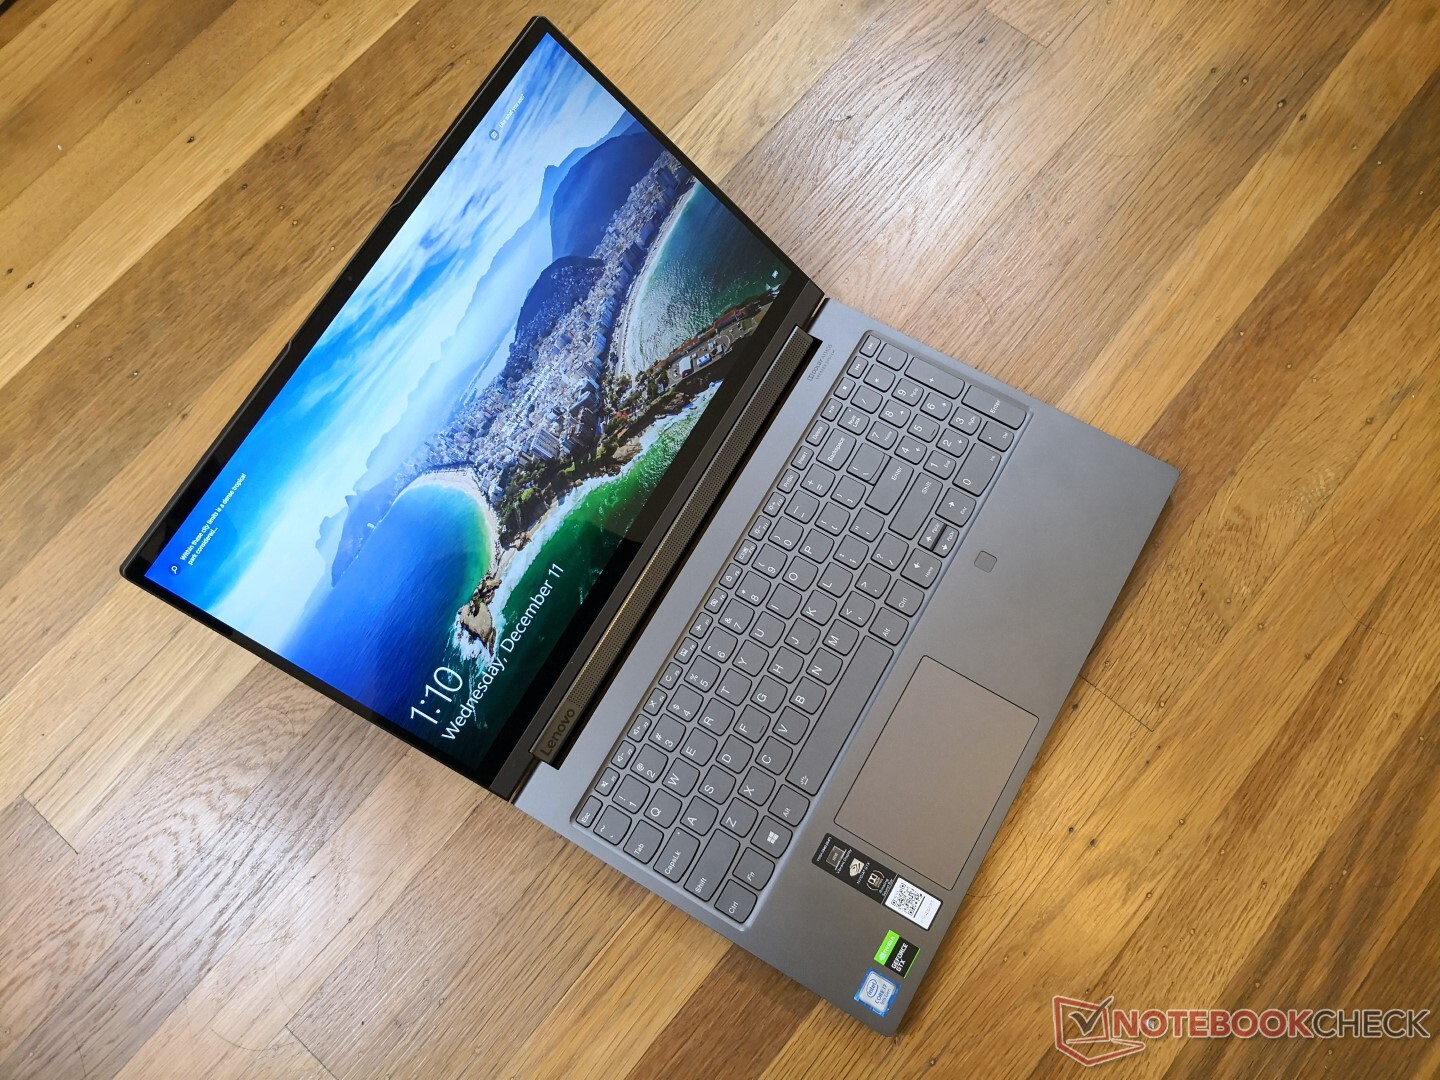
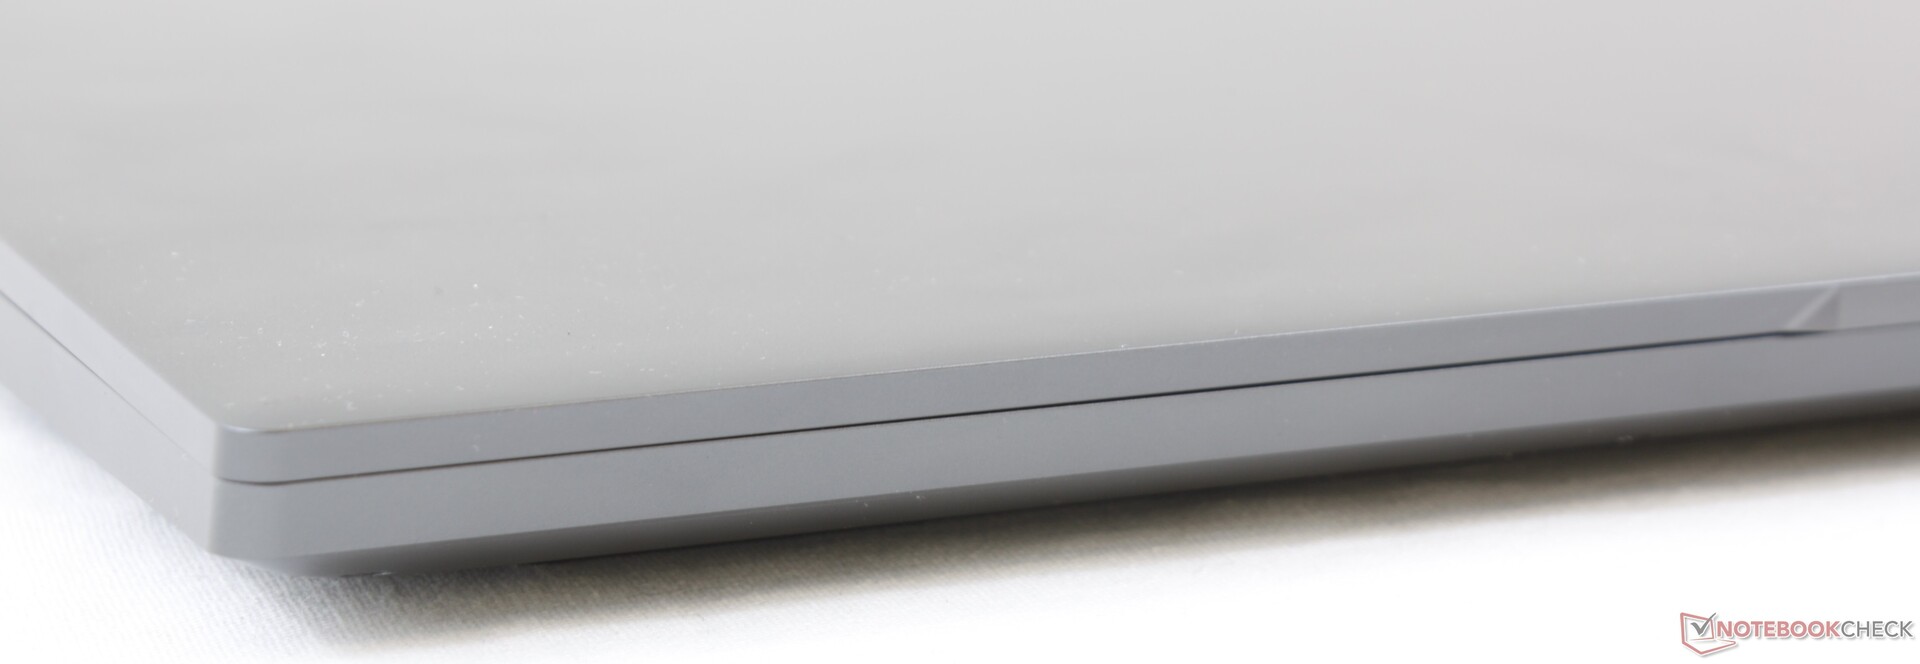
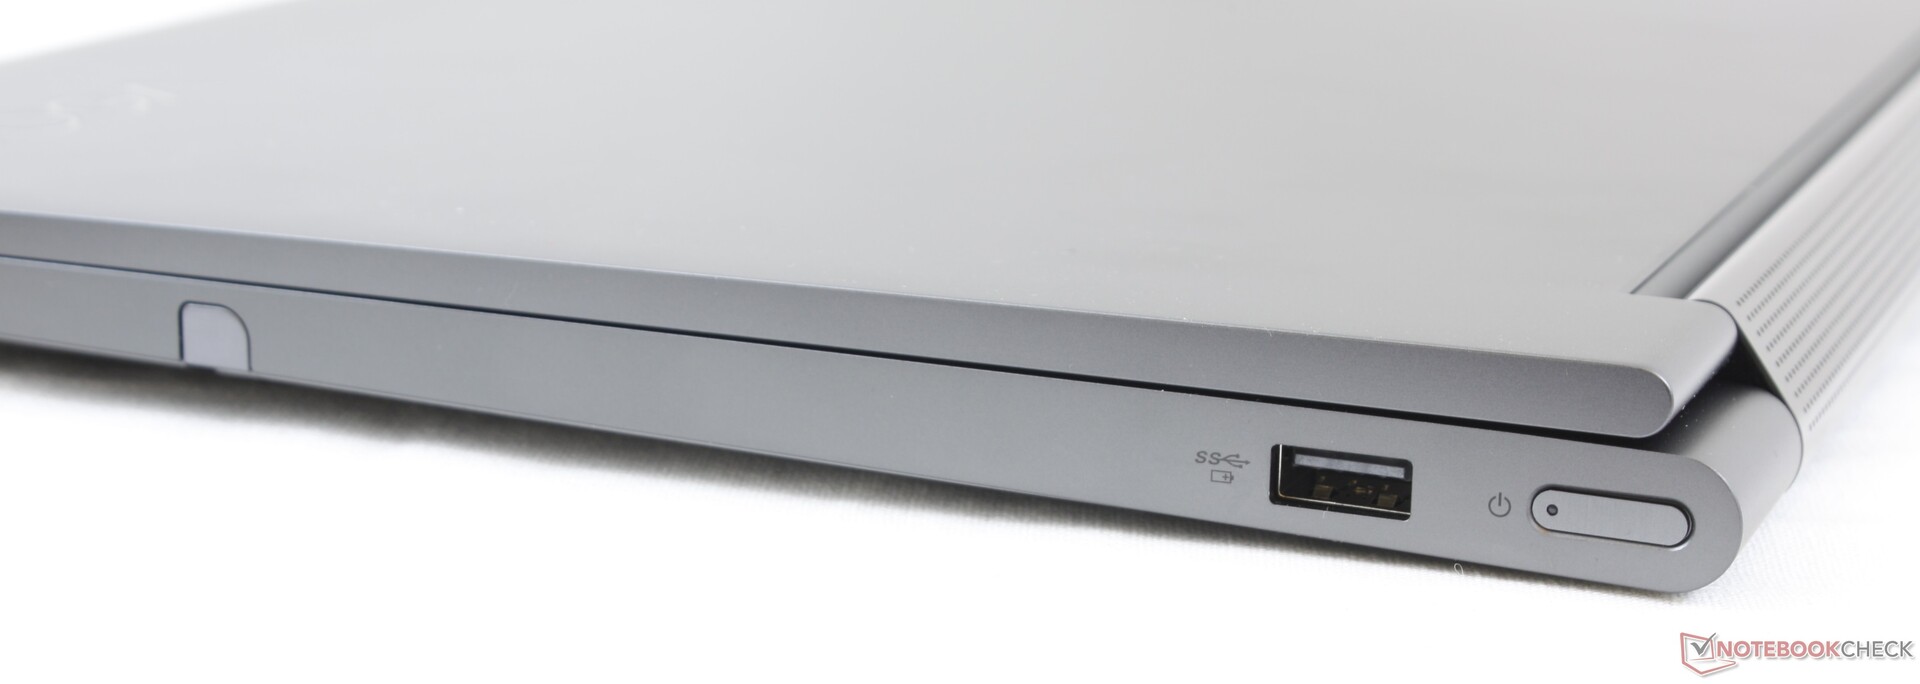
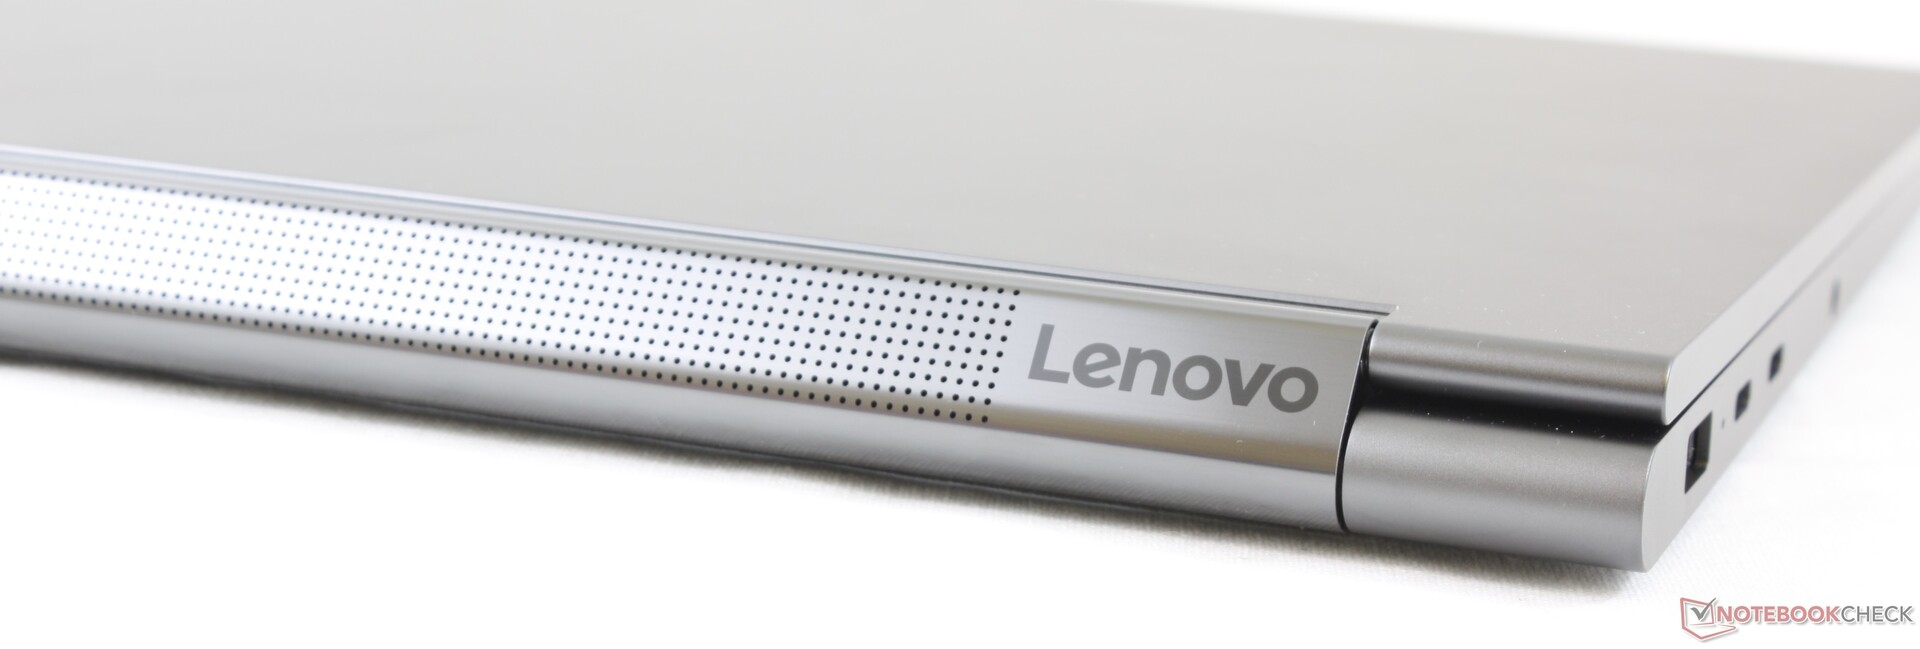
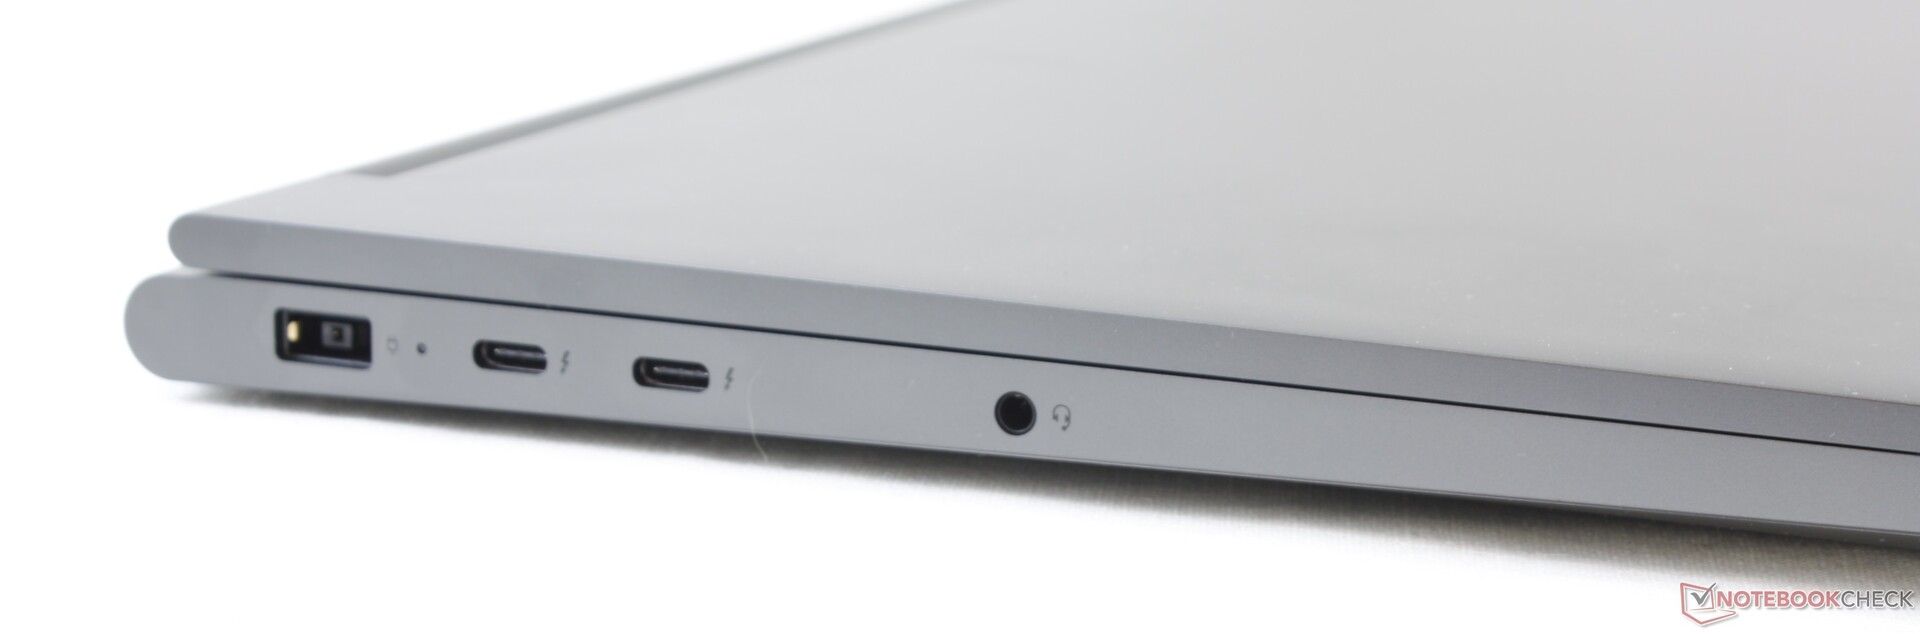
Quand Dell a annoncé son XPS 15 2-en-1, les utilisateurs s’attendaient à un XPS 15 classique mais avec des charnières à 360 degrés. Au lieu de cela, nous avons eu un châssis totalement nouveau avec des couples processeur et carte graphique propres à déstabiliser les fans traditionnels du XPS 15. Le Lenovo Yoga C940-15 est proche de ce que l’on pensait que le XPS 15 2-en-1 serait : un convertible tactile avec un clavier chiclet classique, un processeur traditionnel Intel Core H, une carte graphique GeForce GTX, une maintenance aisée, et un rangement pour stylet plus sécurisé qu’un emplacement magnétique.
Avoir une carte graphique de jeu dans un convertible de 15,6 pouces possède des désavantages. En particulier, le mode tablette est à n’utiliser qu’occasionnellement ou sur de courtes périodes, à cause du poids et de la taille de la machine. Même ainsi, le Yoga C940 reste plus léger, lumineux, compact et puissant que le HP Spectre x360 15 concurrent, ce qui en fait une meilleure machine. Le XPS 15 9575 2-en-1 est encore plus compact, mais il fait moins bien dans presque tous les autres domaines, ce qui inclut les performances, l’autonomie, la luminosité et l’audio. Nous espérons en revanche que les prochaines versions de notre C940 amélioreront le poids et le retour mou des touches et du clickpad.
Le Lenovo Yoga C940-15 est performant pour sa taille, pour un convertible de 15,6 pouces. Bien que n’étant pas particulièrement léger ou bon marché, à environ 1 500 $, il est meilleur que le XPS 15 2-en-1 ou que le HP Spectre x360 15.
L’intégralité de cette critique est disponible en anglais en suivant ce lien.
Lenovo Yoga C940-15IRH
- 12/15/2019 v7 (old)
Allen Ngo
Price comparison
