Test du HP Elite Dragonfly G3 13.5 : tout nouveau design et nouvelles performances
Le Dragonfly G3 succède directement au Dragonfly Max (i.e., le Dragonfly G2) avec un nouveau matériel de haut en bas. Outre la mise à niveau évidente du processeur de la 11e génération Tiger Lake-U à la 12e génération Alder Lake-U, le G3 présente un nouveau facteur de forme 3:2 et un écran de 13,5 pouces qui contraste avec l'ancien design de 13,3 pouces 16:9. Selon HP, tous ces changements sont destinés à répondre aux besoins d'une main-d'œuvre hybride, à domicile et hors domicile
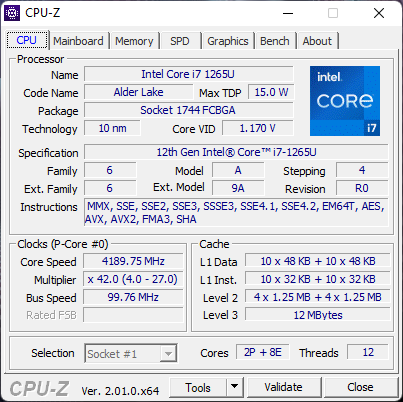
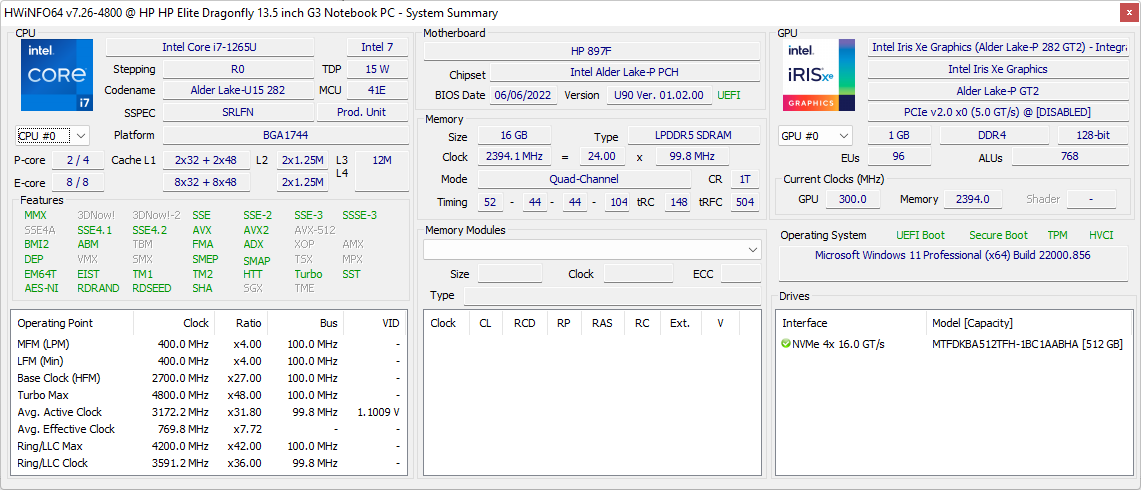
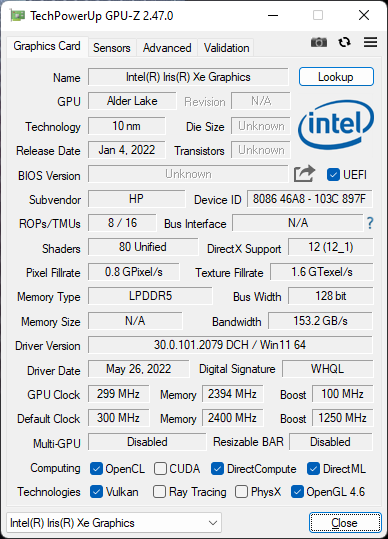
Notre unité d'examen est configurée avec le processeur Core i7-1265U vPro, un écran IPS 1280p, 5G WWAN et 512 Go SSD pour environ 2700 USD. D'autres configurations sont disponibles avec le Core i5-1235U, moins performant, jusqu'à un écran tactile OLED, mais toutes les options sont livrées avec une carte graphique Iris Xe intégrée et au moins 16 Go de RAM LPDDR5
Les alternatives au Dragonfly G3 comprennent d'autres ordinateurs portables phares de 13 pouces destinés au bureau ou à l'entreprise, comme le Dell Latitude 13 7330, Lenovo ThinkPad X1 Yoga G1, MSI Summit E13ou le Ordinateur portable Framework
Plus de commentaires sur HP
Comparaison avec les concurrents potentiels
Note | Date | Modèle | Poids | Épaisseur | Taille | Résolution | Prix |
|---|---|---|---|---|---|---|---|
| 91 % v7 (old) | 08/22 | HP Elite Dragonfly G3 i7-1265U, Iris Xe G7 96EUs | 1.2 kg | 16.3 mm | 13.50" | 1920x1280 | |
| 89.4 % v7 (old) | 12/20 | HP Spectre x360 14t-ea000 i7-1165G7, Iris Xe G7 96EUs | 1.3 kg | 17.2 mm | 13.50" | 1920x1280 | |
| 86.1 % v7 (old) | 08/22 | Dell XPS 13 Plus 9320 i5-1240p i5-1240P, Iris Xe G7 80EUs | 1.2 kg | 15.3 mm | 13.40" | 1920x1200 | |
| 85.1 % v7 (old) | 07/22 | Framework Laptop 13.5 12th Gen Intel i7-1260P, Iris Xe G7 96EUs | 1.3 kg | 15.85 mm | 13.50" | 2256x1504 | |
| 84 % v7 (old) | 08/21 | HP EliteBook Folio 13.5-3G2L2EA SD 8cx Gen 2 5G, Adreno 680 | 1.3 kg | 16 mm | 13.50" | 1920x1280 | |
| 87.3 % v7 (old) | 04/21 | Lenovo ThinkPad X1 Titanium Yoga G1 20QA001RGE i7-1160G7, Iris Xe G7 96EUs | 1.2 kg | 11.5 mm | 13.50" | 2256x1504 |
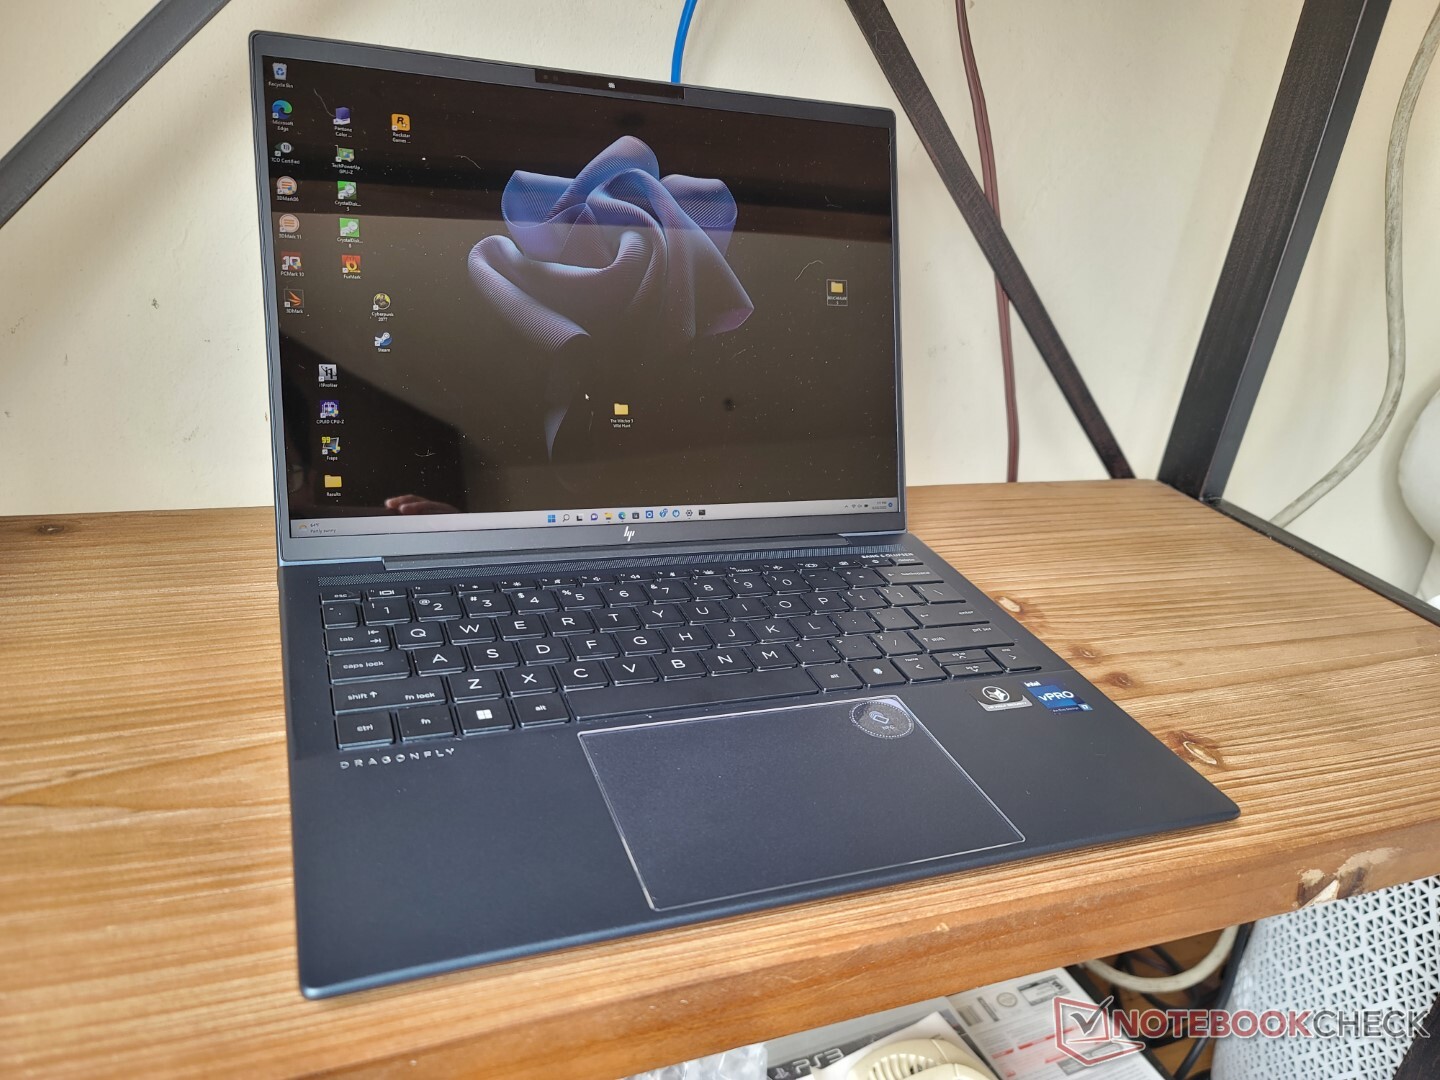
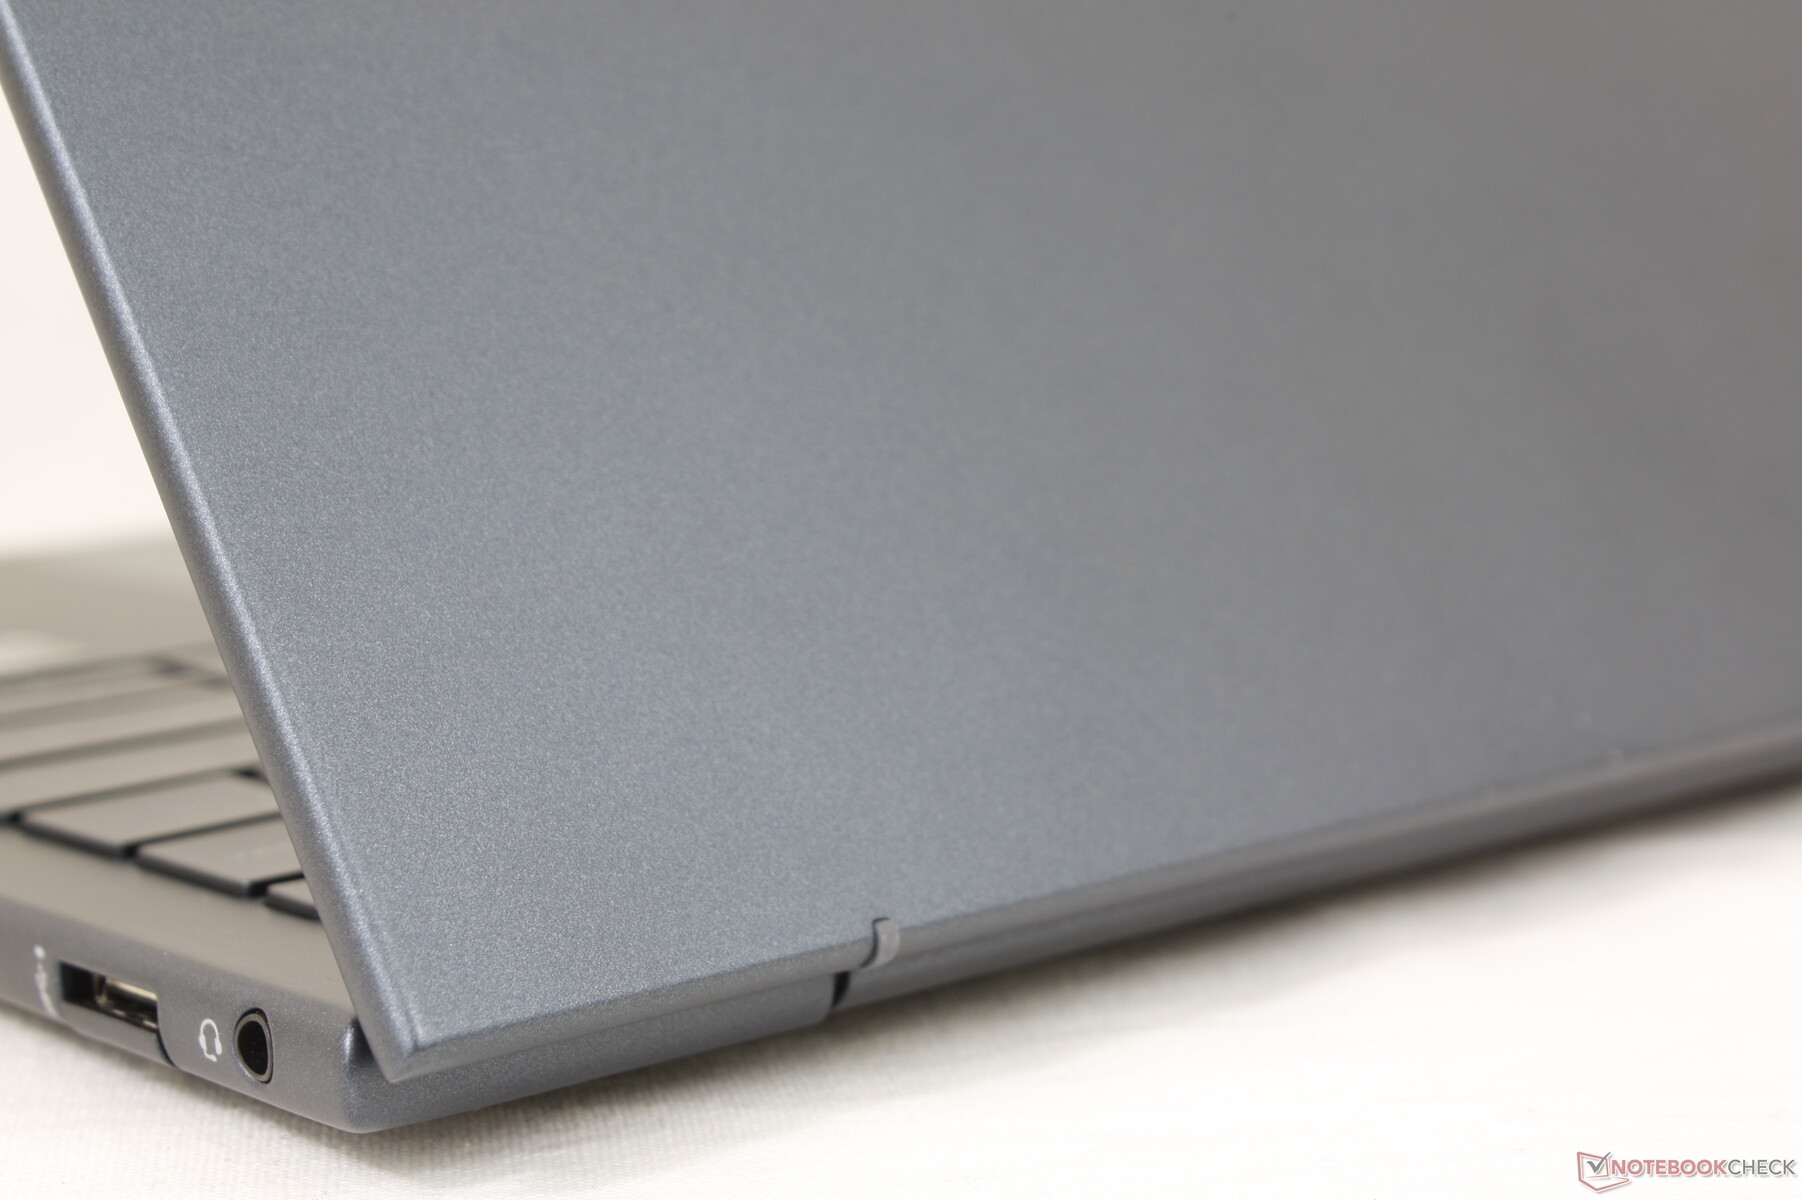
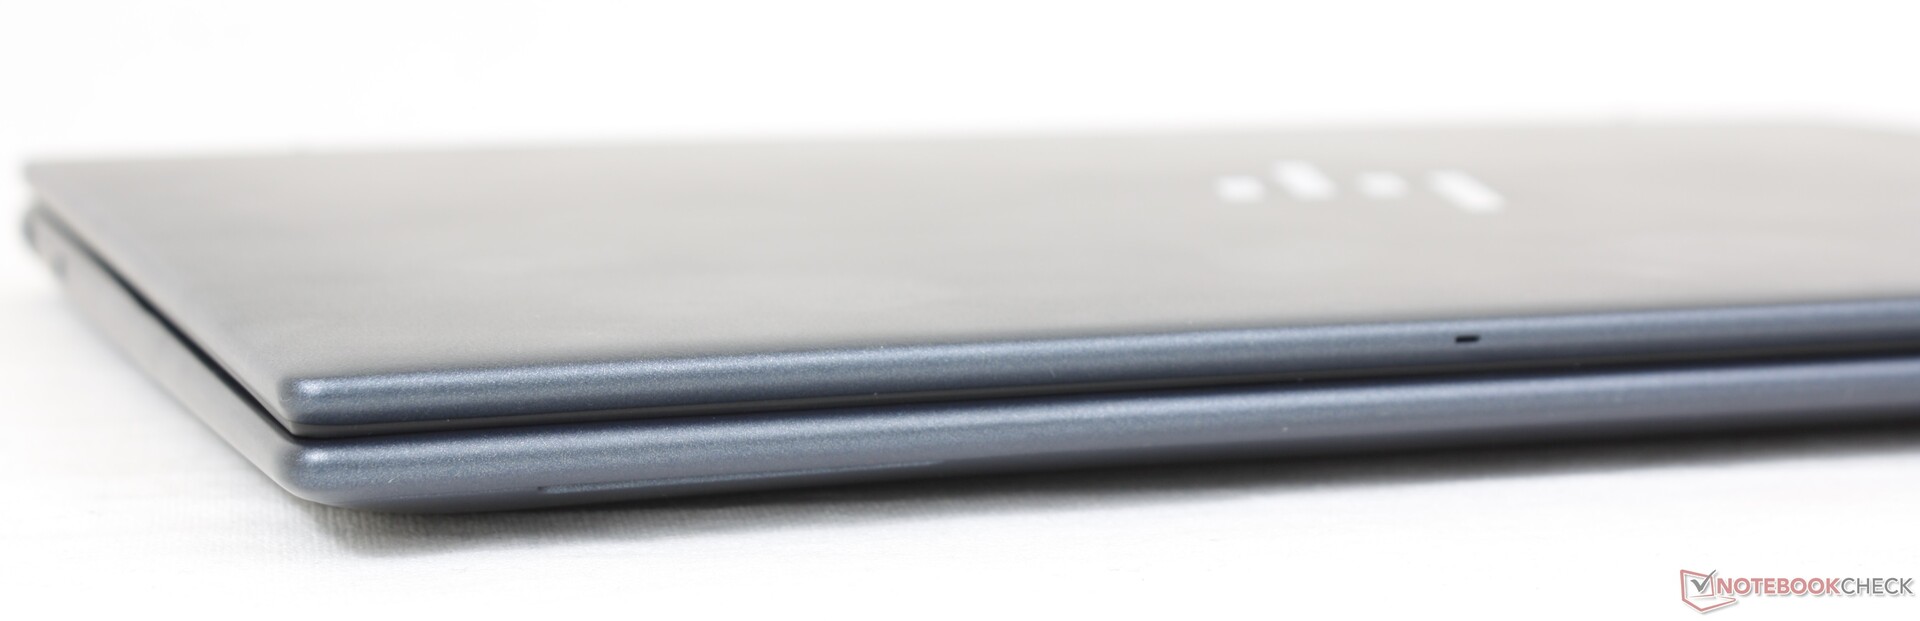
Cas - Base forte, couvercle faible
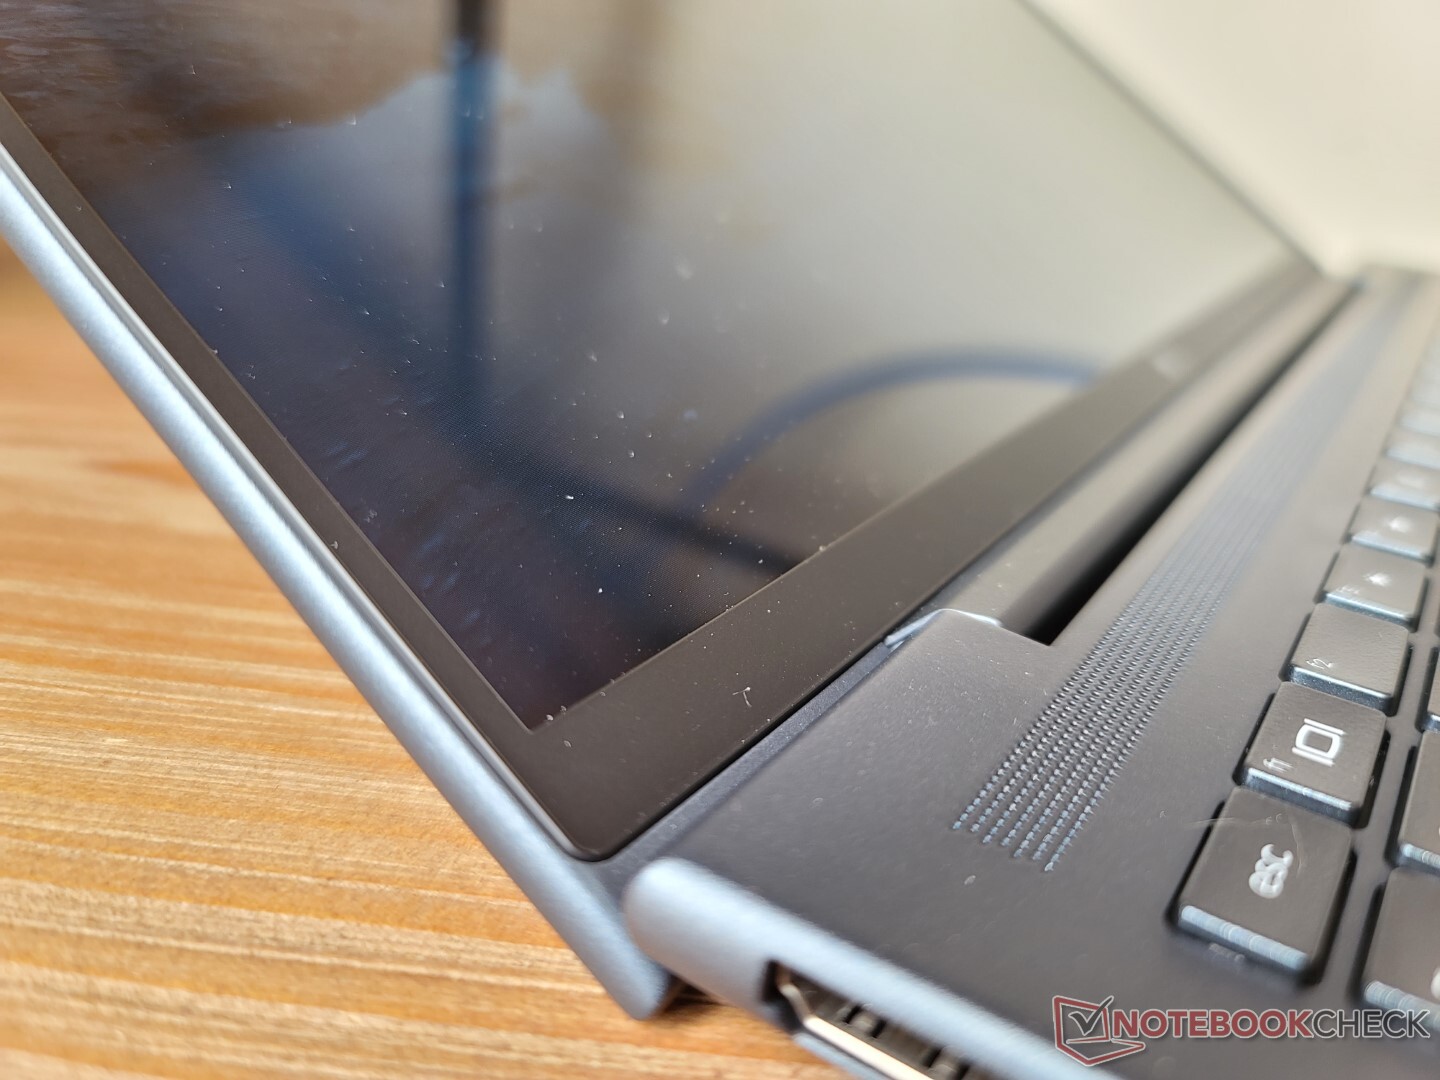
Le châssis métallique reste solide et rigide autour de la base et du centre du clavier. On ne peut cependant pas en dire autant du couvercle, qui se tord et se plie aussi facilement que les couvercles du LG gram ou Samsung Galaxy Book. L'application d'une pression au centre du couvercle extérieur déforme la surface plus facilement que le couvercle du Spectre. Le poids très faible et l'absence de tout renfort Gorilla Glass contribuent à la faiblesse du couvercle du Dragonfly G3.
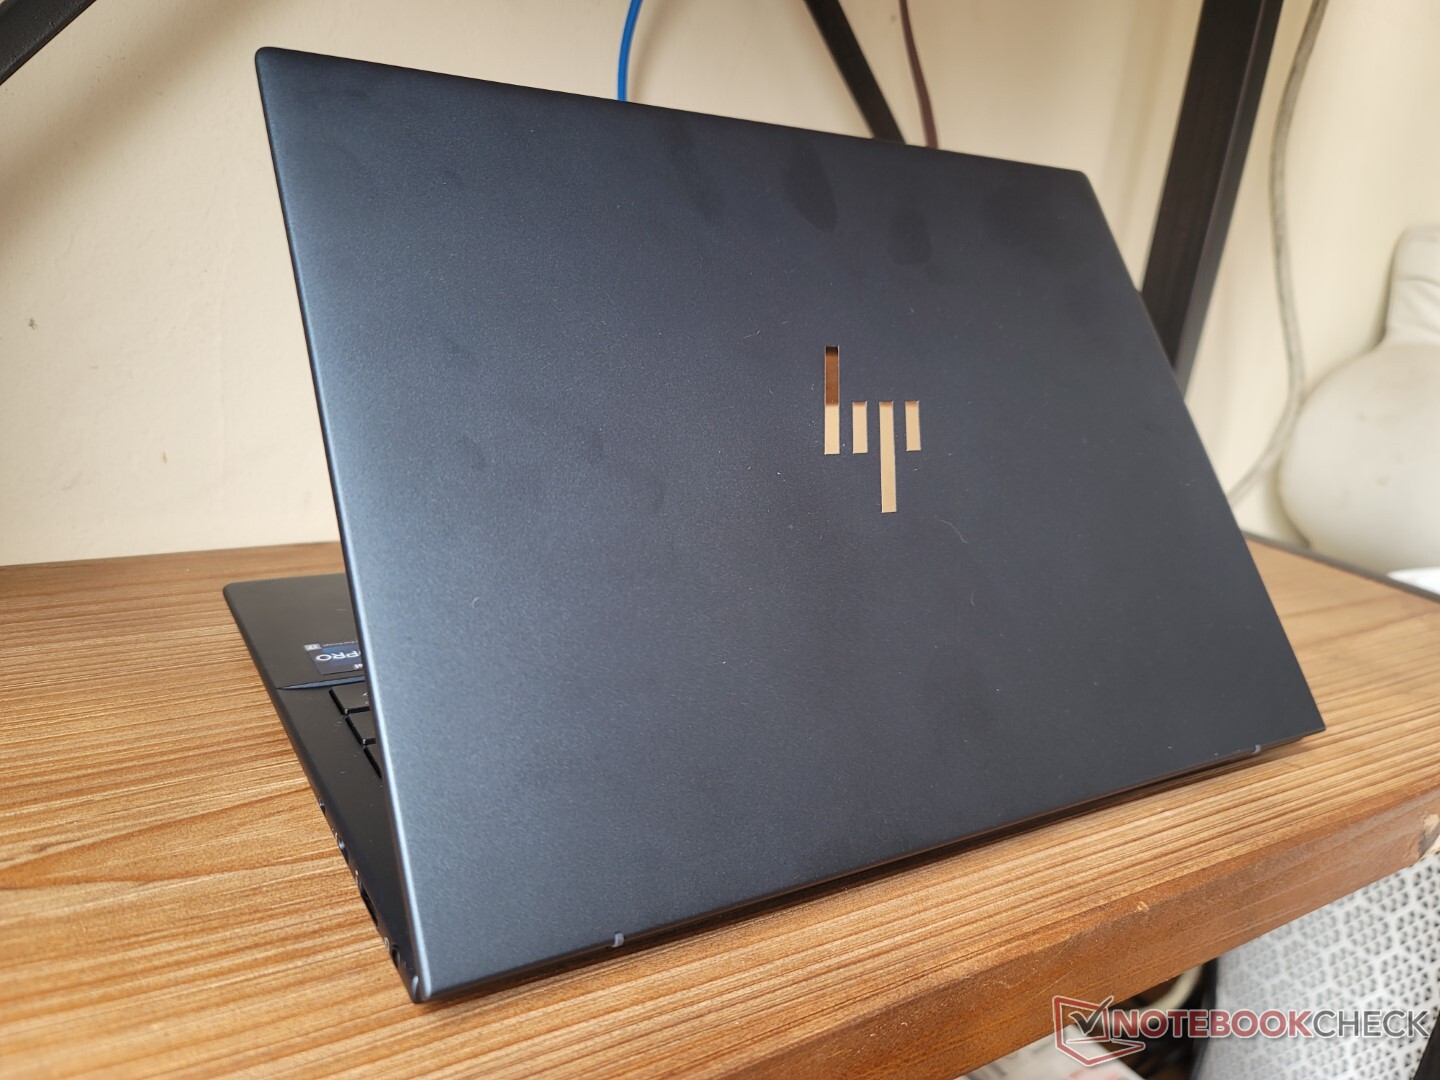
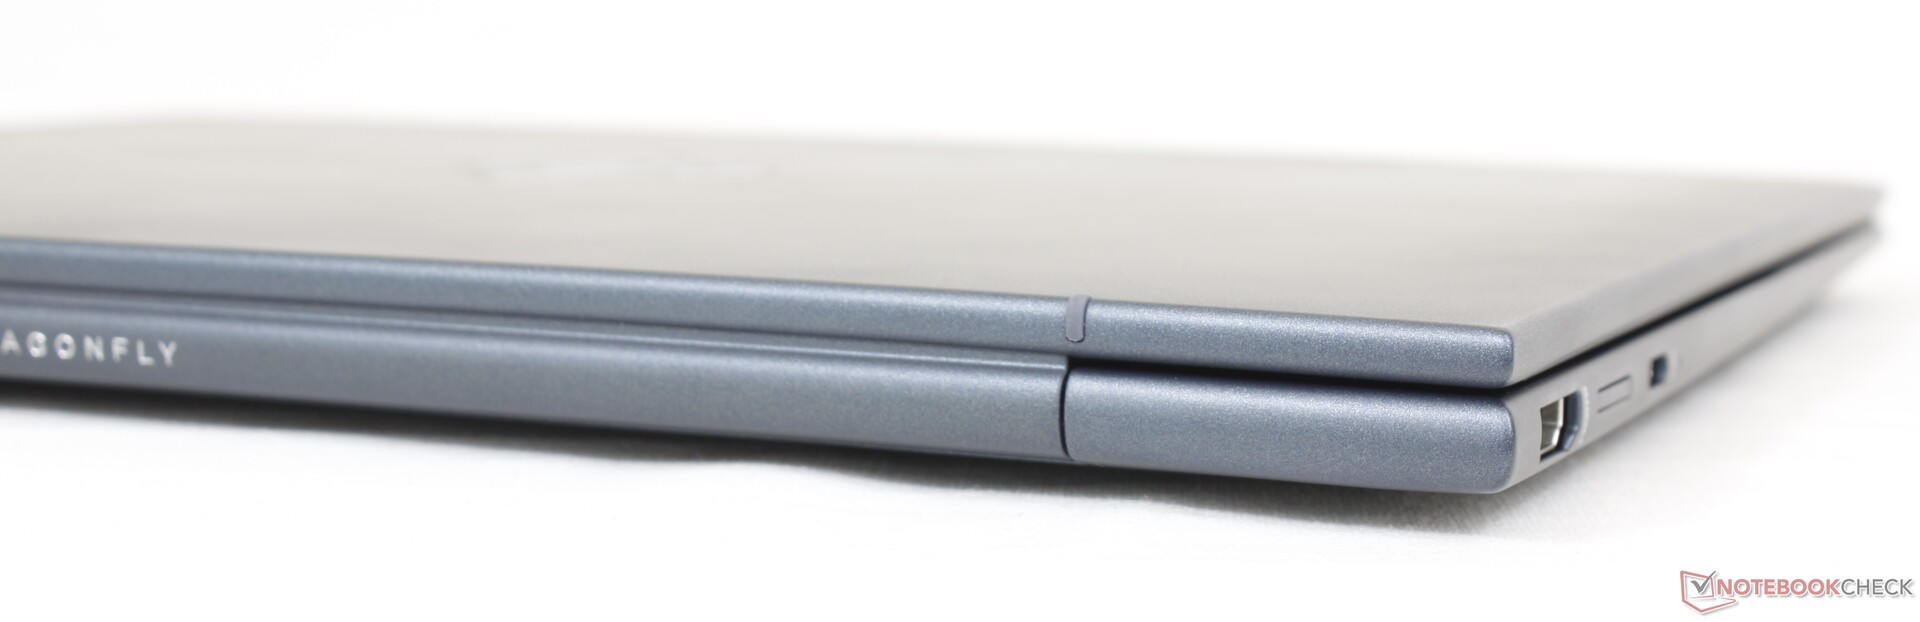
Il convient de noter que le Dragonfly G3 n'est pas livré avec l'une des options de couleurs vives que le modèle original du lancement 2020 offrait. Les nouvelles options de couleurs sont devenues plus mates et stériles en comparaison. Pour une série appelée "Dragonfly", ses couleurs deviennent trop similaires à un modèle EliteBook typique.
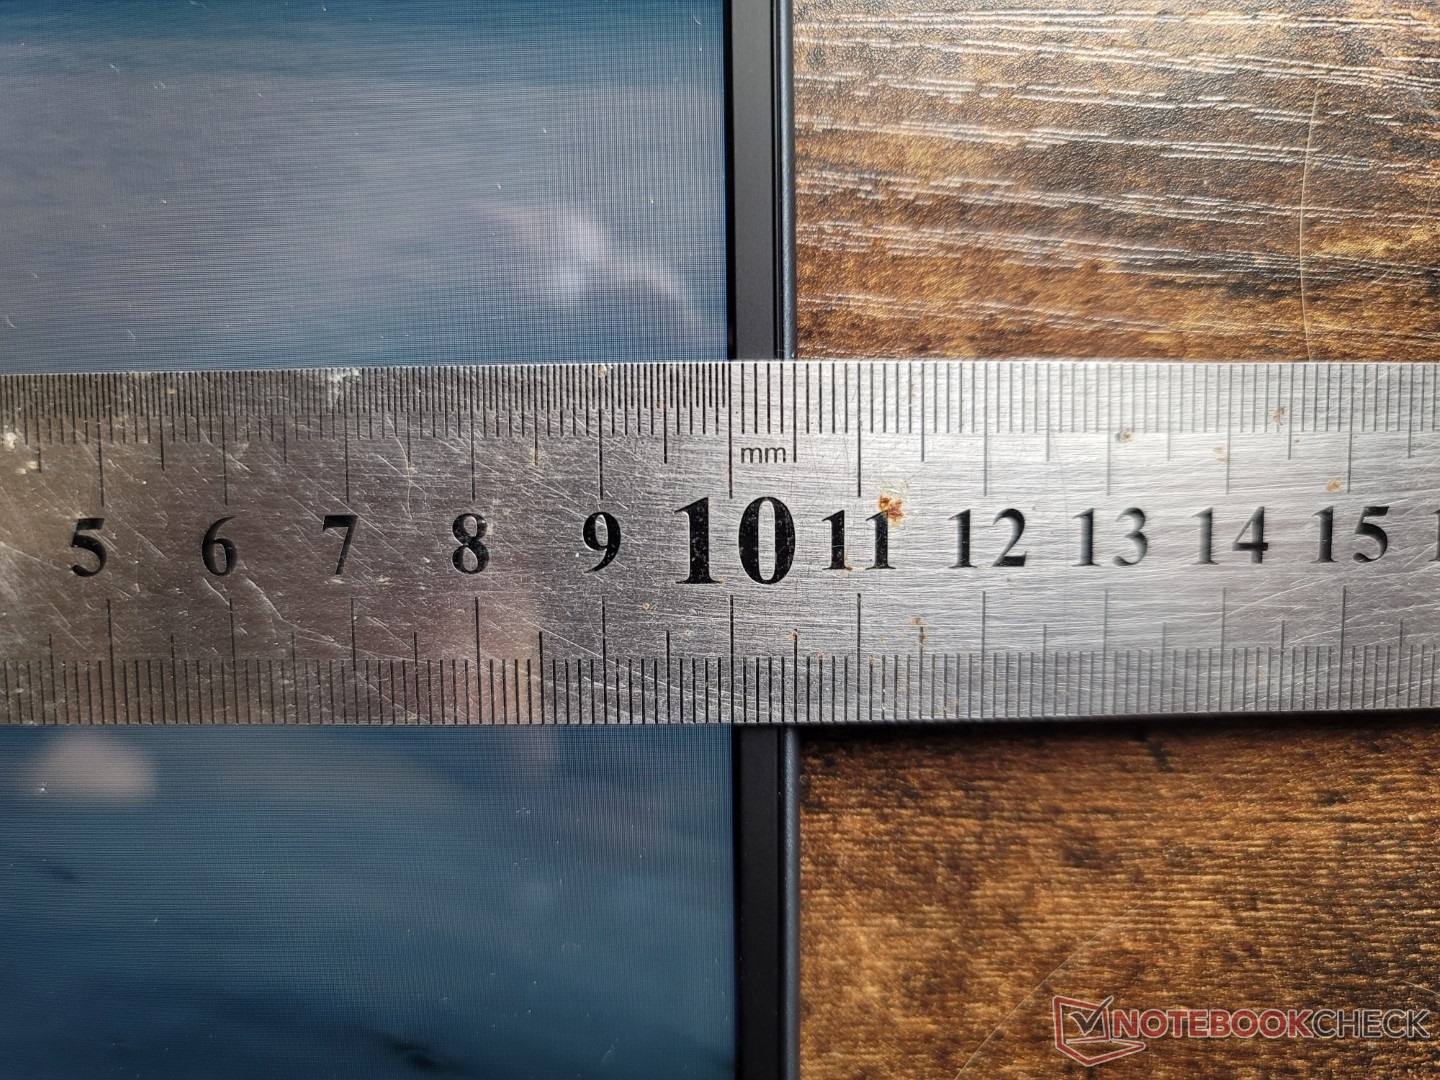
Le nouveau modèle est plus long que le Dragonfly Max sortant de plus de 20 mm en raison de son nouveau facteur de forme de 13,5 pouces, mais il n'est heureusement pas plus lourd à 1,2 kg malgré le volume plus important. Sans surprise, les dimensions sont presque identiques à celles du récent Spectre x360 13.5 pouces.
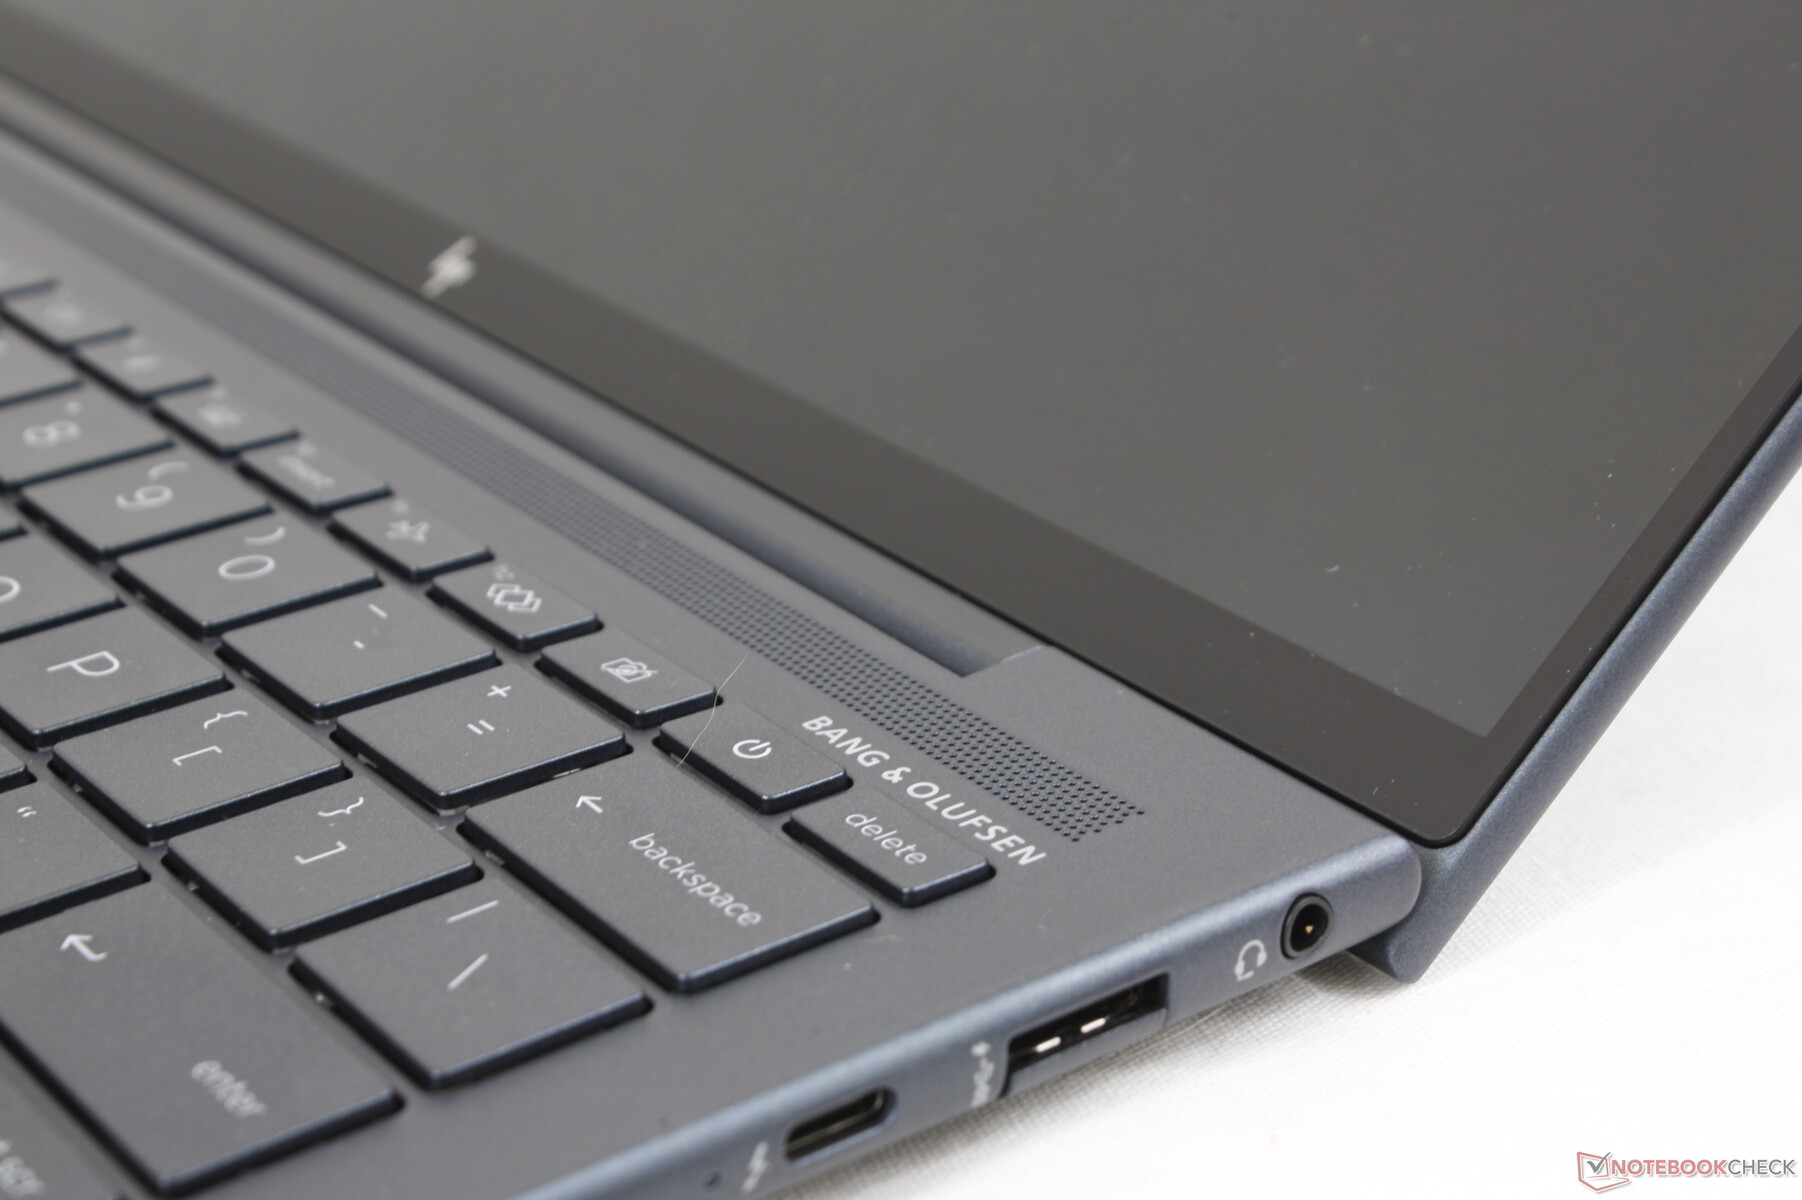
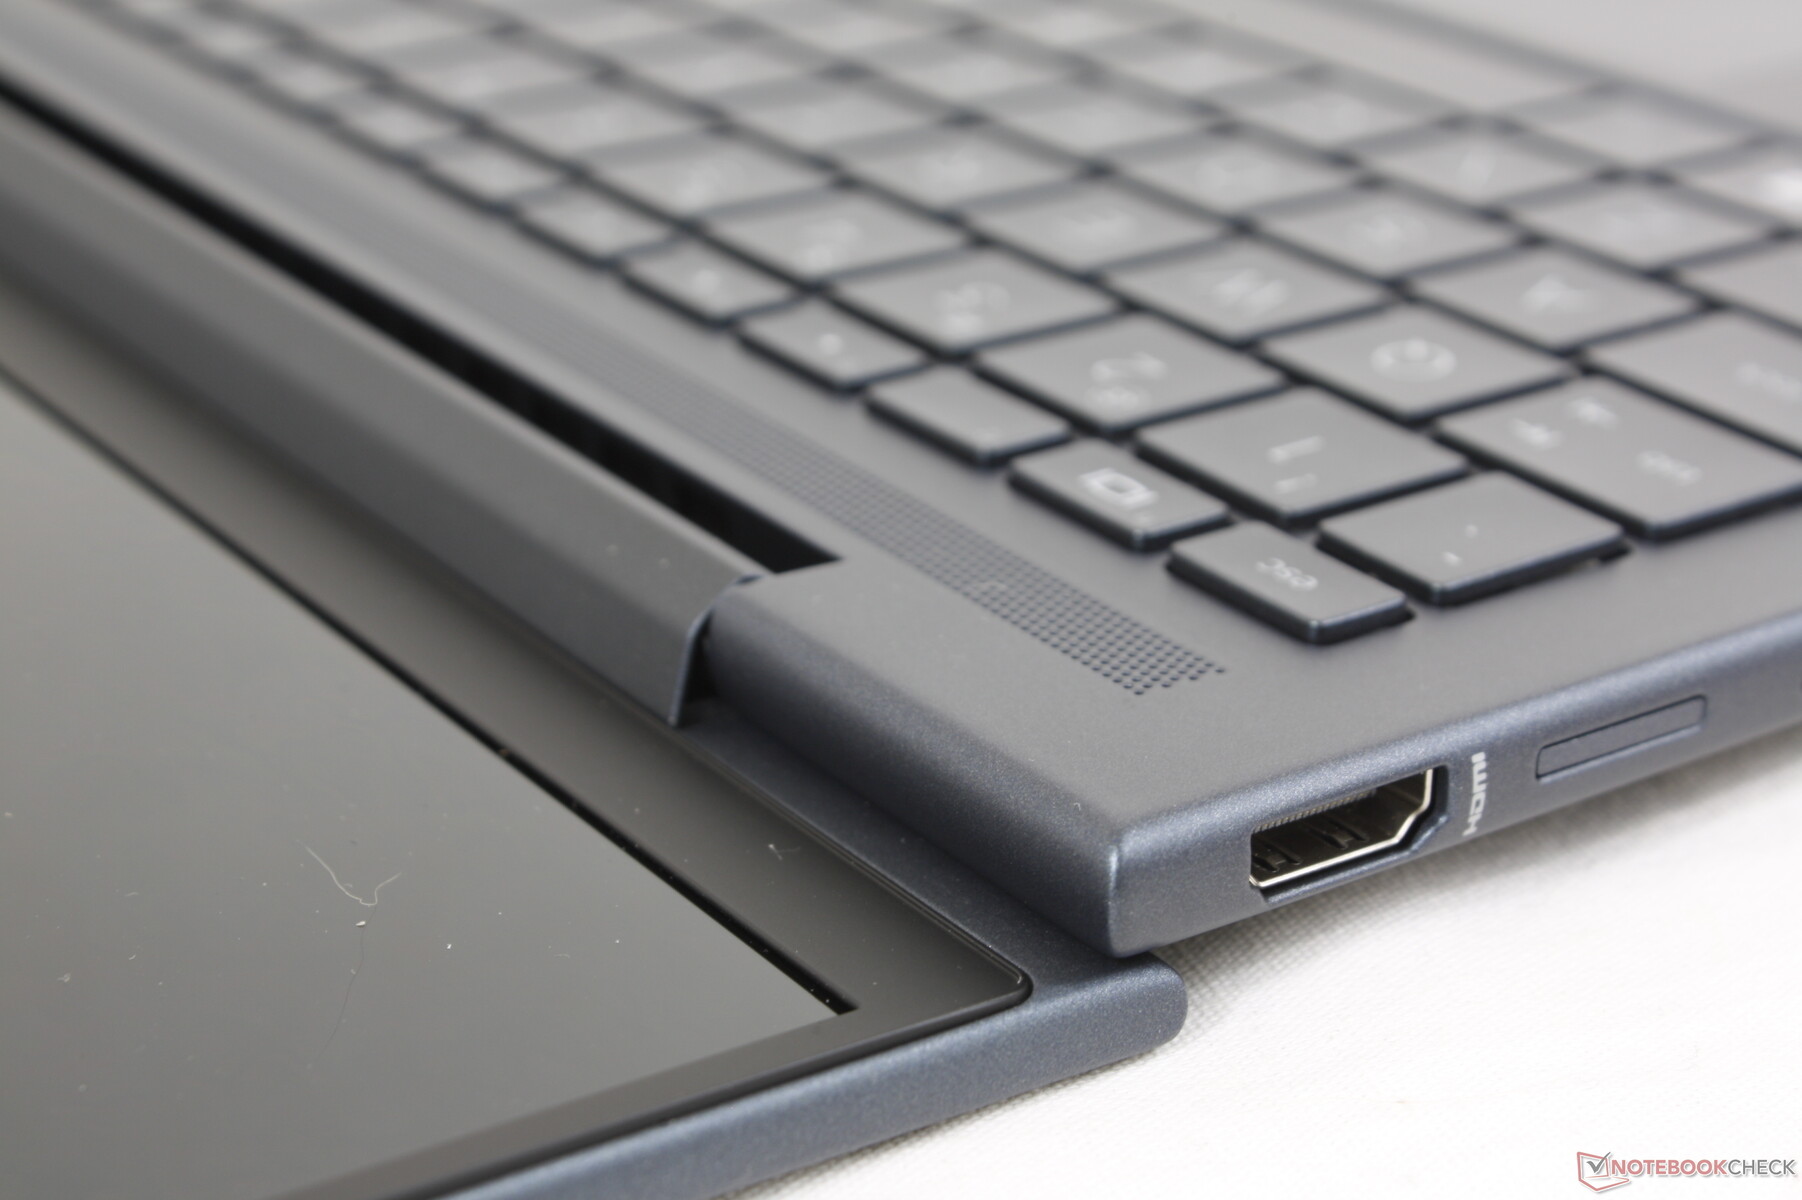
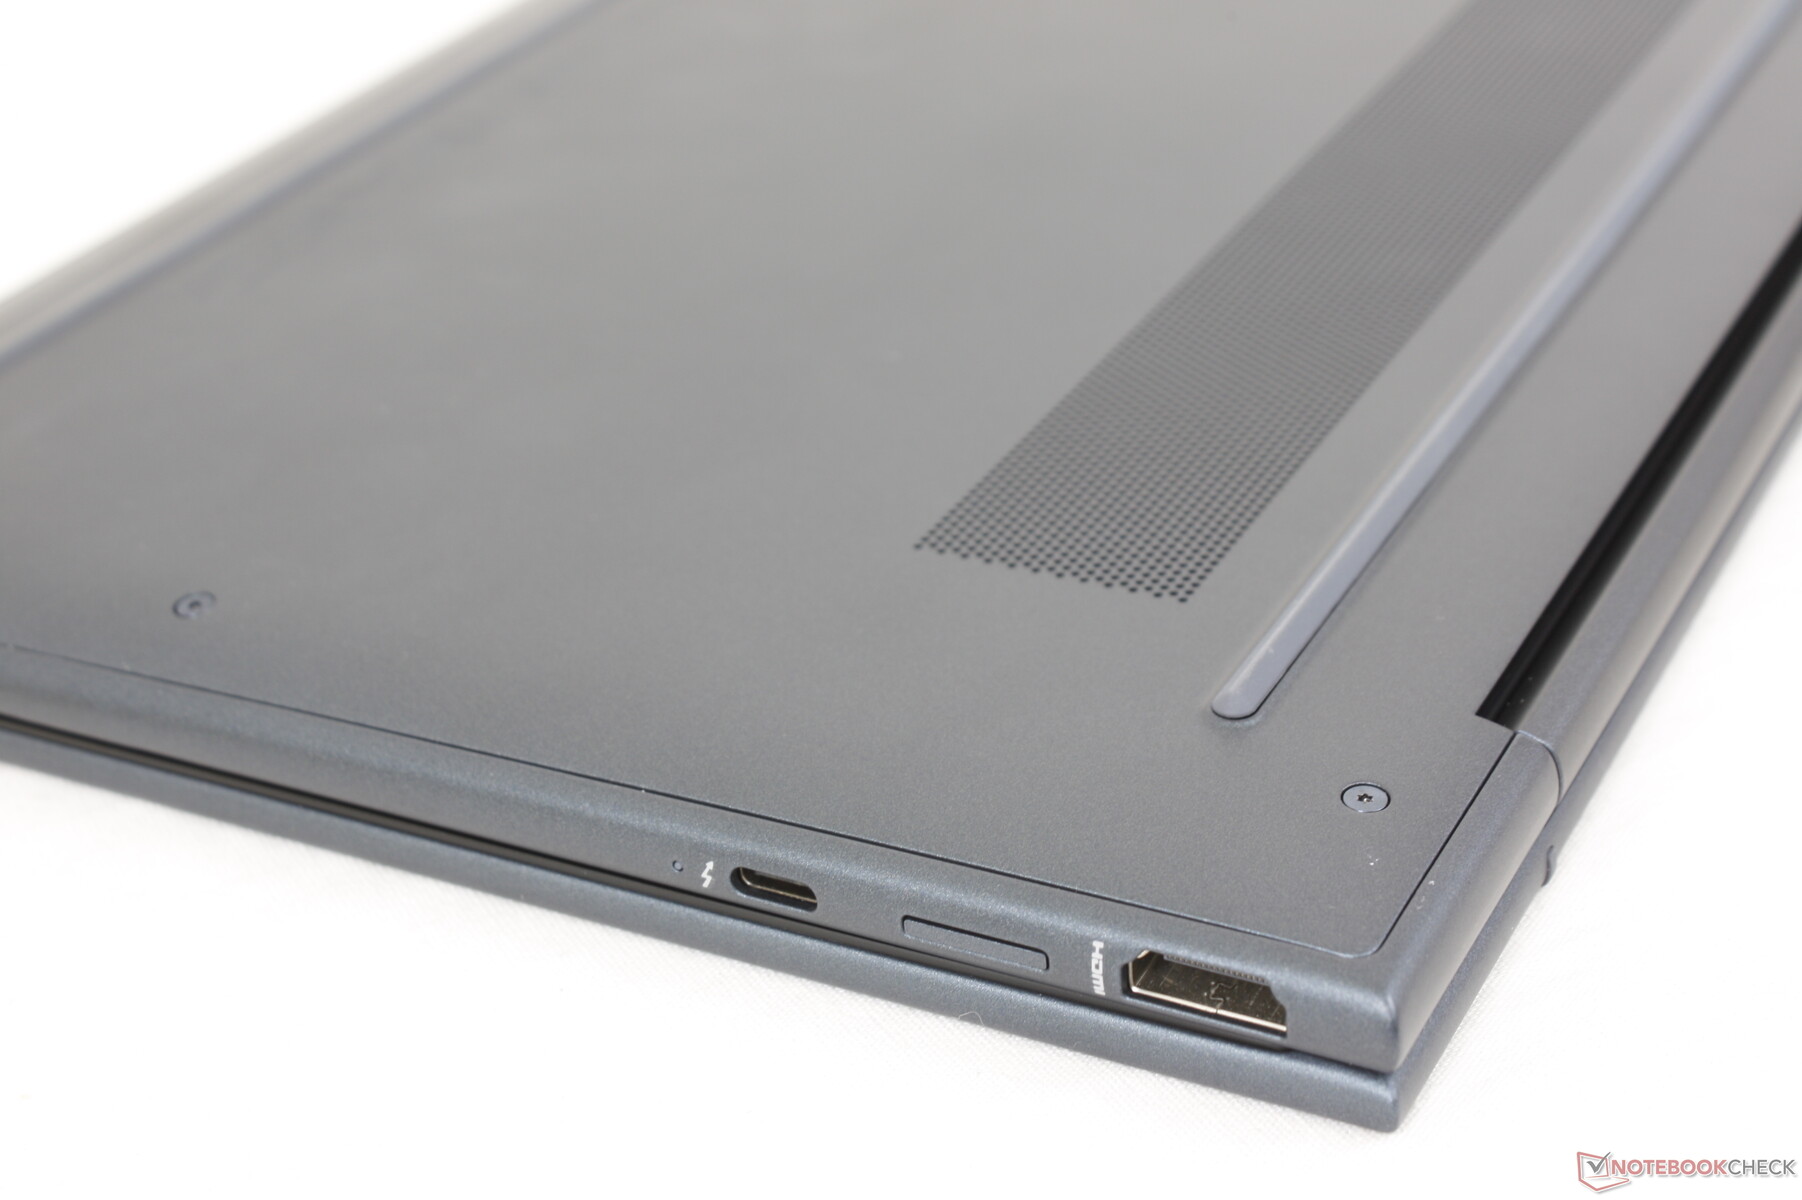
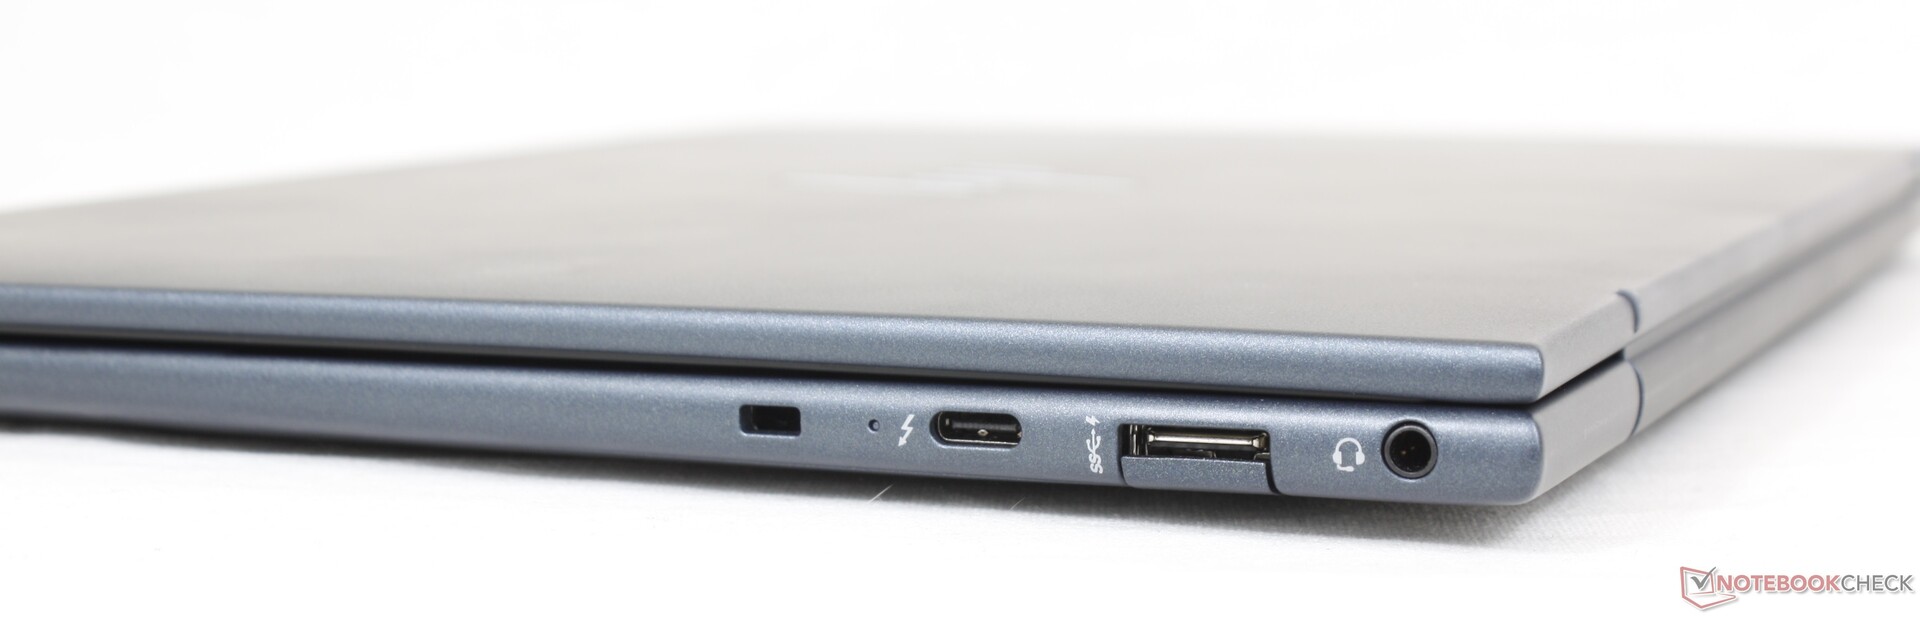
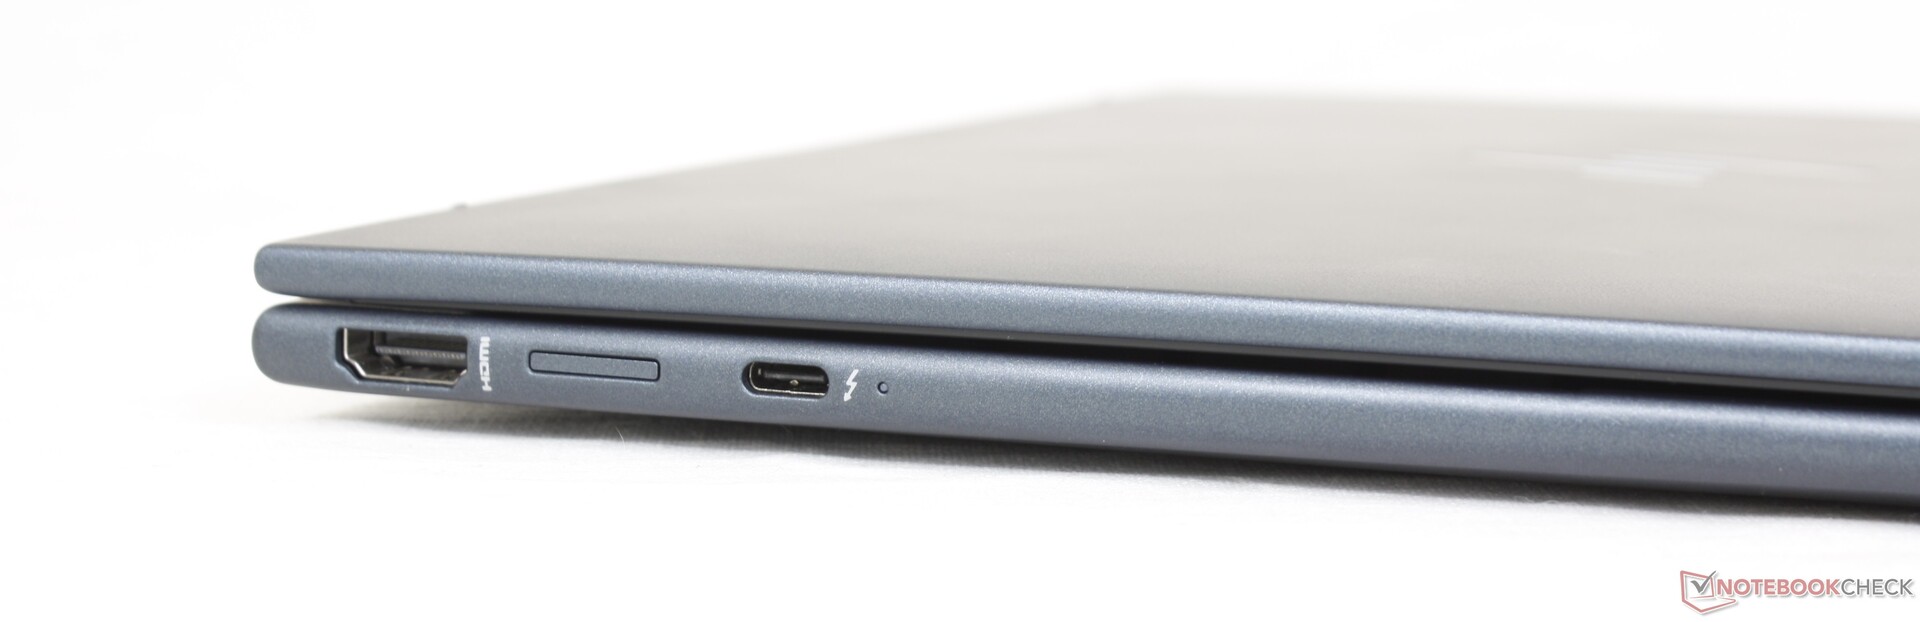
Connectivité - Support Thunderbolt 4
Les options de port sont essentiellement les mêmes que sur le Dragonfly Max, mais réorganisées pour le mieux. Les deux ports USB-C, par exemple, se trouvent désormais le long des bords gauche et droit de l'ordinateur portable, et non plus uniquement le long du bord droit, afin de permettre la recharge des deux côtés de l'ordinateur.
Il n'y a pas de lecteur de carte SD intégré, une fois de plus, car HP met en avant sa propre solution logicielle sans fil QuickDrop. QuickDrop fonctionne assez bien pour les smartphones, mais les utilisateurs d'appareils photo qui comptent sur les cartes SD n'ont pas de chance.
Communication
Un Intel AX211 est fourni en standard pour la connectivité Wi-Fi 6E et Bluetooth 5.2. Nous avons constaté d'excellents taux de transfert en réception lorsqu'il était couplé à notre réseau 6 GHz, mais les taux de transmission auraient pu être plus réguliers
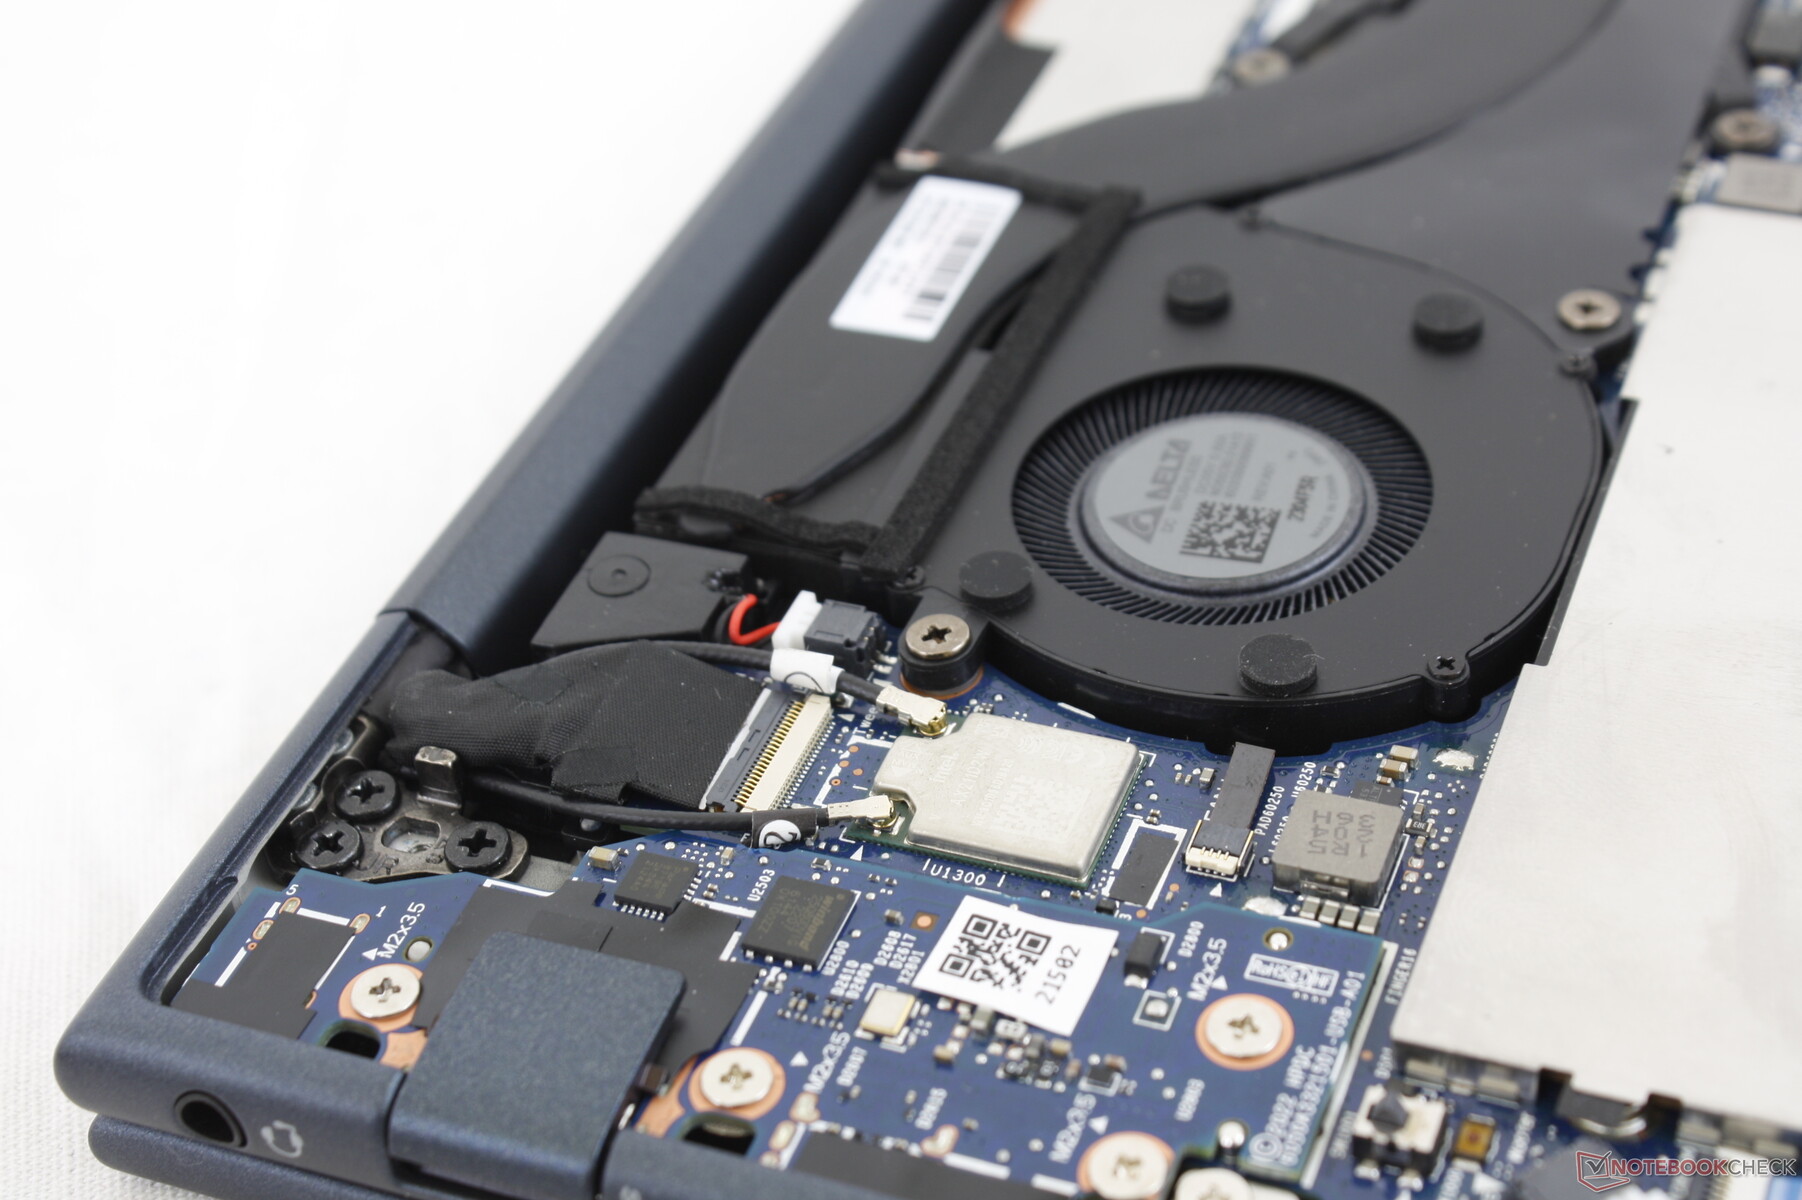
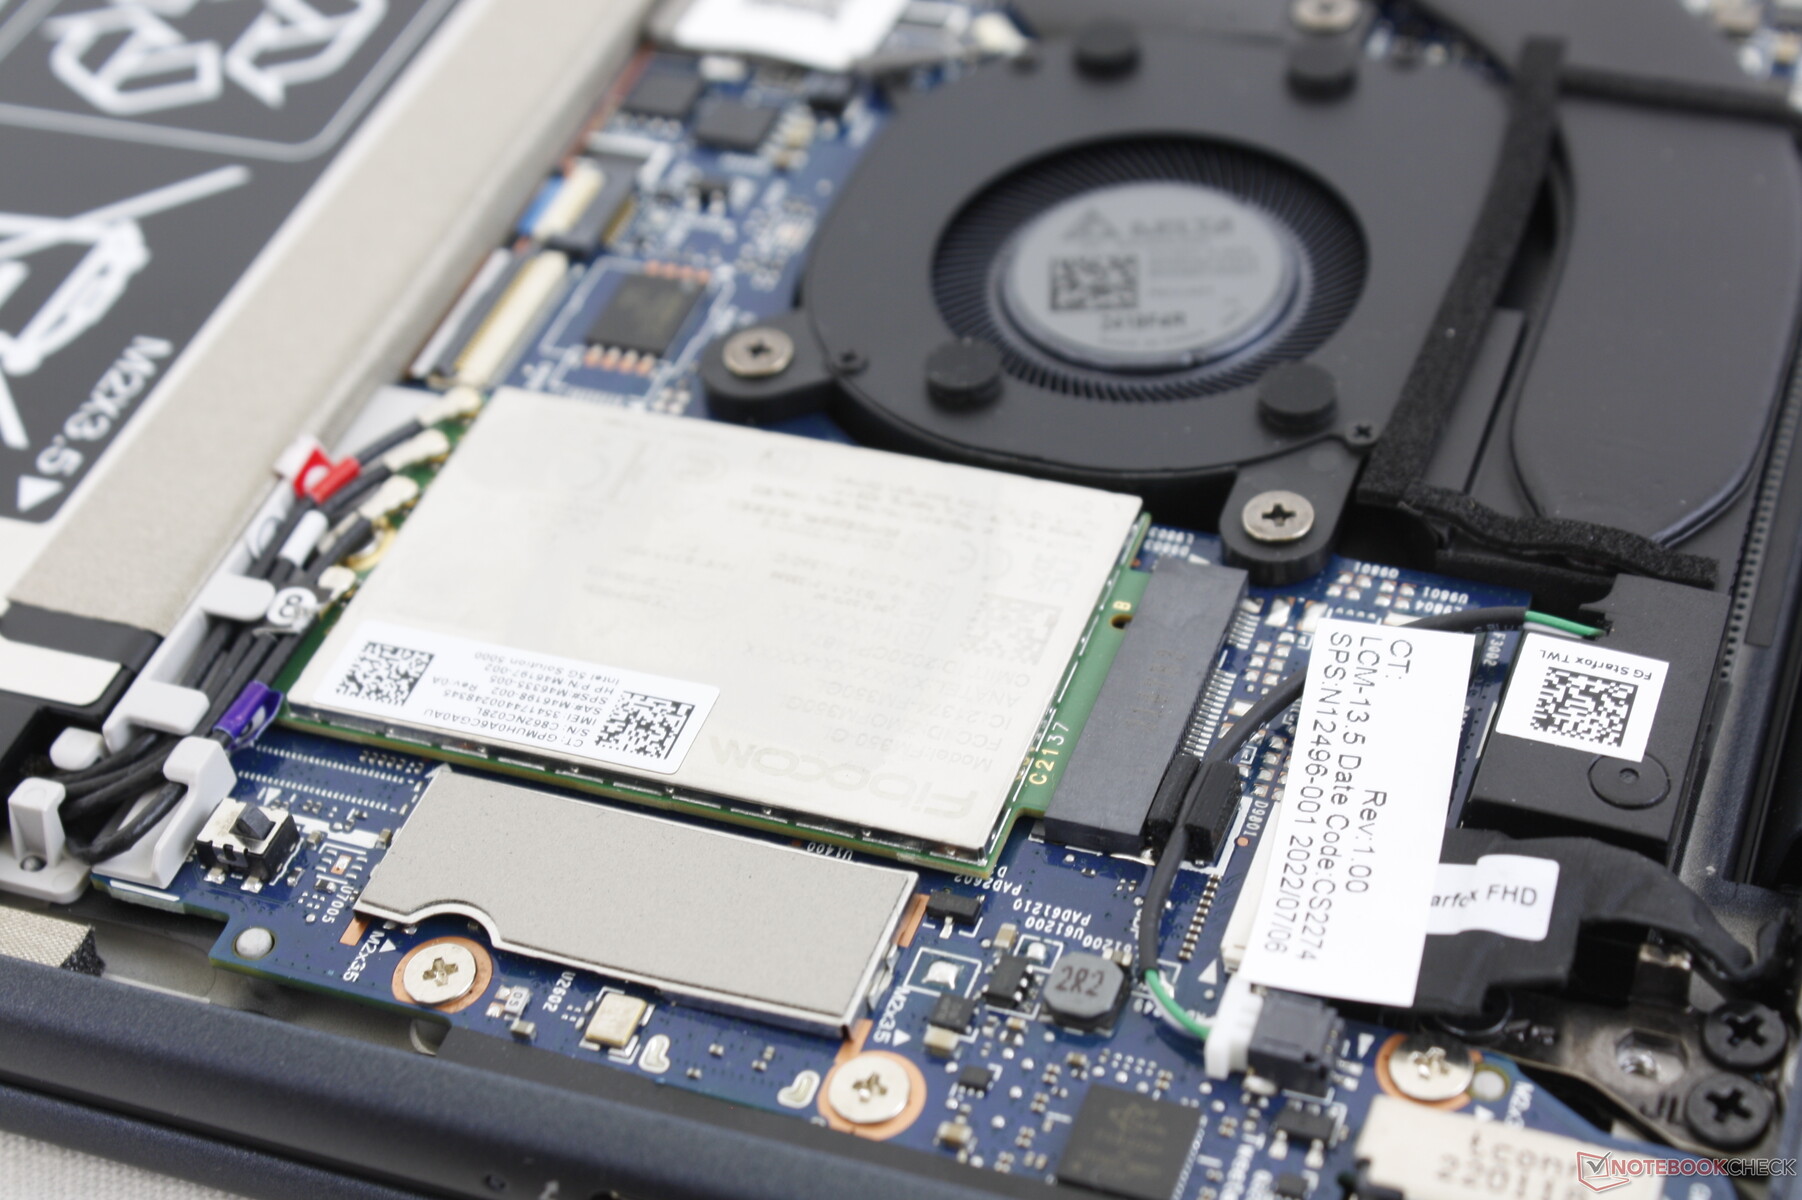
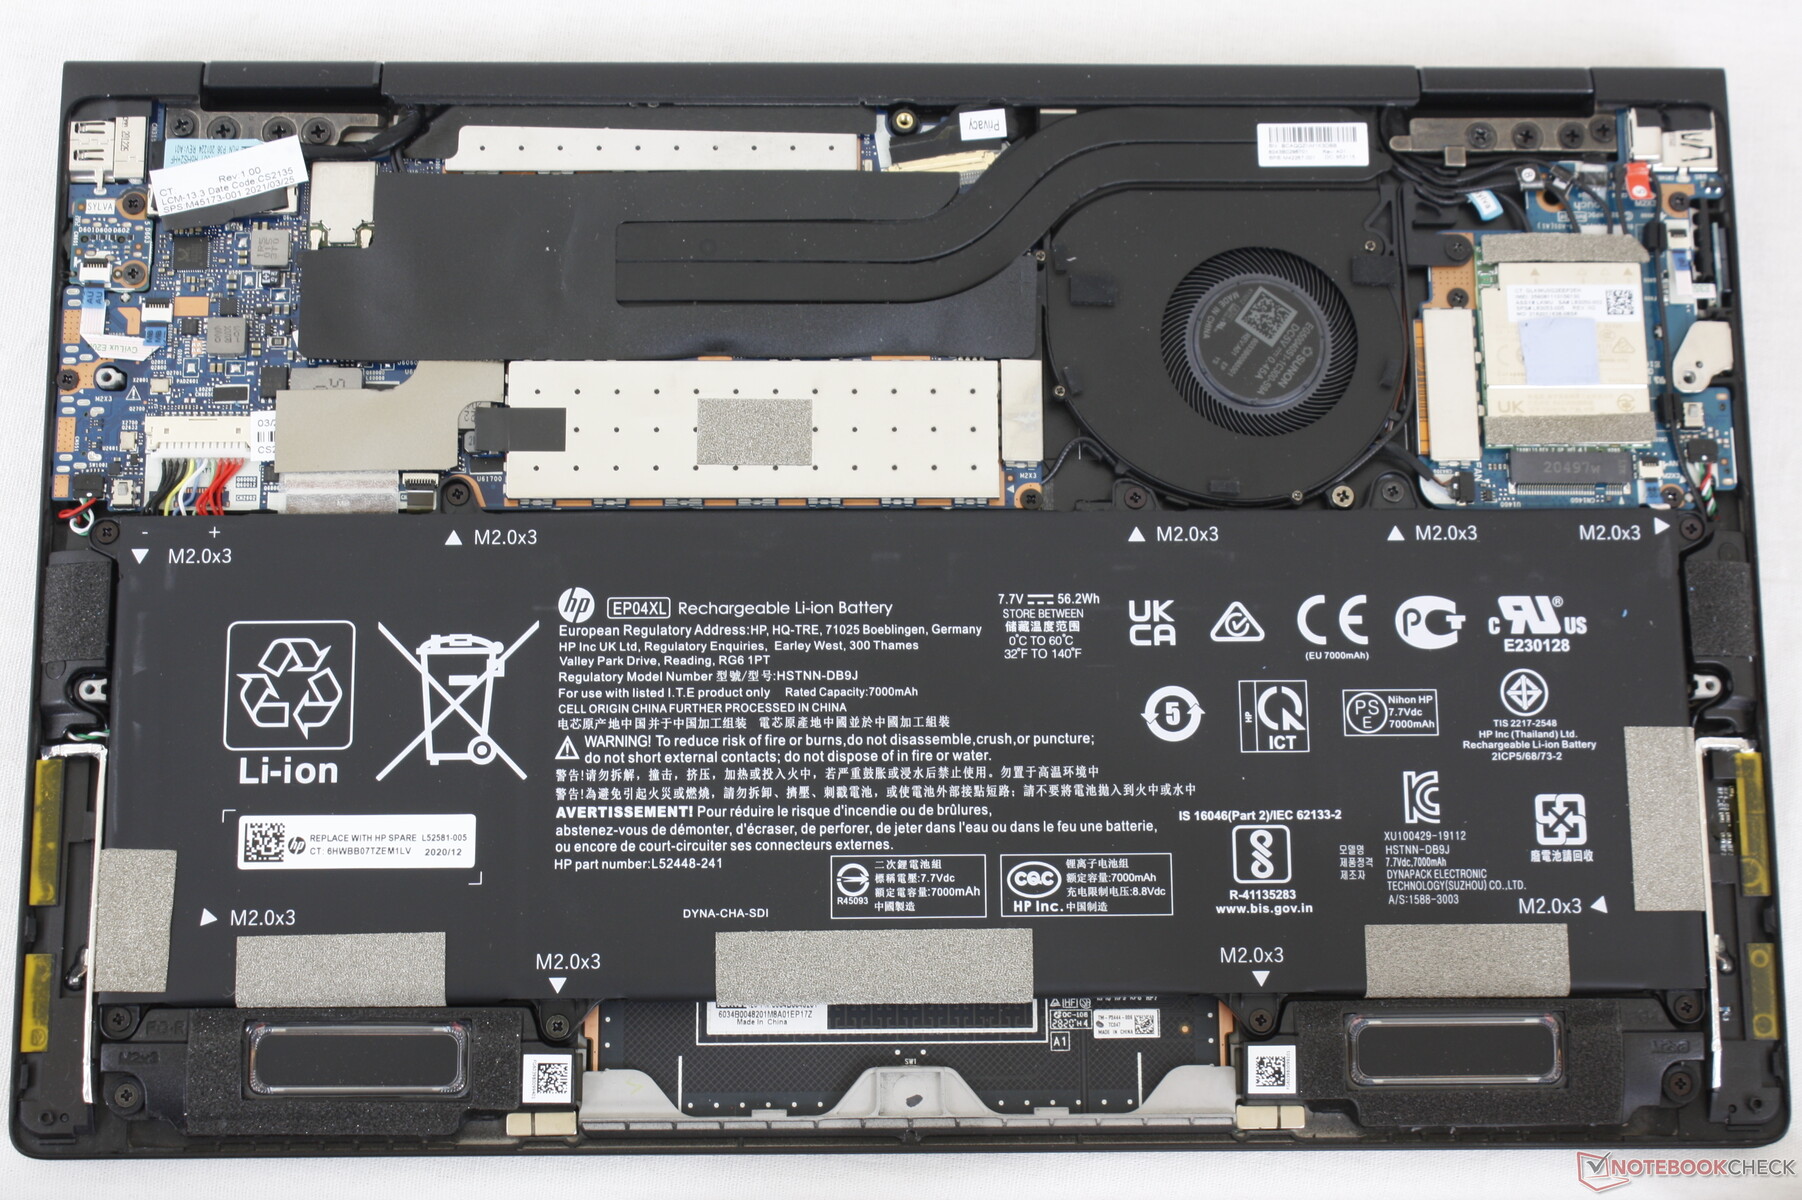
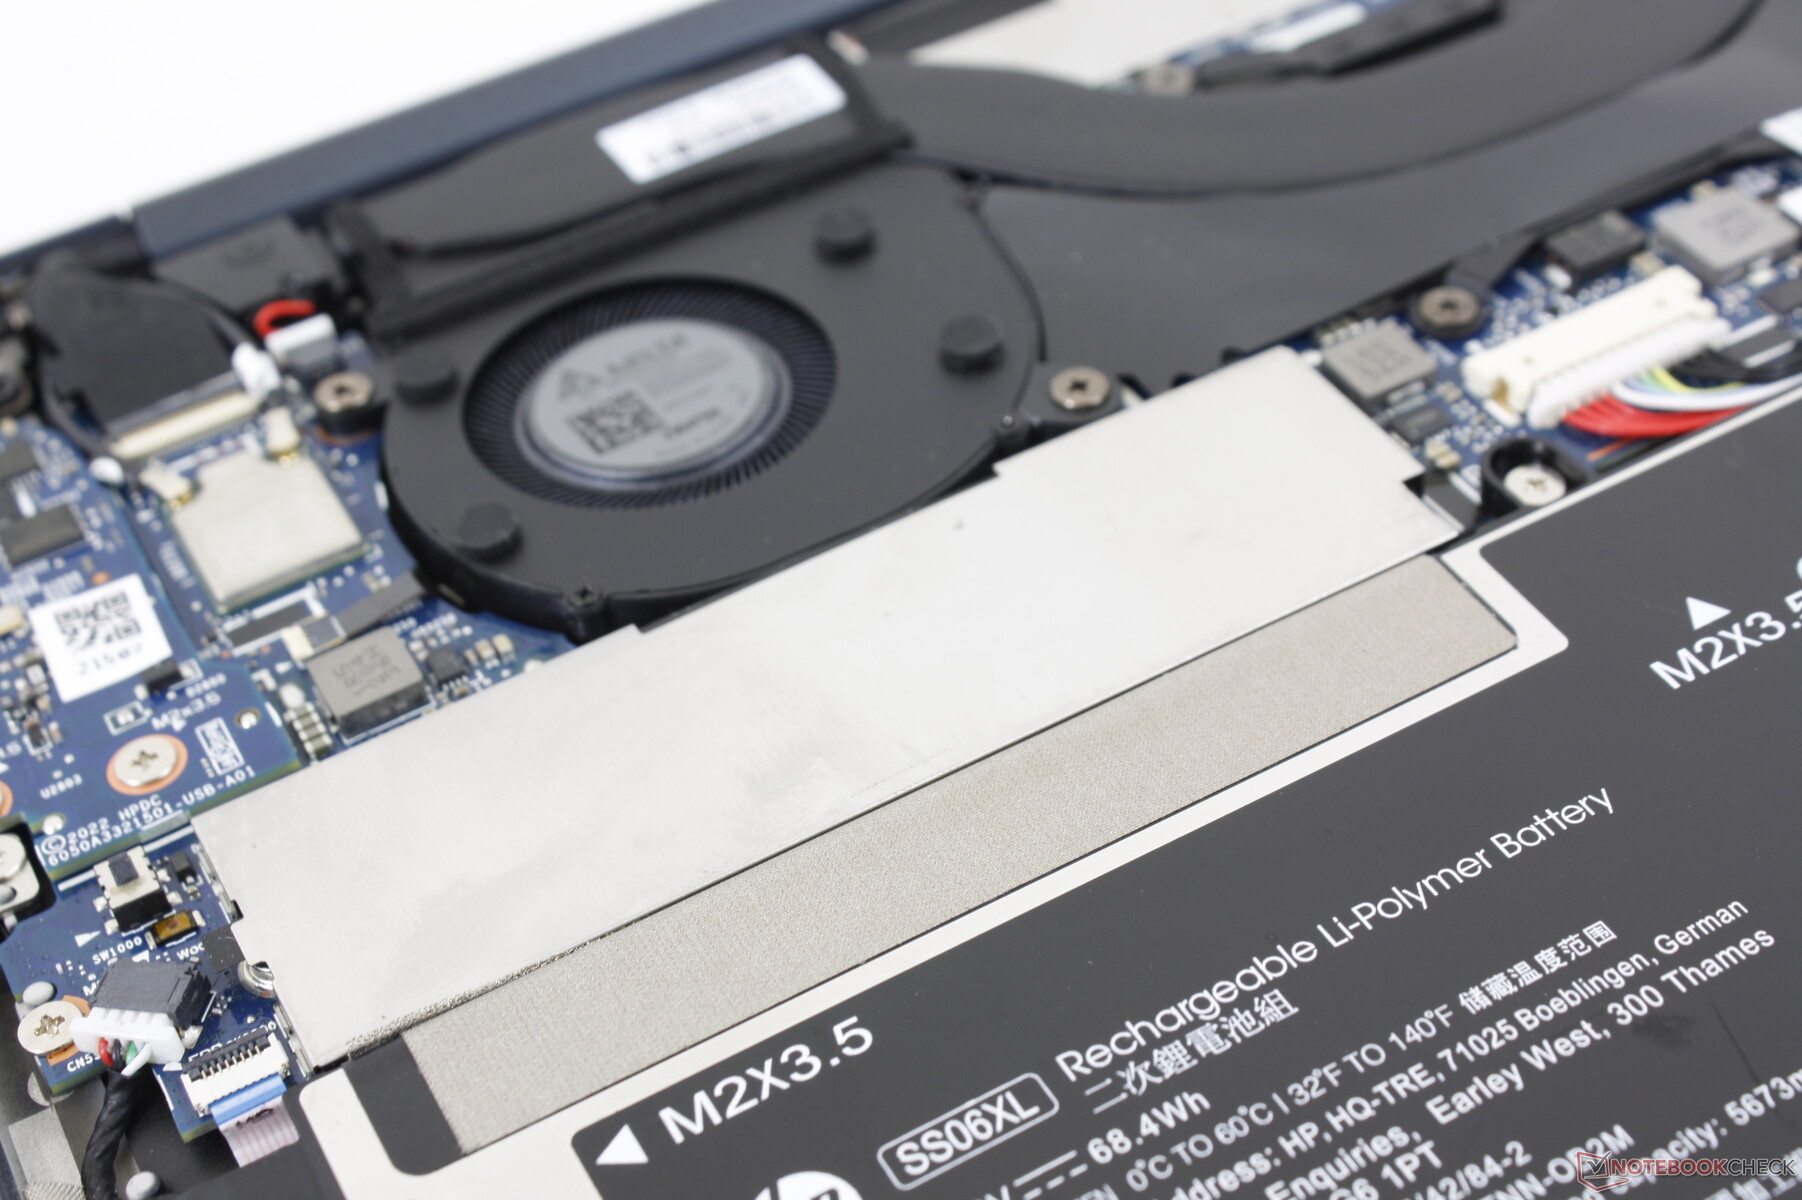
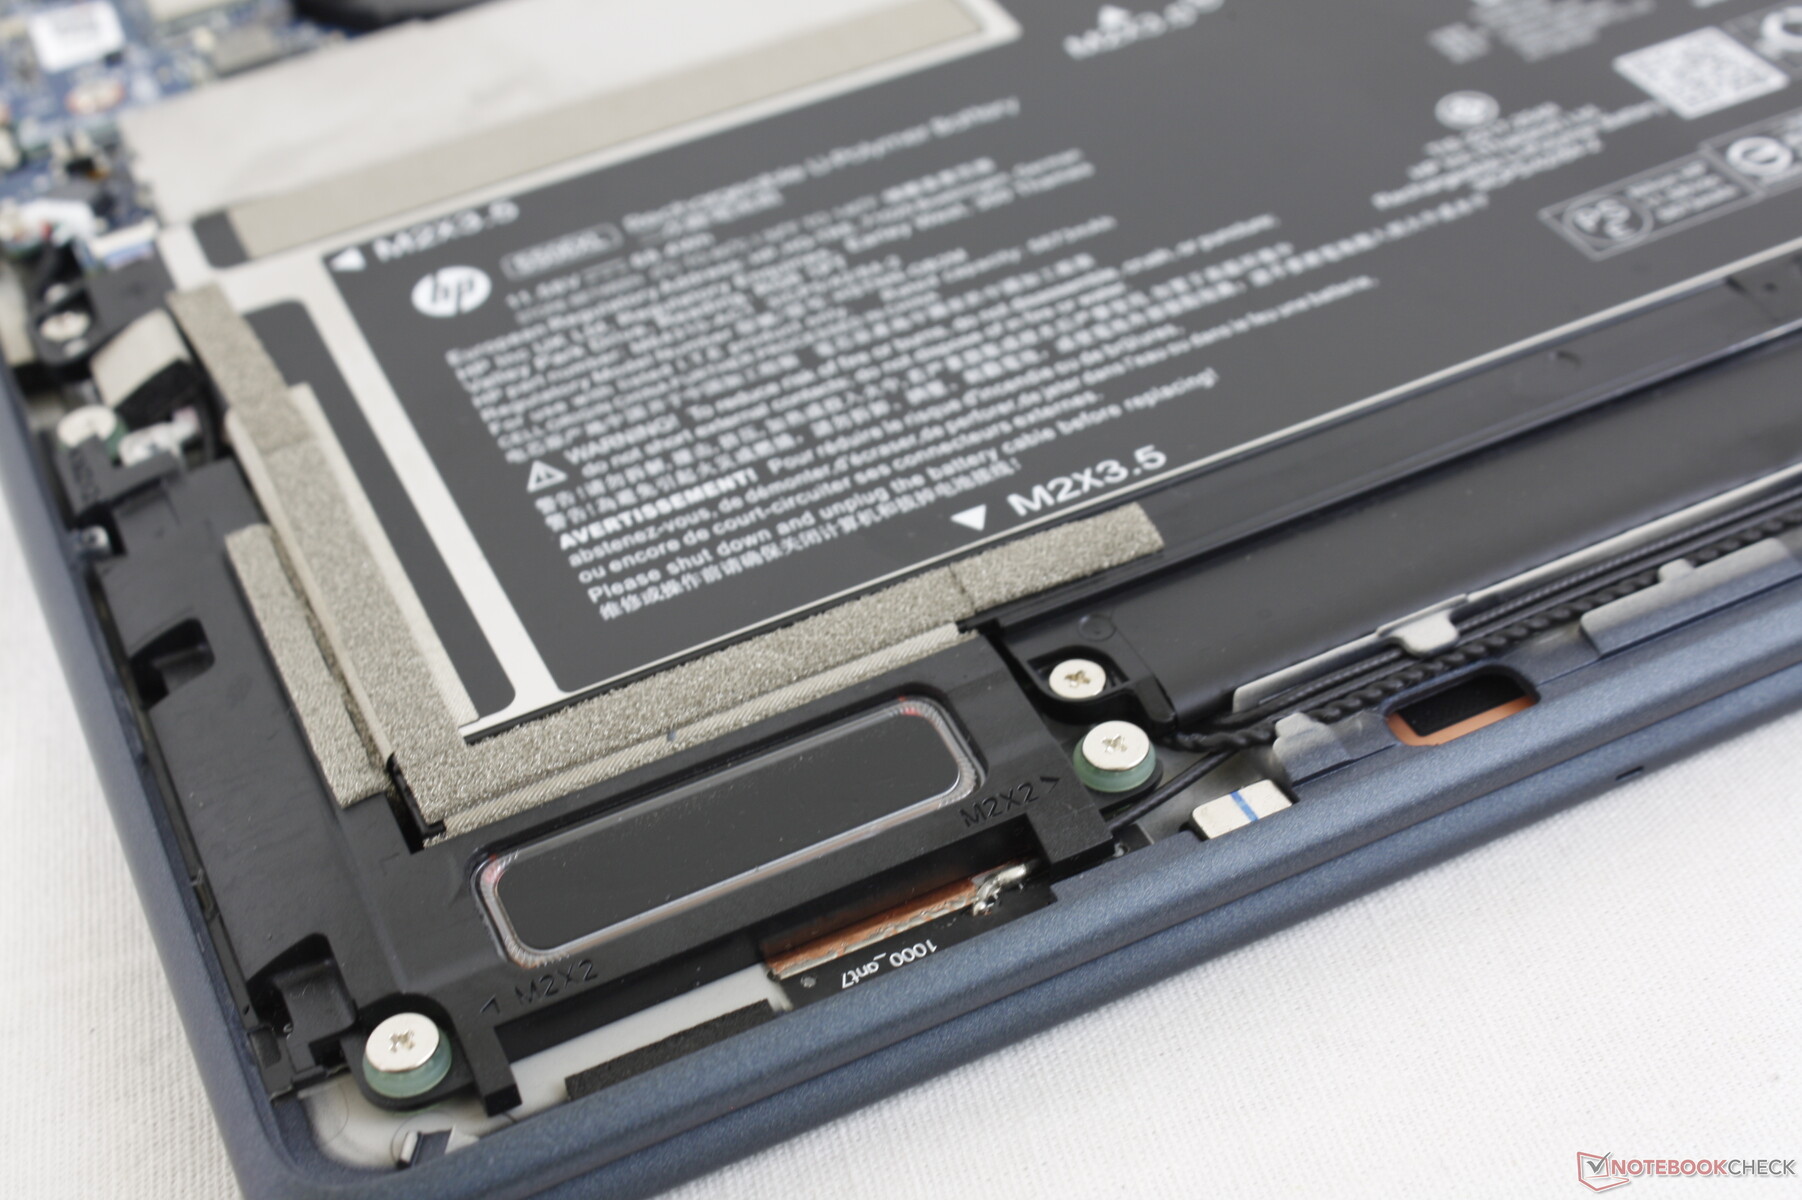
Un module WWAN Intel XMM 7560 R+ ou 5G 5000 est en option. Le module WWAN est amovible alors que le module WLAN ne l'est pas, comme le montrent les images ci-dessous.
| Networking | |
| iperf3 transmit AX12 | |
| Lenovo ThinkPad X1 Titanium Yoga G1 20QA001RGE | |
| HP Spectre x360 14t-ea000 | |
| HP EliteBook Folio 13.5-3G2L2EA | |
| iperf3 receive AX12 | |
| Lenovo ThinkPad X1 Titanium Yoga G1 20QA001RGE | |
| HP Spectre x360 14t-ea000 | |
| HP EliteBook Folio 13.5-3G2L2EA | |
| iperf3 receive AXE11000 6GHz | |
| Dell XPS 13 Plus 9320 i5-1240p | |
| Framework Laptop 13.5 12th Gen Intel | |
| HP Elite Dragonfly G3 | |
| iperf3 transmit AXE11000 6GHz | |
| Framework Laptop 13.5 12th Gen Intel | |
| HP Elite Dragonfly G3 | |
| Dell XPS 13 Plus 9320 i5-1240p | |
Webcam - 5 MP Standard
Bien que le Dragonfly Max de l'année dernière soit également livré avec une webcam de 5 MP, celle du Dragonfly G3 est nettement plus nette et plus lumineuse, ce qui en fait l'une des meilleures webcams intégrées que nous ayons vues sur un ordinateur portable, quelle que soit la taille de l'écran. L'obturateur et l'infrarouge sont tous deux présents, respectivement pour la confidentialité et la prise en charge d'Allo.


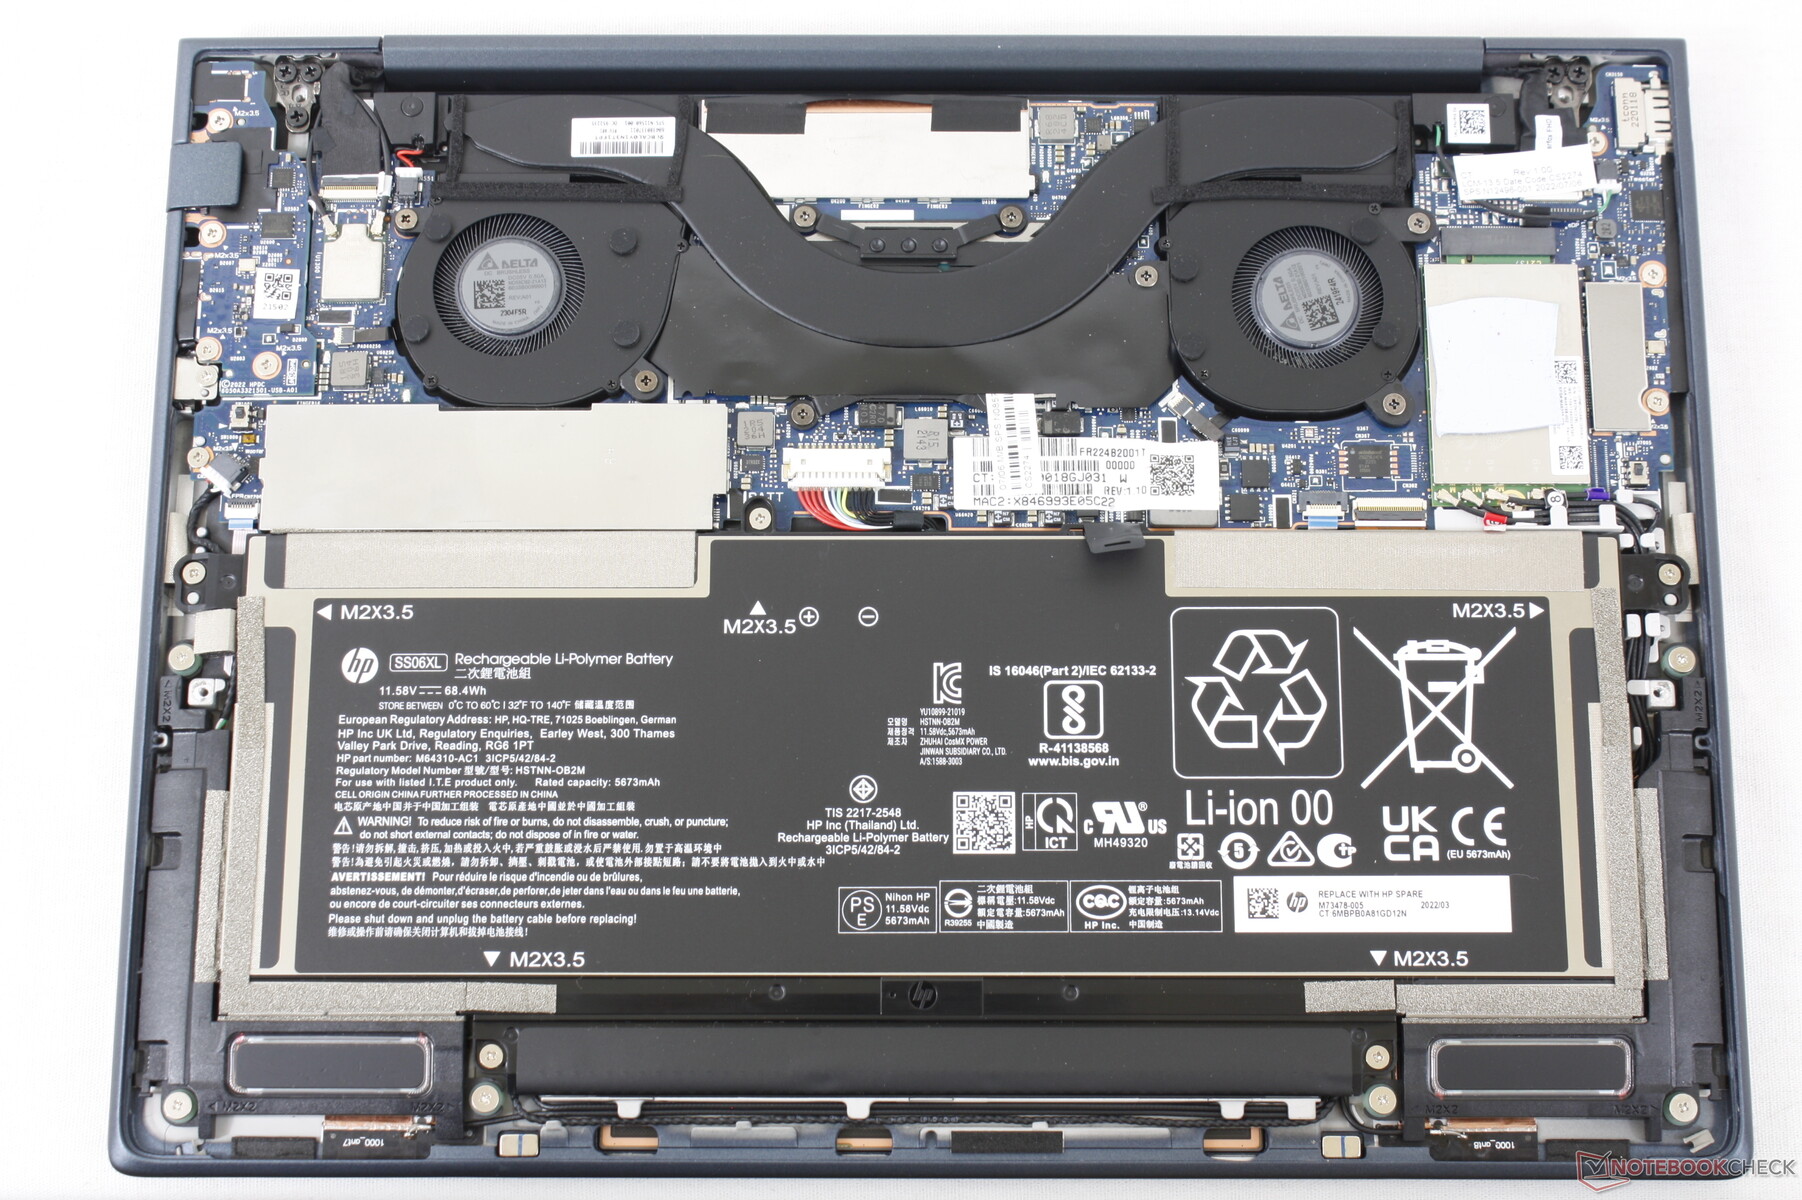
Maintenance
Le panneau inférieur est fixé par seulement quatre vis Torx T5 accessibles pour un entretien facile. Les utilisateurs peuvent remplacer la batterie, le WWAN M.2 ou le SSD M.2 si nécessaire, tandis que les modules de RAM sont fixes.
Accessoires et garantie
Il n'y a pas d'extras dans la boîte, à part l'adaptateur secteur et les papiers. Il aurait été agréable de voir un étui de transport similaire à celui qui est inclus avec certains modèles Spectre.
Une garantie de base limitée d'un an par le fabricant est fournie en standard si elle est achetée aux États-Unis. Nous trouvons cela décevant car le Dragonfly est l'un des ordinateurs portables professionnels phares de HP où une garantie de base de 3 ans est attendue. Le Dell Latitude 7330, par exemple, est livré avec une garantie de 3 ans sans frais supplémentaires.
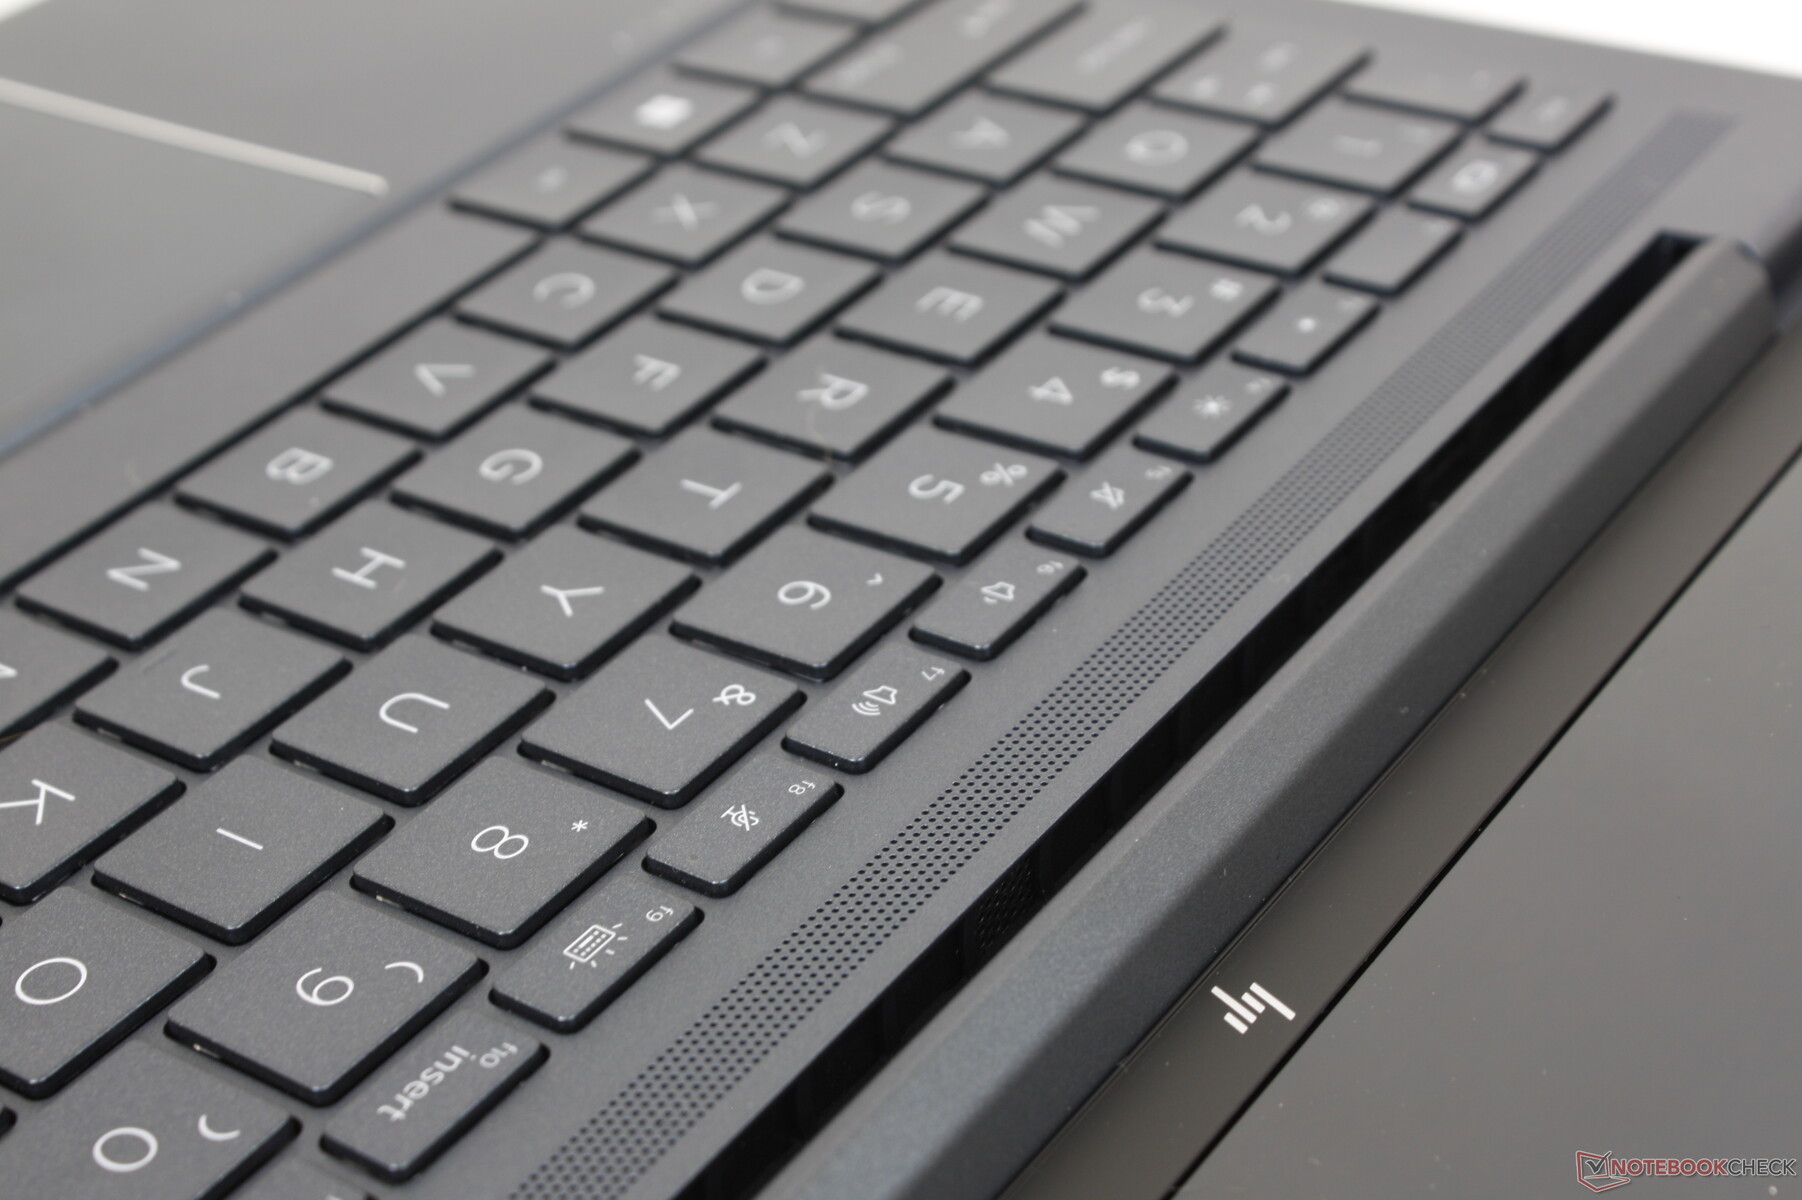
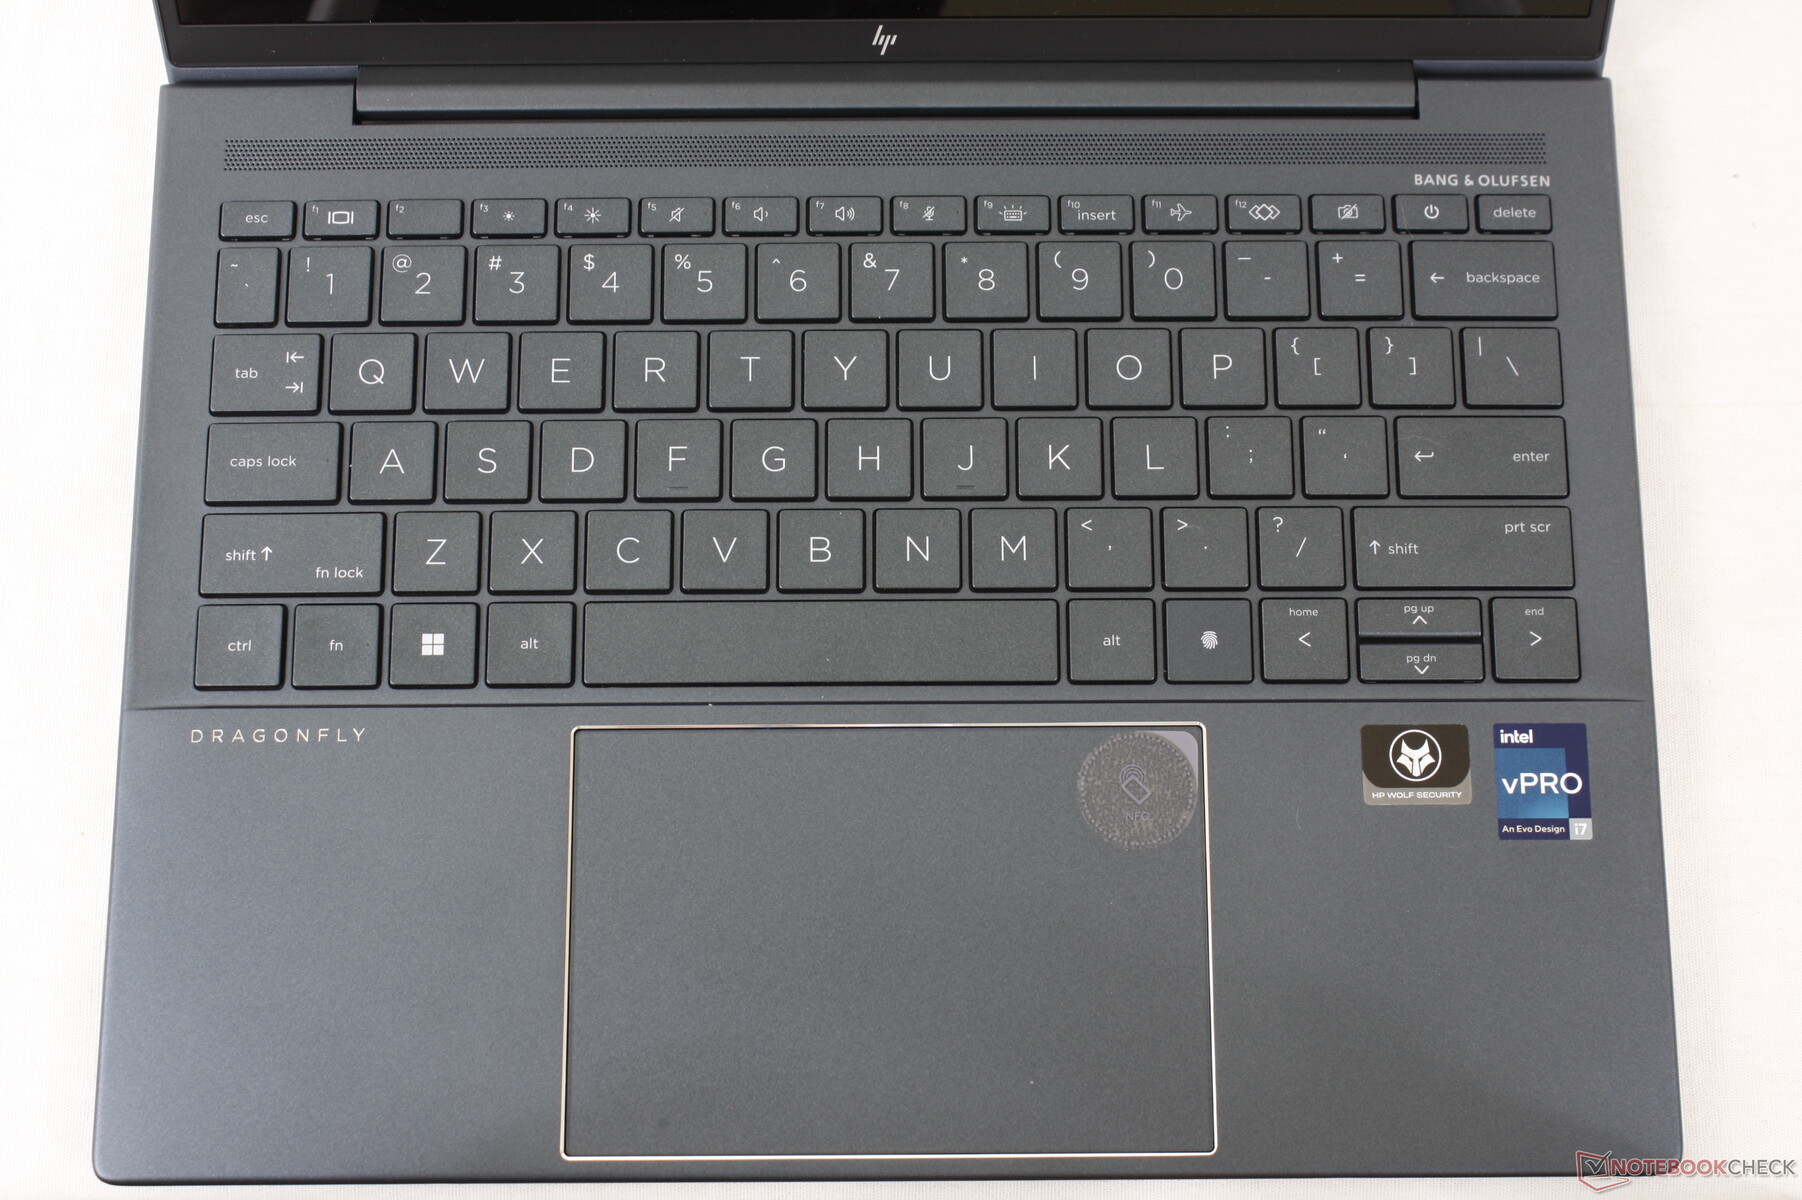
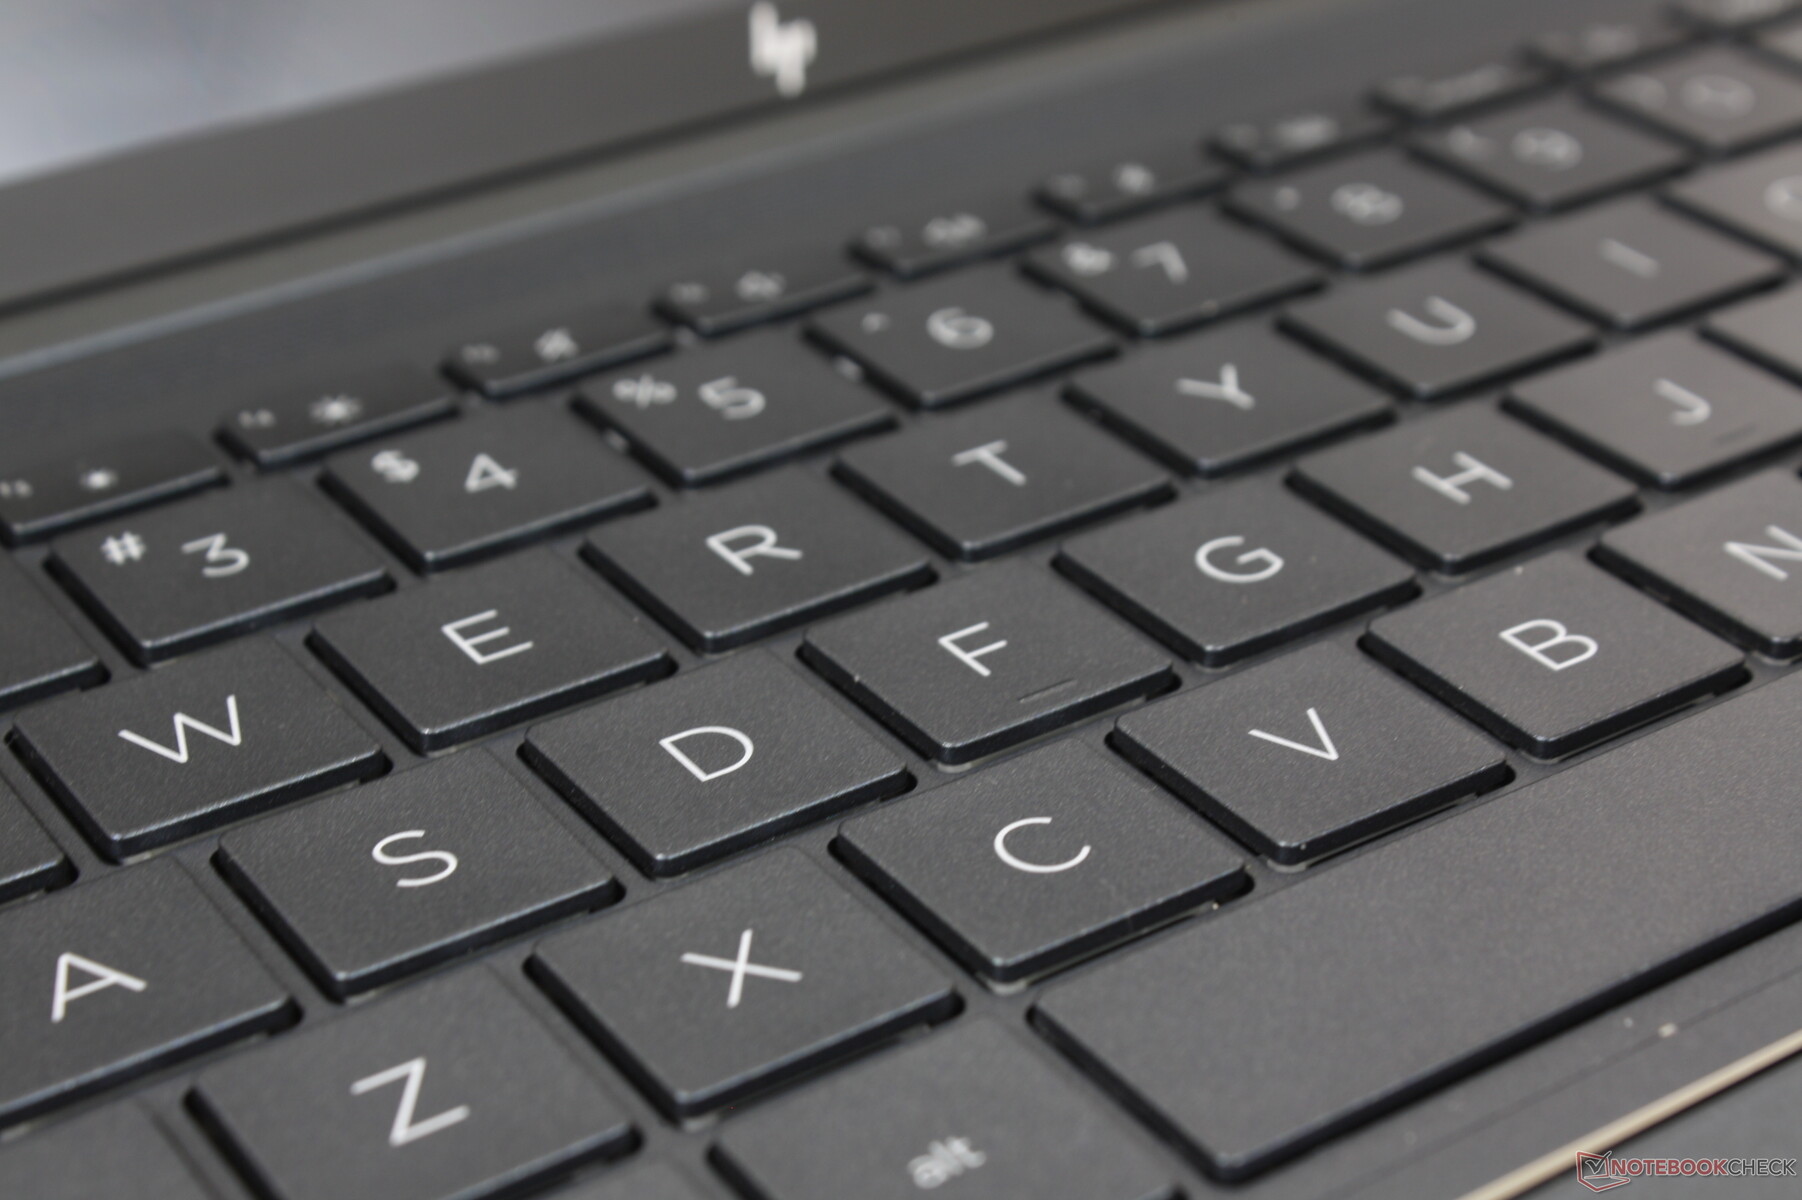
Dispositifs de saisie - Lettres plus grandes, pavé tactile plus grand
Clavier
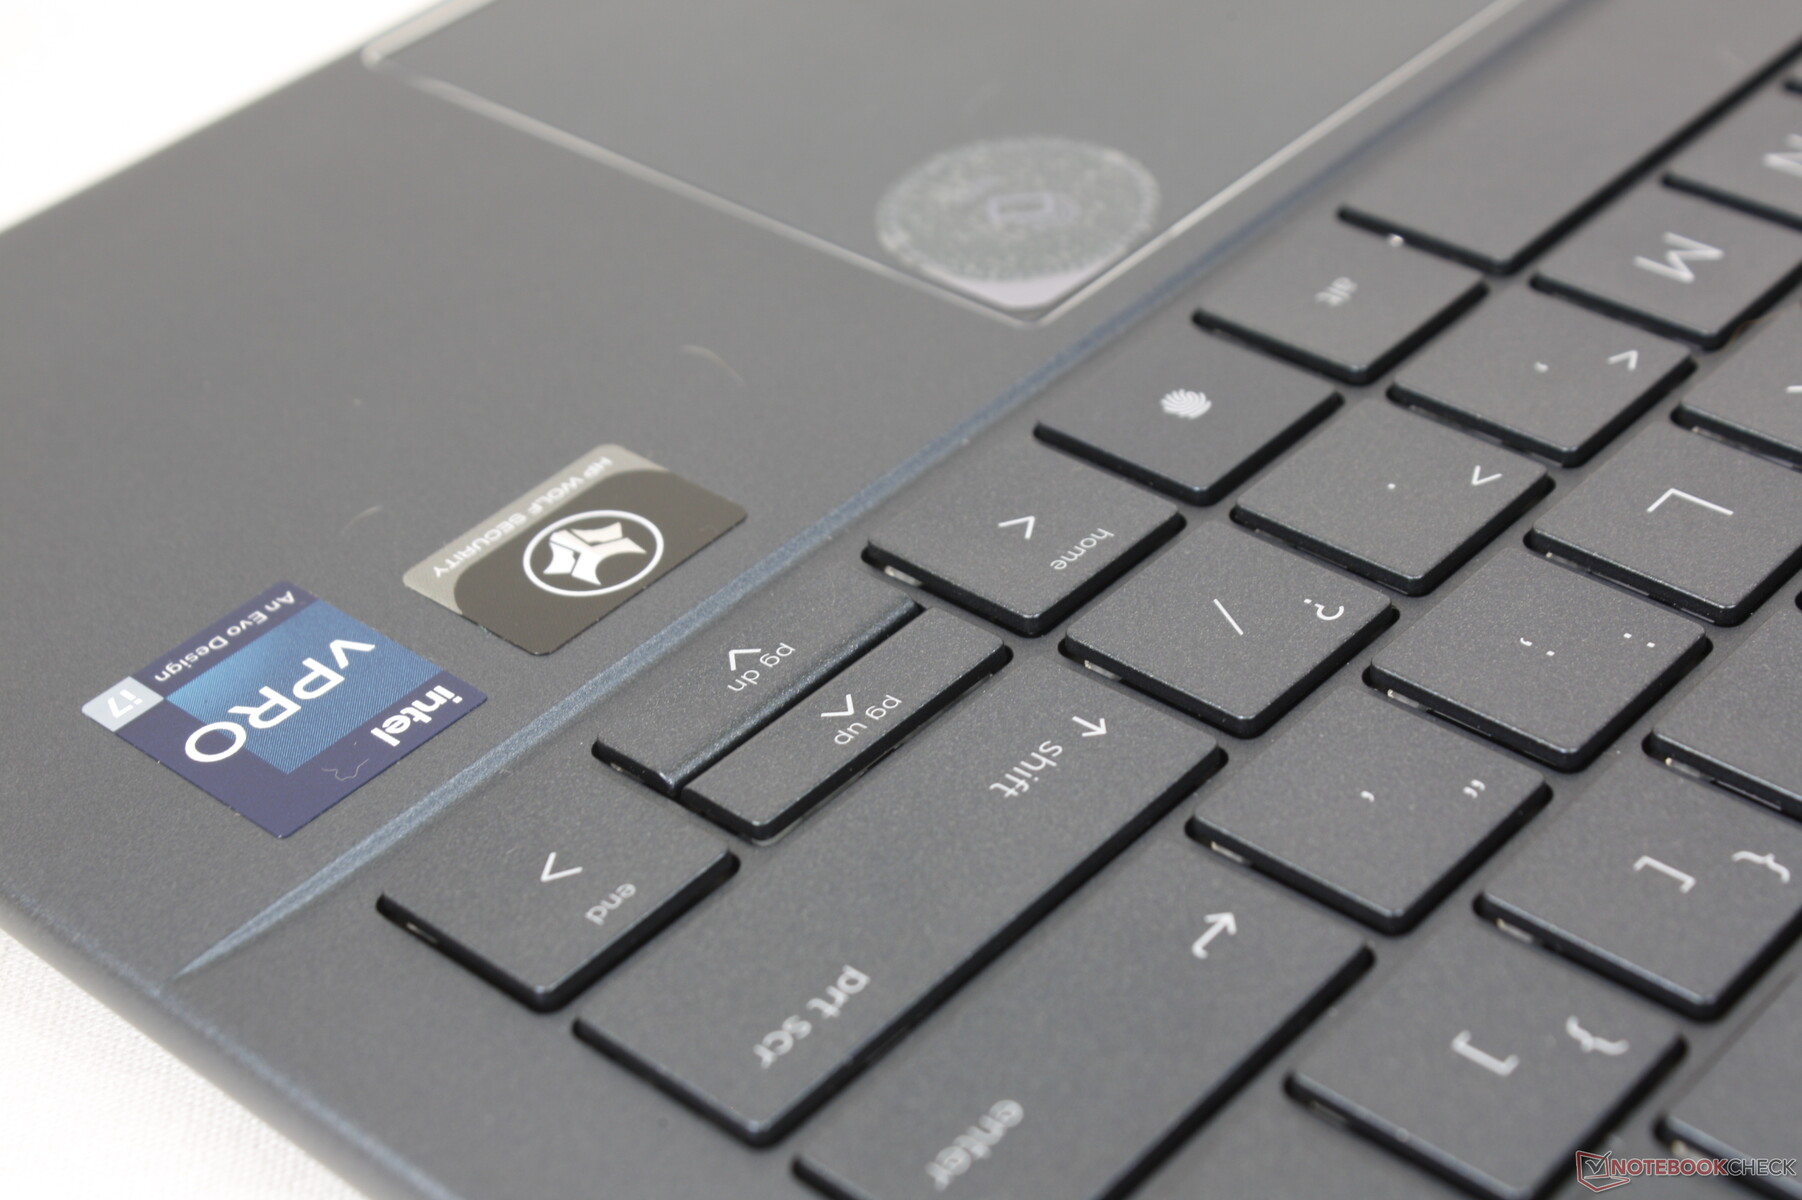
L'expérience de frappe entre les modèles Spectre et EliteBook/Dragonfly est presque identique. Si vous avez déjà tapé sur un portable Spectre, vous saurez à quoi vous attendre avec le Dragonfly G3. Le retour d'information est net et la course semble plus profonde que sur le ThinkPad X1 Nano Gen 2. Les touches Haut et Bas, très étroites, sont peut-être la pire partie du clavier.
Si elle est configurée avec Sure View, la touche F2 aura une option de basculement pour l'affichage. Sinon, la touche n'a pas de fonction secondaire, comme le montre l'image ci-dessous.
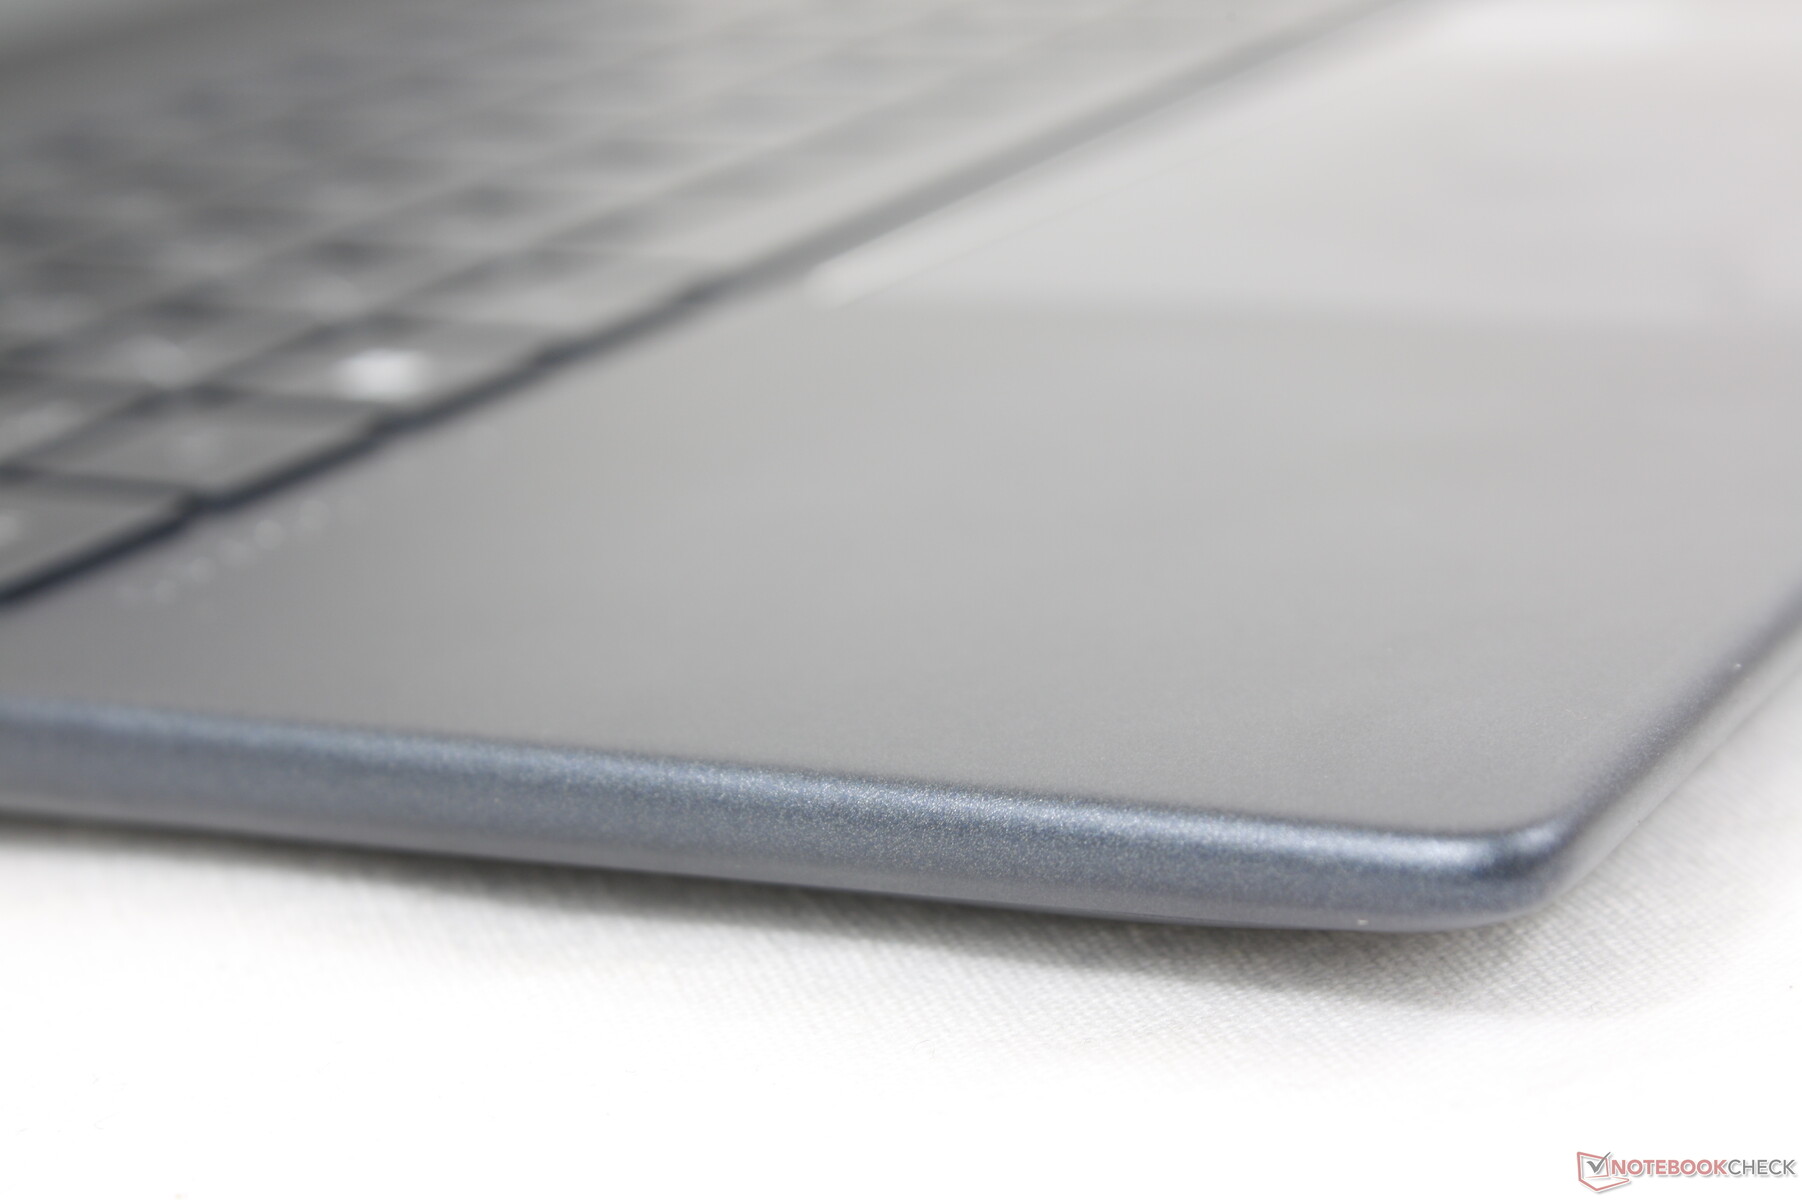
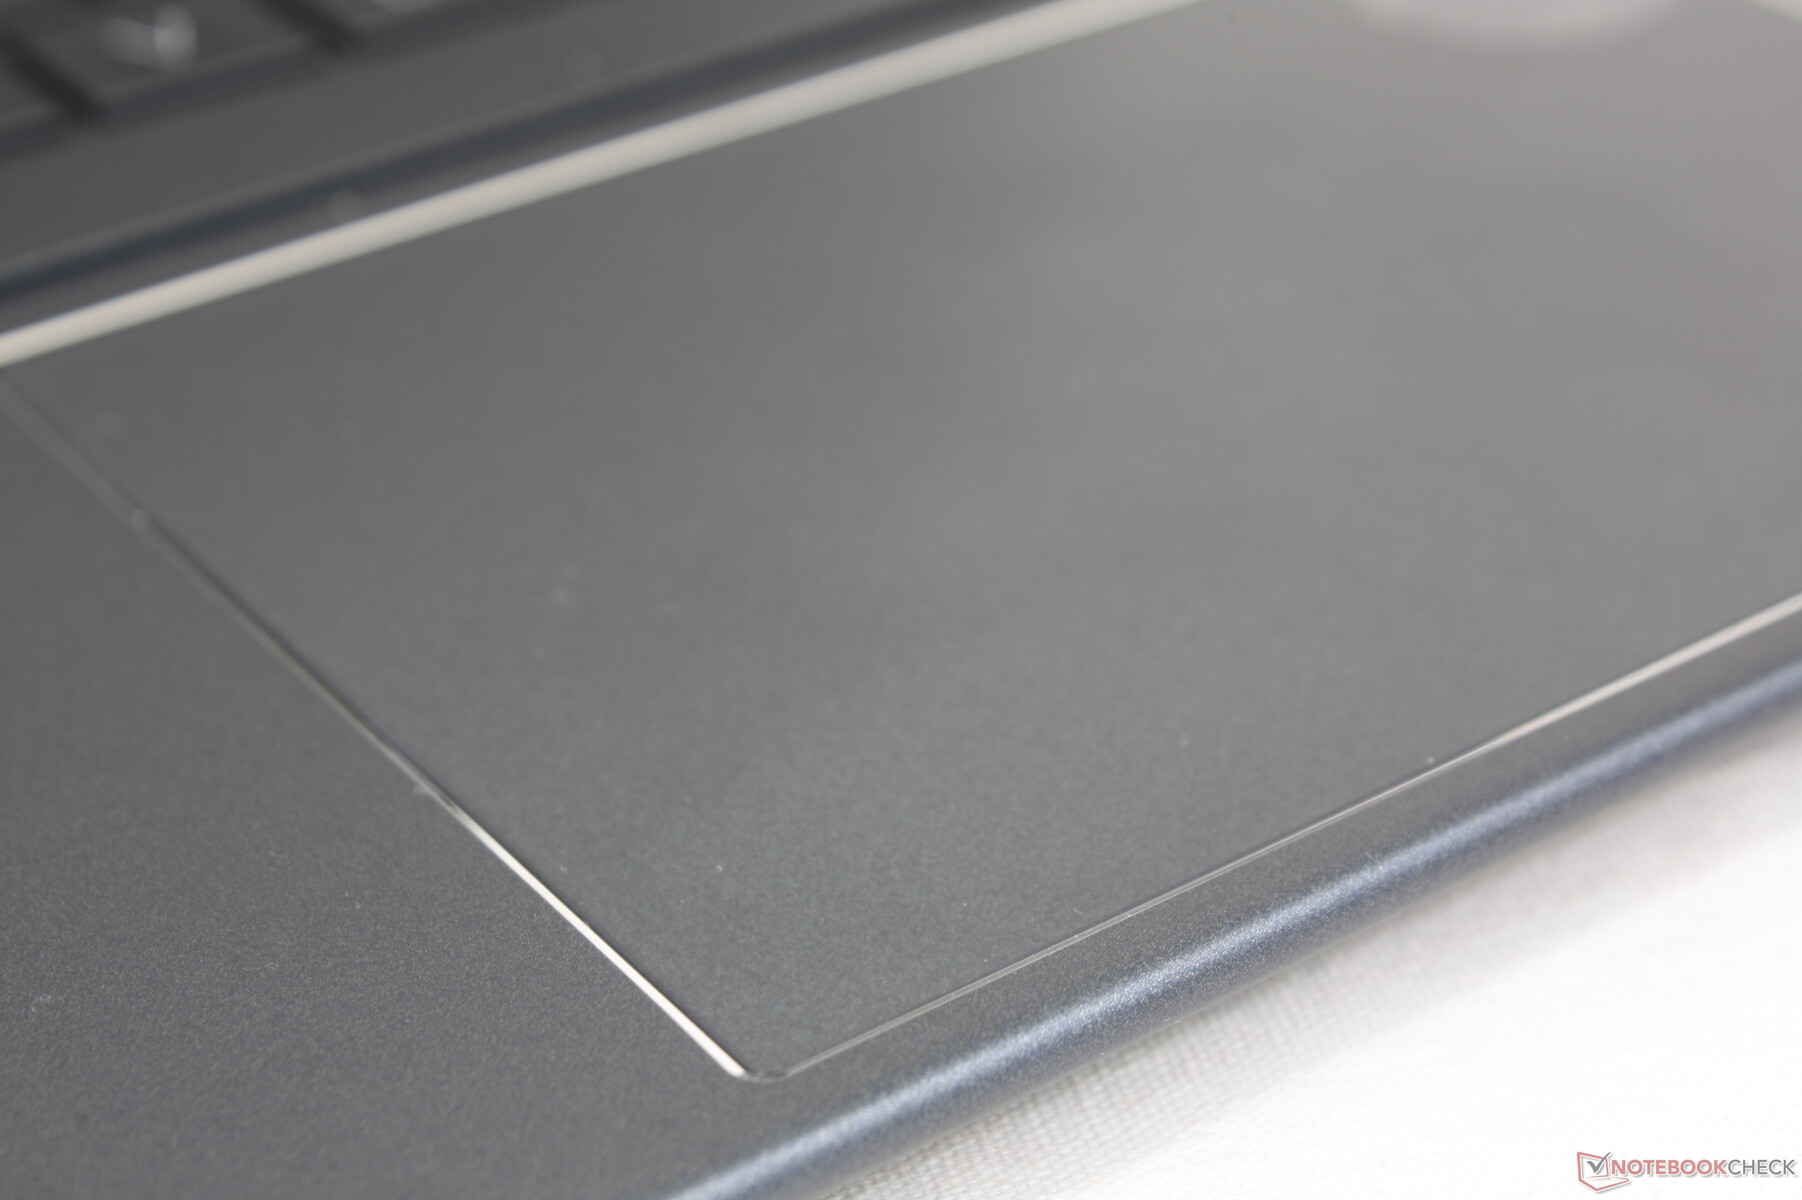
Pavé tactile
Le pavé tactile est plus grand que celui du Dragonfly Max pour faciliter le contrôle du curseur (12 x 8 cm contre 11 x 6,5 cm). Le retour d'information lorsque l'on appuie sur le pavé tactile est faible mais satisfaisant, malgré le bruit plus faible que prévu.
Affichage - Nombreuses options
Un total de six options d'affichage de 13,5 pouces est disponible comme suit :
- 1920 x 1280, 400 nits, brillant, non tactile, IPS
- 1920 x 1280, 400 nits, brillant, tactile, IPS
- 1920 x 1280, 400 nits, mat, tactile, IPS
- 1920 x 1280, 1000 nits, Sure View, mat, non tactile, IPS
- 1920 x 1280, 1000 nits, Sure View, mat, tactile, IPS
- 3000 x 2000, 400 nits, brillant, tactile, OLED
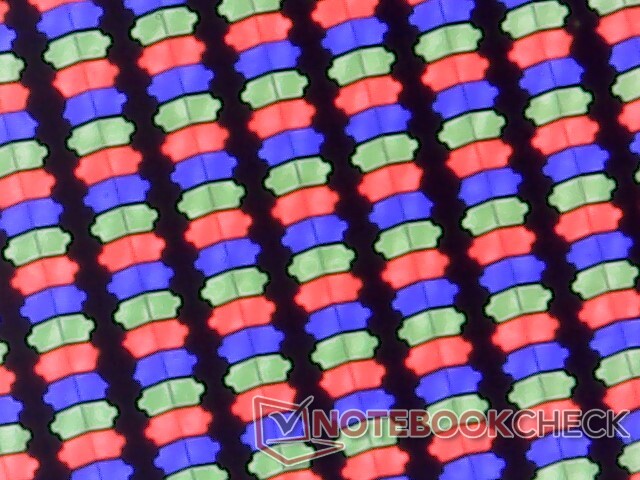
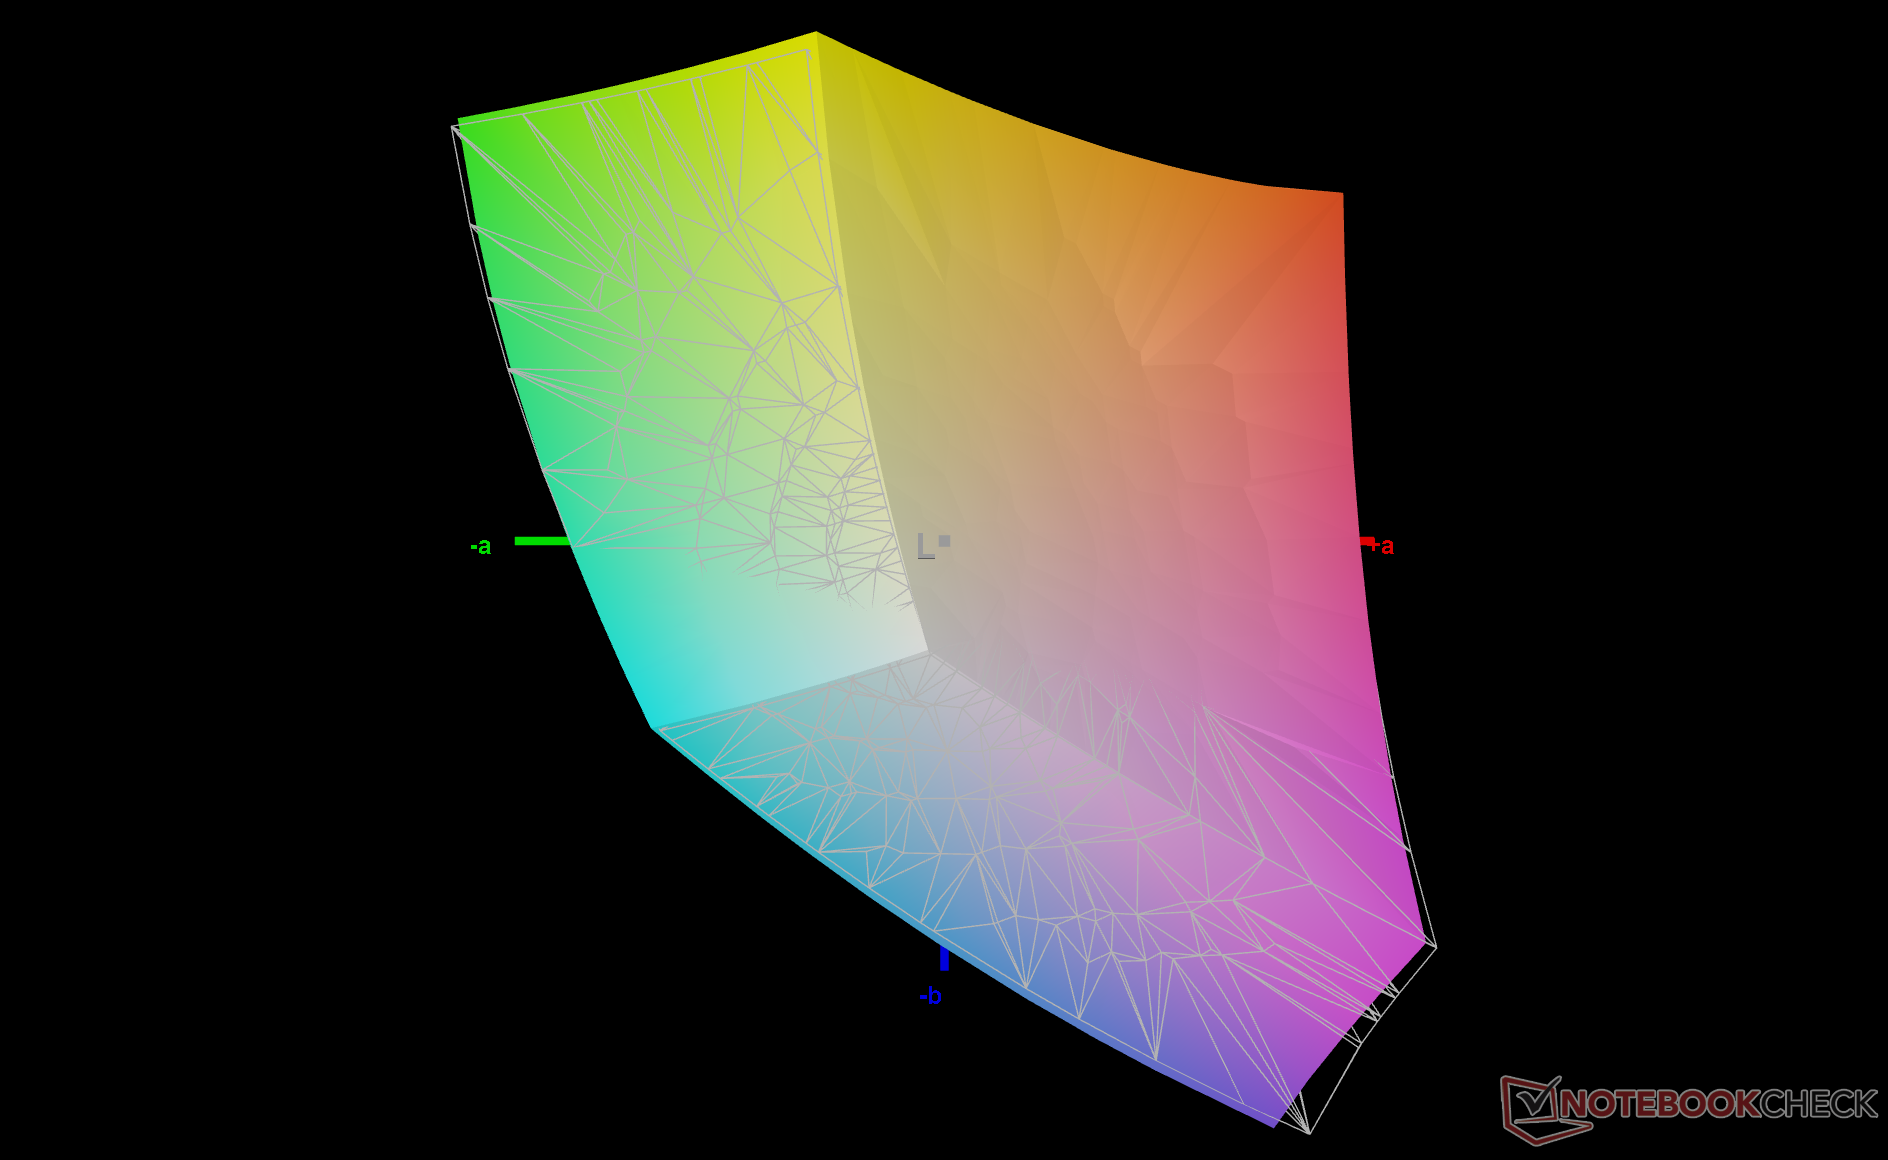
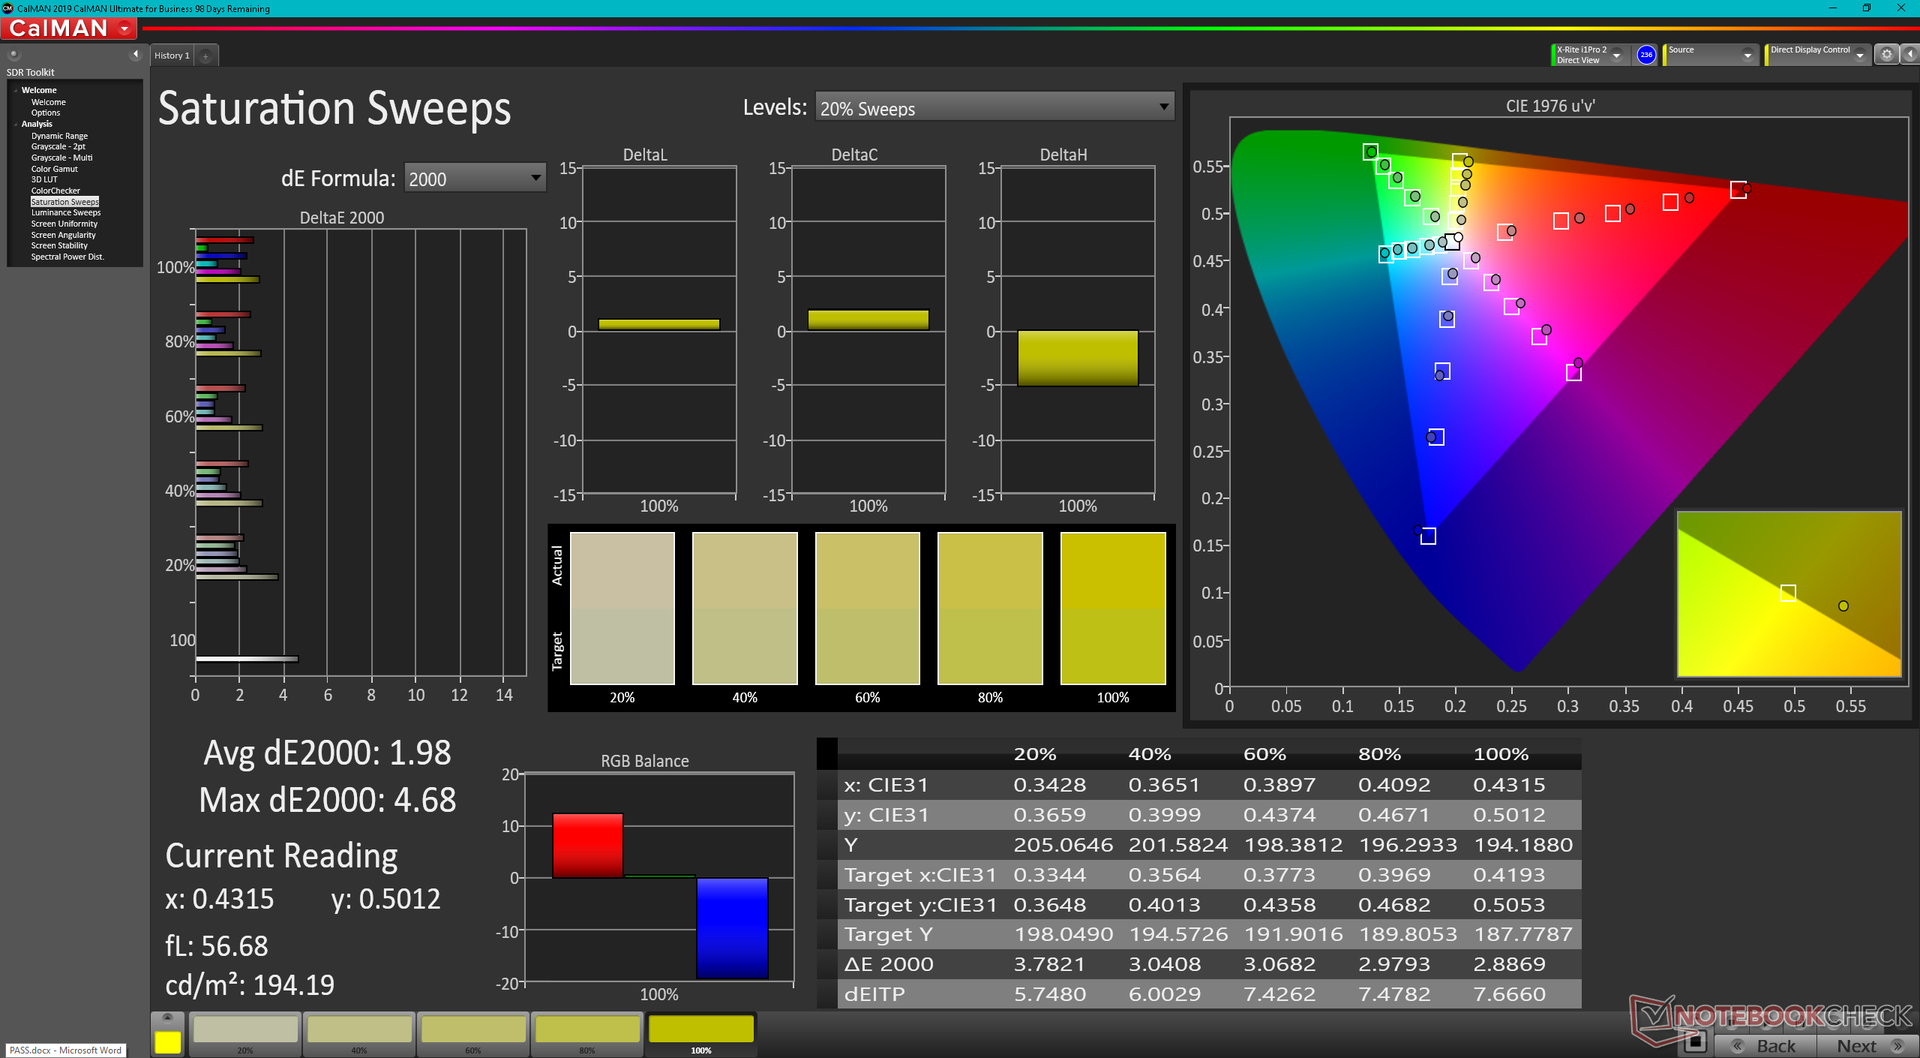
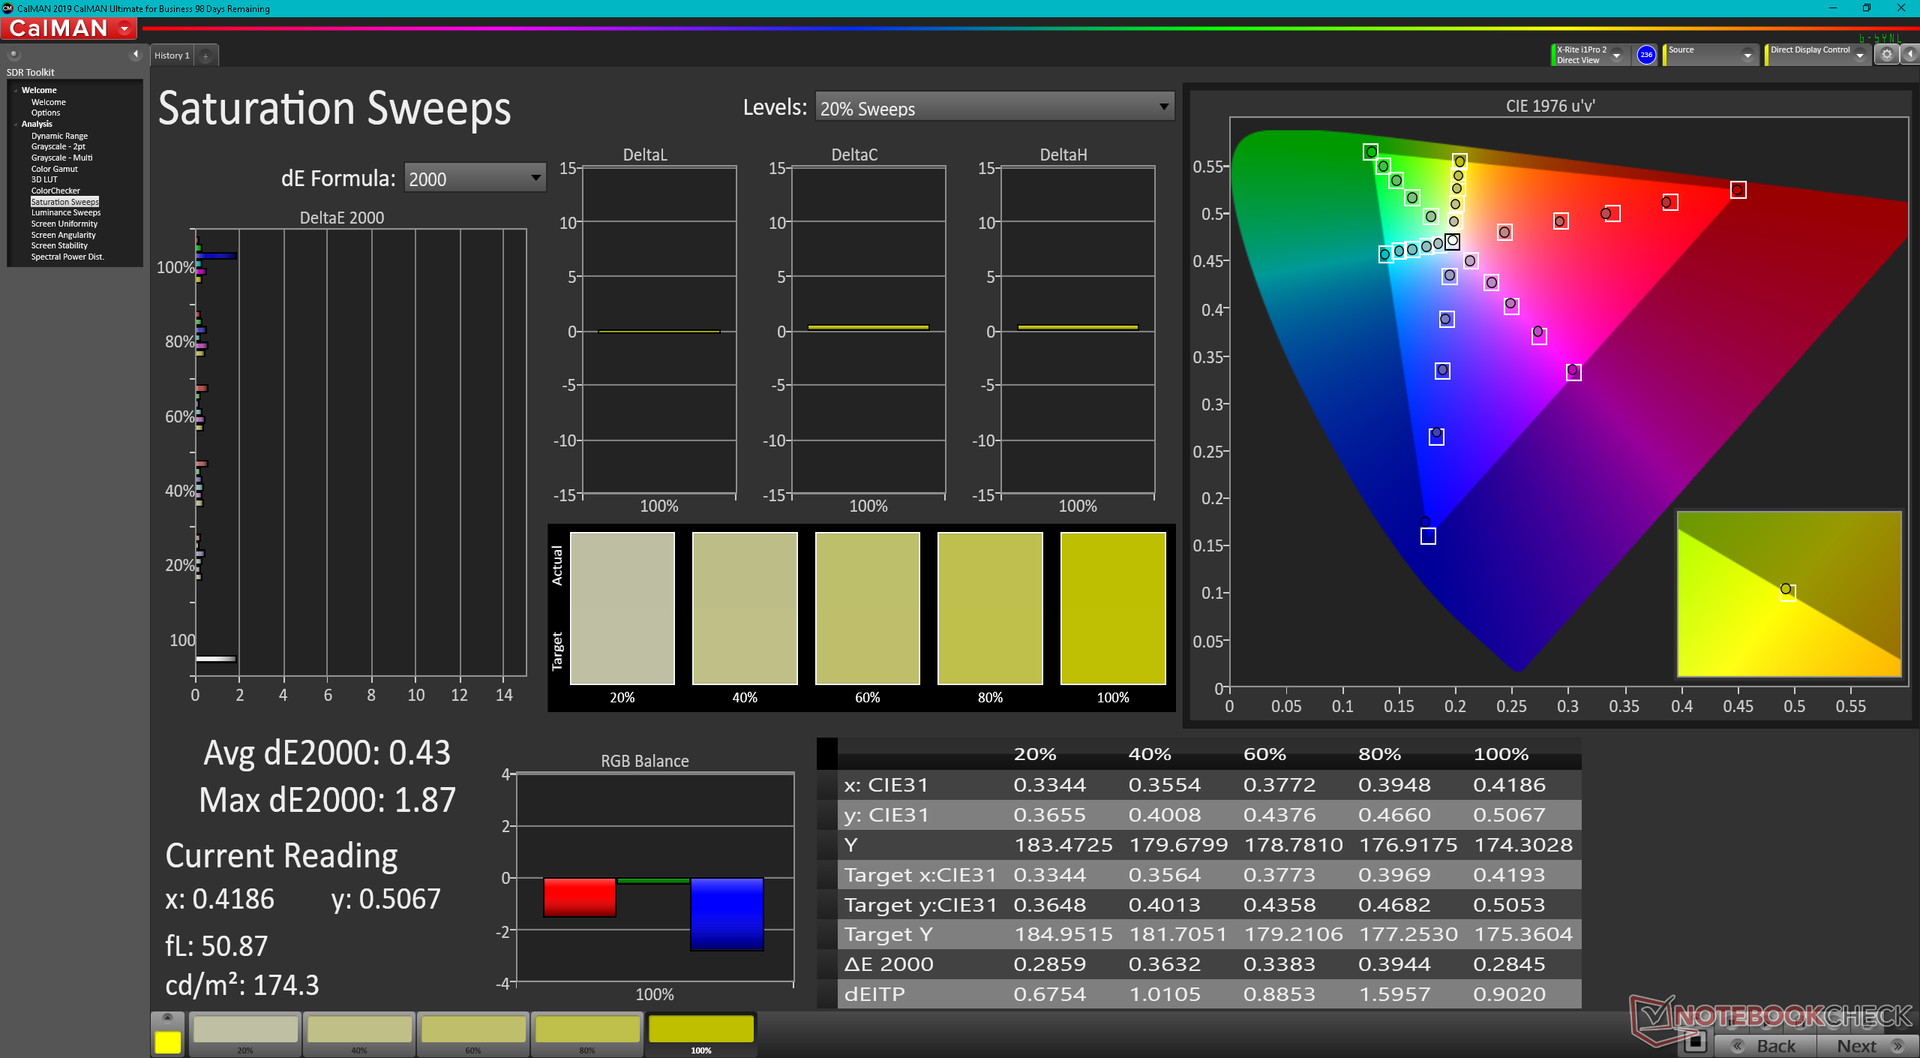
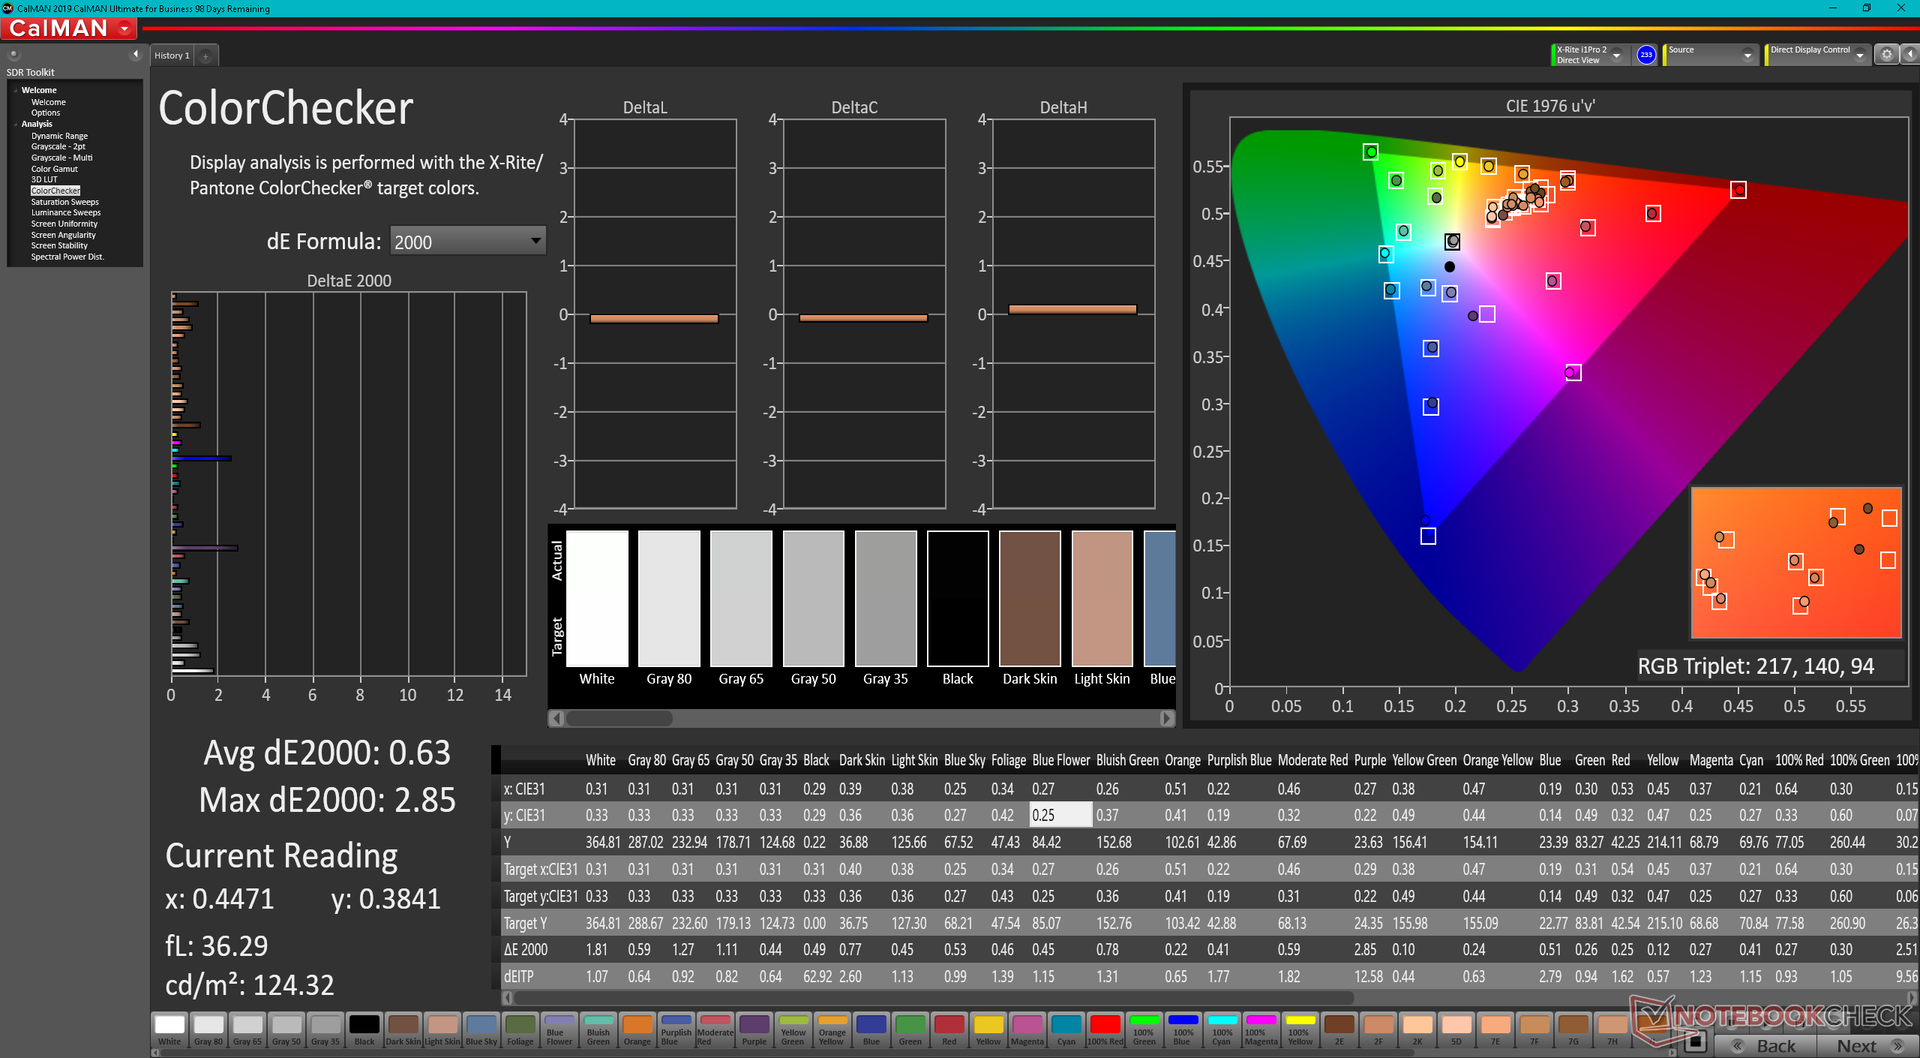
Nos mesures ci-dessous reflètent uniquement la configuration ci-dessus en gras. Il est intéressant de noter que notre unité utilise une dalle Chi Mei au lieu de la dalle LG Philips que l'on trouve sur le Spectre x360 de 13,5 pouces, mais les attributs de base sont autrement presque les mêmes entre eux, y compris la couverture sRGB complète, le rapport de contraste élevé de ~1500:1, et les temps de réponse noir-blanc et gris-gris très lents. Attendez-vous à des images fantômes si vous jouez à des jeux rapides sur le Dragonfly G3. La qualité d'image est nette et vibrante même avec l'option d'écran de base sur notre unité de revue. Pour des couleurs plus profondes, nous soupçonnons que l'option OLED peut offrir une couverture P3 complète comme sur le 2022 Spectre x360 13.5.
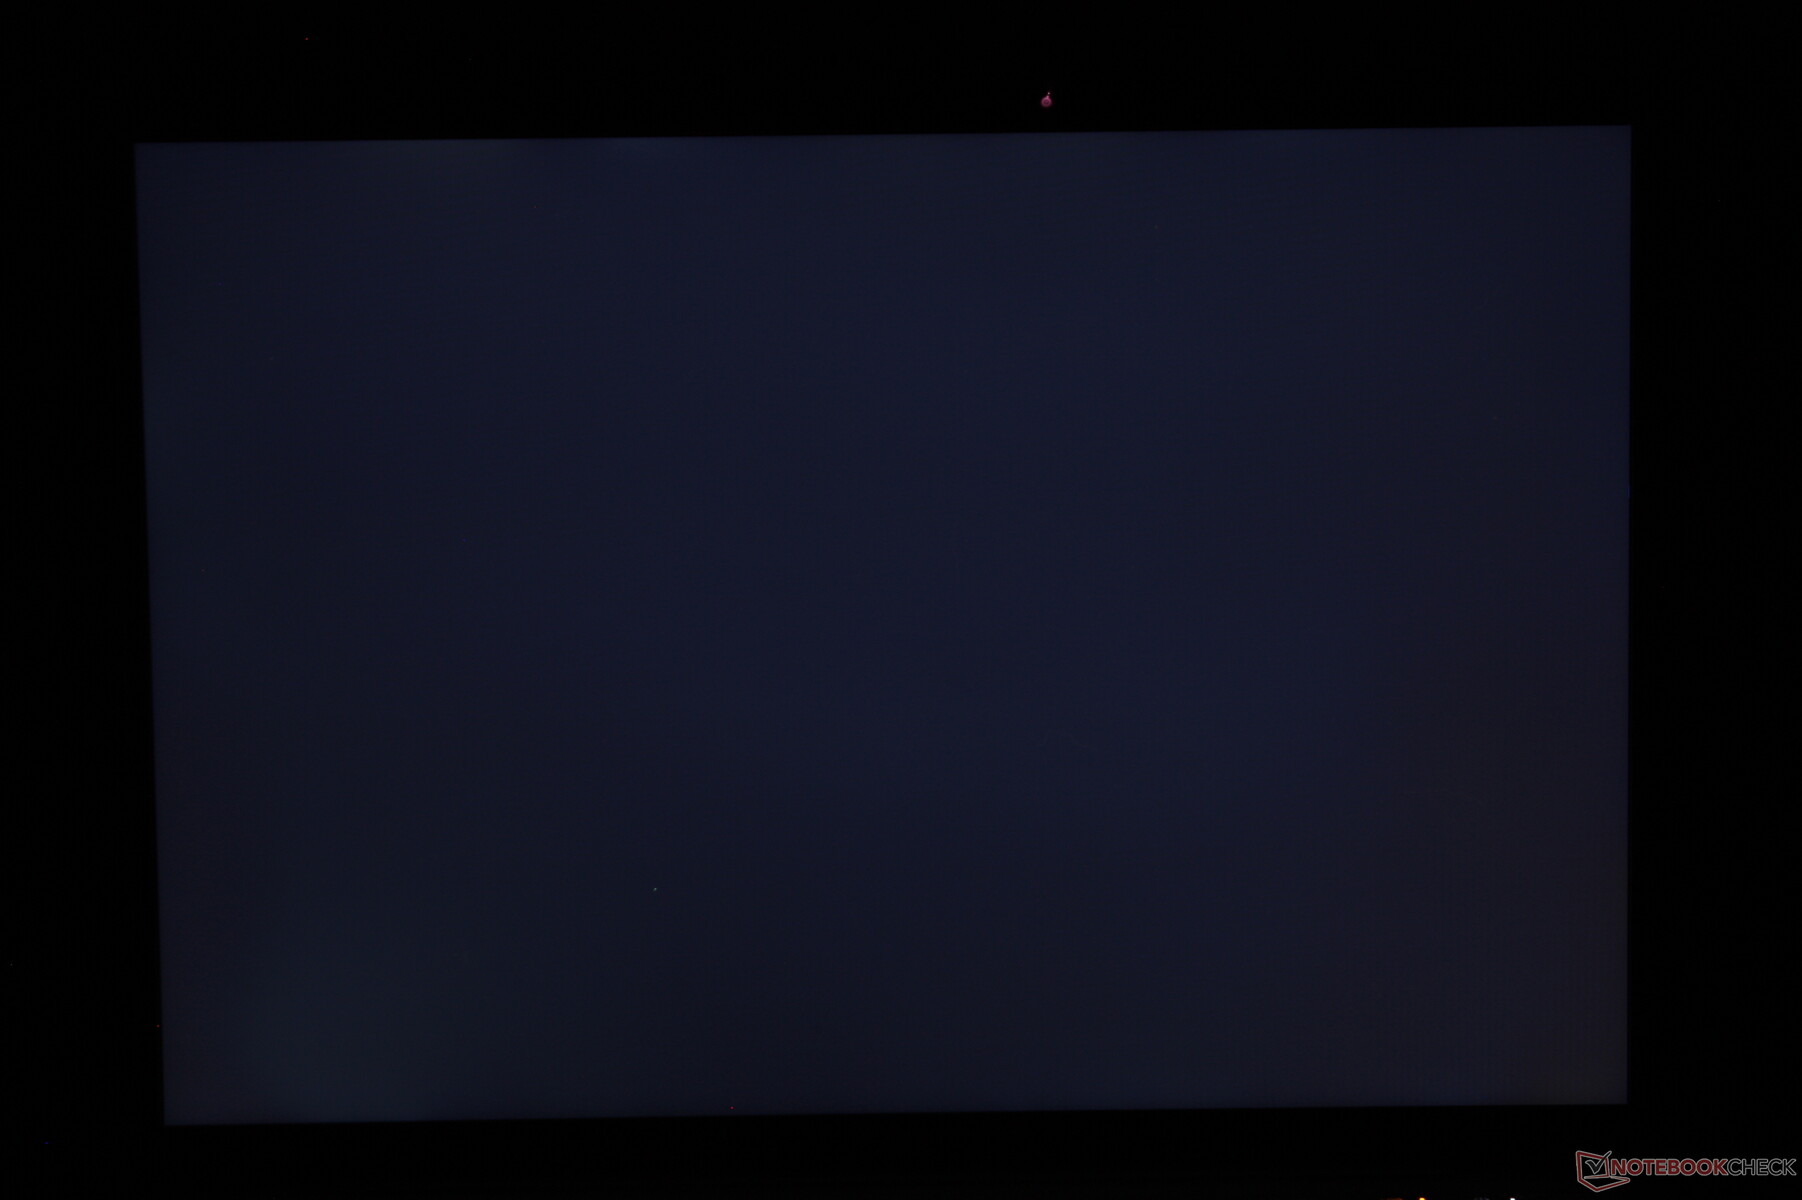
La distribution de la luminosité pourrait être meilleure. Le coin inférieur gauche de notre écran n'est que de 314 nits alors que le coin supérieur droit est de 389 nits, soit une baisse de luminosité de 20 % d'un coin à l'autre. Bien que la différence ne soit pas gênante lors d'une utilisation régulière, nous attendions mieux d'un ordinateur portable haut de gamme comme celui-ci.
| |||||||||||||||||||||||||
Homogénéité de la luminosité: 80 %
Valeur mesurée au centre, sur batterie: 387.2 cd/m²
Contraste: 1489:1 (Valeurs des noirs: 0.26 cd/m²)
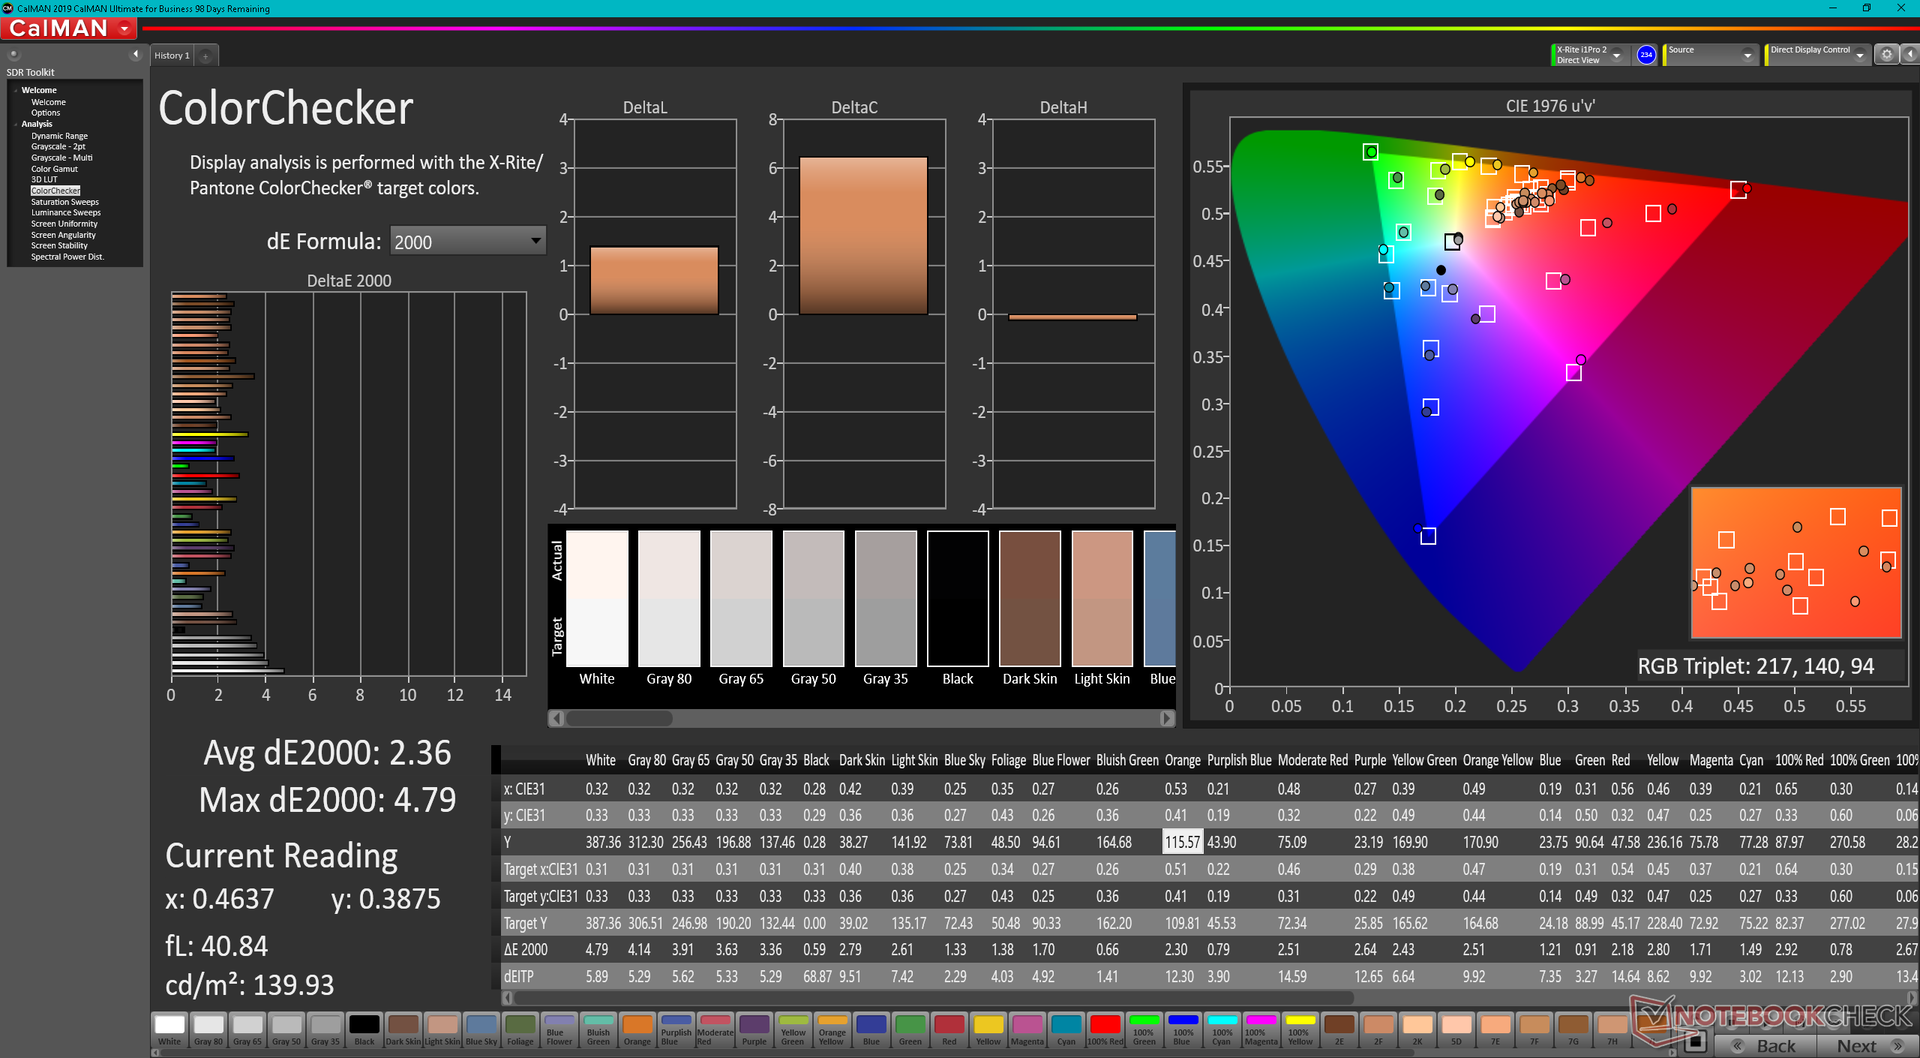
ΔE ColorChecker Calman: 2.36 | ∀{0.5-29.43 Ø4.71}
calibrated: 0.63
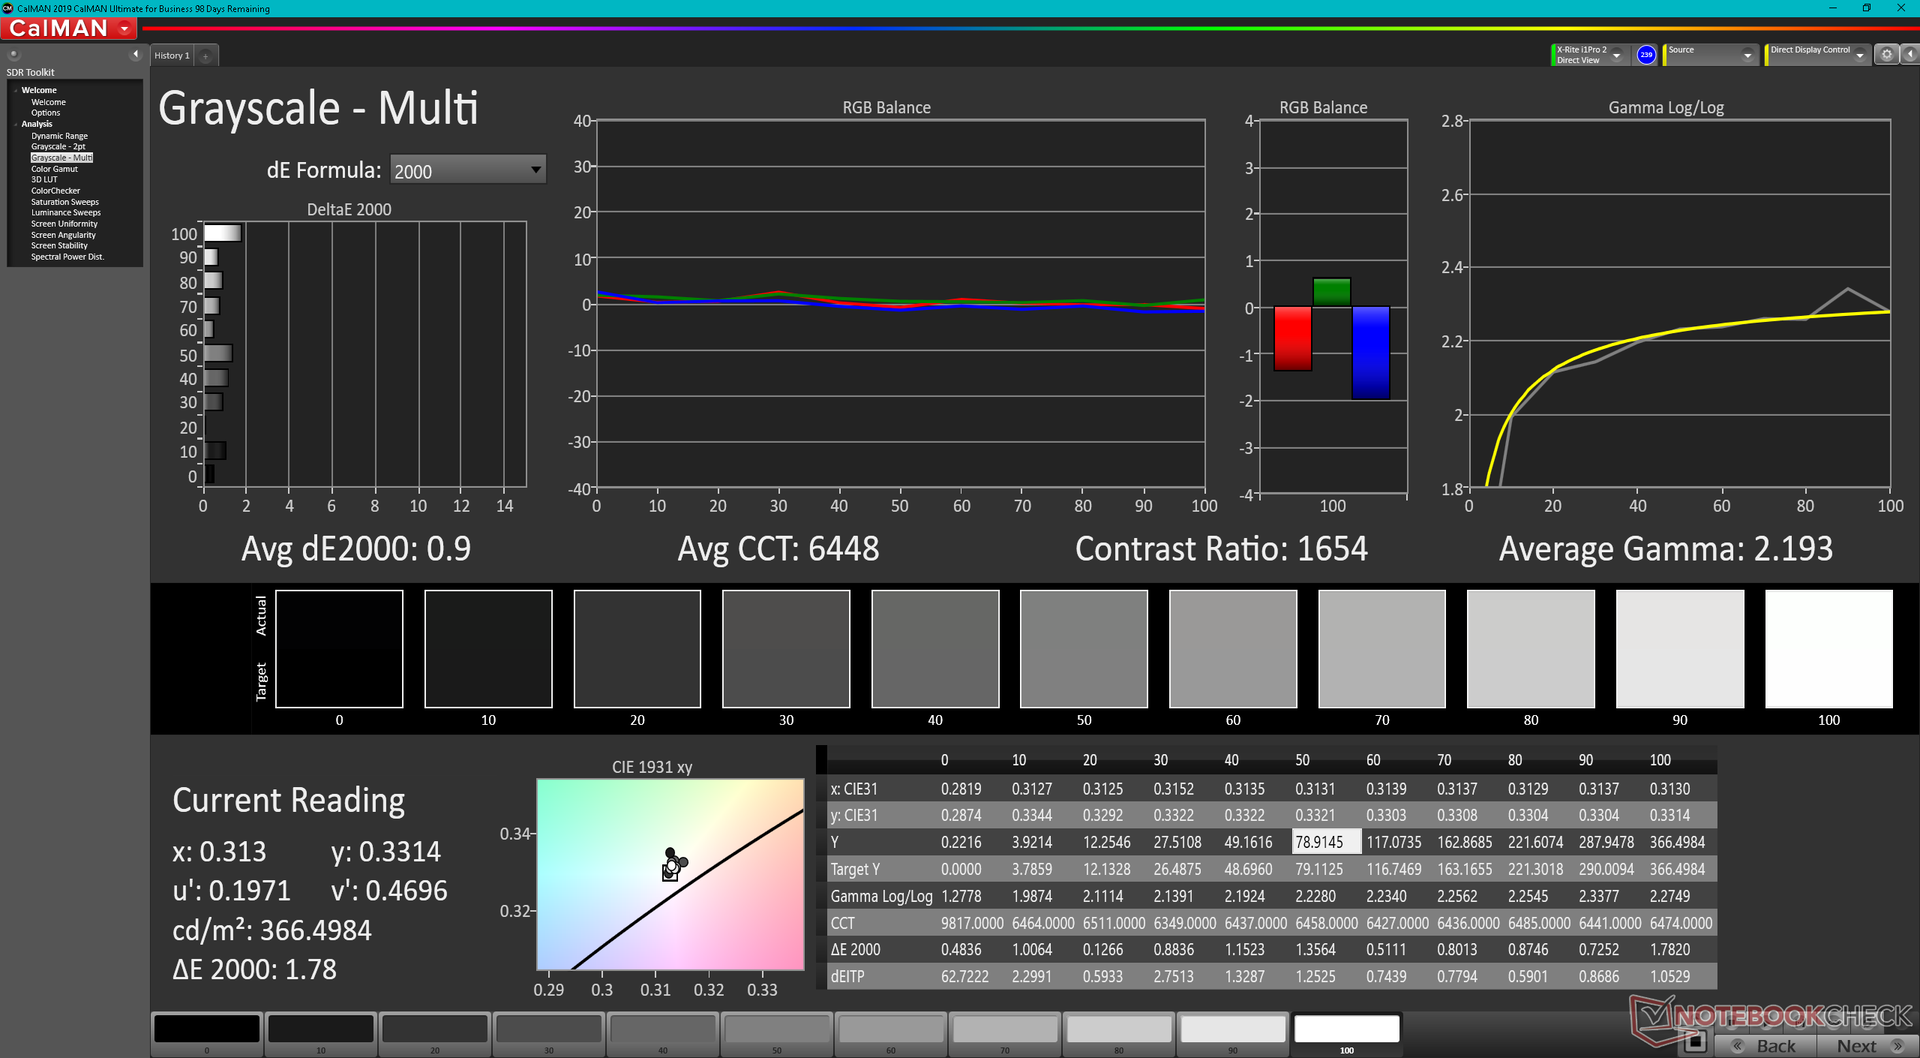
ΔE Greyscale Calman: 3 | ∀{0.09-98 Ø4.96}
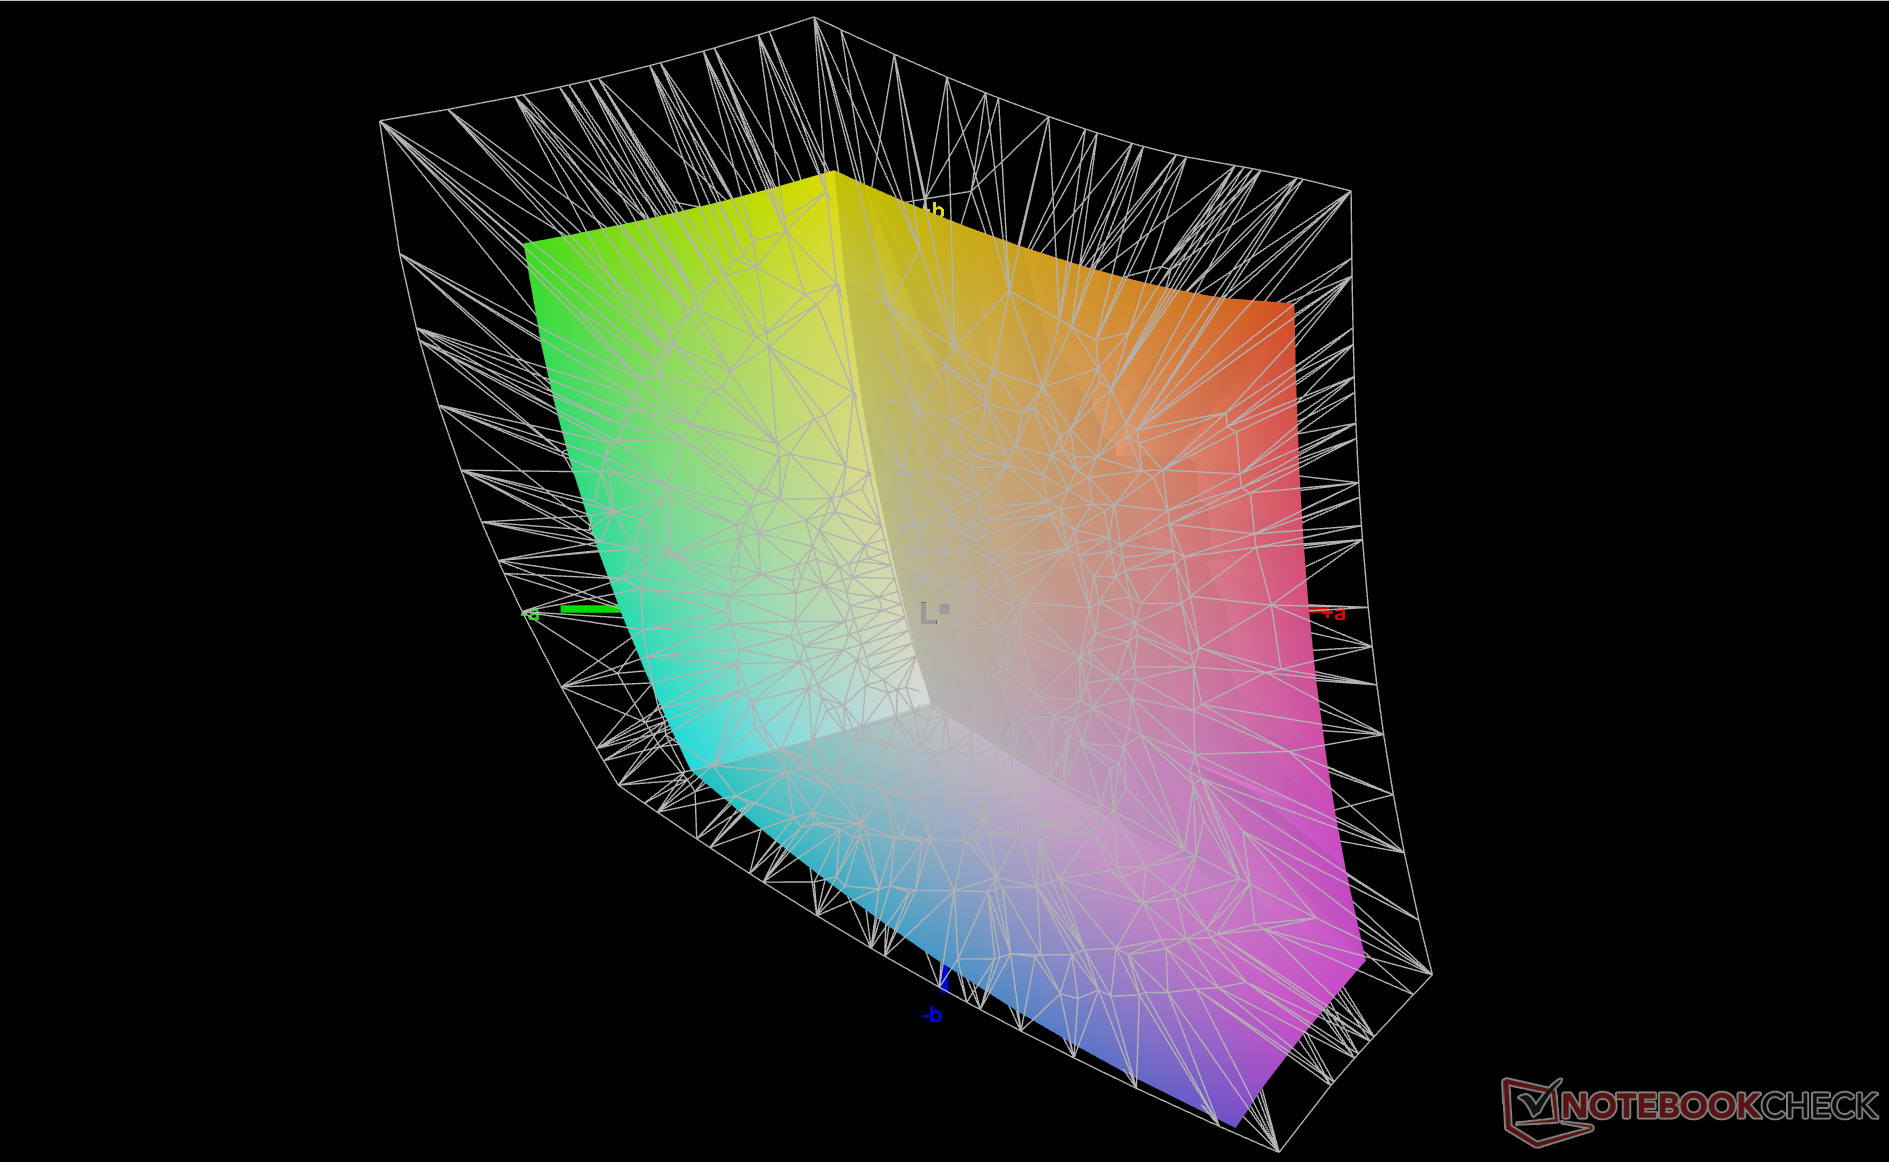
69.9% AdobeRGB 1998 (Argyll 3D)
98.3% sRGB (Argyll 3D)
68% Display P3 (Argyll 3D)
Gamma: 2.17
CCT: 6137 K
| HP Elite Dragonfly G3 Chi Mei CMN13C0, IPS, 1920x1280, 13.5" | HP Spectre x360 14t-ea000 LG Philips LGD0663, IPS, 1920x1280, 13.5" | Dell XPS 13 Plus 9320 i5-1240p Sharp SHP1548 LQ134N1, IPS, 1920x1200, 13.4" | Framework Laptop 13.5 12th Gen Intel BOE CQ NE135FBM-N41, IPS, 2256x1504, 13.5" | HP EliteBook Folio 13.5-3G2L2EA LGD0663, IPS, 1920x1280, 13.5" | Lenovo ThinkPad X1 Titanium Yoga G1 20QA001RGE LPM135M467, IPS, 2256x1504, 13.5" | |
|---|---|---|---|---|---|---|
| Display | -2% | 1% | 2% | |||
| Display P3 Coverage (%) | 68 | 65.8 -3% | 69 1% | 69.9 3% | ||
| sRGB Coverage (%) | 98.3 | 98.2 0% | 99 1% | 99.4 1% | ||
| AdobeRGB 1998 Coverage (%) | 69.9 | 67.9 -3% | 71 2% | 71.1 2% | ||
| Response Times | -18% | 26% | 27% | 18% | 13% | |
| Response Time Grey 50% / Grey 80% * (ms) | 50.8 ? | 62 ? -22% | 45 ? 11% | 34.7 ? 32% | 44 ? 13% | 53.6 ? -6% |
| Response Time Black / White * (ms) | 35.2 ? | 39.6 ? -13% | 21 ? 40% | 27.5 ? 22% | 27 ? 23% | 24 ? 32% |
| PWM Frequency (Hz) | ||||||
| Screen | -22% | -52% | -13% | -23% | 17% | |
| Brightness middle (cd/m²) | 387.2 | 443.5 15% | 498 29% | 449.6 16% | 250 -35% | 466 20% |
| Brightness (cd/m²) | 360 | 394 9% | 460 28% | 431 20% | 226 -37% | 454 26% |
| Brightness Distribution (%) | 80 | 78 -2% | 85 6% | 90 13% | 82 2% | 94 18% |
| Black Level * (cd/m²) | 0.26 | 0.17 35% | 0.53 -104% | 0.31 -19% | 0.215 17% | 0.23 12% |
| Contrast (:1) | 1489 | 2609 75% | 940 -37% | 1450 -3% | 1163 -22% | 2026 36% |
| Colorchecker dE 2000 * | 2.36 | 2.7 -14% | 3.65 -55% | 2.76 -17% | 3.59 -52% | 2.1 11% |
| Colorchecker dE 2000 max. * | 4.79 | 4.36 9% | 7.11 -48% | 7.96 -66% | 5.9 -23% | 4.5 6% |
| Colorchecker dE 2000 calibrated * | 0.63 | 2.61 -314% | 2.16 -243% | 0.58 8% | ||
| Greyscale dE 2000 * | 3 | 3.4 -13% | 4.25 -42% | 5.2 -73% | 3.99 -33% | 2.7 10% |
| Gamma | 2.17 101% | 2.09 105% | 2.45 90% | 2.23 99% | 2.98 74% | 2.08 106% |
| CCT | 6137 106% | 6144 106% | 6690 97% | 6475 100% | 6765 96% | 6210 105% |
| Color Space (Percent of AdobeRGB 1998) (%) | 62.1 | 61.1 | ||||
| Color Space (Percent of sRGB) (%) | 98.5 | 94.9 | ||||
| Moyenne finale (programmes/paramètres) | -14% /
-17% | -8% /
-29% | 5% /
-4% | -3% /
-15% | 15% /
17% |
* ... Moindre est la valeur, meilleures sont les performances
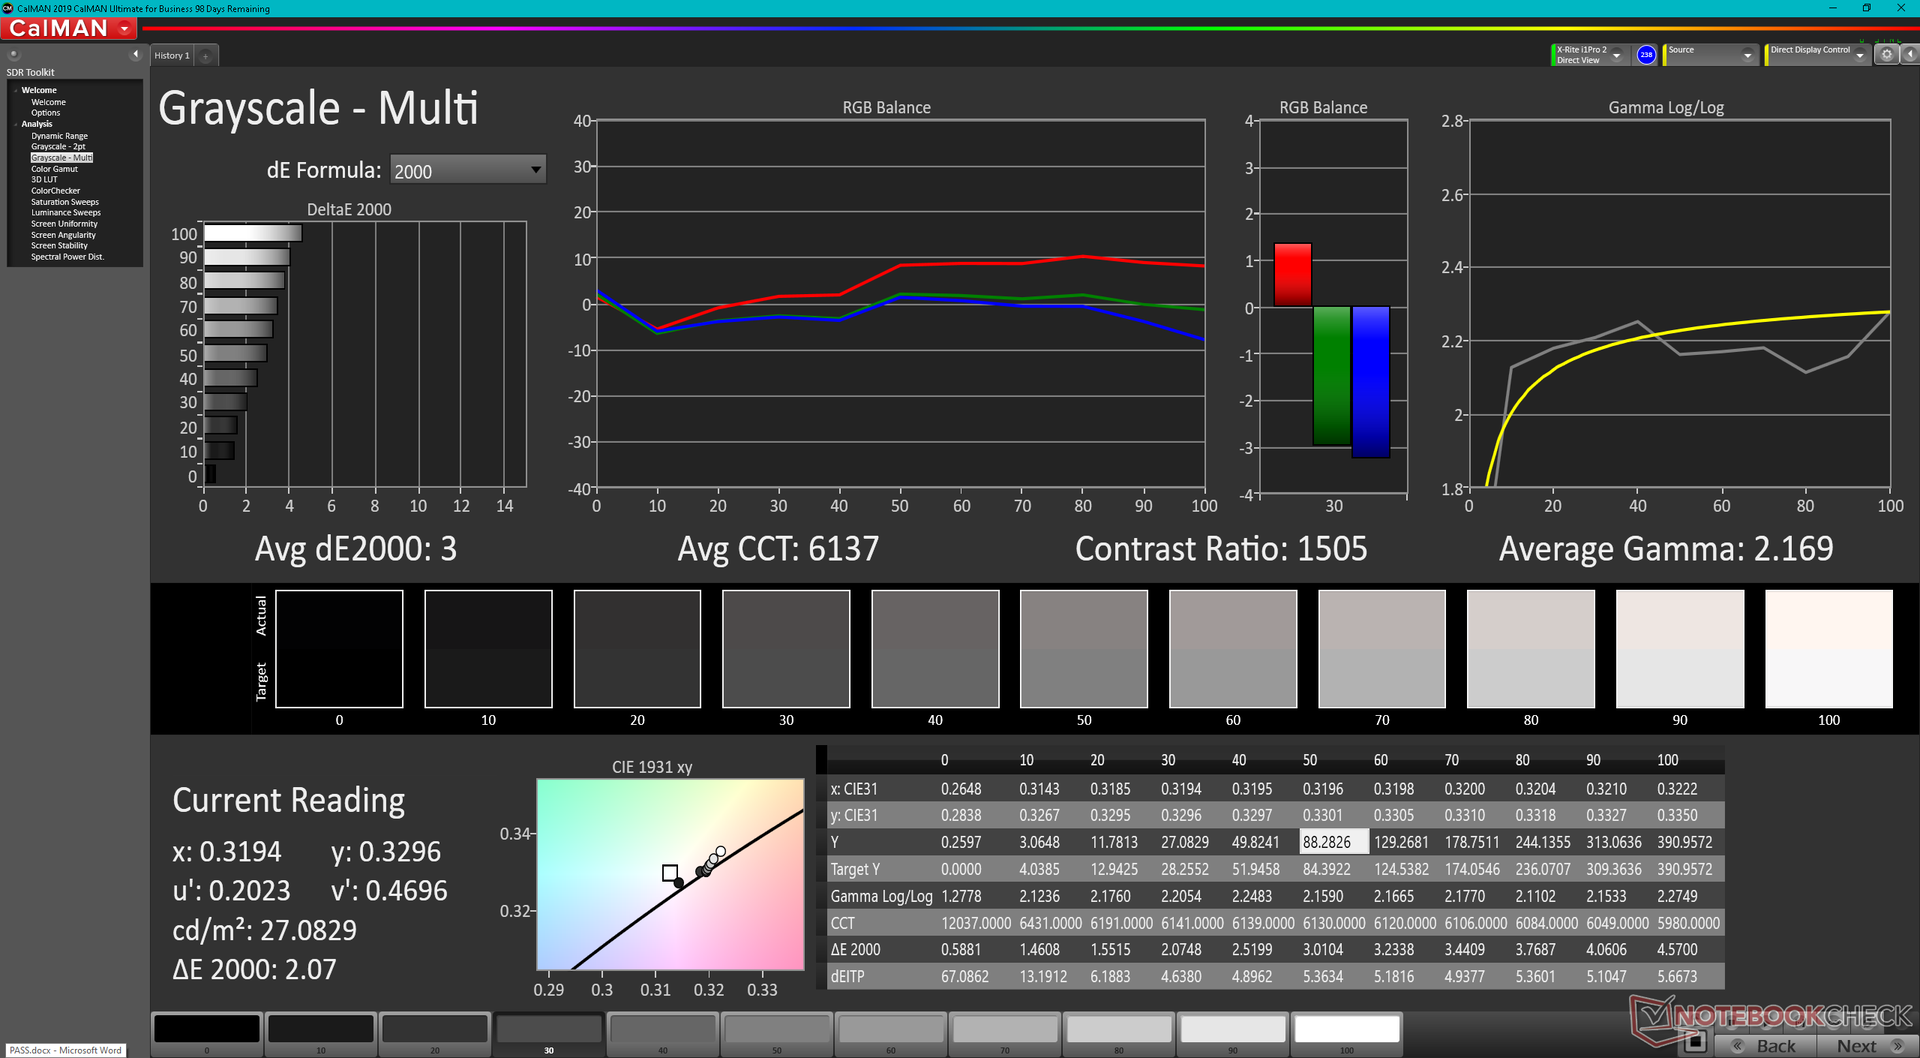
L'écran est correctement calibré, avec des valeurs moyennes de deltaE pour les niveaux de gris et les couleurs de 3 et 2,36, respectivement. En calibrant nous-mêmes l'écran, nous pourrions améliorer encore plus les valeurs DeltaE moyennes pour les ramener à moins de un chacune.
Temps de réponse de l'écran
| ↔ Temps de réponse noir à blanc | ||
|---|---|---|
| 35.2 ms ... hausse ↗ et chute ↘ combinées | ↗ 18.8 ms hausse | 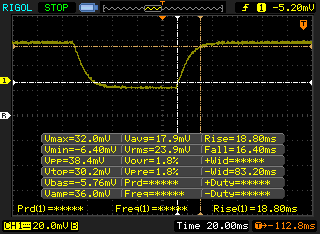 |
| ↘ 16.4 ms chute | ||
| L'écran souffre de latences très élevées, à éviter pour le jeu. En comparaison, tous les appareils testés affichent entre 0.1 (minimum) et 240 (maximum) ms. » 93 % des appareils testés affichent de meilleures performances. Cela signifie que les latences relevées sont moins bonnes que la moyenne (19.8 ms) de tous les appareils testés. | ||
| ↔ Temps de réponse gris 50% à gris 80% | ||
| 50.8 ms ... hausse ↗ et chute ↘ combinées | ↗ 27.2 ms hausse | 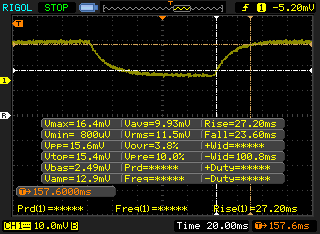 |
| ↘ 23.6 ms chute | ||
| L'écran souffre de latences très élevées, à éviter pour le jeu. En comparaison, tous les appareils testés affichent entre 0.165 (minimum) et 636 (maximum) ms. » 87 % des appareils testés affichent de meilleures performances. Cela signifie que les latences relevées sont moins bonnes que la moyenne (31 ms) de tous les appareils testés. | ||
Scintillement / MLI (Modulation de largeur d'impulsion)
| Scintillement / MLI (Modulation de largeur d'impulsion) non décelé | 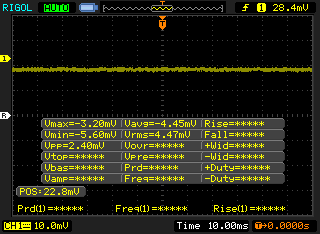 | ||
En comparaison, 52 % des appareils testés n'emploient pas MDI pour assombrir leur écran. Nous avons relevé une moyenne à 7757 (minimum : 5 - maximum : 343500) Hz dans le cas où une MDI était active. | |||
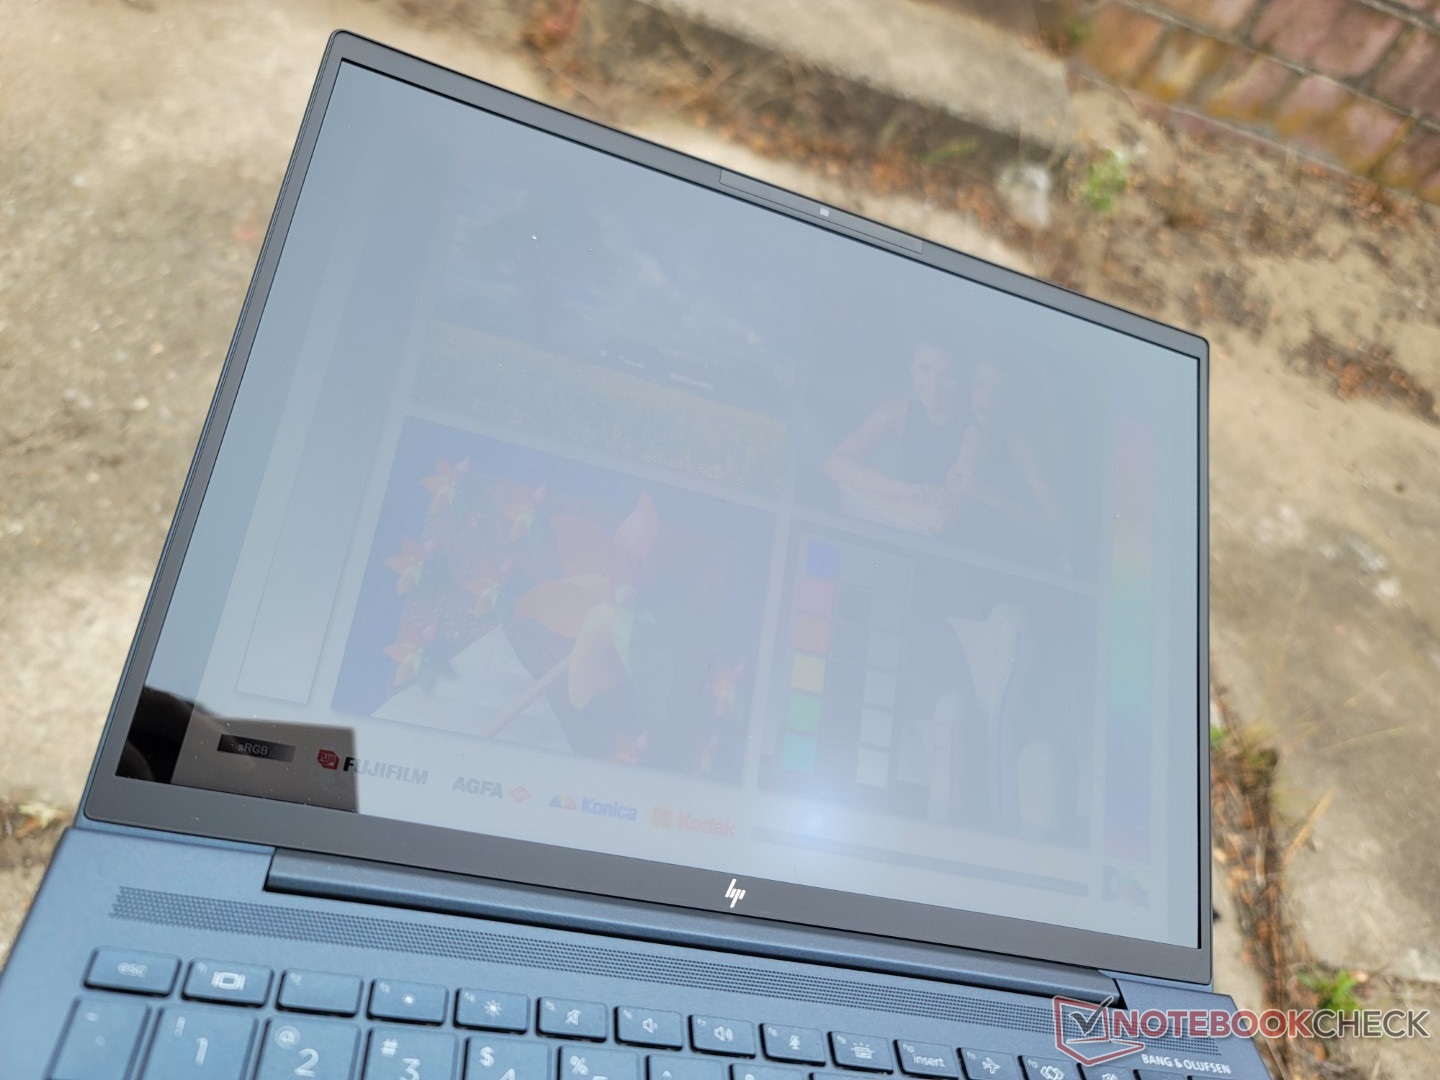
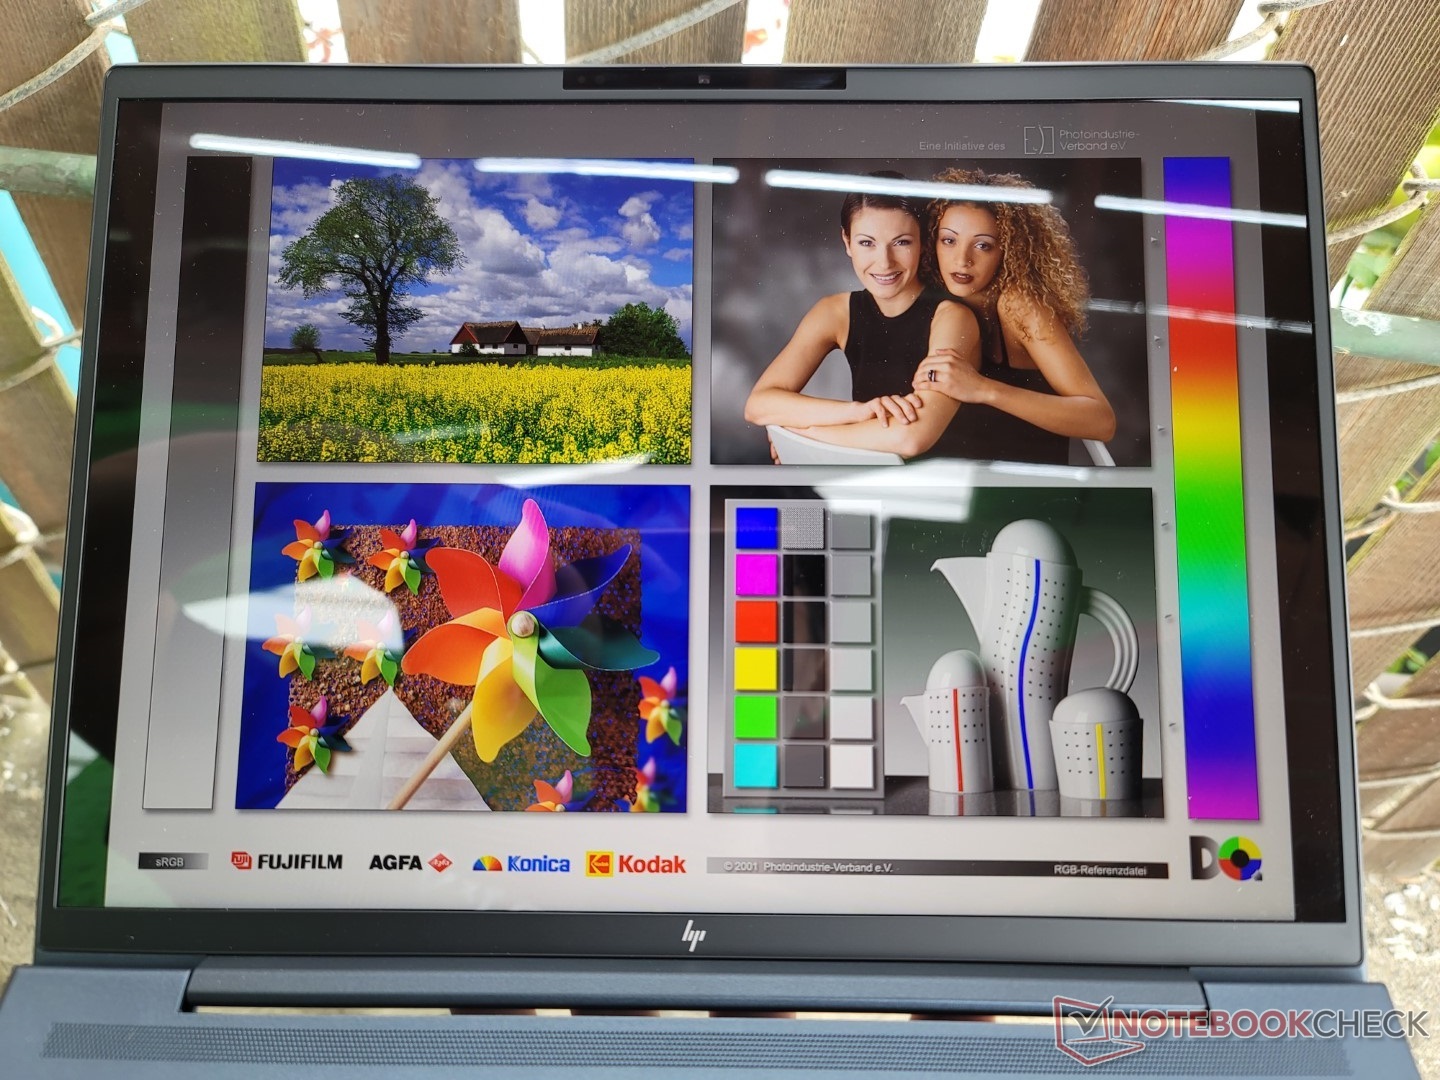
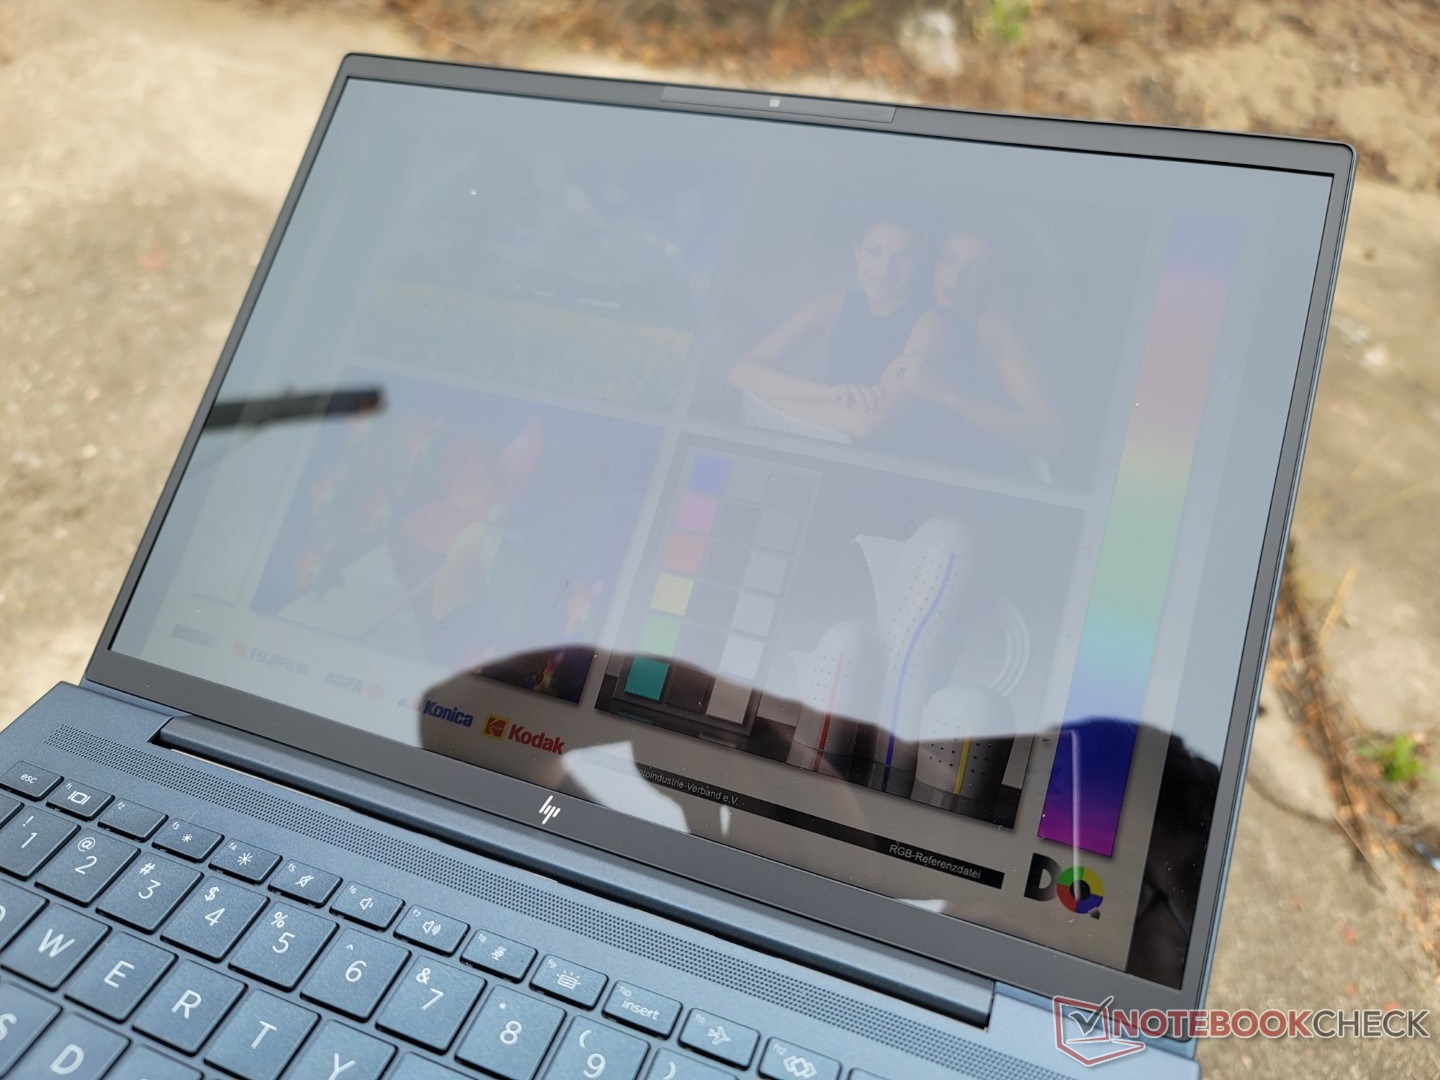
L'écran 400-nit de base est tout juste visible dans la plupart des conditions d'éclairage extérieur intense. HP propose sa dalle 1000-nit en option pour une meilleure visibilité en extérieur, mais elle est malheureusement liée à Sure View, ce qui peut être indésirable pour certains utilisateurs indésirable pour certains utilisateurs.
Performances - Intel 12e génération
Conditions d'essai
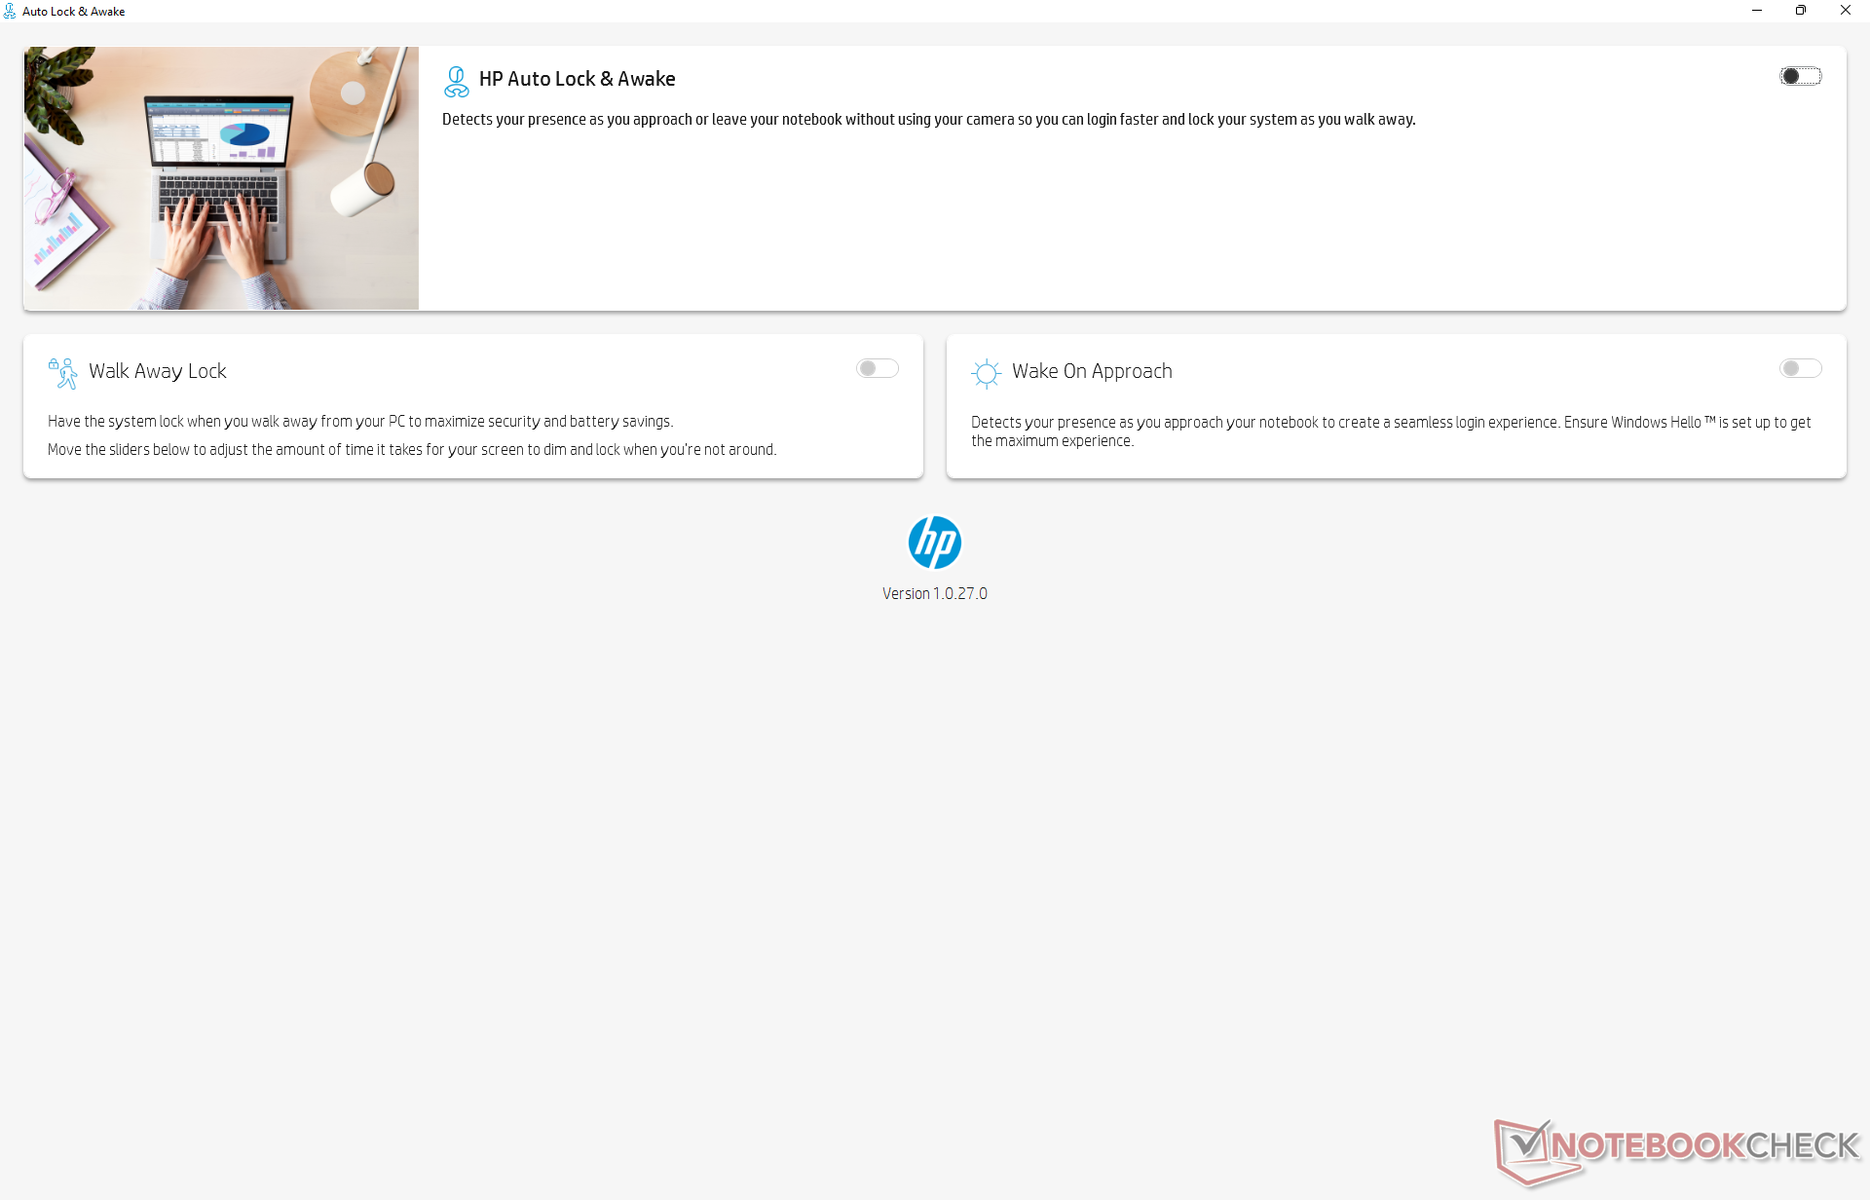
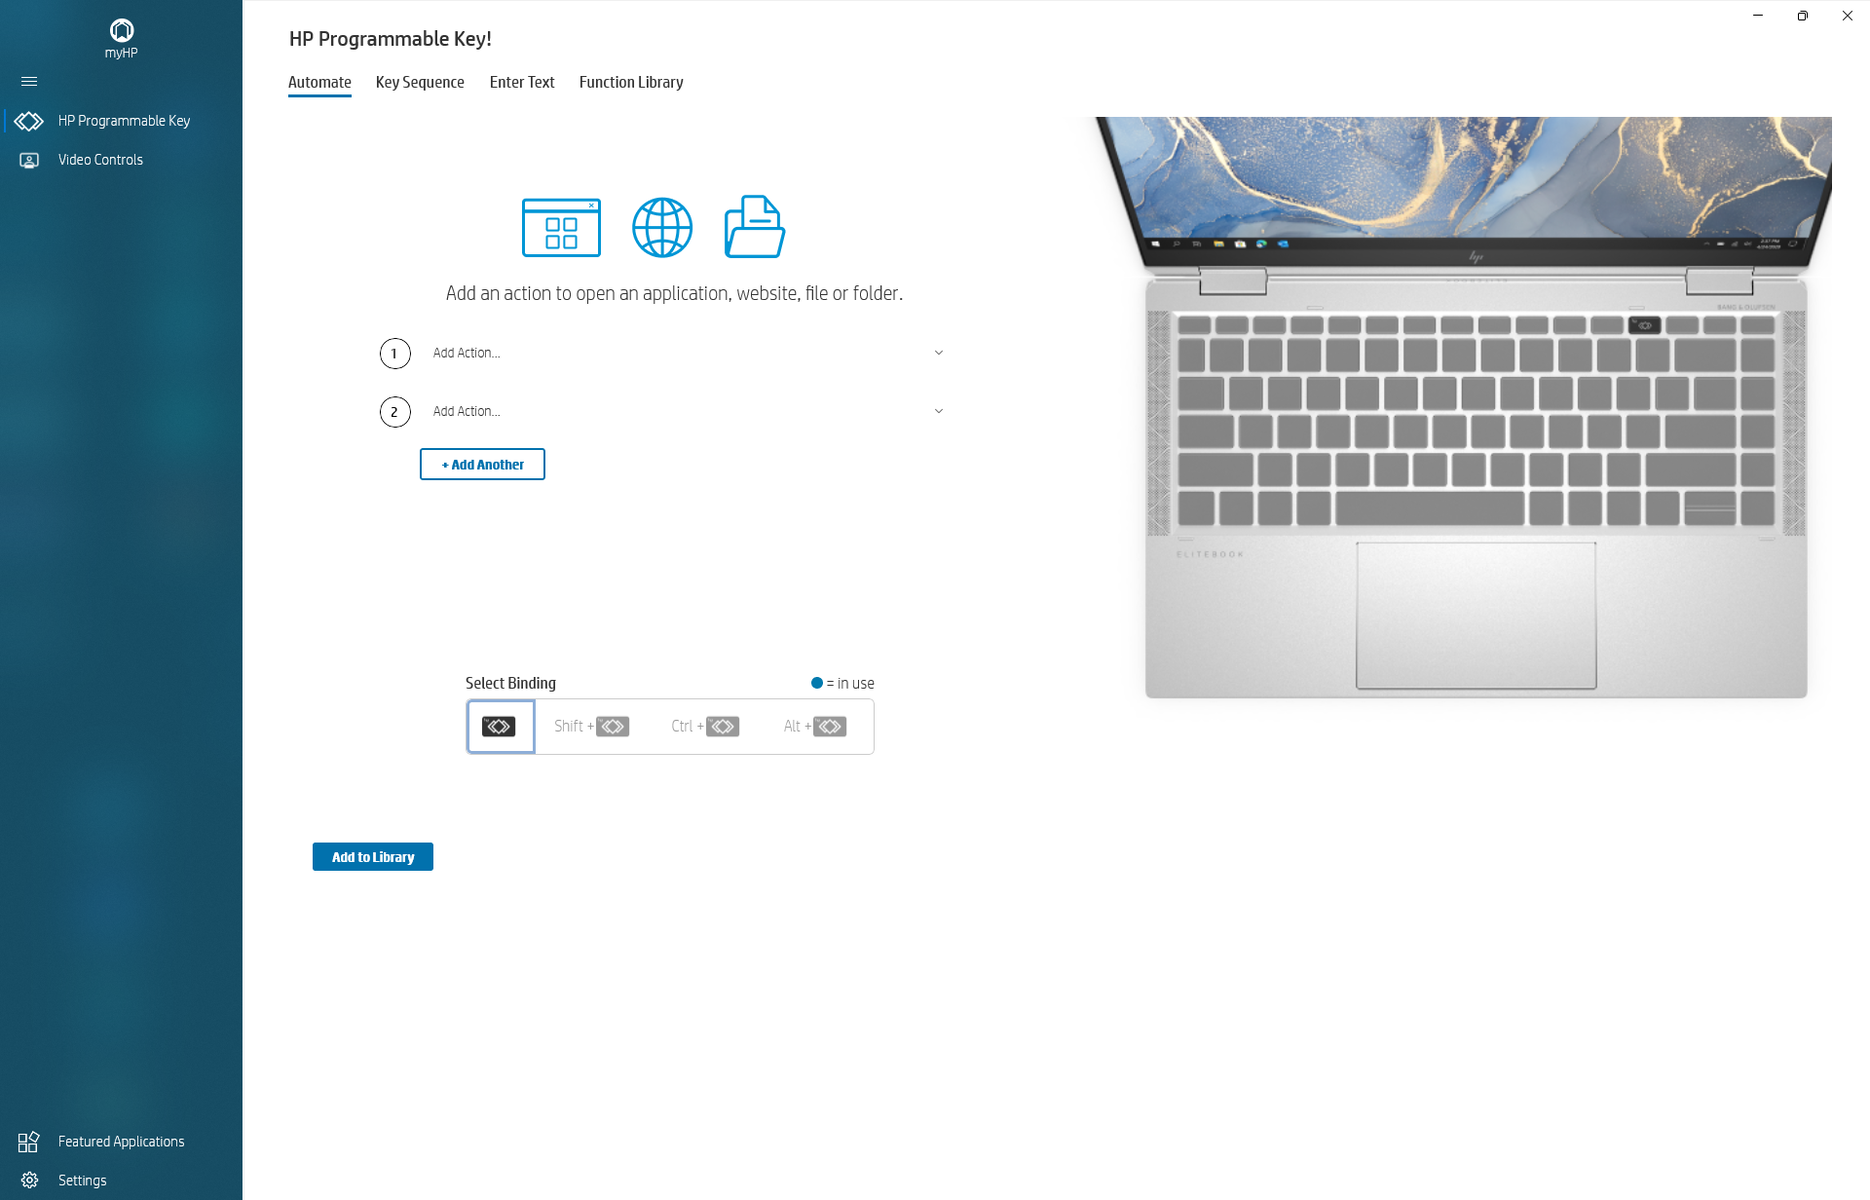
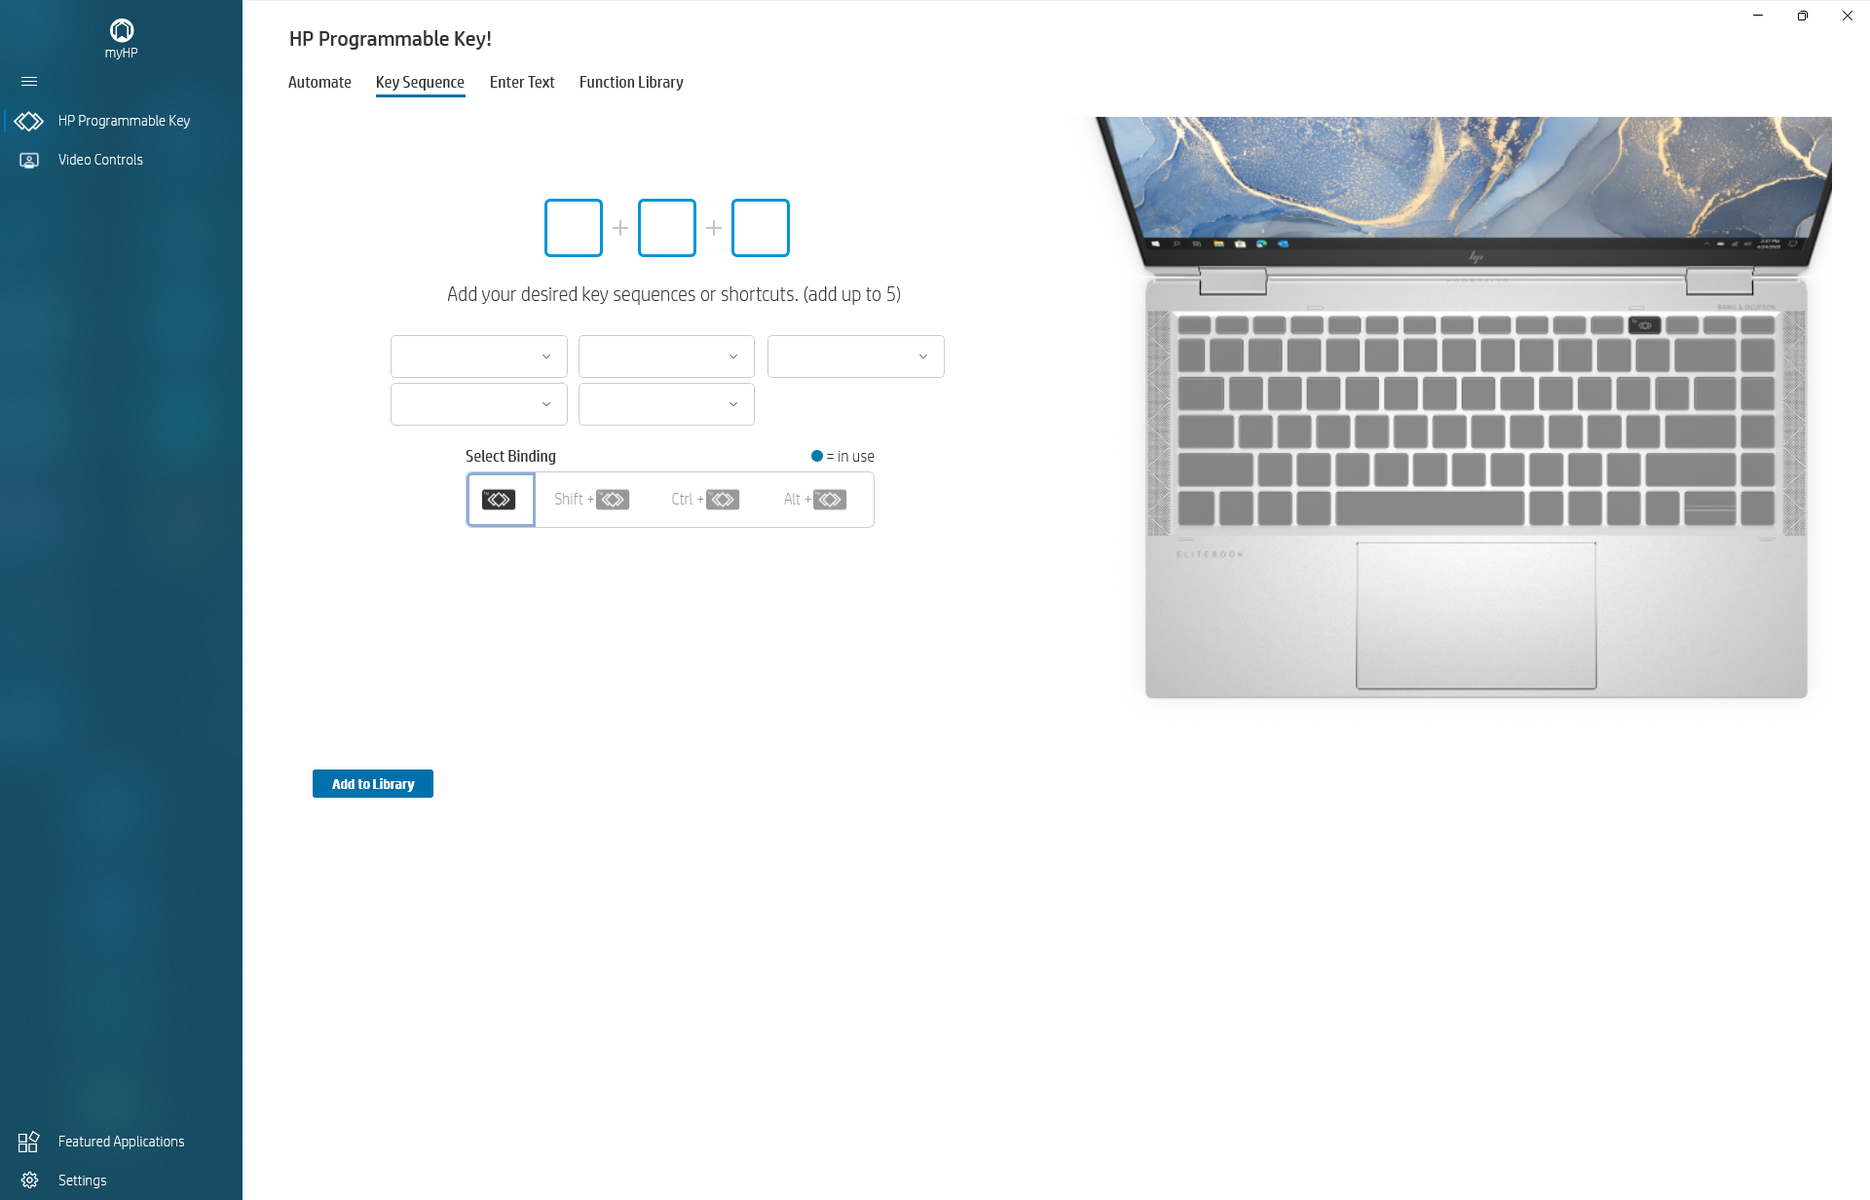
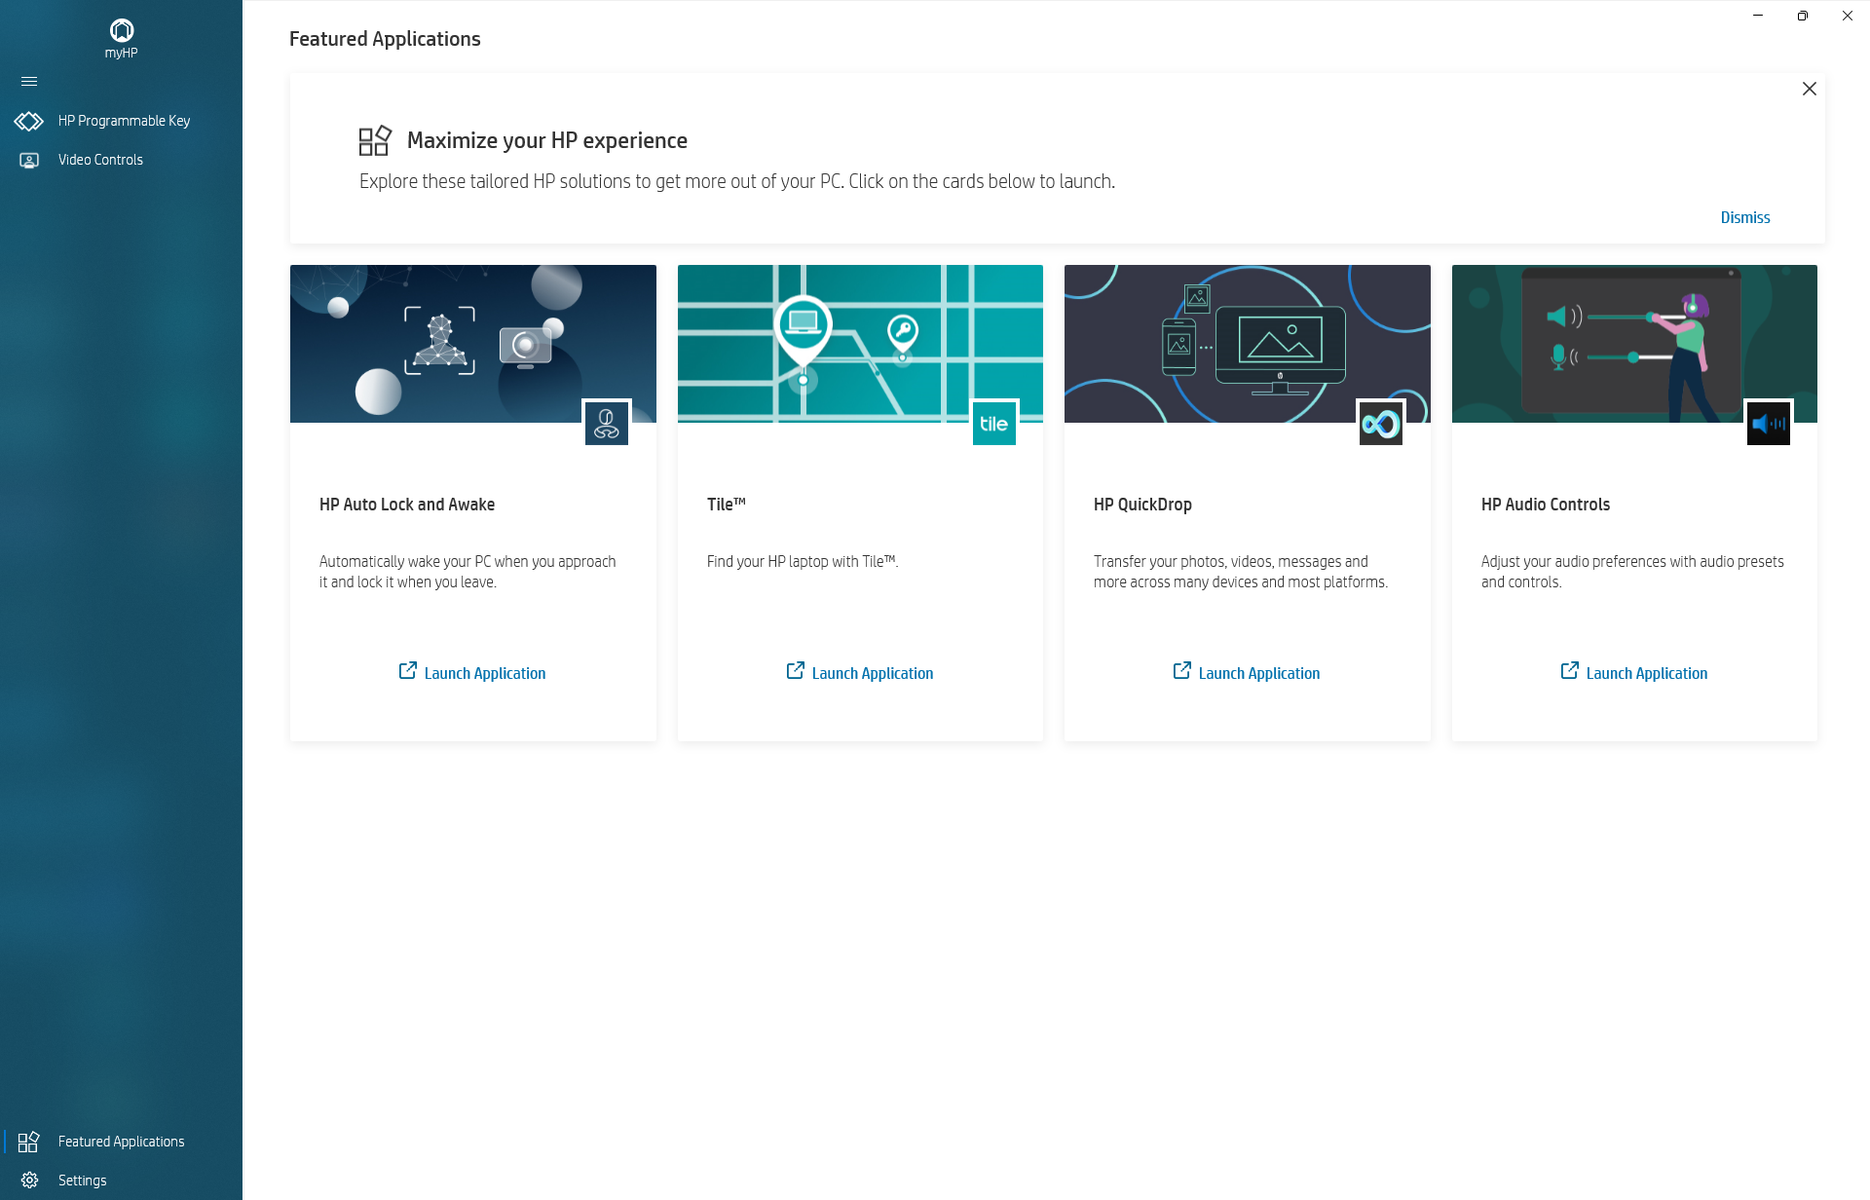
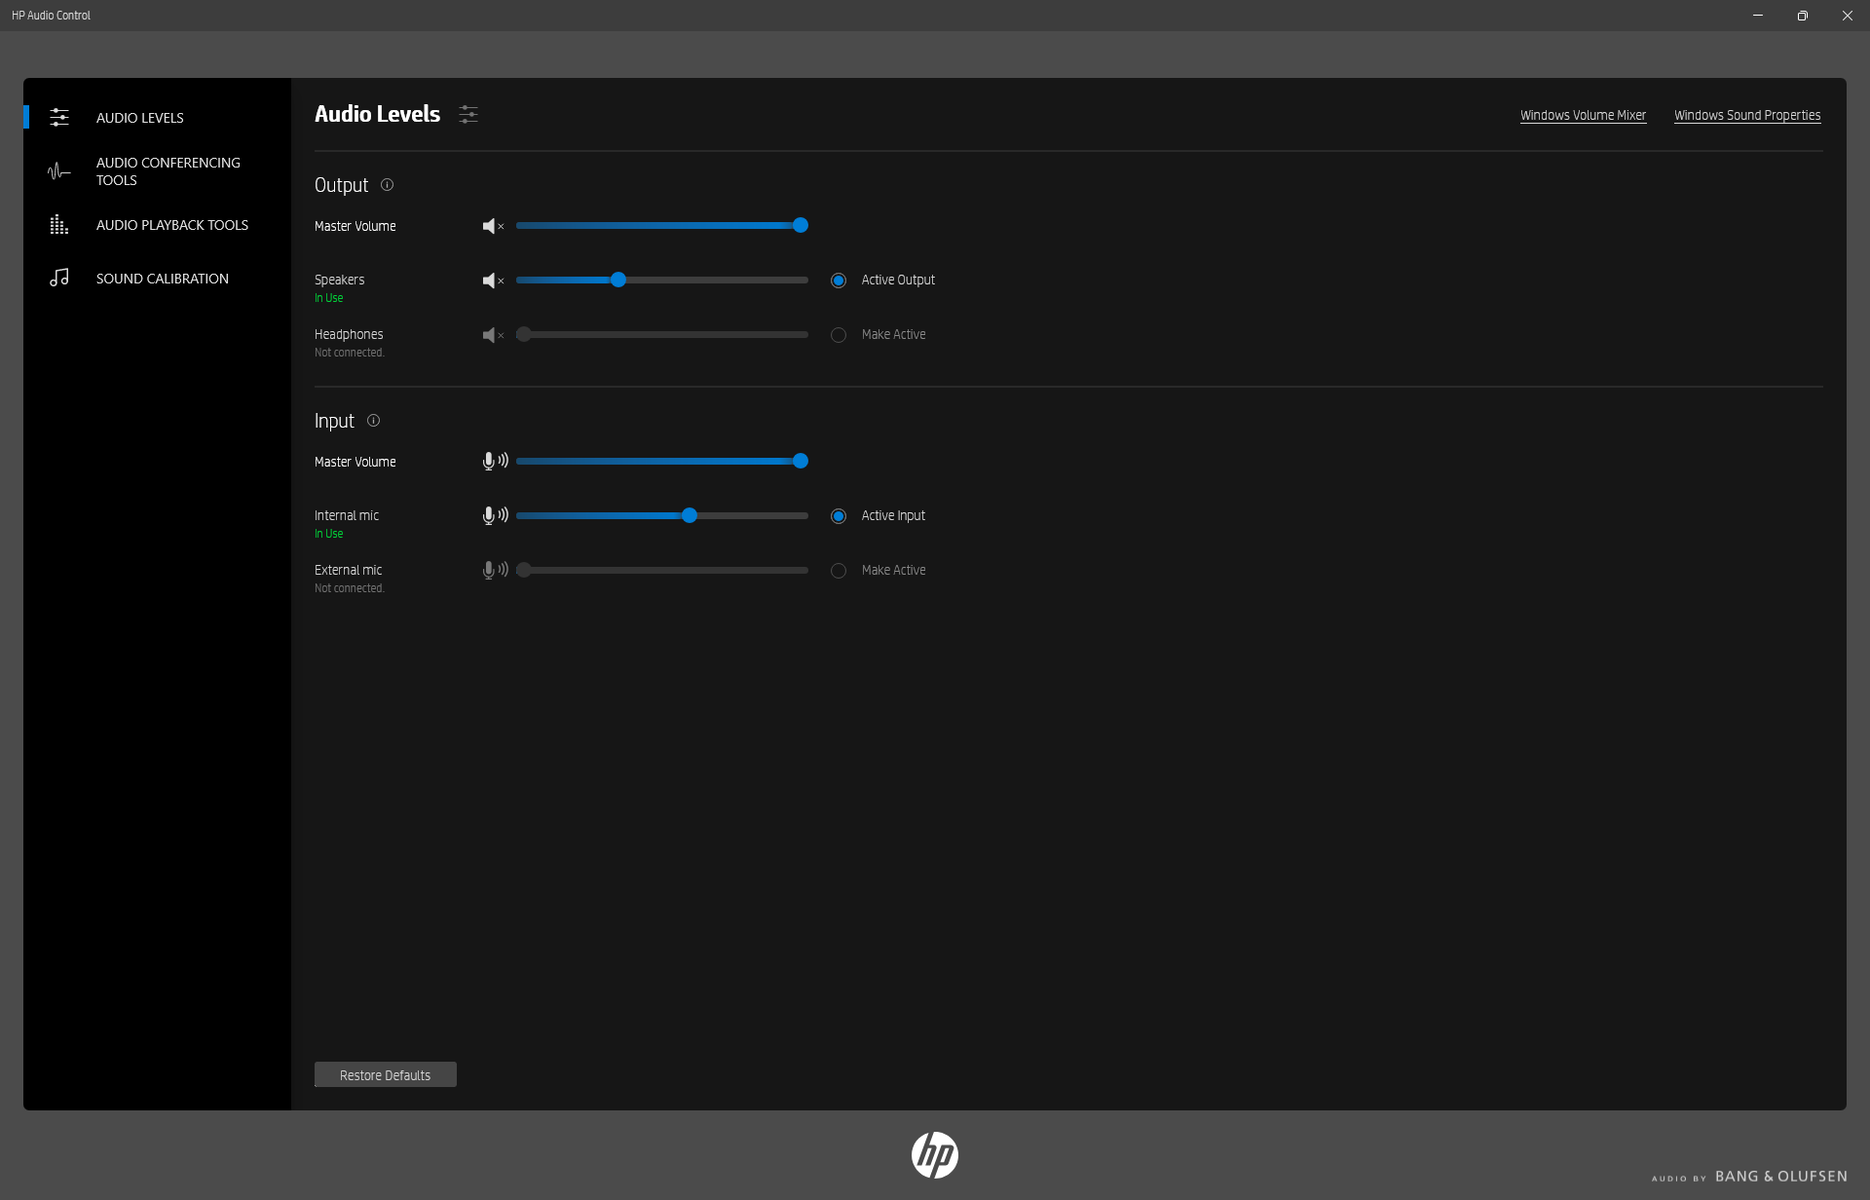
Notre appareil a été réglé en mode Performance via Windows avant d'exécuter les benchmarks ci-dessous. HP Command Center, qui est préinstallé sur les ordinateurs portables Spectre et Envy, n'est pas présent sur le Dragonfly axé sur les entreprises. Au lieu de cela, le modèle est livré avec HP Programmable Key, Auto Lock and Awake, Tile, QuickDrop, et les contrôles audio. Nous vous recommandons de vous familiariser avec la touche programmable et le verrouillage automatique et le réveil, car ce sont les fonctions les plus utiles pour le travail quotidien. Cette dernière utilise l'infrarouge pour se connecter ou se déconnecter automatiquement si elle détecte un utilisateur devant la caméra, comme les modèles haut de gamme de Dell Latitude. Vous trouverez ci-dessous quelques captures d'écran de certains de ces programmes.

Processeur
Sur les trois ordinateurs portables que nous avons testés jusqu'à présent avec le Core i7-1265Unotre Dragonfly G3 est le plus lent, et de loin. Le Core i7-1265U du Dragonfly G3 est le plus lent Dell Latitude 9430 2-en-1 surpasse notre HP de 20 % et 50 % dans les tests de référence à un et plusieurs fils, respectivement. En fait, le Core i7-1255U de notre Spectre x360 13.5 est 40 % plus rapide que notre Dragonfly G3 équipé d'un Core i7-1265U, même en tenant compte des limitations de performances
L'exécution de CineBench R15 xT en boucle révèle un potentiel limité de Turbo Boost, les performances du processeur chutant d'environ 19 % après la première boucle. Le même processeur dans le Latitude 7330 est capable de maintenir des scores plus élevés et donc des performances plus rapides pendant plus longtemps lorsqu'il est soumis au même test en boucle, comme le montre notre graphique de comparaison ci-dessous
Le passage du Core i7-1265U au Core i5-1235U devrait avoir un impact sur les performances d'environ 25 %.
Cinebench R15 Multi Loop
Cinebench R23: Multi Core | Single Core
Cinebench R15: CPU Multi 64Bit | CPU Single 64Bit
Blender: v2.79 BMW27 CPU
7-Zip 18.03: 7z b 4 | 7z b 4 -mmt1
Geekbench 5.5: Multi-Core | Single-Core
HWBOT x265 Benchmark v2.2: 4k Preset
LibreOffice : 20 Documents To PDF
R Benchmark 2.5: Overall mean
Cinebench R23: Multi Core | Single Core
Cinebench R15: CPU Multi 64Bit | CPU Single 64Bit
Blender: v2.79 BMW27 CPU
7-Zip 18.03: 7z b 4 | 7z b 4 -mmt1
Geekbench 5.5: Multi-Core | Single-Core
HWBOT x265 Benchmark v2.2: 4k Preset
LibreOffice : 20 Documents To PDF
R Benchmark 2.5: Overall mean
* ... Moindre est la valeur, meilleures sont les performances
AIDA64: FP32 Ray-Trace | FPU Julia | CPU SHA3 | CPU Queen | FPU SinJulia | FPU Mandel | CPU AES | CPU ZLib | FP64 Ray-Trace | CPU PhotoWorxx
| Performance rating | |
| Framework Laptop 13.5 12th Gen Intel | |
| Dell XPS 13 Plus 9320 i5-1240p | |
| Moyenne Intel Core i7-1265U | |
| HP Elite Dragonfly G3 | |
| Lenovo ThinkPad X1 Titanium Yoga G1 20QA001RGE | |
| AIDA64 / FP32 Ray-Trace | |
| Moyenne Intel Core i7-1265U (2619 - 8178, n=10) | |
| HP Elite Dragonfly G3 | |
| Framework Laptop 13.5 12th Gen Intel | |
| Dell XPS 13 Plus 9320 i5-1240p | |
| Lenovo ThinkPad X1 Titanium Yoga G1 20QA001RGE | |
| AIDA64 / FPU Julia | |
| Moyenne Intel Core i7-1265U (12909 - 41649, n=10) | |
| HP Elite Dragonfly G3 | |
| Framework Laptop 13.5 12th Gen Intel | |
| Dell XPS 13 Plus 9320 i5-1240p | |
| Lenovo ThinkPad X1 Titanium Yoga G1 20QA001RGE | |
| AIDA64 / CPU SHA3 | |
| Framework Laptop 13.5 12th Gen Intel | |
| Dell XPS 13 Plus 9320 i5-1240p | |
| Moyenne Intel Core i7-1265U (824 - 2183, n=10) | |
| HP Elite Dragonfly G3 | |
| Lenovo ThinkPad X1 Titanium Yoga G1 20QA001RGE | |
| AIDA64 / CPU Queen | |
| Framework Laptop 13.5 12th Gen Intel | |
| Dell XPS 13 Plus 9320 i5-1240p | |
| Moyenne Intel Core i7-1265U (63615 - 67065, n=10) | |
| HP Elite Dragonfly G3 | |
| Lenovo ThinkPad X1 Titanium Yoga G1 20QA001RGE | |
| AIDA64 / FPU SinJulia | |
| Framework Laptop 13.5 12th Gen Intel | |
| Dell XPS 13 Plus 9320 i5-1240p | |
| Moyenne Intel Core i7-1265U (3105 - 5135, n=10) | |
| HP Elite Dragonfly G3 | |
| Lenovo ThinkPad X1 Titanium Yoga G1 20QA001RGE | |
| AIDA64 / FPU Mandel | |
| Moyenne Intel Core i7-1265U (6967 - 20804, n=10) | |
| HP Elite Dragonfly G3 | |
| Framework Laptop 13.5 12th Gen Intel | |
| Dell XPS 13 Plus 9320 i5-1240p | |
| Lenovo ThinkPad X1 Titanium Yoga G1 20QA001RGE | |
| AIDA64 / CPU AES | |
| Framework Laptop 13.5 12th Gen Intel | |
| Lenovo ThinkPad X1 Titanium Yoga G1 20QA001RGE | |
| Dell XPS 13 Plus 9320 i5-1240p | |
| Moyenne Intel Core i7-1265U (19489 - 42966, n=10) | |
| HP Elite Dragonfly G3 | |
| AIDA64 / CPU ZLib | |
| Framework Laptop 13.5 12th Gen Intel | |
| Dell XPS 13 Plus 9320 i5-1240p | |
| Moyenne Intel Core i7-1265U (314 - 632, n=10) | |
| HP Elite Dragonfly G3 | |
| Lenovo ThinkPad X1 Titanium Yoga G1 20QA001RGE | |
| AIDA64 / FP64 Ray-Trace | |
| Moyenne Intel Core i7-1265U (1473 - 4376, n=10) | |
| HP Elite Dragonfly G3 | |
| Framework Laptop 13.5 12th Gen Intel | |
| Dell XPS 13 Plus 9320 i5-1240p | |
| Lenovo ThinkPad X1 Titanium Yoga G1 20QA001RGE | |
| AIDA64 / CPU PhotoWorxx | |
| Lenovo ThinkPad X1 Titanium Yoga G1 20QA001RGE | |
| HP Elite Dragonfly G3 | |
| Dell XPS 13 Plus 9320 i5-1240p | |
| Moyenne Intel Core i7-1265U (20213 - 47031, n=10) | |
| Framework Laptop 13.5 12th Gen Intel | |
Performance du système
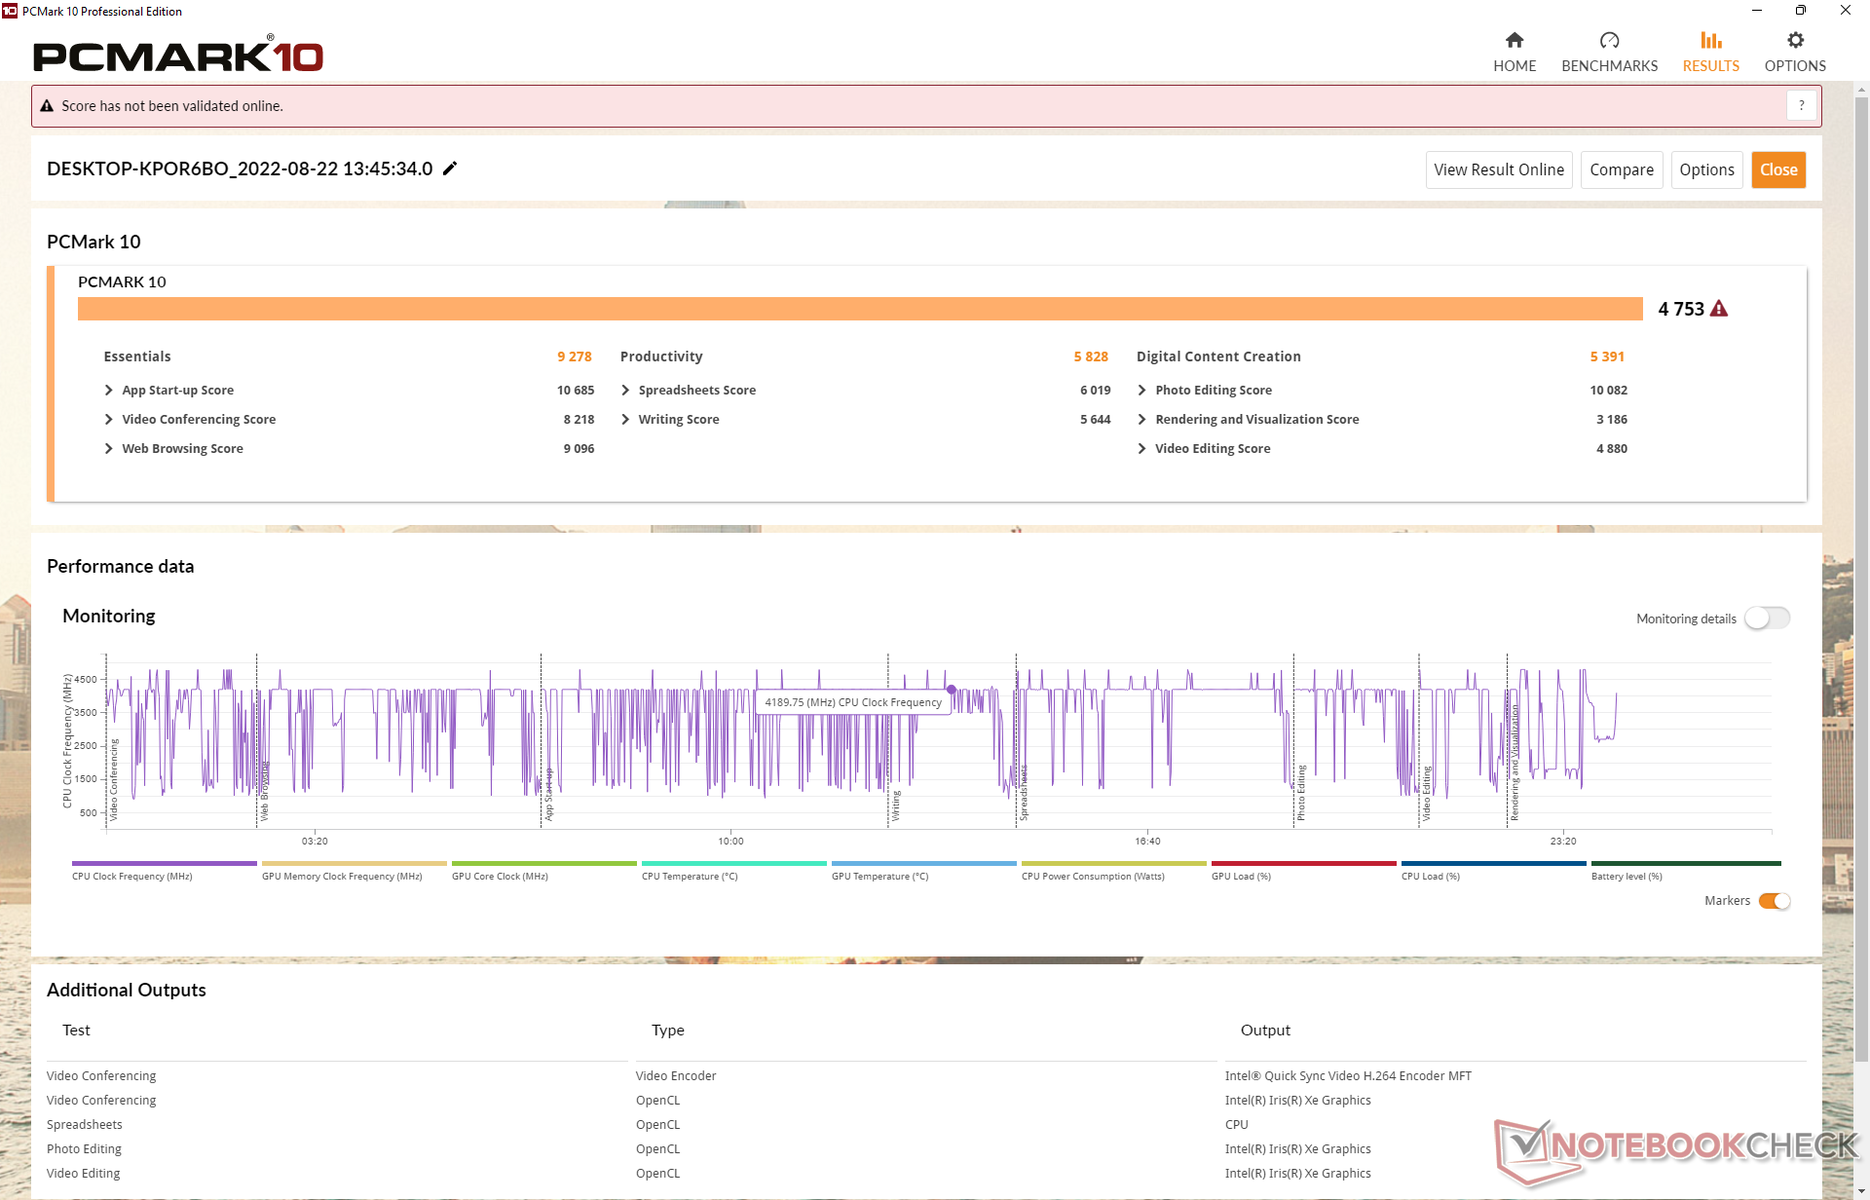
Il est intéressant de noter que les résultats PCMark sont légèrement inférieurs à ceux que nous avons enregistrés sur le Spectre x360 14 équipé du processeur Core i7 de dernière génération. Ne vous attendez pas à ce que le Dragonfly G3 soit sensiblement plus rapide lors de la navigation, du streaming vidéo ou d'autres charges de travail peu exigeantes.
CrossMark: Overall | Productivity | Creativity | Responsiveness
| PCMark 10 / Score | |
| Framework Laptop 13.5 12th Gen Intel | |
| Moyenne Intel Core i7-1265U, Intel Iris Xe Graphics G7 96EUs (4753 - 5766, n=7) | |
| HP Spectre x360 14t-ea000 | |
| Dell XPS 13 Plus 9320 i5-1240p | |
| HP Elite Dragonfly G3 | |
| Lenovo ThinkPad X1 Titanium Yoga G1 20QA001RGE | |
| PCMark 10 / Essentials | |
| Framework Laptop 13.5 12th Gen Intel | |
| Moyenne Intel Core i7-1265U, Intel Iris Xe Graphics G7 96EUs (9278 - 11418, n=7) | |
| Lenovo ThinkPad X1 Titanium Yoga G1 20QA001RGE | |
| HP Spectre x360 14t-ea000 | |
| HP Elite Dragonfly G3 | |
| Dell XPS 13 Plus 9320 i5-1240p | |
| PCMark 10 / Productivity | |
| Framework Laptop 13.5 12th Gen Intel | |
| HP Spectre x360 14t-ea000 | |
| Moyenne Intel Core i7-1265U, Intel Iris Xe Graphics G7 96EUs (5828 - 7311, n=7) | |
| Lenovo ThinkPad X1 Titanium Yoga G1 20QA001RGE | |
| Dell XPS 13 Plus 9320 i5-1240p | |
| HP Elite Dragonfly G3 | |
| PCMark 10 / Digital Content Creation | |
| Framework Laptop 13.5 12th Gen Intel | |
| Moyenne Intel Core i7-1265U, Intel Iris Xe Graphics G7 96EUs (5127 - 6330, n=7) | |
| Dell XPS 13 Plus 9320 i5-1240p | |
| HP Elite Dragonfly G3 | |
| HP Spectre x360 14t-ea000 | |
| Lenovo ThinkPad X1 Titanium Yoga G1 20QA001RGE | |
| CrossMark / Overall | |
| Framework Laptop 13.5 12th Gen Intel | |
| Moyenne Intel Core i7-1265U, Intel Iris Xe Graphics G7 96EUs (1301 - 1615, n=7) | |
| Dell XPS 13 Plus 9320 i5-1240p | |
| HP Elite Dragonfly G3 | |
| CrossMark / Productivity | |
| Framework Laptop 13.5 12th Gen Intel | |
| Moyenne Intel Core i7-1265U, Intel Iris Xe Graphics G7 96EUs (1230 - 1586, n=7) | |
| Dell XPS 13 Plus 9320 i5-1240p | |
| HP Elite Dragonfly G3 | |
| CrossMark / Creativity | |
| Framework Laptop 13.5 12th Gen Intel | |
| Moyenne Intel Core i7-1265U, Intel Iris Xe Graphics G7 96EUs (1413 - 1706, n=7) | |
| Dell XPS 13 Plus 9320 i5-1240p | |
| HP Elite Dragonfly G3 | |
| CrossMark / Responsiveness | |
| Framework Laptop 13.5 12th Gen Intel | |
| Moyenne Intel Core i7-1265U, Intel Iris Xe Graphics G7 96EUs (1193 - 1521, n=7) | |
| Dell XPS 13 Plus 9320 i5-1240p | |
| HP Elite Dragonfly G3 | |
| PCMark 10 Score | 4753 points | |
Aide | ||
| AIDA64 / Memory Copy | |
| HP Elite Dragonfly G3 | |
| Dell XPS 13 Plus 9320 i5-1240p | |
| Moyenne Intel Core i7-1265U (40212 - 72204, n=10) | |
| Lenovo ThinkPad X1 Titanium Yoga G1 20QA001RGE | |
| Framework Laptop 13.5 12th Gen Intel | |
| AIDA64 / Memory Read | |
| Dell XPS 13 Plus 9320 i5-1240p | |
| HP Elite Dragonfly G3 | |
| Lenovo ThinkPad X1 Titanium Yoga G1 20QA001RGE | |
| Moyenne Intel Core i7-1265U (41808 - 69493, n=10) | |
| Framework Laptop 13.5 12th Gen Intel | |
| AIDA64 / Memory Write | |
| Lenovo ThinkPad X1 Titanium Yoga G1 20QA001RGE | |
| Dell XPS 13 Plus 9320 i5-1240p | |
| Moyenne Intel Core i7-1265U (41382 - 76027, n=10) | |
| HP Elite Dragonfly G3 | |
| Framework Laptop 13.5 12th Gen Intel | |
| AIDA64 / Memory Latency | |
| HP Elite Dragonfly G3 | |
| Moyenne Intel Core i7-1265U (74.6 - 112.4, n=10) | |
| Lenovo ThinkPad X1 Titanium Yoga G1 20QA001RGE | |
| Framework Laptop 13.5 12th Gen Intel | |
* ... Moindre est la valeur, meilleures sont les performances
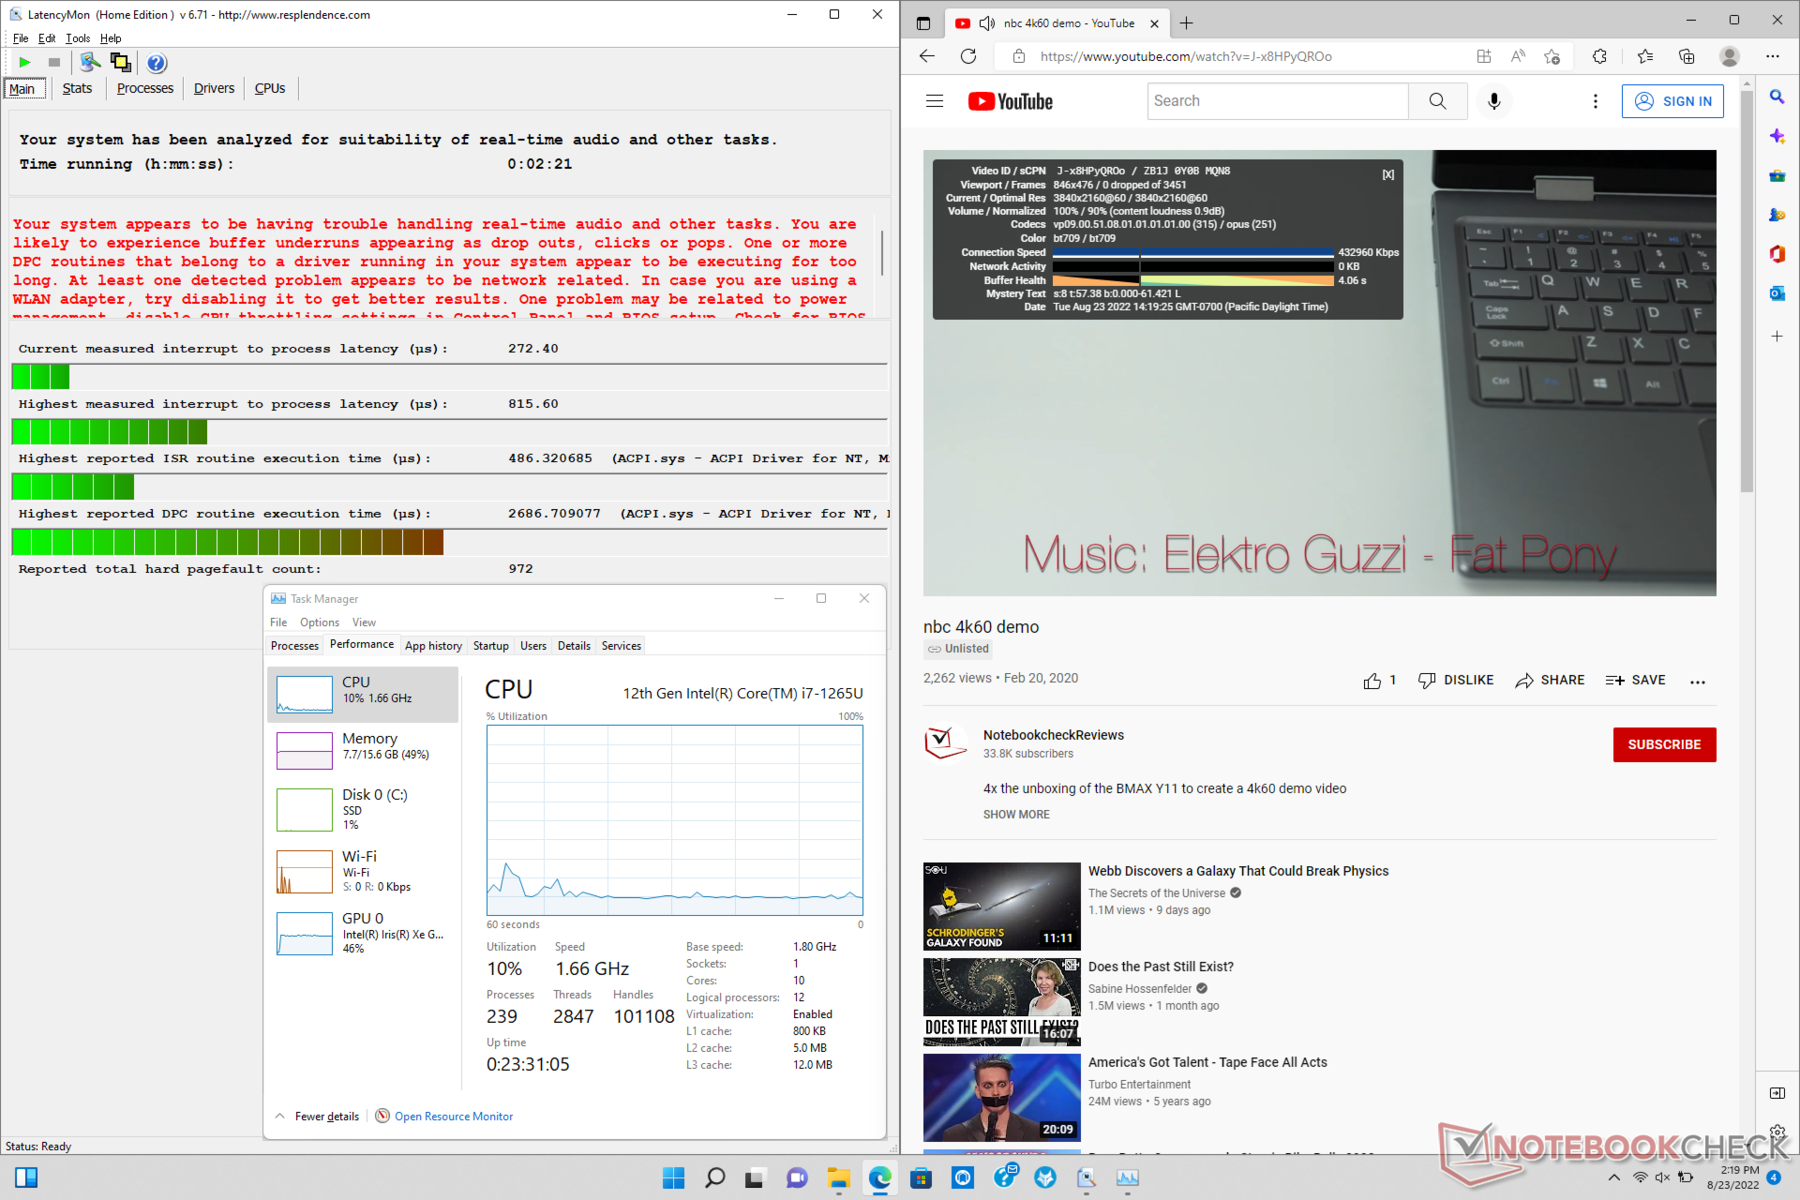
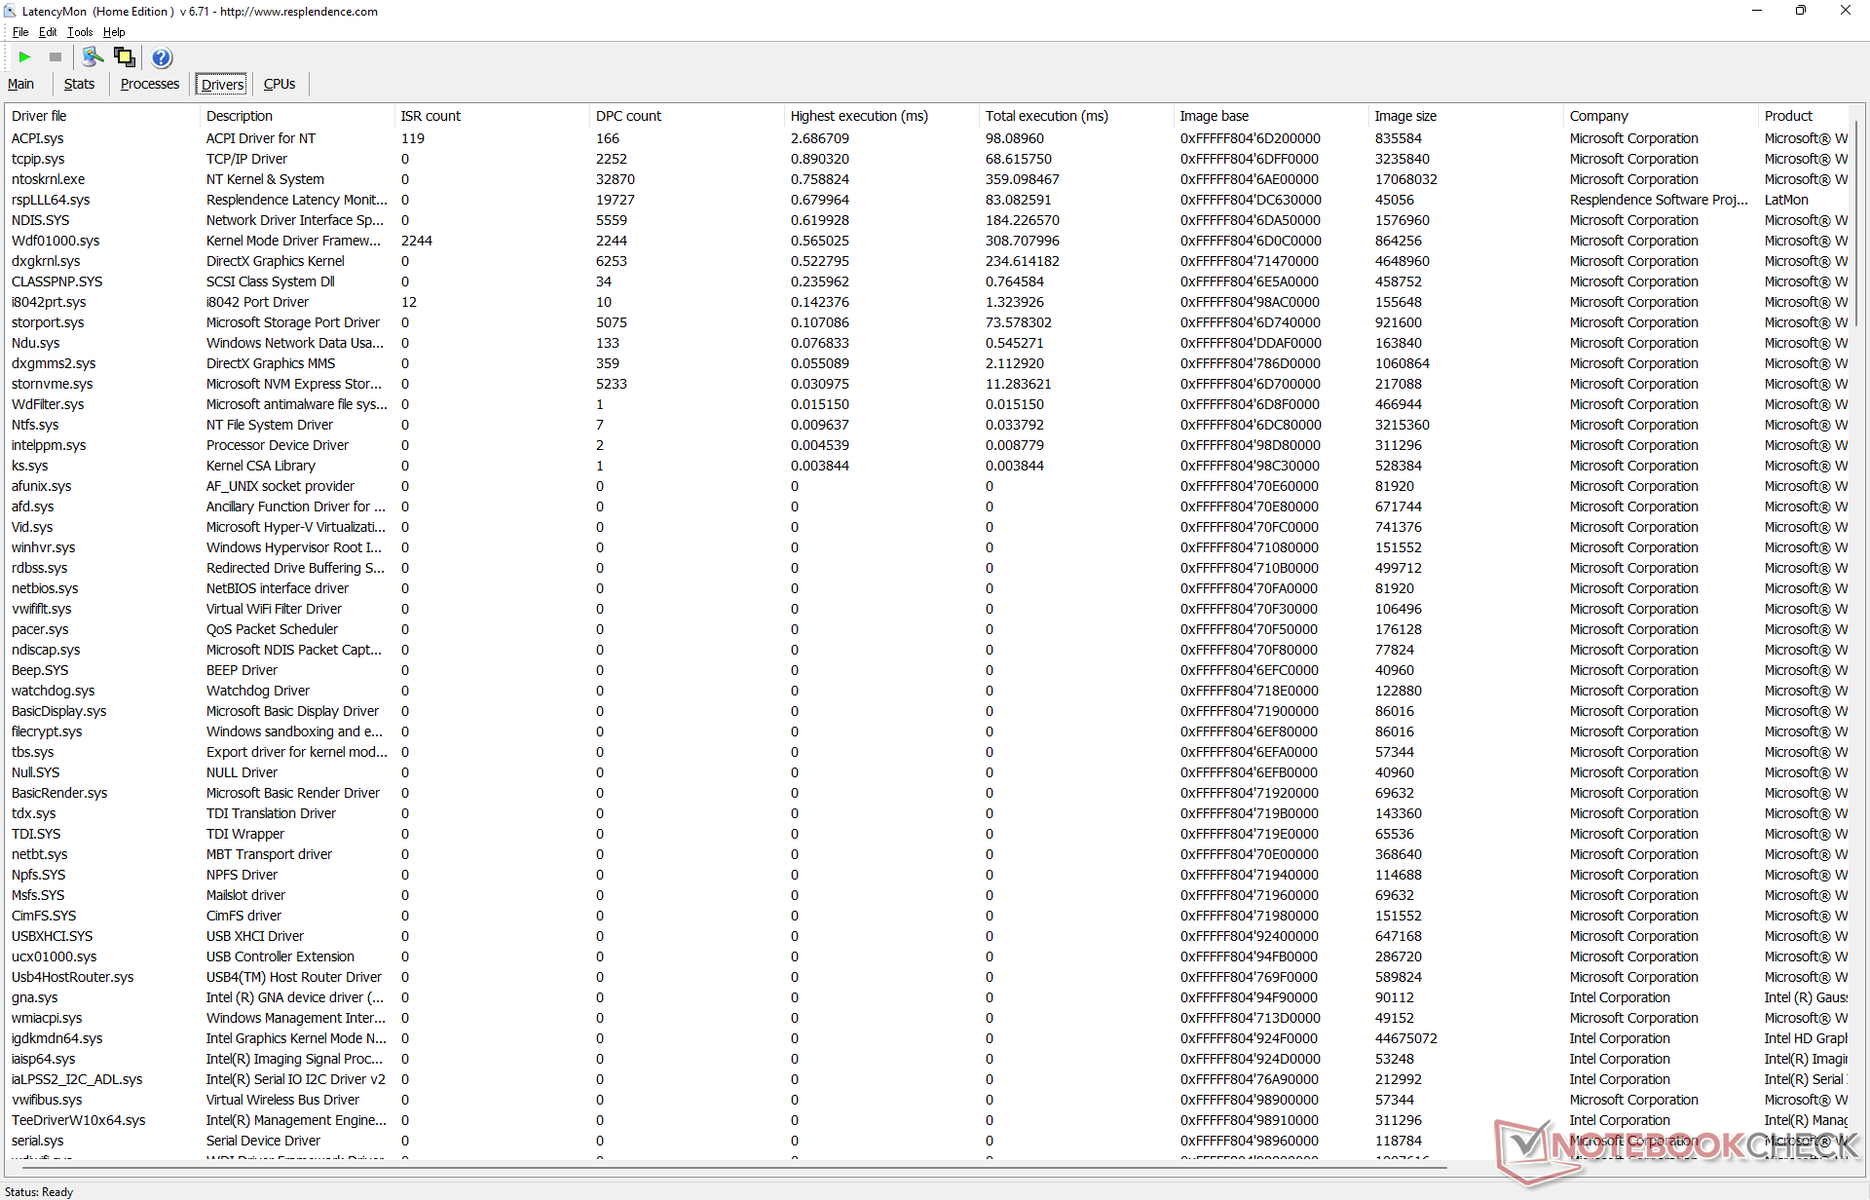
Latence DPC
LatencyMon révèle des problèmes de CPD lors de l'ouverture de plusieurs onglets de navigateur de notre page d'accueil. la lecture de vidéos 4K à 60 FPS est par ailleurs parfaite, sans aucune perte d'images pendant nos tests.
| DPC Latencies / LatencyMon - interrupt to process latency (max), Web, Youtube, Prime95 | |
| Dell XPS 13 Plus 9320 i5-1240p | |
| HP Spectre x360 14t-ea000 | |
| Lenovo ThinkPad X1 Titanium Yoga G1 20QA001RGE | |
| Framework Laptop 13.5 12th Gen Intel | |
| HP Elite Dragonfly G3 | |
* ... Moindre est la valeur, meilleures sont les performances
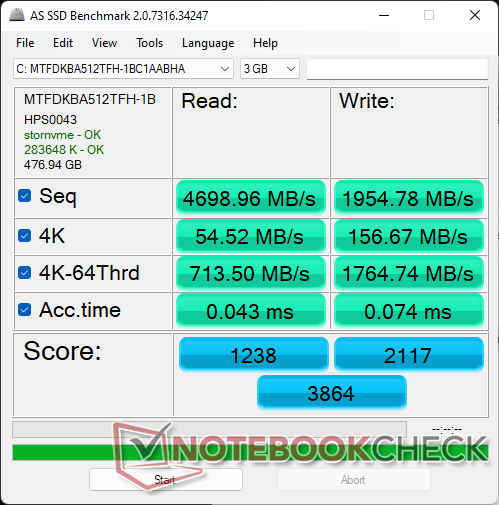
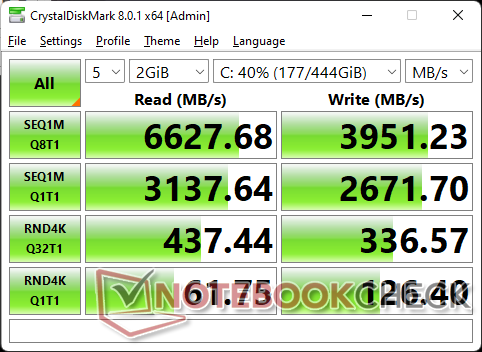
Périphériques de stockage
HP propose des options de SSD allant de 256 Go à 1 To OPAL2 NVMe. Notre configuration spécifique est équipée du 512 Go Micron MTFDKBA512TFH PCIe4 SSD pour des taux de lecture et d'écriture séquentiels d'environ 6500 Mo/s et 4000 Mo/s, respectivement. Le disque ne présenterait aucun problème majeur d'étranglement des performances lors de l'exécution de DiskSpd en boucle.

* ... Moindre est la valeur, meilleures sont les performances
Disk Throttling: DiskSpd Read Loop, Queue Depth 8
Performances du GPU
Le système intégré Iris Xe 96 EUs intégré a des performances conformes à nos attentes par rapport aux autres ordinateurs portables équipés du même GPU. C'est une bonne chose car cela signifie que HP n'a pas trop limité artificiellement les performances graphiques, mais c'est aussi décevant car cela signifie que les utilisateurs ne doivent pas s'attendre à des gains significatifs du GPU par rapport à la dernière génération de Core i7-1165G7.
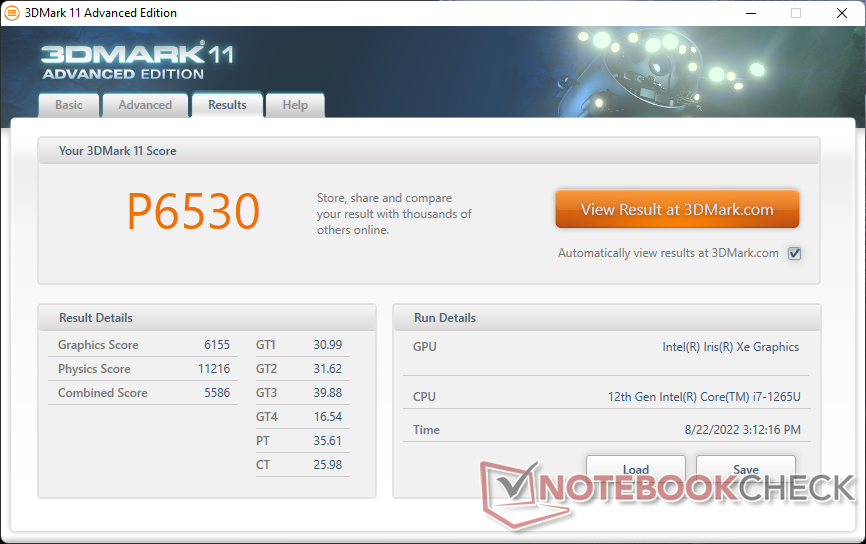
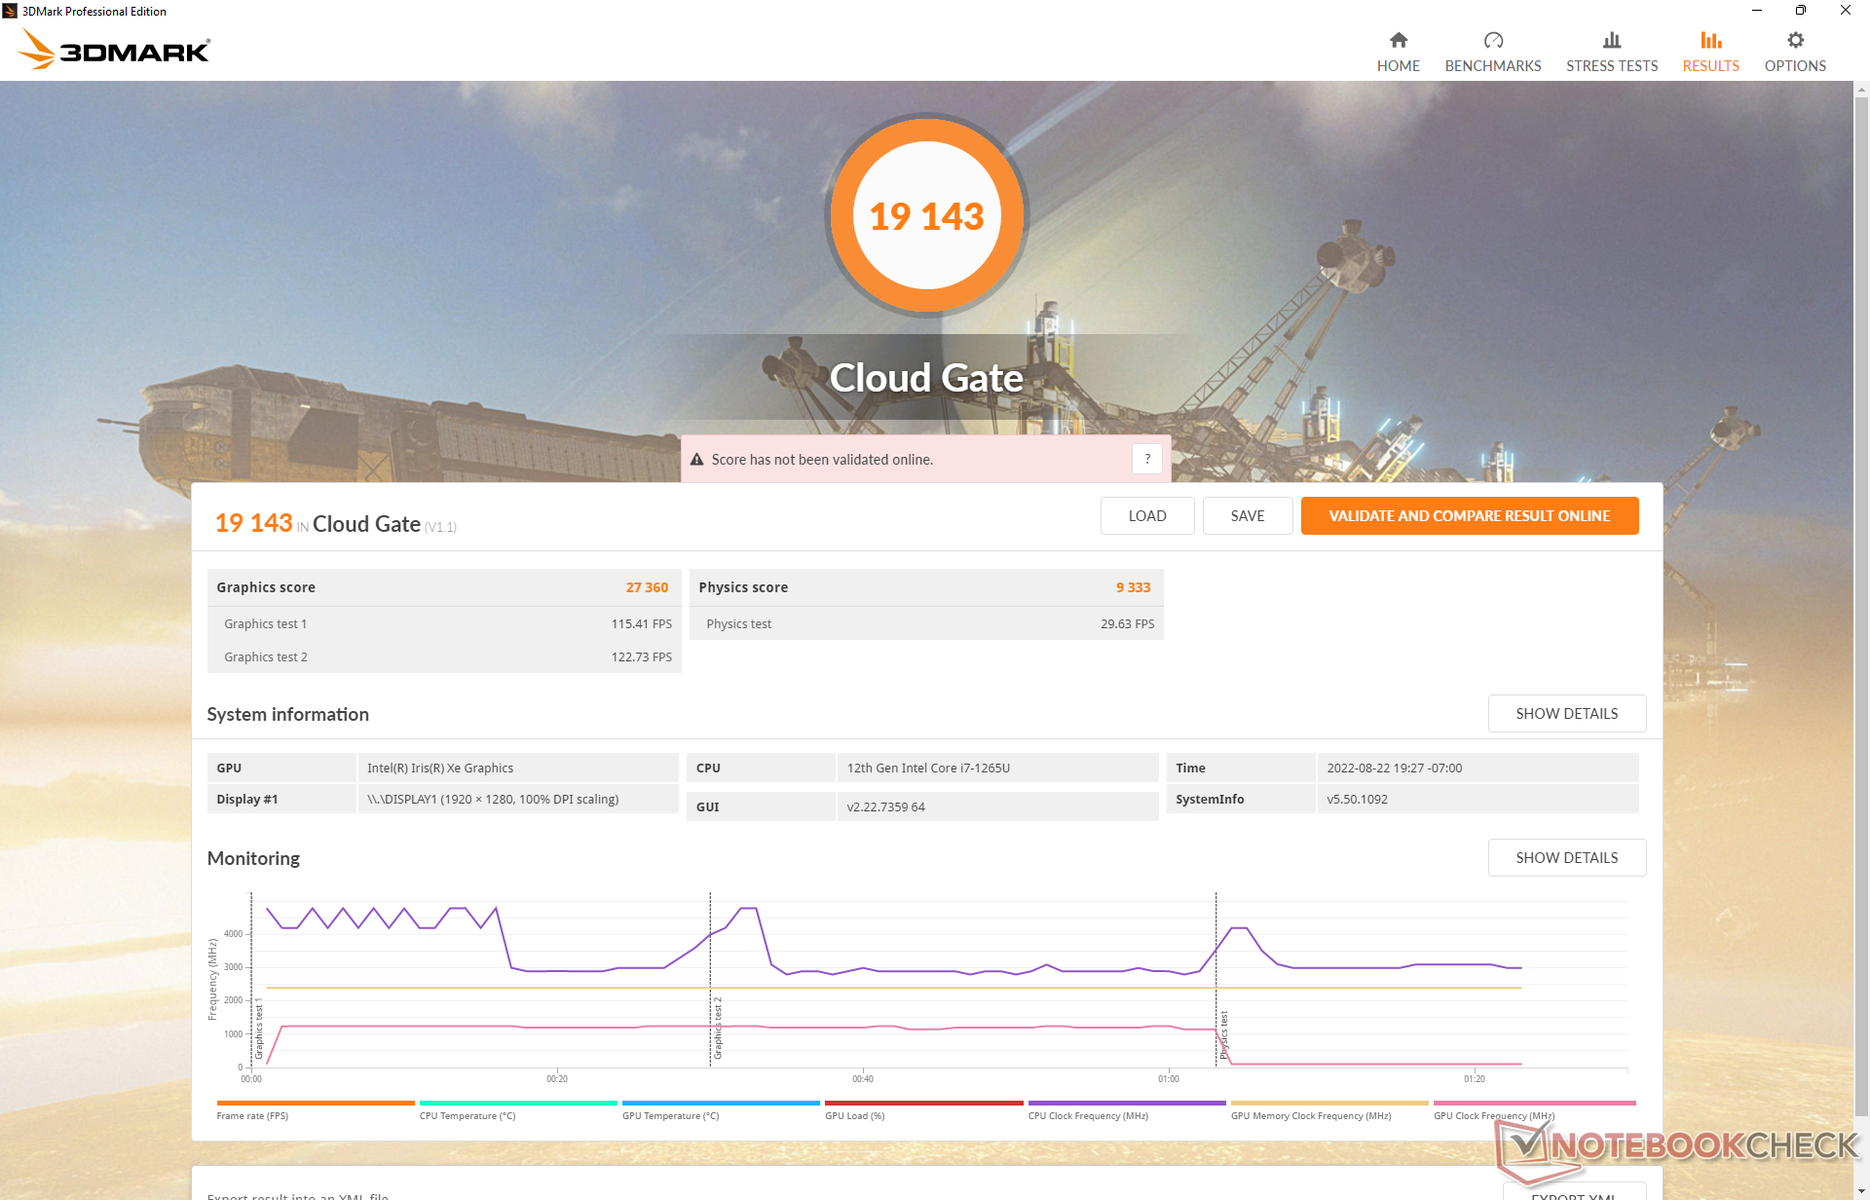
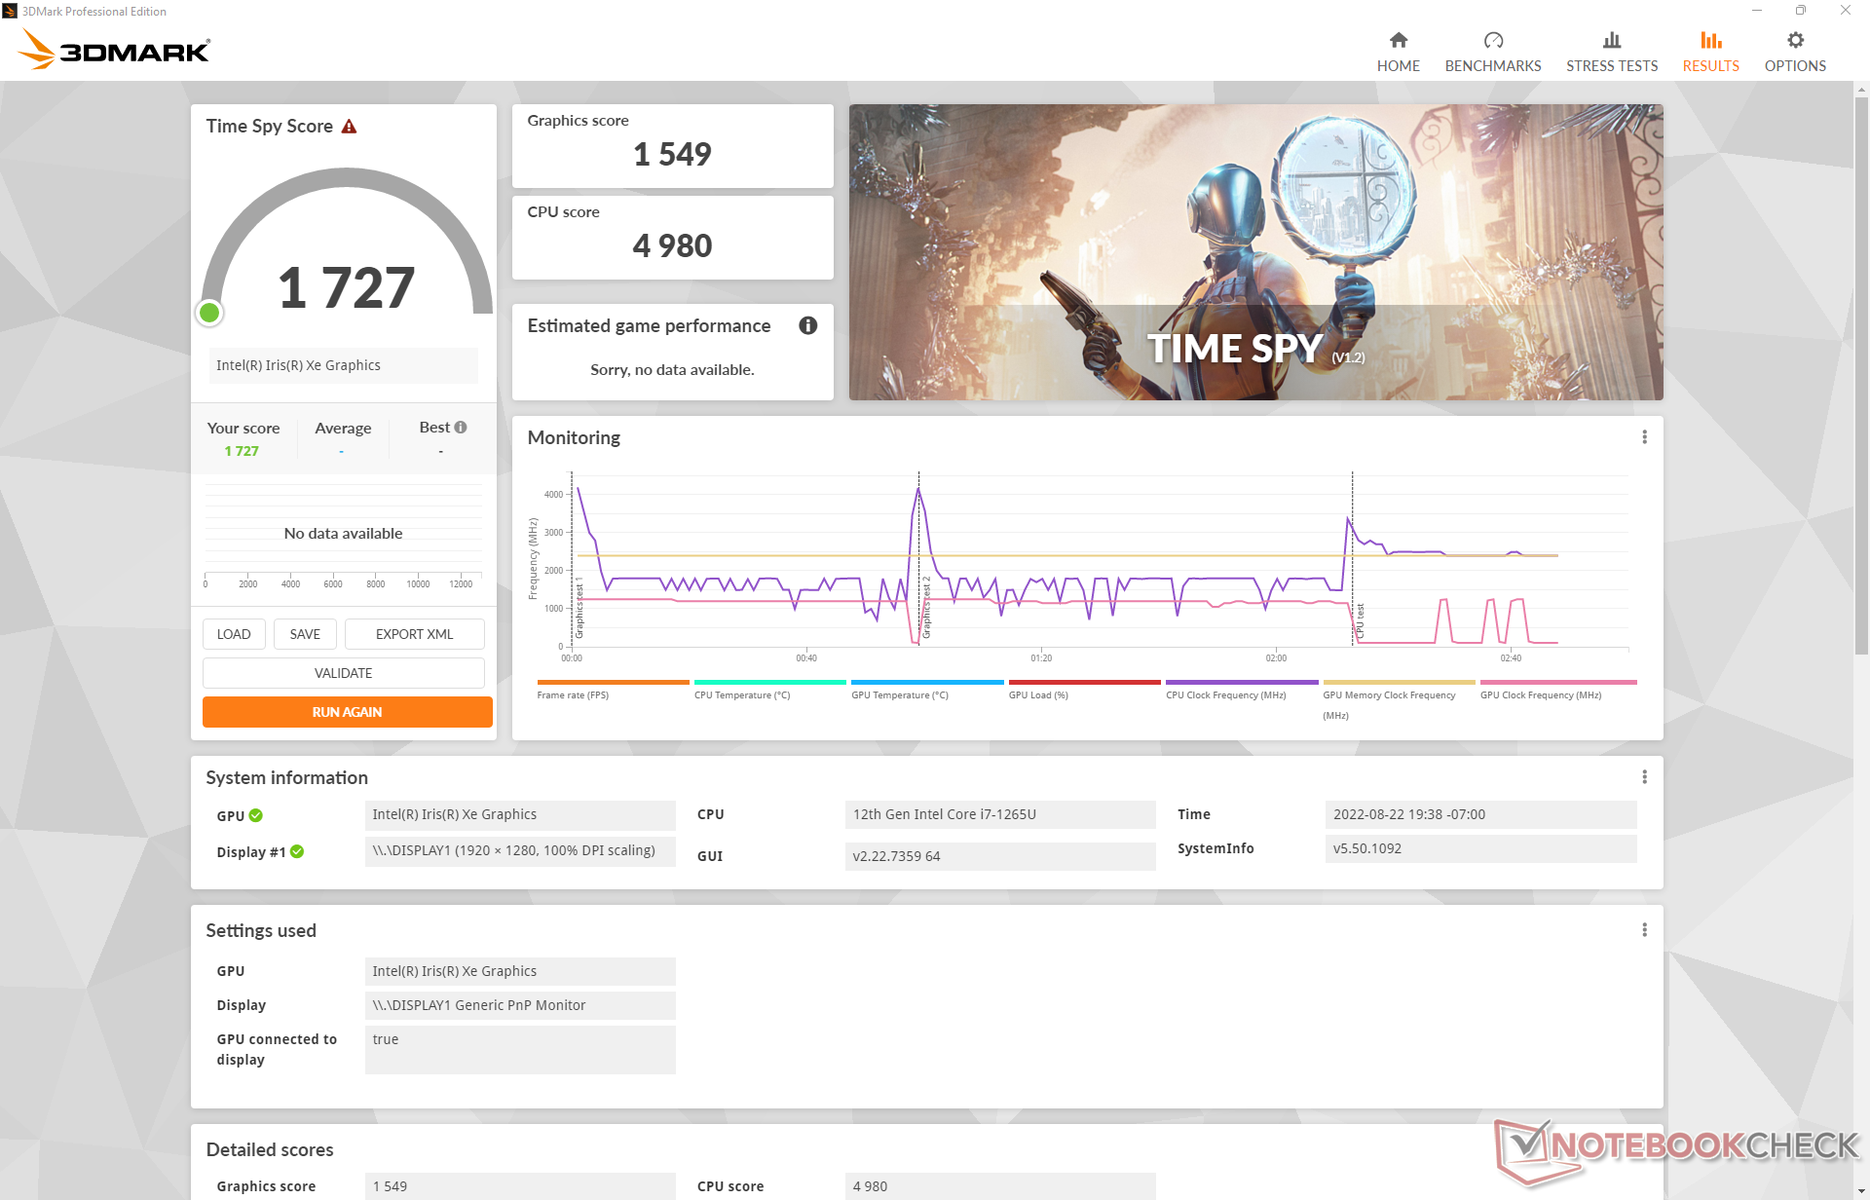
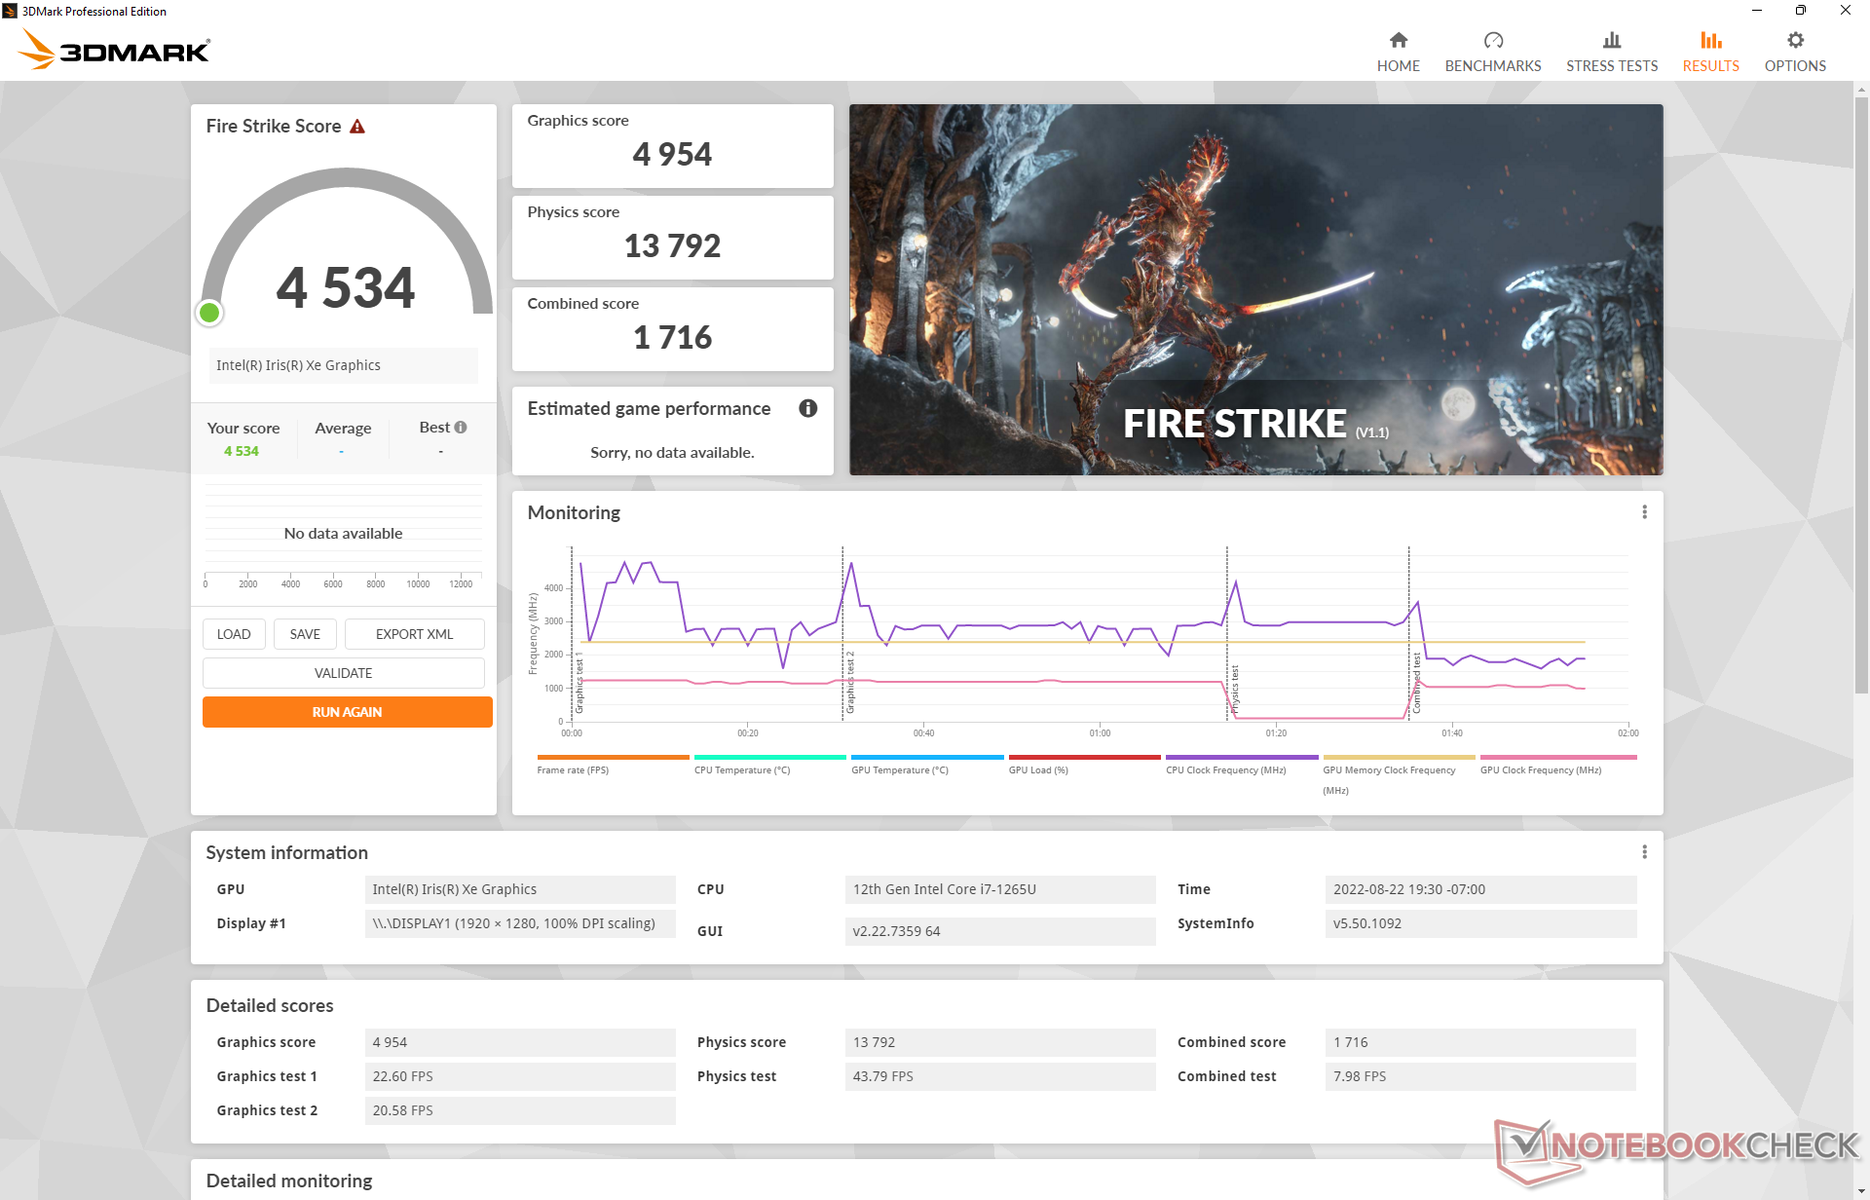
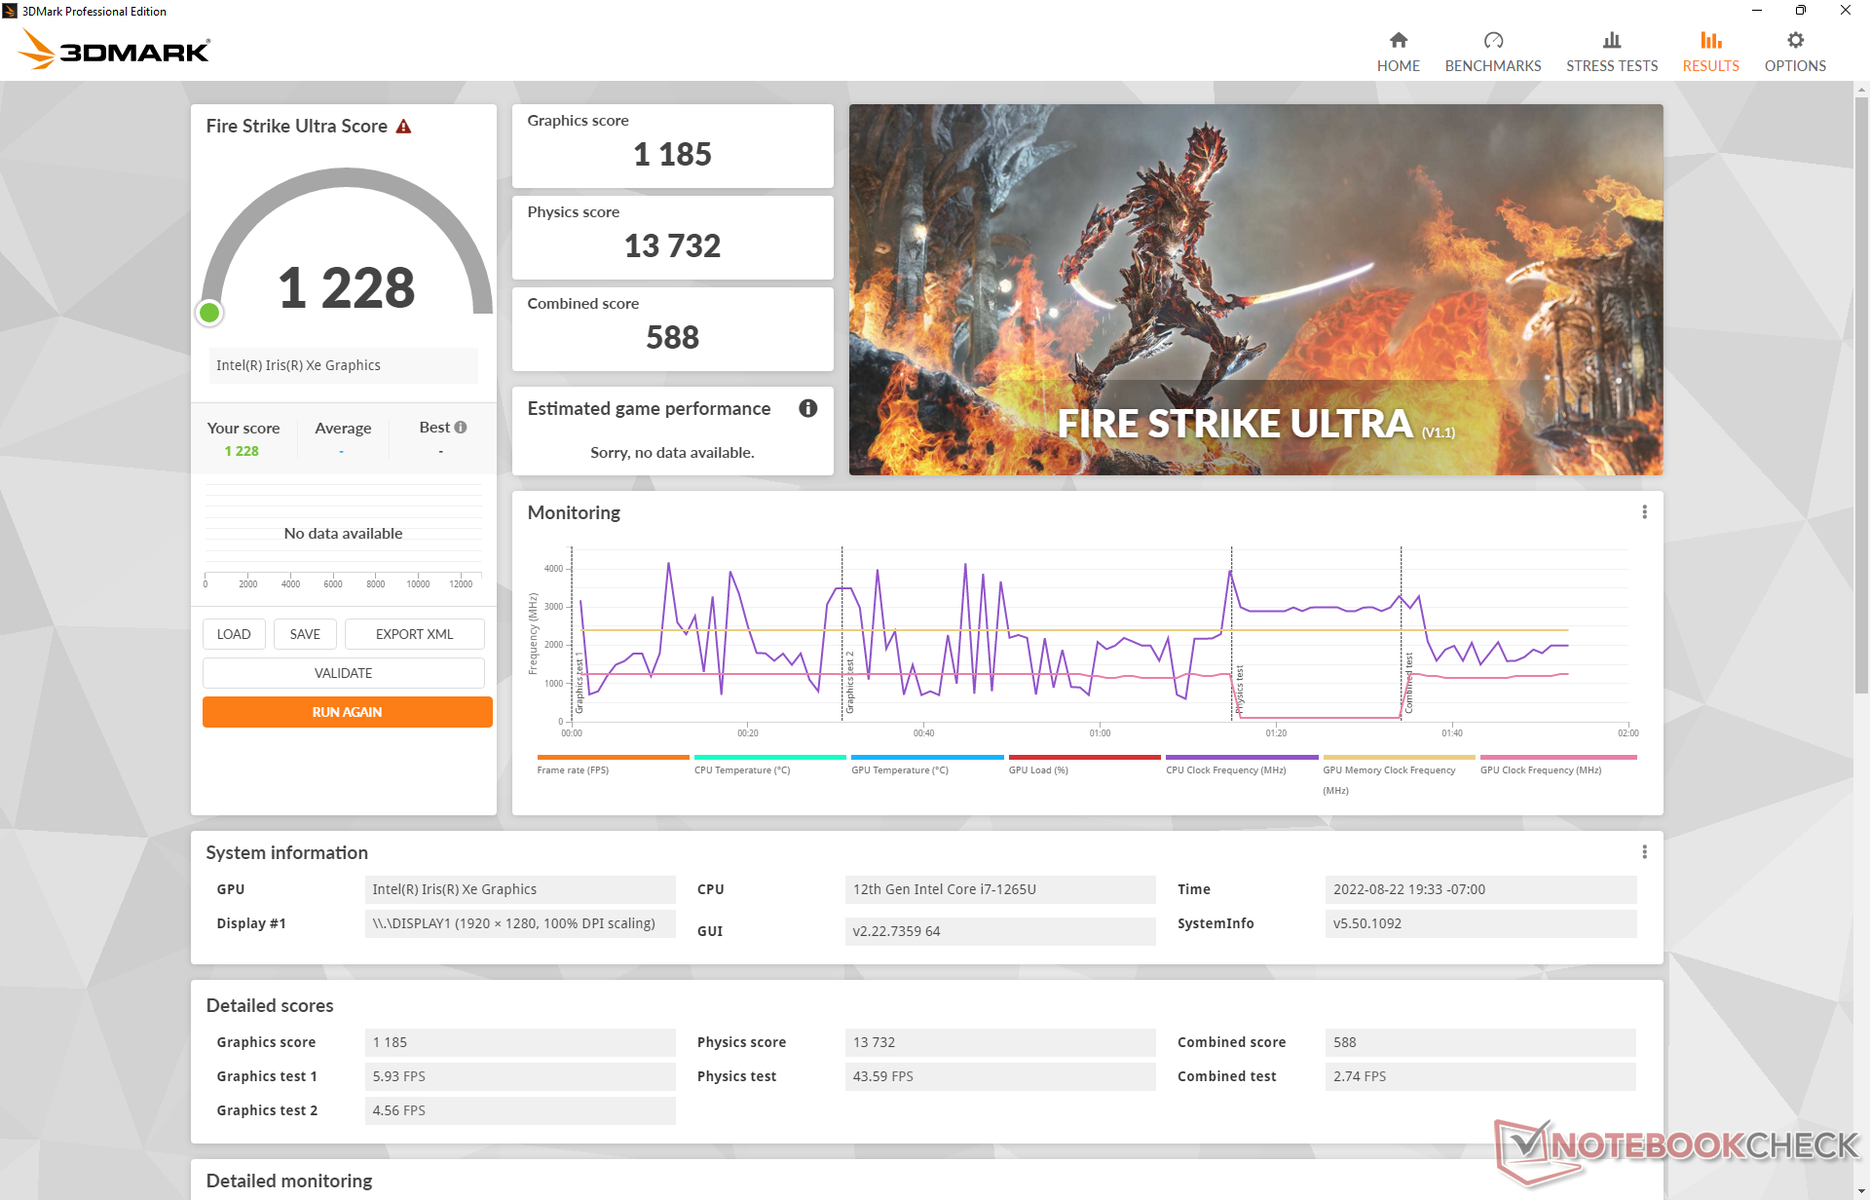
| 3DMark 11 Performance | 6530 points | |
| 3DMark Cloud Gate Standard Score | 19143 points | |
| 3DMark Fire Strike Score | 4534 points | |
| 3DMark Time Spy Score | 1727 points | |
Aide | ||
| Cyberpunk 2077 1.6 | |
| 1920x1080 Low Preset | |
| Framework Laptop 13.5 12th Gen Intel | |
| HP Elite Dragonfly G3 | |
| Moyenne Intel Iris Xe Graphics G7 96EUs (13 - 25.9, n=42) | |
| 1920x1080 Medium Preset | |
| Framework Laptop 13.5 12th Gen Intel | |
| HP Elite Dragonfly G3 | |
| Moyenne Intel Iris Xe Graphics G7 96EUs (10.8 - 21.7, n=37) | |
| 1920x1080 High Preset | |
| Framework Laptop 13.5 12th Gen Intel | |
| HP Elite Dragonfly G3 | |
| Moyenne Intel Iris Xe Graphics G7 96EUs (9.8 - 16.9, n=34) | |
Witcher 3 FPS Chart
| Bas | Moyen | Élevé | Ultra | |
|---|---|---|---|---|
| GTA V (2015) | 90.6 | 79.2 | 23.3 | 10.2 |
| The Witcher 3 (2015) | 76.1 | 52 | 28.4 | 13.8 |
| Dota 2 Reborn (2015) | 97.4 | 71.1 | 57 | 50.9 |
| Final Fantasy XV Benchmark (2018) | 39.7 | 22.7 | 15.8 | |
| X-Plane 11.11 (2018) | 37.3 | 34.7 | 31.2 | |
| Strange Brigade (2018) | 84.9 | 39.3 | 31.4 | 25.4 |
| Cyberpunk 2077 1.6 (2022) | 19.8 | 16.8 | 12.8 | 10.2 |
Émissions - Super silencieux
Bruit du système
Sur le Dragonfly Max, nous avons trouvé que le bruit du ventilateur était plus silencieux que la moyenne, ce qui correspondait à une performance du CPU plus lente que la moyenne. Cette tendance se poursuit sur le Dragonfly G3 pour le meilleur ou pour le pire. Au plus fort, nous n'avons pu enregistrer qu'un bruit de ventilateur de seulement 35 dB(A) contre 40 dB(A) ou plus sur les modèles concurrents comme le montre le tableau ci-dessous. Les utilisateurs qui apprécient les performances du processeur risquent d'être déçus, tandis que ceux qui apprécient les ventilateurs plus silencieux ne verront pas d'inconvénient à ce que le processeur soit plus lent.
Degré de la nuisance sonore
| Au repos |
| 23.2 / 23.2 / 23.2 dB(A) |
| Fortement sollicité |
| 25.1 / 35.2 dB(A) |
 | ||
30 dB silencieux 40 dB(A) audible 50 dB(A) bruyant |
||
min: | ||
| HP Elite Dragonfly G3 Iris Xe G7 96EUs, i7-1265U, Micron 3400 MTFDKBA512TFH 512GB | HP Spectre x360 14t-ea000 Iris Xe G7 96EUs, i7-1165G7, Samsung SSD PM981a MZVLB512HBJQ | Dell XPS 13 Plus 9320 i5-1240p Iris Xe G7 80EUs, i5-1240P, Micron 3400 MTFDKBA512TFH 512GB | Framework Laptop 13.5 12th Gen Intel Iris Xe G7 96EUs, i7-1260P, WDC PC SN730 SDBPNTY-512G | HP EliteBook Folio 13.5-3G2L2EA Adreno 680, SD 8cx Gen 2 5G, Toshiba XG6 KXG60ZNV512G | Lenovo ThinkPad X1 Titanium Yoga G1 20QA001RGE Iris Xe G7 96EUs, i7-1160G7, Toshiba BG4 KBG40ZNT512G | |
|---|---|---|---|---|---|---|
| Noise | -12% | -23% | -25% | -11% | ||
| arrêt / environnement * (dB) | 22.8 | 25.8 -13% | 26 -14% | 22.8 -0% | 25.1 -10% | |
| Idle Minimum * (dB) | 23.2 | 25.9 -12% | 26.2 -13% | 23 1% | 25.1 -8% | |
| Idle Average * (dB) | 23.2 | 25.9 -12% | 26.2 -13% | 23 1% | 25.1 -8% | |
| Idle Maximum * (dB) | 23.2 | 25.9 -12% | 26.2 -13% | 23 1% | 27.1 -17% | |
| Load Average * (dB) | 25.1 | 26.4 -5% | 38.4 -53% | 47.3 -88% | 32.7 -30% | |
| Witcher 3 ultra * (dB) | 32 | 36.9 -15% | 47.3 -48% | 32.7 -2% | ||
| Load Maximum * (dB) | 35.2 | 41.5 -18% | 47.1 -34% | 49.8 -41% | 35.8 -2% |
* ... Moindre est la valeur, meilleures sont les performances
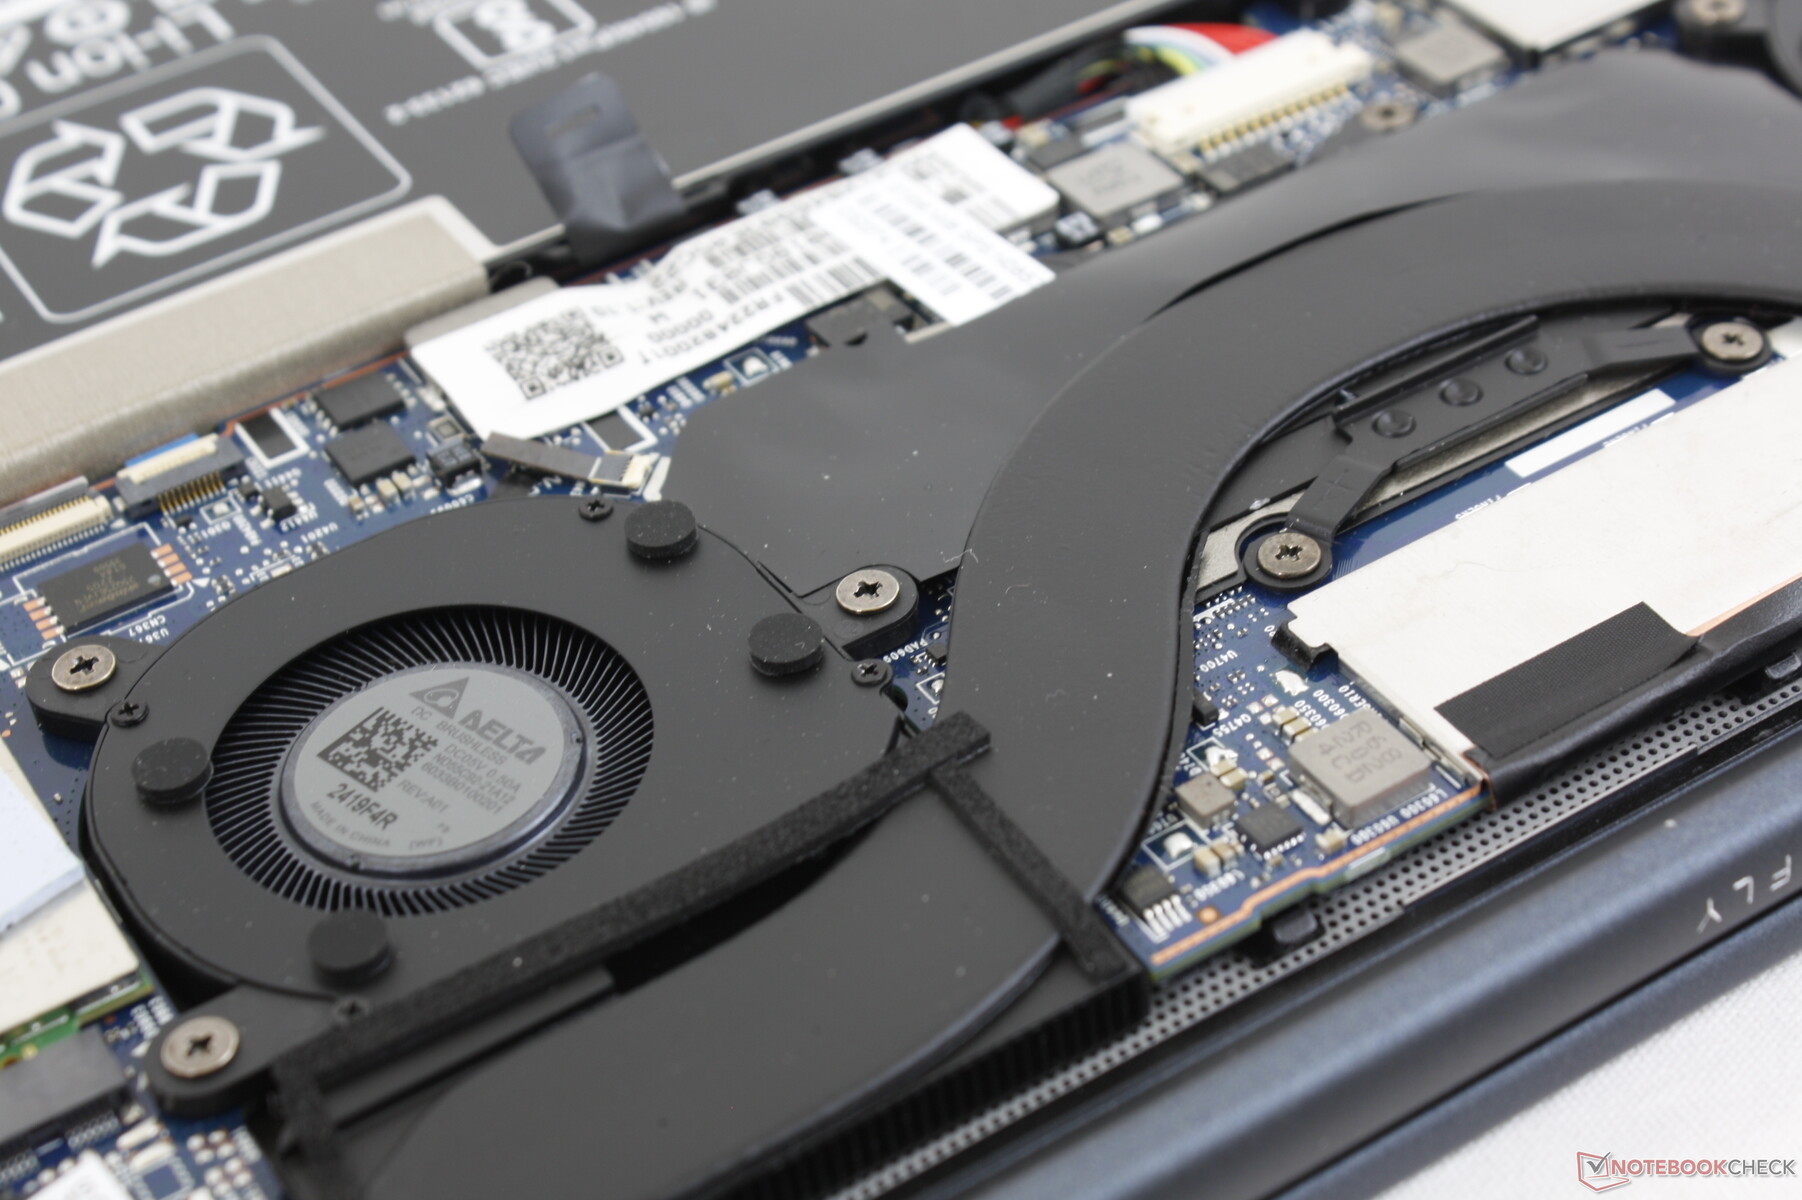
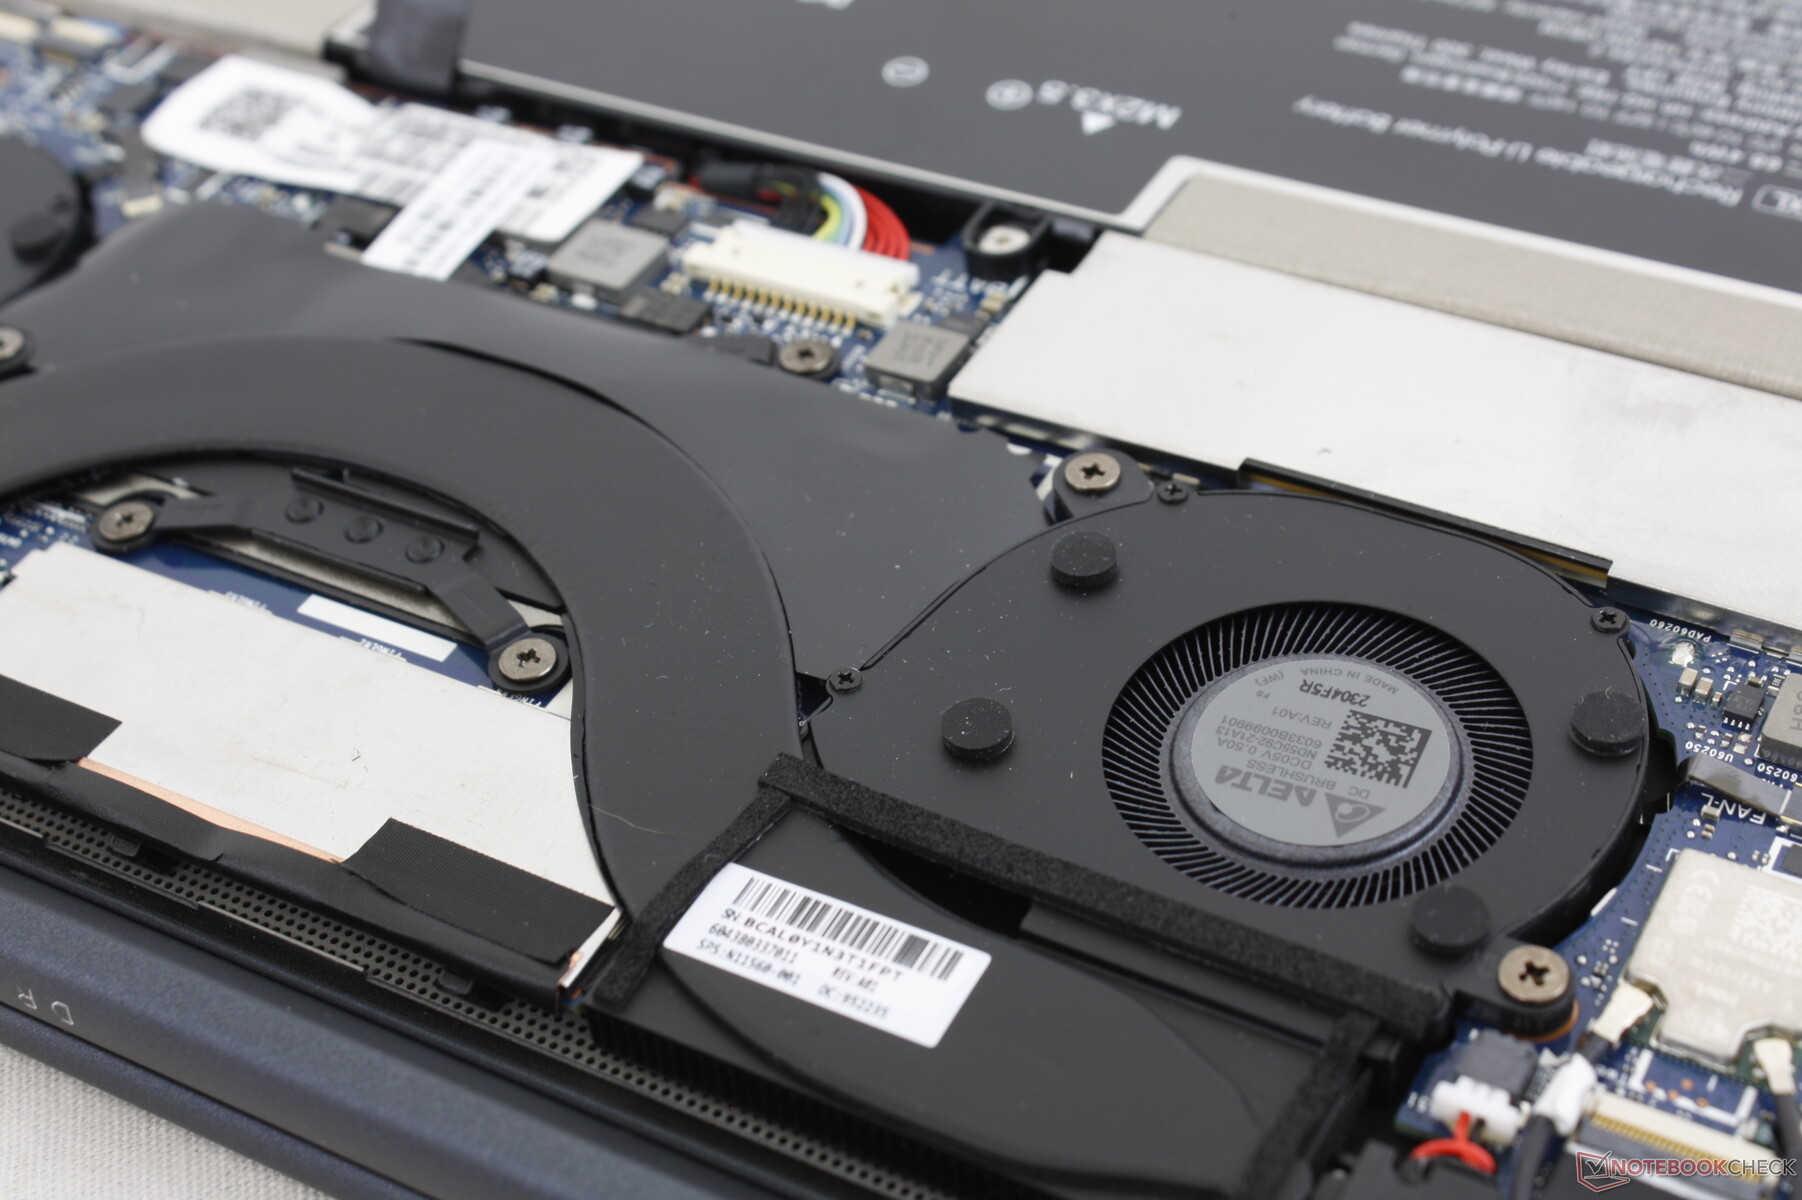
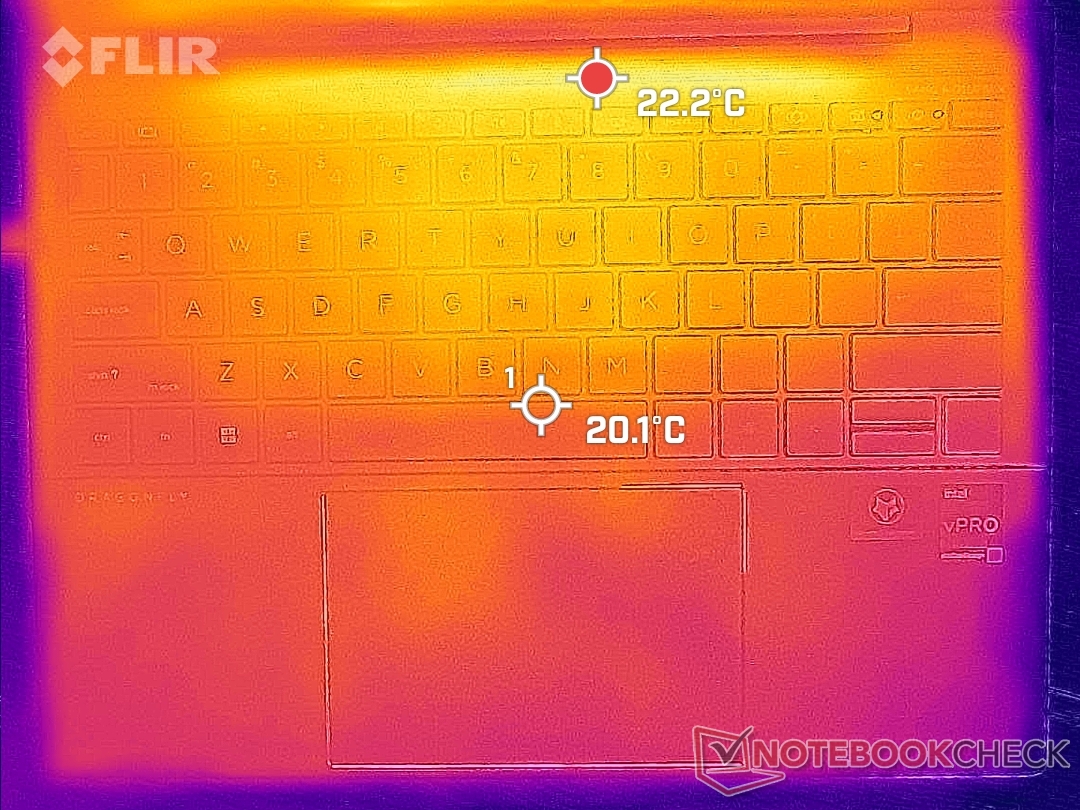
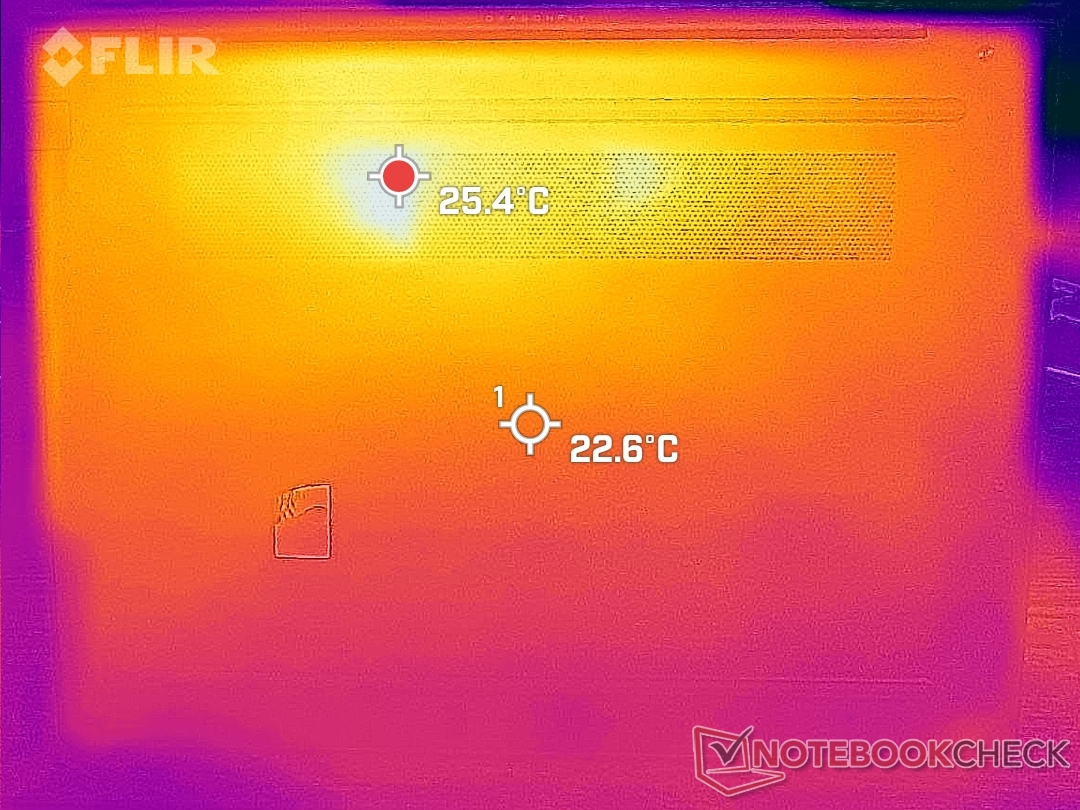
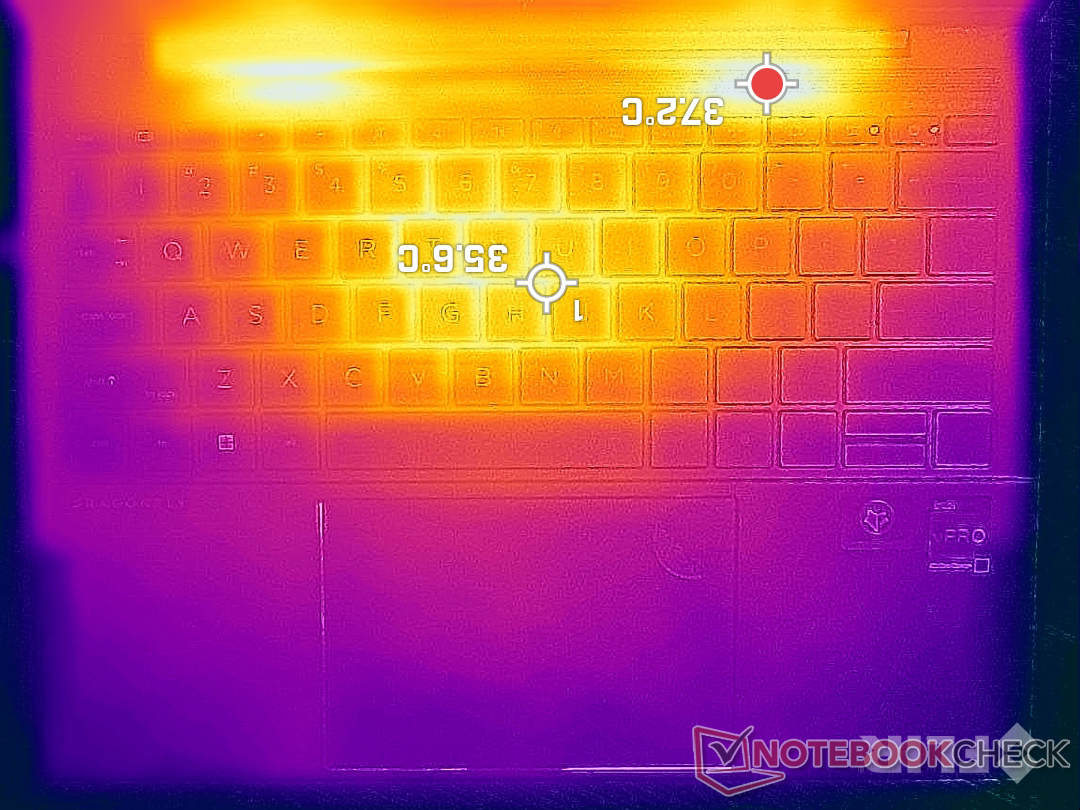
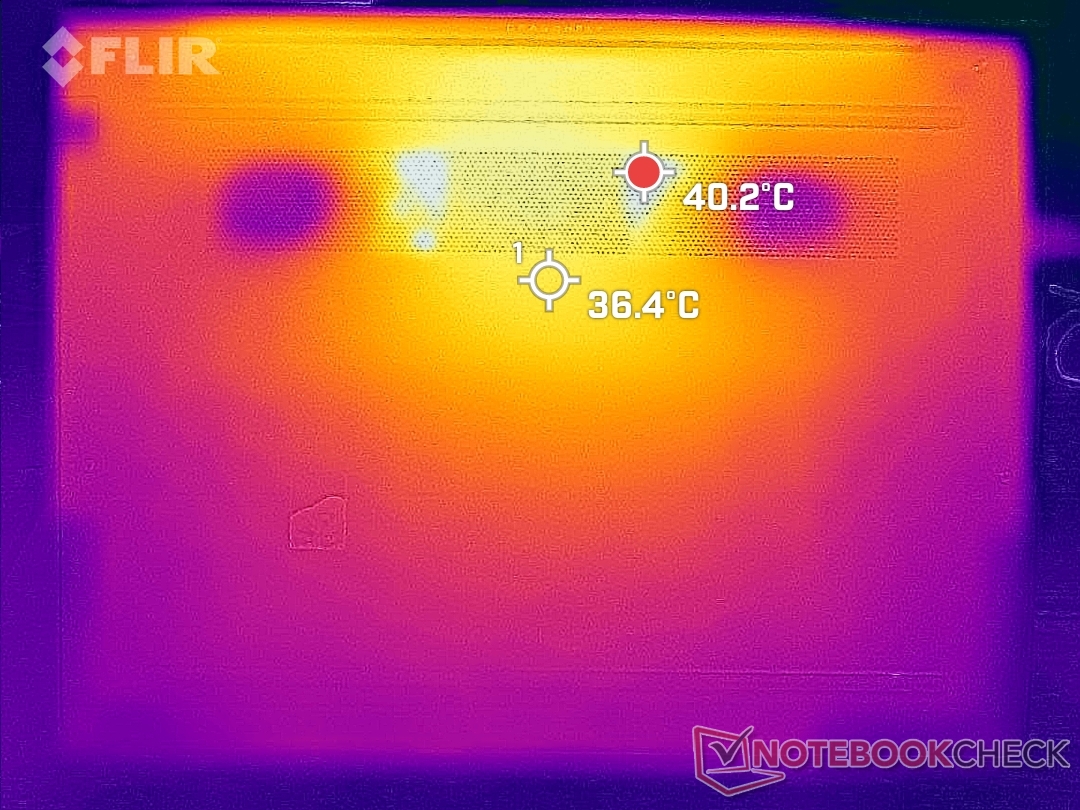
Température
Le gradient de température de surface est plus symétrique que sur l'ancien Dragonfly Max en raison de la solution de refroidissement révisée. Cela signifie que le point chaud sur le Dragonfly G3 est plus proche du centre du clavier que de la moitié droite du clavier. Ces zones peuvent devenir chaudes jusqu'à 40 C lorsqu'elles sont soumises à des charges élevées pendant des périodes prolongées, mais elles se trouvent heureusement vers l'arrière et nulle part près des repose-poignets ou du pavé tactile.
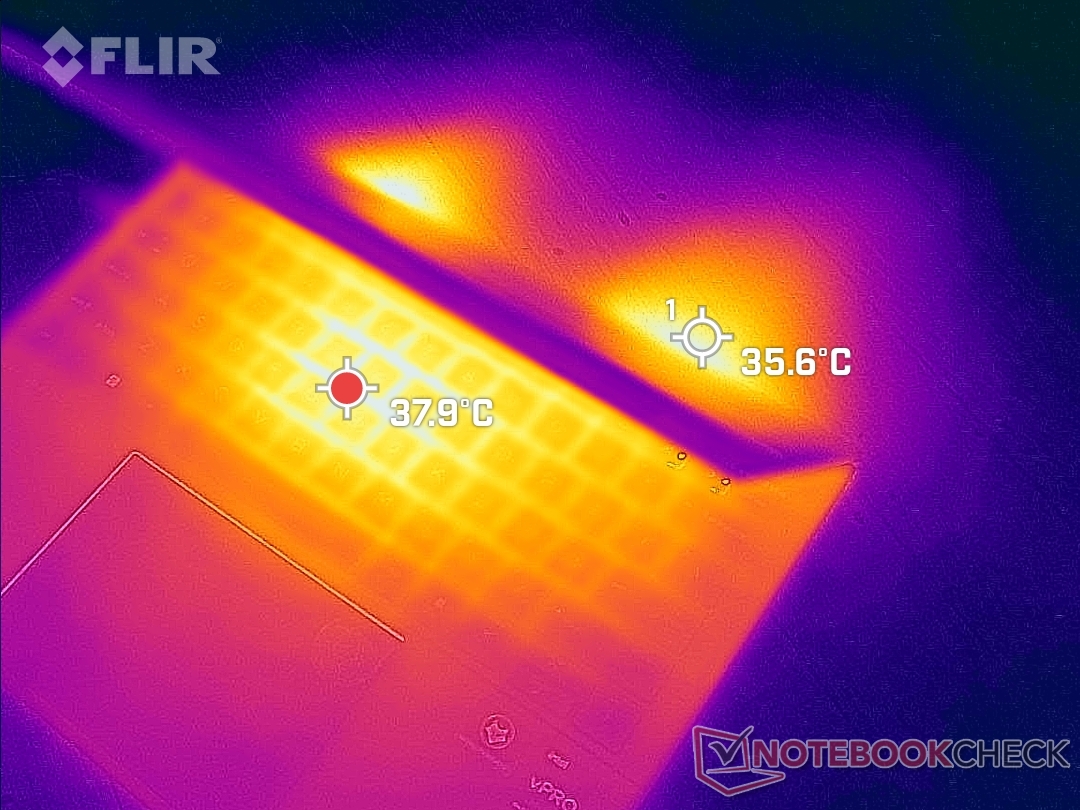
(+) La température maximale du côté supérieur est de 39 °C / 102 F, par rapport à la moyenne de 34.3 °C / 94 F, allant de 21.2 à 62.5 °C pour la classe Office.
(±) Le fond chauffe jusqu'à un maximum de 42.2 °C / 108 F, contre une moyenne de 36.8 °C / 98 F
(+) En utilisation inactive, la température moyenne du côté supérieur est de 25.4 °C / 78 F, par rapport à la moyenne du dispositif de 29.5 °C / 85 F.
(+) Les repose-poignets et le pavé tactile sont plus froids que la température de la peau avec un maximum de 28.4 °C / 83.1 F et sont donc froids au toucher.
(±) La température moyenne de la zone de l'appui-paume de dispositifs similaires était de 27.5 °C / 81.5 F (-0.9 °C / #-1.6 F).
| HP Elite Dragonfly G3 Intel Core i7-1265U, Intel Iris Xe Graphics G7 96EUs | HP Spectre x360 14t-ea000 Intel Core i7-1165G7, Intel Iris Xe Graphics G7 96EUs | Dell XPS 13 Plus 9320 i5-1240p Intel Core i5-1240P, Intel Iris Xe Graphics G7 80EUs | Framework Laptop 13.5 12th Gen Intel Intel Core i7-1260P, Intel Iris Xe Graphics G7 96EUs | HP EliteBook Folio 13.5-3G2L2EA Qualcomm Snapdragon 8cx Gen 2 5G, Qualcomm Adreno 680 | Lenovo ThinkPad X1 Titanium Yoga G1 20QA001RGE Intel Core i7-1160G7, Intel Iris Xe Graphics G7 96EUs | |
|---|---|---|---|---|---|---|
| Heat | -9% | -37% | 3% | 11% | -7% | |
| Maximum Upper Side * (°C) | 39 | 40.4 -4% | 47.6 -22% | 36.8 6% | 34.3 12% | 46.5 -19% |
| Maximum Bottom * (°C) | 42.2 | 52.8 -25% | 57 -35% | 42.4 -0% | 35.4 16% | 45.2 -7% |
| Idle Upper Side * (°C) | 26.8 | 27.2 -1% | 38.8 -45% | 24.2 10% | 25.7 4% | 27.3 -2% |
| Idle Bottom * (°C) | 28.2 | 29.2 -4% | 41 -45% | 29 -3% | 25.1 11% | 27.7 2% |
* ... Moindre est la valeur, meilleures sont les performances
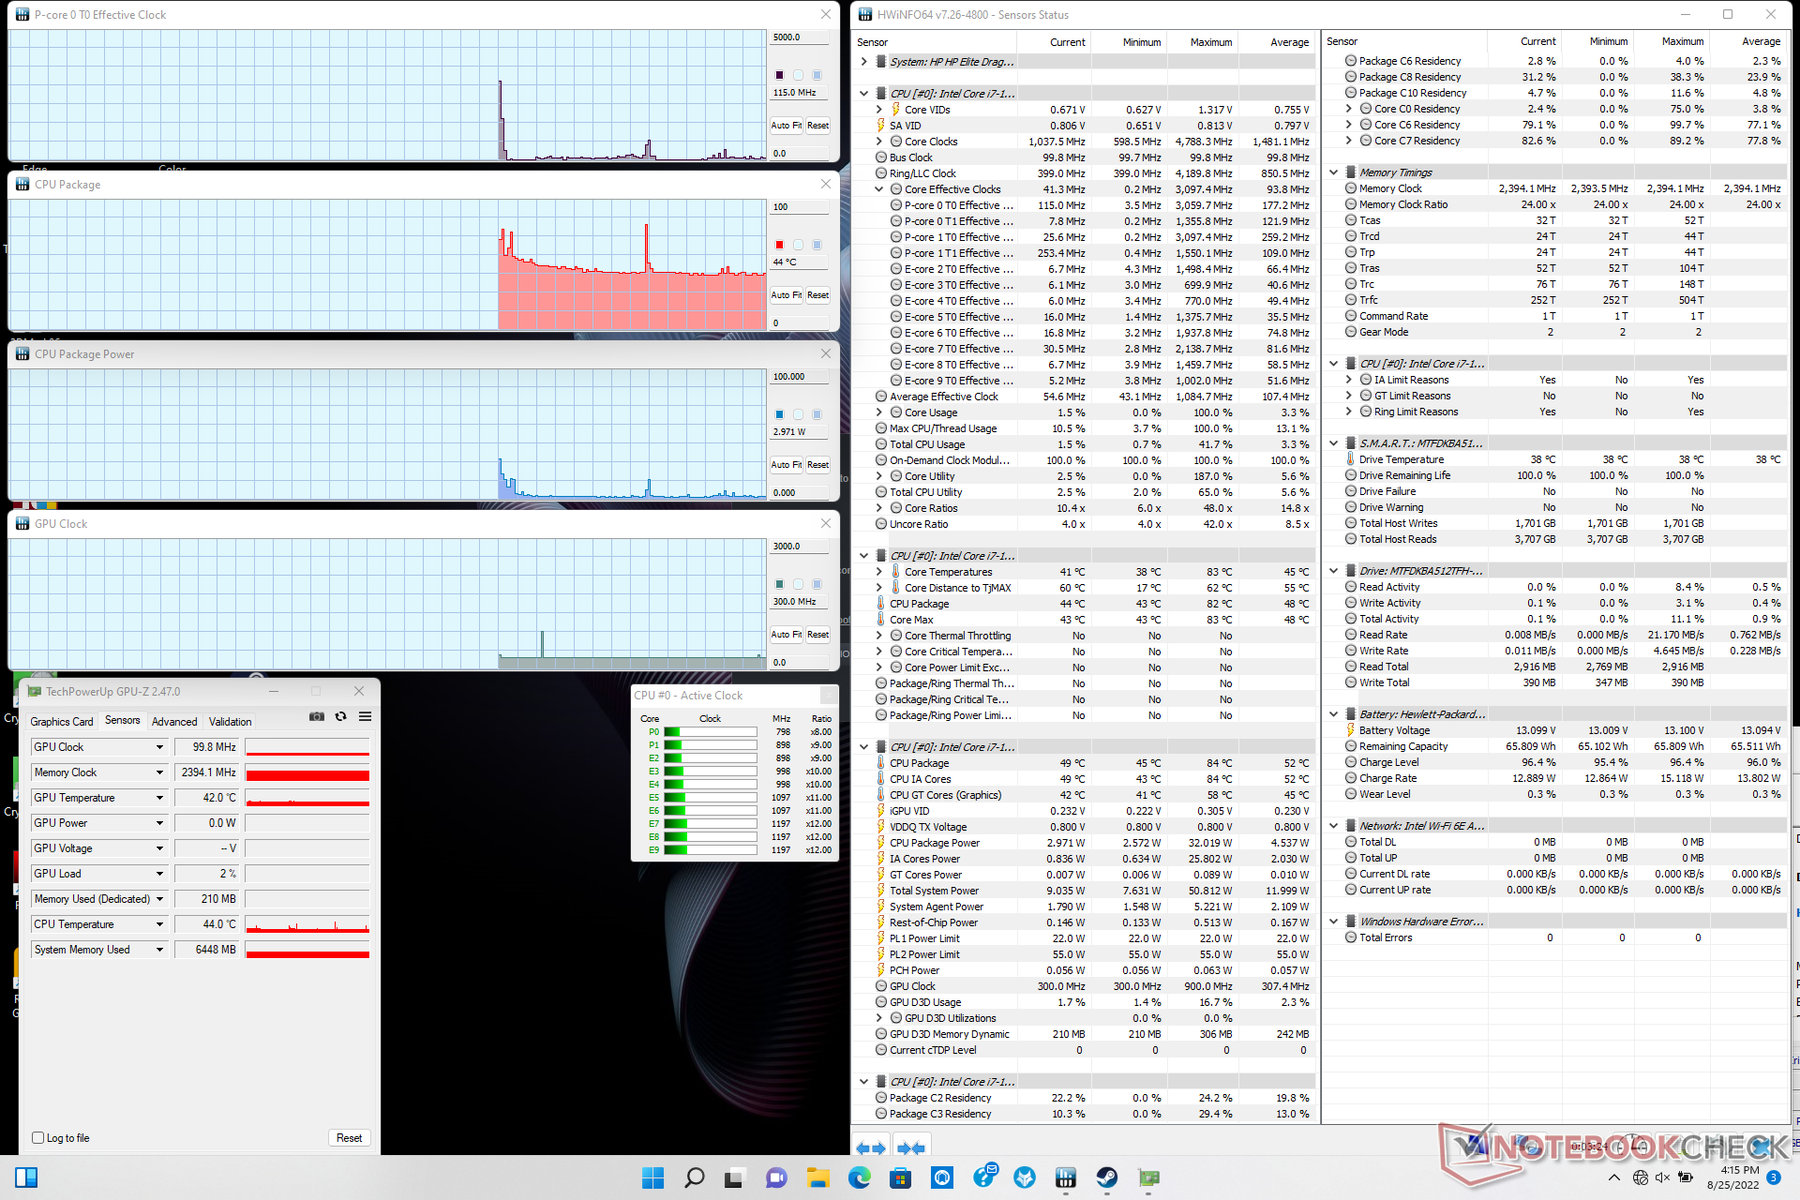
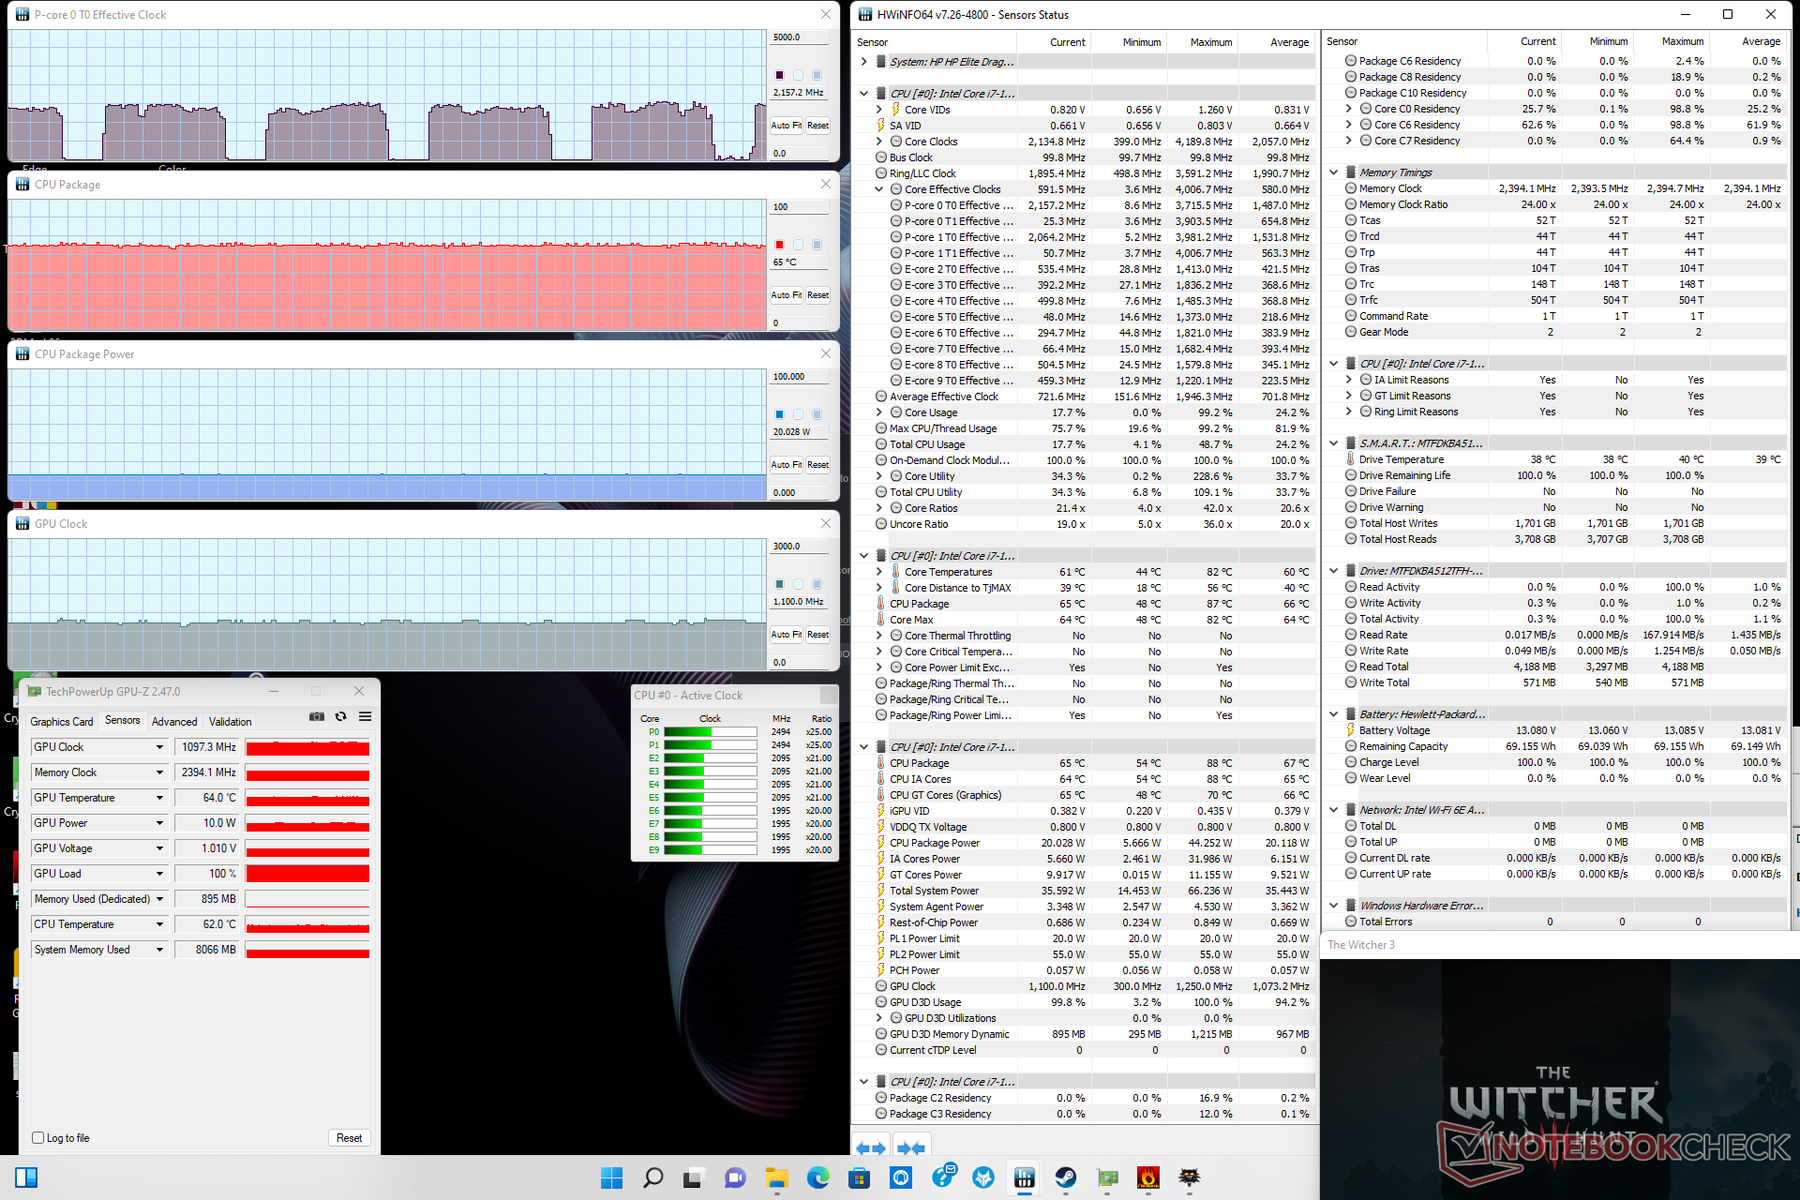
Test de stress
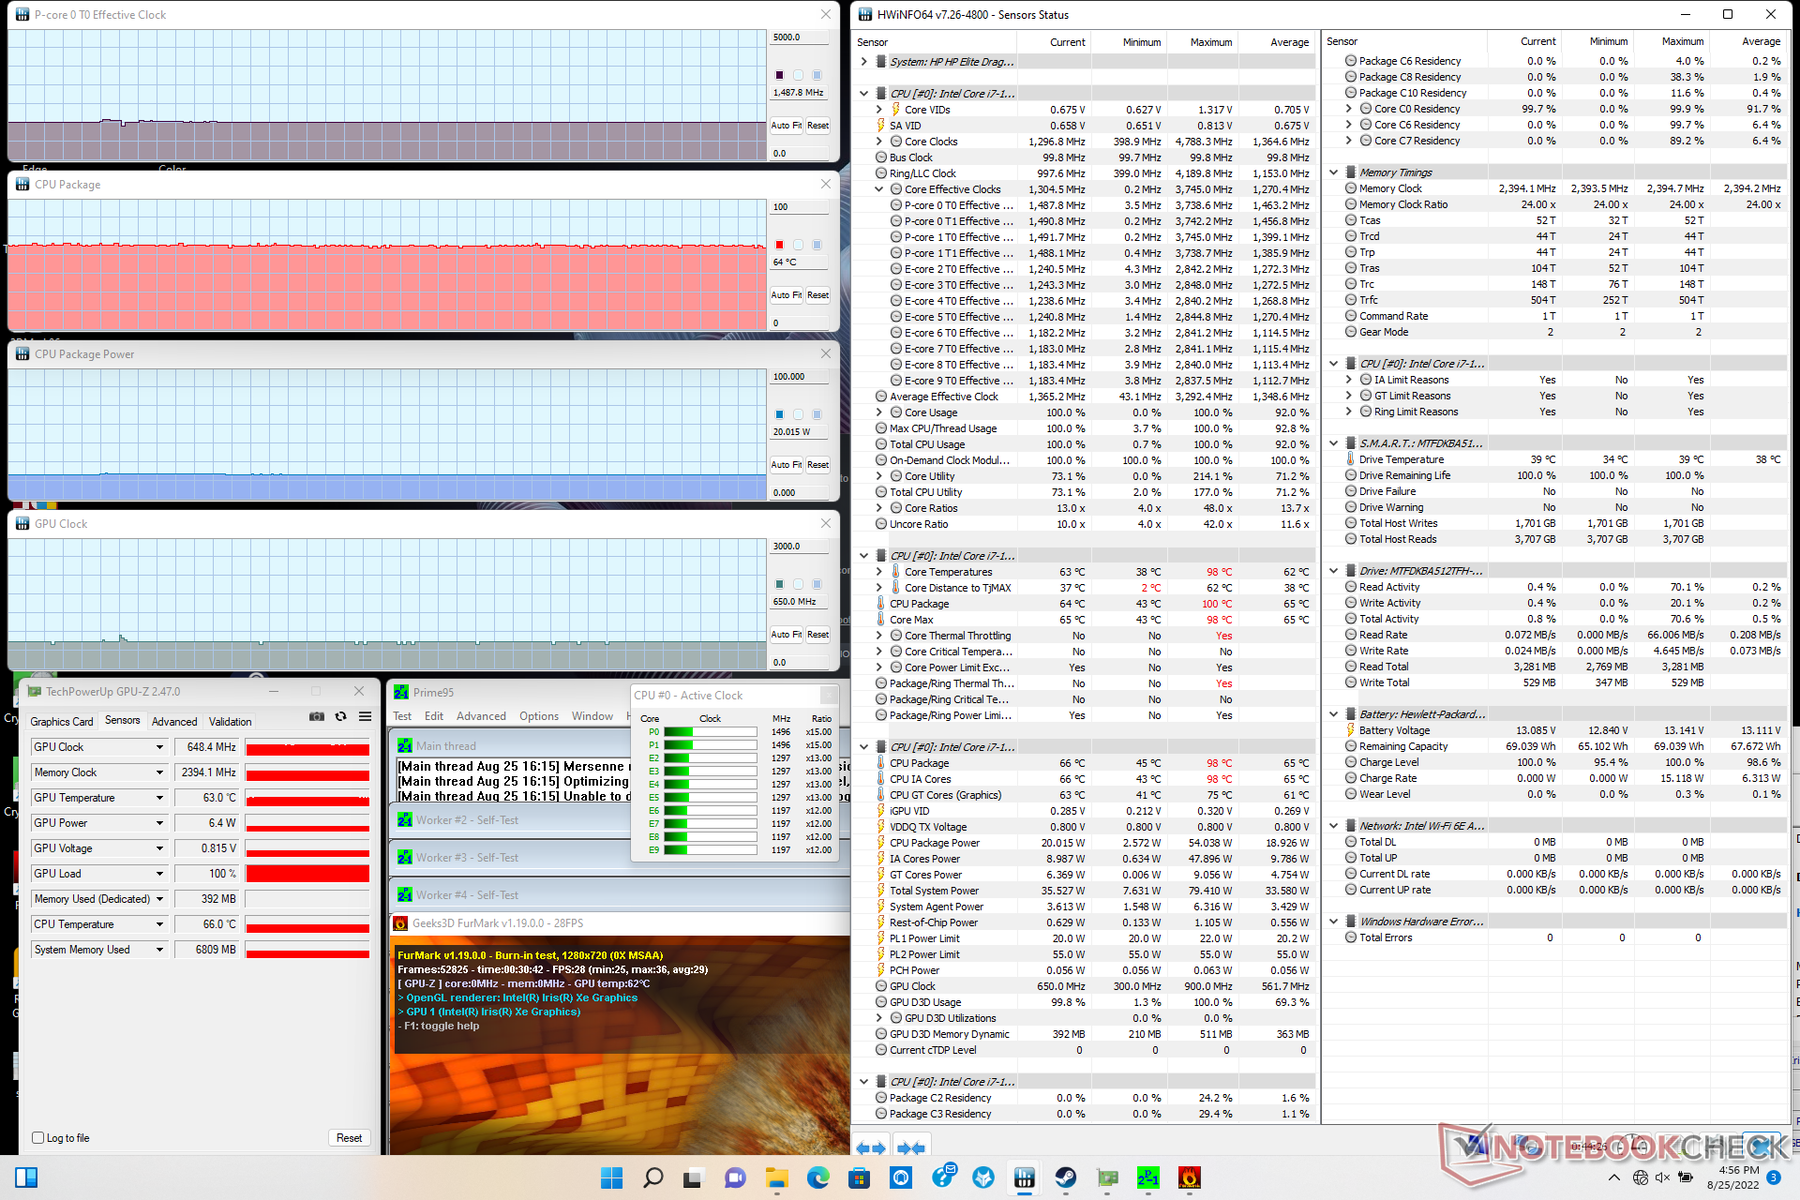
Les fréquences d'horloge du CPU, la température et la consommation d'énergie de la carte atteignent respectivement 3,7 GHz, 100 C et 54 W au début du test Prime95. Cependant, après seulement 10 à 15 secondes, les fréquences d'horloge et la consommation d'énergie de la carte chutaient et se stabilisaient à 2,1 GHz et 20 W, respectivement, afin de maintenir une température centrale plus gérable de 70 C. En répétant ce même test sur la carte Dell Dell Latitude 7330 avec le même processeur Core i7-1265U, les fréquences d'horloge, les températures et la consommation d'énergie de la carte seraient plus stables et atteindraient respectivement 2,4 GHz, >80 C et 25 W. HP utilise le Core i7-1265U de manière plus conservatrice par rapport à la concurrence.
Lors de l'exécution Witcher 3 pour représenter des charges exigeantes, la fréquence d'horloge et la température du GPU se stabilisent à 1097 MHz et 65 C, respectivement, contre 1247 MHz et 83 C sur le Dell susmentionné.
Le fonctionnement sur batterie limite les performances. Un test 3DMark sur batterie donne des scores de physique et de graphisme de 9619 et 5532 points, respectivement, contre 11216 et 6155 points sur le secteur.
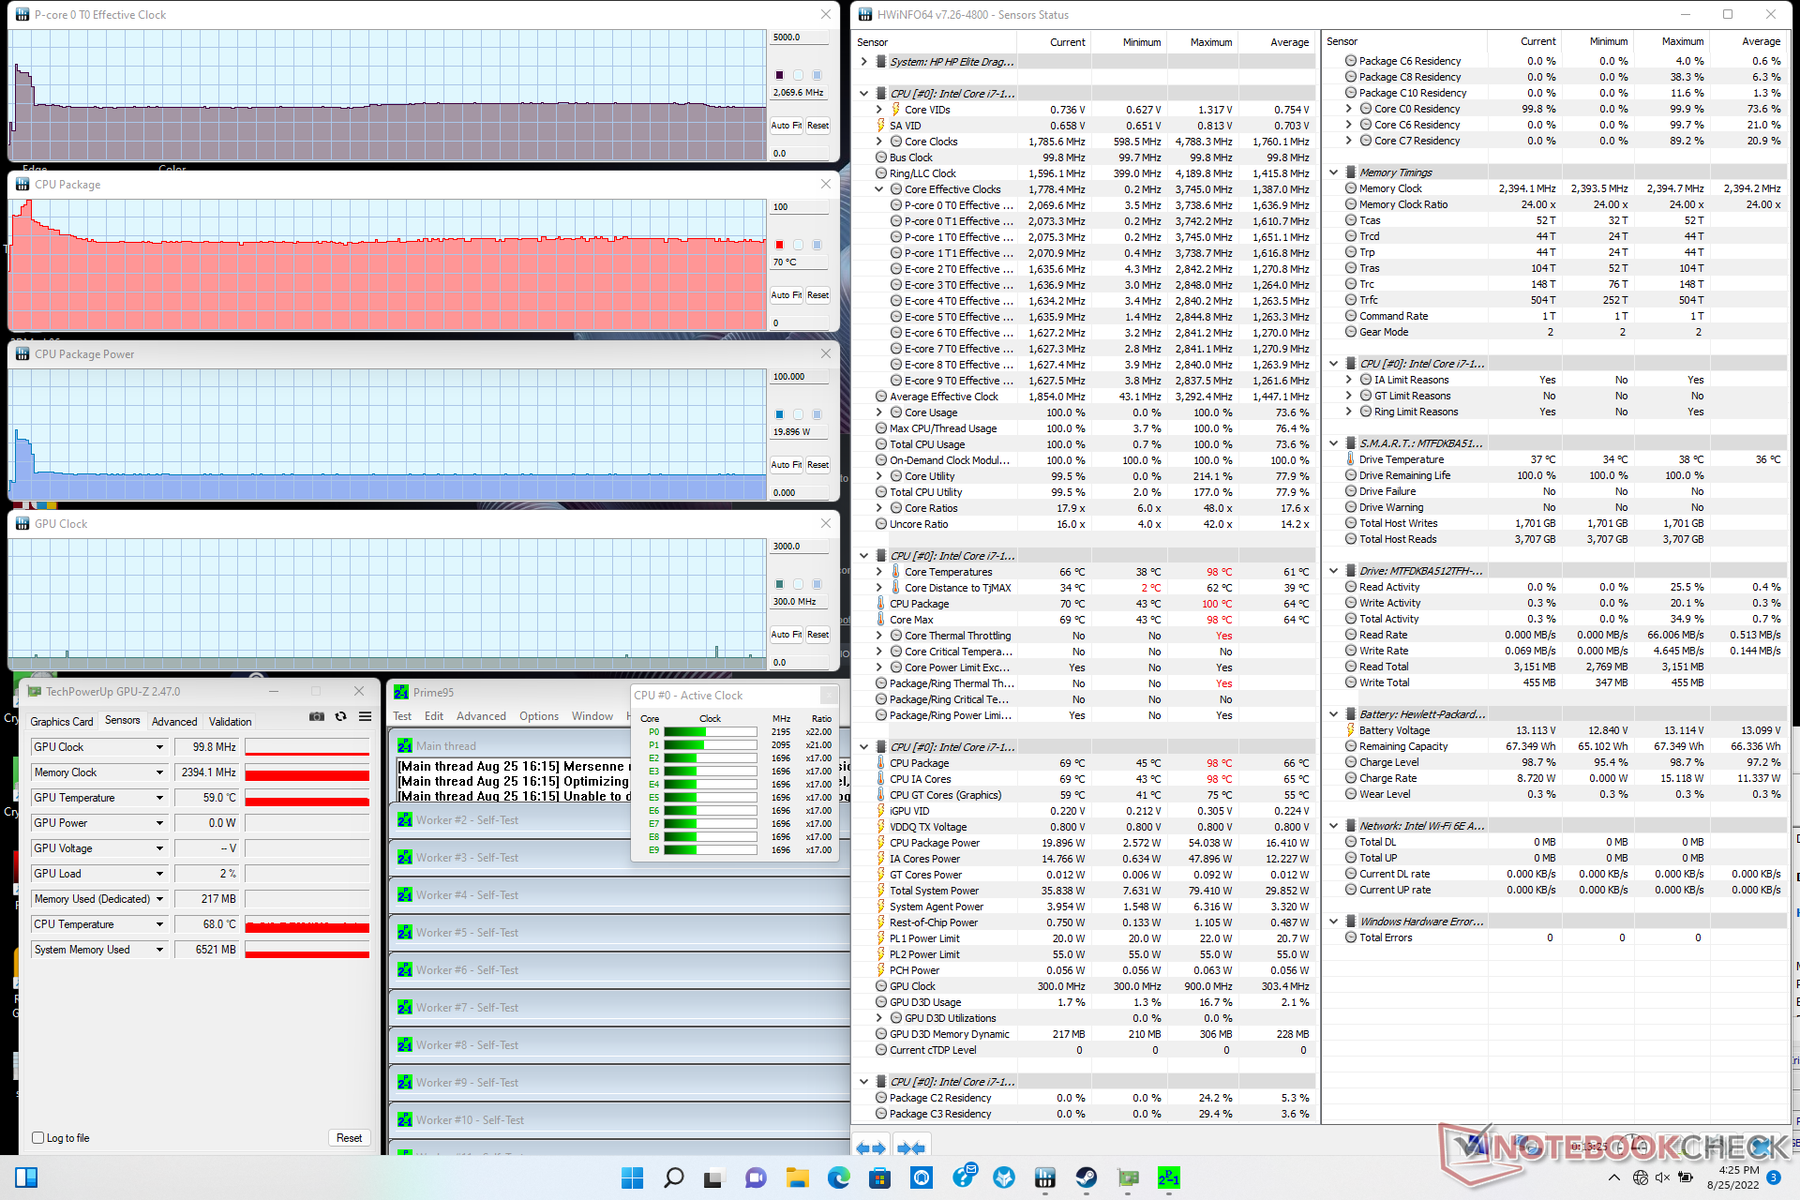
| Fréquence du CPU (GHz) | Fréquence du GPU (MHz) | Température moyenne du CPU (°C) | |
| Système au repos | -- | -- | 2.1 |
| Prime95 Stress | 2.1 | -- | 70 |
| Prime95 + FurMark Stress | 1.5 | 648 | 64 |
| Witcher 3 Stress | ~2.1 | 1097 | 65 |
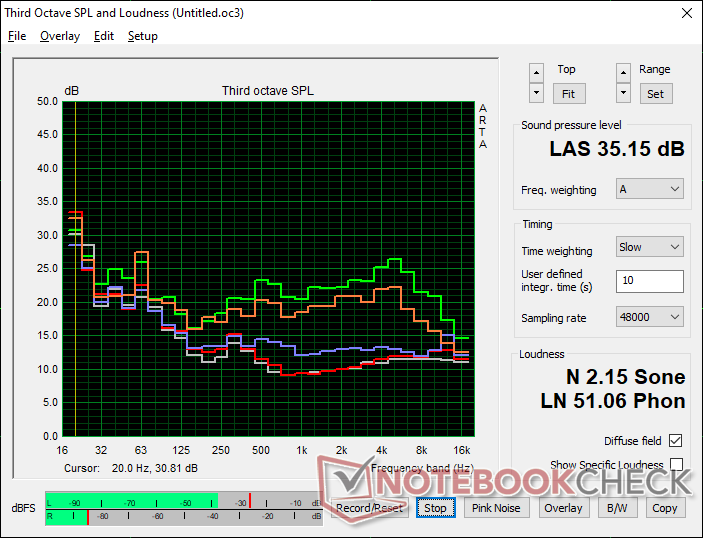
Haut-parleurs
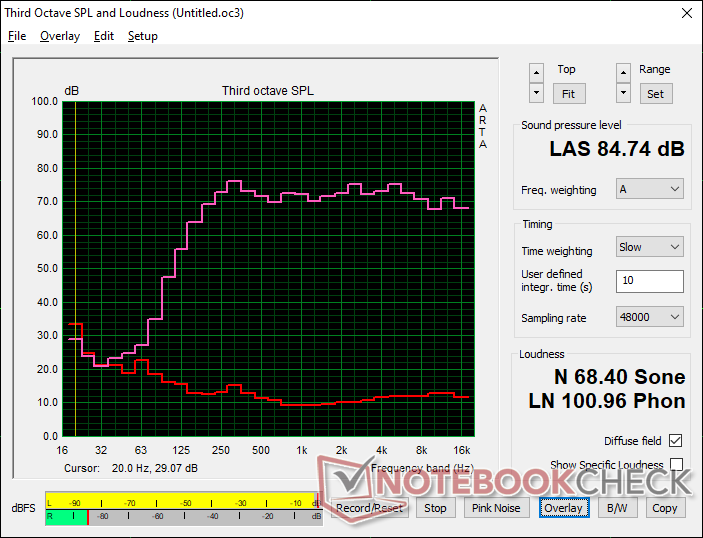
HP Elite Dragonfly G3 analyse audio
(+) | les haut-parleurs peuvent jouer relativement fort (84.7# dB)
Basses 100 - 315 Hz
(±) | basse réduite - en moyenne 9.4% inférieure à la médiane
(±) | la linéarité des basses est moyenne (11.4% delta à la fréquence précédente)
Médiums 400 - 2000 Hz
(+) | médiane équilibrée - seulement 0.9% de la médiane
(+) | les médiums sont linéaires (2.8% delta à la fréquence précédente)
Aiguës 2 - 16 kHz
(+) | des sommets équilibrés - à seulement 2.1% de la médiane
(+) | les aigus sont linéaires (3.9% delta à la fréquence précédente)
Globalement 100 - 16 000 Hz
(+) | le son global est linéaire (6.6% différence à la médiane)
Par rapport à la même classe
» 0% de tous les appareils testés de cette catégorie étaient meilleurs, 0% similaires, 100% pires
» Le meilleur avait un delta de 7%, la moyenne était de 21%, le pire était de 53%.
Par rapport à tous les appareils testés
» 1% de tous les appareils testés étaient meilleurs, 0% similaires, 99% pires
» Le meilleur avait un delta de 4%, la moyenne était de 23%, le pire était de 134%.
Apple MacBook Pro 16 2021 M1 Pro analyse audio
(+) | les haut-parleurs peuvent jouer relativement fort (84.7# dB)
Basses 100 - 315 Hz
(+) | bonne basse - seulement 3.8% loin de la médiane
(+) | les basses sont linéaires (5.2% delta à la fréquence précédente)
Médiums 400 - 2000 Hz
(+) | médiane équilibrée - seulement 1.3% de la médiane
(+) | les médiums sont linéaires (2.1% delta à la fréquence précédente)
Aiguës 2 - 16 kHz
(+) | des sommets équilibrés - à seulement 1.9% de la médiane
(+) | les aigus sont linéaires (2.7% delta à la fréquence précédente)
Globalement 100 - 16 000 Hz
(+) | le son global est linéaire (4.6% différence à la médiane)
Par rapport à la même classe
» 0% de tous les appareils testés de cette catégorie étaient meilleurs, 0% similaires, 100% pires
» Le meilleur avait un delta de 5%, la moyenne était de 17%, le pire était de 45%.
Par rapport à tous les appareils testés
» 0% de tous les appareils testés étaient meilleurs, 0% similaires, 100% pires
» Le meilleur avait un delta de 4%, la moyenne était de 23%, le pire était de 134%.
Gestion de l'énergie
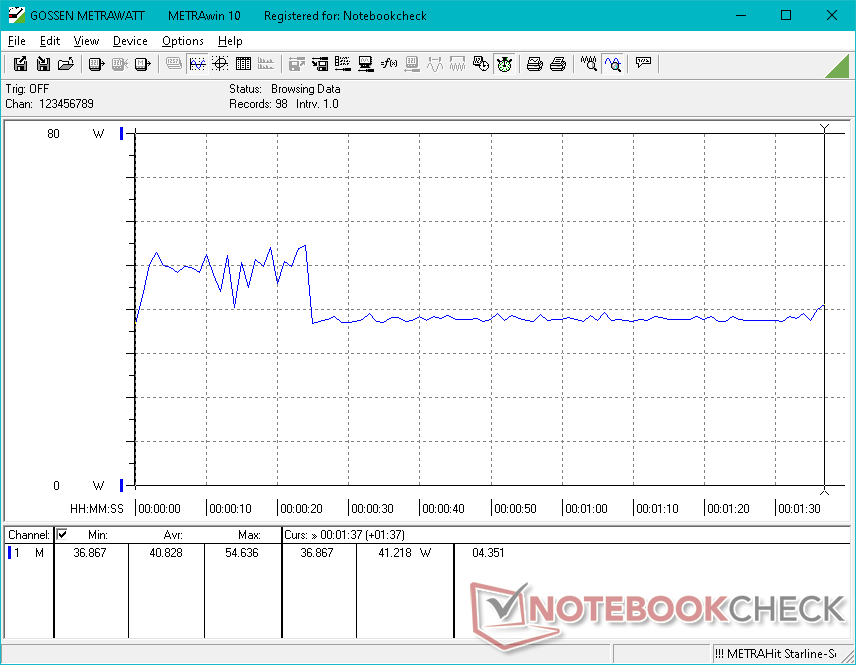
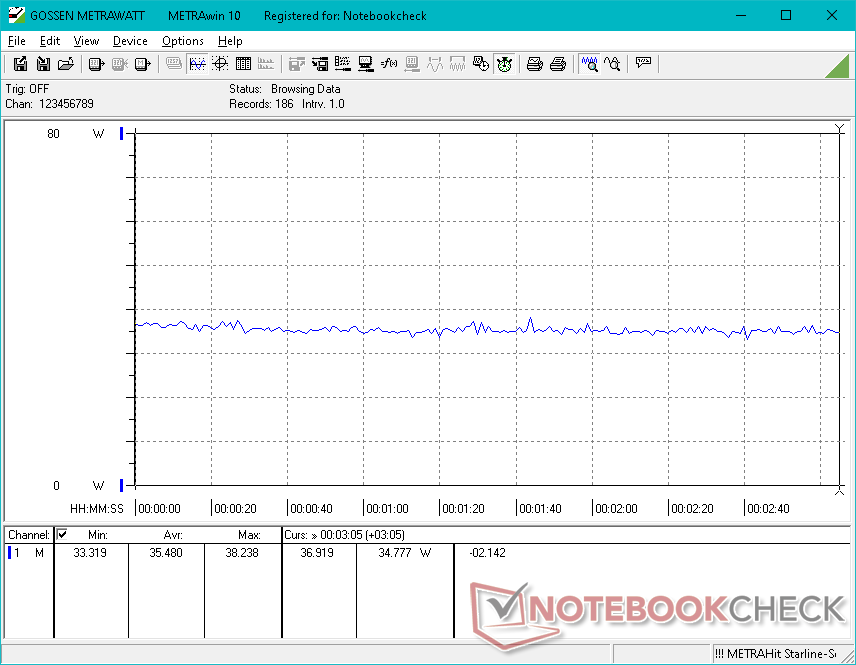
Consommation d'énergie
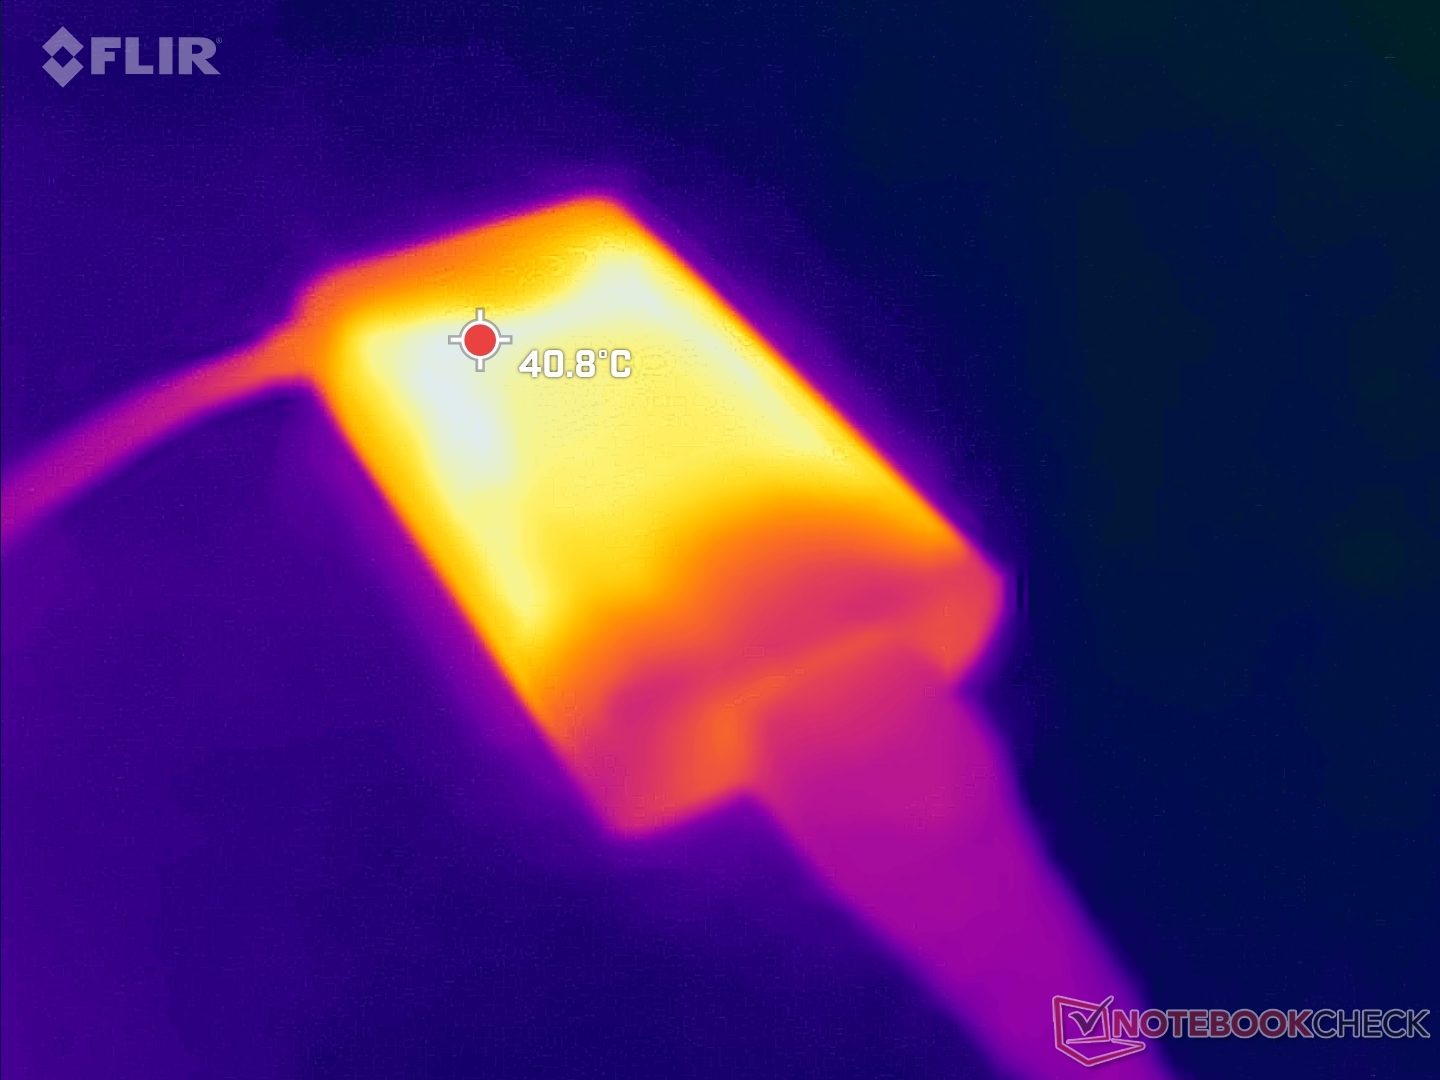
La consommation d'énergie est presque identique à celle du Dell Latitude 7330 équipé du même processeur lors de l'exécution de charges peu exigeantes comme la navigation sur le Web ou la diffusion de vidéos. Cependant, le système Dell est plus exigeant lors de l'exécution de tâches gourmandes en ressources, car il est capable de maintenir des fréquences d'horloge et des niveaux de TDP plus élevés pendant plus longtemps que le système HP. La consommation globale n'est pas très différente de celle du Spectre x360 14 fonctionnant avec le Core i7-1165G7 de dernière génération, malgré une augmentation de 15 à 30 % des performances multithread.
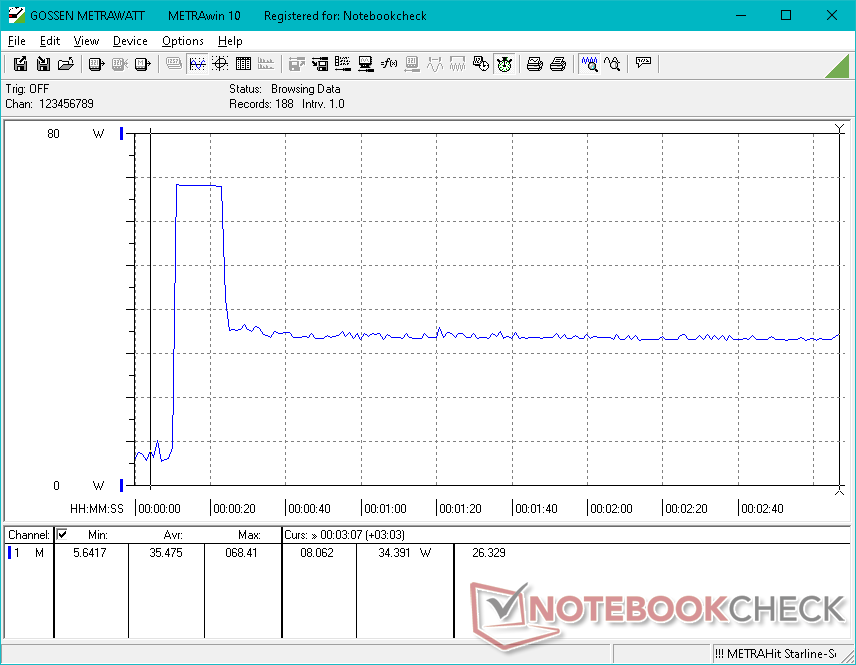
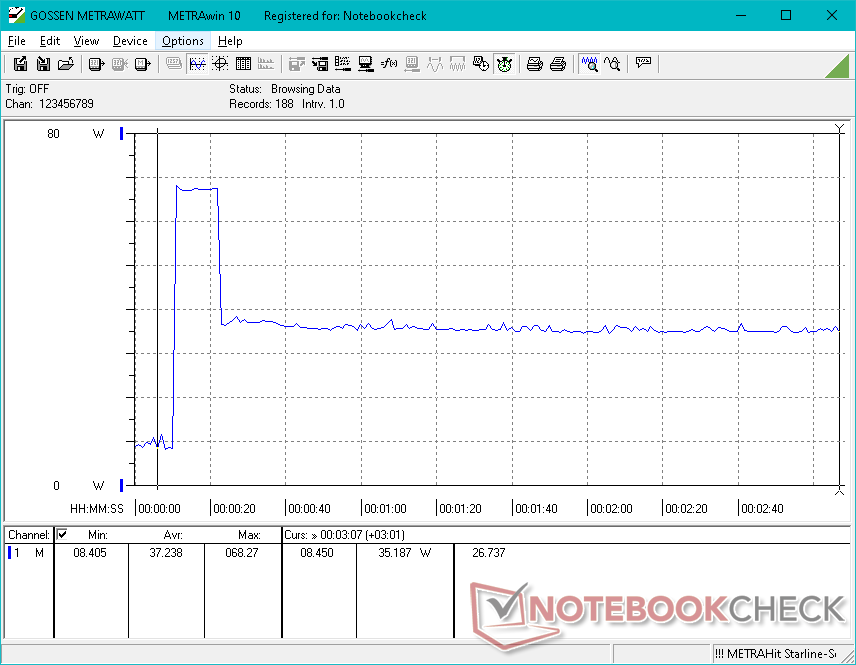
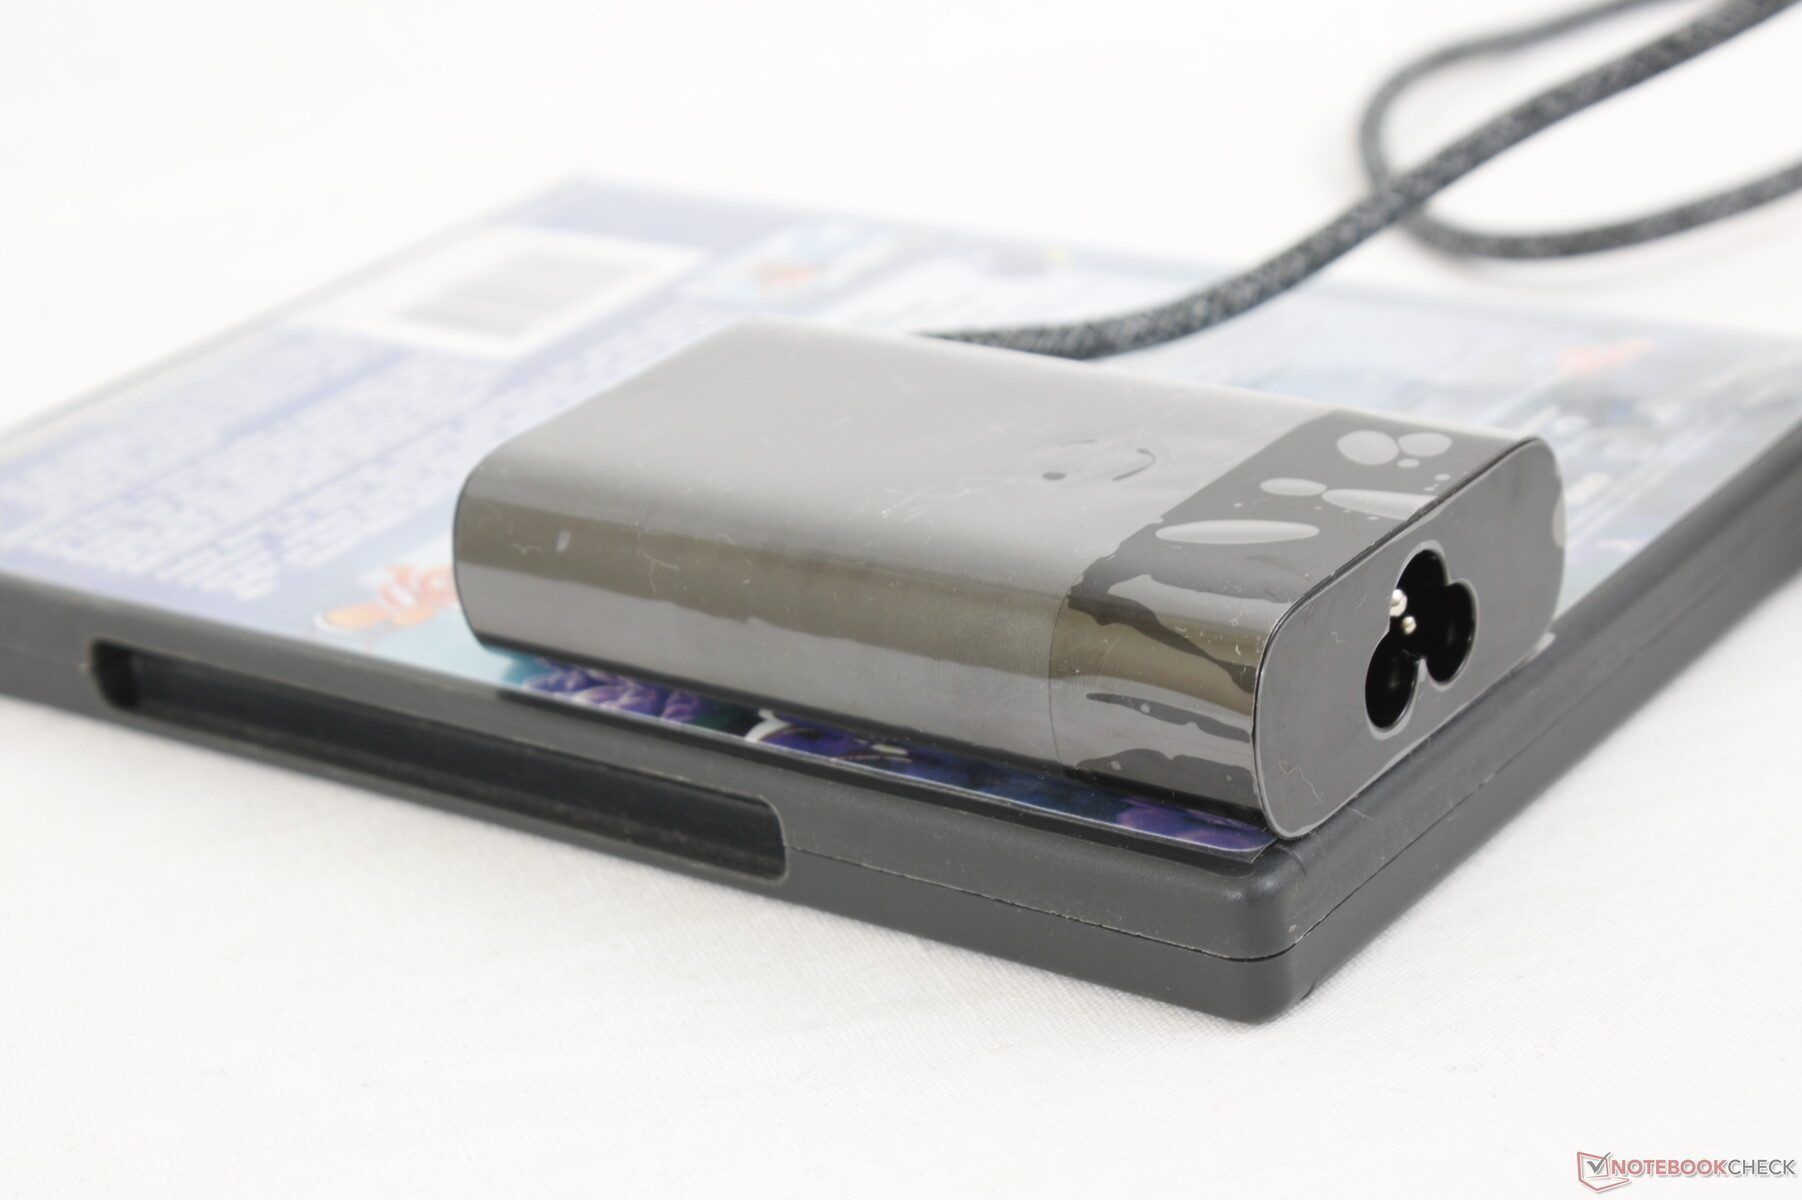
Nous avons pu enregistrer une consommation maximale temporaire de 68,4 W sur le petit adaptateur secteur 65 W (~8,8 x 5,3 x 2,1 cm) lorsque le processeur est utilisé à 100 %. Les limitations thermiques empêchent le CPU de fonctionner à ses fréquences d'horloge Turbo Boost les plus élevées pendant de longues périodes.
| Éteint/en veille | |
| Au repos | |
| Fortement sollicité |
|
Légende:
min: | |
| HP Elite Dragonfly G3 i7-1265U, Iris Xe G7 96EUs, Micron 3400 MTFDKBA512TFH 512GB, IPS, 1920x1280, 13.5" | HP Spectre x360 14t-ea000 i7-1165G7, Iris Xe G7 96EUs, Samsung SSD PM981a MZVLB512HBJQ, IPS, 1920x1280, 13.5" | Dell XPS 13 Plus 9320 i5-1240p i5-1240P, Iris Xe G7 80EUs, Micron 3400 MTFDKBA512TFH 512GB, IPS, 1920x1200, 13.4" | Framework Laptop 13.5 12th Gen Intel i7-1260P, Iris Xe G7 96EUs, WDC PC SN730 SDBPNTY-512G, IPS, 2256x1504, 13.5" | HP EliteBook Folio 13.5-3G2L2EA SD 8cx Gen 2 5G, Adreno 680, Toshiba XG6 KXG60ZNV512G, IPS, 1920x1280, 13.5" | Lenovo ThinkPad X1 Titanium Yoga G1 20QA001RGE i7-1160G7, Iris Xe G7 96EUs, Toshiba BG4 KBG40ZNT512G, IPS, 2256x1504, 13.5" | |
|---|---|---|---|---|---|---|
| Power Consumption | 9% | -70% | -34% | 46% | 0% | |
| Idle Minimum * (Watt) | 3.4 | 3 12% | 10 -194% | 5.3 -56% | 2.3 32% | 3.9 -15% |
| Idle Average * (Watt) | 5.6 | 5.1 9% | 12.3 -120% | 8.4 -50% | 3.7 34% | 7.3 -30% |
| Idle Maximum * (Watt) | 8.4 | 6.4 24% | 15.5 -85% | 11.2 -33% | 5.6 33% | 10.3 -23% |
| Load Average * (Watt) | 40.8 | 39.6 3% | 43 -5% | 57.4 -41% | 13 68% | 30.6 25% |
| Witcher 3 ultra * (Watt) | 35.5 | 39.6 -12% | 43.1 -21% | 46.7 -32% | 25.5 28% | |
| Load Maximum * (Watt) | 68.4 | 56.2 18% | 62.8 8% | 61.2 11% | 25 63% | 57.1 17% |
* ... Moindre est la valeur, meilleures sont les performances
Power Consumption Witcher 3 / Stresstest
Power Consumption external Monitor
Autonomie de la batterie - Longues durées d'utilisation
La capacité de la batterie est passée de 56 Wh sur le Dragonfly Max à 68 Wh sur le Dragonfly G3. L'autonomie du WLAN est néanmoins un peu plus longue, avec presque 12 heures.
Le chargement d'une batterie vide à une batterie pleine prend environ 90 minutes. L'adaptateur secteur USB-C peut être utilisé pour charger rapidement d'autres appareils USB-C, notamment les smartphones et les tablettes.
| HP Elite Dragonfly G3 i7-1265U, Iris Xe G7 96EUs, 68 Wh | HP Spectre x360 14t-ea000 i7-1165G7, Iris Xe G7 96EUs, 66 Wh | Dell XPS 13 Plus 9320 i5-1240p i5-1240P, Iris Xe G7 80EUs, 55 Wh | Framework Laptop 13.5 12th Gen Intel i7-1260P, Iris Xe G7 96EUs, 55 Wh | HP EliteBook Folio 13.5-3G2L2EA SD 8cx Gen 2 5G, Adreno 680, 46 Wh | Lenovo ThinkPad X1 Titanium Yoga G1 20QA001RGE i7-1160G7, Iris Xe G7 96EUs, 44.5 Wh | |
|---|---|---|---|---|---|---|
| Autonomie de la batterie | -12% | -43% | -36% | 22% | -38% | |
| Reader / Idle (h) | 37.8 | 36.4 -4% | ||||
| WiFi v1.3 (h) | 11.8 | 11.8 0% | 8 -32% | 7.5 -36% | 14.6 24% | 8.4 -29% |
| Load (h) | 3.5 | 2.4 -31% | 1.6 -54% | 4.2 20% | 1.9 -46% | |
| H.264 (h) | 11.4 |
Points positifs
Points négatifs
Verdict - Maximiser la fonctionnalité, les caractéristiques et l'esthétique
Le Dragonfly G3 répond à l'une de nos plus grandes plaintes concernant le Dragonfly G2 en faisant évoluer la série du facteur de forme 16:9 vers un format 3:2. le format 16:9 convient bien aux ordinateurs portables grand public et à la lecture de la plupart des vidéos, mais les formats 3:2 ou 16:10 sont généralement plus appropriés pour le public cible des utilisateurs de bureau et des professionnels.
Outre la refonte visuelle, la webcam en particulier mérite des éloges car elle est l'une des meilleures que nous ayons vues sur un ordinateur portable. les 5 MP peuvent sembler dérisoires aux utilisateurs de smartphones, mais c'est littéralement 5 fois la résolution ( !) des webcams de la plupart des autres ordinateurs portables actuels. Si vous accordez de l'importance à la qualité vidéo et que vous faites beaucoup de vidéoconférences, alors ne cherchez pas plus loin que le Dragonfly G3. Parmi les autres points forts, citons les ventilateurs plus silencieux, le très grand pavé tactile, les performances rapides du SSD sans étranglement et l'excellente qualité audio pour sa catégorie de taille.
Le Dragonfly G3 est très beau et encore plus agréable à utiliser. Cependant, les chasseurs de performances de processeur peuvent vouloir regarder ailleurs car les objectifs de TDP sont relativement bas sur le HP.
La grosse astérisque sur le Dragonfly G3 concerne les performances de son processeur. Lorsque le Dell Latitude 9430 2-en-1 concurrent est capable de faire tourner le même processeur Core i7-1265U 50 % plus vite, alors vous savez que vous ne bénéficiez pas de tous les avantages de la 12e génération d'Intel sur le modèle HP. Le bruit des ventilateurs est plus silencieux, c'est certain, mais nous aurions préféré une option permettant d'utiliser des ventilateurs plus bruyants si cela avait permis d'obtenir des performances plus rapides pour ceux qui en ont besoin.
Pour le modèle de l'année prochaine, nous aimerions bien que Sure View soit détaché de l'option de panneau 1000-nit. Vous devrez les accepter comme une paire à partir de cet écrit si vous configurez avec l'un ou l'autre. En outre, des options de taux de rafraîchissement des écrans plus élevés comme ceux que l'on trouve sur la série Asus ZenBook amélioreraient l'expérience utilisateur. Un couvercle plus rigide et une garantie de base plus longue de 36 mois contribueraient grandement à améliorer la robustesse et la longévité, respectivement.
Prix et disponibilité
Le HP Elite Dragonfly G3 n'est pas encore largement disponible sur Amazon, Best Buy, ou d'autres points de vente importants. Nous recommandons d'acheter directement auprès de HP pour bénéficier des options les plus configurables. Les configurations de base commencent à 1 999 USD, tandis que notre configuration spécifique se vend un peu moins de 2 700 USD.
HP Elite Dragonfly G3
- 08/28/2022 v7 (old)
Allen Ngo
Price comparison

