Test du HP ZBook Fury 16 G9 : l'alternative aux Dell Precision 7670 et ThinkPad P16 G1

La série ZBook Fury abrite les stations de travail mobiles les plus performantes de HP, contrairement à la série ZBook Studio de milieu de gamme ZBook Studio et de la série ZBook Firefly.
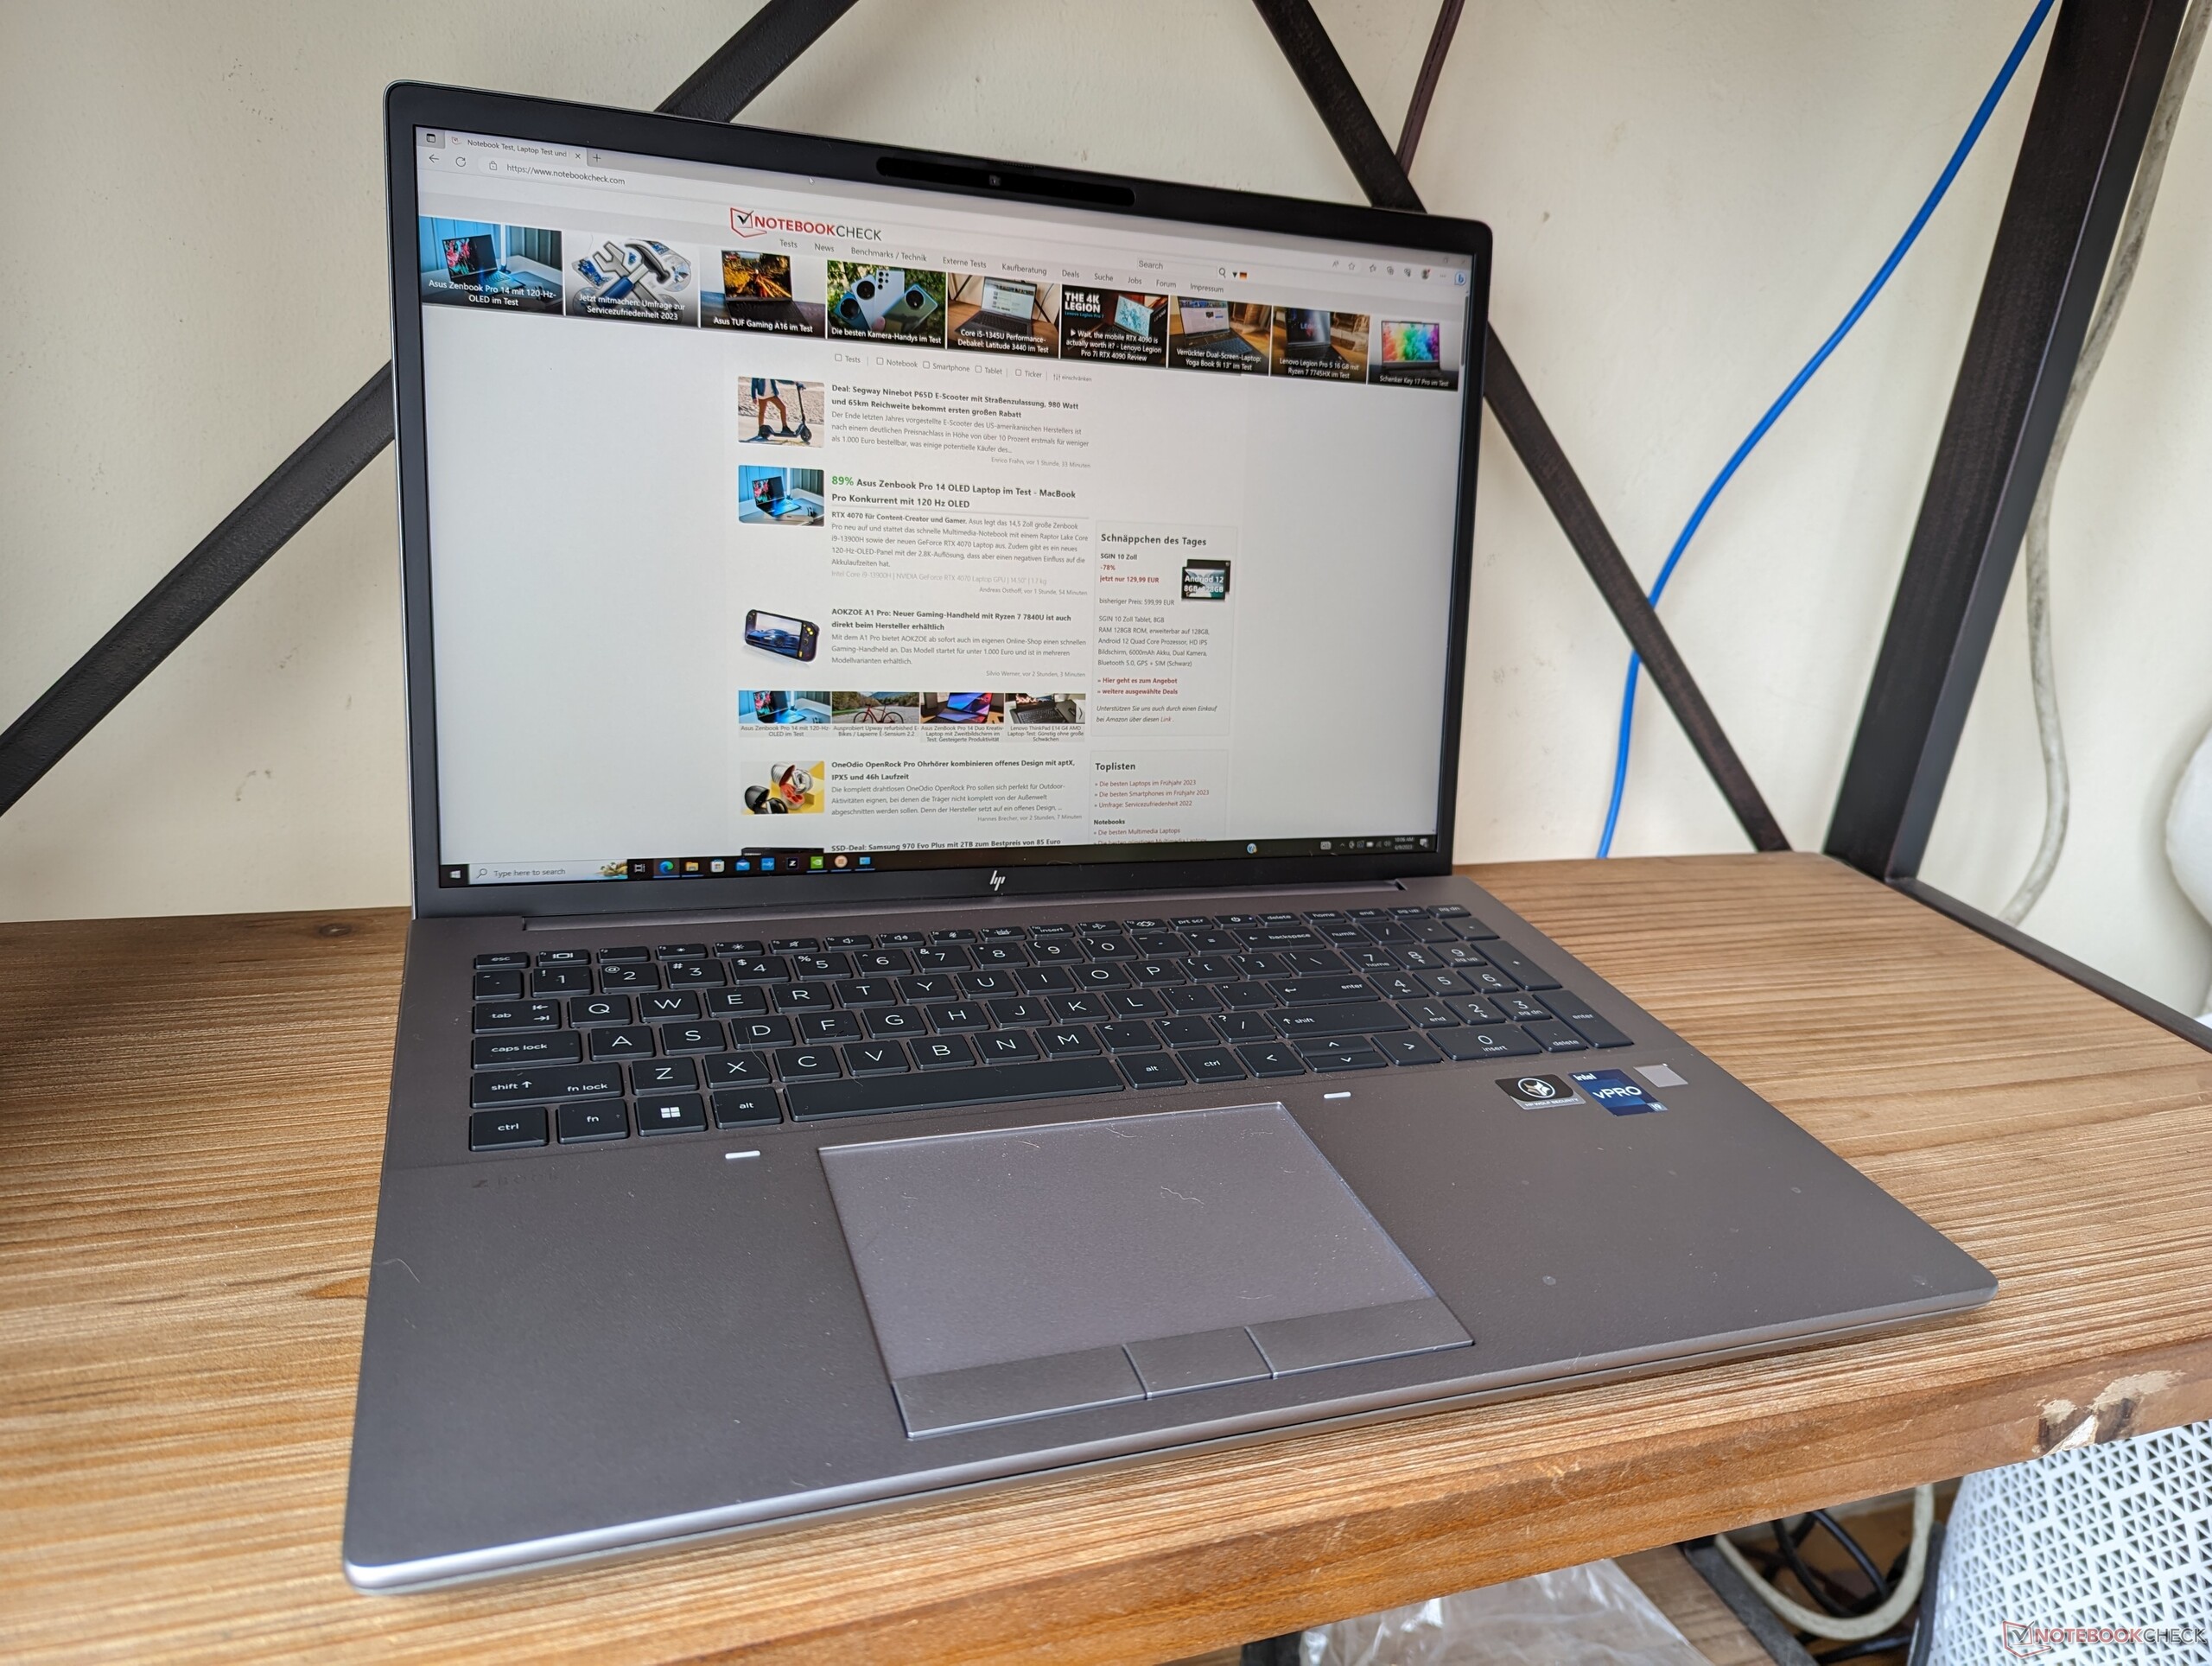
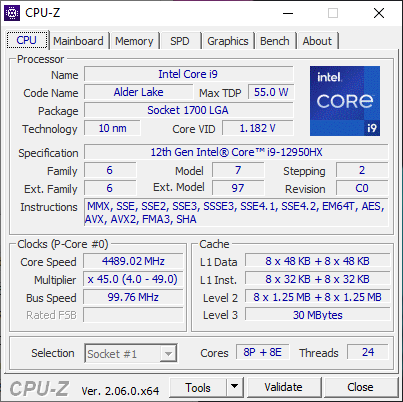
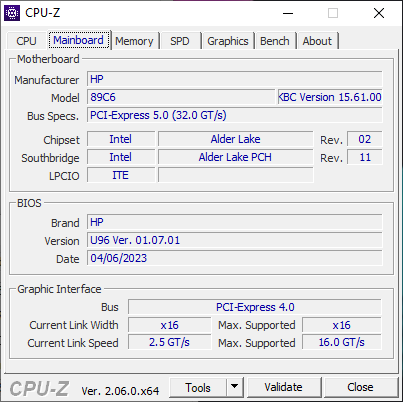
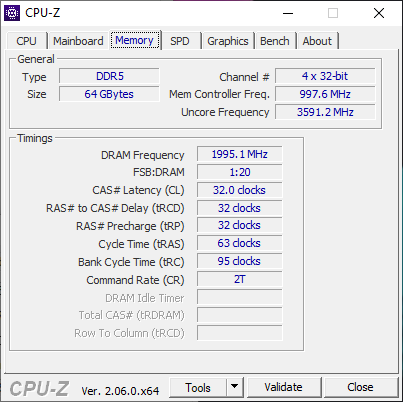
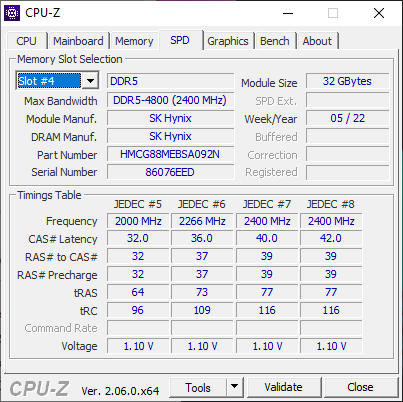
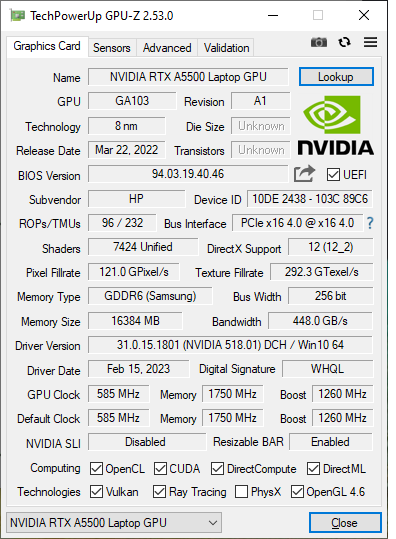
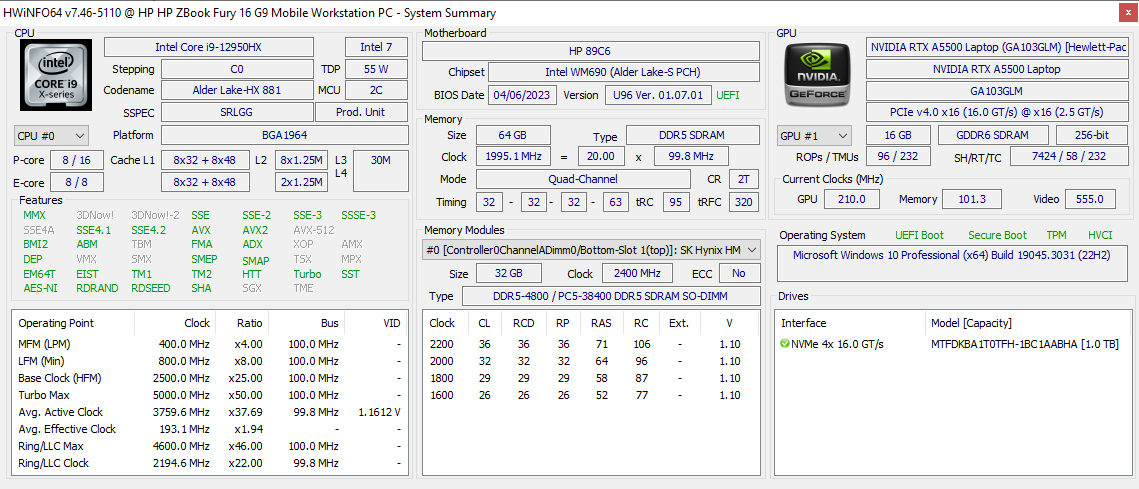
Notre appareil est une configuration haut de gamme du Fury 16 G9 avec le processeur Alder Lake-H Core i9-12950HX de 12e génération, le GPU RTX A5500 Ampere, 64 Go de RAM et un écran IPS 3840 x 2400, vendu au détail à un peu plus de 4000 USD. Les options configurables sont vastes avec LTE, 5G, et même des panneaux OLED comme listé ici. Notez que le ZBook Fury G10 avec des options Intel 13e génération plus récentes est également disponible, mais le châssis reste identique à notre Fury G9.
Les alternatives au ZBook Fury 16 G9 comprennent d'autres stations de travail mobiles de 16 pouces comme le Dell Precision 7670, MSI CreatorPro Z16P, Asus ProArt StudioBook 16ou Lenovo ThinkPad P16 G1.
Plus de commentaires sur HP :
Potentiella konkurrenter i jämförelse
Note | Date | Modèle | Poids | Épaisseur | Taille | Résolution | Prix |
|---|---|---|---|---|---|---|---|
| 91 % v7 (old) | 06/23 | HP ZBook Fury 16 G9 i9-12950HX, RTX A5500 Laptop GPU | 2.6 kg | 28.5 mm | 16.00" | 3840x2400 | |
| 90.1 % v7 (old) | 11/22 | HP ZBook Studio 16 G9 62U04EA i7-12800H, RTX A2000 Laptop GPU | 1.8 kg | 19 mm | 16.00" | 3840x2400 | |
| 82.9 % v7 (old) | 10/22 | HP ZBook Firefly 16 G9-6B897EA i7-1265U, T550 Laptop GPU | 2 kg | 19.2 mm | 16.00" | 1920x1200 | |
| 91 % v7 (old) | 02/23 | Lenovo ThinkPad P16 G1 RTX A5500 i9-12950HX, RTX A5500 Laptop GPU | 3 kg | 30.23 mm | 16.00" | 3840x2400 | |
| 89.1 % v7 (old) | 12/22 | Dell Precision 7000 7670 Performance i9-12950HX, RTX A5500 Laptop GPU | 2.8 kg | 25.95 mm | 16.00" | 3840x2400 | |
| 84.3 % v7 (old) | 11/22 | MSI CreatorPro Z16P B12UKST i7-12700H, RTX A3000 Laptop GPU | 2.4 kg | 19 mm | 16.00" | 2560x1600 |
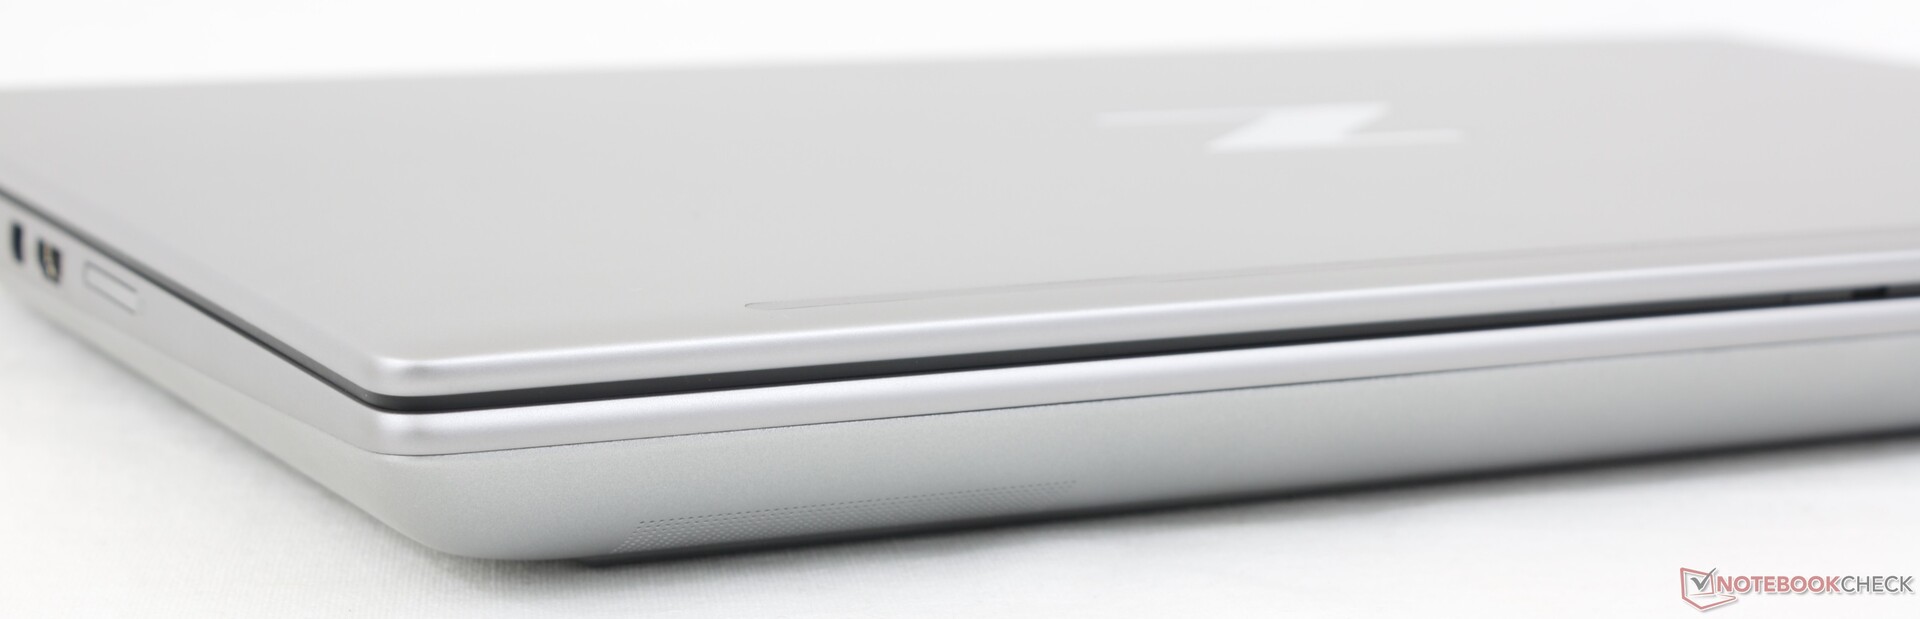
Étui - Classic ZBook
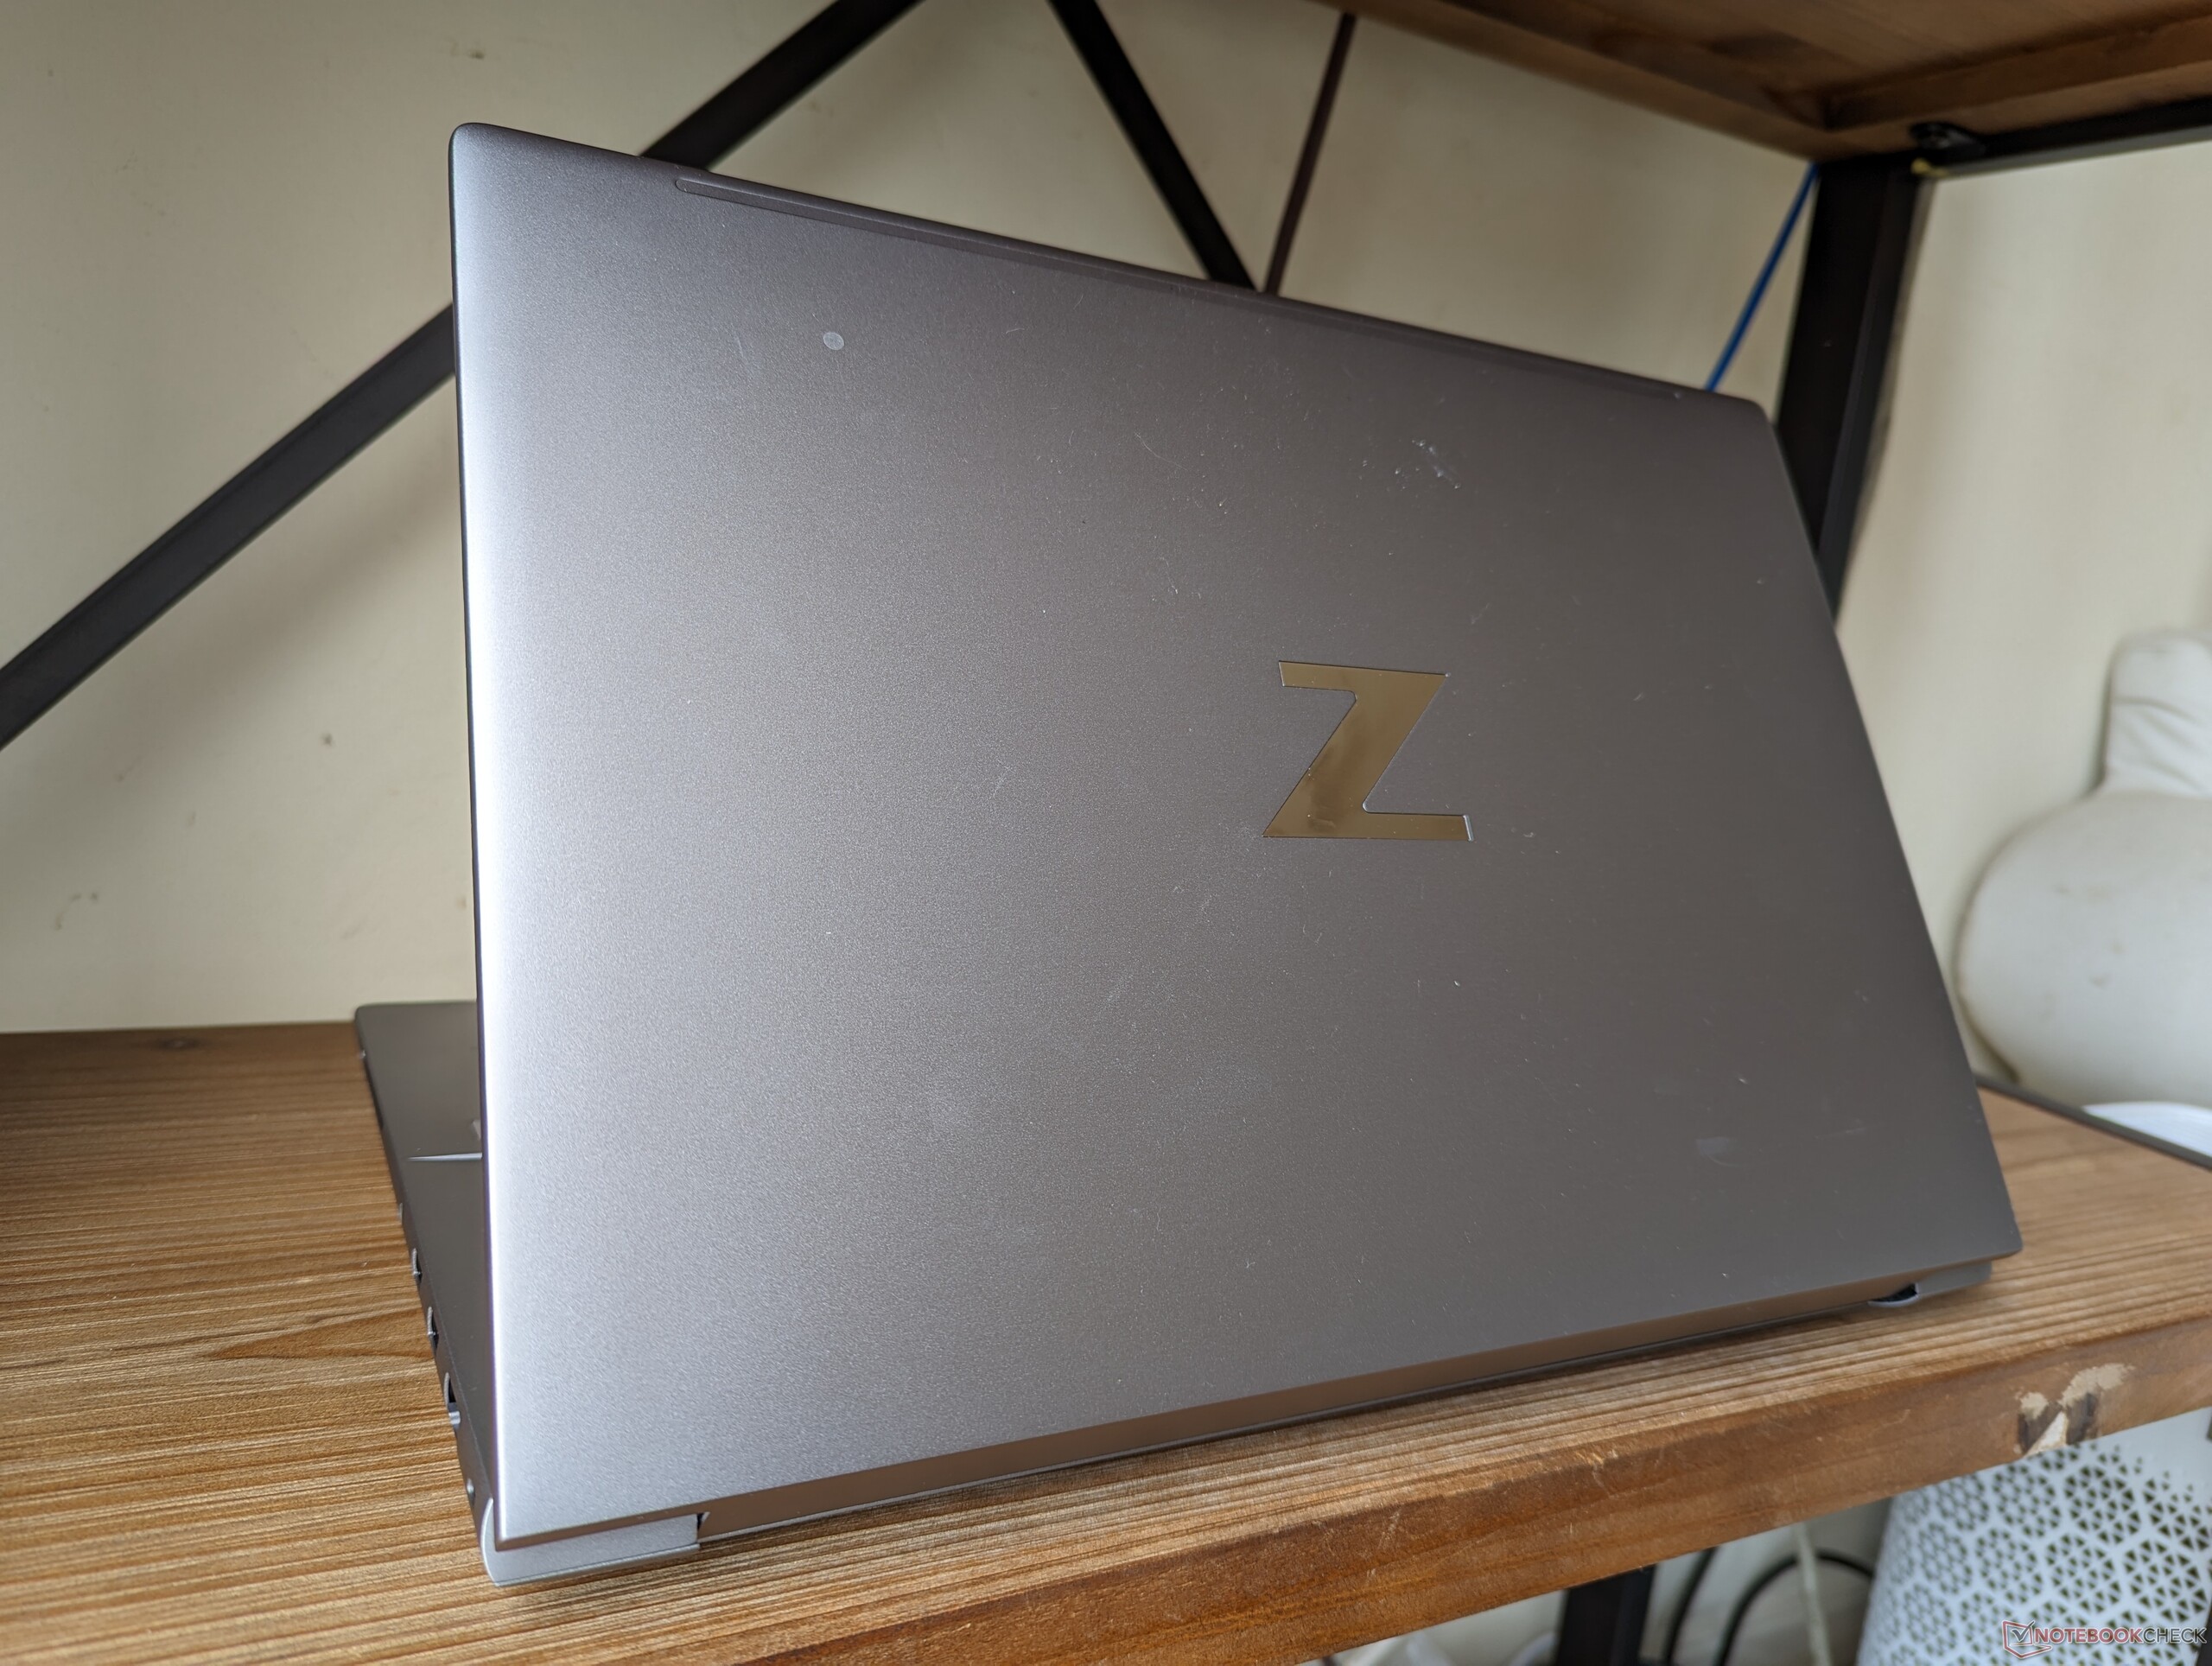
Le châssis est constitué des mêmes matériaux en alliage d'aluminium que les propriétaires de ZBook connaissent déjà. Les torsions, les déformations et les craquements sont minimes et comparables à ceux du Precision 7670 ce qui donne une bonne première impression et ne pose pas de problème. La flexion est plus visible lorsqu'on applique une pression sur le centre du couvercle extérieur où se trouve le logo "Z", mais ce n'est pas une cause d'inquiétude à long terme.
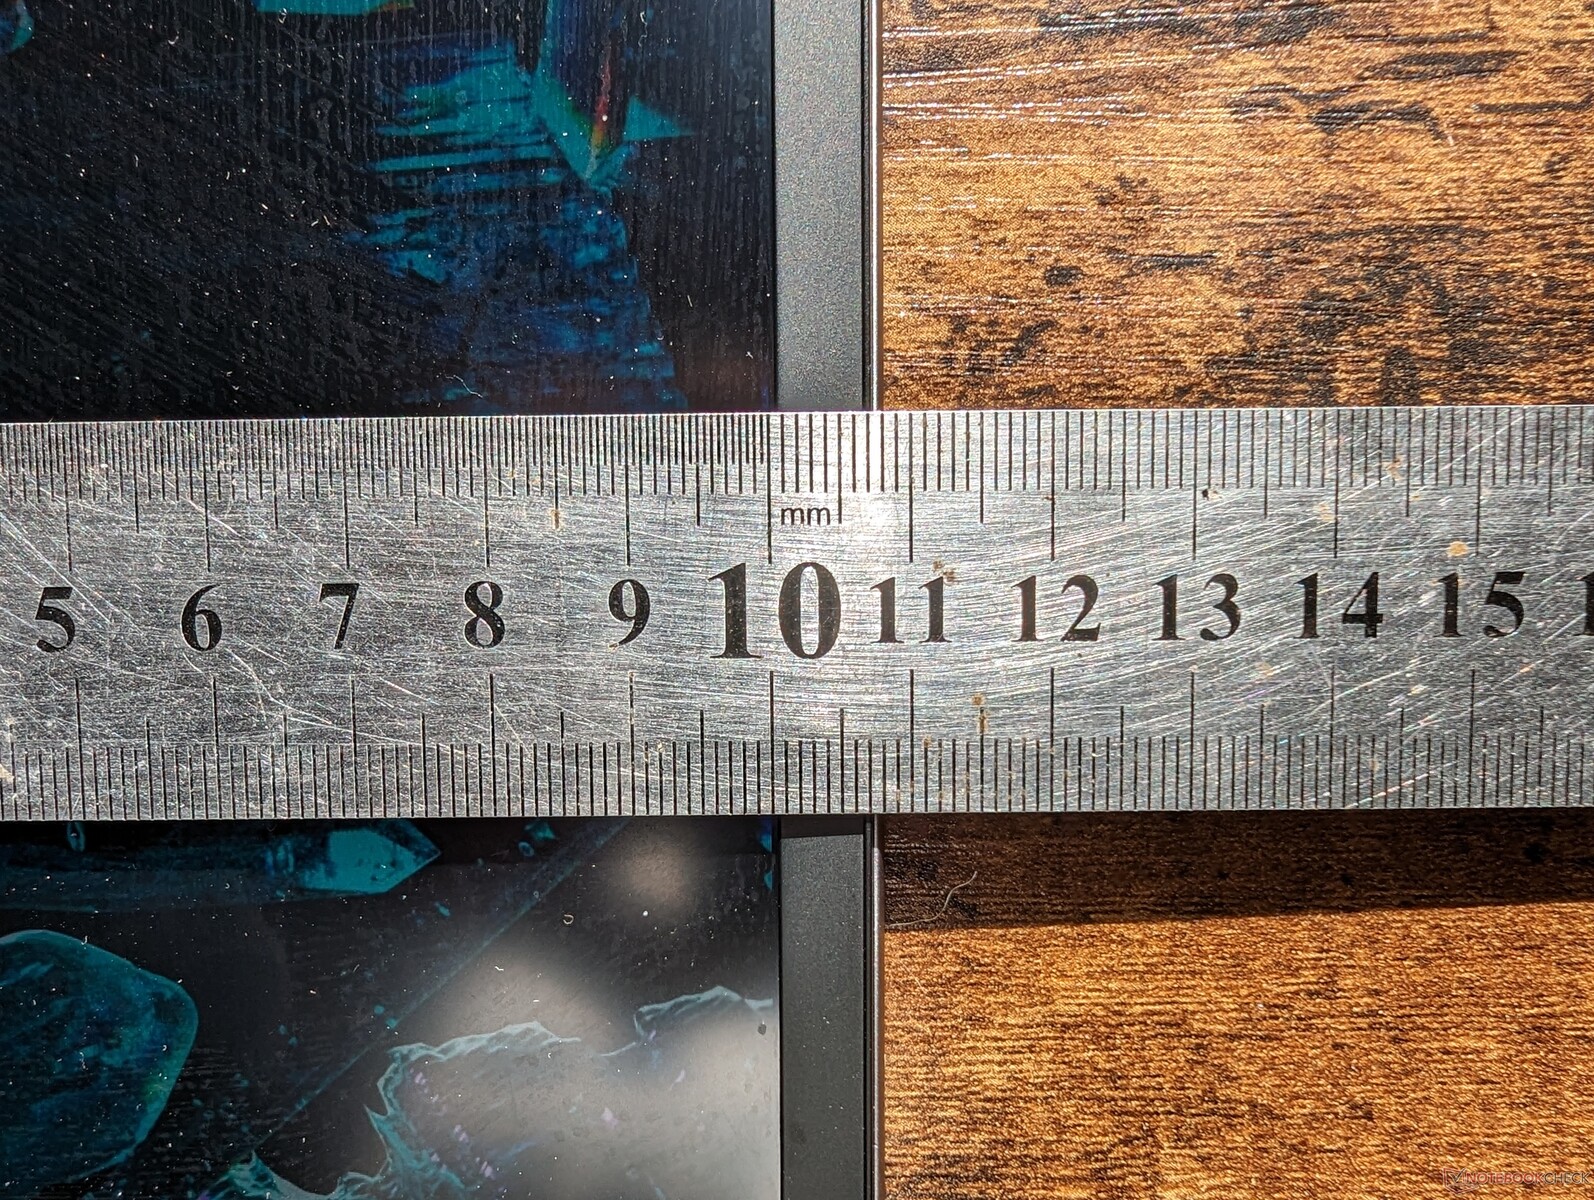
Le HP est sensiblement plus léger que leThinkPad P16 G1 et Precision 7670, bien qu'ils soient tous dotés d'un processeur et d'un GPU similaires. Cependant, cela se fait au détriment des performances, comme le montrent nos comparaisons ci-dessous. Pour une meilleure portabilité, les utilisateurs peuvent opter pour le ZBook Firefly 16 G9 ou le ZBook Studio 16 G9, beaucoup plus fins.
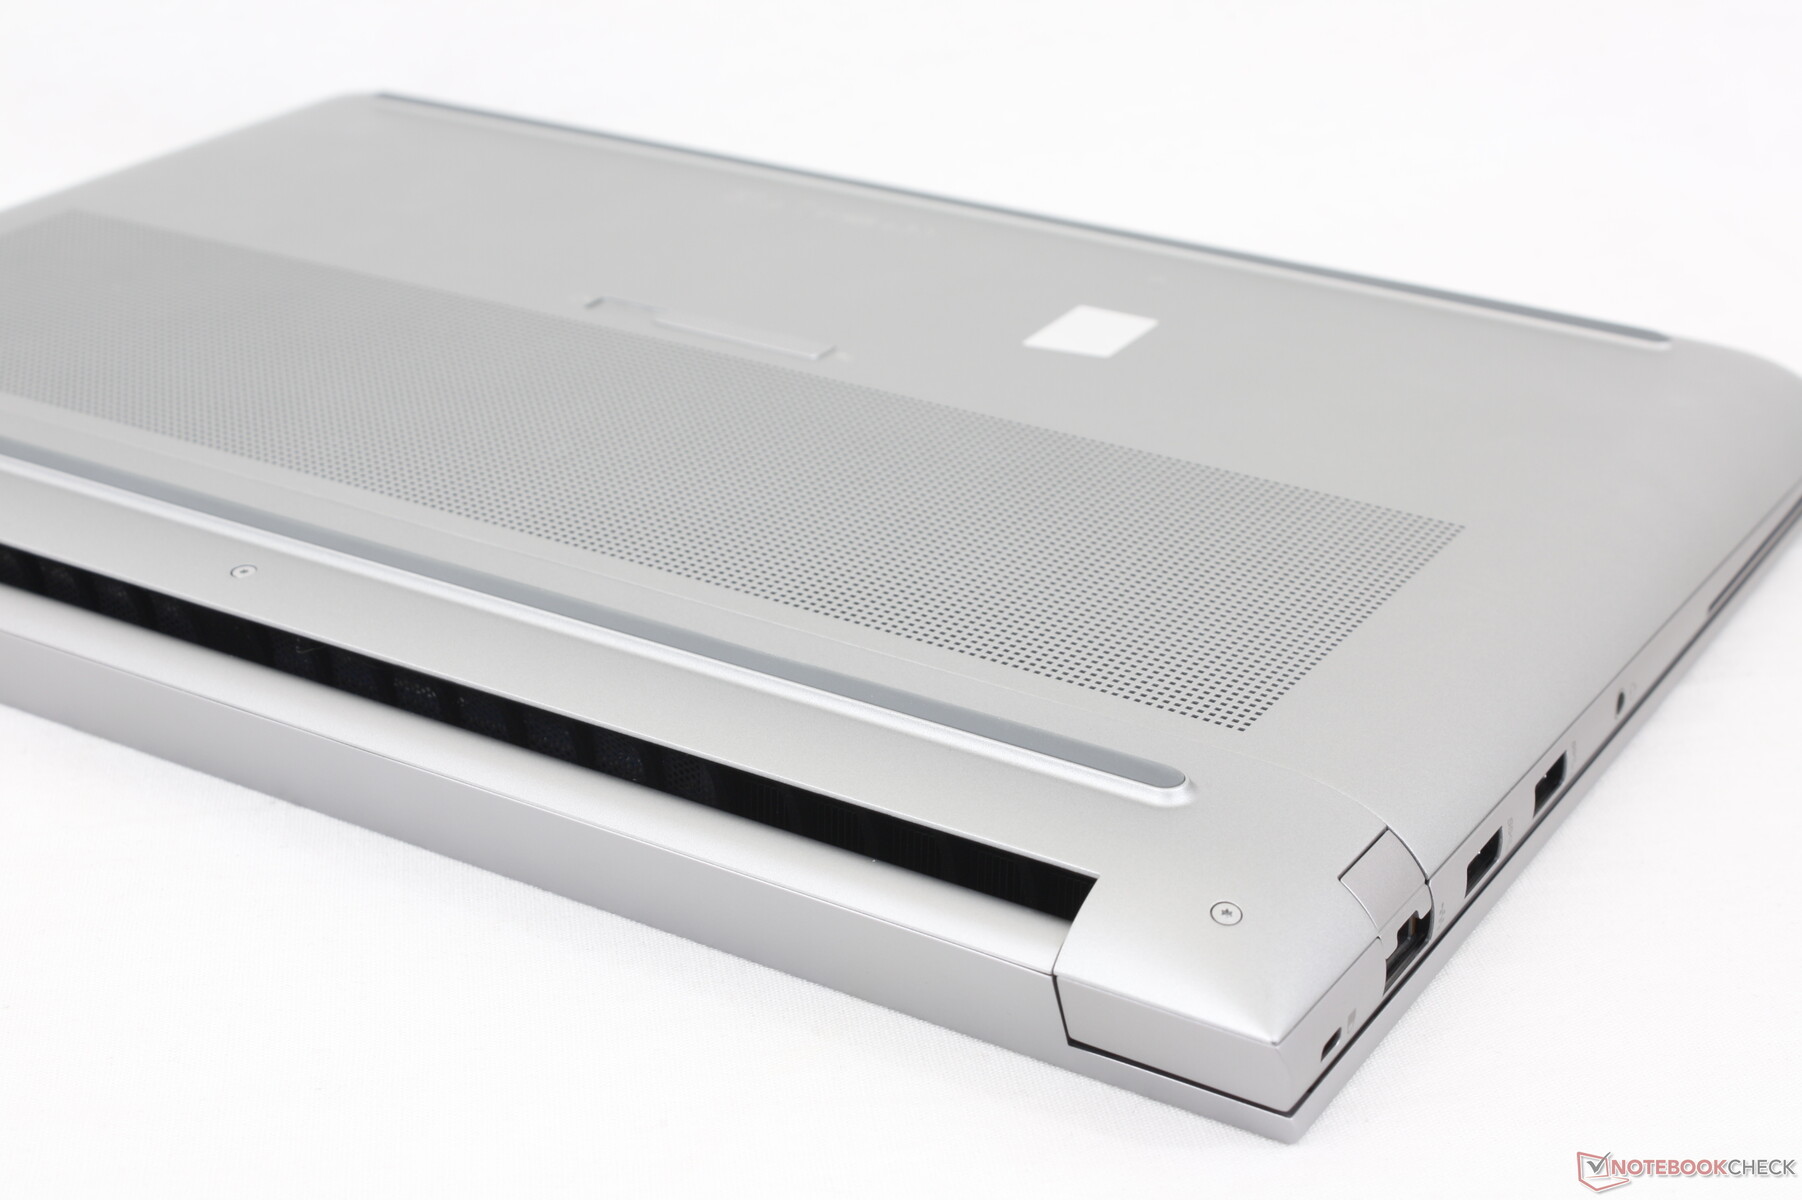
Le cadre inférieur du Fury G9 est étonnamment étroit pour une station de travail, ce qui contribue à réduire la longueur du modèle par rapport à la plupart des autres modèles de 16 pouces.
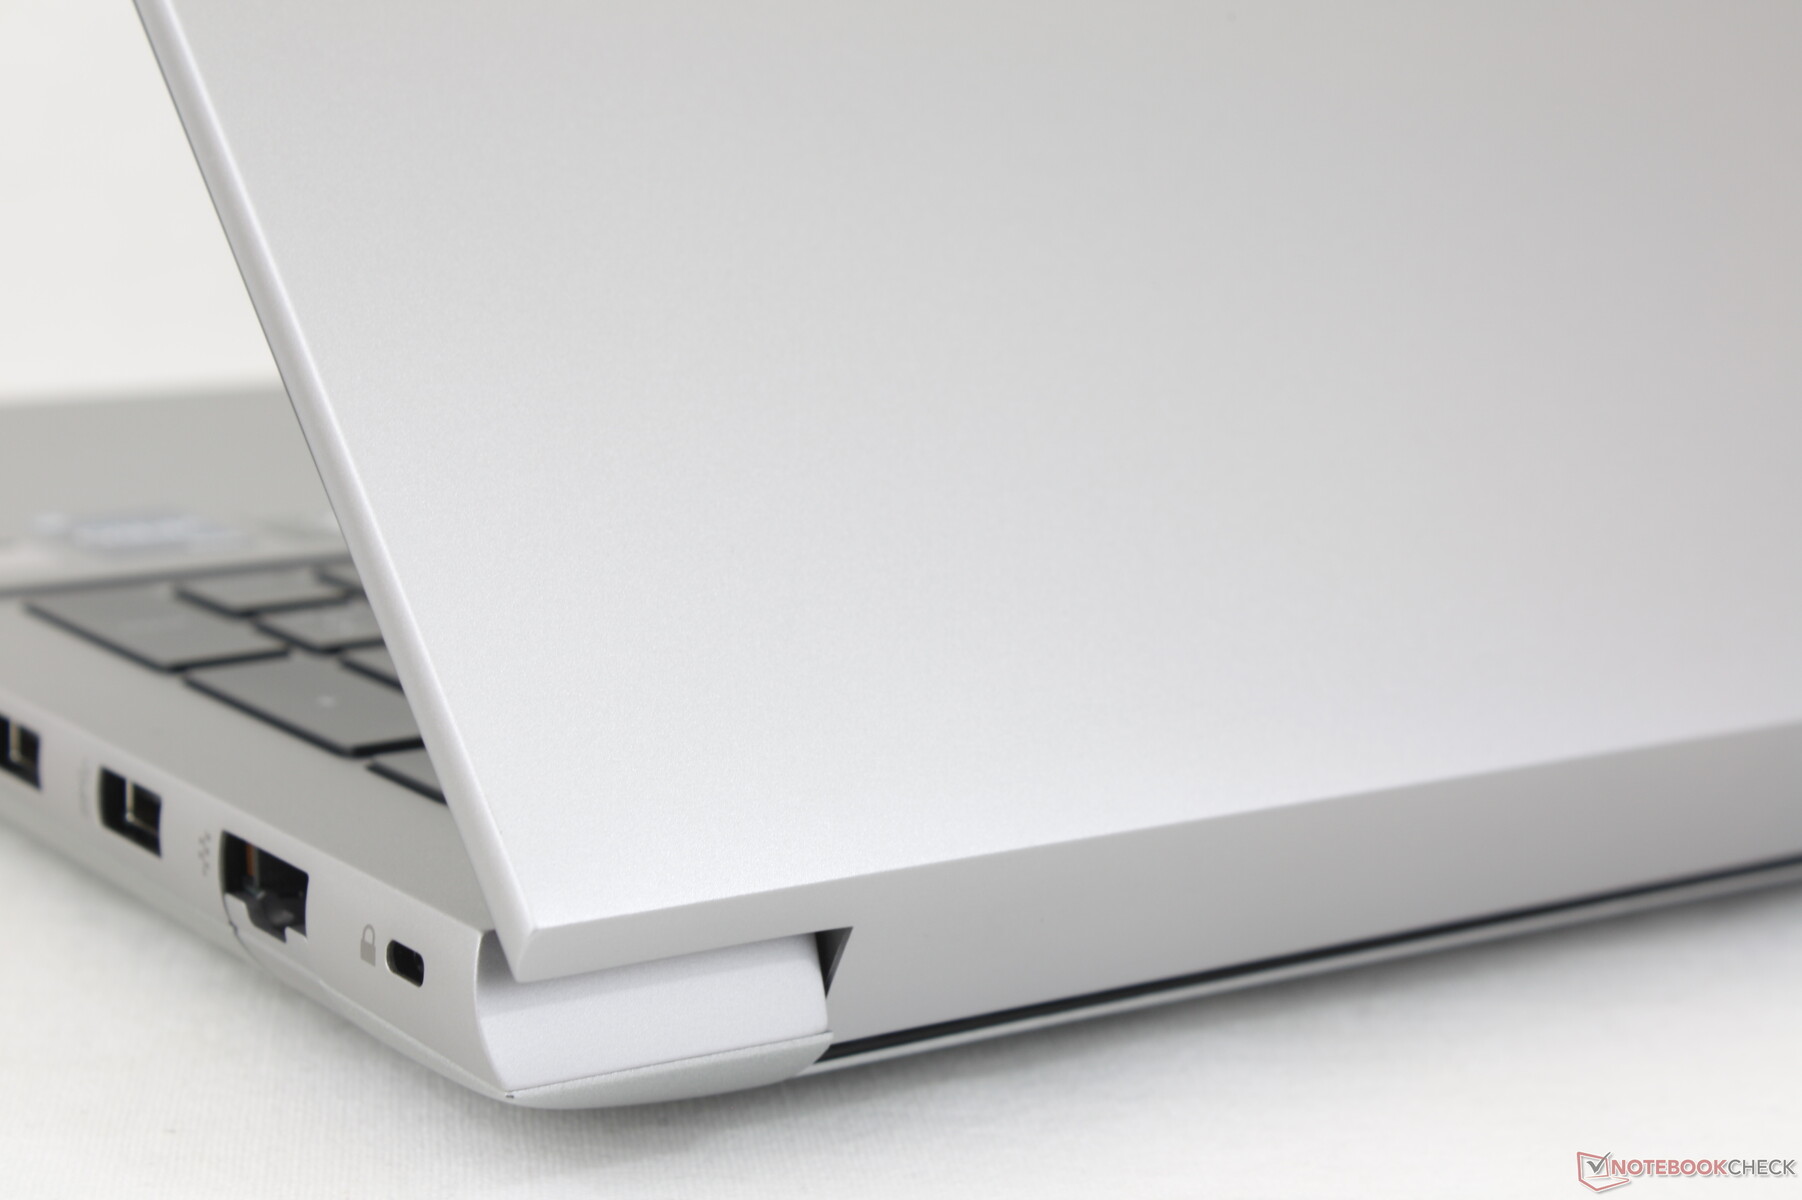
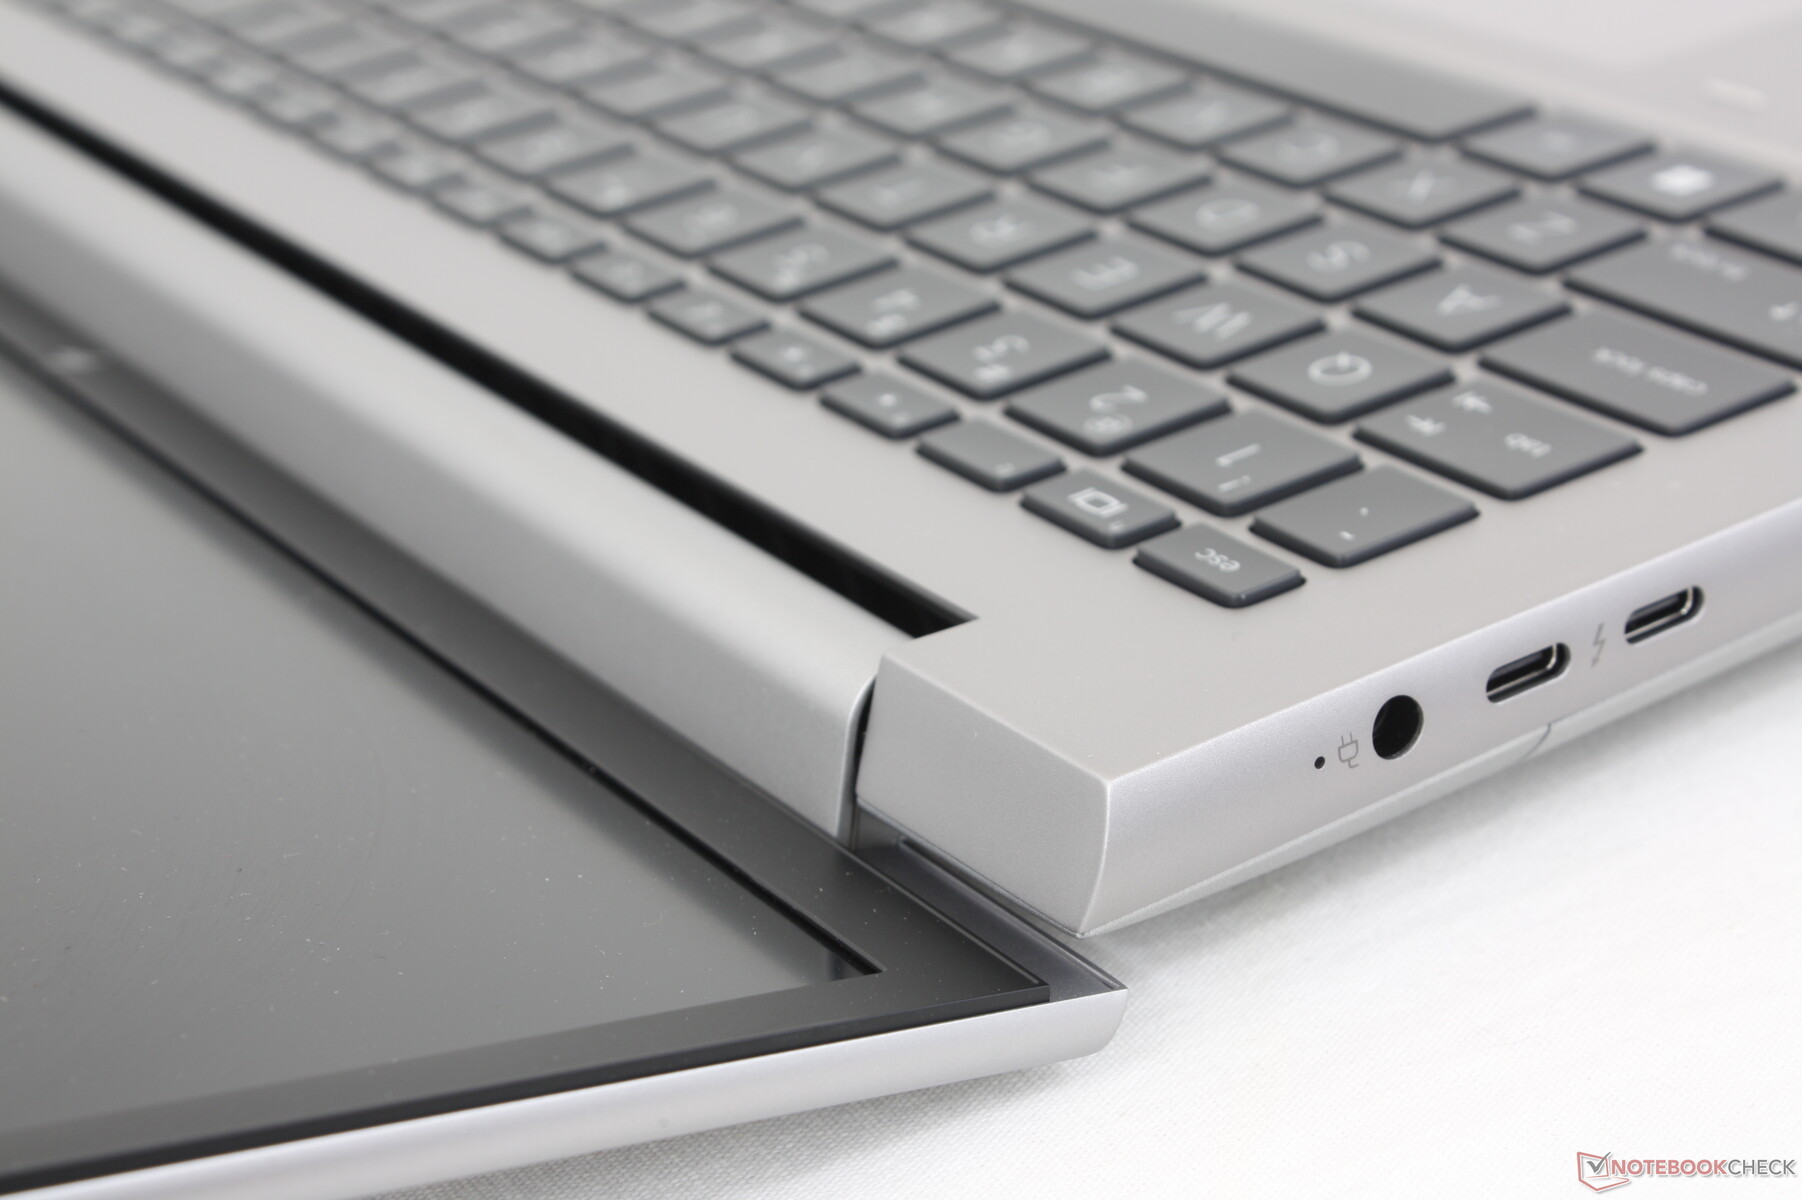
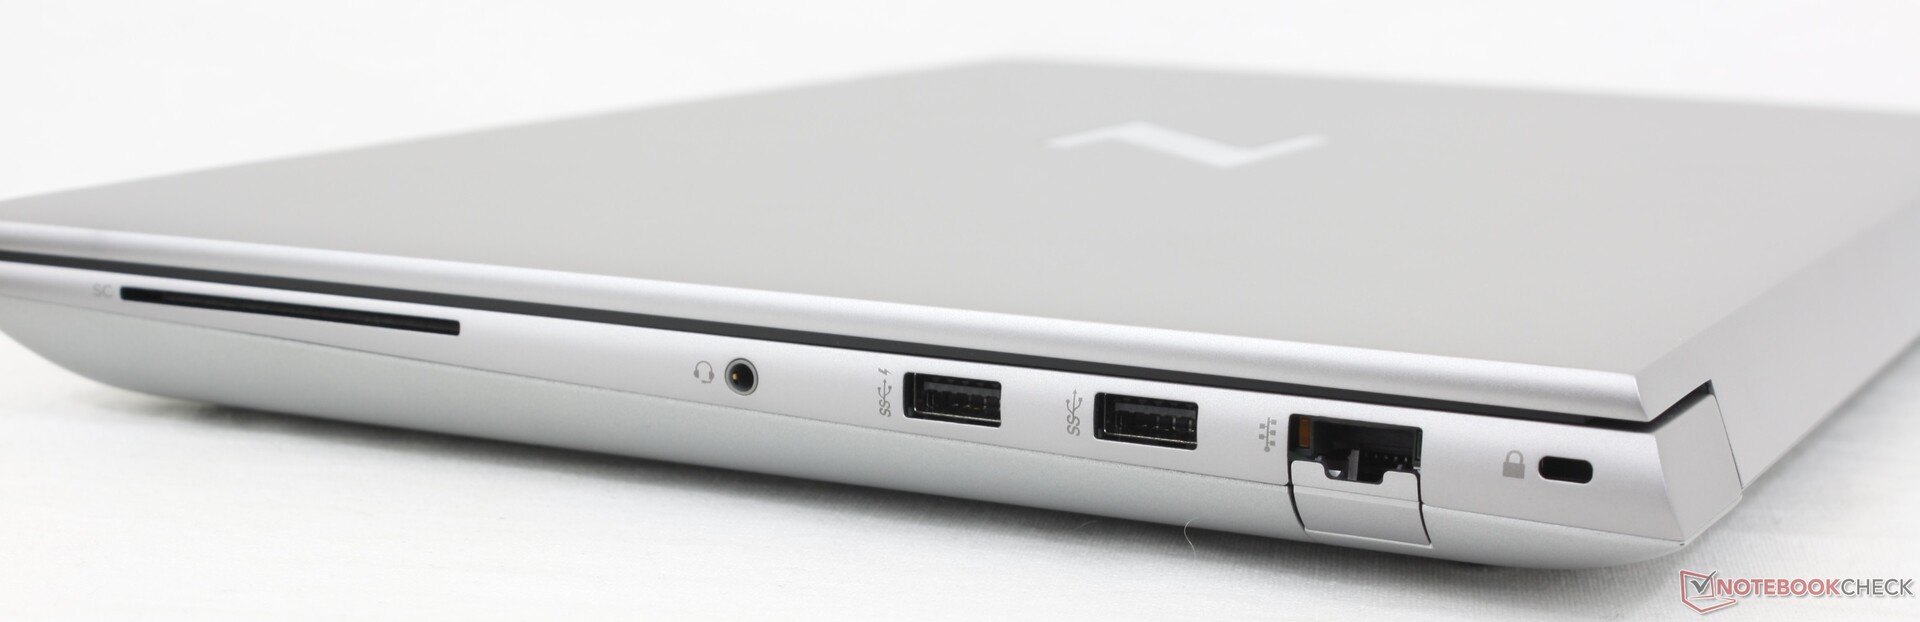
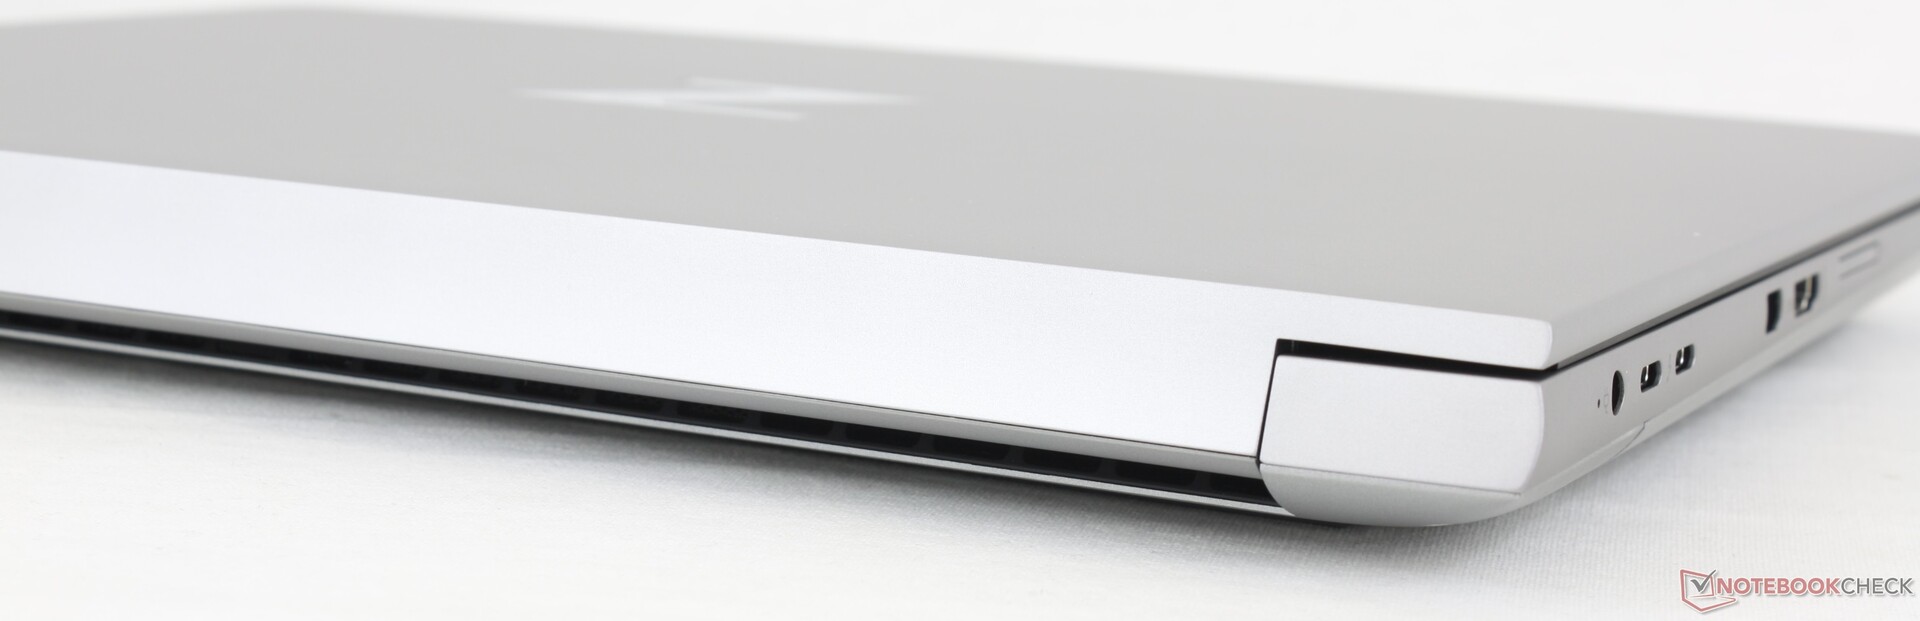
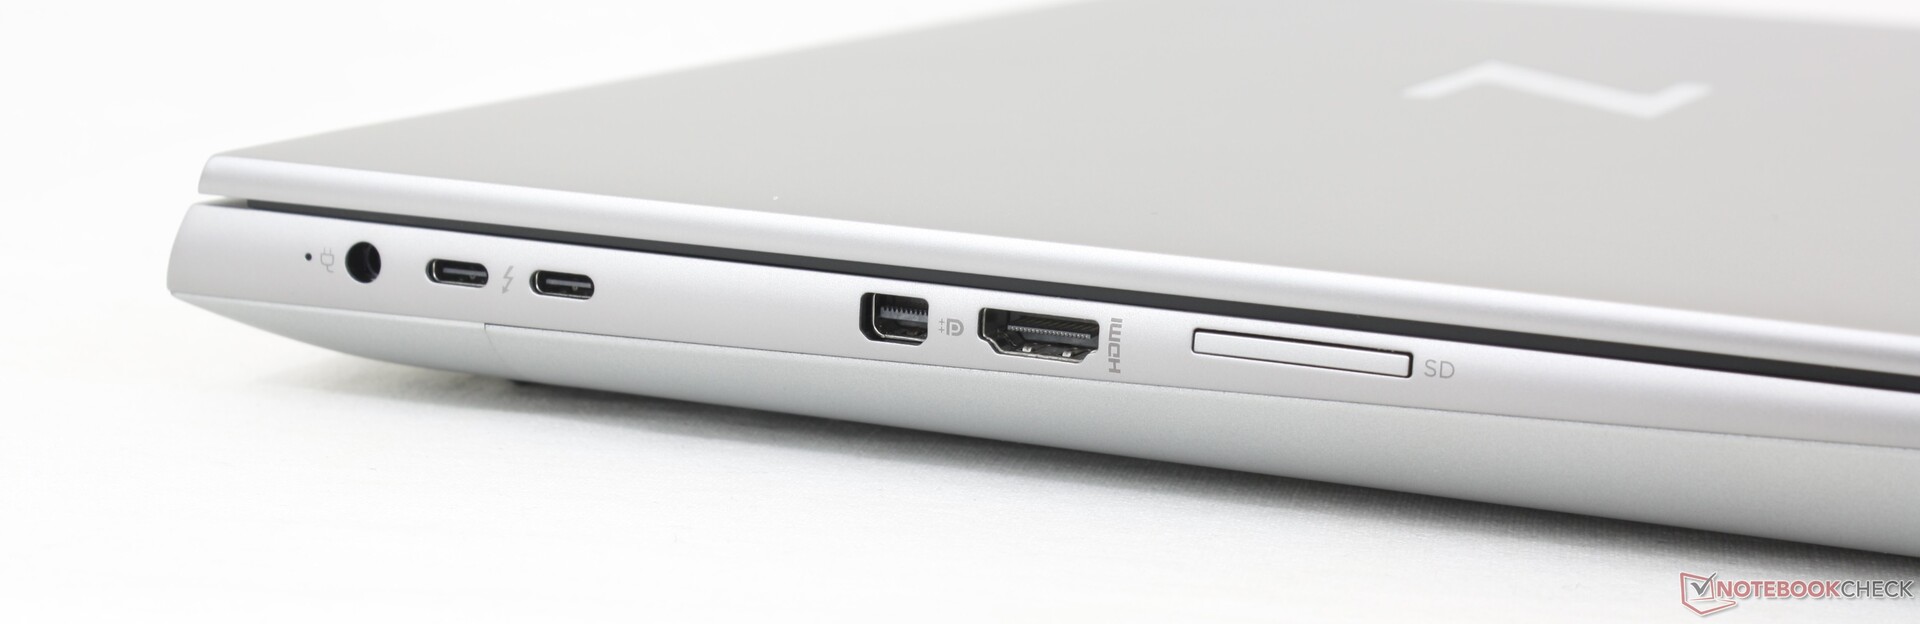
Connectivité
Notre HP comprend tous les ports que l'on trouve sur le Precision 7670, mais avec un mini-DisplayPort intégré au lieu d'un troisième port USB-C. En fait, il s'agit de l'une des rares stations de travail mobiles avec une option mini-DisplayPort.
Le positionnement des ports aurait pu être meilleur en ce qui concerne les deux ports USB-C, car ils sont très serrés à côté du port de l'adaptateur secteur. Le fait de brancher certains adaptateurs ou câbles sur un port, par exemple, pourrait potentiellement bloquer l'accès aux deux autres ports.
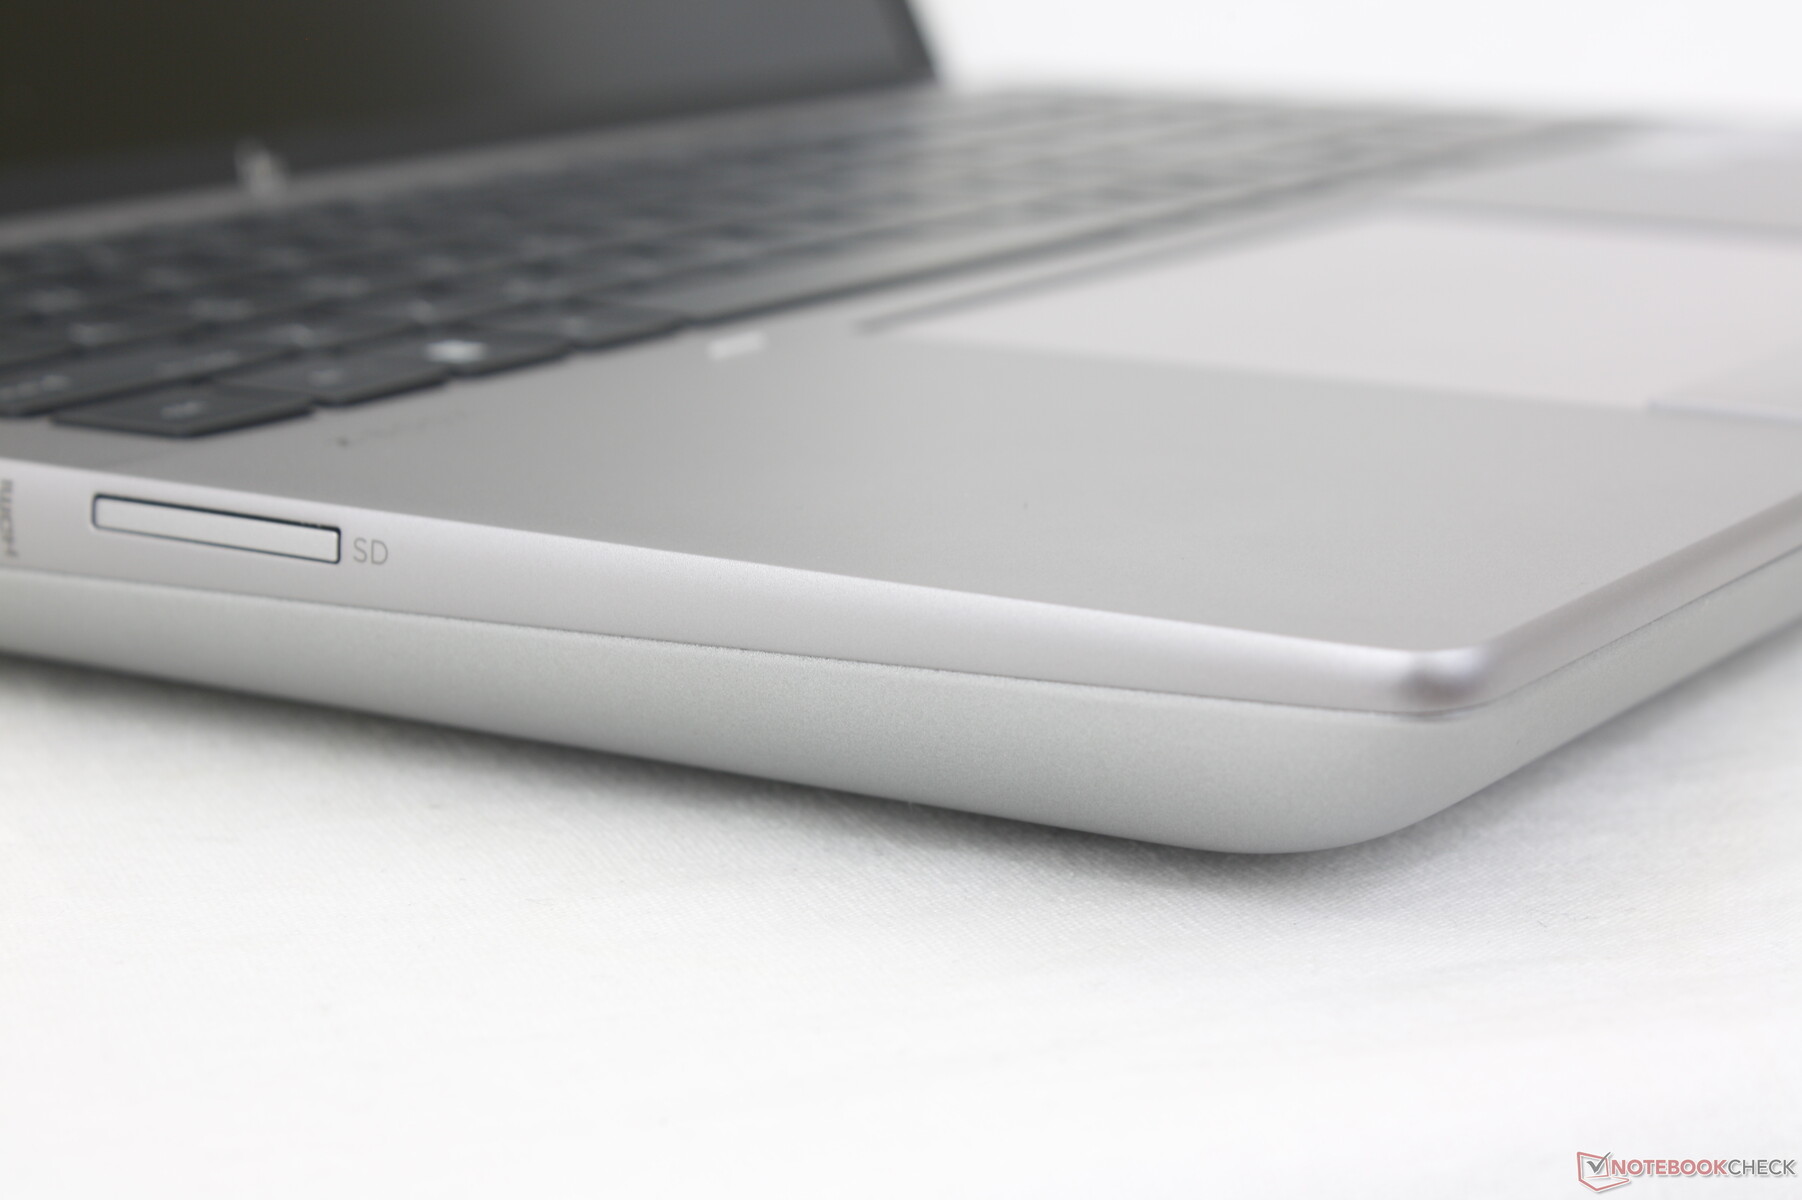
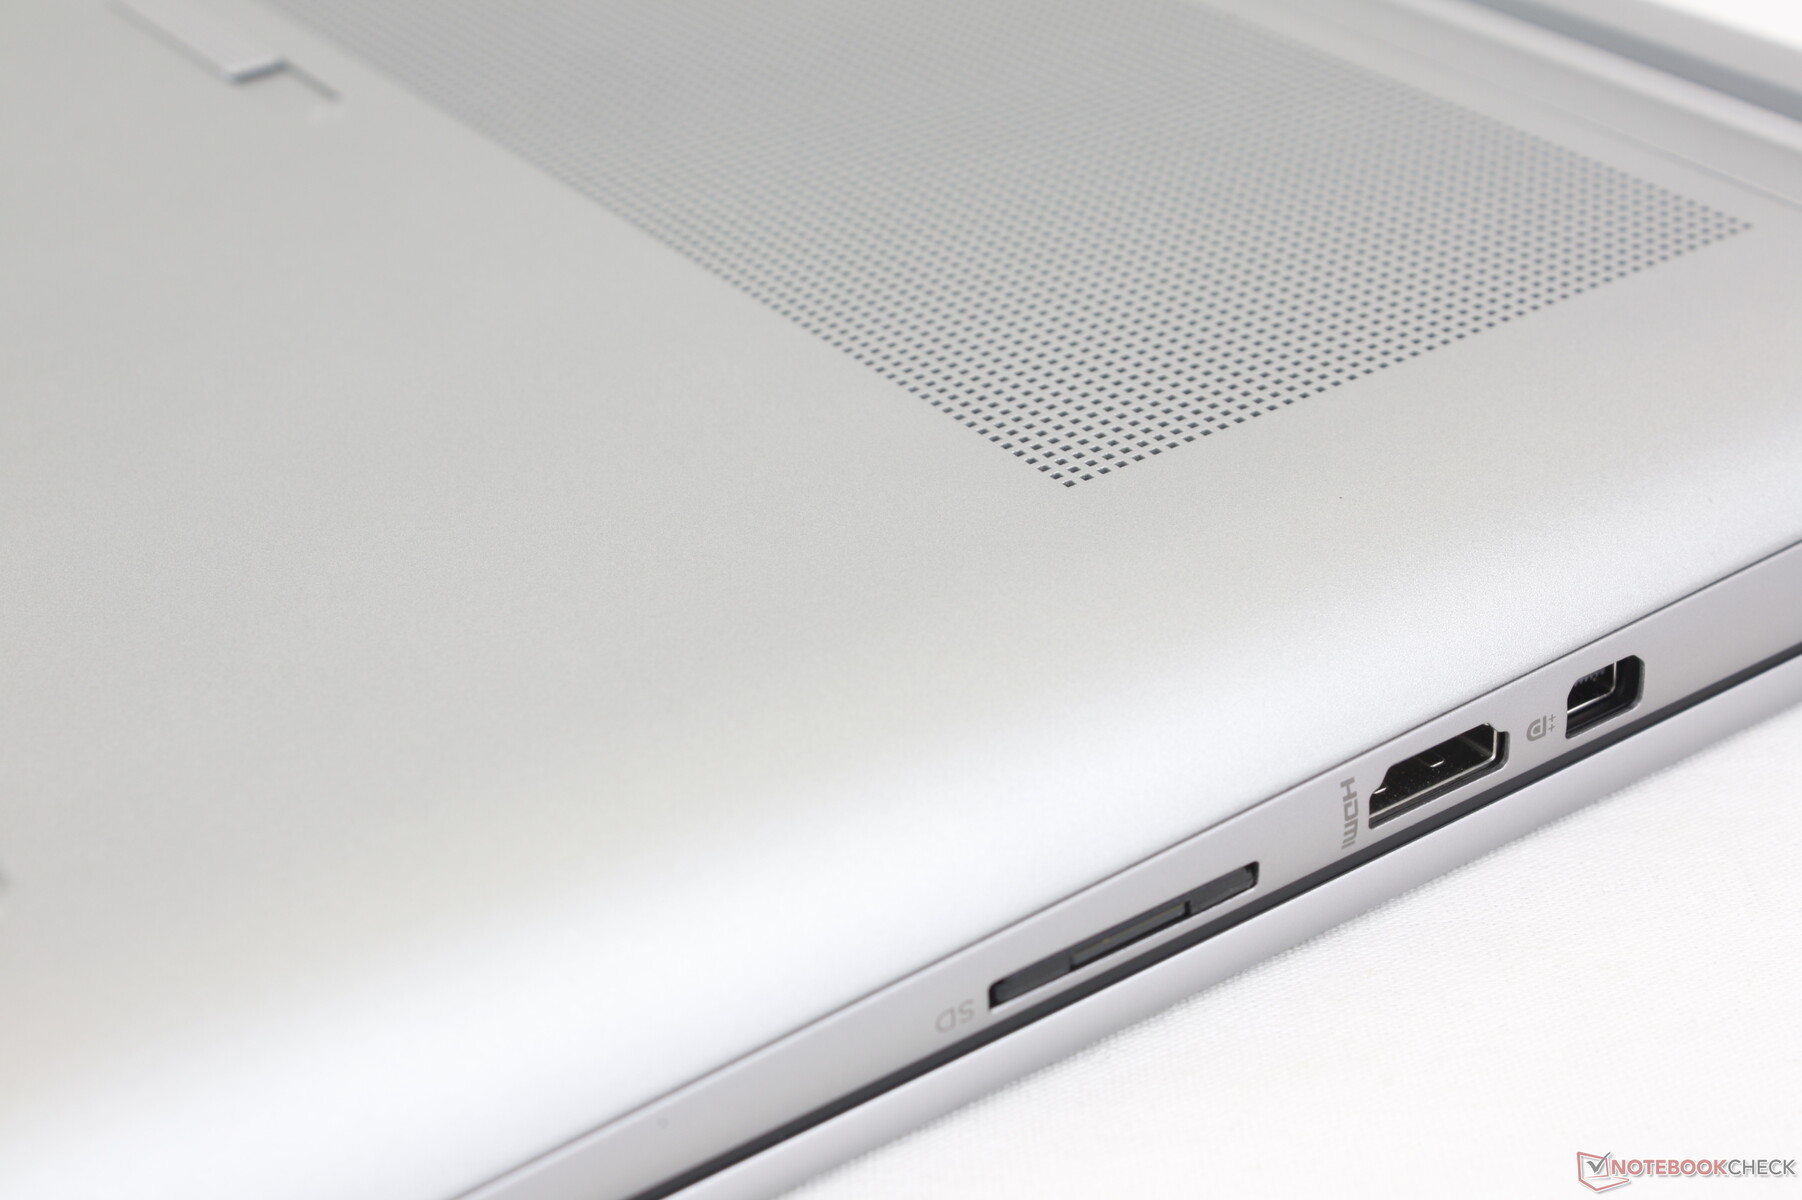
Lecteur de carte SD
Les taux de transfert plafonnent à environ 80 Mo/s avec notre carte de test PNY EliteX-PRO60, bien que la carte soit capable d'atteindre des taux de transfert de 280 Mo/s. En comparaison, le lecteur SD intégré de l'ordinateur Precision 7670 est plus de deux fois plus rapide. Les utilisateurs qui comptent sur les cartes SD pour les transferts de vidéos et de fichiers risquent d'être déçus par le Fury 16 G9 à cet égard.
| SD Card Reader | |
| average JPG Copy Test (av. of 3 runs) | |
| Dell Precision 7000 7670 Performance (Toshiba Exceria Pro SDXC 64 GB UHS-II) | |
| MSI CreatorPro Z16P B12UKST (AV Pro V60) | |
| HP ZBook Fury 16 G9 (PNY EliteX-PRO60) | |
| Lenovo ThinkPad P16 G1 RTX A5500 (Toshiba Exceria Pro SDXC 64 GB UHS-II) | |
| HP ZBook Studio 16 G9 62U04EA (Angelbird AV PRO V60) | |
| maximum AS SSD Seq Read Test (1GB) | |
| Dell Precision 7000 7670 Performance (Toshiba Exceria Pro SDXC 64 GB UHS-II) | |
| HP ZBook Fury 16 G9 (PNY EliteX-PRO60) | |
| MSI CreatorPro Z16P B12UKST (AV Pro V60) | |
| Lenovo ThinkPad P16 G1 RTX A5500 (Toshiba Exceria Pro SDXC 64 GB UHS-II) | |
| HP ZBook Studio 16 G9 62U04EA (Angelbird AV PRO V60) | |
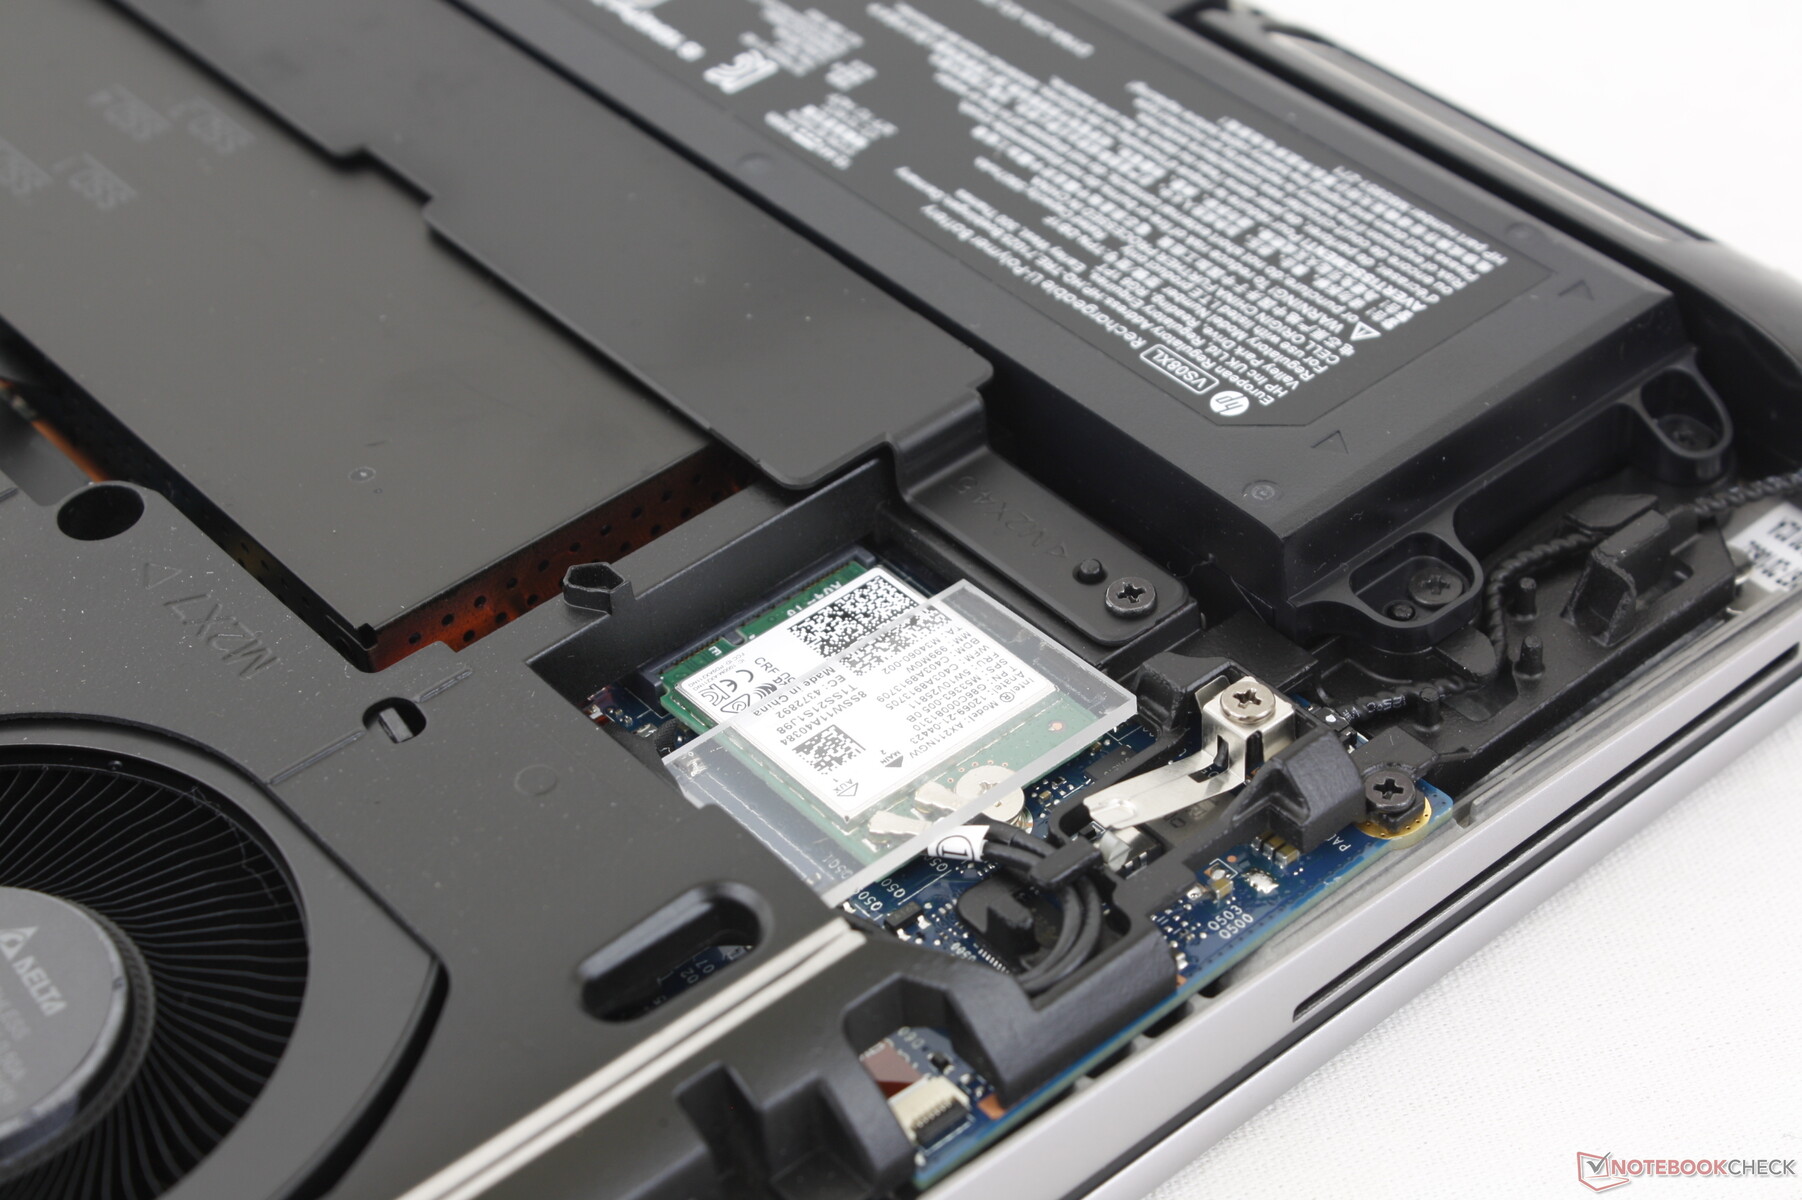
Communication
Notre appareil sous Windows 10 est équipé de l'Intel AX211 pour la connectivité Wi-Fi 6E et Bluetooth 5.2. Malheureusement, le Wi-Fi 6E est désactivé sous Windows 10 car Microsoft l'a (idiotement) rendu exclusif à Windows 11. Vous devrez donc configurer Windows 11 si vous souhaitez profiter des avantages du Wi-Fi 6 GHz. Par ailleurs, nous n'avons rencontré aucun problème de performance lorsque nous avons été couplés à notre réseau Wi-Fi 6 habituel.
Webcam
Le ZBook Fury 16 G9 a hérité de la webcam de 5 mégapixels de la dernière version du Spectre et EliteBook. La qualité d'image est plus nette que sur la plupart des autres ordinateurs portables où les capteurs de 1 MP et 2 MP sont encore monnaie courante, y compris sur les ThinkPad P16 et Precision 7670.
Un obturateur coulissant et un capteur IR sont inclus pour la confidentialité et la prise en charge de Hello, respectivement.


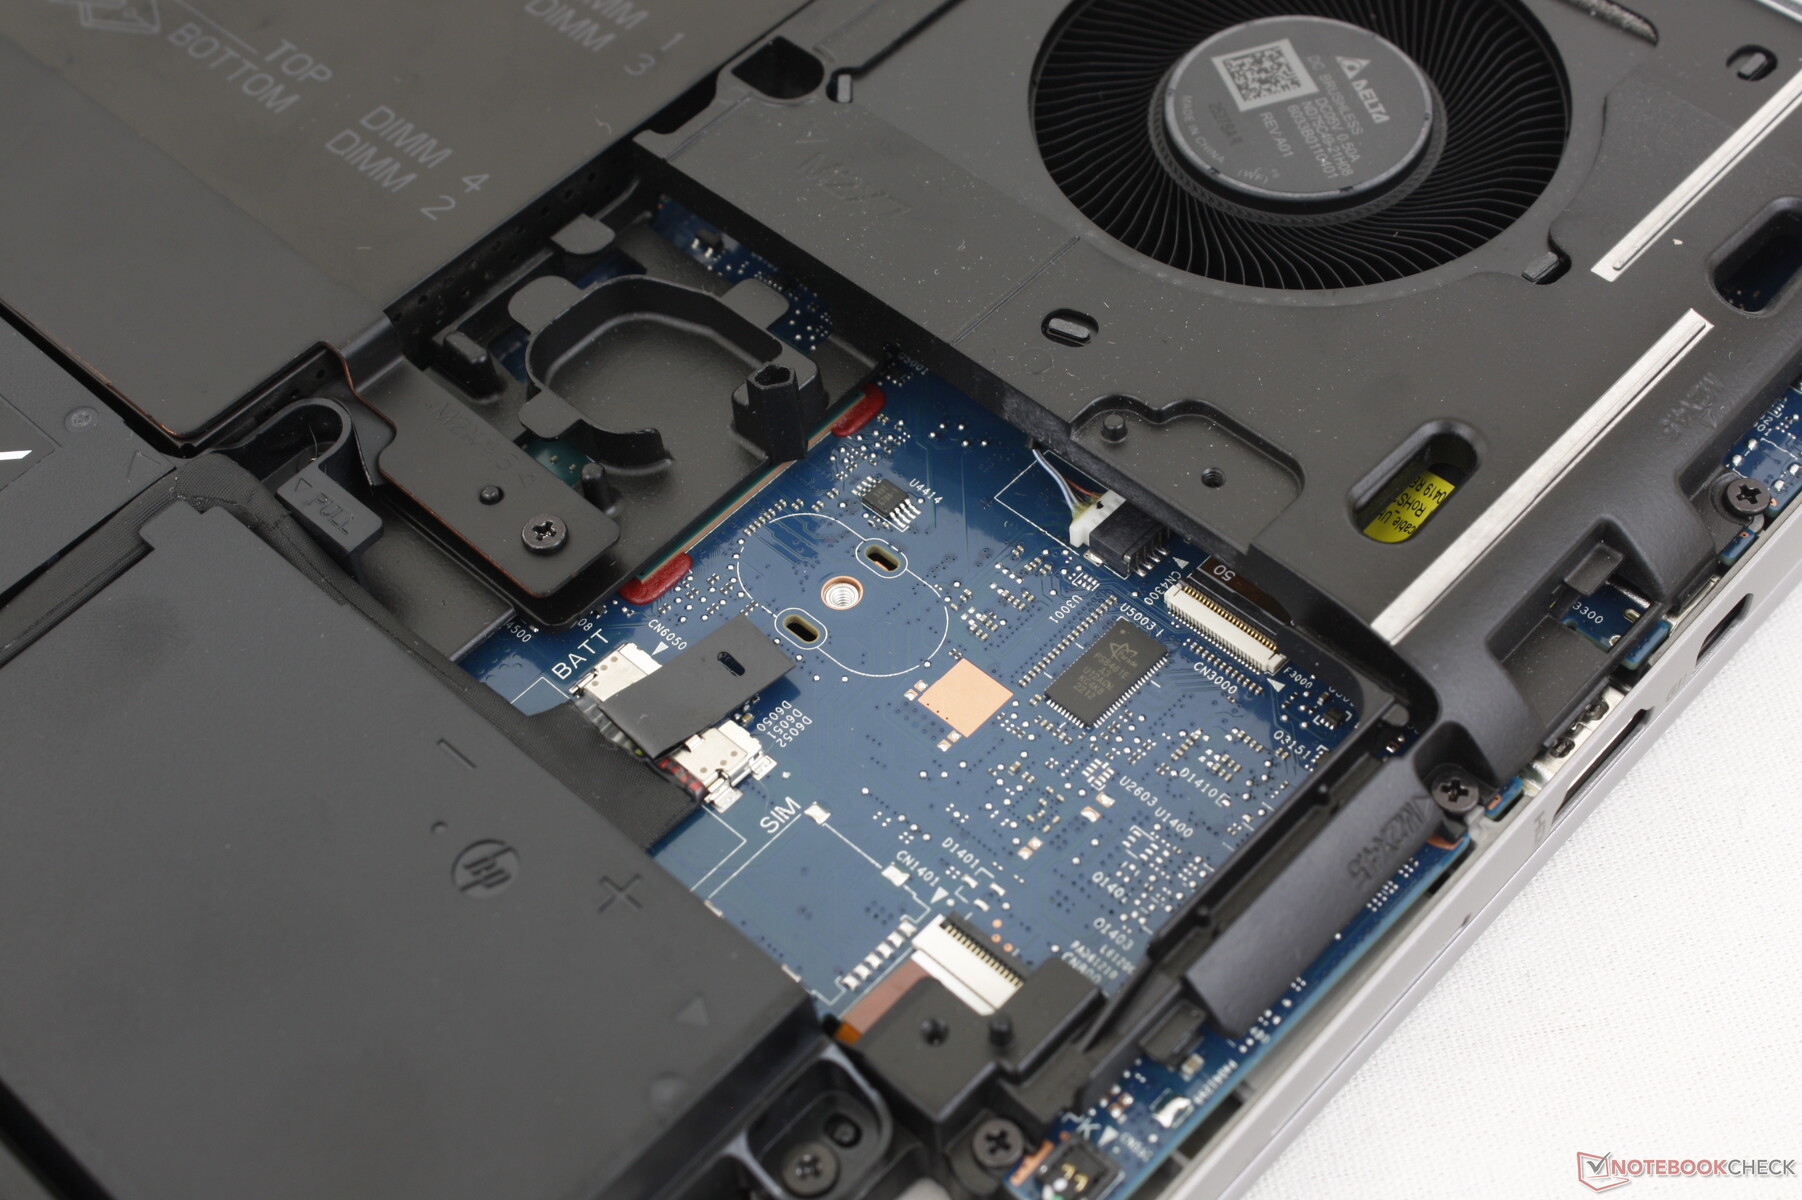
Maintenance
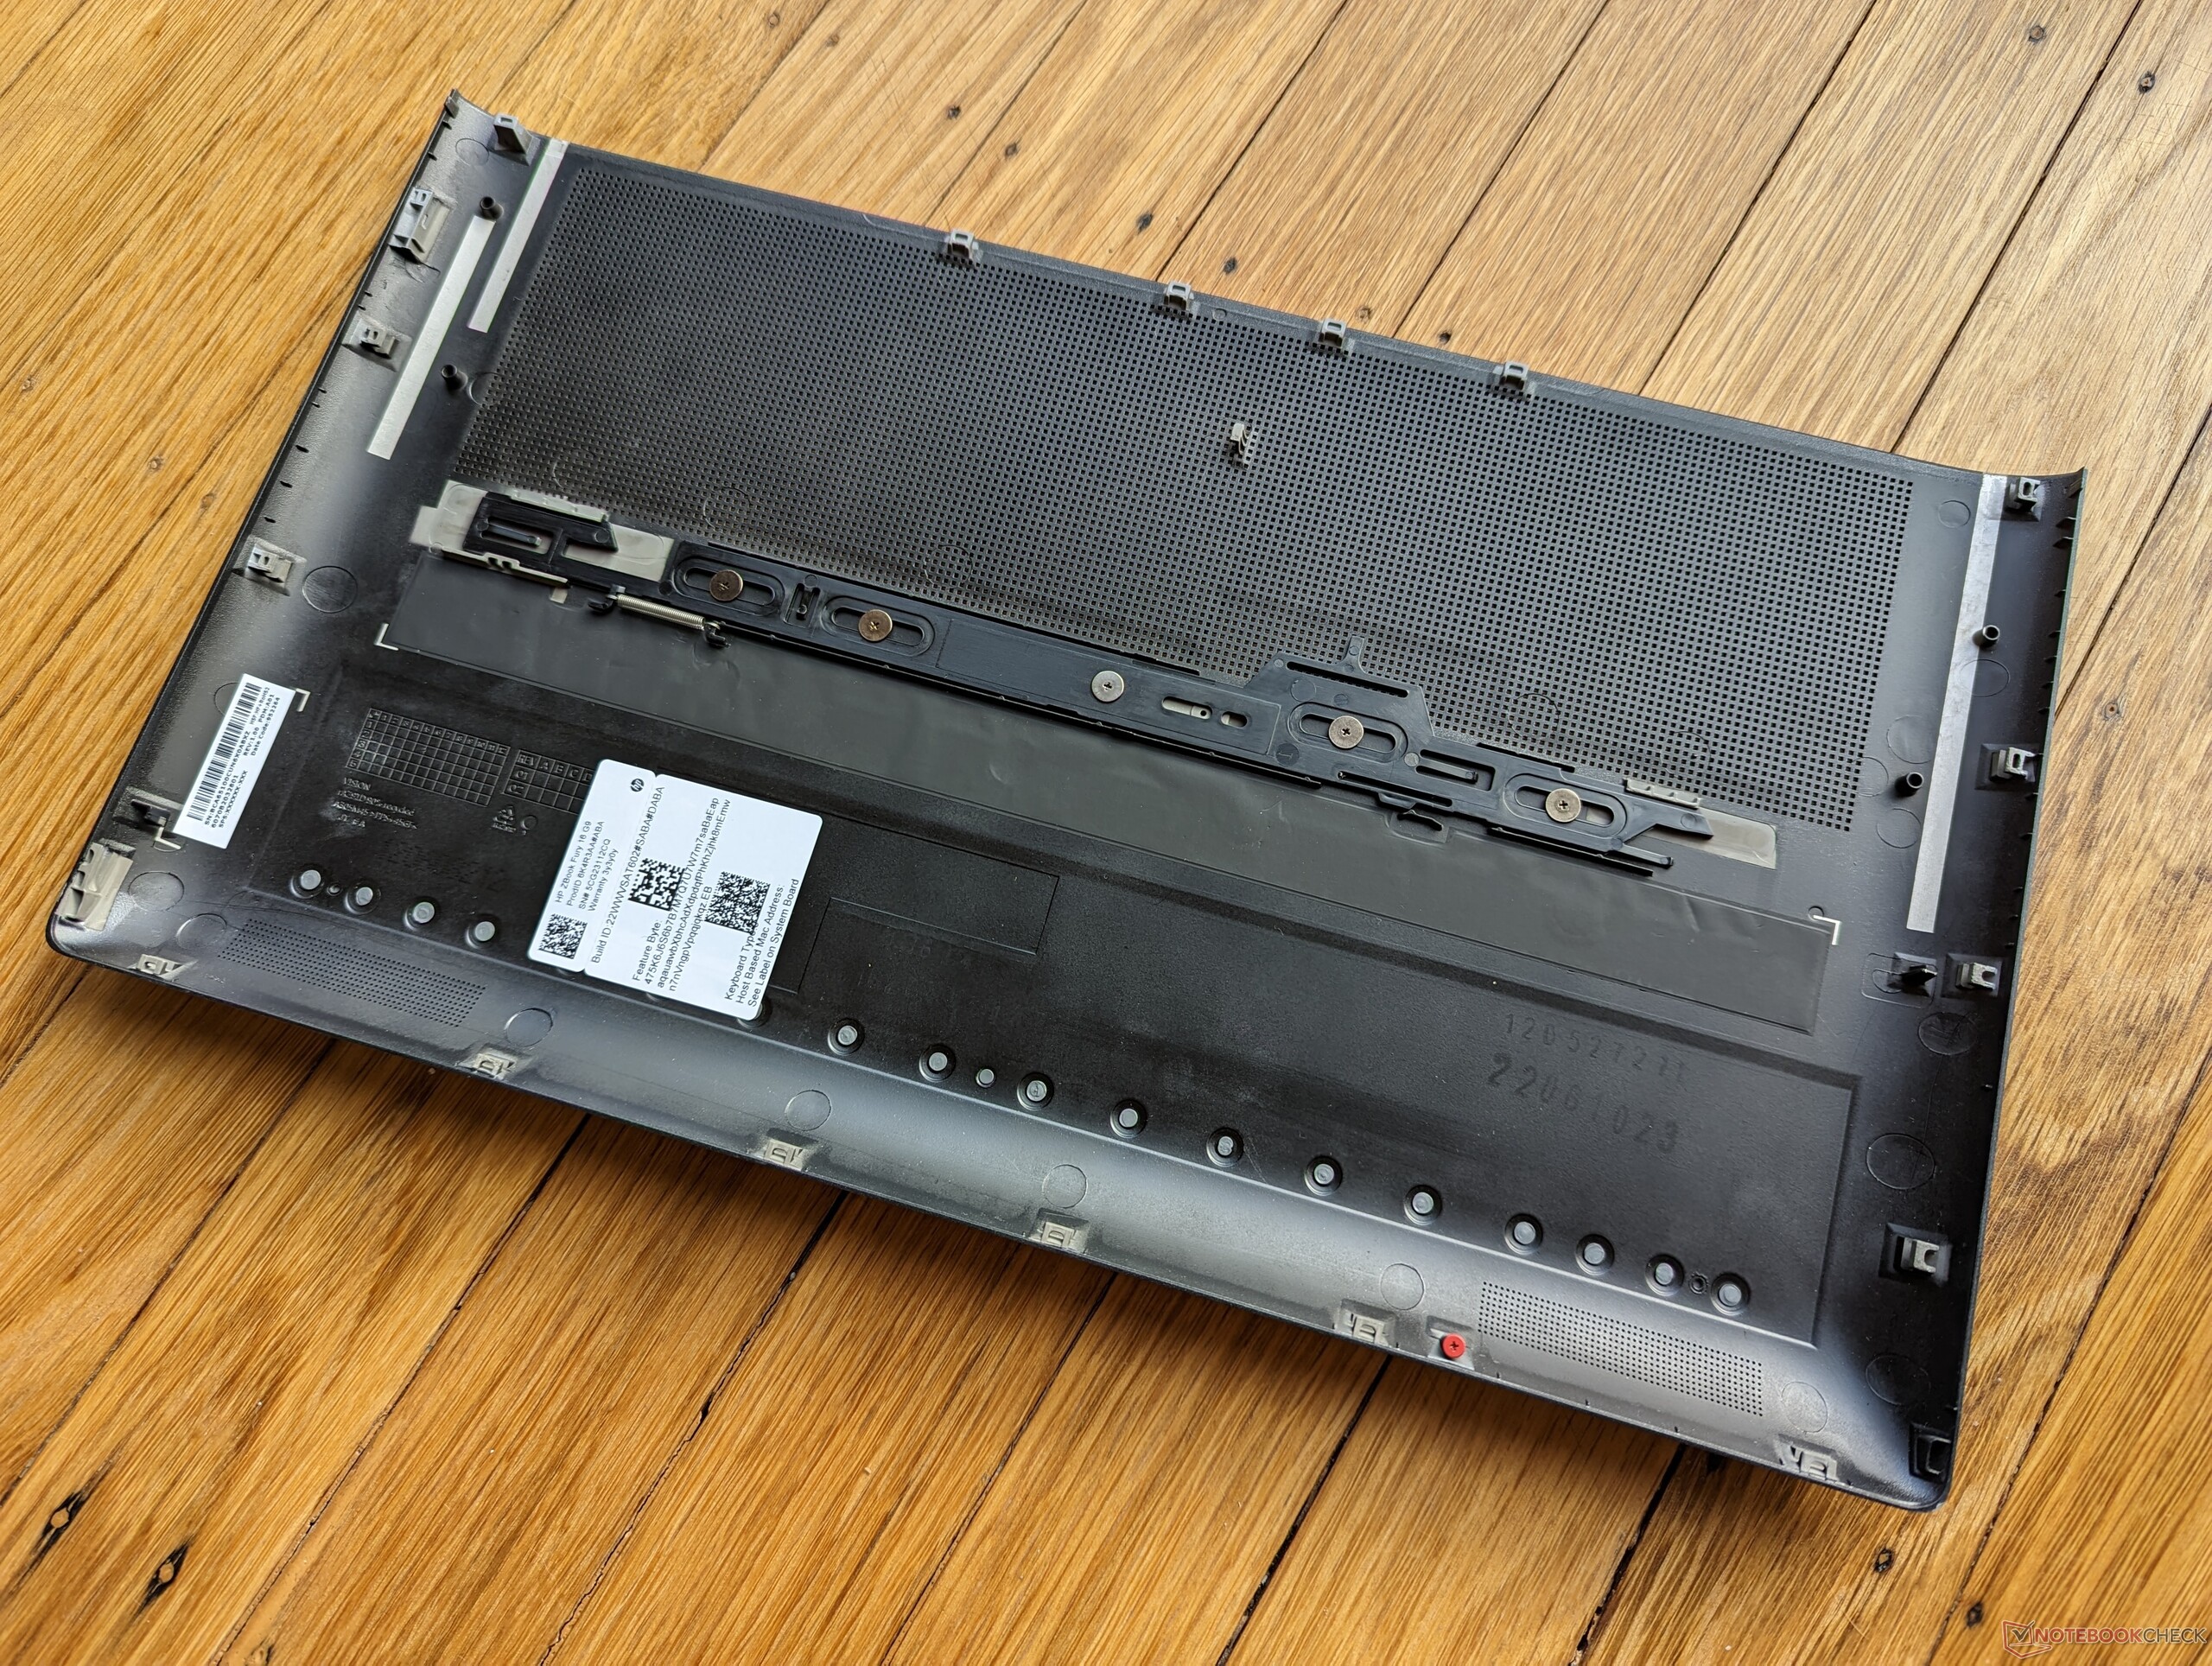
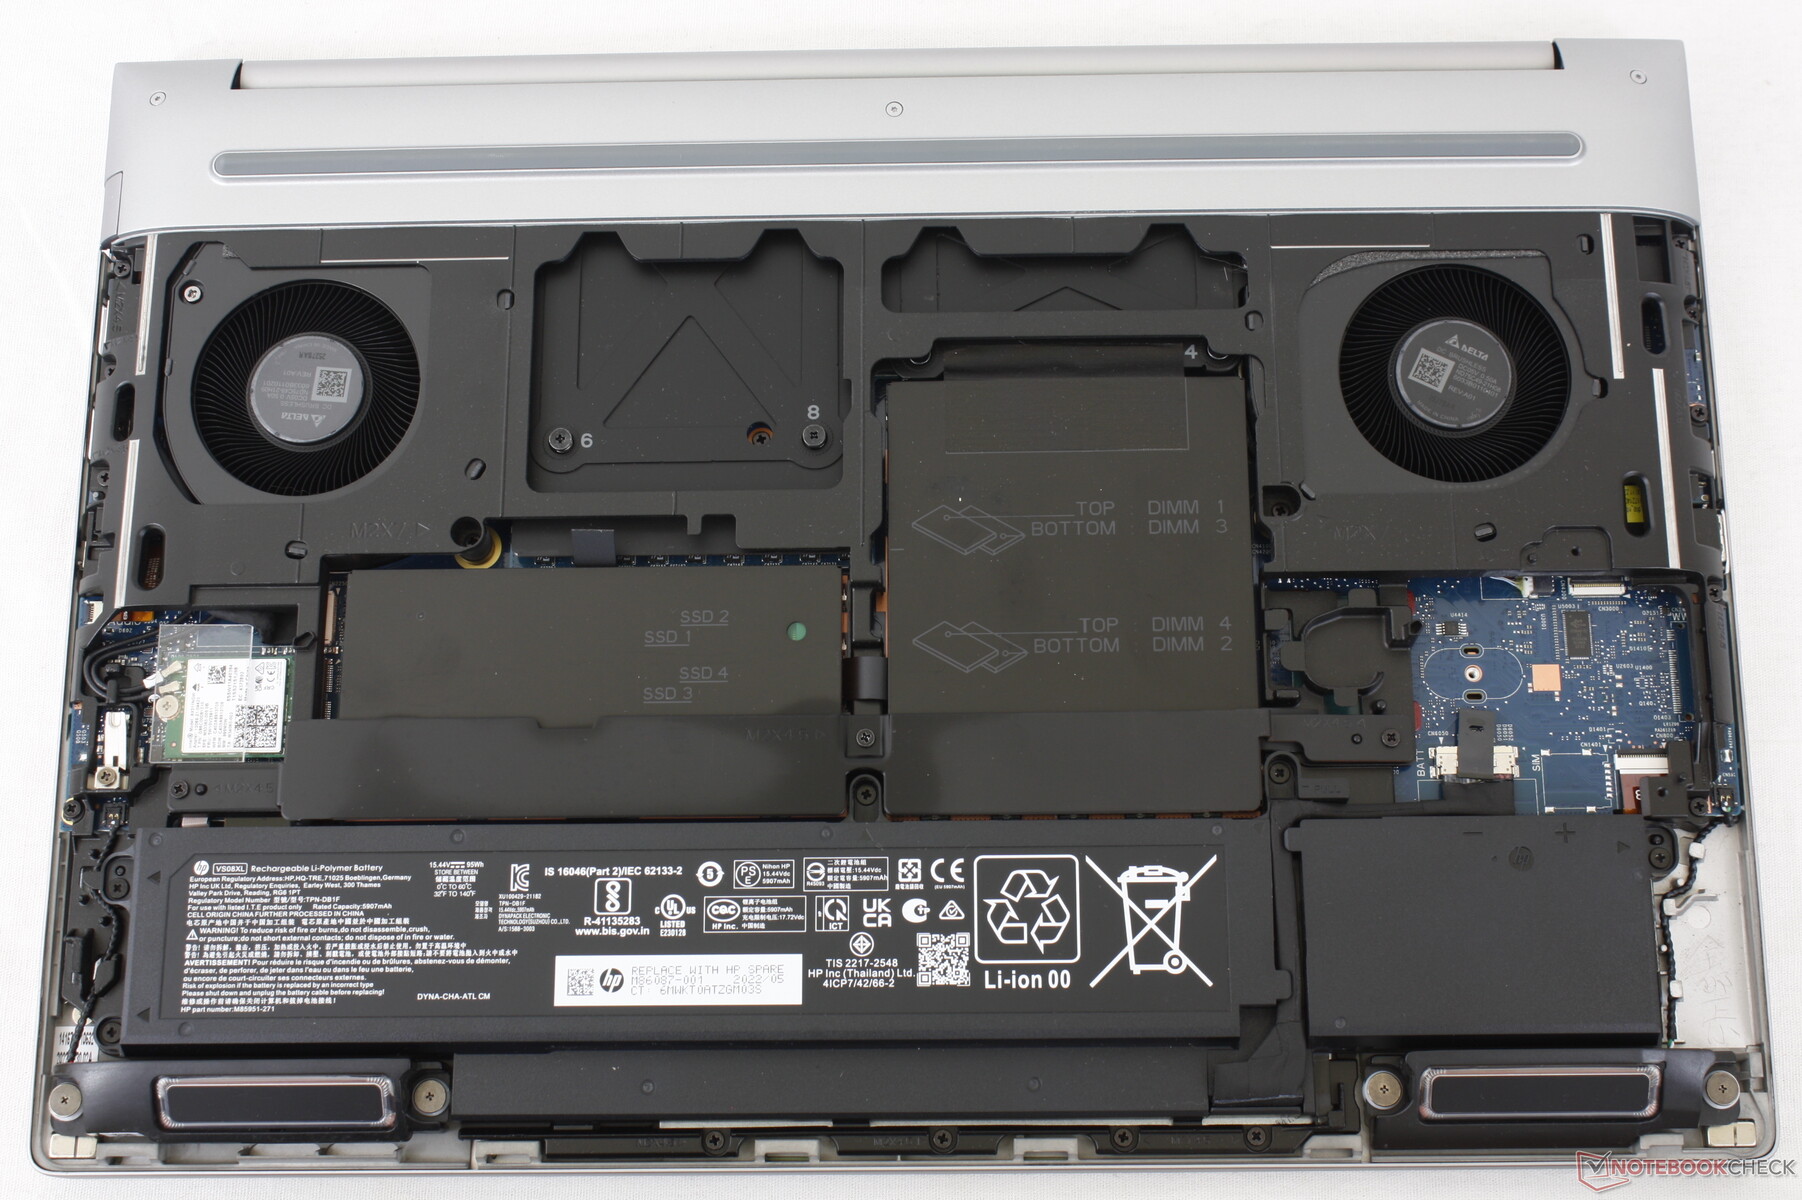
Le panneau inférieur est "toolless", c'est-à-dire qu'il glisse facilement sans aucun outil. Malheureusement, un tournevis est nécessaire car les baies de stockage et les emplacements SODIMM sont protégés par des plaques d'aluminium. Le modèle prend en charge jusqu'à 4 SSD M.2 2280 et 4 modules de RAM DDR5, ce qui est plus que ce que le Precision 7670 et le ThinkPad P16 peuvent offrir.
Accessoires et garantie
L'emballage ne contient aucun élément supplémentaire, hormis l'adaptateur secteur et les documents habituels. Une garantie limitée de trois ans est offerte en standard si l'appareil est acheté aux États-Unis.
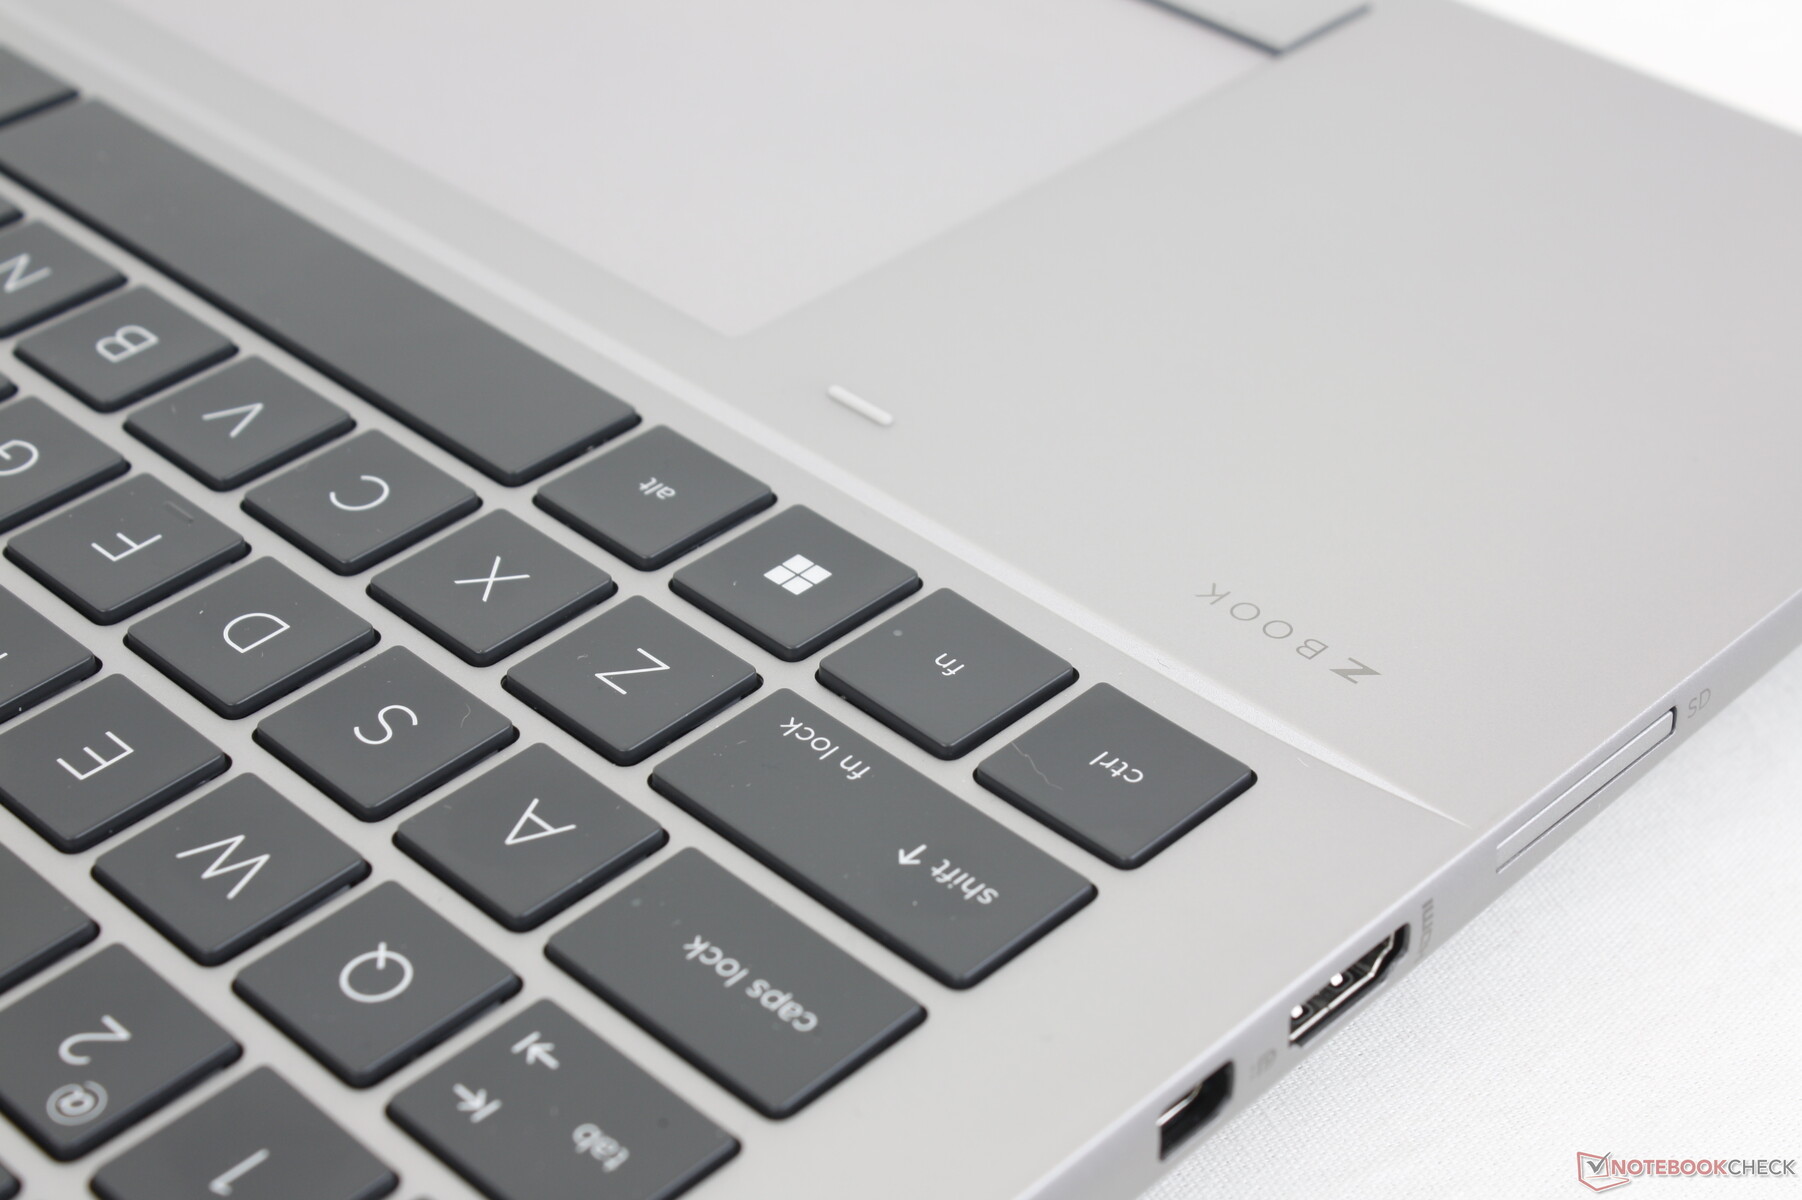
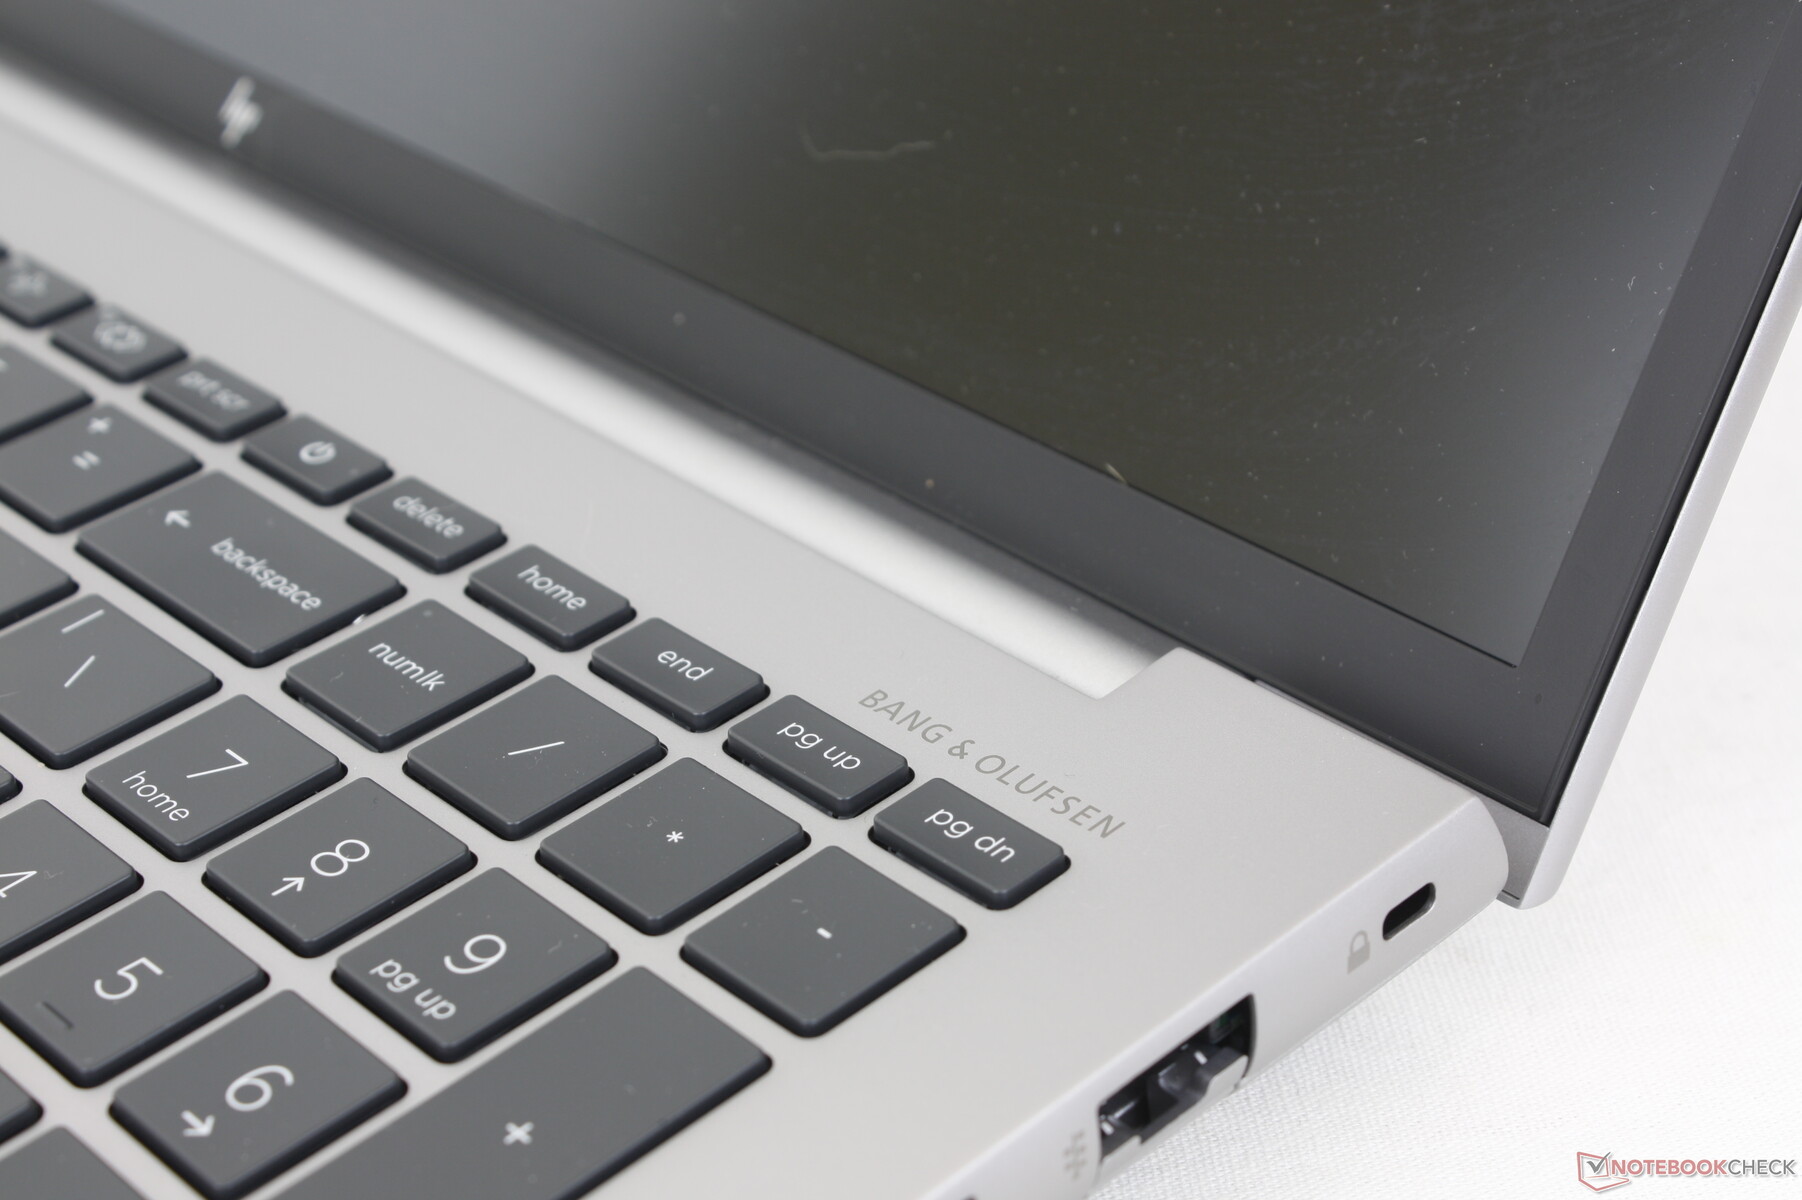
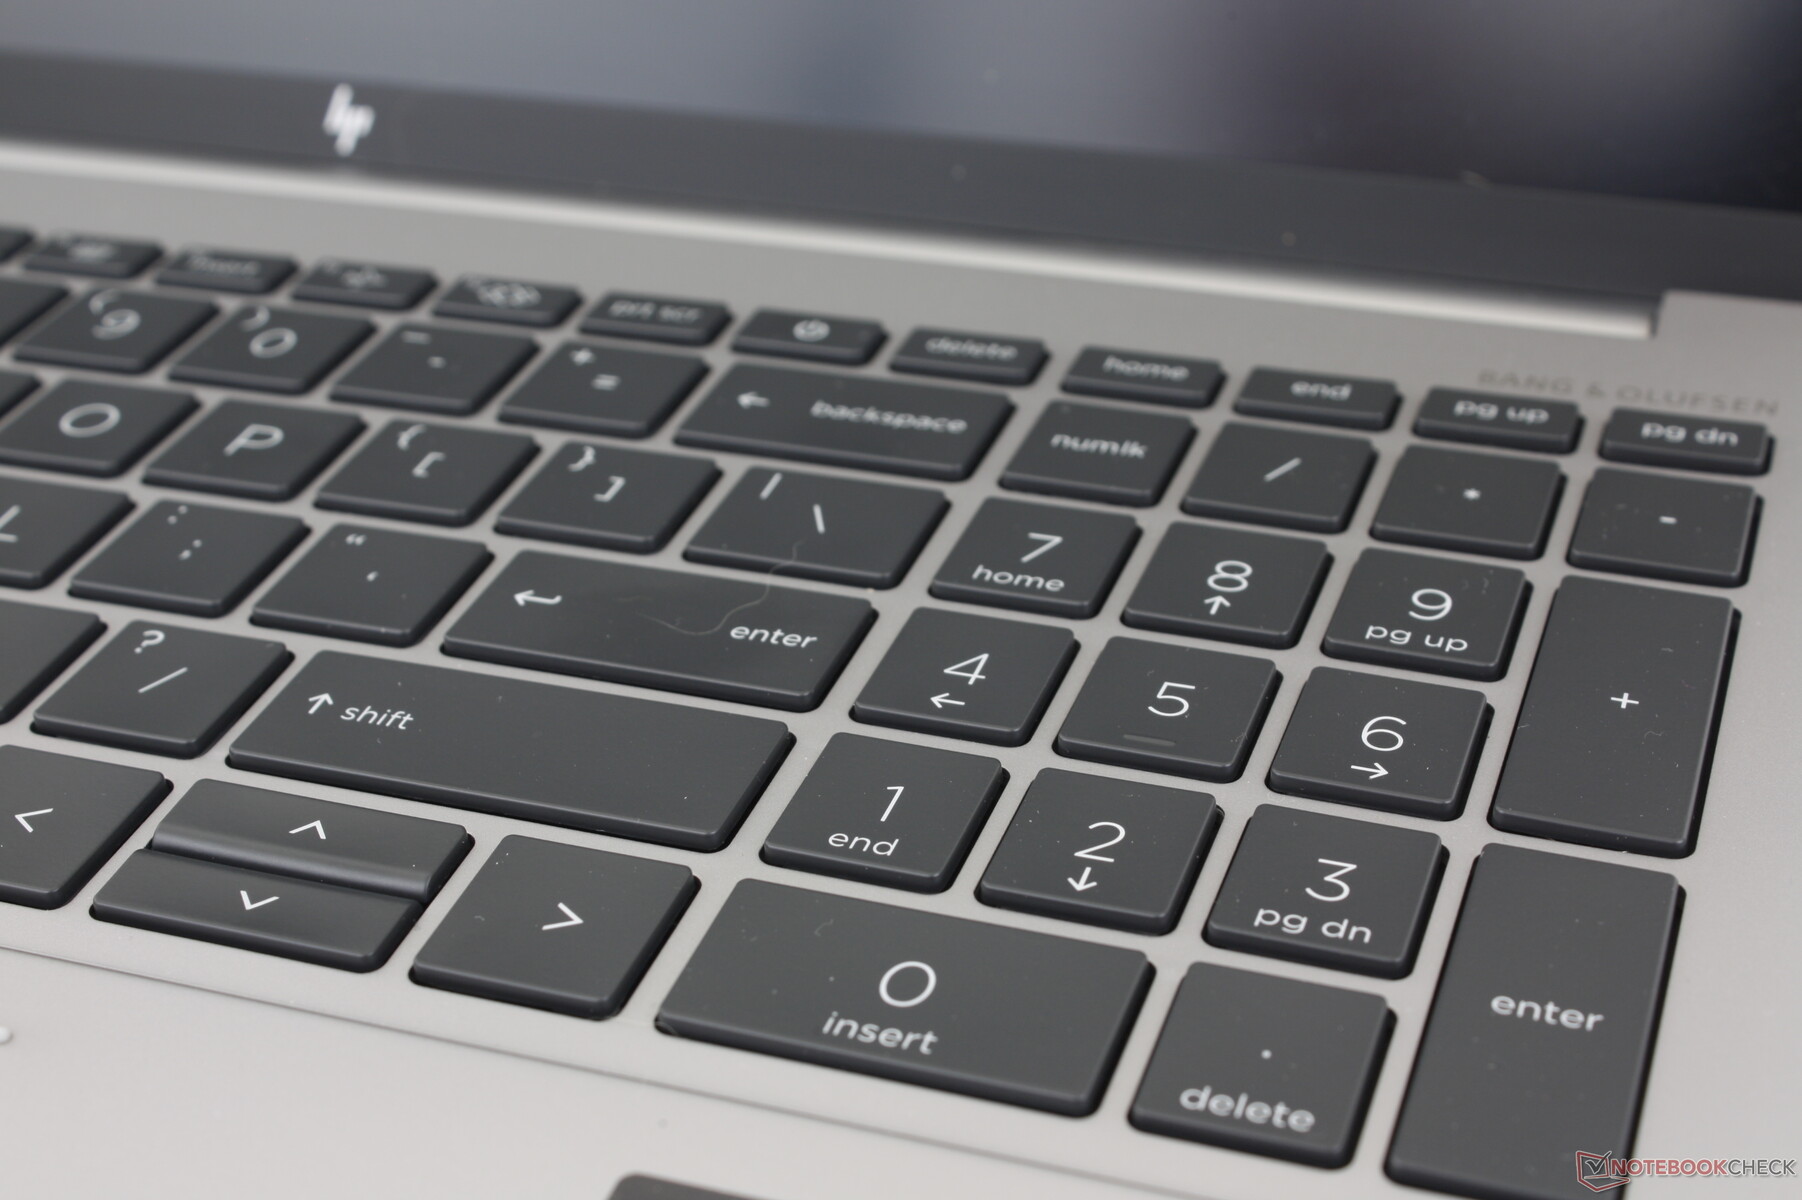
Dispositifs de saisie - Spacieux et confortable
Clavier
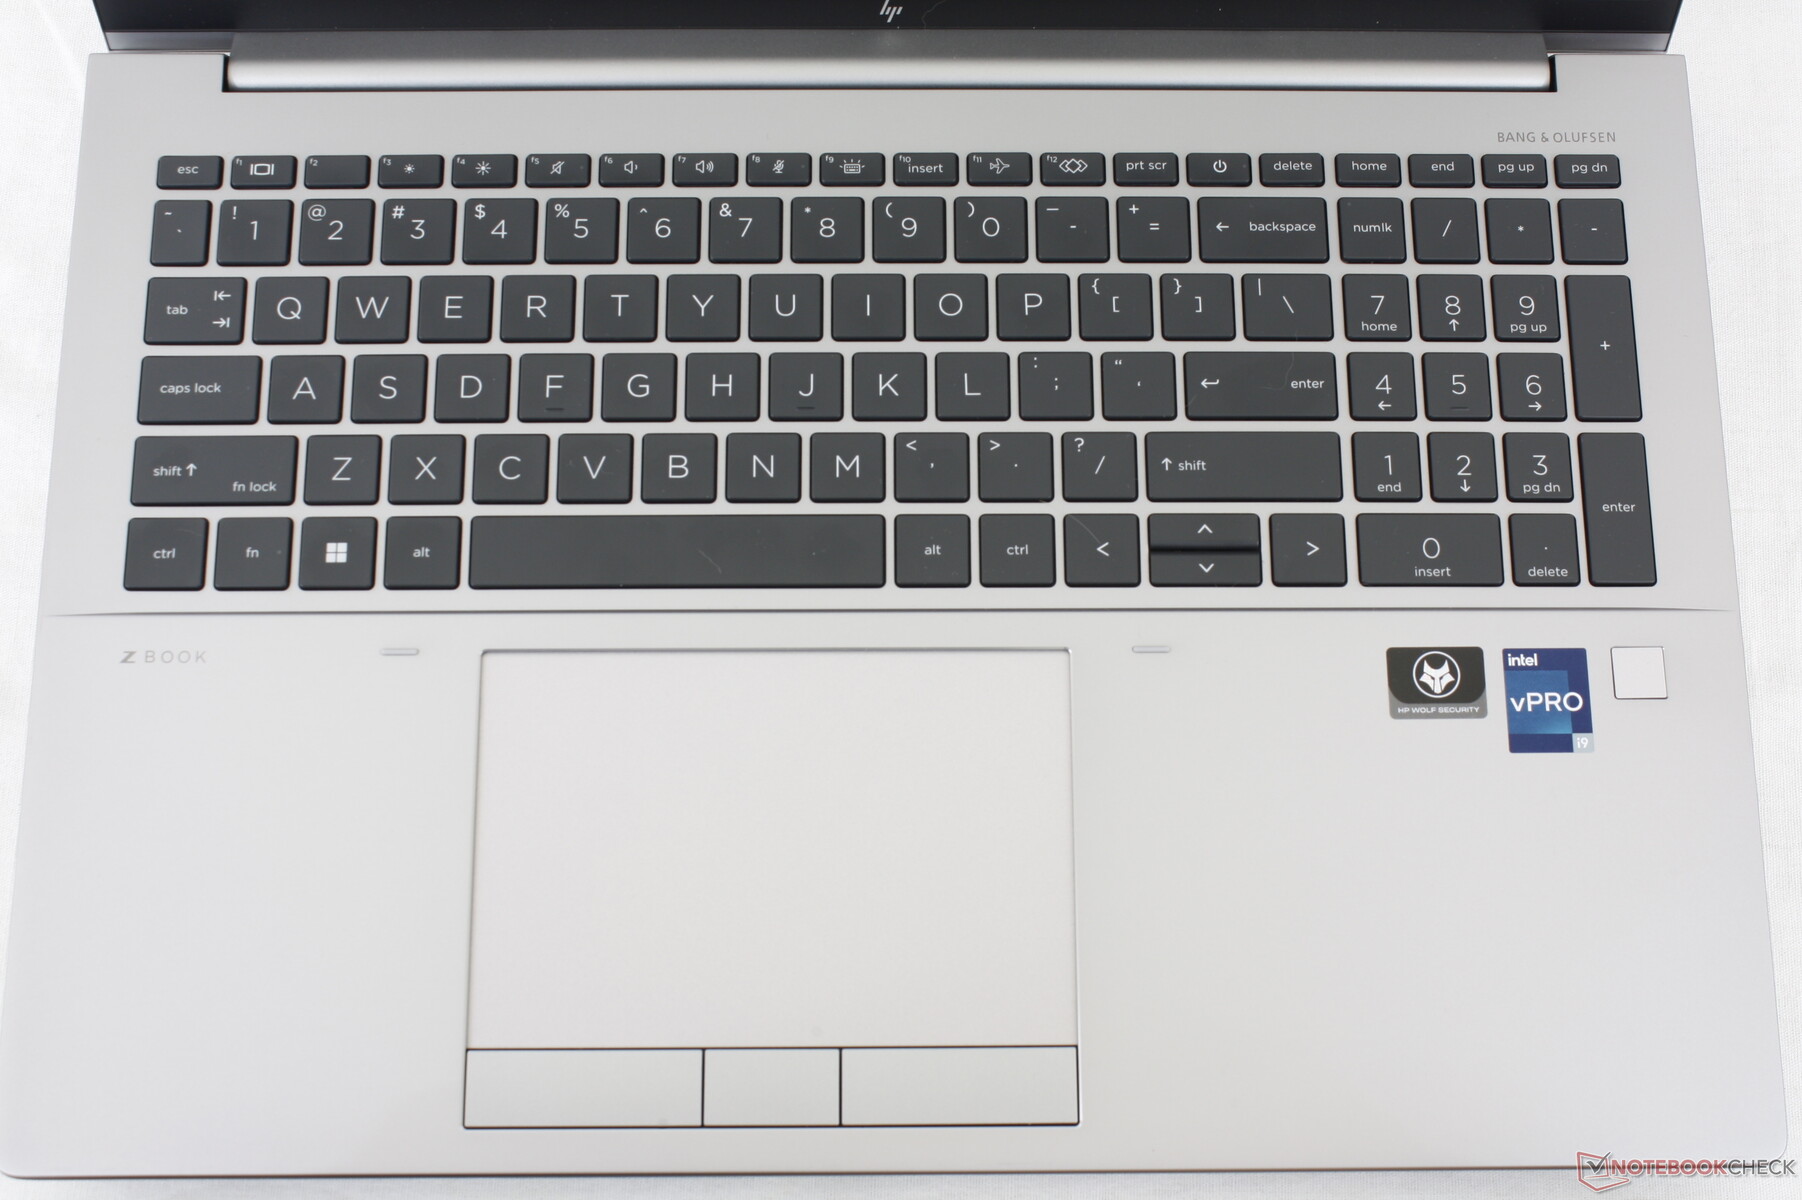
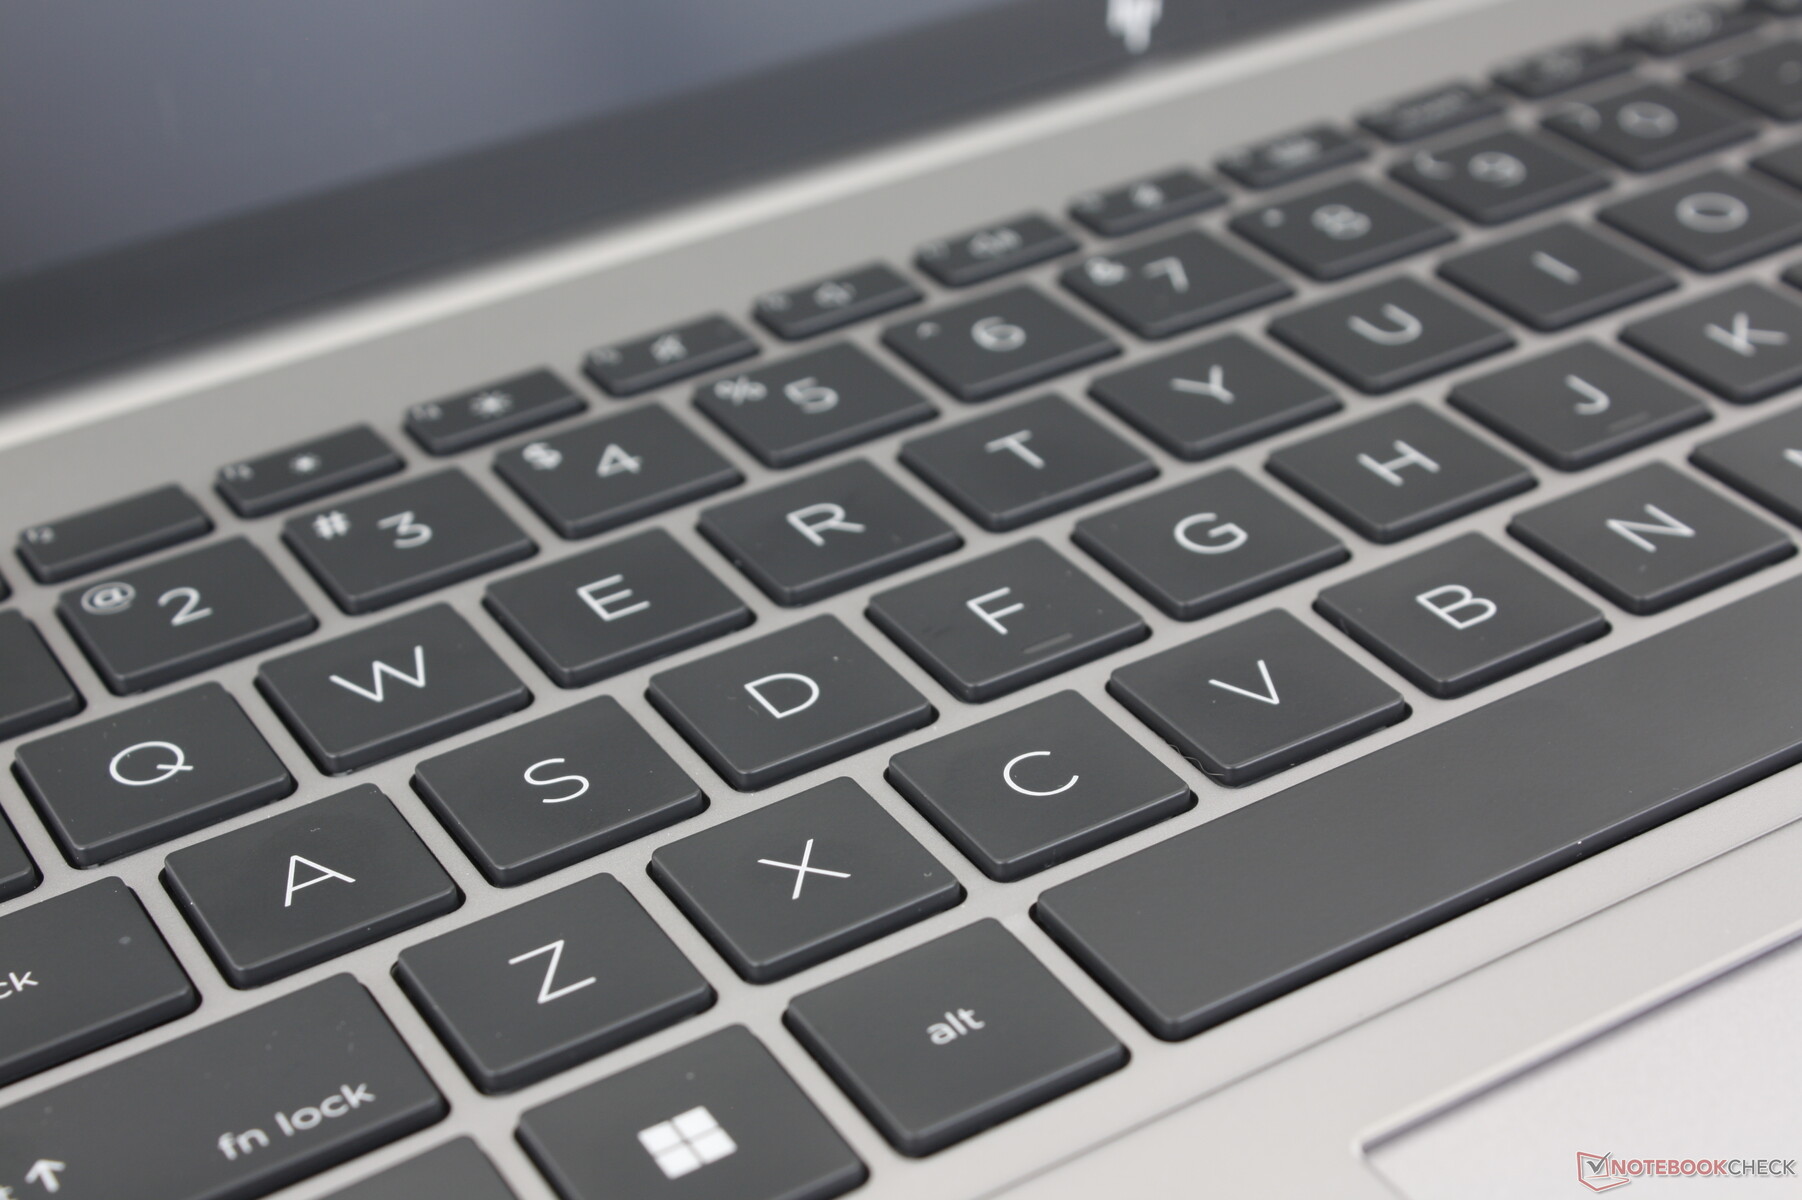
Les familles HP Spectre, EliteBook et ZBook disposent toutes de certains des meilleurs claviers de leurs catégories respectives en termes de retour d'information et de course. Les touches du Fury 16 G9 sont fermes pour une expérience de frappe satisfaisante. Le bruit est cependant plus fort que sur le ThinkPad P16 G1 ou le Precision 7670, en particulier lorsque l'on appuie sur les touches Espace ou Entrée. Les dactylographes qui préfèrent des touches plus silencieuses voudront peut-être essayer le clavier du ZBook avant de s'engager.
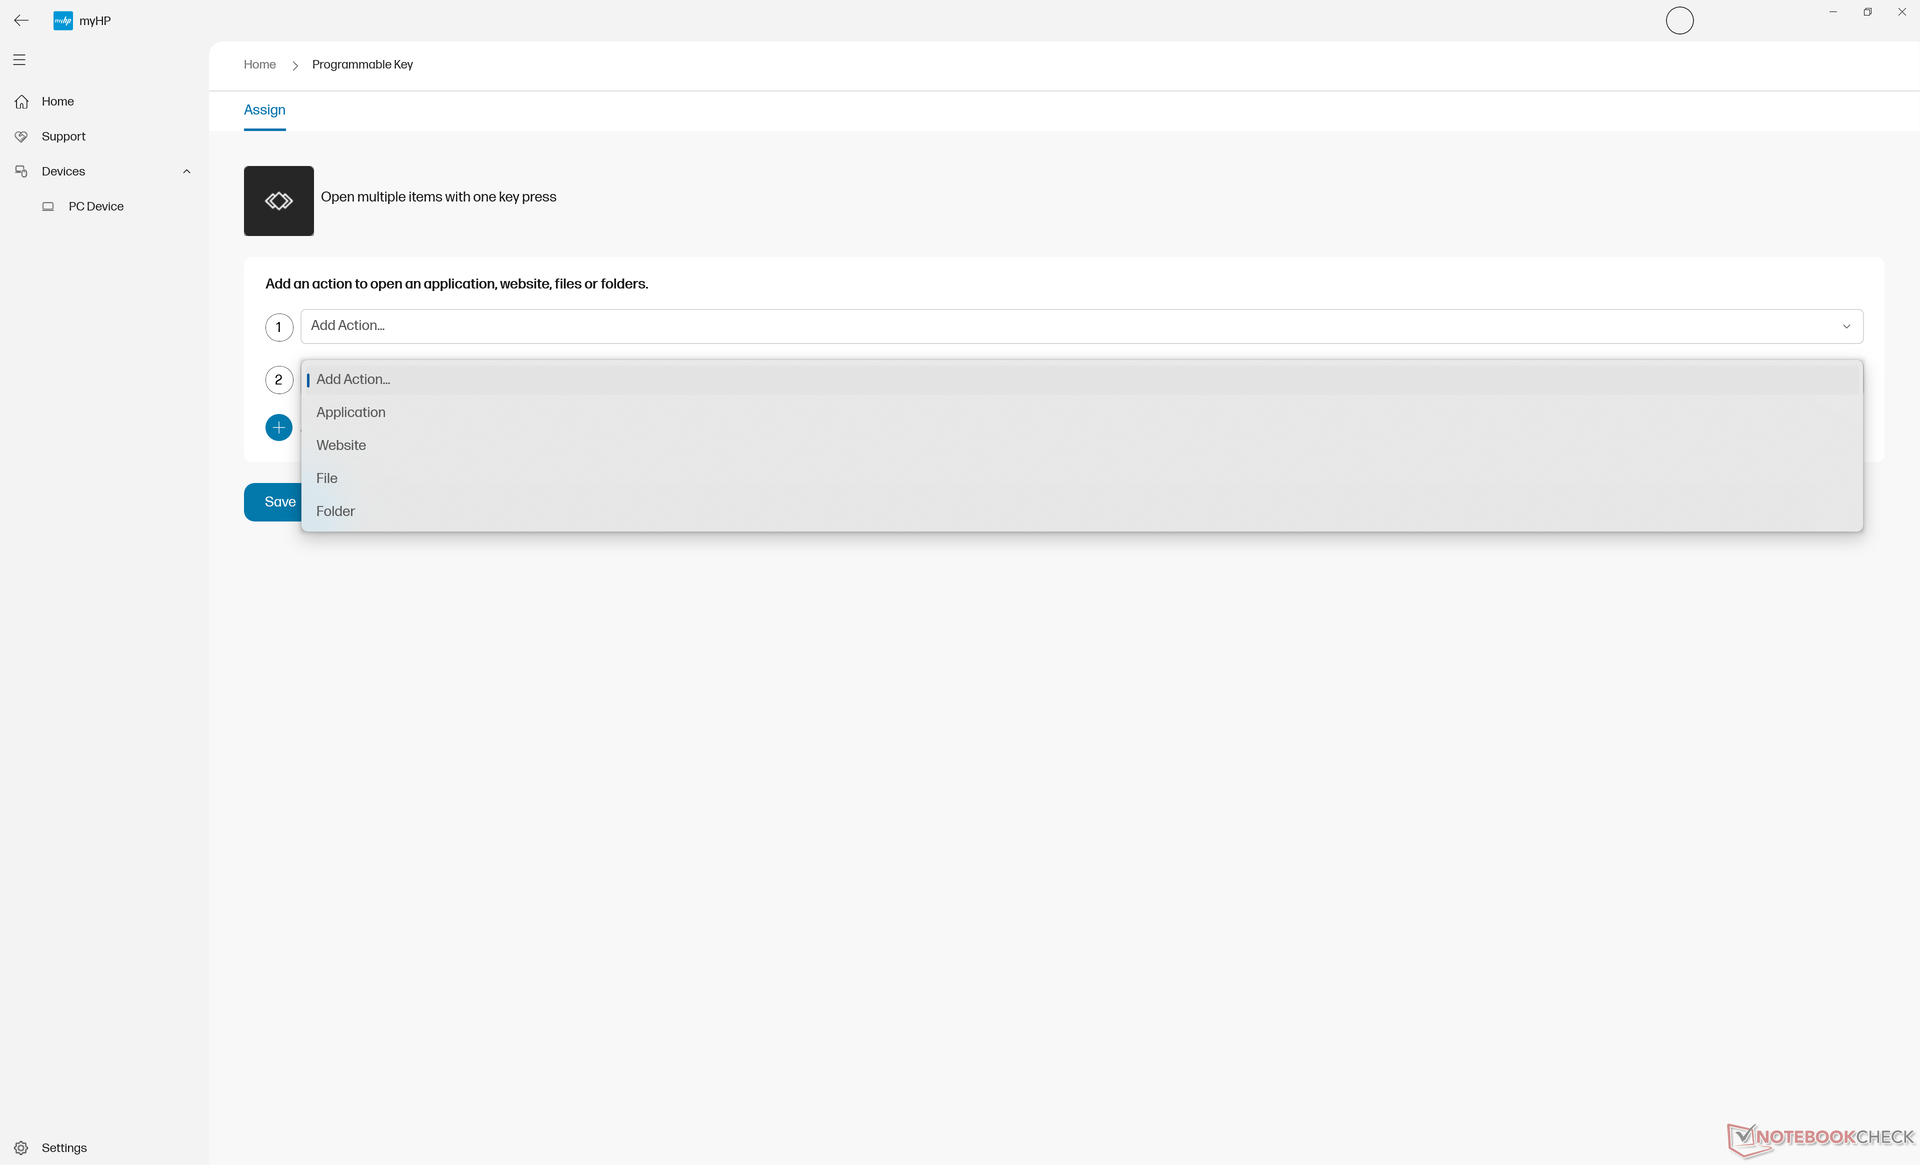
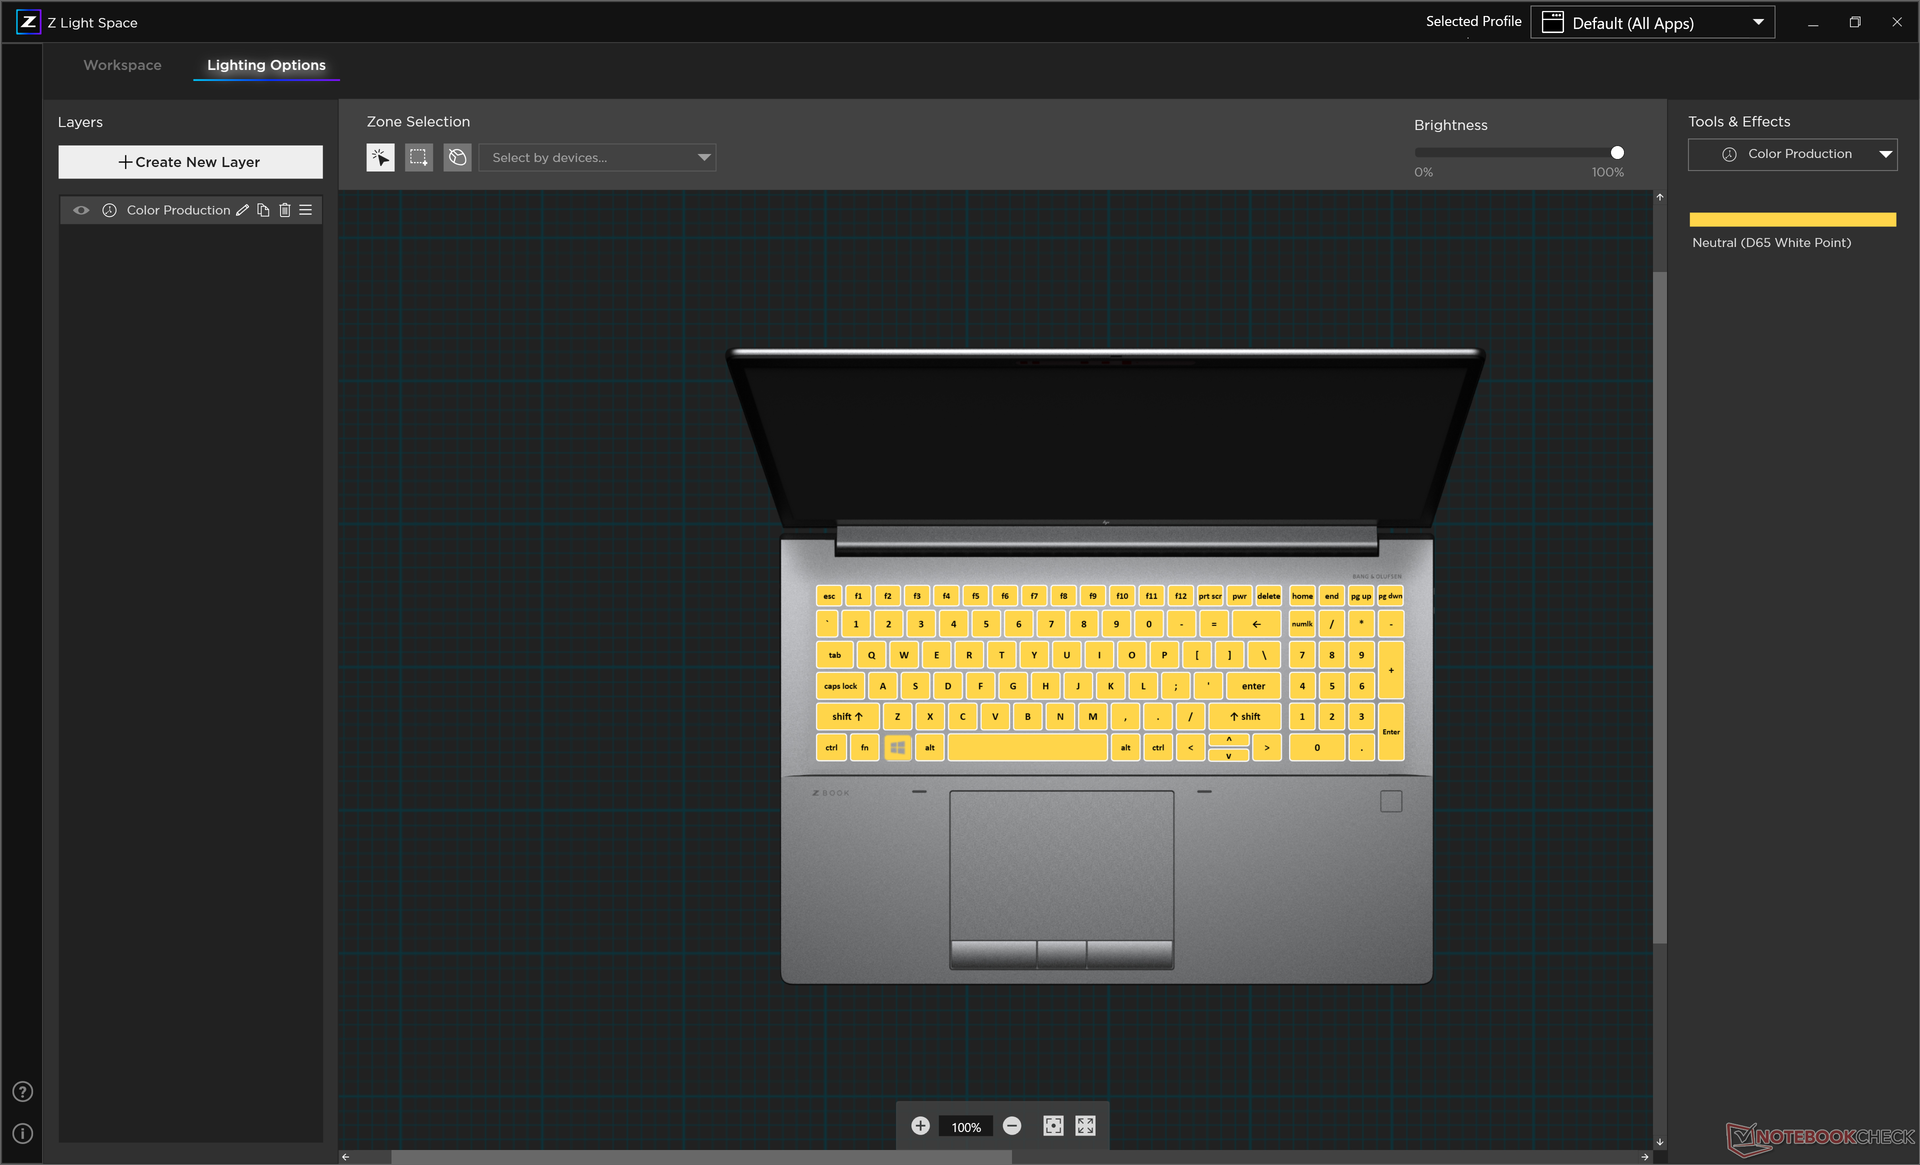
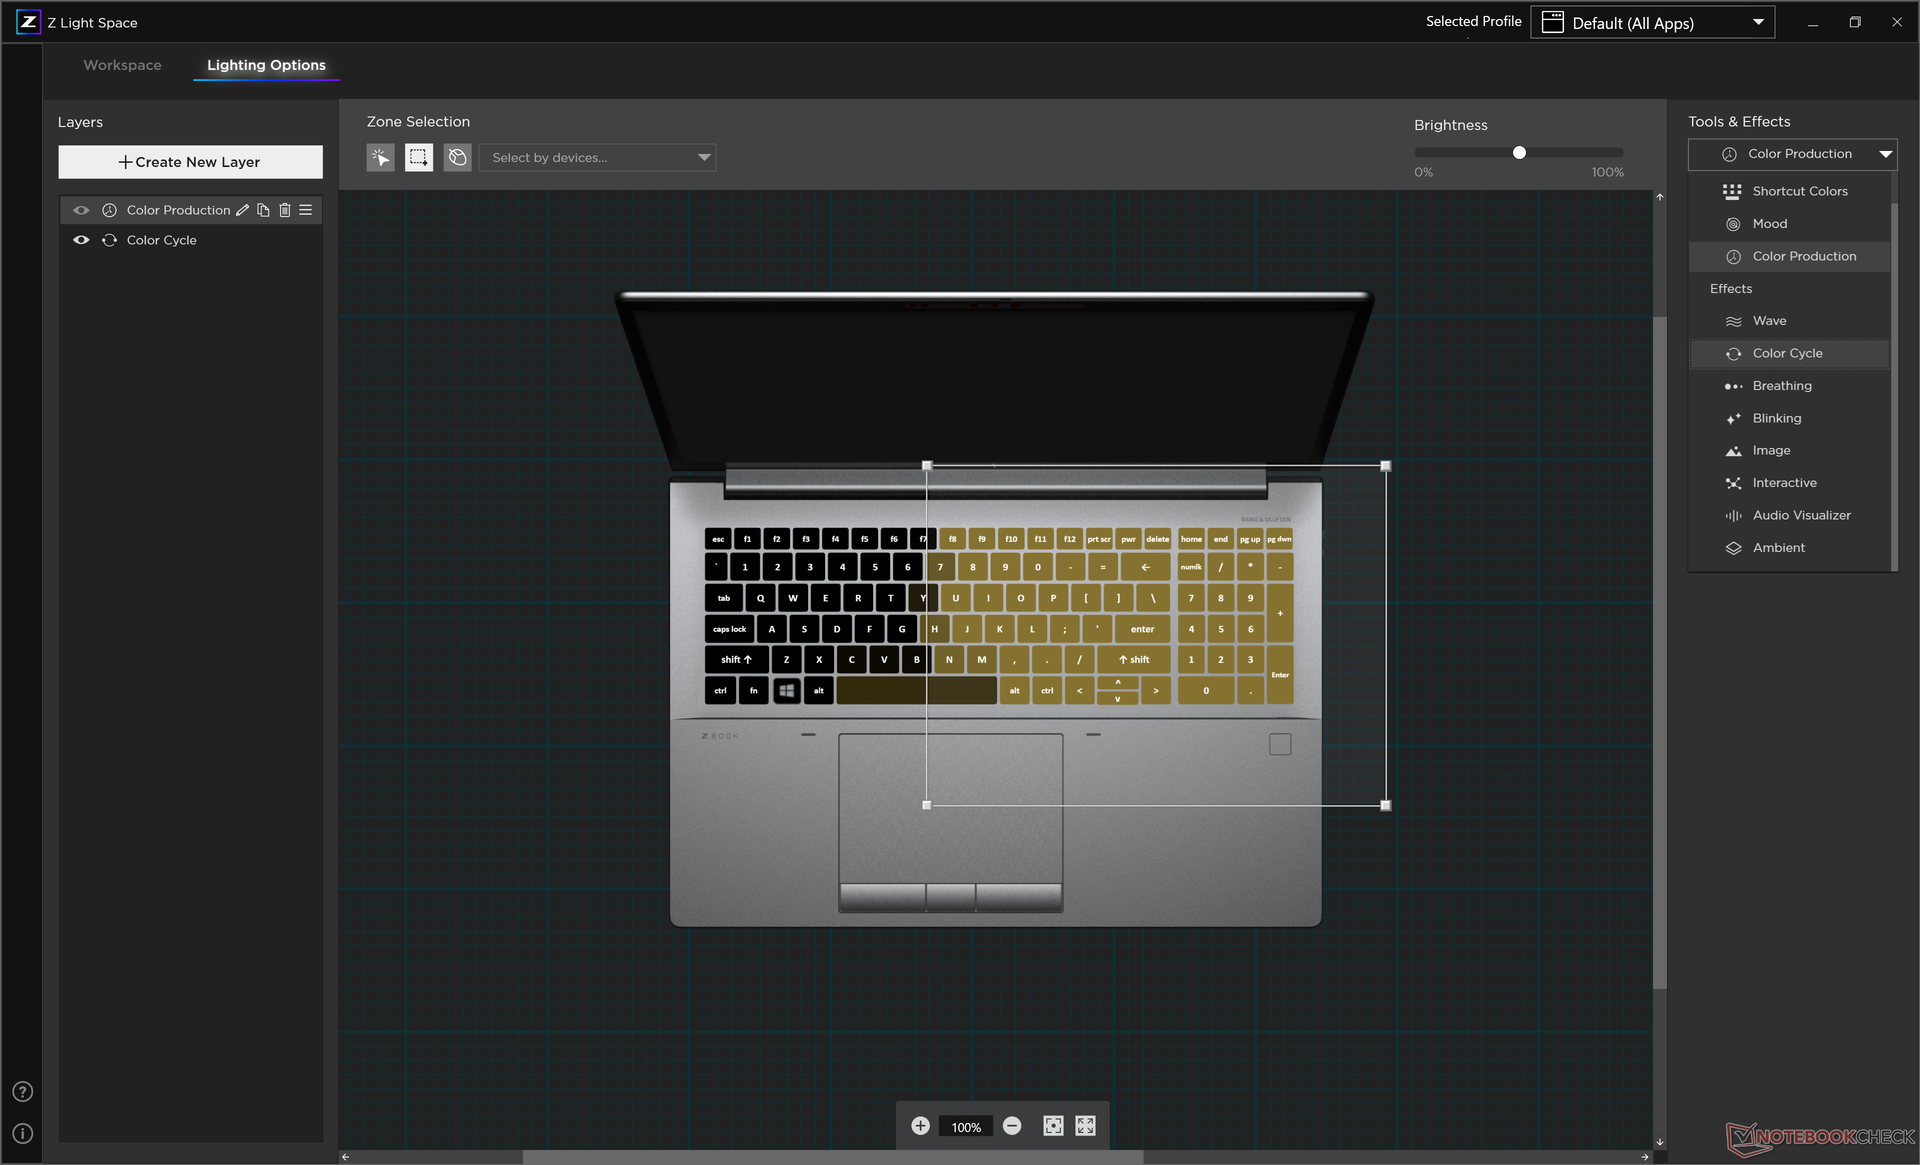
Parmi les caractéristiques notables du clavier du ZBook figurent le rétroéclairage RVB par touche et l'unique touche programmable/personnalisable. La plupart des autres stations de travail ne disposent pas encore de fonctions auxiliaires similaires.
Pavé tactile
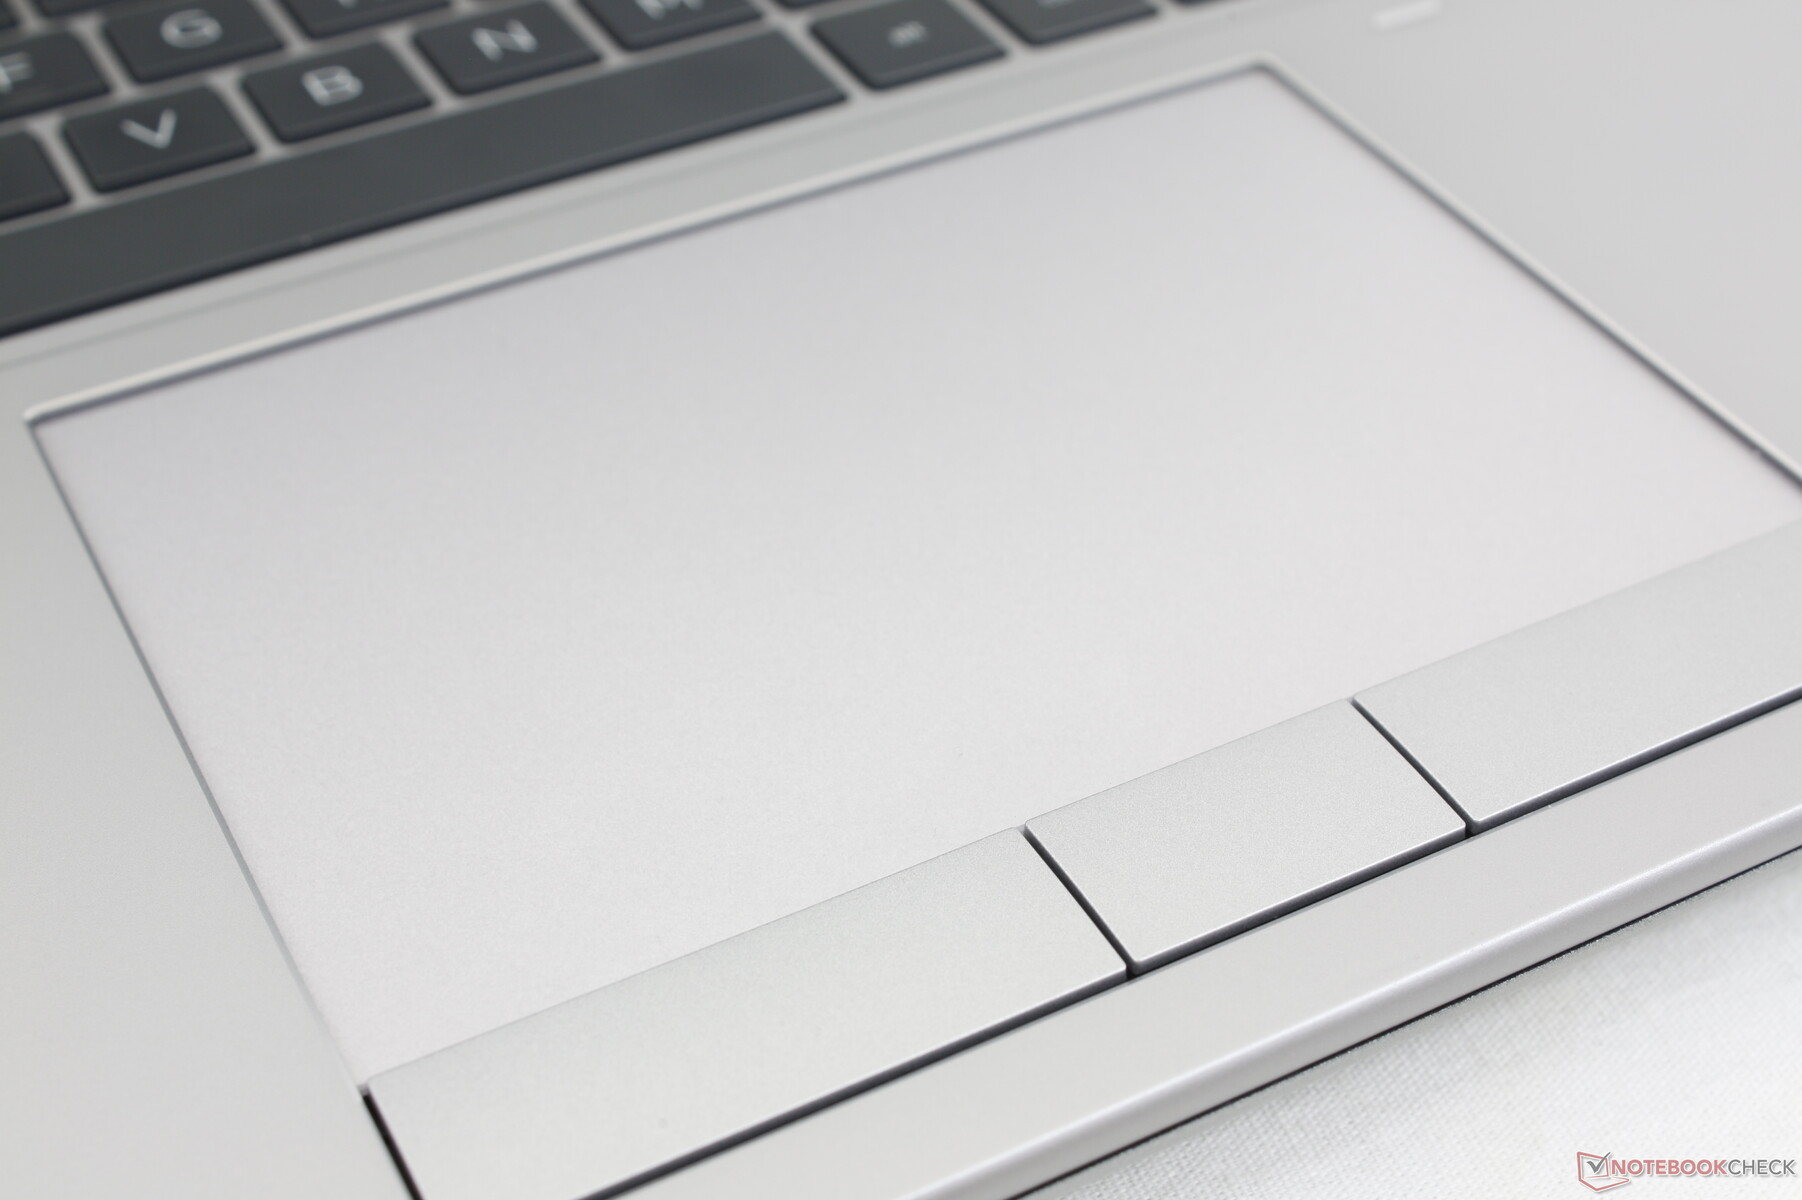
Le pavé tactile est l'un des meilleurs que nous ayons utilisés sur un ordinateur portable, qu'il s'agisse d'une station de travail ou autre. Non seulement il est plus grand (12,4 x 8,3 cm) que les pavés tactiles du ThinkPad P16 G1 (11,5 x 6,9 cm) ou du Precision 7670 (11,5 x 8 cm), mais ses propriétés de glissement sont douces pour un contrôle fiable du curseur à n'importe quelle vitesse. Par ailleurs, les boutons dédiés de la souris ont une course plus importante que sur la plupart des autres ordinateurs portables, tout en conservant un clic satisfaisant lorsqu'ils sont enfoncés. En comparaison, le Precision 7670 est dépourvu de boutons de souris dédiés au profit d'un pavé tactile.
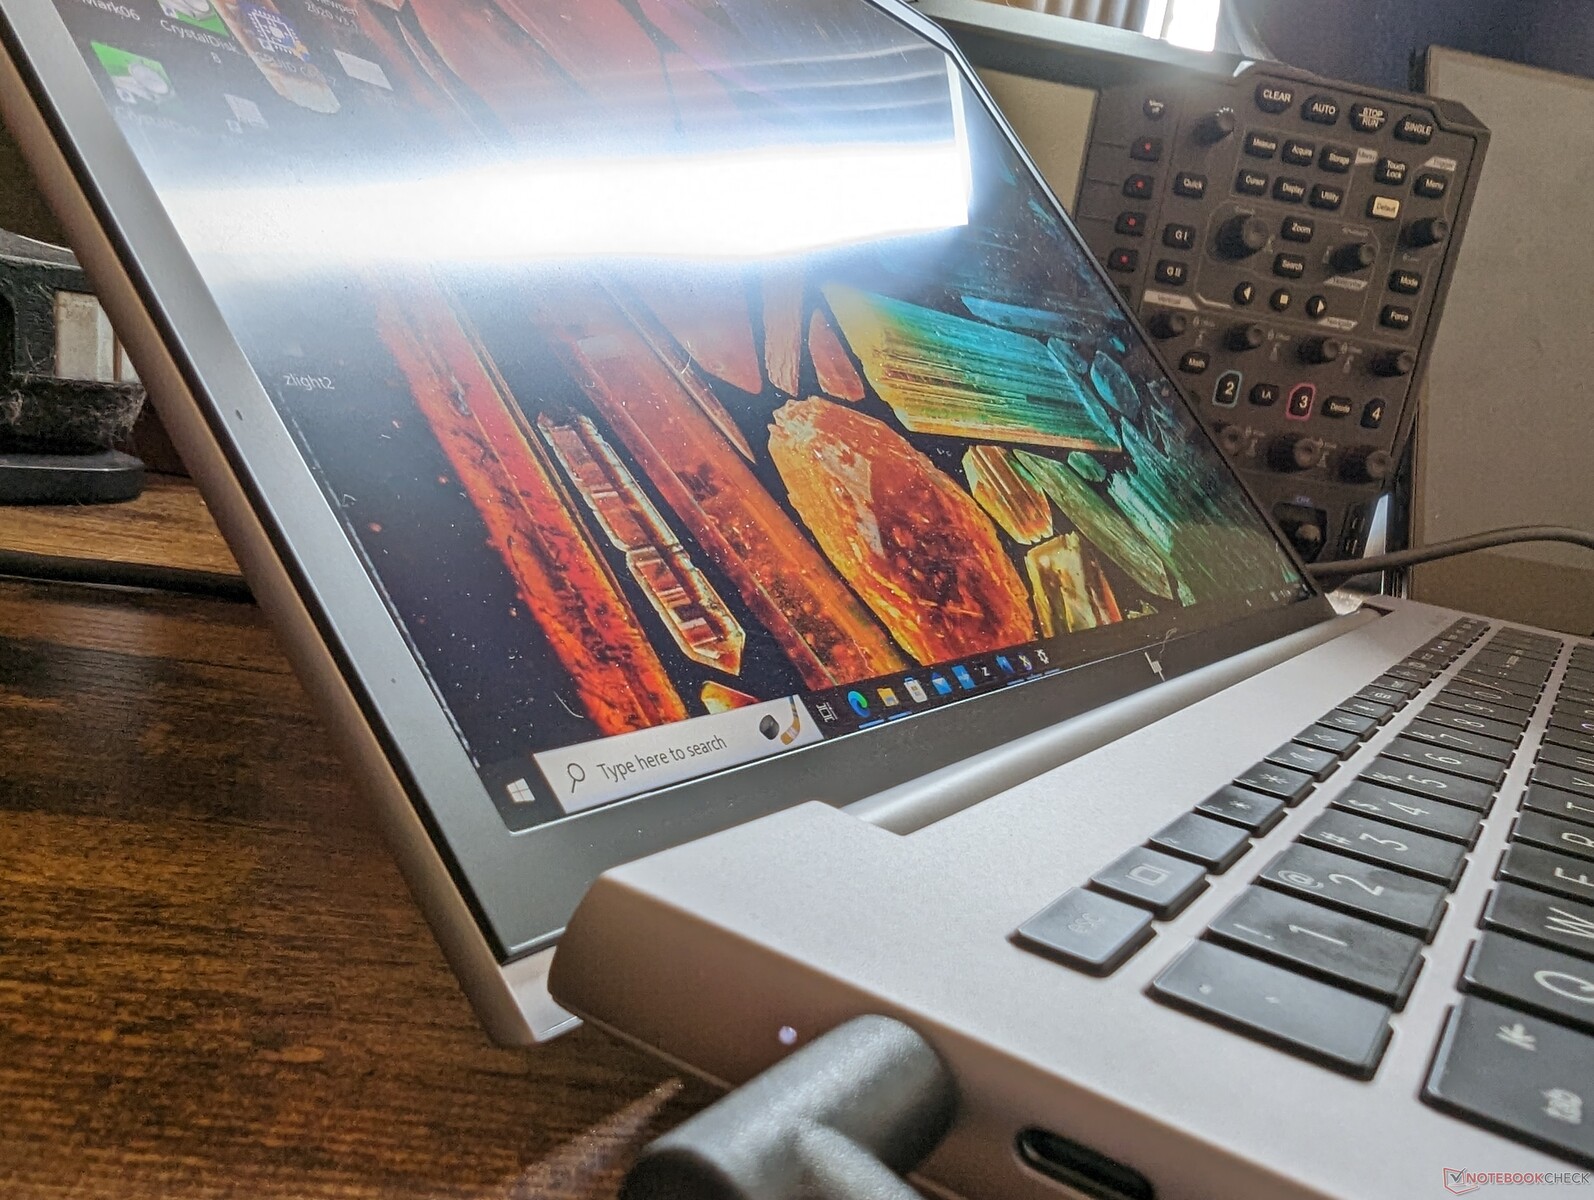
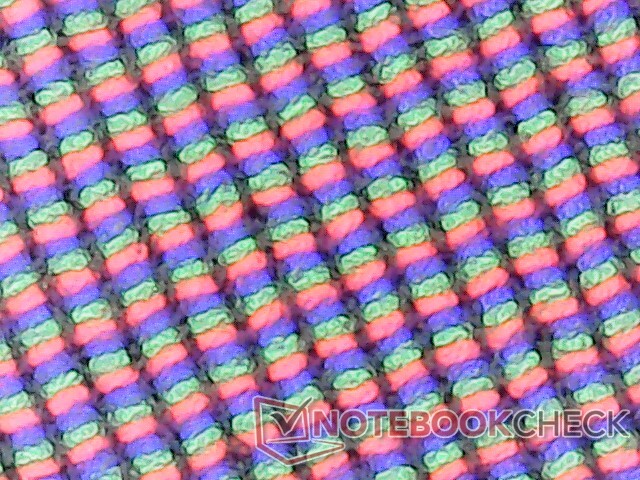
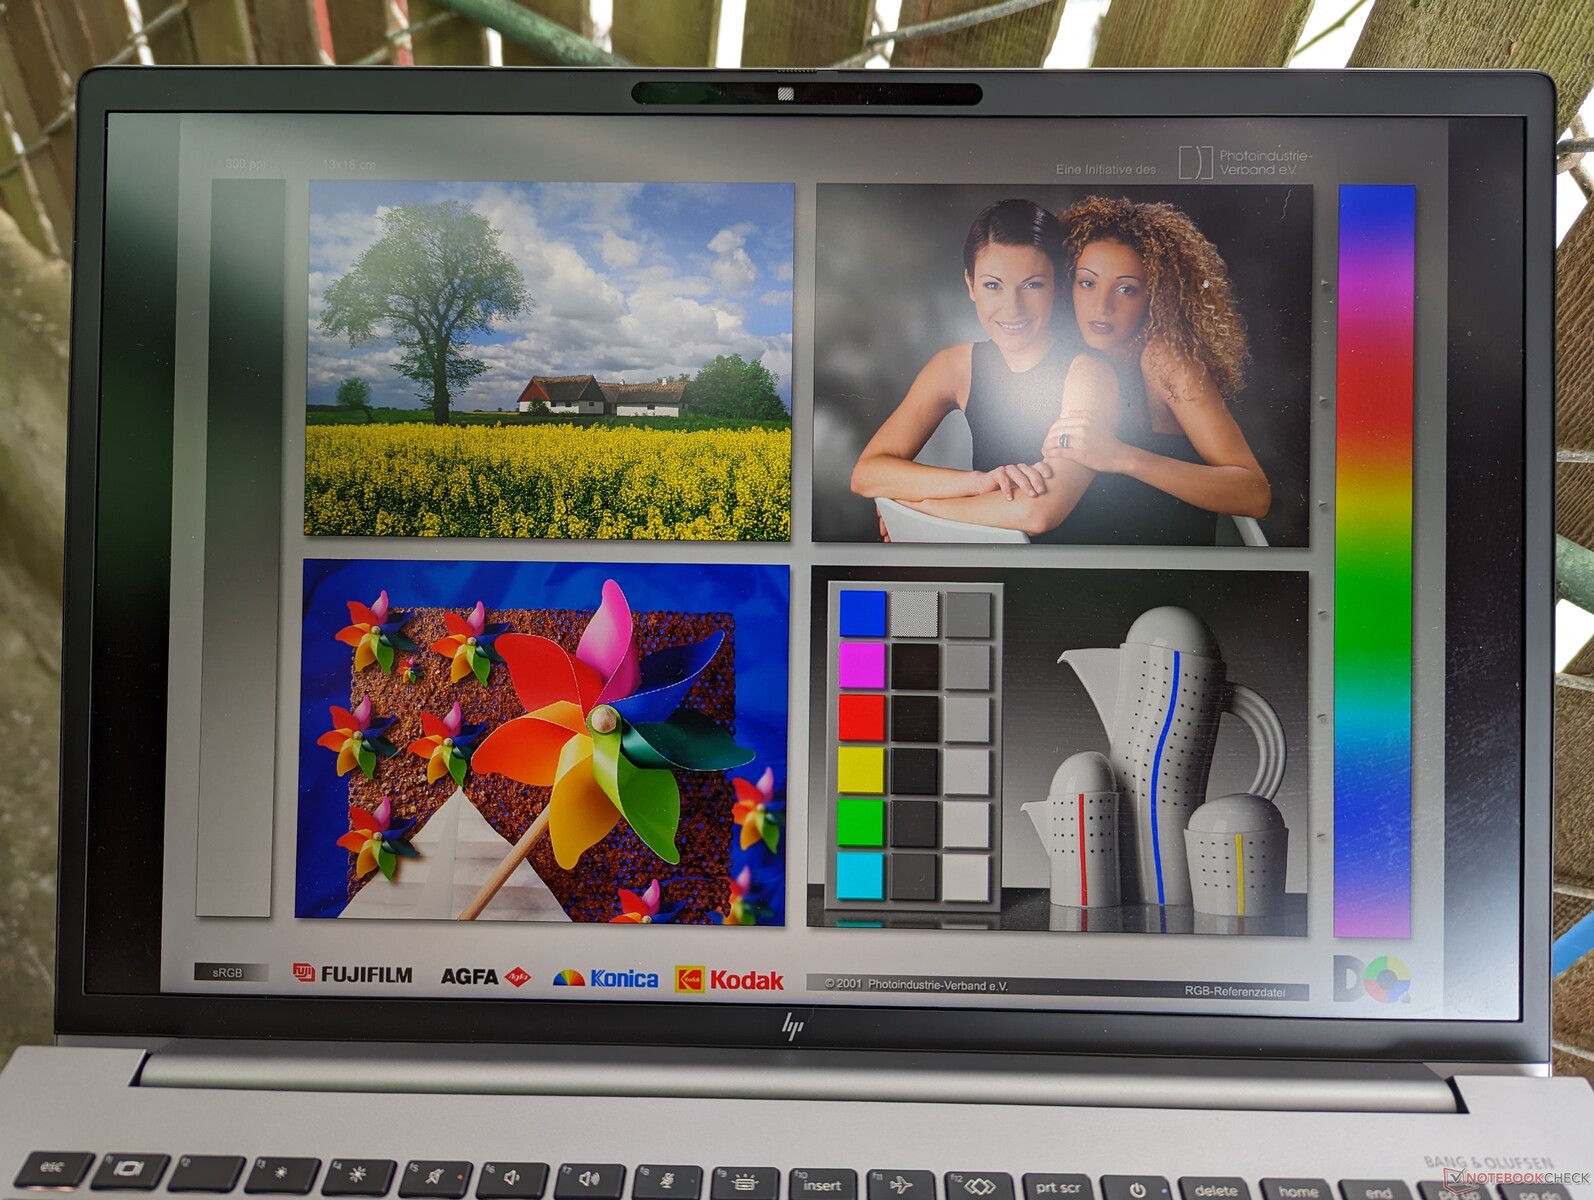
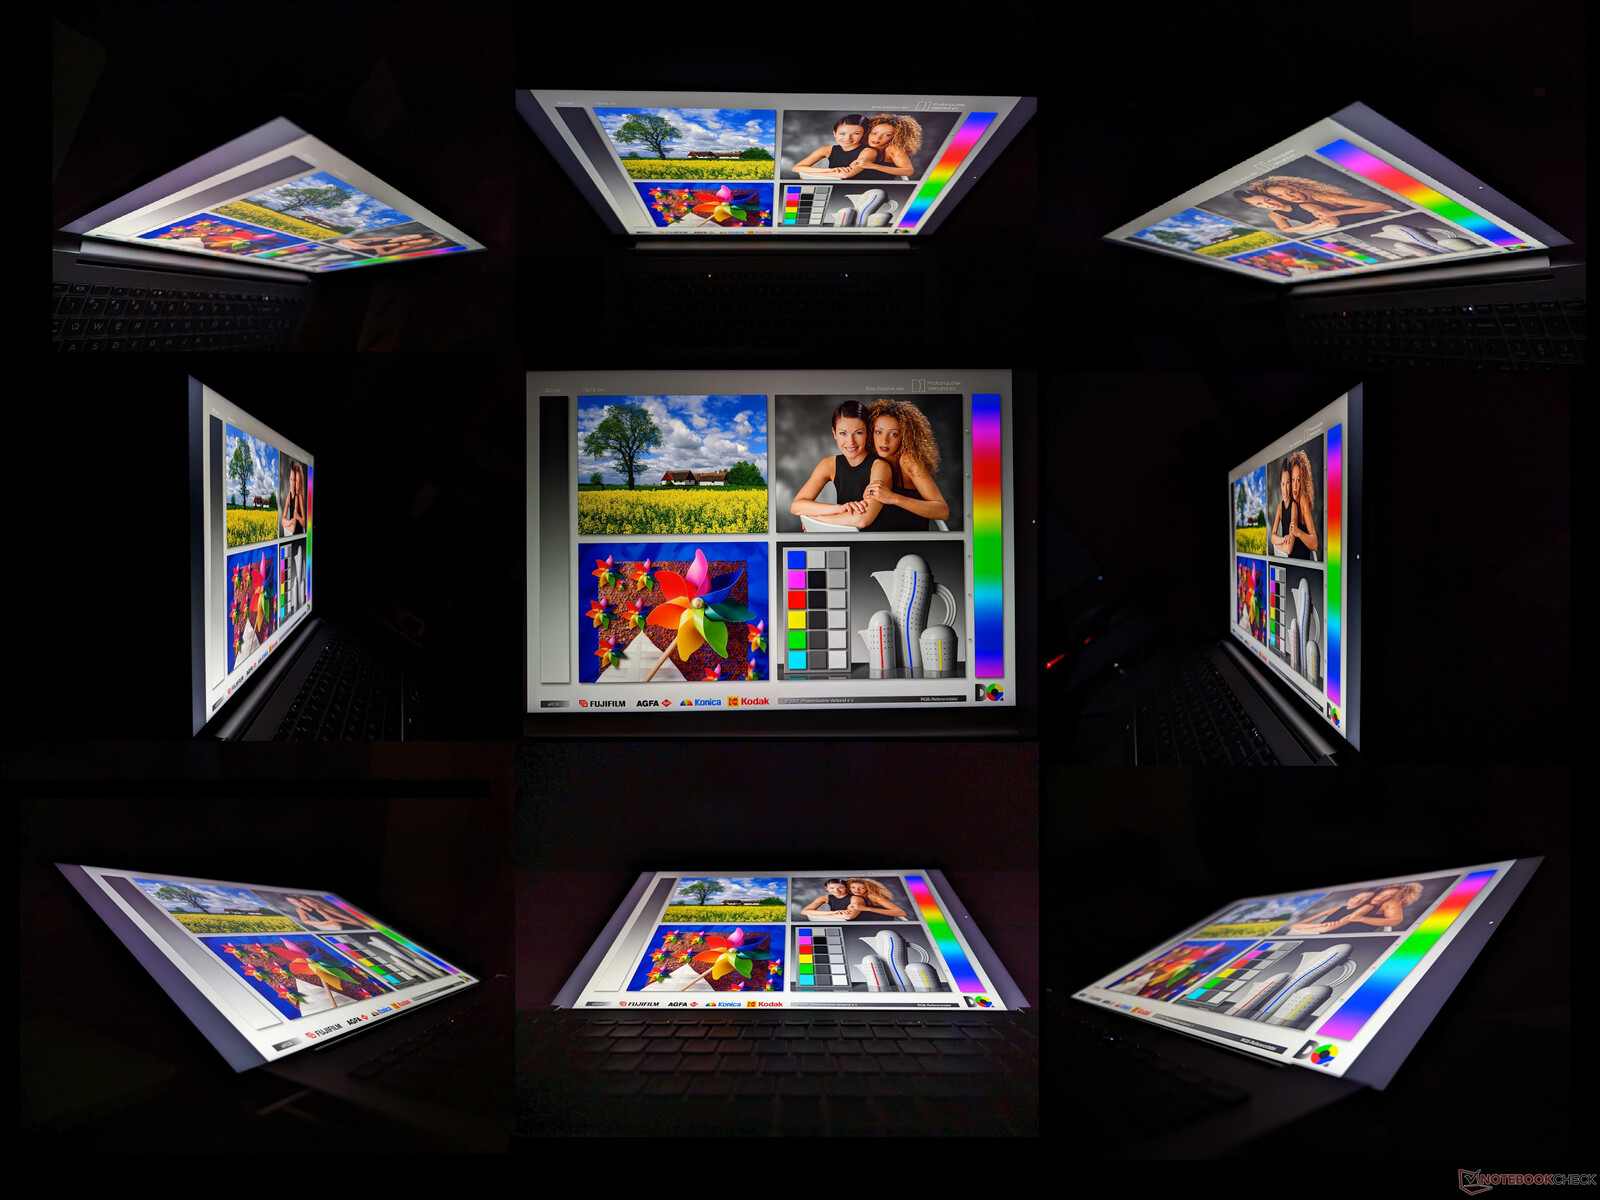
Affichage - Excellentes couleurs et bons temps de réponse
HP utilise les mêmes options de panneau BOE pour la plupart de ses ordinateurs portables de 16 pouces. Le ZBook Studio 16 G9par exemple, utilise le même écran 4K 16:10 que notre ZBook Fury 16 G9, comme le montrent leurs caractéristiques similaires dans le tableau ci-dessous.
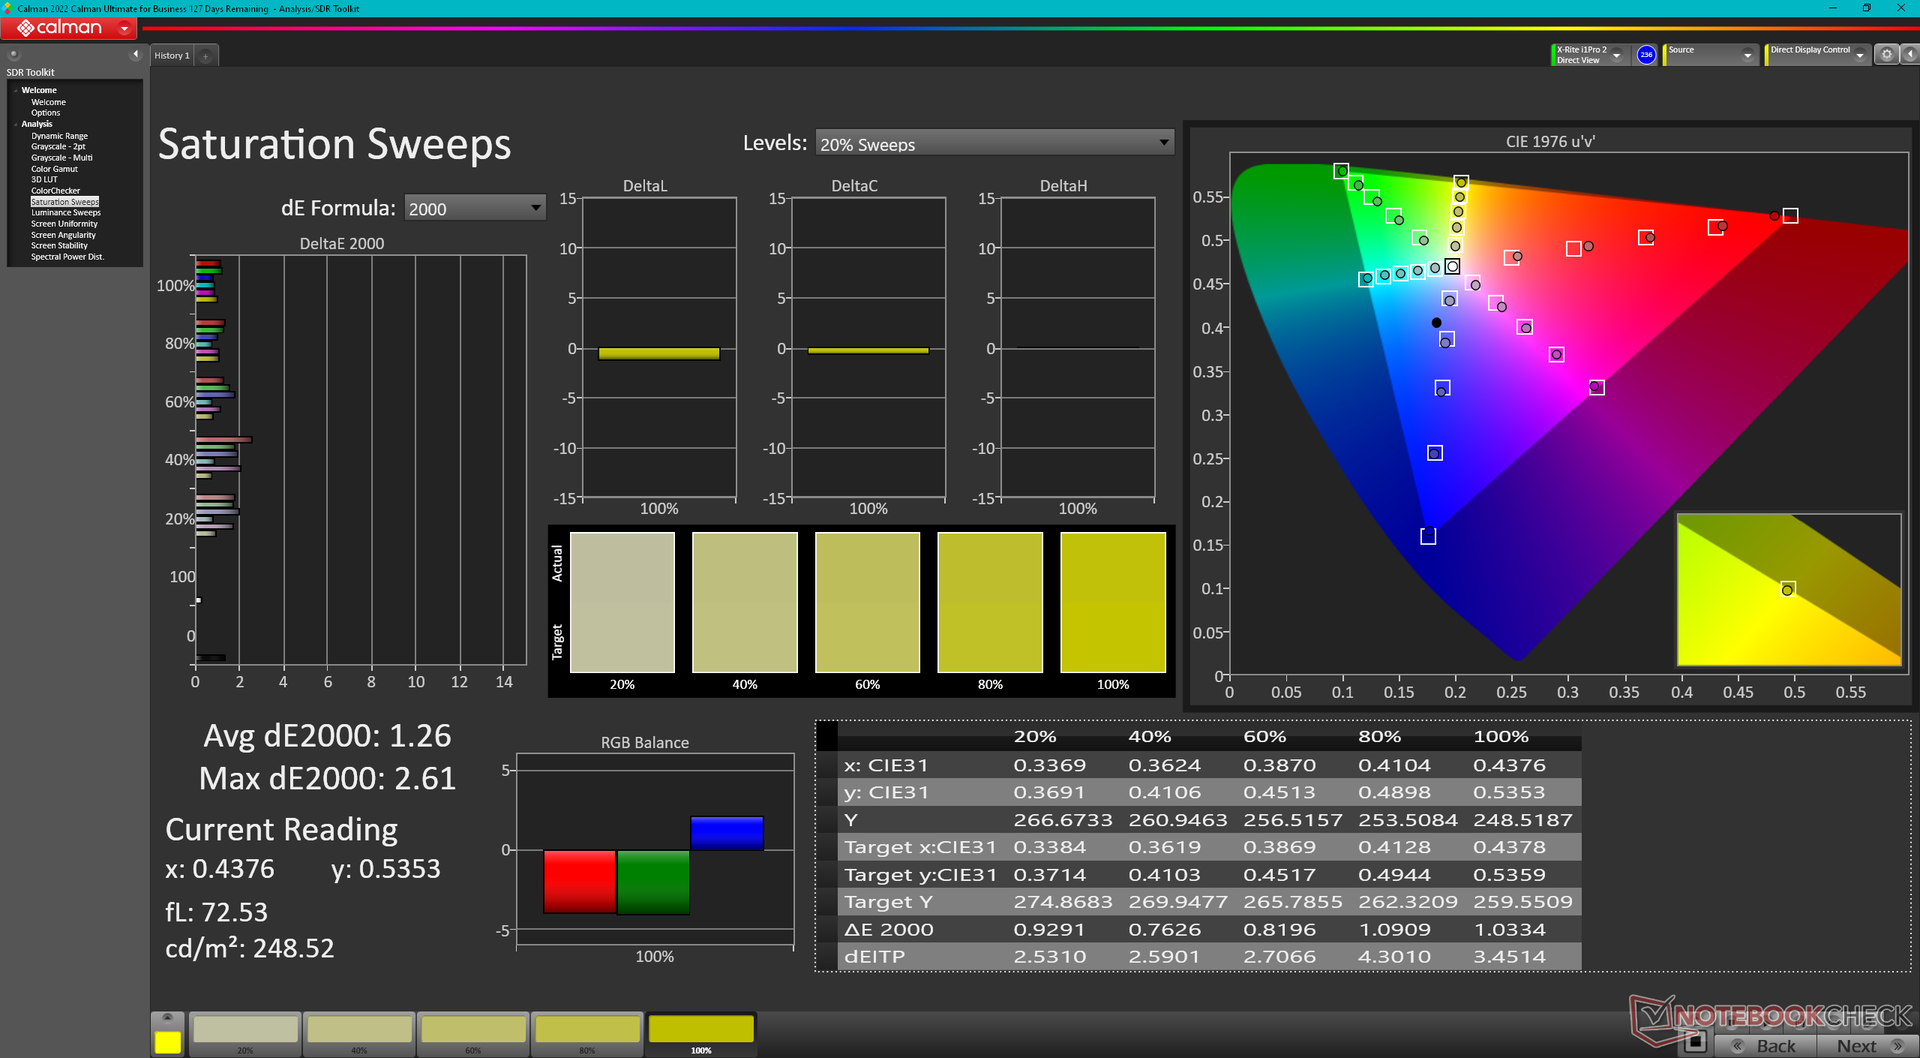
Notre écran IPS 4K particulier est une offre haut de gamme avec ses couleurs P3 étendues et ses bons temps de réponse noir-blanc et gris-gris qui conviennent à la fois à la création de contenu et aux applications de jeu. Cependant, la couche mate n'est pas aussi nette qu'une alternative brillante et le rapport de contraste est limité à ~1000:1. Heureusement, HP propose une option OLED pour remédier directement à ces deux lacunes.
| |||||||||||||||||||||||||
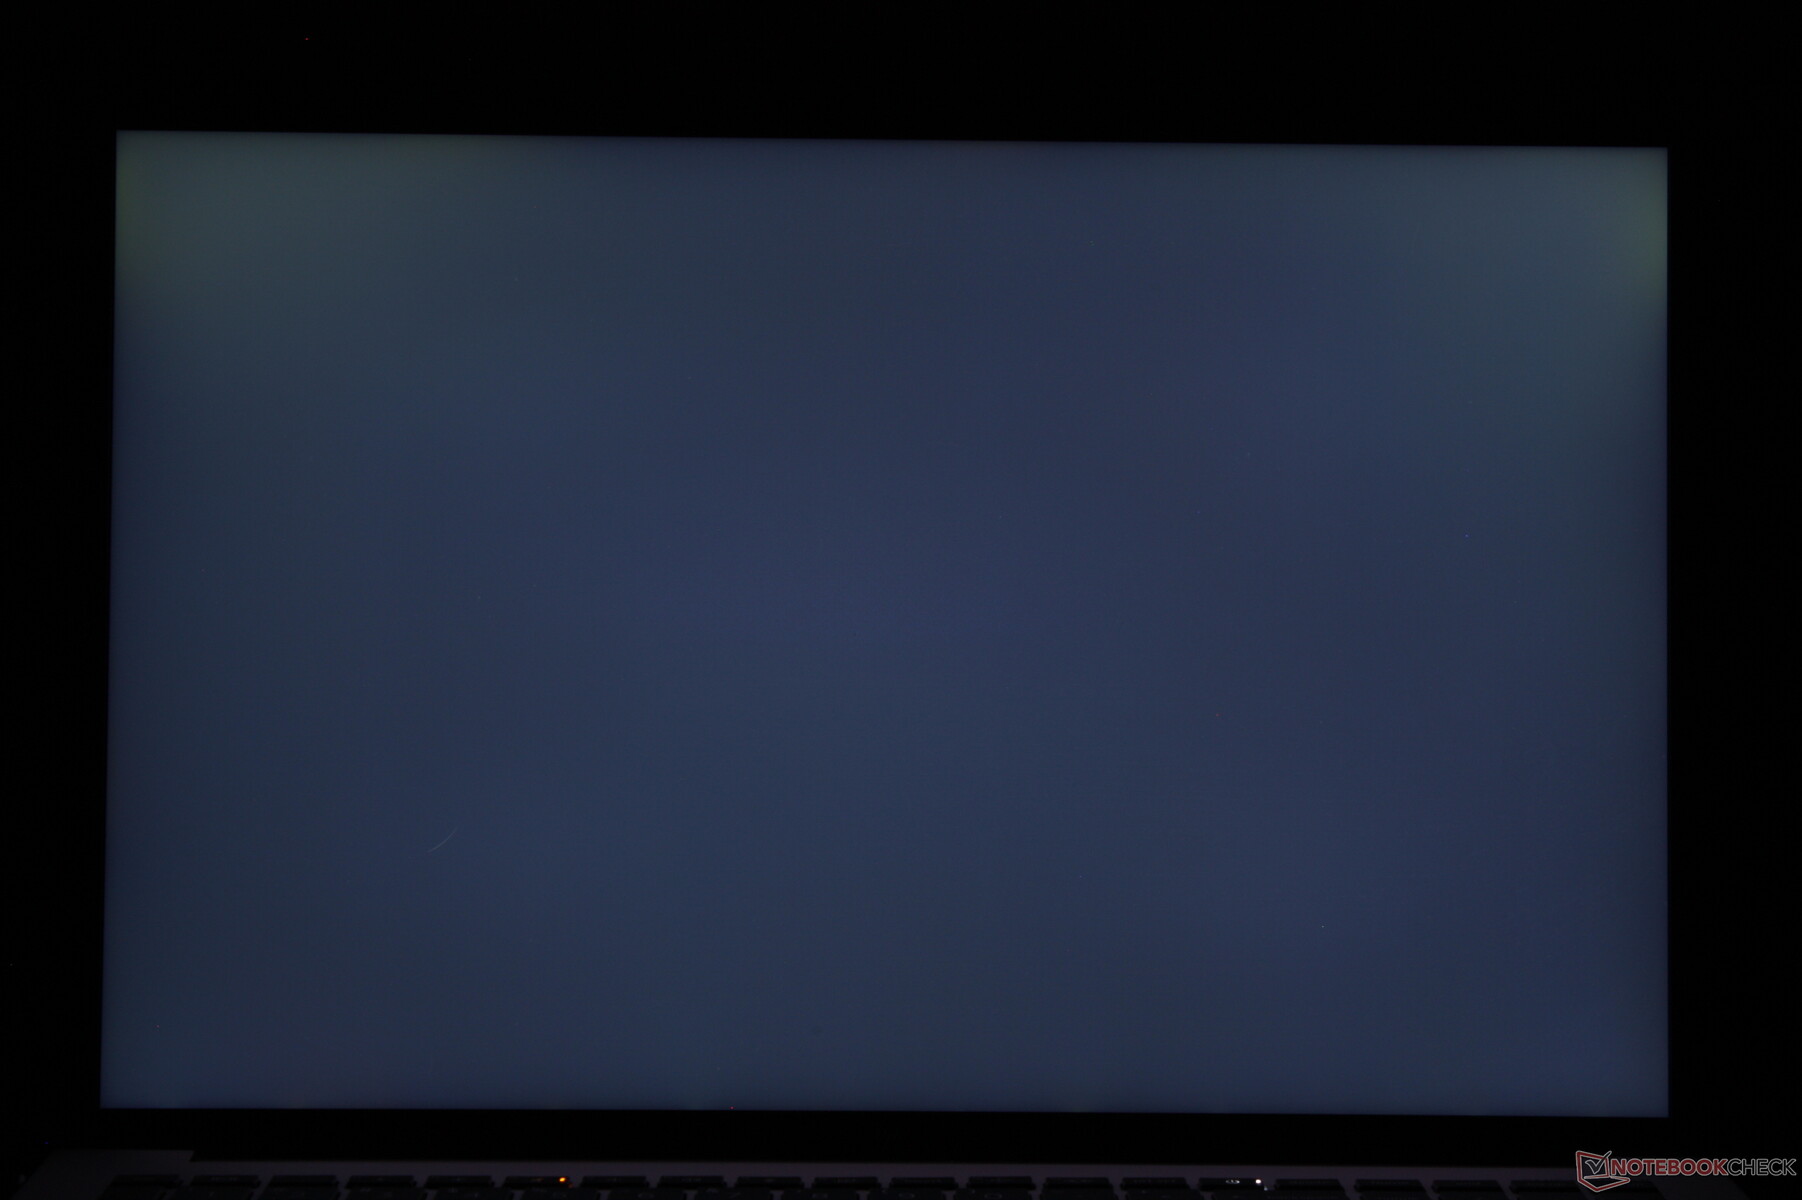
Homogénéité de la luminosité: 83 %
Valeur mesurée au centre, sur batterie: 451.7 cd/m²
Contraste: 931:1 (Valeurs des noirs: 0.57 cd/m²)
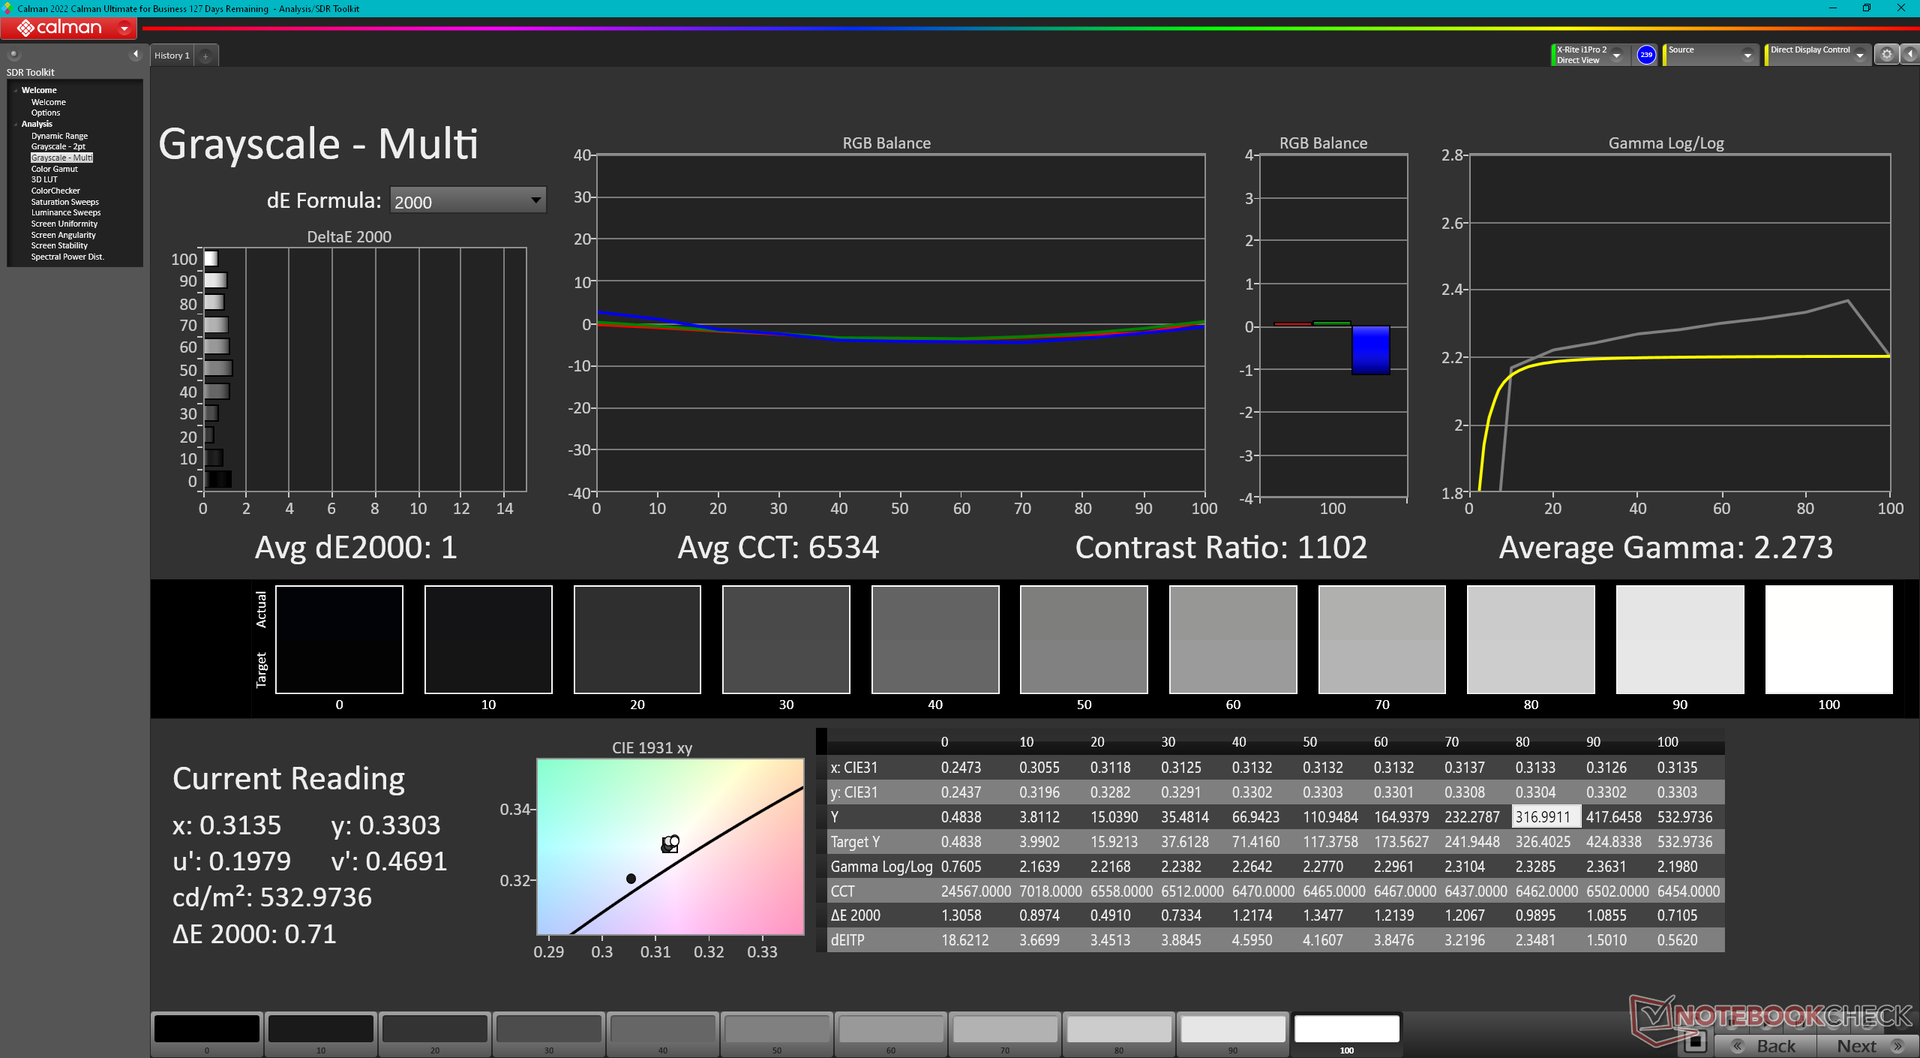
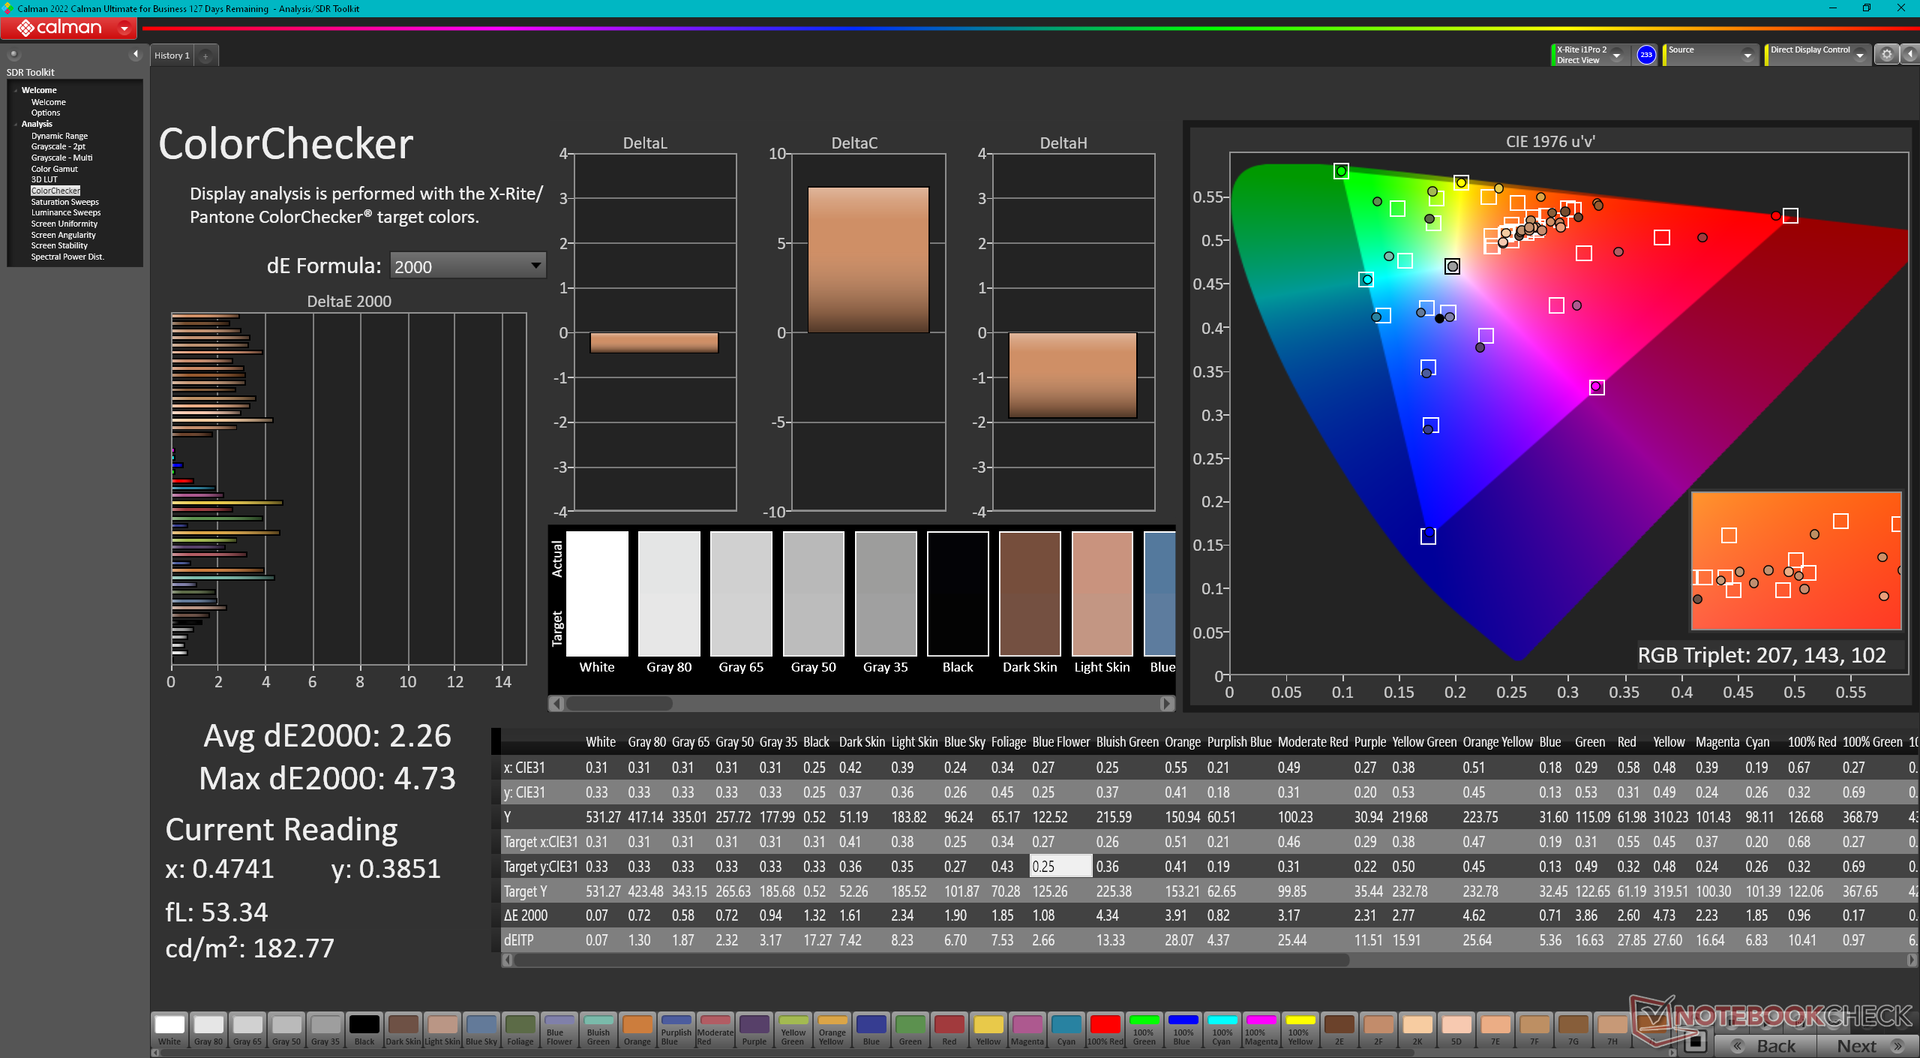
ΔE ColorChecker Calman: 2.26 | ∀{0.5-29.43 Ø4.71}
calibrated: 4.73
ΔE Greyscale Calman: 1 | ∀{0.09-98 Ø4.96}
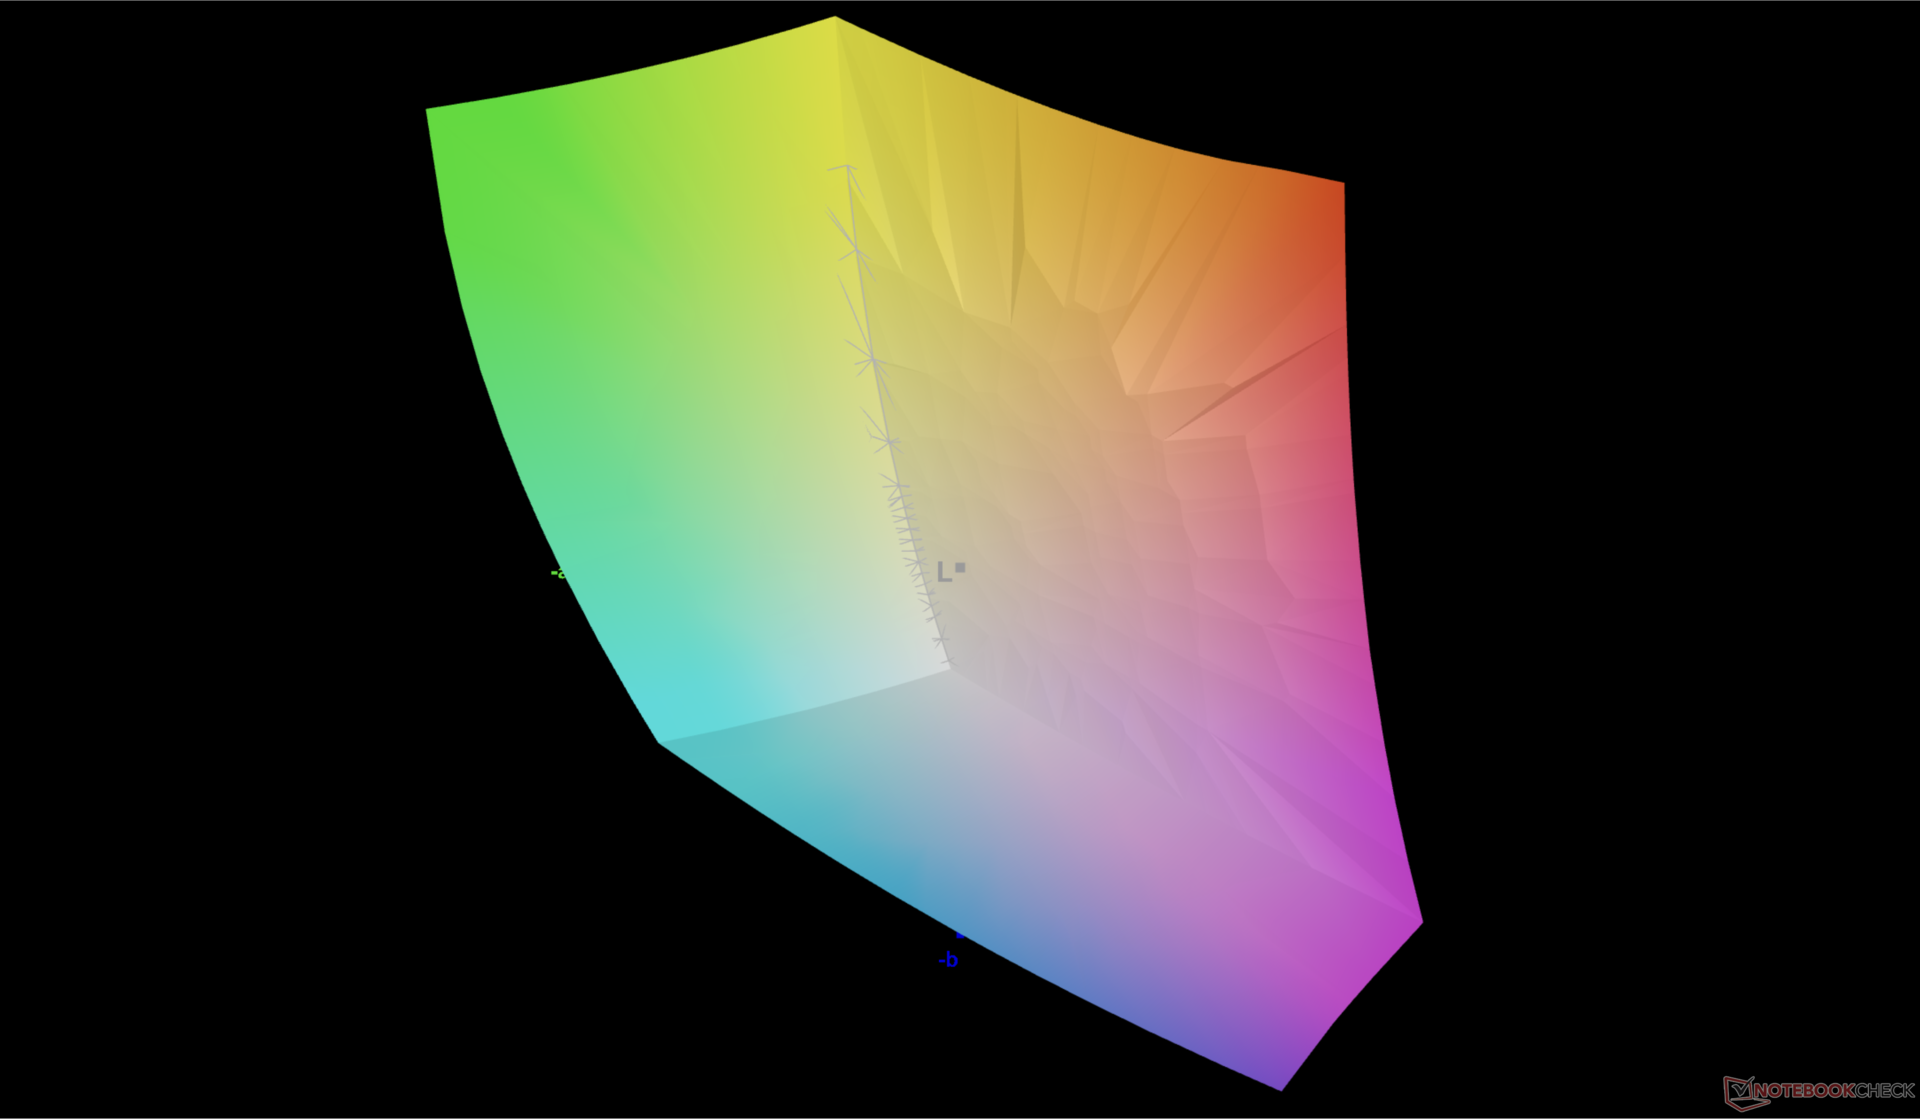
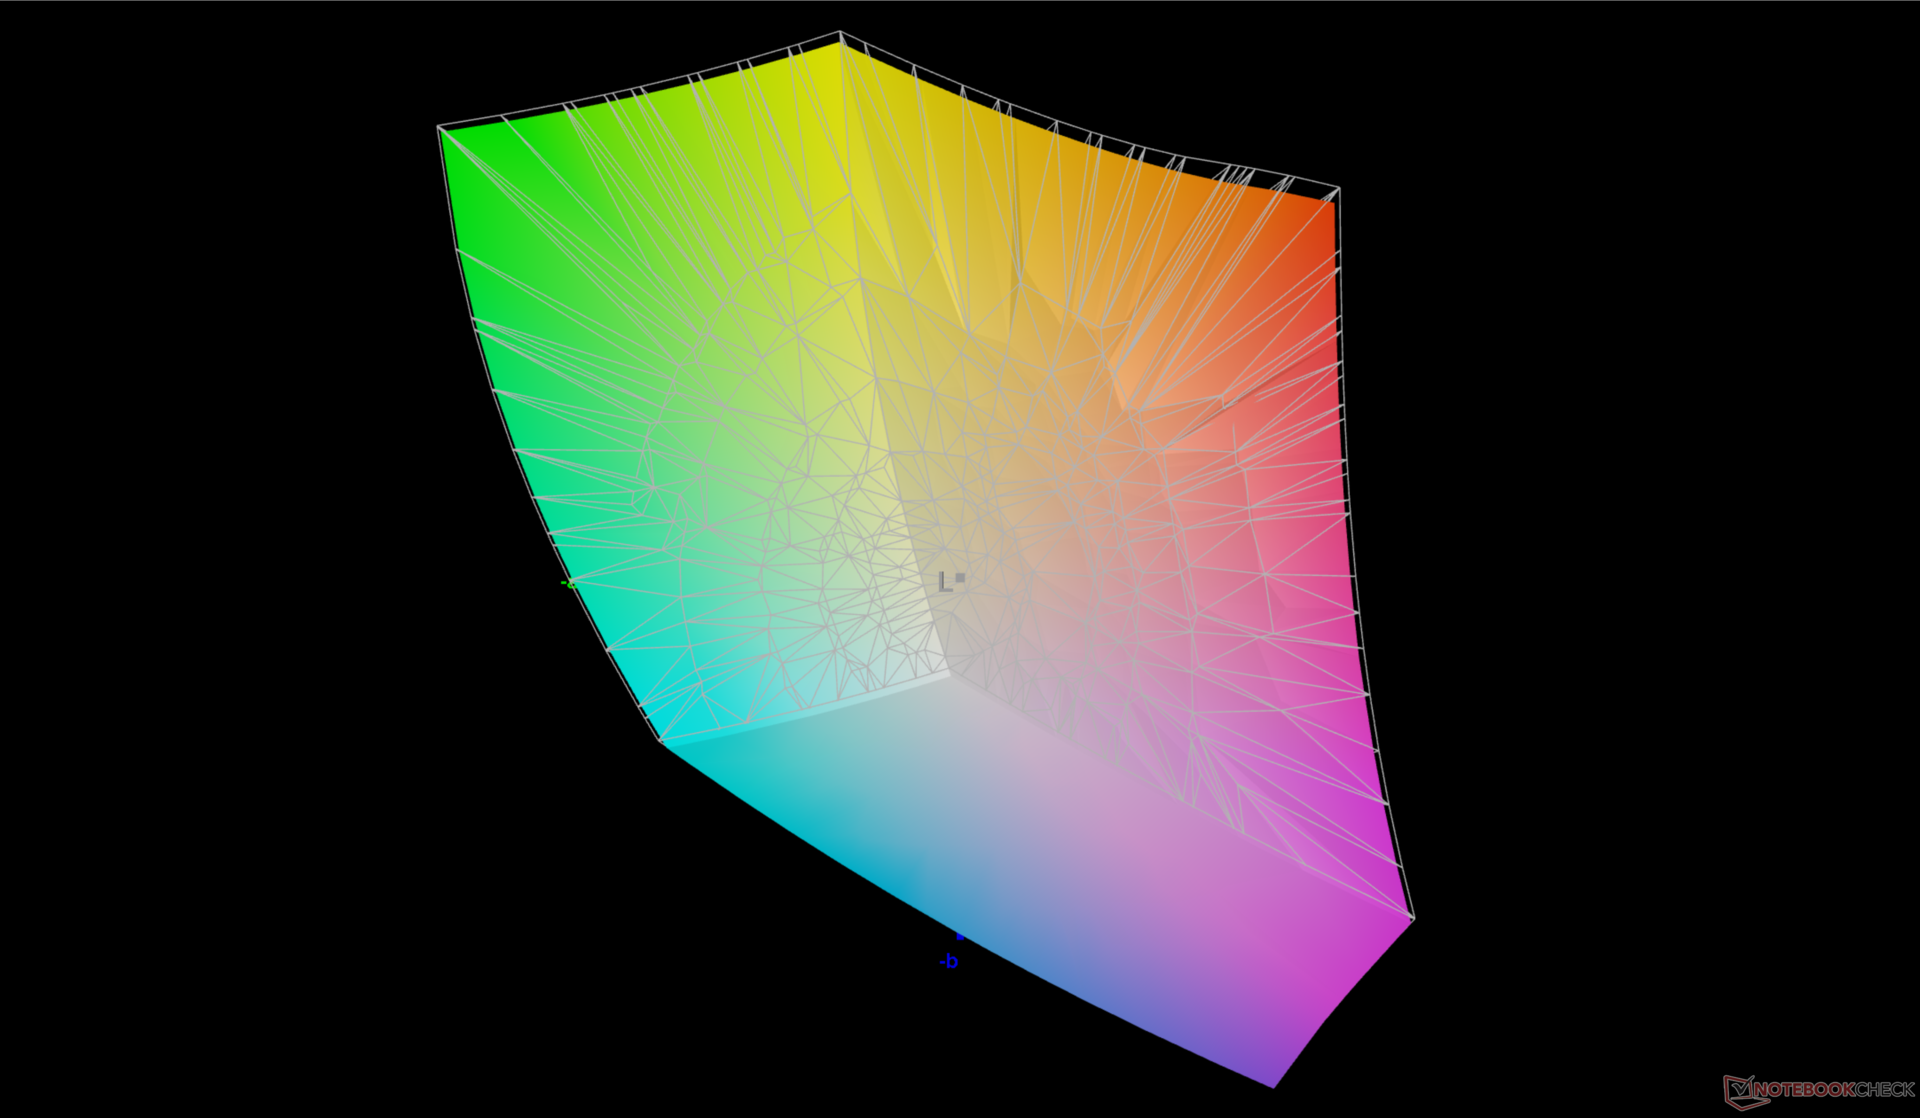
86.3% AdobeRGB 1998 (Argyll 3D)
99.9% sRGB (Argyll 3D)
97.4% Display P3 (Argyll 3D)
Gamma: 2.28
CCT: 6543 K
| HP ZBook Fury 16 G9 BOE0A52, IPS, 3840x2400, 16" | HP ZBook Studio 16 G9 62U04EA BOE0A52, IPS, 3840x2400, 16" | HP ZBook Firefly 16 G9-6B897EA BOE0A02, IPS, 1920x1200, 16" | Lenovo ThinkPad P16 G1 RTX A5500 LP160UQ1-SPB1, IPS, 3840x2400, 16" | Dell Precision 7000 7670 Performance Samsung 160YV03, OLED, 3840x2400, 16" | MSI CreatorPro Z16P B12UKST B160QAN02.N, IPS, 2560x1600, 16" | |
|---|---|---|---|---|---|---|
| Display | 0% | -18% | -2% | 6% | 0% | |
| Display P3 Coverage (%) | 97.4 | 97.5 0% | 68.1 -30% | 82.9 -15% | 99.9 3% | 97.6 0% |
| sRGB Coverage (%) | 99.9 | 99.9 0% | 96.1 -4% | 98.9 -1% | 100 0% | 99.9 0% |
| AdobeRGB 1998 Coverage (%) | 86.3 | 86.3 0% | 70 -19% | 95.9 11% | 98.1 14% | 87.4 1% |
| Response Times | 9% | -206% | -281% | 83% | 11% | |
| Response Time Grey 50% / Grey 80% * (ms) | 13.7 ? | 15.3 ? -12% | 52.8 ? -285% | 45.6 ? -233% | 1.84 ? 87% | 12.8 ? 7% |
| Response Time Black / White * (ms) | 8.6 ? | 6.1 ? 29% | 19.5 ? -127% | 36.8 ? -328% | 1.92 ? 78% | 7.4 ? 14% |
| PWM Frequency (Hz) | 59.52 ? | |||||
| Screen | 18% | -40% | -12% | -61% | 5% | |
| Brightness middle (cd/m²) | 530.5 | 554 4% | 526 -1% | 601.9 13% | 325.2 -39% | 407 -23% |
| Brightness (cd/m²) | 476 | 516 8% | 499 5% | 569 20% | 328 -31% | 388 -18% |
| Brightness Distribution (%) | 83 | 84 1% | 93 12% | 77 -7% | 97 17% | 88 6% |
| Black Level * (cd/m²) | 0.57 | 0.47 18% | 0.31 46% | 0.47 18% | 0.36 37% | |
| Contrast (:1) | 931 | 1179 27% | 1697 82% | 1281 38% | 1131 21% | |
| Colorchecker dE 2000 * | 2.26 | 1 56% | 3.6 -59% | 2.45 -8% | 4.59 -103% | 1.3 42% |
| Colorchecker dE 2000 calibrated * | 4.73 | 0.6 87% | 2.6 45% | 0.7 85% | ||
| Greyscale dE 2000 * | 1 | 1.6 -60% | 5.5 -450% | 2.6 -160% | 2.5 -150% | 2.1 -110% |
| Gamma | 2.28 96% | 2.29 96% | 2.02 109% | 2.3 96% | 2.1 105% | 2.26 97% |
| CCT | 6543 99% | 6458 101% | 6527 100% | 6805 96% | 6541 99% | 6437 101% |
| Colorchecker dE 2000 max. * | 2.4 | 6.6 | 4.46 | 7.65 | 2.5 | |
| Moyenne finale (programmes/paramètres) | 9% /
12% | -88% /
-60% | -98% /
-54% | 9% /
-12% | 5% /
5% |
* ... Moindre est la valeur, meilleures sont les performances
L'écran est calibré en fonction de la norme P3, avec des valeurs DeltaE moyennes en niveaux de gris et en couleurs de seulement 1,0 et 2,26, respectivement.
Temps de réponse de l'écran
| ↔ Temps de réponse noir à blanc | ||
|---|---|---|
| 8.6 ms ... hausse ↗ et chute ↘ combinées | ↗ 4.7 ms hausse | 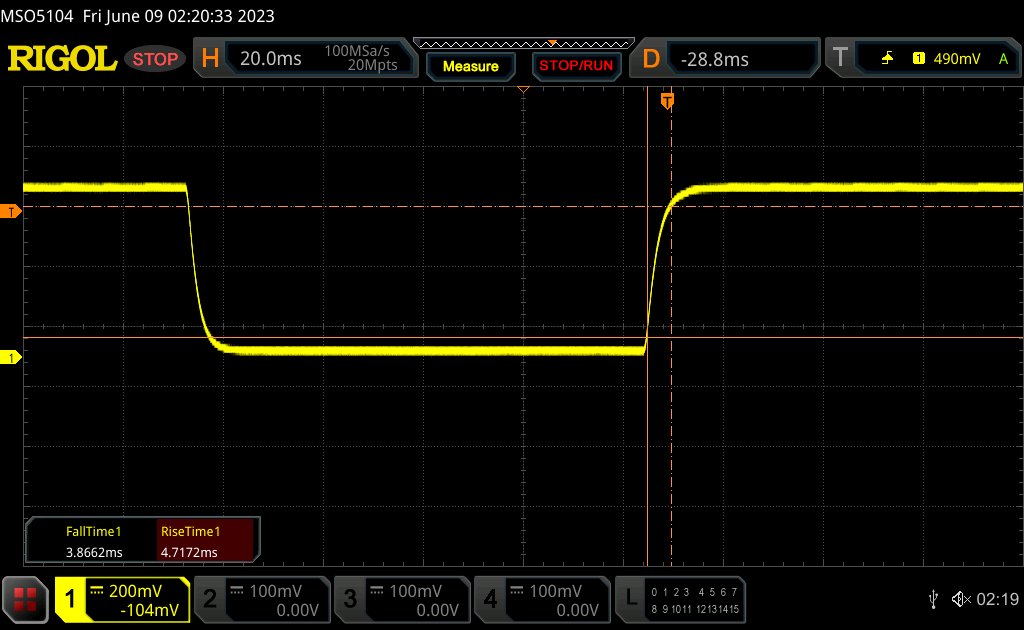 |
| ↘ 3.9 ms chute | ||
| L'écran montre de faibles temps de réponse, un bon écran pour jouer. En comparaison, tous les appareils testés affichent entre 0.1 (minimum) et 240 (maximum) ms. » 24 % des appareils testés affichent de meilleures performances. Cela signifie que les latences relevées sont meilleures que la moyenne (19.8 ms) de tous les appareils testés. | ||
| ↔ Temps de réponse gris 50% à gris 80% | ||
| 13.7 ms ... hausse ↗ et chute ↘ combinées | ↗ 6.6 ms hausse | 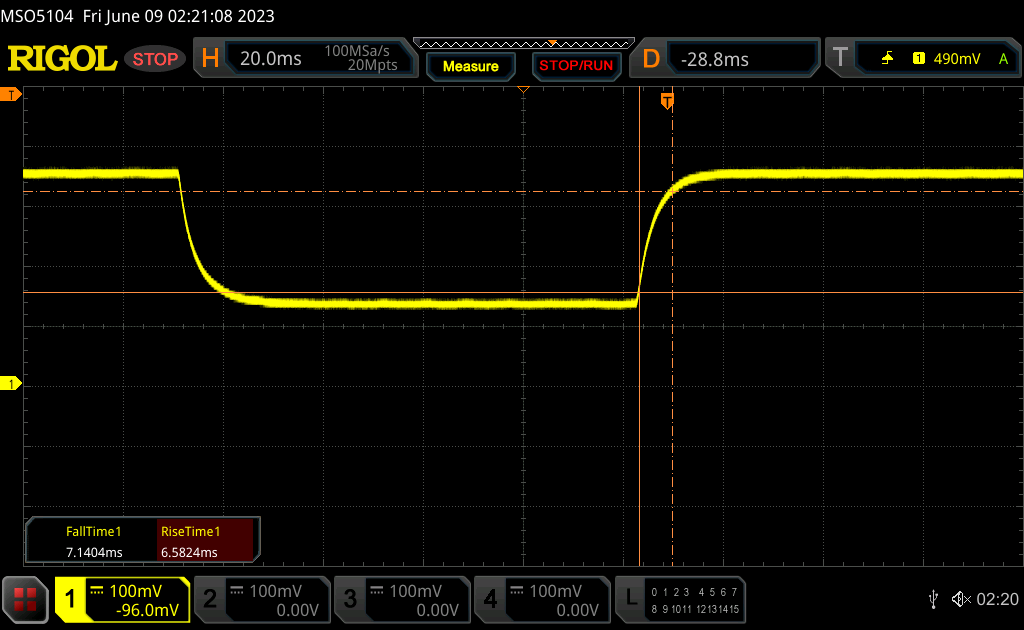 |
| ↘ 7.1 ms chute | ||
| L'écran montre de bons temps de réponse, mais insuffisant pour du jeu compétitif. En comparaison, tous les appareils testés affichent entre 0.165 (minimum) et 636 (maximum) ms. » 28 % des appareils testés affichent de meilleures performances. Cela signifie que les latences relevées sont meilleures que la moyenne (30.9 ms) de tous les appareils testés. | ||
Scintillement / MLI (Modulation de largeur d'impulsion)
| Scintillement / MLI (Modulation de largeur d'impulsion) non décelé | 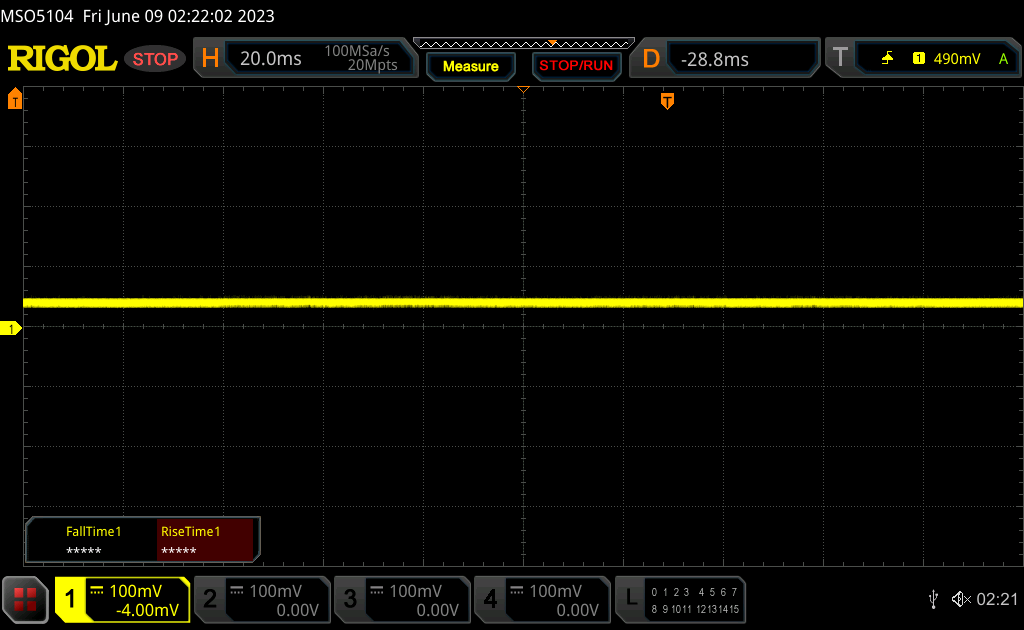 | ||
En comparaison, 52 % des appareils testés n'emploient pas MDI pour assombrir leur écran. Nous avons relevé une moyenne à 7748 (minimum : 5 - maximum : 343500) Hz dans le cas où une MDI était active. | |||
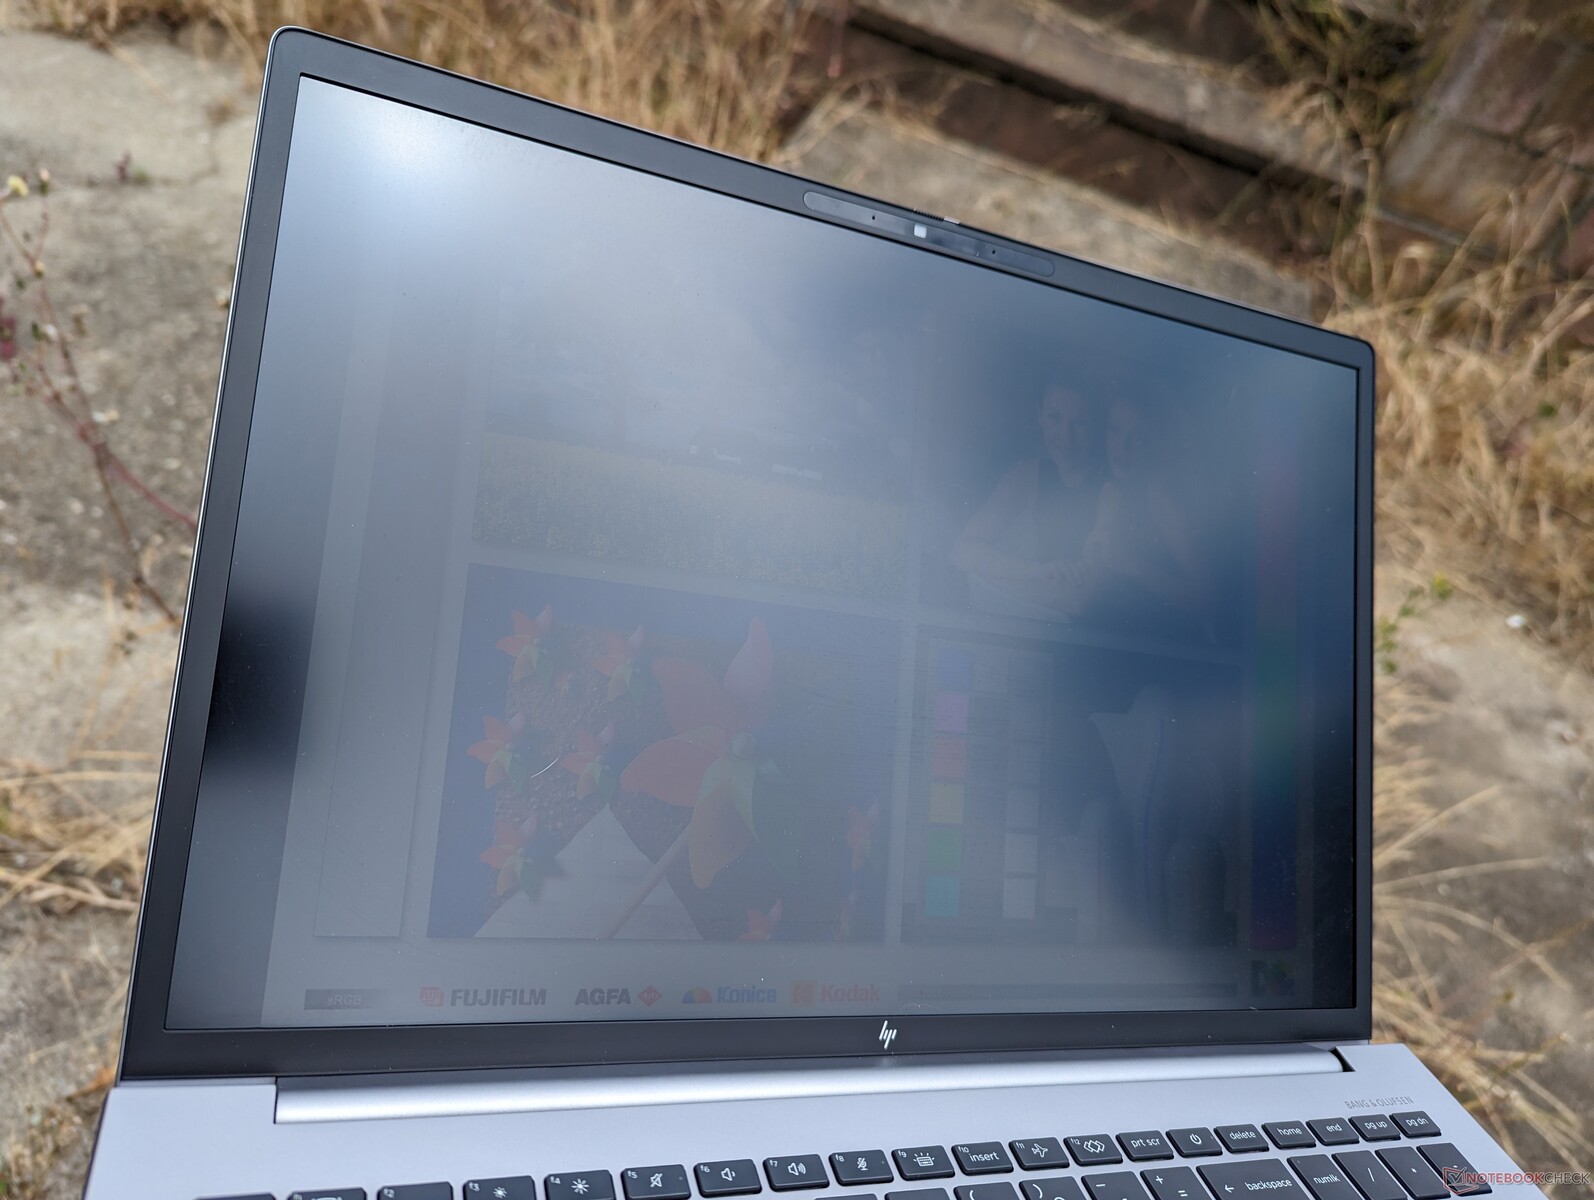
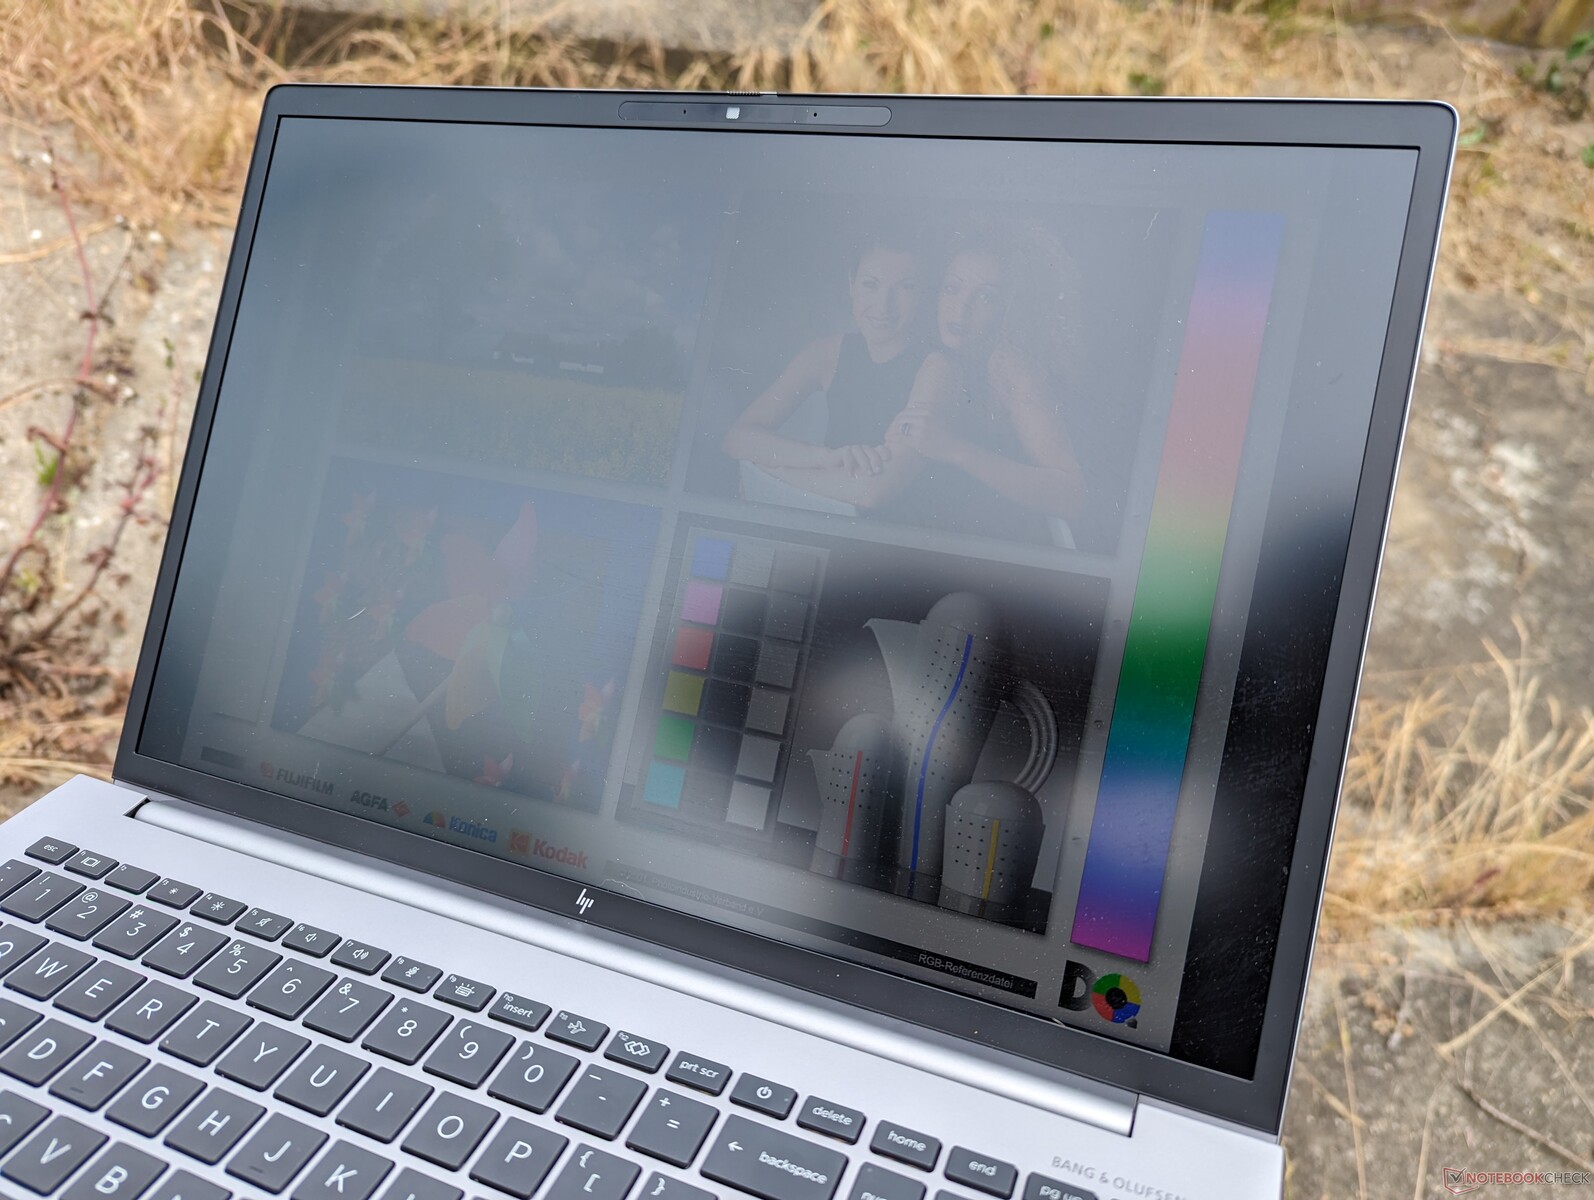
La visibilité en extérieur est correcte à l'ombre et comparable à celle de nombreux Ultrabooks grand public, puisque 400 nits est un objectif commun. HP propose une option beaucoup plus lumineuse de 1000 nits si la visibilité extérieure est une priorité, mais les panneaux sont limités à IPS et à une résolution de seulement 1920 x 1200 pour l'instant.
Il convient de noter que l'option Display Power Savings est activée par défaut, ce qui signifie que la luminosité maximale de l'écran peut chuter de 80 nits si l'ordinateur fonctionne sur batterie. Pour éviter cela, lancez Intel Graphics Command Center et allez dans les sous-menus System et Power pour désactiver Display Power Savings.
Performances - Intel Alder Lake-H 12e génération avec Nvidia RTX Ampere
Conditions d'essai
Nous avons réglé notre appareil en mode Performance avant d'effectuer les tests ci-dessous. HP ne propose pas d'autres profils d'alimentation que les profils standard de Windows et les fonctions avancées comme Optimus 2.0 ou MUX ne sont pas prises en charge.
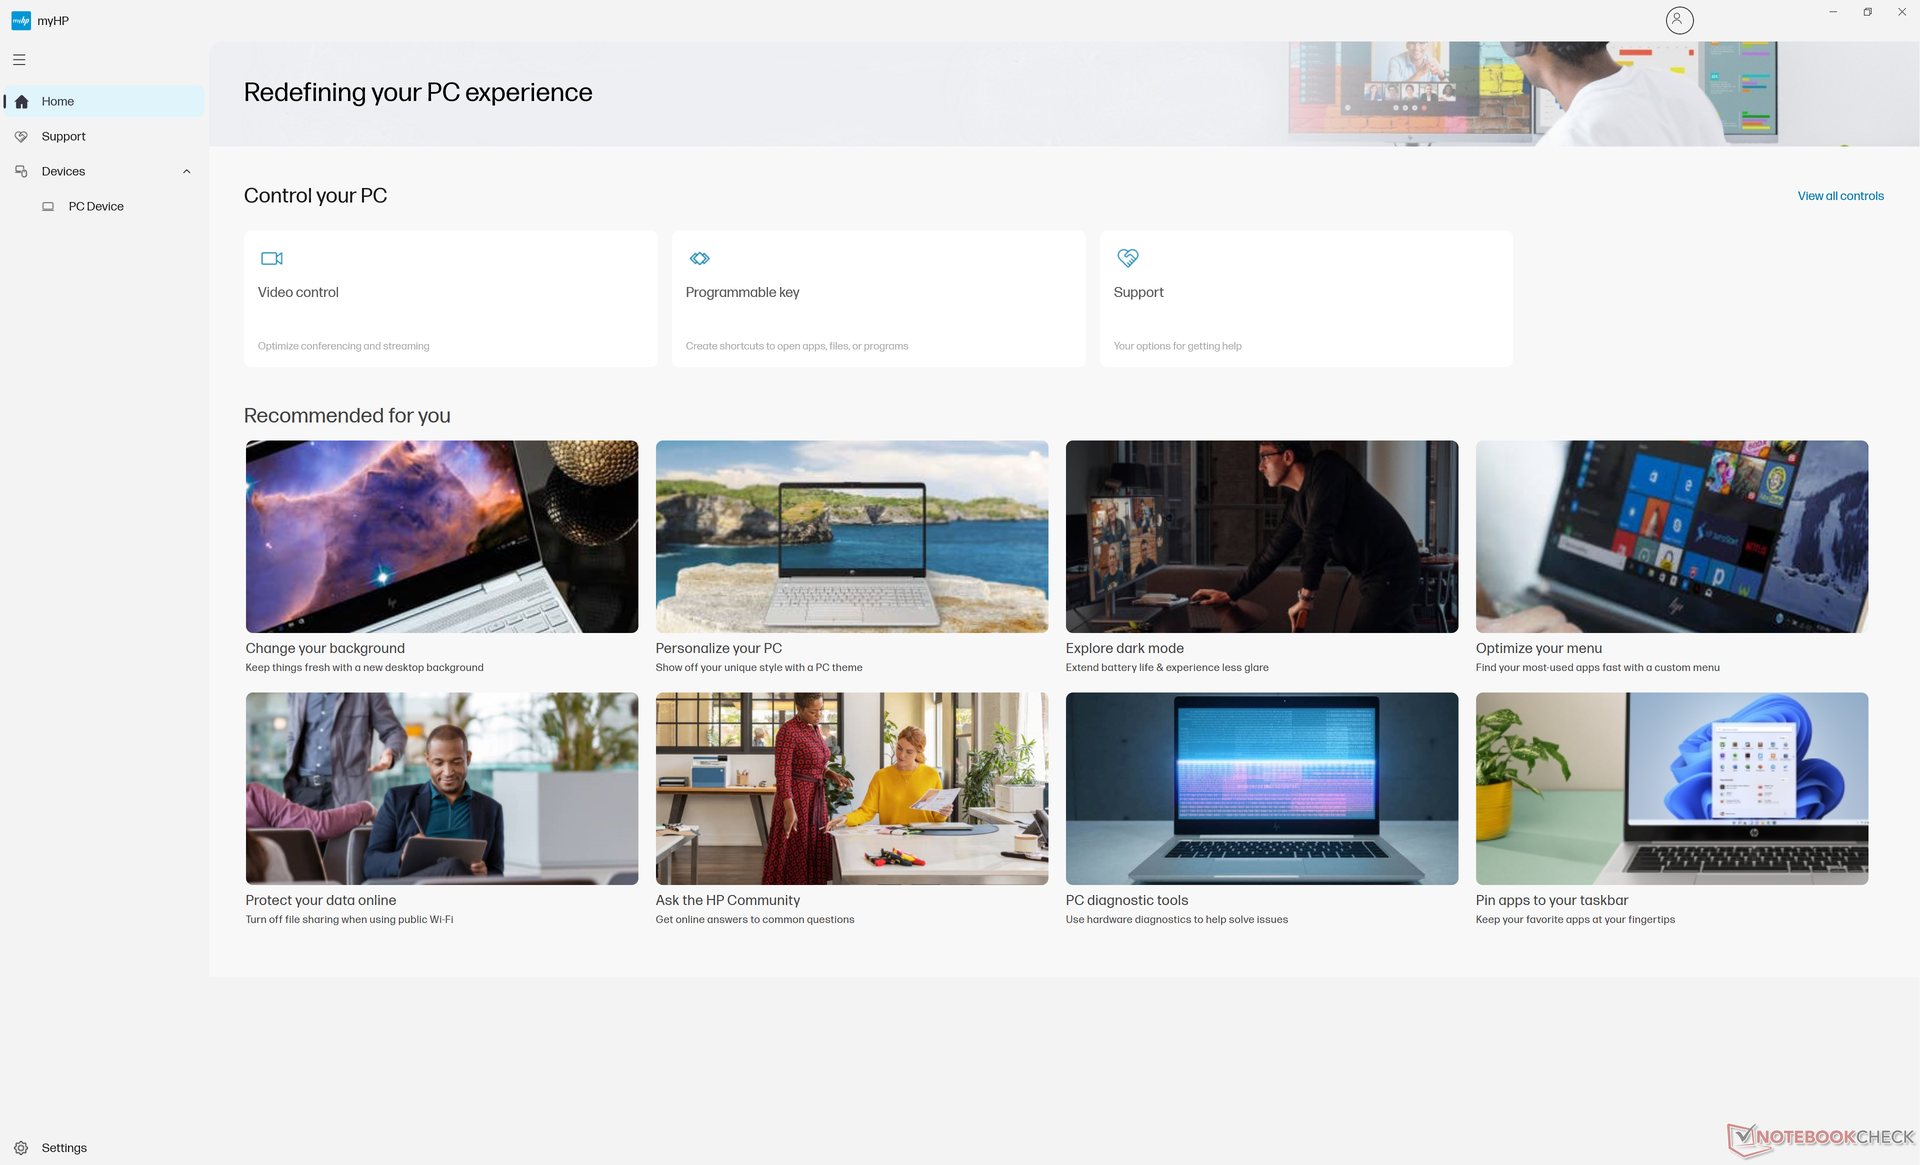
Il est recommandé aux utilisateurs de se familiariser avec MyHP et Z Light Space pour les mises à jour logicielles spécifiques à HP et les paramètres de clavier RVB, respectivement.
Processeur
La 12e génération de Core i9-12950HX a été l'un des processeurs mobiles les plus rapides disponibles avec la prise en charge vPro et ECC jusqu'au lancement du Core i9-12950HX de 13e génération Core i9-13950HX. En ce qui concerne les options de la 13e génération, le Fury 16 G10 a récemment commencé à être expédié.
Le processeur de notre HP est légèrement moins performant d'environ 5 % par rapport à la moyenne des ordinateurs portables de notre base de données équipés du même processeur Core i9-12950HX. Pire encore, le processeur semble s'essouffler davantage lorsqu'il est soumis à de longues périodes de stress. Lors de l'exécution en boucle de CineBench R15 xT, par exemple, les performances chutent d'environ 20 % après la 7e ou la 8e boucle. Le ThinkPad P16 G1 Test du Lenovo ThinkPad P16 G1 RTX A5500 : plus puissant que le Dell Precision 7670 subit un ralentissement moins important du processeur, comme le montre notre graphique de comparaison ci-dessous
.Le passage à la configuration Core i7-12850HX à partir de notre Core i9-12950HX devrait avoir un impact sur les performances mono et multithread d'environ 15 à 20
%.Cinebench R15 Multi Loop
Cinebench R23: Multi Core | Single Core
Cinebench R20: CPU (Multi Core) | CPU (Single Core)
Cinebench R15: CPU Multi 64Bit | CPU Single 64Bit
Blender: v2.79 BMW27 CPU
7-Zip 18.03: 7z b 4 | 7z b 4 -mmt1
Geekbench 5.5: Multi-Core | Single-Core
HWBOT x265 Benchmark v2.2: 4k Preset
LibreOffice : 20 Documents To PDF
R Benchmark 2.5: Overall mean