Test du Framework Laptop 13.5 Intel 12e génération : une Microsoft Surface, mais réparable
L'ordinateur portable Framework original de 13,5 pouces, lancé en 2021, était équipé de processeurs Intel de 11e génération ( Tiger Lake-U). Contrairement à d'autres modèles ultra-minces de grands fabricants qui sont souvent fermés et difficiles à entretenir, le design du Framework donnerait la priorité à la réparabilité et encouragerait les mises à niveau par les utilisateurs finaux. En fait, le fabricant vend ouvertement des composants individuels de l'ordinateur portable Framework à la carte si les propriétaires ont besoin de remplacer certaines pièces. Le dernier modèle 2022 est désormais disponible avec des processeurs Intel Alder Lake-P de 12e génération plus rapides, mais avec la même conception générale du châssis pour préserver la rétrocompatibilité avec les accessoires et composants existants
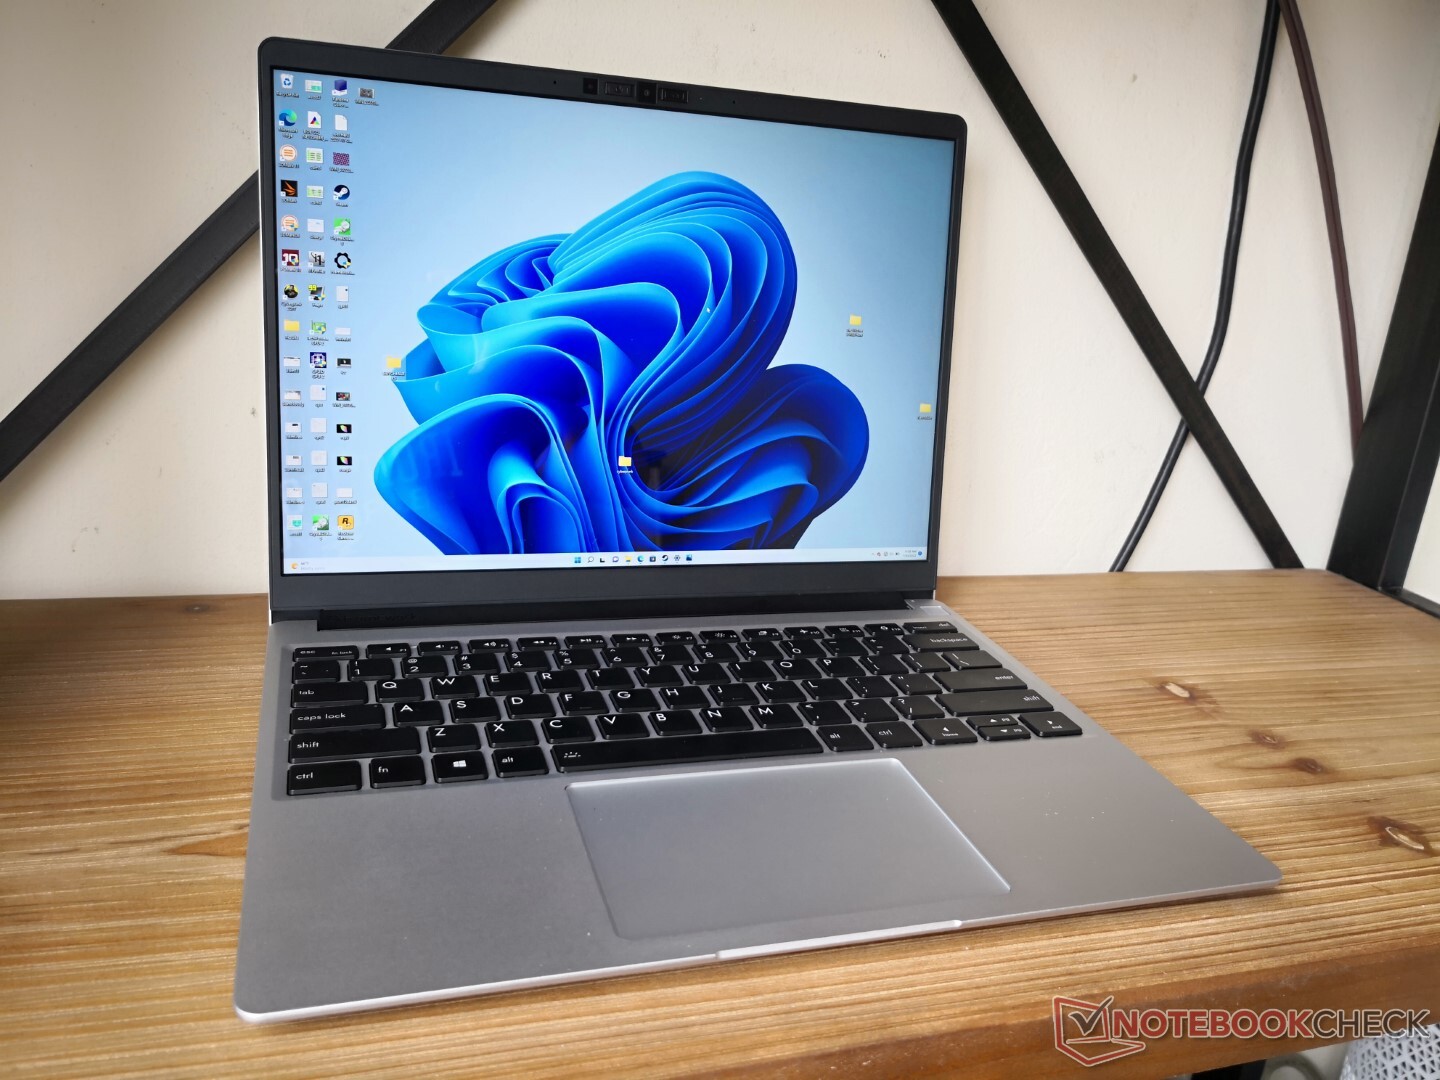
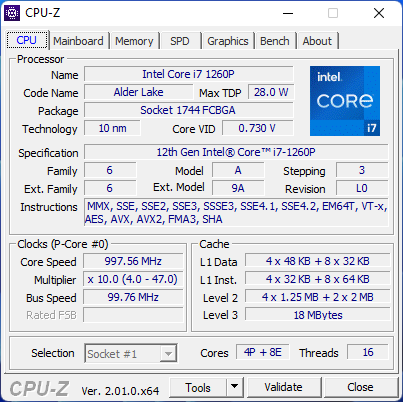
Comme le squelette n'a pas changé, nous vous recommandons de consulter notre revue existante sur le modèle 2021 pour plus d'informations sur les attributs physiques du modèle 2022. Tout, de l'écran au clavier en passant par la plupart des matériaux, est de retour sans changement majeur. Notre unité d'examen particulière est livrée avec le Core i7-1260P pour environ 1450 USD, mais les utilisateurs peuvent configurer avec le moins i5-1240P ou le plus élevé i7-1280P si désiré. Tous les modèles sont équipés de la même dalle IPS de 2256 x 1504 pixels.
Les alternatives au Framework Laptop incluent d'autres Ultrabooks de 13 pouces comme le HP Spectre x360 14, Lenovo ThinkPad X1, Asus Zenbook S13, et bien sûr le Microsoft Surface Laptop 4 13.
Comparaison avec les concurrents potentiels
Note | Date | Modèle | Poids | Épaisseur | Taille | Résolution | Prix |
|---|---|---|---|---|---|---|---|
| 85.1 % v7 (old) | 07/22 | Framework Laptop 13.5 12th Gen Intel i7-1260P, Iris Xe G7 96EUs | 1.3 kg | 15.85 mm | 13.50" | 2256x1504 | |
| 85.4 % v7 (old) | 07/21 | Framework Laptop 13.5 i7-1165G7, Iris Xe G7 96EUs | 1.3 kg | 15.85 mm | 13.50" | 2256x1504 | |
| 88.5 % v7 (old) | Lenovo ThinkPad X1 Titanium Yoga G1 20QB0016GE i5-1140G7, Iris Xe G7 80EUs | 1.2 kg | 11.5 mm | 13.50" | 2256x1504 | ||
| 84 % v7 (old) | 08/21 | HP EliteBook Folio 13.5-3G2L2EA SD 8cx Gen 2 5G, Adreno 680 | 1.3 kg | 16 mm | 13.50" | 1920x1280 | |
| 85.2 % v7 (old) | 05/21 | Microsoft Surface Laptop 4 13 Ryzen 5 R5 4680U, Vega 7 | 1.3 kg | 14 mm | 13.50" | 2256x1504 | |
| 89.5 % v7 (old) | 05/21 | HP Spectre x360 14-ea0378ng i7-1165G7, Iris Xe G7 96EUs | 1.3 kg | 16.9 mm | 13.50" | 3000x2000 |
Cas
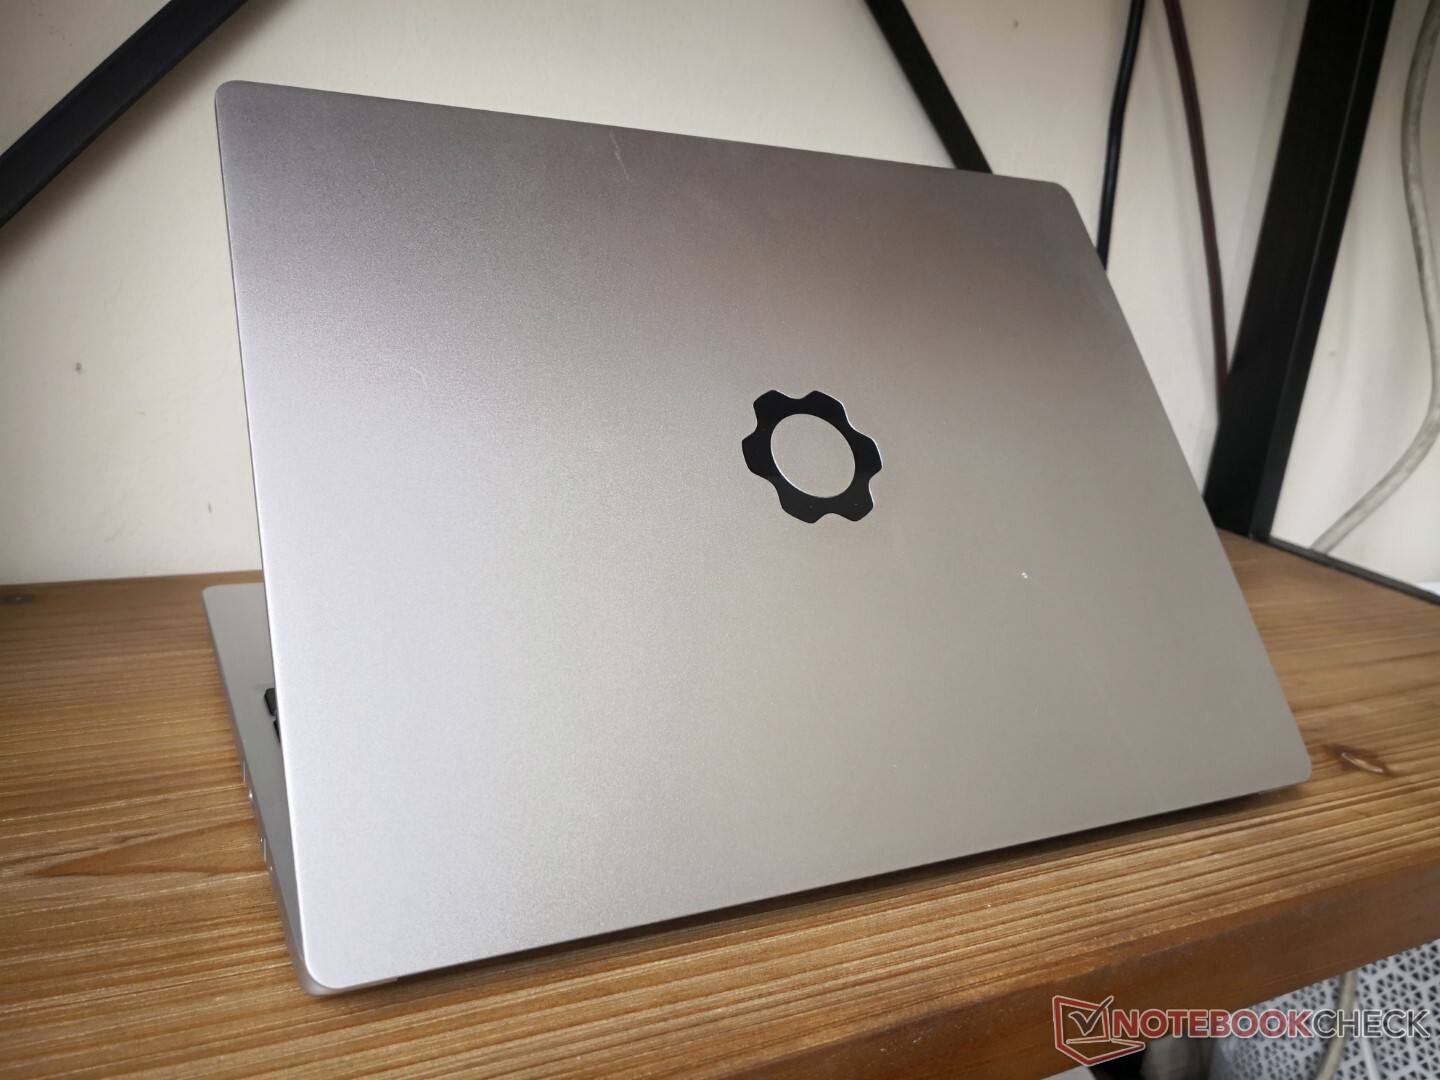
La seule modification apportée au châssis consiste à passer à la fabrication et à l'assemblage CNC pour le couvercle supérieur afin d'améliorer la rigidité du couvercle sans modifier les dimensions globales. Nous avons trouvé que le couvercle était fragile sur la version 2021 et donc le nouveau design est un changement bienvenu. Malgré cela, les couvercles sur la plupart des alternatives concurrentes comme le XPS 13, le Spectre x360 14, le Zenbook S13, Razer Blade Stealthou Série MateBook X continuent d'être beaucoup plus solides et plus rigides. La conception du Framework manque visiblement d'options Gorilla Glass qui auraient renforcé et rigidifié le couvercle.
Lecteur de carte SD
| SD Card Reader | |
| average JPG Copy Test (av. of 3 runs) | |
| HP Spectre x360 14-ea0378ng (Toshiba Exceria Pro M501 microSDXC 64GB) | |
| Framework Laptop 13.5 (AV Pro UHS-II V60) | |
| Framework Laptop 13.5 12th Gen Intel (AV Pro UHS-II V60) | |
| maximum AS SSD Seq Read Test (1GB) | |
| HP Spectre x360 14-ea0378ng (Toshiba Exceria Pro M501 microSDXC 64GB) | |
| Framework Laptop 13.5 (AV Pro UHS-II V60) | |
| Framework Laptop 13.5 12th Gen Intel (AV Pro UHS-II V60) | |
Communication
Bien que le module Intel AX210 n'ait pas changé par rapport au modèle de l'année dernière, nous avons depuis mis à niveau nos routeurs de test pour qu'ils prennent en charge la connectivité à 6 GHz et donc des taux de transfert moyens plus rapides peuvent être enregistrés comme indiqué ci-dessous.
Il n'y a toujours pas d'options 4G ou WAN disponibles.
| Networking | |
| iperf3 transmit AX12 | |
| Microsoft Surface Laptop 4 13 Ryzen 5 | |
| Framework Laptop 13.5 | |
| HP Spectre x360 14-ea0378ng | |
| HP EliteBook Folio 13.5-3G2L2EA | |
| iperf3 receive AX12 | |
| Microsoft Surface Laptop 4 13 Ryzen 5 | |
| Framework Laptop 13.5 | |
| HP Spectre x360 14-ea0378ng | |
| HP EliteBook Folio 13.5-3G2L2EA | |
| iperf3 receive AXE11000 6GHz | |
| Framework Laptop 13.5 12th Gen Intel | |
| iperf3 transmit AXE11000 6GHz | |
| Framework Laptop 13.5 12th Gen Intel | |
Webcam


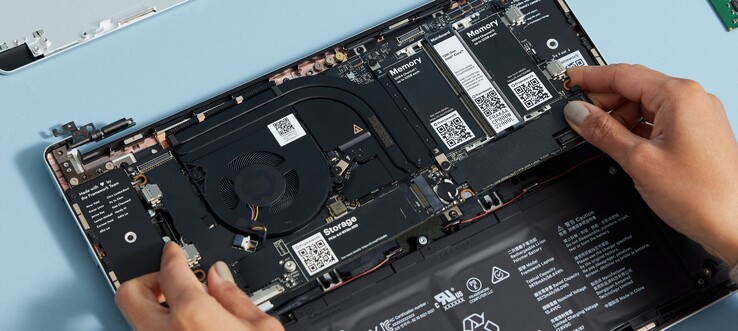
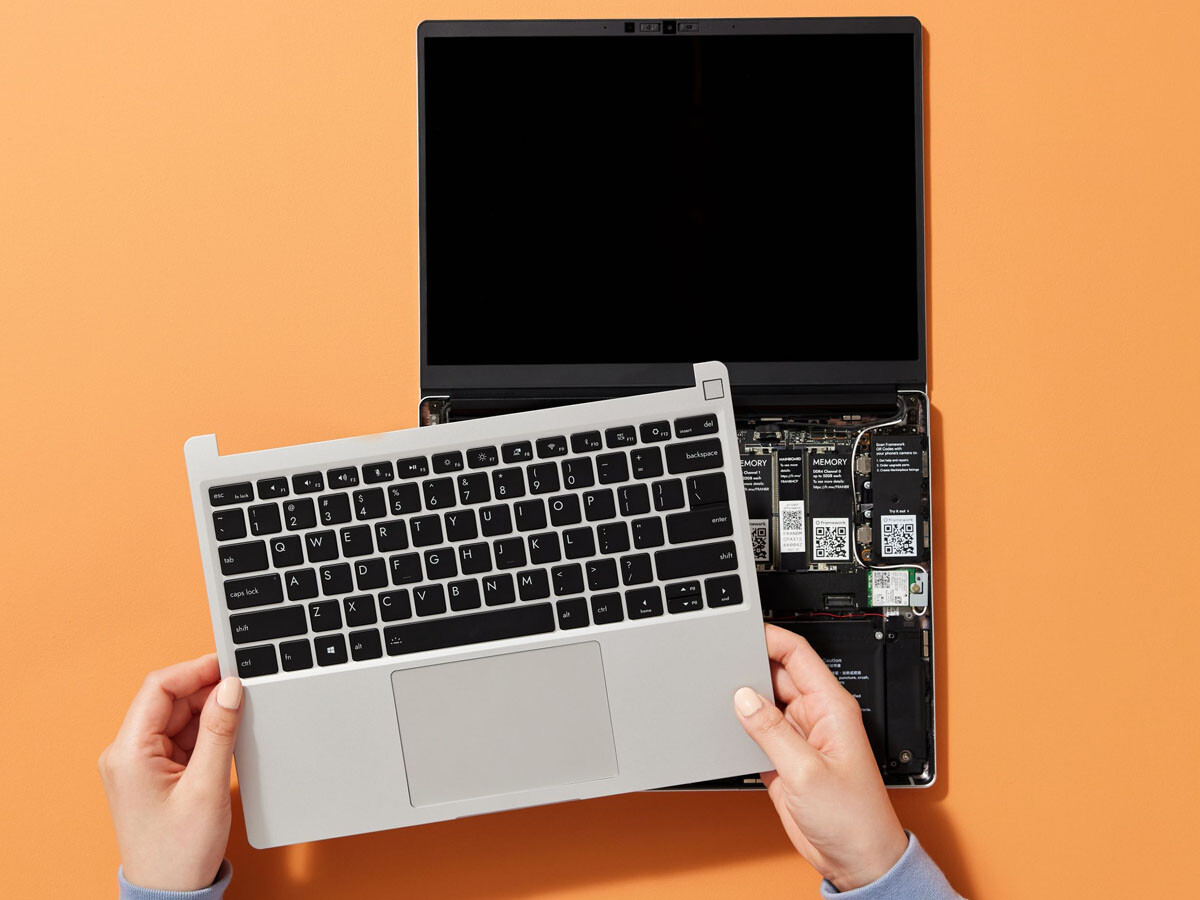
Maintenance
L'appareil est l'un des modèles d'ordinateur portable les plus faciles à entretenir, comme on peut s'y attendre. Framework vend également des cartes mères et des kits de bricolage pour les utilisateurs qui souhaitent assembler l'ordinateur portable eux-mêmes.
Accessoires
Les cartes d'extension uniques basées sur l'USB-C sont toutes de retour cette année, en plus d'une nouvelle carte d'extension Ethernet prenant en charge des vitesses allant jusqu'à 2,5 Gbit. Toutes sont optionnelles et configurables lors du passage en caisse. Le fabricant continuera à développer différentes cartes d'extension en fonction de la demande des utilisateurs.
Chaque boîte de détail comprend une clé Torx pour l'entretien de l'unité.
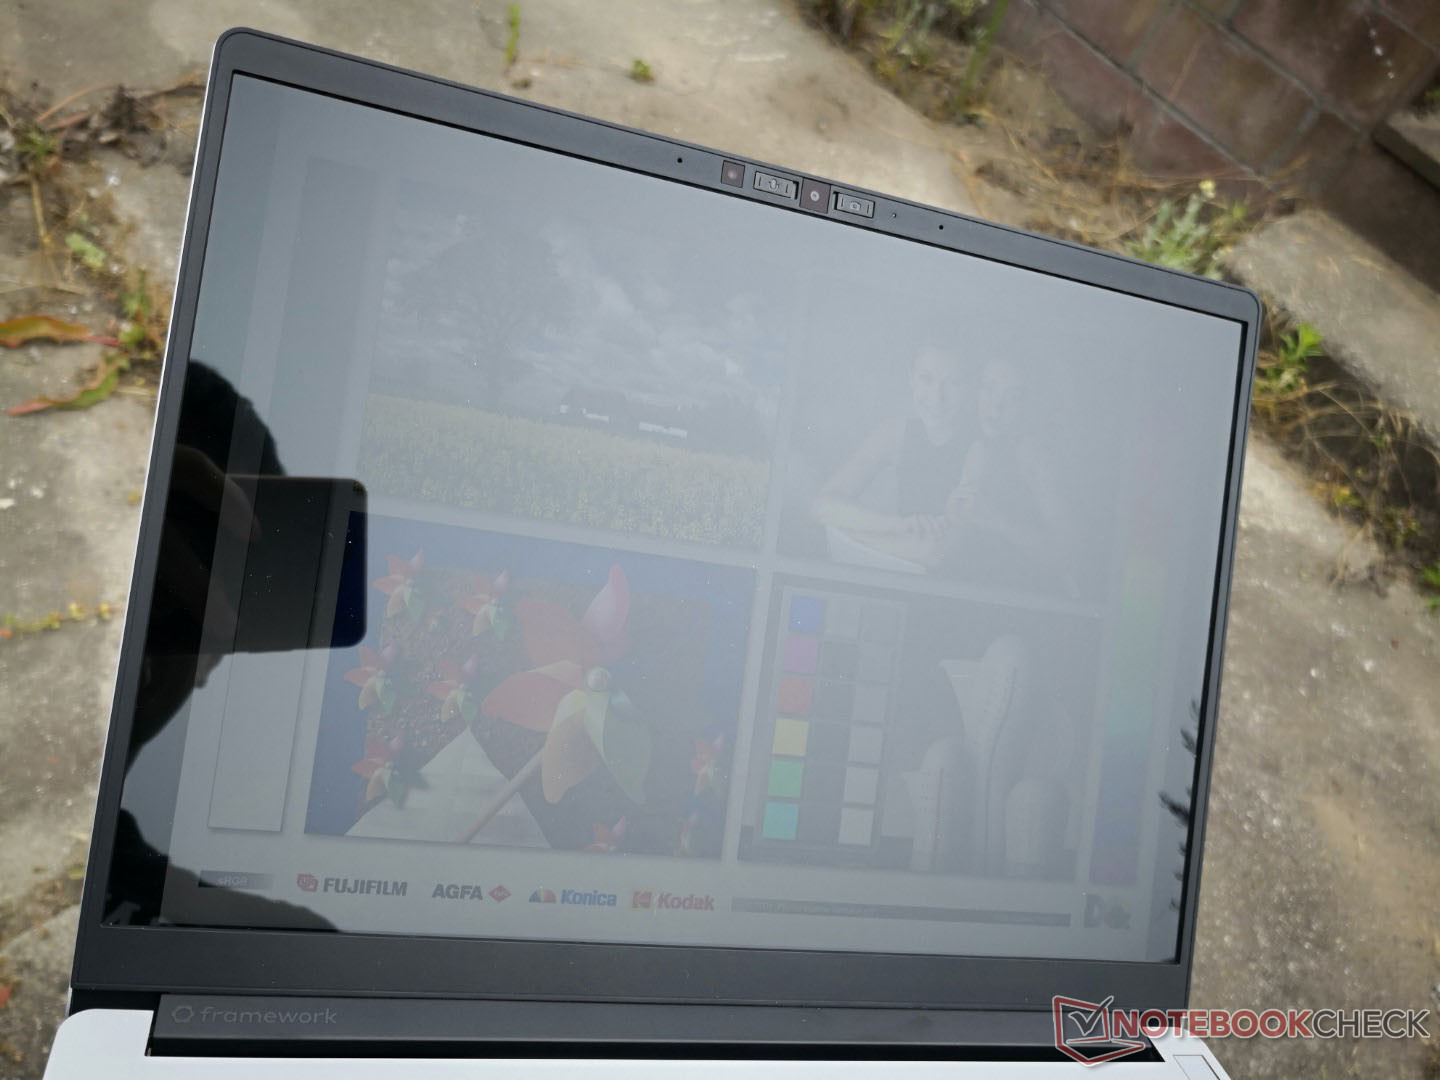
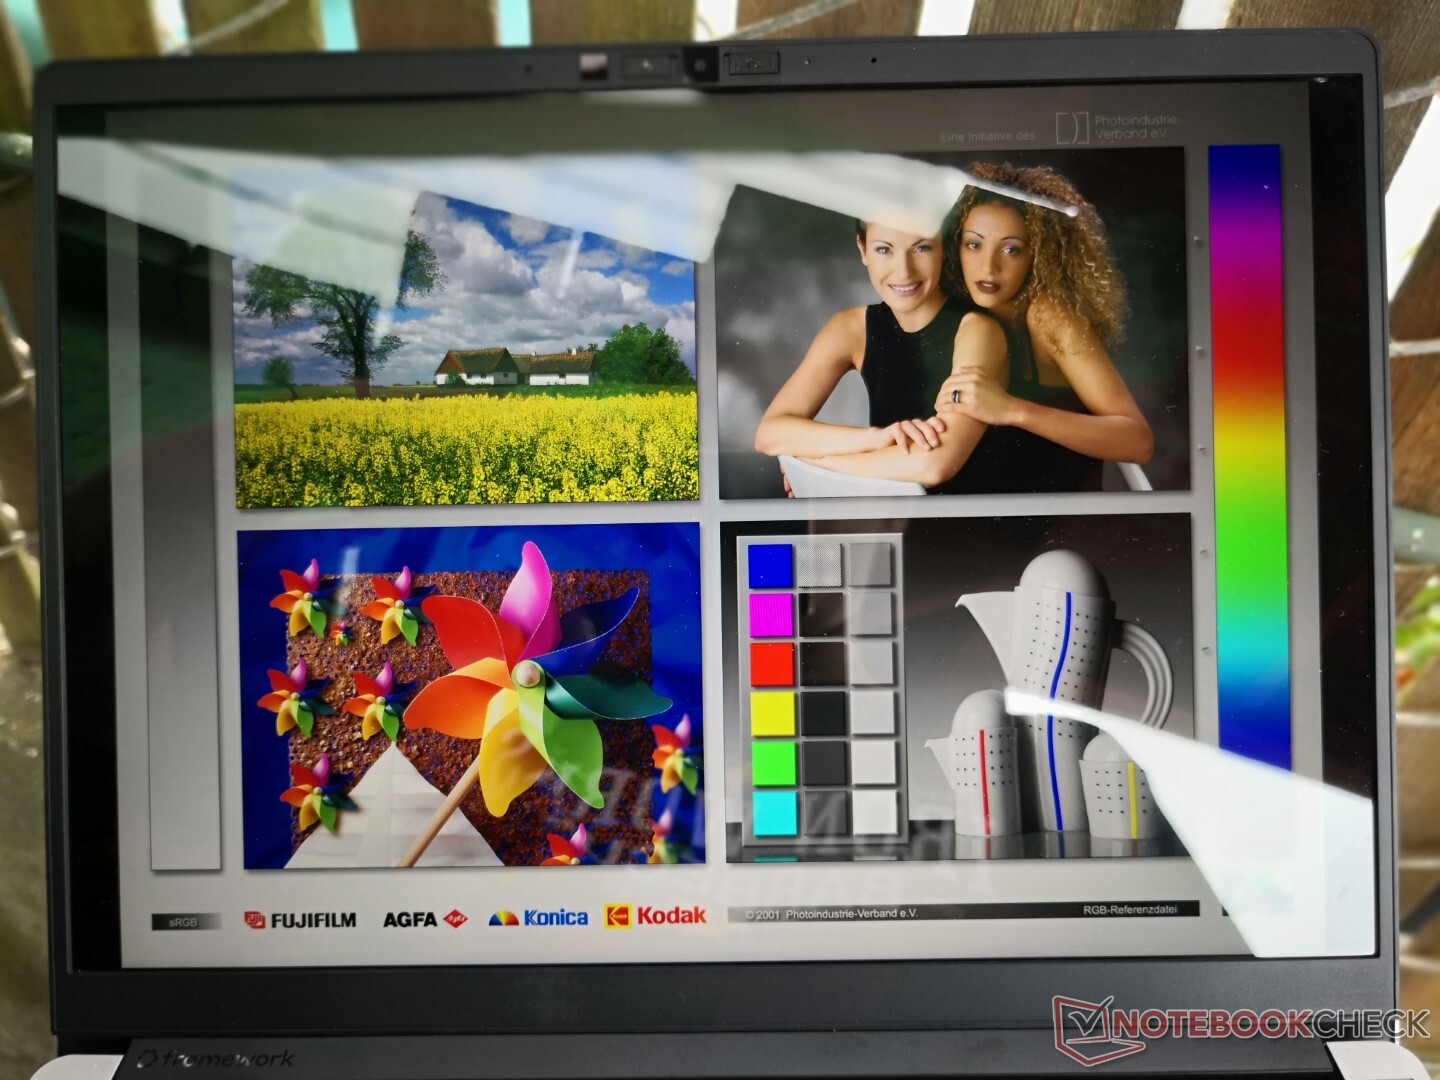
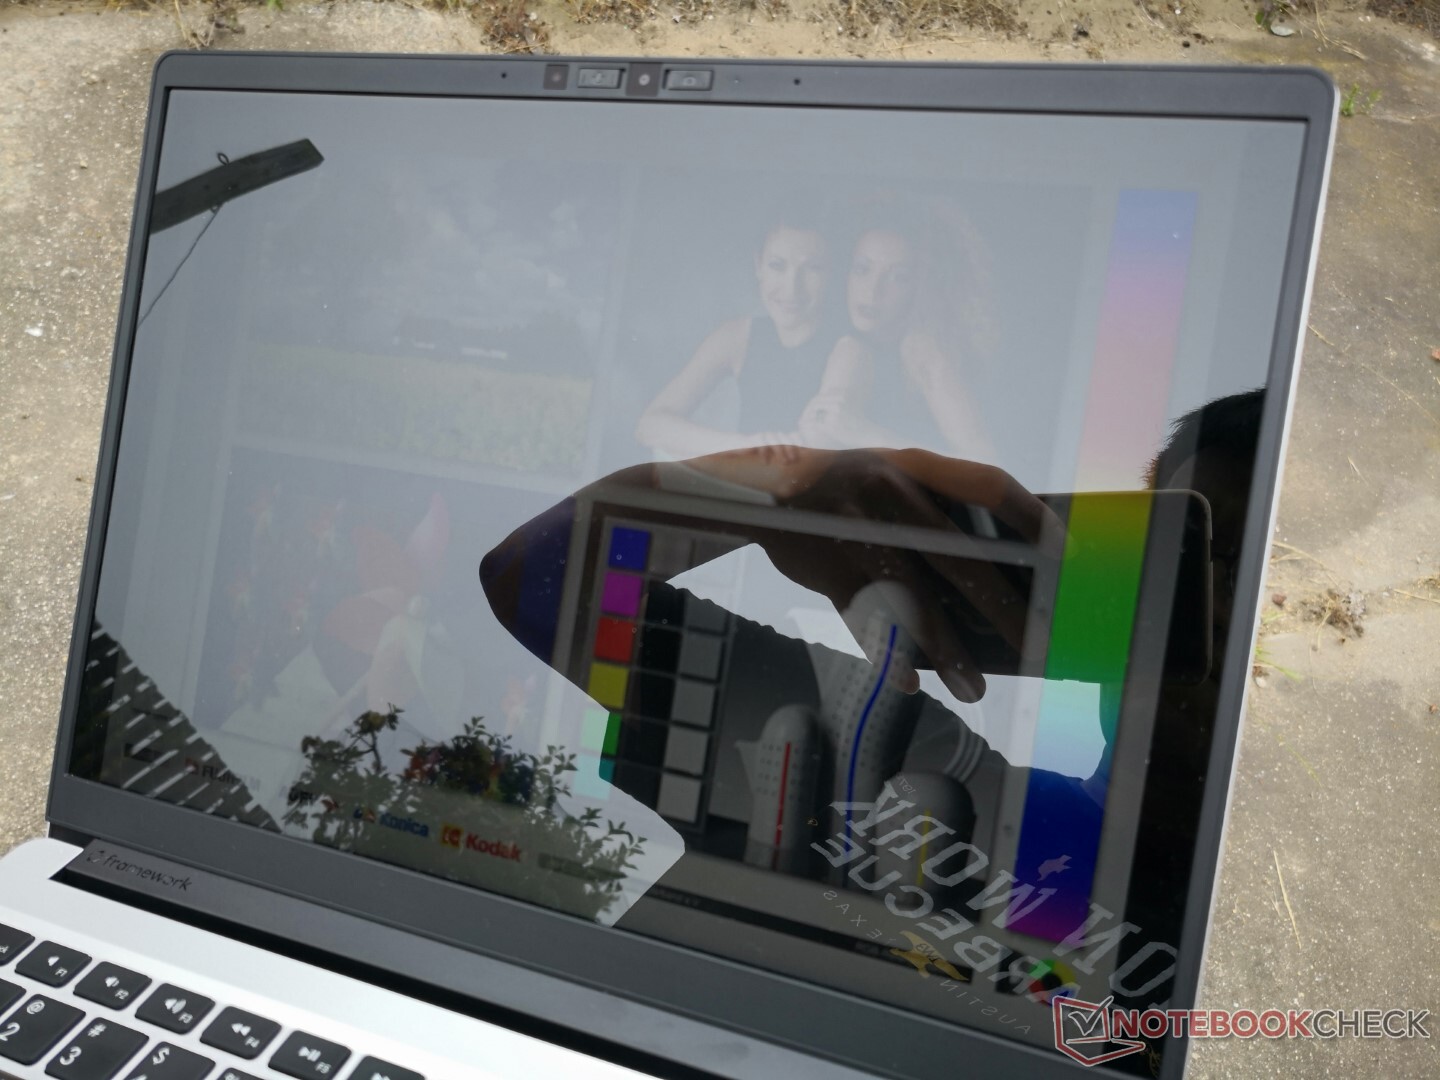
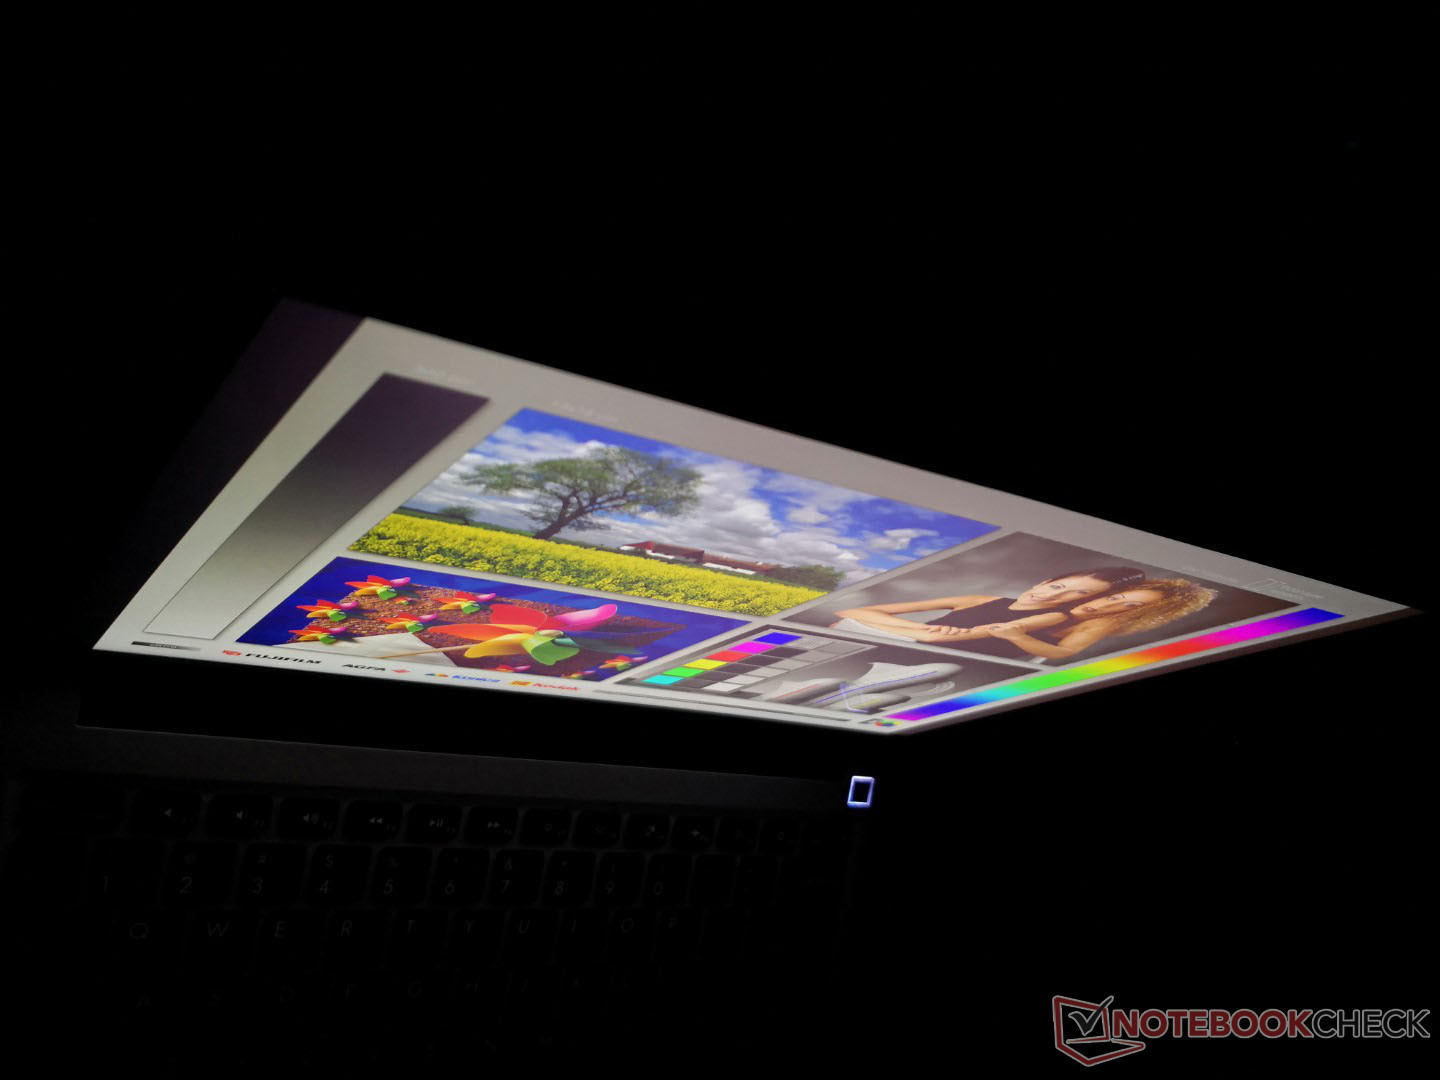
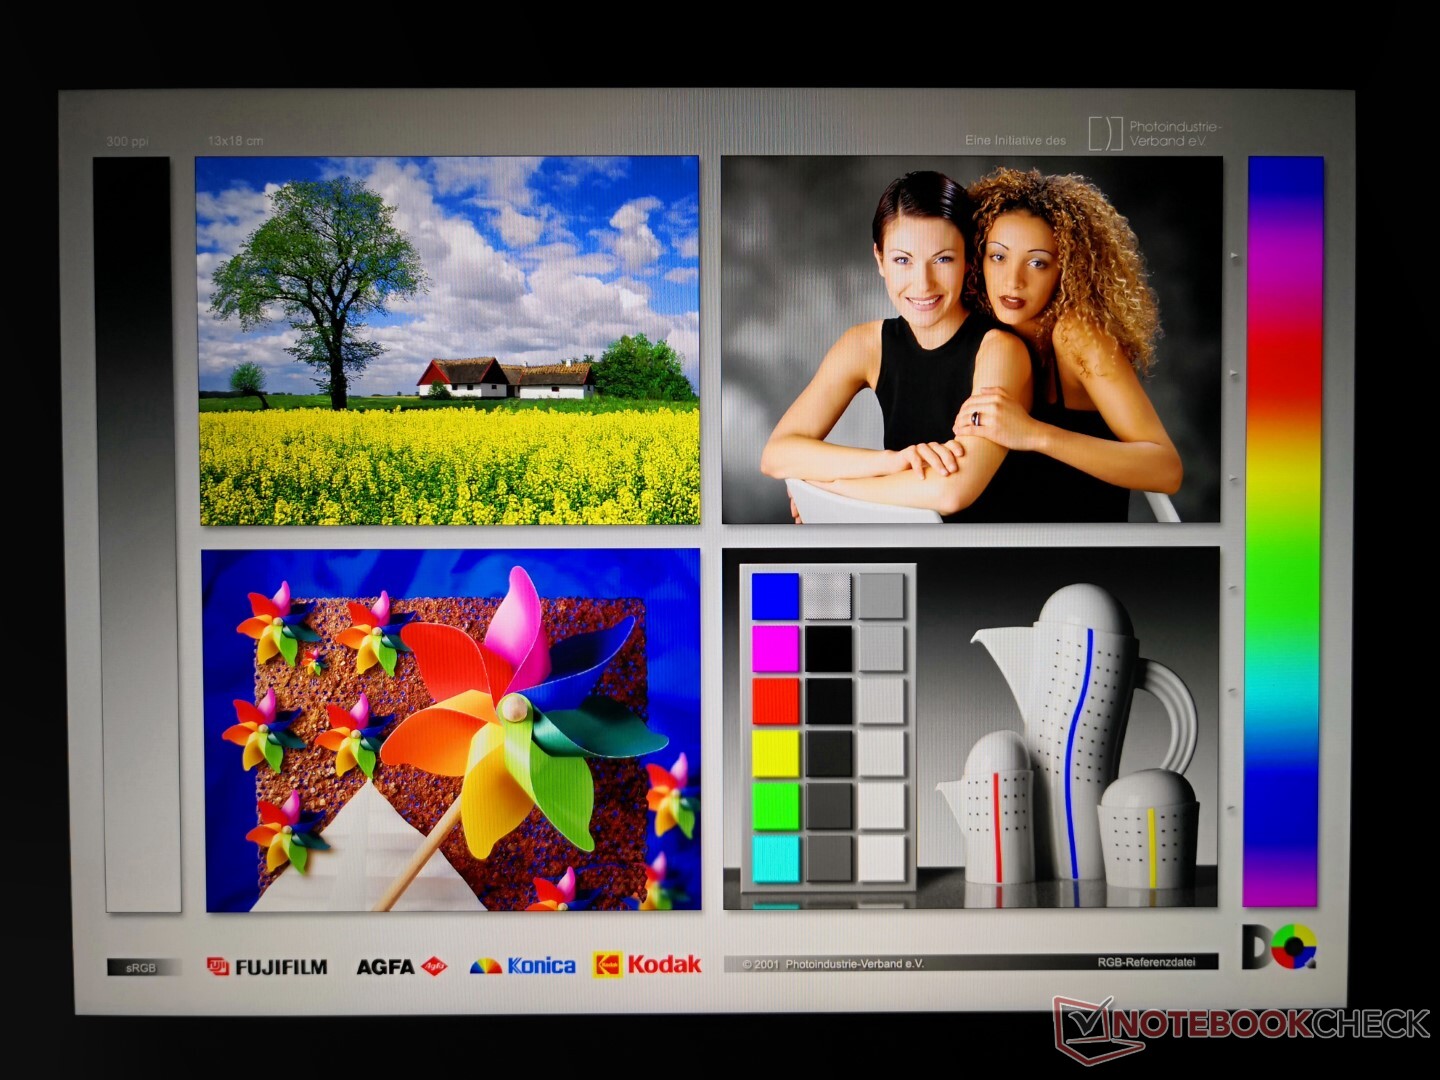
Afficher
| |||||||||||||||||||||||||
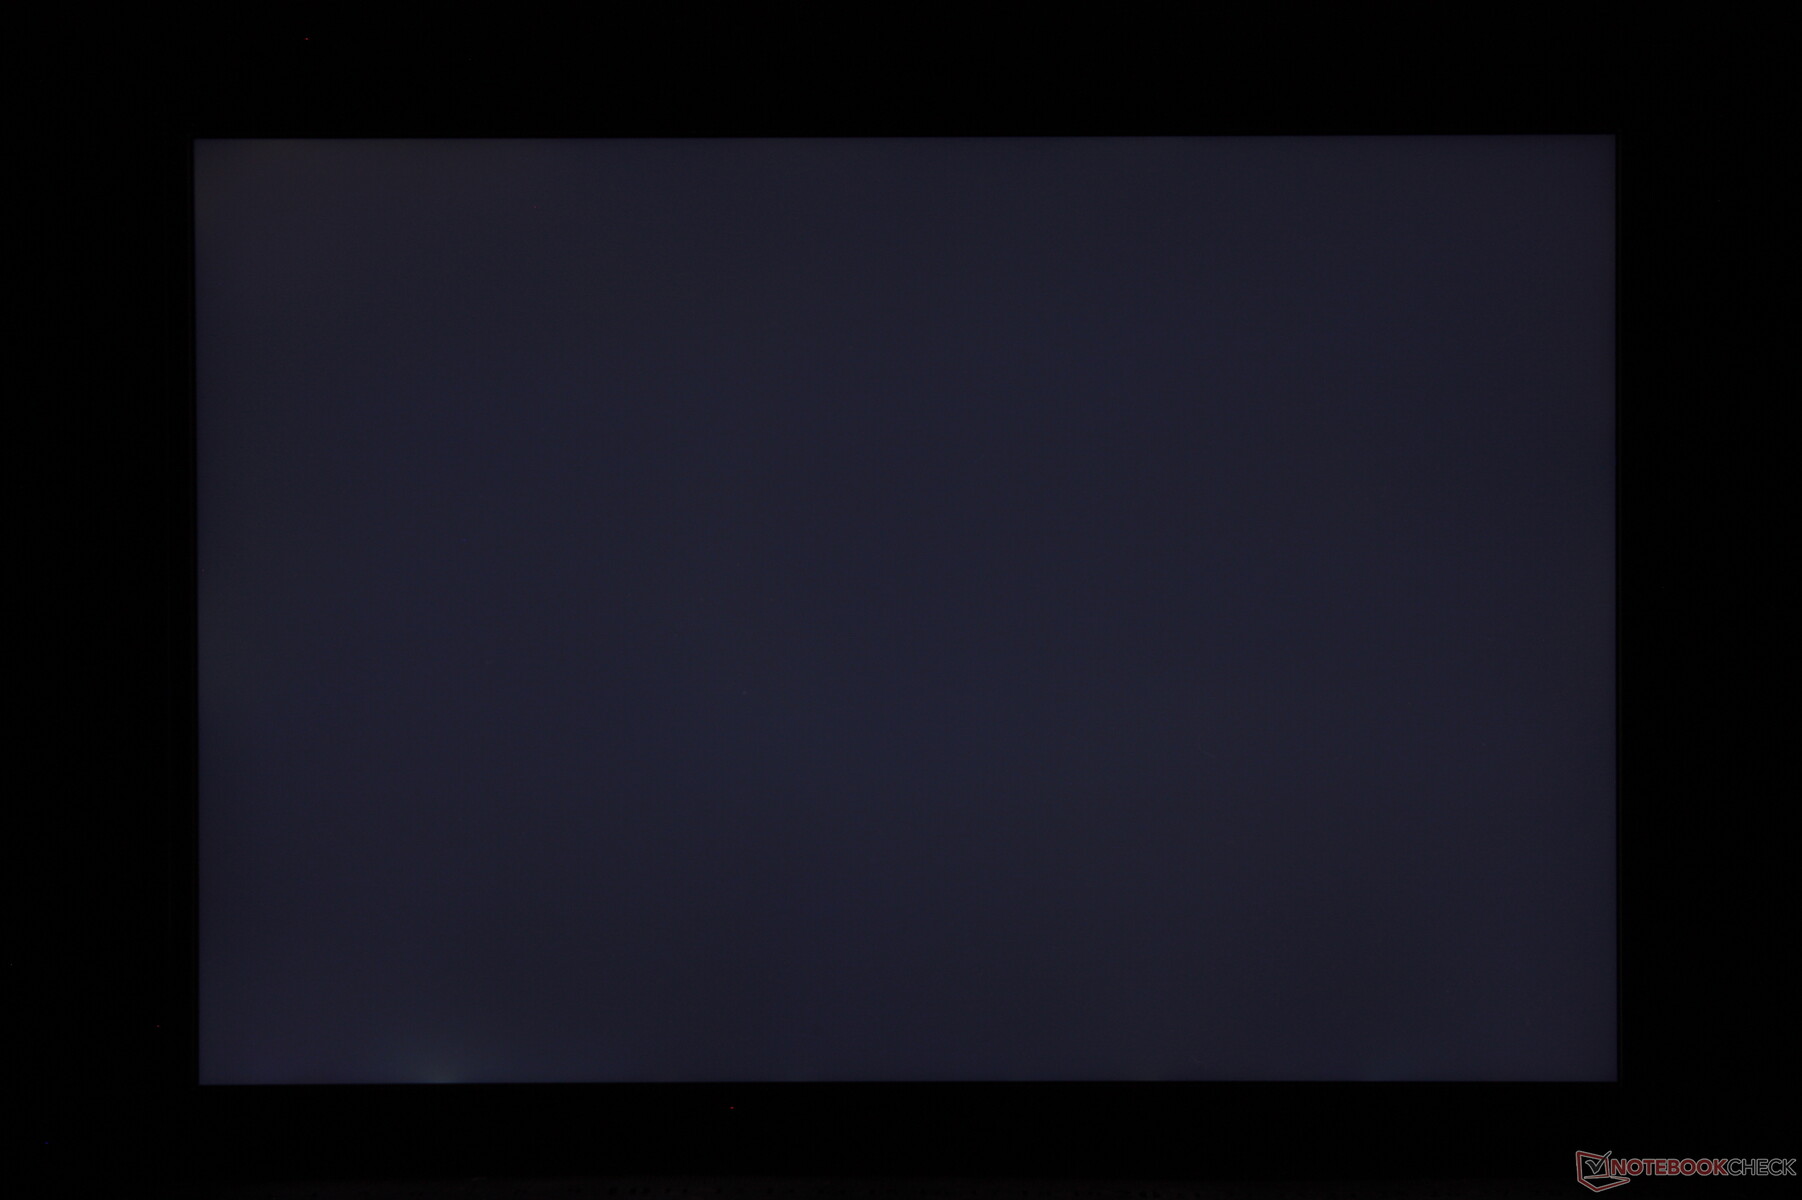
Homogénéité de la luminosité: 90 %
Valeur mesurée au centre, sur batterie: 449.6 cd/m²
Contraste: 1450:1 (Valeurs des noirs: 0.31 cd/m²)
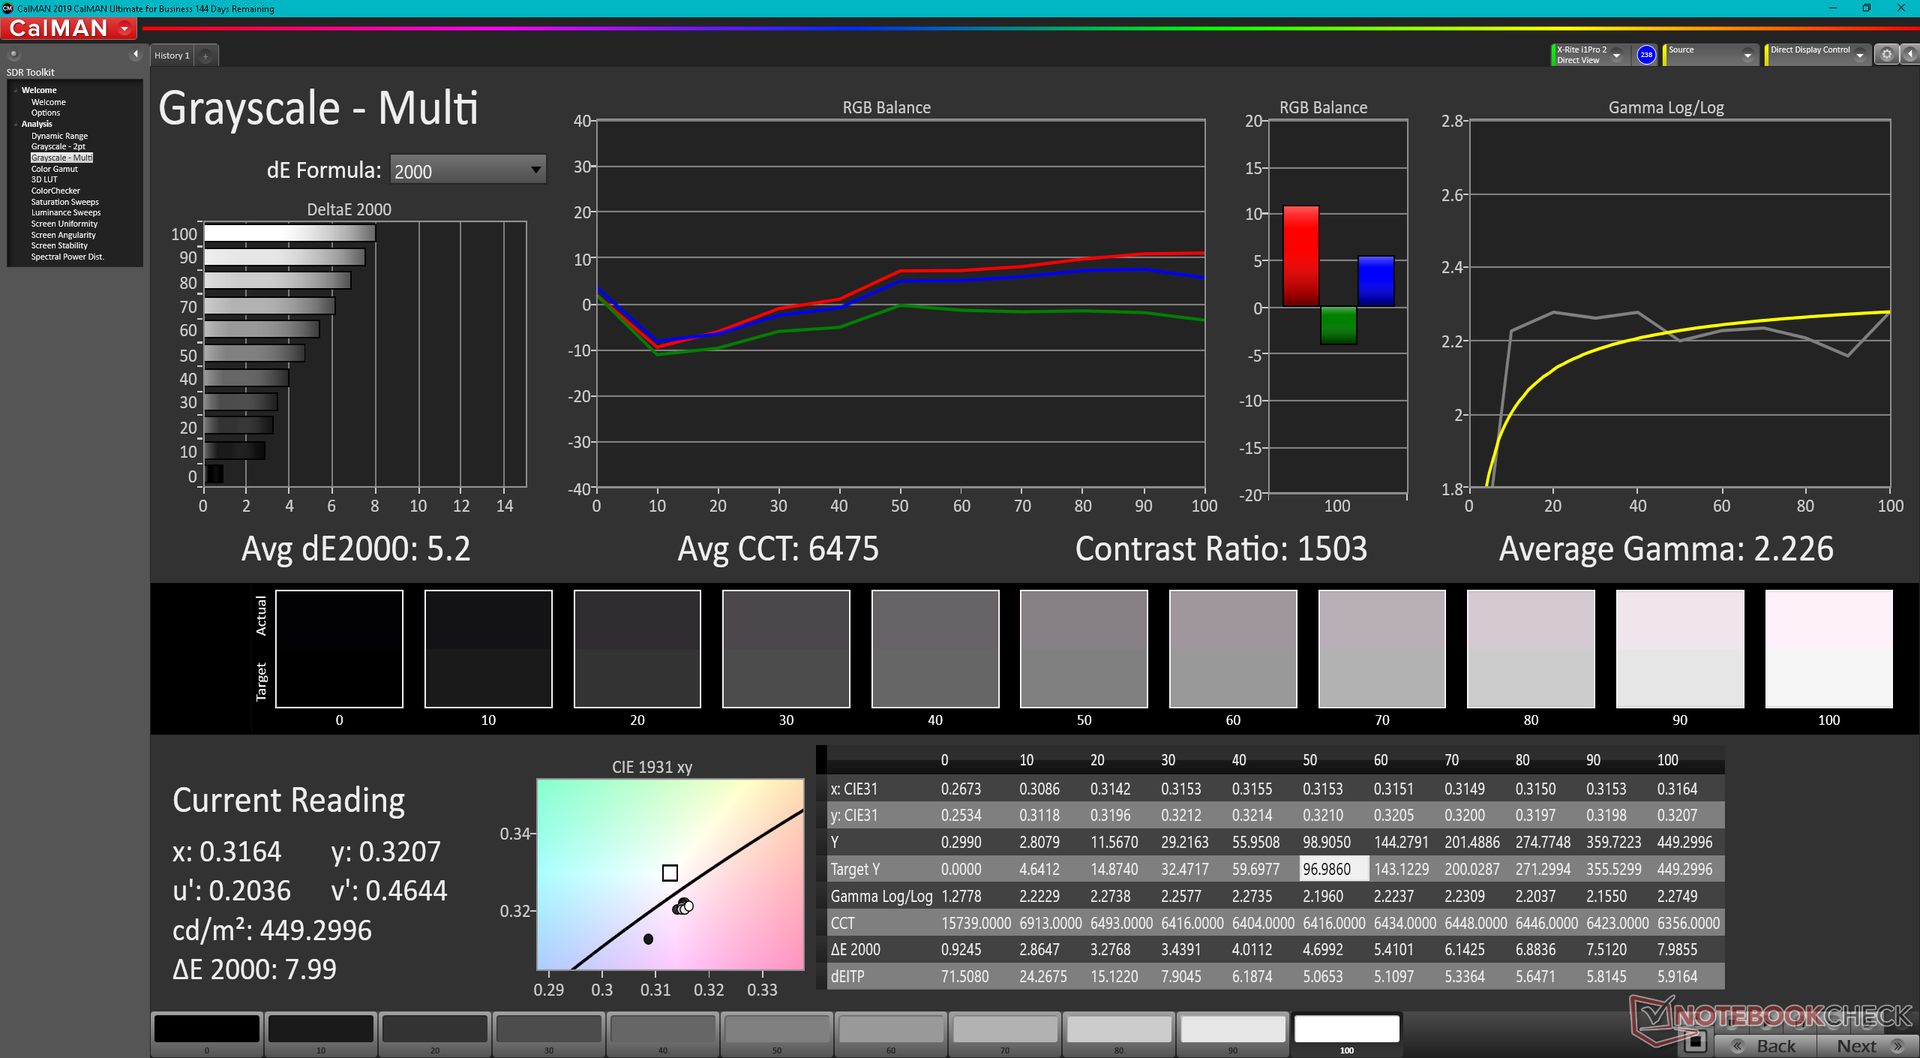
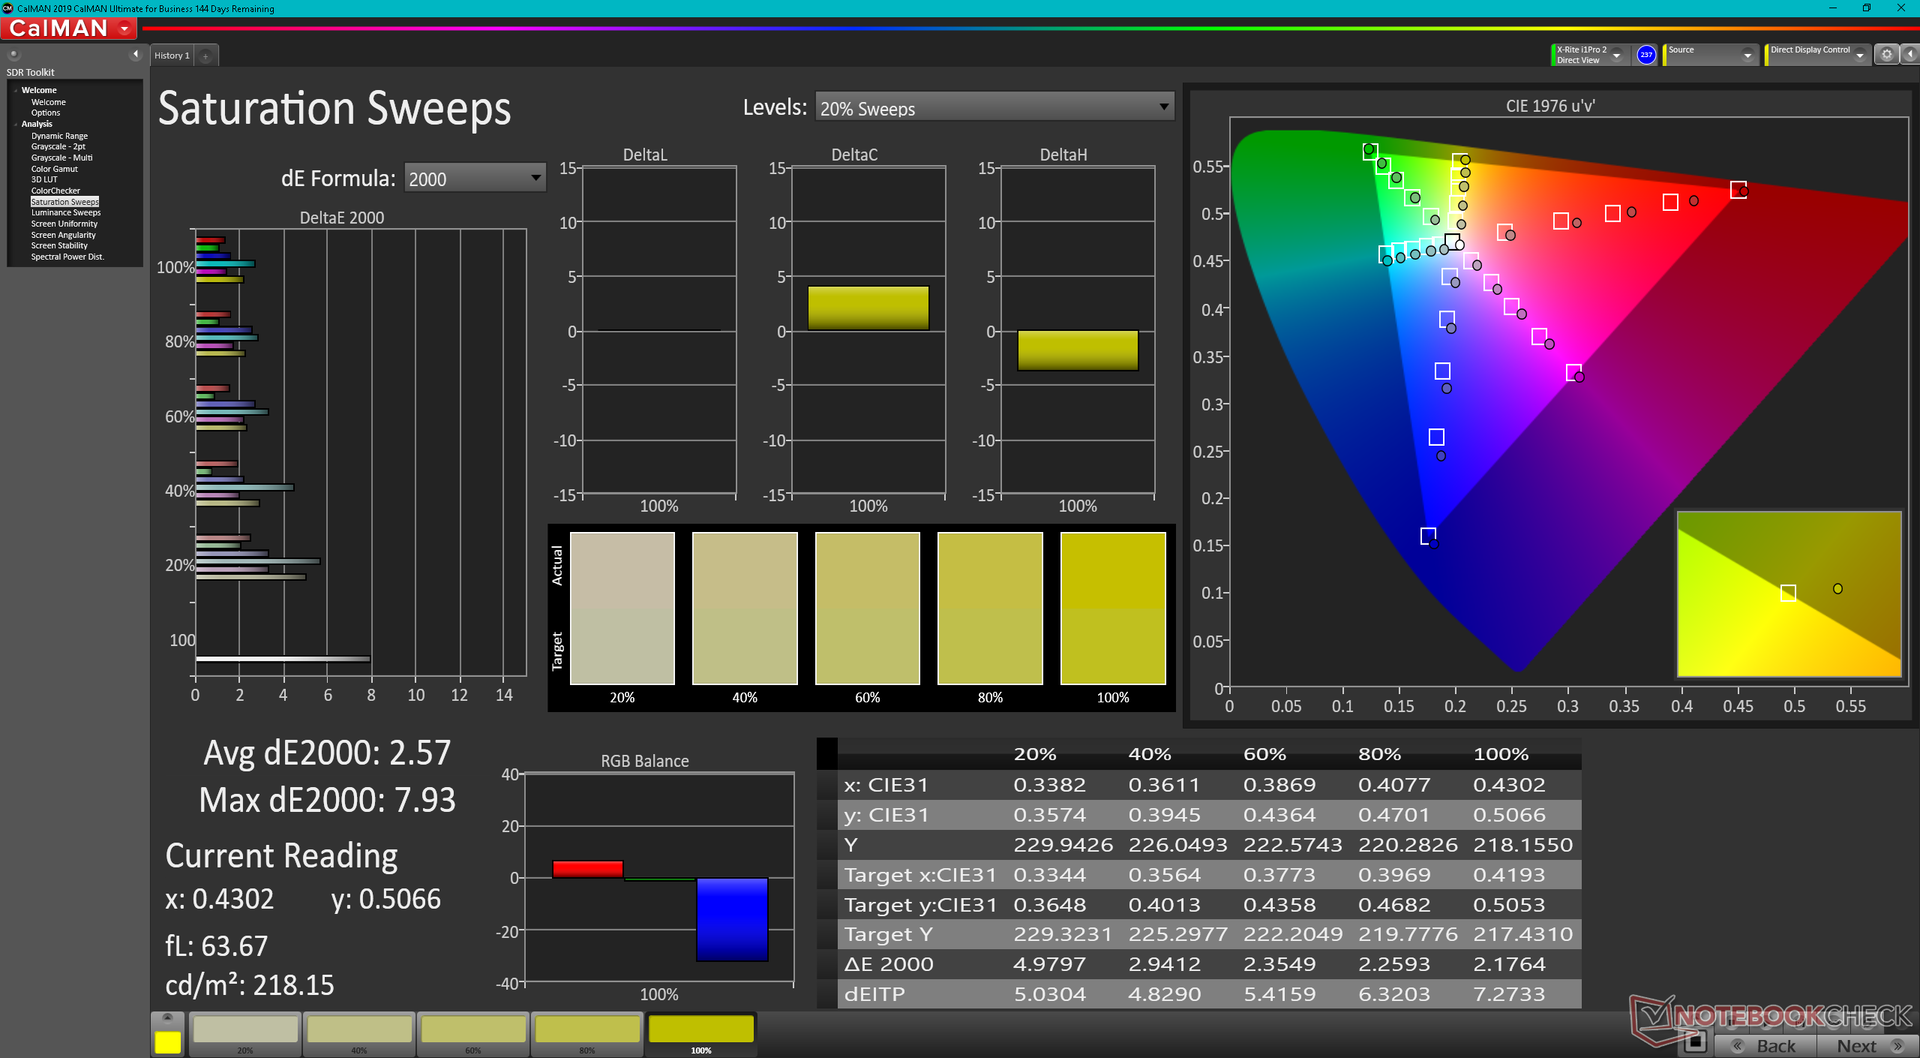
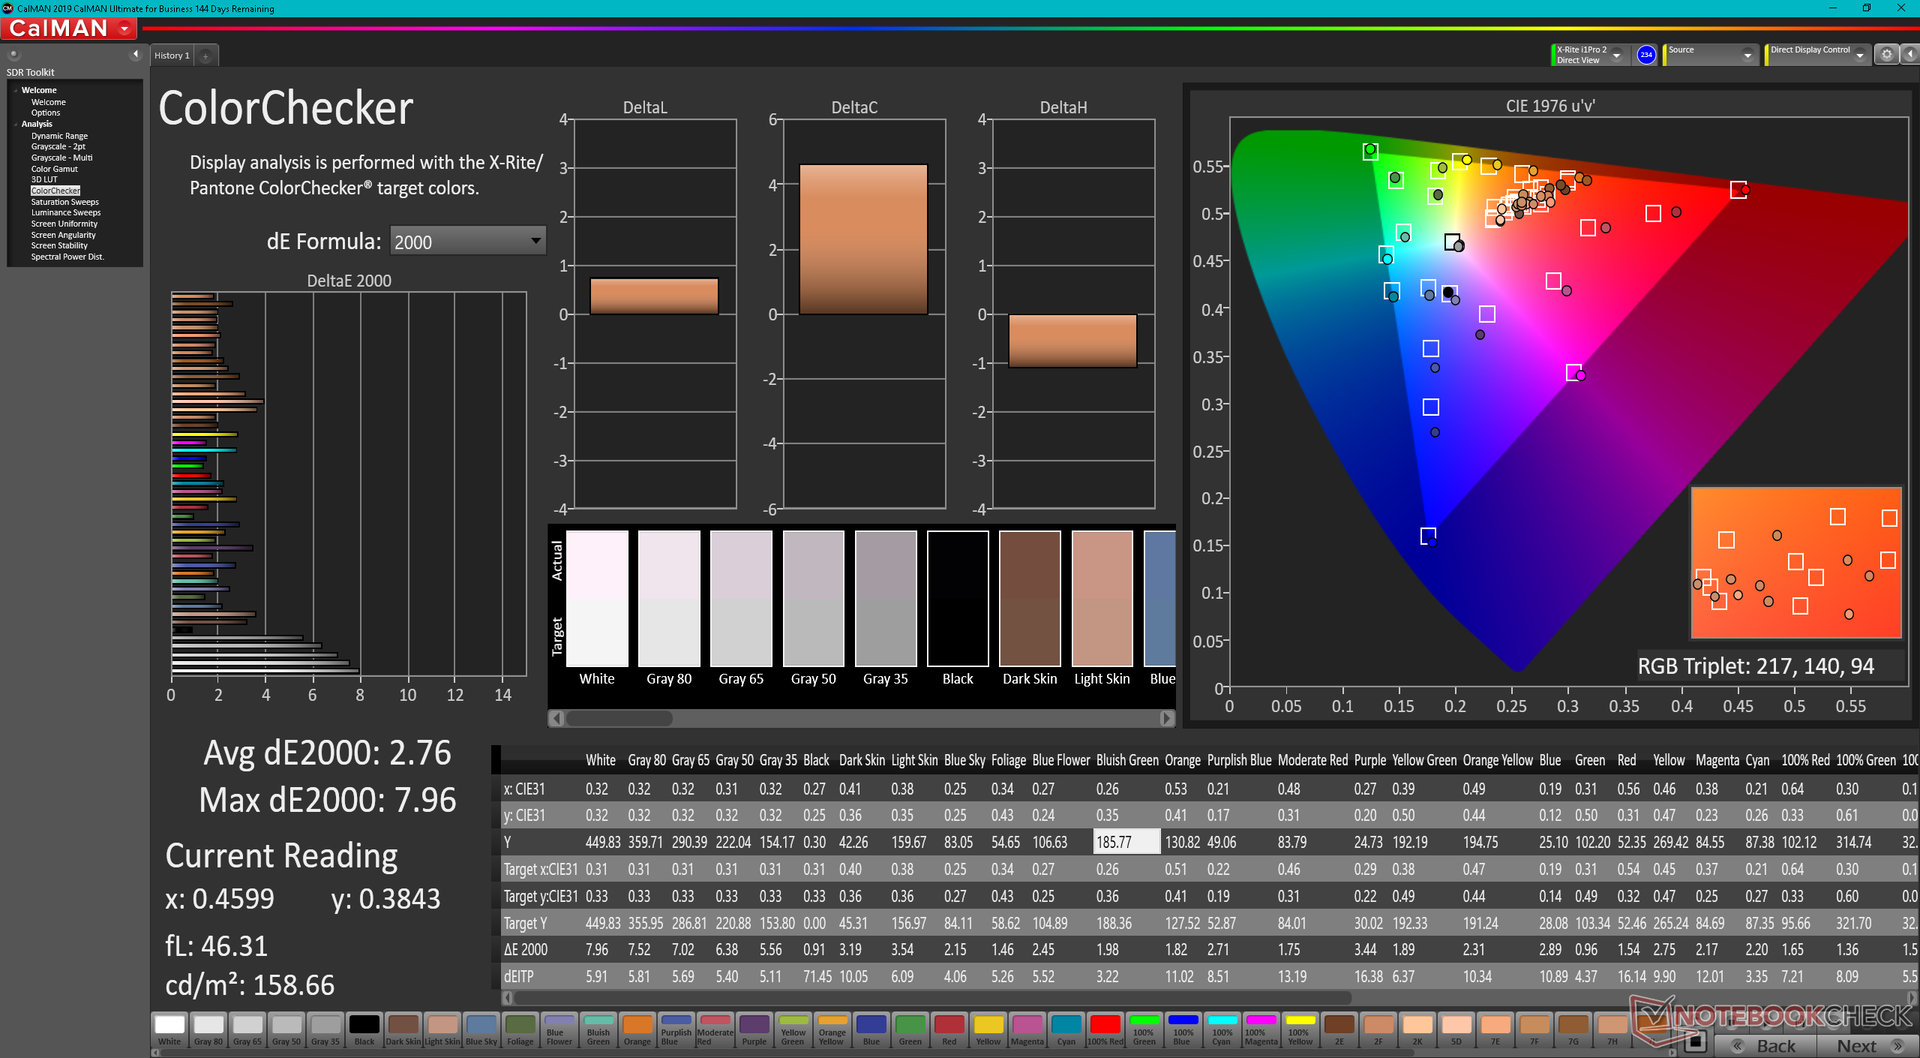
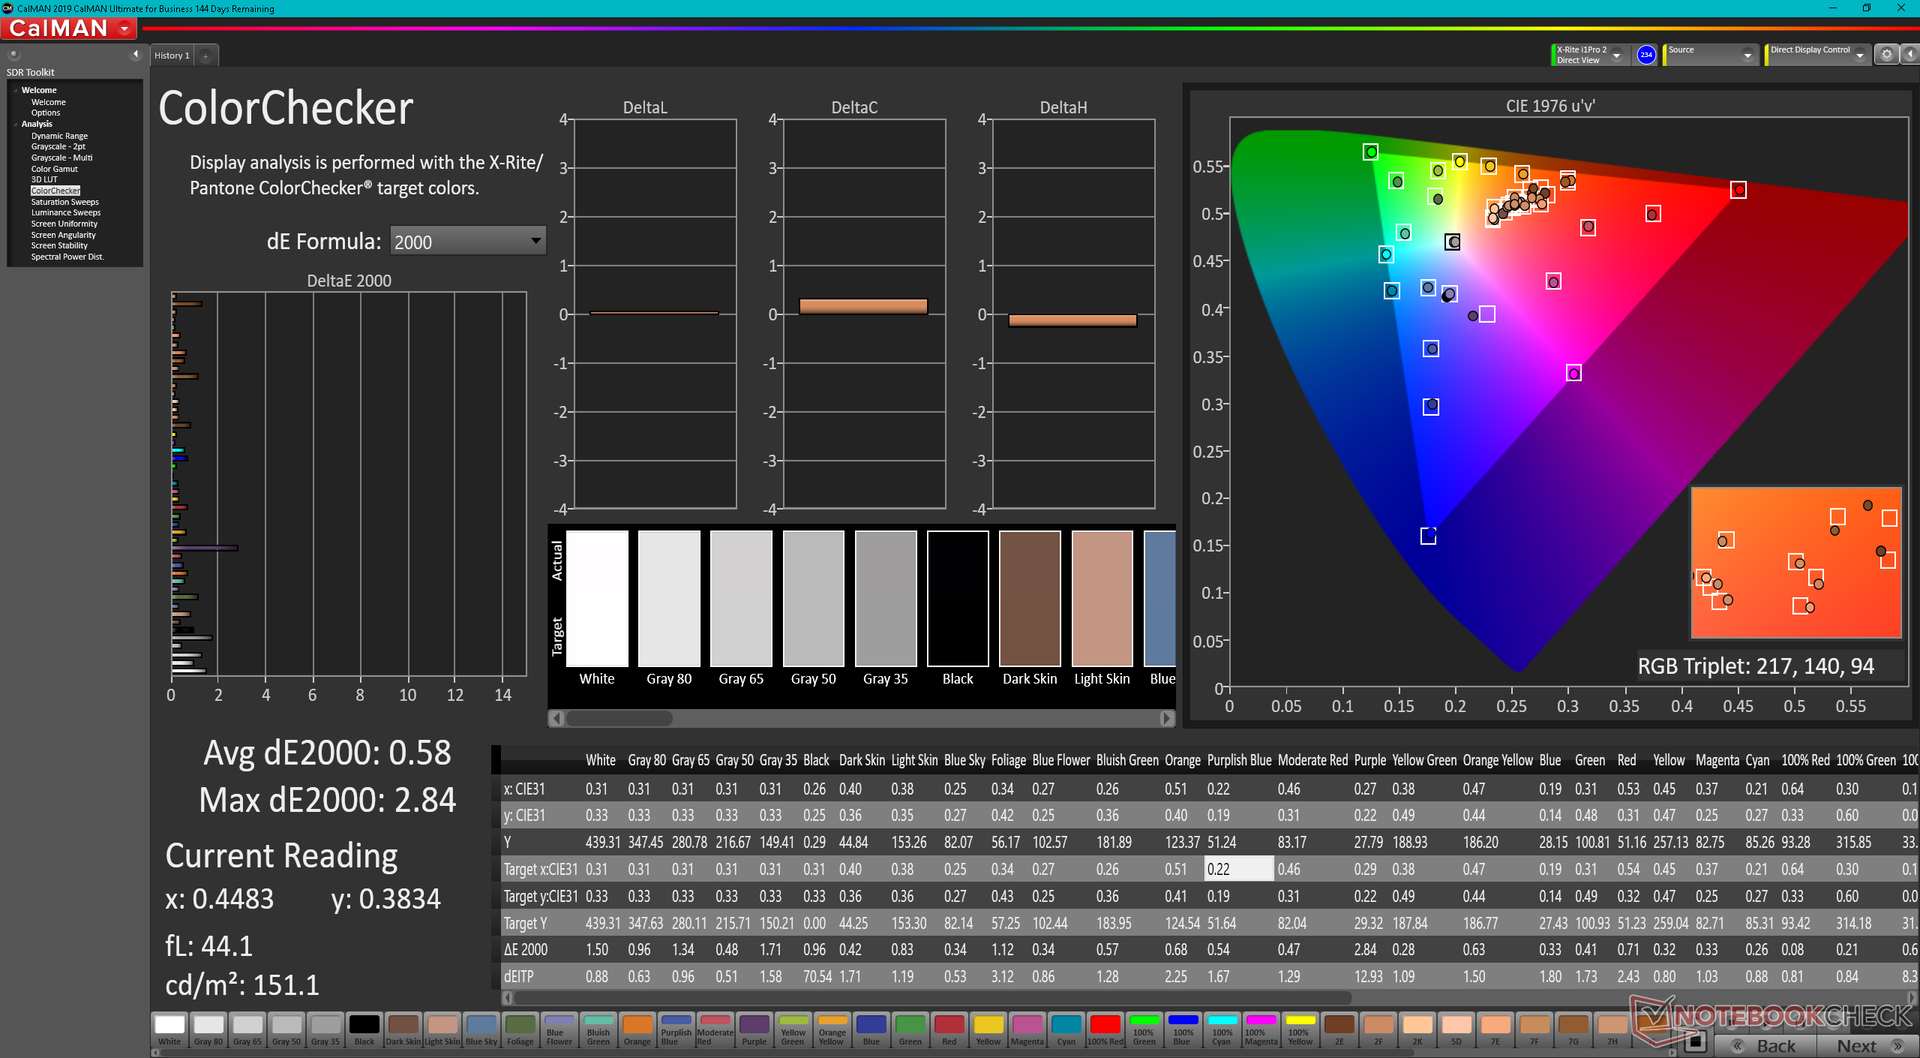
ΔE ColorChecker Calman: 2.76 | ∀{0.5-29.43 Ø4.71}
calibrated: 0.58
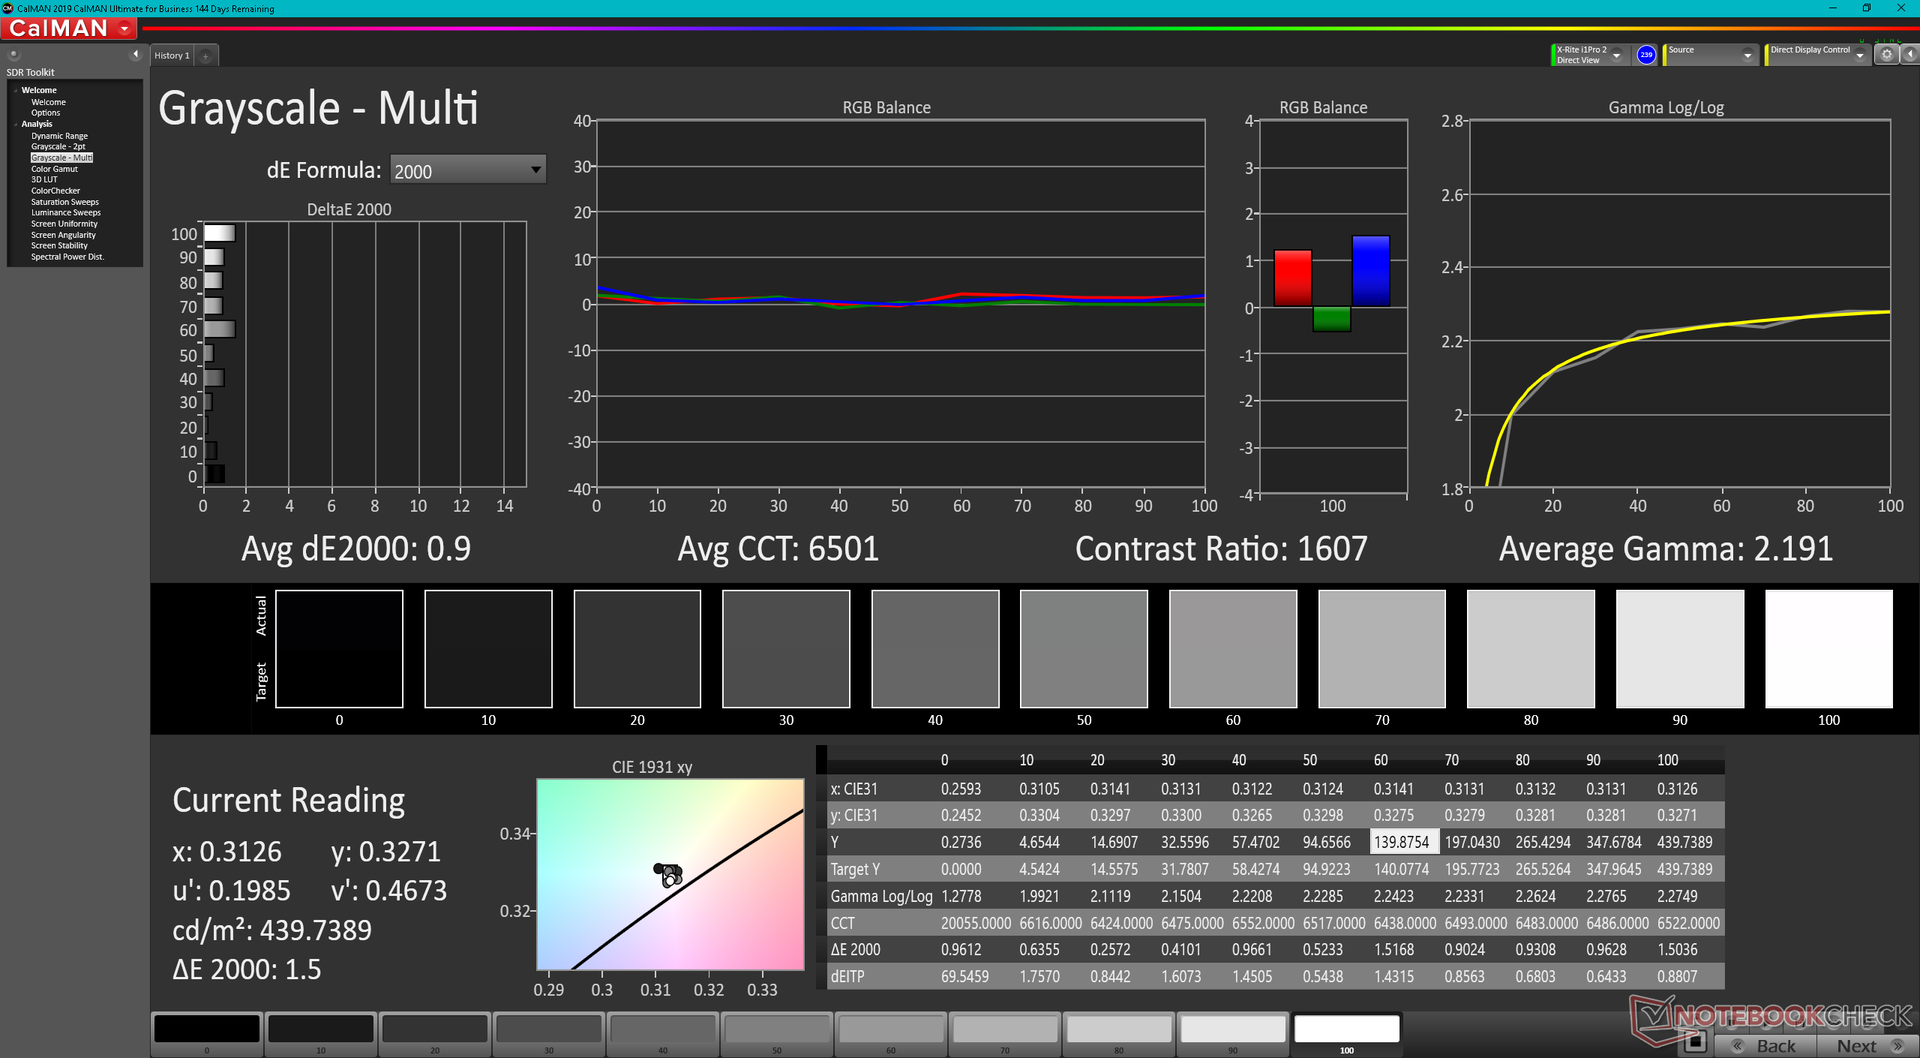
ΔE Greyscale Calman: 5.2 | ∀{0.09-98 Ø4.96}
71.1% AdobeRGB 1998 (Argyll 3D)
99.4% sRGB (Argyll 3D)
69.9% Display P3 (Argyll 3D)
Gamma: 2.23
CCT: 6475 K
| Framework Laptop 13.5 12th Gen Intel BOE CQ NE135FBM-N41, IPS, 2256x1504, 13.5" | Framework Laptop 13.5 BOE CQ NE135FBM-N41, IPS, 2256x1504, 13.5" | Lenovo ThinkPad X1 Titanium Yoga G1 20QB0016GE LPM135M467, IPS LED, 2256x1504, 13.5" | HP EliteBook Folio 13.5-3G2L2EA LGD0663, IPS, 1920x1280, 13.5" | HP Spectre x360 14-ea0378ng Samsung SDC4148, OLED, 3000x2000, 13.5" | Microsoft Surface Laptop 4 13 i7 LQ135P1JX51, IPS, 2256x1504, 13.5" | |
|---|---|---|---|---|---|---|
| Display | -1% | -3% | 26% | -5% | ||
| Display P3 Coverage (%) | 69.9 | 69 -1% | 66.8 -4% | 99.9 43% | 64.7 -7% | |
| sRGB Coverage (%) | 99.4 | 99.3 0% | 98 -1% | 100 1% | 97.2 -2% | |
| AdobeRGB 1998 Coverage (%) | 71.1 | 70.3 -1% | 68.6 -4% | 96.1 35% | 66.9 -6% | |
| Response Times | -46% | -72% | -13% | 94% | -63% | |
| Response Time Grey 50% / Grey 80% * (ms) | 34.7 ? | 55.6 ? -60% | 64 ? -84% | 44 ? -27% | 2 ? 94% | 62.8 ? -81% |
| Response Time Black / White * (ms) | 27.5 ? | 36 ? -31% | 44 ? -60% | 27 ? 2% | 2 ? 93% | 39.8 ? -45% |
| PWM Frequency (Hz) | 250 ? | 21930 ? | ||||
| Screen | -8% | 14% | -9% | 259% | 3% | |
| Brightness middle (cd/m²) | 449.6 | 449 0% | 465 3% | 250 -44% | 370 -18% | 413 -8% |
| Brightness (cd/m²) | 431 | 435 1% | 451 5% | 226 -48% | 374 -13% | 400 -7% |
| Brightness Distribution (%) | 90 | 93 3% | 92 2% | 82 -9% | 90 0% | 94 4% |
| Black Level * (cd/m²) | 0.31 | 0.39 -26% | 0.28 10% | 0.215 31% | 0.01 97% | 0.29 6% |
| Contrast (:1) | 1450 | 1151 -21% | 1661 15% | 1163 -20% | 37000 2452% | 1424 -2% |
| Colorchecker dE 2000 * | 2.76 | 2.34 15% | 2 28% | 3.59 -30% | 2.57 7% | 2.8 -1% |
| Colorchecker dE 2000 max. * | 7.96 | 7.07 11% | 4.7 41% | 5.9 26% | 4.52 43% | 7.2 10% |
| Colorchecker dE 2000 calibrated * | 0.58 | 0.96 -66% | 0.7 -21% | 2.31 -298% | 0.8 -38% | |
| Greyscale dE 2000 * | 5.2 | 4.7 10% | 2.9 44% | 3.99 23% | 2.2 58% | 1.9 63% |
| Gamma | 2.23 99% | 2.29 96% | 2.09 105% | 2.98 74% | 2.36 93% | 2.12 104% |
| CCT | 6475 100% | 6760 96% | 6181 105% | 6765 96% | 6154 106% | 6510 100% |
| Color Space (Percent of AdobeRGB 1998) (%) | 85.8 | 61.6 | ||||
| Color Space (Percent of sRGB) (%) | 100 | 97.2 | ||||
| Moyenne finale (programmes/paramètres) | -18% /
-12% | -20% /
-2% | -11% /
-10% | 126% /
185% | -22% /
-8% |
* ... Moindre est la valeur, meilleures sont les performances
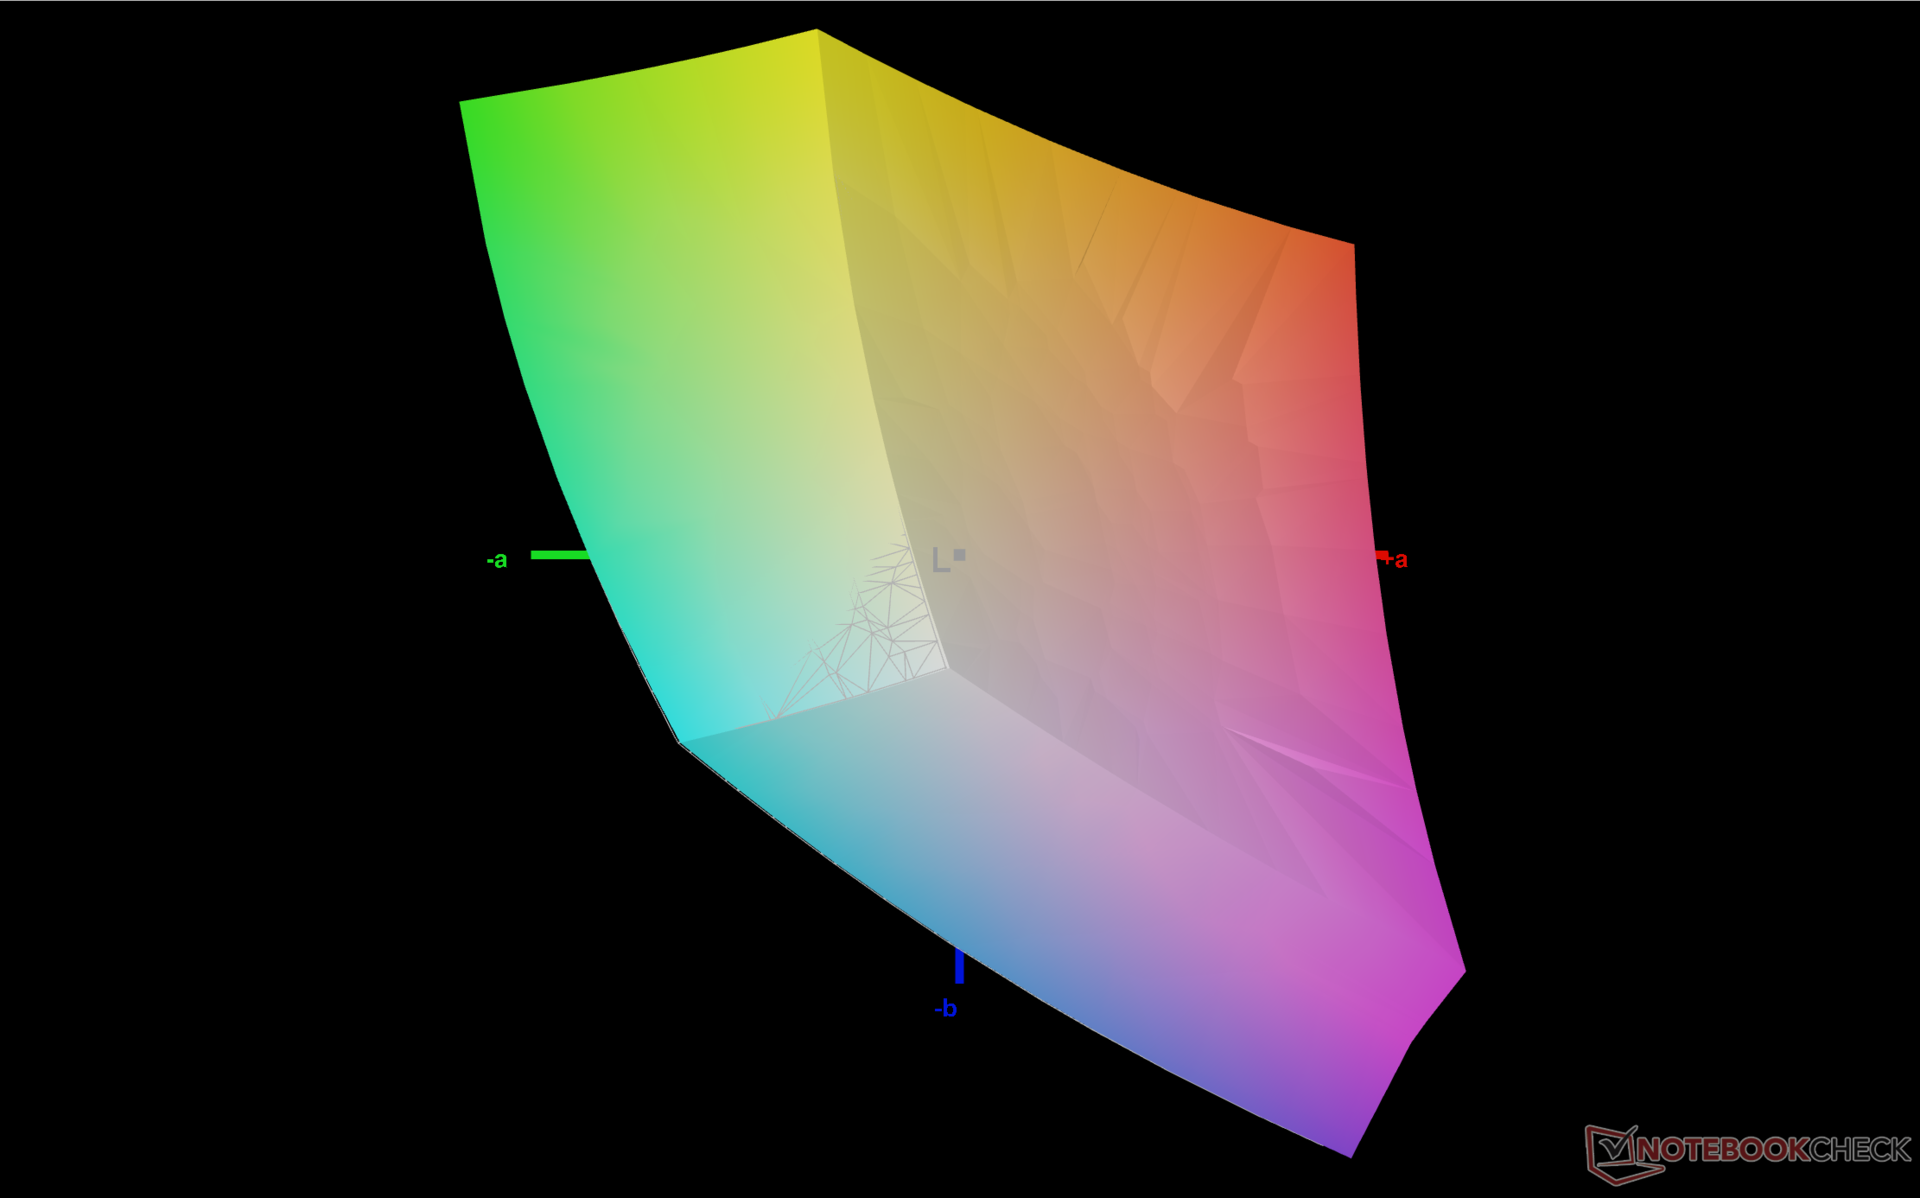
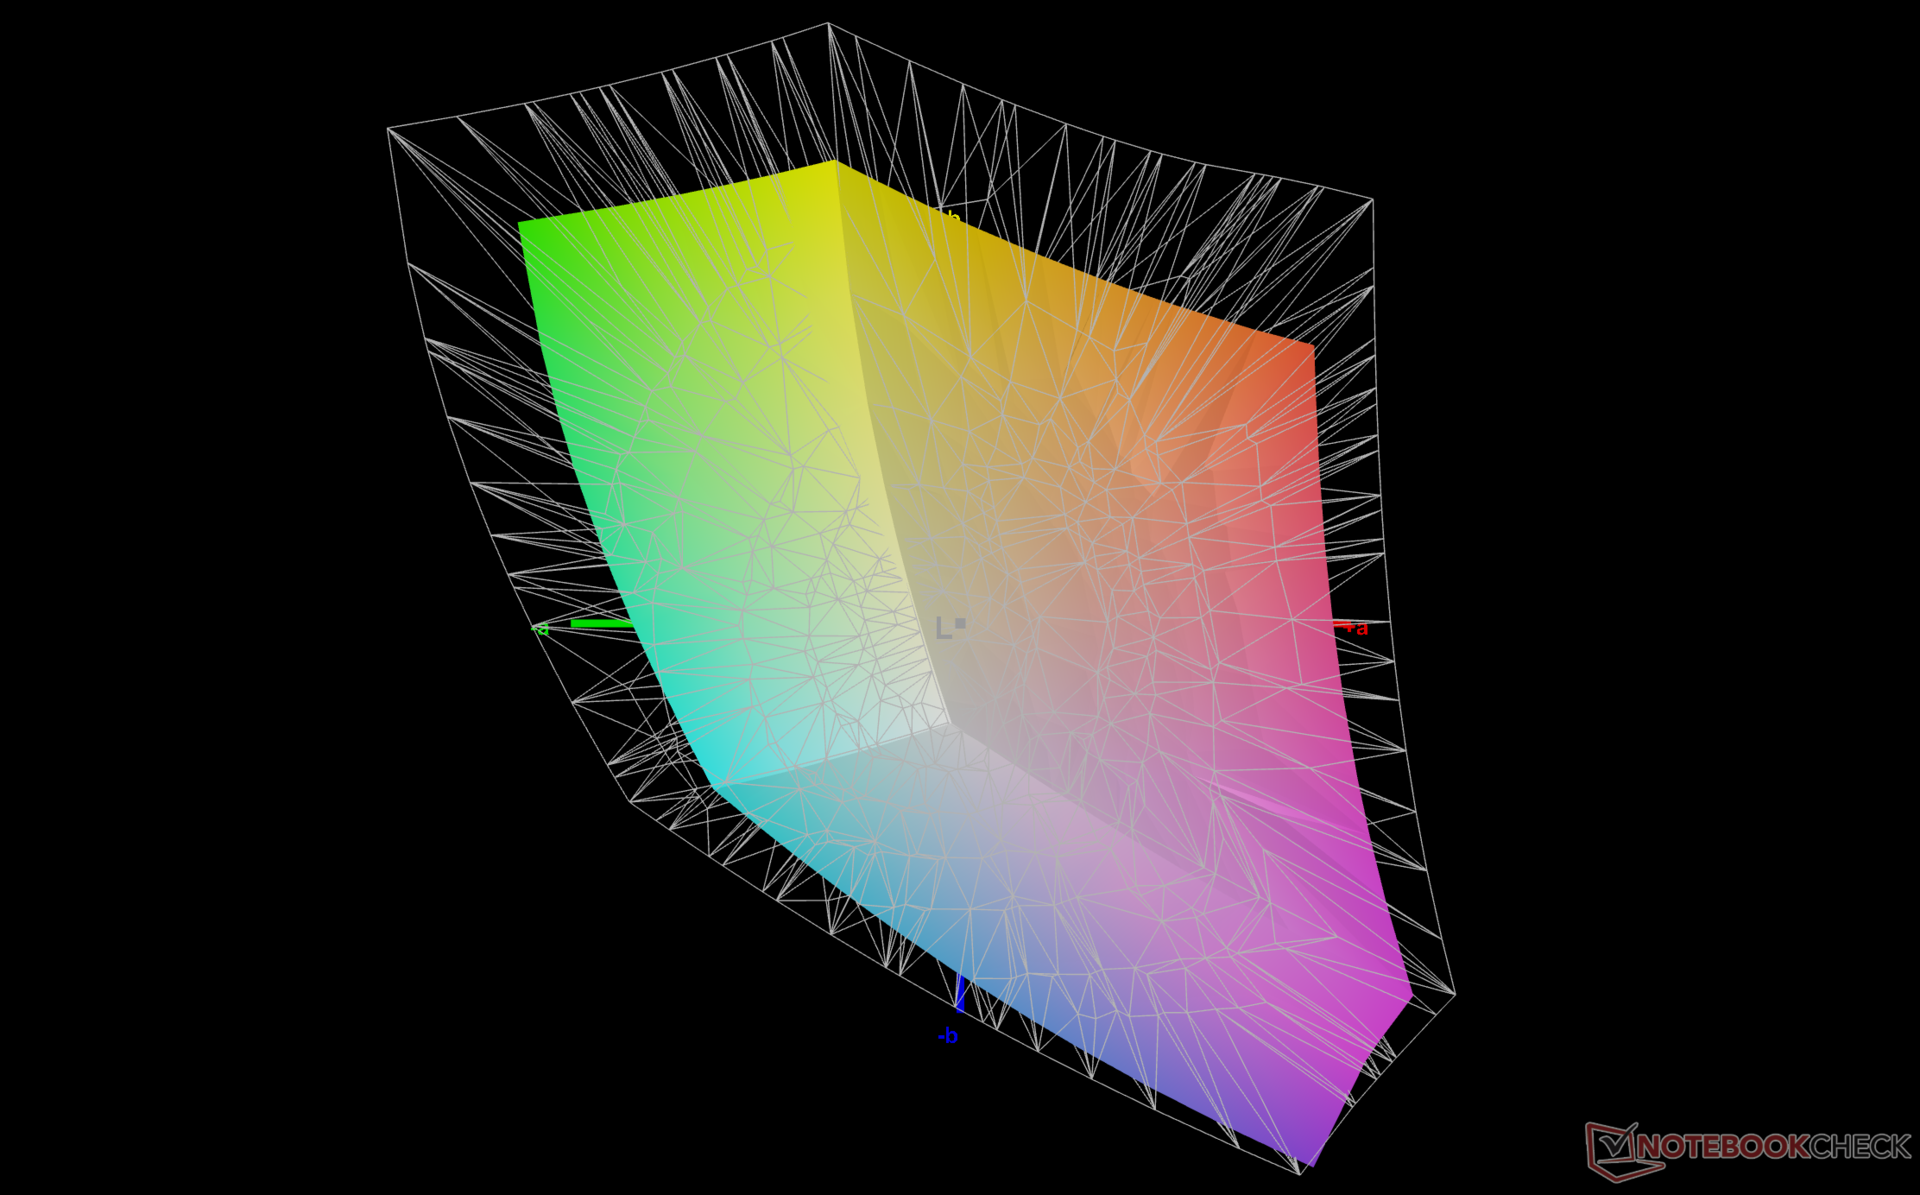
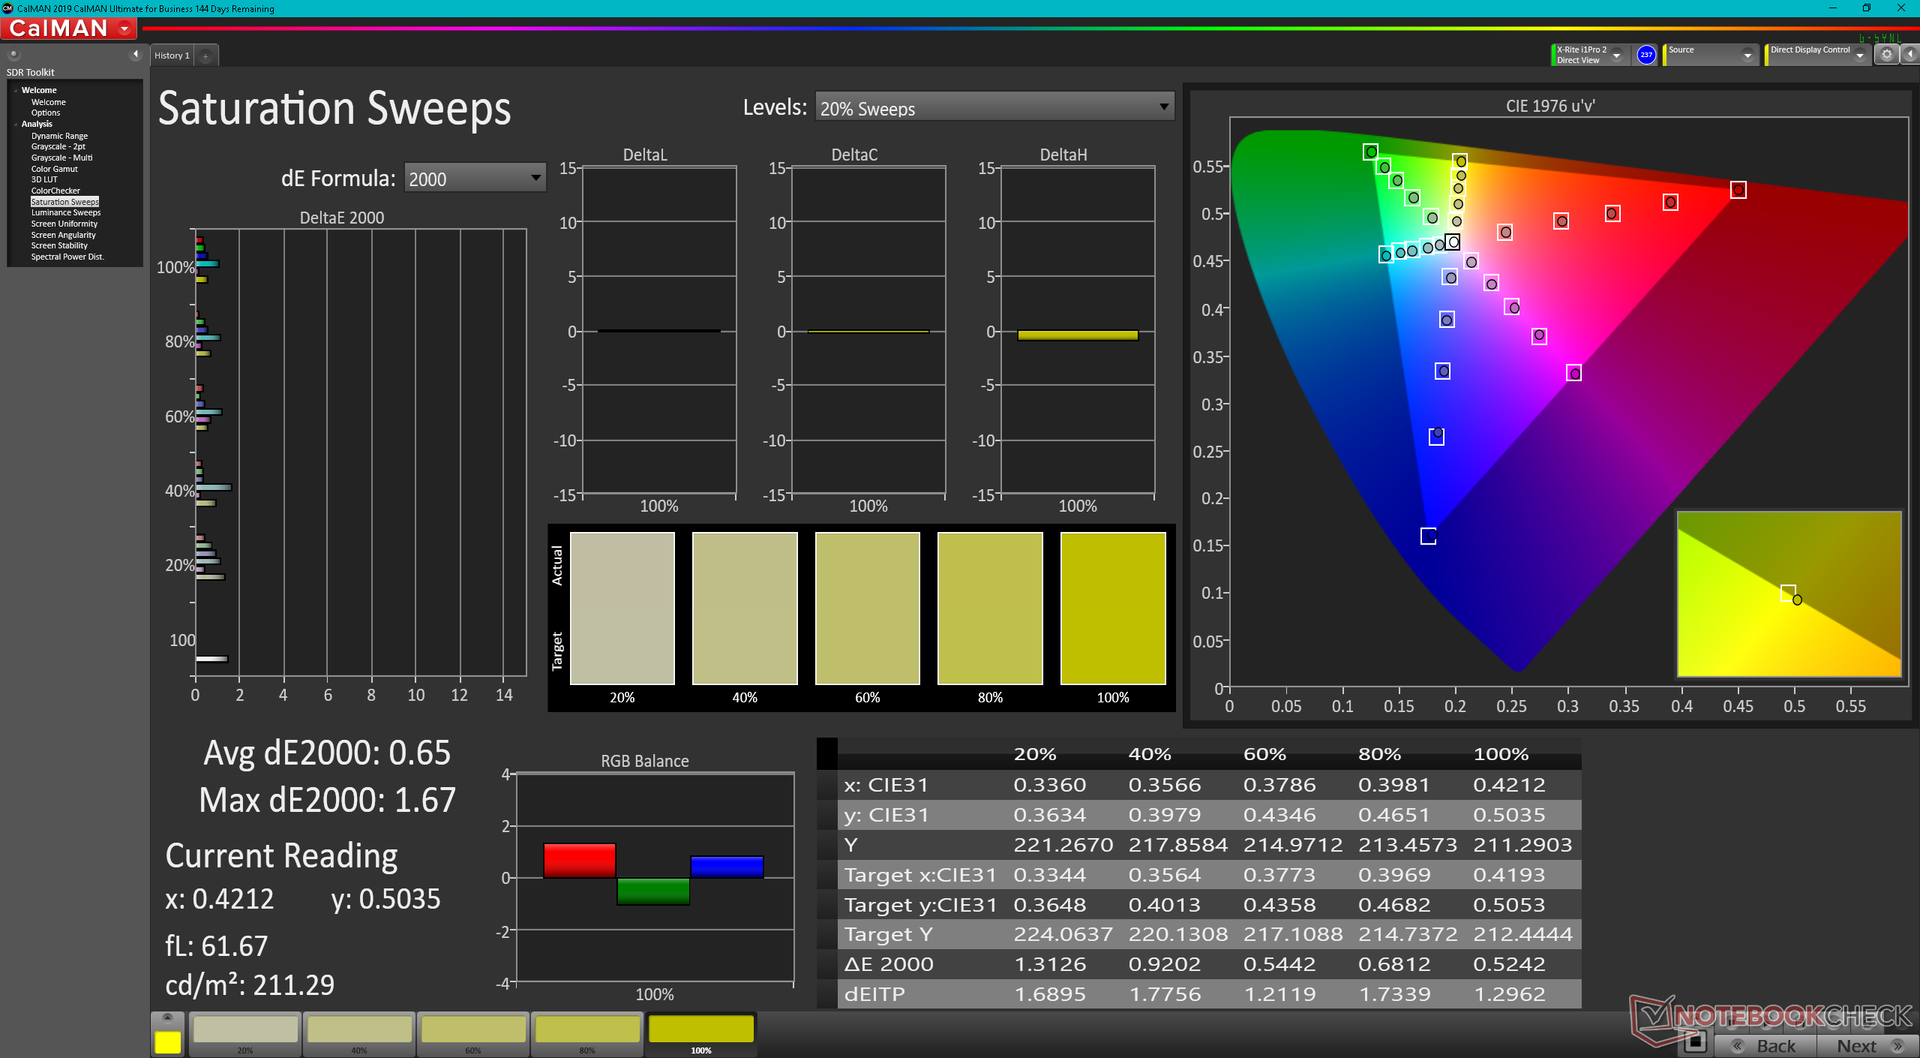
Le fabricant ne calibre pas son Framework Laptop en usine, ce qui est dommage puisque l'écran offre une couverture sRGB complète. Les valeurs moyennes de DeltaE en niveaux de gris et en couleurs sur notre unité de test sont respectivement de 5,2 et 2,76, alors qu'elles ne sont que de 0,9 et 0,58 après avoir calibré le panneau nous-mêmes. La température des couleurs, en particulier, est beaucoup trop chaude sans un calibrage approprié. Nous vous recommandons d'appliquer notre profil ICM ci-dessus pour tirer le meilleur parti de cet écran.
Temps de réponse de l'écran
| ↔ Temps de réponse noir à blanc | ||
|---|---|---|
| 27.5 ms ... hausse ↗ et chute ↘ combinées | ↗ 14.8 ms hausse | 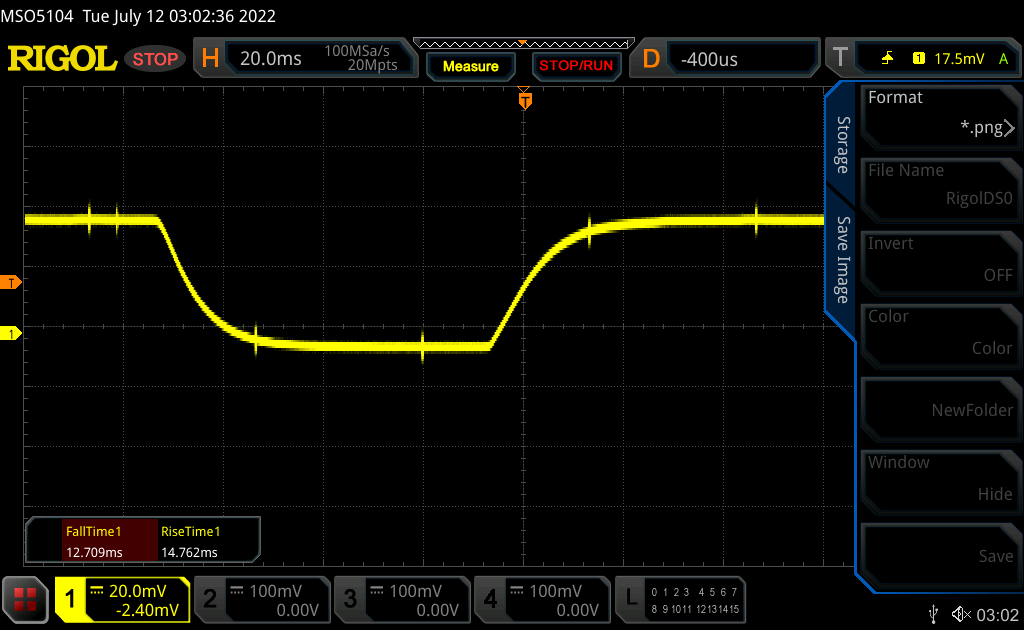 |
| ↘ 12.7 ms chute | ||
| L'écran souffre de latences relativement élevées, insuffisant pour le jeu. En comparaison, tous les appareils testés affichent entre 0.1 (minimum) et 240 (maximum) ms. » 70 % des appareils testés affichent de meilleures performances. Cela signifie que les latences relevées sont moins bonnes que la moyenne (19.8 ms) de tous les appareils testés. | ||
| ↔ Temps de réponse gris 50% à gris 80% | ||
| 34.7 ms ... hausse ↗ et chute ↘ combinées | ↗ 17.7 ms hausse | 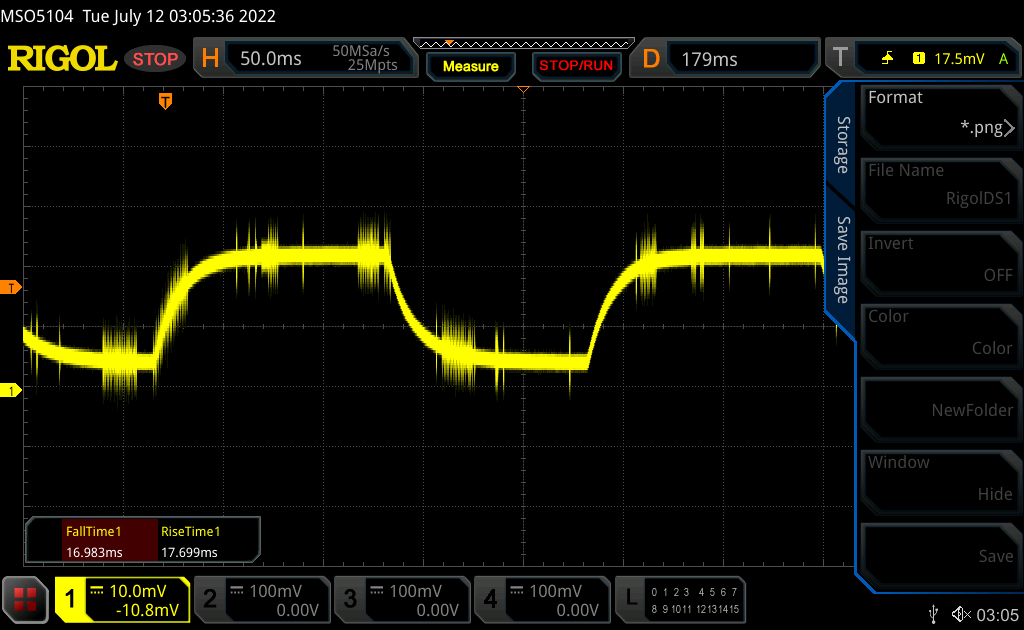 |
| ↘ 17 ms chute | ||
| L'écran souffre de latences très élevées, à éviter pour le jeu. En comparaison, tous les appareils testés affichent entre 0.165 (minimum) et 636 (maximum) ms. » 49 % des appareils testés affichent de meilleures performances. Cela signifie que les latences relevées sont moins bonnes que la moyenne (31 ms) de tous les appareils testés. | ||
Scintillement / MLI (Modulation de largeur d'impulsion)
| Scintillement / MLI (Modulation de largeur d'impulsion) non décelé | 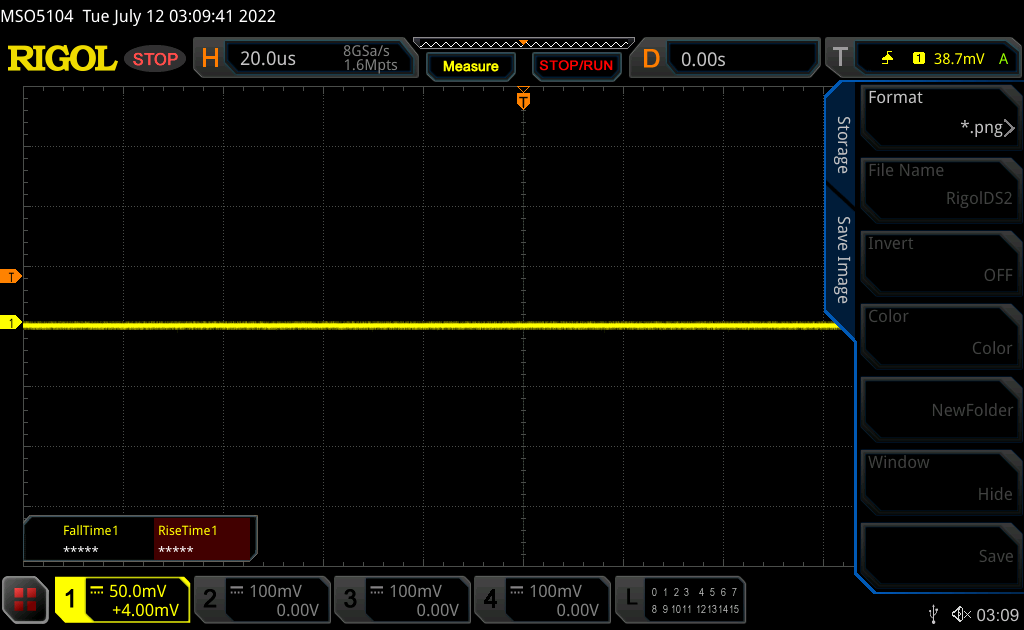 | ||
En comparaison, 52 % des appareils testés n'emploient pas MDI pour assombrir leur écran. Nous avons relevé une moyenne à 7757 (minimum : 5 - maximum : 343500) Hz dans le cas où une MDI était active. | |||
Performance
Conditions d'essai
Nous avons réglé notre appareil en mode Performance via Windows avant d'effectuer les tests de performance ci-dessous.
Processeur
En comparaison avec le Core i7-1165G7 dans le Framework Laptop original, le Core i7-1260P du modèle Framework 2022 peut offrir des performances monofil et multifil respectivement 20 % et 90 % plus rapides. En fait, le modèle Framework fonctionne 20 à 25 % plus vite que l'ordinateur portable moyen de notre base de données fonctionnant avec le même CPU Core i7-1260P jusqu'à présent. Nous sommes heureux de voir que le fabricant propose des processeurs de la 12e génération de la série P au lieu de la 12e génération de la série U, comme le fait le Core i5-1235U et i7-1255U offrent des avantages de performance beaucoup plus faibles par rapport à la série U de 11e génération
La rétrogradation vers le Core i5-1240P à partir de notre Core i7-1260P devrait entraîner un déficit de performance multithread de 45 %, tandis que la mise à niveau vers le Core i7-1280P n'augmenterait les performances que d'environ 10 %. En conséquence, le Core i7-1260P est l'option la plus recommandée.
Cinebench R15 Multi Loop
Cinebench R23: Multi Core | Single Core
Cinebench R15: CPU Multi 64Bit | CPU Single 64Bit
Blender: v2.79 BMW27 CPU
7-Zip 18.03: 7z b 4 | 7z b 4 -mmt1
Geekbench 5.5: Multi-Core | Single-Core
HWBOT x265 Benchmark v2.2: 4k Preset
LibreOffice : 20 Documents To PDF
R Benchmark 2.5: Overall mean
Cinebench R23: Multi Core | Single Core
Cinebench R15: CPU Multi 64Bit | CPU Single 64Bit
Blender: v2.79 BMW27 CPU
7-Zip 18.03: 7z b 4 | 7z b 4 -mmt1
Geekbench 5.5: Multi-Core | Single-Core
HWBOT x265 Benchmark v2.2: 4k Preset
LibreOffice : 20 Documents To PDF
R Benchmark 2.5: Overall mean
* ... Moindre est la valeur, meilleures sont les performances
AIDA64: FP32 Ray-Trace | FPU Julia | CPU SHA3 | CPU Queen | FPU SinJulia | FPU Mandel | CPU AES | CPU ZLib | FP64 Ray-Trace | CPU PhotoWorxx
| Performance rating | |
| Microsoft Surface Laptop 4 13 Ryzen 5 | |
| Framework Laptop 13.5 12th Gen Intel | |
| Moyenne Intel Core i7-1260P | |
| Framework Laptop 13.5 | |
| HP Spectre x360 14-ea0378ng | |
| Lenovo ThinkPad X1 Titanium Yoga G1 20QB0016GE | |
| AIDA64 / FP32 Ray-Trace | |
| Microsoft Surface Laptop 4 13 Ryzen 5 | |
| Framework Laptop 13.5 | |
| Moyenne Intel Core i7-1260P (2176 - 10898, n=26) | |
| Framework Laptop 13.5 12th Gen Intel | |
| HP Spectre x360 14-ea0378ng | |
| Lenovo ThinkPad X1 Titanium Yoga G1 20QB0016GE | |
| AIDA64 / FPU Julia | |
| Microsoft Surface Laptop 4 13 Ryzen 5 | |
| Moyenne Intel Core i7-1260P (11015 - 56906, n=26) | |
| Framework Laptop 13.5 | |
| Framework Laptop 13.5 12th Gen Intel | |
| Lenovo ThinkPad X1 Titanium Yoga G1 20QB0016GE | |
| HP Spectre x360 14-ea0378ng | |
| AIDA64 / CPU SHA3 | |
| Framework Laptop 13.5 | |
| Framework Laptop 13.5 12th Gen Intel | |
| Moyenne Intel Core i7-1260P (669 - 2709, n=26) | |
| Microsoft Surface Laptop 4 13 Ryzen 5 | |
| Lenovo ThinkPad X1 Titanium Yoga G1 20QB0016GE | |
| HP Spectre x360 14-ea0378ng | |
| AIDA64 / CPU Queen | |
| Framework Laptop 13.5 12th Gen Intel | |
| Moyenne Intel Core i7-1260P (42571 - 82493, n=26) | |
| Microsoft Surface Laptop 4 13 Ryzen 5 | |
| HP Spectre x360 14-ea0378ng | |
| Framework Laptop 13.5 | |
| Lenovo ThinkPad X1 Titanium Yoga G1 20QB0016GE | |
| AIDA64 / FPU SinJulia | |
| Microsoft Surface Laptop 4 13 Ryzen 5 | |
| Framework Laptop 13.5 12th Gen Intel | |
| Moyenne Intel Core i7-1260P (2901 - 6975, n=26) | |
| Framework Laptop 13.5 | |
| HP Spectre x360 14-ea0378ng | |
| Lenovo ThinkPad X1 Titanium Yoga G1 20QB0016GE | |
| AIDA64 / FPU Mandel | |
| Microsoft Surface Laptop 4 13 Ryzen 5 | |
| Framework Laptop 13.5 | |
| Moyenne Intel Core i7-1260P (5950 - 26376, n=26) | |
| Framework Laptop 13.5 12th Gen Intel | |
| HP Spectre x360 14-ea0378ng | |
| Lenovo ThinkPad X1 Titanium Yoga G1 20QB0016GE | |
| AIDA64 / CPU AES | |
| Framework Laptop 13.5 | |
| Framework Laptop 13.5 12th Gen Intel | |
| Lenovo ThinkPad X1 Titanium Yoga G1 20QB0016GE | |
| HP Spectre x360 14-ea0378ng | |
| Moyenne Intel Core i7-1260P (16041 - 92356, n=26) | |
| Microsoft Surface Laptop 4 13 Ryzen 5 | |
| AIDA64 / CPU ZLib | |
| Framework Laptop 13.5 12th Gen Intel | |
| Moyenne Intel Core i7-1260P (259 - 771, n=26) | |
| Microsoft Surface Laptop 4 13 Ryzen 5 | |
| Framework Laptop 13.5 | |
| HP Spectre x360 14-ea0378ng | |
| Lenovo ThinkPad X1 Titanium Yoga G1 20QB0016GE | |
| AIDA64 / FP64 Ray-Trace | |
| Microsoft Surface Laptop 4 13 Ryzen 5 | |
| Framework Laptop 13.5 | |
| Moyenne Intel Core i7-1260P (1237 - 5858, n=26) | |
| Framework Laptop 13.5 12th Gen Intel | |
| HP Spectre x360 14-ea0378ng | |
| Lenovo ThinkPad X1 Titanium Yoga G1 20QB0016GE | |
| AIDA64 / CPU PhotoWorxx | |
| HP Spectre x360 14-ea0378ng | |
| Lenovo ThinkPad X1 Titanium Yoga G1 20QB0016GE | |
| Moyenne Intel Core i7-1260P (13261 - 43652, n=26) | |
| Framework Laptop 13.5 12th Gen Intel | |
| Microsoft Surface Laptop 4 13 Ryzen 5 | |
| Framework Laptop 13.5 | |
Performance du système
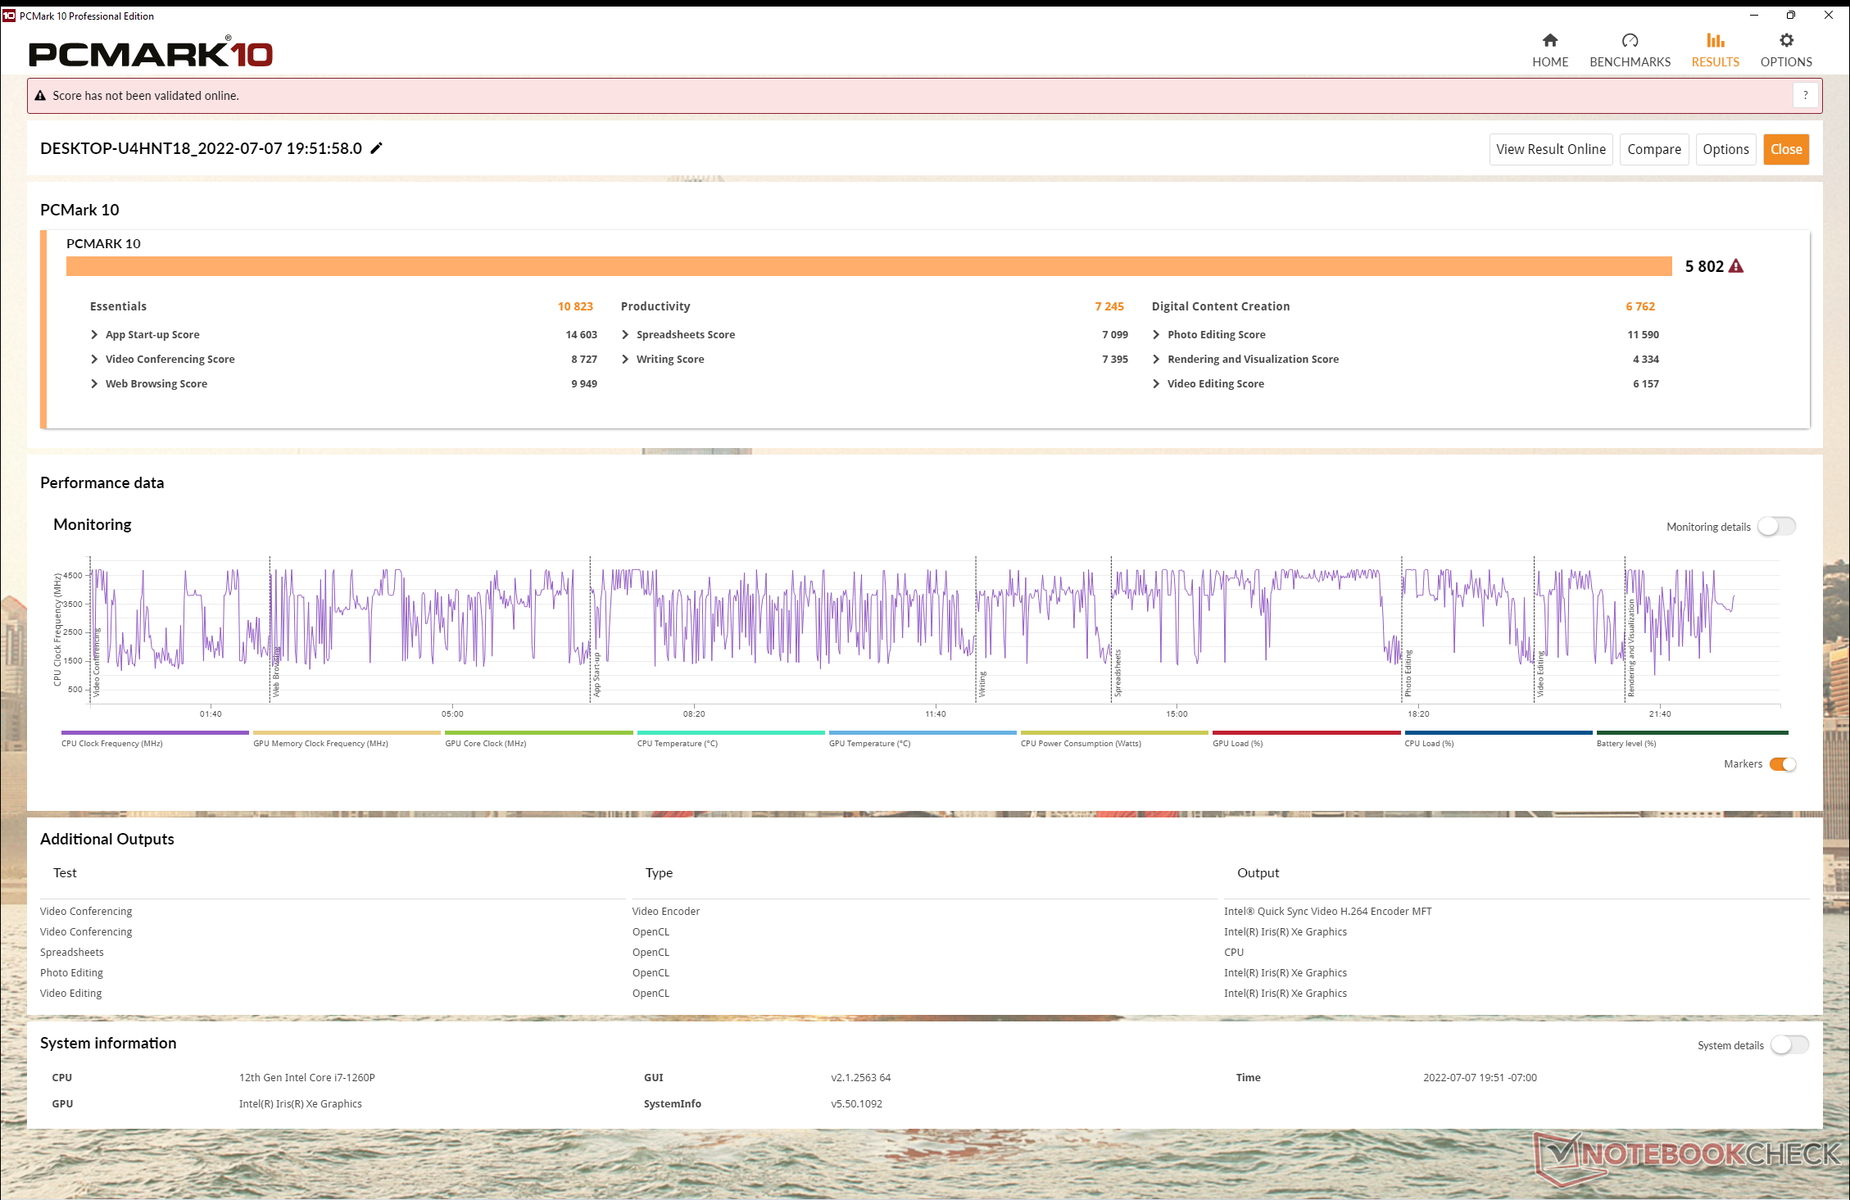
Les résultats de PCMark 10 sont systématiquement supérieurs à ceux du Framework Laptop de l'année dernière et de la plupart des autres Ultrabooks fonctionnant avec des CPU de 11e génération ou plus anciens.
CrossMark: Overall | Productivity | Creativity | Responsiveness
| PCMark 10 / Score | |
| Framework Laptop 13.5 12th Gen Intel | |
| Moyenne Intel Core i7-1260P, Intel Iris Xe Graphics G7 96EUs (4796 - 6068, n=17) | |
| Framework Laptop 13.5 | |
| Microsoft Surface Laptop 4 13 Ryzen 5 | |
| HP Spectre x360 14-ea0378ng | |
| Lenovo ThinkPad X1 Titanium Yoga G1 20QB0016GE | |
| PCMark 10 / Essentials | |
| Framework Laptop 13.5 12th Gen Intel | |
| Moyenne Intel Core i7-1260P, Intel Iris Xe Graphics G7 96EUs (9260 - 11251, n=17) | |
| Framework Laptop 13.5 | |
| Lenovo ThinkPad X1 Titanium Yoga G1 20QB0016GE | |
| HP Spectre x360 14-ea0378ng | |
| Microsoft Surface Laptop 4 13 Ryzen 5 | |
| PCMark 10 / Productivity | |
| Framework Laptop 13.5 12th Gen Intel | |
| Moyenne Intel Core i7-1260P, Intel Iris Xe Graphics G7 96EUs (6167 - 8629, n=17) | |
| Microsoft Surface Laptop 4 13 Ryzen 5 | |
| HP Spectre x360 14-ea0378ng | |
| Lenovo ThinkPad X1 Titanium Yoga G1 20QB0016GE | |
| Framework Laptop 13.5 | |
| PCMark 10 / Digital Content Creation | |
| Framework Laptop 13.5 12th Gen Intel | |
| Moyenne Intel Core i7-1260P, Intel Iris Xe Graphics G7 96EUs (5231 - 6908, n=17) | |
| Framework Laptop 13.5 | |
| Microsoft Surface Laptop 4 13 Ryzen 5 | |
| HP Spectre x360 14-ea0378ng | |
| Lenovo ThinkPad X1 Titanium Yoga G1 20QB0016GE | |
| CrossMark / Overall | |
| Framework Laptop 13.5 12th Gen Intel | |
| Moyenne Intel Core i7-1260P, Intel Iris Xe Graphics G7 96EUs (1484 - 1811, n=16) | |
| CrossMark / Productivity | |
| Framework Laptop 13.5 12th Gen Intel | |
| Moyenne Intel Core i7-1260P, Intel Iris Xe Graphics G7 96EUs (1486 - 1755, n=16) | |
| CrossMark / Creativity | |
| Framework Laptop 13.5 12th Gen Intel | |
| Moyenne Intel Core i7-1260P, Intel Iris Xe Graphics G7 96EUs (1451 - 1872, n=16) | |
| CrossMark / Responsiveness | |
| Framework Laptop 13.5 12th Gen Intel | |
| Moyenne Intel Core i7-1260P, Intel Iris Xe Graphics G7 96EUs (1253 - 1807, n=16) | |
| PCMark 10 Score | 5802 points | |
Aide | ||
| AIDA64 / Memory Copy | |
| HP Spectre x360 14-ea0378ng | |
| Lenovo ThinkPad X1 Titanium Yoga G1 20QB0016GE | |
| Moyenne Intel Core i7-1260P (25125 - 71544, n=25) | |
| Framework Laptop 13.5 12th Gen Intel | |
| Microsoft Surface Laptop 4 13 Ryzen 5 | |
| Framework Laptop 13.5 | |
| AIDA64 / Memory Read | |
| Lenovo ThinkPad X1 Titanium Yoga G1 20QB0016GE | |
| Moyenne Intel Core i7-1260P (24983 - 72065, n=25) | |
| HP Spectre x360 14-ea0378ng | |
| Framework Laptop 13.5 12th Gen Intel | |
| Microsoft Surface Laptop 4 13 Ryzen 5 | |
| Framework Laptop 13.5 | |
| AIDA64 / Memory Write | |
| Lenovo ThinkPad X1 Titanium Yoga G1 20QB0016GE | |
| HP Spectre x360 14-ea0378ng | |
| Moyenne Intel Core i7-1260P (23512 - 66799, n=25) | |
| Framework Laptop 13.5 12th Gen Intel | |
| Microsoft Surface Laptop 4 13 Ryzen 5 | |
| Framework Laptop 13.5 | |
| AIDA64 / Memory Latency | |
| Microsoft Surface Laptop 4 13 Ryzen 5 | |
| Lenovo ThinkPad X1 Titanium Yoga G1 20QB0016GE | |
| HP Spectre x360 14-ea0378ng | |
| Framework Laptop 13.5 12th Gen Intel | |
| Moyenne Intel Core i7-1260P (77.9 - 118.4, n=21) | |
| Framework Laptop 13.5 | |
* ... Moindre est la valeur, meilleures sont les performances
Latence DPC
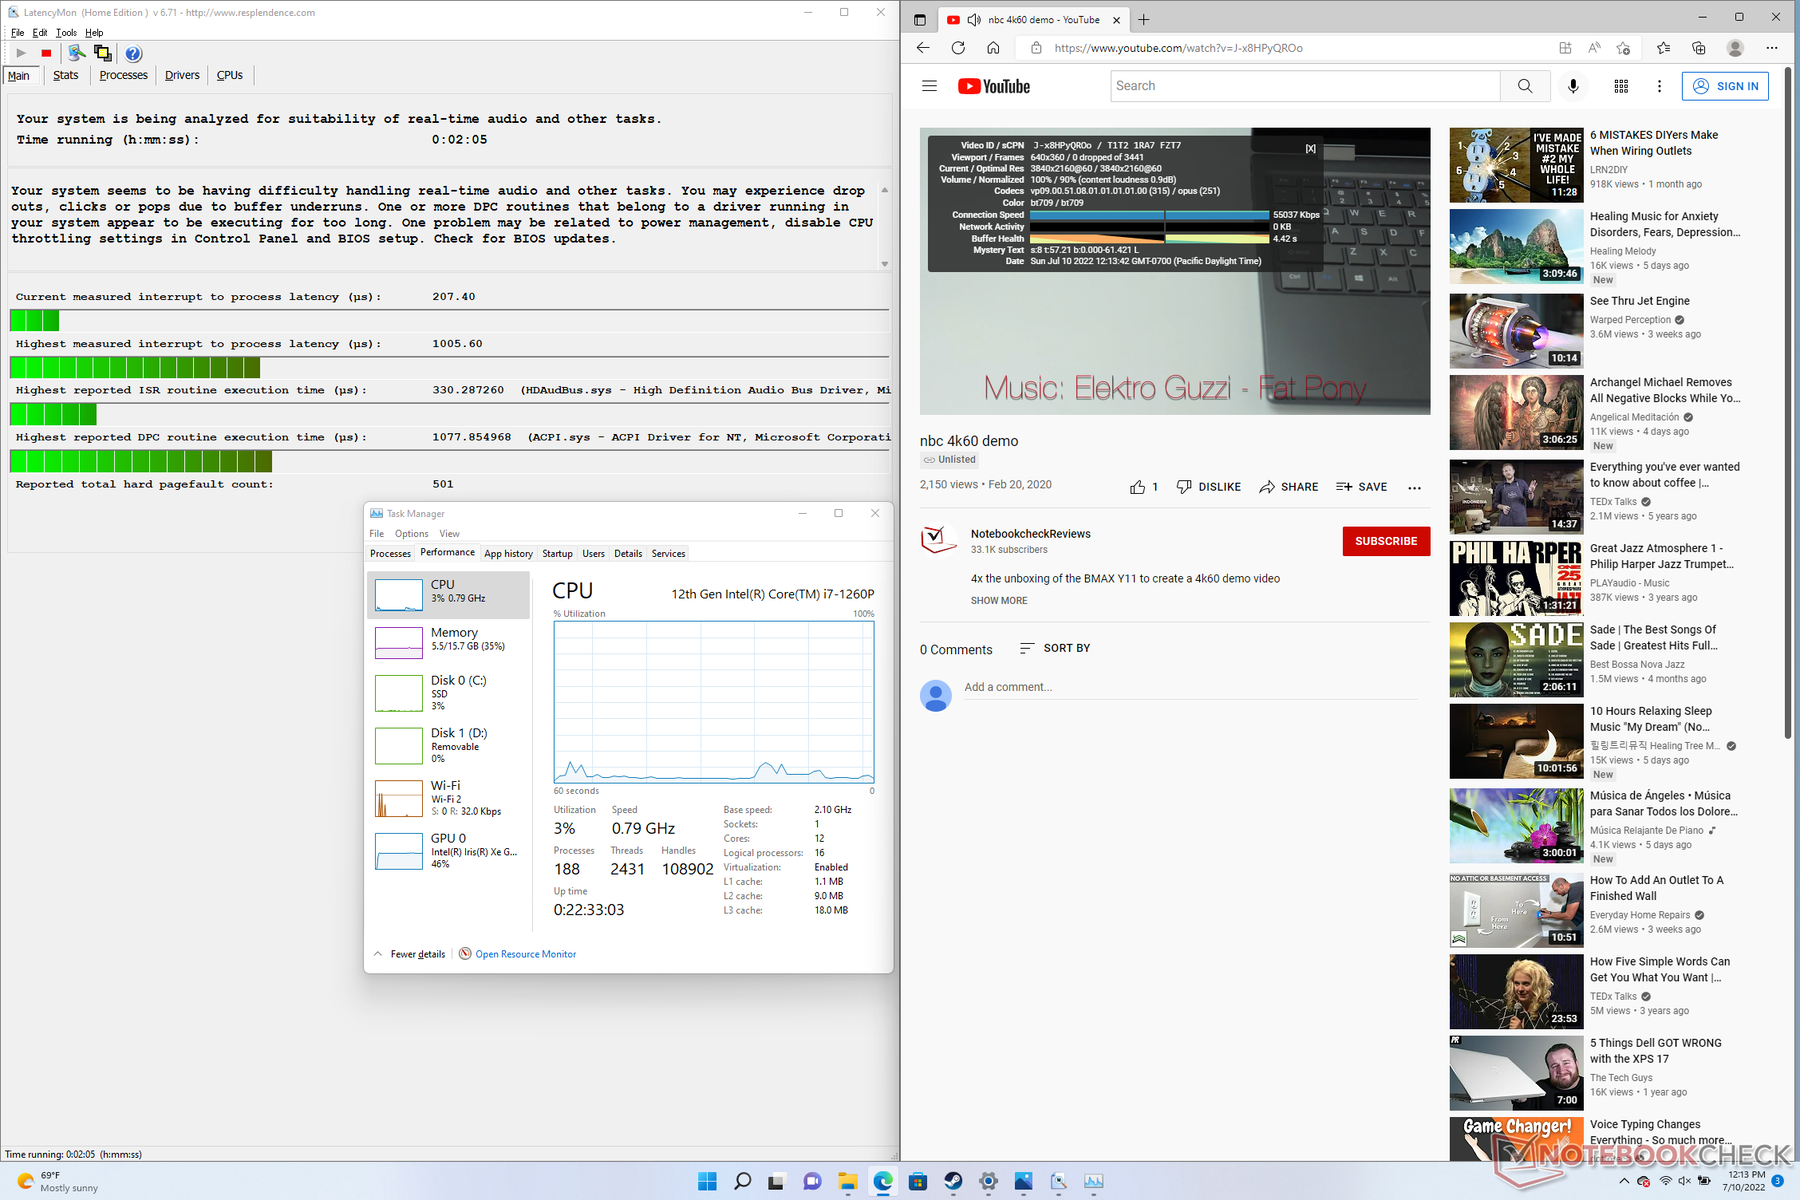
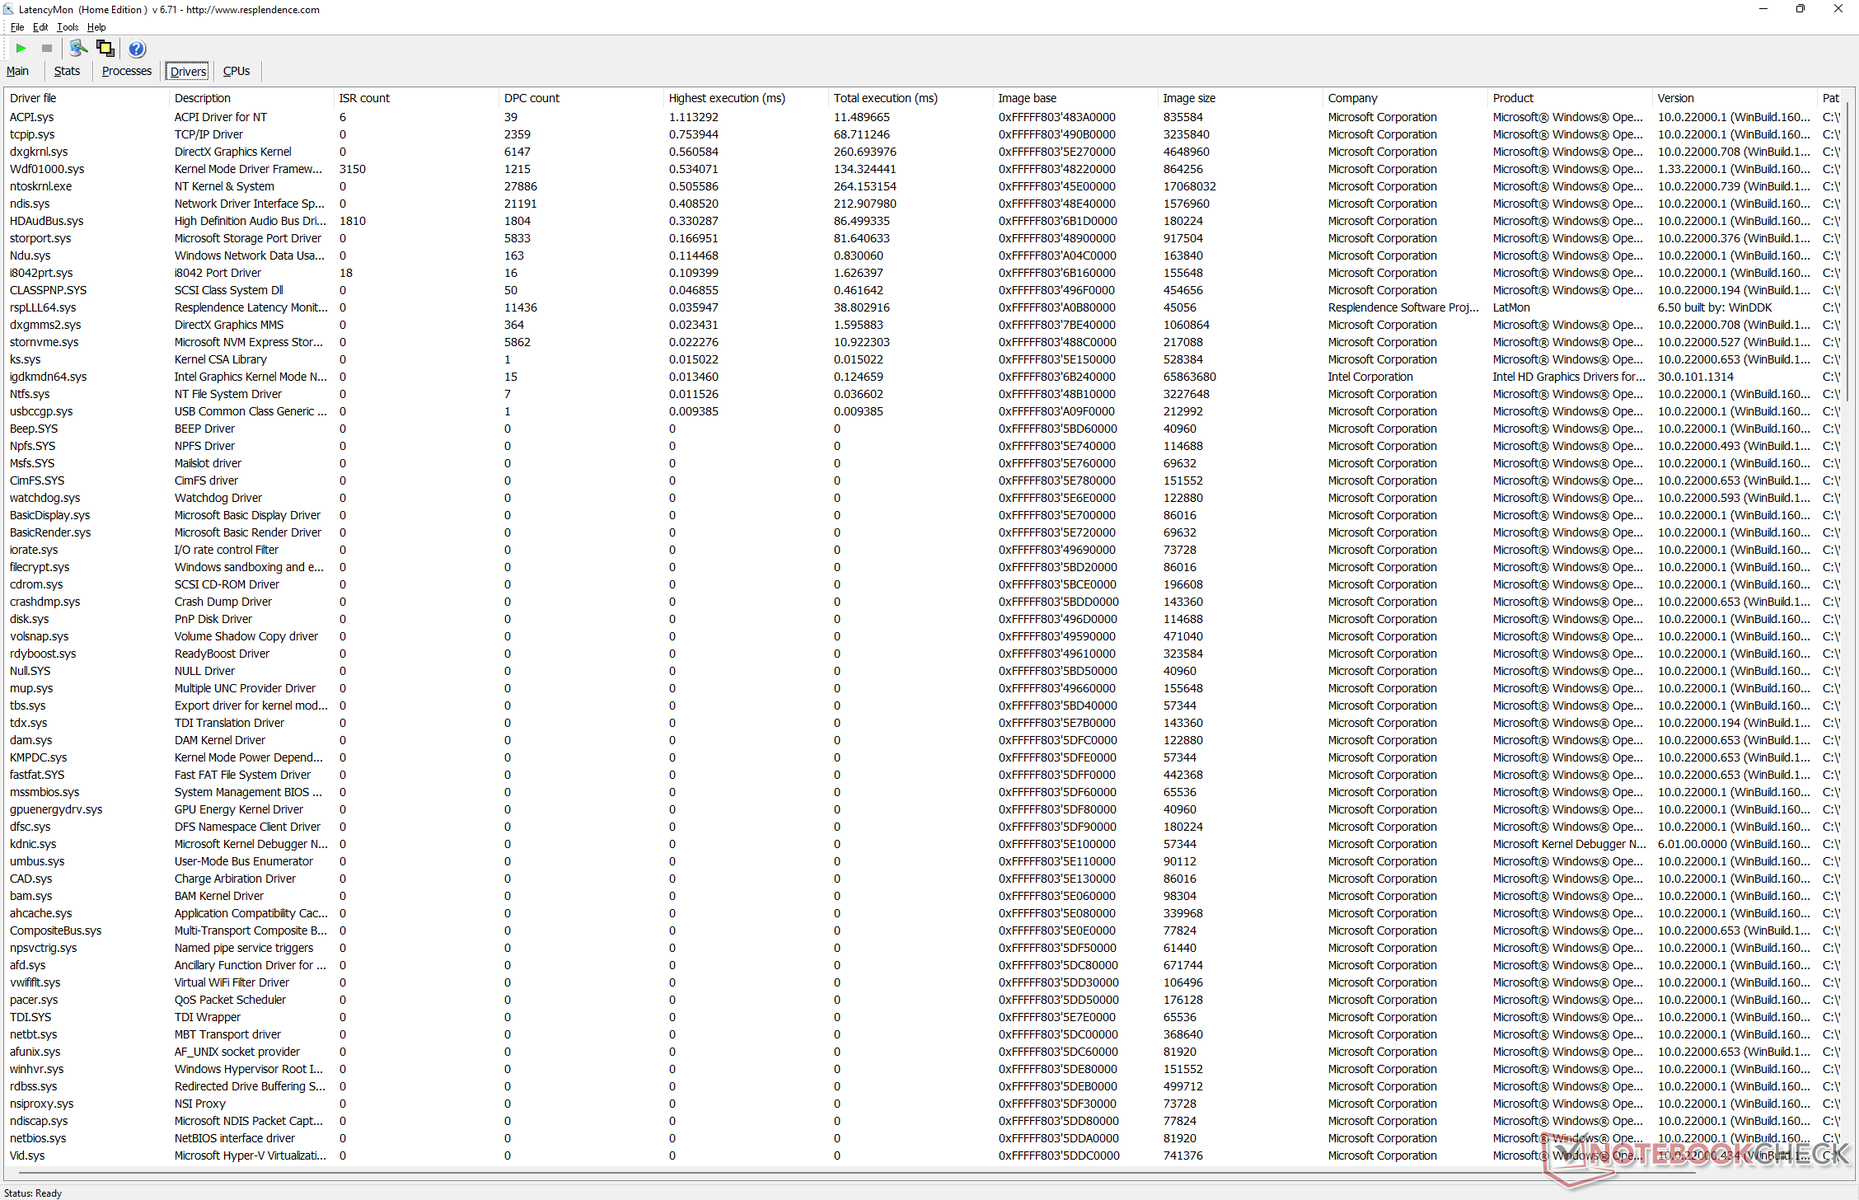
LatencyMon révèle des problèmes mineurs de CPD lors de l'ouverture de plusieurs onglets de navigateur de notre page d'accueil. la lecture de vidéos 4K à 60 FPS est par ailleurs parfaite et ne présente aucune perte d'images.
| DPC Latencies / LatencyMon - interrupt to process latency (max), Web, Youtube, Prime95 | |
| Framework Laptop 13.5 | |
| HP Spectre x360 14-ea0378ng | |
| Framework Laptop 13.5 12th Gen Intel | |
| Microsoft Surface Laptop 4 13 Ryzen 5 | |
| Lenovo ThinkPad X1 Titanium Yoga G1 20QB0016GE | |
* ... Moindre est la valeur, meilleures sont les performances
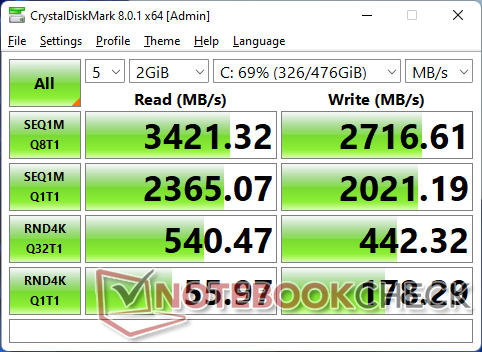
Périphériques de stockage
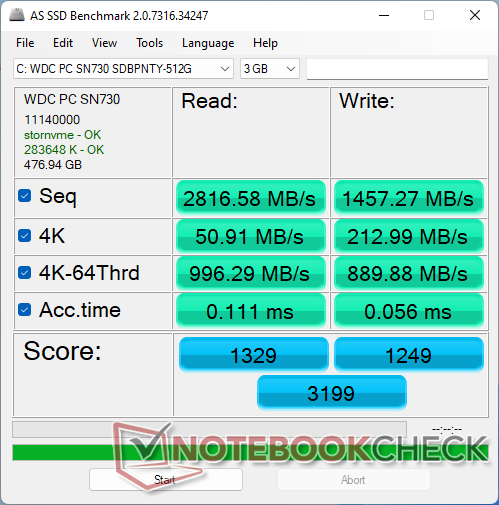
Alors que notre unité Framework 2021 était livrée avec un SSD NVMe WD SN850 M.2 PCIe4 x4, notre unité 2022 était livrée avec un SSD NVMe PCIe3 x4 plus lent.WD SN730 Plus lent. Les utilisateurs peuvent toujours passer à un SSD PCIe4 x4 plus rapide, bien sûr.
Un seul disque interne est pris en charge.

| Drive Performance rating - Percent | |
| Framework Laptop 13.5 | |
| Framework Laptop 13.5 12th Gen Intel | |
| Lenovo ThinkPad X1 Titanium Yoga G1 20QB0016GE | |
| HP Spectre x360 14-ea0378ng | |
| Microsoft Surface Laptop 4 13 Ryzen 5 | |
| HP EliteBook Folio 13.5-3G2L2EA -8! | |
* ... Moindre est la valeur, meilleures sont les performances
Disk Throttling: DiskSpd Read Loop, Queue Depth 8
Performances du GPU
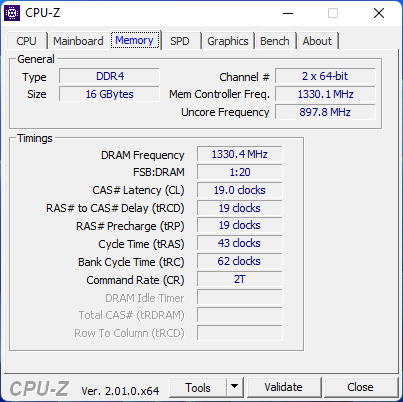
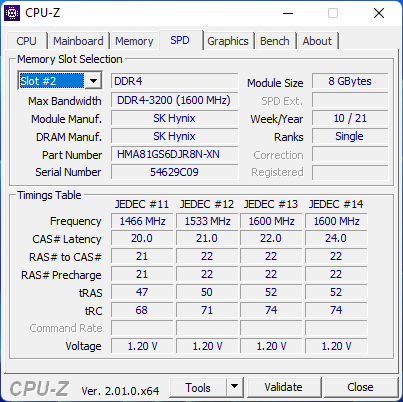
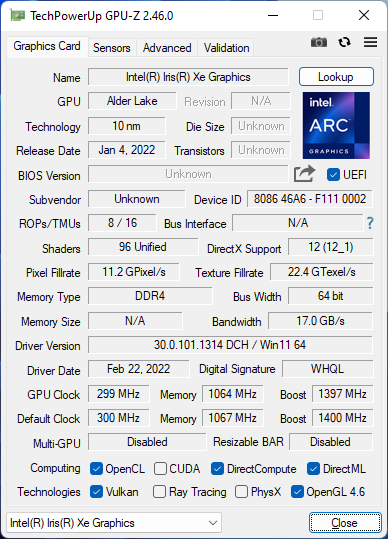
Les performances graphiques sont environ 5 à 15 % plus rapides que celles de l'ordinateur portable moyen de notre base de données équipé de la même technologie intégrée Iris Xe 96 EU intégrée. Les performances étaient beaucoup plus lentes sur notre unité de test 2021 originale, car elle fonctionnait avec une mémoire à canal unique. Si les graphiques sont importants pour vos charges de travail, il est fortement recommandé de configurer la mémoire à double canal.
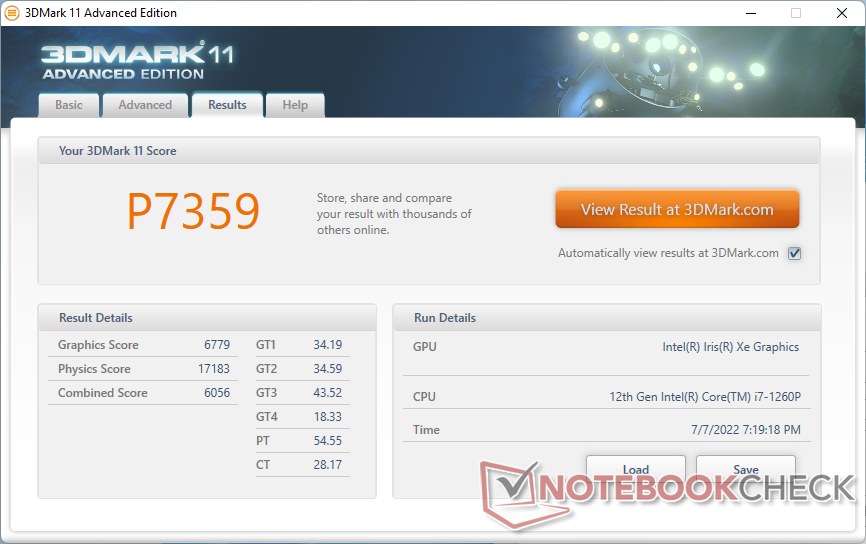
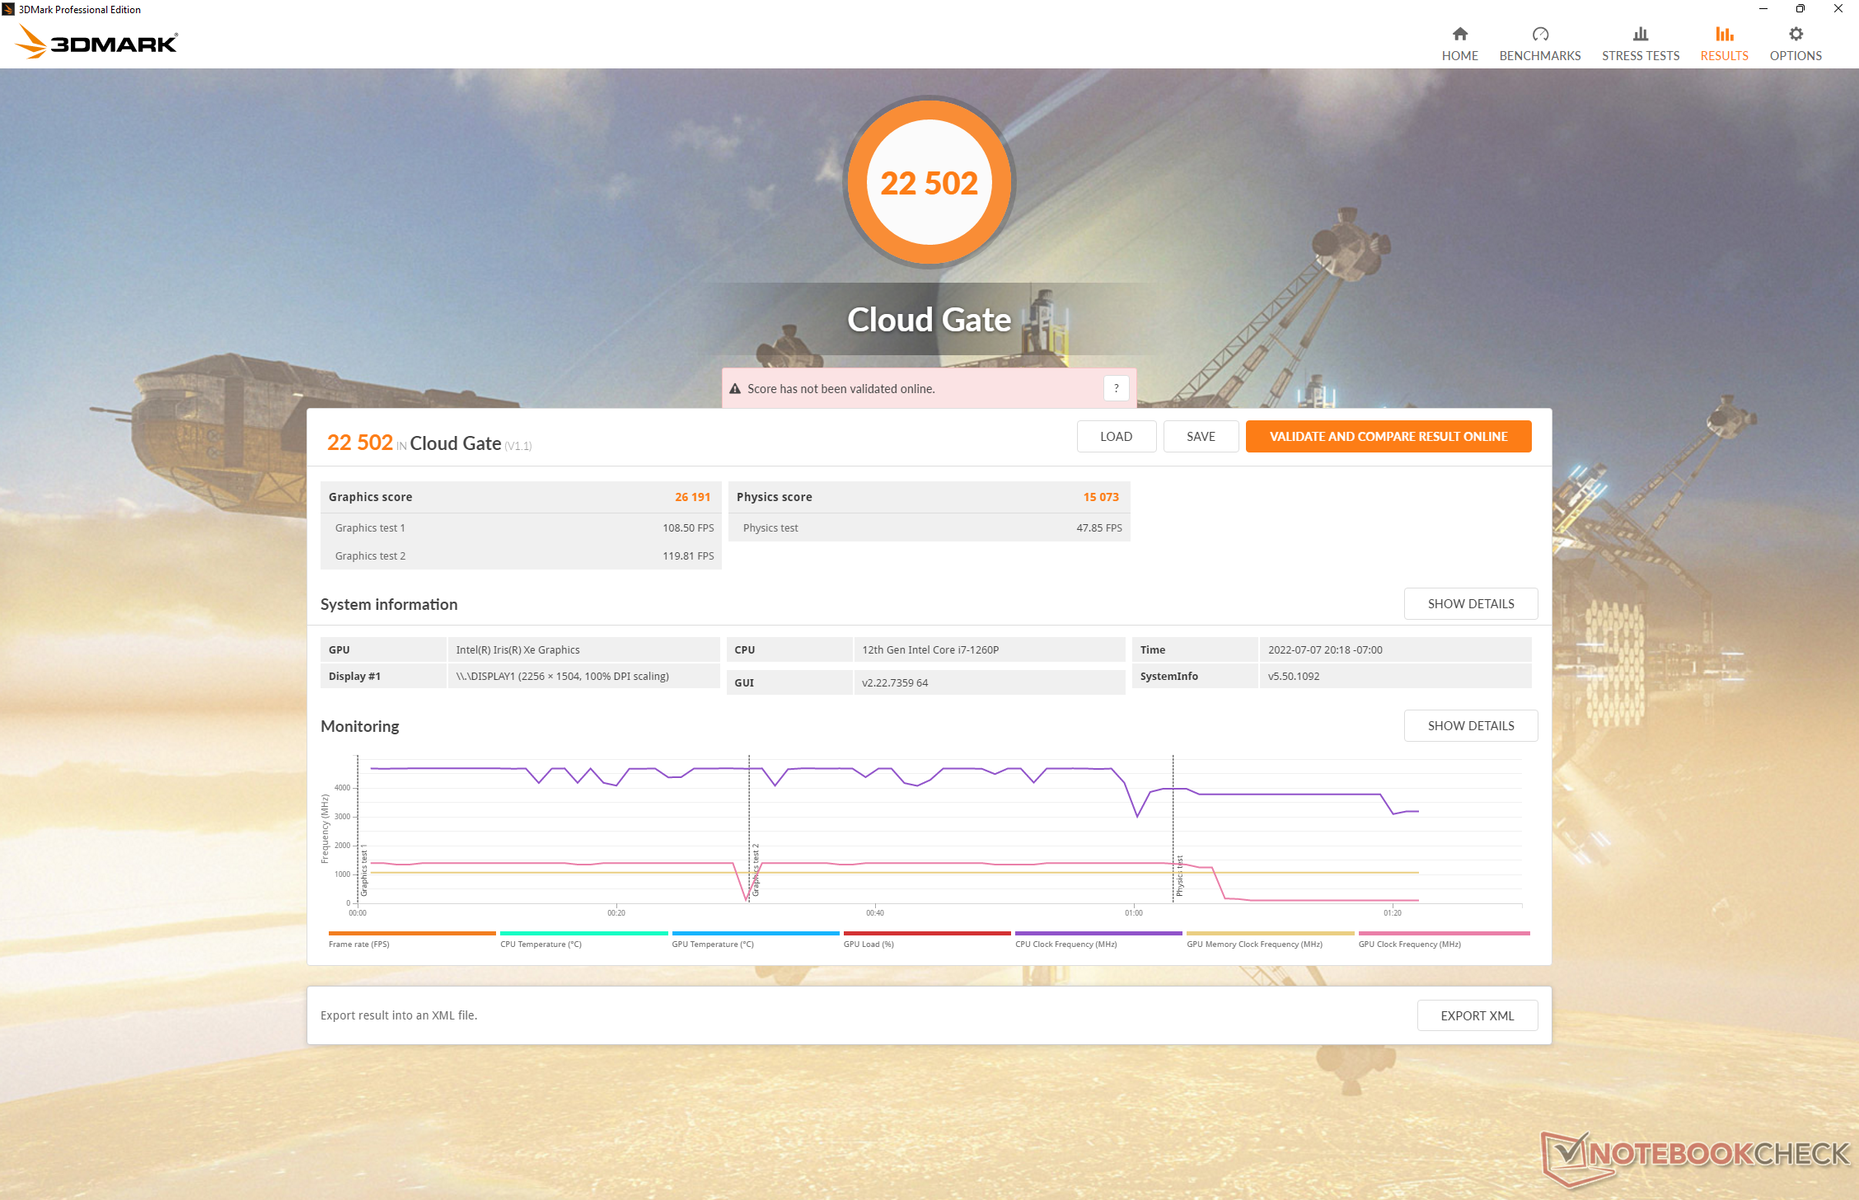
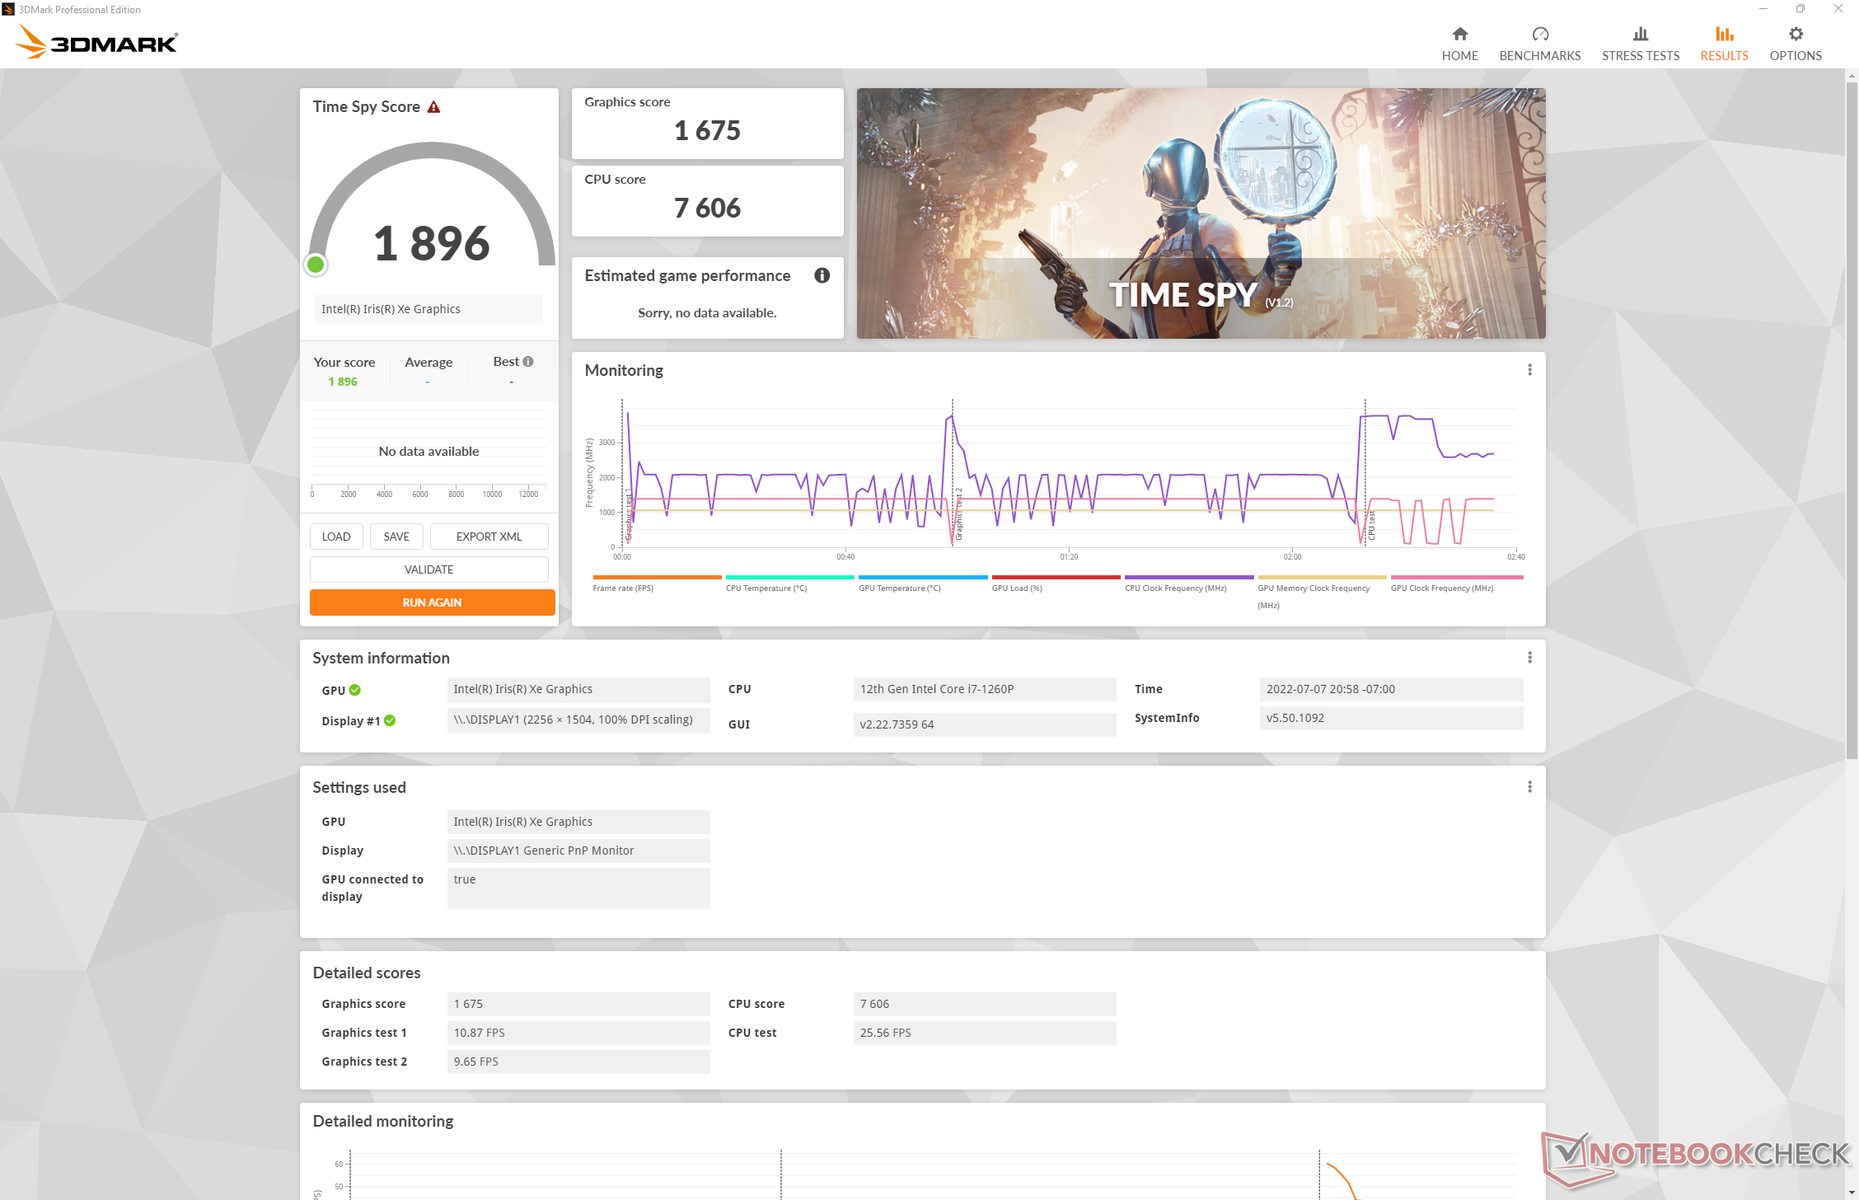
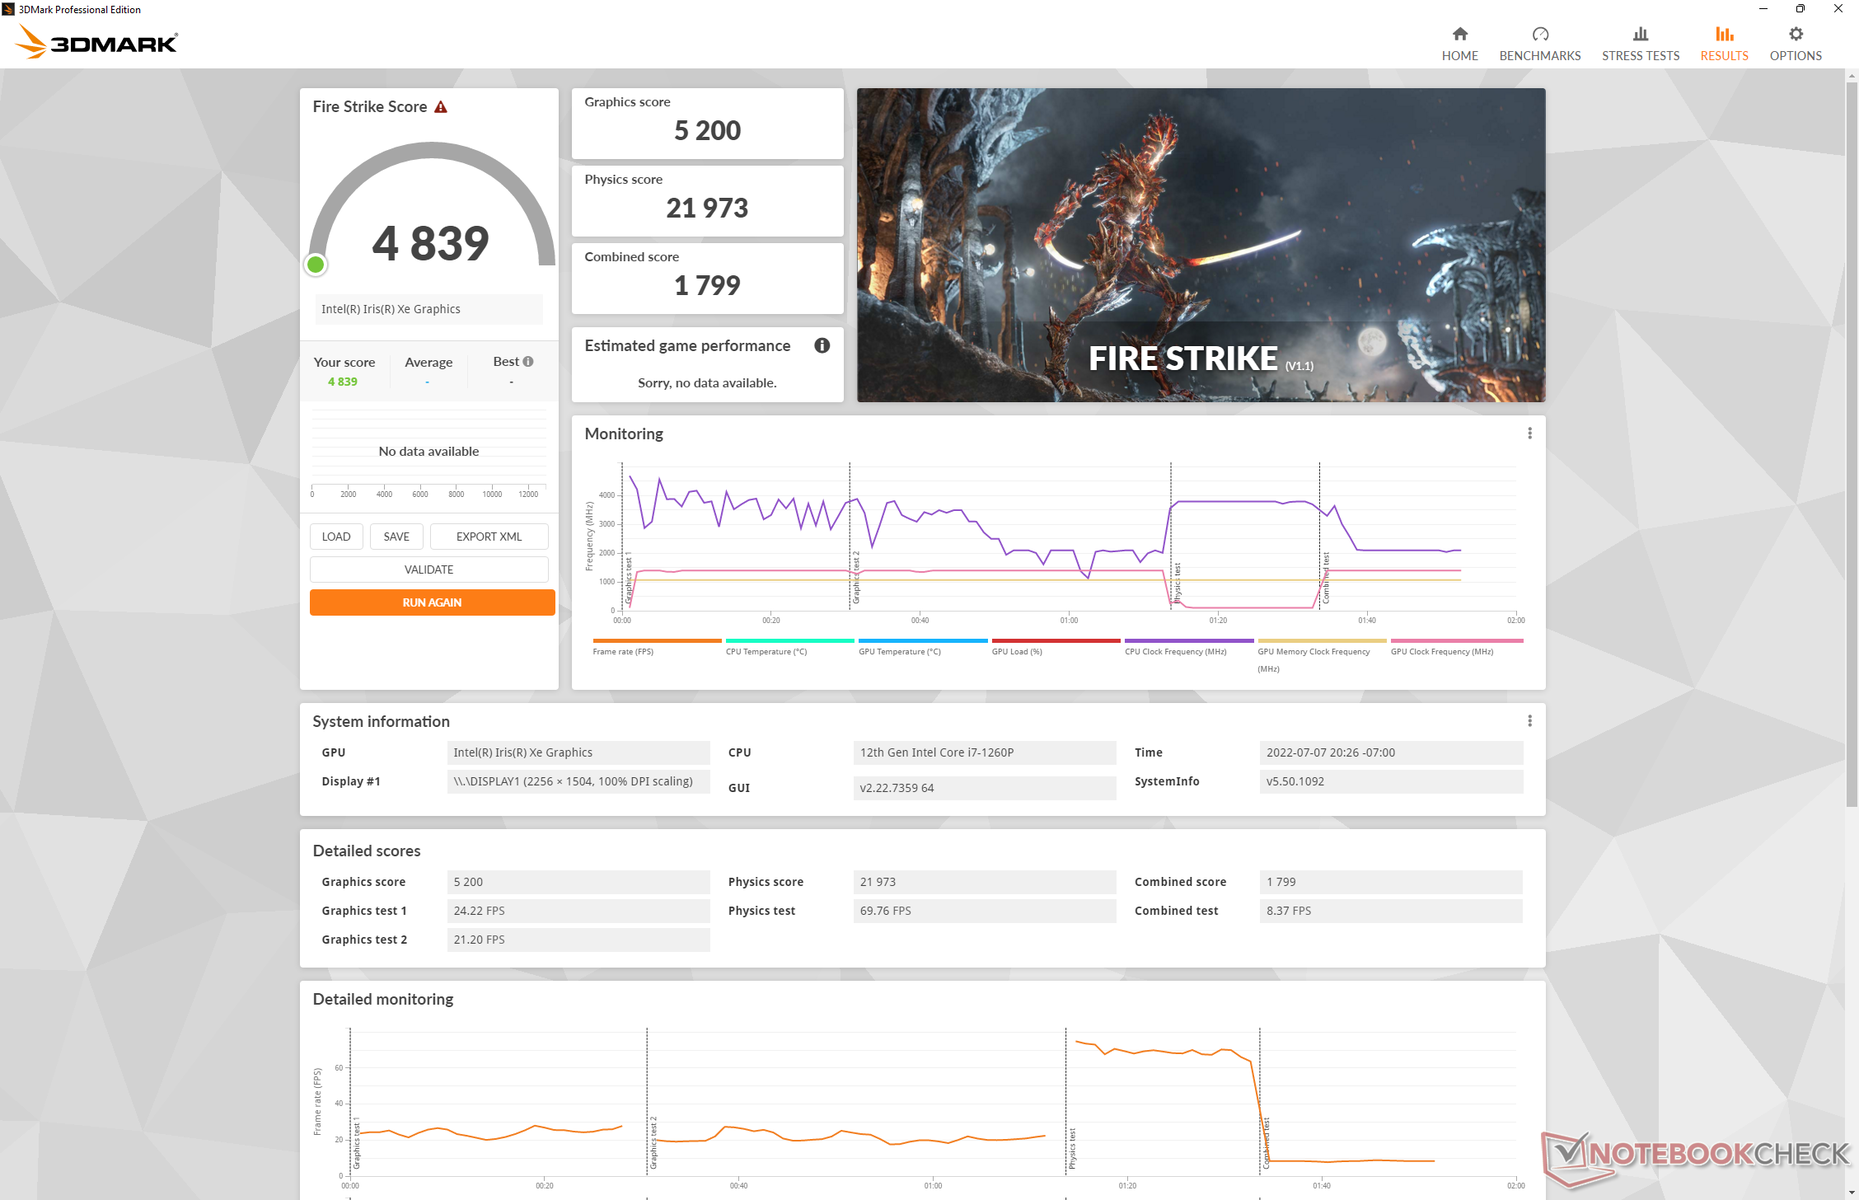
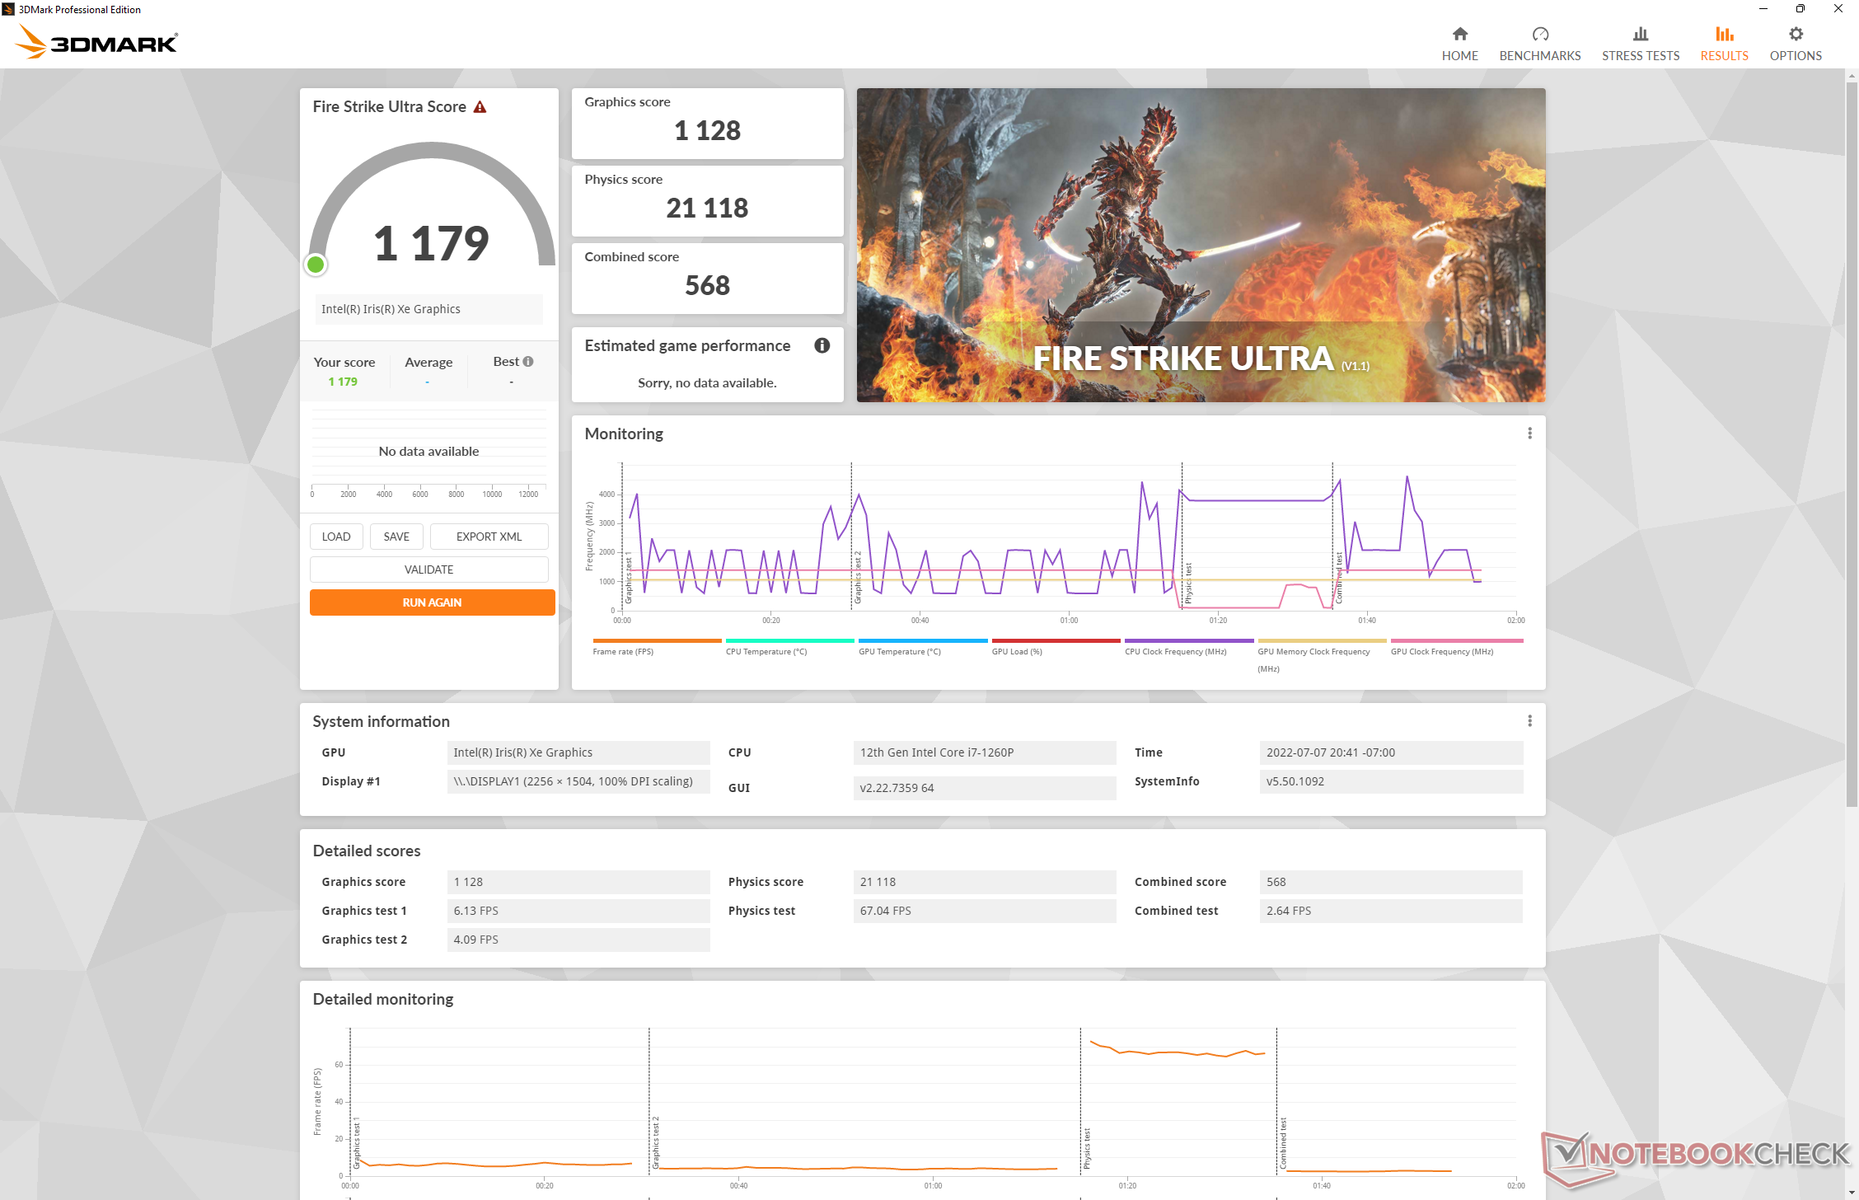
| 3DMark 11 Performance | 7359 points | |
| 3DMark Cloud Gate Standard Score | 22502 points | |
| 3DMark Fire Strike Score | 4839 points | |
| 3DMark Time Spy Score | 1896 points | |
Aide | ||
| Cyberpunk 2077 1.6 | |
| 1920x1080 Low Preset | |
| Asus Zenbook S 13 OLED | |
| Framework Laptop 13.5 12th Gen Intel | |
| Moyenne Intel Iris Xe Graphics G7 96EUs (13 - 25.9, n=42) | |
| 1920x1080 Medium Preset | |
| Asus Zenbook S 13 OLED | |
| Framework Laptop 13.5 12th Gen Intel | |
| Moyenne Intel Iris Xe Graphics G7 96EUs (10.8 - 21.7, n=37) | |
| 1920x1080 High Preset | |
| Asus Zenbook S 13 OLED | |
| Framework Laptop 13.5 12th Gen Intel | |
| Moyenne Intel Iris Xe Graphics G7 96EUs (9.8 - 16.9, n=34) | |
| 1920x1080 Ultra Preset | |
| Asus Zenbook S 13 OLED | |
| Framework Laptop 13.5 12th Gen Intel | |
| Moyenne Intel Iris Xe Graphics G7 96EUs (7.4 - 16.8, n=32) | |
Witcher 3 FPS Chart
| Bas | Moyen | Élevé | Ultra | |
|---|---|---|---|---|
| GTA V (2015) | 117.5 | 96.9 | 20 | 8.36 |
| The Witcher 3 (2015) | 97.5 | 60.5 | 32.3 | 15.1 |
| Dota 2 Reborn (2015) | 121.7 | 90.3 | 62.6 | 57.7 |
| Final Fantasy XV Benchmark (2018) | 42.5 | 23.3 | 23.3 | |
| X-Plane 11.11 (2018) | 62.6 | 45.9 | 41.3 | |
| Strange Brigade (2018) | 90.2 | 39.6 | 32.6 | 26.2 |
| Cyberpunk 2077 1.6 (2022) | 21.9 | 18.5 | 13.7 | 11.2 |
Émissions
Bruit du système
Le bruit du ventilateur reste plus fort que sur la plupart des autres Ultrabooks, en particulier en cas de charge. En exécutant la première scène de benchmark de 3DMark 06 pour simuler des charges moyennes, le bruit du ventilateur serait de 47 dB(A), ce qui en fait l'un des ordinateurs portables de la série U les plus bruyants que nous ayons testés. Si vous jouez, le bruit du ventilateur a tendance à osciller entre 41 et 47 dB(A). Attendez-vous à un système bruyant si vous avez l'intention d'exécuter des charges exigeantes pour exploiter les performances rapides du processeur.
Si vous exécutez des charges moins exigeantes comme la navigation ou le streaming vidéo, le bruit du ventilateur a tendance à rester en dessous de 28 dB(A) contre un fond silencieux de 22,8 dB(A). Les pulsations du ventilateur dans cette plage ne sont pas assez fortes pour être gênantes.
Degré de la nuisance sonore
| Au repos |
| 23 / 23 / 23 dB(A) |
| Fortement sollicité |
| 47.3 / 49.8 dB(A) |
 | ||
30 dB silencieux 40 dB(A) audible 50 dB(A) bruyant |
||
min: | ||
| Framework Laptop 13.5 12th Gen Intel Iris Xe G7 96EUs, i7-1260P, WDC PC SN730 SDBPNTY-512G | Framework Laptop 13.5 Iris Xe G7 96EUs, i7-1165G7, Western Digital WD_BLACK SN850 WDS100T1X0E | Lenovo ThinkPad X1 Titanium Yoga G1 20QB0016GE Iris Xe G7 80EUs, i5-1140G7, Lenovo UMIS RPJTJ256MEE1OWX | Microsoft Surface Laptop 4 13 Ryzen 5 Vega 7, R5 4680U, Samsung PM991 MZ9LQ256HBJQ | HP Spectre x360 14-ea0378ng Iris Xe G7 96EUs, i7-1165G7, Intel Optane Memory H10 with Solid State Storage 32GB + 1TB HBRPEKNX0203AH(L/H) | |
|---|---|---|---|---|---|
| Noise | -1% | -2% | 1% | -1% | |
| arrêt / environnement * (dB) | 22.8 | 23.9 -5% | 25.61 -12% | 24.6 -8% | 26 -14% |
| Idle Minimum * (dB) | 23 | 23.9 -4% | 25.61 -11% | 24.6 -7% | 26 -13% |
| Idle Average * (dB) | 23 | 23.9 -4% | 25.61 -11% | 24.6 -7% | 26 -13% |
| Idle Maximum * (dB) | 23 | 23.9 -4% | 25.61 -11% | 24.6 -7% | 26 -13% |
| Load Average * (dB) | 47.3 | 45.6 4% | 40.14 15% | 39.5 16% | 37.5 21% |
| Witcher 3 ultra * (dB) | 47.3 | 47.1 -0% | |||
| Load Maximum * (dB) | 49.8 | 47.9 4% | 40.14 19% | 39.5 21% | 36.3 27% |
* ... Moindre est la valeur, meilleures sont les performances
Température
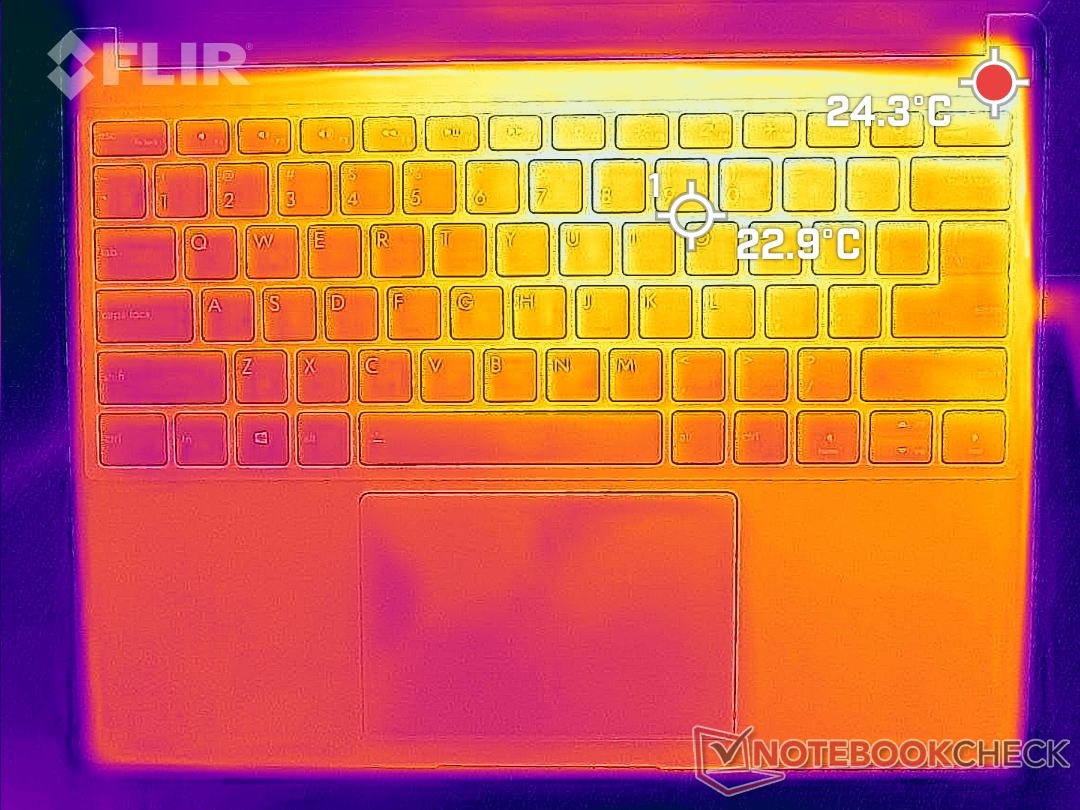
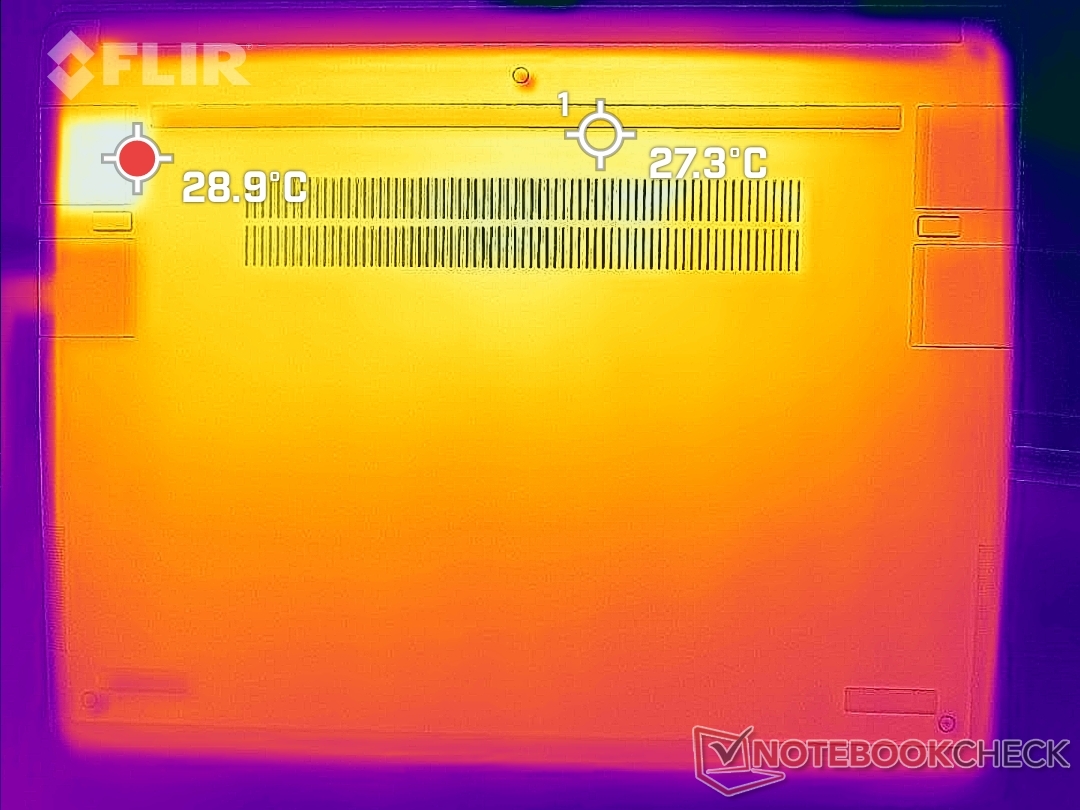
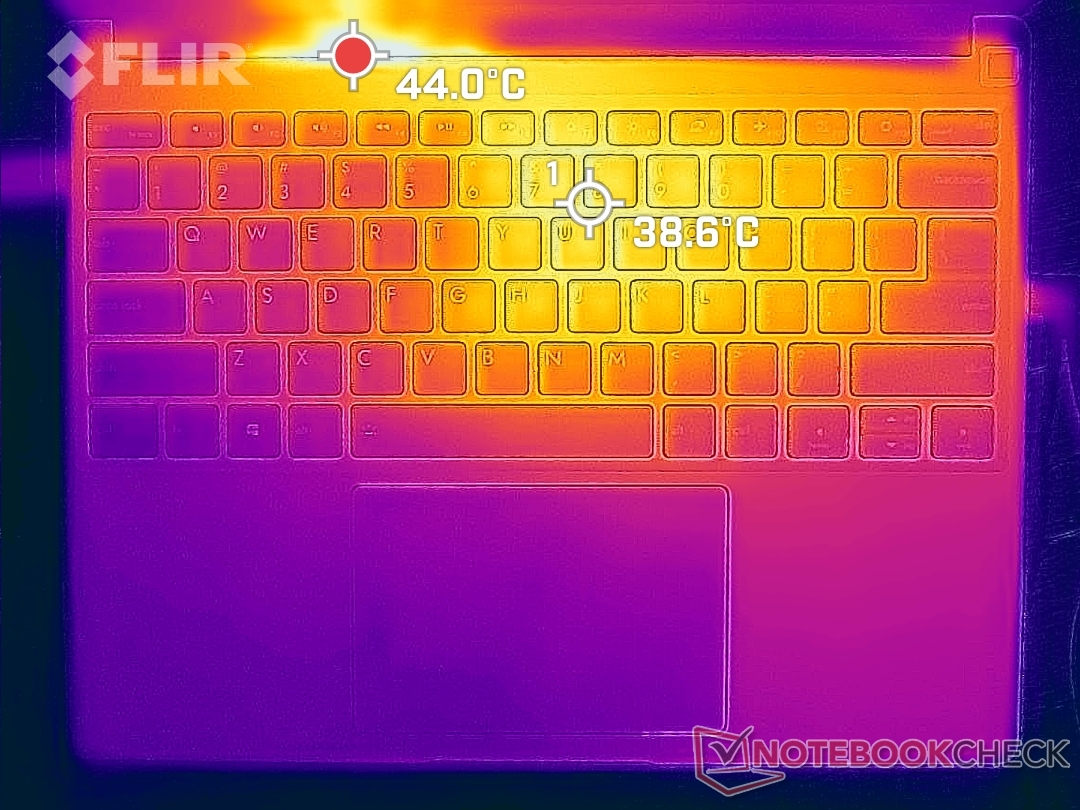
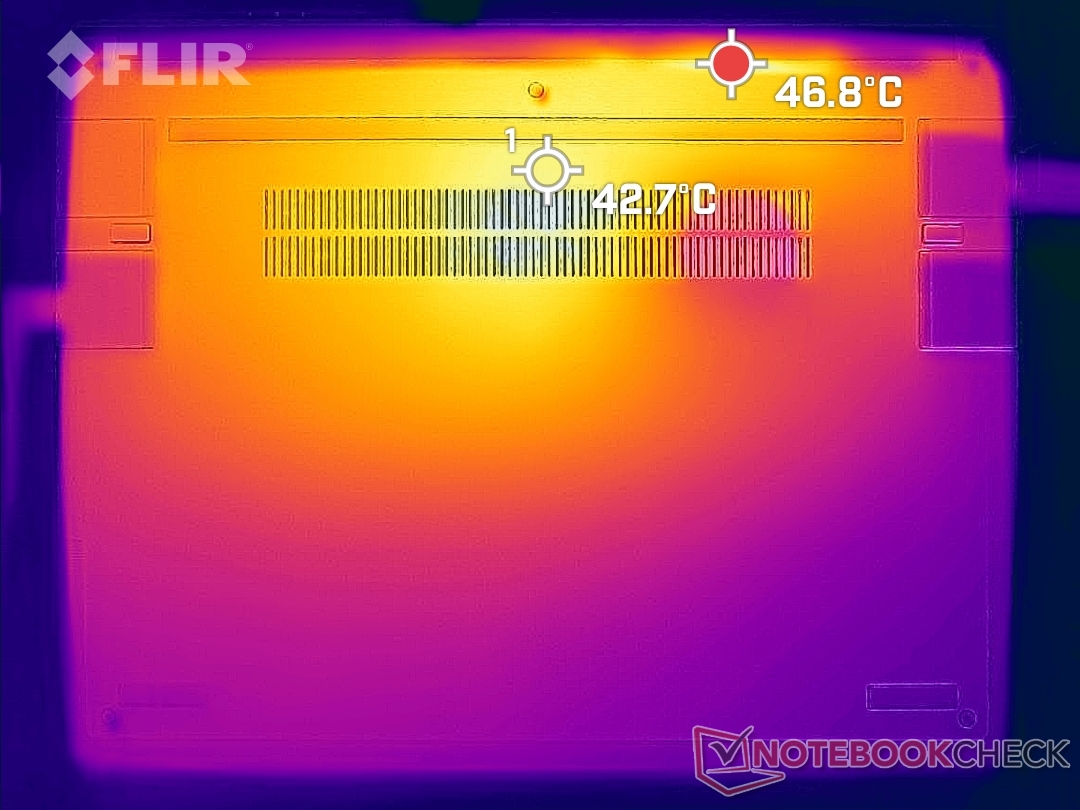
Les points chauds de la surface peuvent atteindre 39 C et 43 C en haut et en bas, respectivement, contre 45 C et 46 C sur le Surface Laptop 4 13 ou 40 C et 51 C sur le HP Spectre x360 14. La température n'est pas assez élevée pour être gênante, mais elle est certainement perceptible pendant l'utilisation. Des grilles de ventilation plus grandes sur le fond auraient pu potentiellement améliorer les thermiques.
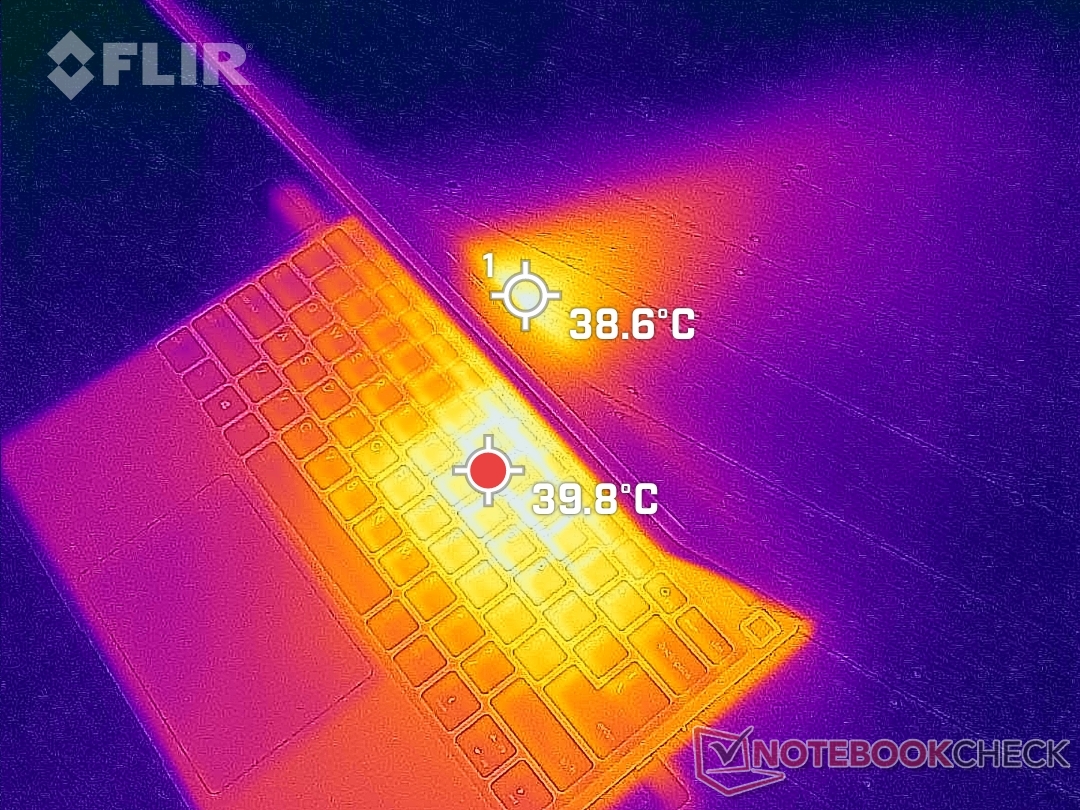
(+) La température maximale du côté supérieur est de 36.8 °C / 98 F, par rapport à la moyenne de 34.3 °C / 94 F, allant de 21.2 à 62.5 °C pour la classe Office.
(±) Le fond chauffe jusqu'à un maximum de 42.4 °C / 108 F, contre une moyenne de 36.8 °C / 98 F
(+) En utilisation inactive, la température moyenne du côté supérieur est de 21.2 °C / 70 F, par rapport à la moyenne du dispositif de 29.5 °C / 85 F.
(+) Les repose-poignets et le pavé tactile sont plus froids que la température de la peau avec un maximum de 24.4 °C / 75.9 F et sont donc froids au toucher.
(+) La température moyenne de la zone de l'appui-paume de dispositifs similaires était de 27.5 °C / 81.5 F (+3.1 °C / #5.6 F).
| Framework Laptop 13.5 12th Gen Intel Intel Core i7-1260P, Intel Iris Xe Graphics G7 96EUs | Framework Laptop 13.5 Intel Core i7-1165G7, Intel Iris Xe Graphics G7 96EUs | Lenovo ThinkPad X1 Titanium Yoga G1 20QB0016GE Intel Core i5-1140G7, Intel Iris Xe Graphics G7 80EUs | HP EliteBook Folio 13.5-3G2L2EA Qualcomm Snapdragon 8cx Gen 2 5G, Qualcomm Adreno 680 | Microsoft Surface Laptop 4 13 Ryzen 5 AMD Ryzen 5 4680U, AMD Radeon RX Vega 7 | HP Spectre x360 14-ea0378ng Intel Core i7-1165G7, Intel Iris Xe Graphics G7 96EUs | |
|---|---|---|---|---|---|---|
| Heat | -5% | -9% | 8% | -6% | -6% | |
| Maximum Upper Side * (°C) | 36.8 | 47.2 -28% | 46.3 -26% | 34.3 7% | 45.8 -24% | 37.1 -1% |
| Maximum Bottom * (°C) | 42.4 | 39.4 7% | 43.3 -2% | 35.4 17% | 45.5 -7% | 43.1 -2% |
| Idle Upper Side * (°C) | 24.2 | 25.2 -4% | 26.8 -11% | 25.7 -6% | 24.9 -3% | 29 -20% |
| Idle Bottom * (°C) | 29 | 27.8 4% | 28.3 2% | 25.1 13% | 25.7 11% | 28.6 1% |
* ... Moindre est la valeur, meilleures sont les performances
Test de stress
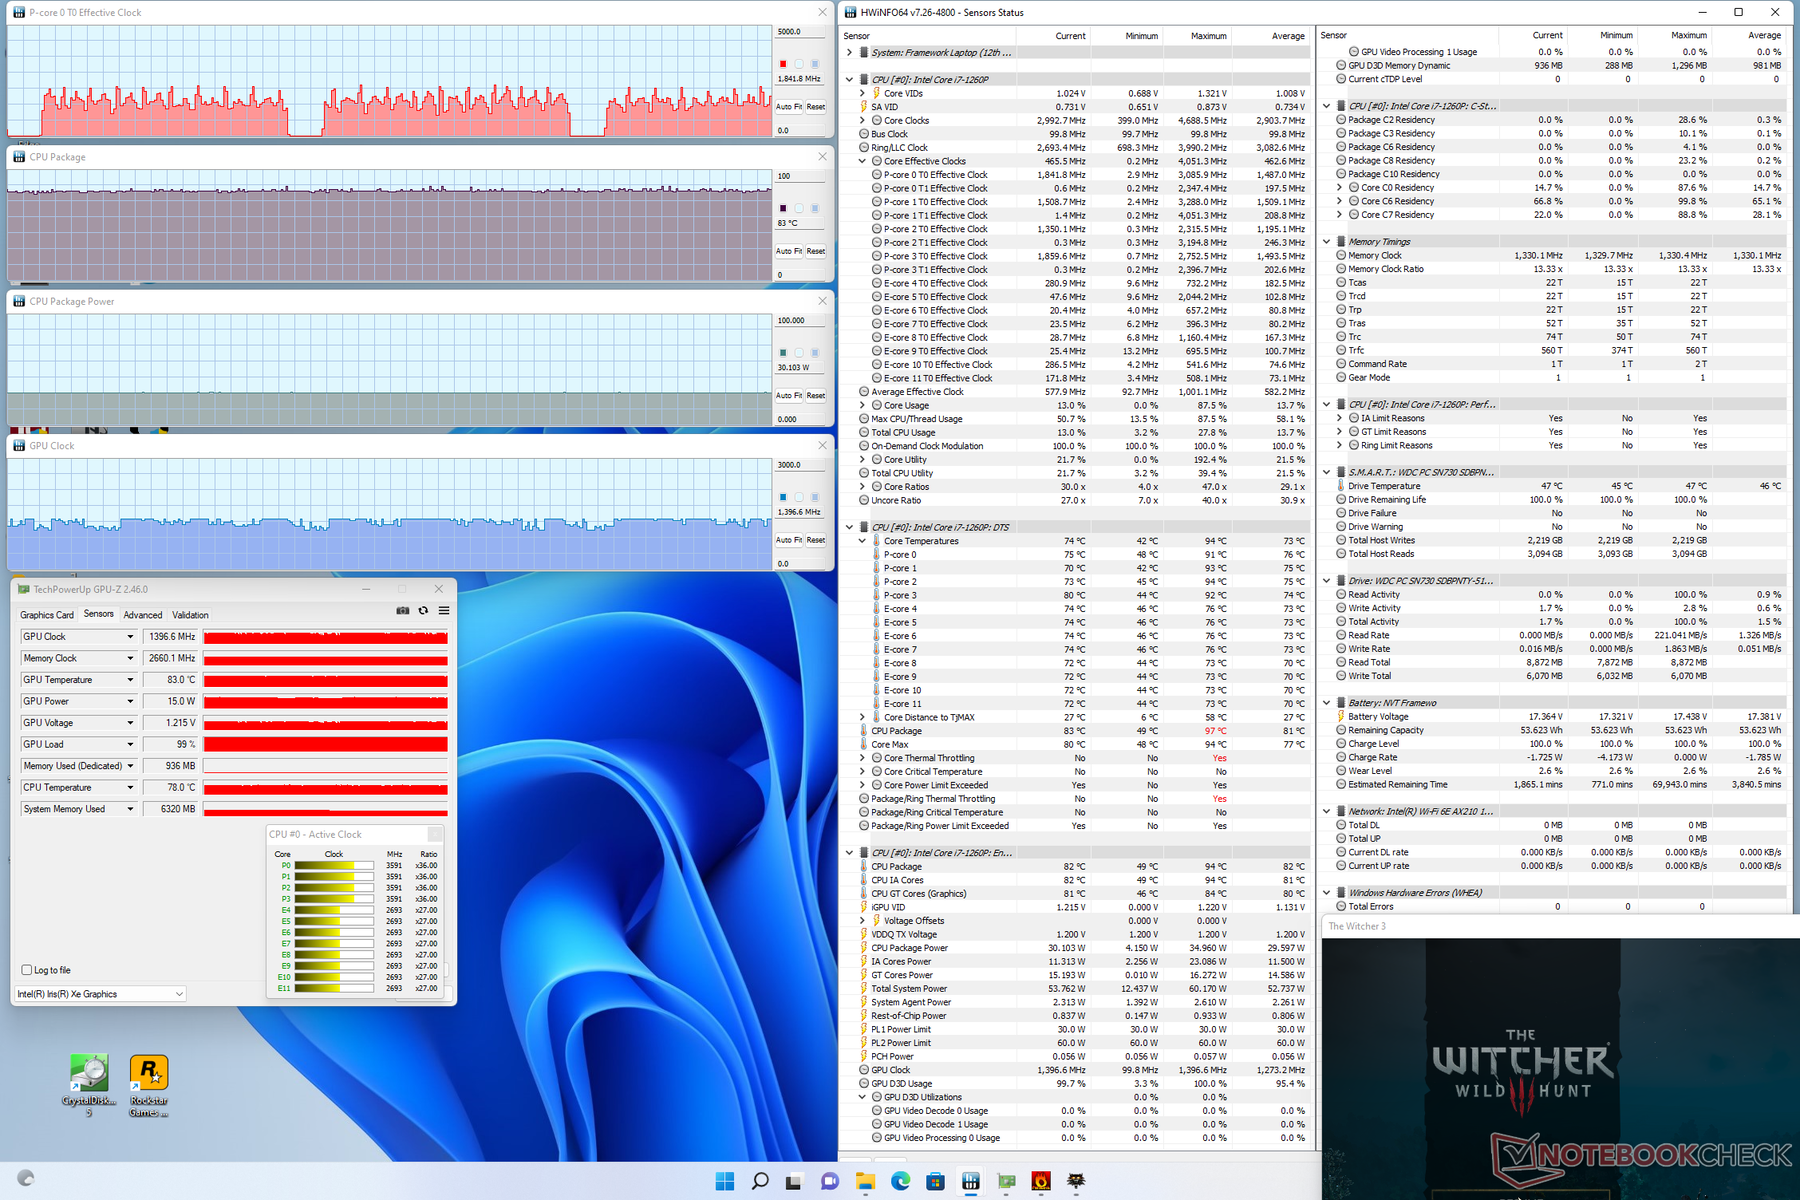
Lors de l'exécution de Prime95, les fréquences d'horloge du processeur augmentent à 3,5 GHz pendant les 10 premières secondes environ, jusqu'à atteindre une température centrale de 94 °C. Les fréquences d'horloge et la puissance du processeur baissent ensuite dans la plage de 2,4 à 2,6 GHz et de 52 W à 30 W, respectivement, afin de maintenir une température centrale plus fraîche de 87 °C. Les températures centrales globales sont toujours sensiblement plus élevées que celles que nous avons enregistrées sur le modèle de l'année dernière, qui se stabilisait à 82 °C dans des conditions similaires.
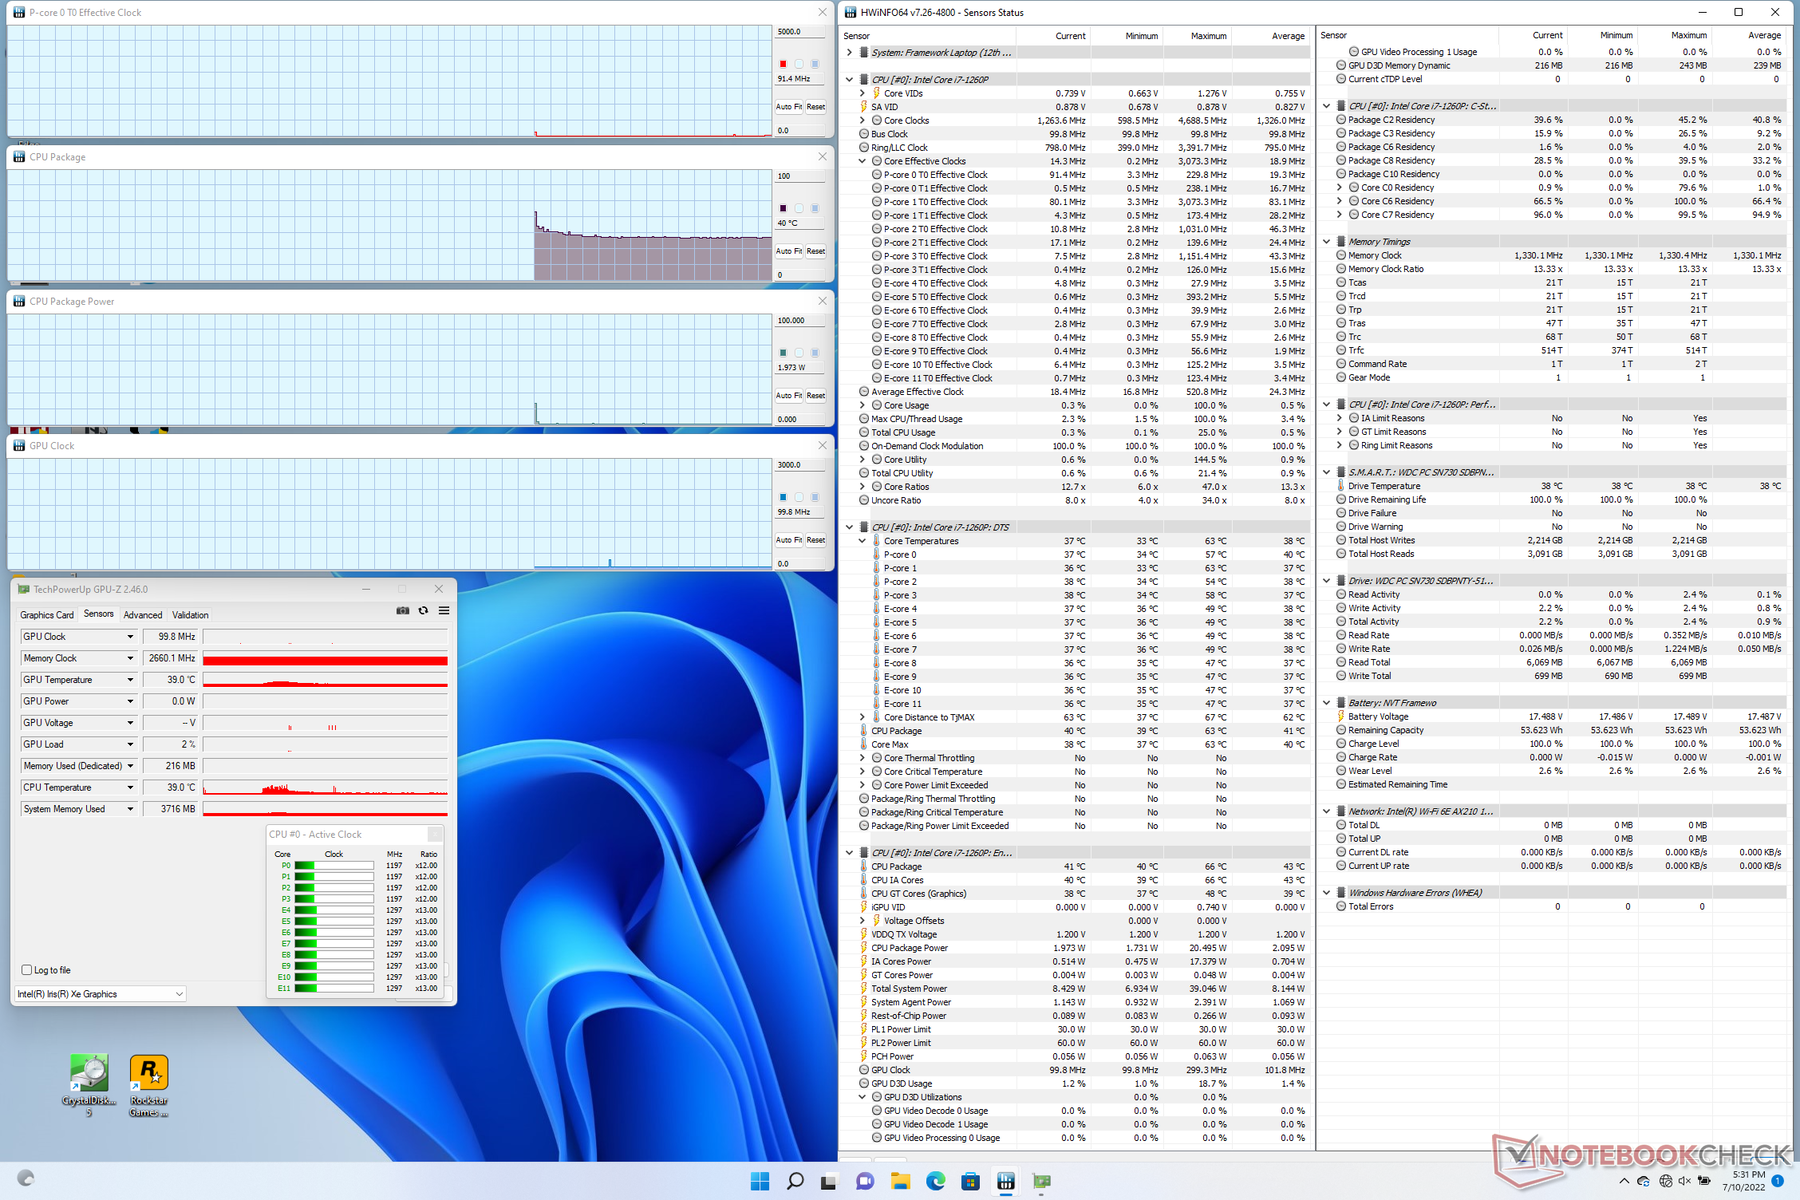
Lorsque vous exécutez Witcher 3 pour représenter les charges de jeu, la température du cœur est à nouveau plus élevée que sur le modèle de l'année dernière (83 C contre 73 C).
Le fonctionnement sur batterie peut avoir un léger impact sur les performances du processeur. Un test 3DMark 11 sur batterie donnerait des scores de physique et de graphisme de 14919 et 6604 points, respectivement, contre 17183 et 6779 points sur le secteur.
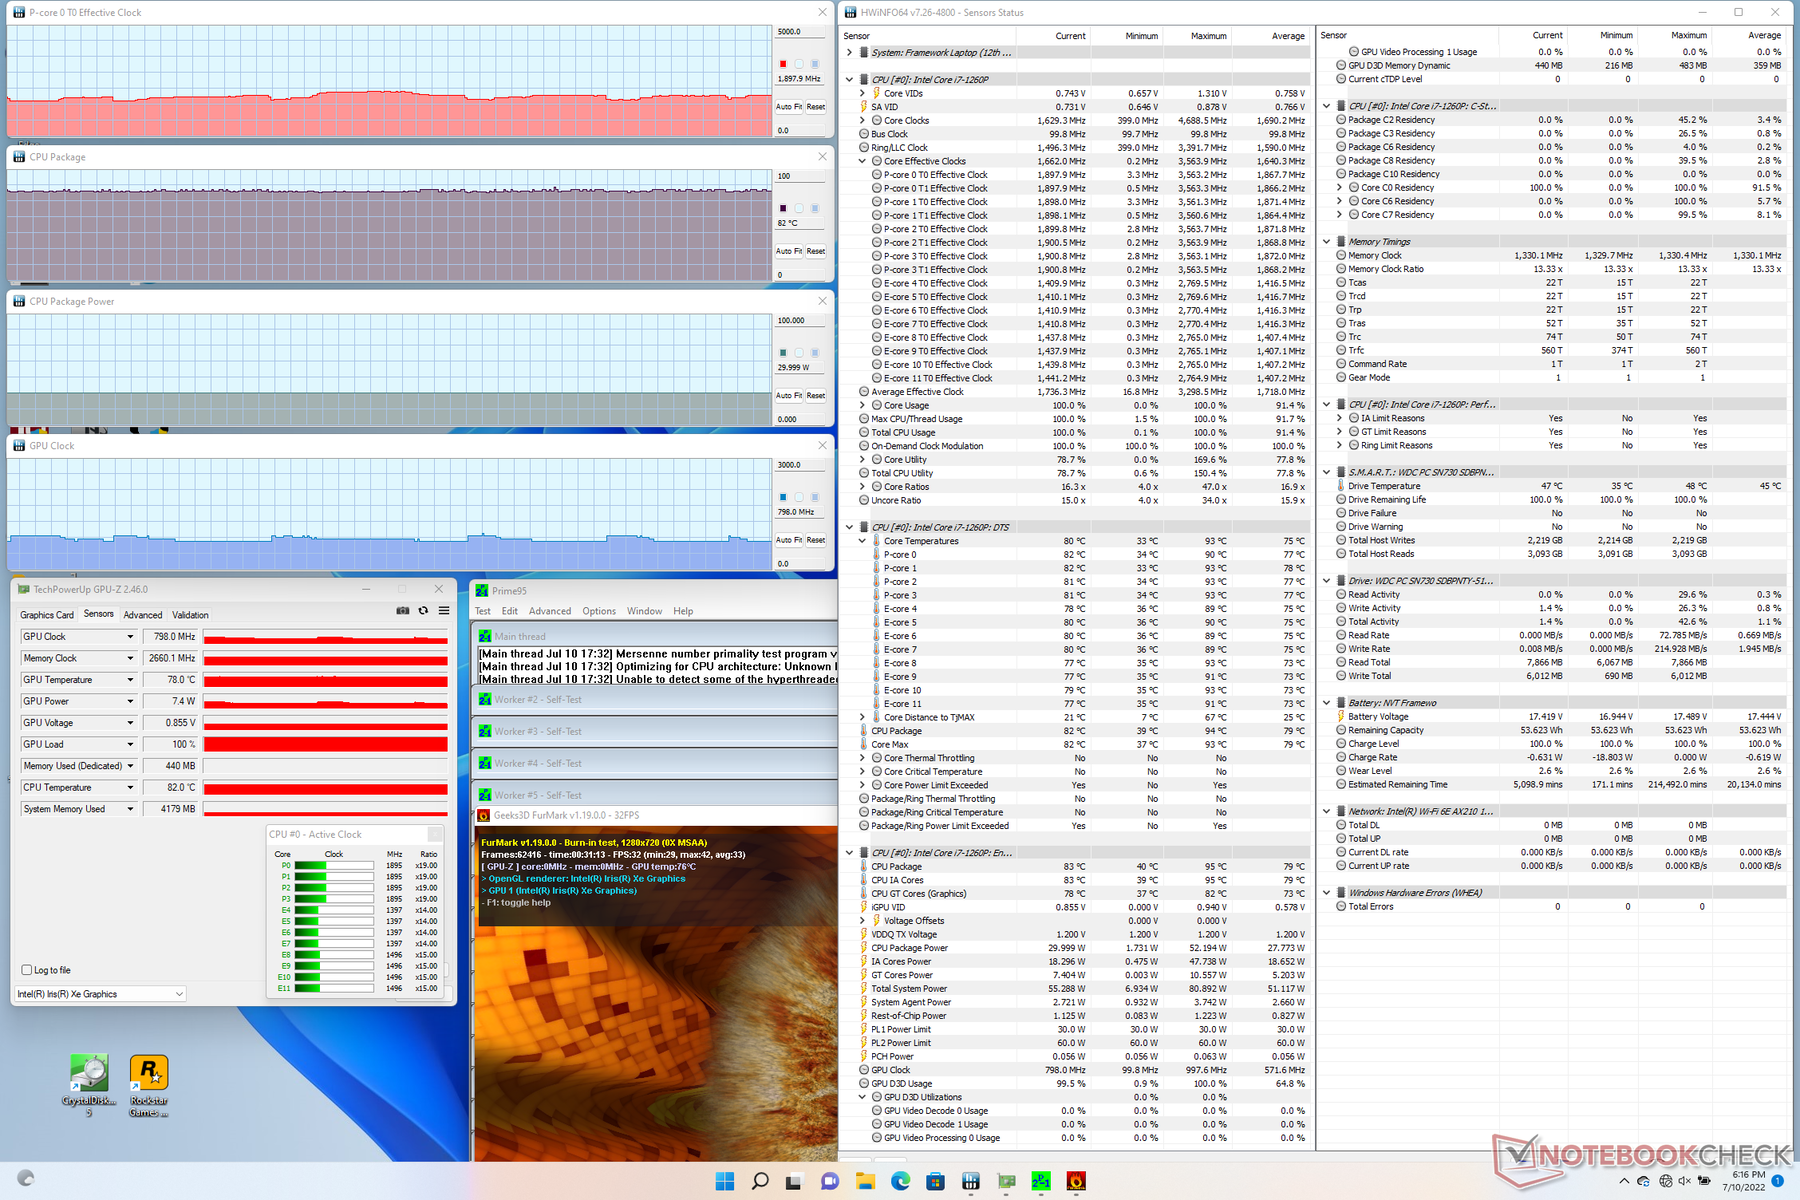
| Fréquence du CPU (GHz) | Fréquence du GPU (MHz) | Température moyenne du CPU (°C) | |
| Système au repos | -- | -- | 40 |
| Prime95 Stress | 2.4 - 2.6 | -- | 87 |
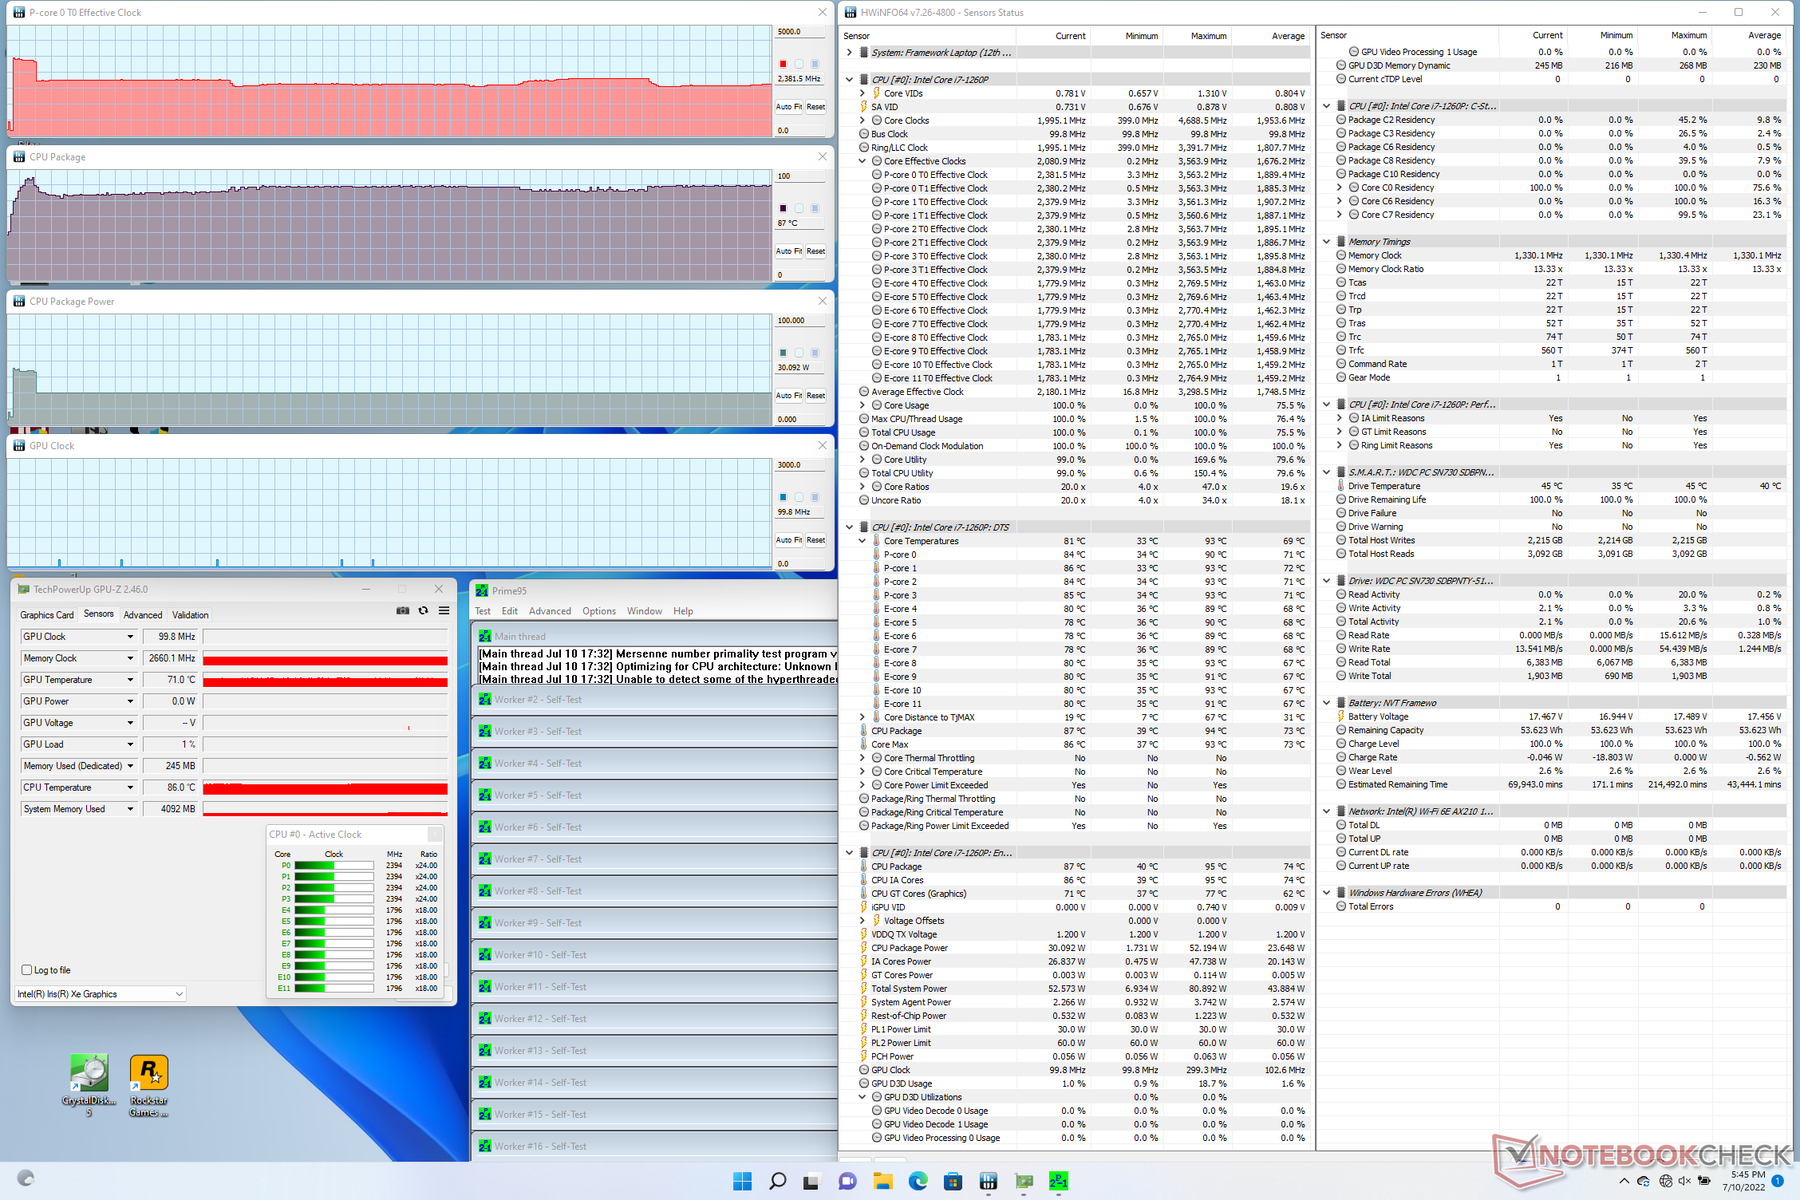
| Prime95 + FurMark Stress | 1.7 - 1.9 | 0.8 - 0.9 | 82 |
| Witcher 3 Stress | ~1.8 | 1396 | 83 |
Haut-parleurs
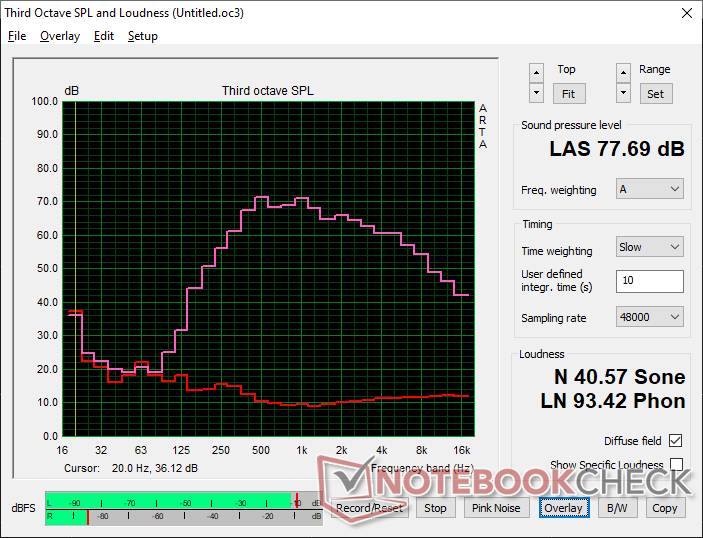
Framework Laptop 13.5 12th Gen Intel analyse audio
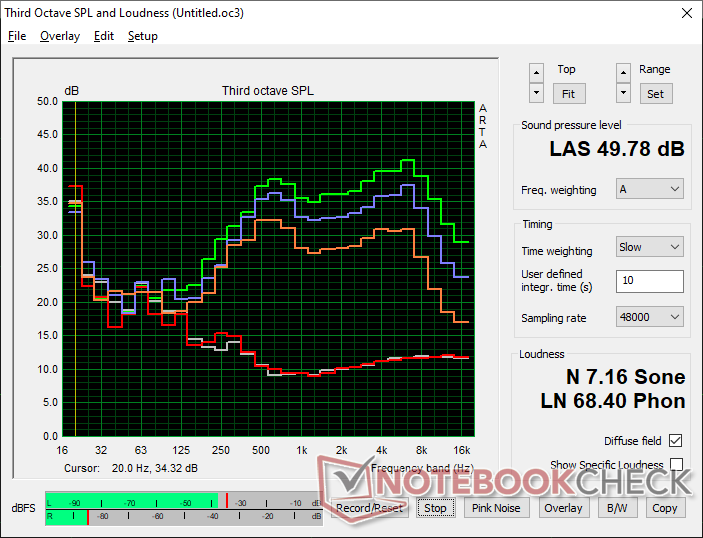
(±) | le niveau sonore du haut-parleur est moyen mais bon (77.7# dB)
Basses 100 - 315 Hz
(-) | presque aucune basse - en moyenne 16.1% plus bas que la médiane
(±) | la linéarité des basses est moyenne (14.3% delta à la fréquence précédente)
Médiums 400 - 2000 Hz
(±) | médiane supérieure - en moyenne 7.5% supérieure à la médiane
(+) | les médiums sont linéaires (5.9% delta à la fréquence précédente)
Aiguës 2 - 16 kHz
(+) | des sommets équilibrés - à seulement 4% de la médiane
(+) | les aigus sont linéaires (5% delta à la fréquence précédente)
Globalement 100 - 16 000 Hz
(±) | la linéarité du son global est moyenne (20.7% de différence avec la médiane)
Par rapport à la même classe
» 48% de tous les appareils testés de cette catégorie étaient meilleurs, 10% similaires, 42% pires
» Le meilleur avait un delta de 7%, la moyenne était de 21%, le pire était de 53%.
Par rapport à tous les appareils testés
» 56% de tous les appareils testés étaient meilleurs, 8% similaires, 36% pires
» Le meilleur avait un delta de 4%, la moyenne était de 23%, le pire était de 134%.
Apple MacBook Pro 16 2021 M1 Pro analyse audio
(+) | les haut-parleurs peuvent jouer relativement fort (84.7# dB)
Basses 100 - 315 Hz
(+) | bonne basse - seulement 3.8% loin de la médiane
(+) | les basses sont linéaires (5.2% delta à la fréquence précédente)
Médiums 400 - 2000 Hz
(+) | médiane équilibrée - seulement 1.3% de la médiane
(+) | les médiums sont linéaires (2.1% delta à la fréquence précédente)
Aiguës 2 - 16 kHz
(+) | des sommets équilibrés - à seulement 1.9% de la médiane
(+) | les aigus sont linéaires (2.7% delta à la fréquence précédente)
Globalement 100 - 16 000 Hz
(+) | le son global est linéaire (4.6% différence à la médiane)
Par rapport à la même classe
» 0% de tous les appareils testés de cette catégorie étaient meilleurs, 0% similaires, 100% pires
» Le meilleur avait un delta de 5%, la moyenne était de 17%, le pire était de 45%.
Par rapport à tous les appareils testés
» 0% de tous les appareils testés étaient meilleurs, 0% similaires, 100% pires
» Le meilleur avait un delta de 4%, la moyenne était de 23%, le pire était de 134%.
Gestion de l'énergie
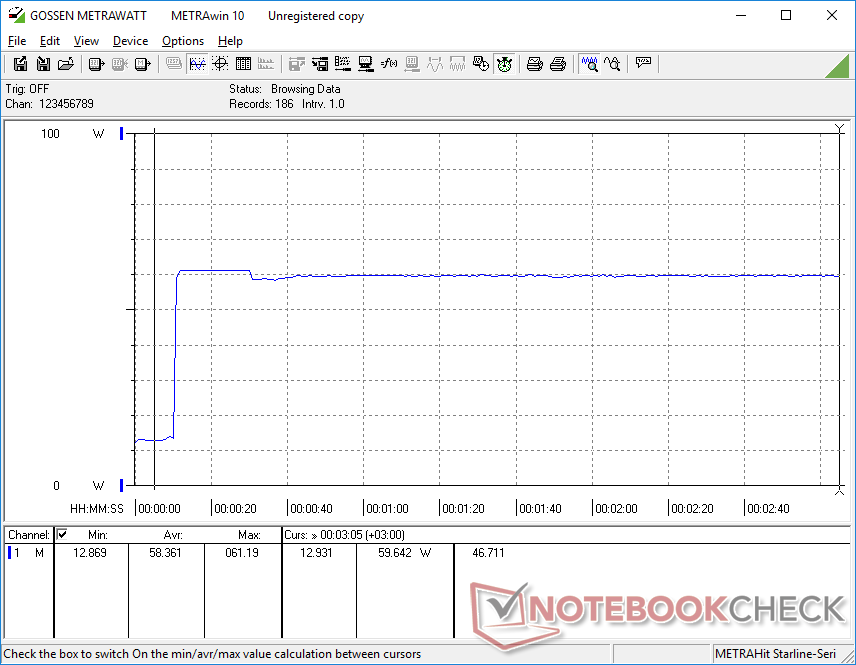
Consommation d'énergie
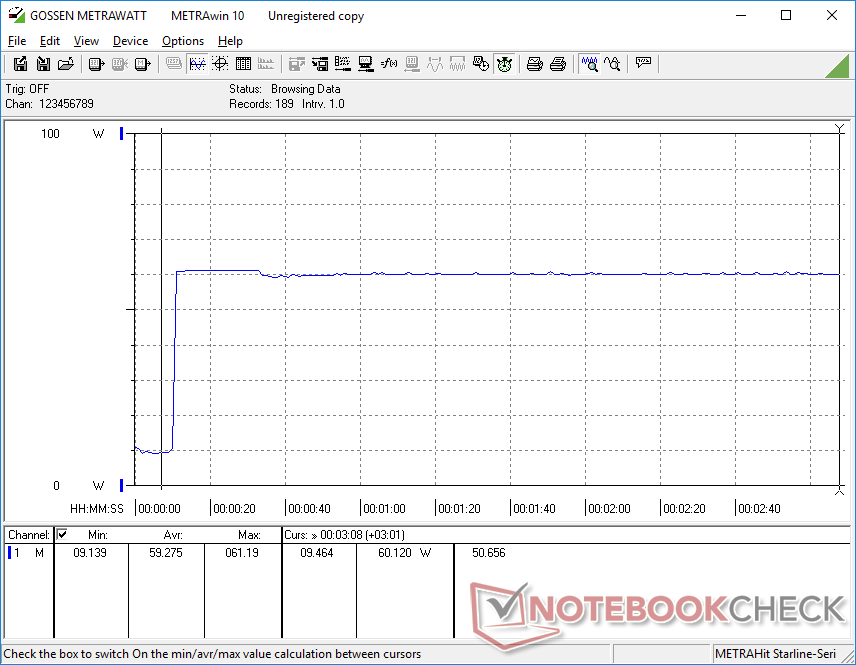
Comme on pouvait s'y attendre d'un système Alder Lake-P de 12e génération, la consommation d'énergie globale est plus élevée que celle de nombreux ordinateurs portables équipés de processeurs Tiger Lake-U de 11e génération, y compris le modèle Framework de l'année dernière. L'exécution de Prime95 consommerait 60 W pour être 25 % plus exigeant d'une année sur l'autre. Les performances supérieures du processeur ne sont pas gratuites à cet égard
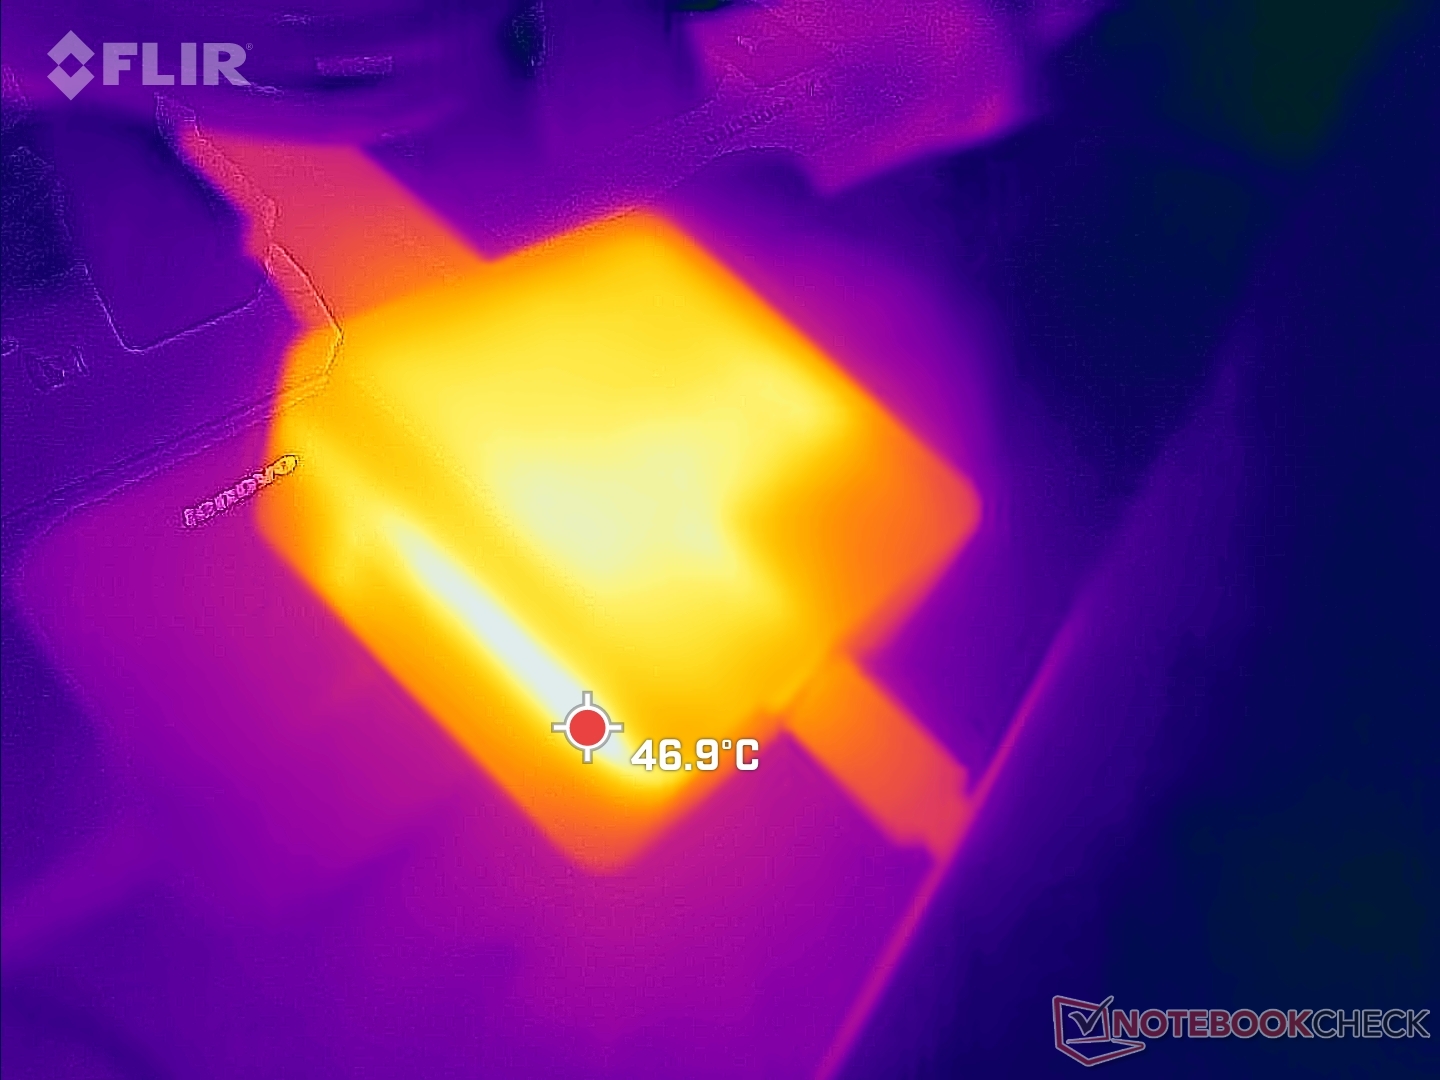
Nous avons pu enregistrer une consommation maximale de 61,2 W sur le petit (~5,8 x 5,8 x 2,7 cm) adaptateur secteur de 60 W lors de l'exécution de charges Prime95. Le fabricant n'a apporté aucune modification à l'adaptateur secteur, même si le processeur plus récent est plus exigeant cette année. Un adaptateur secteur de plus grande capacité aurait pu permettre une meilleure performance Turbo Boost ou une charge plus rapide lors de l'exécution de charges exigeantes. Le siteGPD Win Max 2par exemple, est équipé du même processeur Core i7-1260P et pourtant il est livré avec un adaptateur secteur de 100W.

| Éteint/en veille | |
| Au repos | |
| Fortement sollicité |
|
Légende:
min: | |
| Framework Laptop 13.5 12th Gen Intel i7-1260P, Iris Xe G7 96EUs, WDC PC SN730 SDBPNTY-512G, IPS, 2256x1504, 13.5" | Framework Laptop 13.5 i7-1165G7, Iris Xe G7 96EUs, Western Digital WD_BLACK SN850 WDS100T1X0E, IPS, 2256x1504, 13.5" | Lenovo ThinkPad X1 Titanium Yoga G1 20QB0016GE i5-1140G7, Iris Xe G7 80EUs, Lenovo UMIS RPJTJ256MEE1OWX, IPS LED, 2256x1504, 13.5" | HP EliteBook Folio 13.5-3G2L2EA SD 8cx Gen 2 5G, Adreno 680, Toshiba XG6 KXG60ZNV512G, IPS, 1920x1280, 13.5" | Microsoft Surface Laptop 4 13 Ryzen 5 R5 4680U, Vega 7, Samsung PM991 MZ9LQ256HBJQ, IPS, 2256x1504, 13.5" | HP Spectre x360 14-ea0378ng i7-1165G7, Iris Xe G7 96EUs, Intel Optane Memory H10 with Solid State Storage 32GB + 1TB HBRPEKNX0203AH(L/H), OLED, 3000x2000, 13.5" | |
|---|---|---|---|---|---|---|
| Power Consumption | 12% | 31% | 60% | 24% | 3% | |
| Idle Minimum * (Watt) | 5.3 | 4.3 19% | 3.75 29% | 2.3 57% | 3.4 36% | 6.3 -19% |
| Idle Average * (Watt) | 8.4 | 8.2 2% | 7.75 8% | 3.7 56% | 6.3 25% | 11.2 -33% |
| Idle Maximum * (Watt) | 11.2 | 8.7 22% | 8.69 22% | 5.6 50% | 8.1 28% | 13.3 -19% |
| Load Average * (Watt) | 57.4 | 43.5 24% | 33.12 42% | 13 77% | 36.2 37% | 32 44% |
| Witcher 3 ultra * (Watt) | 46.7 | 43.5 7% | 28.7 39% | |||
| Load Maximum * (Watt) | 61.2 | 61.8 -1% | 35.19 43% | 25 59% | 64.1 -5% | 35.6 42% |
* ... Moindre est la valeur, meilleures sont les performances
Power Consumption Witcher 3 / Stresstest
Power Consumption external Monitor
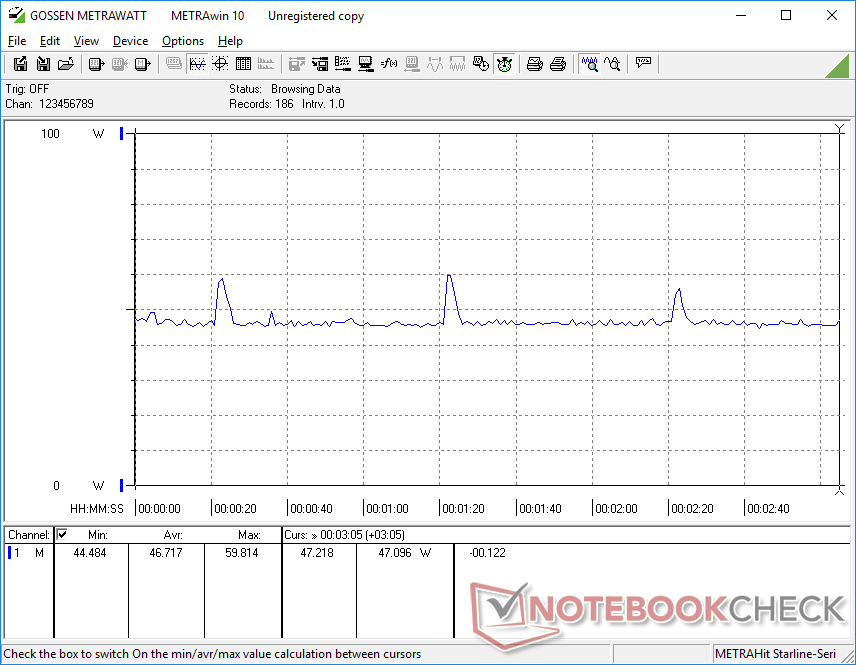
Autonomie de la batterie
Les durées d'exécution sont plus courtes d'à peine une demi-heure par rapport au modèle de l'année dernière, malgré les performances beaucoup plus rapides du processeur. 7.5 heures d'utilisation réelle du WLAN devraient suffire à la majorité des utilisateurs, même si c'est plusieurs heures de moins que sur le Surface Laptop 4 13
La charge de l'adaptateur secteur inclus, de l'état vide à l'état plein, prend environ 90 minutes. Cependant, la charge ralentira considérablement lors de l'exécution de charges exigeantes en raison de l'adaptateur secteur de 60 W, comme mentionné ci-dessus.
| Framework Laptop 13.5 12th Gen Intel i7-1260P, Iris Xe G7 96EUs, 55 Wh | Framework Laptop 13.5 i7-1165G7, Iris Xe G7 96EUs, 55 Wh | Lenovo ThinkPad X1 Titanium Yoga G1 20QA001RGE i7-1160G7, Iris Xe G7 96EUs, 44.5 Wh | HP EliteBook Folio 13.5-3G2L2EA SD 8cx Gen 2 5G, Adreno 680, 46 Wh | Microsoft Surface Laptop 4 13 Ryzen 5 R5 4680U, Vega 7, 47.4 Wh | HP Spectre x360 14-ea0378ng i7-1165G7, Iris Xe G7 96EUs, 66 Wh | |
|---|---|---|---|---|---|---|
| Autonomie de la batterie | 7% | 12% | 95% | 45% | 4% | |
| WiFi v1.3 (h) | 7.5 | 8 7% | 8.4 12% | 14.6 95% | 10.9 45% | 7.8 4% |
| H.264 (h) | 11.4 | 11.1 | ||||
| Load (h) | 1.9 | 4.2 | 2.6 | |||
| Reader / Idle (h) | 13.4 |
Points positifs
Points négatifs
Verdict - Une solution à long terme
Framework avait promis que la conception de ses ordinateurs portables permettrait des mises à niveau faciles dès que la dernière génération de processeurs serait disponible. C'est exactement ce qu'a fait le modèle 2022, avec des kits de mise à niveau de carte mère pour les propriétaires existants ou des configurations prêtes à l'emploi pour les nouveaux venus qui veulent monter à bord. Par rapport au modèle 2021 équipé d'un processeur Intel de 11e génération, le modèle 2022 peut offrir une augmentation des performances du processeur allant jusqu'à 90 %, ce que les passionnés peuvent certainement apprécier. Cela se fait au prix d'une température du cœur plus élevée et d'une durée de vie de la batterie légèrement plus courte, mais les compromis peuvent en valoir la peine en fonction des scénarios d'utilisation.
En dehors de la mise à niveau du processeur, l'expérience reste la même, ce qui peut être à la fois bon et mauvais. C'est une bonne chose pour la cohérence et la prévisibilité garanties entre les mises à jour annuelles, mais c'est aussi une mauvaise chose car certains inconvénients ne peuvent pas être corrigés très facilement. Les Ultrabooks les plus récents comme ceux d'Asuspar exemple, commencent à être livrés avec des écrans Intel/AMD et des écrans OLED à taux de rafraîchissement élevé, alors que le modèle Framework continue à n'avoir qu'une seule option d'affichage et aucun CPU Ryzen. La base et le couvercle sont toujours plus susceptibles de grincer et de se tordre que les modèles phares de Dell, HP ou Lenovo. Nous aimerions voir des options WAN et IR, peut-être sous la forme d'une carte d'extension si les modifications de la carte mère interne ne sont pas possibles. L'inclusion de certaines de ces fonctionnalités pourrait être difficile car le fabricant est limité à la conception de son châssis et à ses pièces d'origine 2021.
Même avec les défis perçus à l'esprit, ils n'enlèvent rien à la personnalisation élevée ou à la conception conviviale du Framework Laptop. Les propriétaires qui apprécient la réparabilité et la facilité d'obtention de pièces de rechange pour leurs produits coûteux trouveront le Framework Laptop moins frustrant à utiliser qu'une alternative fermée comme le Surface Laptop.
Prix et disponibilité
Framework est et prend maintenant les commandes pour son ordinateur portable Intel de 12e génération à partir de 1050 USD pour la version Core i5 ou 1450 USD pour notre configuration d'examen.
Framework Laptop 13.5 12th Gen Intel
- 07/12/2022 v7 (old)
Allen Ngo
Price comparison

