Test du HP Spectre x360 14 : un coup de cœur immédiat
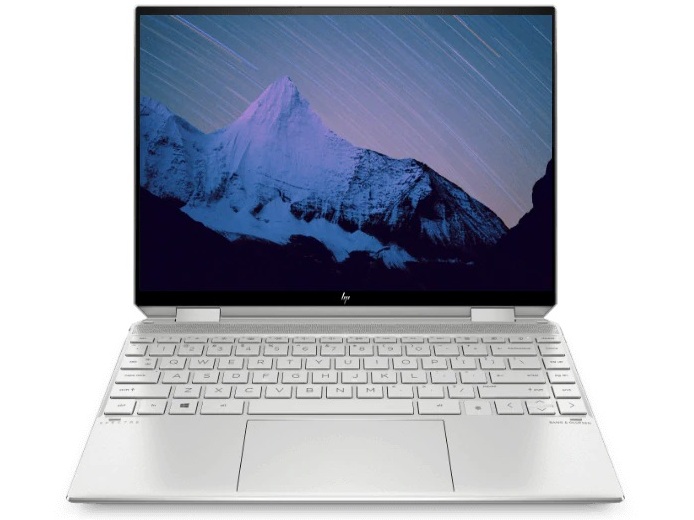
Le Spectre x360 14 est le dernier cabriolet phare de HP dans sa série Spectre haut de gamme. Il vient s'ajouter aux Spectre x360 13 et Spectre x360 15 de 13,3 et 15,6 pouces existants. Malgré ce que son nom peut laisser penser, le Spectre x360 14 utilise un écran de 13,5 pouces au lieu de 14 pouces, mais dans un format 3:2 plus carré, ce qui est de plus en plus courant sur les nouveaux ultrabooks. HP espère attirer un plus grand nombre de professionnels et d'utilisateurs de bureau avec le nouveau format d'image, par opposition au traditionnel 16:9.
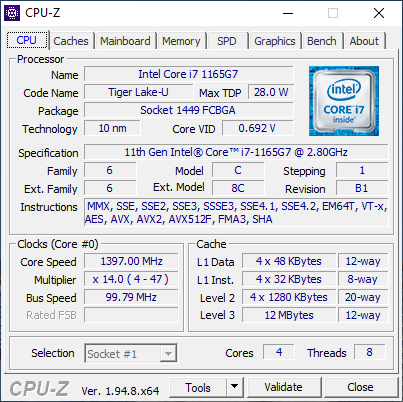
Les configurations actuelles vont du FHD (1920 x 1280) à l'OLED (3000 x 2000) avec des options 400 nit ou 1000 nit, le processeur Core i5-1135G7 ou Core i7-1165G7, 8 Go à 16 Go de RAM, et jusqu'à 2 To de stockage SSD à partir de 1300 $ à plus de 1700 $ USD. Toutes les options sont fournies uniquement avec les graphiques Iris Xe intégrés. Notre unité de test spécifique est une configuration intermédiaire équipée du processeur Core i7, d'un écran tactile FHD de 400 bits et d'un disque dur SSD de 512 Go pour environ 1500 dollars US.
Les concurrents dans cet espace comprennent d'autres sous-portables 16:10 ou 3:2 comme le Huawei MateBook X Pro, Microsoft Surface Laptop 3 13, Dell XPS 13 9300, Razer Book 13, ou Asus ZenBook S.
D'autres avis de HP :
potential competitors in comparison
Note | Date | Modèle | Poids | Épaisseur | Taille | Résolution | Prix |
|---|---|---|---|---|---|---|---|
| 89.4 % v7 (old) | 12/20 | HP Spectre x360 14t-ea000 i7-1165G7, Iris Xe G7 96EUs | 1.3 kg | 17.2 mm | 13.50" | 1920x1280 | |
| 88.4 % v7 (old) | 01/20 | HP Spectre x360 13-aw0013dx i7-1065G7, Iris Plus Graphics G7 (Ice Lake 64 EU) | 1.2 kg | 16.9 mm | 13.30" | 1920x1080 | |
| 86.3 % v7 (old) | 10/19 | Dell XPS 13 7390 2-in-1 Core i7 i7-1065G7, Iris Plus Graphics G7 (Ice Lake 64 EU) | 1.3 kg | 13 mm | 13.40" | 1920x1200 | |
| 86.3 % v7 (old) | 12/20 | Huawei MateBook 14 2020 Intel i7-10510U, GeForce MX350 | 1.5 kg | 15.9 mm | 14.00" | 2160x1440 | |
| 85.1 % v7 (old) | 10/20 | Asus Zenbook S UX393JA i7-1065G7, Iris Plus Graphics G7 (Ice Lake 64 EU) | 1.4 kg | 15.7 mm | 13.90" | 3300x2200 | |
| 87.1 % v7 (old) | 12/20 | Lenovo Yoga 9i 14ITL5 i5-1135G7, Iris Xe G7 80EUs | 1.4 kg | 15.7 mm | 14.00" | 1920x1080 |
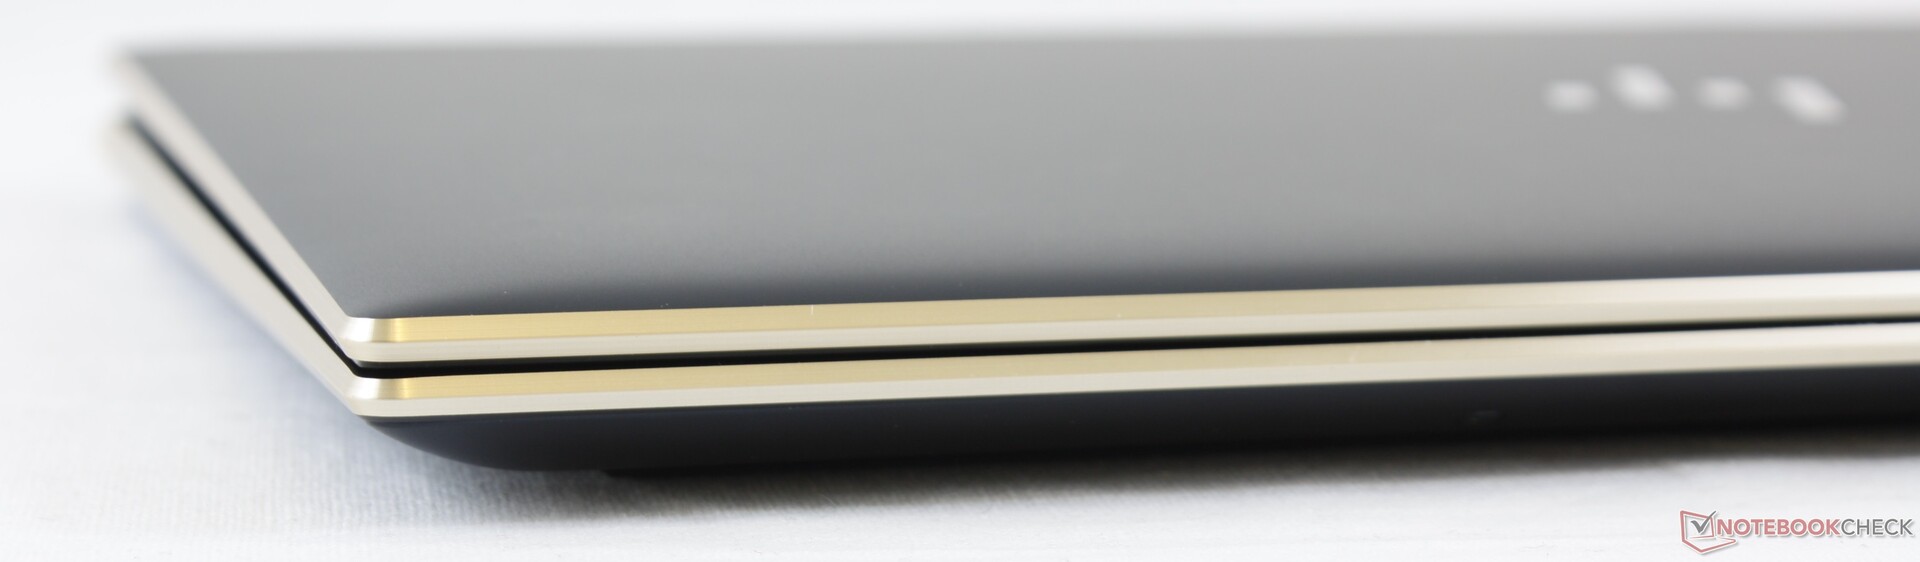
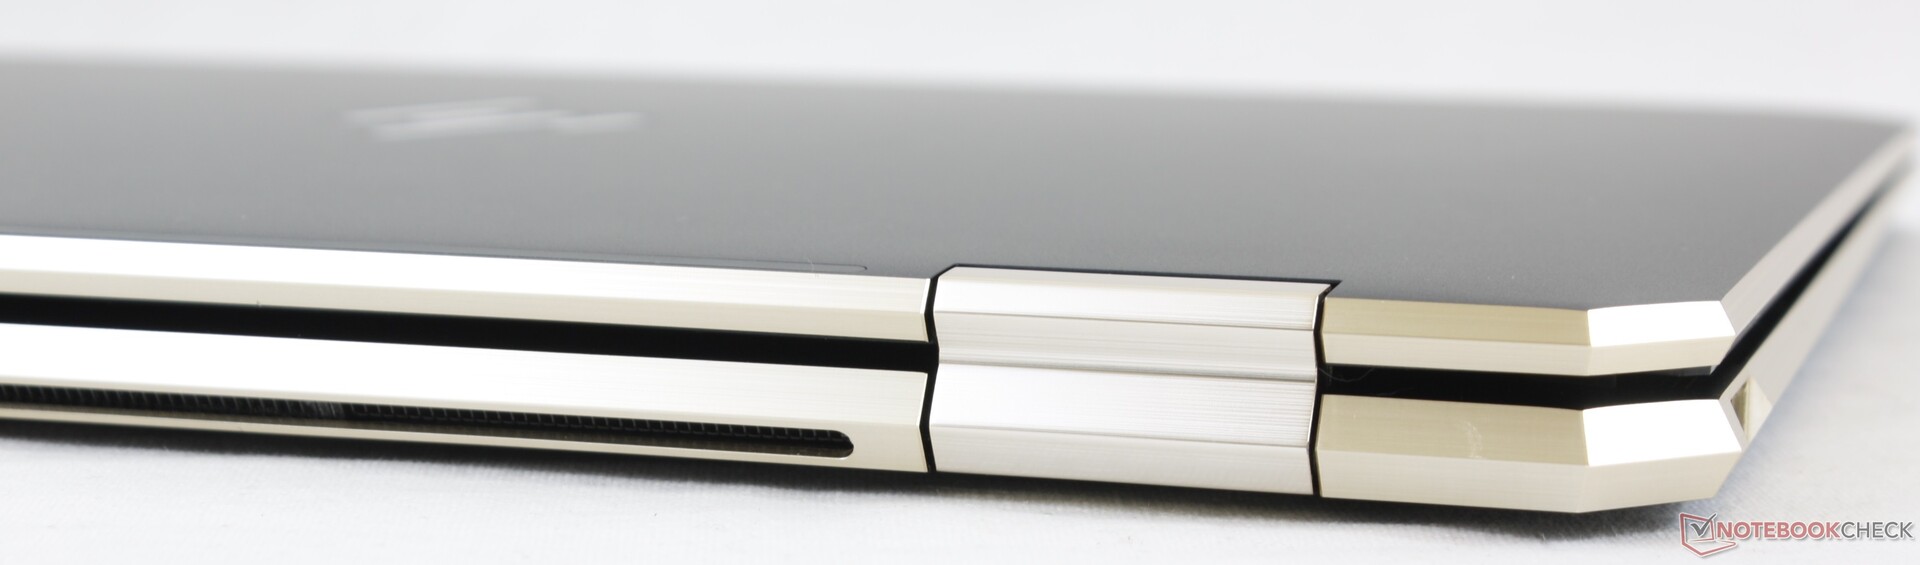
Cas
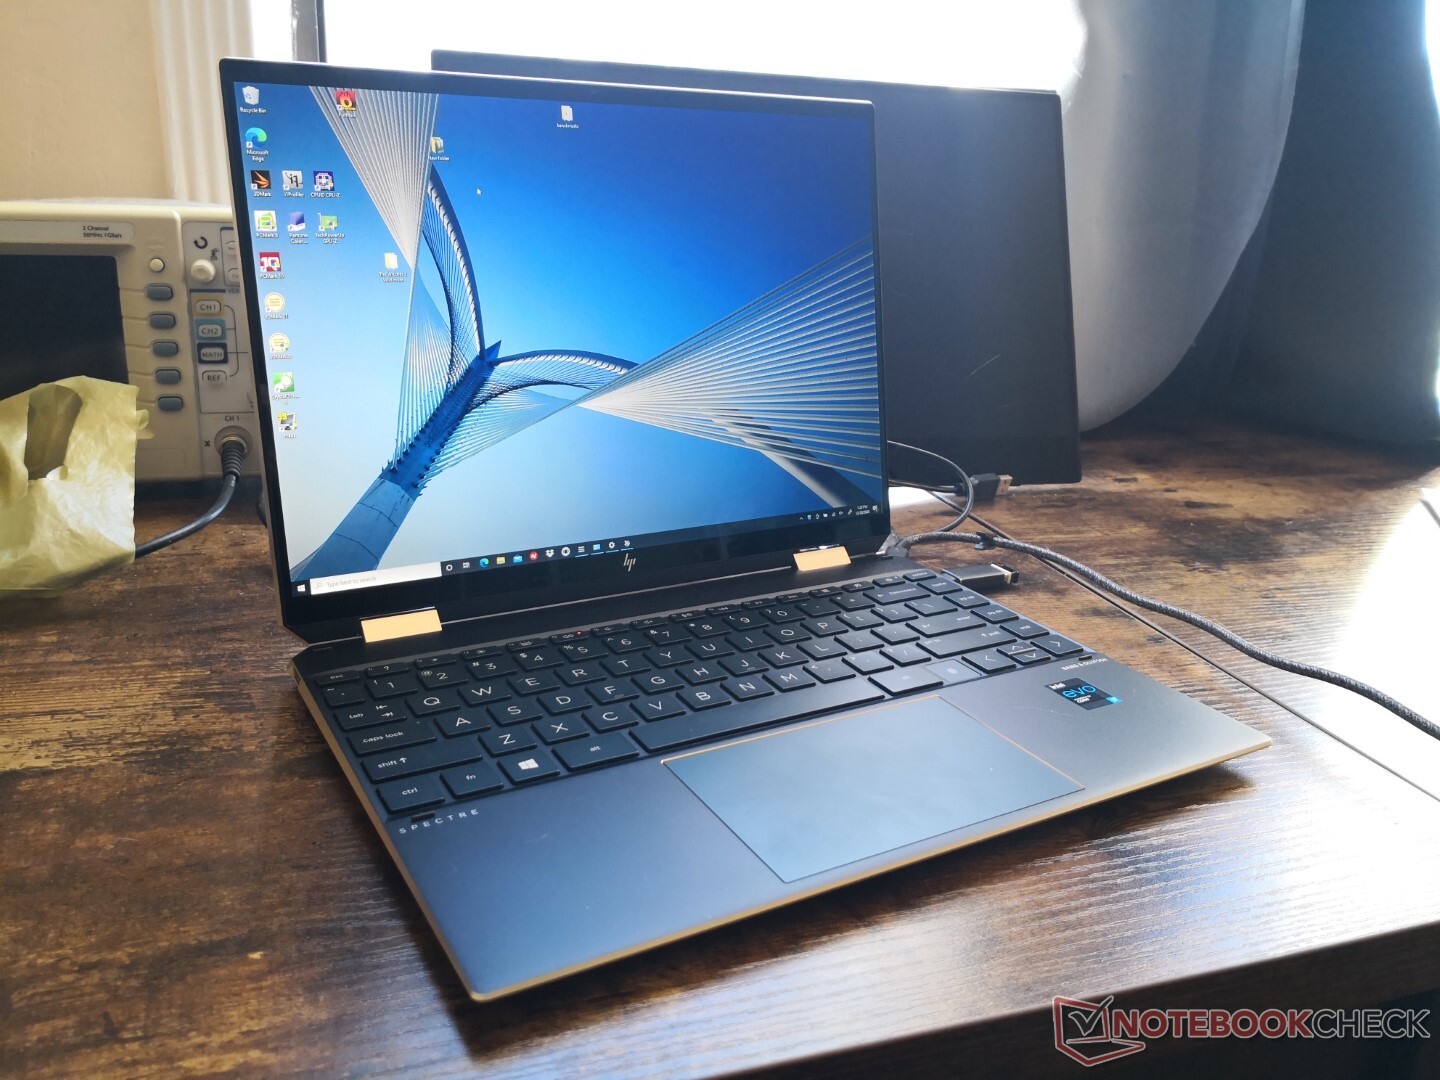
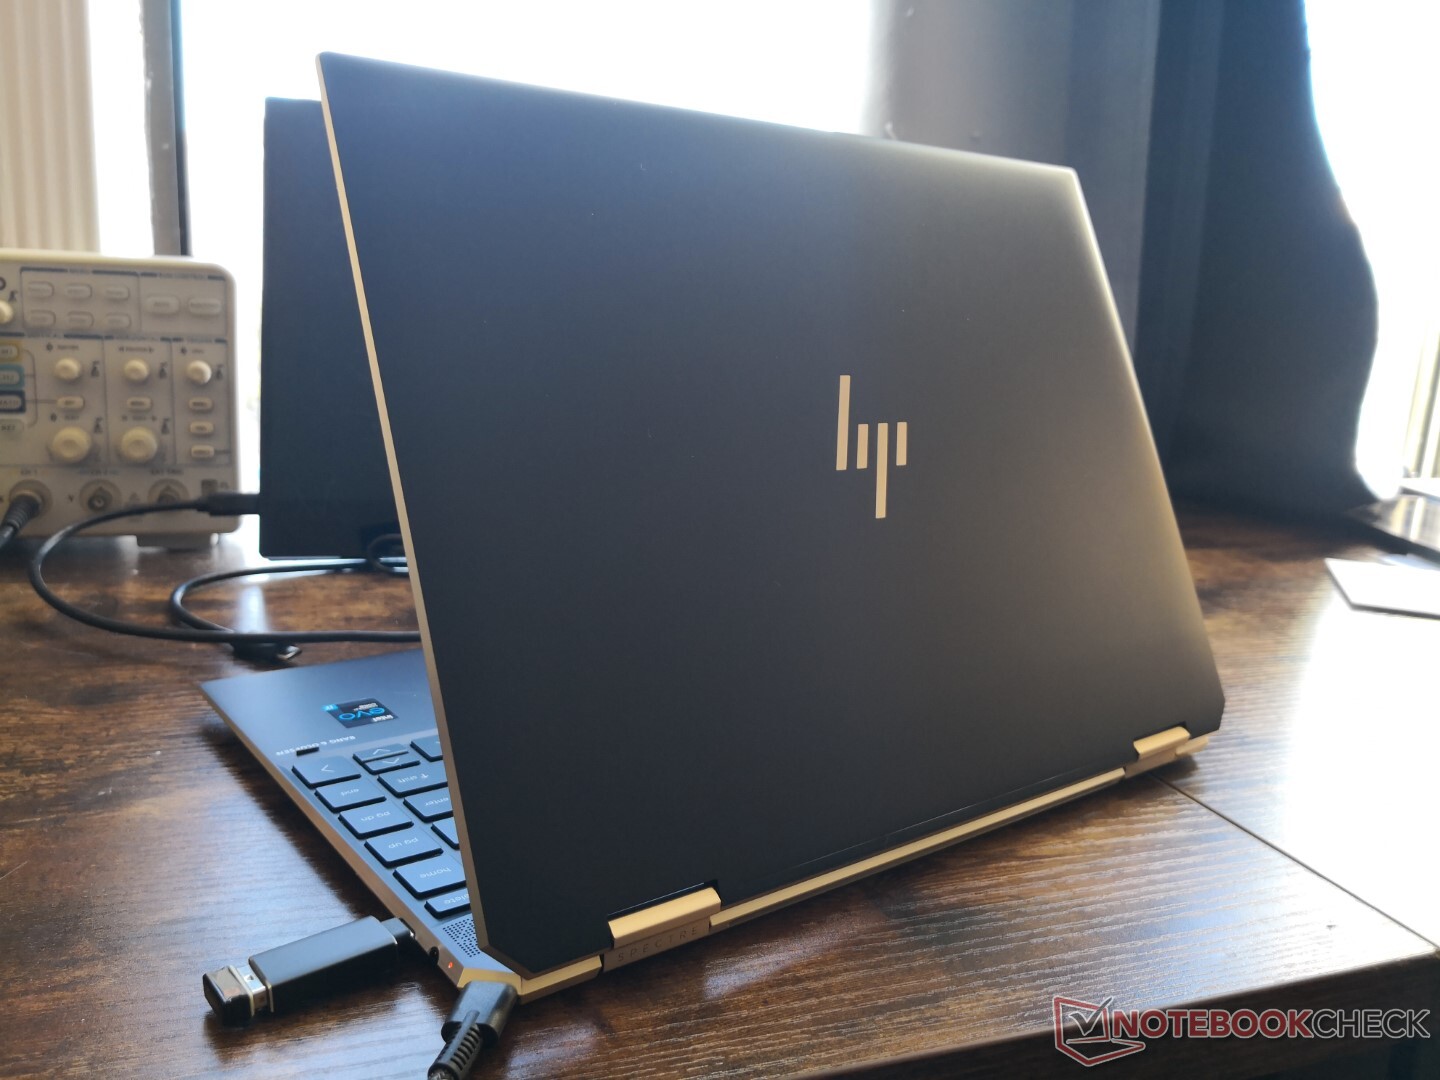
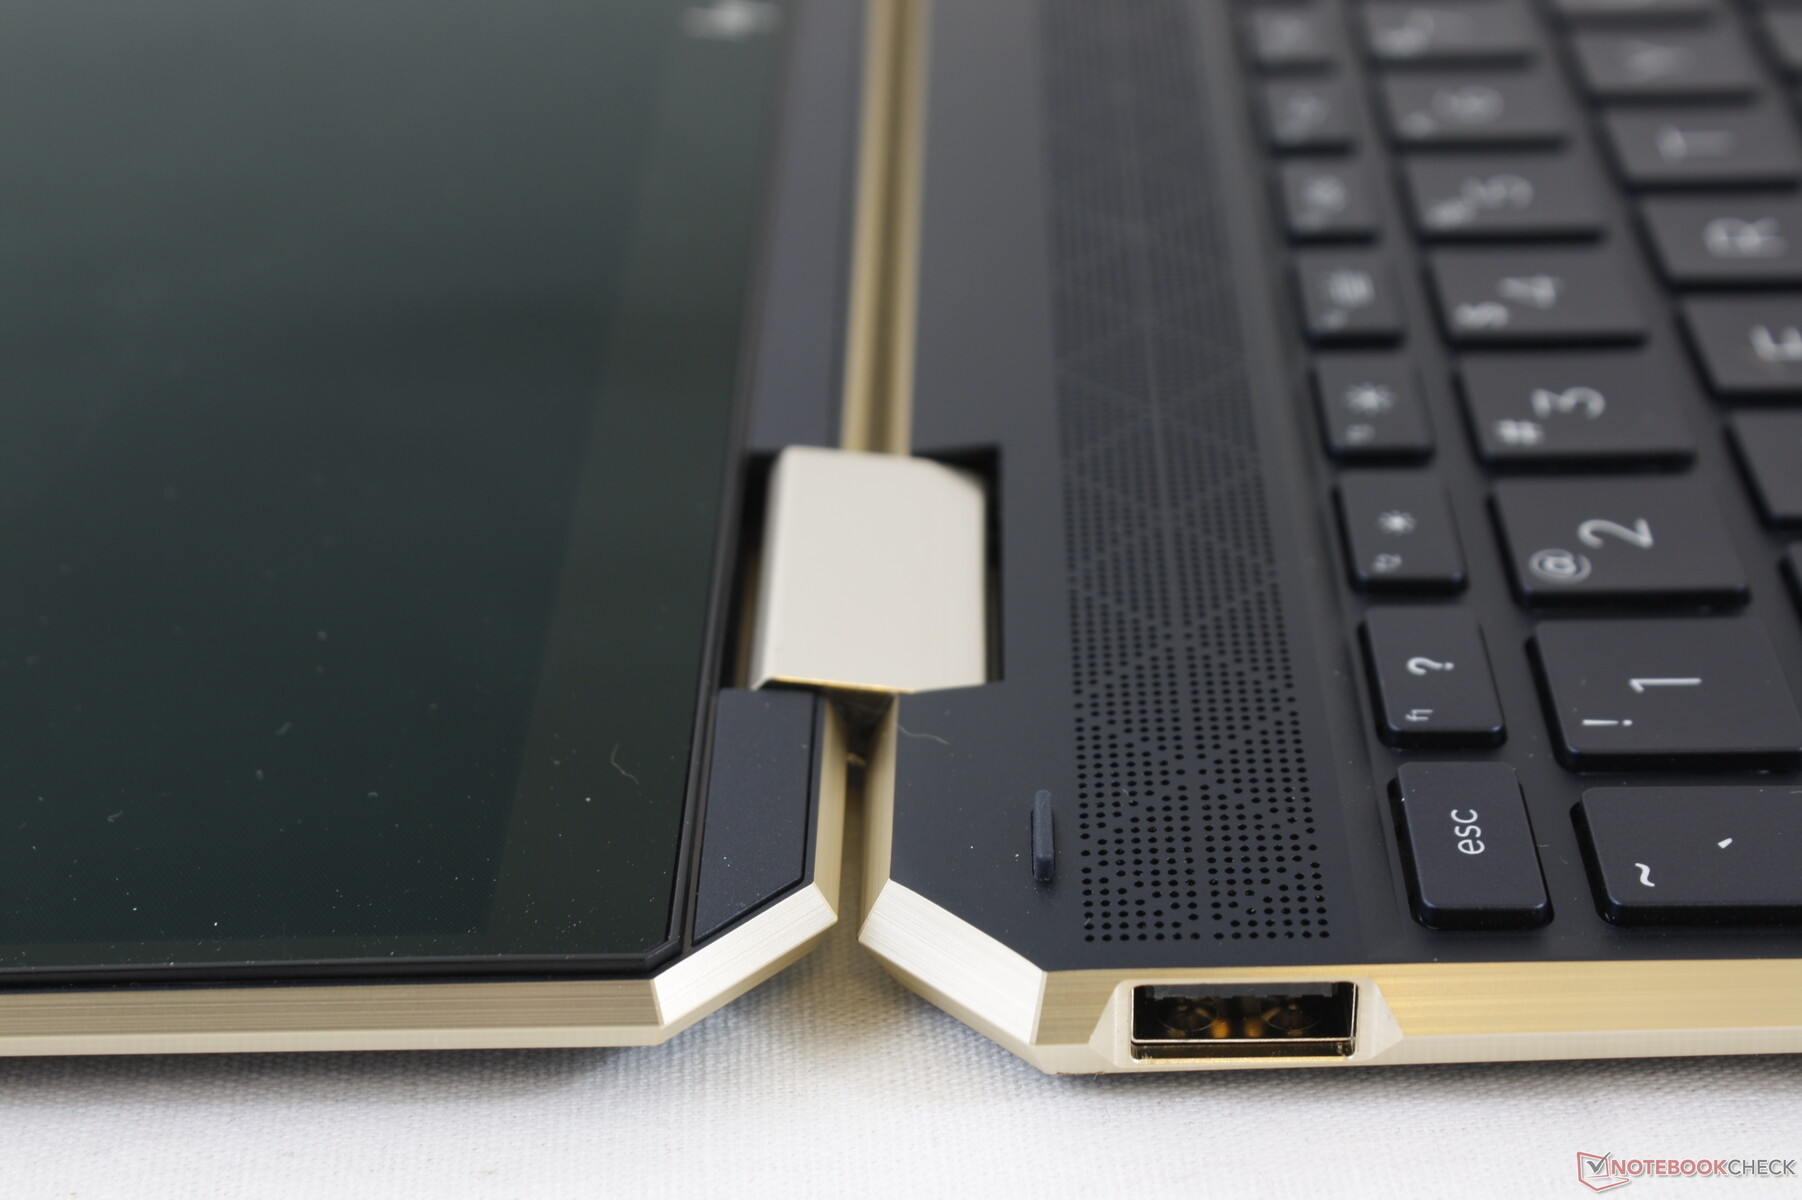
Si vous avez déjà manipulé un Spectre x360 13 ou 15 dans le passé, vous saurez exactement à quoi vous attendre avec le Spectre x360 14. HP a transposé sans surprise le design luxueux du Spectre et les matériaux métalliques existants au nouveau facteur de forme 3:2. La base et le couvercle présentent peu de flexion et ne grincent pas lorsqu'on tente de tordre leurs coins ou d'enfoncer leurs surfaces. La rigidité du châssis n'est ni meilleure ni pire que celle du Asus ZenBook S ou du XPS 13, mais ses garnitures dorées sont sans doute plus classe.
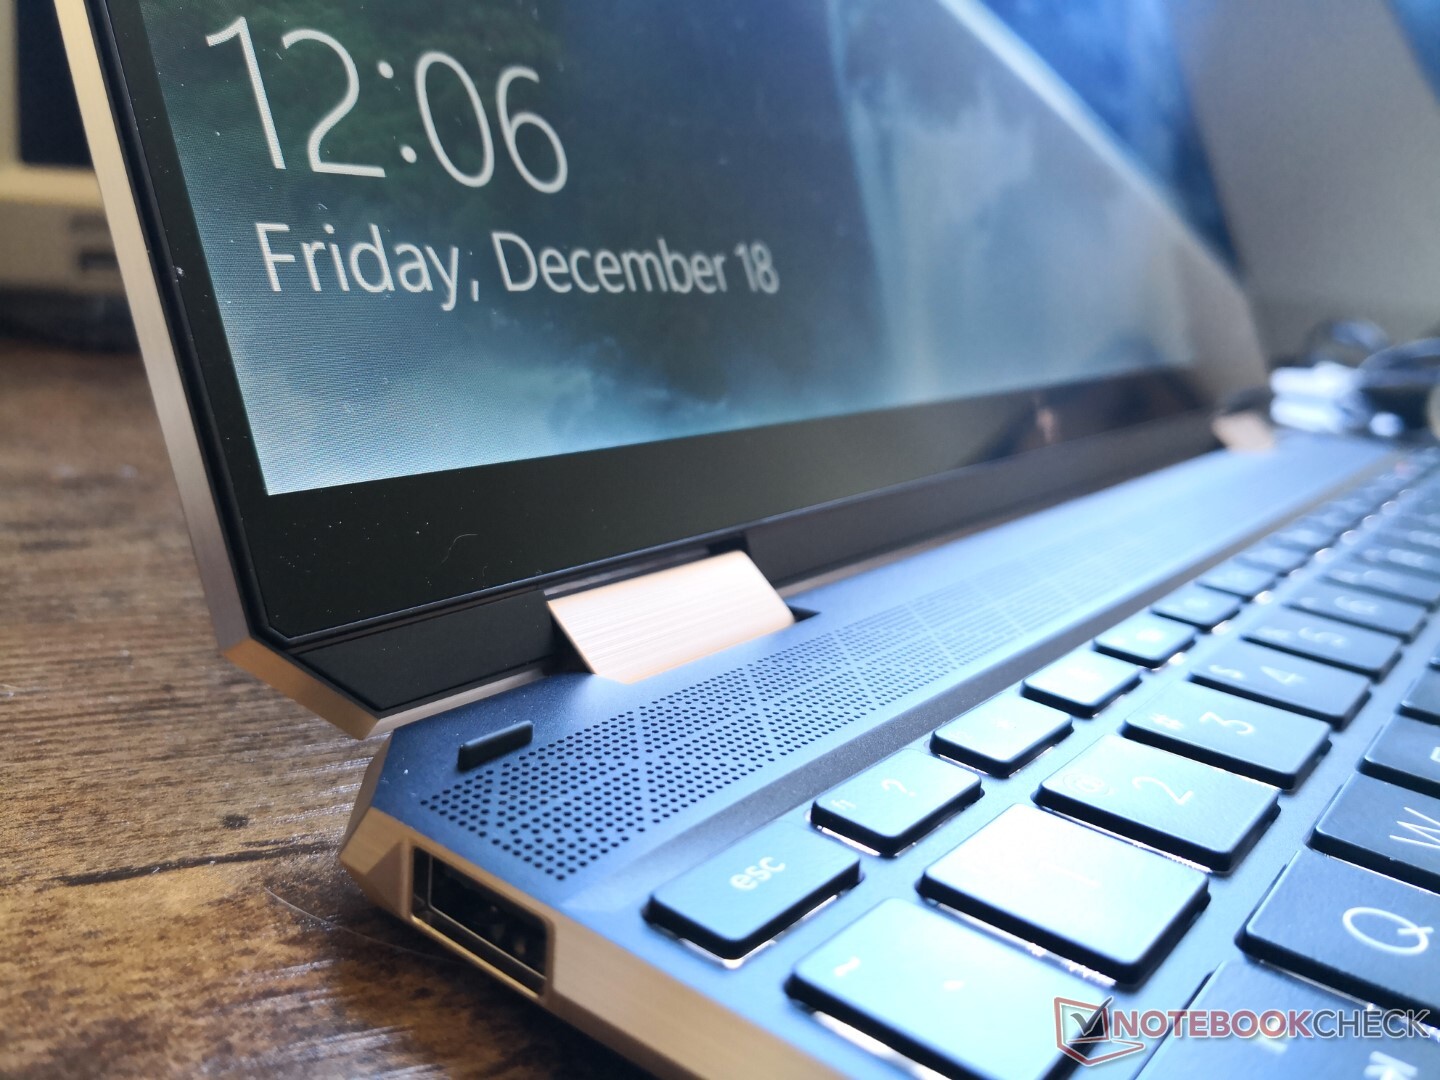
Une chose que nous améliorerions, c'est la rigidité des charnières à certains angles. Le couvercle tombe trop facilement lorsqu'il dépasse les 120 degrés, ce qui peut être gênant pour taper ou transporter le portable. Cela ne donne pas non plus une bonne idée de la longévité, car les charnières s'affaiblissent inévitablement avec le temps.
Le système est plus grand et légèrement plus lourd que le Spectre x360 13 de 13,3 pouces et le mode tablette est donc un peu plus lourd à manipuler. Bien sûr, les propriétaires obtiennent un écran plus grand en retour sans avoir à opter pour le Spectre x360 15, encore plus grand. Notez que le Dell XPS 13 9300 est plus petit que notre Spectre x360 14 dans toutes les dimensions, en partie grâce à son écran 16:10 de 13,4 pouces.
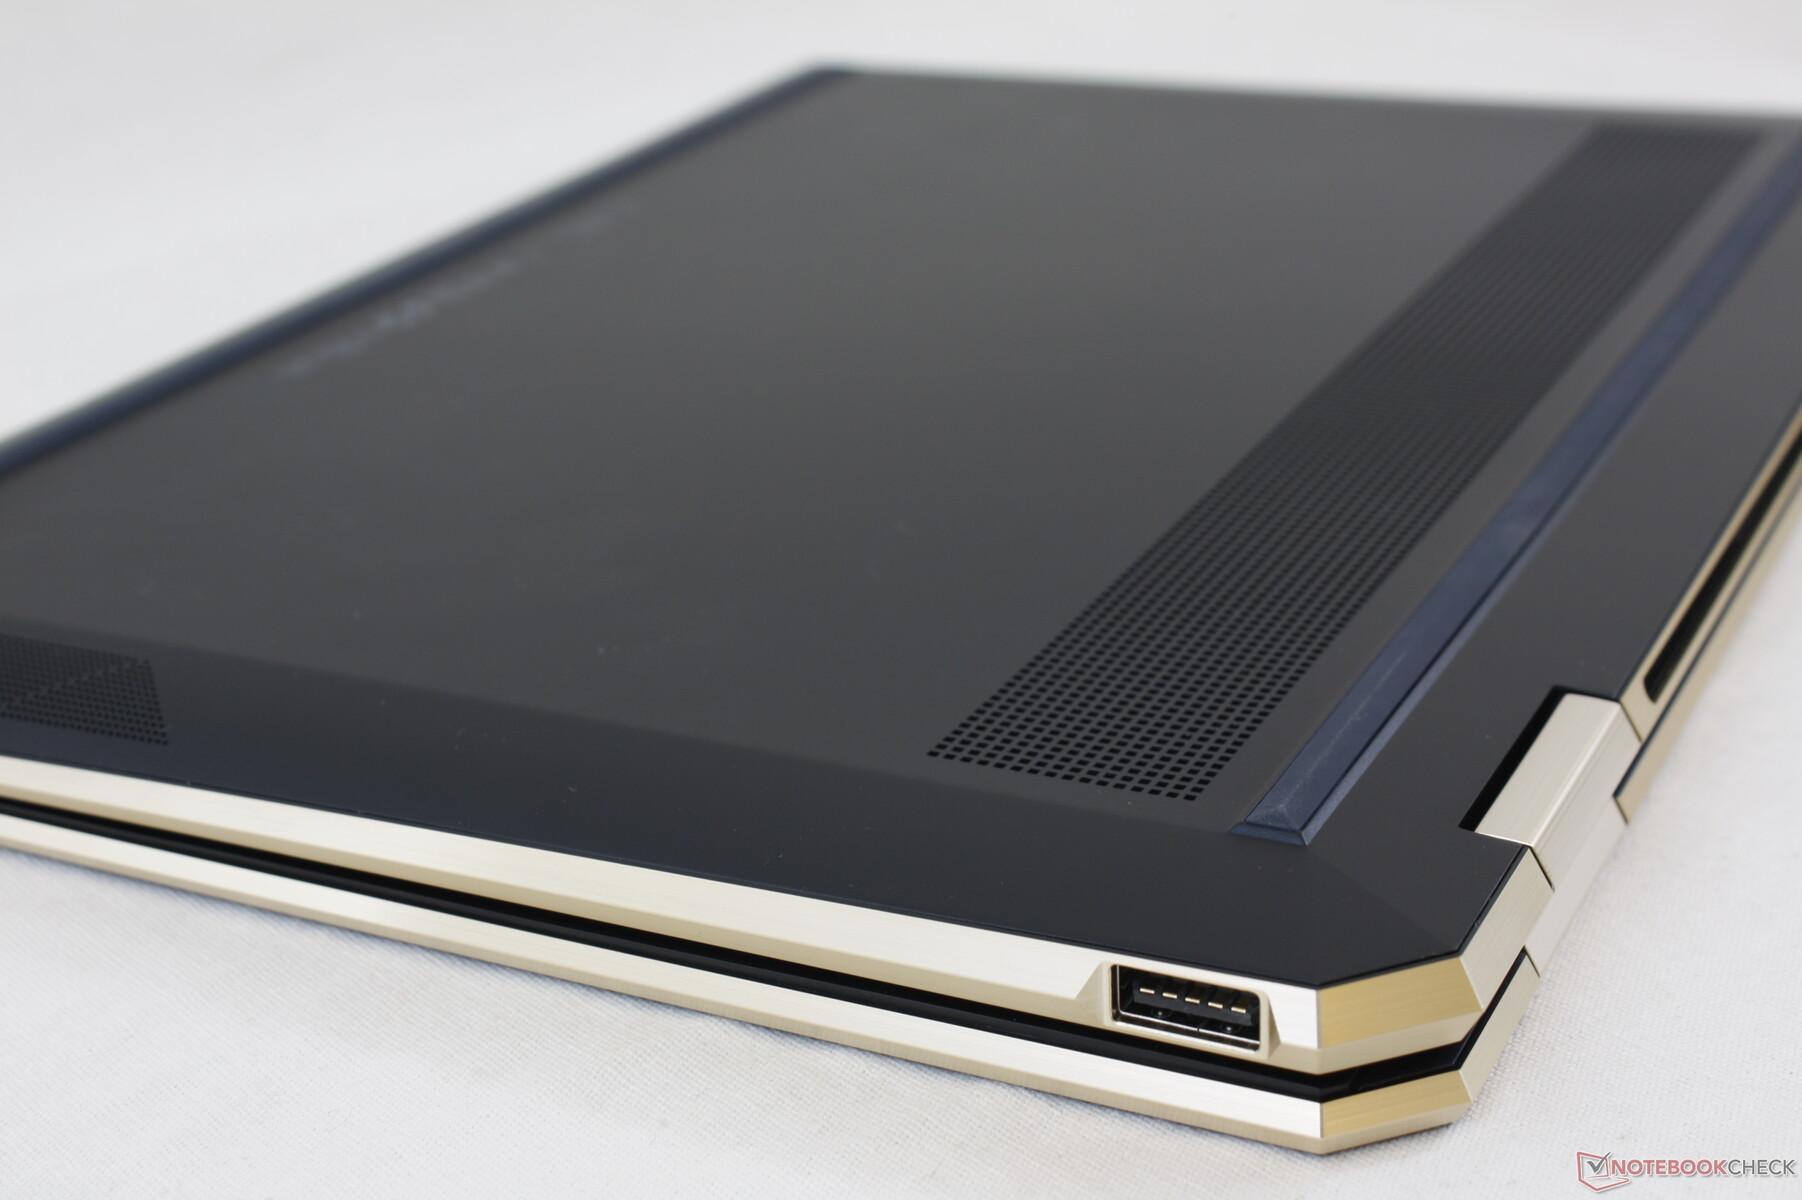
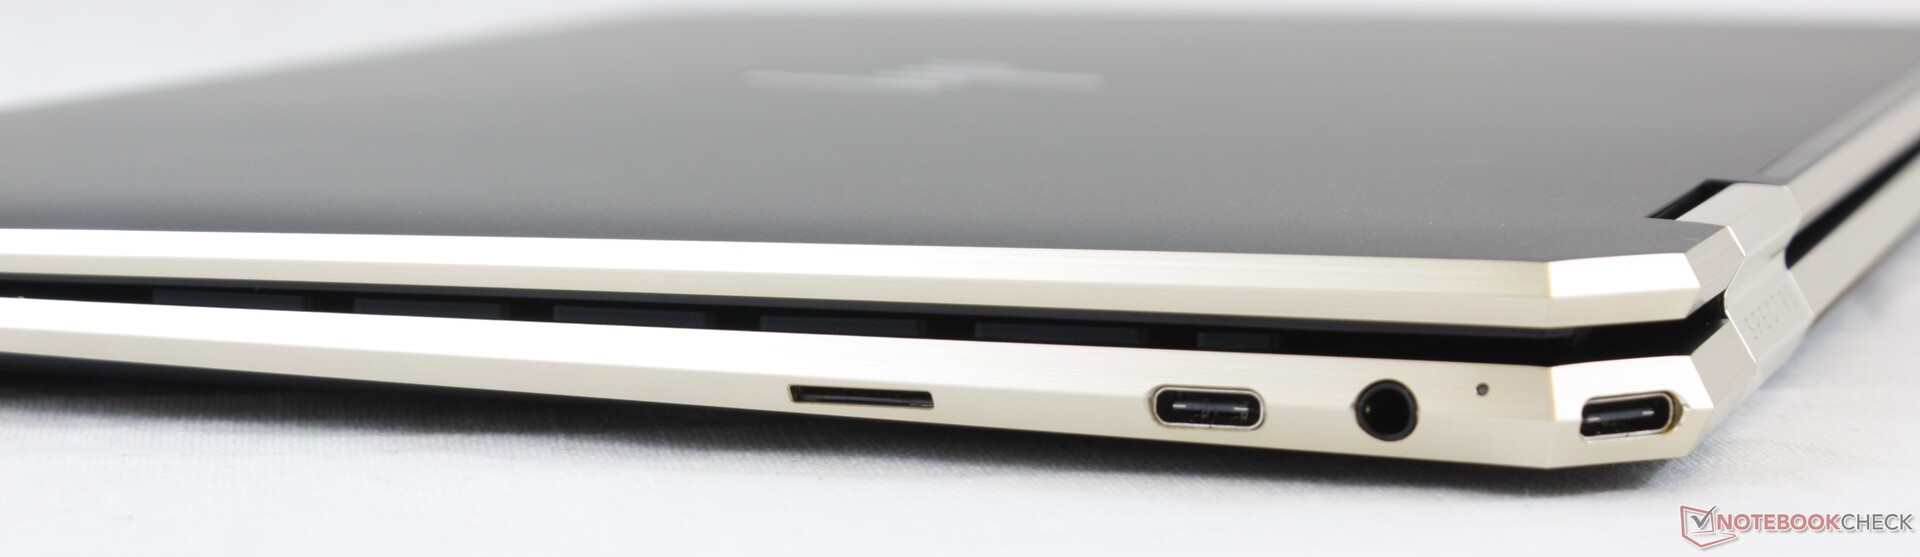
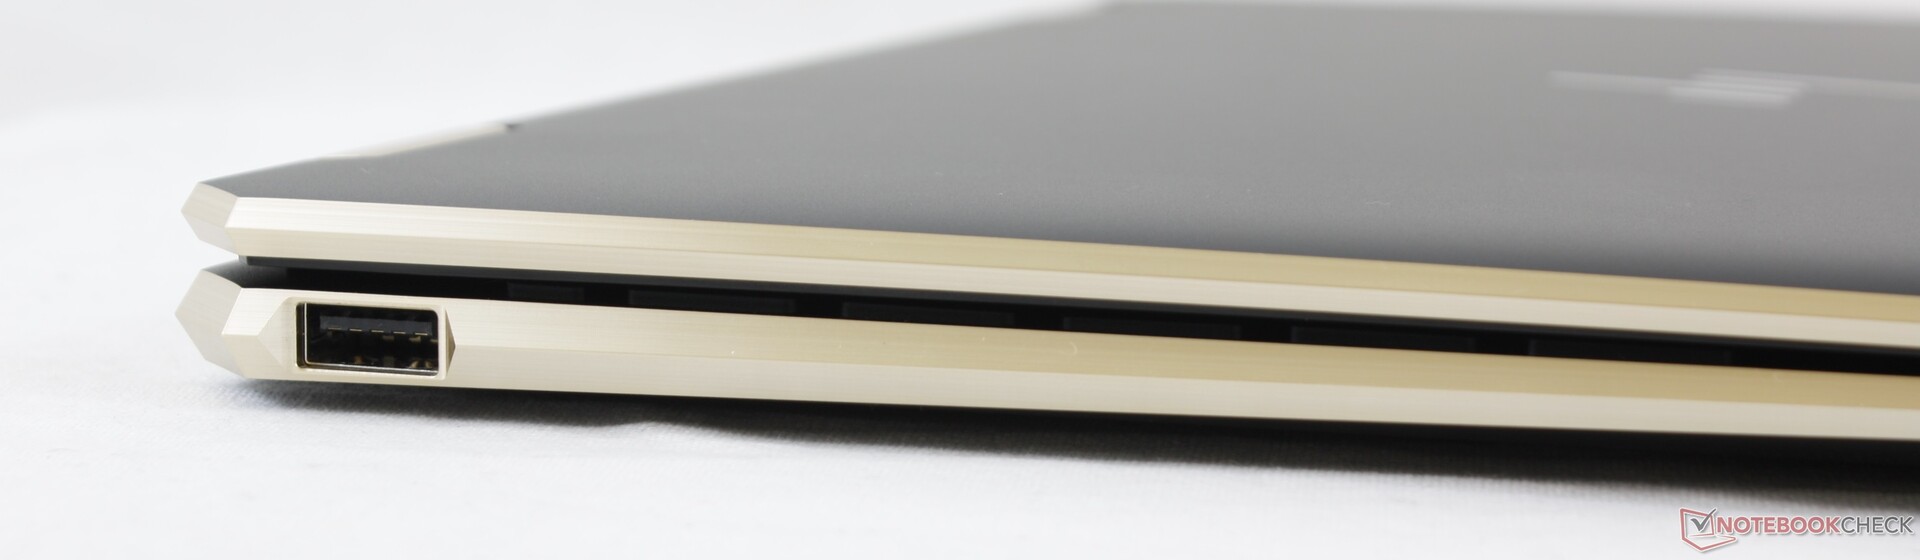
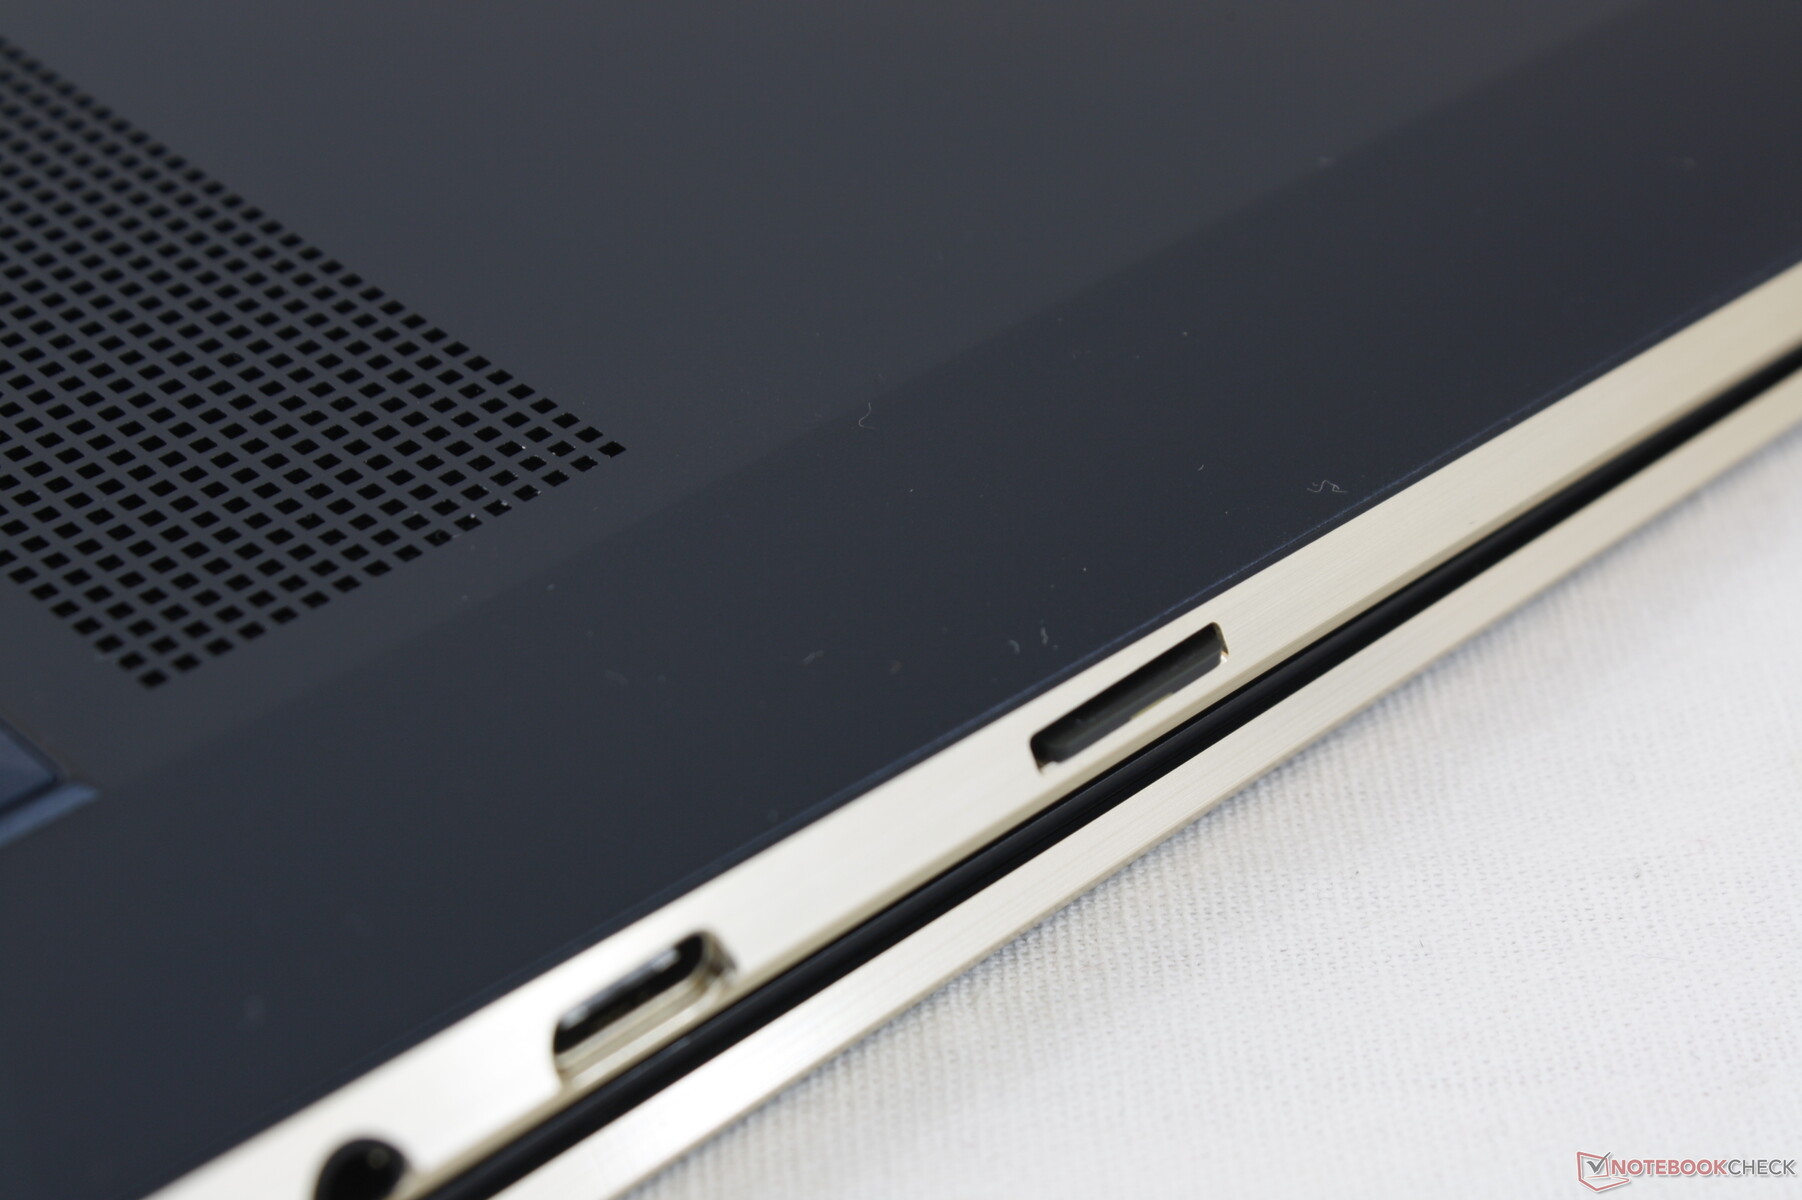
Connectivité
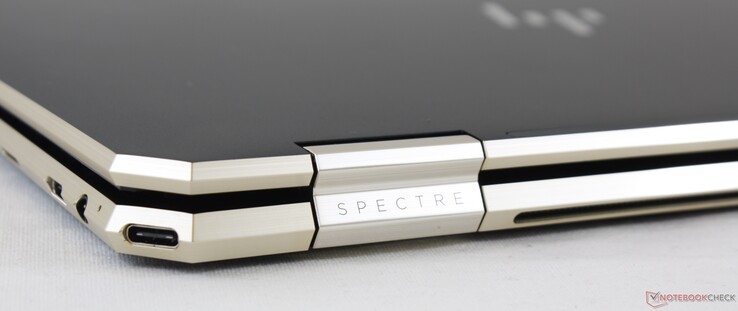
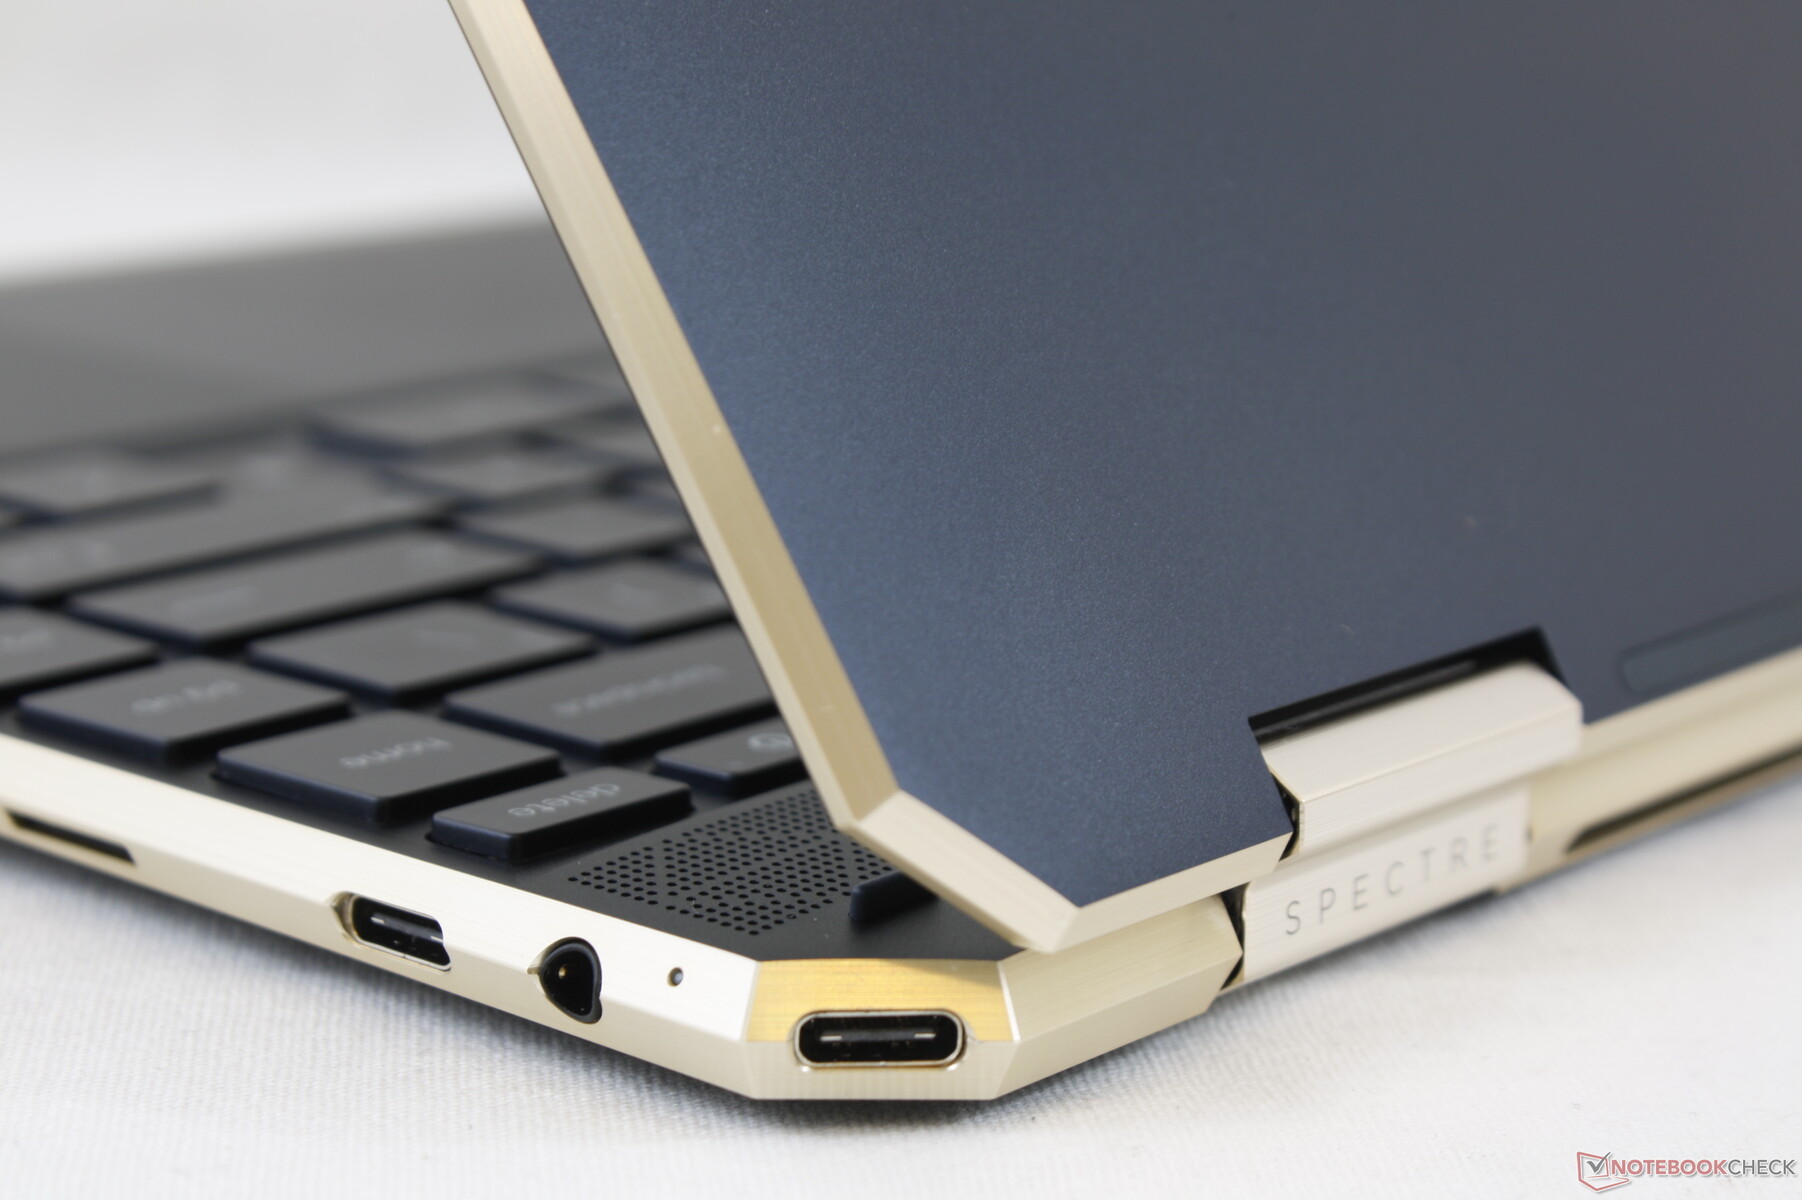
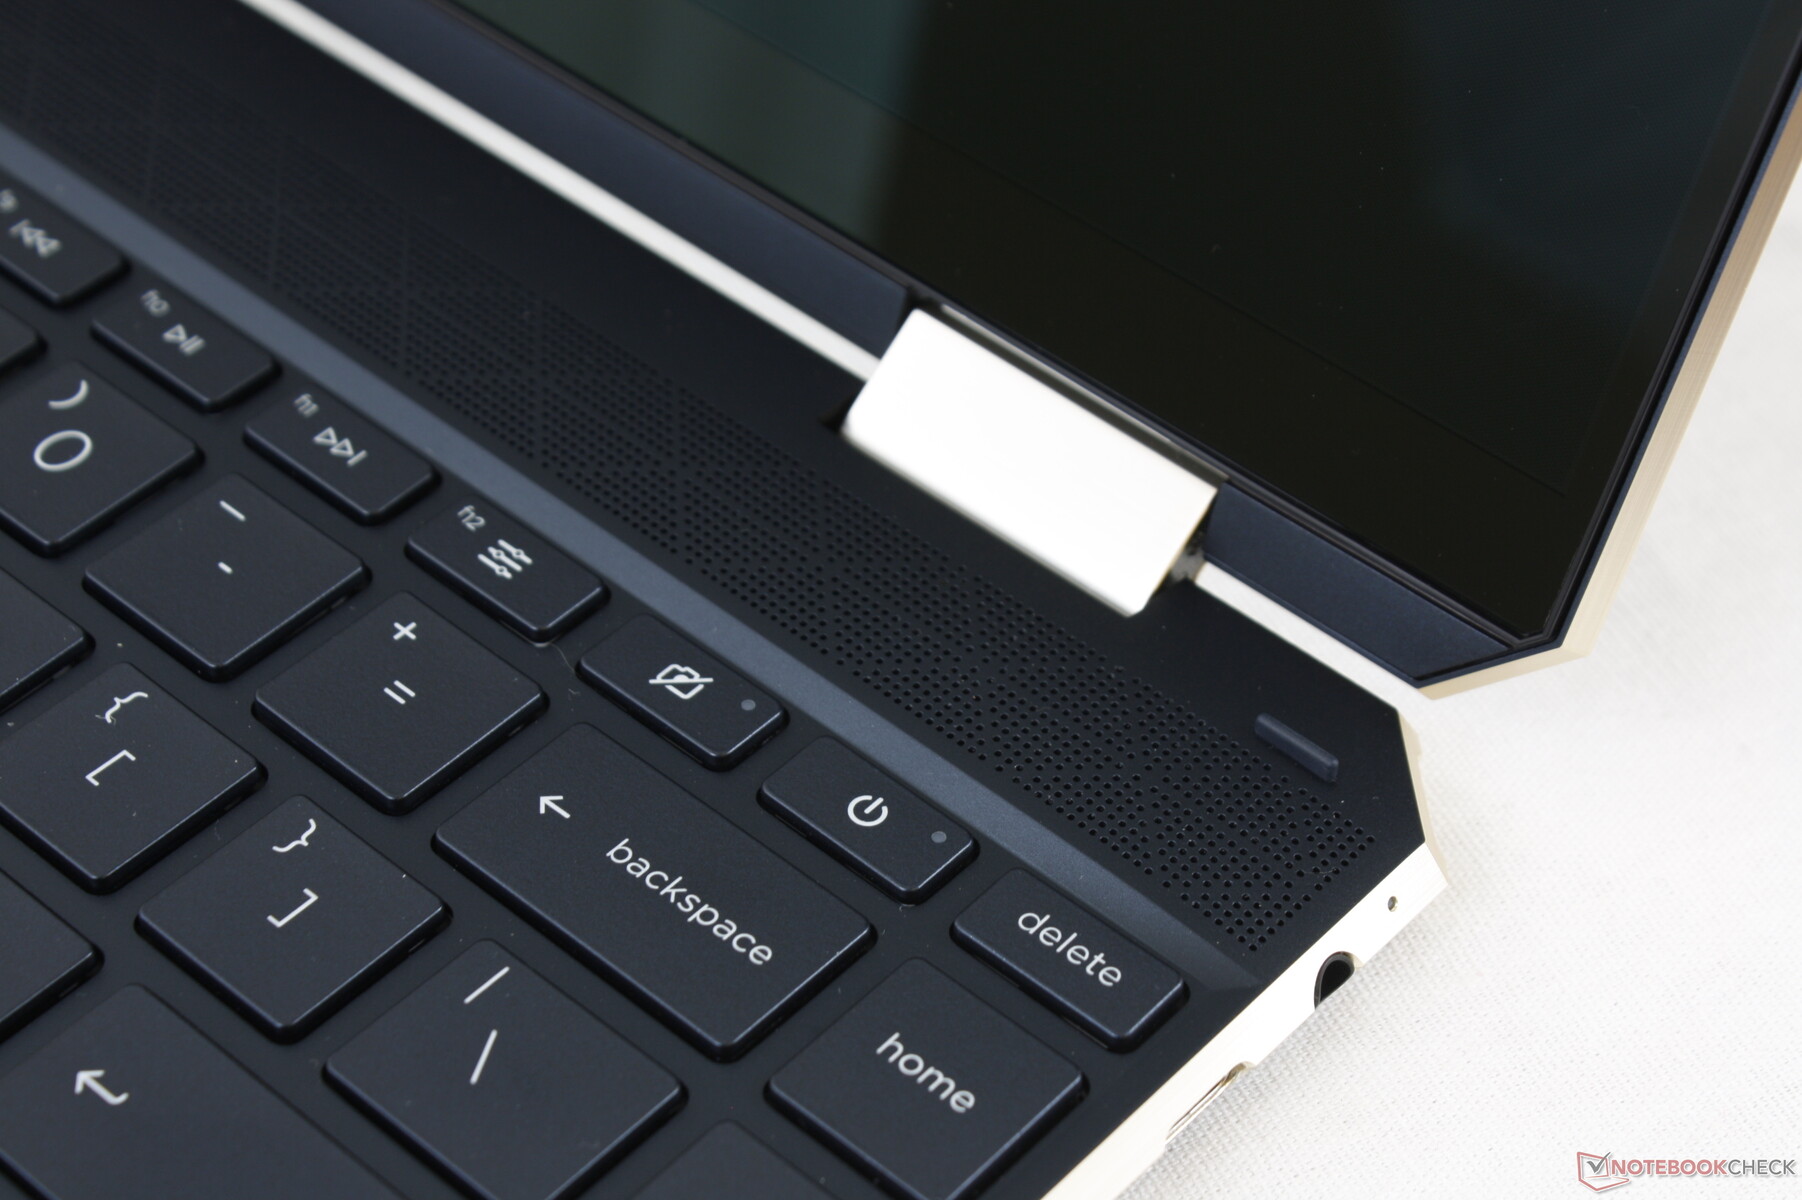
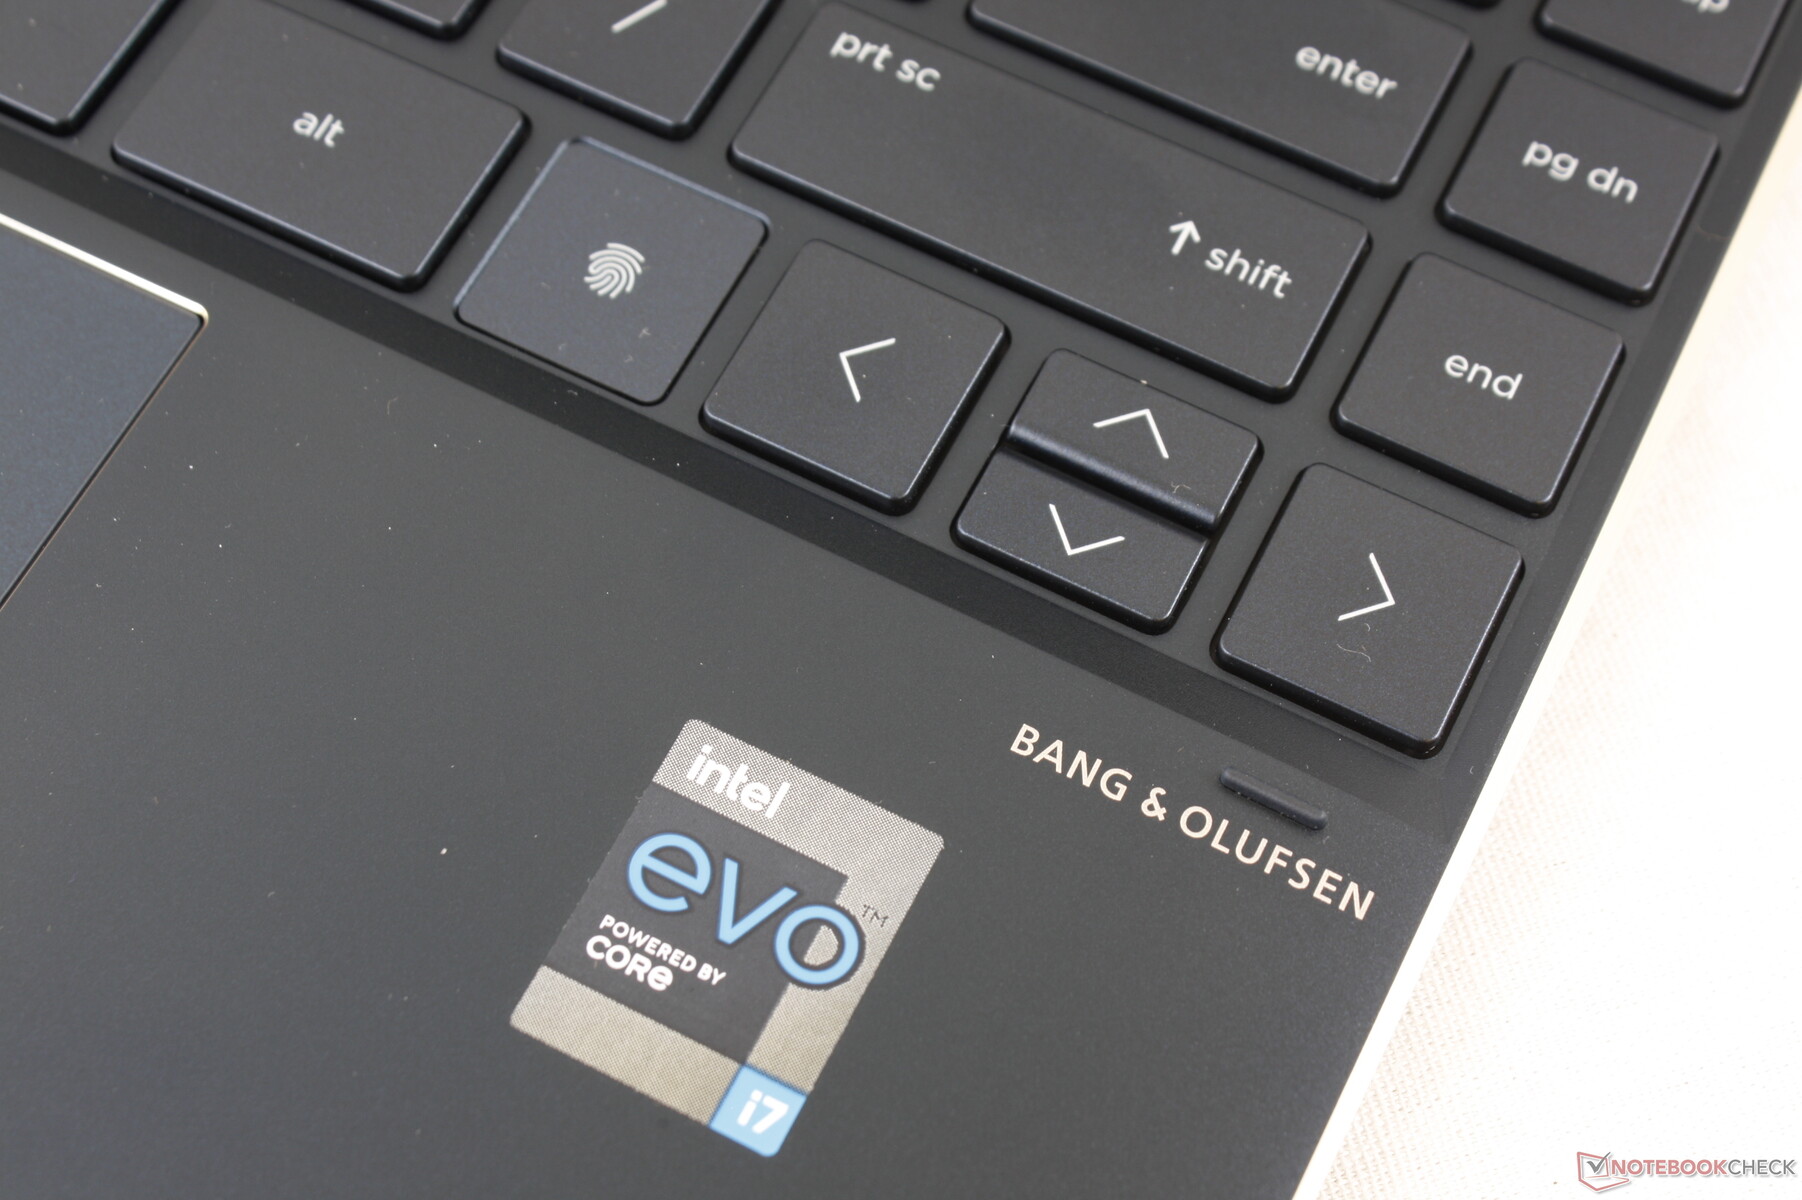
Les options de port sont identiques à celles du Spectre x360 13, mais avec quelques modifications mineures. Premièrement, le bouton d'alimentation et l'interrupteur d'arrêt de la caméra se trouvent maintenant directement sur le clavier au lieu du coin arrière ou du bord droit du châssis, respectivement. Deuxièmement, les deux ports USB-C prennent désormais en charge la Thunderbolt 4 en plus de la Thunderbolt 3 pour les utilisateurs qui peuvent profiter de la bande passante supplémentaire
Le port USB-C d'angle peut sembler un peu bizarre au début. Nous aurions préféré un port USB-C sur les bords gauche et droit pour que les utilisateurs puissent charger le portable de chaque côté, comme sur le Razer Book 13.
Lecteur de carte SD
| SD Card Reader | |
| average JPG Copy Test (av. of 3 runs) | |
| HP Spectre x360 14t-ea000 (Toshiba Exceria Pro M501 microSDXC 32GB) | |
| HP Spectre x360 13-aw0013dx (Toshiba Exceria Pro M501 microSDXC 64GB) | |
| Dell XPS 13 7390 2-in-1 Core i7 (Toshiba Exceria Pro M501 64 GB UHS-II) | |
| Asus Zenbook S UX393JA (Toshiba Exceria Pro M501 64 GB UHS-II) | |
| maximum AS SSD Seq Read Test (1GB) | |
| HP Spectre x360 14t-ea000 (Toshiba Exceria Pro M501 microSDXC 32GB) | |
| Dell XPS 13 7390 2-in-1 Core i7 (Toshiba Exceria Pro M501 64 GB UHS-II) | |
| HP Spectre x360 13-aw0013dx (Toshiba Exceria Pro M501 microSDXC 64GB) | |
| Asus Zenbook S UX393JA (Toshiba Exceria Pro M501 64 GB UHS-II) | |
Communication
L'Intel AX201 est livré en standard pour la connectivité Wi-Fi 6 et Bluetooth 5.1. Nous n'avons rencontré aucun problème lors de la connexion à notre routeur de test Netgear RAX200.
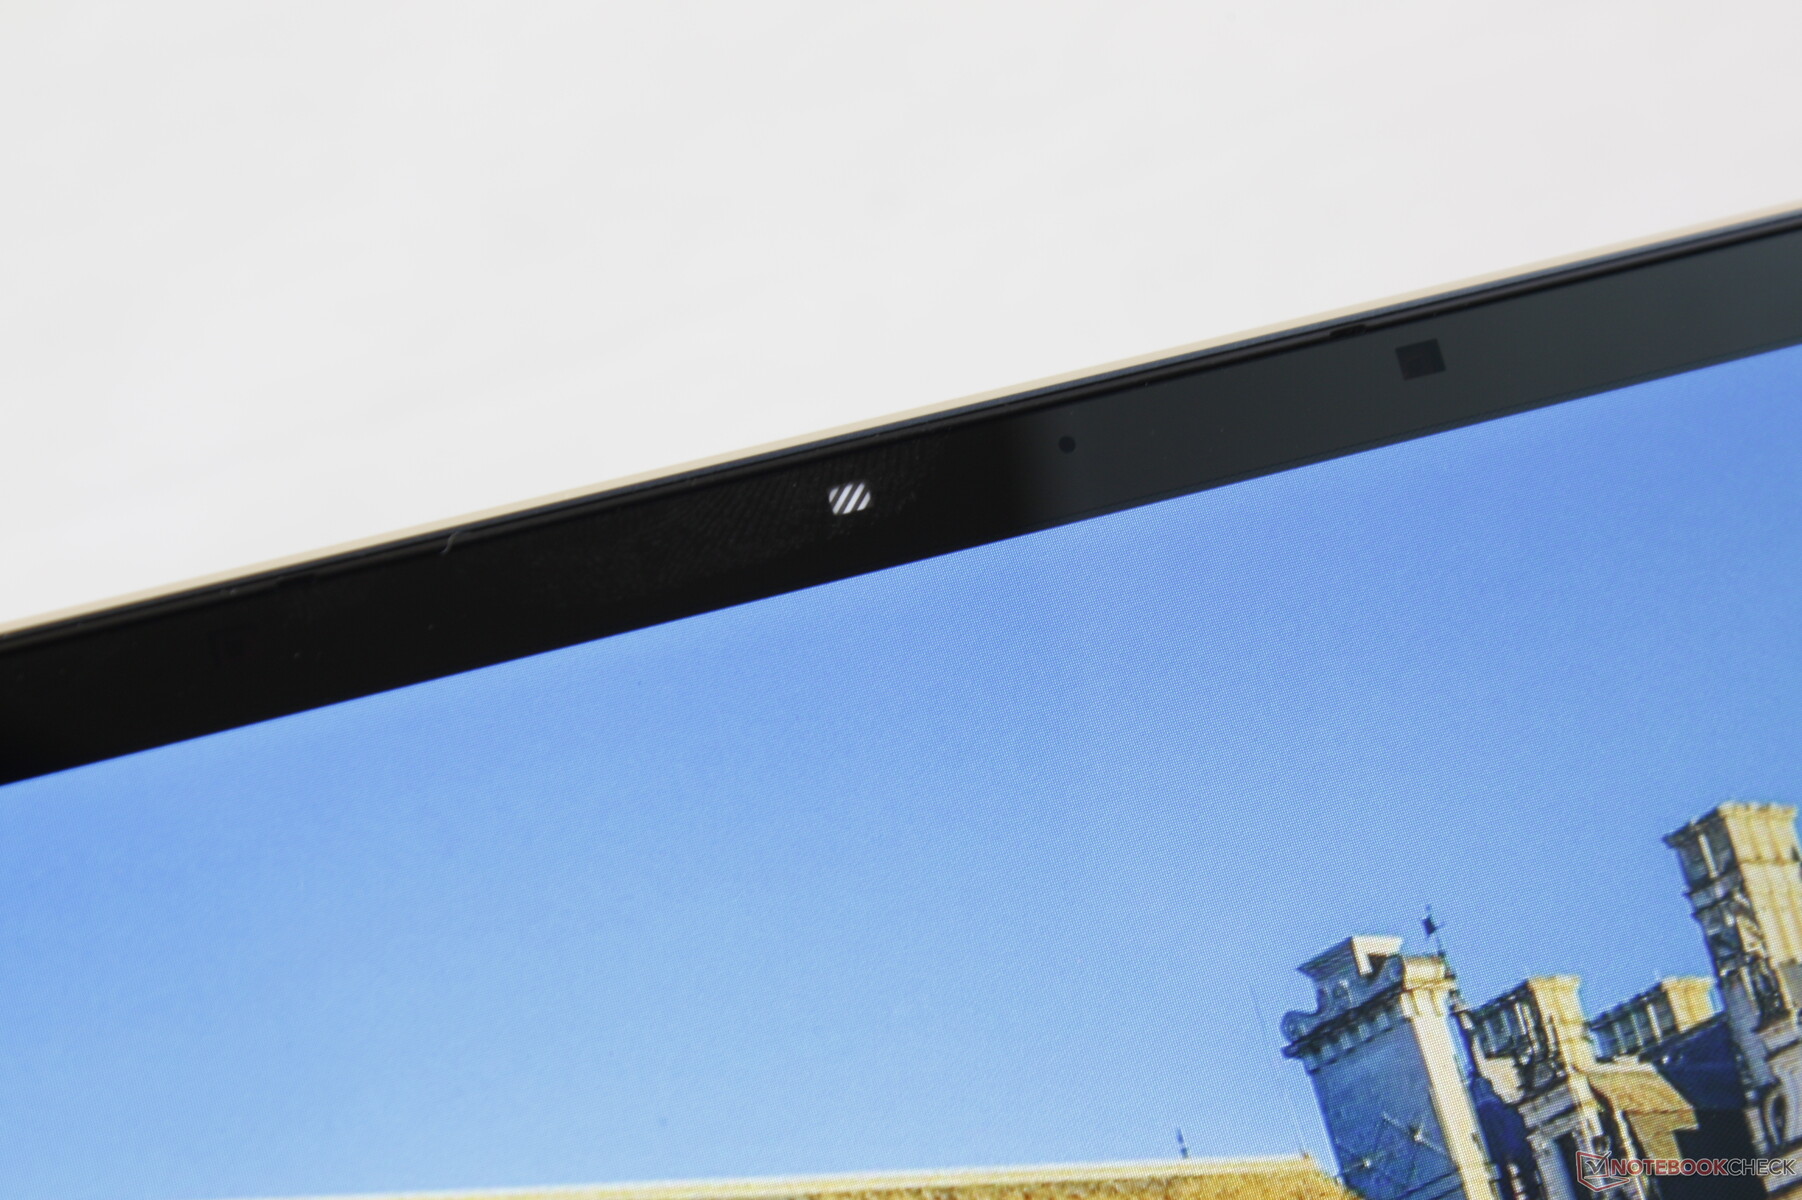
Webcam
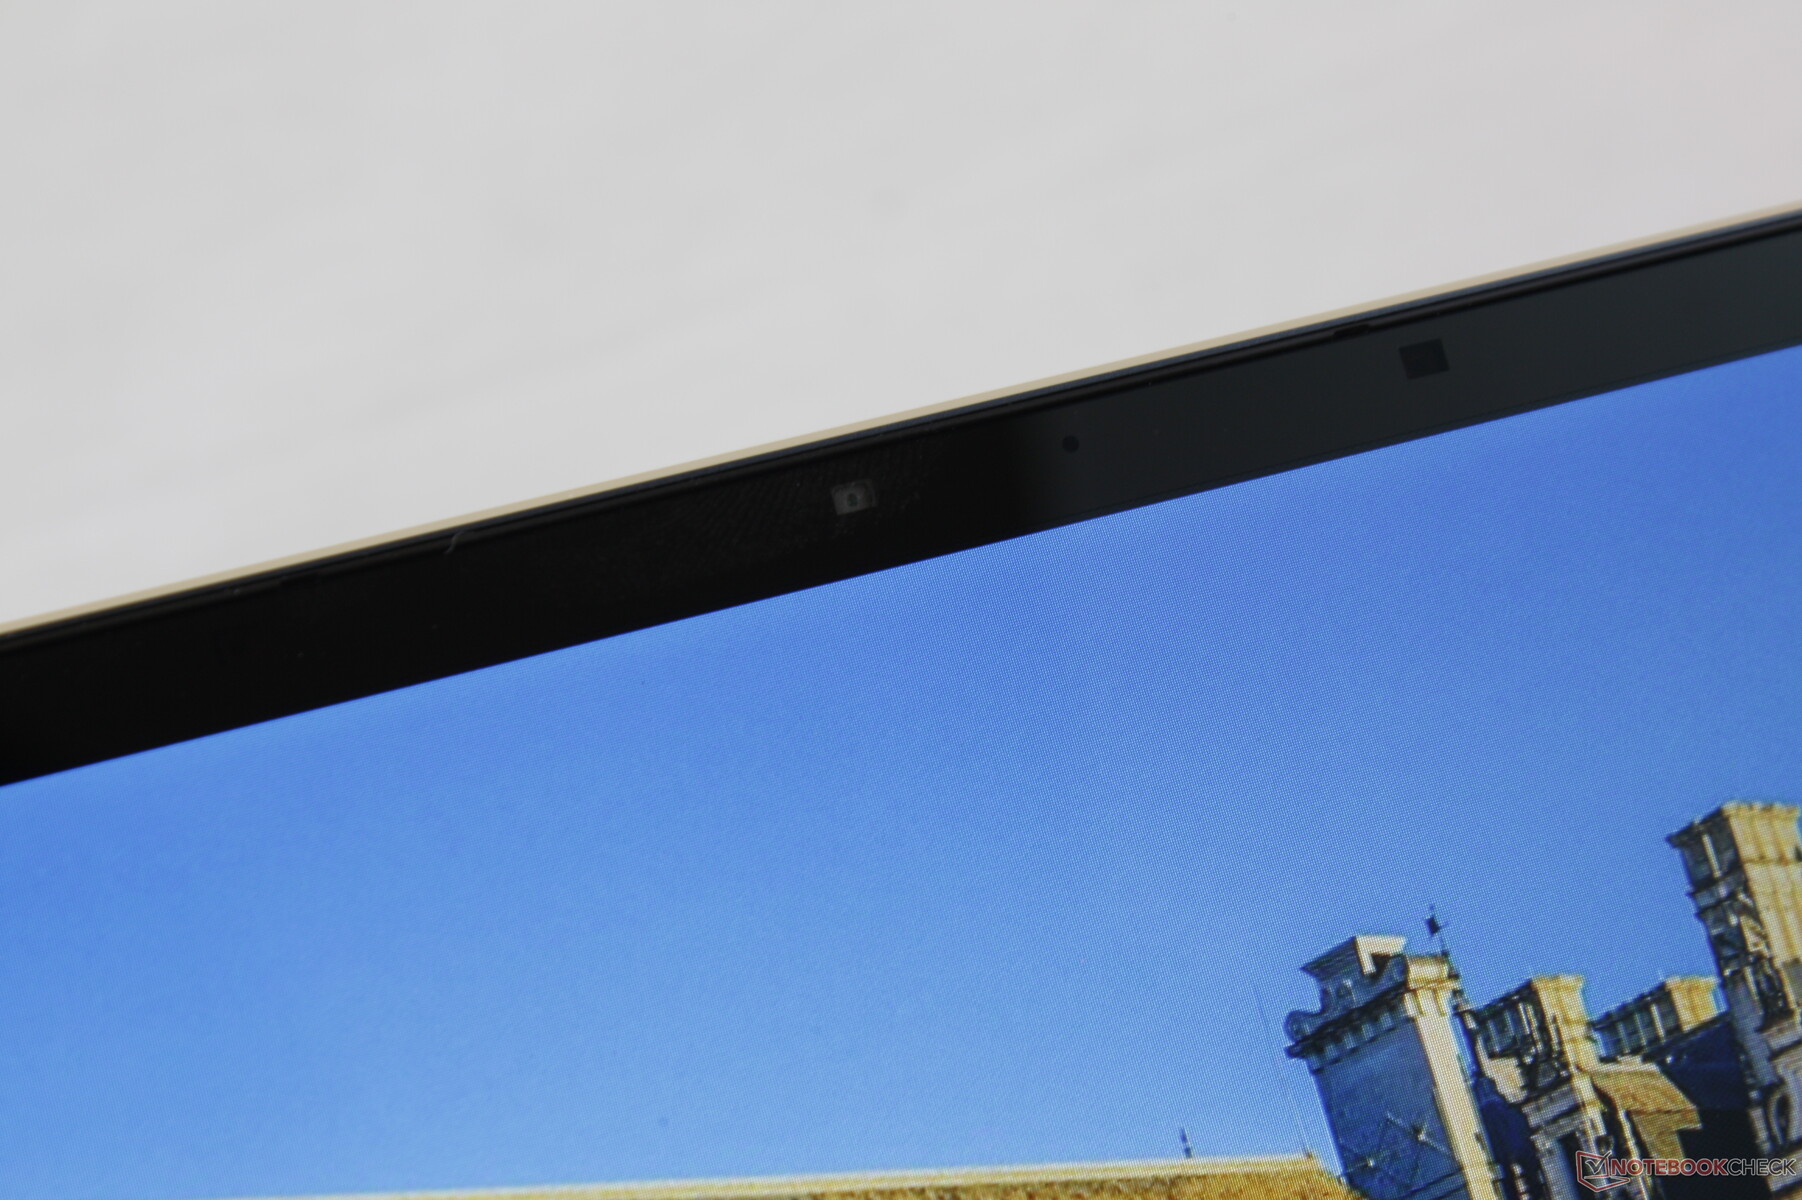


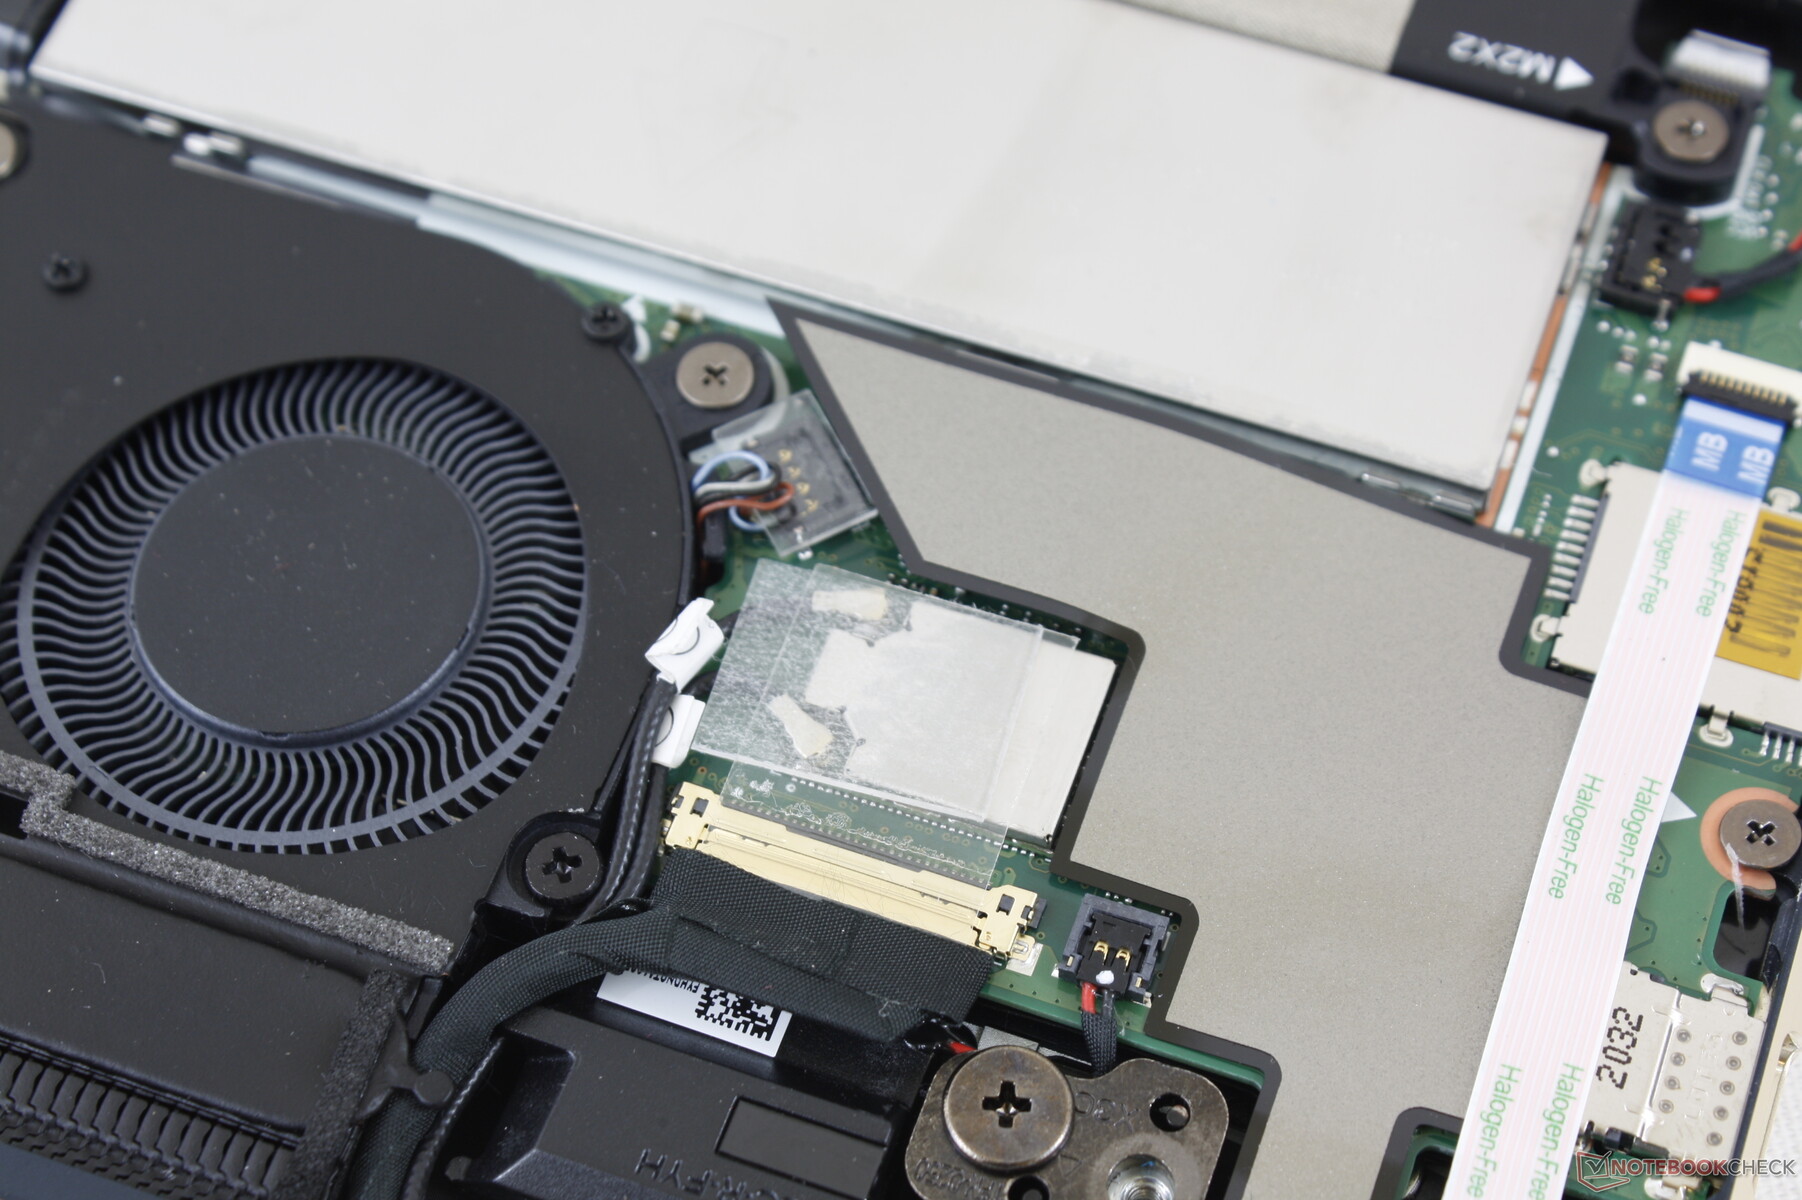
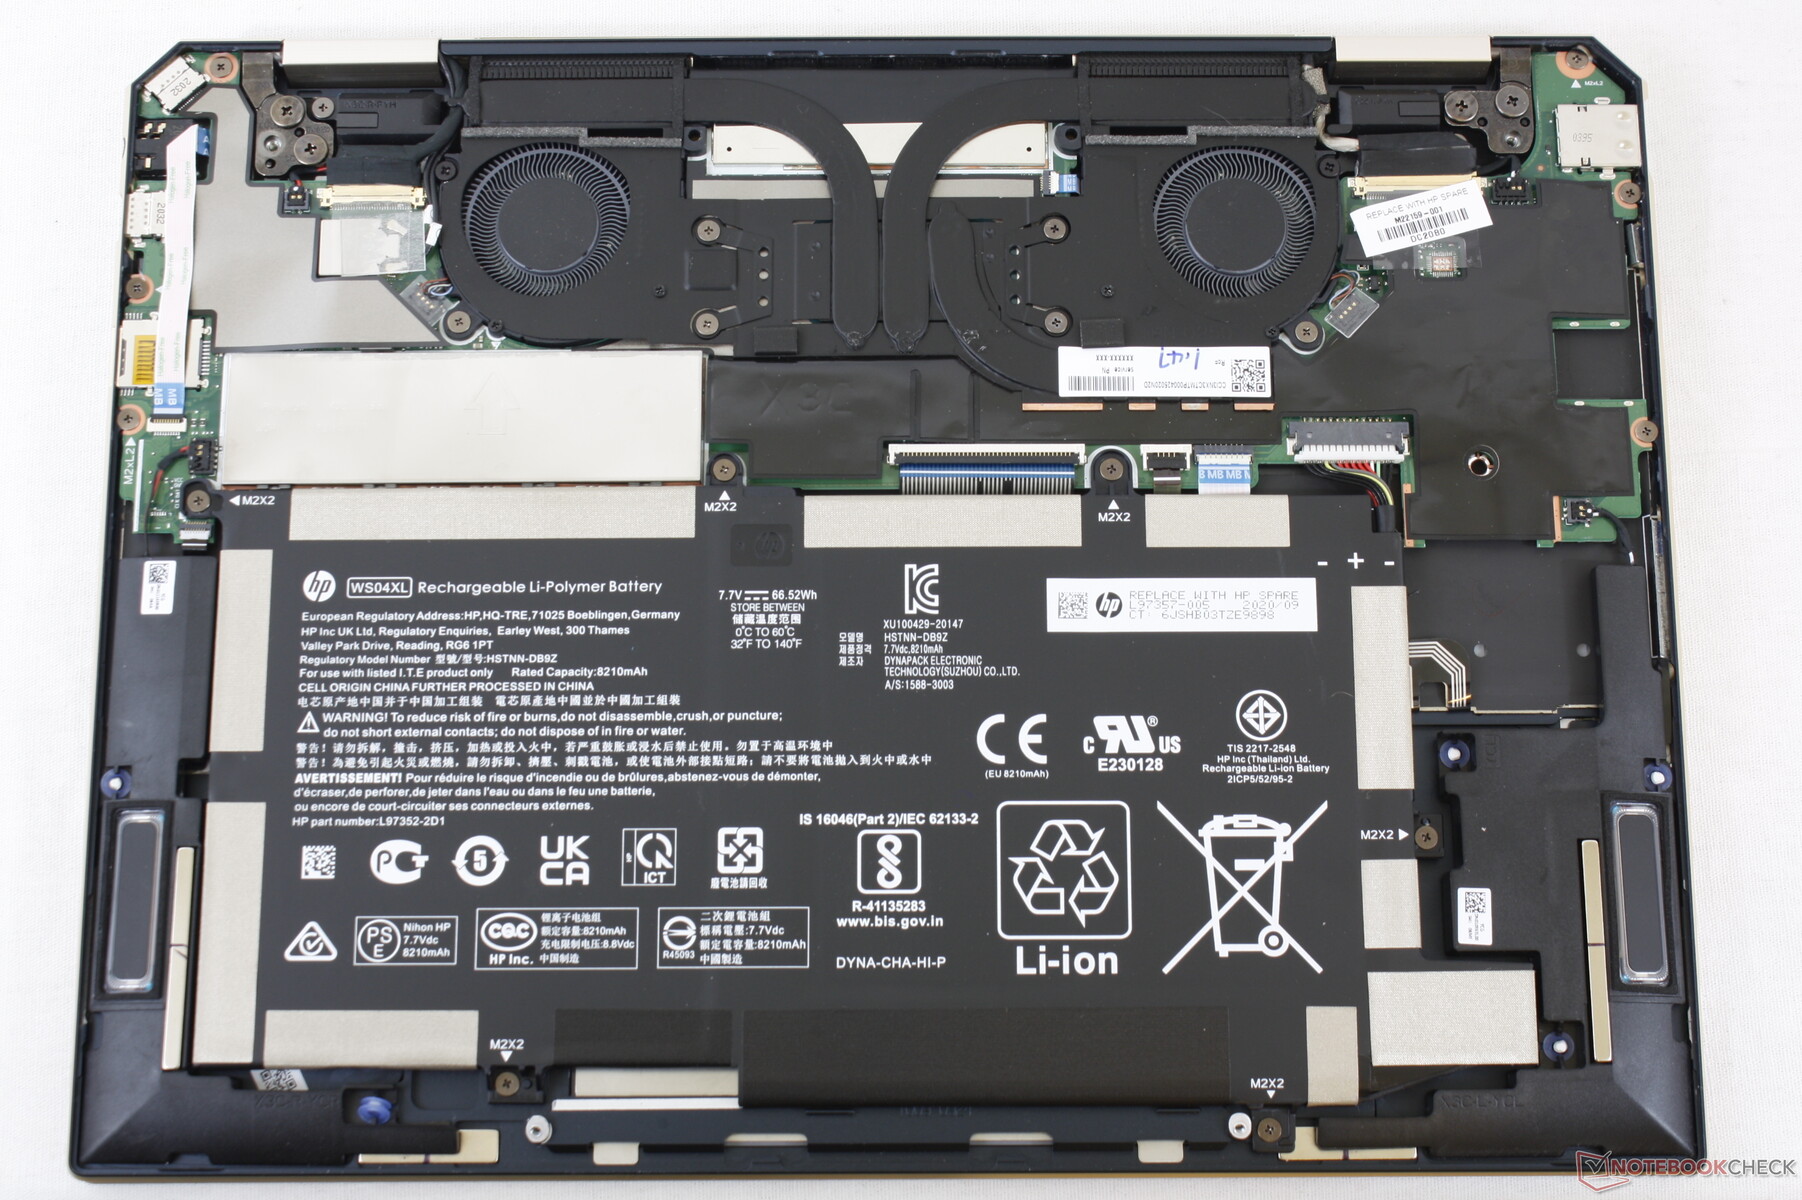
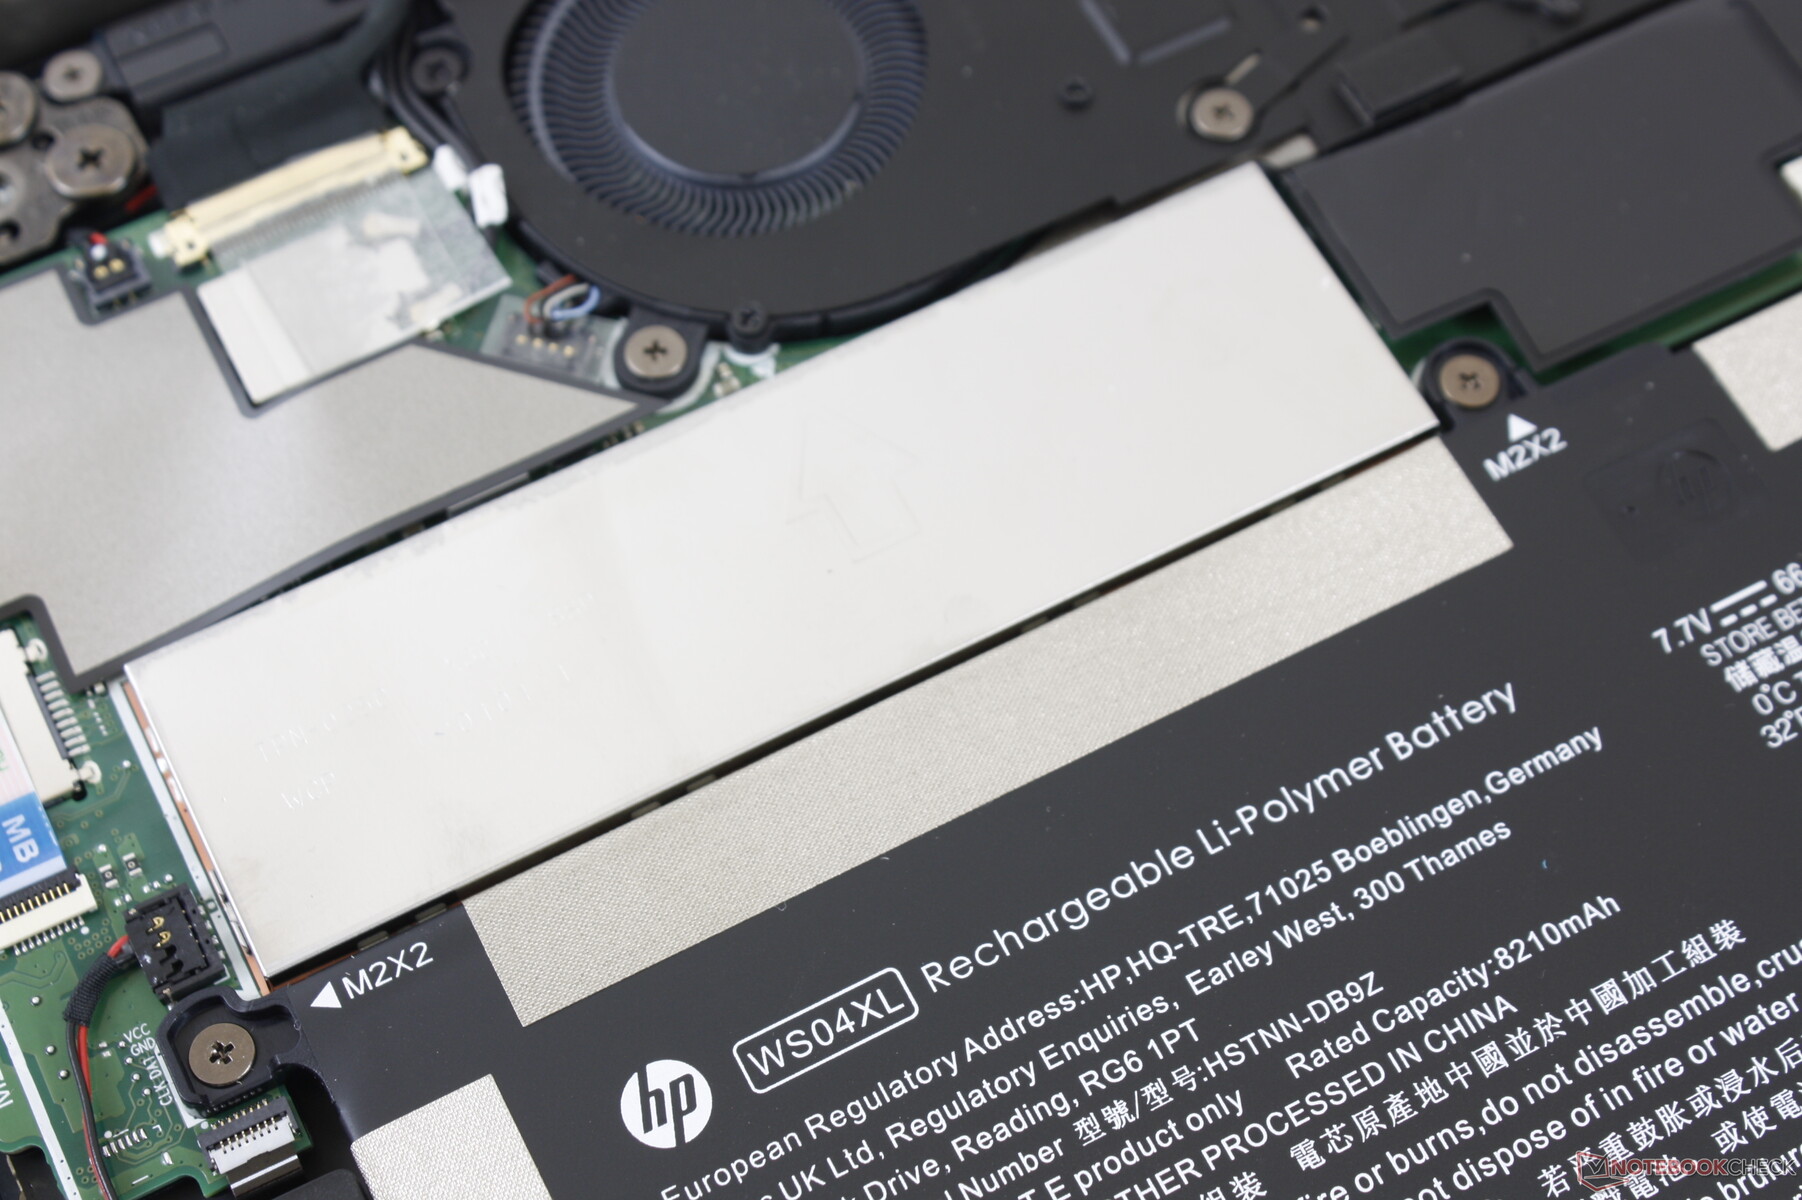
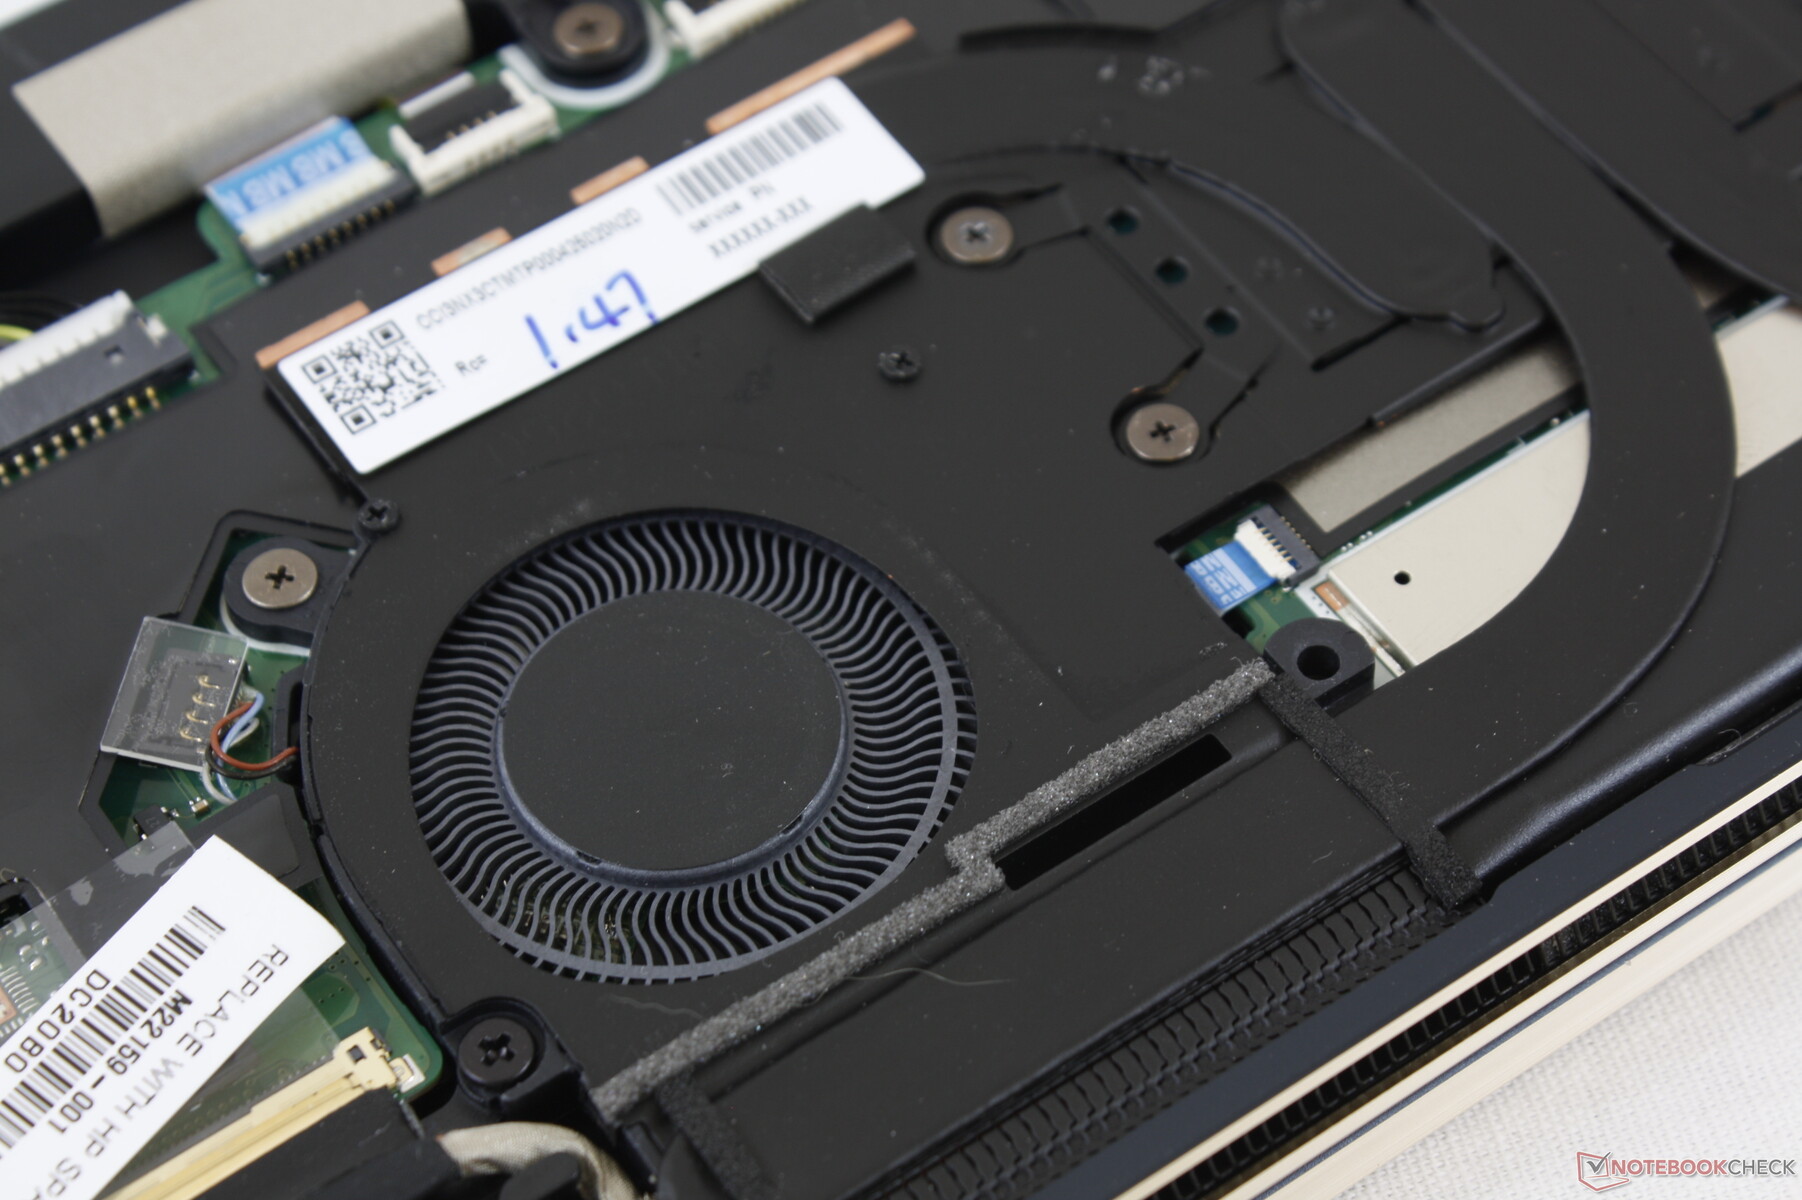
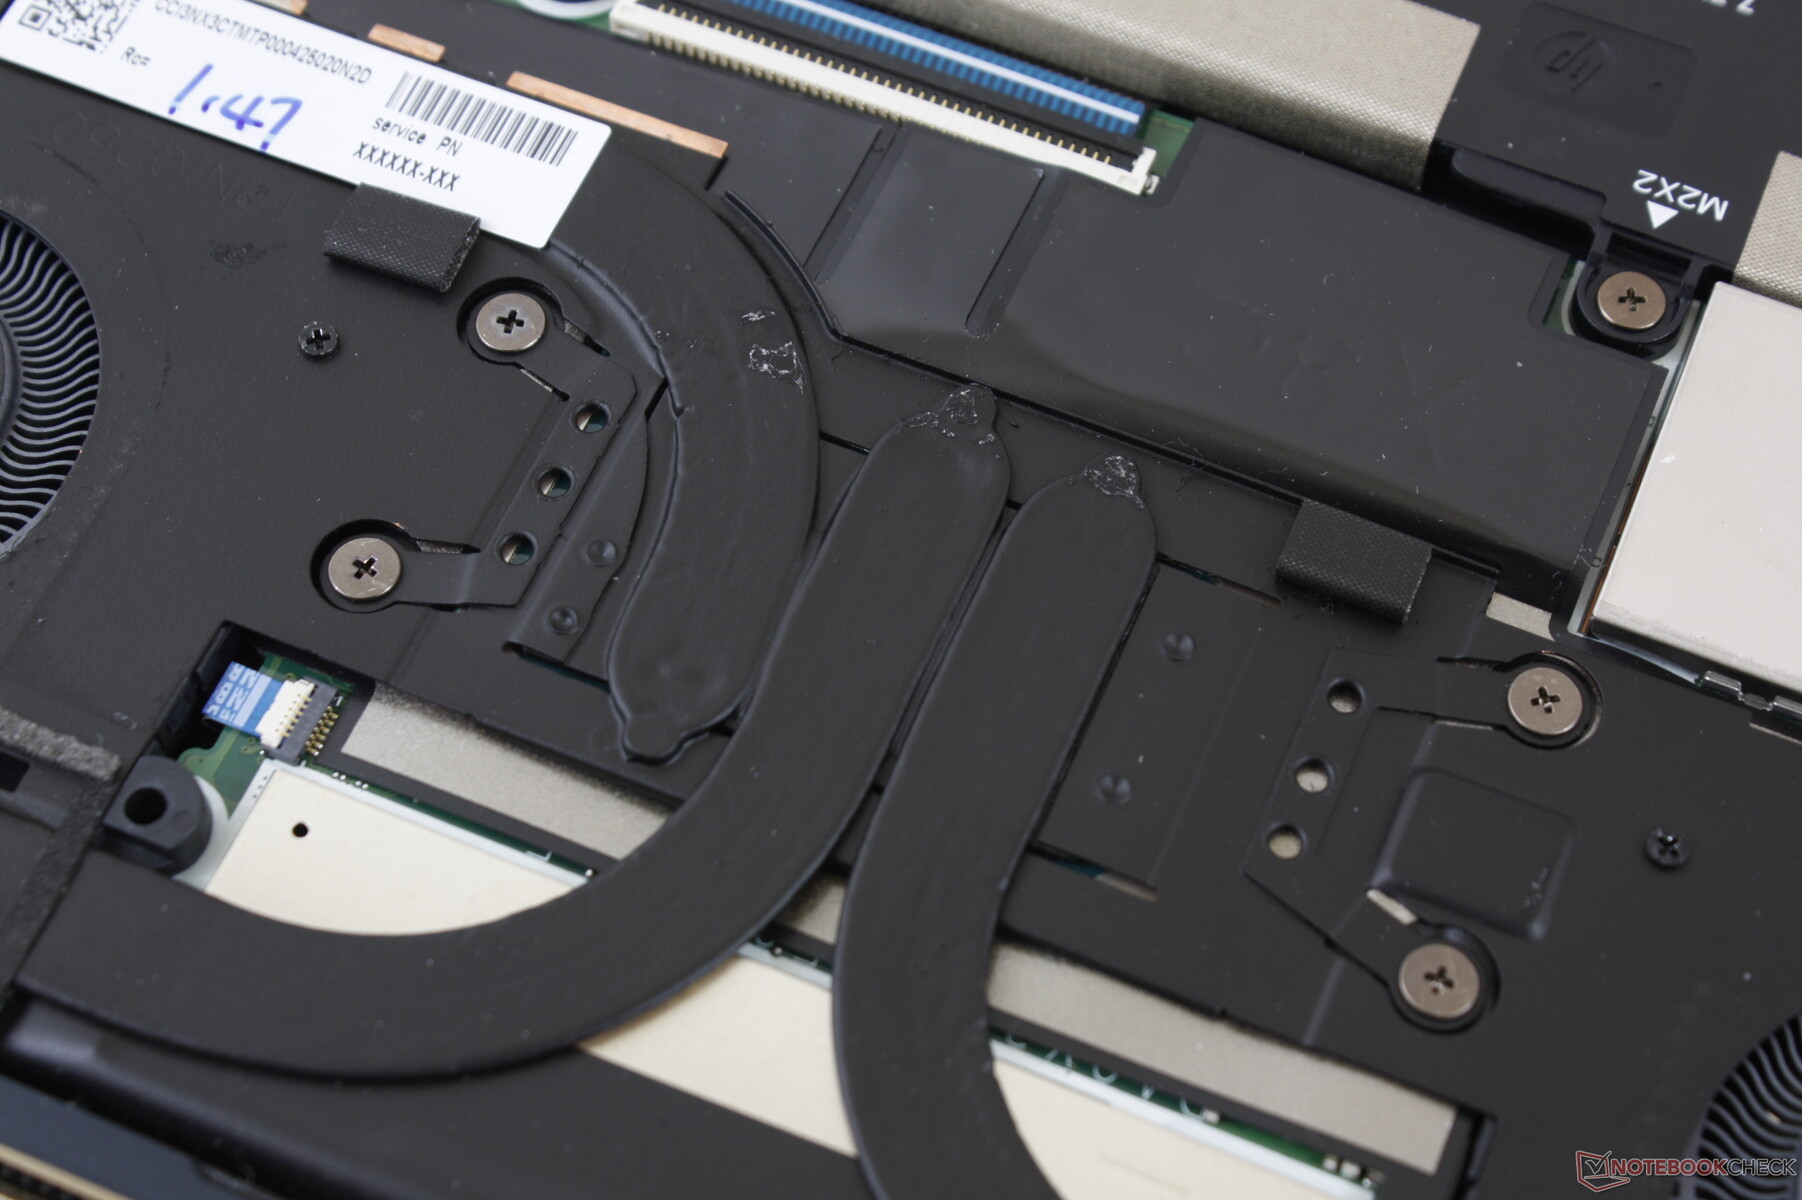
Maintenance
Le panneau inférieur est fixé par deux vis Torx T5 et quatre vis Philips cachées sous les pieds arrière en caoutchouc. Ces dernières vis sont d'un accès très difficile, ce qui peut rendre les mises à niveau SSD plus compliquées qu'elles ne le devraient. La RAM et le WLAN sont tous deux soudés.
Accessoires et garantie
L'emballage de vente au détail comprend une pochette de transport et le stylo actif HP MPP2.0 gratuit. La garantie limitée standard d'un an s'applique avec de nombreuses options d'extension si elle est commandée directement auprès de HP.com.
Dispositifs de saisie
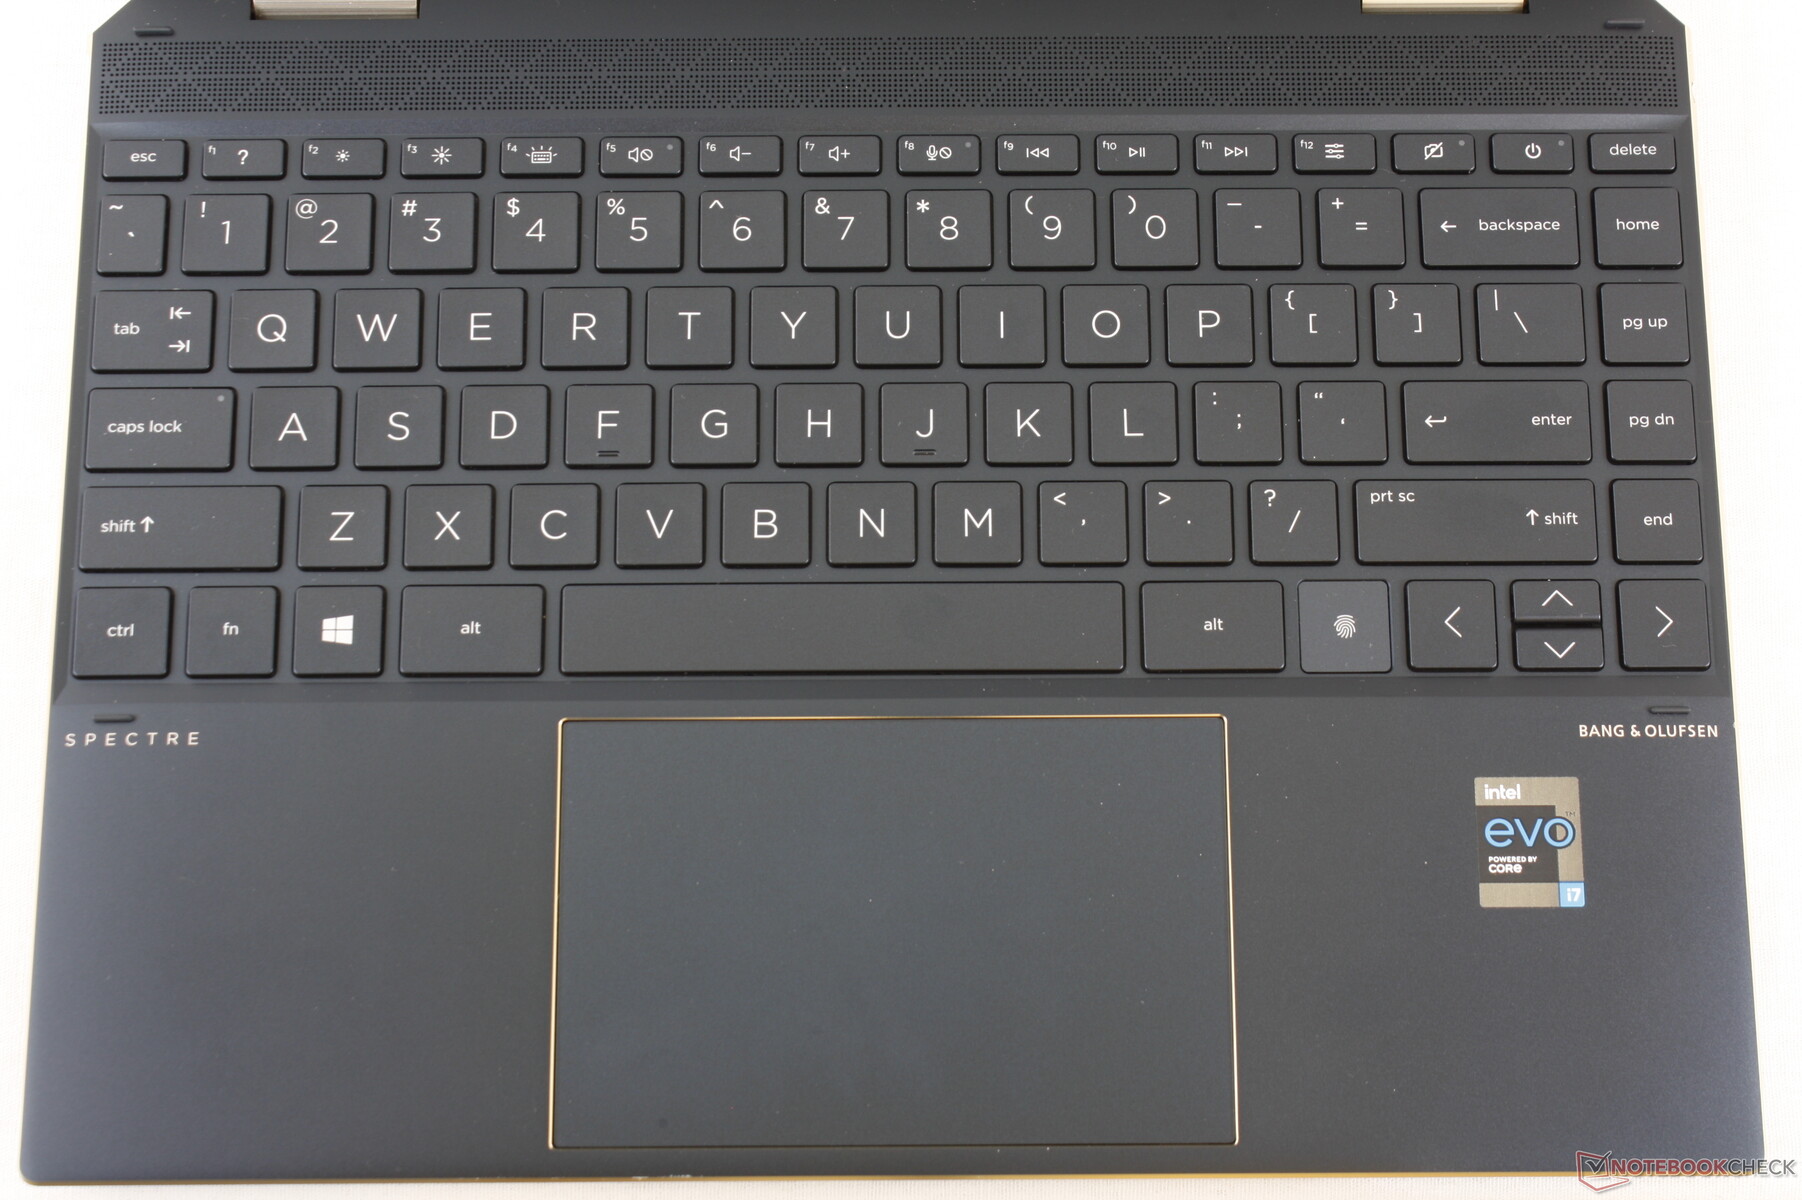
Clavier
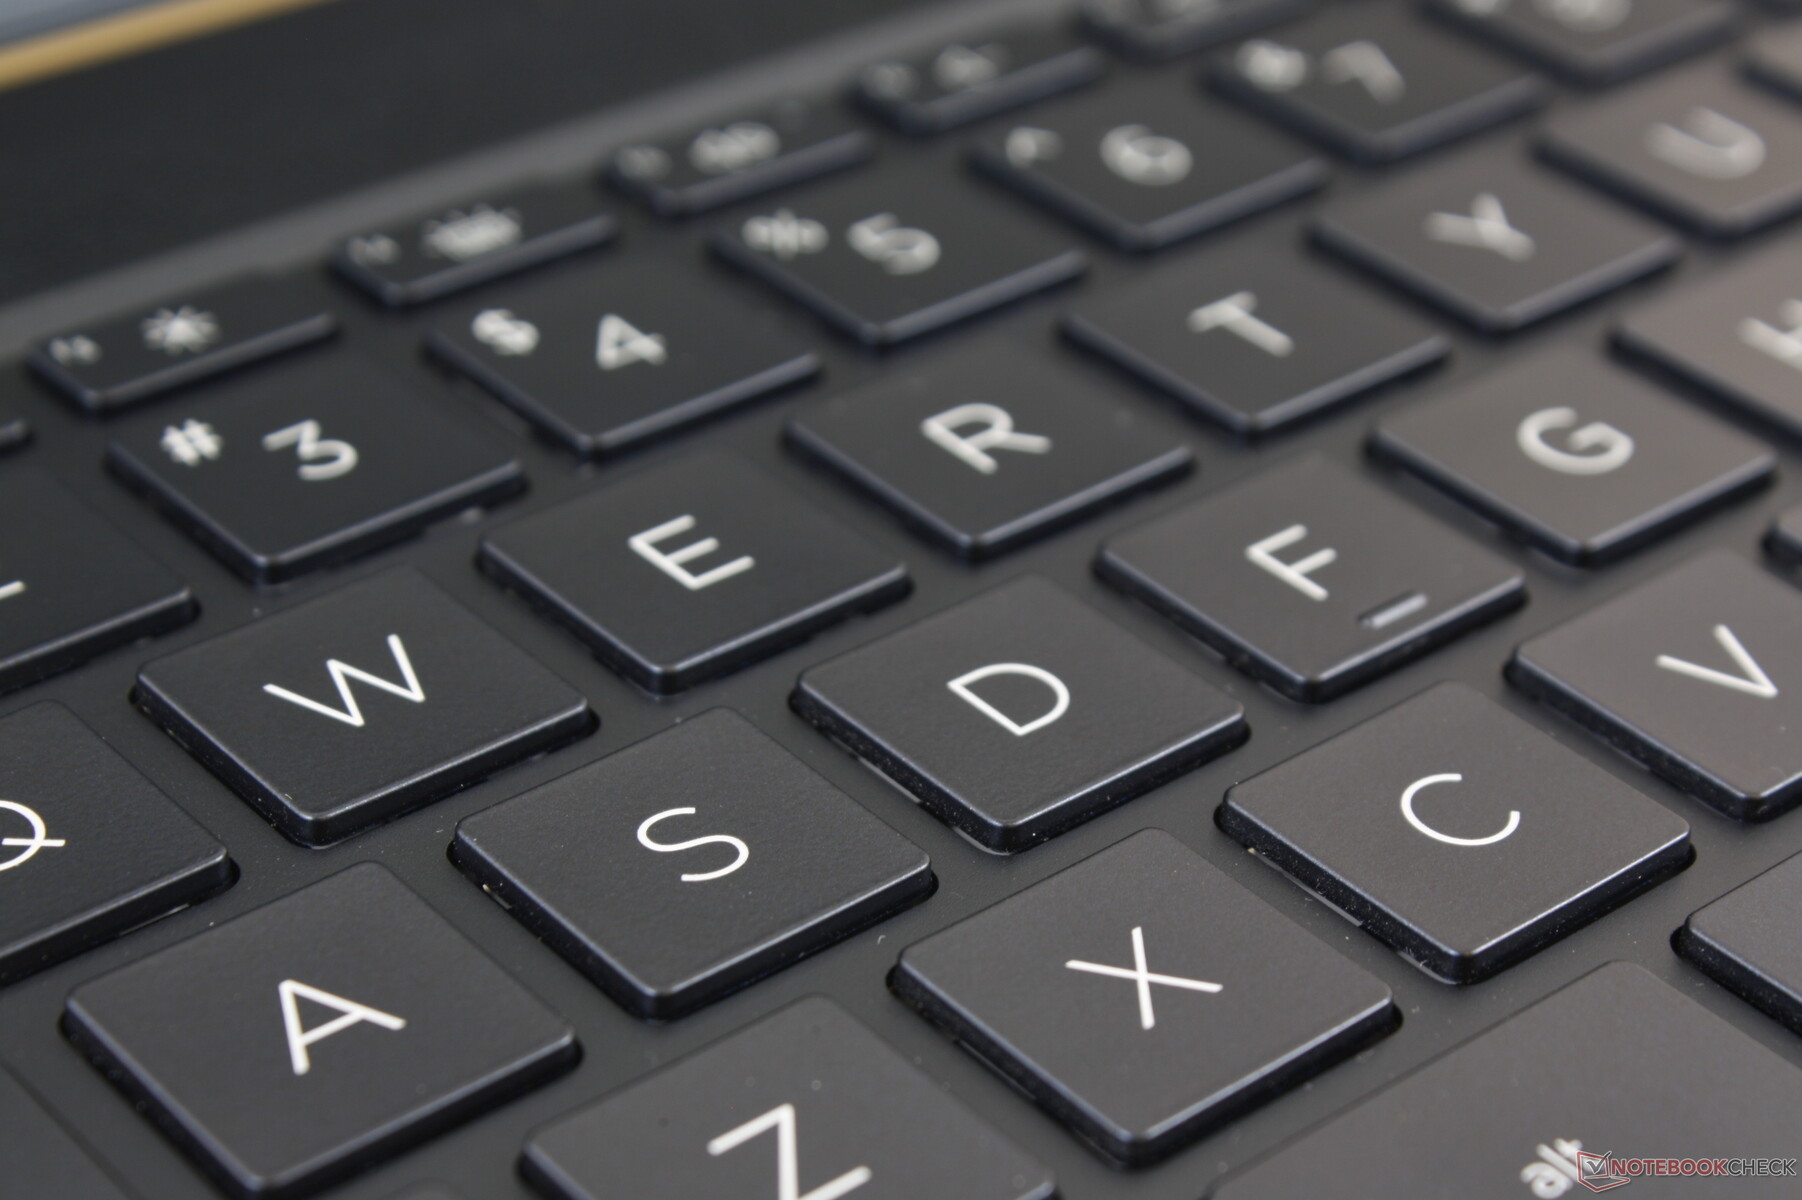
HP dispose de certains des meilleurs claviers d'ordinateur portable pour ses familles Spectre et EliteBook. Le feedback est plus net et plus profond pour une expérience de frappe plus satisfaisante que les claviers souvent moins profonds et plus spongieux de la plupart des autres ultrabooks. Les touches du clavier XPS 13, par exemple, sont moins profondes et la pression de saisie est plus légère. Tout dépend bien sûr des préférences de l'utilisateur. Nous vous recommandons de tester les claviers du Spectre x360 13 ou 15 pour avoir une bonne idée de ce que ressent le clavier du Spectre x360 14
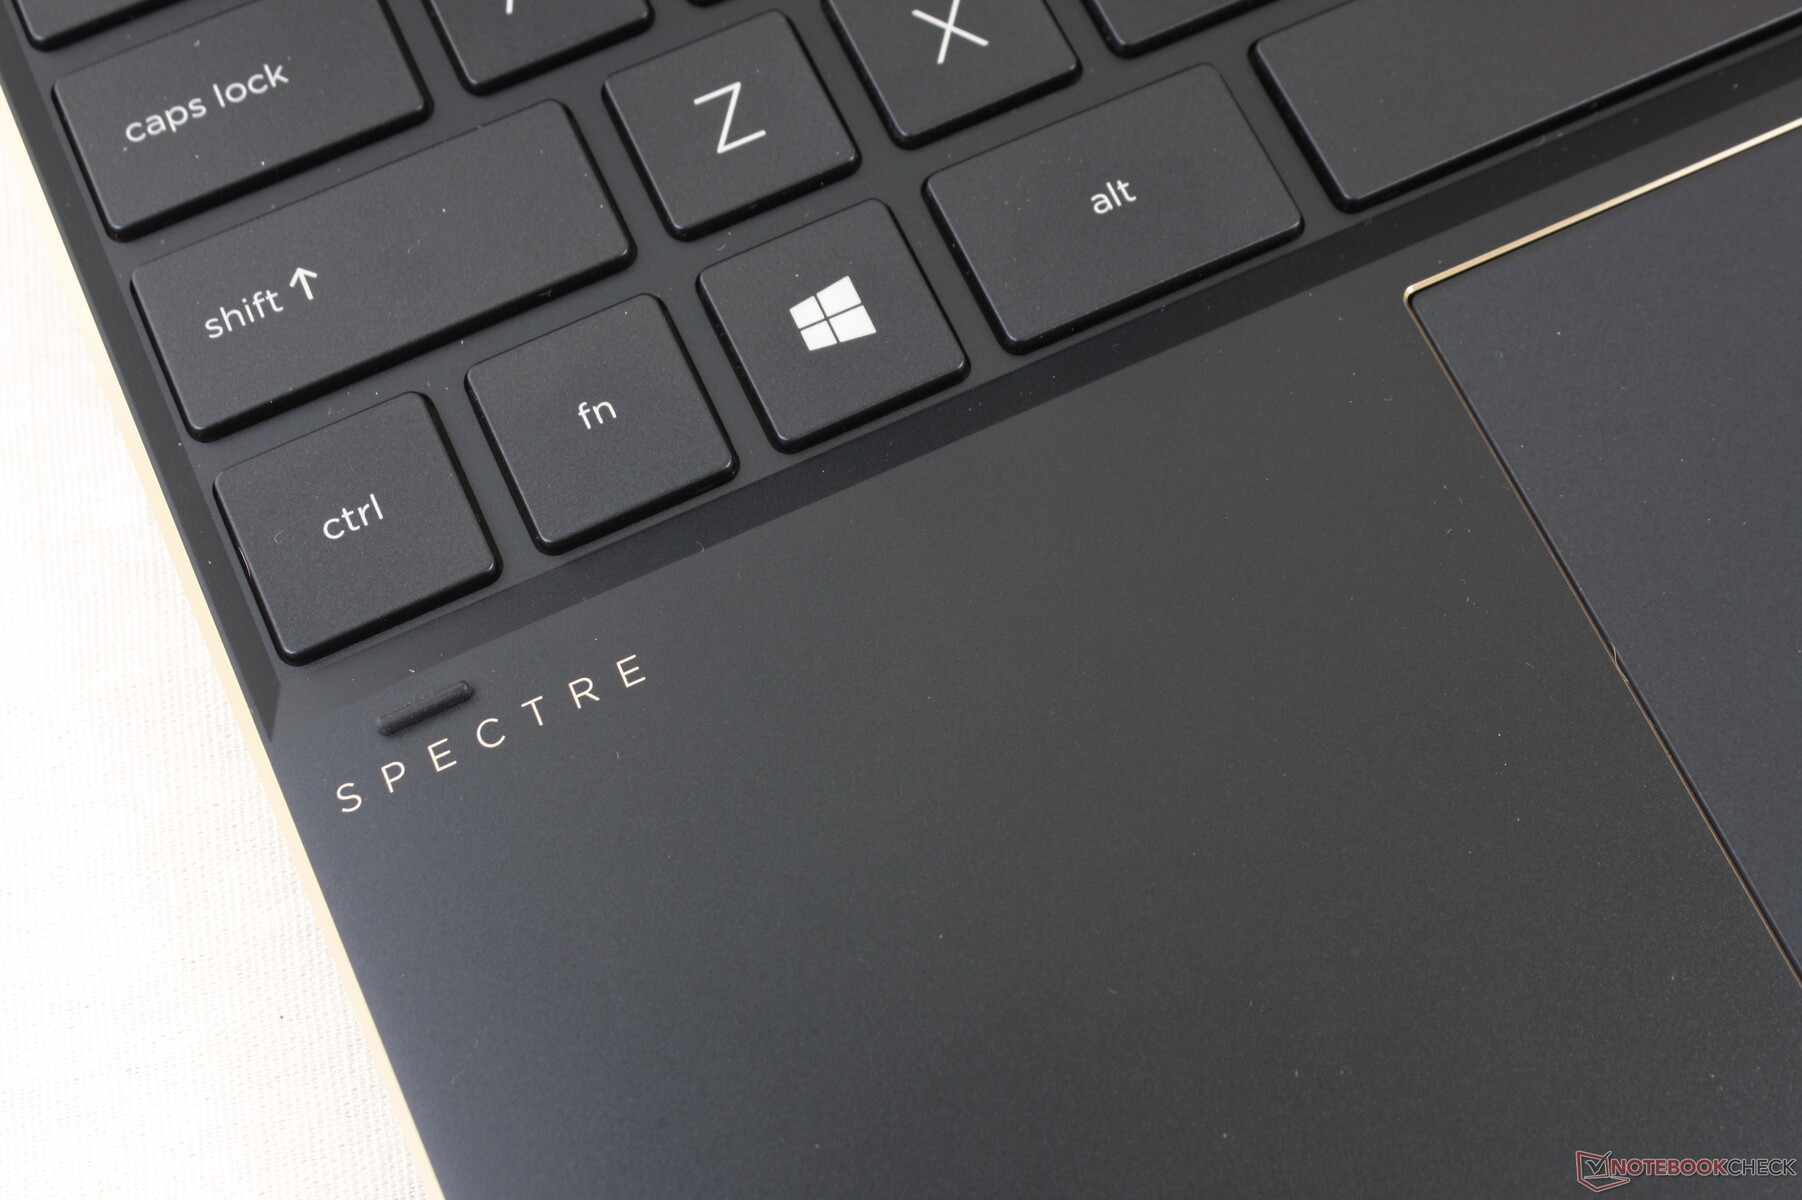
La disposition des touches est un mélange. Le lecteur d'empreintes digitales, en particulier, remplace la touche Ctrl, ce qui signifie que les utilisateurs qui ont utilisé cette touche sur d'autres ordinateurs portables trouveront ce changement ennuyeux. Par ailleurs, le bouton d'alimentation prend un peu plus de force à enfoncer que les touches environnantes pour éviter les pressions accidentelles, mais nous aurions préféré un bouton d'alimentation activé par les empreintes digitales à la place.
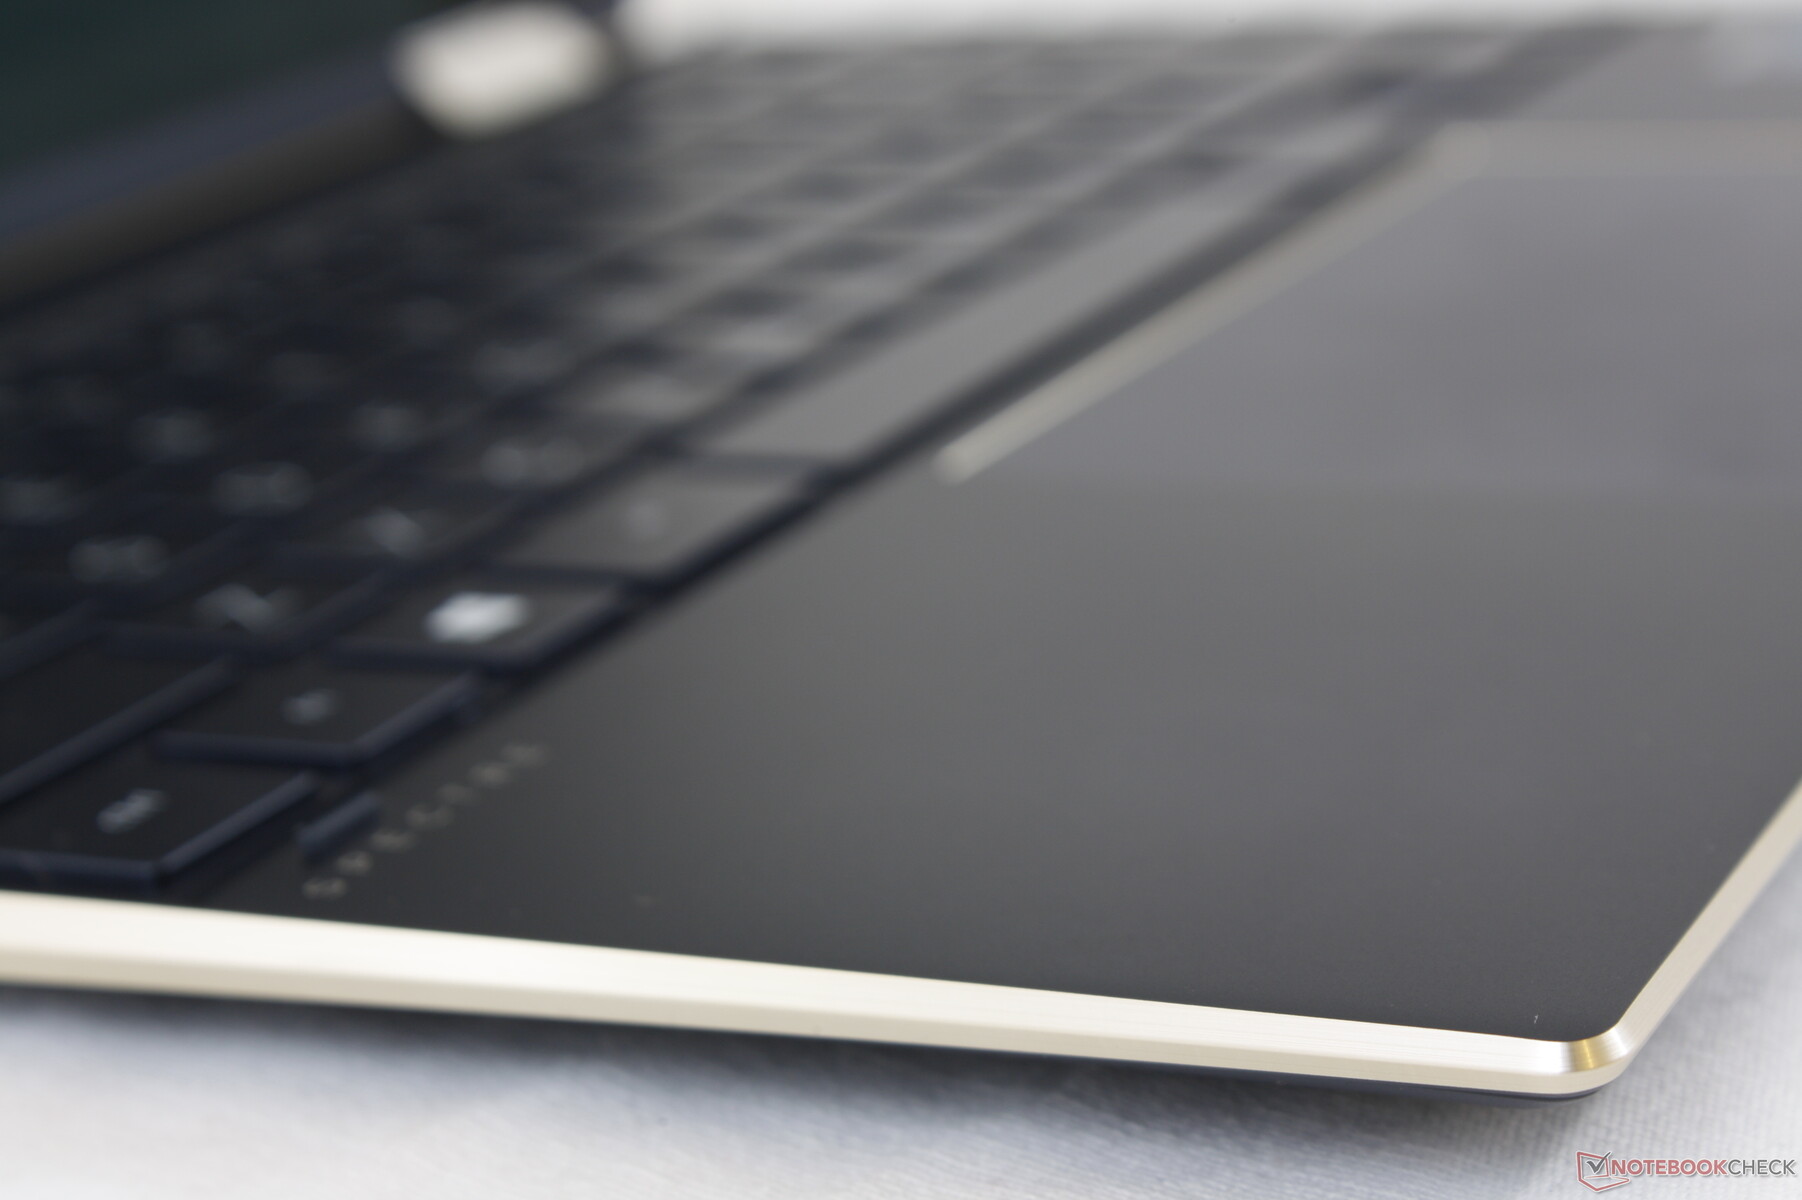
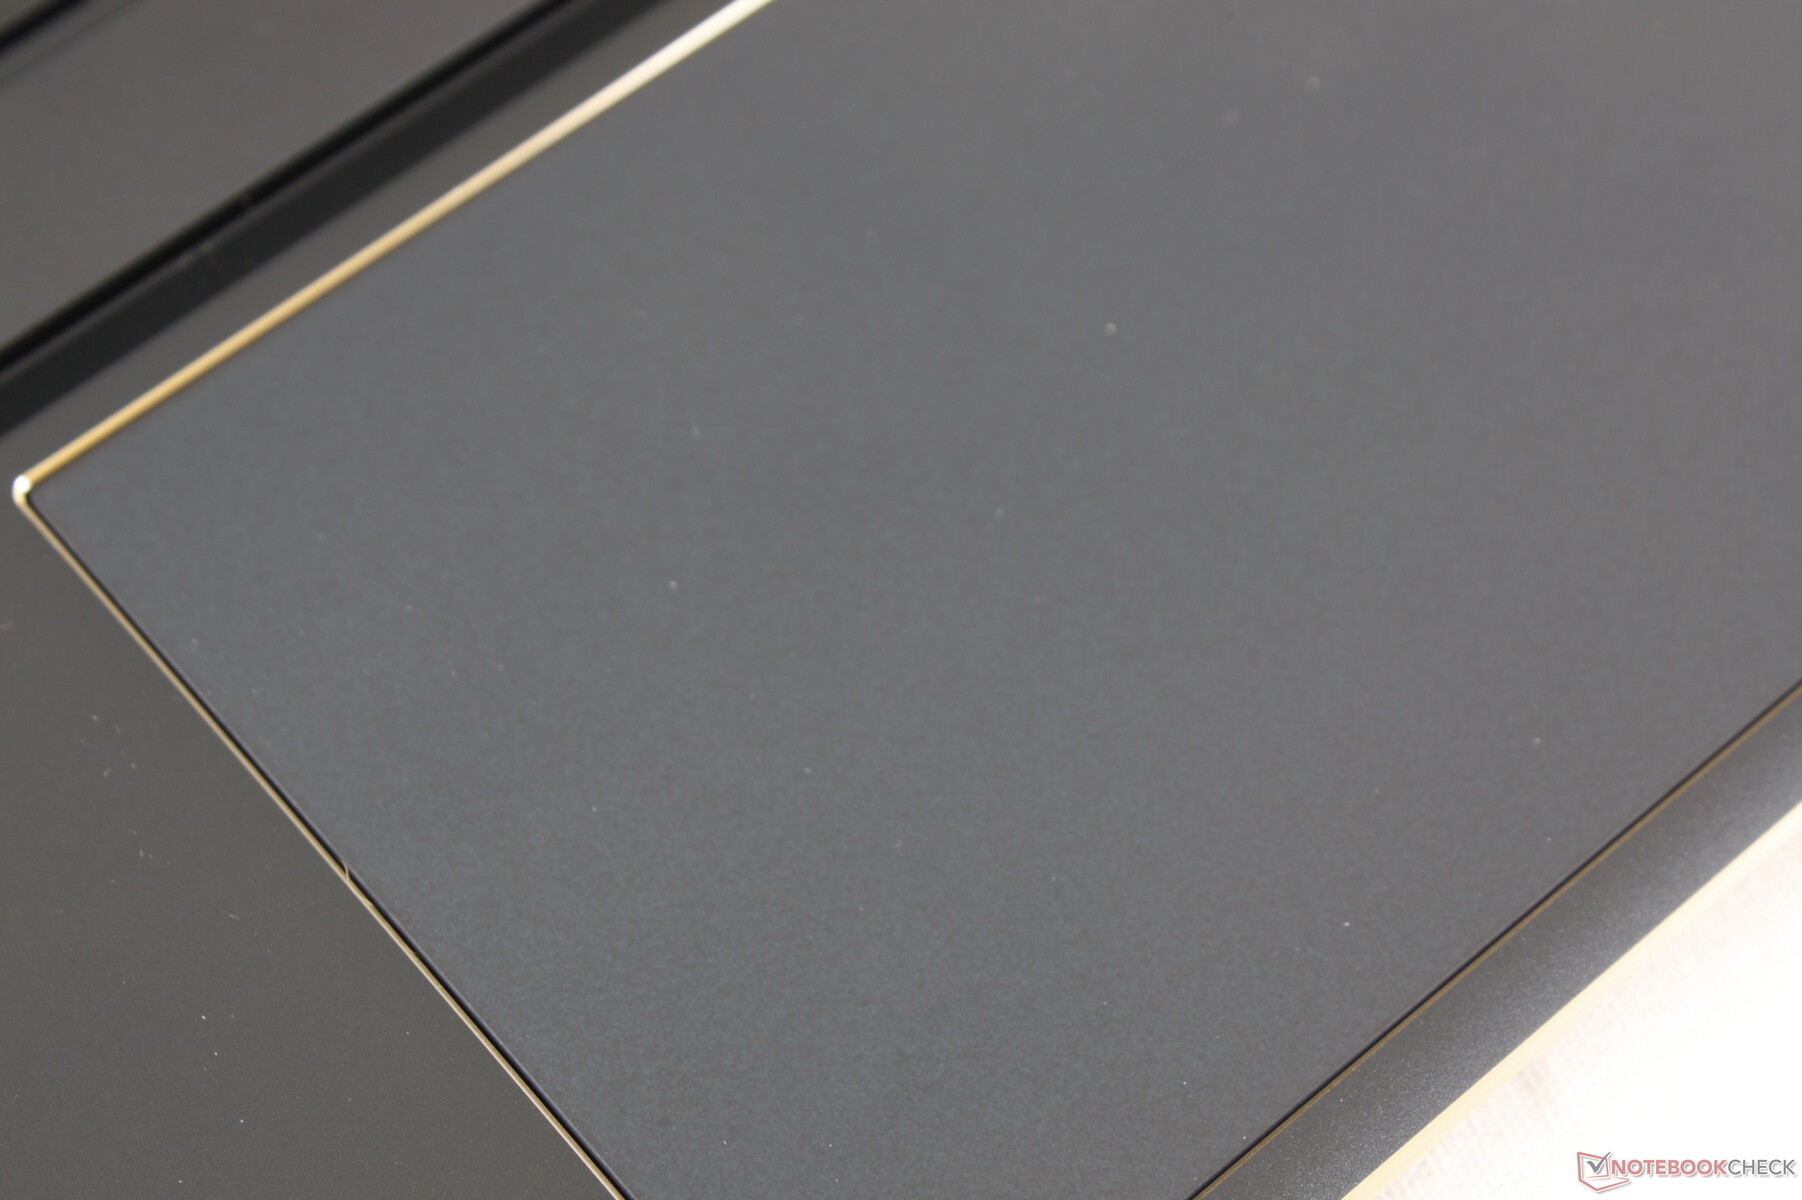
Touchpad
Le clickpad est plus grand que celui du Spectre x360 13 (11,5 x 7,4 cm contre 11,1 x 5,6 cm) en raison de la plus grande longueur du châssis. La texture est également lisse et très peu collante lorsque le curseur glisse à faible vitesse pour un contrôle précis du curseur. Le clic sur le pavé tactile est audible et satisfaisant, même si le feedback aurait pu être plus ferme.
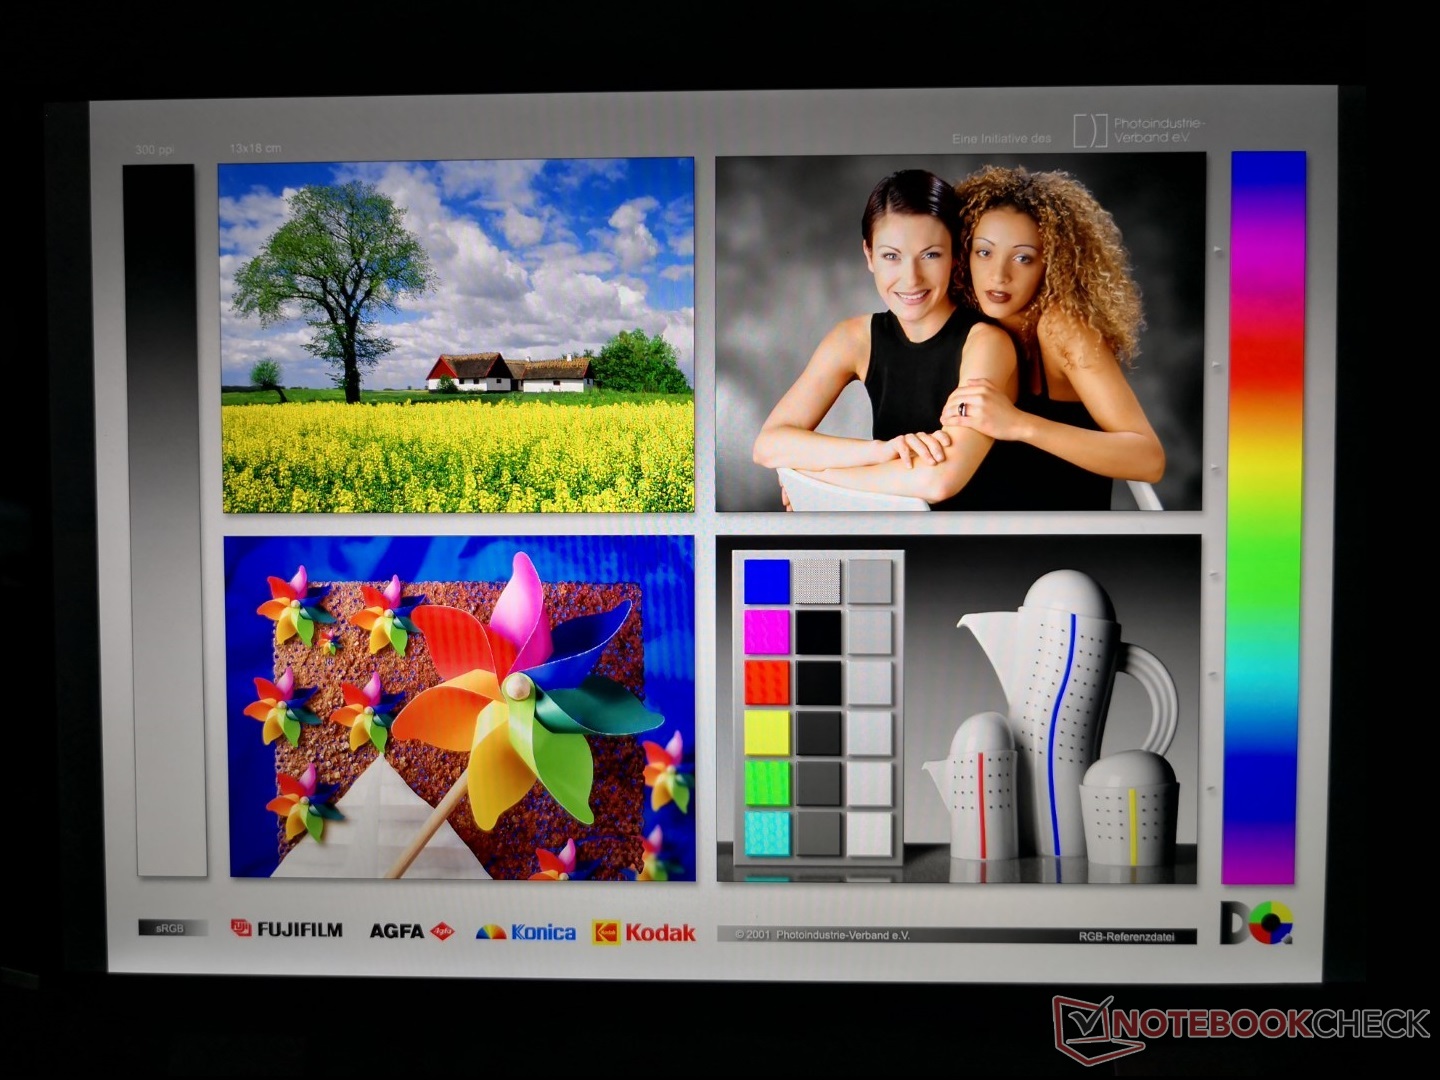
Afficher
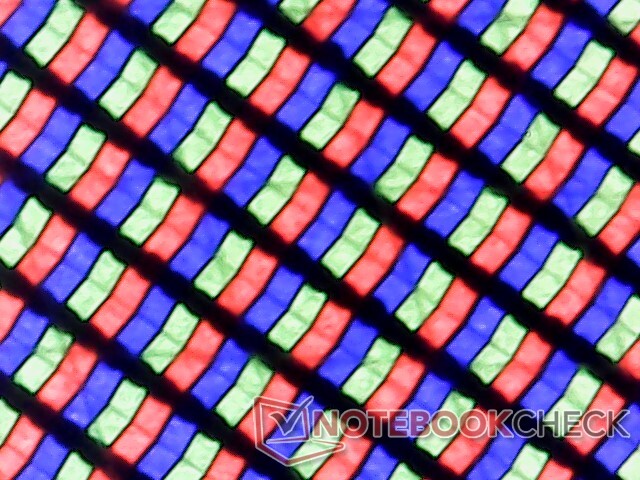
Le panneau de base LG Philips FHD est un panneau IPS de haute qualité digne du nom de Spectre. Il excelle en offrant un rapport de contraste très élevé de plus de 2500:1, comparé à la moitié de celui de la plupart des autres ultrabooks phares. Les temps de réponse en noir et blanc sont toutefois relativement lents pour les fantômes visibles. La mise à niveau vers l'option OLED, plus coûteuse, résoudra complètement ce problème.
HP propose des options de luminosité de 1000 pixels pour être au moins deux fois plus lumineux que tout ce qui existe dans les séries Dell XPS, Lenovo Yoga, Microsoft Surface ou Asus ZenBook. Cette fonction n'est disponible que pour les références FHD IPS et se trouve également sur certains ordinateurs portables EliteBook. L'option de base 400-nit est par ailleurs suffisante si vous prévoyez d'utiliser le cabriolet principalement à l'intérieur car il est déjà plus lumineux que l'écran du Lenovo Yoga 9i.
| |||||||||||||||||||||||||
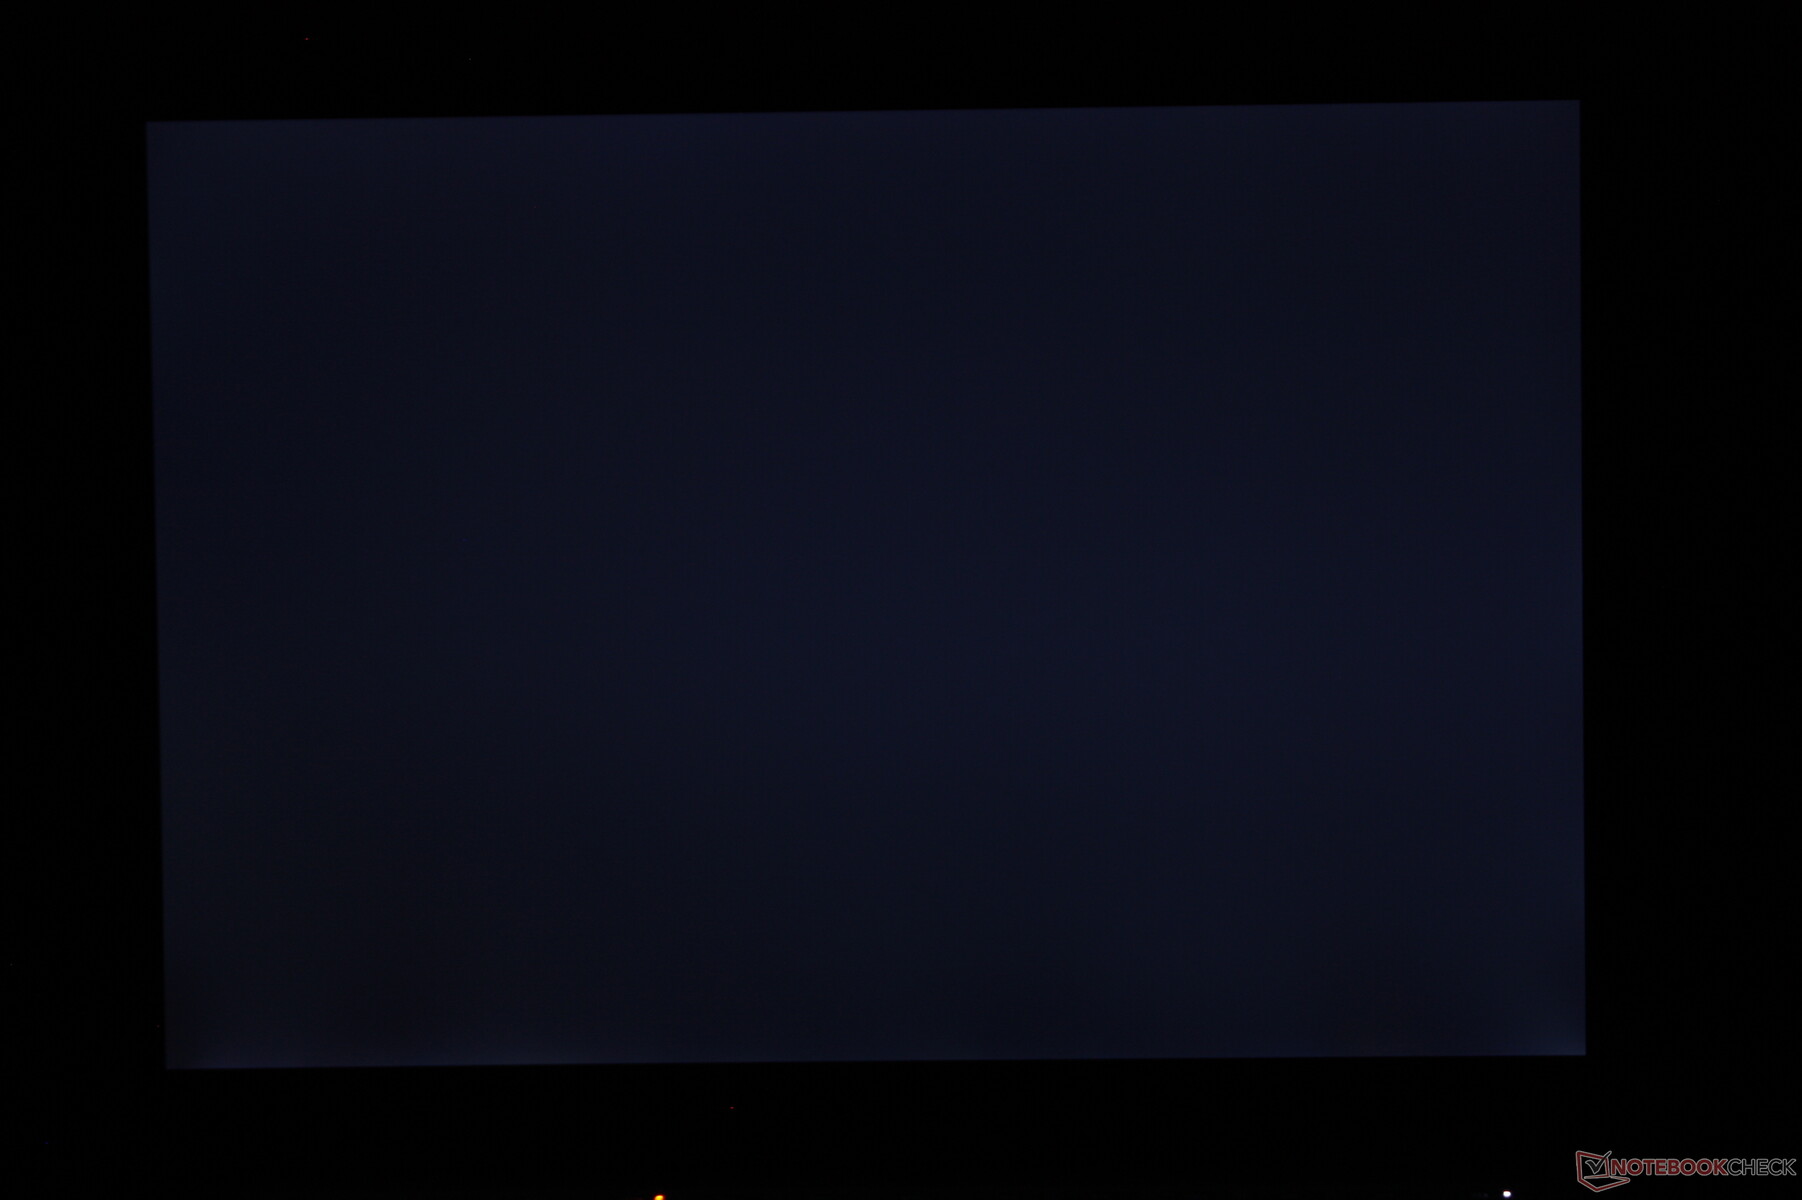
Homogénéité de la luminosité: 78 %
Valeur mesurée au centre, sur batterie: 443.5 cd/m²
Contraste: 2609:1 (Valeurs des noirs: 0.17 cd/m²)
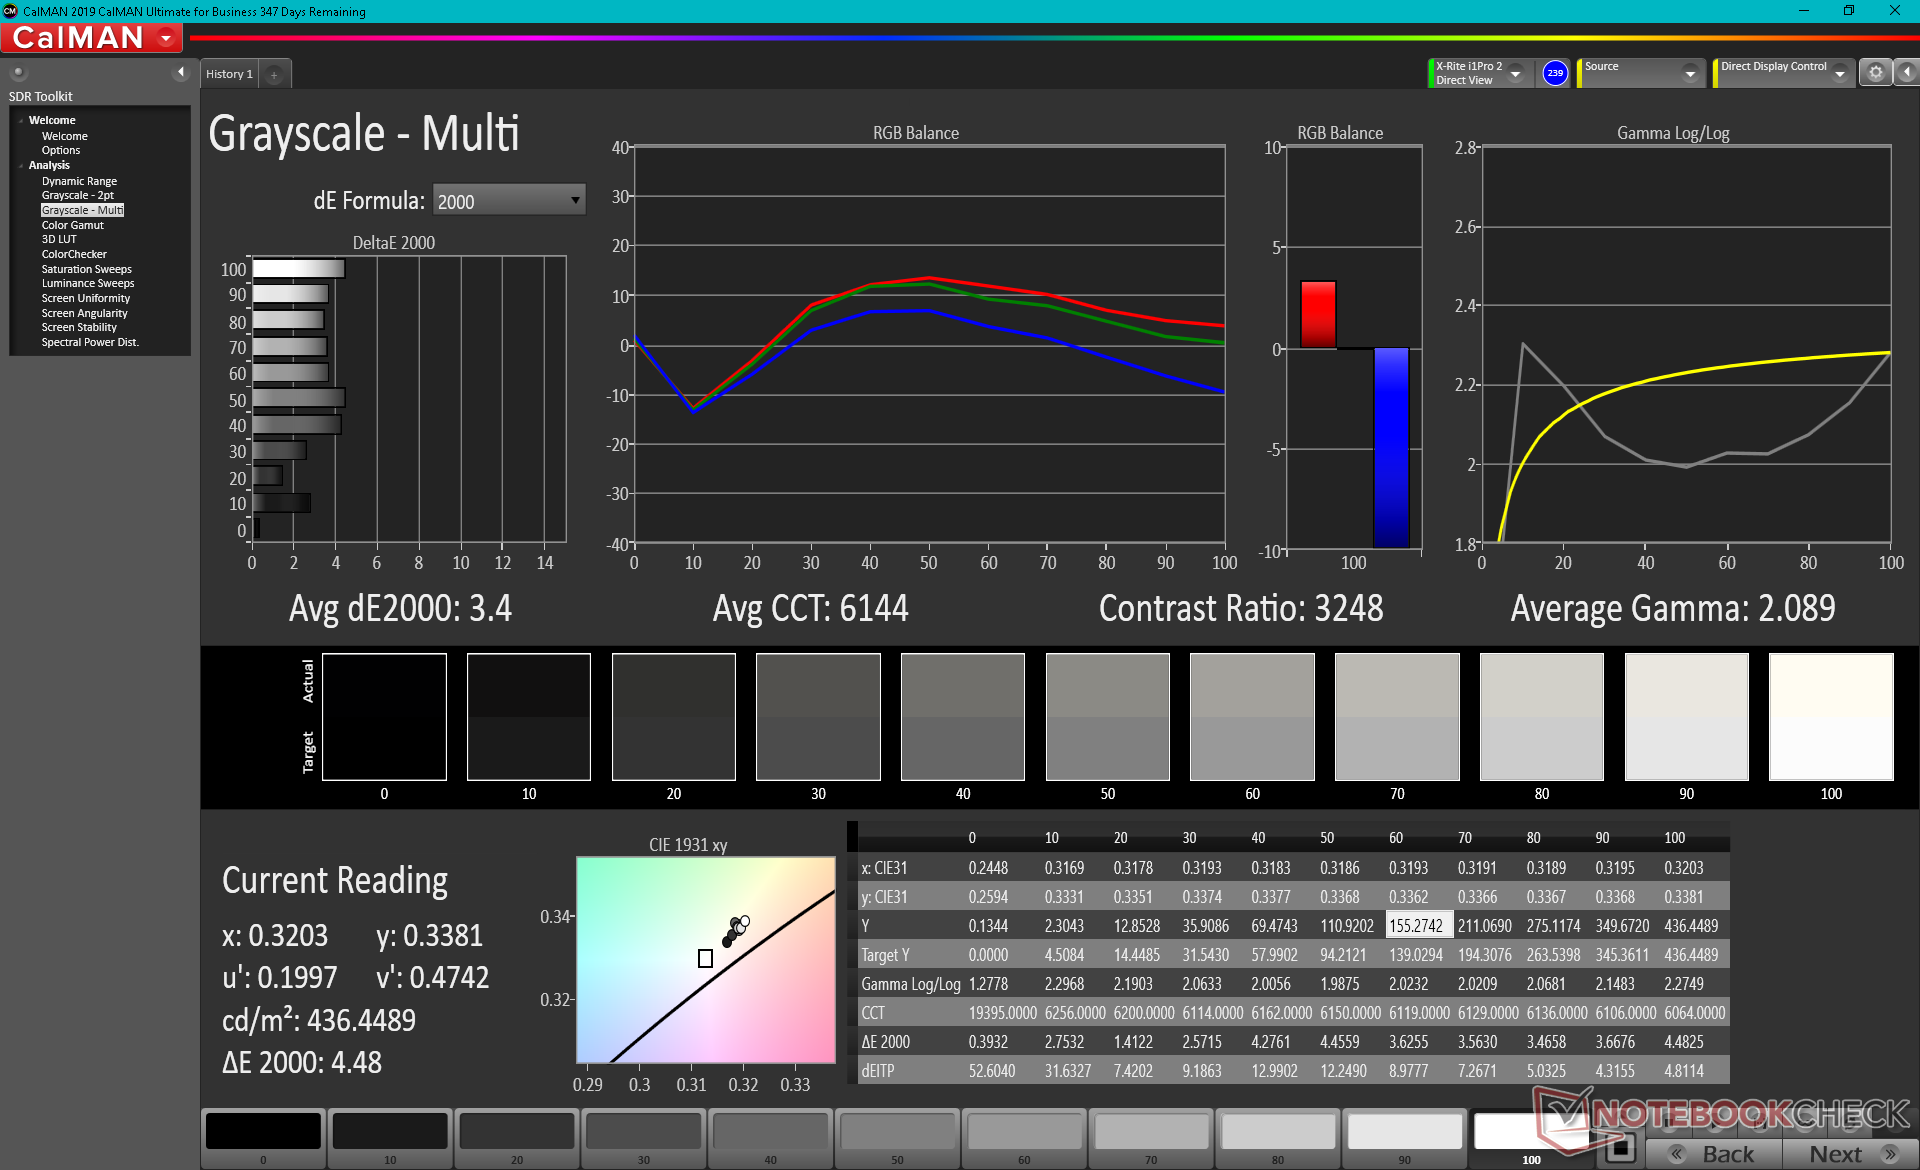
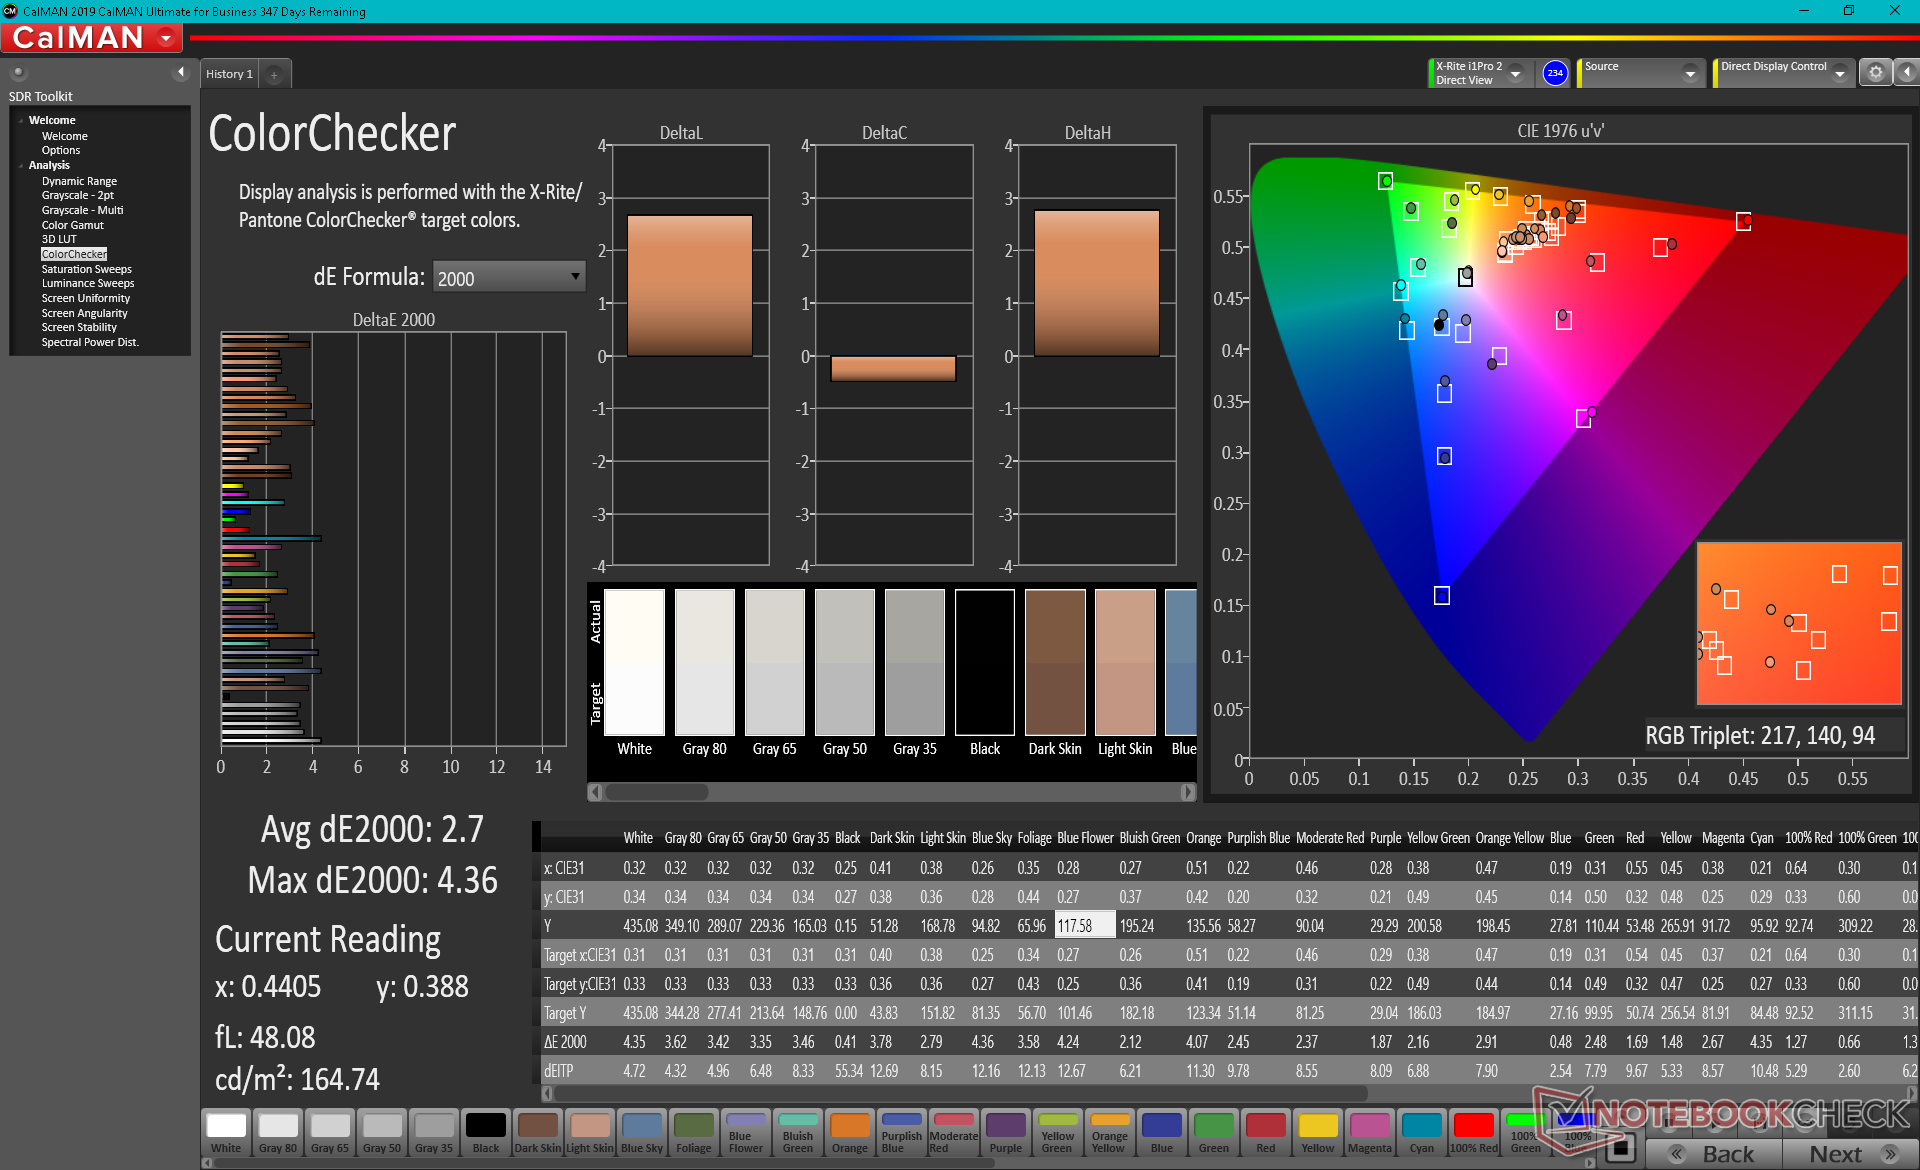
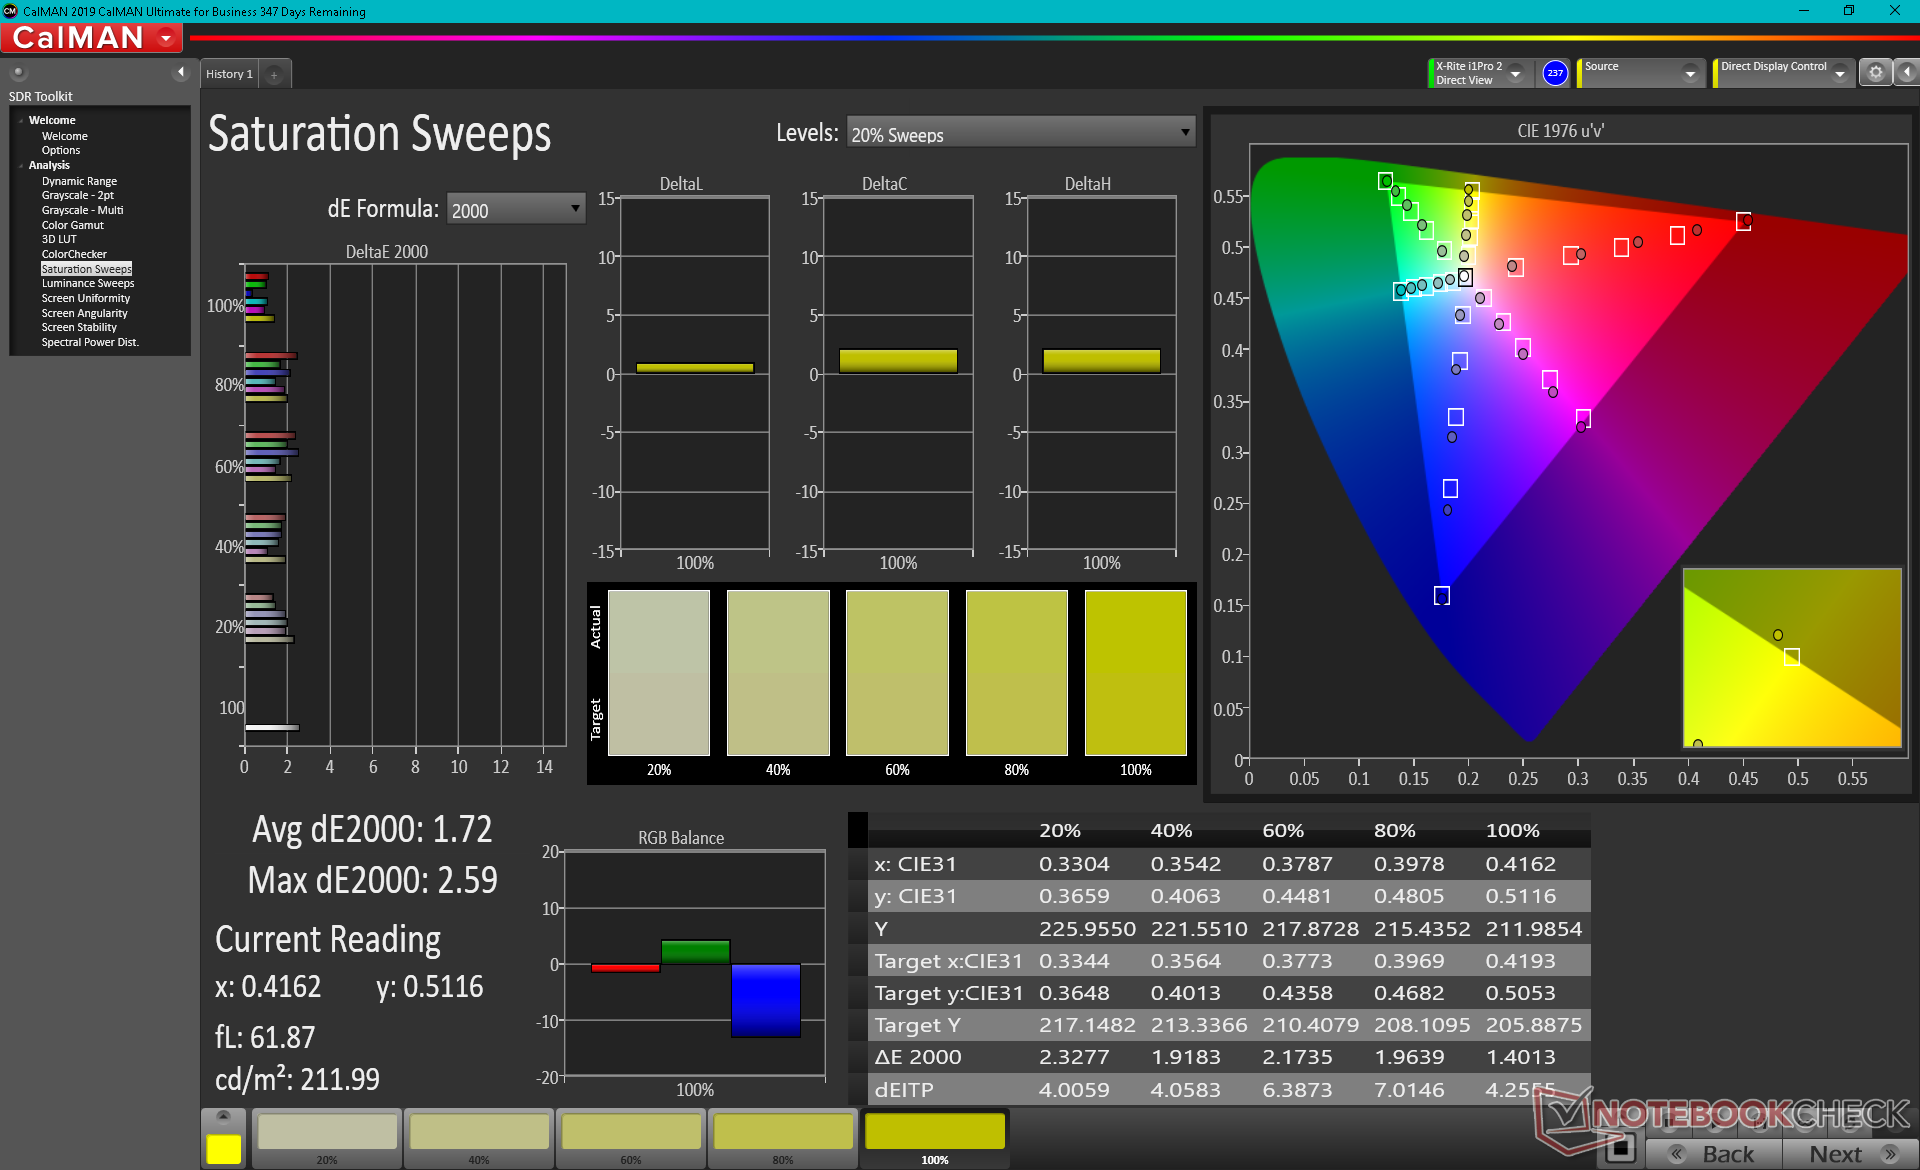
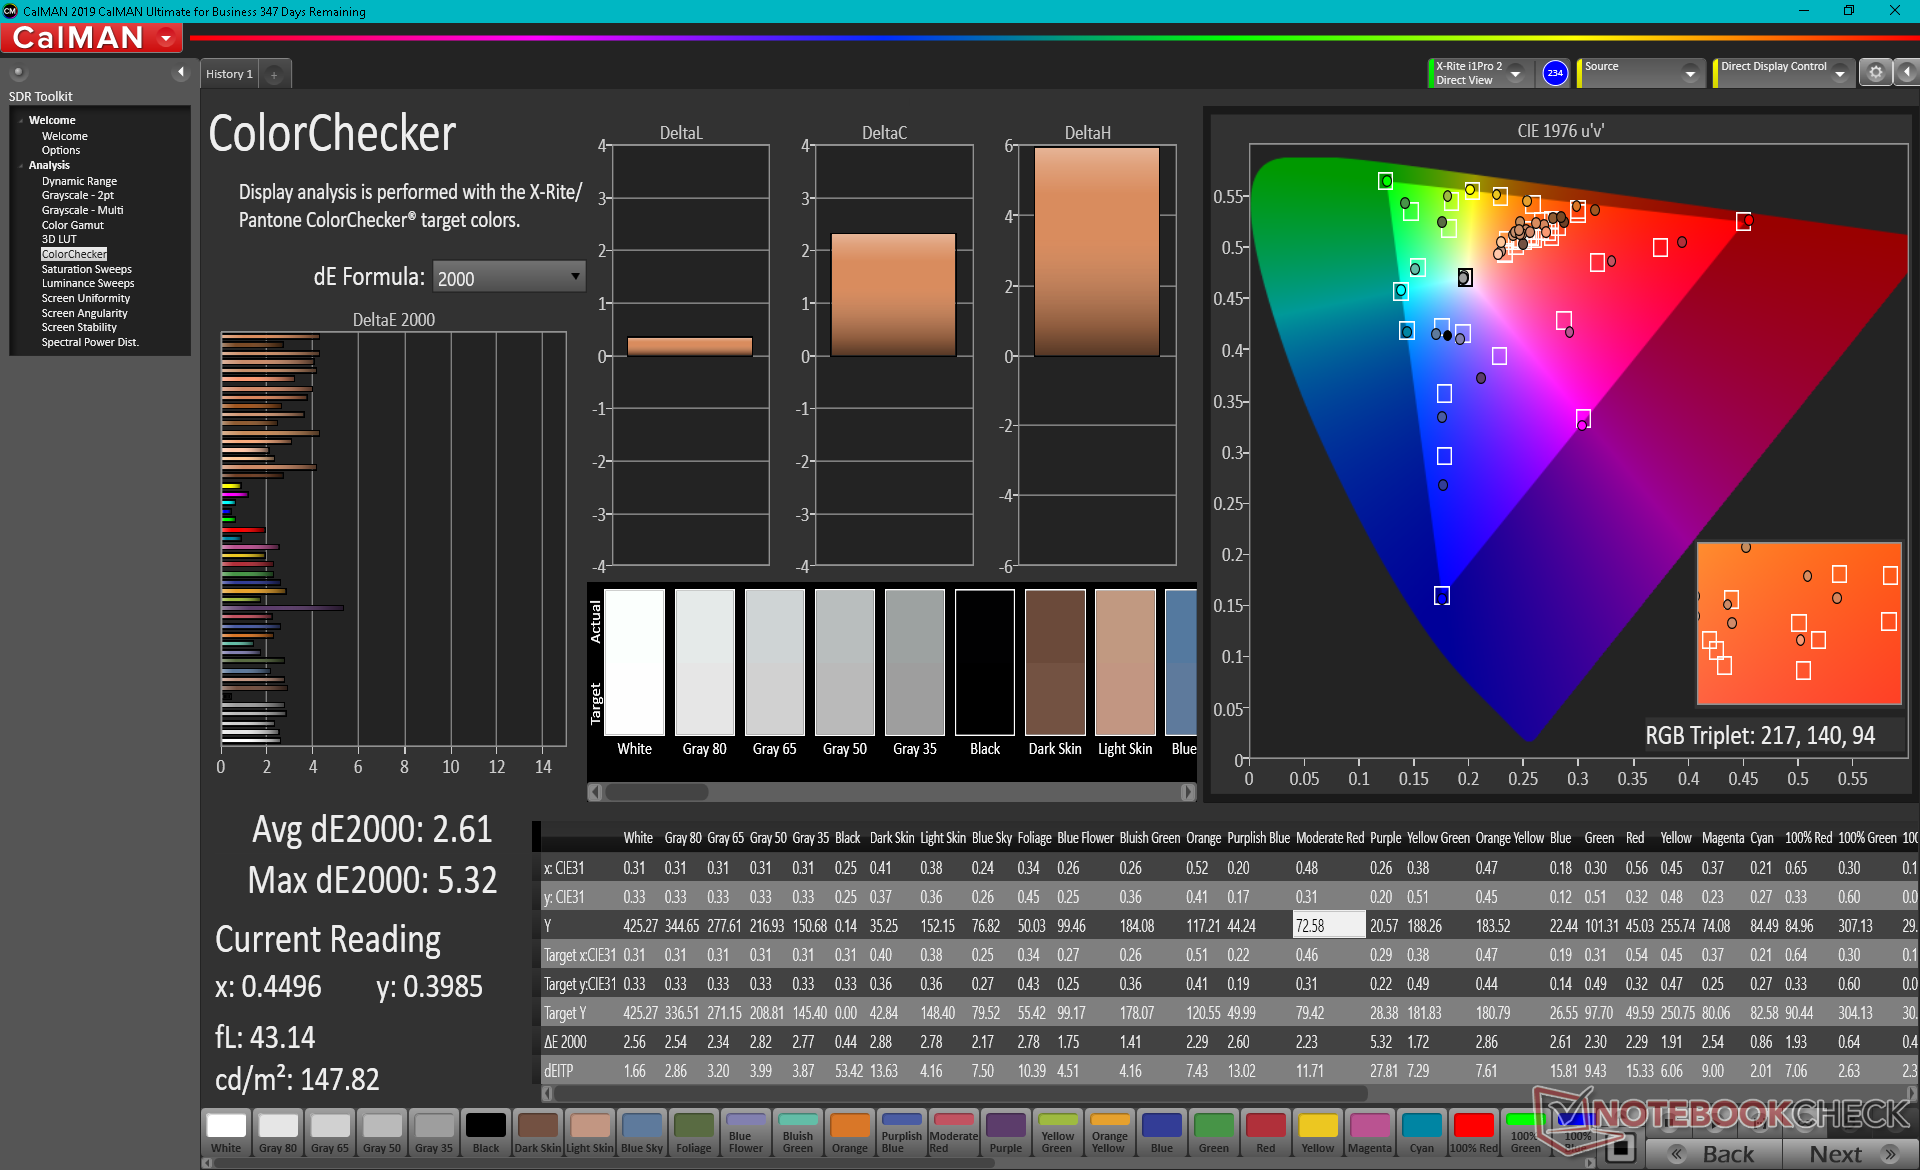
ΔE ColorChecker Calman: 2.7 | ∀{0.5-29.43 Ø4.71}
calibrated: 2.61
ΔE Greyscale Calman: 3.4 | ∀{0.09-98 Ø4.96}
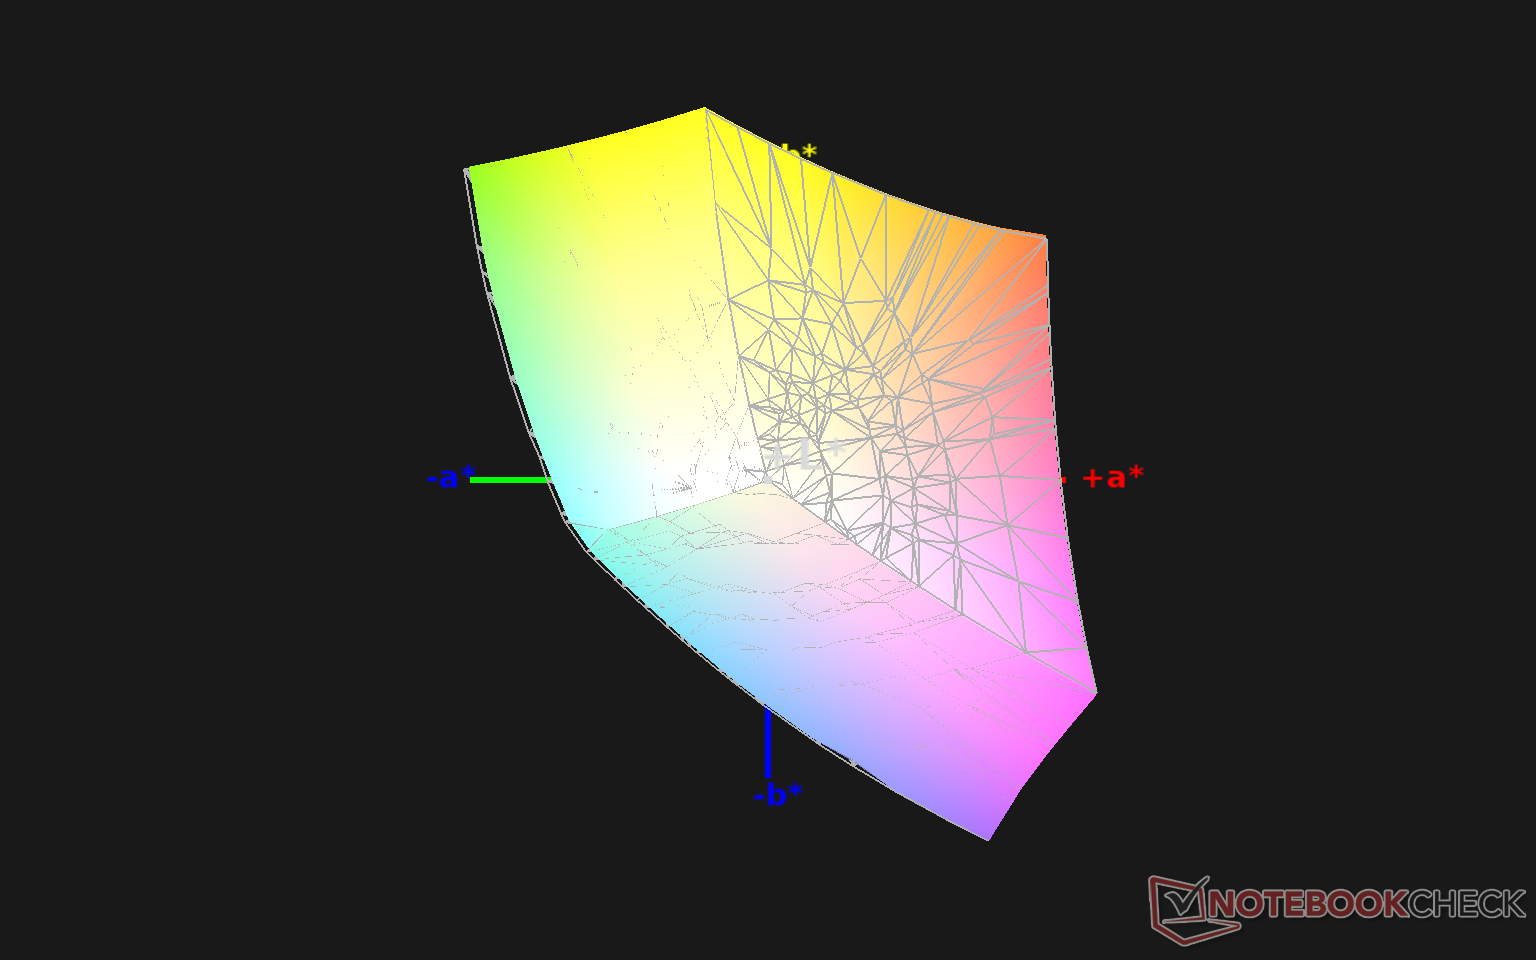
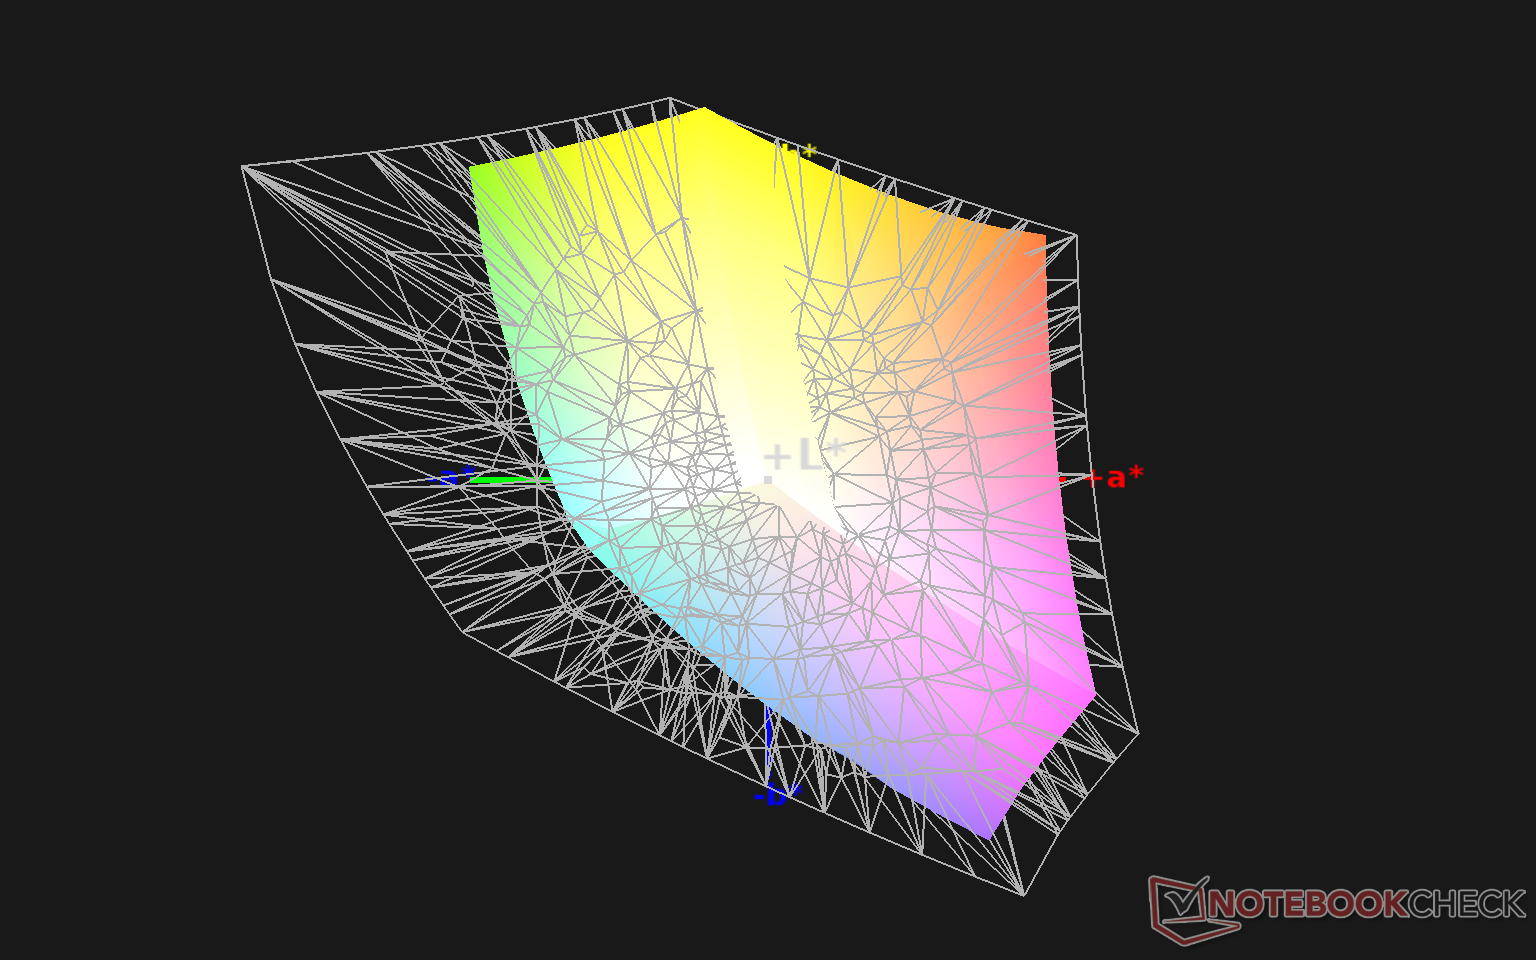
98.5% sRGB (Argyll 1.6.3 3D)
62.1% AdobeRGB 1998 (Argyll 1.6.3 3D)
67.9% AdobeRGB 1998 (Argyll 3D)
98.2% sRGB (Argyll 3D)
65.8% Display P3 (Argyll 3D)
Gamma: 2.09
CCT: 6144 K
| HP Spectre x360 14t-ea000 LG Philips LGD0663, IPS, 13.5", 1920x1280 | HP Spectre x360 13-aw0013dx AU Optronics AUO5E2D, IPS, 13.3", 1920x1080 | Dell XPS 13 7390 2-in-1 Core i7 Sharp LQ134N1, IPS, 13.4", 1920x1200 | Huawei MateBook 14 2020 Intel TV140WTM-NH0, IPS LED, 14", 2160x1440 | Asus Zenbook S UX393JA AU Optronics B139KAN01.0, IPS, 13.9", 3300x2200 | Lenovo Yoga 9i 14ITL5 LG Display LP140WF9-SPE2, IPS, 14", 1920x1080 | |
|---|---|---|---|---|---|---|
| Display | 4% | 4% | 2% | 26% | -3% | |
| Display P3 Coverage (%) | 65.8 | 69.6 6% | 69.9 6% | 67.1 2% | 97.7 48% | 64.2 -2% |
| sRGB Coverage (%) | 98.2 | 98.9 1% | 99.2 1% | 99.1 1% | 99.8 2% | 94.2 -4% |
| AdobeRGB 1998 Coverage (%) | 67.9 | 71.5 5% | 71.5 5% | 69 2% | 87.9 29% | 65 -4% |
| Response Times | 5% | 25% | 41% | 6% | 12% | |
| Response Time Grey 50% / Grey 80% * (ms) | 62 ? | 60.8 ? 2% | 47.6 ? 23% | 37.6 ? 39% | 56.4 ? 9% | 55.2 ? 11% |
| Response Time Black / White * (ms) | 39.6 ? | 36.8 ? 7% | 29.2 ? 26% | 22.4 ? 43% | 38.8 ? 2% | 34.4 ? 13% |
| PWM Frequency (Hz) | 2500 ? | 59520 ? | ||||
| Screen | -28% | 1% | -12% | -19% | -16% | |
| Brightness middle (cd/m²) | 443.5 | 447.4 1% | 549.8 24% | 458 3% | 444.1 0% | 365 -18% |
| Brightness (cd/m²) | 394 | 420 7% | 520 32% | 448 14% | 423 7% | 346 -12% |
| Brightness Distribution (%) | 78 | 85 9% | 86 10% | 89 14% | 89 14% | 82 5% |
| Black Level * (cd/m²) | 0.17 | 0.31 -82% | 0.39 -129% | 0.25 -47% | 0.37 -118% | 0.23 -35% |
| Contrast (:1) | 2609 | 1443 -45% | 1410 -46% | 1832 -30% | 1200 -54% | 1587 -39% |
| Colorchecker dE 2000 * | 2.7 | 4.23 -57% | 2.12 21% | 3.4 -26% | 2.94 -9% | 3.65 -35% |
| Colorchecker dE 2000 max. * | 4.36 | 9.34 -114% | 3.66 16% | 6.7 -54% | 7.37 -69% | 6.69 -53% |
| Colorchecker dE 2000 calibrated * | 2.61 | 1.32 49% | 1.37 48% | 1.7 35% | 3.05 -17% | 1.61 38% |
| Greyscale dE 2000 * | 3.4 | 6.1 -79% | 2.6 24% | 4.9 -44% | 2.9 15% | 4 -18% |
| Gamma | 2.09 105% | 2.11 104% | 2.3 96% | 2.16 102% | 2.1 105% | 2.33 94% |
| CCT | 6144 106% | 6136 106% | 6884 94% | 7704 84% | 6766 96% | 6873 95% |
| Color Space (Percent of AdobeRGB 1998) (%) | 62.1 | 64.8 4% | 65.4 5% | 63.5 2% | 78.2 26% | 60.1 -3% |
| Color Space (Percent of sRGB) (%) | 98.5 | 98.9 0% | 99.7 1% | 99.1 1% | 99.8 1% | 93.9 -5% |
| Moyenne finale (programmes/paramètres) | -6% /
-18% | 10% /
4% | 10% /
-3% | 4% /
-7% | -2% /
-10% |
* ... Moindre est la valeur, meilleures sont les performances
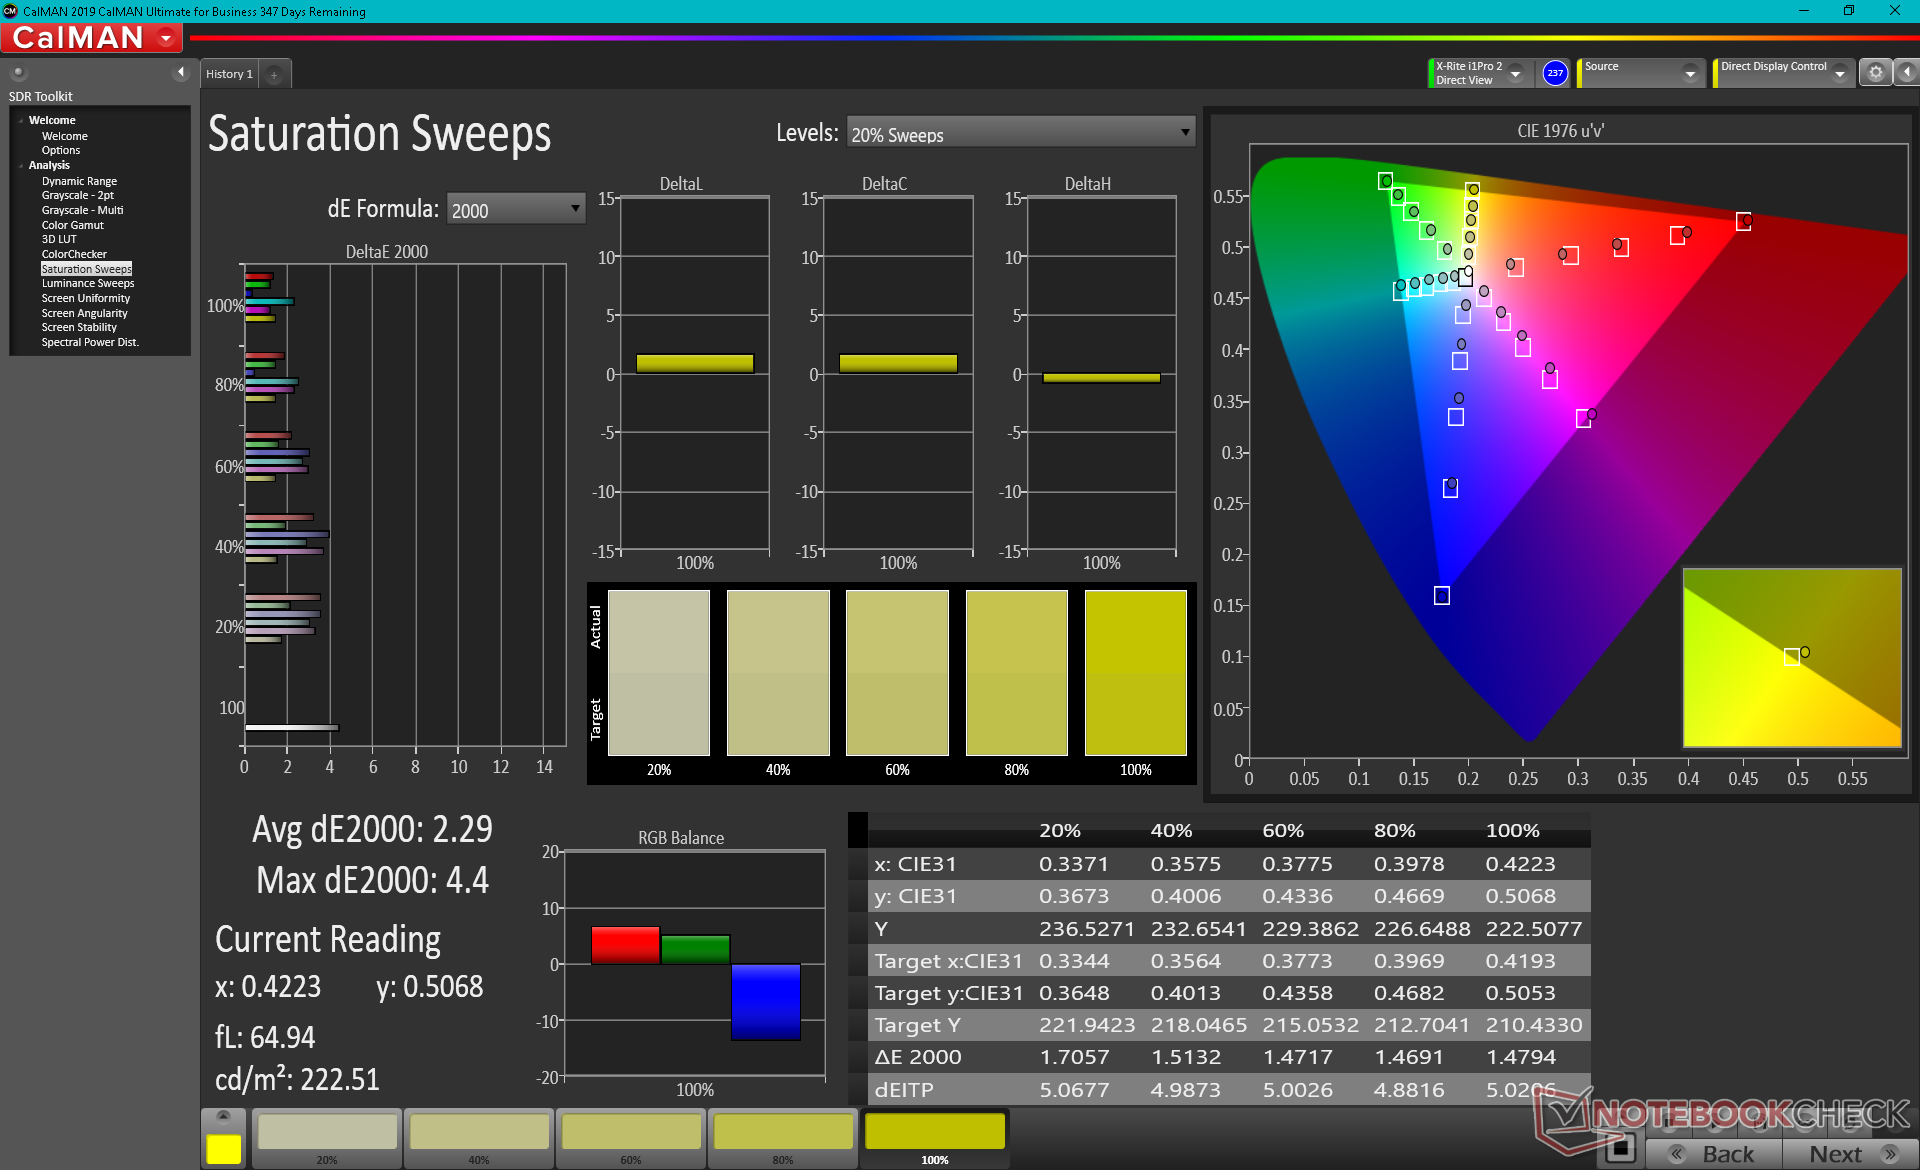
L'espace de couleur couvre presque tout le sRGB et environ 62 % du sRGB, ce qui n'est pas sans rappeler les autres ultrabooks haut de gamme. L'option OLED, plus coûteuse, pourra offrir des couleurs encore plus profondes, proches de celles du DCI-P3.
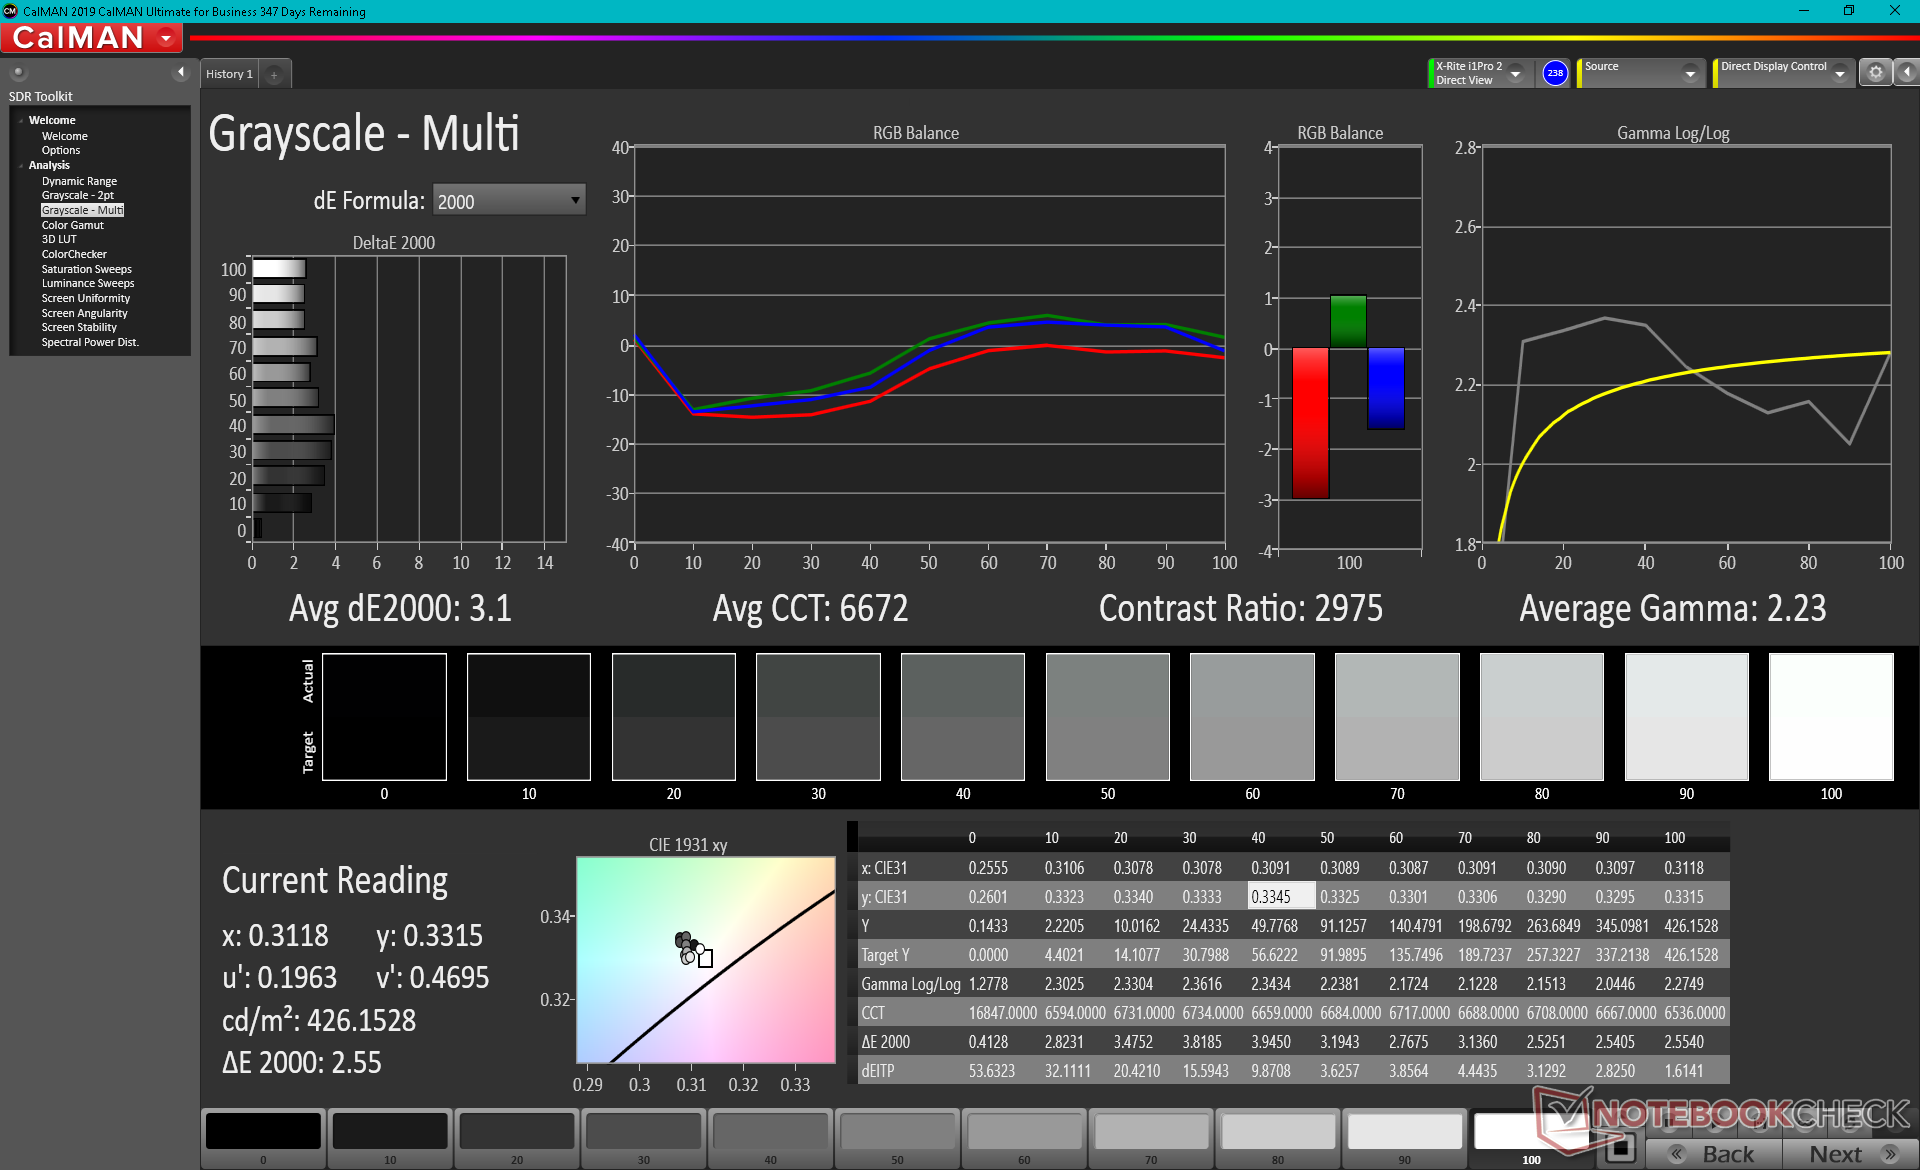
La température de couleur est un peu trop chaude pour que notre colorimètre X-Rite puisse l'indiquer. La balance RGB est simplement moyenne, même après avoir calibré le panneau nous-mêmes.
Temps de réponse de l'écran
| ↔ Temps de réponse noir à blanc | ||
|---|---|---|
| 39.6 ms ... hausse ↗ et chute ↘ combinées | ↗ 21.6 ms hausse | 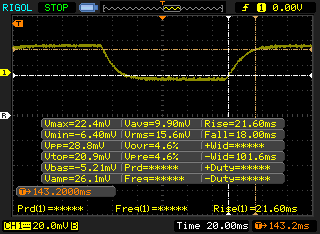 |
| ↘ 18 ms chute | ||
| L'écran souffre de latences très élevées, à éviter pour le jeu. En comparaison, tous les appareils testés affichent entre 0.1 (minimum) et 240 (maximum) ms. » 97 % des appareils testés affichent de meilleures performances. Cela signifie que les latences relevées sont moins bonnes que la moyenne (19.8 ms) de tous les appareils testés. | ||
| ↔ Temps de réponse gris 50% à gris 80% | ||
| 62 ms ... hausse ↗ et chute ↘ combinées | ↗ 32 ms hausse | 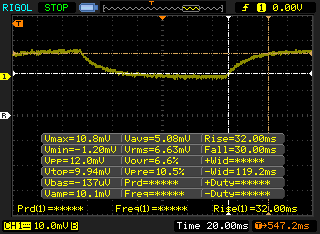 |
| ↘ 30 ms chute | ||
| L'écran souffre de latences très élevées, à éviter pour le jeu. En comparaison, tous les appareils testés affichent entre 0.165 (minimum) et 636 (maximum) ms. » 97 % des appareils testés affichent de meilleures performances. Cela signifie que les latences relevées sont moins bonnes que la moyenne (31 ms) de tous les appareils testés. | ||
Scintillement / MLI (Modulation de largeur d'impulsion)
| Scintillement / MLI (Modulation de largeur d'impulsion) non décelé |  | ||
En comparaison, 52 % des appareils testés n'emploient pas MDI pour assombrir leur écran. Nous avons relevé une moyenne à 7754 (minimum : 5 - maximum : 343500) Hz dans le cas où une MDI était active. | |||
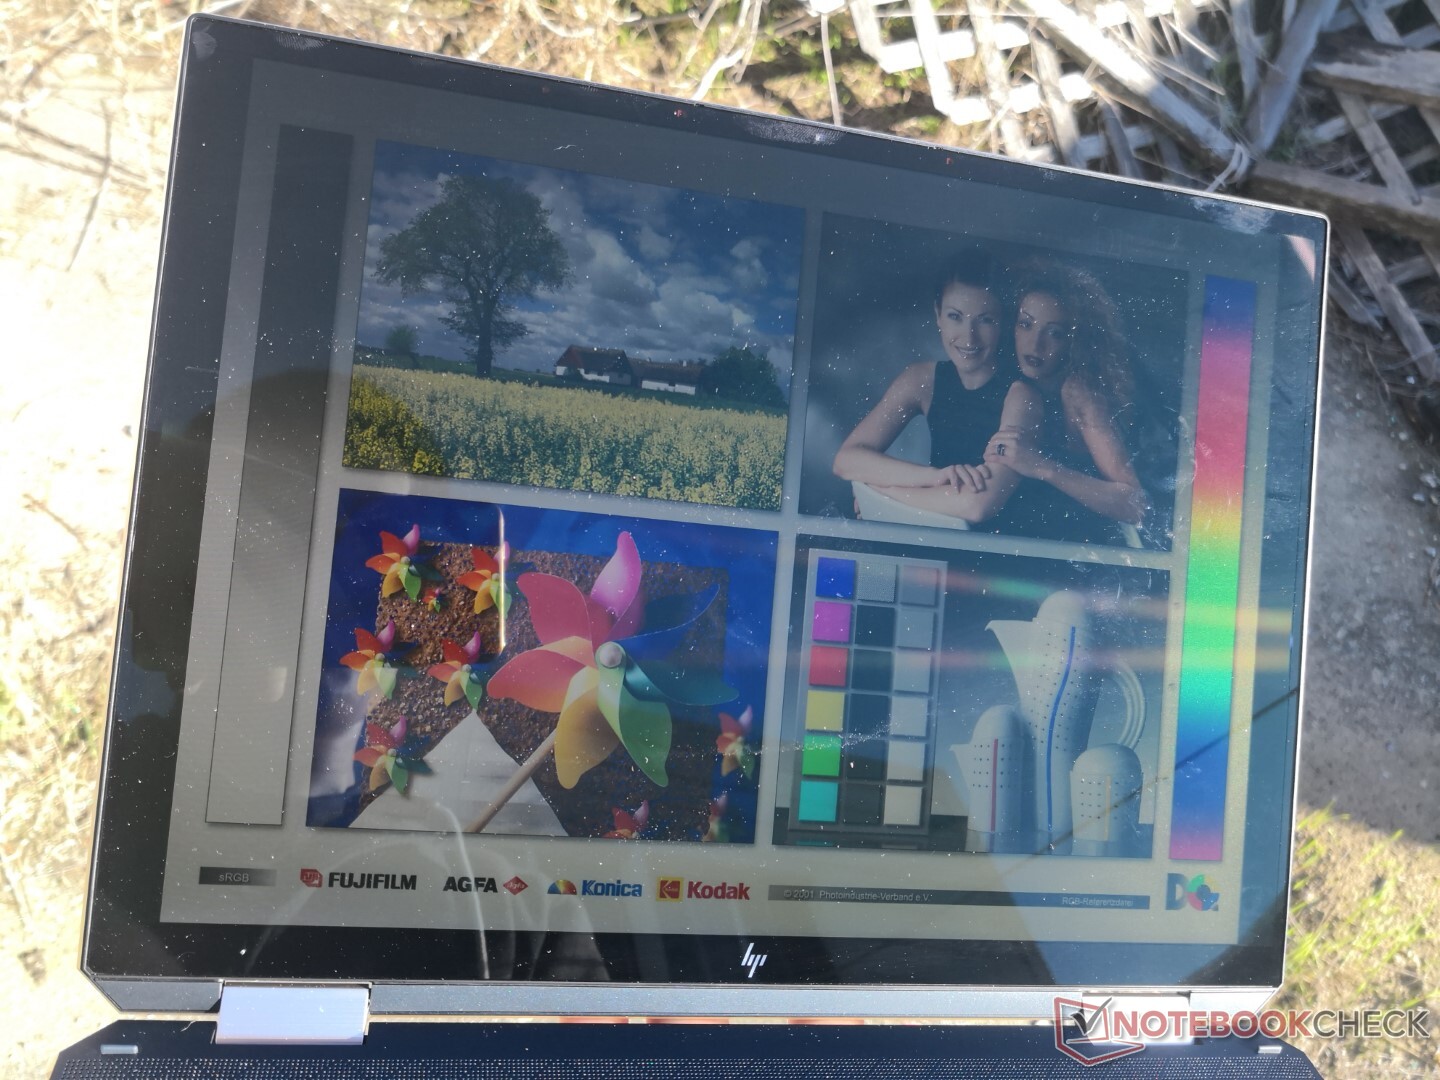
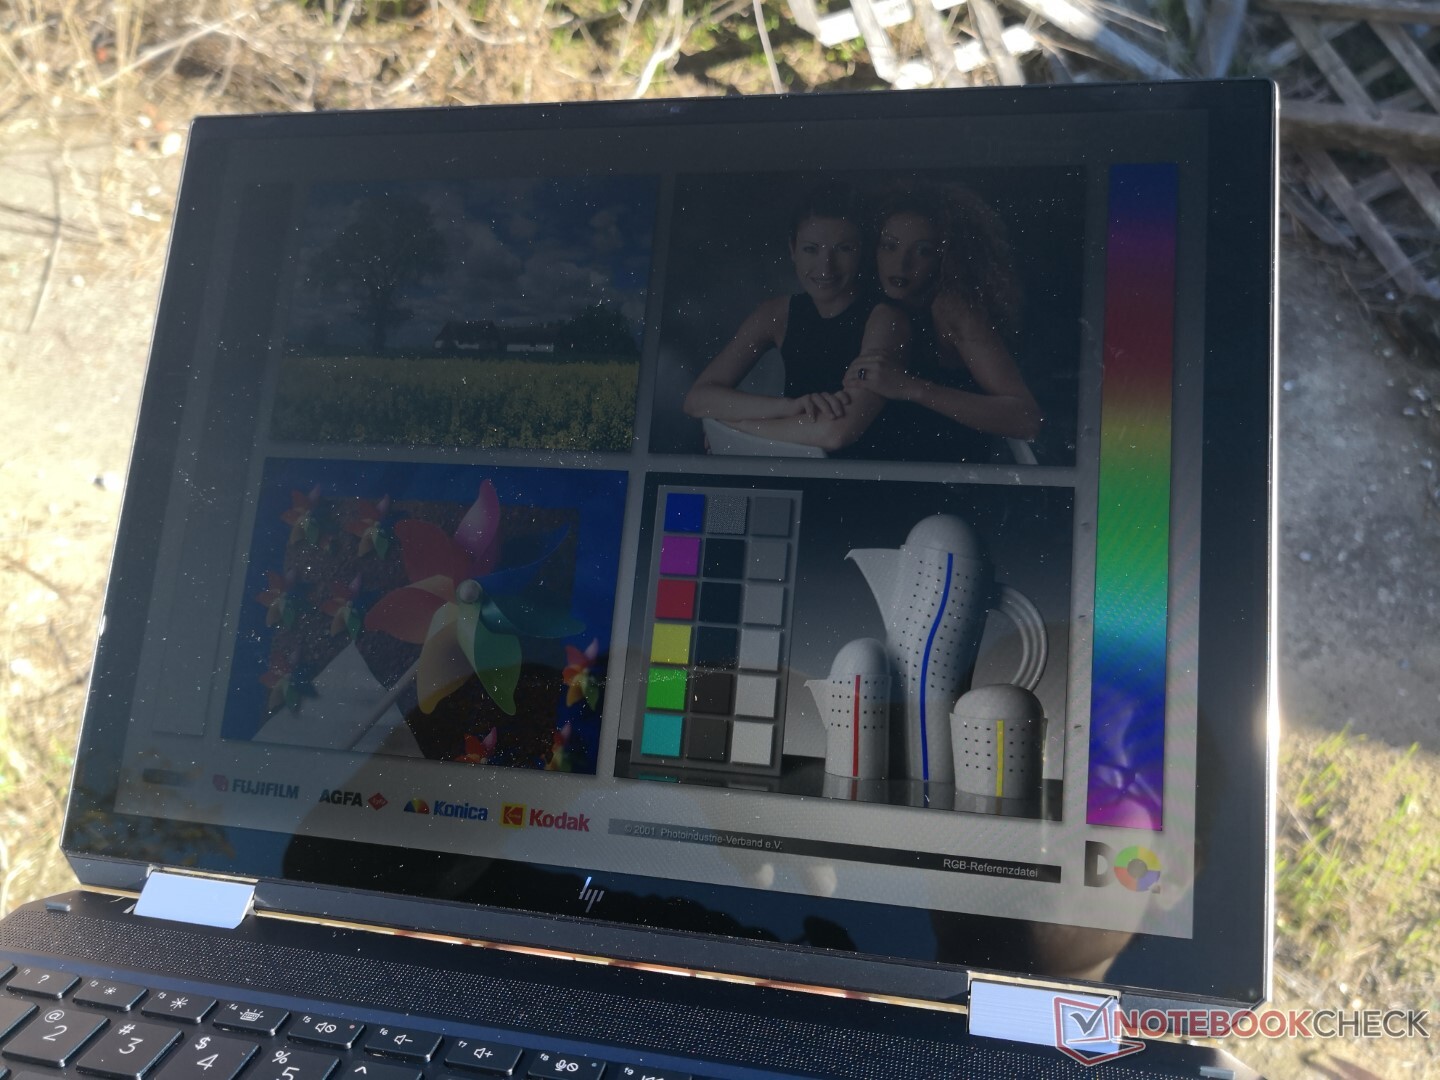
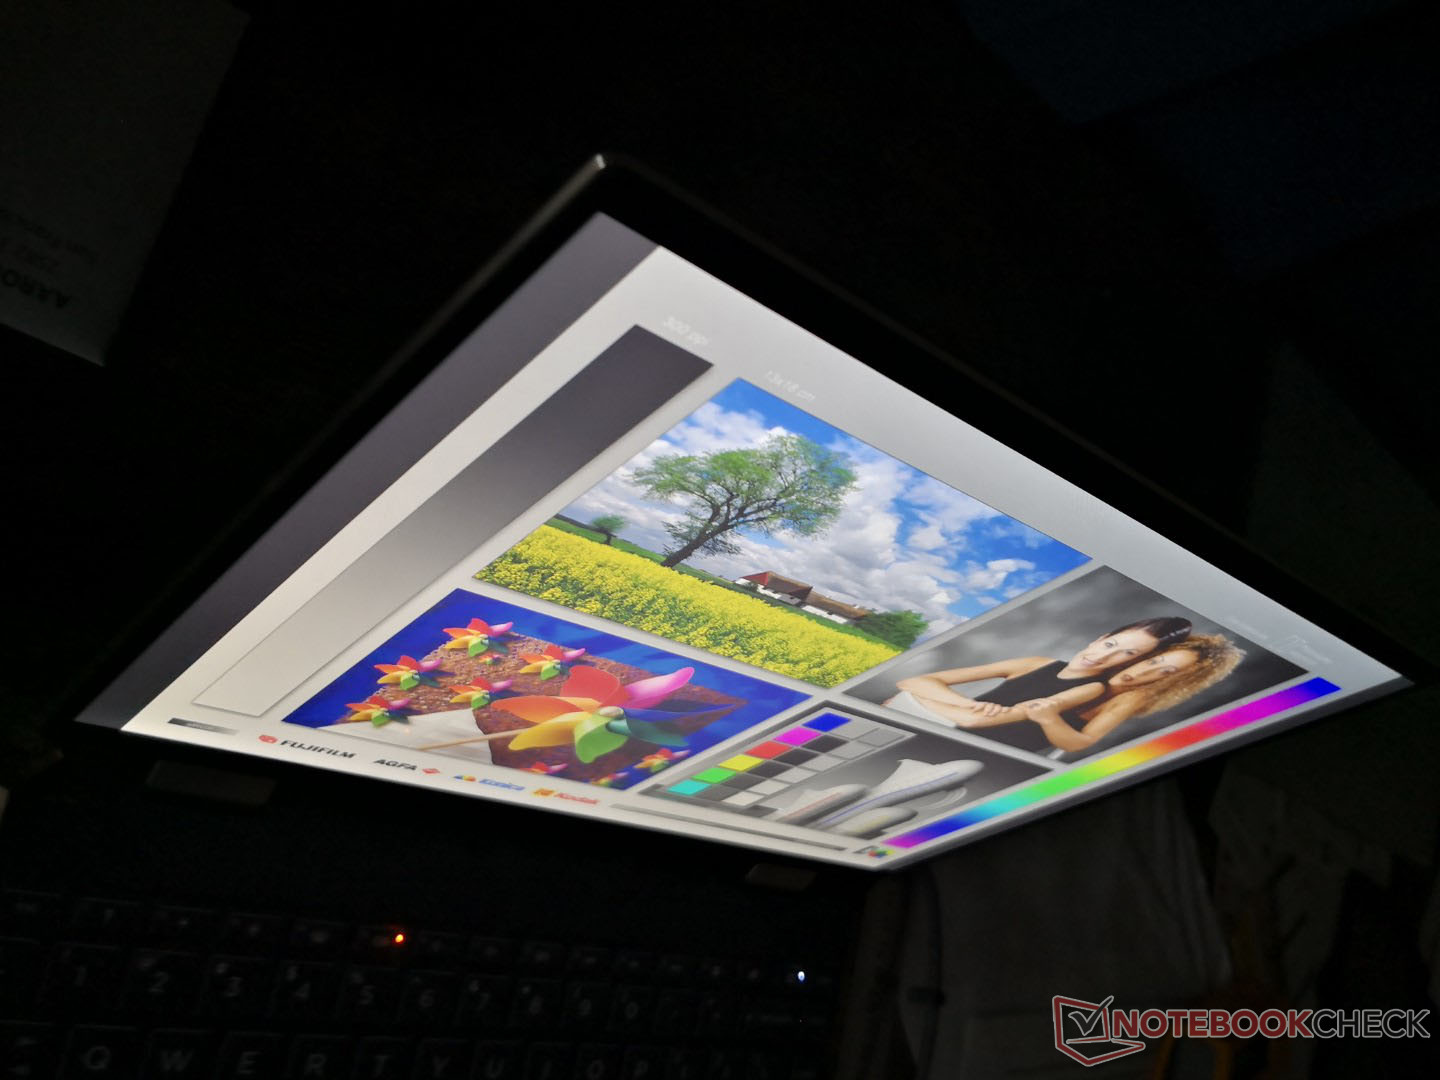
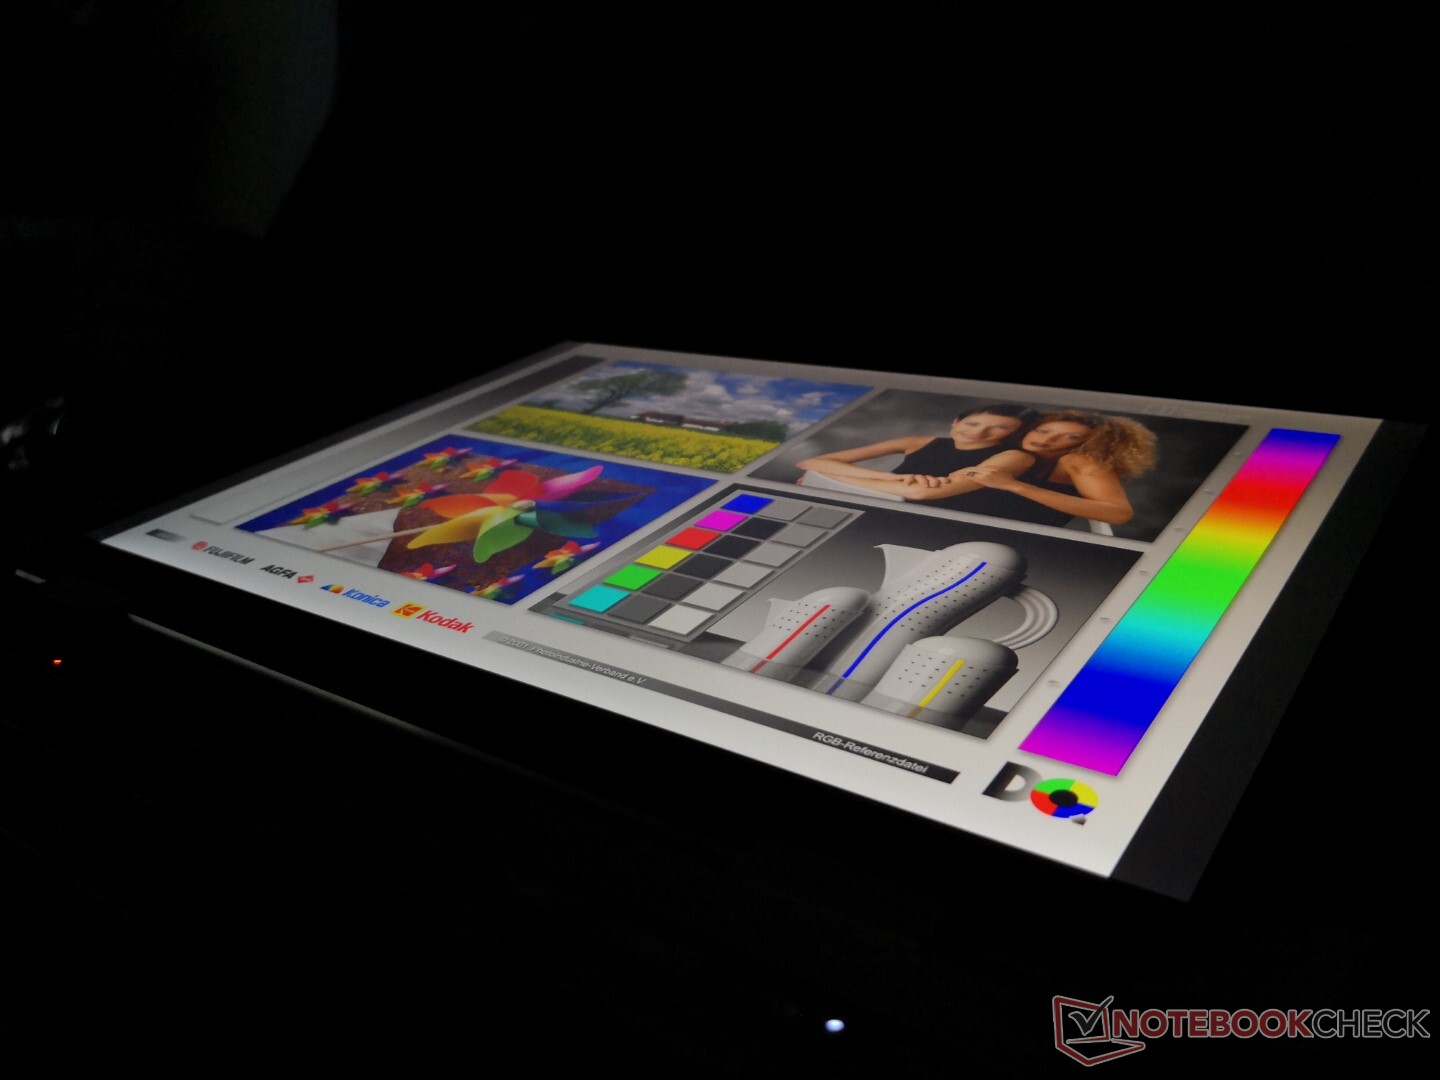
La visibilité extérieure est à peu près la même que celle du Spectre x360 13 ou du Asus ZenBook S, car ils ont tous des niveaux de luminosité maximum similaires. Le rapport de contraste plus élevé de l'écran du Spectre x360 14, cependant, contribue à atténuer un peu les couleurs délavées par le soleil. Sinon, l'éblouissement est presque inévitable. Nous recommandons l'option 1000 nits si la visibilité extérieure est prioritaire

Performance
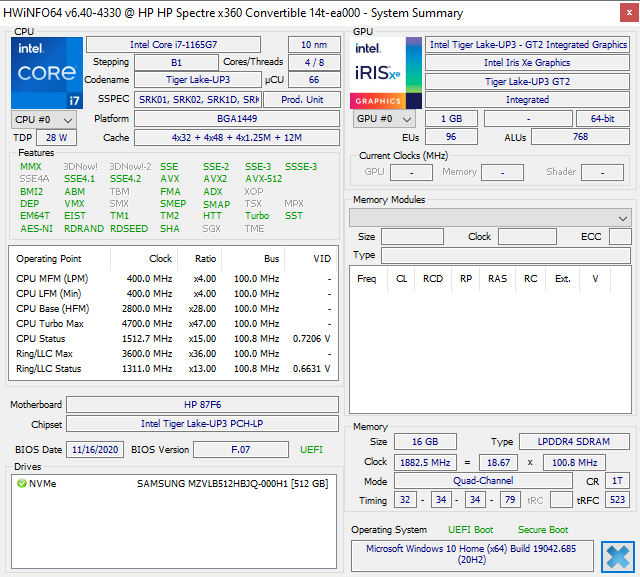
La 11e génération Tiger Lake Le noyau i7-1165G7 remplace directement la 10e génération de l'année dernière Ice Lake Le noyau i7-1065G7. Contrairement à la série Envy, il n'y a malheureusement pas d'options AMD disponibles sur ce Spectre puisqu'il s'agit d'un portable certifié Intel Evo. Le Spectre perdrait sa certification Evo s'il était équipé d'options AMD.
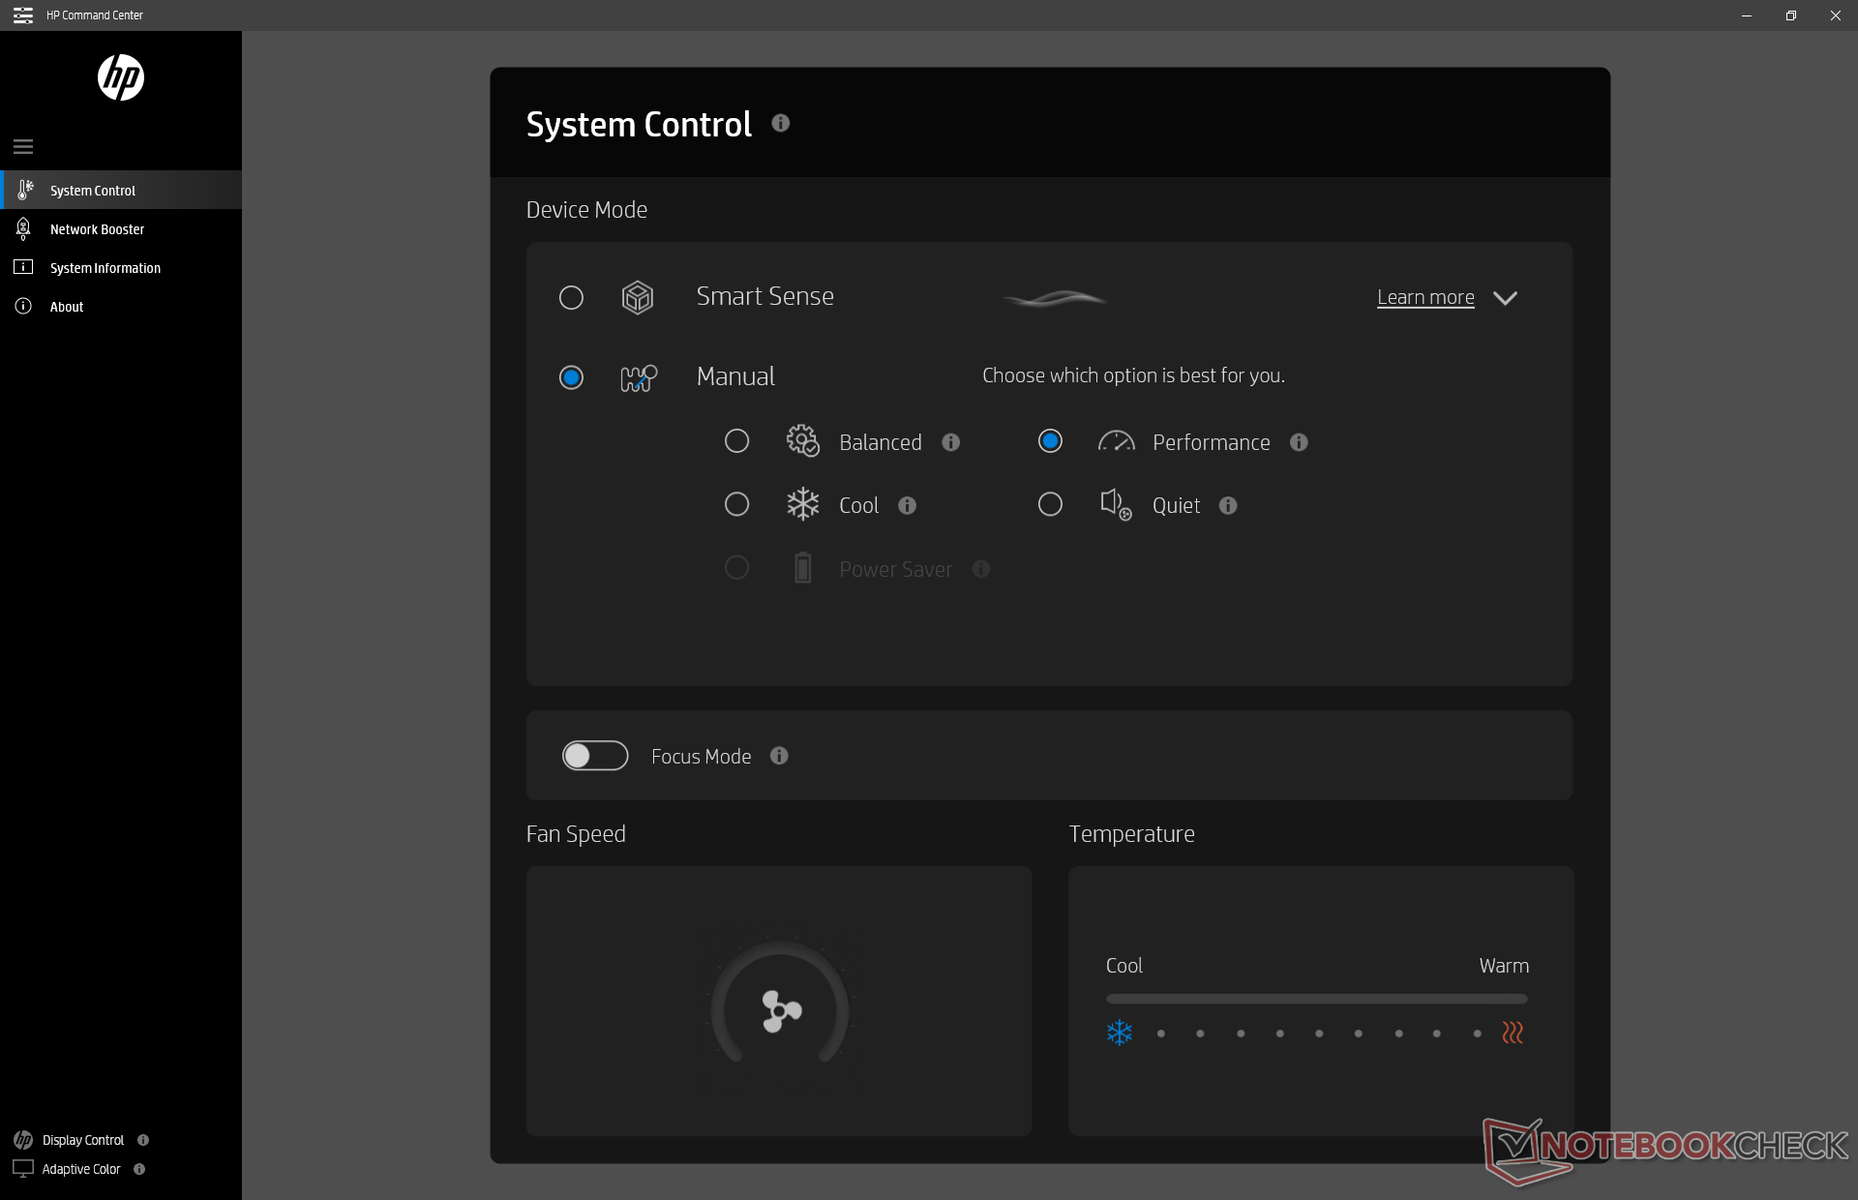
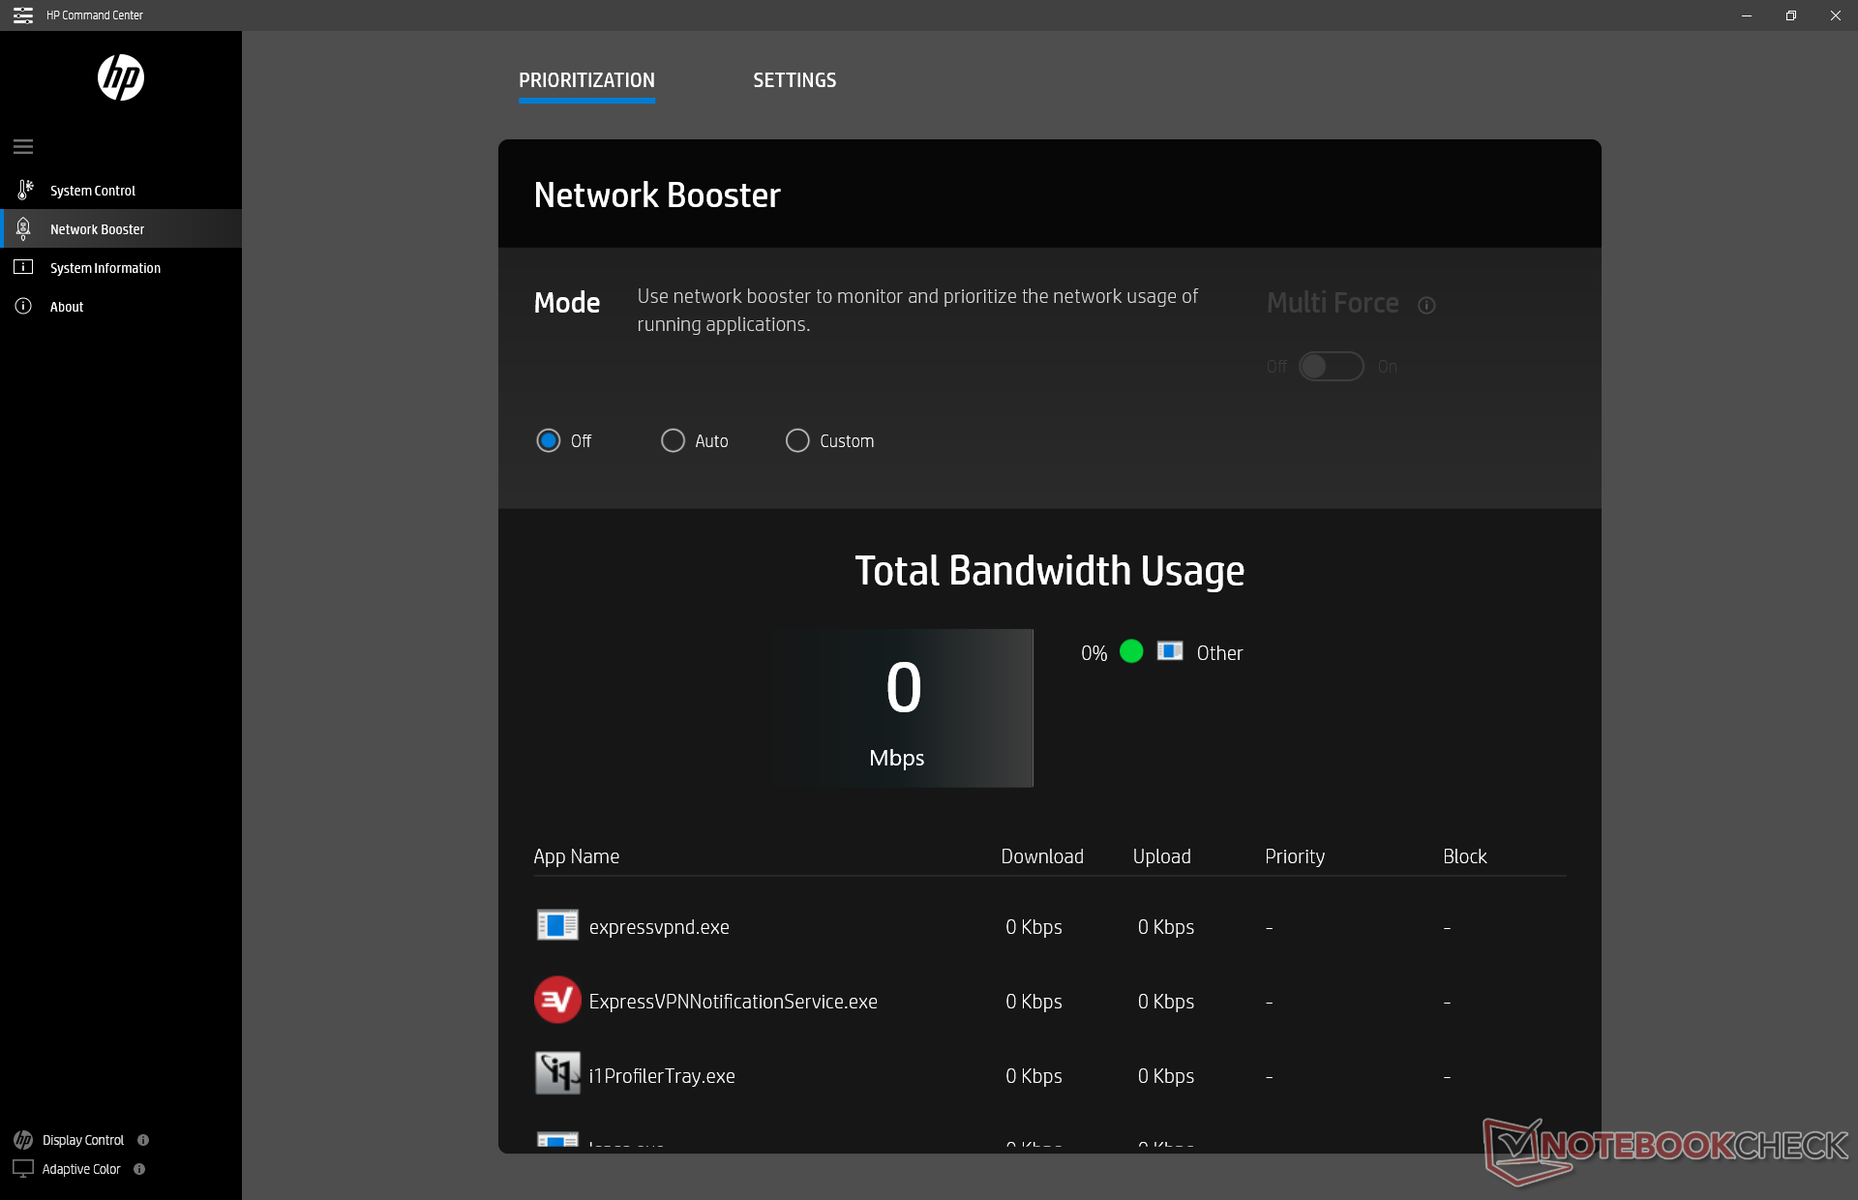
Nous avons réglé notre appareil en mode Performance via le HP Command Center avant d'effectuer les tests de performance ci-dessous pour obtenir les meilleurs scores possibles. Nous recommandons aux propriétaires de se familiariser avec Command Center car il comprend des contrôles de performances et de réseau spécifiques au fabricant.
Processeur
Tout comme sur le Dell XPS 13 9310 avec le même processeur Core i7-1165G7, les performances du processeur peuvent être instables lorsque la charge est élevée pendant de longues périodes, car les fréquences d'horloge sont cycliques pour maintenir la température du cœur sous contrôle. Cependant, l'amplitude et la plage de fréquence d'horloge du HP sont plus étroites que celles du Dell pour un niveau de performance plus prévisible. Notre test en boucle CineBench R15 xT ci-dessous illustre ce fait, car notre Spectre 14 obtiendrait généralement entre 770 et 820 points contre 620 et 750 points sur le XPS 13. Le système HP semble donc mieux à même de maintenir des cadences plus serrées et plus rapides que le Dell.
Les performances brutes du multi-thread sont environ 20 à 40 % plus rapides que celles du Core i7-1065G7 du Spectre x360 13. Certains ordinateurs portables dotés du même processeur Core i7-1165G7 sont capables de fonctionner encore plus vite que le Razer Book 13.
Cinebench R15: CPU Multi 64Bit | CPU Single 64Bit
Blender: v2.79 BMW27 CPU
7-Zip 18.03: 7z b 4 -mmt1 | 7z b 4
Geekbench 5.5: Single-Core | Multi-Core
HWBOT x265 Benchmark v2.2: 4k Preset
LibreOffice : 20 Documents To PDF
R Benchmark 2.5: Overall mean
| Blender / v2.79 BMW27 CPU | |
| HP Envy x360 13-ar0601ng | |
| Huawei MateBook 14 2020 Intel | |
| Asus Zenbook S UX393JA | |
| Asus ZenBook 14 UX434FL-DB77 | |
| HP Envy x360 13-ay0359ng | |
| Dell XPS 13 7390 2-in-1 Core i7 | |
| Lenovo Yoga 9i 14ITL5 | |
| Moyenne Intel Core i7-1165G7 (468 - 1138, n=80) | |
| HP Spectre x360 14t-ea000 | |
| Dell XPS 13 7390 Core i7-10710U | |
| Lenovo Yoga Slim 7 14ARE05 82A20008GE | |
| Lenovo Yoga Slim 7-14ARE | |
| 7-Zip 18.03 / 7z b 4 -mmt1 | |
| Moyenne Intel Core i7-1165G7 (4478 - 5507, n=80) | |
| HP Spectre x360 14t-ea000 | |
| Lenovo Yoga 9i 14ITL5 | |
| Huawei MateBook 14 2020 Intel | |
| Lenovo Yoga Slim 7-14ARE | |
| Dell XPS 13 7390 2-in-1 Core i7 | |
| Asus Zenbook S UX393JA | |
| Dell XPS 13 7390 Core i7-10710U | |
| Lenovo Yoga Slim 7 14ARE05 82A20008GE | |
| HP Envy x360 13-ay0359ng | |
| Asus ZenBook 14 UX434FL-DB77 | |
| HP Envy x360 13-ar0601ng | |
| 7-Zip 18.03 / 7z b 4 | |
| Lenovo Yoga Slim 7-14ARE | |
| Lenovo Yoga Slim 7 14ARE05 82A20008GE | |
| Dell XPS 13 7390 Core i7-10710U | |
| Moyenne Intel Core i7-1165G7 (15347 - 27405, n=80) | |
| Dell XPS 13 7390 2-in-1 Core i7 | |
| Lenovo Yoga 9i 14ITL5 | |
| HP Envy x360 13-ay0359ng | |
| HP Spectre x360 14t-ea000 | |
| Asus Zenbook S UX393JA | |
| Huawei MateBook 14 2020 Intel | |
| Asus ZenBook 14 UX434FL-DB77 | |
| HP Envy x360 13-ar0601ng | |
| Geekbench 5.5 / Single-Core | |
| Moyenne Intel Core i7-1165G7 (1302 - 1595, n=77) | |
| HP Spectre x360 14t-ea000 | |
| Lenovo Yoga 9i 14ITL5 | |
| Asus Zenbook S UX393JA | |
| Huawei MateBook 14 2020 Intel | |
| Asus ZenBook 14 UX434FL-DB77 | |
| Lenovo Yoga Slim 7-14ARE | |
| Lenovo Yoga Slim 7-14ARE | |
| Lenovo Yoga Slim 7 14ARE05 82A20008GE | |
| Geekbench 5.5 / Multi-Core | |
| Lenovo Yoga Slim 7-14ARE | |
| Lenovo Yoga Slim 7-14ARE | |
| Lenovo Yoga Slim 7 14ARE05 82A20008GE | |
| HP Spectre x360 14t-ea000 | |
| Lenovo Yoga 9i 14ITL5 | |
| Moyenne Intel Core i7-1165G7 (3078 - 5926, n=77) | |
| Asus Zenbook S UX393JA | |
| Huawei MateBook 14 2020 Intel | |
| Asus ZenBook 14 UX434FL-DB77 | |
| HWBOT x265 Benchmark v2.2 / 4k Preset | |
| Lenovo Yoga Slim 7-14ARE | |
| Lenovo Yoga Slim 7 14ARE05 82A20008GE | |
| Lenovo Yoga 9i 14ITL5 | |
| Dell XPS 13 7390 2-in-1 Core i7 | |
| Moyenne Intel Core i7-1165G7 (1.39 - 8.47, n=80) | |
| HP Spectre x360 14t-ea000 | |
| HP Envy x360 13-ay0359ng | |
| Dell XPS 13 7390 Core i7-10710U | |
| Asus ZenBook 14 UX434FL-DB77 | |
| Huawei MateBook 14 2020 Intel | |
| Asus Zenbook S UX393JA | |
| HP Envy x360 13-ar0601ng | |
| LibreOffice / 20 Documents To PDF | |
| HP Envy x360 13-ay0359ng | |
| Asus ZenBook 14 UX434FL-DB77 | |
| Lenovo Yoga Slim 7 14ARE05 82A20008GE | |
| Lenovo Yoga Slim 7-14ARE | |
| HP Spectre x360 14t-ea000 | |
| Huawei MateBook 14 2020 Intel | |
| Moyenne Intel Core i7-1165G7 (21.5 - 88.1, n=78) | |
| Lenovo Yoga 9i 14ITL5 | |
| Asus Zenbook S UX393JA | |
| R Benchmark 2.5 / Overall mean | |
| Asus ZenBook 14 UX434FL-DB77 | |
| Asus Zenbook S UX393JA | |
| Huawei MateBook 14 2020 Intel | |
| HP Envy x360 13-ay0359ng | |
| Lenovo Yoga 9i 14ITL5 | |
| Lenovo Yoga Slim 7 14ARE05 82A20008GE | |
| Lenovo Yoga Slim 7-14ARE | |
| HP Spectre x360 14t-ea000 | |
| Moyenne Intel Core i7-1165G7 (0.552 - 1.002, n=80) | |
Cinebench R15: CPU Multi 64Bit | CPU Single 64Bit
Blender: v2.79 BMW27 CPU
7-Zip 18.03: 7z b 4 -mmt1 | 7z b 4
Geekbench 5.5: Single-Core | Multi-Core
HWBOT x265 Benchmark v2.2: 4k Preset
LibreOffice : 20 Documents To PDF
R Benchmark 2.5: Overall mean
* ... Moindre est la valeur, meilleures sont les performances
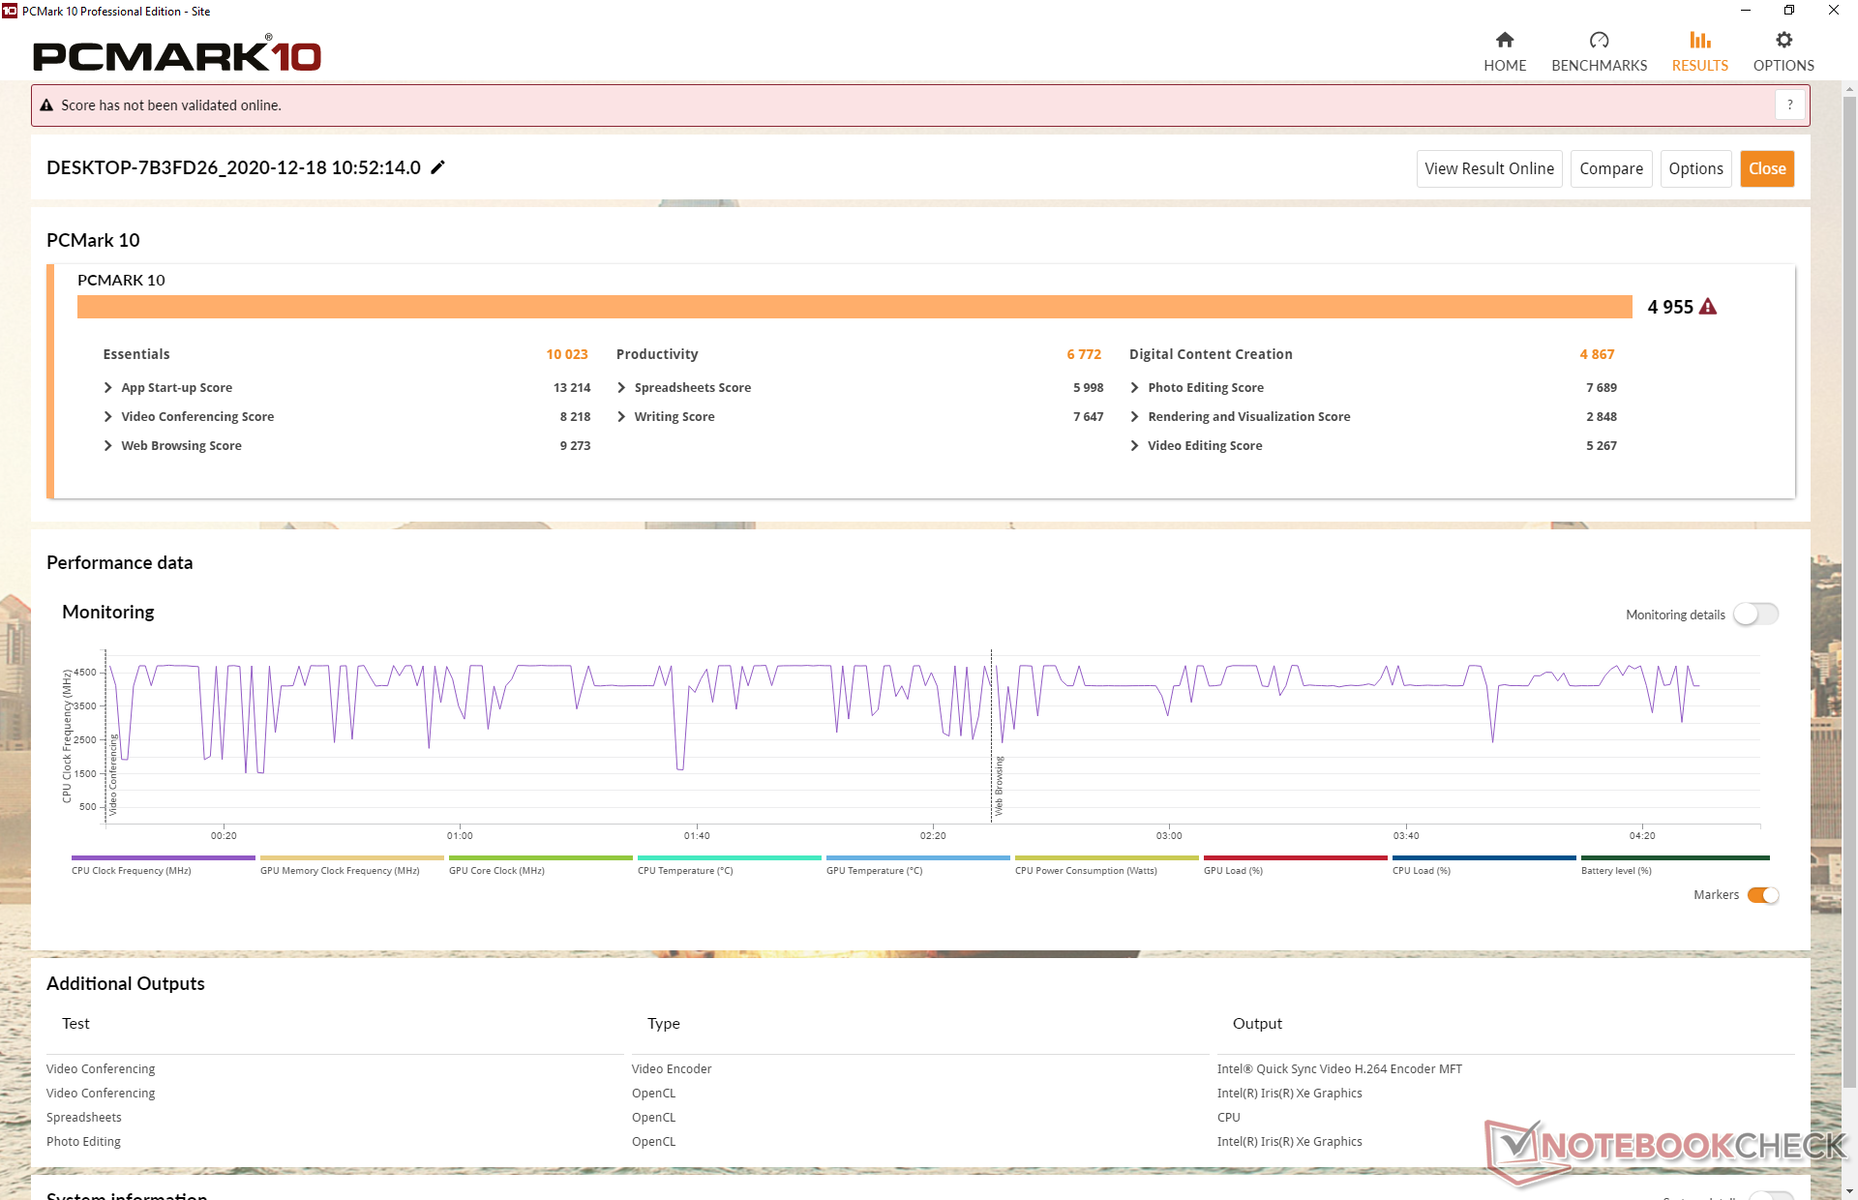
Performance du système
Les résultats de PCMark 10 sont là où nous les attendons par rapport aux autres ordinateurs portables dotés du même processeur Core i7-1165G7. Le système HP devance les Ultrabooks équipés de CPU d'ancienne génération comme l'Asus Zenbook S ou le Spectre x360 13.
Nous n'avons rencontré aucun problème logiciel ou matériel avec notre unité de test, à l'exception d'une observation intéressante de Smart Sense que nous noterons dans notre section Consommation d'énergie ci-dessous.
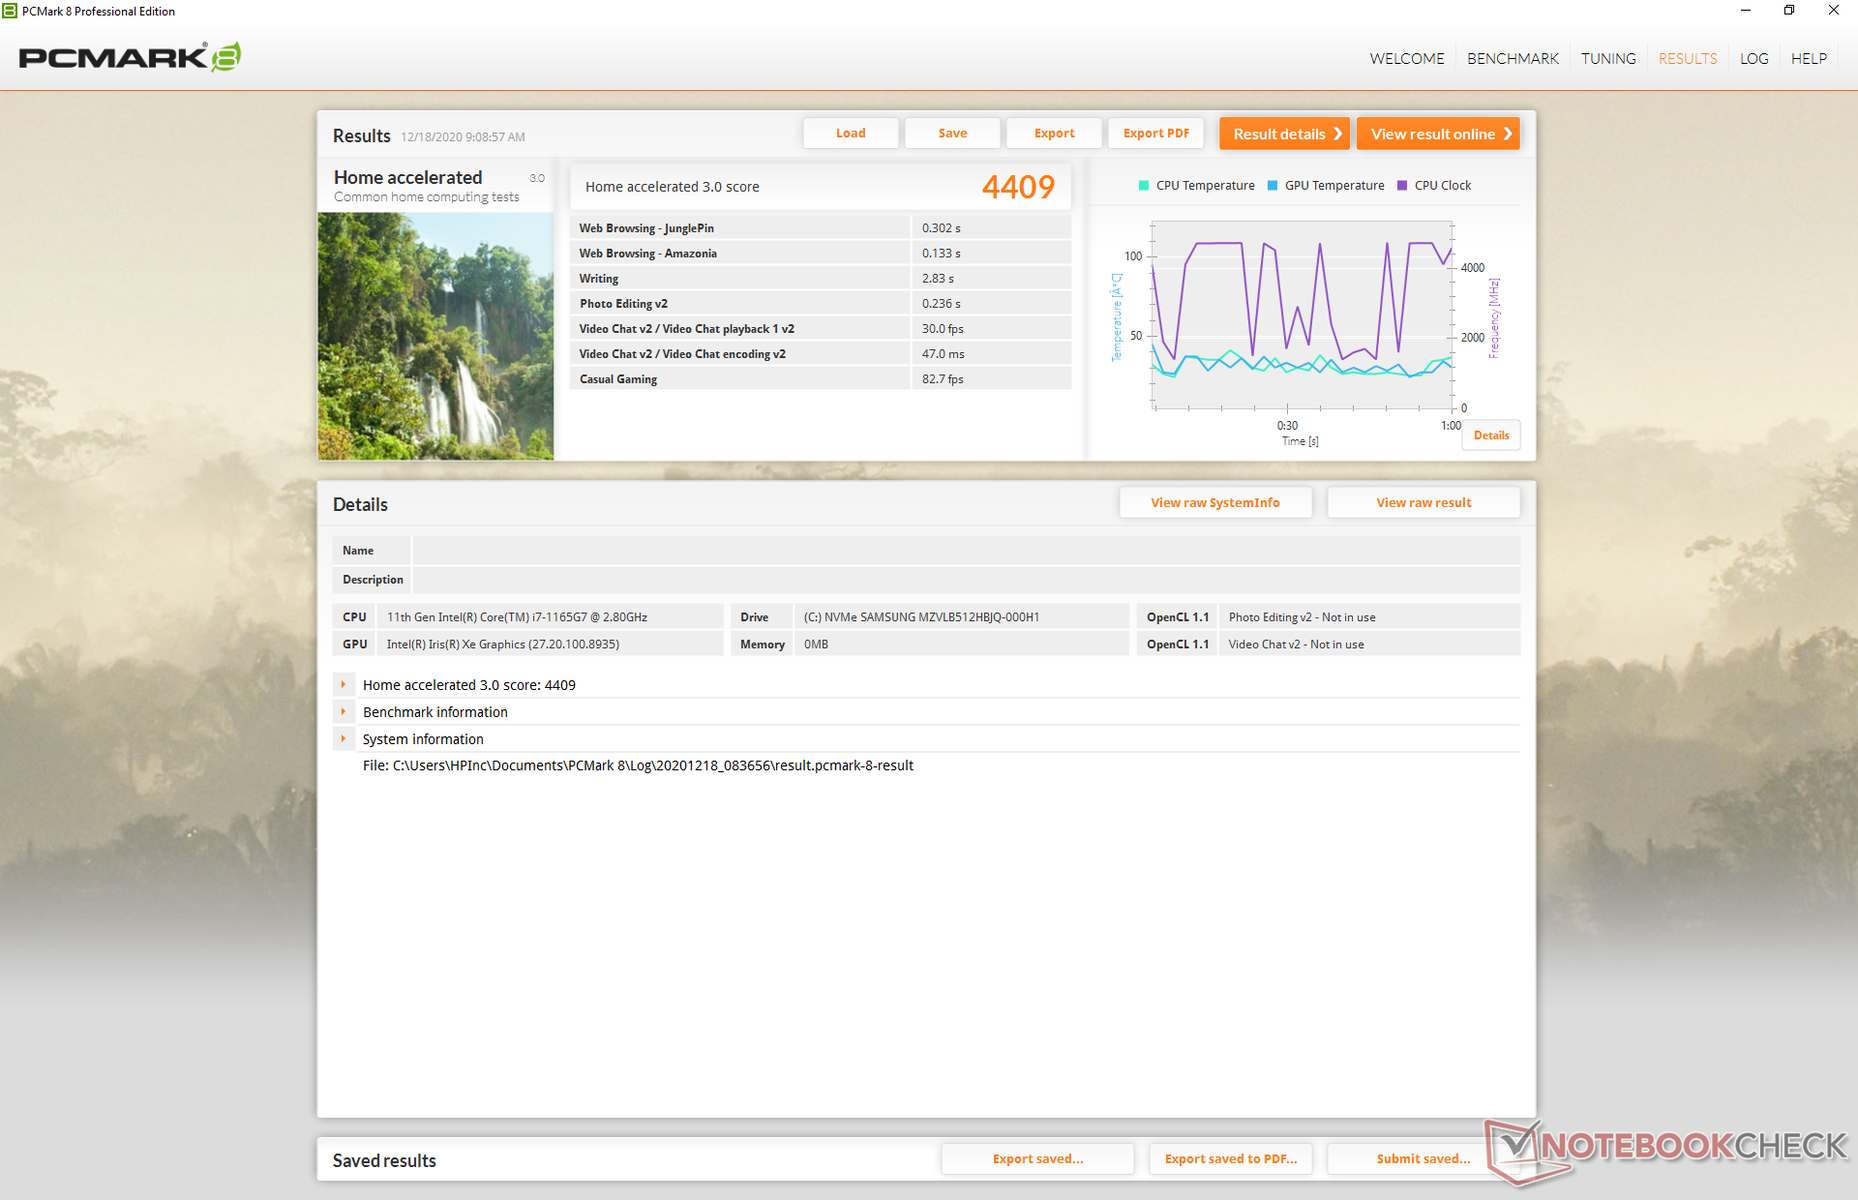
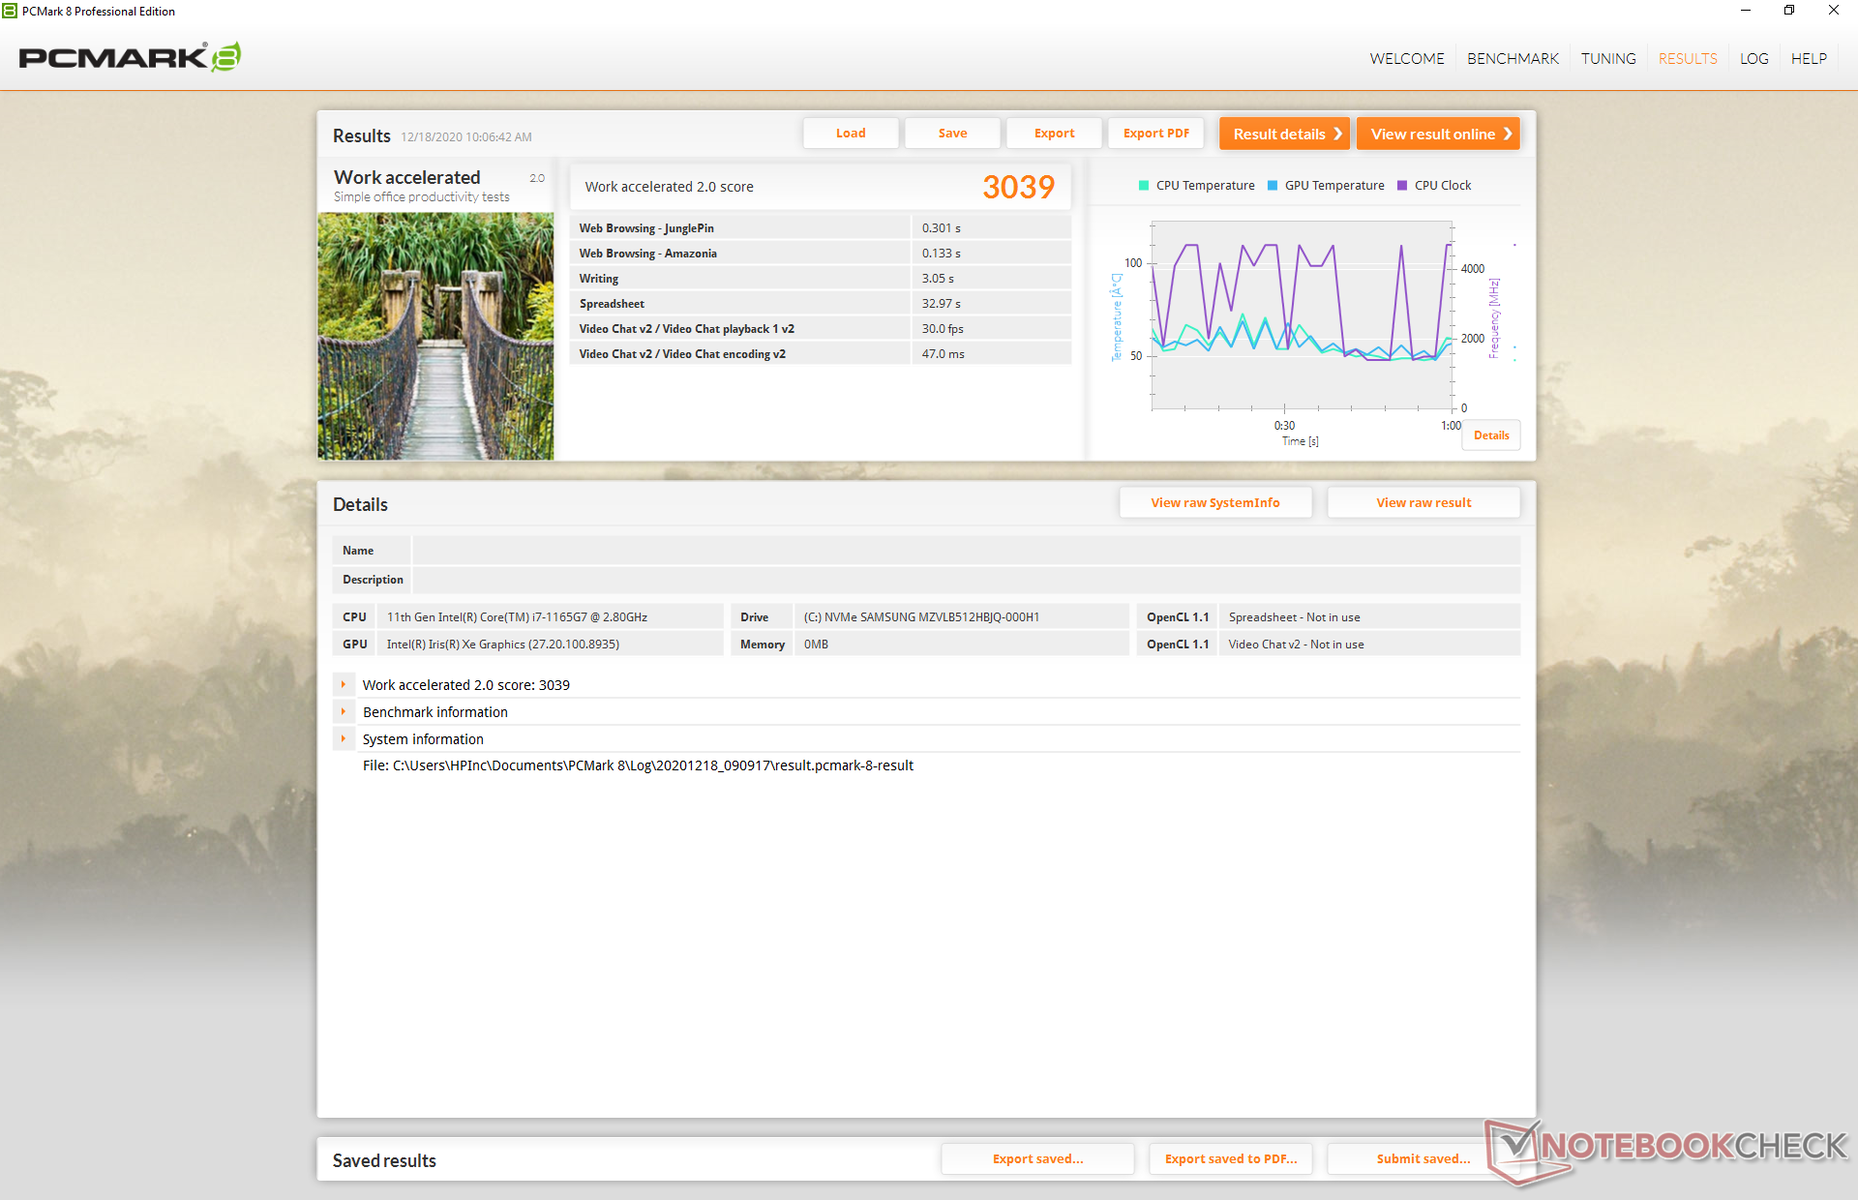
| PCMark 8 Home Score Accelerated v2 | 4409 points | |
| PCMark 8 Work Score Accelerated v2 | 3039 points | |
| PCMark 10 Score | 4955 points | |
Aide | ||
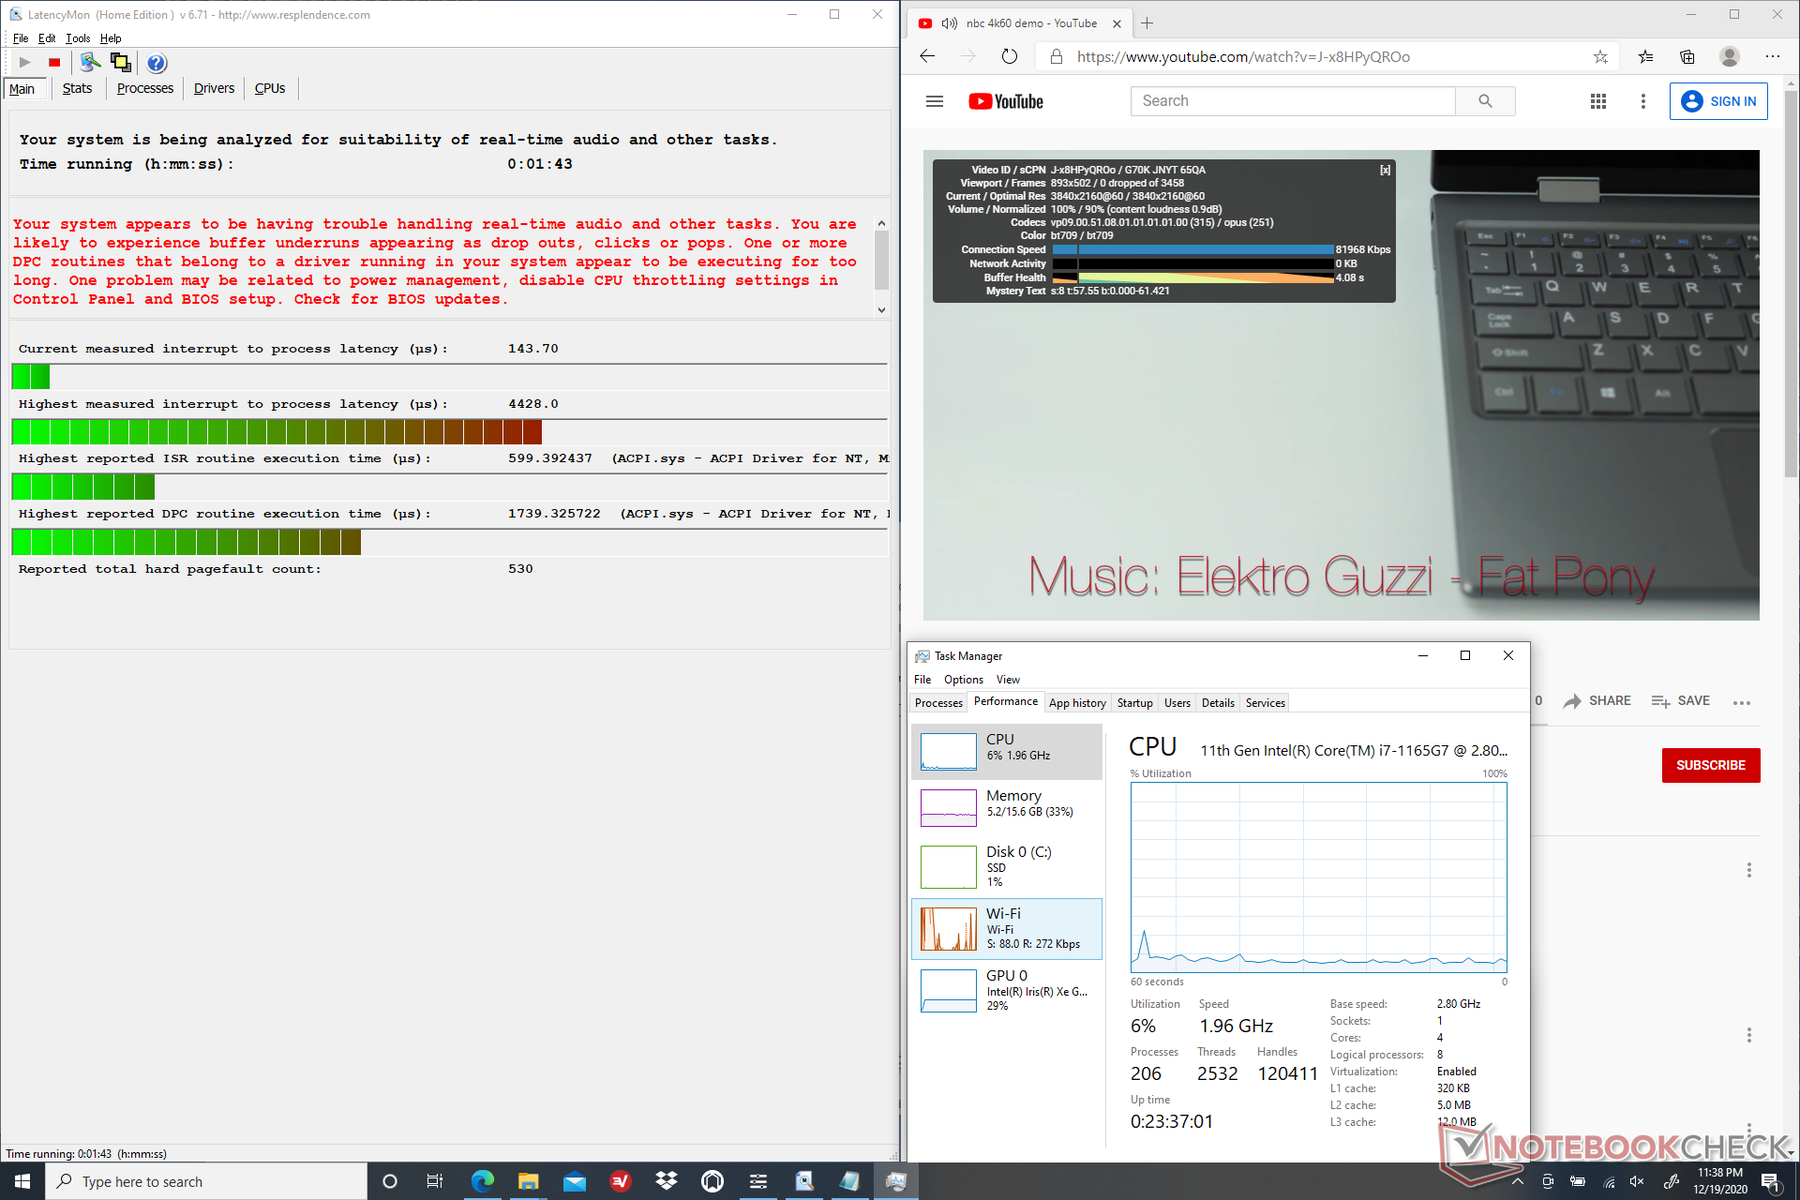
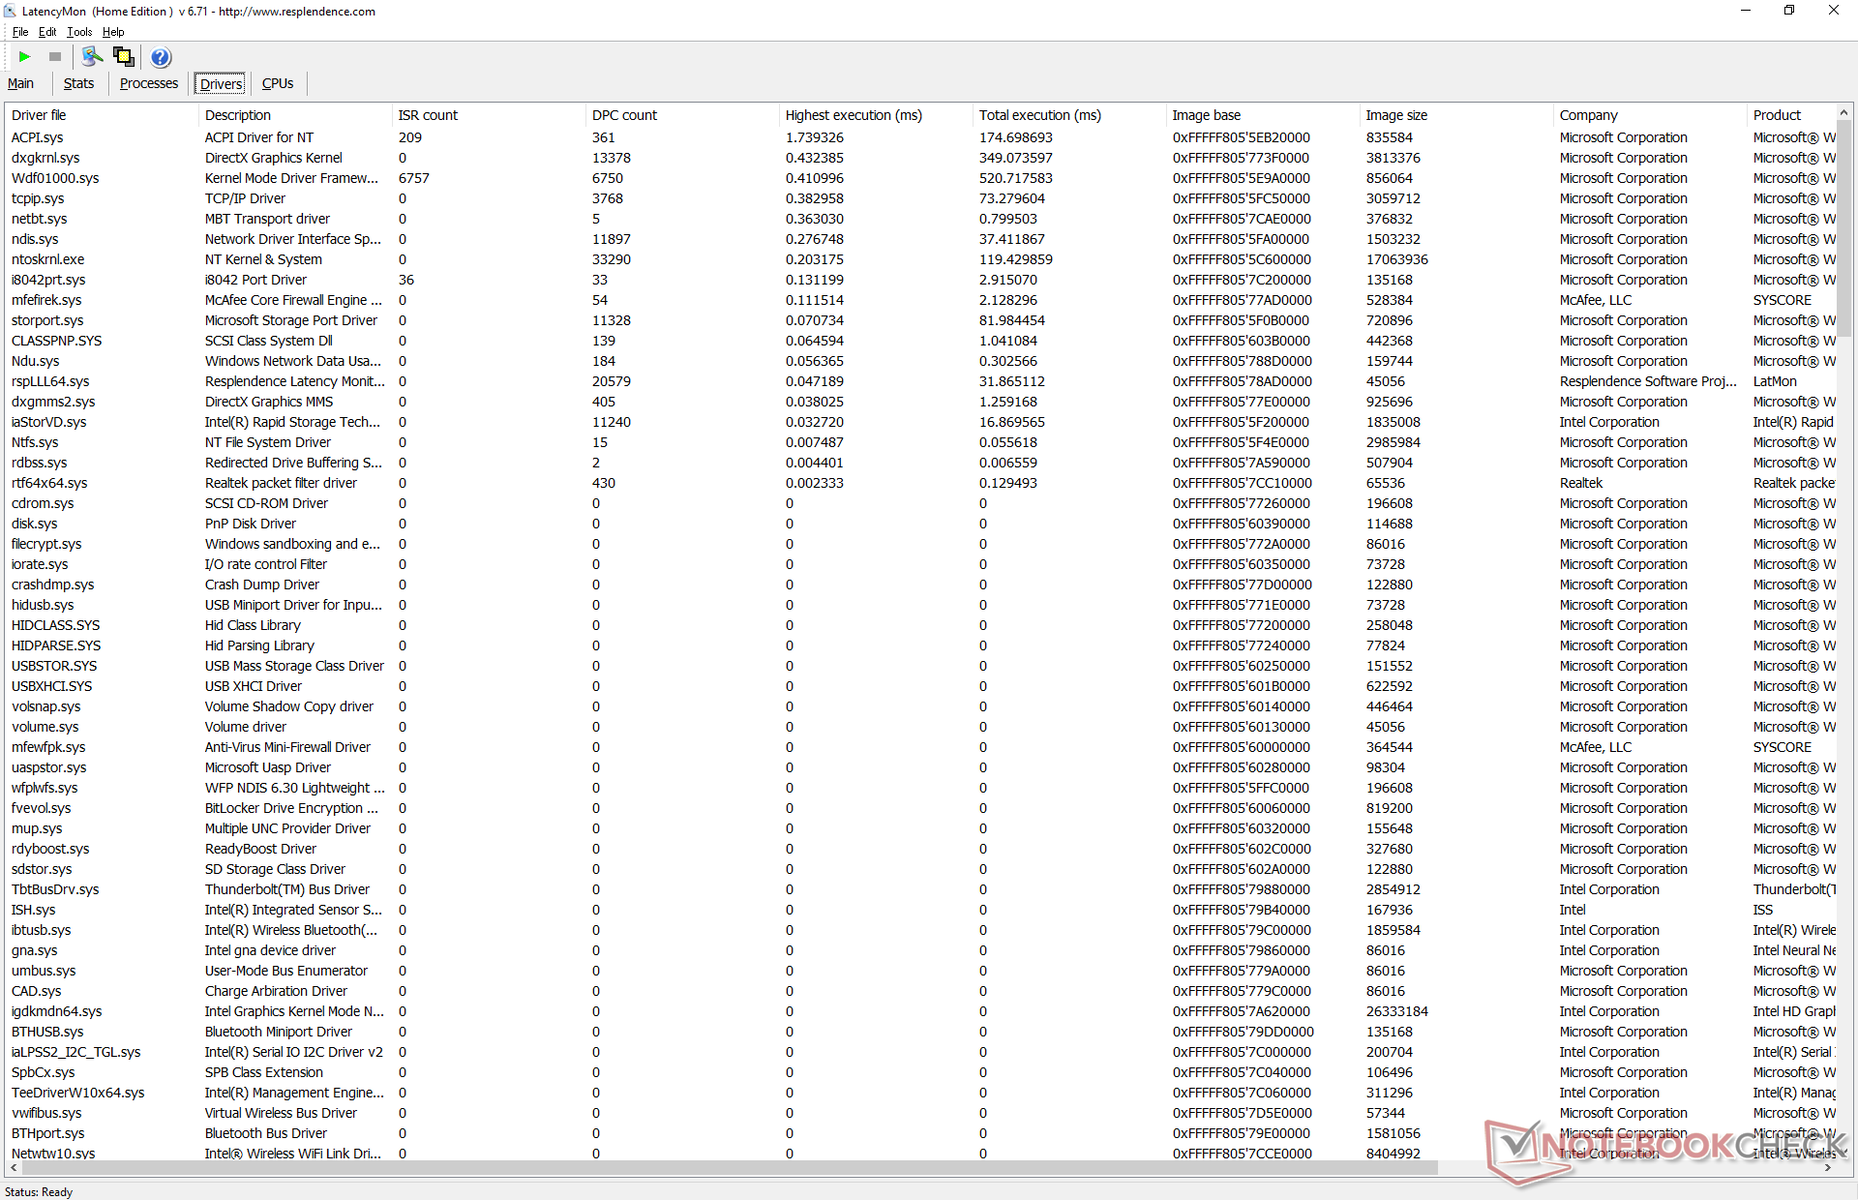
DPC Latence
LatencyMon révèle les problèmes de latence de DPC liés à ACPI.sys. La lecture de vidéos UHD 4K à 60 FPS est par ailleurs fluide et sans perte d'images pendant notre test YouTube d'une minute.
| DPC Latencies / LatencyMon - interrupt to process latency (max), Web, Youtube, Prime95 | |
| Asus Zenbook S UX393JA | |
| HP Spectre x360 14t-ea000 | |
| Lenovo Yoga 9i 14ITL5 | |
| Huawei MateBook 14 2020 Intel | |
* ... Moindre est la valeur, meilleures sont les performances
Dispositifs de stockage
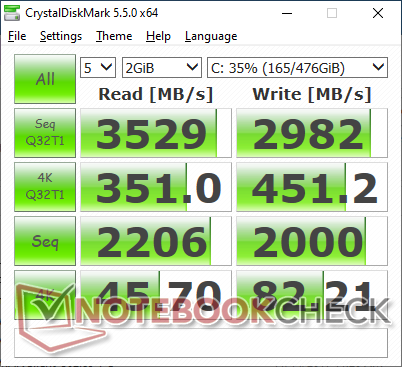
Notre unité est livrée avec le Samsung PM981a qui est un SSD NVMe PCIe 3.0 haut de gamme. L'exécution de DiskSpd Read in a loop montre que l'interface de la carte mère est capable d'utiliser les taux de transfert x4 élevés du SSD. Les options Optane sont disponibles comme sur le Spectre x360 13, mais la plupart des utilisateurs de bureau s'en passeront très bien.
Consultez notre tableau des SSD et des disques durs pour plus de comparaisons.
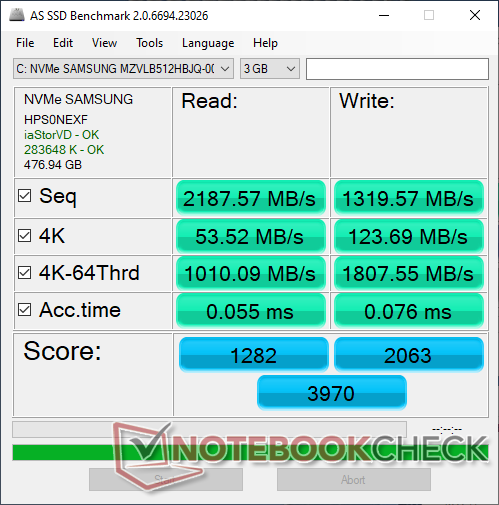
| HP Spectre x360 14t-ea000 Samsung SSD PM981a MZVLB512HBJQ | Dell XPS 13 7390 2-in-1 Core i7 Toshiba BG4 KBG40ZPZ512G | Huawei MateBook 14 2020 Intel Lite-On CA5-8D512 | Asus Zenbook S UX393JA Intel SSD 660p 1TB SSDPEKNW010T8 | Lenovo Yoga 9i 14ITL5 Samsung SSD PM981a MZVLB256HBHQ | |
|---|---|---|---|---|---|
| AS SSD | -80% | -2% | -27% | -21% | |
| Seq Read (MB/s) | 2188 | 1801 -18% | 2933 34% | 1405 -36% | 2177 -1% |
| Seq Write (MB/s) | 1320 | 1125 -15% | 810 -39% | 1062 -20% | 813 -38% |
| 4K Read (MB/s) | 53.5 | 39.7 -26% | 56.6 6% | 50.8 -5% | 53.2 -1% |
| 4K Write (MB/s) | 123.7 | 67 -46% | 147.6 19% | 124.9 1% | 180 46% |
| 4K-64 Read (MB/s) | 1010 | 1253 24% | 856 -15% | 590 -42% | 531 -47% |
| 4K-64 Write (MB/s) | 1808 | 209 -88% | 1099 -39% | 840 -54% | 398.5 -78% |
| Access Time Read * (ms) | 0.055 | 0.069 -25% | 0.046 16% | 0.041 25% | 0.052 5% |
| Access Time Write * (ms) | 0.076 | 0.625 -722% | 0.028 63% | 0.118 -55% | 0.058 24% |
| Score Read (Points) | 1282 | 1472 15% | 1206 -6% | 781 -39% | 802 -37% |
| Score Write (Points) | 2063 | 388 -81% | 1328 -36% | 1071 -48% | 660 -68% |
| Score Total (Points) | 3970 | 2583 -35% | 3059 -23% | 2251 -43% | 1822 -54% |
| Copy ISO MB/s (MB/s) | 1644 | 1293 -21% | 1459 -11% | 1962 19% | |
| Copy Program MB/s (MB/s) | 920 | 560 -39% | 600 -35% | 522 -43% | |
| Copy Game MB/s (MB/s) | 1725 | 927 -46% | 1411 -18% | 1258 -27% | |
| CrystalDiskMark 5.2 / 6 | -10% | 25% | -12% | 4% | |
| Write 4K (MB/s) | 82.2 | 106.7 30% | 161.8 97% | 129.5 58% | 139.6 70% |
| Read 4K (MB/s) | 45.7 | 49.94 9% | 60.6 33% | 54 18% | 37.3 -18% |
| Write Seq (MB/s) | 2000 | 1223 -39% | 2209 10% | 1265 -37% | 1827 -9% |
| Read Seq (MB/s) | 2206 | 1801 -18% | 2473 12% | 1410 -36% | 2253 2% |
| Write 4K Q32T1 (MB/s) | 451.2 | 325.3 -28% | 514 14% | 420.3 -7% | 467.9 4% |
| Read 4K Q32T1 (MB/s) | 351 | 551 57% | 586 67% | 357.7 2% | 366.7 4% |
| Write Seq Q32T1 (MB/s) | 2982 | 1224 -59% | 2205 -26% | 1799 -40% | 2349 -21% |
| Read Seq Q32T1 (MB/s) | 3529 | 2350 -33% | 3352 -5% | 1616 -54% | 3540 0% |
| Moyenne finale (programmes/paramètres) | -45% /
-55% | 12% /
10% | -20% /
-22% | -9% /
-12% |
* ... Moindre est la valeur, meilleures sont les performances

Disk Throttling: DiskSpd Read Loop, Queue Depth 8
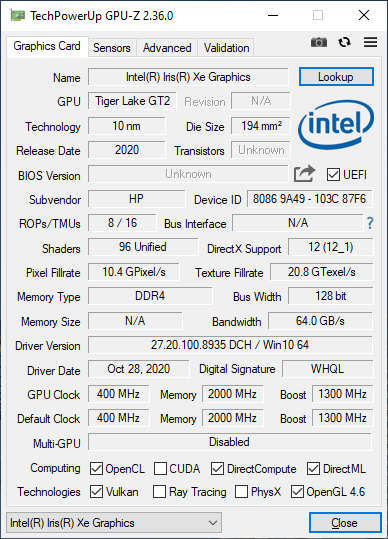
Performances des GPU
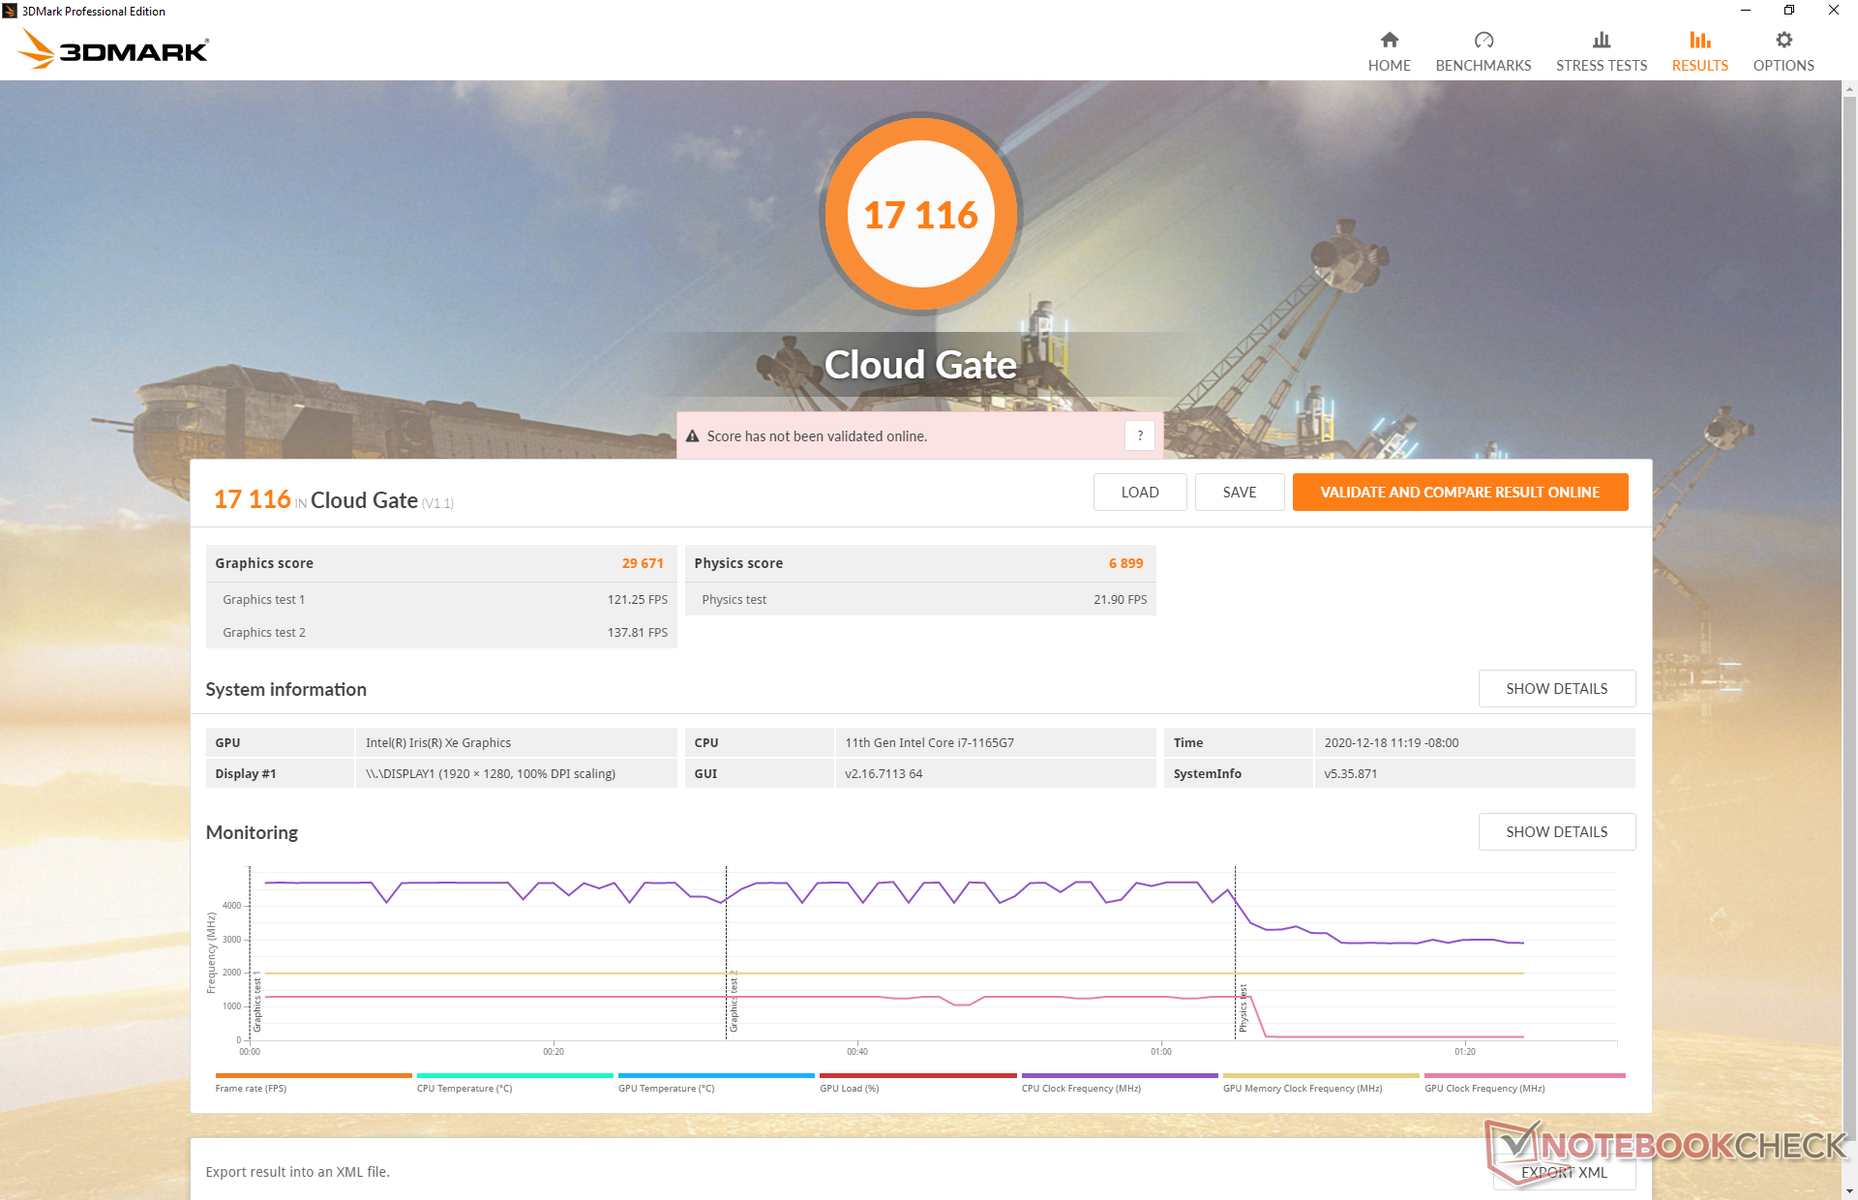
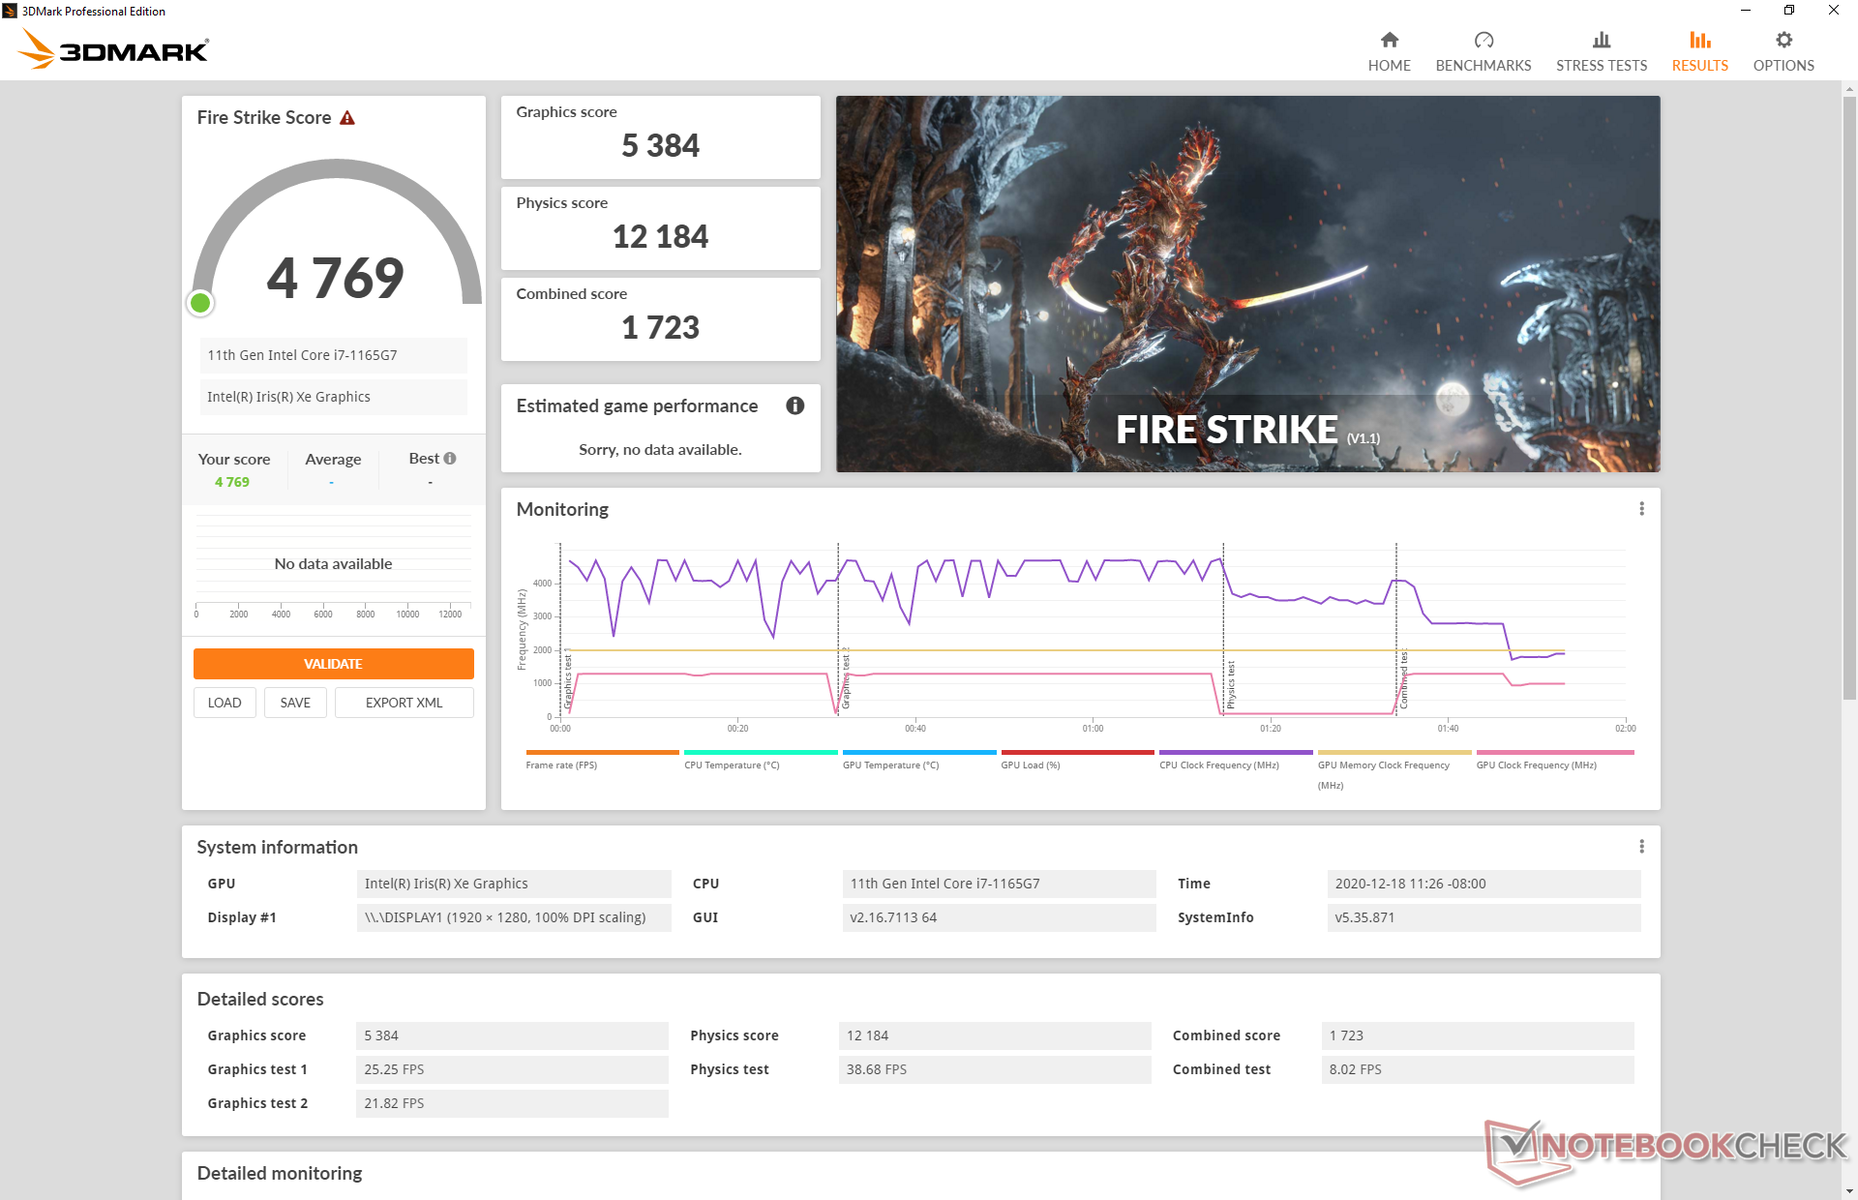
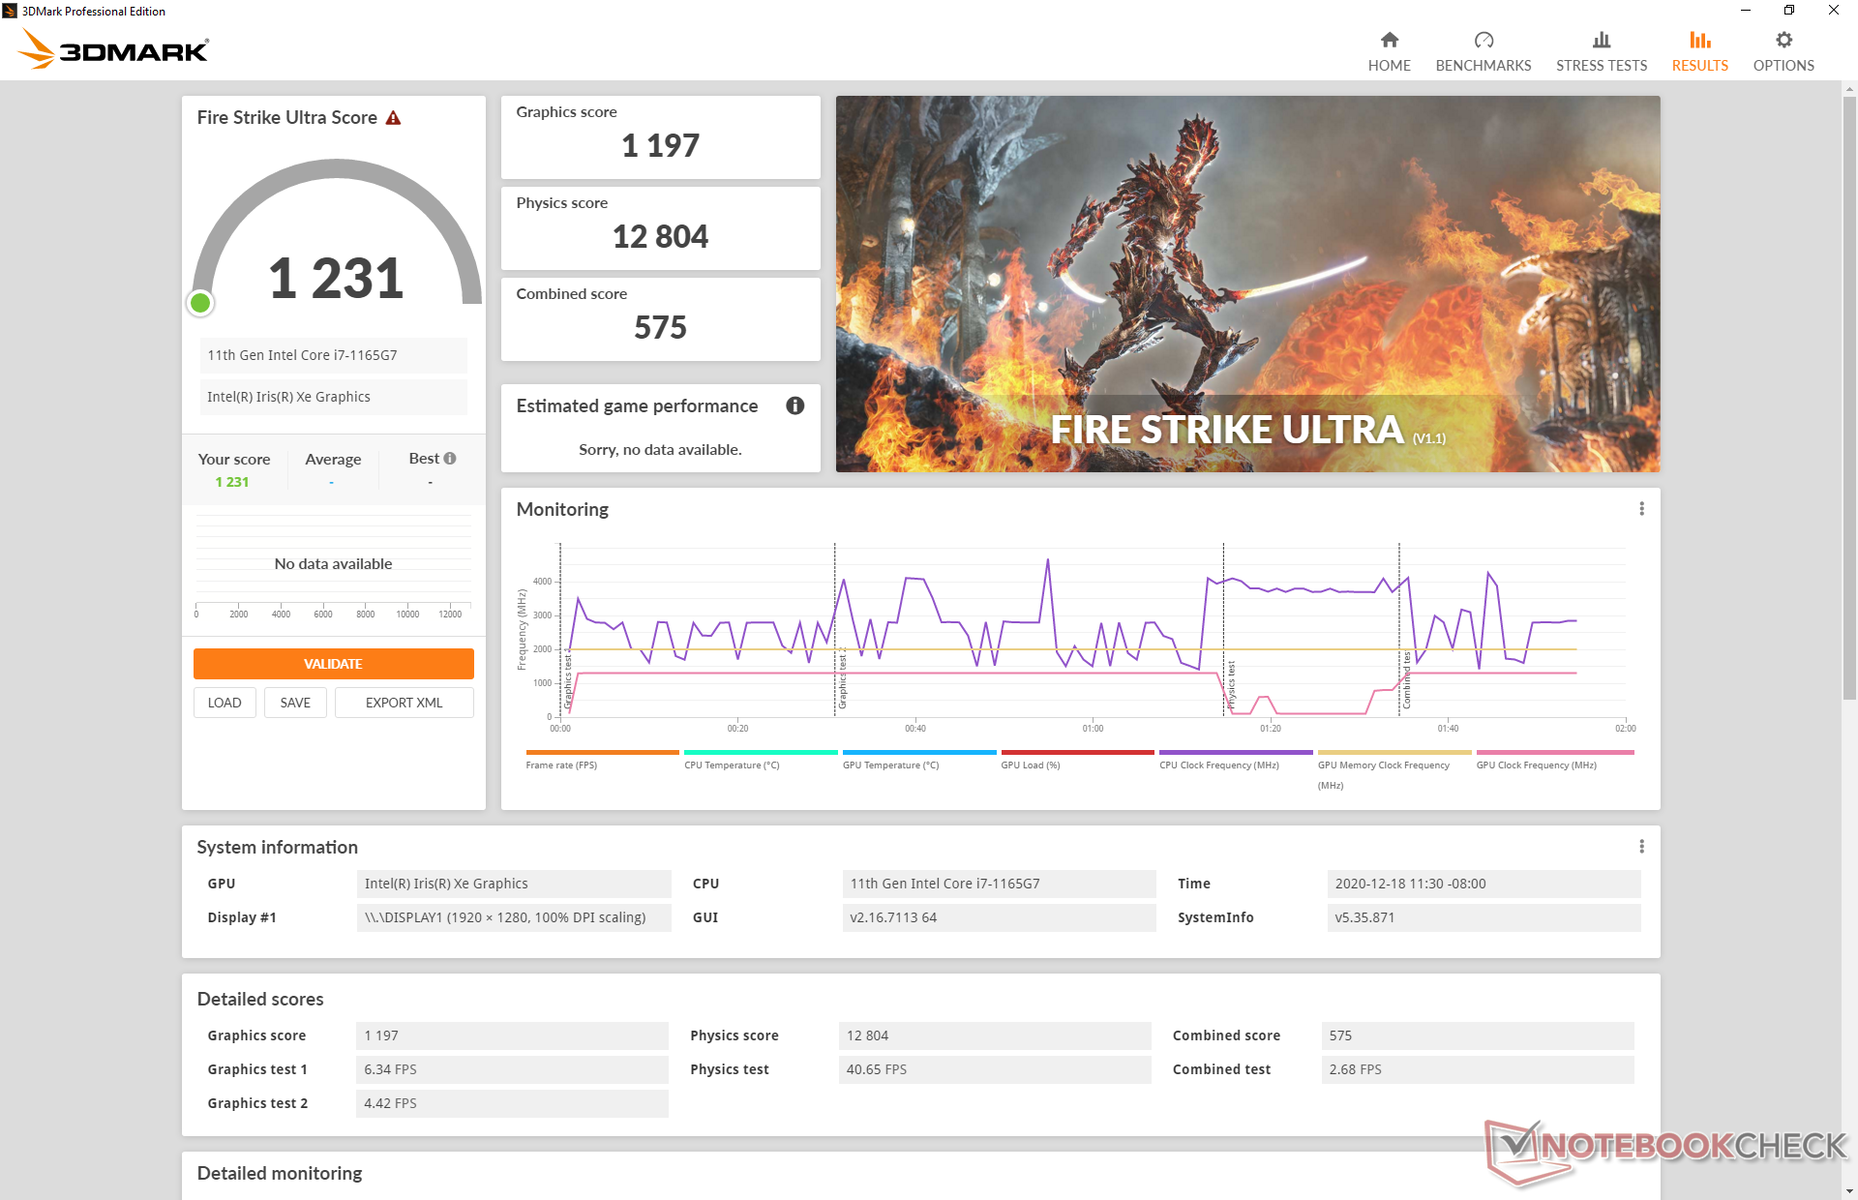
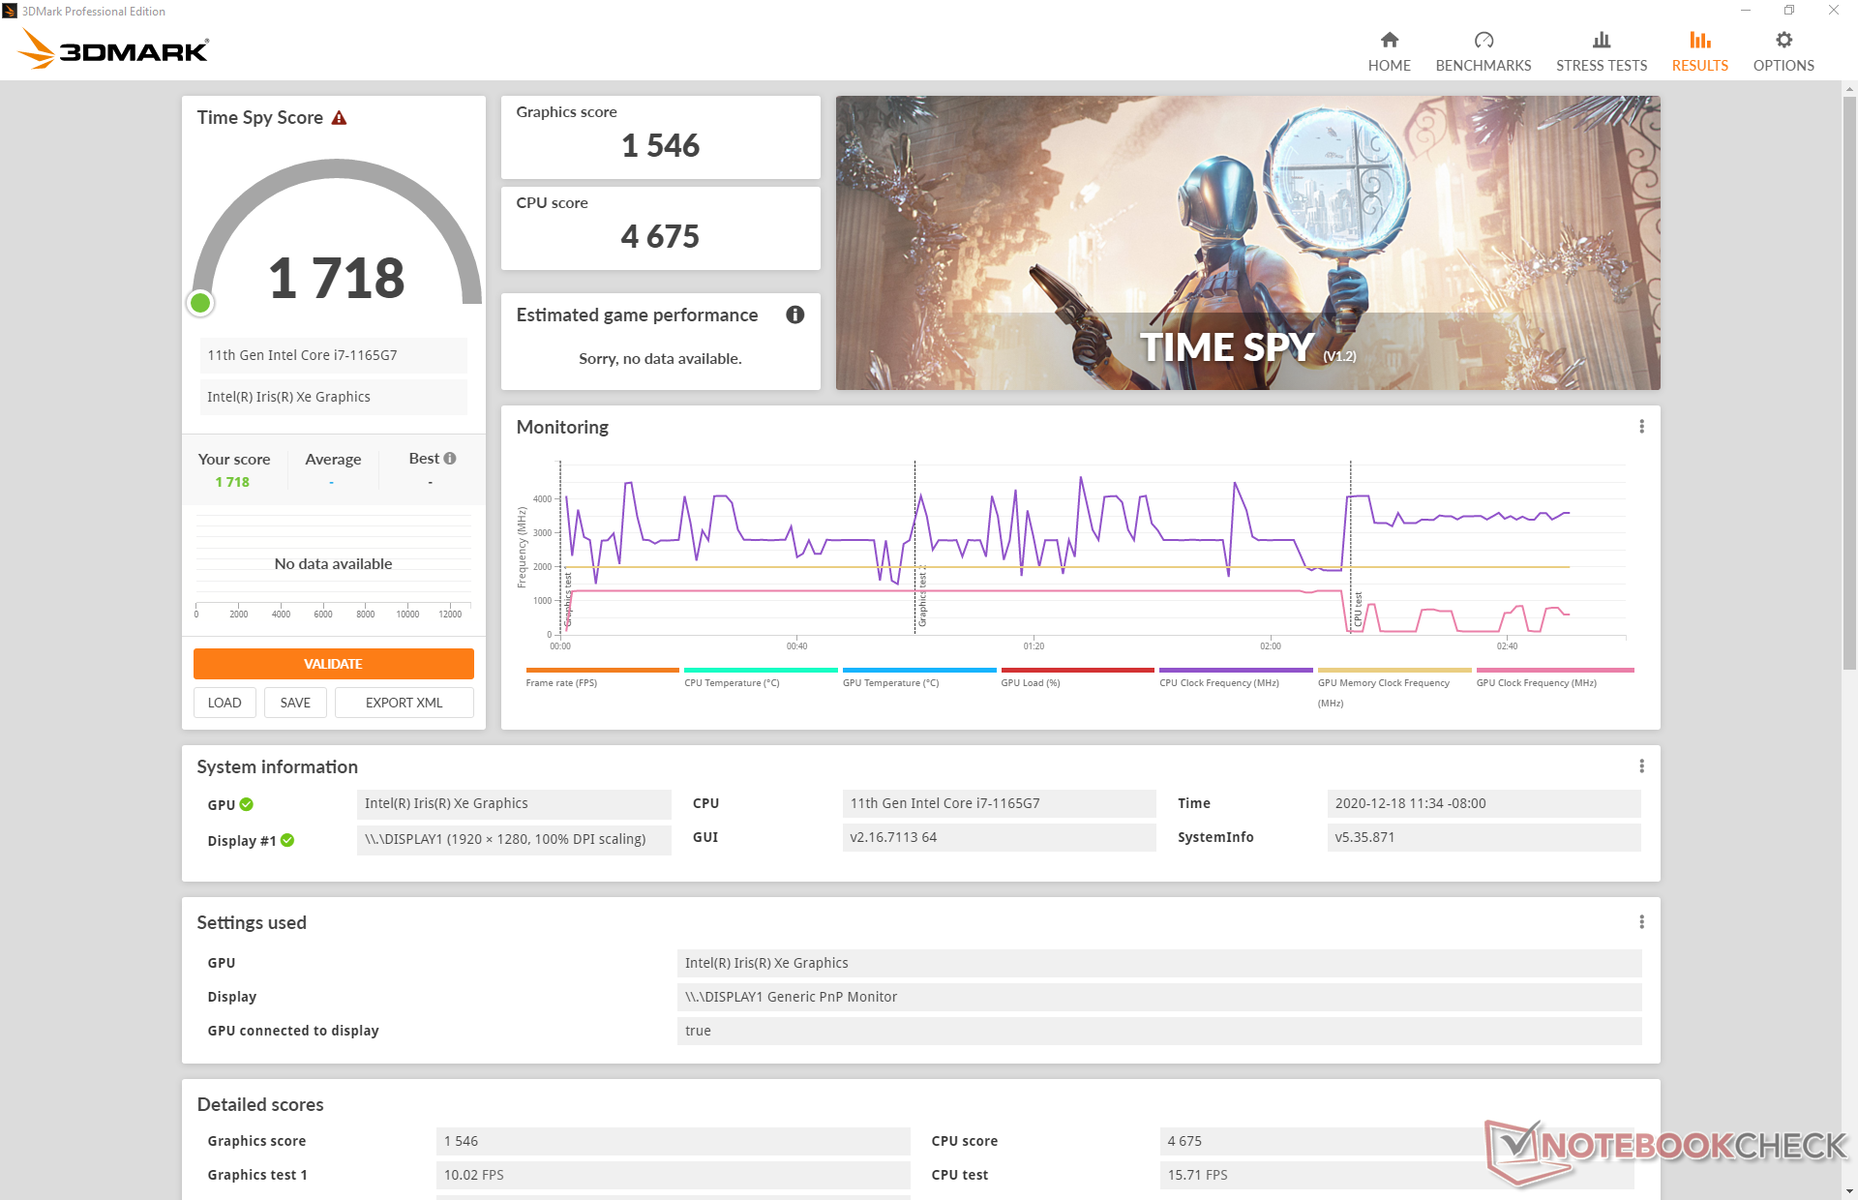
Les performances graphiques sont excellentes et se situent dans le haut de gamme par rapport aux autres ordinateurs portables dotés du même GPU. Les scores de 3DMark sont notamment bien supérieurs d'environ 30 % à ceux du MX350 deGeForce , mais les jeux du monde réel continueront de tourner plus vite sur le GPU Nvidia, le plus souvent grâce à ses pilotes plus matures et prêts pour le jeu.
Les taux de trame des jeux sur le Spectre 14 ont tendance à fluctuer en raison de la fluctuation des taux d'horloge dans des conditions stressantes. Lorsque le moteur tourne au ralentiWitcher 3 sur les réglages les plus bas, par exemple, les fréquences d'images oscilleraient constamment entre 80 et 95 FPS au lieu de rester constantes comme le montre notre graphique ci-dessous. Ce comportement est similaire à celui du XPS 13, bien qu'il soit encore plus prononcé sur la machine de Dell. Nous approfondissons cette question dans notre section "Test de stress".
Voir notre page consacrée aux Iris Xe 96 EU pour plus d'informations techniques et de références.
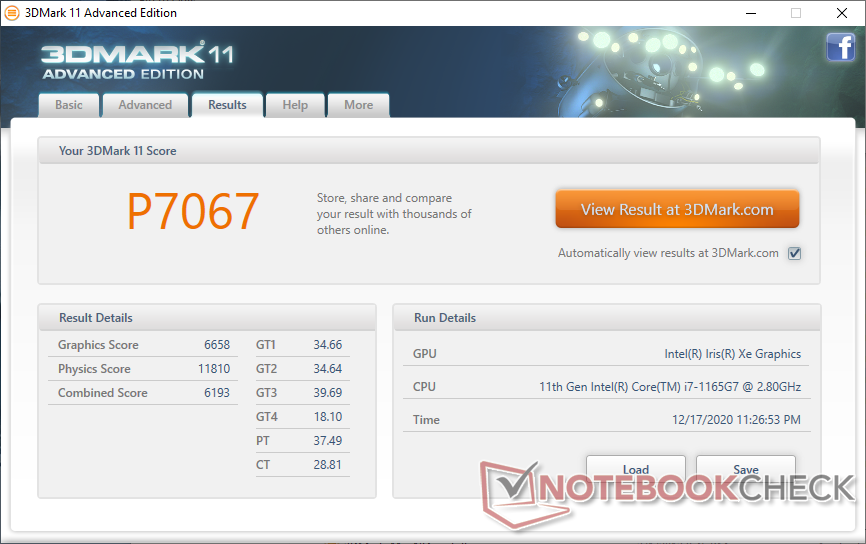
| 3DMark 11 Performance | 7067 points | |
| 3DMark Cloud Gate Standard Score | 17116 points | |
| 3DMark Fire Strike Score | 4769 points | |
| 3DMark Time Spy Score | 1718 points | |
Aide | ||
| Bas | Moyen | Élevé | Ultra | |
|---|---|---|---|---|
| The Witcher 3 (2015) | 77.6 | 50.9 | 30.1 | 13.6 |
| Dota 2 Reborn (2015) | 83.6 | 65.5 | 53 | 46.6 |
| Final Fantasy XV Benchmark (2018) | 41.2 | 22.8 | 17.6 | |
| X-Plane 11.11 (2018) | 46.6 | 34.7 | 31.3 |
Emissions
Bruit du système
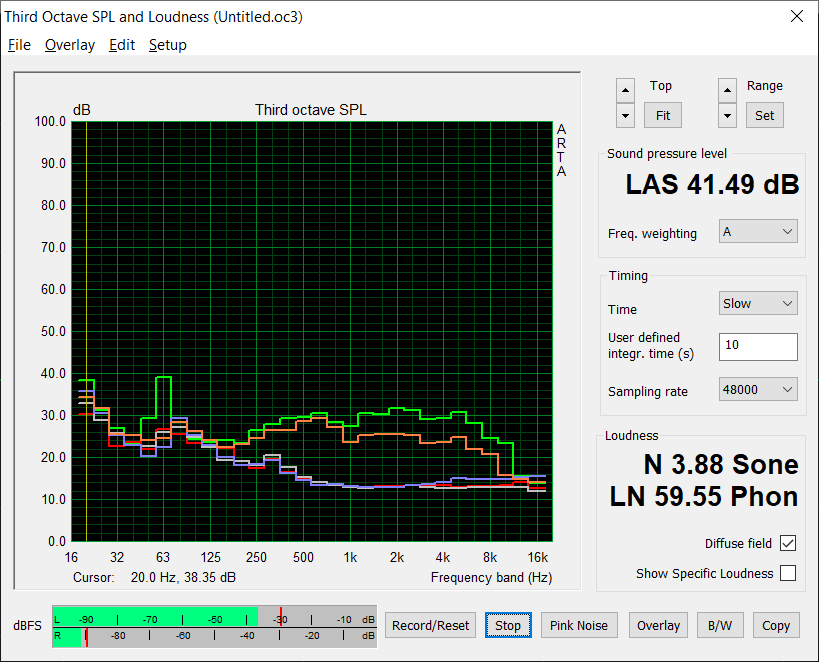
Le bruit des ventilateurs reste silencieux même lorsque l'on navigue sur le web ou que l'on diffuse des vidéos en mode "Performance". L'exécution de la première scène de référence de 3DMark 06, par exemple, induirait un bruit de ventilateur de seulement 26,4 dB(A) sur un fond silencieux de 25,9 dB(A). Ce n'est que lorsque nous aurons lancé Witcher 3 pendant des périodes plus longues, les ventilateurs commenceraient à fonctionner à des régimes plus élevés et plus audibles. Au pire, les utilisateurs peuvent s'attendre à un bruit de 41,5 dB(A) sans heureusement que les pulsations soient gênantes.
| HP Spectre x360 14t-ea000 Iris Xe G7 96EUs, i7-1165G7, Samsung SSD PM981a MZVLB512HBJQ | HP Spectre x360 13-aw0013dx Iris Plus Graphics G7 (Ice Lake 64 EU), i7-1065G7, Intel Optane Memory H10 with Solid State Storage 32GB + 512GB HBRPEKNX0202A(L/H) | Dell XPS 13 7390 2-in-1 Core i7 Iris Plus Graphics G7 (Ice Lake 64 EU), i7-1065G7, Toshiba BG4 KBG40ZPZ512G | Huawei MateBook 14 2020 Intel GeForce MX350, i7-10510U, Lite-On CA5-8D512 | Lenovo Yoga 9i 14ITL5 Iris Xe G7 80EUs, i5-1135G7, Samsung SSD PM981a MZVLB256HBHQ | |
|---|---|---|---|---|---|
| Noise | -4% | -11% | -12% | -8% | |
| arrêt / environnement * (dB) | 25.8 | 28.5 -10% | 28.1 -9% | 29.3 -14% | 26.3 -2% |
| Idle Minimum * (dB) | 25.9 | 28.5 -10% | 28.1 -8% | 29.3 -13% | 26.3 -2% |
| Idle Average * (dB) | 25.9 | 28.5 -10% | 28.1 -8% | 29.3 -13% | 26.3 -2% |
| Idle Maximum * (dB) | 25.9 | 28.5 -10% | 28.1 -8% | 30.8 -19% | 26.3 -2% |
| Load Average * (dB) | 26.4 | 28.5 -8% | 31.7 -20% | 35.7 -35% | 34.1 -29% |
| Witcher 3 ultra * (dB) | 36.9 | 35.3 4% | 43.4 -18% | 35.7 3% | 43.4 -18% |
| Load Maximum * (dB) | 41.5 | 35.3 15% | 43.4 -5% | 37.9 9% | 43.3 -4% |
* ... Moindre est la valeur, meilleures sont les performances
Degré de la nuisance sonore
| Au repos |
| 25.9 / 25.9 / 25.9 dB(A) |
| Fortement sollicité |
| 26.4 / 41.5 dB(A) |
 | ||
30 dB silencieux 40 dB(A) audible 50 dB(A) bruyant |
||
min: | ||
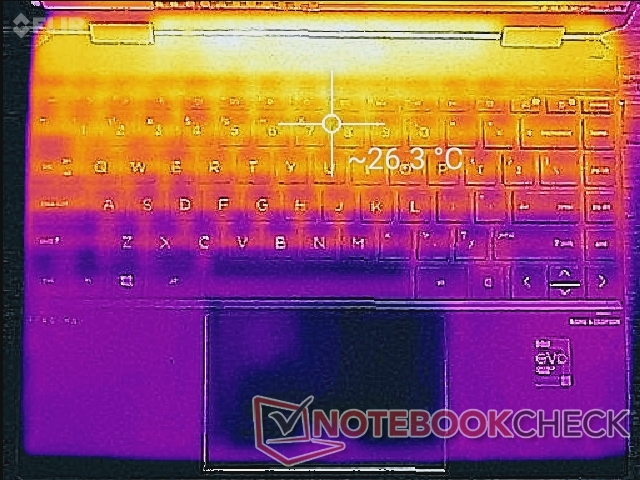
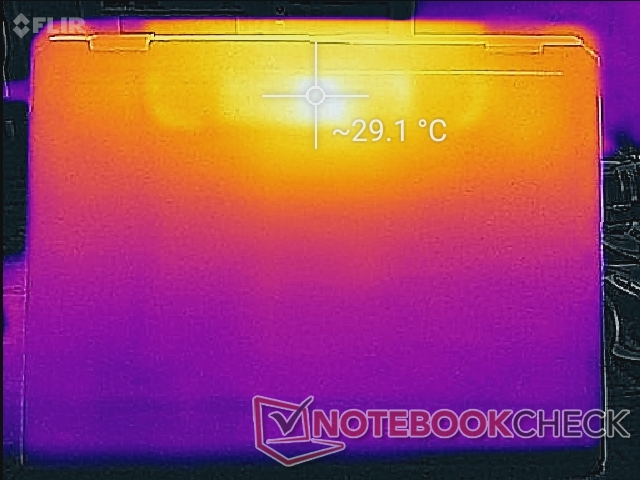
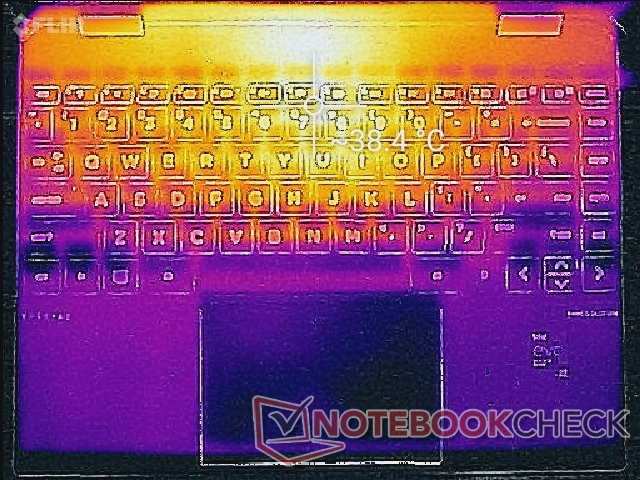
Température
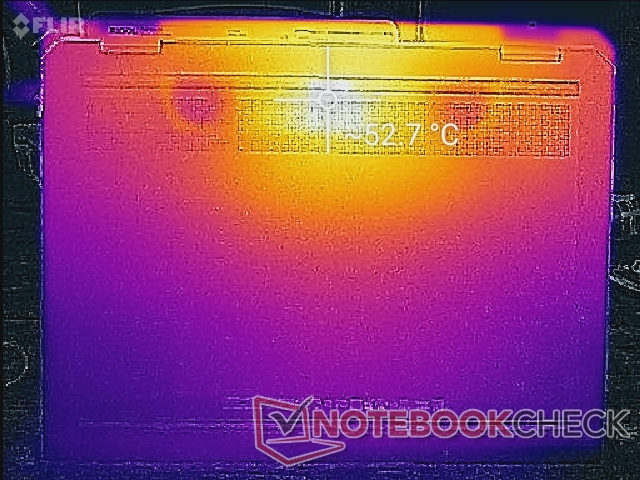
L'évolution de la température de surface est symétrique en raison de la solution de refroidissement symétrique à l'intérieur. Le centre du clavier peut être aussi chaud que 39 C tandis que le point chaud inférieur peut atteindre 53 W lorsqu'il est soumis à une forte contrainte de traitement. Ces résultats sont encore plus chauds que ce que nous avons enregistré sur le Spectre x360 13 de 13,3 pouces, de 5 à 10 degrés C de chaque côté. Bien que les repose-poignets ne soient jamais trop chauds, un fond plus frais aurait été apprécié
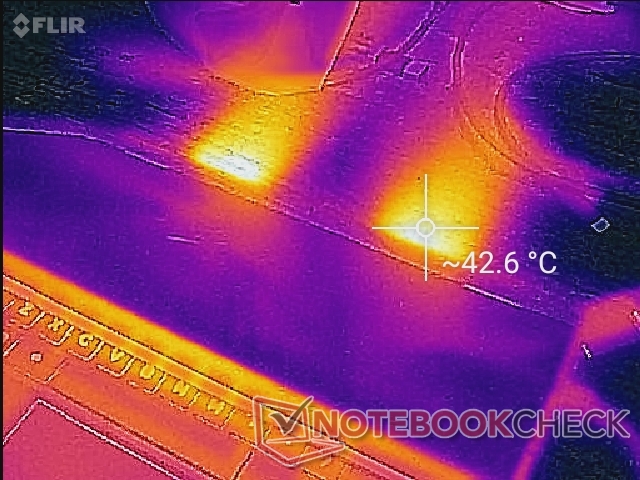
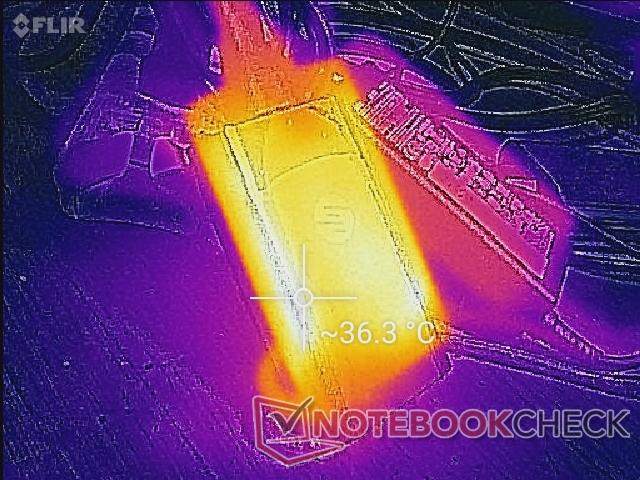
(±) La température maximale du côté supérieur est de 40.4 °C / 105 F, par rapport à la moyenne de 35.4 °C / 96 F, allant de 19.6 à 60 °C pour la classe Convertible.
(-) Le fond chauffe jusqu'à un maximum de 52.8 °C / 127 F, contre une moyenne de 36.9 °C / 98 F
(+) En utilisation inactive, la température moyenne du côté supérieur est de 25 °C / 77 F, par rapport à la moyenne du dispositif de 30.3 °C / 87 F.
(+) Les repose-poignets et le pavé tactile sont plus froids que la température de la peau avec un maximum de 27.6 °C / 81.7 F et sont donc froids au toucher.
(±) La température moyenne de la zone de l'appui-paume de dispositifs similaires était de 28 °C / 82.4 F (+0.4 °C / #0.7 F).
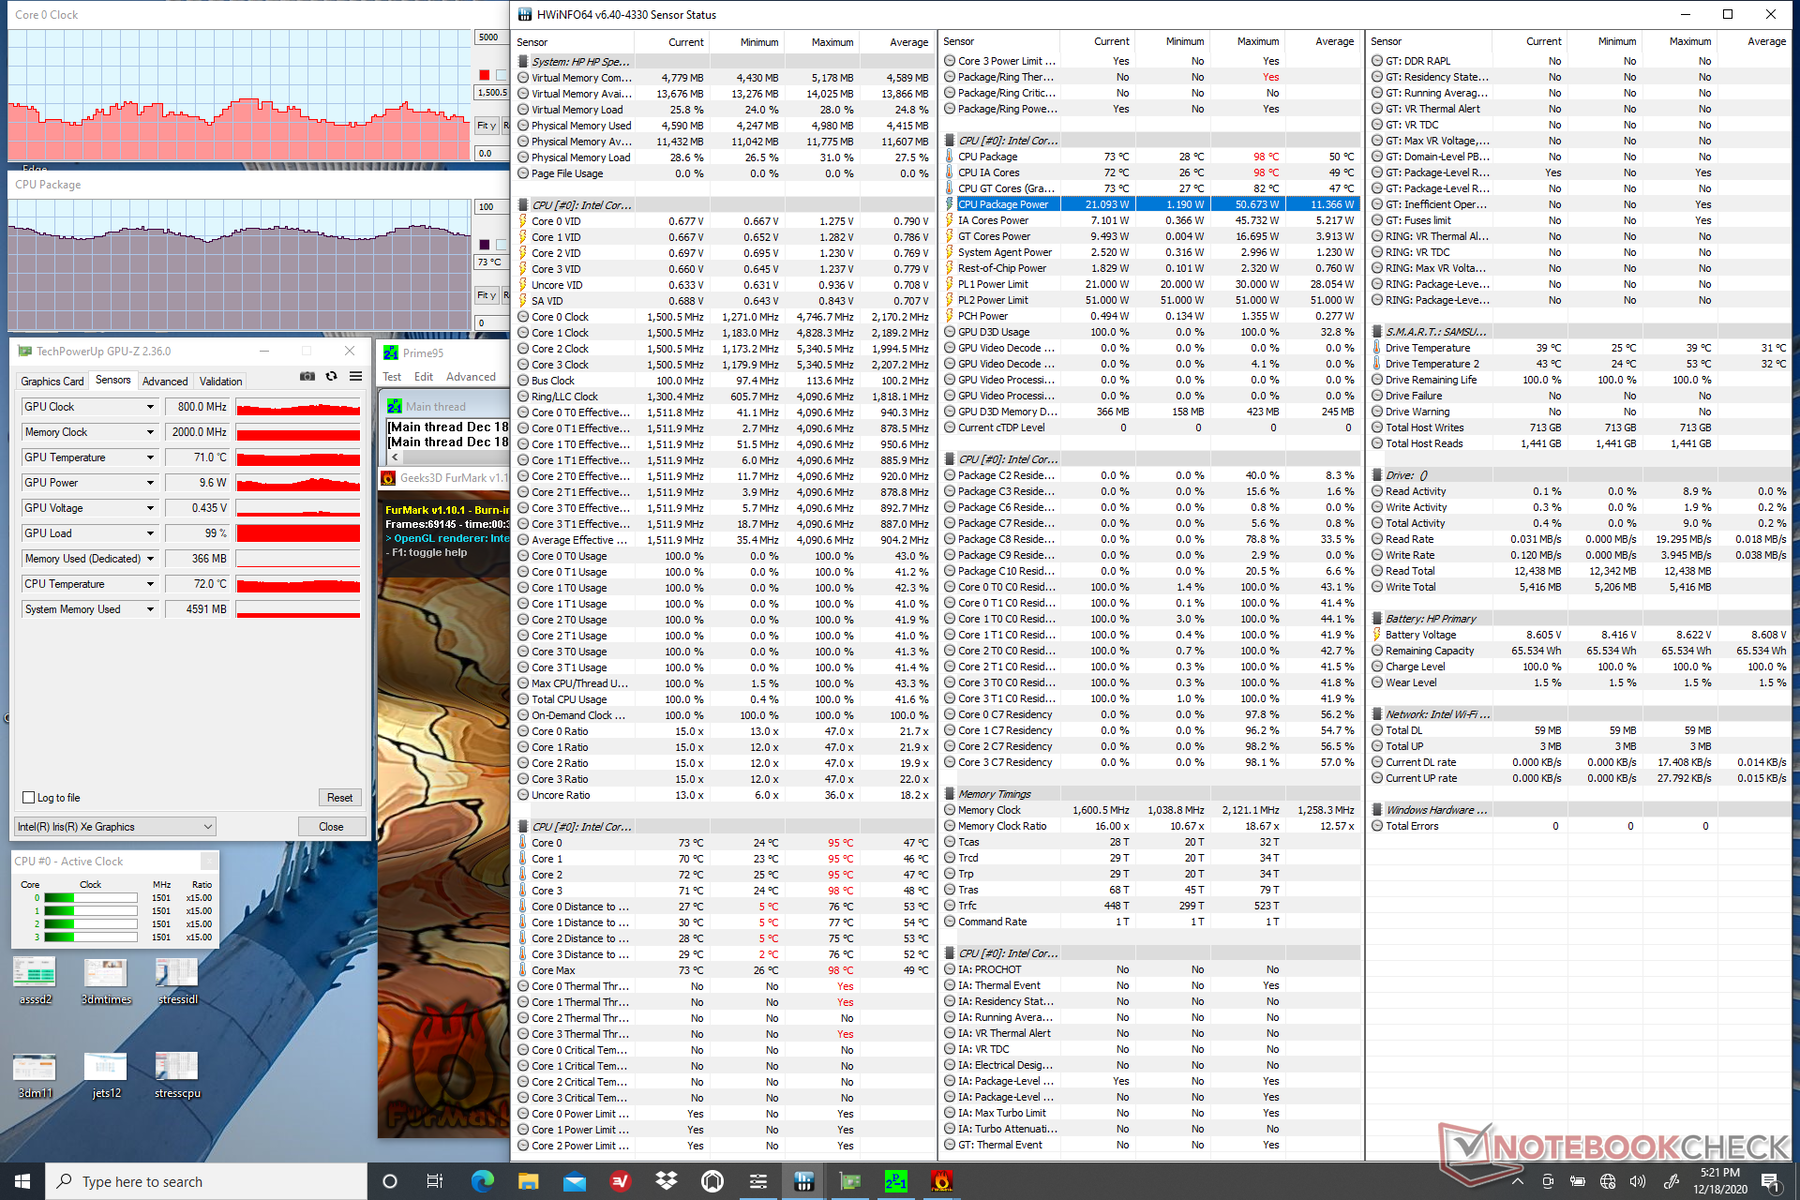
Test de stress
En cas de stress avec Prime95, l'unité centrale passerait à 4 GHz pendant les premières secondes et à une température centrale de 95 C. La fréquence d'horloge et la température centrale baisseraient ensuite régulièrement et finiraient par osciller entre 2,1 et 3,4 GHz et 75 C et 95 C, respectivement. En effectuant ce même test sur le XPS 13 9310 avec le même processeur Core i7-1165G7, on obtiendrait des fréquences d'horloge plus lentes de 1,9 à 3,1 GHz et une température centrale plus froide de 71 à 78 C
Les fréquences d'horloge du CPU et du GPU fluctueraient également lors des jeux, ce qui entraînerait des fréquences d'images instables. Notre capture d'écran ci-dessous illustre ce phénomène lors de l'exécution Witcher 3. Vous pouvez activer la synchronisation en v pour réduire les déchirures de l'écran et les irrégularités du rythme des images
Le fait de fonctionner sur batterie limite les performances du processeur, même lorsqu'il se trouve sur le profil de puissance Performance. Un test 3DMark 11 sur batteries donnerait des résultats en physique et en graphique de 3209 et 6714 points, respectivement, contre 11810 et 6658 points sur secteur.
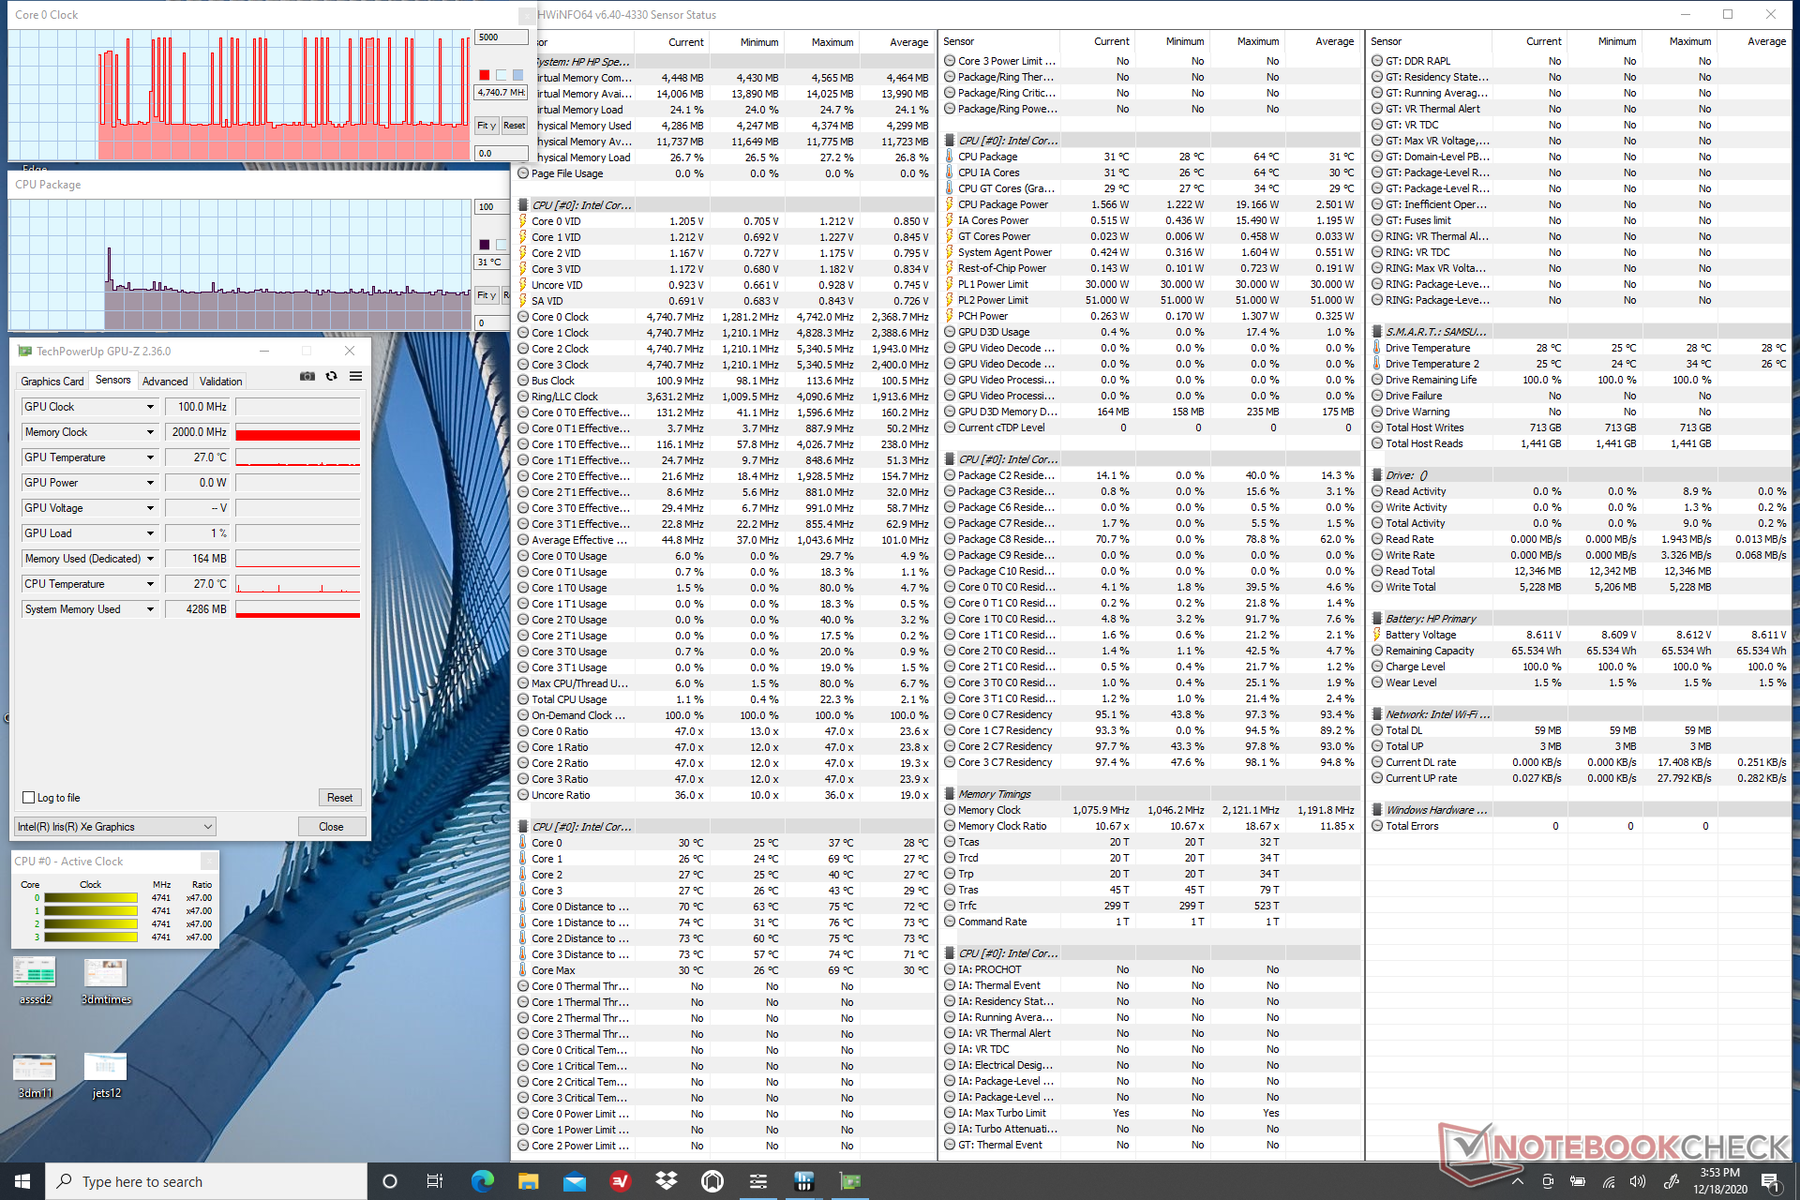
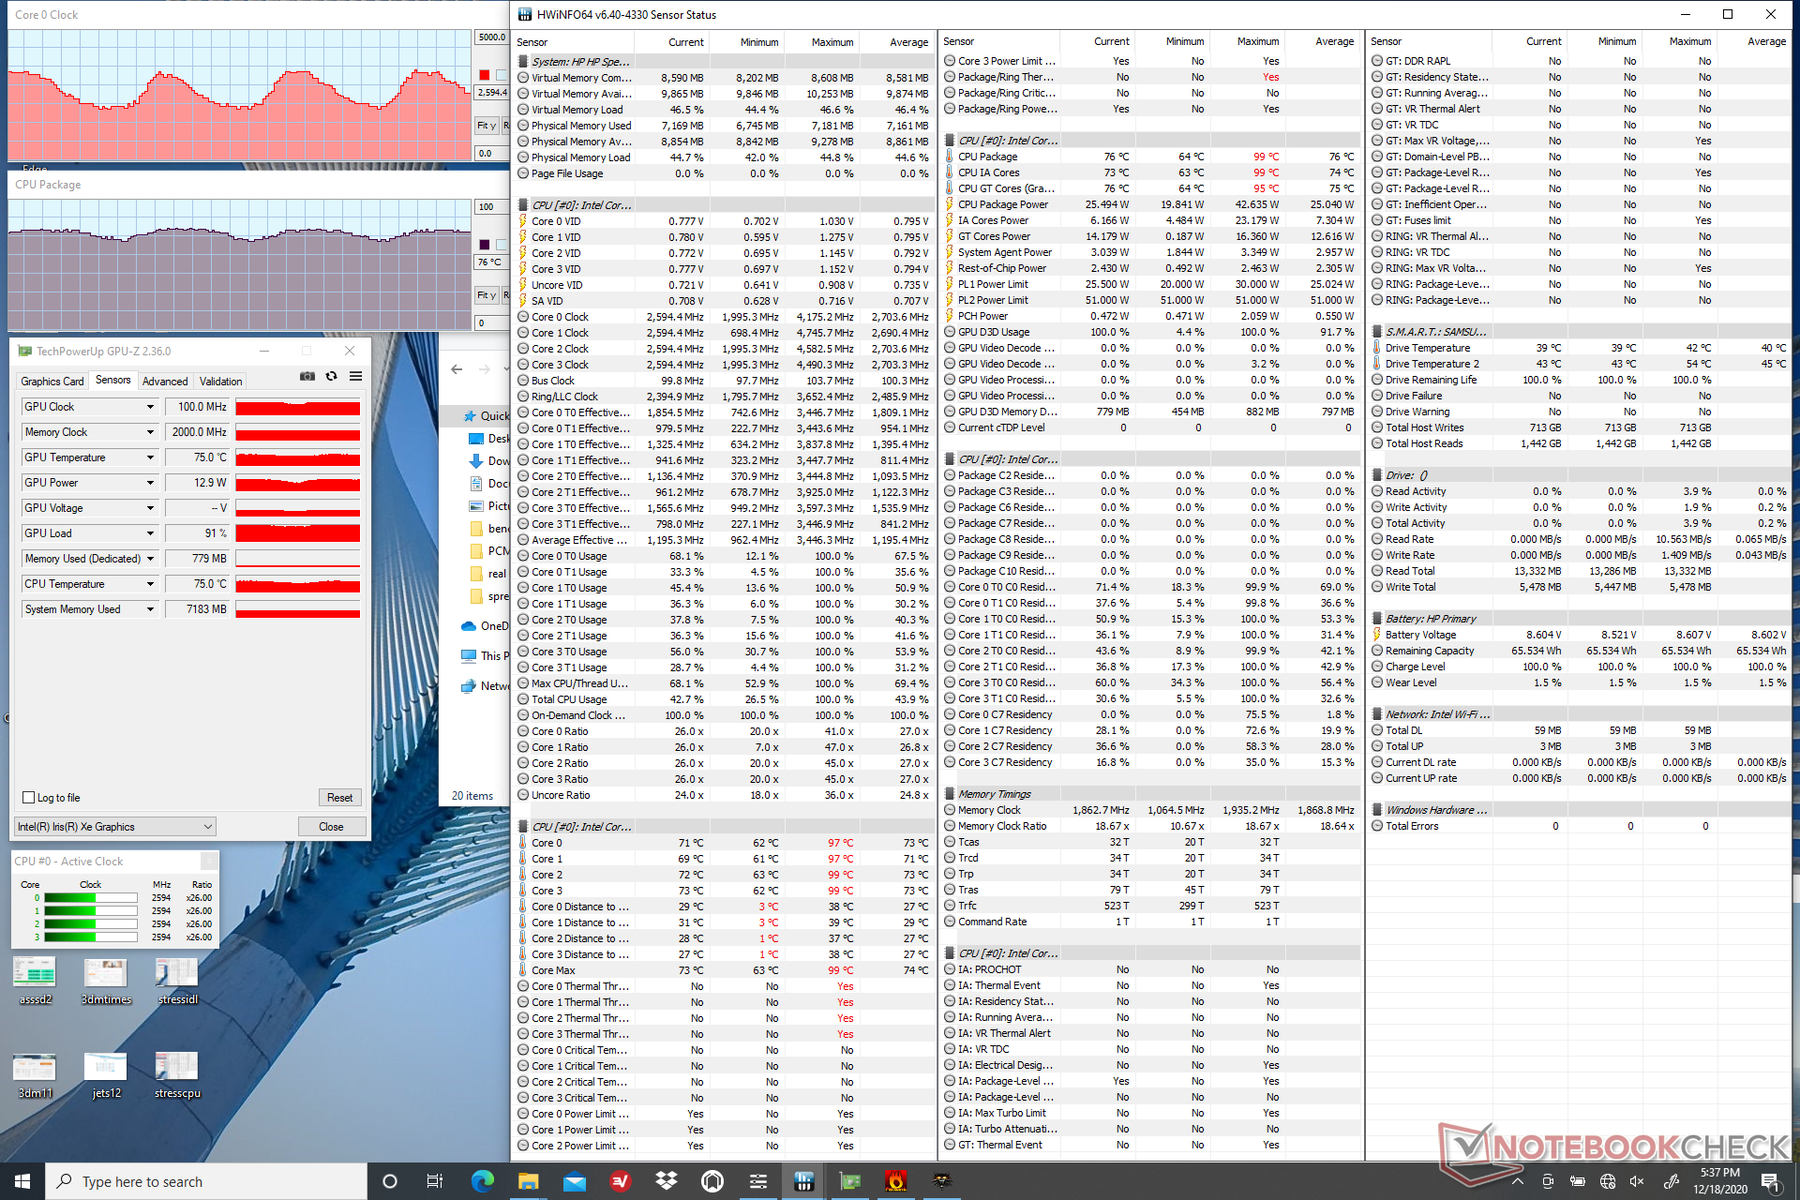
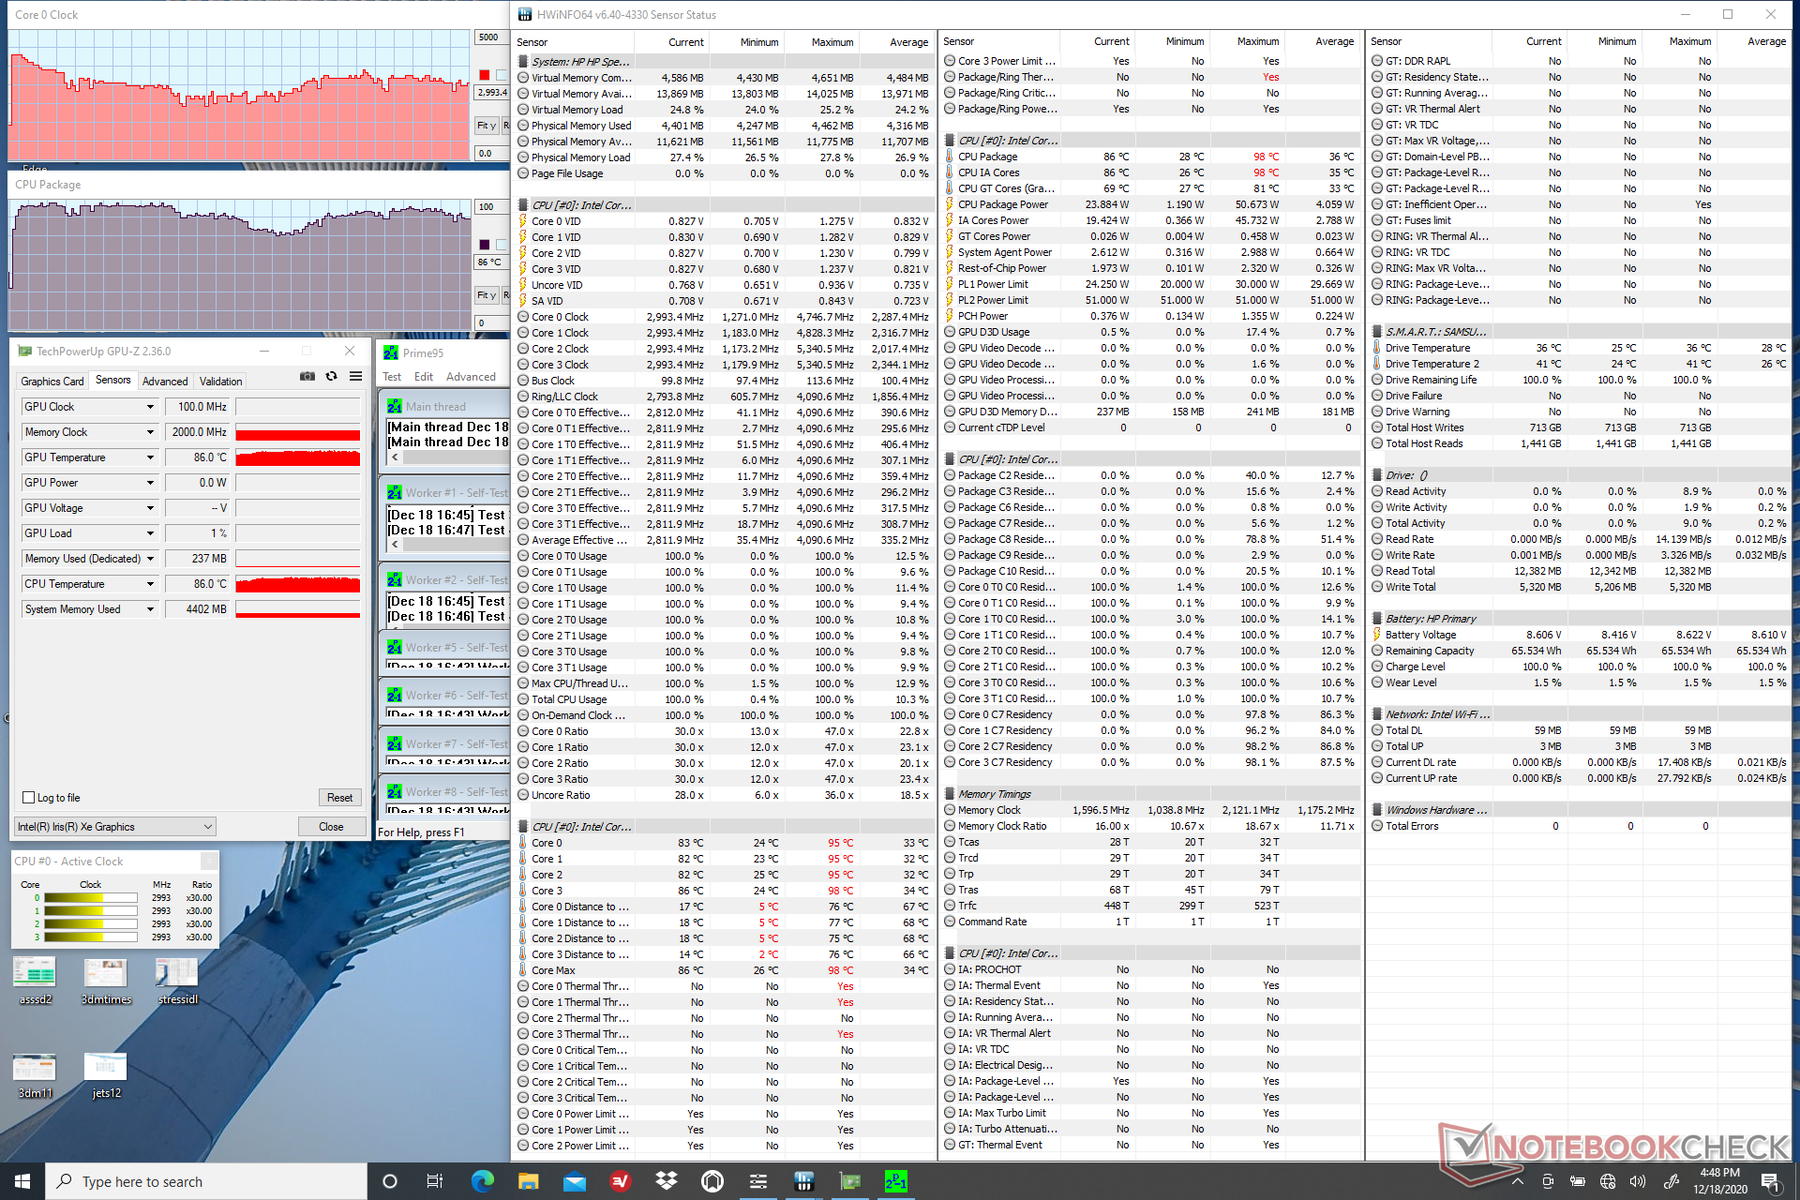
| Horloge CPU (GHz) | HorlogeGPU(MHz) | Températuremoyenne duCPU (°C) | |
| Système en veilleuse | -- | -- | 31 |
| Prime95 Stress | 2.1 - 3.4 | -- | 75 - 95 |
| Prime95 + FurMark Stress | 1.4 - 2.3 | 800 - 1150 | 70 - 80 |
| Witcher 3 Stress | 2.0 - 3.4 | 1150 - 1300 | 69 - 76 |
Intervenants


HP Spectre x360 14t-ea000 analyse audio
(±) | le niveau sonore du haut-parleur est moyen mais bon (79.6# dB)
Basses 100 - 315 Hz
(±) | basse réduite - en moyenne 11.6% inférieure à la médiane
(±) | la linéarité des basses est moyenne (10.5% delta à la fréquence précédente)
Médiums 400 - 2000 Hz
(+) | médiane équilibrée - seulement 3.2% de la médiane
(+) | les médiums sont linéaires (4% delta à la fréquence précédente)
Aiguës 2 - 16 kHz
(+) | des sommets équilibrés - à seulement 2.8% de la médiane
(+) | les aigus sont linéaires (5.3% delta à la fréquence précédente)
Globalement 100 - 16 000 Hz
(+) | le son global est linéaire (12.3% différence à la médiane)
Par rapport à la même classe
» 14% de tous les appareils testés de cette catégorie étaient meilleurs, 3% similaires, 83% pires
» Le meilleur avait un delta de 6%, la moyenne était de 20%, le pire était de 57%.
Par rapport à tous les appareils testés
» 10% de tous les appareils testés étaient meilleurs, 3% similaires, 87% pires
» Le meilleur avait un delta de 4%, la moyenne était de 23%, le pire était de 134%.
Apple MacBook 12 (Early 2016) 1.1 GHz analyse audio
(+) | les haut-parleurs peuvent jouer relativement fort (83.6# dB)
Basses 100 - 315 Hz
(±) | basse réduite - en moyenne 11.3% inférieure à la médiane
(±) | la linéarité des basses est moyenne (14.2% delta à la fréquence précédente)
Médiums 400 - 2000 Hz
(+) | médiane équilibrée - seulement 2.4% de la médiane
(+) | les médiums sont linéaires (5.5% delta à la fréquence précédente)
Aiguës 2 - 16 kHz
(+) | des sommets équilibrés - à seulement 2% de la médiane
(+) | les aigus sont linéaires (4.5% delta à la fréquence précédente)
Globalement 100 - 16 000 Hz
(+) | le son global est linéaire (10.2% différence à la médiane)
Par rapport à la même classe
» 7% de tous les appareils testés de cette catégorie étaient meilleurs, 2% similaires, 90% pires
» Le meilleur avait un delta de 5%, la moyenne était de 18%, le pire était de 53%.
Par rapport à tous les appareils testés
» 5% de tous les appareils testés étaient meilleurs, 1% similaires, 94% pires
» Le meilleur avait un delta de 4%, la moyenne était de 23%, le pire était de 134%.
Energy Management
Power Consumption
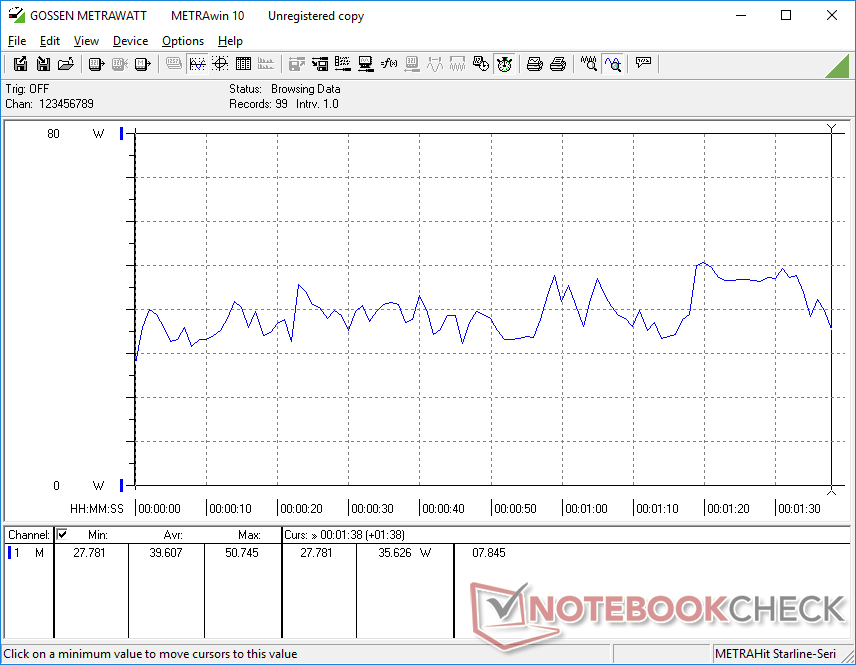
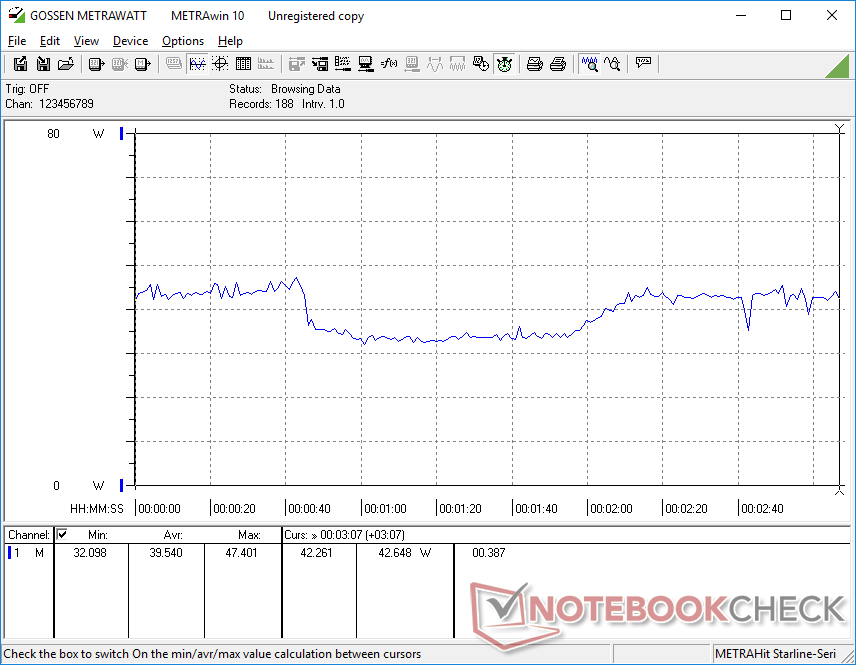
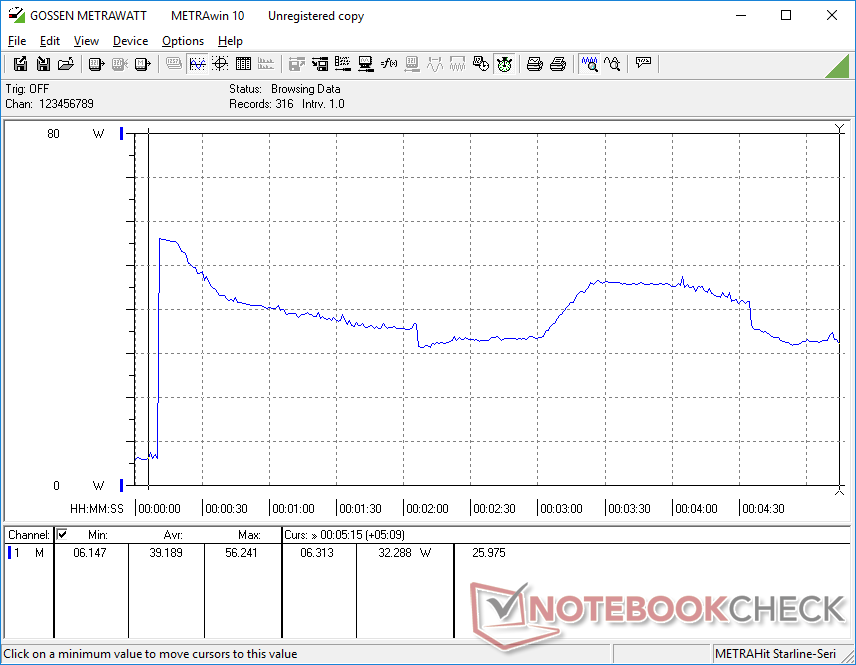
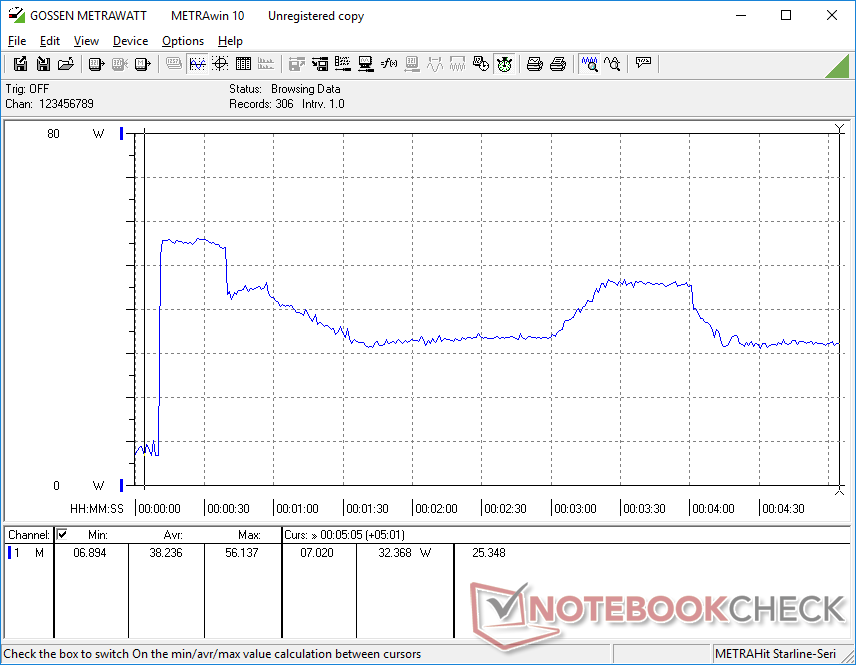
Power consumption fluctuates more readily on the Spectre x360 14 when compared to most other Ultrabooks with the same Core i7-1165G7 like the Asus ZenBook 14. Our screenshots below illustrate the ranges owners can expect when running high processing loads. This behavior is in line with the fluctuating clock rates we observed above.
On average, however, power consumption when running higher loads isn't all that different from the Asus Zenbook S or Lenovo Yoga 9i 14 each equipped with less powerful Ice Lake or Core i5 processors. The HP is especially efficient when compared to Ultrabooks with discrete GeForce MX graphics like the Huawei MateBook 14 which consumes about 15 to 20 W more when gaming.
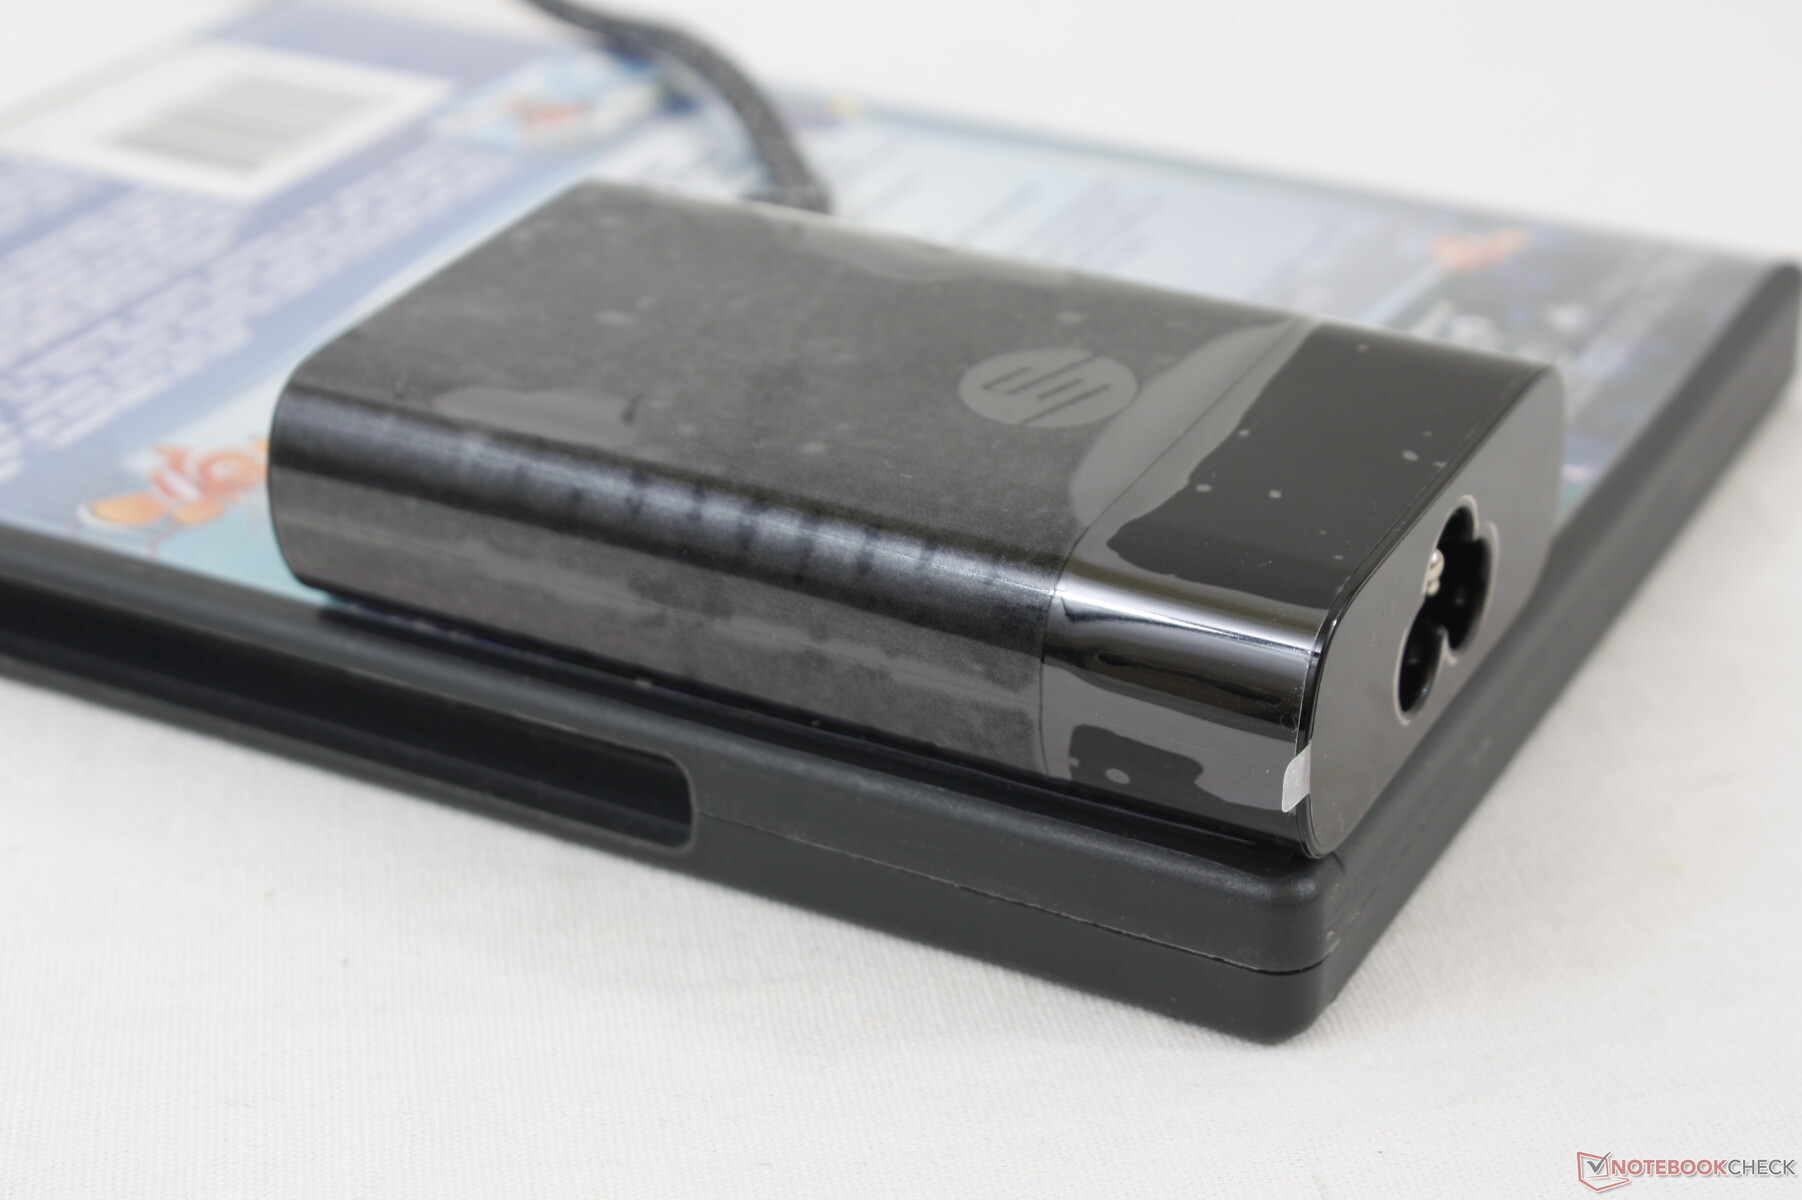
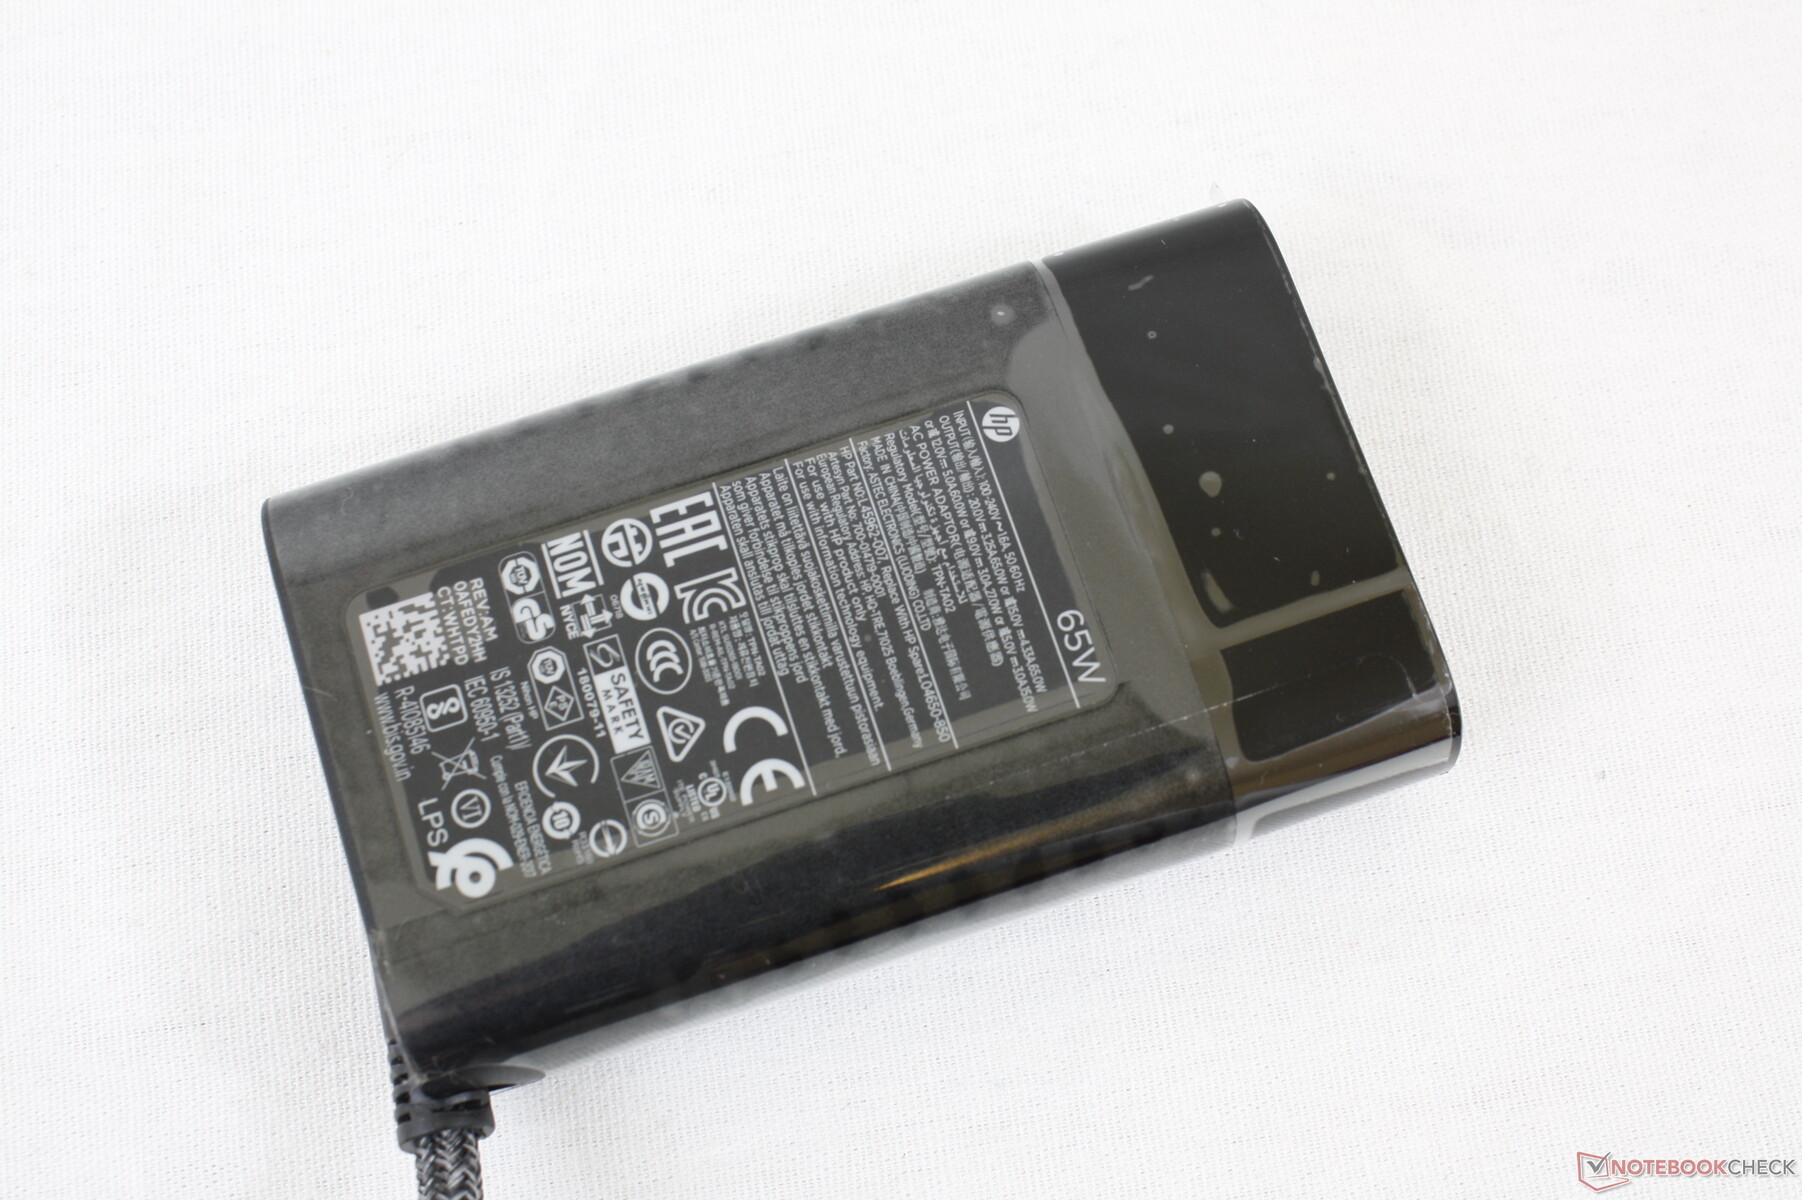
We're able to record a temporary maximum draw of 56.2 W from the small (~8.8 x 5.3 x 2.1 cm) 65 W AC adapter when running extreme loads.
It's worth noting that the default HP Smart Sense power profile is not the most power efficient mode. During our tests, the system would consume at least 6 W on Smart Sense mode compared to just 2 to 3 W when on Quiet mode. You'll want to use Quiet mode if battery life is of utmost importance.
| Éteint/en veille | |
| Au repos | |
| Fortement sollicité |
|
Légende:
min: | |
| HP Spectre x360 14t-ea000 i7-1165G7, Iris Xe G7 96EUs, Samsung SSD PM981a MZVLB512HBJQ, IPS, 1920x1280, 13.5" | HP Spectre x360 13-aw0013dx i7-1065G7, Iris Plus Graphics G7 (Ice Lake 64 EU), Intel Optane Memory H10 with Solid State Storage 32GB + 512GB HBRPEKNX0202A(L/H), IPS, 1920x1080, 13.3" | Dell XPS 13 7390 2-in-1 Core i7 i7-1065G7, Iris Plus Graphics G7 (Ice Lake 64 EU), Toshiba BG4 KBG40ZPZ512G, IPS, 1920x1200, 13.4" | Huawei MateBook 14 2020 Intel i7-10510U, GeForce MX350, Lite-On CA5-8D512, IPS LED, 2160x1440, 14" | Asus Zenbook S UX393JA i7-1065G7, Iris Plus Graphics G7 (Ice Lake 64 EU), Intel SSD 660p 1TB SSDPEKNW010T8, IPS, 3300x2200, 13.9" | Lenovo Yoga 9i 14ITL5 i5-1135G7, Iris Xe G7 80EUs, Samsung SSD PM981a MZVLB256HBHQ, IPS, 1920x1080, 14" | |
|---|---|---|---|---|---|---|
| Power Consumption | -2% | -1% | -43% | -20% | -11% | |
| Idle Minimum * (Watt) | 3 | 3.9 -30% | 2.6 13% | 3 -0% | 4.1 -37% | 3.3 -10% |
| Idle Average * (Watt) | 5.1 | 6.3 -24% | 5.3 -4% | 9 -76% | 7.5 -47% | 6.7 -31% |
| Idle Maximum * (Watt) | 6.4 | 6.8 -6% | 7 -9% | 11 -72% | 8.5 -33% | 6.9 -8% |
| Load Average * (Watt) | 39.6 | 32.6 18% | 43.1 -9% | 60.8 -54% | 36.8 7% | 41.4 -5% |
| Witcher 3 ultra * (Watt) | 39.6 | 25.6 35% | 43.1 -9% | 56 -41% | 39.2 1% | 39.3 1% |
| Load Maximum * (Watt) | 56.2 | 59 -5% | 49 13% | 65.6 -17% | 61.6 -10% | 64.7 -15% |
* ... Moindre est la valeur, meilleures sont les performances
Durée de vie des piles
La capacité de la batterie est 10 % plus importante que celle du Spectre x360 13 (66 Wh contre 60 Wh) et l'autonomie du WLAN est plus longue d'environ 1,5 heure. Les utilisateurs peuvent s'attendre à près de 12 heures d'utilisation réelle du WLAN avec une charge complète.
La marche au ralenti sur le bureau avec le réglage de luminosité le plus bas en mode HP Smart Sense ne durerait que 14,5 heures contre plus de 36 heures en mode Silencieux. Cet écart important peut être dû à la consommation d'énergie plus élevée du mode Smart Sense mentionnée ci-dessus.
Le chargement du vide à la pleine capacité prend environ 2 à 2,5 heures.
| HP Spectre x360 14t-ea000 i7-1165G7, Iris Xe G7 96EUs, 66 Wh | HP Spectre x360 13-aw0013dx i7-1065G7, Iris Plus Graphics G7 (Ice Lake 64 EU), 60 Wh | Dell XPS 13 7390 2-in-1 Core i7 i7-1065G7, Iris Plus Graphics G7 (Ice Lake 64 EU), 51 Wh | Huawei MateBook 14 2020 Intel i7-10510U, GeForce MX350, 56 Wh | Asus Zenbook S UX393JA i7-1065G7, Iris Plus Graphics G7 (Ice Lake 64 EU), 67 Wh | Lenovo Yoga 9i 14ITL5 i5-1135G7, Iris Xe G7 80EUs, 60 Wh | |
|---|---|---|---|---|---|---|
| Autonomie de la batterie | -0% | -24% | -5% | -4% | -14% | |
| Reader / Idle (h) | 36.4 | 37.1 2% | 38.4 5% | 37.7 4% | ||
| WiFi v1.3 (h) | 11.8 | 9.9 -16% | 9 -24% | 12.8 8% | 8.3 -30% | 9.9 -16% |
| Load (h) | 2.4 | 2.7 13% | 2 -17% | 2.7 13% | 1.7 -29% |
Points positifs
Points négatifs
Verdict
La meilleure chose au sujet du Spectre x360 14 est qu'il s'agit d'une adaptation parfaite du Spectre x360 13. Presque tout ce que nous aimions dans le modèle 13,3 pouces se retrouve intact sur le modèle 13,5 pouces, notamment l'excellent retour de clavier, le design métallique solide et élégant, l'écran à haut rapport de contraste avec une couverture sRGB complète et la longue durée de vie des piles. Toutefois, cela signifie également que le système hérite de bon nombre des mêmes inconvénients que le Spectre x360 13, comme les fréquences d'horloge cycliques du CPU, la RAM non extensible par l'utilisateur, la rigidité moyenne des charnières à certains angles et les temps de réponse lents en noir et blanc. Il est certain qu'il y a encore des améliorations à apporter à cet égard.
Nous ne sommes pas partisans de quelques changements. Alors que le Spectre x360 13 disposait d'options WAN, le Spectre x360 14 les a silencieusement omises. En attendant, le lecteur d'empreintes digitales, plus grand, est plus facile à utiliser, mais il se fait au détriment de la touche Ctrl. Mais si vous n'avez jamais utilisé ces fonctionnalités, ces changements ne poseront pas de problème.
Le Spectre x360 14 de 13,5 pouces met le Spectre x360 13 de 13,3 pouces dans une situation difficile. Bien que HP insiste sur le fait que le premier ne remplacera pas le second, nous pouvons envisager un scénario dans lequel le Spectre x360 13 sera de toute façon lentement éliminé au profit du Spectre x360 14, car les deux sont très similaires. Si vous êtes à la recherche d'un Spectre, nous recommandons le modèle 13,5 pouces plutôt que le 13,3 pouces, simplement parce qu'il est capable d'offrir une taille d'écran sensiblement plus grande avec seulement une augmentation marginale de la taille et du poids.
Le dernier convertible de HP est plus rapide que le Dell XPS 13 avec le même processeur Core i7 tout en offrant un écran plus grand et, en option, deux fois plus lumineux. Il y a quelques défauts, mais ils sont généralement faciles à ignorer étant donné que le Spectre x360 14 est si bien conçu et qu'il est très agréable à travailler.
Prix et disponibilité
HP Spectre x360 14t-ea000
- 12/22/2020 v7 (old)
Allen Ngo
Price comparison

