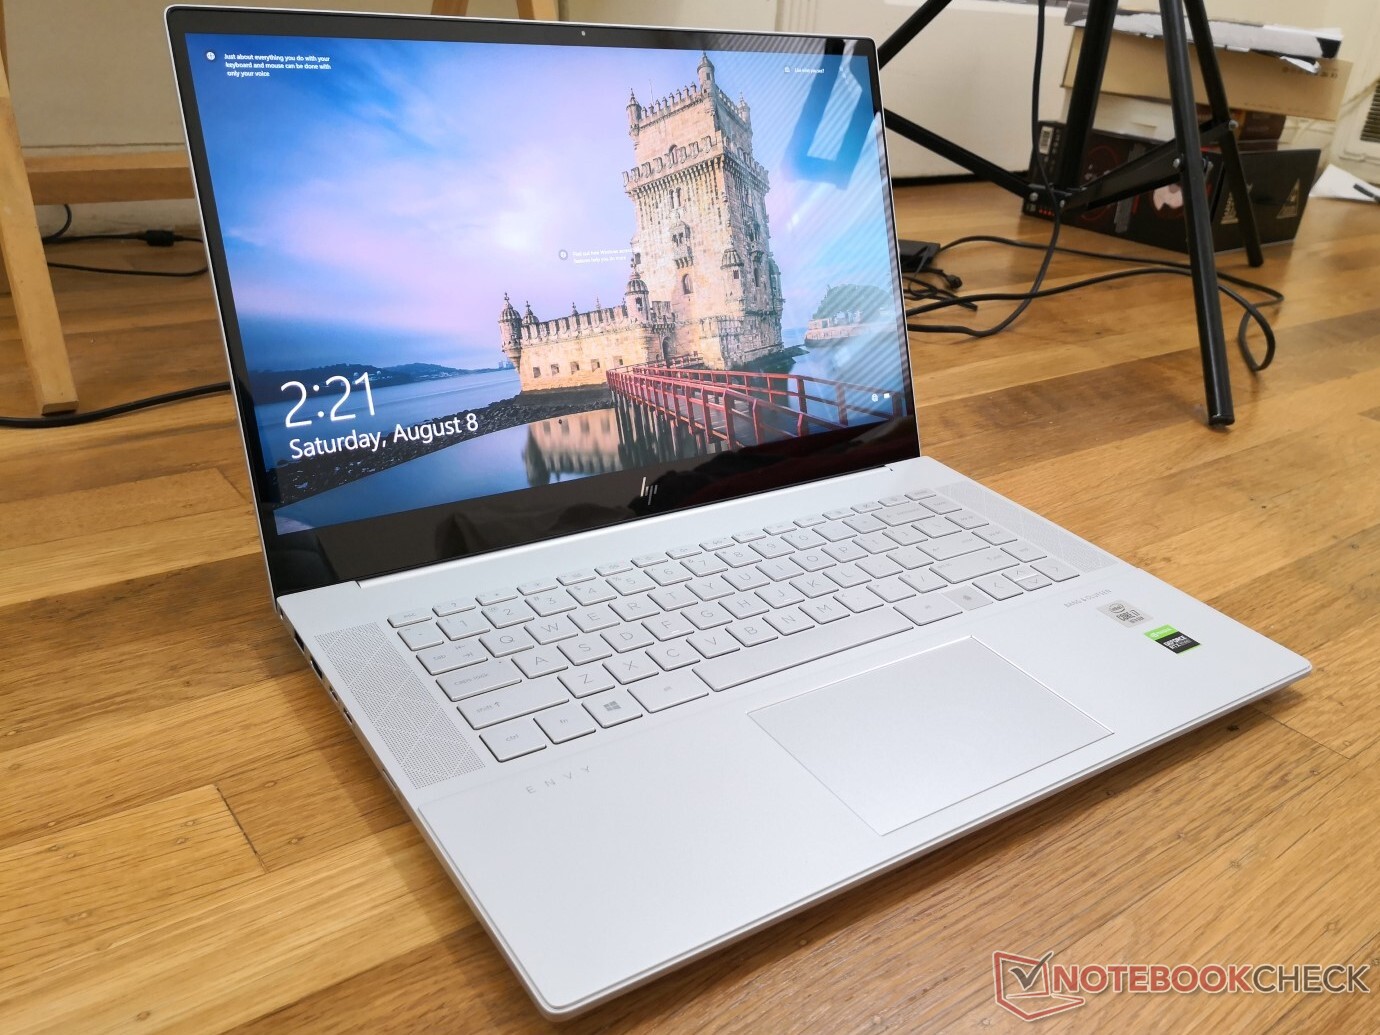
Test du HP Envy Creator 2020 (i7-10750H, RTX 2060 Max-Q, 4K UHD) : la réponse de HP à l'Apple MacBook Pro
Note | Date | Modèle | Poids | Épaisseur | Taille | Résolution | Prix |
|---|---|---|---|---|---|---|---|
| 83 % v7 (old) | 09/20 | HP Envy 15-ep0098nr i7-10750H, GeForce RTX 2060 Max-Q | 2 kg | 19 mm | 15.60" | 3840x2160 | |
| 80.4 % v7 (old) | 07/20 | HP Envy x360 15-dr1679cl i7-10510U, UHD Graphics 620 | 2.1 kg | 17.2 mm | 15.60" | 1920x1080 | |
| 85 % v7 (old) | 01/20 | HP Spectre X360 15-5ZV31AV i7-10510U, GeForce MX250 | 2.1 kg | 19.3 mm | 15.60" | 3840x2160 | |
| 90.1 % v7 (old) | 07/20 | Dell XPS 15 9500 Core i7 4K UHD i7-10875H, GeForce GTX 1650 Ti Mobile | 2 kg | 18 mm | 15.60" | 3840x2400 | |
| 86 % v7 (old) | 12/19 | Lenovo Yoga C940-15IRH i7-9750H, GeForce GTX 1650 Max-Q | 2 kg | 19.7 mm | 15.60" | 1920x1080 | |
| 89.7 % v7 (old) | 04/20 | Apple MacBook Pro 16 2019 i9 5500M i9-9880H, Radeon Pro 5500M | 2 kg | 16.2 mm | 16.00" | 3072x1920 |
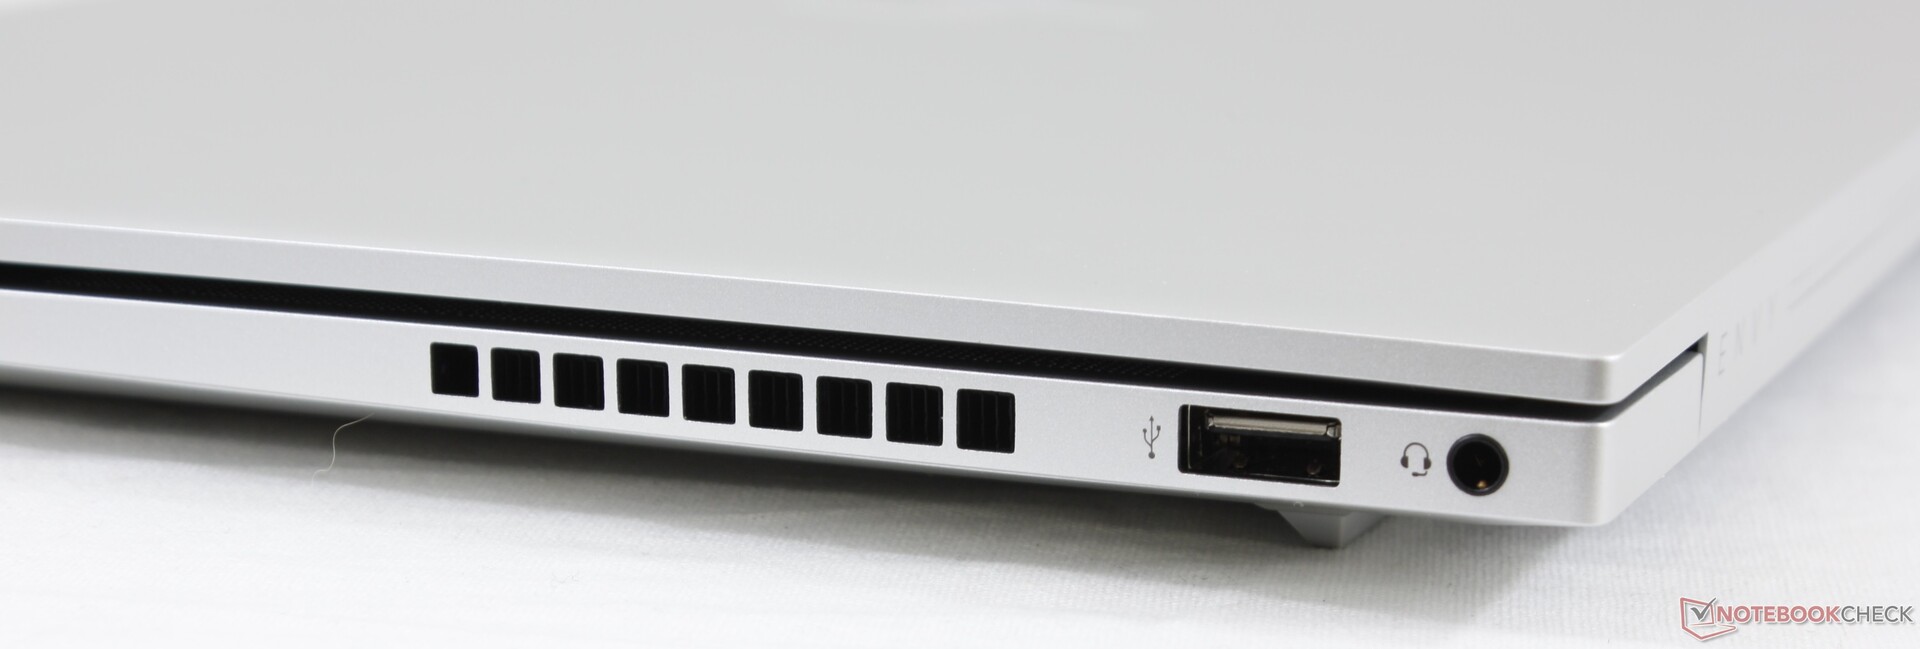
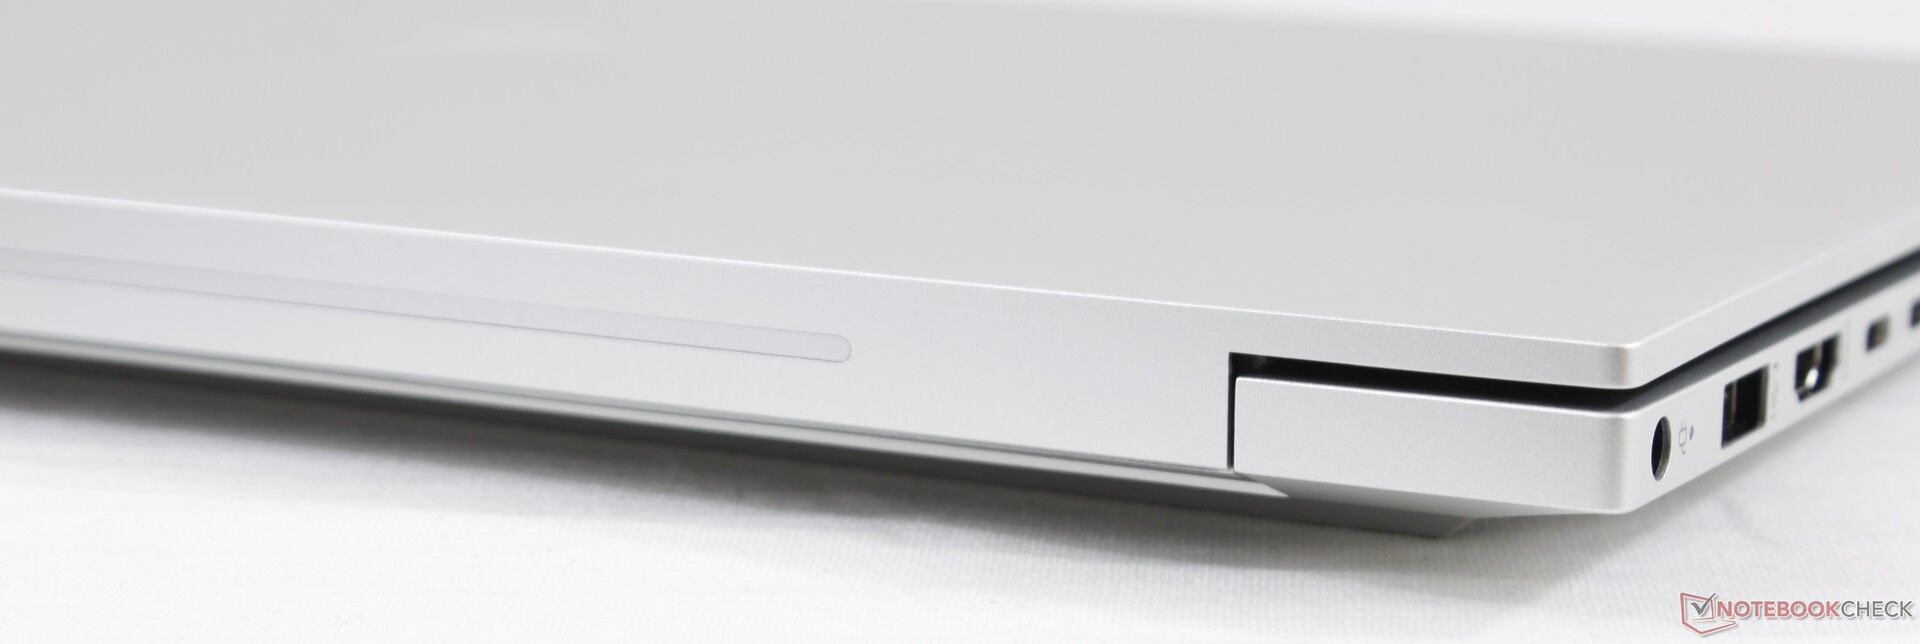
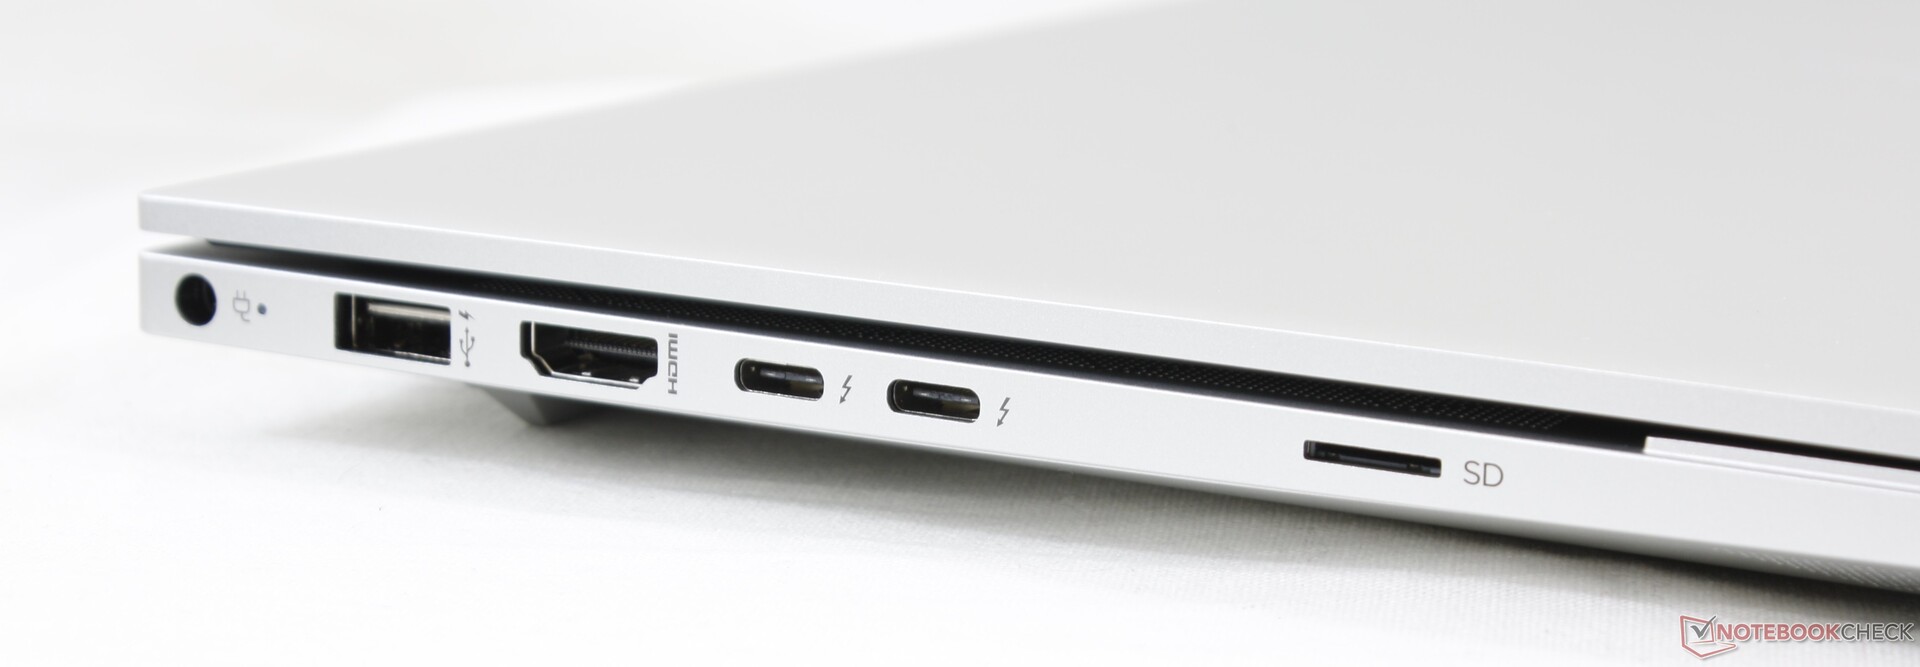
| SD Card Reader | |
| average JPG Copy Test (av. of 3 runs) | |
| Dell XPS 15 9500 Core i7 4K UHD (Toshiba Exceria Pro SDXC 64 GB UHS-II) | |
| HP Spectre X360 15-5ZV31AV (Toshiba Exceria Pro M501 UHS-II) | |
| HP Envy x360 15-dr1679cl (Toshiba Exceria Pro SDXC 64 GB UHS-II) | |
| HP Envy 15-ep0098nr (Toshiba Exceria Pro M501 UHS-II) | |
| maximum AS SSD Seq Read Test (1GB) | |
| Dell XPS 15 9500 Core i7 4K UHD (Toshiba Exceria Pro SDXC 64 GB UHS-II) | |
| HP Spectre X360 15-5ZV31AV (Toshiba Exceria Pro M501 UHS-II) | |
| HP Envy 15-ep0098nr (Toshiba Exceria Pro M501 UHS-II) | |
| HP Envy x360 15-dr1679cl (Toshiba Exceria Pro SDXC 64 GB UHS-II) | |

")
")
| |||||||||||||||||||||||||
Homogénéité de la luminosité: 91 %
Valeur mesurée au centre, sur batterie: 374.3 cd/m²
Contraste: ∞:1 (Valeurs des noirs: 0 cd/m²)
ΔE ColorChecker Calman: 5.47 | ∀{0.5-29.43 Ø4.73}
calibrated: 4.61
ΔE Greyscale Calman: 2.3 | ∀{0.09-98 Ø4.97}
100% sRGB (Argyll 1.6.3 3D)
87.8% AdobeRGB 1998 (Argyll 1.6.3 3D)
99.9% AdobeRGB 1998 (Argyll 3D)
100% sRGB (Argyll 3D)
88.5% Display P3 (Argyll 3D)
Gamma: 2.09
CCT: 6340 K
| HP Envy 15-ep0098nr Samsung SDC4145, AMOLED, 15.6", 3840x2160 | HP Envy x360 15-dr1679cl AU Optronics B156HW02, IPS, 15.6", 1920x1080 | HP Spectre X360 15-5ZV31AV AU Optronics AUO30EB, IPS, 15.6", 3840x2160 | Dell XPS 15 9500 Core i7 4K UHD Sharp LQ156R1, IPS, 15.6", 3840x2400 | Lenovo Yoga C940-15IRH LG Philips LP156WFC-SPU1, IPS, 15.6", 1920x1080 | Apple MacBook Pro 16 2019 i9 5500M APPA044, IPS, 16", 3072x1920 | |
|---|---|---|---|---|---|---|
| Display | -52% | -20% | 0% | -25% | ||
| Display P3 Coverage (%) | 88.5 | 39.28 -56% | 68.3 -23% | 89.7 1% | 61.5 -31% | |
| sRGB Coverage (%) | 100 | 58.8 -41% | 94.3 -6% | 100 0% | 92.7 -7% | |
| AdobeRGB 1998 Coverage (%) | 99.9 | 40.58 -59% | 68.4 -32% | 99.8 0% | 63.6 -36% | |
| Response Times | -2812% | -4206% | -3890% | -3599% | -3822% | |
| Response Time Grey 50% / Grey 80% * (ms) | 0.8 ? | 39.6 ? -4850% | 56.8 ? -7000% | 54 ? -6650% | 48.4 ? -5950% | 52.4 ? -6450% |
| Response Time Black / White * (ms) | 2.7 ? | 23.6 ? -774% | 40.8 ? -1411% | 33.2 ? -1130% | 36.4 ? -1248% | 34.9 ? -1193% |
| PWM Frequency (Hz) | 242.7 ? | 131700 | ||||
| Screen | -36% | -3% | 10% | -5% | 34% | |
| Brightness middle (cd/m²) | 374.3 | 261.2 -30% | 284.6 -24% | 557.9 49% | 484.8 30% | 519 39% |
| Brightness (cd/m²) | 379 | 248 -35% | 285 -25% | 541 43% | 463 22% | 477 26% |
| Brightness Distribution (%) | 91 | 92 1% | 85 -7% | 91 0% | 82 -10% | 86 -5% |
| Black Level * (cd/m²) | 0.38 | 0.25 | 0.39 | 0.26 | 0.39 | |
| Colorchecker dE 2000 * | 5.47 | 5.4 1% | 3.52 36% | 4.54 17% | 4.5 18% | 2.28 58% |
| Colorchecker dE 2000 max. * | 8.22 | 16.31 -98% | 5.56 32% | 7.92 4% | 7.55 8% | 6.54 20% |
| Colorchecker dE 2000 calibrated * | 4.61 | 3.81 17% | 3 35% | 3.82 17% | 1.19 74% | 0.86 81% |
| Greyscale dE 2000 * | 2.3 | 4.1 -78% | 3.2 -39% | 3.2 -39% | 5.7 -148% | 0.9 61% |
| Gamma | 2.09 105% | 2.53 87% | 2.28 96% | 1.99 111% | 2.45 90% | 2145 0% |
| CCT | 6340 103% | 6611 98% | 7070 92% | 6451 101% | 6101 107% | 6572 99% |
| Color Space (Percent of AdobeRGB 1998) (%) | 87.8 | 37.4 -57% | 61.1 -30% | 89.5 2% | 58.7 -33% | 78 -11% |
| Color Space (Percent of sRGB) (%) | 100 | 58.7 -41% | 93.8 -6% | 100 0% | 92.8 -7% | |
| Contrast (:1) | 687 | 1138 | 1431 | 1865 | 1331 | |
| Moyenne finale (programmes/paramètres) | -967% /
-436% | -1410% /
-607% | -1293% /
-549% | -1210% /
-523% | -1894% /
-737% |
* ... Moindre est la valeur, meilleures sont les performances
Temps de réponse de l'écran
| ↔ Temps de réponse noir à blanc | ||
|---|---|---|
| 2.7 ms ... hausse ↗ et chute ↘ combinées | ↗ 1.3 ms hausse | 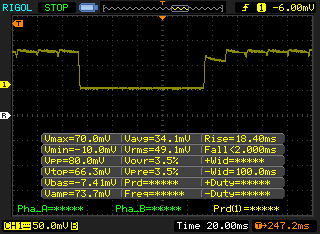 |
| ↘ 1.4 ms chute | ||
| L'écran montre de très faibles temps de réponse, parfait pour le jeu. En comparaison, tous les appareils testés affichent entre 0.1 (minimum) et 240 (maximum) ms. » 14 % des appareils testés affichent de meilleures performances. Cela signifie que les latences relevées sont meilleures que la moyenne (19.9 ms) de tous les appareils testés. | ||
| ↔ Temps de réponse gris 50% à gris 80% | ||
| 0.8 ms ... hausse ↗ et chute ↘ combinées | ↗ 0.4 ms hausse | 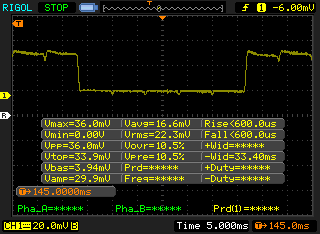 |
| ↘ 0.4 ms chute | ||
| L'écran montre de très faibles temps de réponse, parfait pour le jeu. En comparaison, tous les appareils testés affichent entre 0.165 (minimum) et 636 (maximum) ms. » 3 % des appareils testés affichent de meilleures performances. Cela signifie que les latences relevées sont meilleures que la moyenne (31.1 ms) de tous les appareils testés. | ||
Scintillement / MLI (Modulation de largeur d'impulsion)
| Scintillement / MLI (Modulation de largeur d'impulsion) décelé | 242.7 Hz | ≤ 44 Niveau de luminosité | 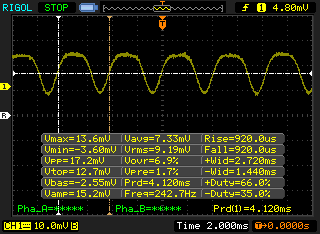 |
Le rétroéclairage de l'écran scintille à la fréquence de 242.7 Hz (certainement du fait de l'utilisation d'une MDI - Modulation de largeur d'impulsion) à un niveau de luminosité inférieur ou égal à 44 % . Aucun scintillement ne devrait être perceptible au-dessus de cette valeur. La fréquence de rafraîchissement de 242.7 Hz est relativement faible, les personnes les plus sensibles devraient percevoir un scintillement et être sujettes à une fatigue oculaire accrue (avec le niveau de luminosité indiqué) En comparaison, 52 % des appareils testés n'emploient pas MDI pour assombrir leur écran. Nous avons relevé une moyenne à 7784 (minimum : 5 - maximum : 343500) Hz dans le cas où une MDI était active. | |||
Cinebench R15: CPU Multi 64Bit | CPU Single 64Bit
Blender: v2.79 BMW27 CPU
7-Zip 18.03: 7z b 4 -mmt1 | 7z b 4
Geekbench 5.5: Single-Core | Multi-Core
HWBOT x265 Benchmark v2.2: 4k Preset
LibreOffice : 20 Documents To PDF
R Benchmark 2.5: Overall mean
| Cinebench R20 / CPU (Multi Core) | |
| Eurocom Sky X4C i9-9900KS | |
| Asus TUF Gaming A15 FA506IV-HN172 | |
| MSI GS66 Stealth 10SFS | |
| MSI GE65 Raider 9SF-049US | |
| Dell XPS 15 9500 Core i7 4K UHD | |
| Acer Nitro 5 AN515-44-R5FT | |
| HP Envy 15-ep0098nr | |
| Moyenne Intel Core i7-10750H (1749 - 3325, n=43) | |
| Lenovo Yoga C940-15IRH | |
| Schenker Work 15 | |
| Cinebench R20 / CPU (Single Core) | |
| Eurocom Sky X4C i9-9900KS | |
| Dell XPS 15 9500 Core i7 4K UHD | |
| Asus TUF Gaming A15 FA506IV-HN172 | |
| MSI GS66 Stealth 10SFS | |
| MSI GE65 Raider 9SF-049US | |
| Moyenne Intel Core i7-10750H (431 - 504, n=43) | |
| Lenovo Yoga C940-15IRH | |
| HP Envy 15-ep0098nr | |
| Acer Nitro 5 AN515-44-R5FT | |
| Schenker Work 15 | |
| Cinebench R15 / CPU Multi 64Bit | |
| Eurocom Sky X4C i9-9900KS | |
| Asus TUF Gaming A15 FA506IV-HN172 | |
| MSI GS66 Stealth 10SFS | |
| MSI GE65 Raider 9SF-049US | |
| Acer Nitro 5 AN515-44-R5FT | |
| Dell XPS 15 9500 Core i7 4K UHD | |
| HP Envy 15-ep0098nr | |
| Moyenne Intel Core i7-10750H (804 - 1418, n=50) | |
| Lenovo Yoga C940-15IRH | |
| Schenker Work 15 | |
| Cinebench R15 / CPU Single 64Bit | |
| Eurocom Sky X4C i9-9900KS | |
| Dell XPS 15 9500 Core i7 4K UHD | |
| MSI GS66 Stealth 10SFS | |
| MSI GE65 Raider 9SF-049US | |
| HP Envy 15-ep0098nr | |
| Moyenne Intel Core i7-10750H (184 - 213, n=45) | |
| Asus TUF Gaming A15 FA506IV-HN172 | |
| Lenovo Yoga C940-15IRH | |
| Acer Nitro 5 AN515-44-R5FT | |
| Schenker Work 15 | |
| Blender / v2.79 BMW27 CPU | |
| Schenker Work 15 | |
| Schenker Work 15 | |
| Moyenne Intel Core i7-10750H (322 - 587, n=43) | |
| Dell XPS 15 9500 Core i7 4K UHD | |
| HP Envy 15-ep0098nr | |
| Acer Nitro 5 AN515-44-R5FT | |
| MSI GS66 Stealth 10SFS | |
| Asus TUF Gaming A15 FA506IV-HN172 | |
| Eurocom Sky X4C i9-9900KS | |
| 7-Zip 18.03 / 7z b 4 -mmt1 | |
| Eurocom Sky X4C i9-9900KS | |
| Dell XPS 15 9500 Core i7 4K UHD | |
| MSI GS66 Stealth 10SFS | |
| Moyenne Intel Core i7-10750H (4504 - 5470, n=43) | |
| Asus TUF Gaming A15 FA506IV-HN172 | |
| Schenker Work 15 | |
| Schenker Work 15 | |
| HP Envy 15-ep0098nr | |
| Acer Nitro 5 AN515-44-R5FT | |
| 7-Zip 18.03 / 7z b 4 | |
| Eurocom Sky X4C i9-9900KS | |
| Asus TUF Gaming A15 FA506IV-HN172 | |
| MSI GS66 Stealth 10SFS | |
| Acer Nitro 5 AN515-44-R5FT | |
| Dell XPS 15 9500 Core i7 4K UHD | |
| Moyenne Intel Core i7-10750H (26040 - 37345, n=43) | |
| HP Envy 15-ep0098nr | |
| Schenker Work 15 | |
| Schenker Work 15 | |
| Geekbench 5.5 / Single-Core | |
| Eurocom Sky X4C i9-9900KS | |
| Dell XPS 15 9500 Core i7 4K UHD | |
| MSI GS66 Stealth 10SFS | |
| HP Envy 15-ep0098nr | |
| Moyenne Intel Core i7-10750H (1114 - 1333, n=43) | |
| Asus TUF Gaming A15 FA506IV-HN172 | |
| Acer Nitro 5 AN515-44-R5FT | |
| Geekbench 5.5 / Multi-Core | |
| Eurocom Sky X4C i9-9900KS | |
| Dell XPS 15 9500 Core i7 4K UHD | |
| MSI GS66 Stealth 10SFS | |
| HP Envy 15-ep0098nr | |
| Moyenne Intel Core i7-10750H (4443 - 6674, n=43) | |
| Asus TUF Gaming A15 FA506IV-HN172 | |
| Acer Nitro 5 AN515-44-R5FT | |
| HWBOT x265 Benchmark v2.2 / 4k Preset | |
| Eurocom Sky X4C i9-9900KS | |
| MSI GS66 Stealth 10SFS | |
| Asus TUF Gaming A15 FA506IV-HN172 | |
| HP Envy 15-ep0098nr | |
| Dell XPS 15 9500 Core i7 4K UHD | |
| Moyenne Intel Core i7-10750H (5.54 - 11.6, n=43) | |
| Acer Nitro 5 AN515-44-R5FT | |
| Schenker Work 15 | |
| Schenker Work 15 | |
| LibreOffice / 20 Documents To PDF | |
| Acer Nitro 5 AN515-44-R5FT | |
| Moyenne Intel Core i7-10750H (43.1 - 99.2, n=43) | |
| Dell XPS 15 9500 Core i7 4K UHD | |
| MSI GS66 Stealth 10SFS | |
| HP Envy 15-ep0098nr | |
| Asus TUF Gaming A15 FA506IV-HN172 | |
| R Benchmark 2.5 / Overall mean | |
| Acer Nitro 5 AN515-44-R5FT | |
| Moyenne Intel Core i7-10750H (0.578 - 0.708, n=42) | |
| HP Envy 15-ep0098nr | |
| Asus TUF Gaming A15 FA506IV-HN172 | |
| MSI GS66 Stealth 10SFS | |
| Dell XPS 15 9500 Core i7 4K UHD | |
* ... Moindre est la valeur, meilleures sont les performances
| PCMark 8 Home Score Accelerated v2 | 3463 points | |
| PCMark 8 Work Score Accelerated v2 | 4448 points | |
| PCMark 10 Score | 5553 points | |
Aide | ||
| DPC Latencies / LatencyMon - interrupt to process latency (max), Web, Youtube, Prime95 | |
| Dell XPS 15 9500 Core i7 4K UHD | |
| HP Envy 15-ep0098nr | |
| HP Envy x360 15-dr1679cl | |
| MSI GS66 Stealth 10SFS | |
| MSI GS66 Stealth 10SE-045 | |
| Razer Blade 15 RZ09-0328 | |
| Asus TUF Gaming A15 FA506IV-HN172 | |
* ... Moindre est la valeur, meilleures sont les performances
| HP Envy 15-ep0098nr Intel Optane Memory H10 with Solid State Storage 32GB + 512GB HBRPEKNX0202A(L/H) | HP Envy x360 15-dr1679cl Intel Optane Memory H10 with Solid State Storage 32GB + 512GB HBRPEKNX0202A(L/H) | HP Spectre X360 15-5ZV31AV Intel SSD 660p 2TB SSDPEKNW020T8 | Dell XPS 15 9500 Core i7 4K UHD SK Hynix PC611 512GB | Apple MacBook Pro 16 2019 i9 5500M Apple SSD AP1024 7171 | |
|---|---|---|---|---|---|
| AS SSD | -13% | 32% | 49% | 80% | |
| Seq Read (MB/s) | 1005 | 931 -7% | 1220 21% | 2072 106% | 2531 152% |
| Seq Write (MB/s) | 436.8 | 331.5 -24% | 1152 164% | 1486 240% | 2289 424% |
| 4K Read (MB/s) | 51.5 | 72.8 41% | 52.3 2% | 47.41 -8% | 15.85 -69% |
| 4K Write (MB/s) | 88 | 119 35% | 146.6 67% | 117.6 34% | 39.88 -55% |
| 4K-64 Read (MB/s) | 517 | 389.7 -25% | 652 26% | 967 87% | 1267 145% |
| 4K-64 Write (MB/s) | 839 | 573 -32% | 847 1% | 715 -15% | 1749 108% |
| Access Time Read * (ms) | 0.088 | 0.07 20% | 0.077 12% | 0.057 35% | 0.122 -39% |
| Access Time Write * (ms) | 0.151 | 0.138 9% | 0.106 30% | 0.096 36% | 0.095 37% |
| Score Read (Points) | 669 | 556 -17% | 826 23% | 1222 83% | 1536 130% |
| Score Write (Points) | 970 | 725 -25% | 1109 14% | 981 1% | 2018 108% |
| Score Total (Points) | 1972 | 1565 -21% | 2371 20% | 2809 42% | 4317 119% |
| Copy ISO MB/s (MB/s) | 1173 | 593 -49% | 2070 76% | 1999 70% | 1995 70% |
| Copy Program MB/s (MB/s) | 769 | 495.5 -36% | 571 -26% | 627 -18% | 584 -24% |
| Copy Game MB/s (MB/s) | 1045 | 566 -46% | 1219 17% | 1001 -4% | 1135 9% |
| CrystalDiskMark 5.2 / 6 | 4% | 26% | 51% | 48% | |
| Write 4K (MB/s) | 100.2 | 125.6 25% | 151.5 51% | 123.3 23% | 55.5 -45% |
| Read 4K (MB/s) | 112.8 | 145.8 29% | 59.3 -47% | 41.85 -63% | 16.21 -86% |
| Write Seq (MB/s) | 537 | 509 -5% | 1424 165% | 2054 282% | 1959 265% |
| Read Seq (MB/s) | 1270 | 1536 21% | 1609 27% | 1617 27% | 1763 39% |
| Write 4K Q32T1 (MB/s) | 480.6 | 362.4 -25% | 393.6 -18% | 413 -14% | 398.5 -17% |
| Read 4K Q32T1 (MB/s) | 364.9 | 307.3 -16% | 369.4 1% | 377.5 3% | 648 78% |
| Write Seq Q32T1 (MB/s) | 1224 | 1320 8% | 1946 59% | 2705 121% | 2727 123% |
| Read Seq Q32T1 (MB/s) | 2635 | 2489 -6% | 1934 -27% | 3442 31% | 3242 23% |
| Moyenne finale (programmes/paramètres) | -5% /
-7% | 29% /
30% | 50% /
50% | 64% /
68% |
* ... Moindre est la valeur, meilleures sont les performances

Disk Throttling: DiskSpd Read Loop, Queue Depth 8
| 3DMark 11 Performance | 18109 points | |
| 3DMark Cloud Gate Standard Score | 25407 points | |
| 3DMark Fire Strike Score | 14259 points | |
| 3DMark Time Spy Score | 6052 points | |
Aide | ||
| The Witcher 3 - 1920x1080 Ultra Graphics & Postprocessing (HBAO+) | |
| Eurocom Sky X4C i9-9900KS | |
| Gigabyte Aero 15 OLED XB-8DE51B0SP | |
| MSI GE65 Raider 9SF-049US | |
| MSI RTX 2060 Gaming Z 6G | |
| MSI GS66 Stealth 10SFS | |
| Dell G5 15 SE 5505 P89F | |
| HP Envy 15-ep0098nr | |
| Eluktronics RP-15 | |
| Razer Blade 15 RZ09-0328 | |
| Asus TUF Gaming A15 FA506IV-HN172 | |
| Moyenne NVIDIA GeForce RTX 2060 Max-Q (51.2 - 62.9, n=4) | |
| MSI P65 8RF-451 - Creator | |
| Microsoft Surface Book 3 15 | |
| Apple MacBook Pro 16 2019 i9 5500M | |
| Acer Nitro 5 AN515-44-R5FT | |
| Dell XPS 15 9500 Core i7 4K UHD | |
| Lenovo Yoga C940-15IRH | |
| Apple MacBook Pro 15 2019 i9 Vega 20 | |
| HP Spectre X360 15-5ZV31AV | |
| Bas | Moyen | Élevé | Ultra | QHD | 4K | |
|---|---|---|---|---|---|---|
| The Witcher 3 (2015) | 310.8 | 209.6 | 119 | 62.9 | 45.5 | |
| Dota 2 Reborn (2015) | 141 | 129 | 120 | 114 | 83.2 | |
| Final Fantasy XV Benchmark (2018) | 139 | 79 | 61.3 | 43.6 | 24.9 | |
| X-Plane 11.11 (2018) | 103 | 90.7 | 77.4 | 59.3 |
| HP Envy 15-ep0098nr GeForce RTX 2060 Max-Q, i7-10750H, Intel Optane Memory H10 with Solid State Storage 32GB + 512GB HBRPEKNX0202A(L/H) | HP Envy x360 15-dr1679cl UHD Graphics 620, i7-10510U, Intel Optane Memory H10 with Solid State Storage 32GB + 512GB HBRPEKNX0202A(L/H) | HP Spectre X360 15-5ZV31AV GeForce MX250, i7-10510U, Intel SSD 660p 2TB SSDPEKNW020T8 | Dell XPS 15 9500 Core i7 4K UHD GeForce GTX 1650 Ti Mobile, i7-10875H, SK Hynix PC611 512GB | Apple MacBook Pro 16 2019 i9 5500M Radeon Pro 5500M, i9-9880H, Apple SSD AP1024 7171 | |
|---|---|---|---|---|---|
| Noise | 11% | 14% | 11% | 8% | |
| arrêt / environnement * (dB) | 26.4 | 28 -6% | 30.1 -14% | 28.4 -8% | 29.8 -13% |
| Idle Minimum * (dB) | 32.2 | 28 13% | 30.1 7% | 28.4 12% | 29.9 7% |
| Idle Average * (dB) | 32.2 | 30.2 6% | 30.1 7% | 28.4 12% | 29.9 7% |
| Idle Maximum * (dB) | 32.2 | 31.5 2% | 30.1 7% | 28.4 12% | 29.9 7% |
| Load Average * (dB) | 48.3 | 35.7 26% | 30.1 38% | 46 5% | 43 11% |
| Witcher 3 ultra * (dB) | 53.7 | 39.7 26% | 42 22% | 45.4 15% | |
| Load Maximum * (dB) | 58.8 | 43.1 27% | 42 29% | 47.1 20% | 46.1 22% |
* ... Moindre est la valeur, meilleures sont les performances
Degré de la nuisance sonore
| Au repos |
| 32.2 / 32.2 / 32.2 dB(A) |
| Fortement sollicité |
| 48.3 / 58.8 dB(A) |
 | ||
30 dB silencieux 40 dB(A) audible 50 dB(A) bruyant |
||
min: | ||
(-) La température maximale du côté supérieur est de 47.6 °C / 118 F, par rapport à la moyenne de 36.8 °C / 98 F, allant de 21 à 71 °C pour la classe Multimedia.
(-) Le fond chauffe jusqu'à un maximum de 52 °C / 126 F, contre une moyenne de 39.1 °C / 102 F
(+) En utilisation inactive, la température moyenne du côté supérieur est de 26.1 °C / 79 F, par rapport à la moyenne du dispositif de 31.3 °C / 88 F.
(±) En jouant à The Witcher 3, la température moyenne du côté supérieur est de 32.4 °C / 90 F, alors que la moyenne de l'appareil est de 31.3 °C / 88 F.
(+) Les repose-poignets et le pavé tactile sont plus froids que la température de la peau avec un maximum de 31.8 °C / 89.2 F et sont donc froids au toucher.
(-) La température moyenne de la zone de l'appui-paume de dispositifs similaires était de 28.7 °C / 83.7 F (-3.1 °C / #-5.5 F).
HP Envy 15-ep0098nr analyse audio
(±) | le niveau sonore du haut-parleur est moyen mais bon (79.9# dB)
Basses 100 - 315 Hz
(-) | presque aucune basse - en moyenne 15.8% plus bas que la médiane
(±) | la linéarité des basses est moyenne (14.9% delta à la fréquence précédente)
Médiums 400 - 2000 Hz
(+) | médiane équilibrée - seulement 3.7% de la médiane
(+) | les médiums sont linéaires (5.9% delta à la fréquence précédente)
Aiguës 2 - 16 kHz
(+) | des sommets équilibrés - à seulement 1.8% de la médiane
(+) | les aigus sont linéaires (4% delta à la fréquence précédente)
Globalement 100 - 16 000 Hz
(±) | la linéarité du son global est moyenne (16.2% de différence avec la médiane)
Par rapport à la même classe
» 41% de tous les appareils testés de cette catégorie étaient meilleurs, 7% similaires, 51% pires
» Le meilleur avait un delta de 5%, la moyenne était de 17%, le pire était de 45%.
Par rapport à tous les appareils testés
» 26% de tous les appareils testés étaient meilleurs, 6% similaires, 68% pires
» Le meilleur avait un delta de 4%, la moyenne était de 24%, le pire était de 134%.
Apple MacBook 12 (Early 2016) 1.1 GHz analyse audio
(+) | les haut-parleurs peuvent jouer relativement fort (83.6# dB)
Basses 100 - 315 Hz
(±) | basse réduite - en moyenne 11.3% inférieure à la médiane
(±) | la linéarité des basses est moyenne (14.2% delta à la fréquence précédente)
Médiums 400 - 2000 Hz
(+) | médiane équilibrée - seulement 2.4% de la médiane
(+) | les médiums sont linéaires (5.5% delta à la fréquence précédente)
Aiguës 2 - 16 kHz
(+) | des sommets équilibrés - à seulement 2% de la médiane
(+) | les aigus sont linéaires (4.5% delta à la fréquence précédente)
Globalement 100 - 16 000 Hz
(+) | le son global est linéaire (10.2% différence à la médiane)
Par rapport à la même classe
» 7% de tous les appareils testés de cette catégorie étaient meilleurs, 2% similaires, 91% pires
» Le meilleur avait un delta de 5%, la moyenne était de 18%, le pire était de 53%.
Par rapport à tous les appareils testés
» 5% de tous les appareils testés étaient meilleurs, 1% similaires, 94% pires
» Le meilleur avait un delta de 4%, la moyenne était de 24%, le pire était de 134%.
| Éteint/en veille | |
| Au repos | |
| Fortement sollicité |
|
Légende:
min: | |
| HP Envy 15-ep0098nr i7-10750H, GeForce RTX 2060 Max-Q, Intel Optane Memory H10 with Solid State Storage 32GB + 512GB HBRPEKNX0202A(L/H), AMOLED, 3840x2160, 15.6" | HP Envy x360 15-dr1679cl i7-10510U, UHD Graphics 620, Intel Optane Memory H10 with Solid State Storage 32GB + 512GB HBRPEKNX0202A(L/H), IPS, 1920x1080, 15.6" | HP Spectre X360 15-5ZV31AV i7-10510U, GeForce MX250, Intel SSD 660p 2TB SSDPEKNW020T8, IPS, 3840x2160, 15.6" | Dell XPS 15 9500 Core i7 4K UHD i7-10875H, GeForce GTX 1650 Ti Mobile, SK Hynix PC611 512GB, IPS, 3840x2400, 15.6" | Apple MacBook Pro 16 2019 i9 5500M i9-9880H, Radeon Pro 5500M, Apple SSD AP1024 7171, IPS, 3072x1920, 16" | Lenovo Yoga C940-15IRH i7-9750H, GeForce GTX 1650 Max-Q, Intel Optane Memory H10 with Solid State Storage 32GB + 512GB HBRPEKNX0202A(L/H), IPS, 1920x1080, 15.6" | |
|---|---|---|---|---|---|---|
| Power Consumption | 58% | 48% | 15% | 28% | 20% | |
| Idle Minimum * (Watt) | 9.2 | 4.3 53% | 5.2 43% | 5.7 38% | 3.7 60% | 5.2 43% |
| Idle Average * (Watt) | 14.5 | 7.2 50% | 8.5 41% | 13.5 7% | 12.1 17% | 10.7 26% |
| Idle Maximum * (Watt) | 18 | 7.5 58% | 8.7 52% | 19.6 -9% | 17 6% | 24.3 -35% |
| Load Average * (Watt) | 110.9 | 40.4 64% | 65.6 41% | 114.1 -3% | 91.5 17% | 84.4 24% |
| Witcher 3 ultra * (Watt) | 125.5 | 56.5 55% | 93 26% | 103 18% | 83.9 33% | |
| Load Maximum * (Watt) | 194.6 | 65.7 66% | 92.4 53% | 135.2 31% | 102.3 47% | 142.8 27% |
* ... Moindre est la valeur, meilleures sont les performances
| HP Envy 15-ep0098nr i7-10750H, GeForce RTX 2060 Max-Q, 83 Wh | HP Envy x360 15-dr1679cl i7-10510U, UHD Graphics 620, 55.67 Wh | HP Spectre X360 15-5ZV31AV i7-10510U, GeForce MX250, 84 Wh | Dell XPS 15 9500 Core i7 4K UHD i7-10875H, GeForce GTX 1650 Ti Mobile, 86 Wh | Apple MacBook Pro 15 2019 i9 Vega 20 i9-9980HK, Radeon Pro Vega 20, 83 Wh | Lenovo Yoga C940-15IRH i7-9750H, GeForce GTX 1650 Max-Q, 69 Wh | |
|---|---|---|---|---|---|---|
| Autonomie de la batterie | 55% | 71% | 43% | 92% | 15% | |
| Reader / Idle (h) | 15 | 25.4 69% | 22.6 51% | 23 53% | 18.2 21% | |
| WiFi v1.3 (h) | 6 | 9.2 53% | 10.8 80% | 9.1 52% | 11.5 92% | 9.7 62% |
| Load (h) | 1.6 | 2.3 44% | 2.9 81% | 2 25% | 1 -37% |
Points positifs
Points négatifs
HP réinvente sa série Envy 15. Ce dernier modèle est totalement précédent de la génération précédente, pratiquement tous les changements allant dans le bon sens. En plus de l'allure plus professionnelle, la maintenance plus aisée et la nouvelle série Core H, la GeForce RTX 2060 Max-Q est bien plus puissante que ce que les MacBook Pro 15 et MacBook Pro 16 peuvent proposer pour le moment, tout en coûtant moins cher - et c'est exactement ce que recherchait HP.
Cependant, les composants de jeu signifient que l'Envy 15 hérite des mêmes défauts qu'un PC portable de jeu fin. Il ne faut pas se laisser tromper par l'allure d'ultrabook de la bête, parce que l'appareil ne tiendra pas aussi longtemps que les ultraportables classiques avec Intel UHD ou GeForce MX, et il ne sera ni aussi silencieux, ni aussi léger. C'est plutôt un PC portable de jeu qui se déguise, même s'il cible les créateur de contenus, comme le fait la série Gigabyte Aero. L'adaptateur secteur de 200 W par exemple est bien plus gros et donc plus gênant que celui de n'importe quel ultrabook. Ceux qui auront conscience de ces faiblesses seront ravis de leur Envy 15 et de son niveau de performances, vu son prix et son format. Les autres, ceux qui font principalement de la navigation web et du traitement de texte, devraient plutôt se tourner vers le Spectre.
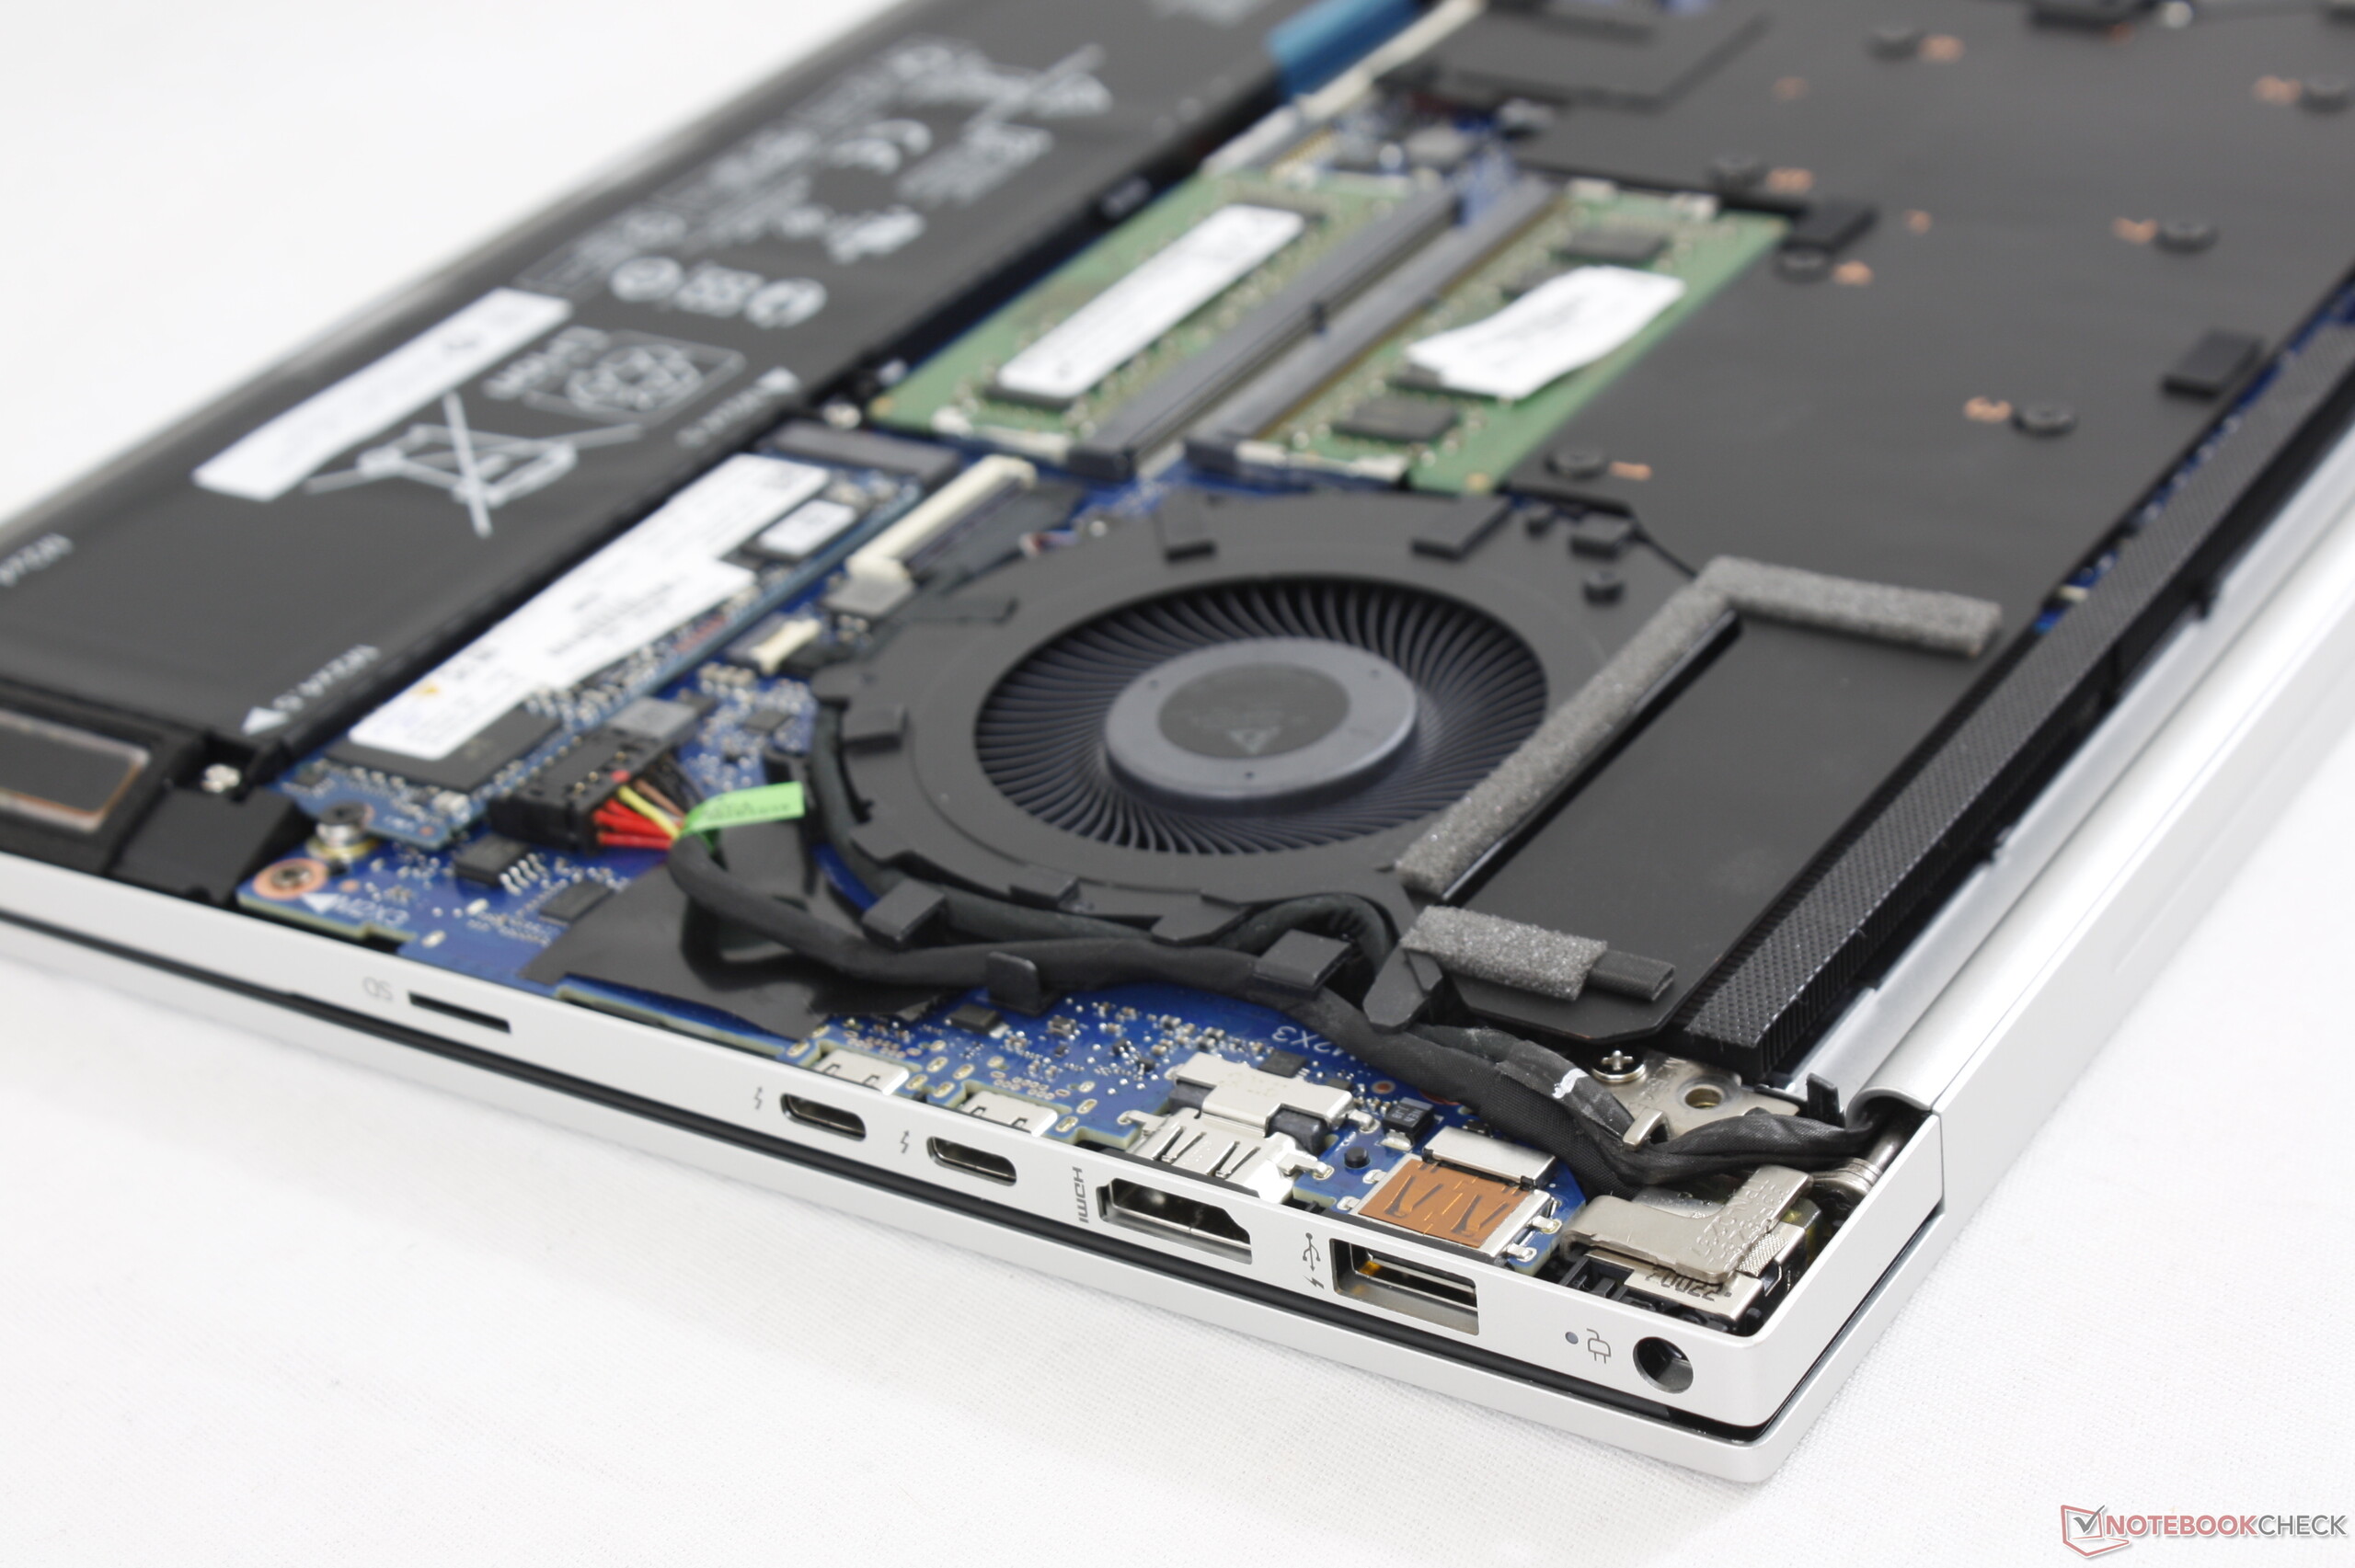
Il y a quelques améliorations que nous souhaiterions voir pour rendre l'Envy 15 encore meilleur. La charge USB C serait très utile pour les nomades, le gros adaptateur 200 W pouvant alors rester à la maison. Le clickpad comme les charnières pourraient être plus fermes pour mieux refléter le prix du nouvel appareil. Et un positionnement moins gênant du lecteur d'empreintes digitales serait plus utile pour ceux qui comptent sur la touche Fn.
Vous voulez un MacBook Pro mais avec de meilleurs graphismes, un écran OLED, et plus de ports ? Alors l'Envy 15 2020 vaut le coup d'être pris en compte. Terminé les processeurs ULV, le nouvel Envy intègre des composants prêts pour le jeu, intégrés dans un châssis copiant celui des ultrabook, s'avérant être une excellente solution à mi chemin entre PC de jeu et ultraportable.
L’intégralité de cette critique est disponible en anglais en suivant ce lien.
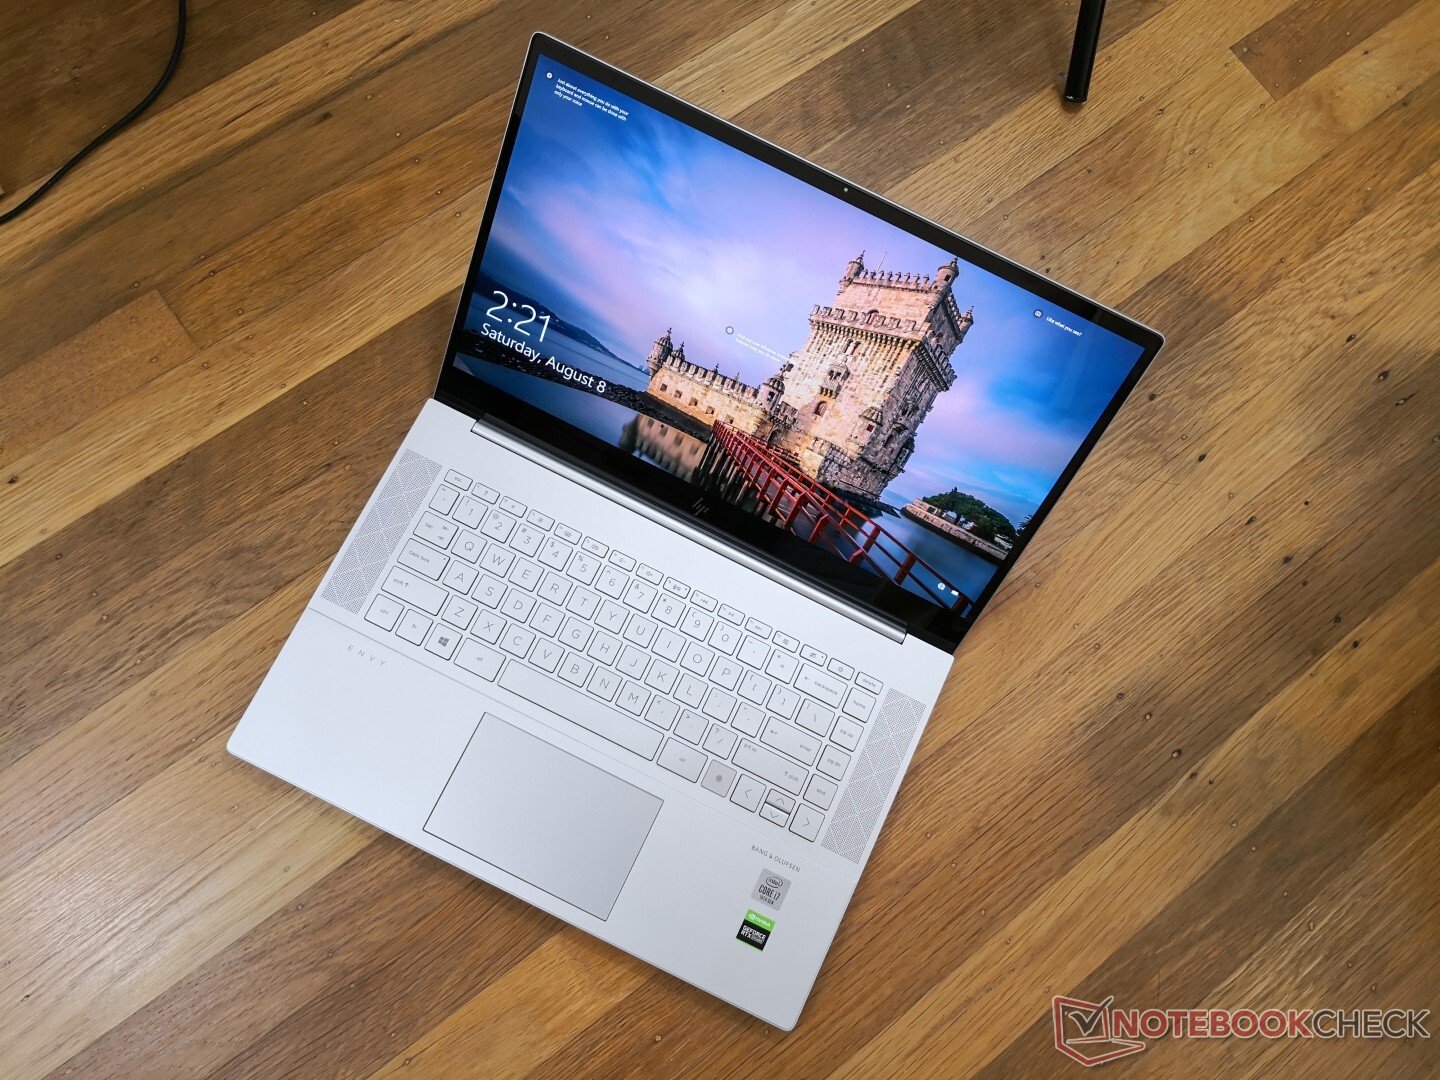
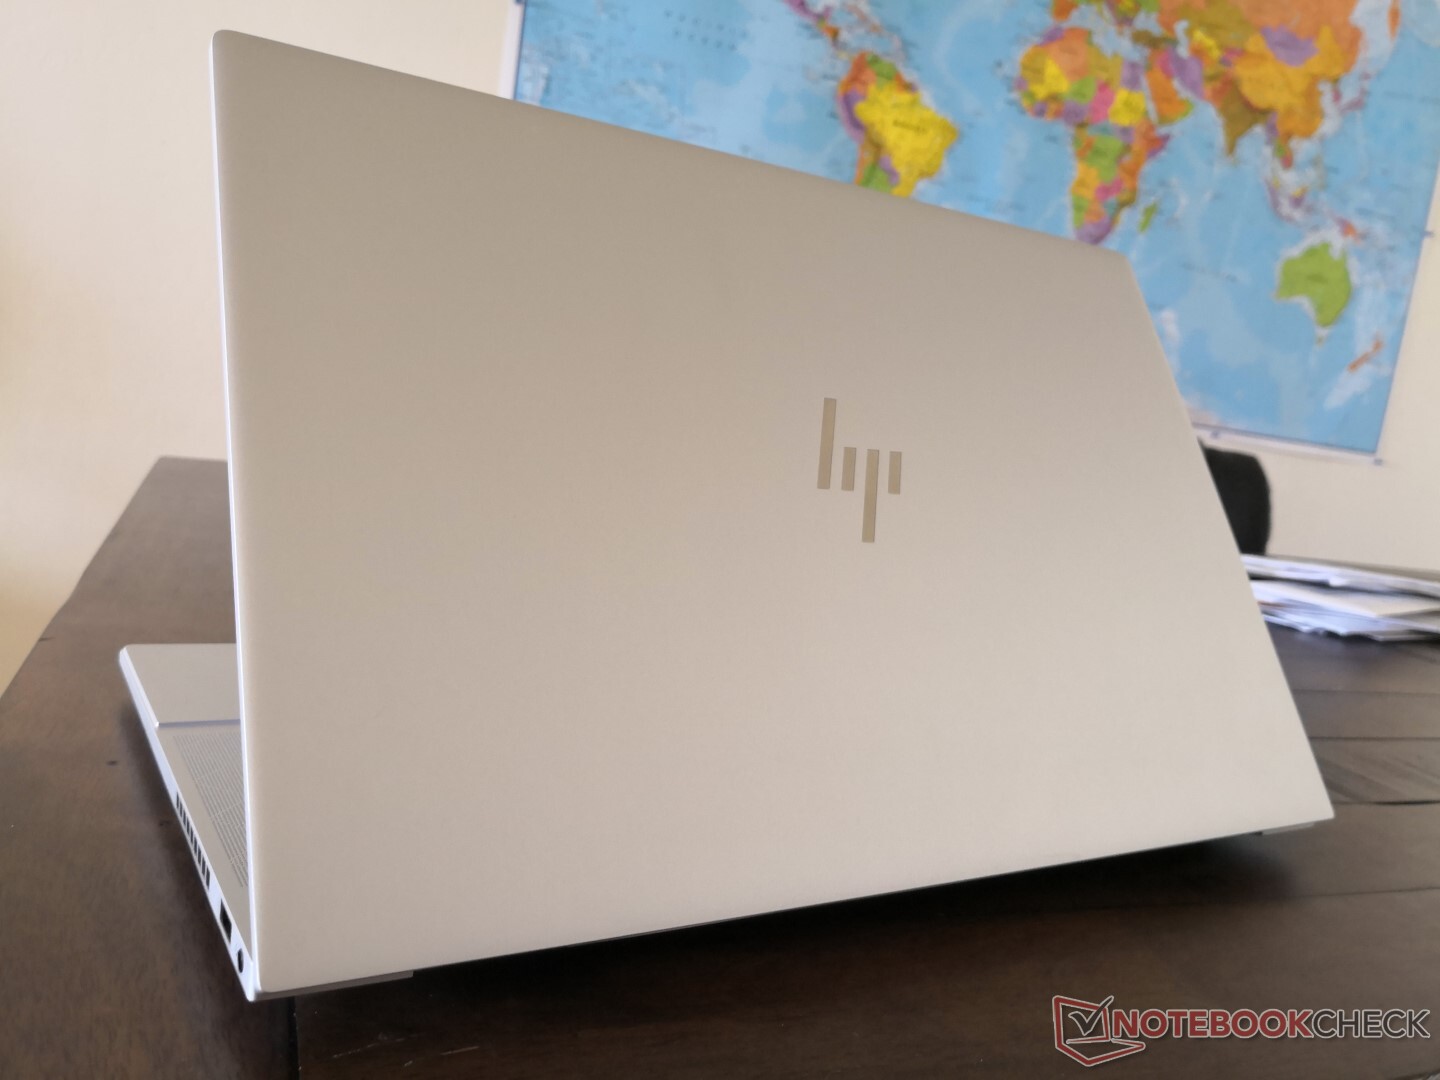
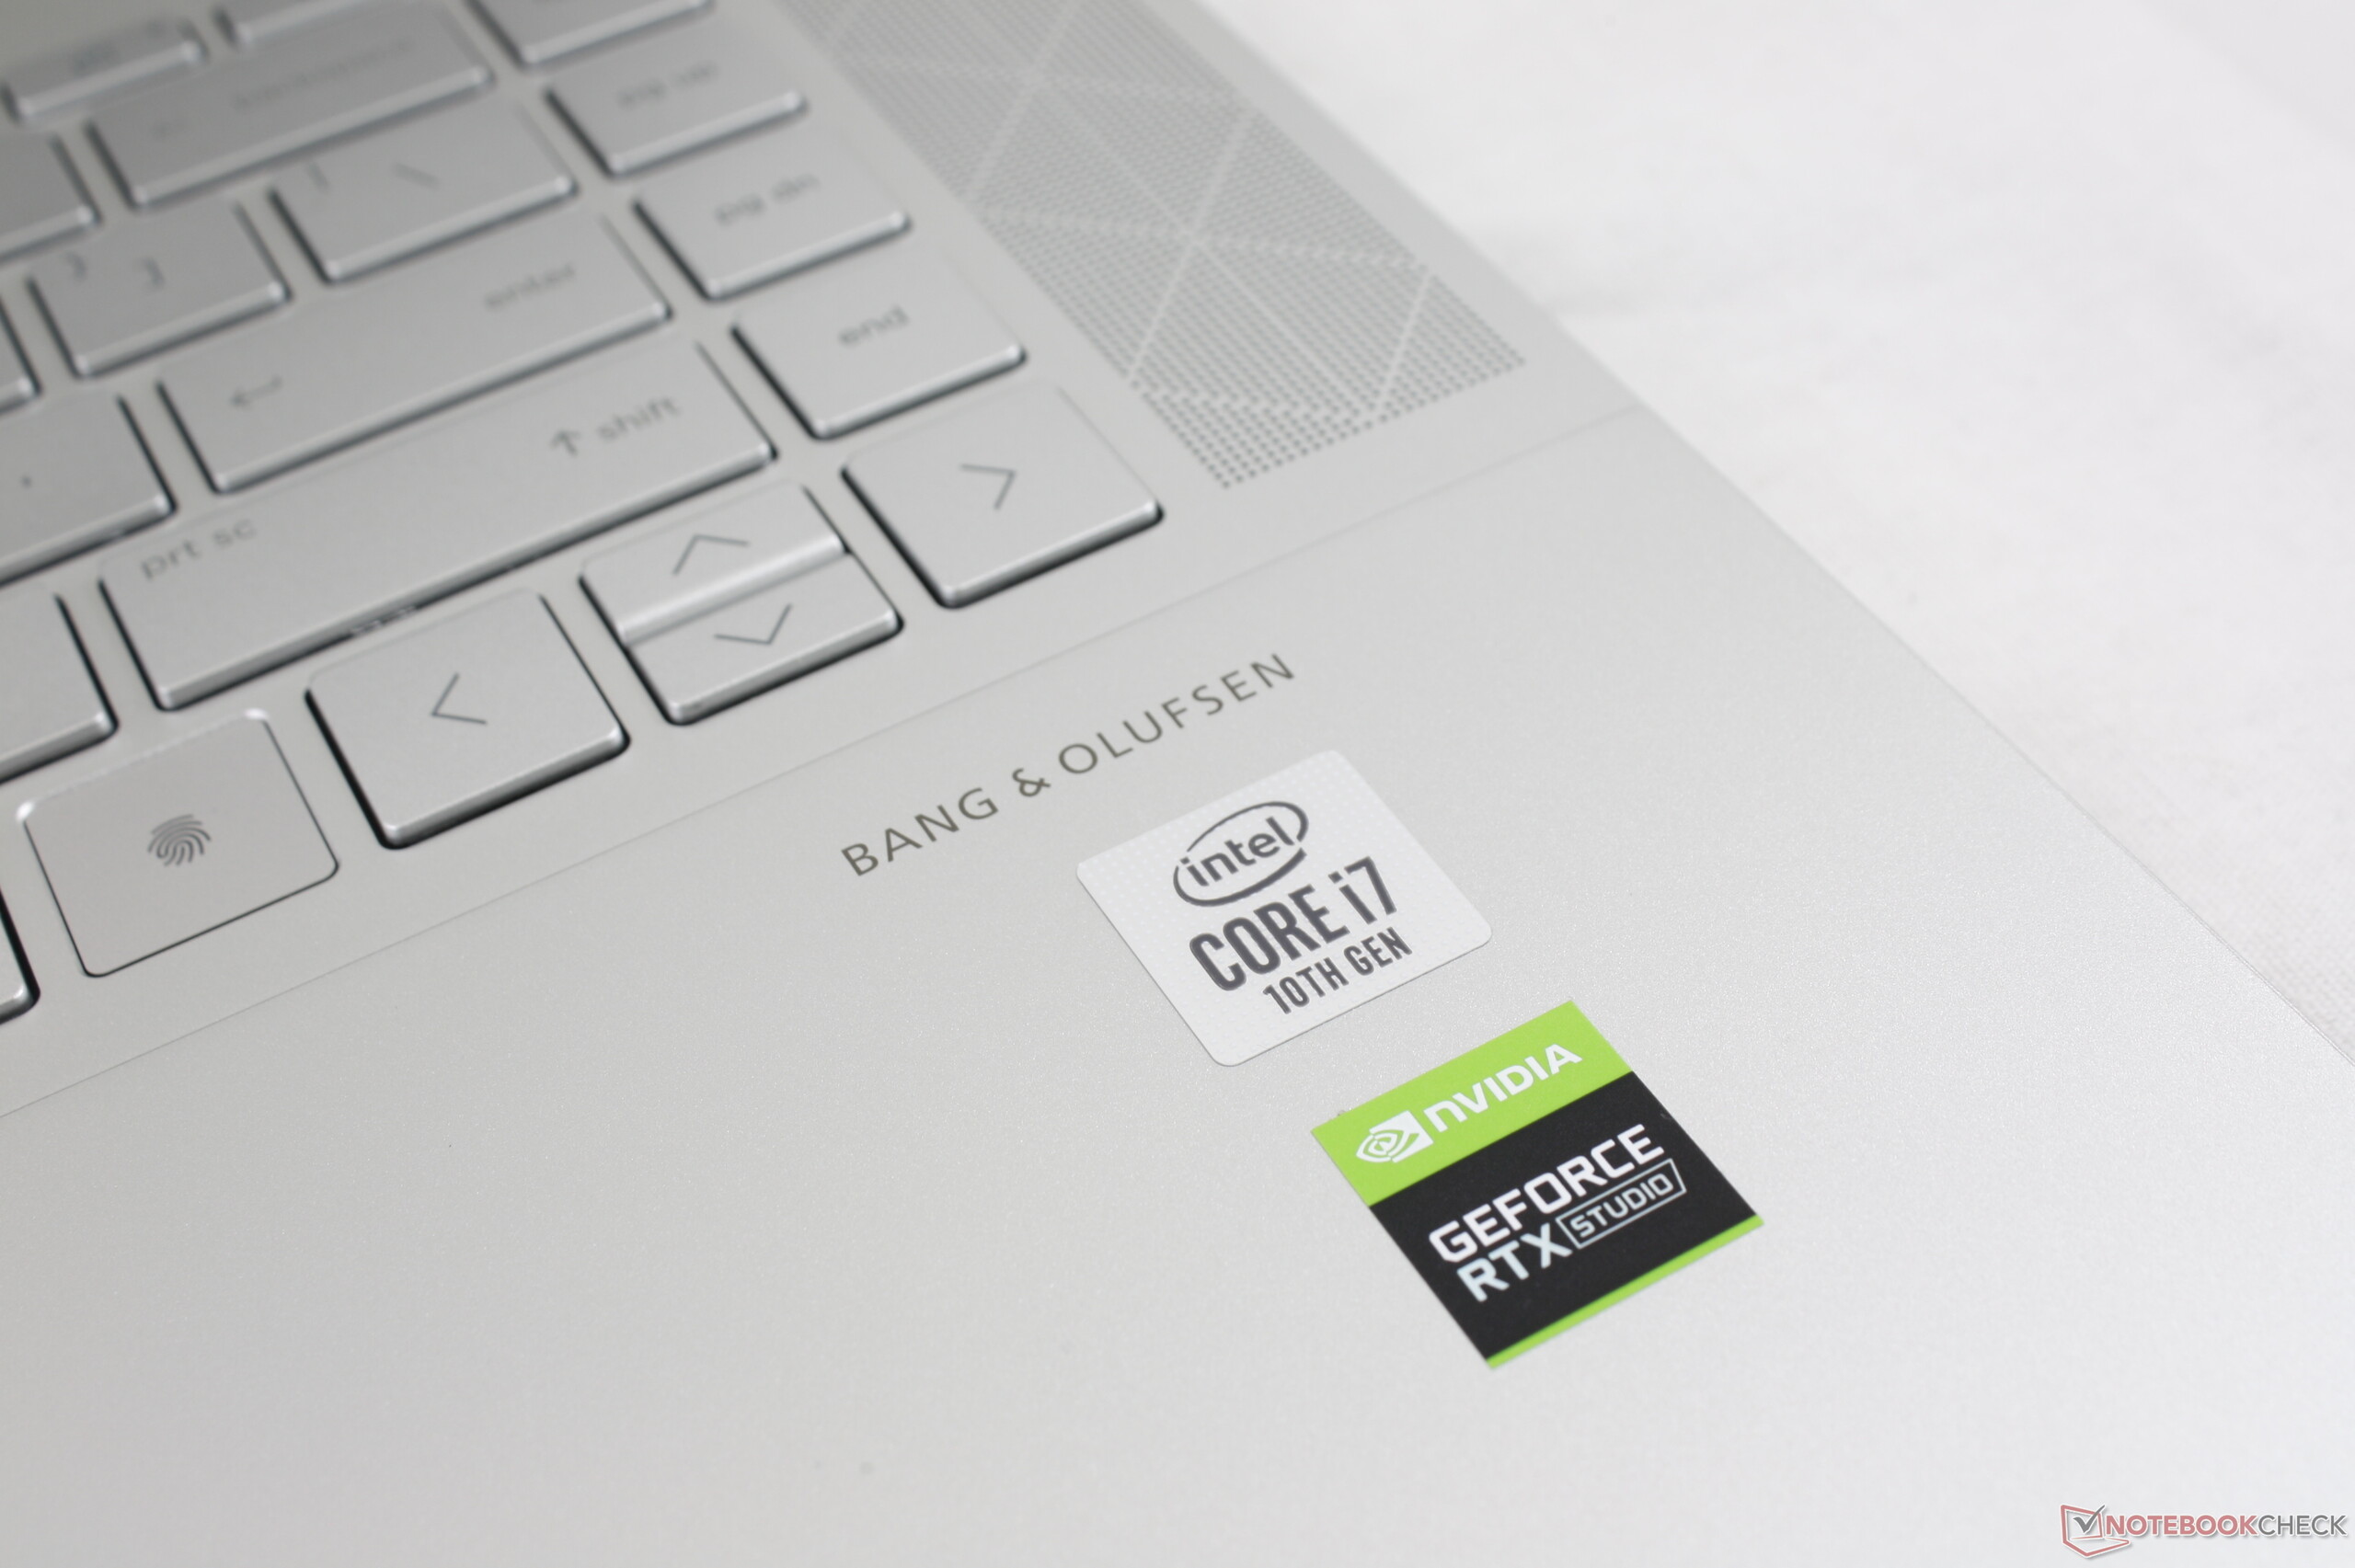
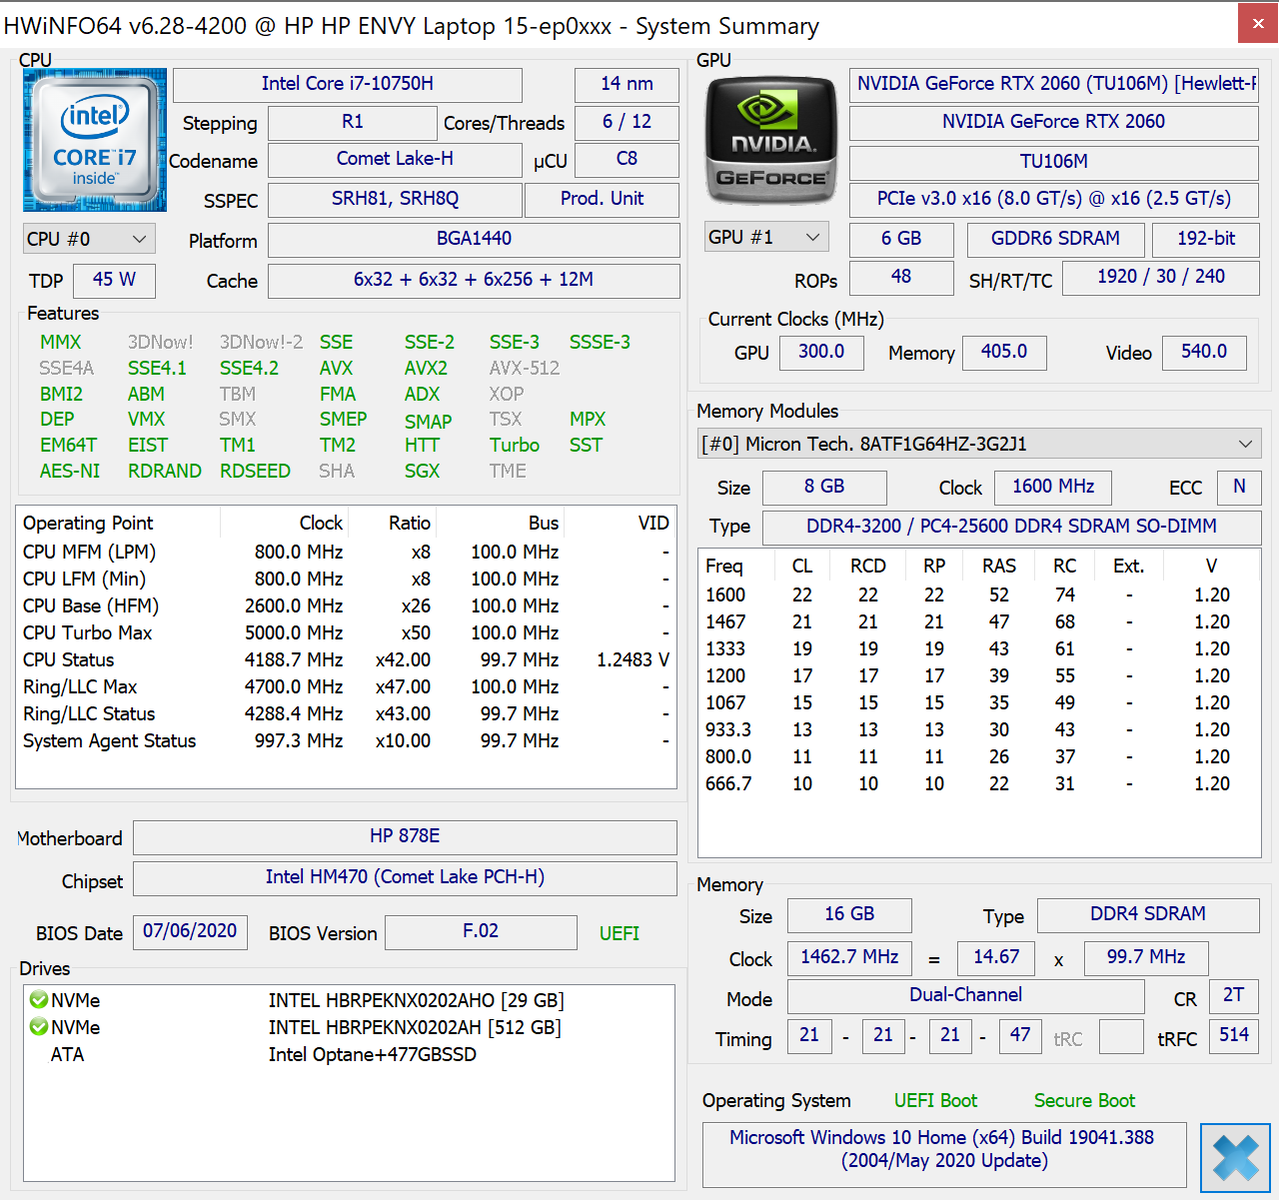
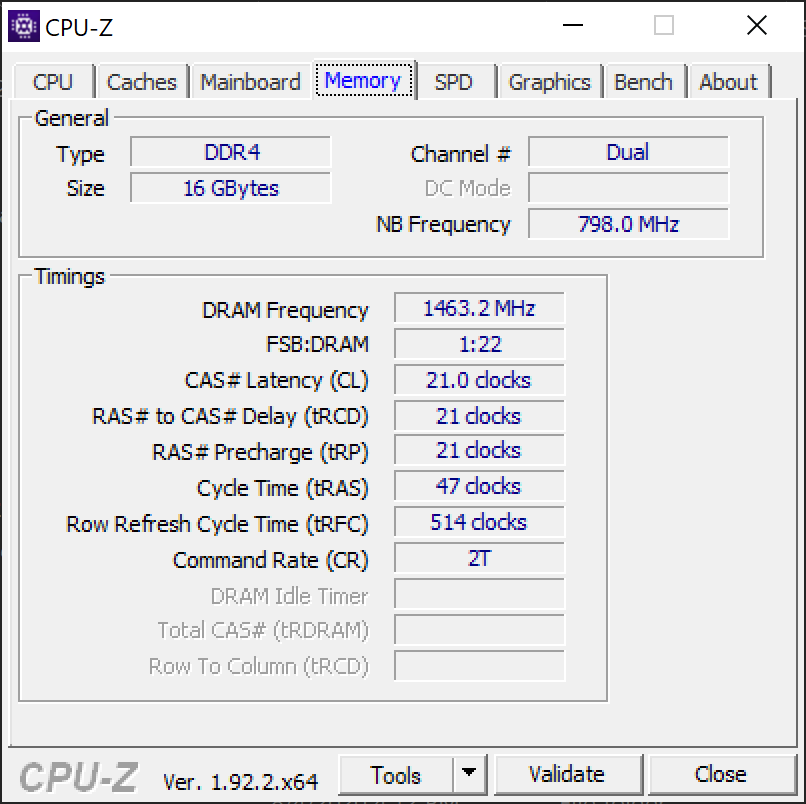
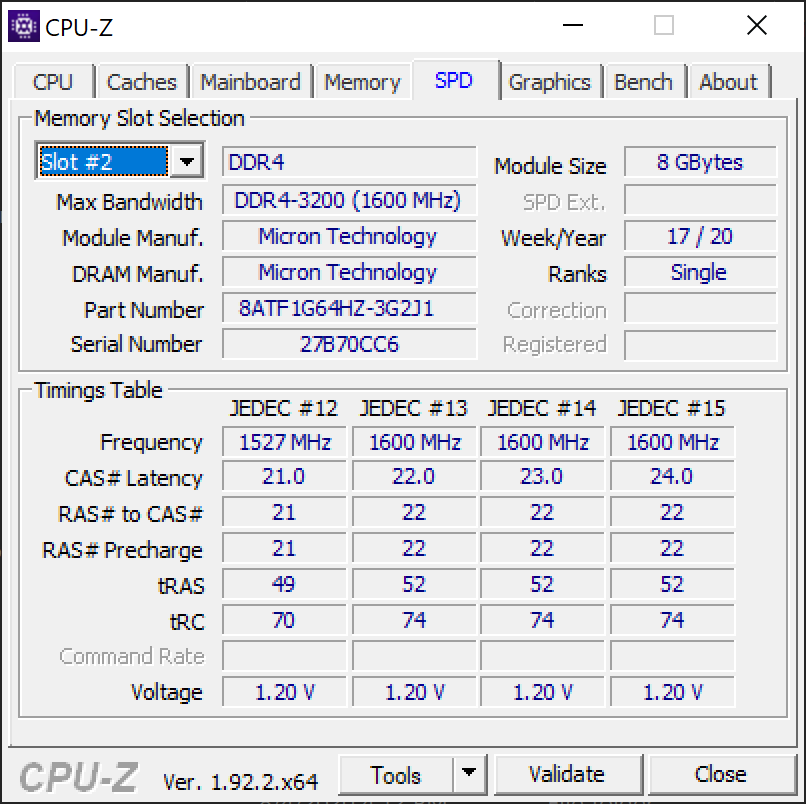
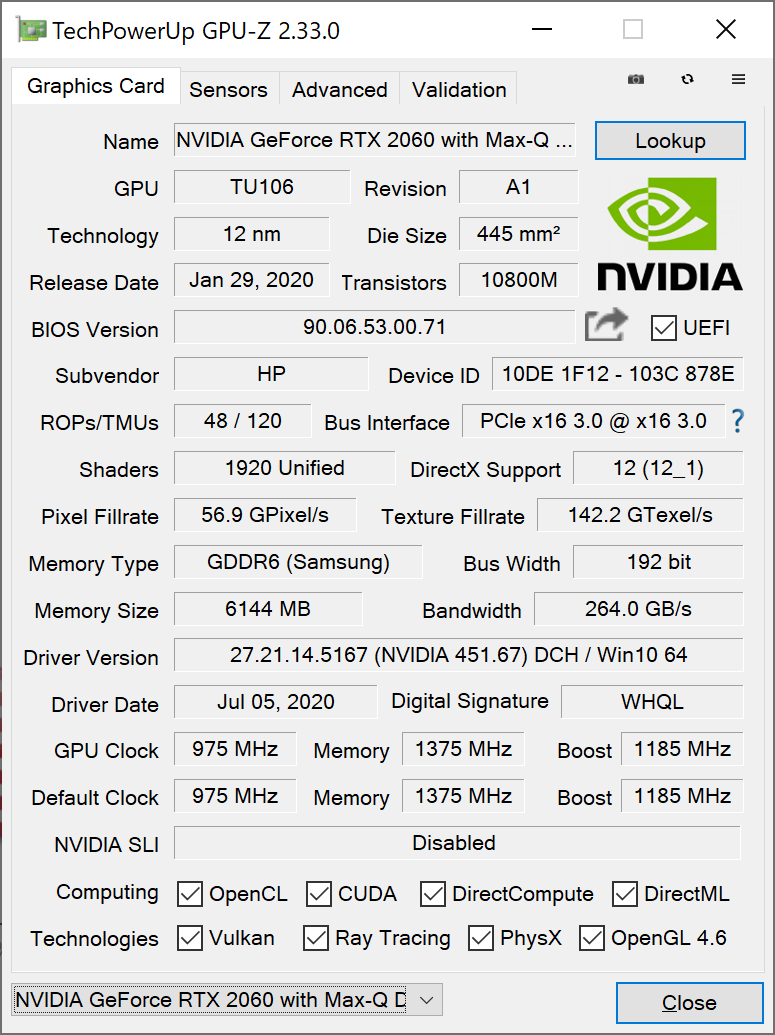
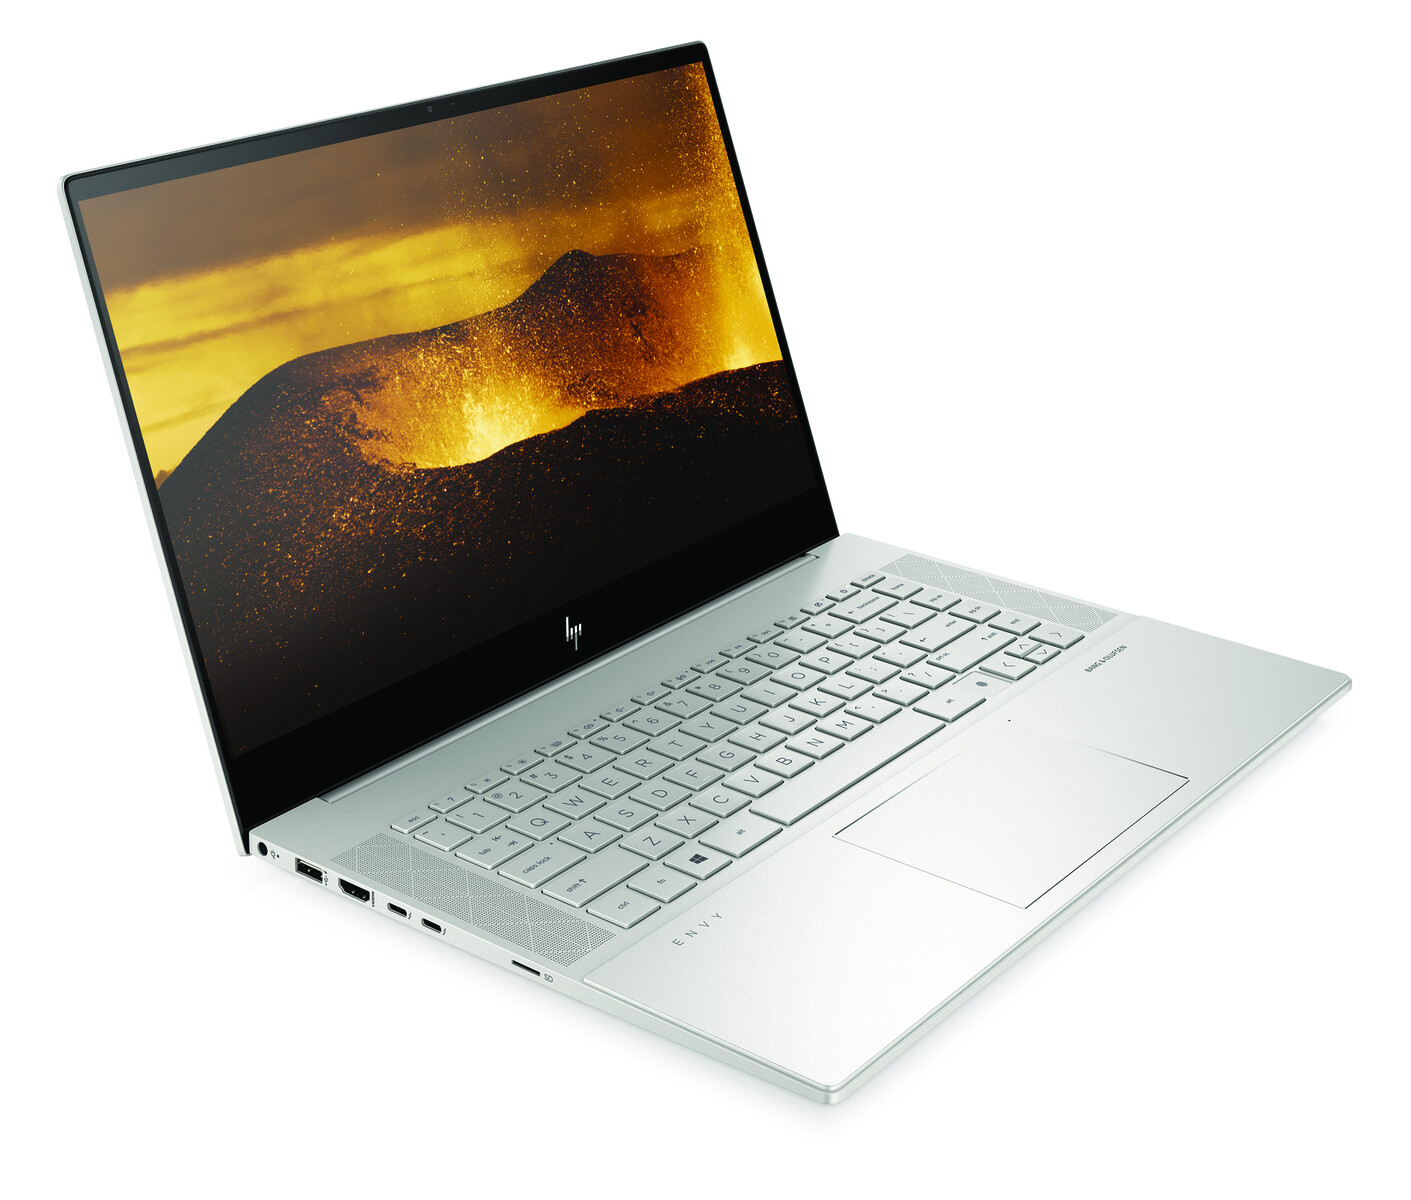
HP Envy 15-ep0098nr
- 08/31/2022 v7 (old)
Allen Ngo
Price comparison
