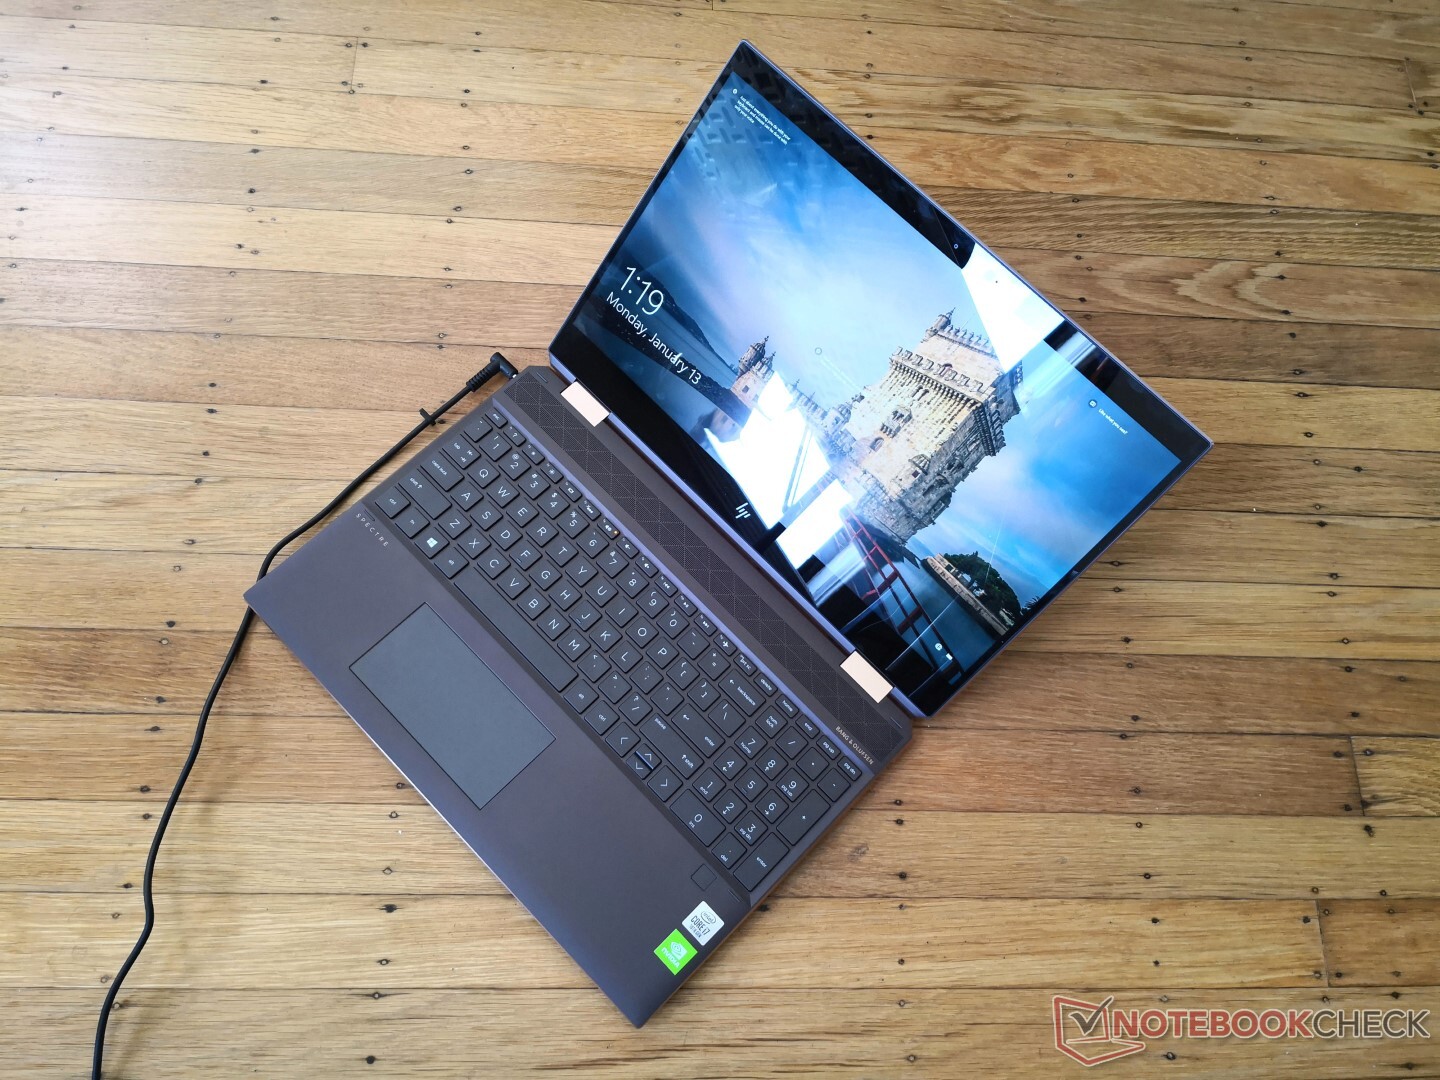
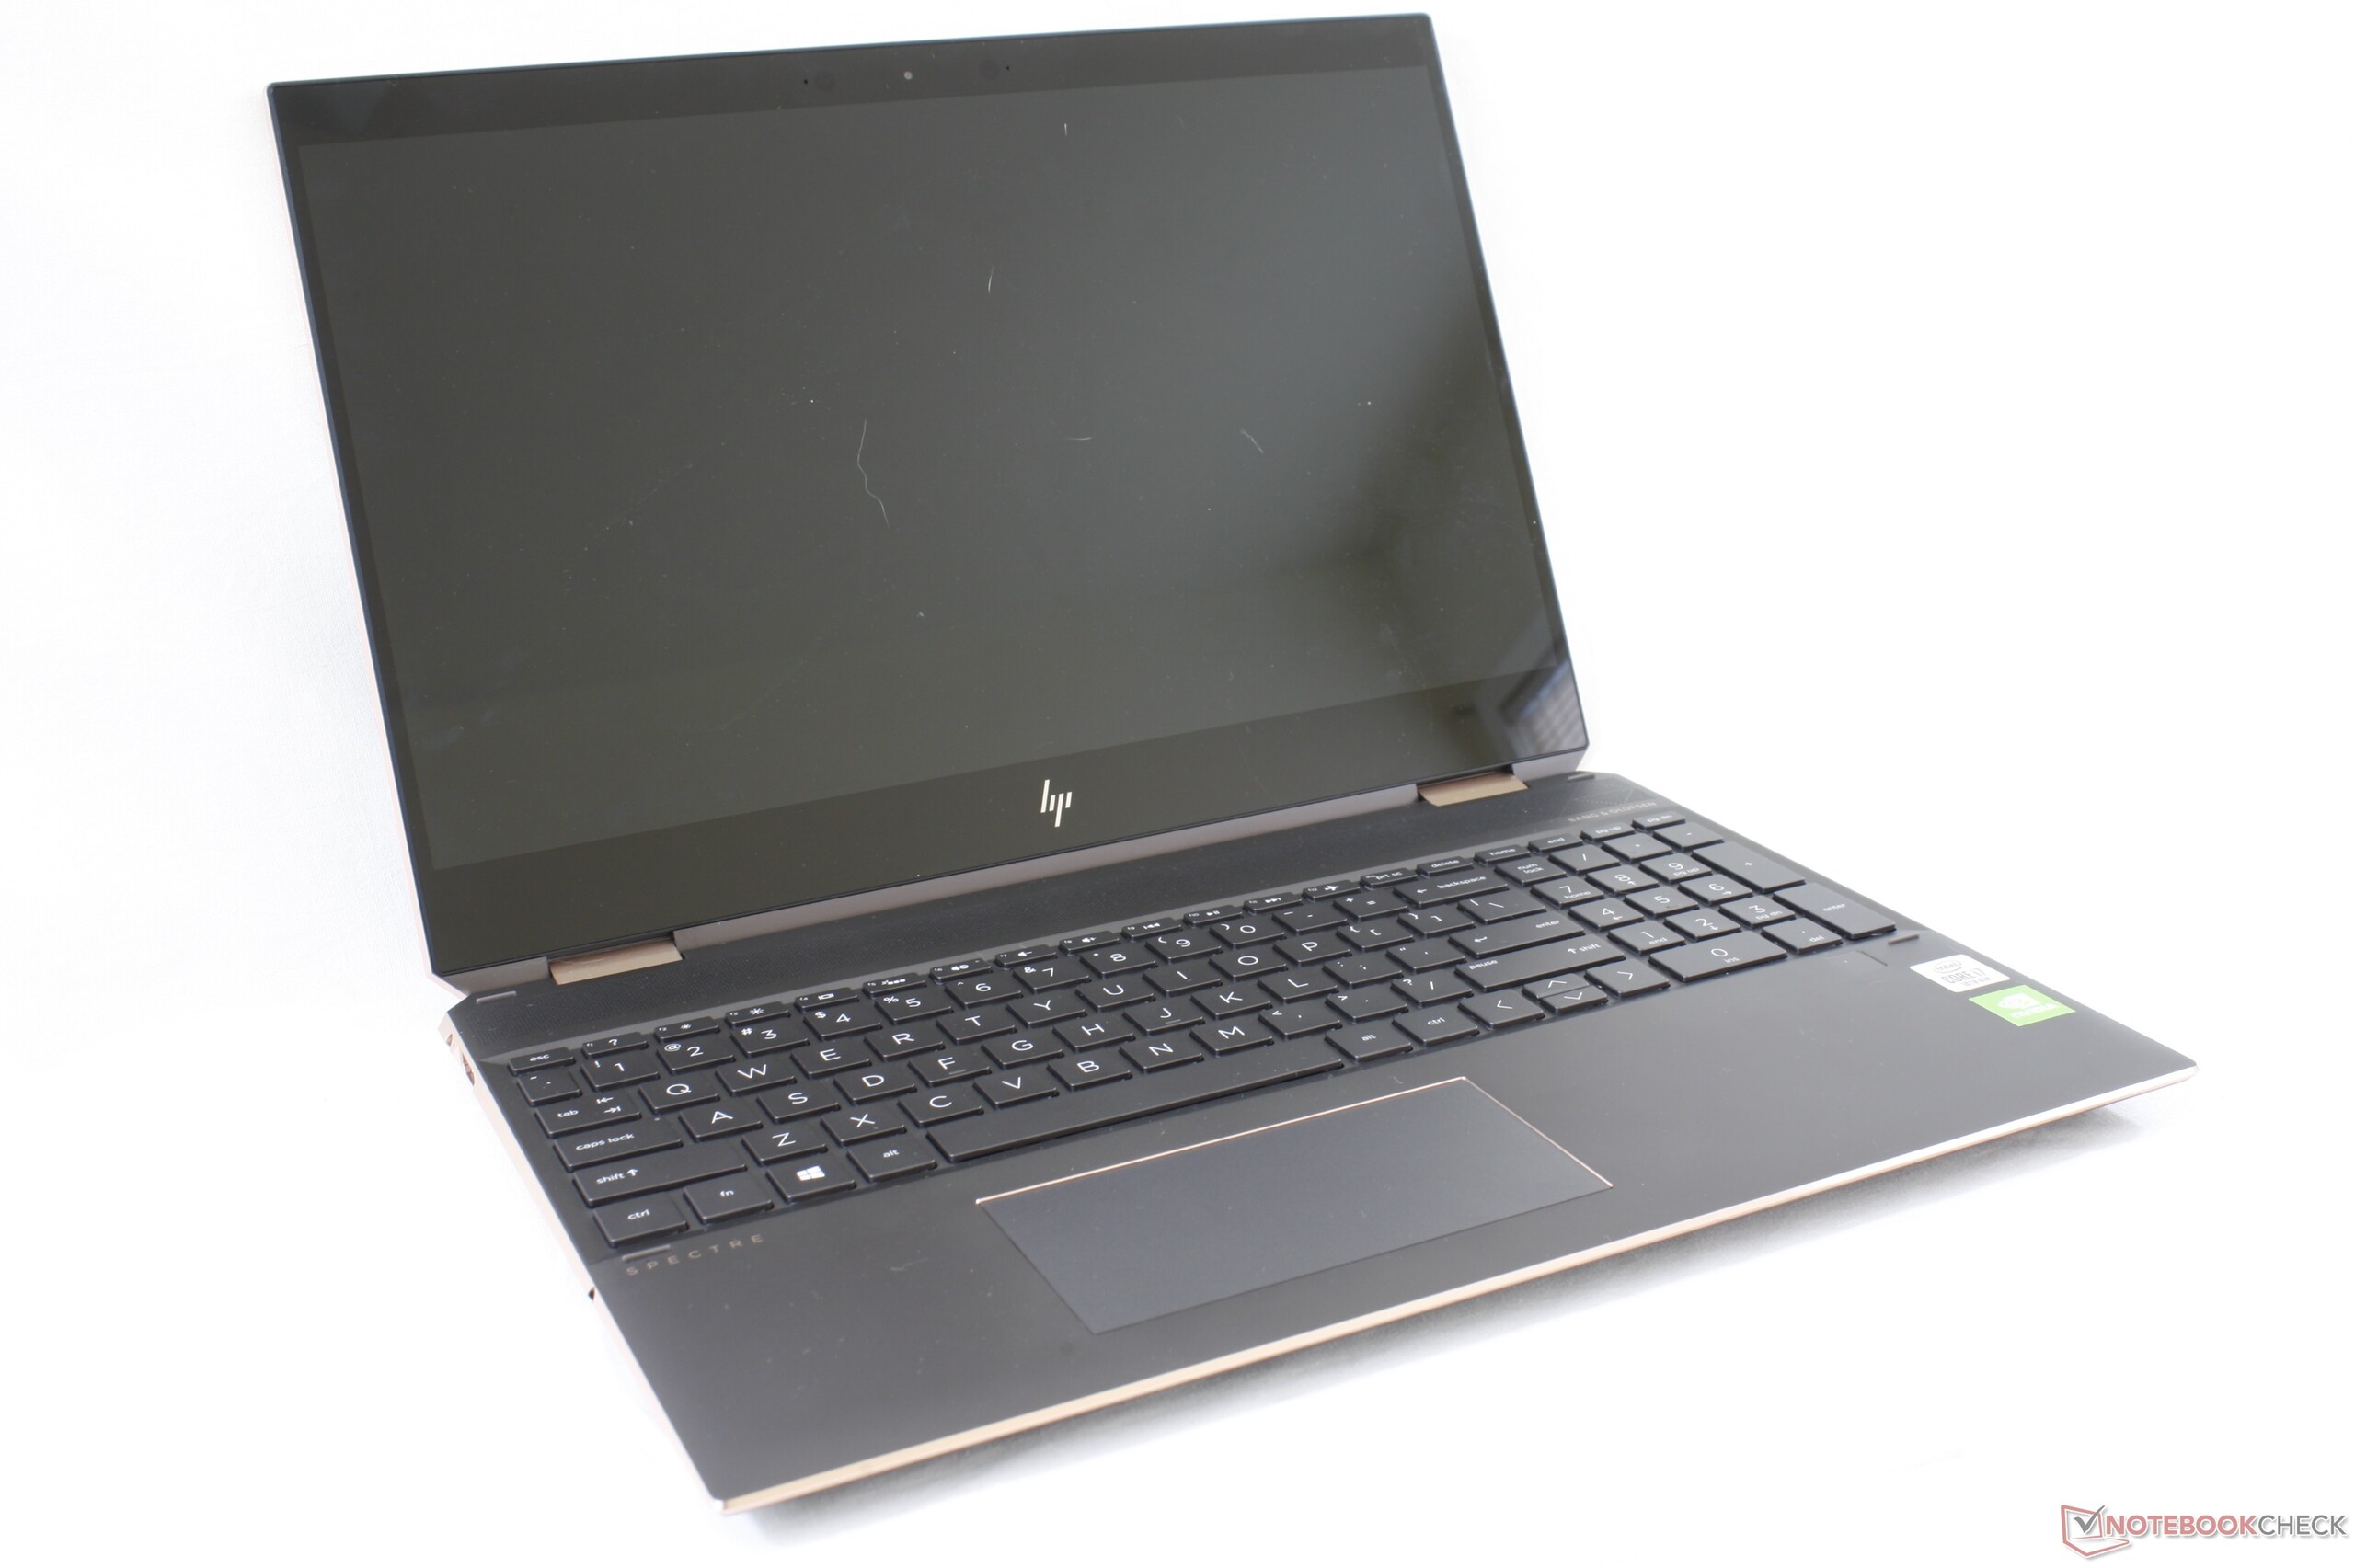
Test du HP Spectre X360 15 fin 2019 (i7-1051U, MX250, 4K UHD) : convertible Comet Lake et graphismes dédiés
Note | Date | Modèle | Poids | Épaisseur | Taille | Résolution | Prix |
|---|---|---|---|---|---|---|---|
| 85 % v7 (old) | 01/20 | HP Spectre X360 15-5ZV31AV i7-10510U, GeForce MX250 | 2.1 kg | 19.3 mm | 15.60" | 3840x2160 | |
| 86 % v7 (old) | 12/19 | Lenovo Yoga C940-15IRH i7-9750H, GeForce GTX 1650 Max-Q | 2 kg | 19.7 mm | 15.60" | 1920x1080 | |
| 83.1 % v7 (old) | 12/19 | Asus ZenBook 15 UX534FT-DB77 i7-8565U, GeForce GTX 1650 Max-Q | 1.7 kg | 18.9 mm | 15.60" | 1920x1080 | |
| 86.5 % v6 (old) | 07/18 | HP Spectre x360 15-ch011nr i5-8550U, GeForce MX150 | 2.1 kg | 19.3 mm | 15.60" | 3840x2160 | |
| 85.2 % v7 (old) | 11/19 | MSI Prestige 15 A10SC i7-10710U, GeForce GTX 1650 Max-Q | 1.7 kg | 16 mm | 15.60" | 3840x2160 |

| SD Card Reader | |
| average JPG Copy Test (av. of 3 runs) | |
| Dell XPS 15 7590 9980HK GTX 1650 (Toshiba Exceria Pro SDXC 64 GB UHS-II) | |
| HP Spectre X360 15-5ZV31AV (Toshiba Exceria Pro M501 UHS-II) | |
| MSI Prestige 15 A10SC (Toshiba Exceria Pro M501 UHS-II) | |
| Asus ZenBook 15 UX534FT-DB77 (Toshiba Exceria Pro SDXC 64 GB UHS-II) | |
| HP Pavilion Gaming 15-ec0017ng (Toshiba Exceria Pro SDXC 64 GB UHS-II) | |
| maximum AS SSD Seq Read Test (1GB) | |
| MSI Prestige 15 A10SC (Toshiba Exceria Pro M501 UHS-II) | |
| Dell XPS 15 7590 9980HK GTX 1650 (Toshiba Exceria Pro SDXC 64 GB UHS-II) | |
| HP Spectre X360 15-5ZV31AV (Toshiba Exceria Pro M501 UHS-II) | |
| Asus ZenBook 15 UX534FT-DB77 (Toshiba Exceria Pro SDXC 64 GB UHS-II) | |
| HP Pavilion Gaming 15-ec0017ng (Toshiba Exceria Pro SDXC 64 GB UHS-II) | |
| Networking | |
| iperf3 transmit AX12 | |
| MSI Prestige 15 A10SC | |
| HP Pavilion Gaming 15-ec0017ng | |
| iperf3 receive AX12 | |
| MSI Prestige 15 A10SC | |
| HP Pavilion Gaming 15-ec0017ng | |
| |||||||||||||||||||||||||
Homogénéité de la luminosité: 85 %
Valeur mesurée au centre, sur batterie: 284.6 cd/m²
Contraste: 1138:1 (Valeurs des noirs: 0.25 cd/m²)
ΔE ColorChecker Calman: 3.52 | ∀{0.5-29.43 Ø4.72}
calibrated: 3
ΔE Greyscale Calman: 3.2 | ∀{0.09-98 Ø4.97}
93.8% sRGB (Argyll 1.6.3 3D)
61.1% AdobeRGB 1998 (Argyll 1.6.3 3D)
68.4% AdobeRGB 1998 (Argyll 3D)
94.3% sRGB (Argyll 3D)
68.3% Display P3 (Argyll 3D)
Gamma: 2.28
CCT: 7070 K
| HP Spectre X360 15-5ZV31AV AU Optronics AUO30EB, IPS, 15.6", 3840x2160 | HP Spectre x360 15-ch011nr BOE0730, IPS, 15.6", 3840x2160 | Dell XPS 15 7590 9980HK GTX 1650 Samsung 156WR04, SDCA029, OLED, 15.6", 3840x2160 | Lenovo Yoga C940-15IRH LG Philips LP156WFC-SPU1, IPS, 15.6", 1920x1080 | MSI Prestige 15 A10SC Sharp LQ156D1JW42, IPS, 15.6", 3840x2160 | HP Spectre x360 15-df0126ng AU Optronics AUO30EB, IPS, 15.6", 3840x2160 | |
|---|---|---|---|---|---|---|
| Display | -2% | 23% | -6% | 22% | 0% | |
| Display P3 Coverage (%) | 68.3 | 68.5 0% | 88.1 29% | 61.5 -10% | 82 20% | 68.1 0% |
| sRGB Coverage (%) | 94.3 | 90.7 -4% | 99.6 6% | 92.7 -2% | 98.3 4% | 94.2 0% |
| AdobeRGB 1998 Coverage (%) | 68.4 | 66.3 -3% | 91.8 34% | 63.6 -7% | 96.2 41% | 68.4 0% |
| Response Times | 33% | 95% | 13% | -4% | 12% | |
| Response Time Grey 50% / Grey 80% * (ms) | 56.8 ? | 38 ? 33% | 2.3 ? 96% | 48.4 ? 15% | 60 ? -6% | 57 ? -0% |
| Response Time Black / White * (ms) | 40.8 ? | 27.6 ? 32% | 2.4 ? 94% | 36.4 ? 11% | 41.2 ? -1% | 31 ? 24% |
| PWM Frequency (Hz) | 943 ? | 59.5 ? | 26040 ? | |||
| Screen | -29% | -4% | 9% | 7% | -8% | |
| Brightness middle (cd/m²) | 284.6 | 329.3 16% | 421.2 48% | 484.8 70% | 464.5 63% | 330 16% |
| Brightness (cd/m²) | 285 | 316 11% | 417 46% | 463 62% | 451 58% | 310 9% |
| Brightness Distribution (%) | 85 | 84 -1% | 94 11% | 82 -4% | 92 8% | 87 2% |
| Black Level * (cd/m²) | 0.25 | 0.31 -24% | 0.26 -4% | 0.5 -100% | 0.37 -48% | |
| Contrast (:1) | 1138 | 1062 -7% | 1865 64% | 929 -18% | 892 -22% | |
| Colorchecker dE 2000 * | 3.52 | 4.78 -36% | 6.06 -72% | 4.5 -28% | 3.36 5% | 4.03 -14% |
| Colorchecker dE 2000 max. * | 5.56 | 11.75 -111% | 11.89 -114% | 7.55 -36% | 7.06 -27% | 6.74 -21% |
| Colorchecker dE 2000 calibrated * | 3 | 3.51 -17% | 1.19 60% | 3.42 -14% | 1.96 35% | |
| Greyscale dE 2000 * | 3.2 | 7.9 -147% | 2.8 13% | 5.7 -78% | 1.3 59% | 4.49 -40% |
| Gamma | 2.28 96% | 2.24 98% | 2.15 102% | 2.45 90% | 2.14 103% | 2.57 86% |
| CCT | 7070 92% | 8323 78% | 6235 104% | 6101 107% | 6596 99% | 6744 96% |
| Color Space (Percent of AdobeRGB 1998) (%) | 61.1 | 58.8 -4% | 81 33% | 58.7 -4% | 84.8 39% | 61 0% |
| Color Space (Percent of sRGB) (%) | 93.8 | 90.4 -4% | 99.6 6% | 92.8 -1% | 98.3 5% | 94 0% |
| Moyenne finale (programmes/paramètres) | 1% /
-17% | 38% /
18% | 5% /
7% | 8% /
9% | 1% /
-4% |
* ... Moindre est la valeur, meilleures sont les performances
Temps de réponse de l'écran
| ↔ Temps de réponse noir à blanc | ||
|---|---|---|
| 40.8 ms ... hausse ↗ et chute ↘ combinées | ↗ 20.4 ms hausse | 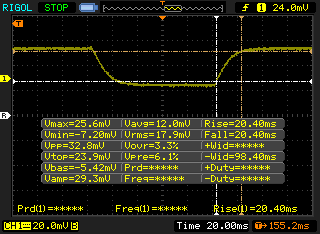 |
| ↘ 20.4 ms chute | ||
| L'écran souffre de latences très élevées, à éviter pour le jeu. En comparaison, tous les appareils testés affichent entre 0.1 (minimum) et 240 (maximum) ms. » 98 % des appareils testés affichent de meilleures performances. Cela signifie que les latences relevées sont moins bonnes que la moyenne (19.8 ms) de tous les appareils testés. | ||
| ↔ Temps de réponse gris 50% à gris 80% | ||
| 56.8 ms ... hausse ↗ et chute ↘ combinées | ↗ 26 ms hausse | 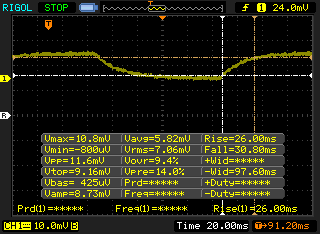 |
| ↘ 30.8 ms chute | ||
| L'écran souffre de latences très élevées, à éviter pour le jeu. En comparaison, tous les appareils testés affichent entre 0.165 (minimum) et 636 (maximum) ms. » 94 % des appareils testés affichent de meilleures performances. Cela signifie que les latences relevées sont moins bonnes que la moyenne (31 ms) de tous les appareils testés. | ||
Scintillement / MLI (Modulation de largeur d'impulsion)
| Scintillement / MLI (Modulation de largeur d'impulsion) non décelé |  | ||
En comparaison, 52 % des appareils testés n'emploient pas MDI pour assombrir leur écran. Nous avons relevé une moyenne à 7775 (minimum : 5 - maximum : 343500) Hz dans le cas où une MDI était active. | |||
| PCMark 8 Home Score Accelerated v2 | 3365 points | |
| PCMark 8 Work Score Accelerated v2 | 4633 points | |
| PCMark 10 Score | 4101 points | |
Aide | ||
| HP Spectre X360 15-5ZV31AV Intel SSD 660p 2TB SSDPEKNW020T8 | Dell XPS 15 7590 9980HK GTX 1650 Toshiba XG6 KXG60ZNV1T02 | Lenovo Yoga C940-15IRH Intel Optane Memory H10 with Solid State Storage 32GB + 512GB HBRPEKNX0202A(L/H) | Asus ZenBook 15 UX534FT-DB77 Samsung SSD PM981 MZVLB1T0HALR | HP Spectre x360 15-ch011nr SK hynix PC401 NVMe 500 GB | |
|---|---|---|---|---|---|
| AS SSD | 42% | -20% | 27% | -4% | |
| Seq Read (MB/s) | 1220 | 1723 41% | 769 -37% | 1887 55% | 1739 43% |
| Seq Write (MB/s) | 1152 | 1386 20% | 351.1 -70% | 1432 24% | 1189 3% |
| 4K Read (MB/s) | 52.3 | 43.25 -17% | 69.1 32% | 52.3 0% | 38.76 -26% |
| 4K Write (MB/s) | 146.6 | 98.3 -33% | 100.9 -31% | 146 0% | 93.2 -36% |
| 4K-64 Read (MB/s) | 652 | 1078 65% | 472 -28% | 969 49% | 646 -1% |
| 4K-64 Write (MB/s) | 847 | 1456 72% | 948 12% | 1375 62% | 545 -36% |
| Access Time Read * (ms) | 0.077 | 0.05 35% | 0.071 8% | 0.034 56% | 0.054 30% |
| Access Time Write * (ms) | 0.106 | 0.039 63% | 0.137 -29% | 0.075 29% | 0.051 52% |
| Score Read (Points) | 826 | 1294 57% | 618 -25% | 1210 46% | 859 4% |
| Score Write (Points) | 1109 | 1693 53% | 1084 -2% | 1664 50% | 757 -32% |
| Score Total (Points) | 2371 | 3638 53% | 2024 -15% | 3483 47% | 2037 -14% |
| Copy ISO MB/s (MB/s) | 2070 | 3182 54% | 839 -59% | 1375 -34% | 1668 -19% |
| Copy Program MB/s (MB/s) | 571 | 984 72% | 455.8 -20% | 468 -18% | 486.8 -15% |
| Copy Game MB/s (MB/s) | 1219 | 1824 50% | 969 -21% | 1287 6% | 1042 -15% |
* ... Moindre est la valeur, meilleures sont les performances

| 3DMark 11 Performance | 4929 points | |
| 3DMark Cloud Gate Standard Score | 12540 points | |
| 3DMark Fire Strike Score | 3206 points | |
| 3DMark Time Spy Score | 1218 points | |
Aide | ||
| The Witcher 3 | |
| 1366x768 Medium Graphics & Postprocessing | |
| Lenovo Yoga C940-15IRH | |
| Dell G3 3590 | |
| HP Spectre x360 15-df0126ng | |
| HP Spectre X360 15-5ZV31AV | |
| Xiaomi Mi Notebook Pro i7 | |
| Moyenne NVIDIA GeForce MX250 (30 - 40, n=27) | |
| 1920x1080 High Graphics & Postprocessing (Nvidia HairWorks Off) | |
| Asus TUF FX705GM | |
| Dell G3 3590 | |
| Lenovo Yoga C940-15IRH | |
| HP Spectre x360 15-df0126ng | |
| HP Spectre X360 15-5ZV31AV | |
| Moyenne NVIDIA GeForce MX250 (16.3 - 23.1, n=27) | |
| Xiaomi Mi Notebook Pro i7 | |
| Dell Inspiron 15 5000 5585 | |
| 1920x1080 Ultra Graphics & Postprocessing (HBAO+) | |
| Asus TUF FX705GM | |
| Lenovo Yoga C940-15IRH | |
| Dell G3 3590 | |
| HP Spectre x360 15-df0126ng | |
| HP Spectre X360 15-5ZV31AV | |
| Moyenne NVIDIA GeForce MX250 (9 - 16, n=24) | |
| Xiaomi Mi Notebook Pro i7 | |
| Dell Inspiron 15 5000 5585 | |
| Bas | Moyen | Élevé | Ultra | |
|---|---|---|---|---|
| BioShock Infinite (2013) | 203 | 112.2 | 94.2 | 35.3 |
| The Witcher 3 (2015) | 38.7 | 21.9 | 12.2 | |
| Shadow of the Tomb Raider (2018) | 53 | 18 | 13 | 9 |
| HP Spectre X360 15-5ZV31AV GeForce MX250, i7-10510U, Intel SSD 660p 2TB SSDPEKNW020T8 | Dell XPS 15 7590 9980HK GTX 1650 GeForce GTX 1650 Mobile, i9-9980HK, Toshiba XG6 KXG60ZNV1T02 | Lenovo Yoga C940-15IRH GeForce GTX 1650 Max-Q, i7-9750H, Intel Optane Memory H10 with Solid State Storage 32GB + 512GB HBRPEKNX0202A(L/H) | Asus ZenBook 15 UX534FT-DB77 GeForce GTX 1650 Max-Q, i7-8565U, Samsung SSD PM981 MZVLB1T0HALR | MSI Prestige 15 A10SC GeForce GTX 1650 Max-Q, i7-10710U, Samsung SSD PM981 MZVLB1T0HALR | HP Spectre x360 15-ch011nr GeForce MX150, i5-8550U, SK hynix PC401 NVMe 500 GB | |
|---|---|---|---|---|---|---|
| Noise | -9% | -7% | 2% | -1% | 2% | |
| arrêt / environnement * (dB) | 30.1 | 28.2 6% | 28.7 5% | 28.4 6% | 29.3 3% | 28.6 5% |
| Idle Minimum * (dB) | 30.1 | 28.2 6% | 28.7 5% | 28.4 6% | 30.1 -0% | 29.2 3% |
| Idle Average * (dB) | 30.1 | 28.2 6% | 28.8 4% | 28.4 6% | 30.2 -0% | 29.2 3% |
| Idle Maximum * (dB) | 30.1 | 30.4 -1% | 28.8 4% | 28.4 6% | 30.2 -0% | 29.2 3% |
| Load Average * (dB) | 30.1 | 43.8 -46% | 45 -50% | 33.9 -13% | 31.5 -5% | 29.2 3% |
| Witcher 3 ultra * (dB) | 39.7 | 47.2 -19% | 44.7 -13% | 39.8 -0% | 37 7% | 38.4 3% |
| Load Maximum * (dB) | 42 | 47.2 -12% | 44.7 -6% | 40.2 4% | 47 -12% | 45.7 -9% |
* ... Moindre est la valeur, meilleures sont les performances
Degré de la nuisance sonore
| Au repos |
| 30.1 / 30.1 / 30.1 dB(A) |
| Fortement sollicité |
| 30.1 / 42 dB(A) |
 | ||
30 dB silencieux 40 dB(A) audible 50 dB(A) bruyant |
||
min: | ||
(-) La température maximale du côté supérieur est de 47 °C / 117 F, par rapport à la moyenne de 36.8 °C / 98 F, allant de 21 à 71 °C pour la classe Multimedia.
(-) Le fond chauffe jusqu'à un maximum de 47.4 °C / 117 F, contre une moyenne de 39.1 °C / 102 F
(+) En utilisation inactive, la température moyenne du côté supérieur est de 21.4 °C / 71 F, par rapport à la moyenne du dispositif de 31.3 °C / 88 F.
(±) En jouant à The Witcher 3, la température moyenne du côté supérieur est de 33.6 °C / 92 F, alors que la moyenne de l'appareil est de 31.3 °C / 88 F.
(+) Les repose-poignets et le pavé tactile sont plus froids que la température de la peau avec un maximum de 29.8 °C / 85.6 F et sont donc froids au toucher.
(±) La température moyenne de la zone de l'appui-paume de dispositifs similaires était de 28.7 °C / 83.7 F (-1.1 °C / #-1.9 F).
HP Spectre X360 15-5ZV31AV analyse audio
(+) | les haut-parleurs peuvent jouer relativement fort (82.7# dB)
Basses 100 - 315 Hz
(±) | basse réduite - en moyenne 13.6% inférieure à la médiane
(±) | la linéarité des basses est moyenne (11.8% delta à la fréquence précédente)
Médiums 400 - 2000 Hz
(+) | médiane équilibrée - seulement 2.5% de la médiane
(+) | les médiums sont linéaires (6.7% delta à la fréquence précédente)
Aiguës 2 - 16 kHz
(+) | des sommets équilibrés - à seulement 2.5% de la médiane
(±) | la linéarité des aigus est moyenne (7% delta à la fréquence précédente)
Globalement 100 - 16 000 Hz
(±) | la linéarité du son global est moyenne (15.4% de différence avec la médiane)
Par rapport à la même classe
» 39% de tous les appareils testés de cette catégorie étaient meilleurs, 3% similaires, 59% pires
» Le meilleur avait un delta de 5%, la moyenne était de 17%, le pire était de 45%.
Par rapport à tous les appareils testés
» 22% de tous les appareils testés étaient meilleurs, 4% similaires, 73% pires
» Le meilleur avait un delta de 4%, la moyenne était de 24%, le pire était de 134%.
Apple MacBook 12 (Early 2016) 1.1 GHz analyse audio
(+) | les haut-parleurs peuvent jouer relativement fort (83.6# dB)
Basses 100 - 315 Hz
(±) | basse réduite - en moyenne 11.3% inférieure à la médiane
(±) | la linéarité des basses est moyenne (14.2% delta à la fréquence précédente)
Médiums 400 - 2000 Hz
(+) | médiane équilibrée - seulement 2.4% de la médiane
(+) | les médiums sont linéaires (5.5% delta à la fréquence précédente)
Aiguës 2 - 16 kHz
(+) | des sommets équilibrés - à seulement 2% de la médiane
(+) | les aigus sont linéaires (4.5% delta à la fréquence précédente)
Globalement 100 - 16 000 Hz
(+) | le son global est linéaire (10.2% différence à la médiane)
Par rapport à la même classe
» 7% de tous les appareils testés de cette catégorie étaient meilleurs, 2% similaires, 91% pires
» Le meilleur avait un delta de 5%, la moyenne était de 18%, le pire était de 53%.
Par rapport à tous les appareils testés
» 5% de tous les appareils testés étaient meilleurs, 1% similaires, 94% pires
» Le meilleur avait un delta de 4%, la moyenne était de 24%, le pire était de 134%.
| Éteint/en veille | |
| Au repos | |
| Fortement sollicité |
|
Légende:
min: | |
| HP Spectre X360 15-5ZV31AV i7-10510U, GeForce MX250, Intel SSD 660p 2TB SSDPEKNW020T8, IPS, 3840x2160, 15.6" | HP Spectre x360 15-ch011nr i5-8550U, GeForce MX150, SK hynix PC401 NVMe 500 GB, IPS, 3840x2160, 15.6" | Dell XPS 15 7590 9980HK GTX 1650 i9-9980HK, GeForce GTX 1650 Mobile, Toshiba XG6 KXG60ZNV1T02, OLED, 3840x2160, 15.6" | Lenovo Yoga C940-15IRH i7-9750H, GeForce GTX 1650 Max-Q, Intel Optane Memory H10 with Solid State Storage 32GB + 512GB HBRPEKNX0202A(L/H), IPS, 1920x1080, 15.6" | Asus ZenBook 15 UX534FT-DB77 i7-8565U, GeForce GTX 1650 Max-Q, Samsung SSD PM981 MZVLB1T0HALR, IPS, 1920x1080, 15.6" | MSI Prestige 15 A10SC i7-10710U, GeForce GTX 1650 Max-Q, Samsung SSD PM981 MZVLB1T0HALR, IPS, 3840x2160, 15.6" | |
|---|---|---|---|---|---|---|
| Power Consumption | -13% | -57% | -56% | -45% | -39% | |
| Idle Minimum * (Watt) | 5.2 | 5.3 -2% | 6.2 -19% | 5.2 -0% | 5 4% | 6.1 -17% |
| Idle Average * (Watt) | 8.5 | 9.8 -15% | 9.6 -13% | 10.7 -26% | 13.2 -55% | 13.2 -55% |
| Idle Maximum * (Watt) | 8.7 | 12.6 -45% | 21.2 -144% | 24.3 -179% | 24 -176% | 19.2 -121% |
| Load Average * (Watt) | 65.6 | 73 -11% | 104.3 -59% | 84.4 -29% | 70 -7% | 75 -14% |
| Witcher 3 ultra * (Watt) | 56.5 | 67.6 -20% | 91.7 -62% | 83.9 -48% | 63.3 -12% | 74 -31% |
| Load Maximum * (Watt) | 92.4 | 80 13% | 135.3 -46% | 142.8 -55% | 114 -23% | 89.7 3% |
* ... Moindre est la valeur, meilleures sont les performances
| HP Spectre X360 15-5ZV31AV i7-10510U, GeForce MX250, 84 Wh | Dell XPS 15 7590 9980HK GTX 1650 i9-9980HK, GeForce GTX 1650 Mobile, 97 Wh | Lenovo Yoga C940-15IRH i7-9750H, GeForce GTX 1650 Max-Q, 69 Wh | Asus ZenBook 15 UX534FT-DB77 i7-8565U, GeForce GTX 1650 Max-Q, 71 Wh | MSI Prestige 15 A10SC i7-10710U, GeForce GTX 1650 Max-Q, 82 Wh | HP Spectre x360 15-ch011nr i5-8550U, GeForce MX150, 84 Wh | |
|---|---|---|---|---|---|---|
| Autonomie de la batterie | -16% | -32% | -9% | -24% | -19% | |
| Reader / Idle (h) | 22.6 | 15.2 -33% | 18.2 -19% | 21.5 -5% | 19.1 -15% | 15.5 -31% |
| WiFi v1.3 (h) | 10.8 | 7.8 -28% | 9.7 -10% | 8.4 -22% | 7.6 -30% | 10.4 -4% |
| Load (h) | 2.9 | 3.3 14% | 1 -66% | 2.9 0% | 2.1 -28% | 2.3 -21% |
Points positifs
Points négatifs

Dans nos tests des Spectre x360 13 Ice Lake et Spectre x360 15 Kaby Lake G, nous avions constaté que la fréquence, les taux d’image et le bruit des ventilateurs fluctuaient en cas de grosses sollicitations, rendant l’expérience de jeu insatisfaisante. Ce Spectre x360 15 Comet Lake U fait de même, et sa fréquence, ses taux d’image, et le niveau sonore des ventilateurs, varient tout autant en jeu. Les spécialistes qui voudraient des performances plus stables devraient éviter cette configuration du Spectre.
De plus, il faut noter que le Core i7-10510U Comet Lake U et que la GeForce MX250 ne sont que très légèrement meilleurs que les Core i7-8565U Whiskey Lake U et GeForce MX150 de génération précédente, et qu’à la marge en ce qui concerne les performances brutes. Ajoutons à cela que la version Comet Lake U 2019 partage le même clavier, le même écran, la même autonomie et le même châssis que le modèle Whiskey Lake U moins cher, et nous pouvons conclure que la mise à jour ne vaut pas le coup si vous possédez déjà un Spectre. Les nouveaux-venus intéressés par le convertible HP pourraient même se tourner vers le modèle Whiskey Lake U, pour son meilleur ratio prix / performances.
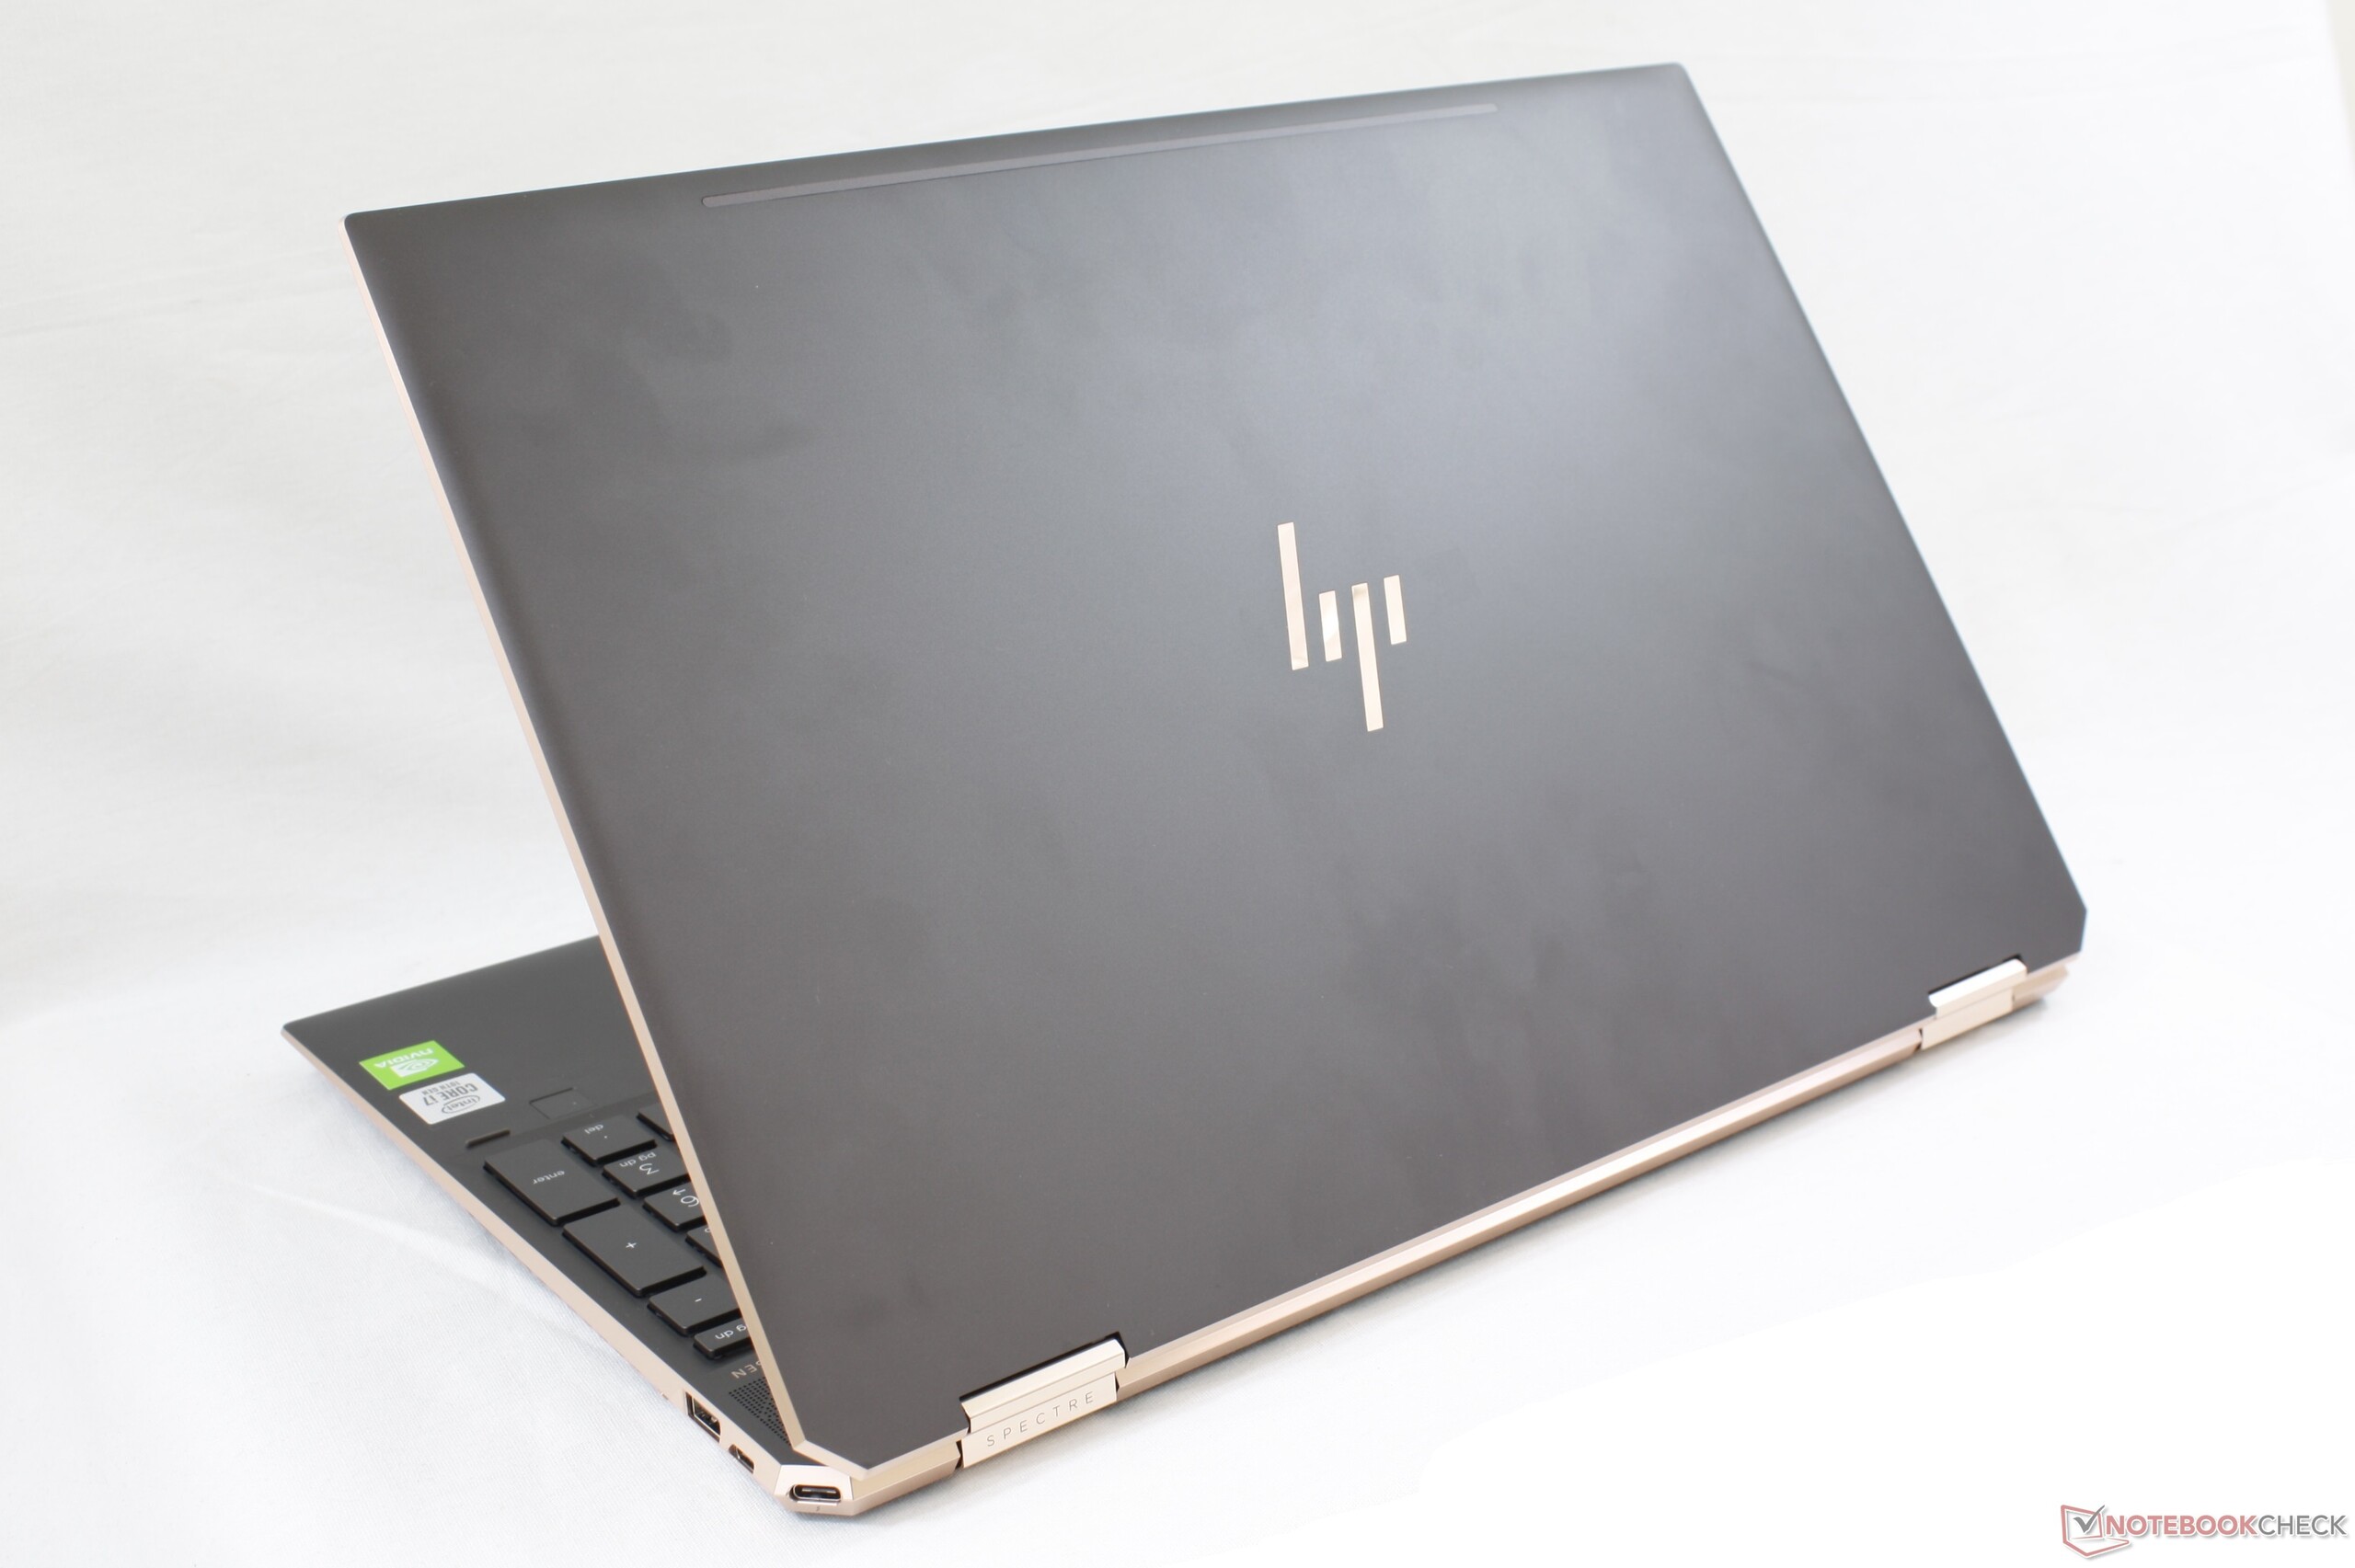
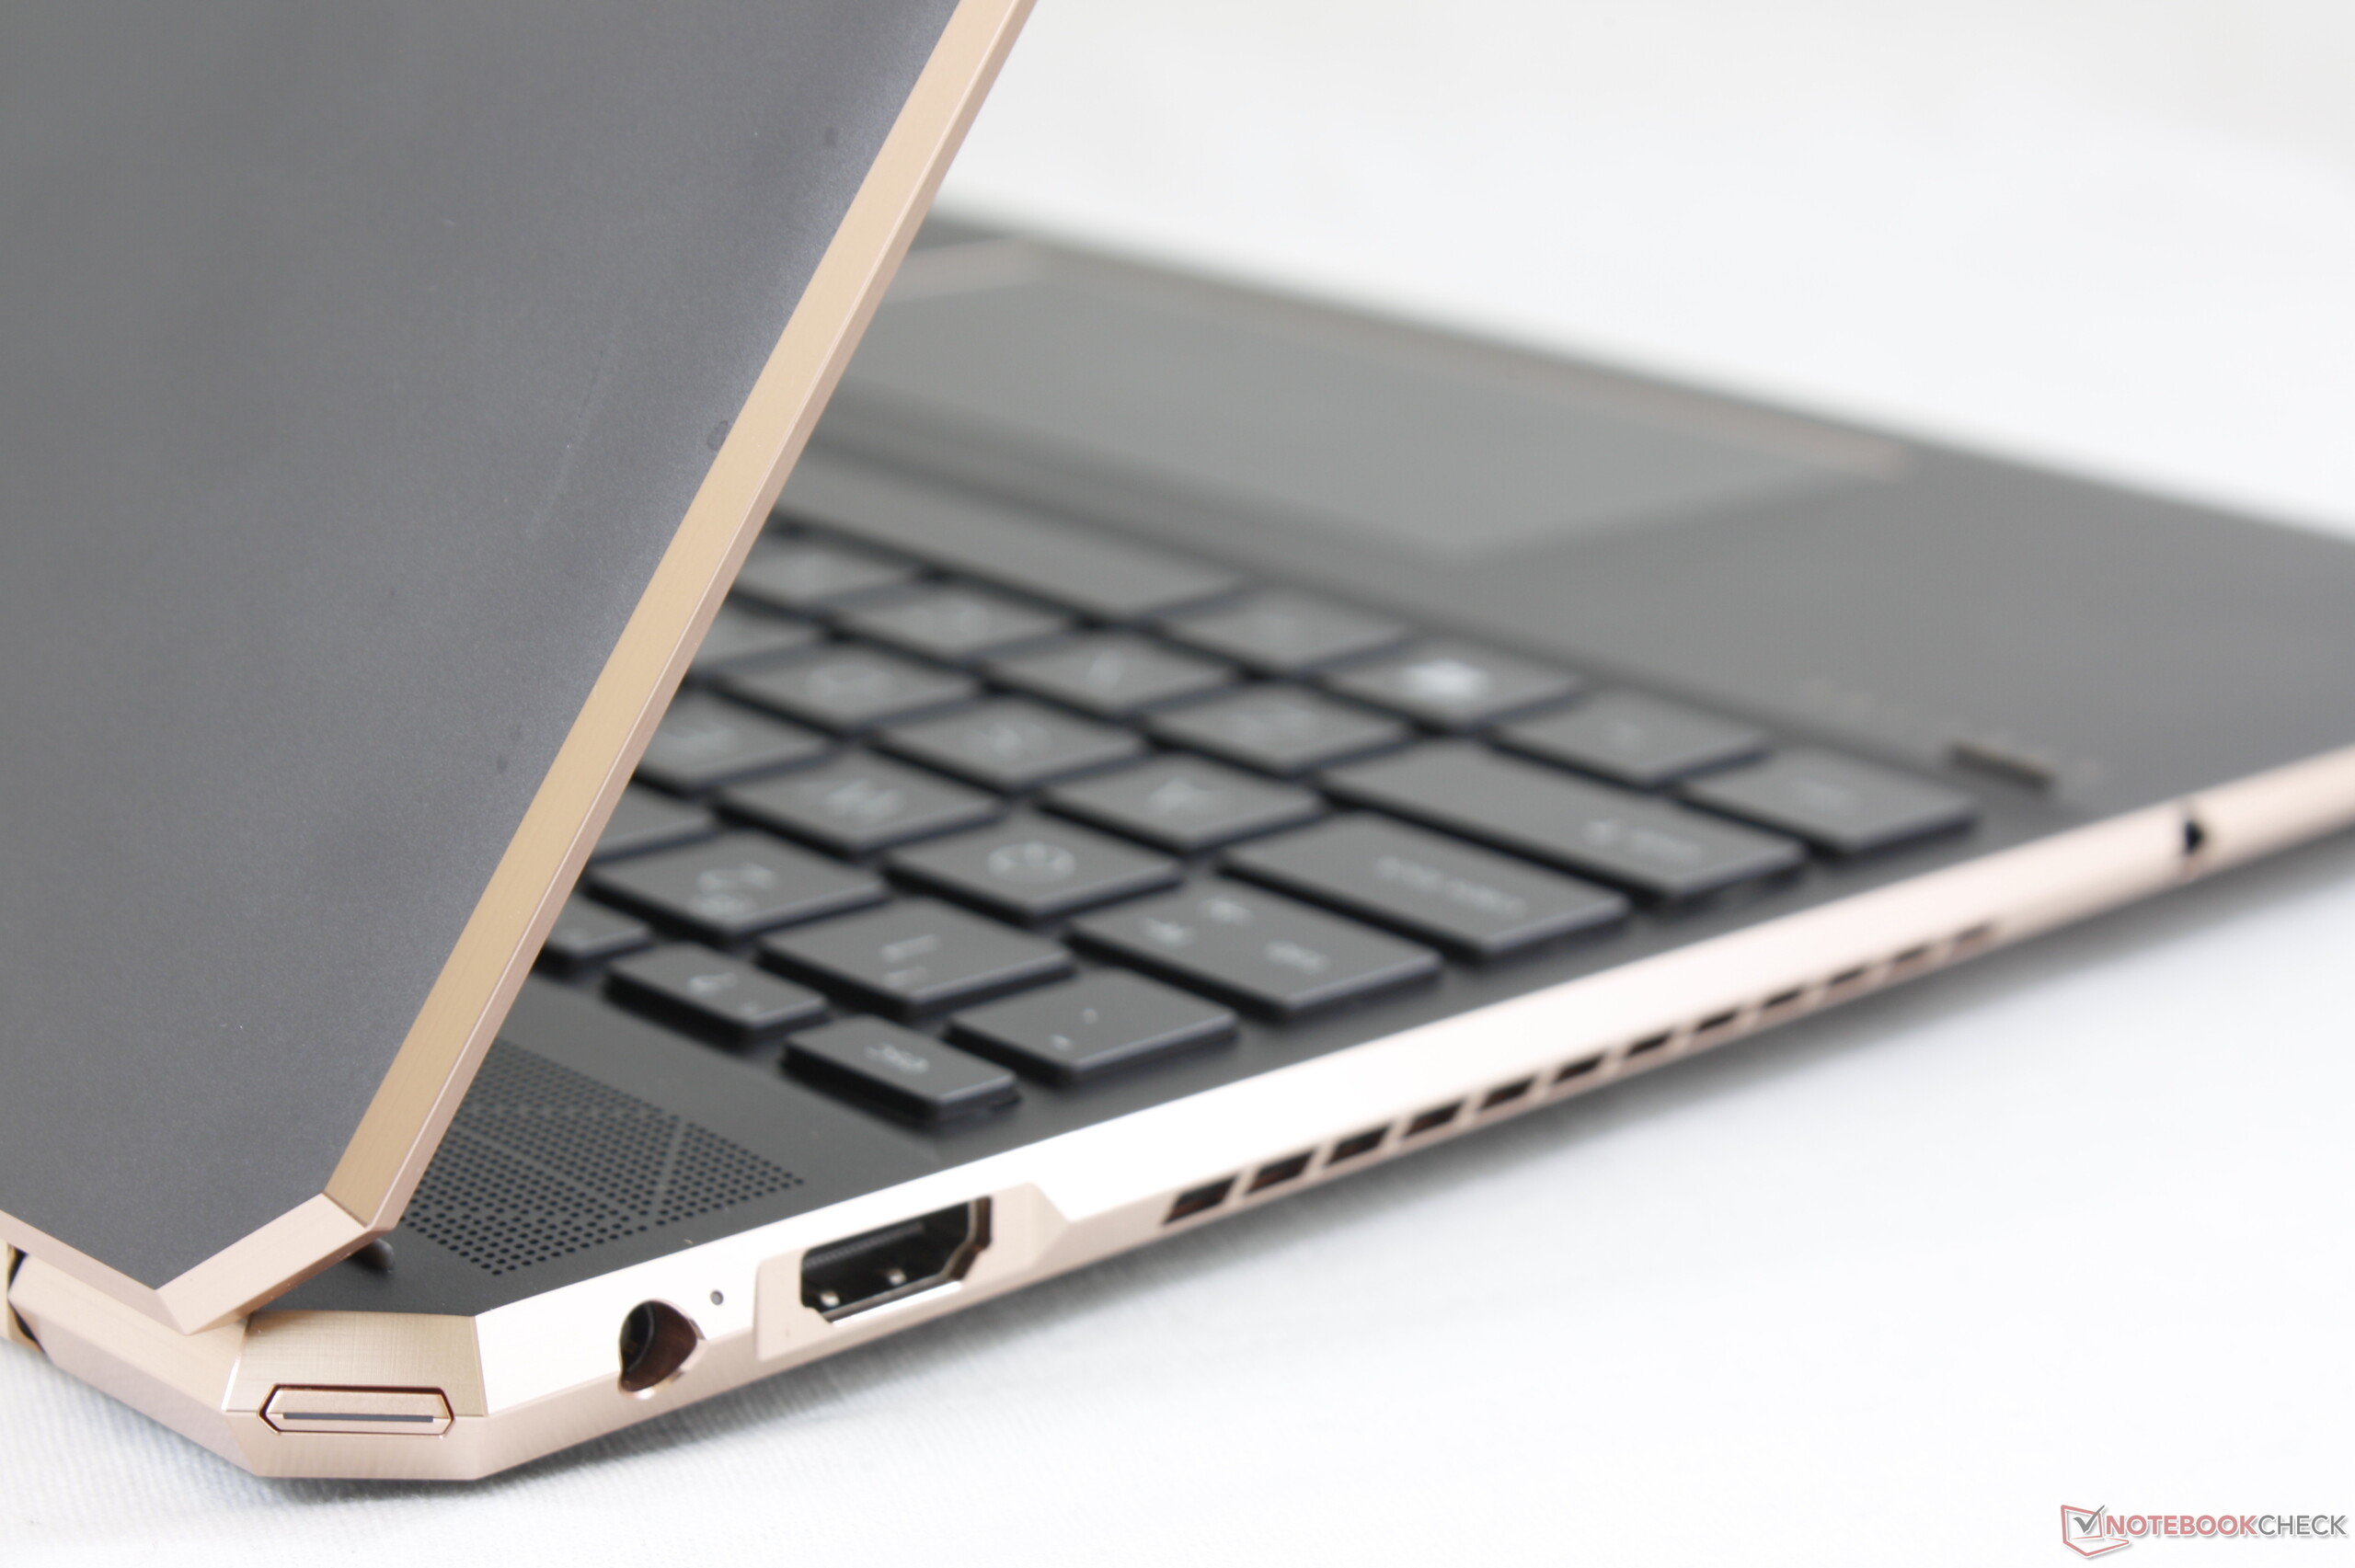
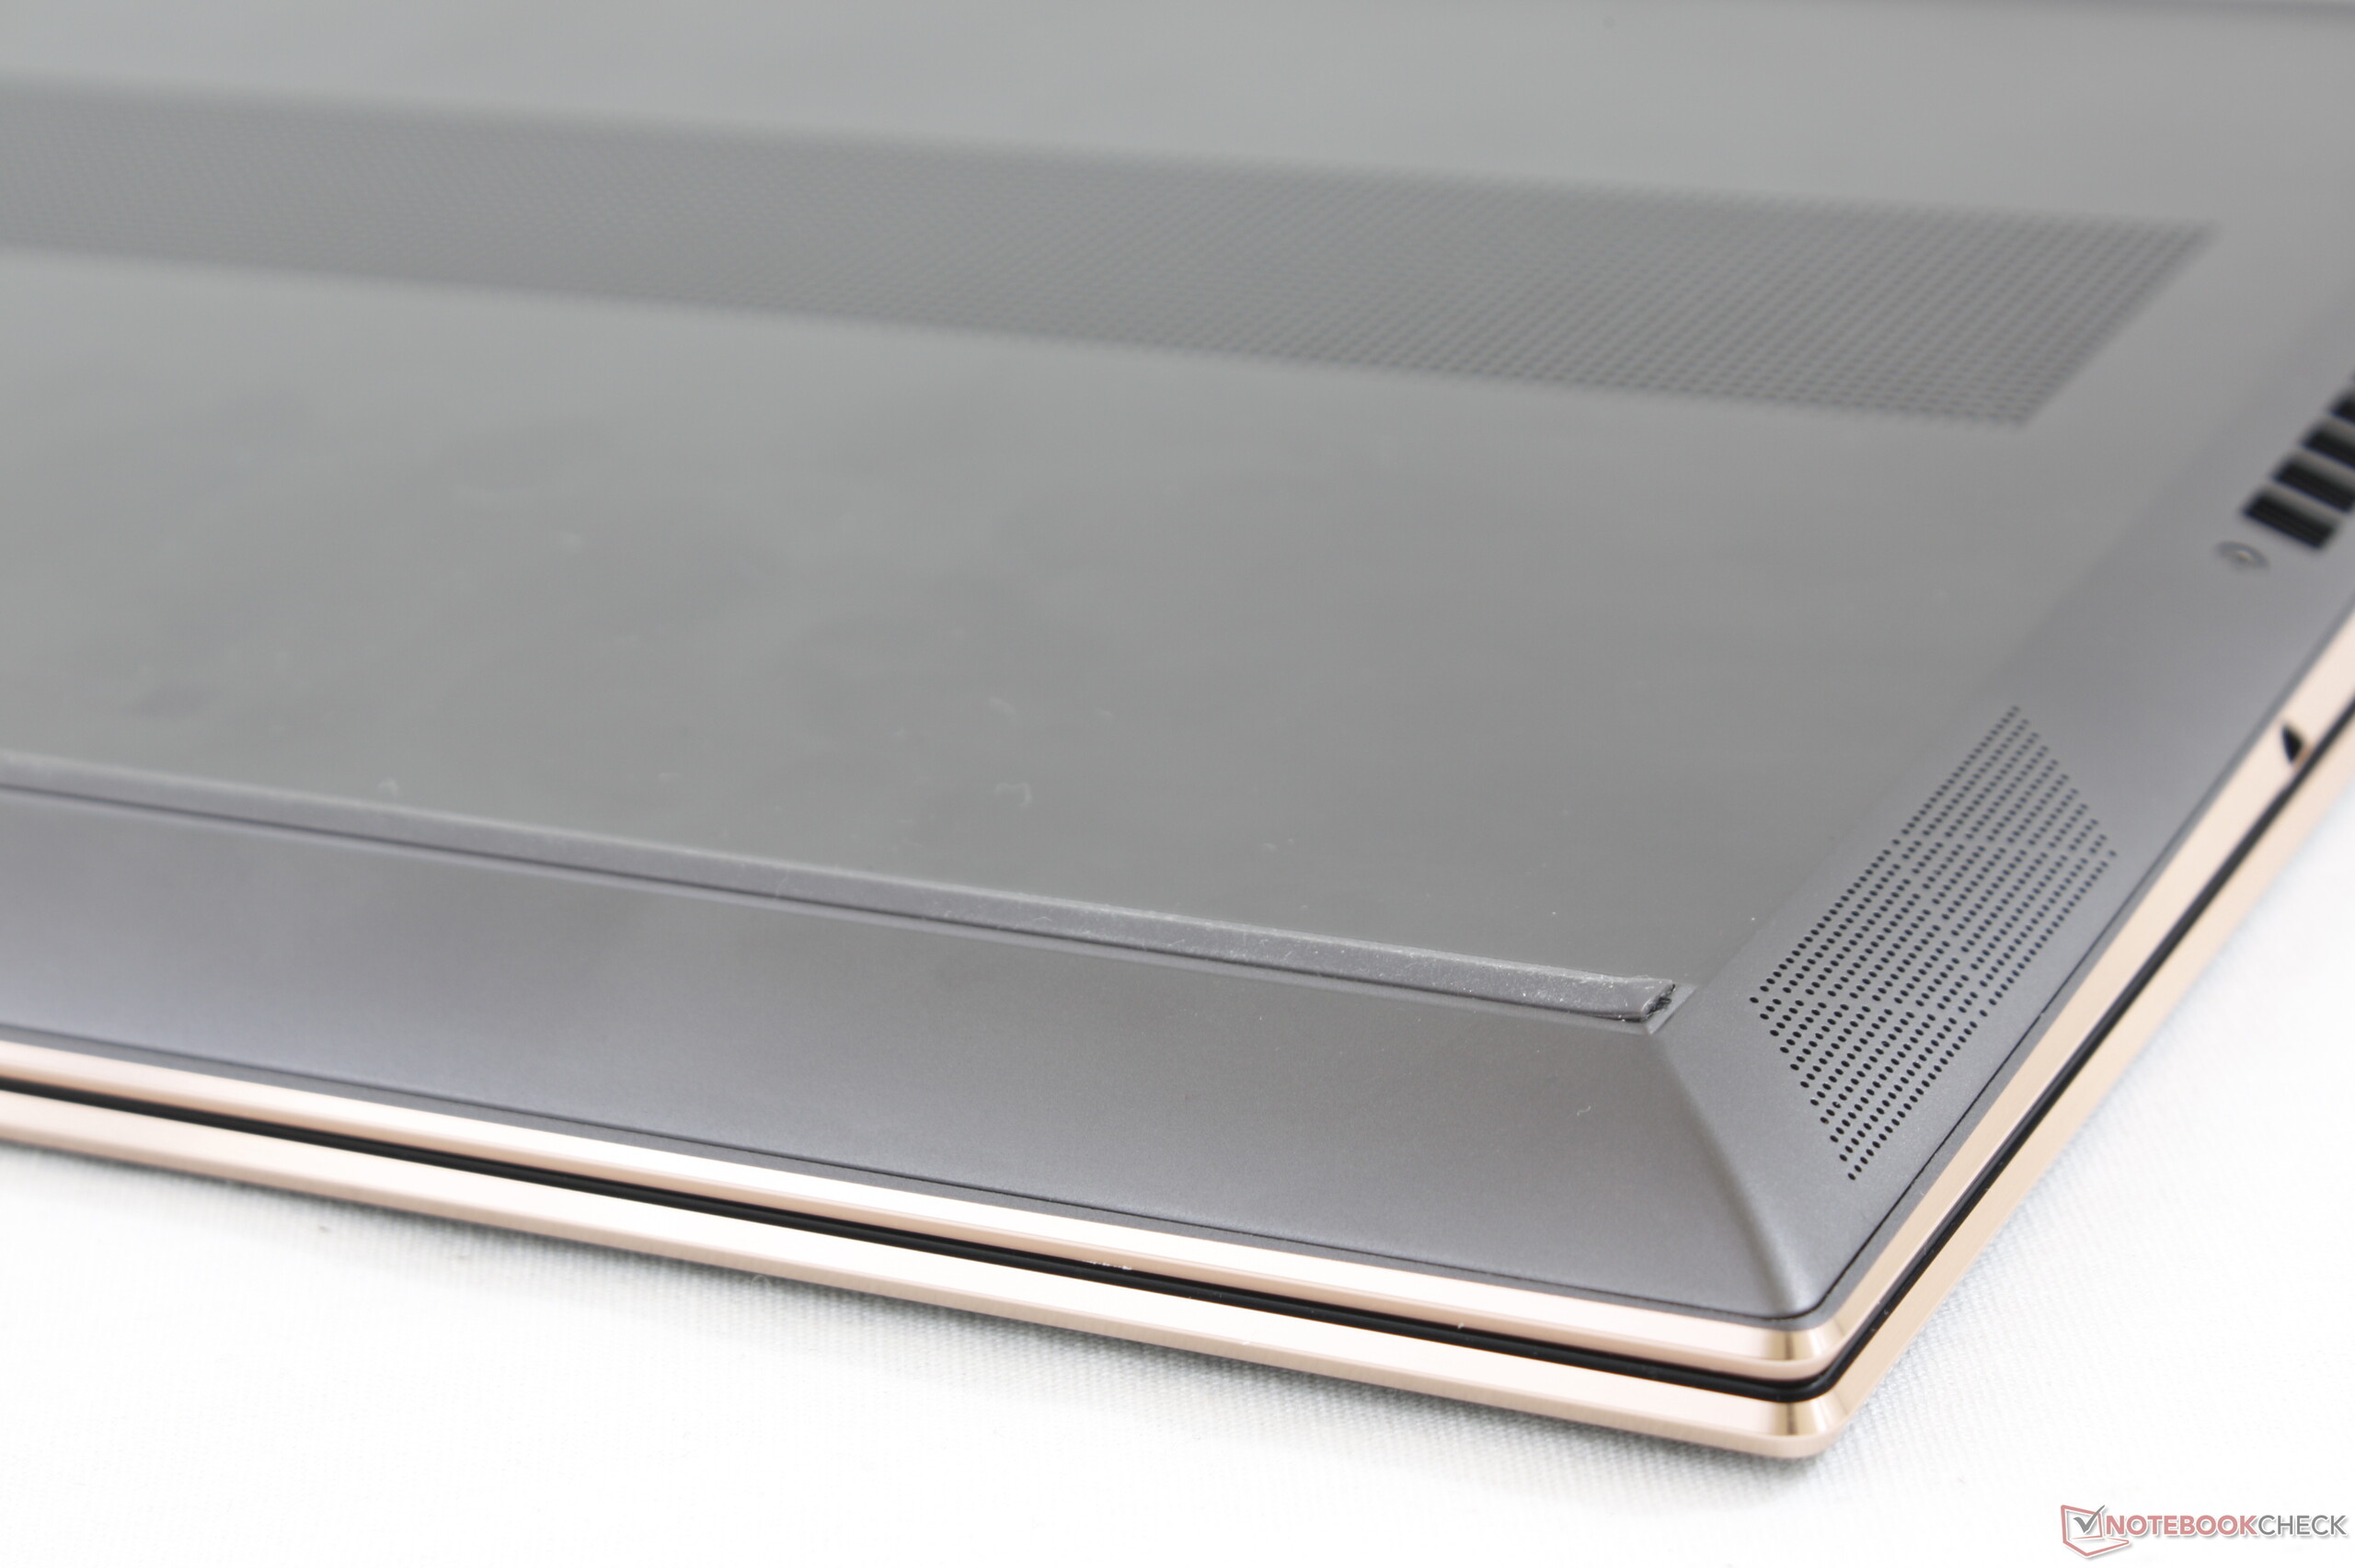
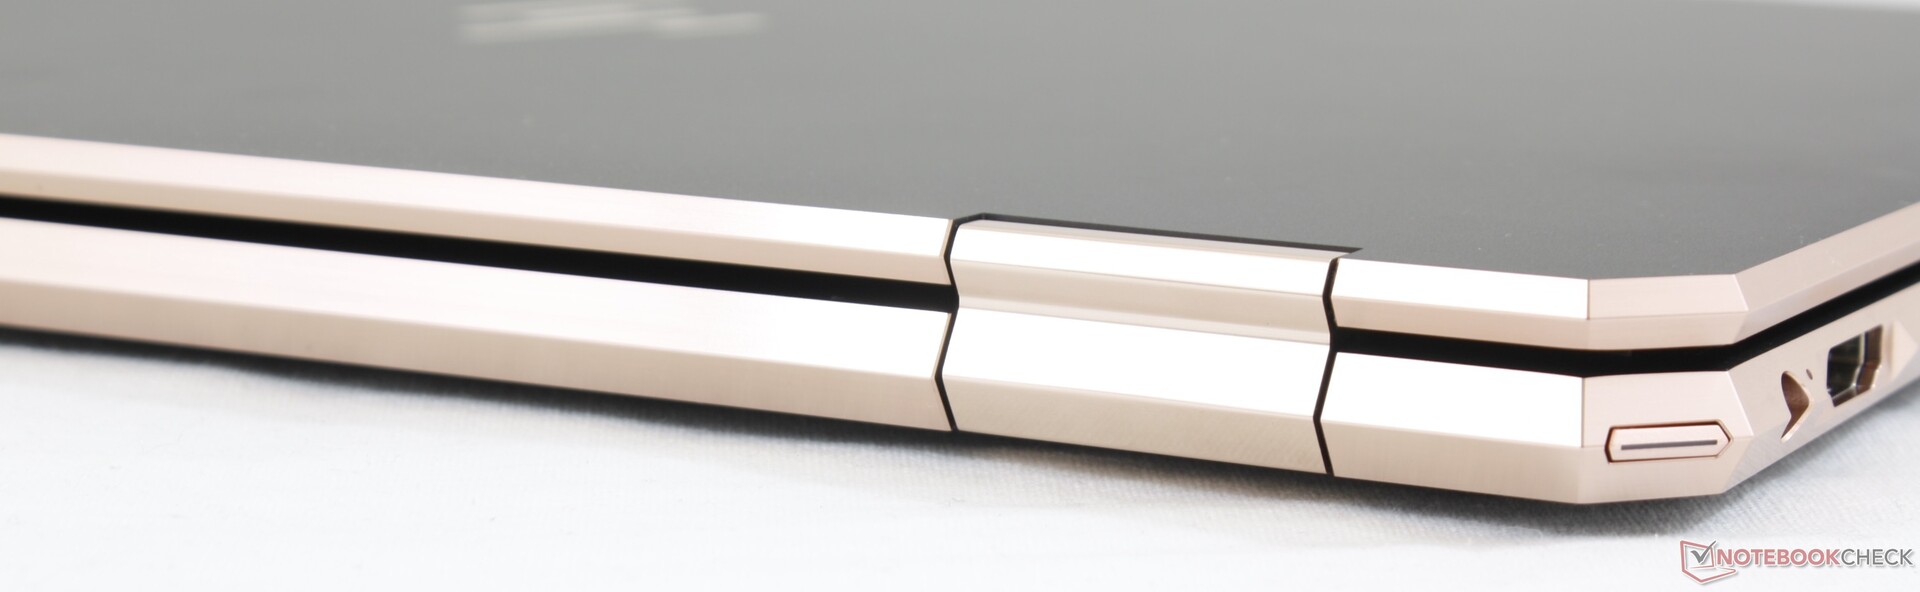
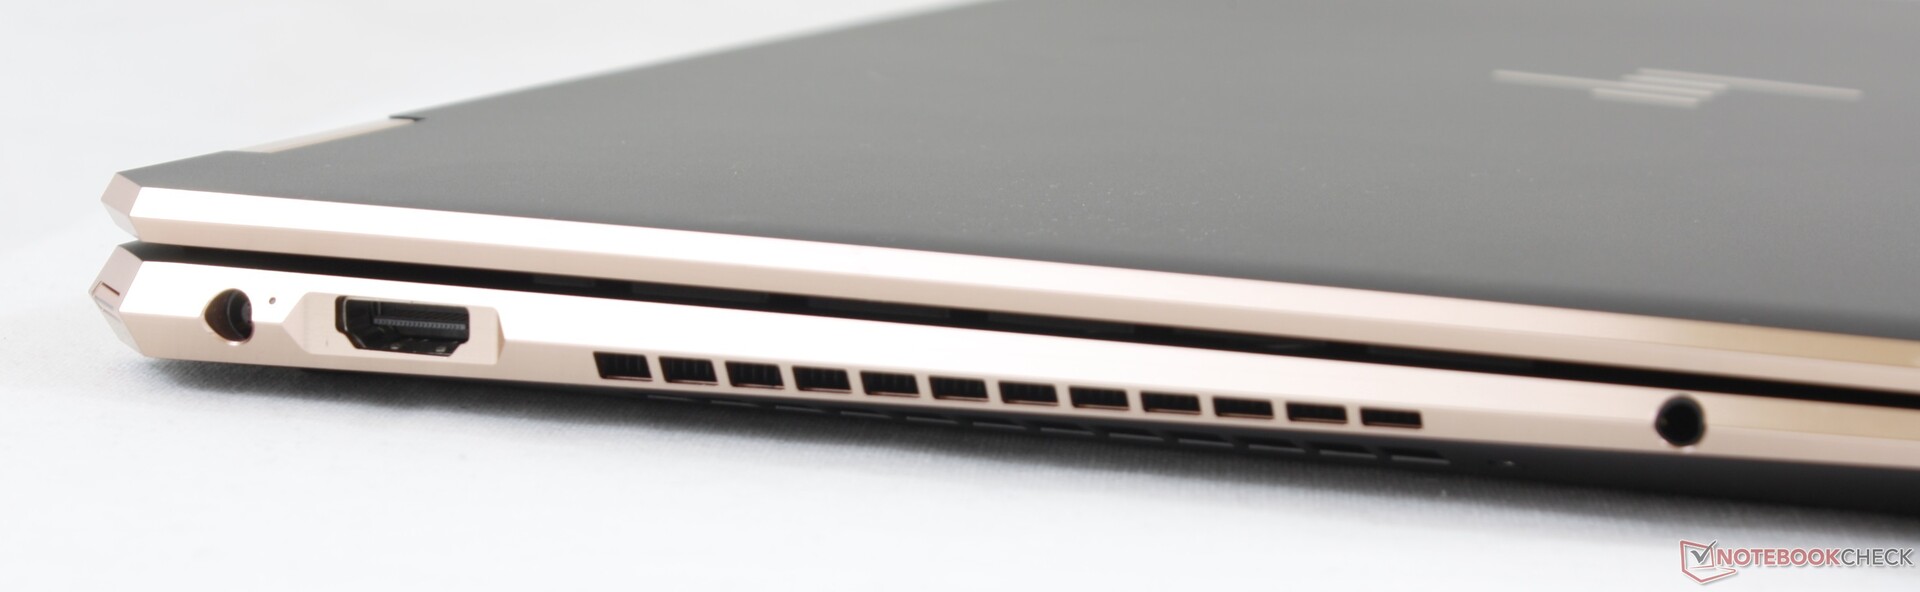
Si l’on passe outre ces limitations de performances, le Spectre x360 15 possède un excellent châssis, et s’avère être toujours l’un des convertibles de 15,6 pouces les plus robustes du marché. L’autonomie est plutôt longue et les ventilateurs plutôt discrets, lorsque l’appareil n’est pas trop sollicité.
Ceux qui sont prêts à attendre quelques mois devraient peut-être attendre que le Spectre x360 15 2020 arrive sur le marché, avec plus d’évolutions, dont des bordures d’écran bien plus étroites, et des processeurs hexacœur et une carte graphique GTX 1650 Max-Q Turing bien plus puissants.
L’intégralité de cette critique est disponible en anglais en suivant ce lien.
HP Spectre X360 15-5ZV31AV
- 01/16/2020 v7 (old)
Allen Ngo
Price comparison
