Critiques du AMD Ryzen 9 6900HX processeur
Test du Geekom AS 6 : mini PC ultime pour les pros et les joueurs avec Ryzen 9 6900HX et Radeon 680M
Le Geekom AS 6, successeur de l'AS 5, est entré dans l'arène et ce petit appareil ne manque pas de punch. L'AMD Ryzen 9 6900HX apporte la puissance et son iGPU puissant est suffisant pour une session de jeu occasionnelle. Mais ce n'est pas tout - le Geekom AS 6 a beaucoup plus à offrir. Vous pouvez lire tout ce qui est important dans cet article.
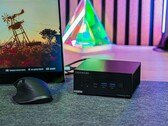
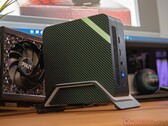
AMD Ryzen 9 6900HX, Radeon 680M, 753 gTest de l'Ace Magician AM08 Pro : test du mini PC avec Radeon 680M et Ryzen 9 6900HX !
Le Ace Magician AM08 Pro est le mini PC ultime pour les joueurs et tous ceux qui recherchent des performances maximales dans un boîtier très compact. Avec son processeur moderne et puissant AMD Ryzen 9 6900HX et la AMD Radeon 680M, il offre de nombreuses performances de jeu, tout en étant suffisamment petit pour se glisser dans n'importe quel sac. Découvrez dans cet examen approfondi avec de nombreux benchmarks ce que le Ace Magician AM08 Pro a de plus à offrir.
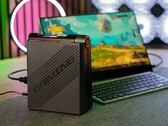
AMD Ryzen 9 6900HX, Radeon 680M, 874 gTest du Morefine M600 : Mini PC moderne avec AMD Ryzen 9 6900HX, 32 Go DDR5 et USB4
Le Morefine M600, équipé d'un AMD Ryzen 9 6900HX, est basé sur le dernier SoC Rembrandt d'AMD. Nous avons examiné ce modèle de plus près et comparé ses performances à celles de ses concurrents, qui disposent en partie d'un matériel similaire. Pour connaître le vainqueur de la course, nous vous invitons à lire cet article détaillé, qui présente une série de tests et de mesures.
AMD Ryzen 9 6900HX, Radeon 680M, 779 gTest du Minisforum Neptune HX99G : PC de jeu compact avec AMD Ryzen 9 6900HX et Radeon RX 6600M, USB4 et Thunderbolt
Ceux qui sont actuellement à la recherche d'un PC de jeu compact devraient certainement regarder de plus près la série Neptune HX99G de Minisforum. Découvrez dans cette revue ce que ce petit PC de bureau équipé d'un AMD Ryzen 9 6900HX et d'un AMD Radeon RX 6600M dédié est capable de faire. En ce qui concerne les connexions, avec USB4 et Thunderbolt les standards les plus actuels sont également inclus.
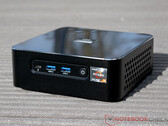
AMD Ryzen 9 6900HX, Radeon RX 6600M, 1.6 kgTest du Minisforum Venus Series UM690 : petit PC de bureau avec Ryzen 9 6900HX et USB4
Le fabricant chinois de systèmes Minisforum propose une pléthore de PC de bureau compacts adaptés à un large éventail d'applications. L'UM690 de la série Venus utilise le dernier SoC Rembrandt d'AMD et prend en charge USB4 et Thunderbolt. Dans cet examen approfondi avec de nombreux benchmarks et mesures, nous vous dirons quels sont les avantages de cet appareil et comment il se positionne par rapport à la concurrence.
AMD Ryzen 9 6900HX, Radeon 680M, 621 gAlienware m17 R5 (R9 6900HX, RX 6850M XT): AMD Radeon RX 6850M XT, 17.00", 3.4 kg
Critique » Test de l'Alienware m17 R5 : gamer AMD au gros potentiel, mais avec des problèmes de pilotes
Beelink GTR6: AMD Radeon 680M, 0.8 kg
Critique » Test du mini PC Beelink GTR6 Ryzen 9 6900HX : Plus rapide que la plupart des NUC d'Intel
Schenker XMG Neo 15 (Ryzen 9 6900HX, RTX 3070 Ti): NVIDIA GeForce RTX 3070 Ti Laptop GPU, 15.60", 2.3 kg
Critique » Test du Schenker XMG Neo 15 : Ryzen 6000 avec ports de refroidissement liquide
Lenovo ThinkBook 16p G3 ARH: NVIDIA GeForce RTX 3060 Laptop GPU, 16.00", 2.1 kg
Critique » Test du Lenovo ThinkBook 16p Gen 3 ARH : le challenger du Dell XPS 15
Lenovo Legion 7 16ARHA7: AMD Radeon RX 6850M XT, 16.00", 2.6 kg
Critique » Test du Lenovo Legion 7 16ARHA7 : les débuts de la Radeon RX 6850M XT
Schenker XMG Neo 17 M22: NVIDIA GeForce RTX 3080 Ti Laptop GPU, 17.00", 2.8 kg
Critique » Test du Schenker XMG Neo 17 M22 : jeu hautes performances et touches mécaniques Cherry MX
Asus ROG Zephyrus Duo 16 GX650RX: NVIDIA GeForce RTX 3080 Ti Laptop GPU, 16.00", 2.6 kg
Critique » Test de l'Asus ROG Zephyrus Duo 16 : PC portable de jeu inhabituel avec une bonne autonomie
Razer Blade 14 Ryzen 9 6900HX: NVIDIA GeForce RTX 3070 Ti Laptop GPU, 14.00", 1.8 kg
Critique » Test du Razer Blade 14 : les débuts de l'AMD Ryzen 9 6900HX
Alienware m17 R5 (R9 6900HX, RX 6850M XT): AMD Radeon RX 6850M XT, 17.00", 3.4 kg
Autres tests » Alienware m17 R5 (R9 6900HX, RX 6850M XT)
HP Omen 16-n0007ns: NVIDIA GeForce RTX 3070 Ti Laptop GPU, 16.10", 2.3 kg
Autres tests » HP Omen 16-n0007ns
HP Omen 16-n0598nd: NVIDIA GeForce RTX 3070 Ti Laptop GPU, 16.00", 2.3 kg
Autres tests » HP Omen 16-n0598nd
Asus VivoBook Pro 16X M7600RE: NVIDIA GeForce RTX 3050 Ti Laptop GPU, 16.00", 2 kg
Autres tests » Asus VivoBook Pro 16X M7600RE
Lenovo Legion S7 16ARHA7: AMD Radeon RX 6800S, 16.00", 2.2 kg
Autres tests » Lenovo Legion S7 16ARHA7
Lenovo ThinkBook 16p G3 ARH: NVIDIA GeForce RTX 3060 Laptop GPU, 16.00", 2.1 kg
Autres tests » Lenovo ThinkBook 16p G3 ARH
Asus ROG Strix G17 G713RW-LL009: NVIDIA GeForce RTX 3070 Ti Laptop GPU, 17.30", 2.8 kg
Autres tests » Asus ROG Strix G17 G713RW-LL009
Lenovo Legion 7 16ARHA7: AMD Radeon RX 6850M XT, 16.00", 2.6 kg
Autres tests » Lenovo Legion 7 16ARHA7
Alienware m17 R5, 6900HX RX 6850M XT: AMD Radeon RX 6850M XT, 17.30", 3.3 kg
Autres tests » Alienware m17 R5, 6900HX RX 6850M XT
Schenker XMG Neo 17 M22: NVIDIA GeForce RTX 3080 Ti Laptop GPU, 17.00", 2.8 kg
Autres tests » Schenker XMG Neo 17 M22
Razer Blade 14 Ryzen 9 RTX 3080 Ti: NVIDIA GeForce RTX 3080 Ti Laptop GPU, 14.00", 1.8 kg
Autres tests » Razer Blade 14 Ryzen 9 RTX 3080 Ti
Alienware m17 R5, 6900HX RTX 3070 Ti : NVIDIA GeForce RTX 3070 Ti Laptop GPU, 17.30", 3.3 kg
Autres tests » Alienware m17 R5, 6900HX RTX 3070 Ti
Razer Blade 14 Ryzen 9 6900HX: NVIDIA GeForce RTX 3070 Ti Laptop GPU, 14.00", 1.8 kg
Autres tests » Razer Blade 14 Ryzen 9 6900HX
Asus ROG Zephyrus Duo 16 GX650RX: NVIDIA GeForce RTX 3080 Ti Laptop GPU, 16.00", 2.6 kg
Autres tests » Asus ROG Zephyrus Duo 16 GX650RX
Asus ROG Strix G17 G713RW-LL103W: NVIDIA GeForce RTX 3070 Ti Laptop GPU, 17.30", 2.8 kg
Autres tests » Asus ROG Strix G17 G713RW-LL103W
Asus ROG Strix G15 G513RW-HQ021W: NVIDIA GeForce RTX 3070 Ti Laptop GPU, 15.60", 2.3 kg
Autres tests » Asus ROG Strix G15 G513RW-HQ021W
Alienware m17 R5, 6900HX RTX 3060: NVIDIA GeForce RTX 3060 Laptop GPU, 17.30", 3.3 kg
Autres tests » Alienware m17 R5, 6900HX RTX 3060
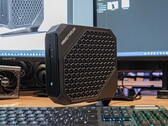
ACEMagician Ace Magician AM08 Pro: AMD Radeon 680M, 0.9 kg
» Chatreey AM08 : Mini-PC rafraîchi avec les options AMD Ryzen 9 6900HX et Ryzen 7 7735HS
Lenovo Legion 7 16ARHA7: AMD Radeon RX 6850M XT, 16.00", 2.6 kg
» La Radeon RX 6850M XT est plus rapide que de nombreux ordinateurs portables RTX 3080 Ti GeForce, mais la consommation d'énergie peut être hors normes
Razer Blade 14 Ryzen 9 6900HX: NVIDIA GeForce RTX 3070 Ti Laptop GPU, 14.00", 1.8 kg
» AMD Ryzen 9 6900HX vs. Core i7-12800H : Intel a toujours l'avantage