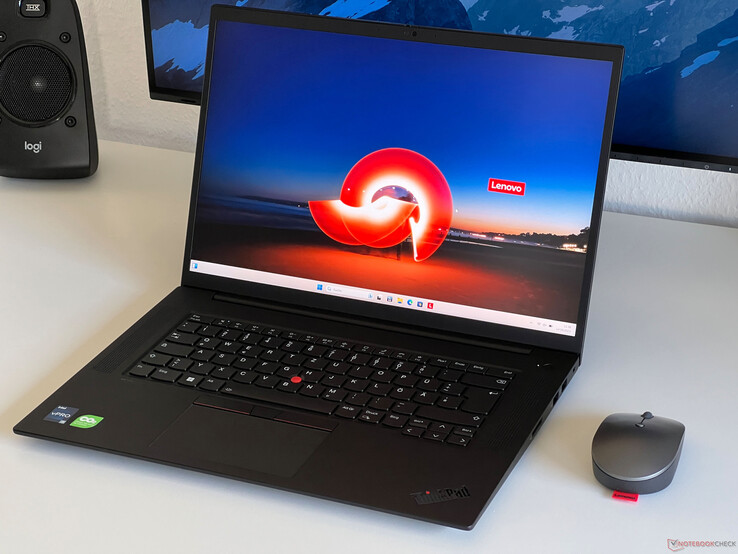
Test du Lenovo ThinkPad P1 G6 : station de travail mobile à la place du ThinkPad X1 Extreme
Pendant des années, Lenovo a proposé deux grands modèles de 16 pouces dans sa gamme : le Lenovo ThinkPad X1 Extreme et sa station de travail de conception identique, le ThinkPad P1. Aujourd'hui, la gamme a été rationalisée et le nouveau ThinkPad P1 Gen 6 reprend immédiatement les deux rôles. Il n'y a pas de successeur au ThinkPad X1 Extreme Gen 5 de l'année dernière. Le nouveau ThinkPad P1 Gen 6 est disponible avec les GPU grand public GeForce et les adaptateurs graphiques professionnels, ce qui offre une grande souplesse de choix. Notamment, le design du boîtier reste largement inchangé et deux modèles de base sont toujours proposés. Selon la carte graphique choisie, un refroidissement conventionnel ou une chambre à vapeur (pour GeForce RTX 4060/RTX 3500 Ada) sont utilisés.
La gamme de composants du ThinkPad P1 Gen 6 est très étendue. Il utilise toujours les derniers processeurs Raptor-Lake de 45 watts d'Intel, et les options de carte graphique vont de la RTX 1000 Ada à la RTX 5000 Ada (ou GeForce RTX 4060, 4080, ou 4090). Cette grande variété se traduit par des écarts de prix considérables. Le modèle de base, équipé d'un Core i7-13700H, de 32 Go de RAM et de la RTX 1000 Ada, démarre actuellement à environ 2850 USD. Cependant, les prix peuvent facilement dépasser les 6 350 USD pour les configurations plus haut de gamme avec Core i9, RTX 5000 Ada, 96 Go de RAM et un écran OLED.
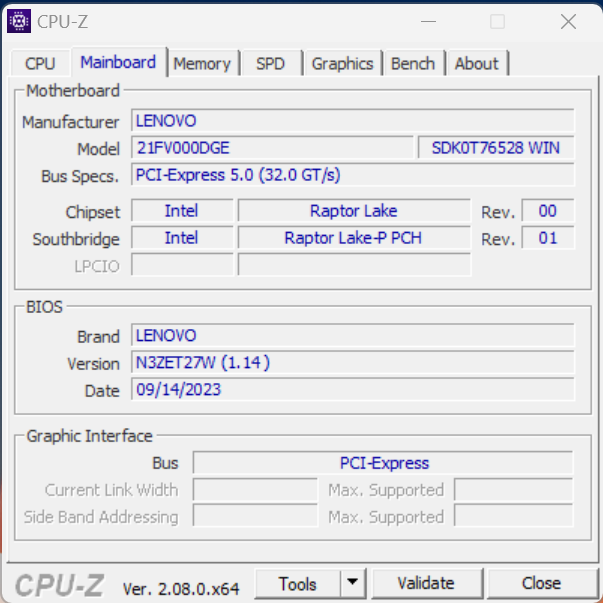
Notre appareil de test, identifié par le numéro de produit 21FV000DGE, est actuellement vendu à environ 3 400 USD. Il est équipé d'un Core i9-13900HrTX 2000 Ada, 32 Go de RAM et un disque dur SSD de 1 To. En outre, il est équipé en option d'un écran WQHD IPS avec un taux de rafraîchissement de 165 Hz. Les personnes ayant accès au programme Campus de Lenovo peuvent se procurer ce modèle pour environ 3 000 USD.
Comparaison avec les concurrents potentiels
Note | Date | Modèle | Poids | Épaisseur | Taille | Résolution | Prix |
|---|---|---|---|---|---|---|---|
| 91.7 % v7 (old) | 10/23 | Lenovo ThinkPad P1 G6-21FV000DGE i9-13900H, RTX 2000 Ada Generation Laptop | 1.9 kg | 17.5 mm | 16.00" | 2560x1600 | |
| 89 % v7 (old) | 08/23 | Dell Precision 5000 5680 i9-13900H, RTX 5000 Ada Generation Laptop | 2.3 kg | 22.17 mm | 16.00" | 3840x2400 | |
| 88.8 % v7 (old) | 05/23 | Samsung Galaxy Book3 Ultra 16, i9-13900H RTX 4070 i9-13900H, GeForce RTX 4070 Laptop GPU | 1.8 kg | 16.8 mm | 16.00" | 2880x1800 | |
| 90.1 % v7 (old) | 11/22 | HP ZBook Studio 16 G9 62U04EA i7-12800H, RTX A2000 Laptop GPU | 1.8 kg | 19 mm | 16.00" | 3840x2400 | |
| 84.3 % v7 (old) | 11/22 | MSI CreatorPro Z16P B12UKST i7-12700H, RTX A3000 Laptop GPU | 2.4 kg | 19 mm | 16.00" | 2560x1600 | |
| 88.6 % v7 (old) | 07/23 | Schenker VISION 16 Pro (M23) i7-13700H, GeForce RTX 4070 Laptop GPU | 1.6 kg | 17.1 mm | 16.00" | 2560x1600 |
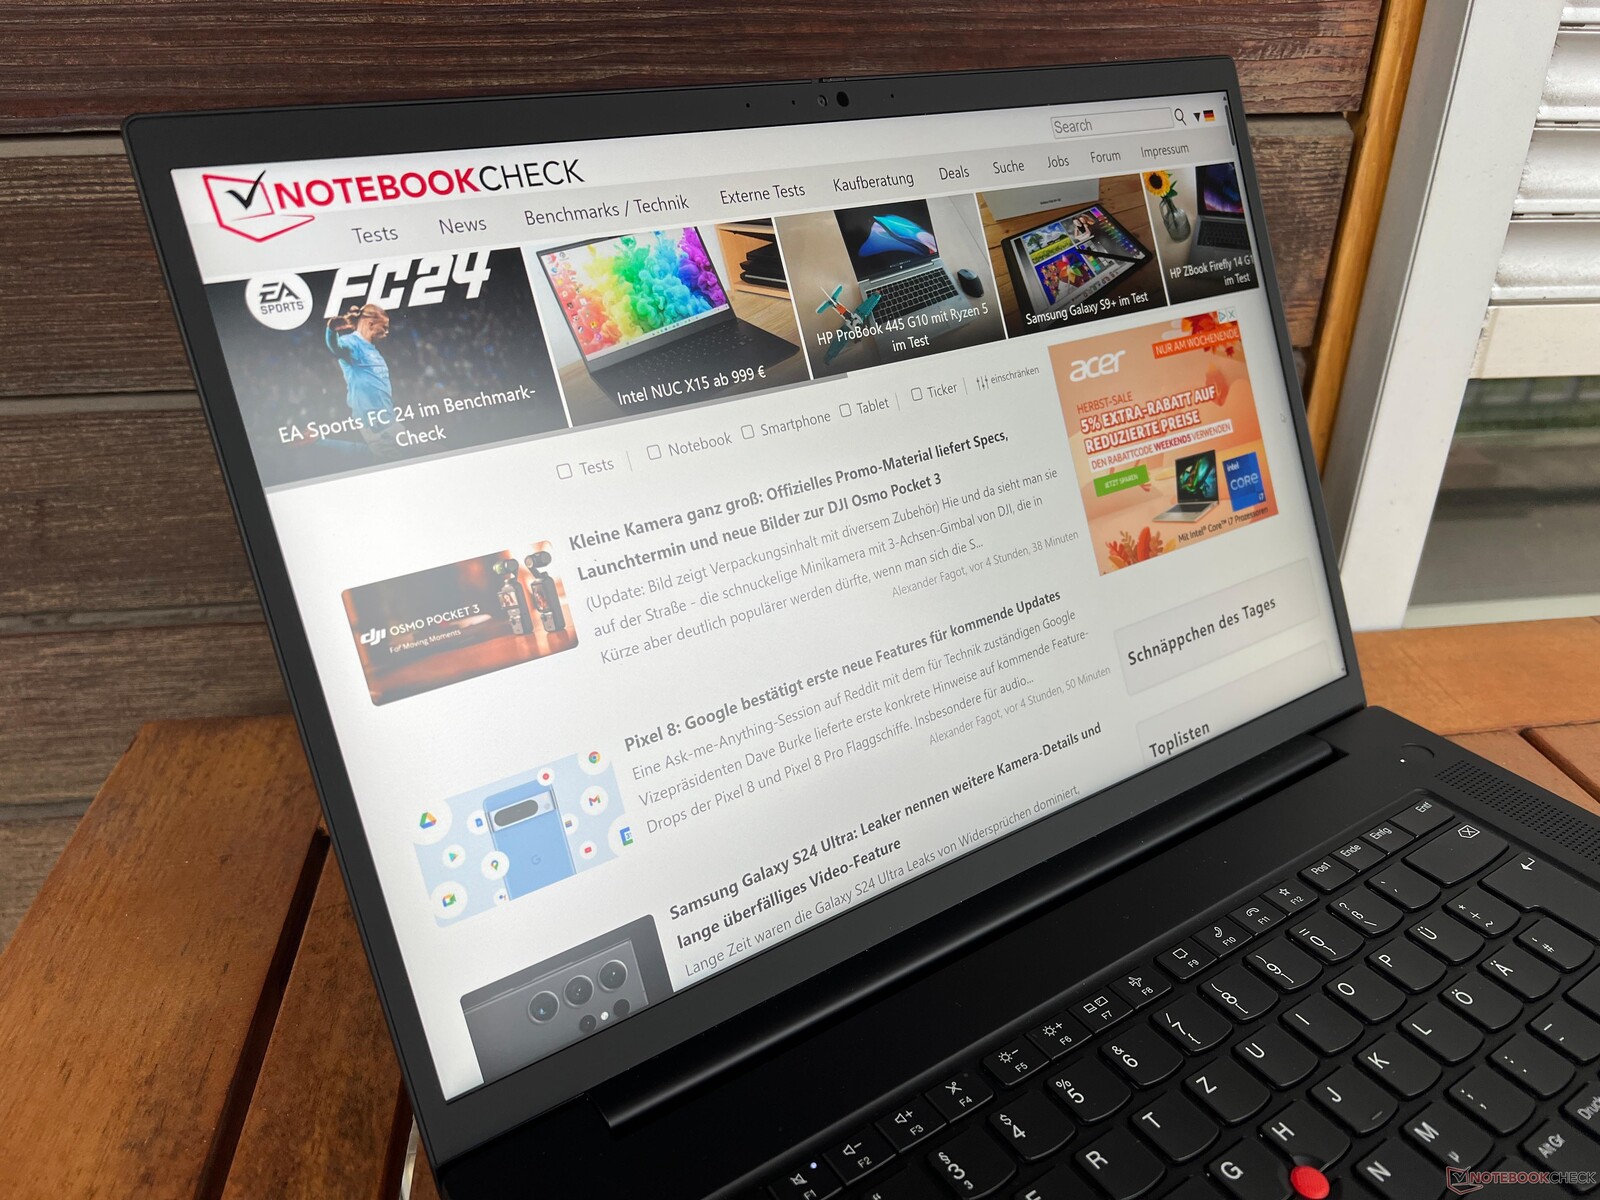
Boîtier - La stabilité est assurée par la fibre de carbone et le magnésium
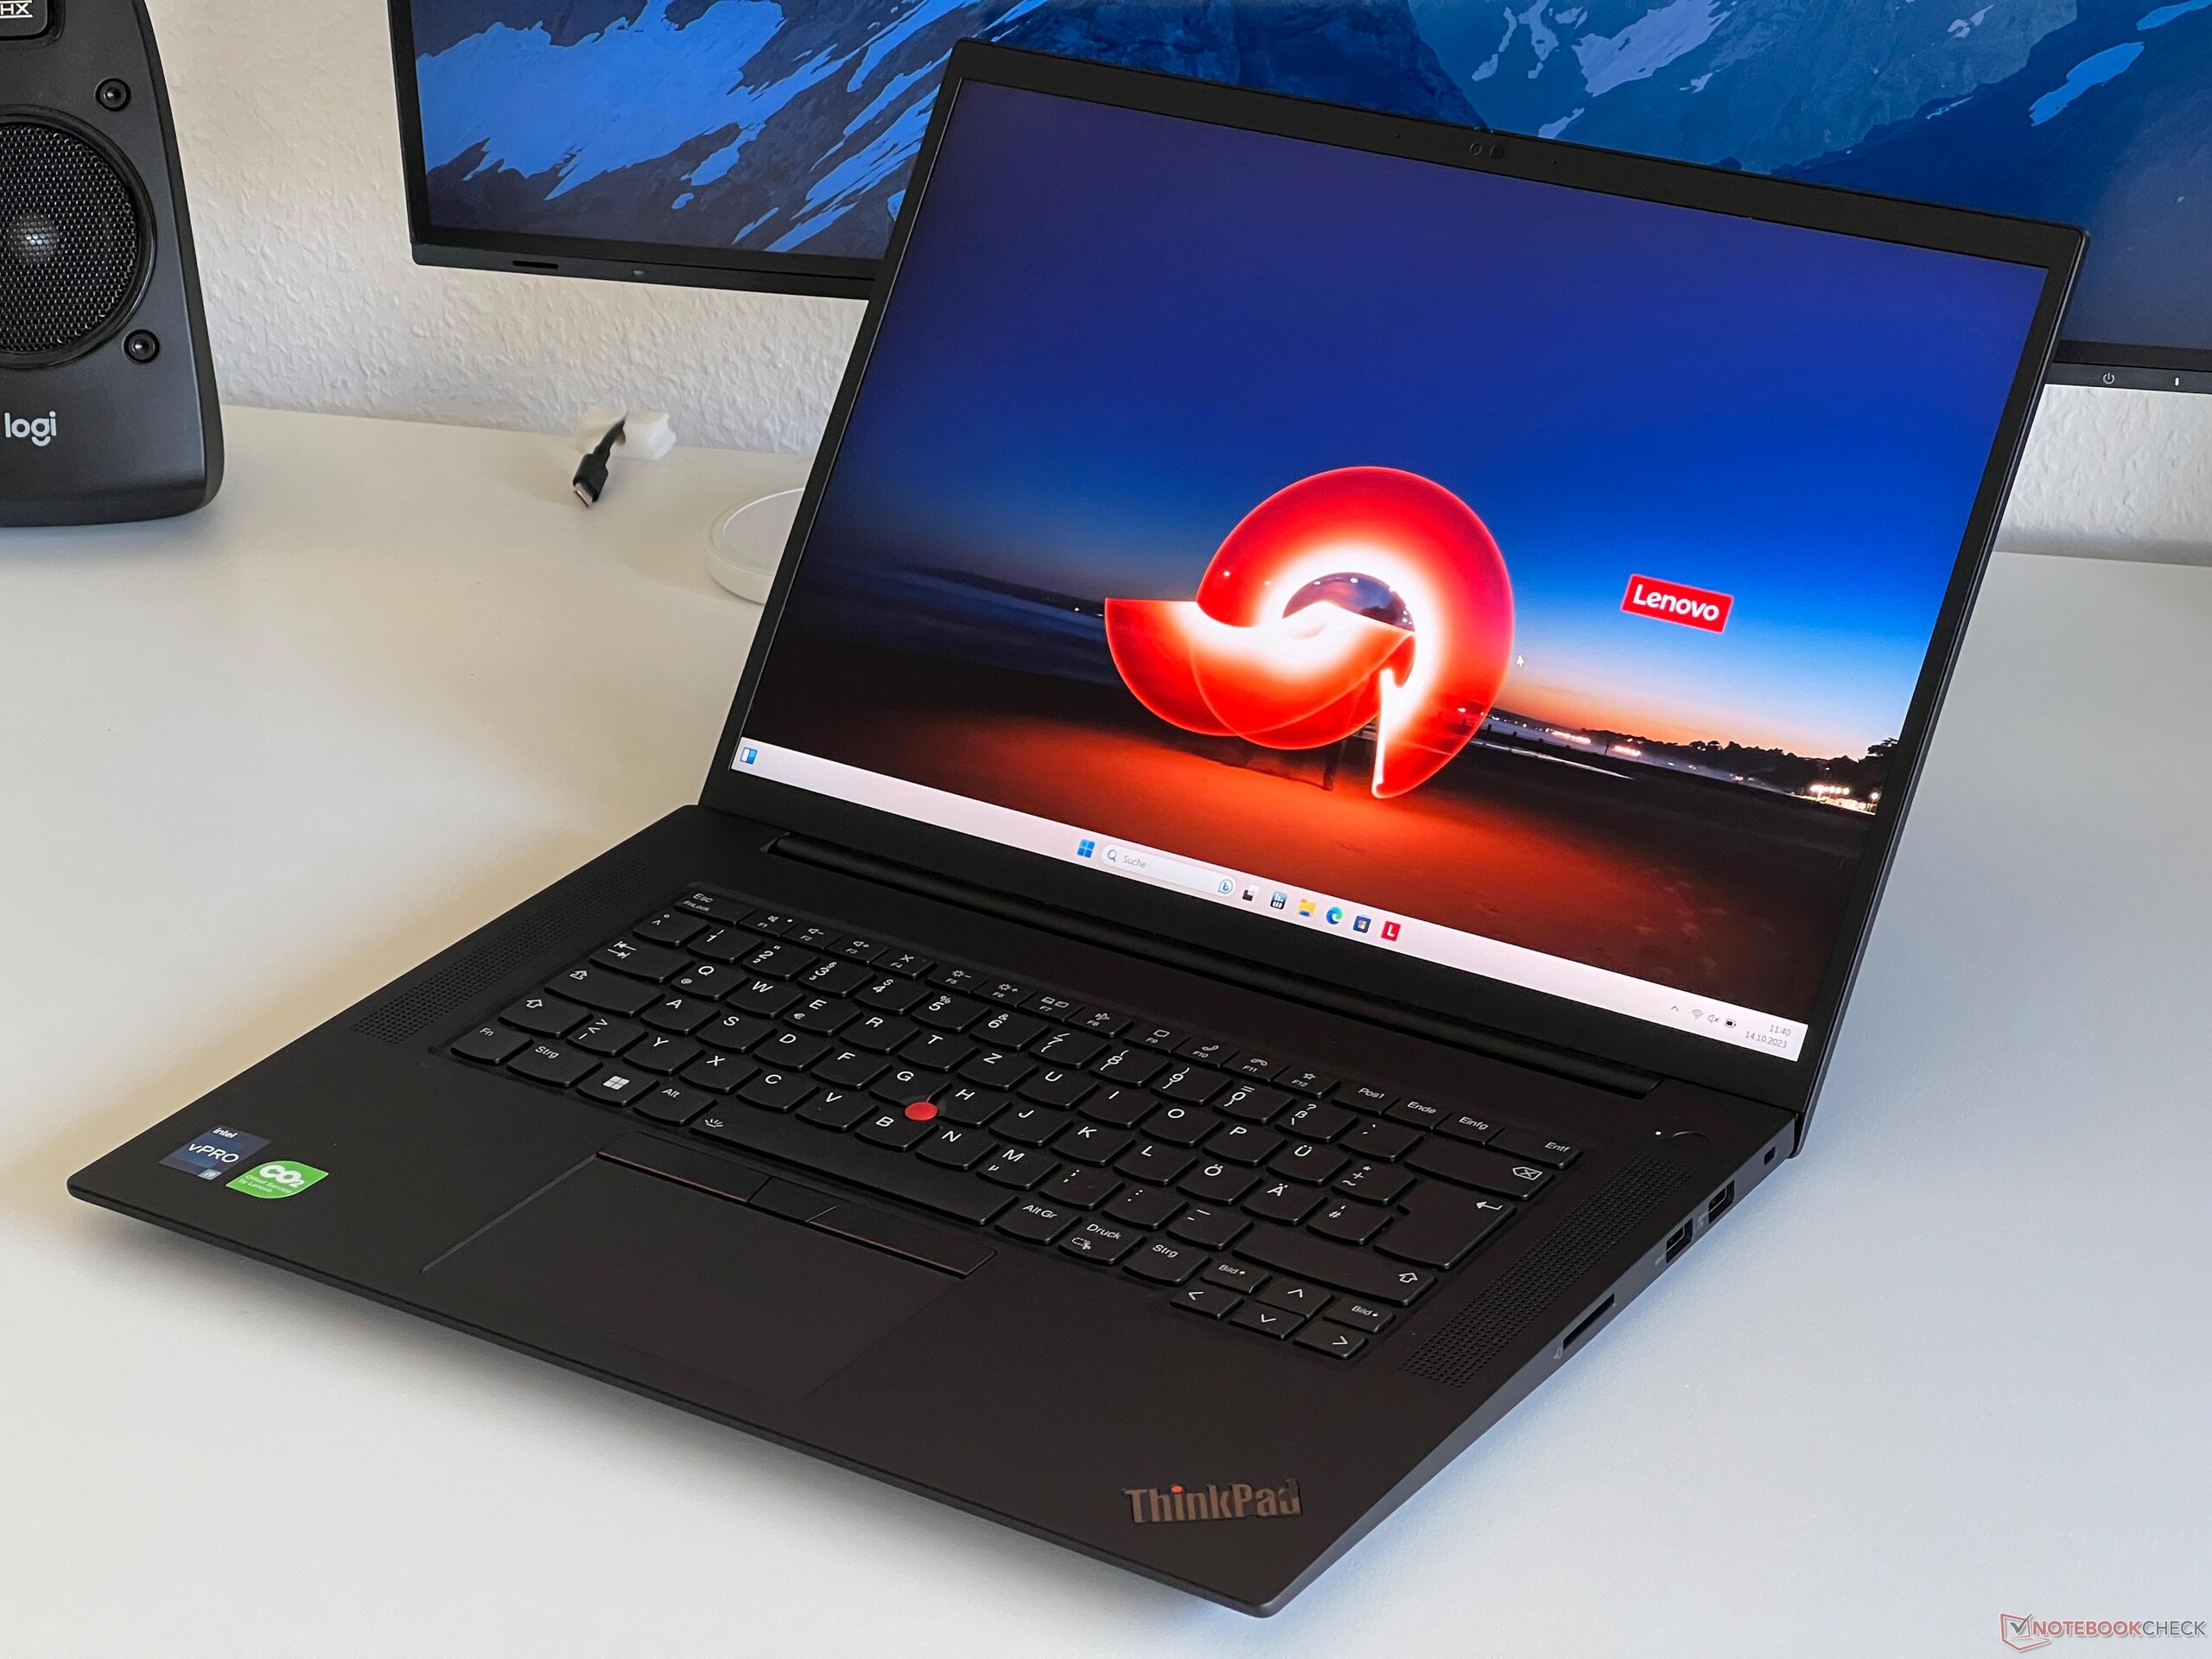
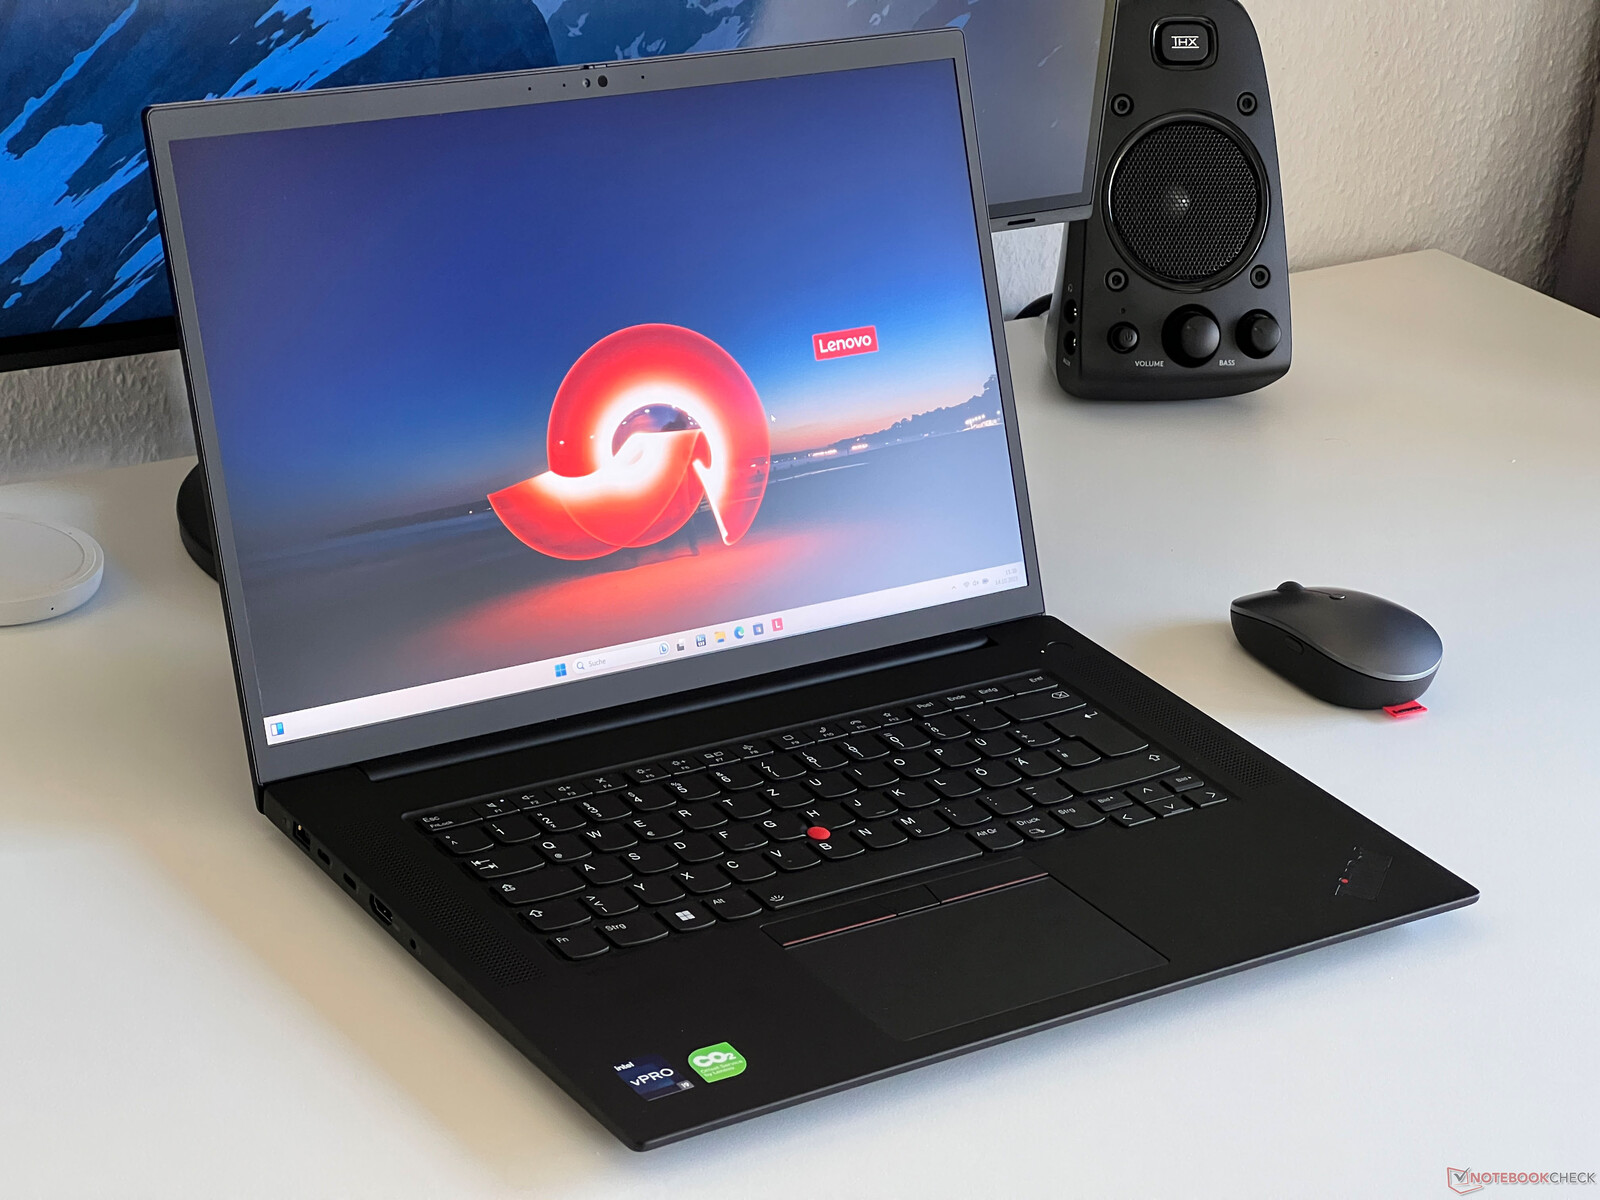
Lenovo conserve le design bien connu du ThinkPad P1 Gen 6, en cohérence avec ses prédécesseurs, les générations G4 et G5. Le design noir peut être perçu comme simple ou peu attrayant, selon le point de vue de chacun. Néanmoins, l'identité distinctive du ThinkPad reste incontestable. Les modèles dotés d'un écran OLED continuent de présenter un couvercle d'écran avec un motif en fibre de carbone, bien qu'il s'agisse d'un motif imprimé plutôt que d'une véritable fibre de carbone. Dans l'ensemble, le design conserve un aspect contemporain, mais les surfaces lisses sont susceptibles de s'encrasser et de se graisser au fil du temps, ce qui nécessite un nettoyage régulier.
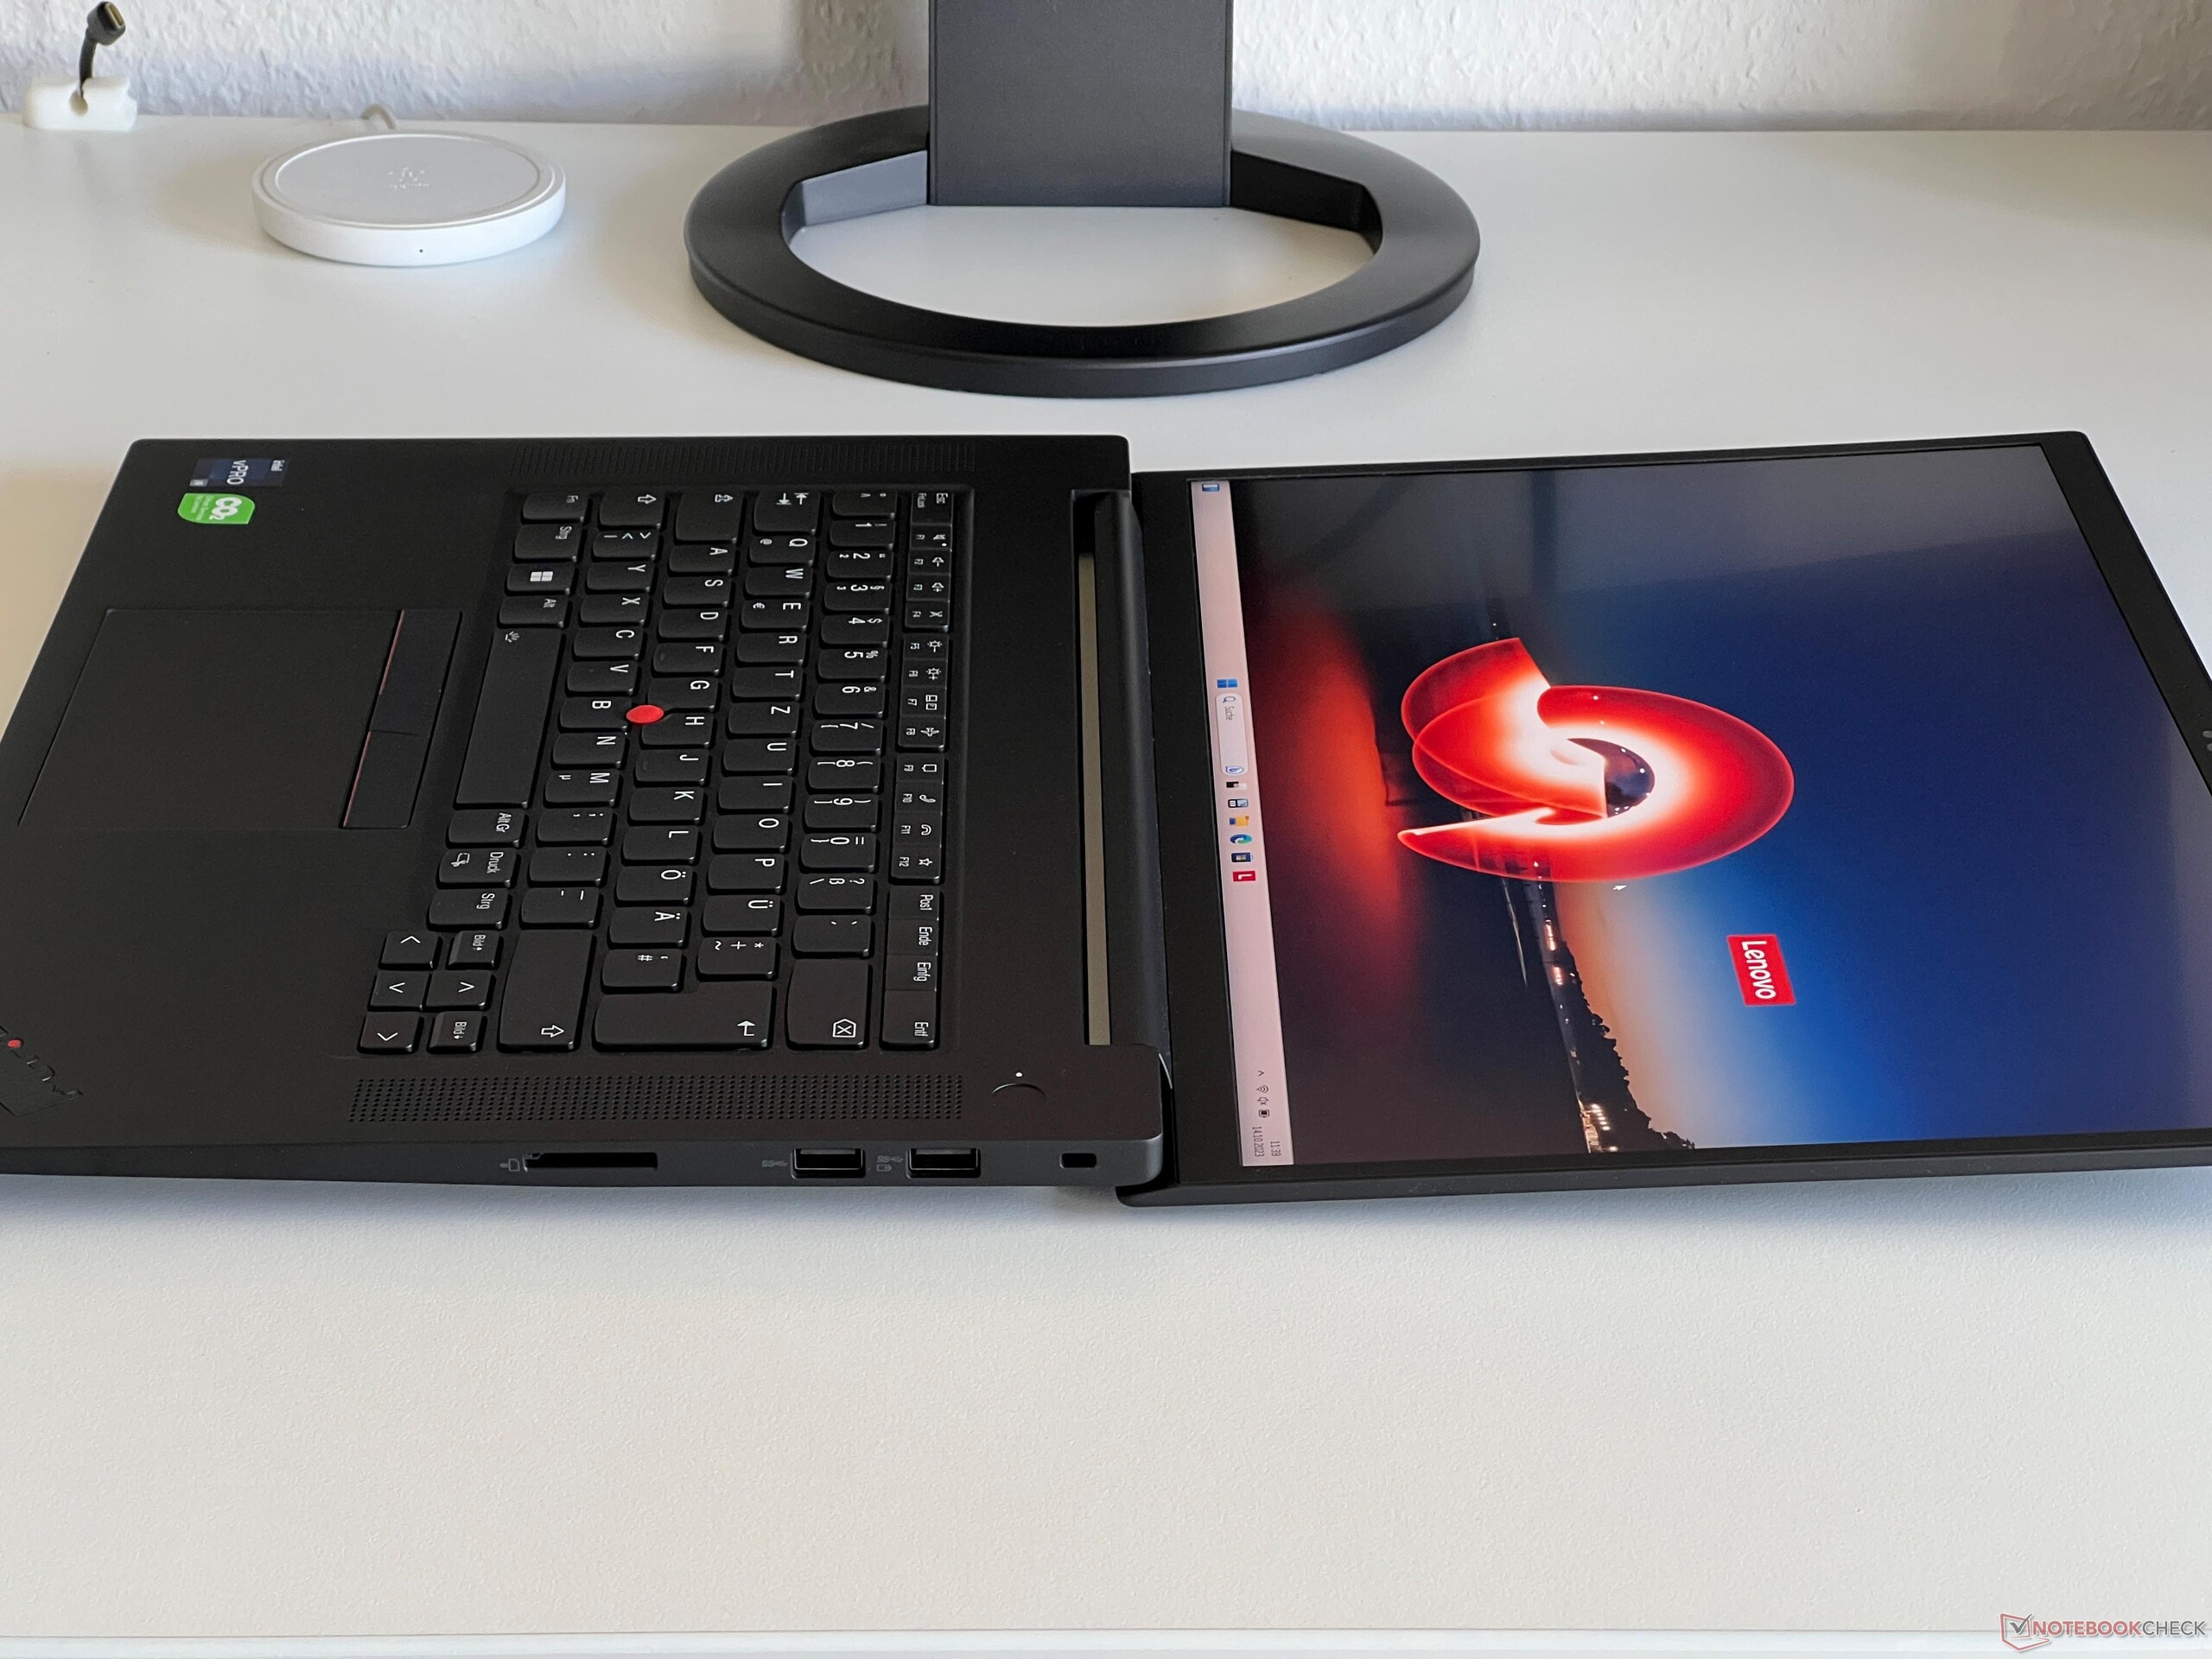
La construction combine la fibre de carbone et le magnésium, ce qui garantit une stabilité exceptionnelle. L'unité de base et le couvercle de l'écran sont robustes, sans torsion ni point de pression perceptibles. Les deux charnières (angle d'ouverture maximal de 180 degrés) permettent d'ouvrir le couvercle d'une seule main tout en maintenant une tension suffisante pour éviter tout rebondissement perceptible.
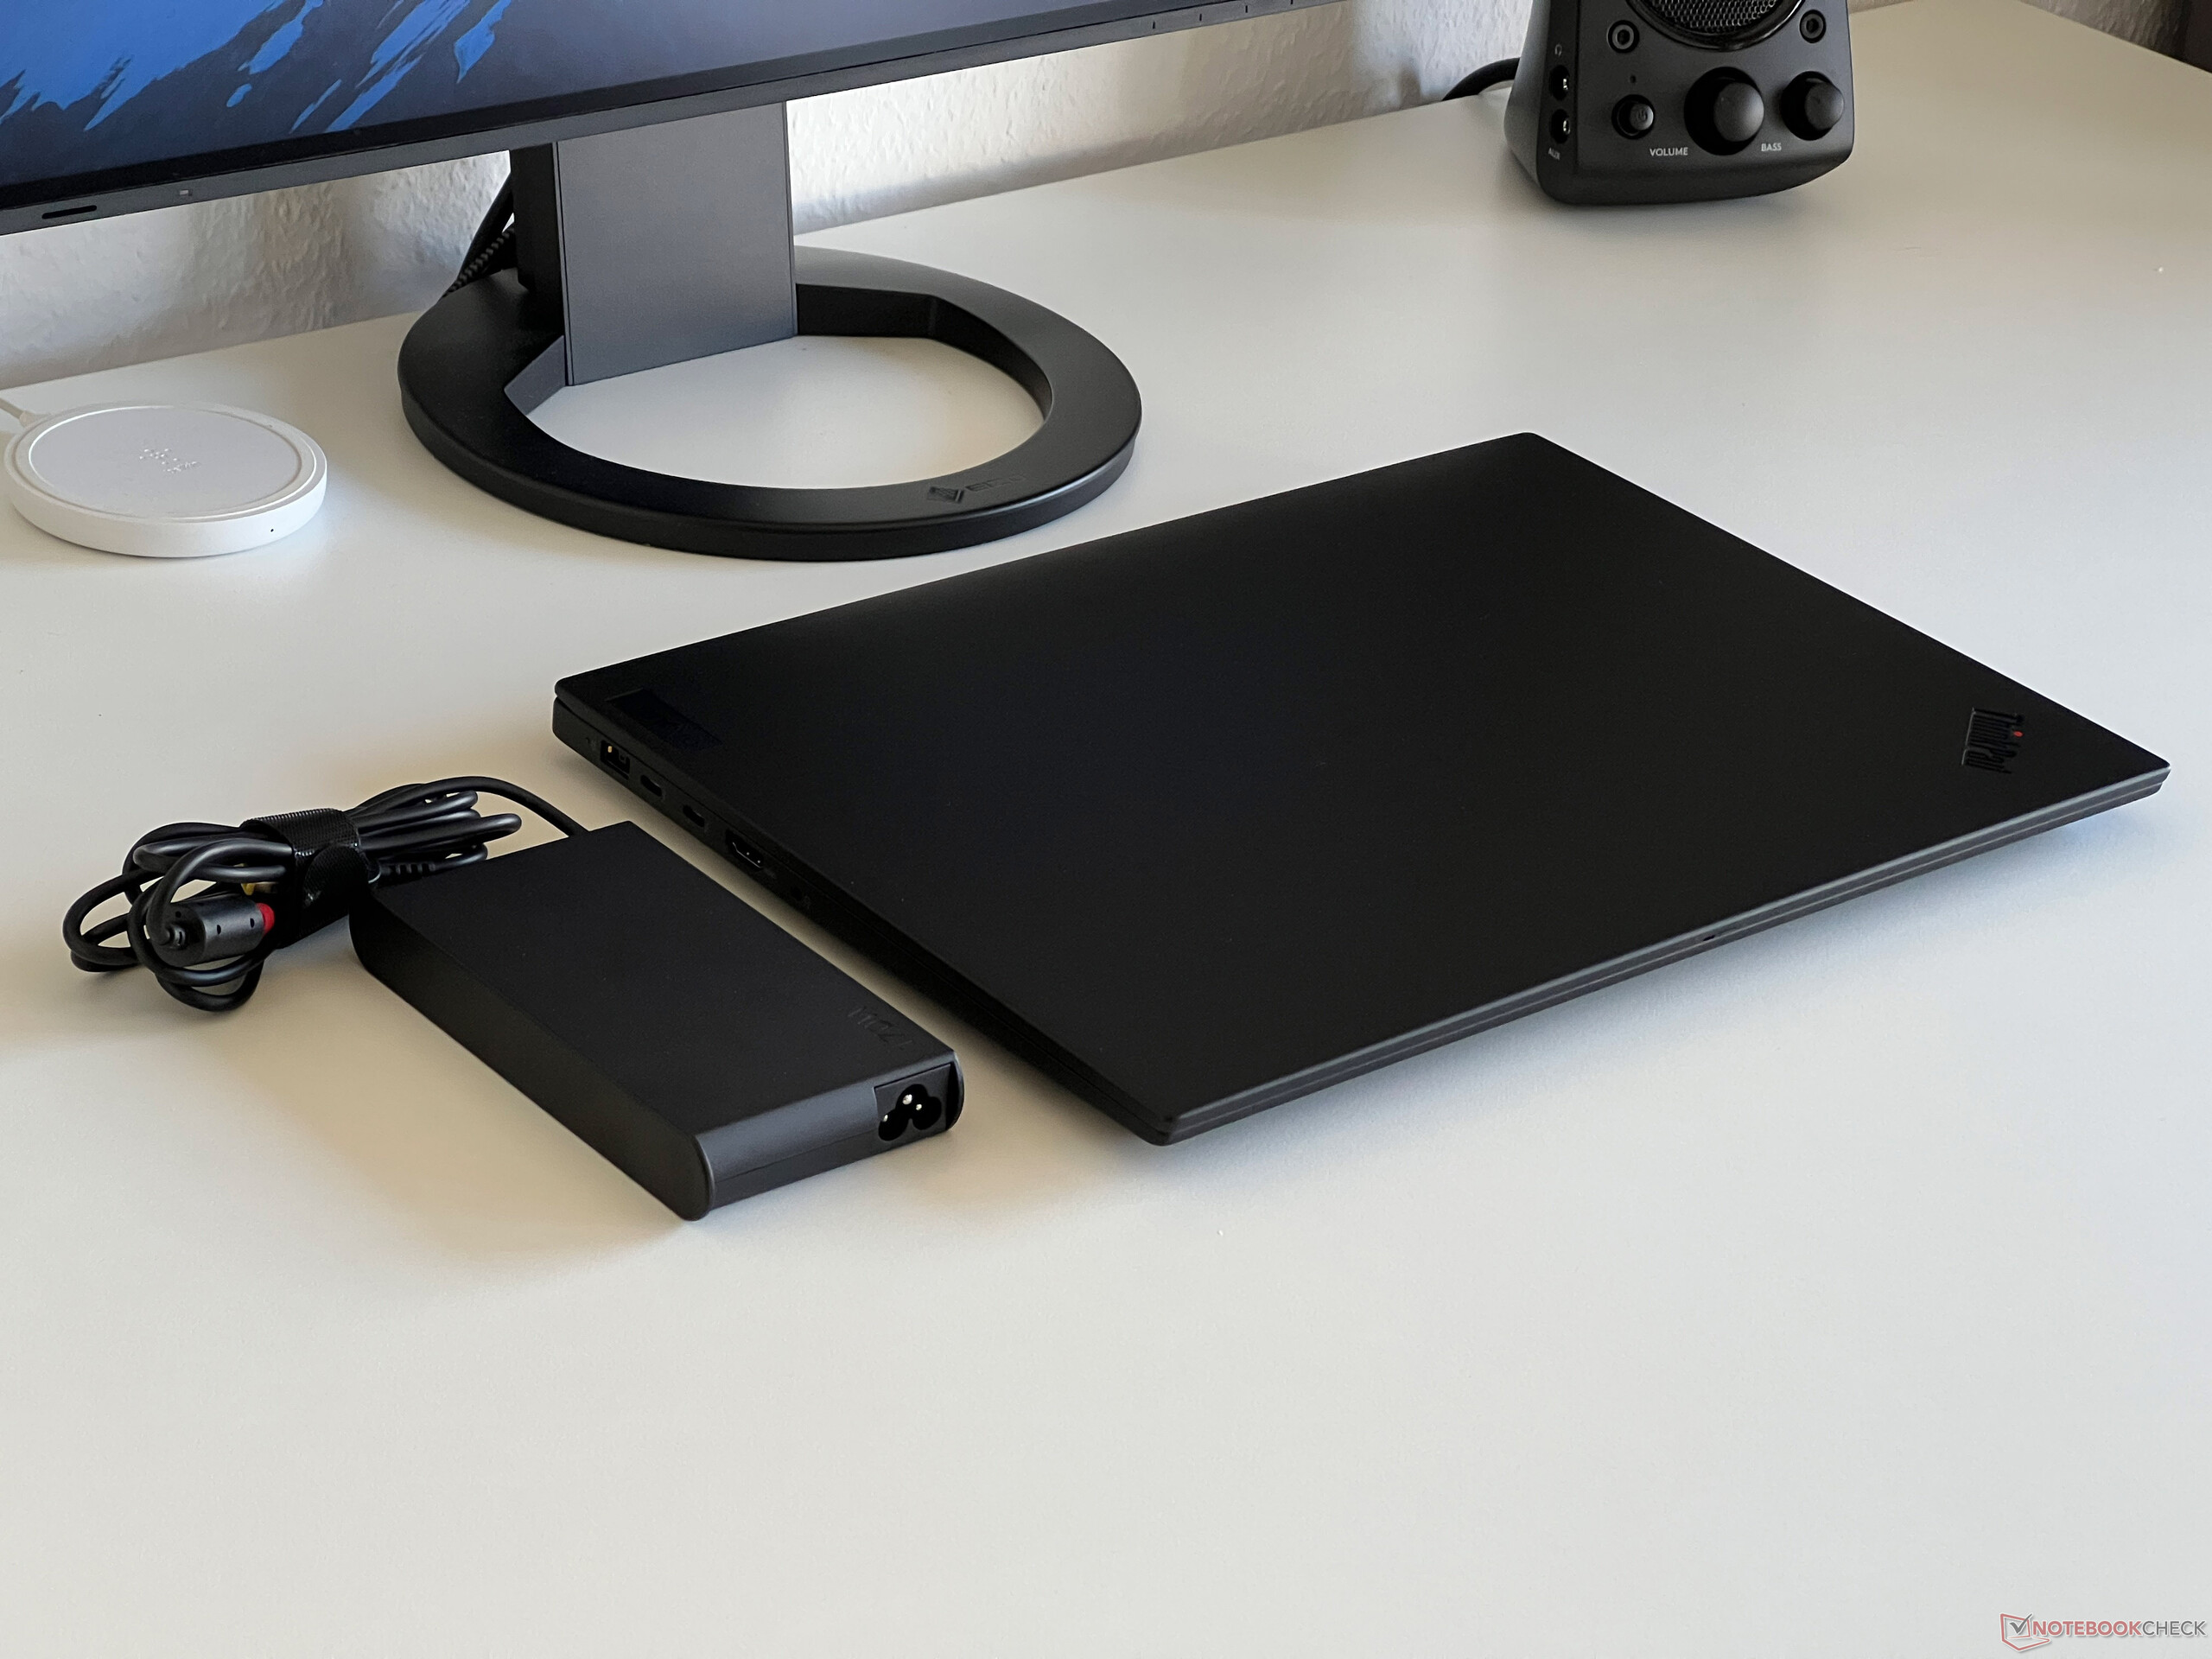
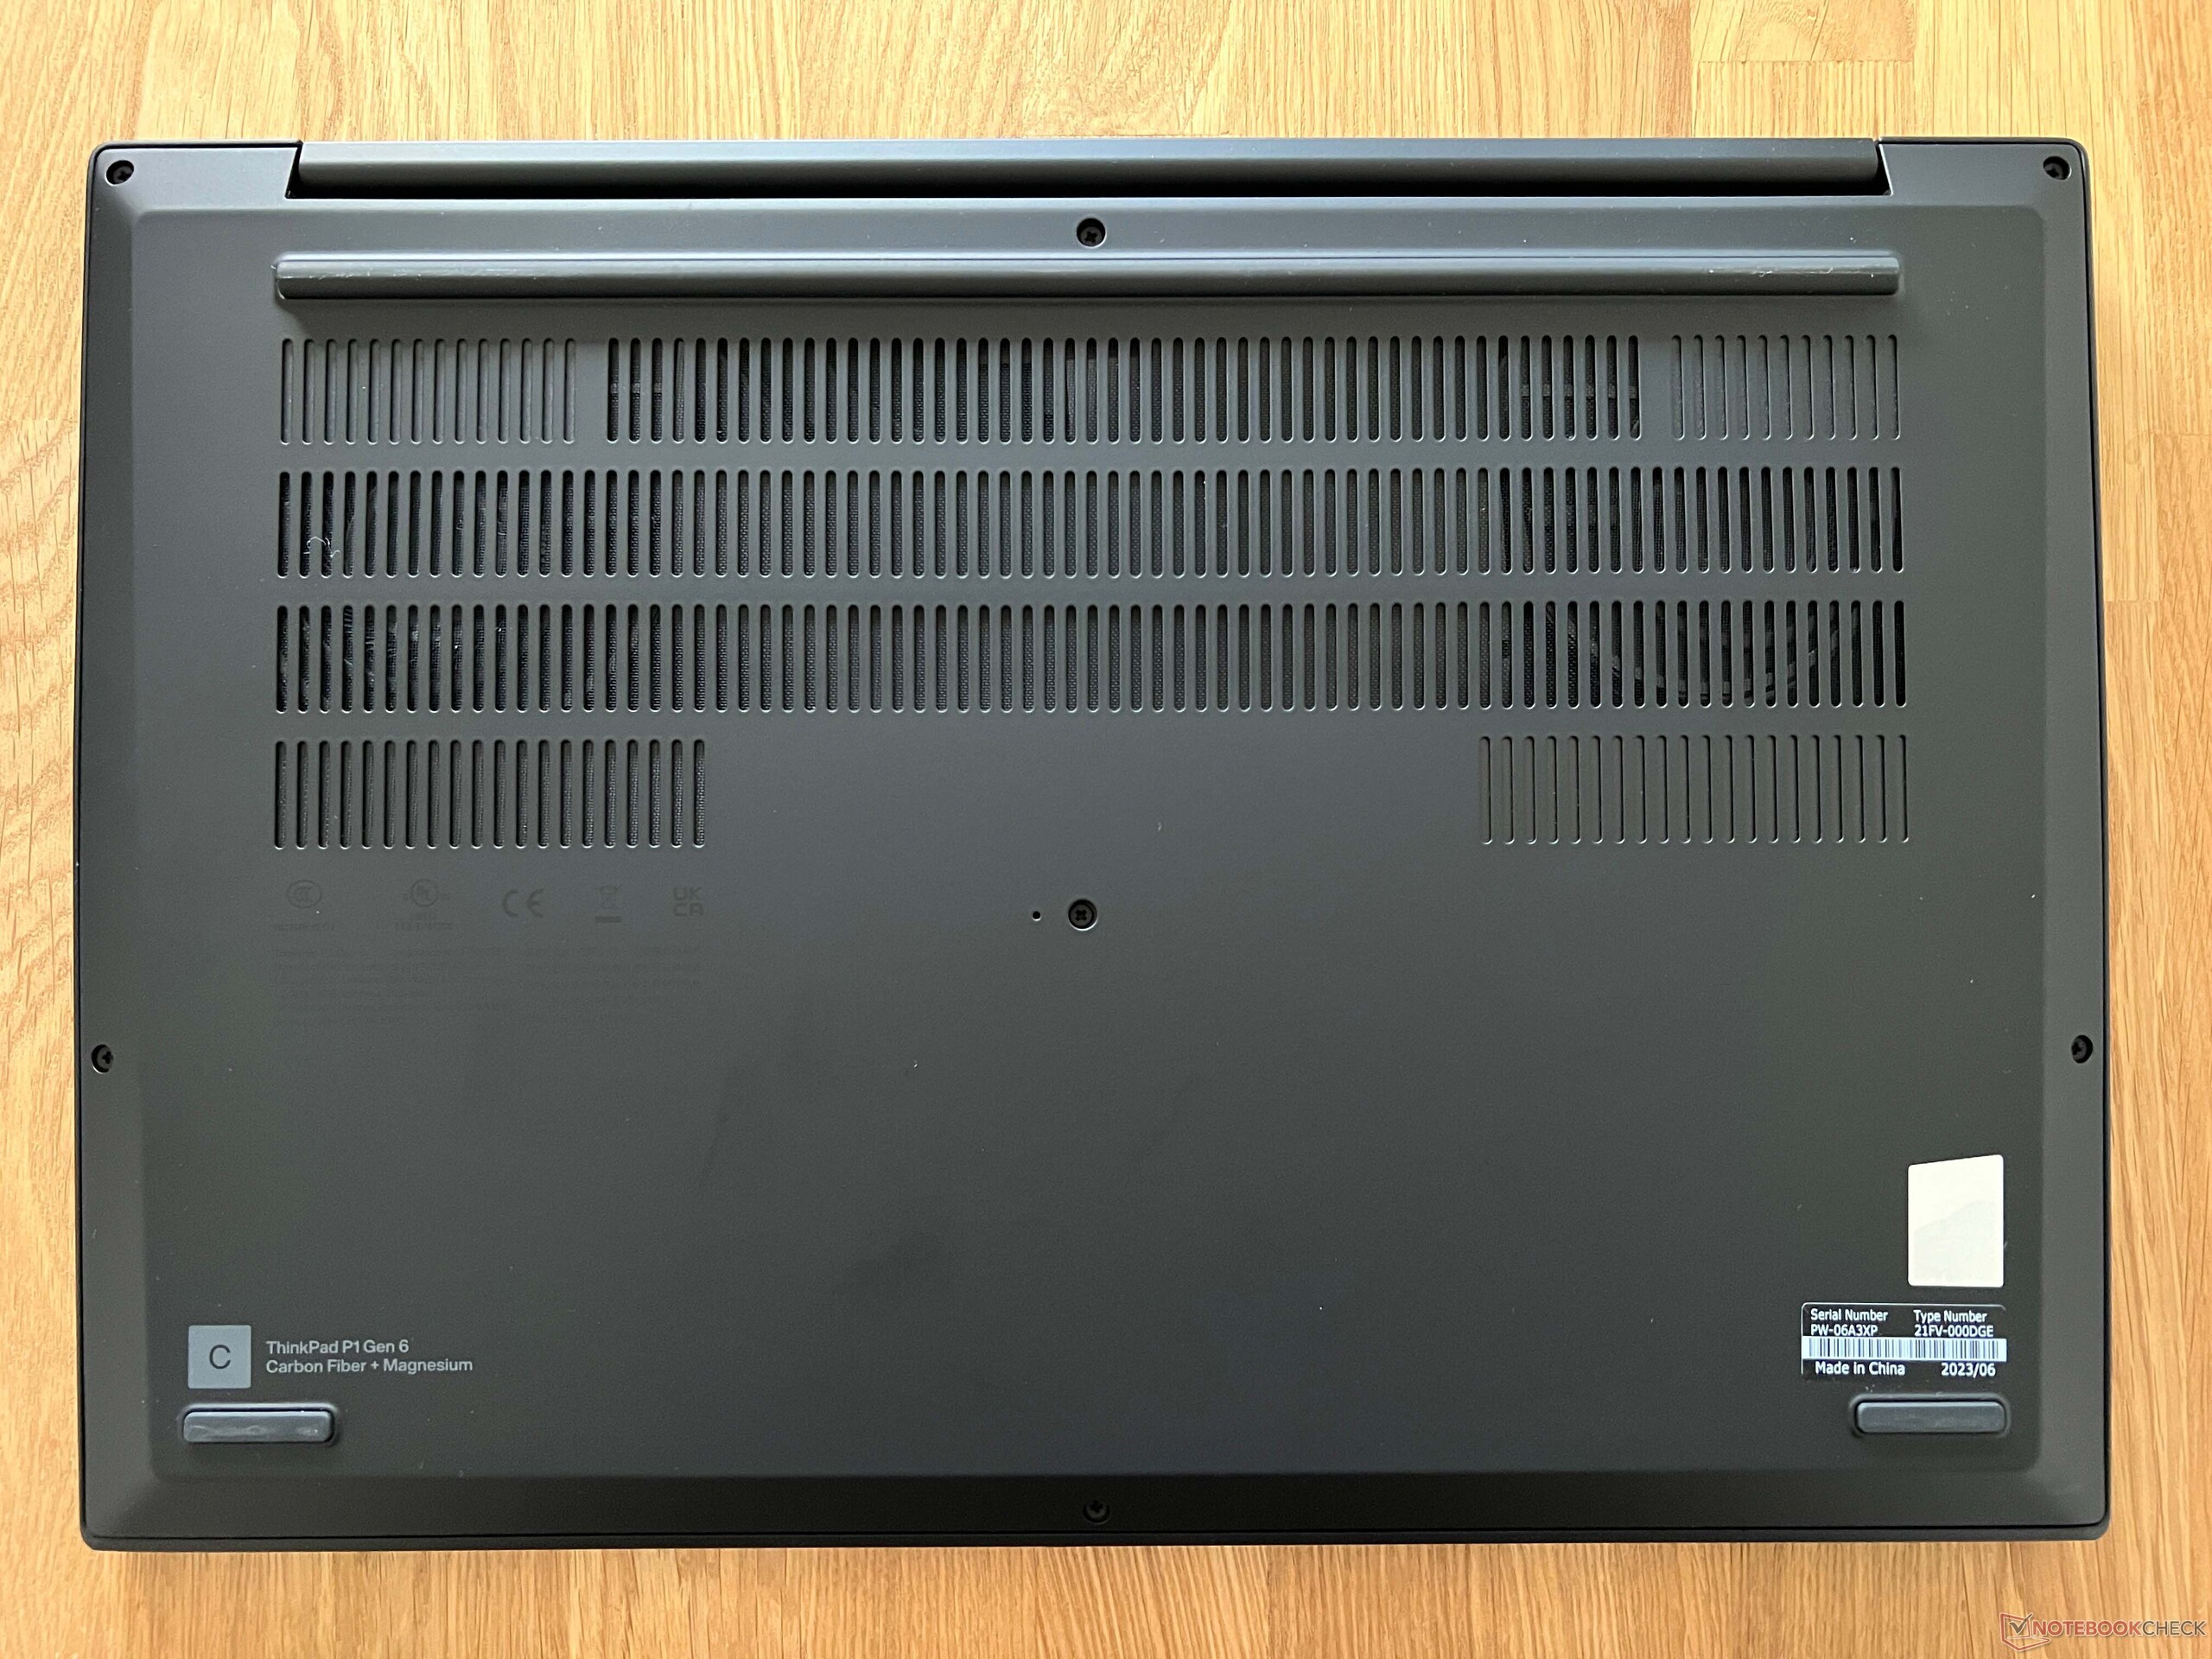
Les gadgets comparables ont un encombrement similaire, mais ils sont nettement plus lourds. Le ThinkPad P1 Gen 6 est l'une des variantes les plus légères, pesant un peu moins de 4,19 livres et n'étant surpassé que par le Schenker Vision 16. Le bloc d'alimentation de 170 watts ajoute 1,23 lb au poids total.
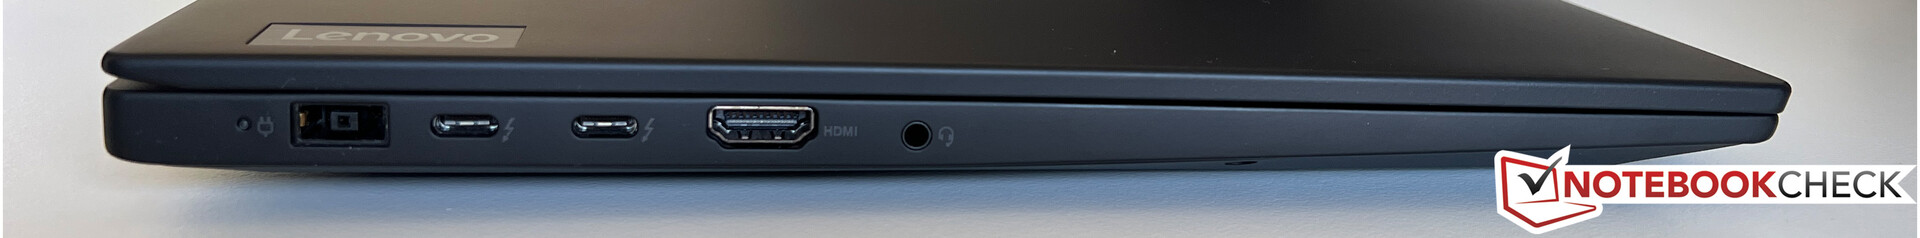
Connectivité - Thunderbolt et Wi-Fi 6E
Aucun changement n'a été apporté aux ports, et toutes les normes essentielles restent disponibles. En outre, les deux ports USB-C avec Thunderbolt 4 peuvent être utilisés pour la charge, délivrant une puissance minimale de 90 watts.
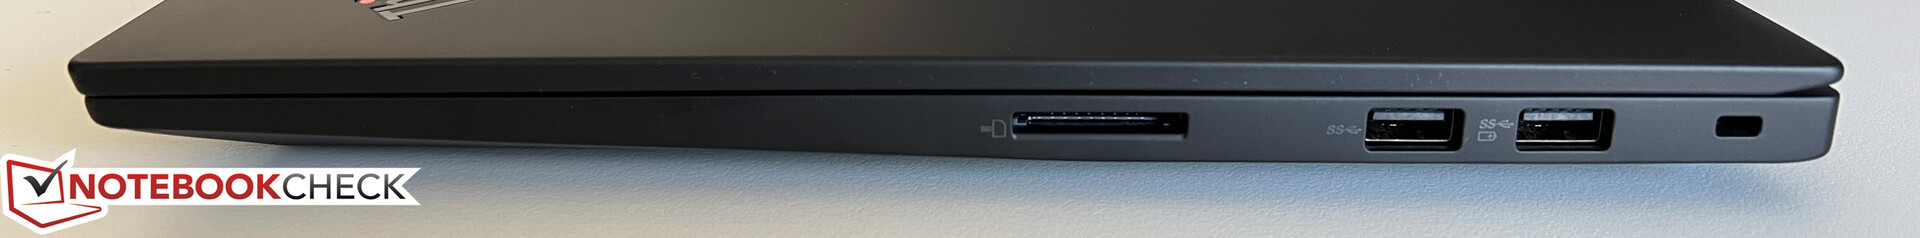
Lecteur de carte SD
Le lecteur de carte adéquat n'offre que des taux de transfert moyens. Les taux de transfert sont d'environ 80 MB/s en combinaison avec notre carte de référence (Angelbird AV Pro V60).
Communication
Pas de changement en ce qui concerne le module WLAN ; la carte Intel AX211 est toujours utilisée, supportant les réseaux modernes de 6 GHz. Les taux de transfert sont excellents, et lors de nos tests, nous n'avons rencontré aucun problème de connexion. Bien qu'il n'y ait pas de port Ethernet, il peut être ajouté grâce à un adaptateur USB-C compatible. À l'intérieur du boîtier, il y a un emplacement M.2-2242 pour un module WWAN ; cependant, les antennes nécessaires ne sont pas préinstallées, ce qui empêche les rétrofits pour la connectivité WWAN.
| Networking | |
| Lenovo ThinkPad P1 G6-21FV000DGE | |
| iperf3 transmit AXE11000 | |
| iperf3 receive AXE11000 | |
| Dell Precision 5000 5680 | |
| iperf3 transmit AXE11000 | |
| iperf3 receive AXE11000 | |
| iperf3 transmit AXE11000 6GHz | |
| iperf3 receive AXE11000 6GHz | |
| Samsung Galaxy Book3 Ultra 16, i9-13900H RTX 4070 | |
| iperf3 transmit AXE11000 | |
| iperf3 receive AXE11000 | |
| iperf3 transmit AXE11000 6GHz | |
| iperf3 receive AXE11000 6GHz | |
| HP ZBook Studio 16 G9 62U04EA | |
| iperf3 transmit AXE11000 6GHz | |
| iperf3 receive AXE11000 6GHz | |
| MSI CreatorPro Z16P B12UKST | |
| iperf3 transmit AXE11000 6GHz | |
| iperf3 receive AXE11000 6GHz | |
| Schenker VISION 16 Pro (M23) | |
| iperf3 transmit AXE11000 | |
| iperf3 receive AXE11000 | |
| Lenovo ThinkPad X1 Extreme G5-21DE003RGE | |
| iperf3 transmit AXE11000 6GHz | |
| iperf3 receive AXE11000 6GHz | |
Webcam
L'appareil photo 1080p prend des photos correctes dans de bonnes conditions d'éclairage et dispose d'un obturateur mécanique. De plus, une caméra IR est disponible pour la reconnaissance faciale via Windows Hello.


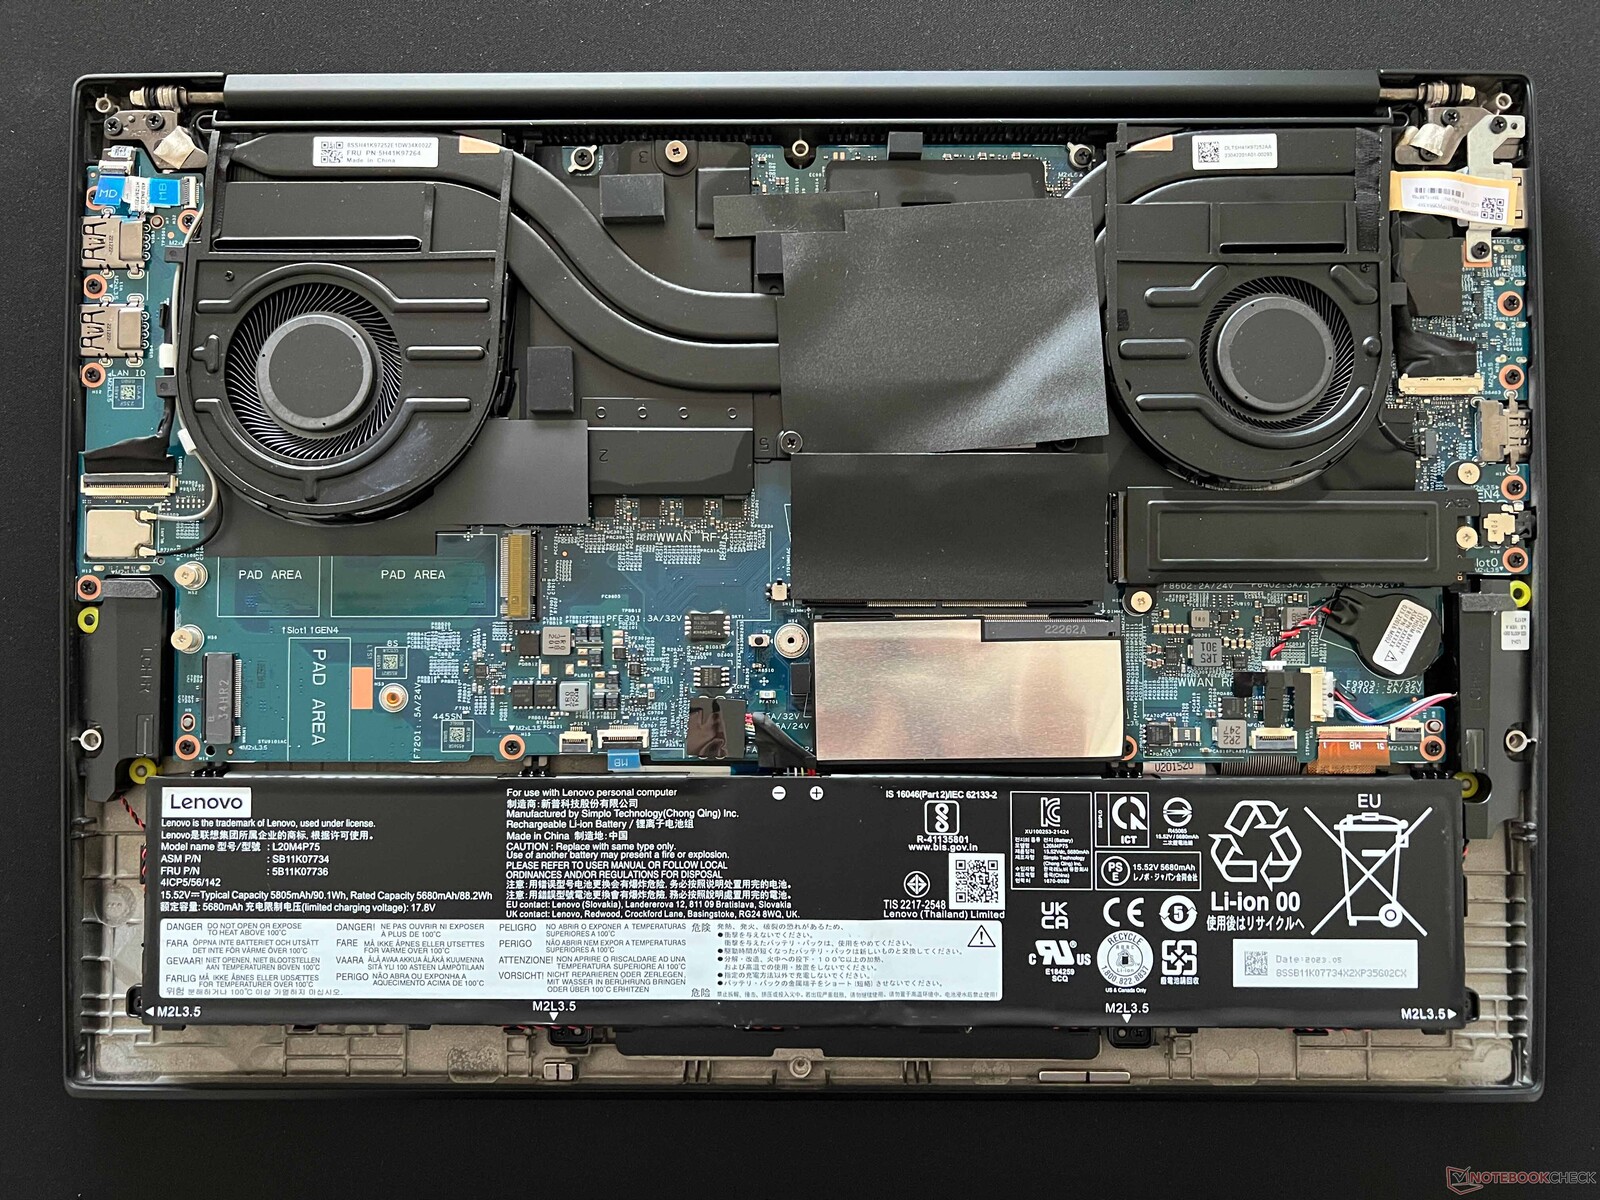
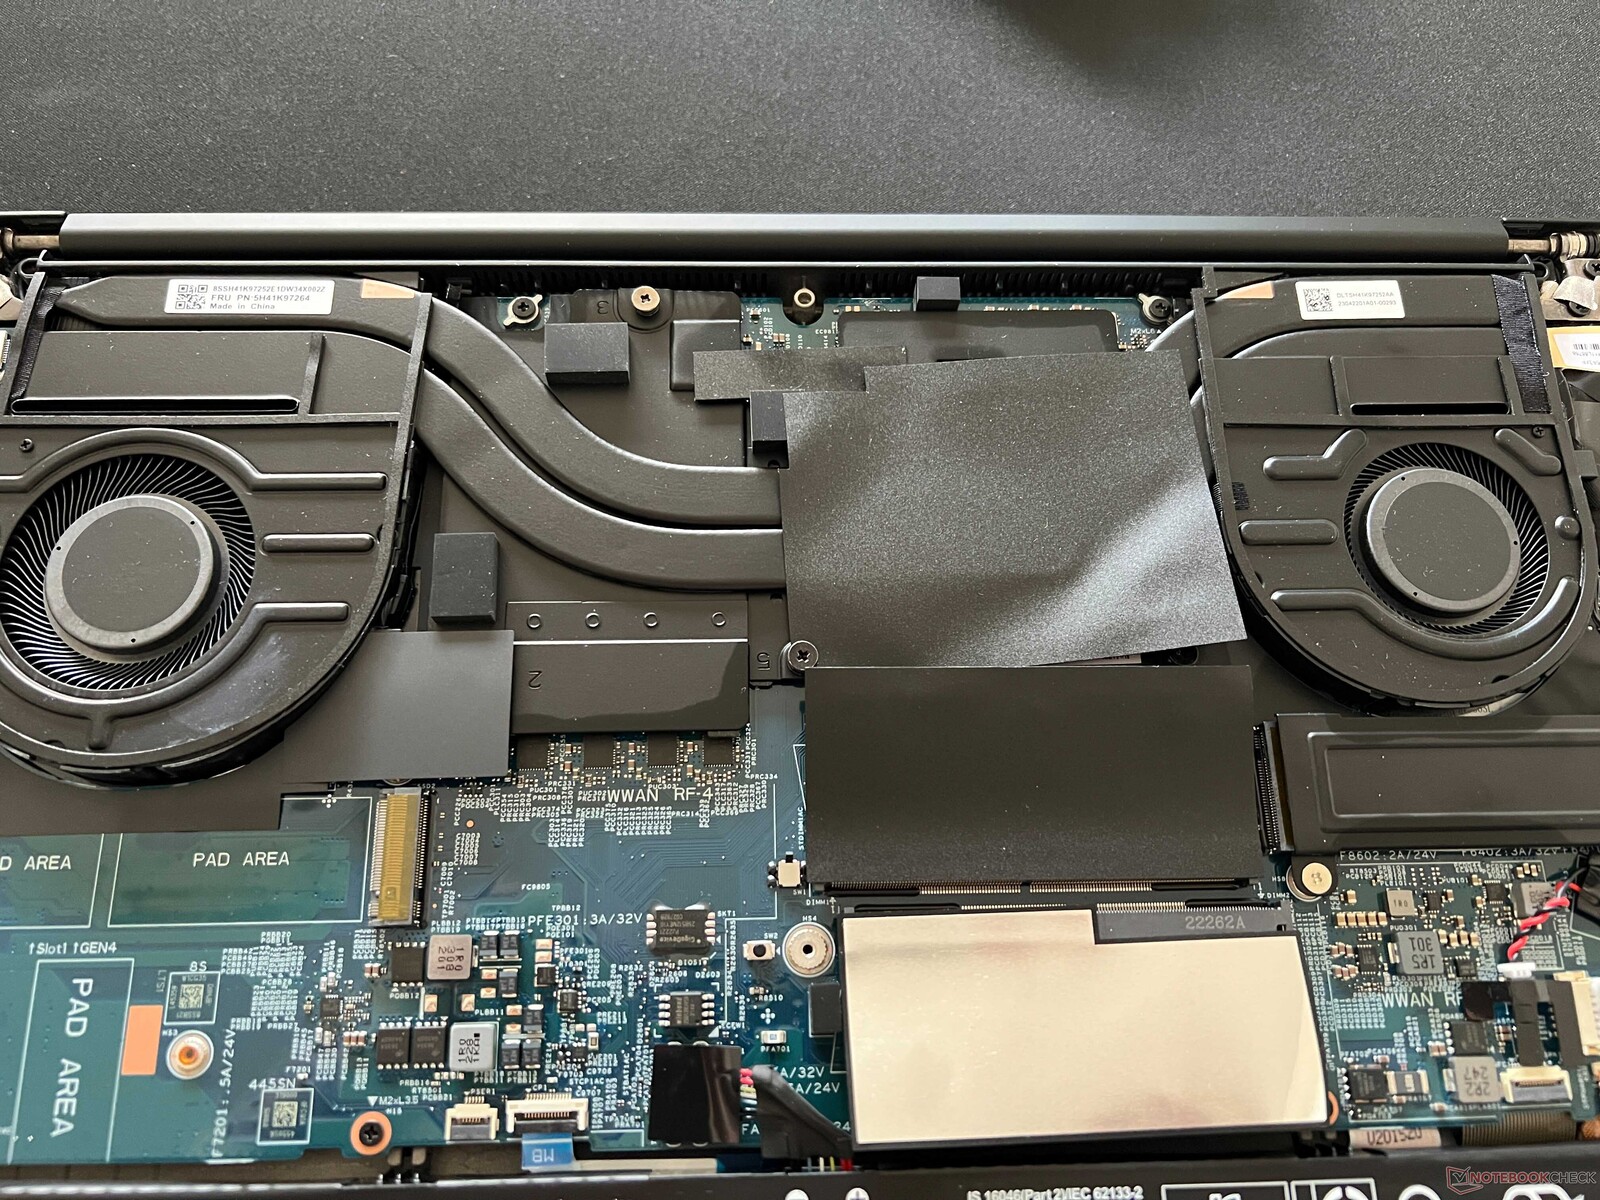
Maintenance
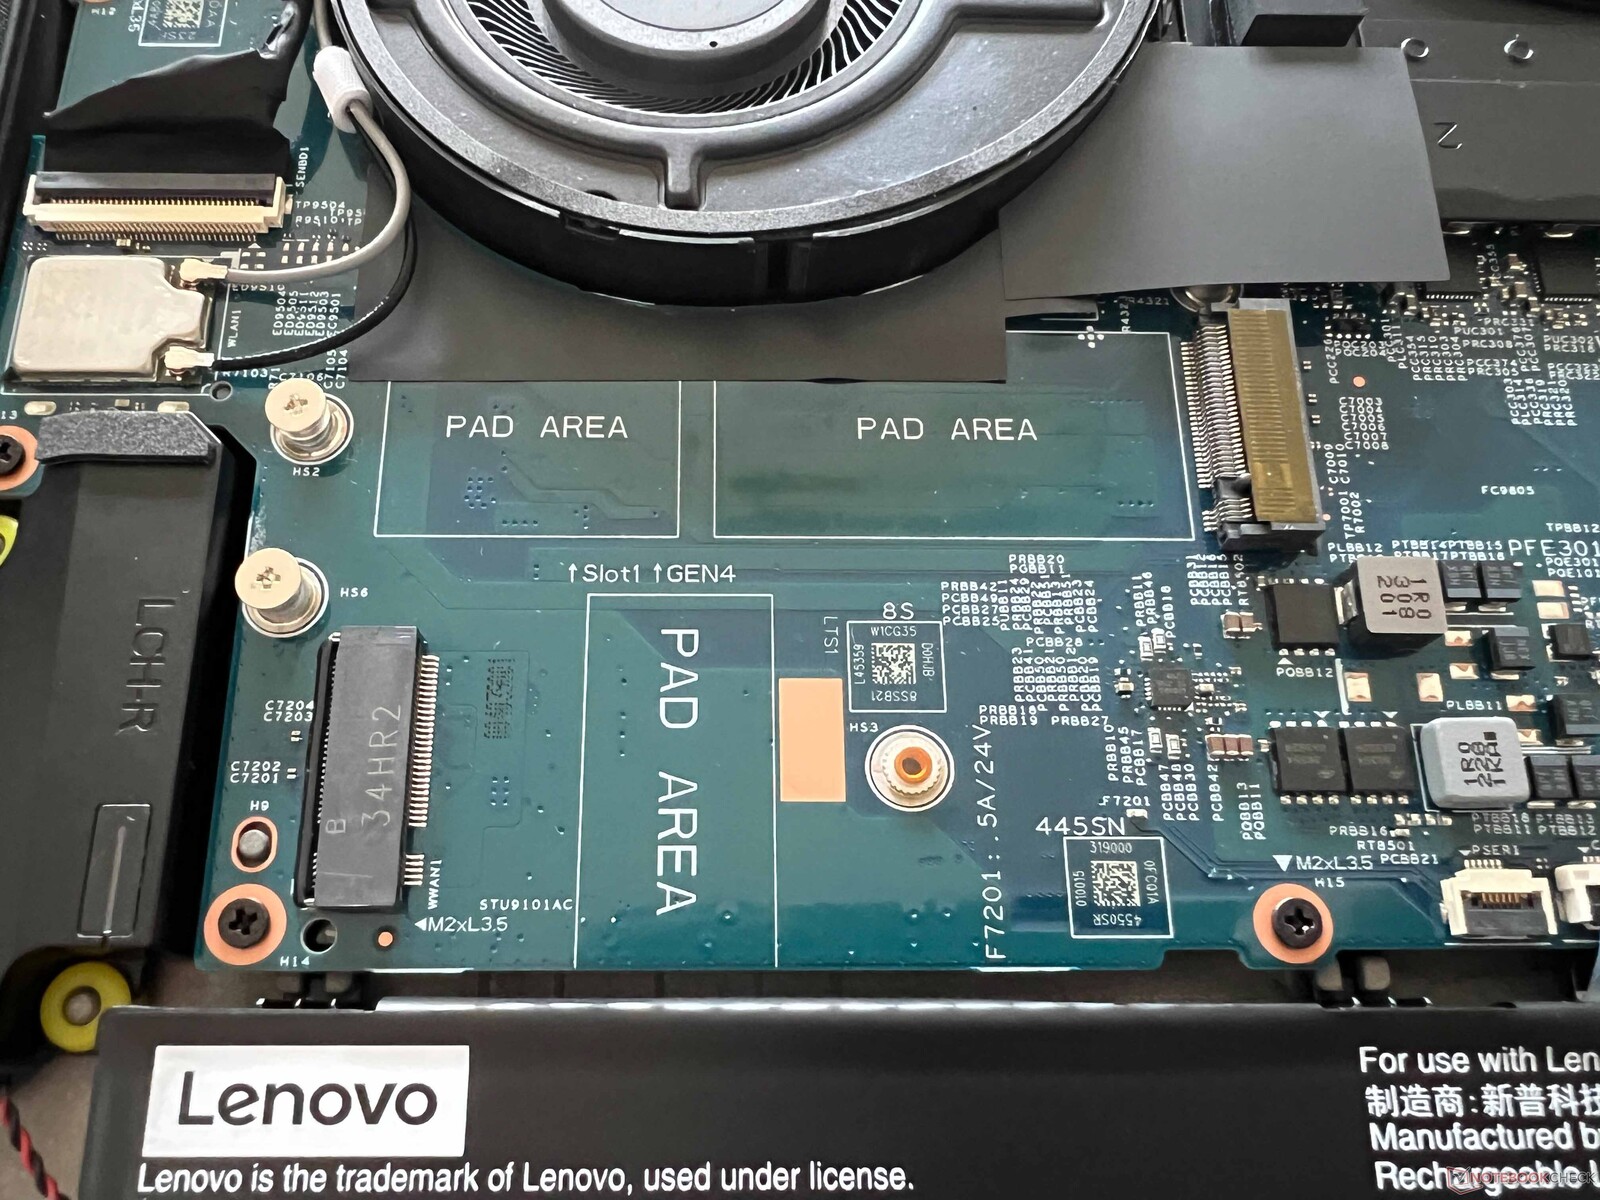
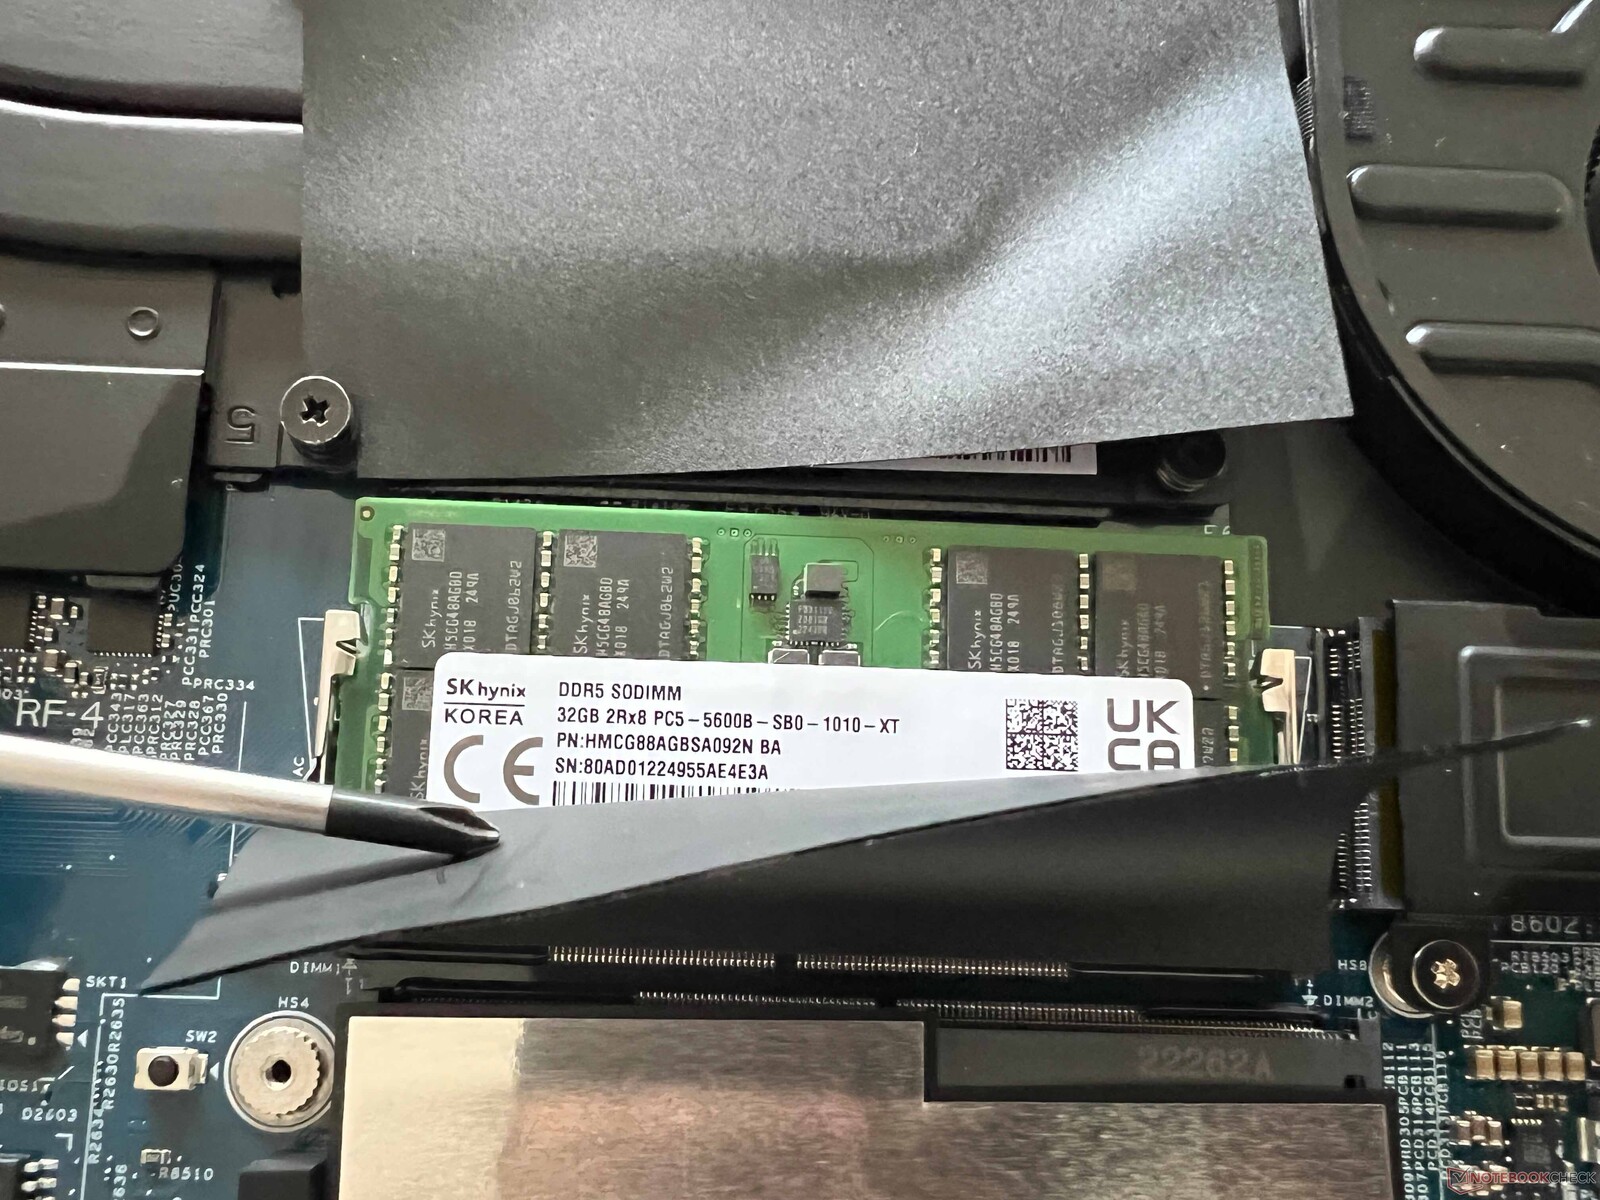
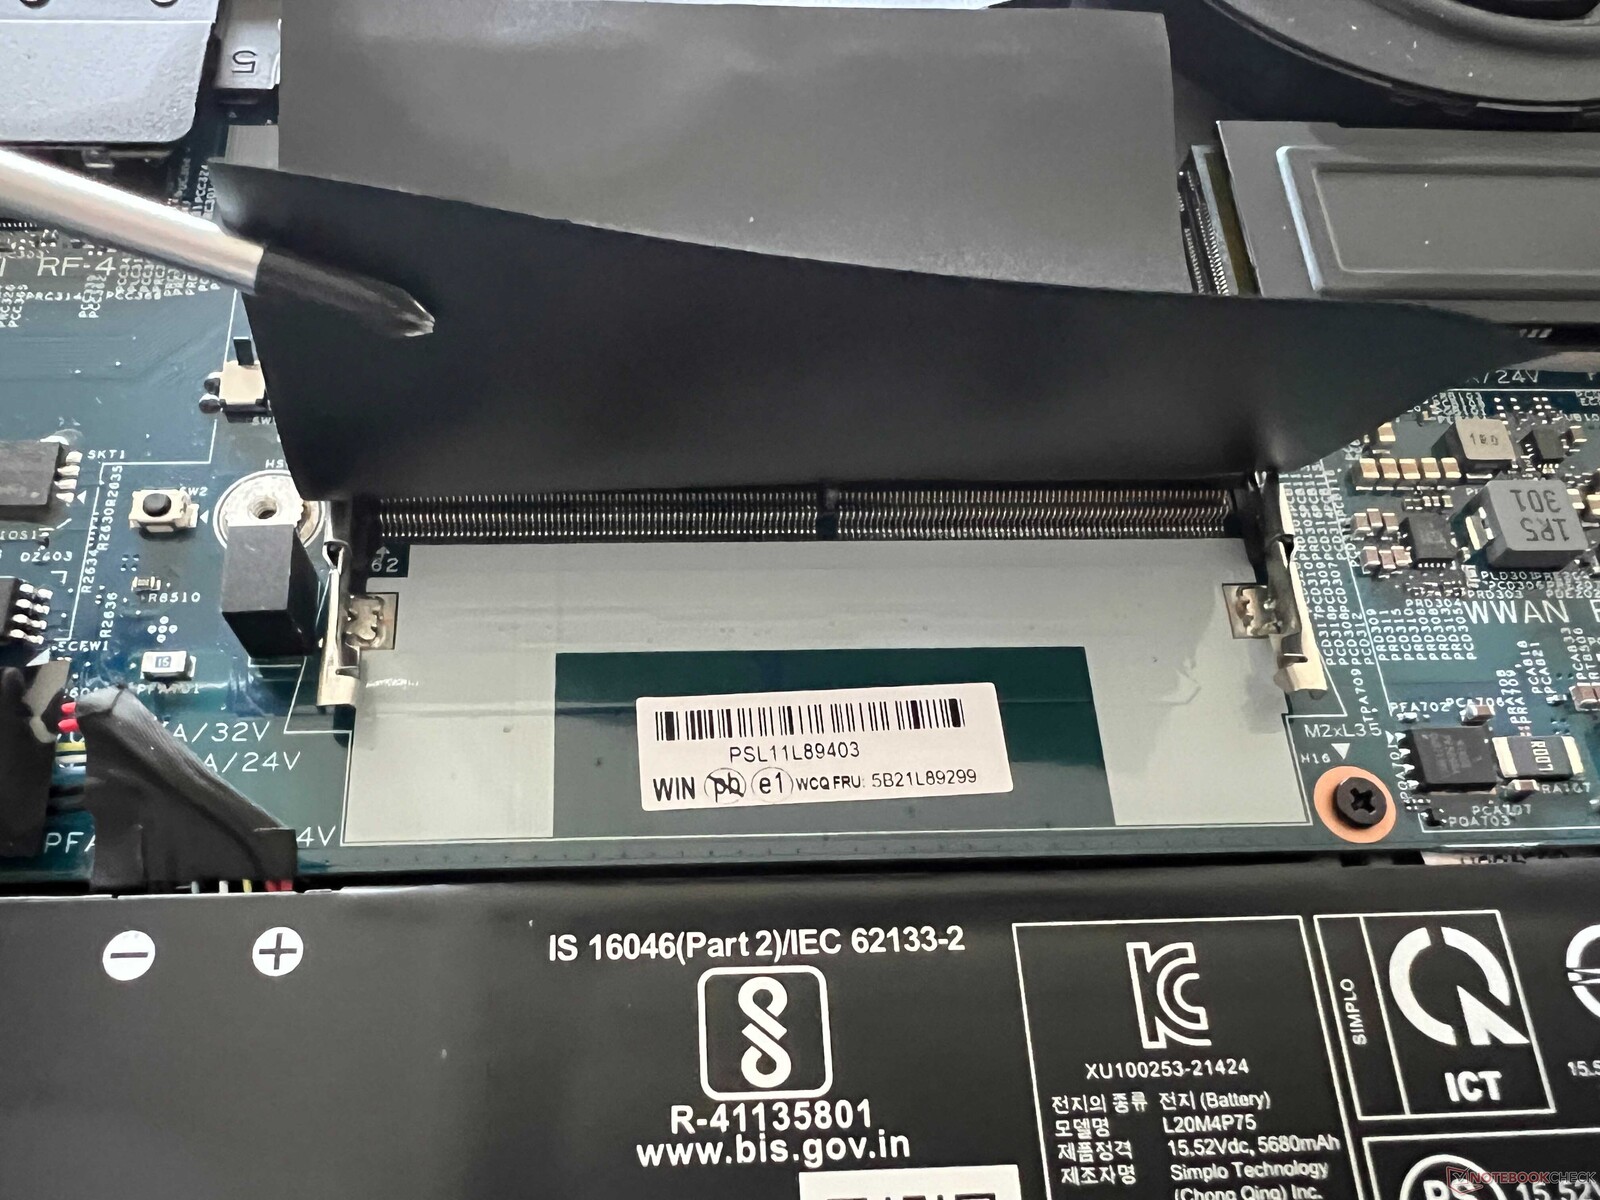
Le couvercle du boîtier inférieur peut être facilement retiré. Notre appareil de test est doté d'un système de refroidissement conventionnel avec des ailettes de refroidissement, ce qui permet d'avoir deux emplacements pour des disques durs SSD M.2-2280. En outre, il y a deux emplacements SODIMM pour les modules RAM, mais le module WLAN ne peut pas être remplacé.
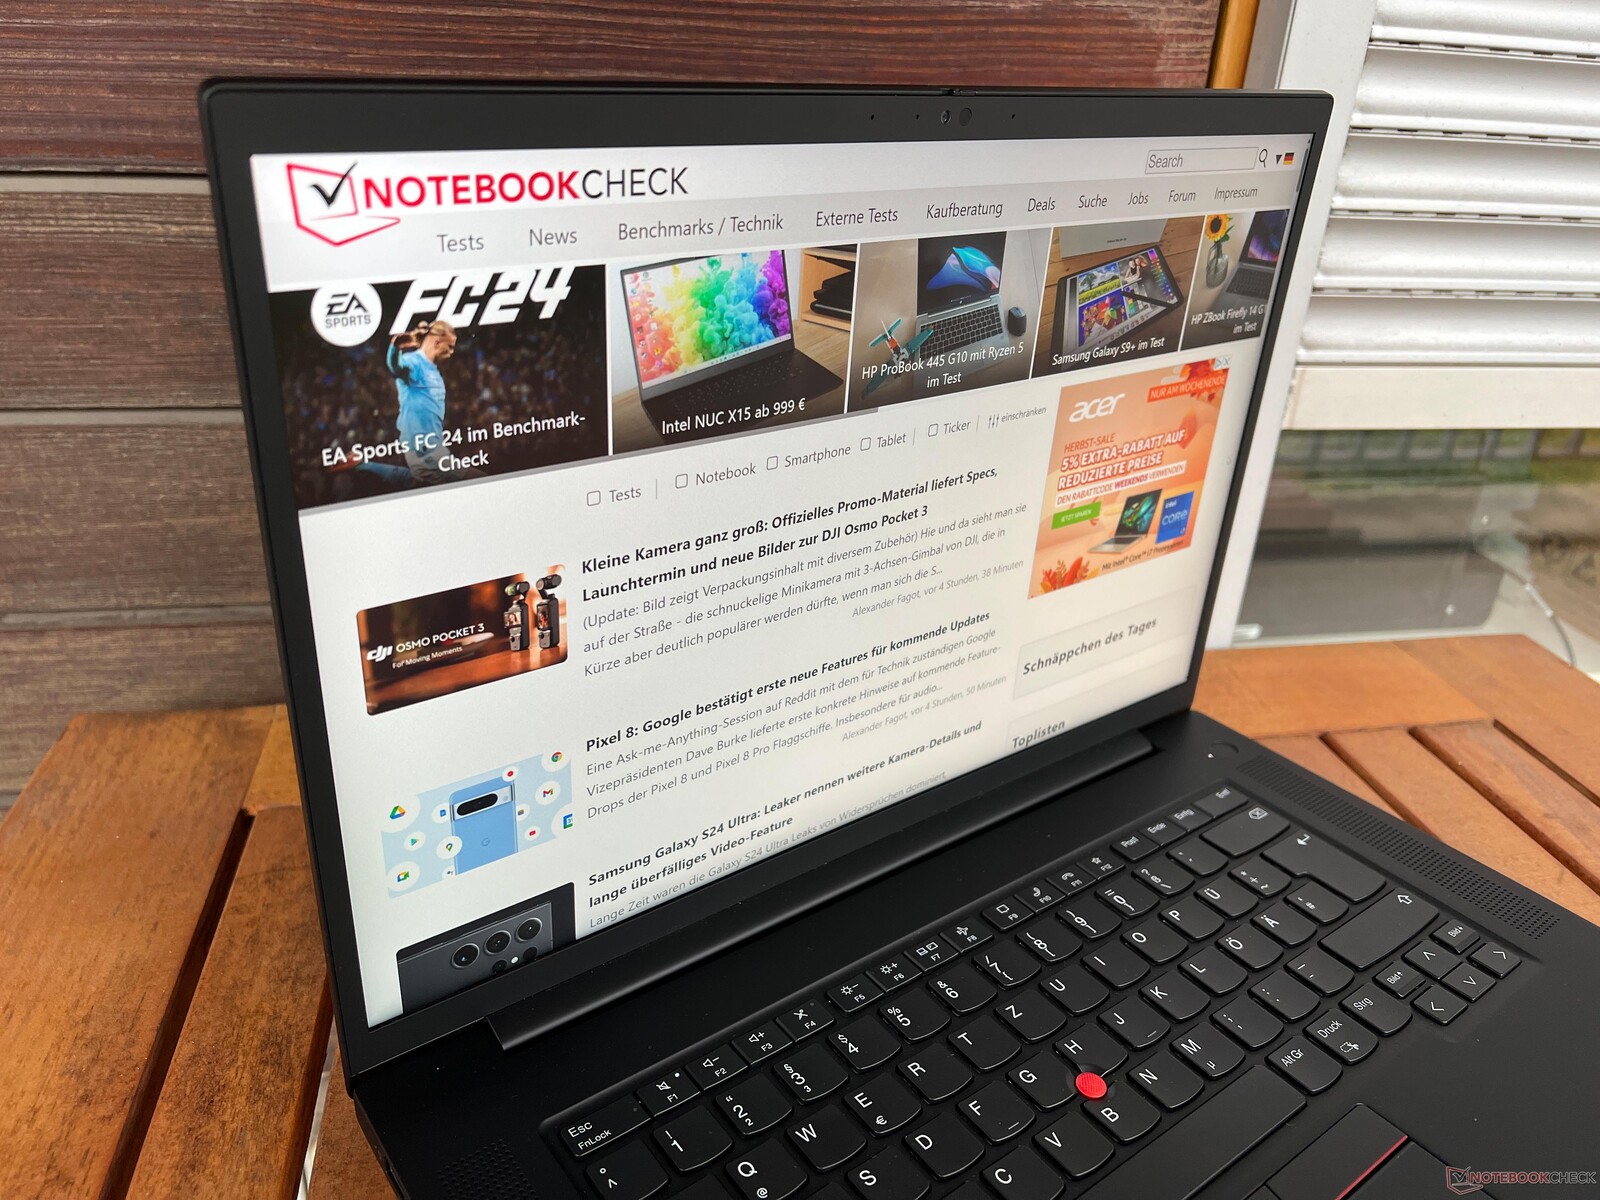
Dispositifs d'entrée - course de 1,5 mm
Lenovo utilise depuis deux ans un clavier avec une course de 0,06 pouce pour le ThinkPad P1, inchangé dans le modèle actuel. Bien que le clavier offre une expérience de frappe confortable, permettant de rédiger des textes longs sans problème, il n'atteint plus la qualité des modèles précédents. Le rétroéclairage blanc à deux niveaux s'avère utile dans des conditions de faible luminosité, bien qu'il n'y ait pas d'activation automatique par le biais d'un capteur.
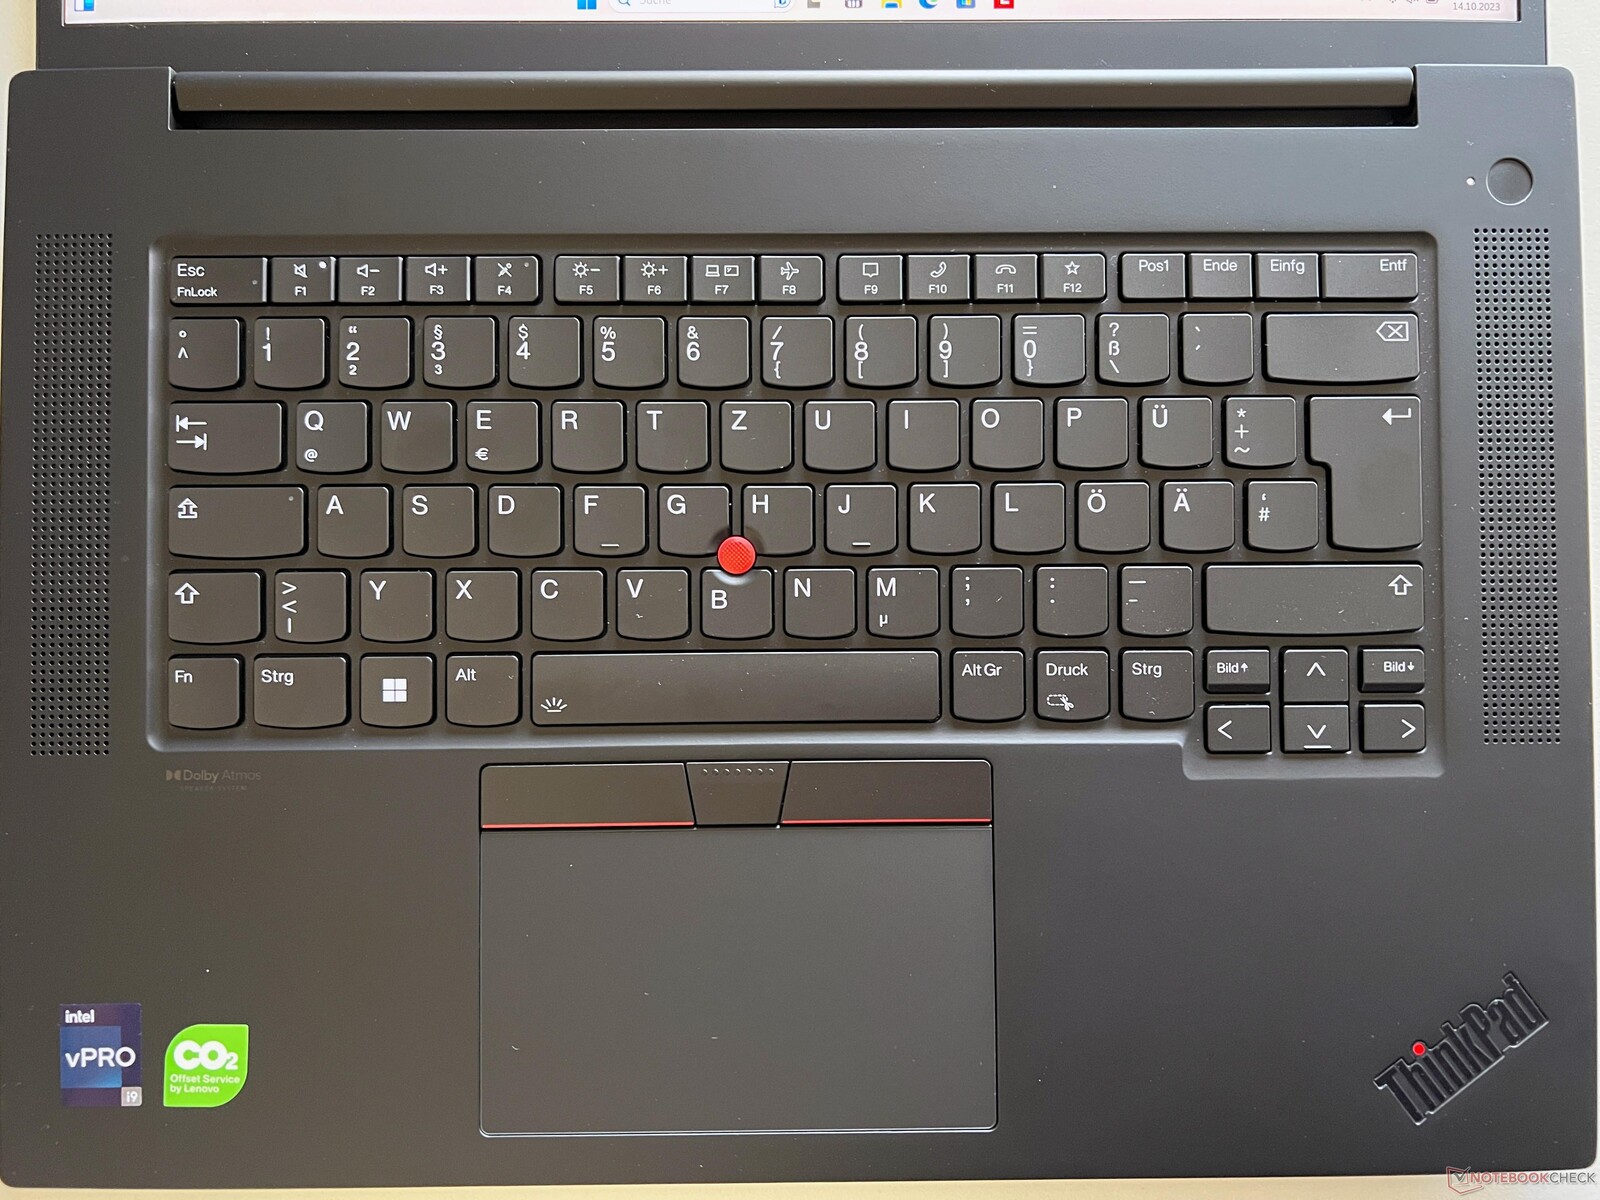
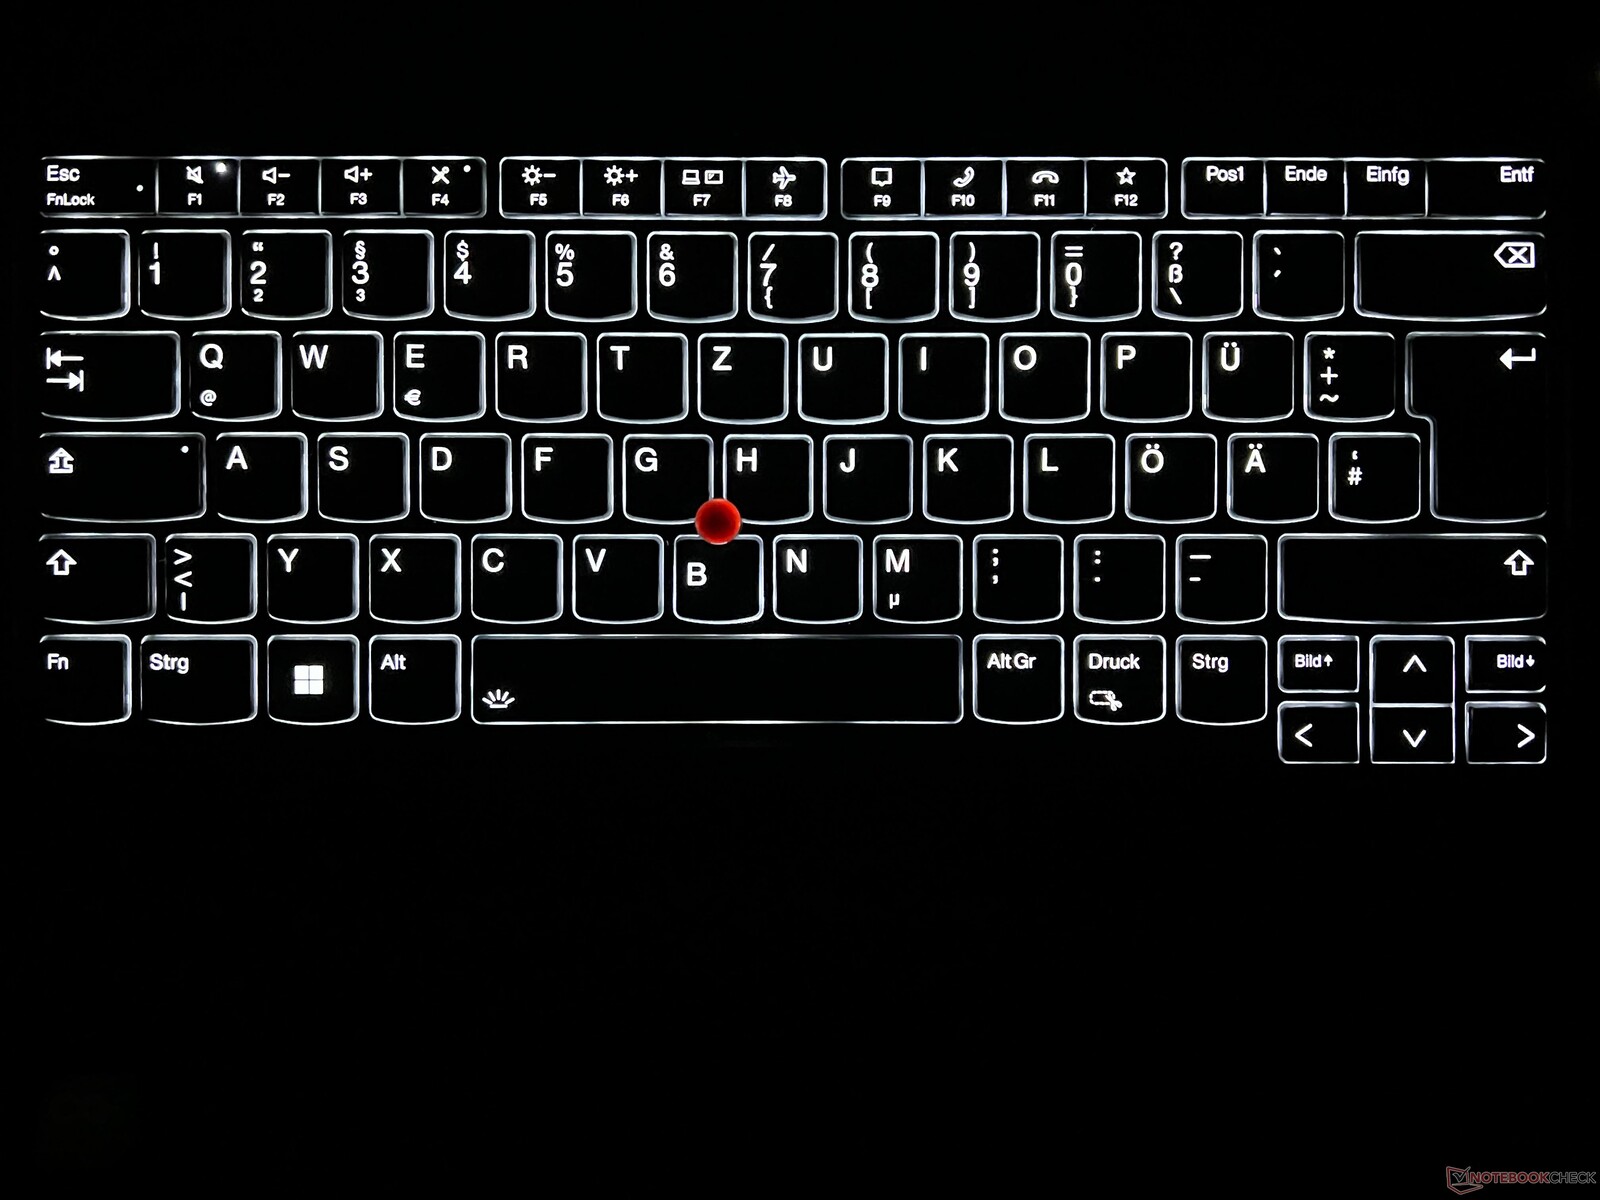
Le ClickPad offre d'excellentes propriétés de glissement et un mécanisme de haute qualité, offrant des bruits de clics doux et silencieux. En outre, pour le contrôle de la souris, le TrackPoint et les boutons dédiés sont disponibles. Les touches plates offrent une expérience de frappe agréable et silencieuse, fonctionnant sans problème, bien que les touches de notre appareil de test semblent quelque peu bruyantes.
Écran - Panneau IPS mat avec 165 Hz et 500 cd/m²
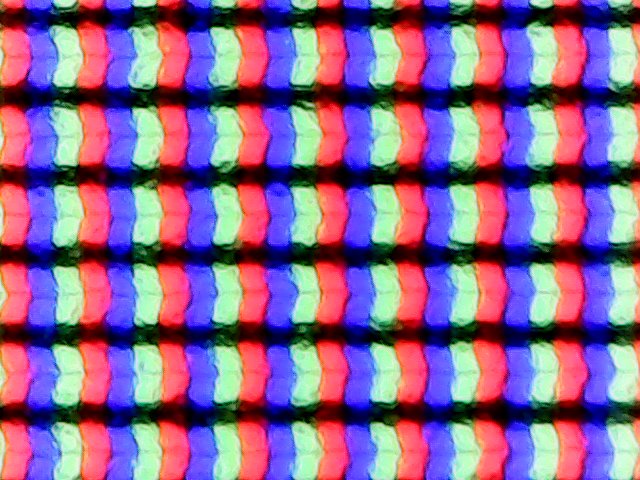
Lenovo a introduit l'écran optionnel 165 Hz avec une résolution WQHD dans la génération G5 de l'année dernière, mais nous ne sommes en mesure de le tester qu'aujourd'hui. La configuration standard comprend un écran Full HD mat avec une luminosité de 300 cd/m². En outre, il existe une option pour un écran OLED 4K avec une couverture P3 complète. Il convient de noter que le modèle IPS 4K avec couverture AdobeRGB, que nous avons testé l'année dernière avec le ThinkPad X1 Extremede l'année dernière, n'est pas disponible dans cette version.
L'écran IPS optionnel de notre modèle d'essai se distingue par son excellente qualité d'image subjective. Les couleurs sont éclatantes et les mouvements sont incroyablement fluides grâce au taux de rafraîchissement élevé, ce qui confère à tous les contenus une netteté exceptionnelle. Même dans les zones lumineuses, il n'y a pas de grain et l'écran ne présente aucun problème de scintillement PWM. En outre, les temps de réponse sont impressionnants et il n'y a pas d'effets d'image fantôme perceptibles. À des niveaux de luminosité élevés, de légers halos sont visibles sur un fond sombre, mais ce n'est pas un problème important en pratique.
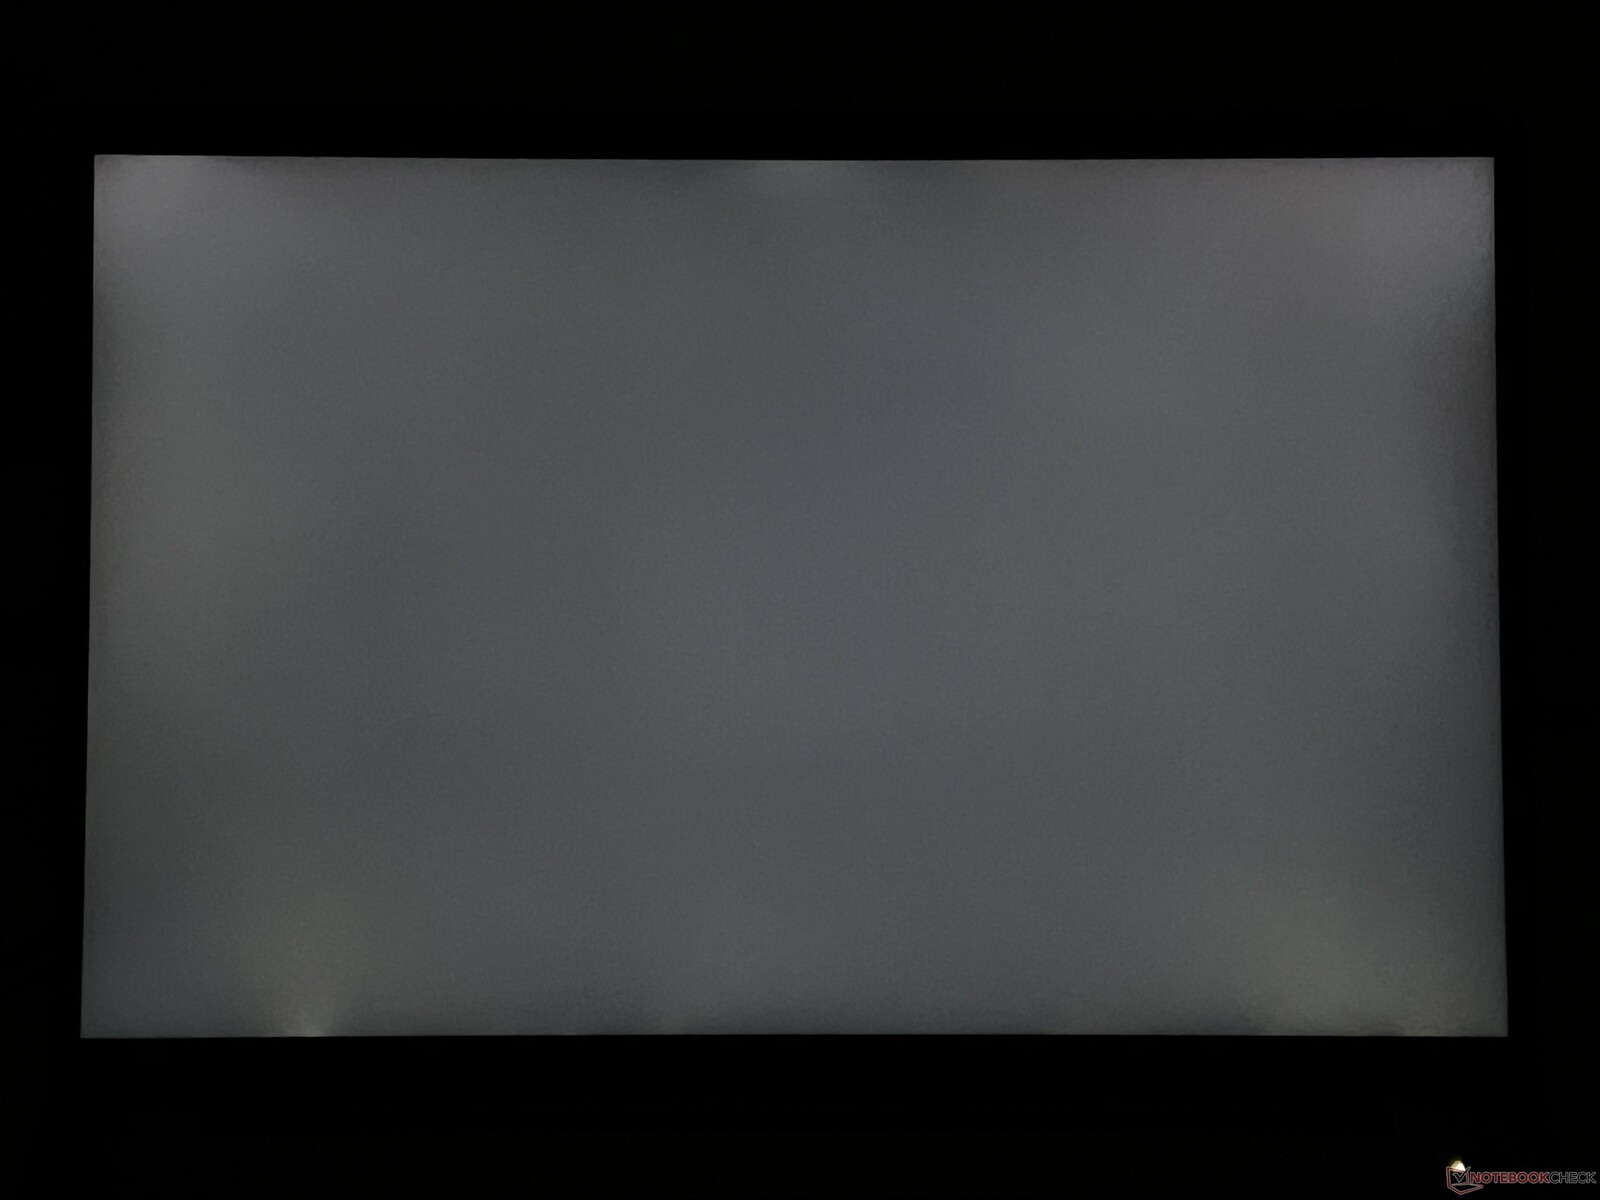
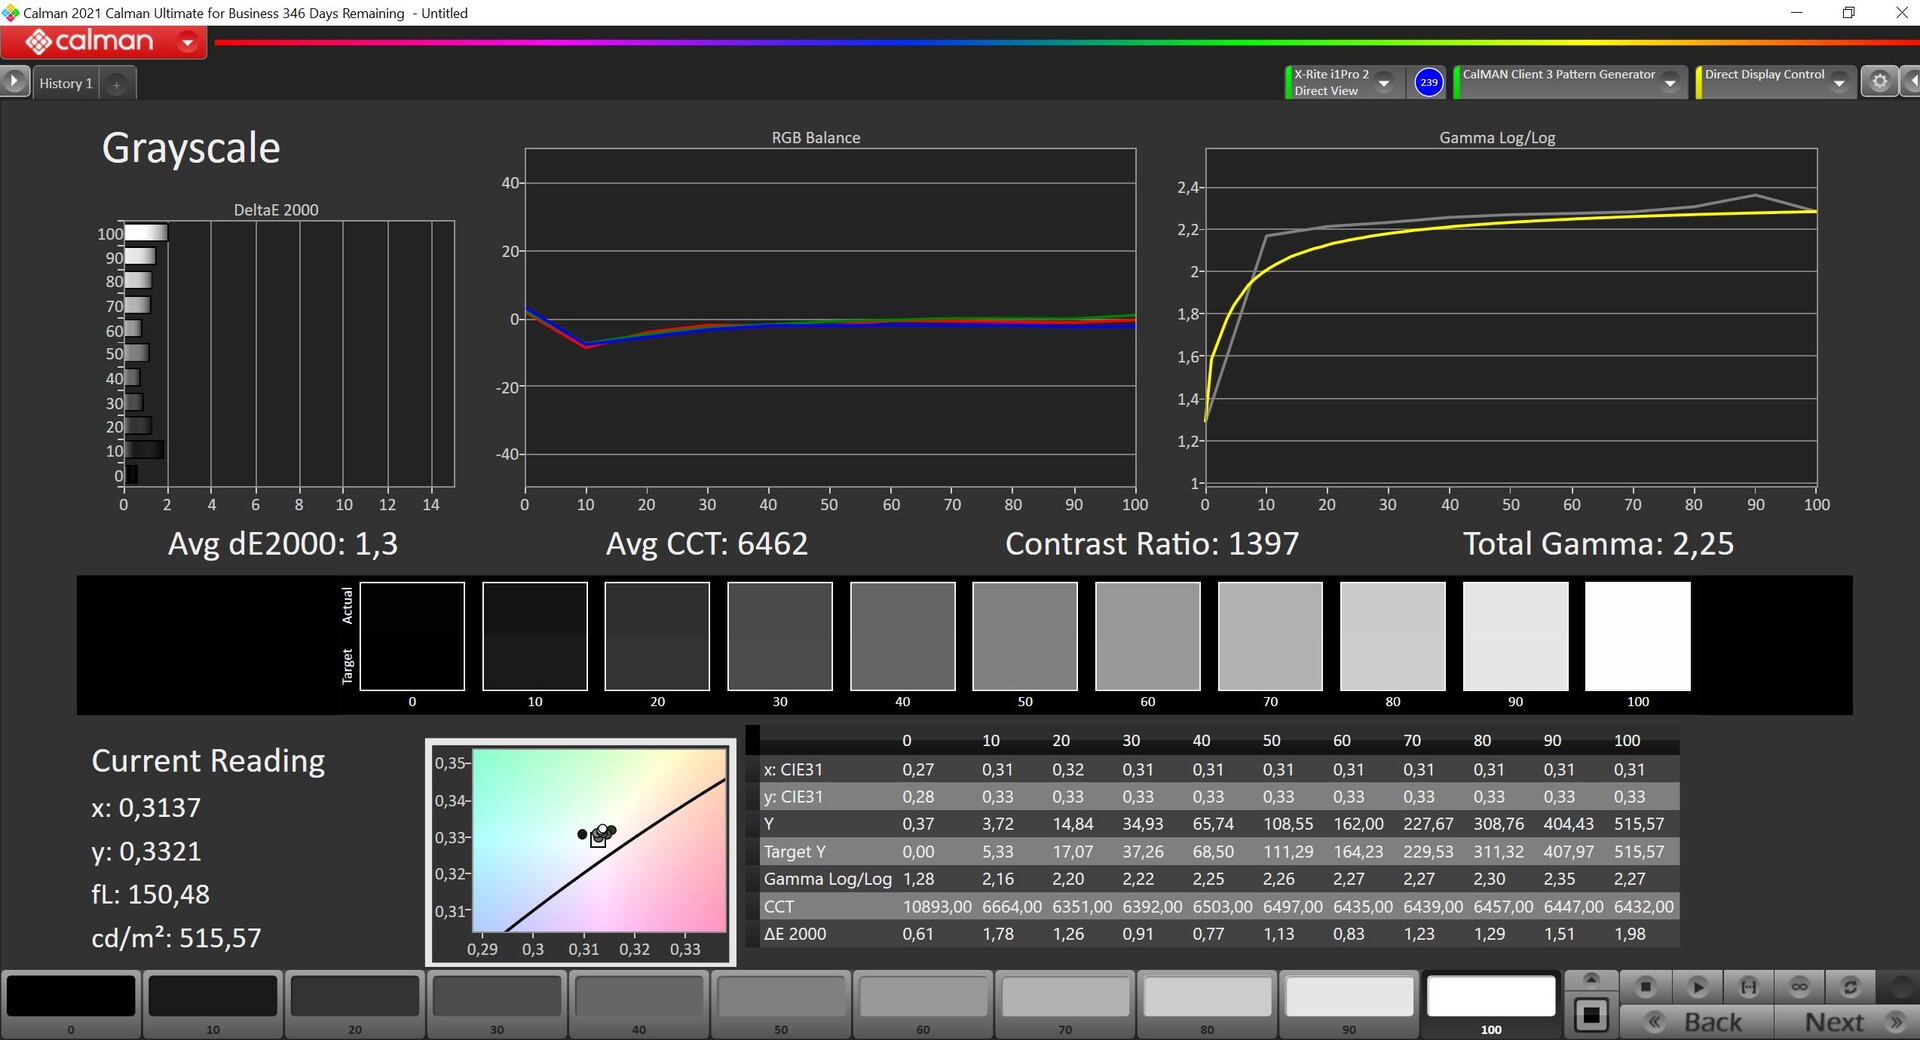
Lenovo annonce une luminosité de 500 cd/m², un chiffre que nous pouvons confirmer, du moins au centre de l'écran. La luminosité moyenne de notre échantillon mesure un peu moins de 485 cd/m², ce qui représente une amélioration substantielle par rapport à la dalle standard. La valeur du noir (0,36 cd/m²) est quelque peu affectée par la luminosité élevée. Néanmoins, le rapport de contraste maximal dépasse toujours 1400:1.
| |||||||||||||||||||||||||
Homogénéité de la luminosité: 89 %
Valeur mesurée au centre, sur batterie: 520 cd/m²
Contraste: 1447:1 (Valeurs des noirs: 0.36 cd/m²)
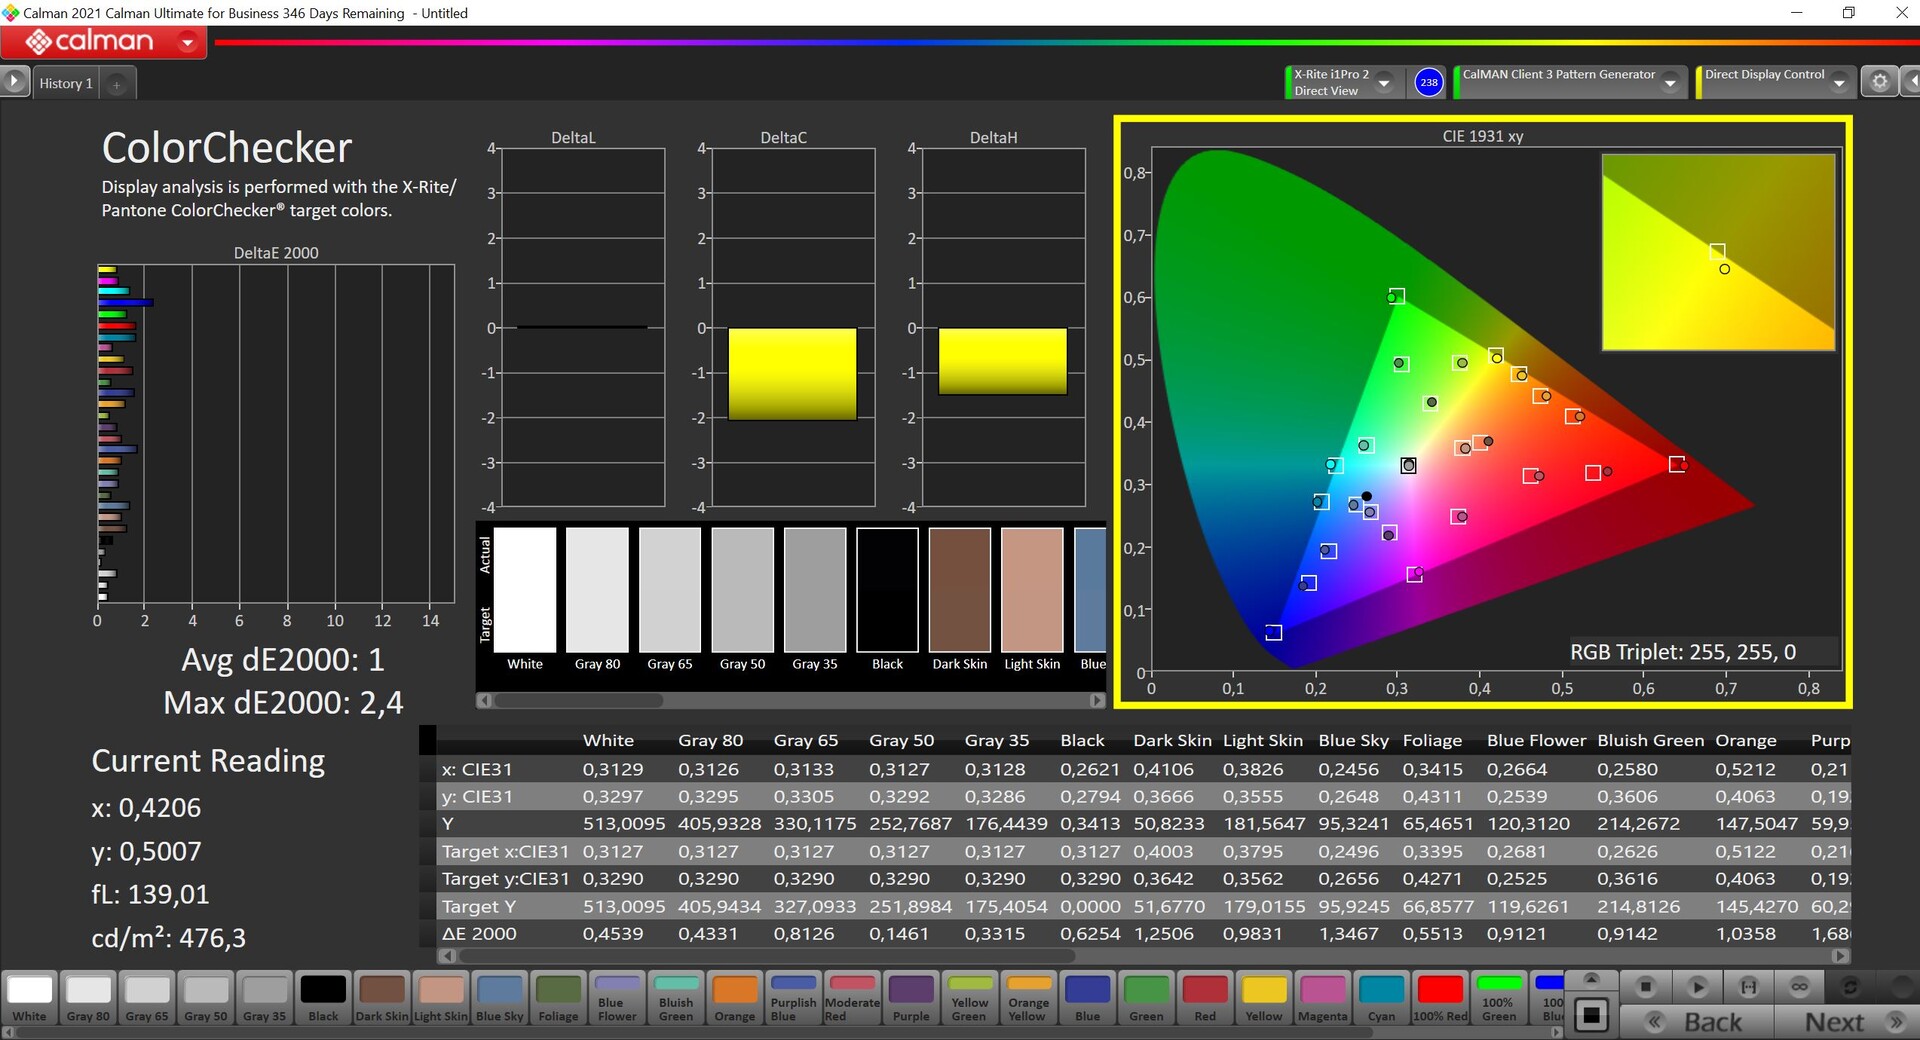
ΔE ColorChecker Calman: 1.2 | ∀{0.5-29.43 Ø4.71}
calibrated: 1
ΔE Greyscale Calman: 1.4 | ∀{0.09-98 Ø4.96}
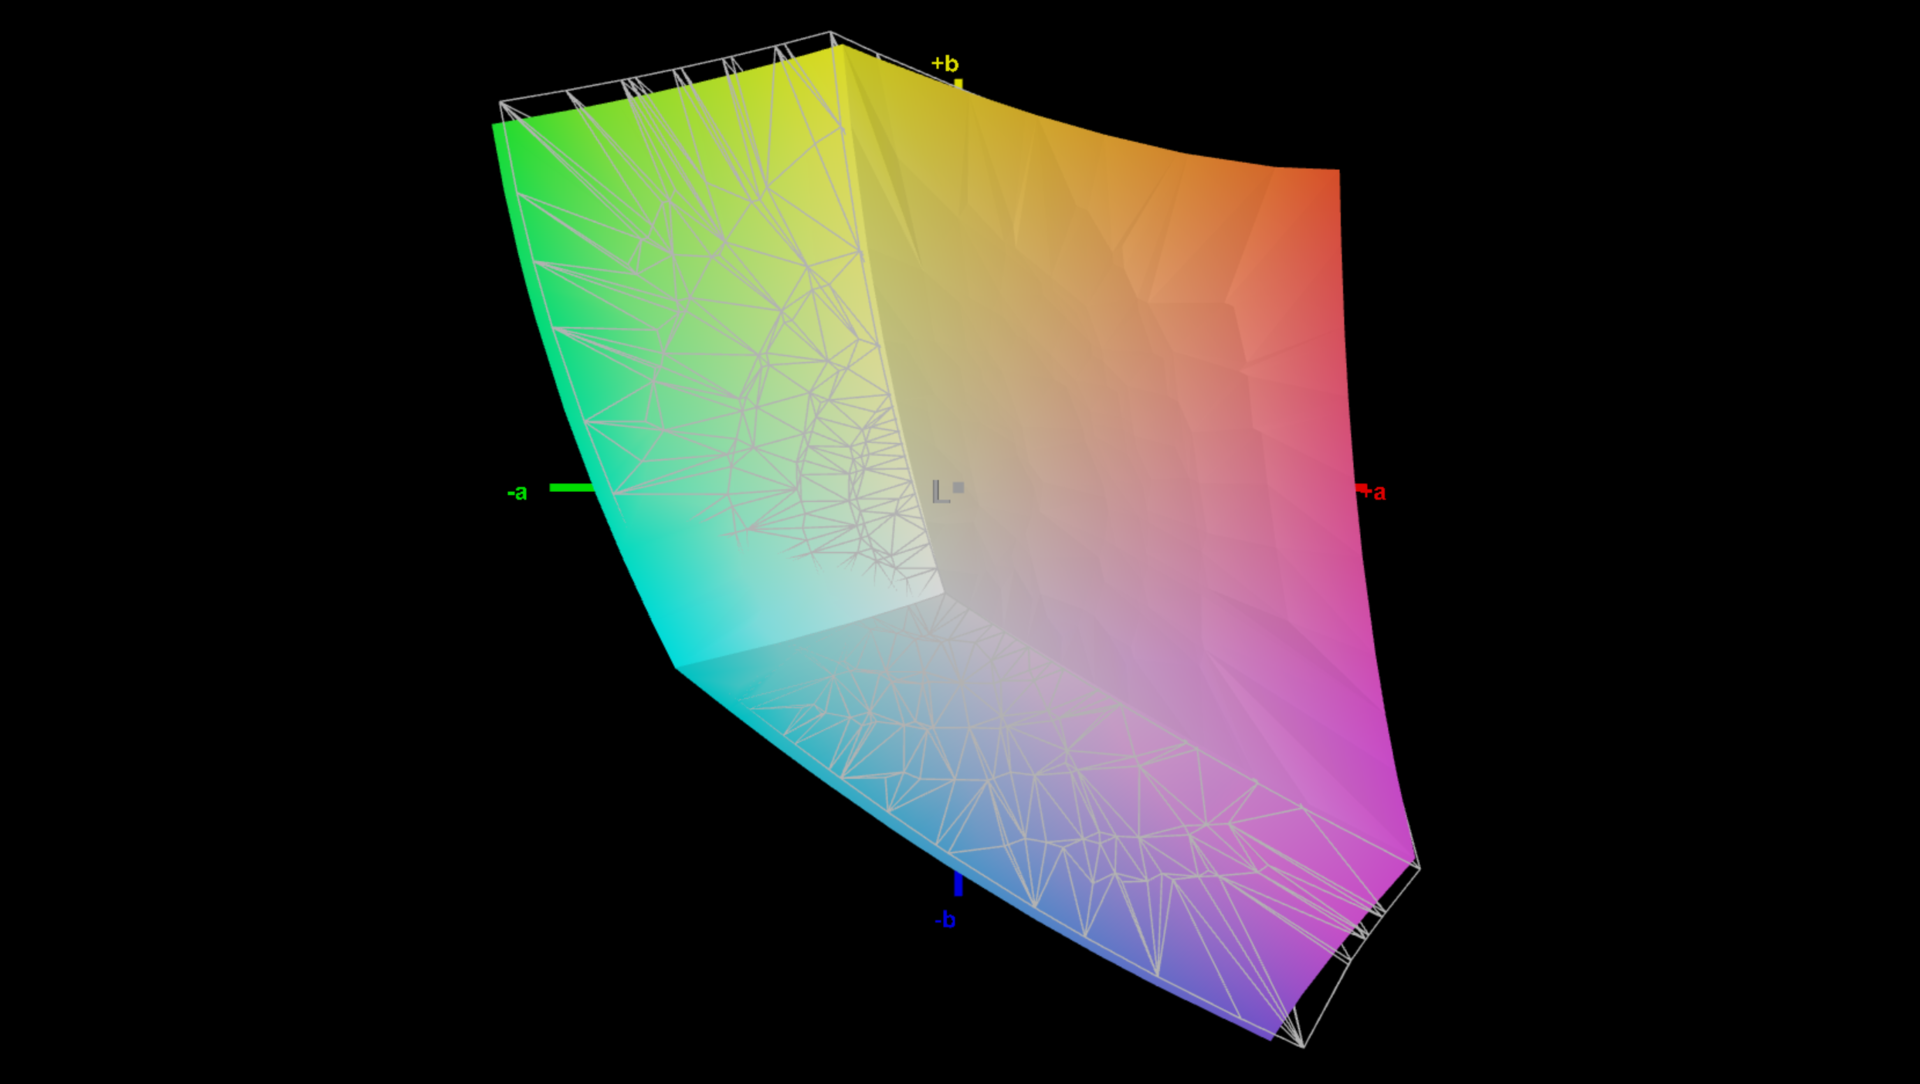
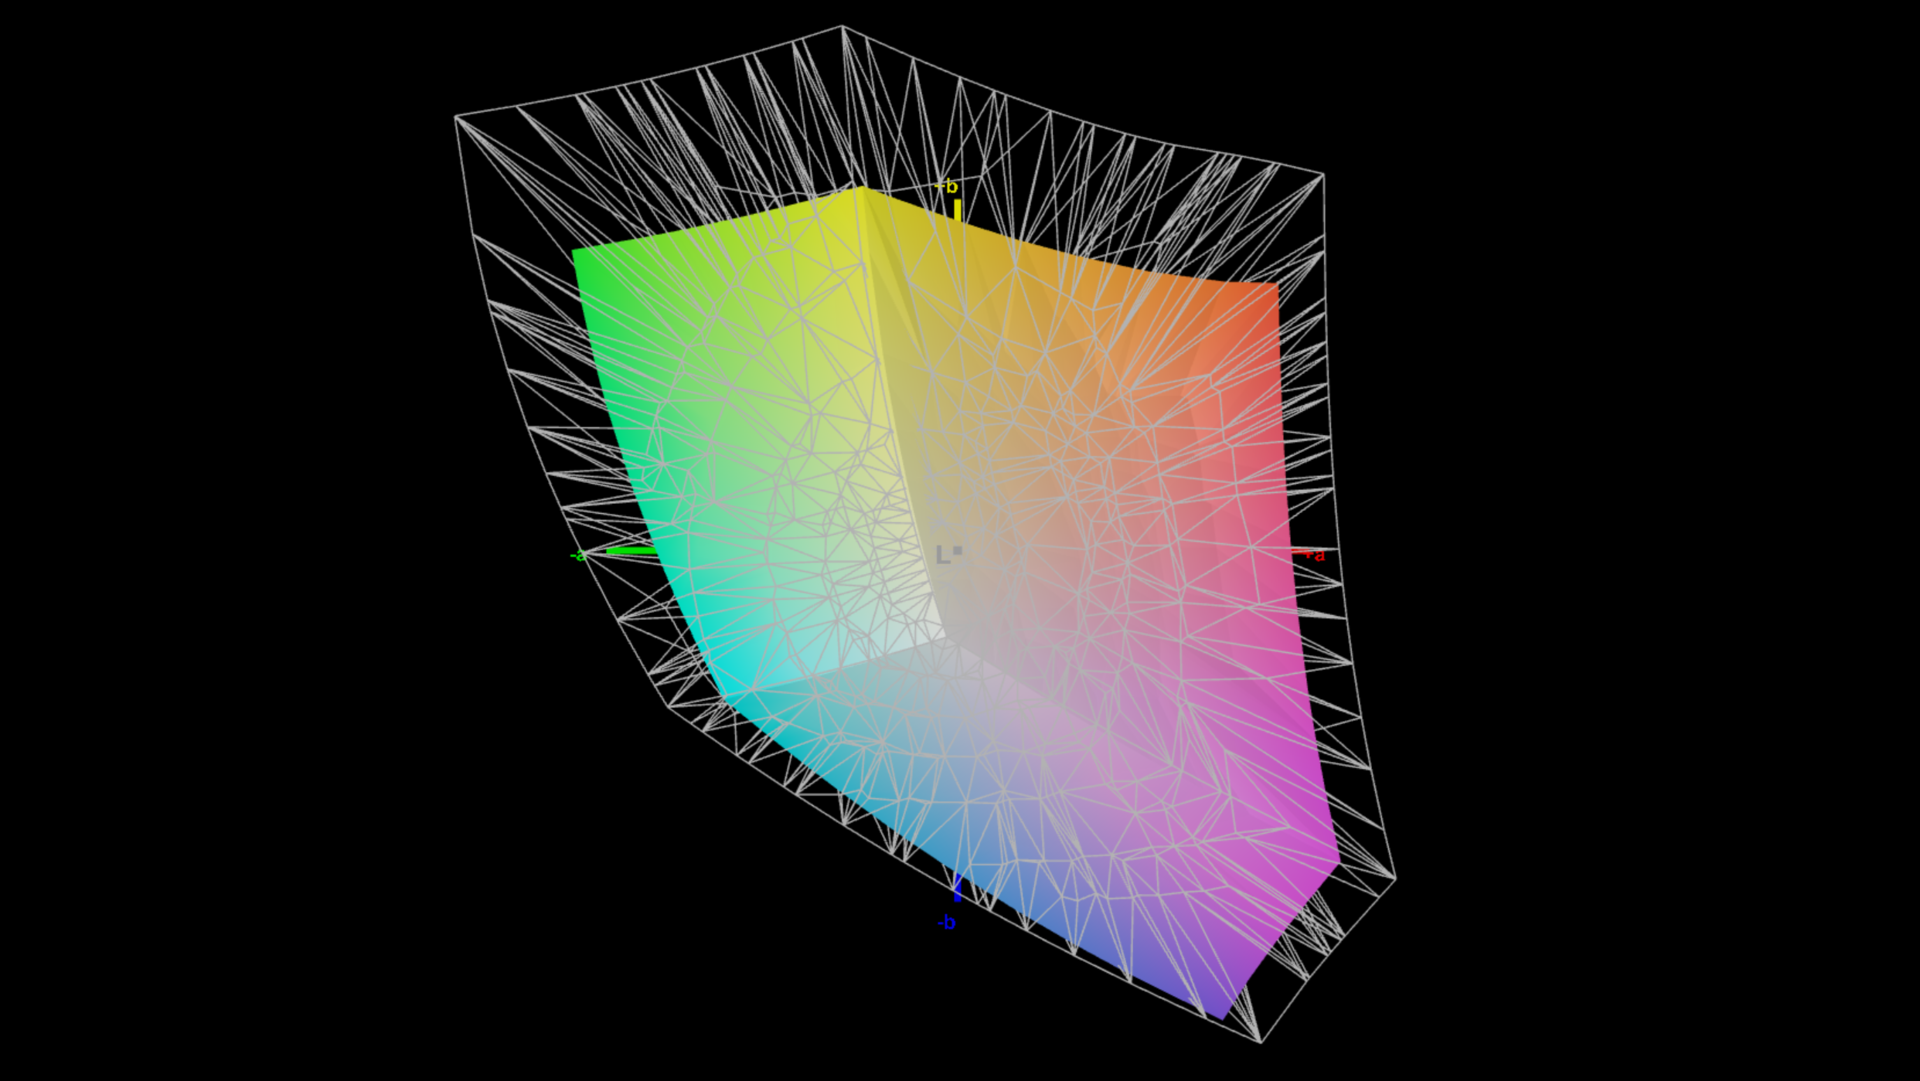
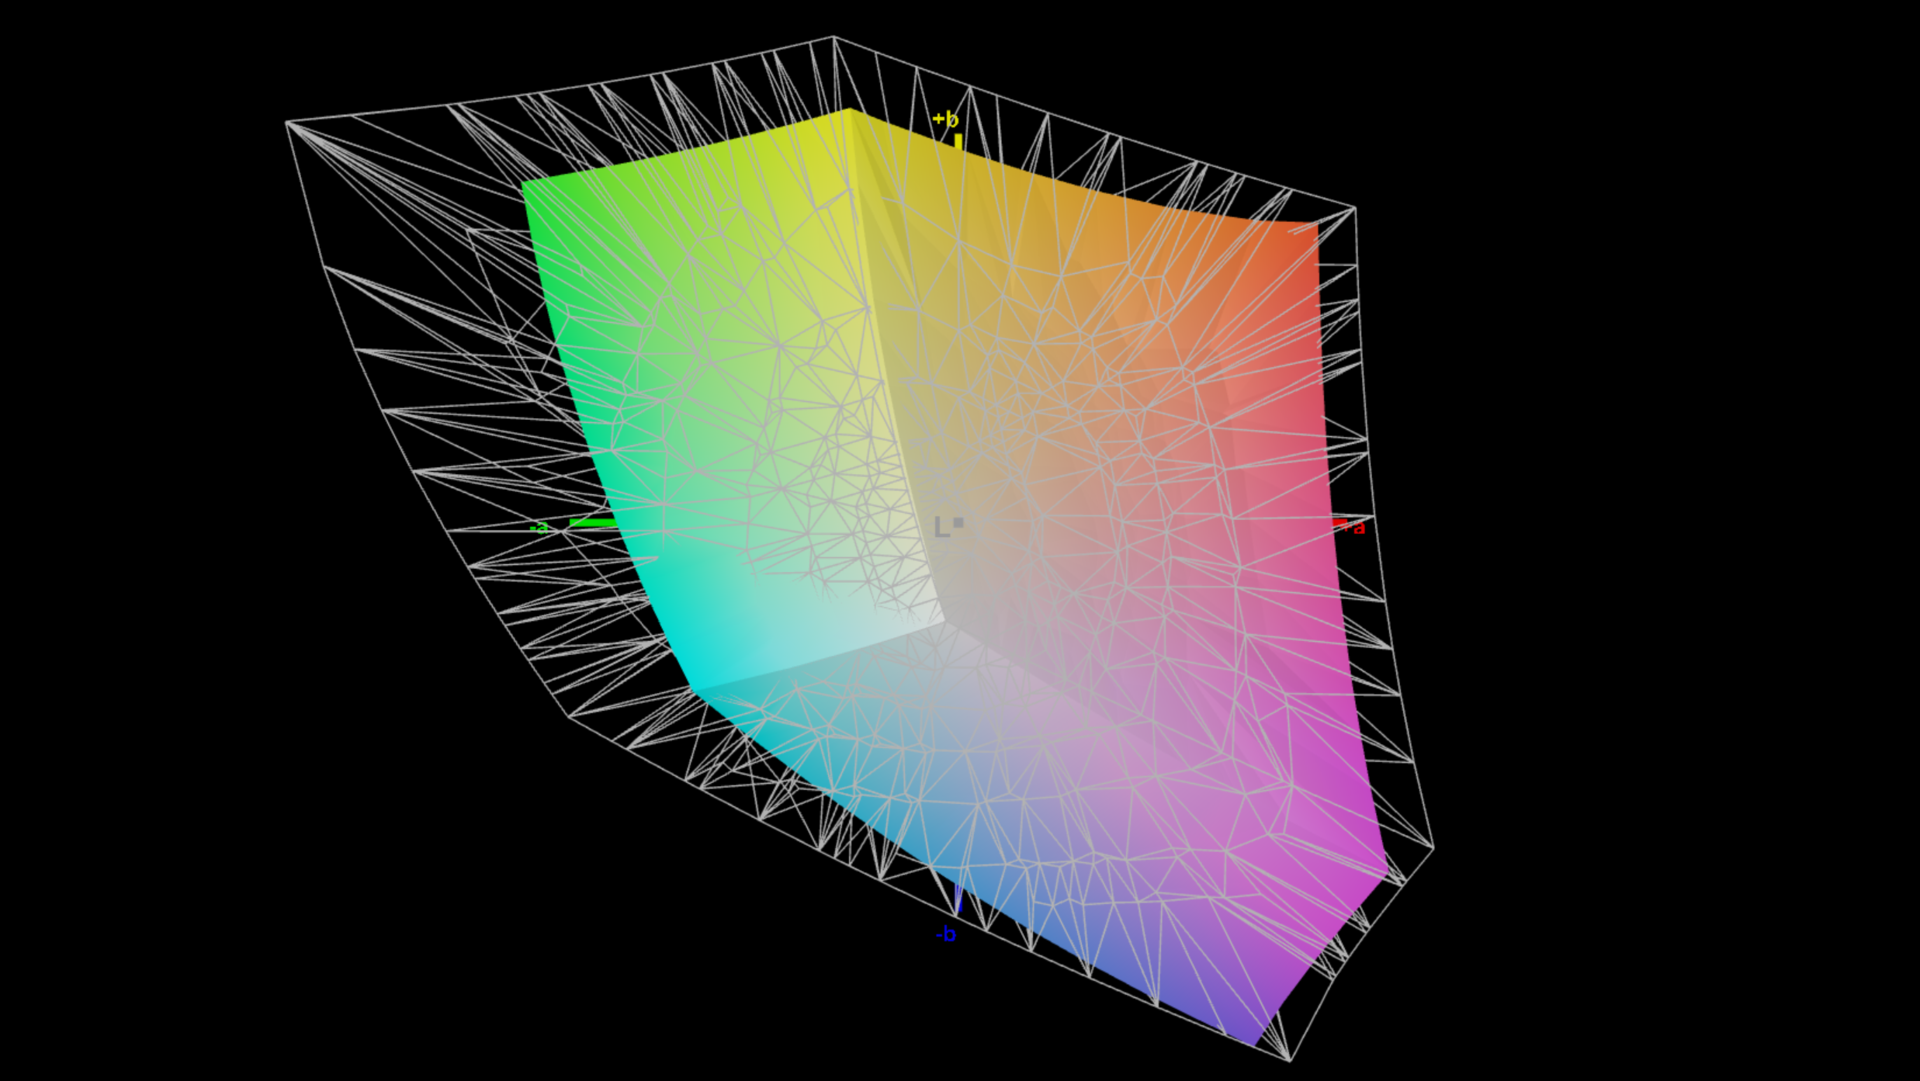
70.2% AdobeRGB 1998 (Argyll 3D)
97.5% sRGB (Argyll 3D)
68.1% Display P3 (Argyll 3D)
Gamma: 2.25
CCT: 6682 K
| Lenovo ThinkPad P1 G6-21FV000DGE NE160QDM-NY1, IPS, 2560x1600, 16" | Dell Precision 5000 5680 Samsung 160YV03, OLED, 3840x2400, 16" | Samsung Galaxy Book3 Ultra 16, i9-13900H RTX 4070 Samsung SDC4185 ATNA60CL03-0, OLED / AMOLED, 2880x1800, 16" | HP ZBook Studio 16 G9 62U04EA BOE0A52, IPS, 3840x2400, 16" | MSI CreatorPro Z16P B12UKST B160QAN02.N, IPS, 2560x1600, 16" | Schenker VISION 16 Pro (M23) NE160QDM-NZ1, IPS, 2560x1600, 16" | Lenovo ThinkPad X1 Extreme G5-21DE003RGE LP160UQ1-SPB1, IPS, 3840x2400, 16" | |
|---|---|---|---|---|---|---|---|
| Display | 30% | 27% | 23% | 23% | 1% | 22% | |
| Display P3 Coverage (%) | 68.1 | 99.9 47% | 95.3 40% | 97.5 43% | 97.6 43% | 68.8 1% | 84.6 24% |
| sRGB Coverage (%) | 97.5 | 100 3% | 99.1 2% | 99.9 2% | 99.9 2% | 98.8 1% | 99.2 2% |
| AdobeRGB 1998 Coverage (%) | 70.2 | 97.5 39% | 97.4 39% | 86.3 23% | 87.4 25% | 70 0% | 97.7 39% |
| Response Times | 85% | 82% | 12% | 15% | 8% | -168% | |
| Response Time Grey 50% / Grey 80% * (ms) | 13.7 ? | 1.68 ? 88% | 2 ? 85% | 15.3 ? -12% | 12.8 ? 7% | 13.7 ? -0% | 46 ? -236% |
| Response Time Black / White * (ms) | 9.6 ? | 1.77 ? 82% | 2 ? 79% | 6.1 ? 36% | 7.4 ? 23% | 8.1 ? 16% | 19.2 ? -100% |
| PWM Frequency (Hz) | 60 ? | 250 ? | |||||
| Screen | -79% | -51% | 0% | -10% | -74% | -29% | |
| Brightness middle (cd/m²) | 521 | 345.7 -34% | 403 -23% | 554 6% | 407 -22% | 384 -26% | 476 -9% |
| Brightness (cd/m²) | 484 | 349 -28% | 408 -16% | 516 7% | 388 -20% | 371 -23% | 470 -3% |
| Brightness Distribution (%) | 89 | 98 10% | 98 10% | 84 -6% | 88 -1% | 88 -1% | 90 1% |
| Black Level * (cd/m²) | 0.36 | 0.47 -31% | 0.36 -0% | 0.3 17% | 0.35 3% | ||
| Contrast (:1) | 1447 | 1179 -19% | 1131 -22% | 1280 -12% | 1360 -6% | ||
| Colorchecker dE 2000 * | 1.2 | 3.59 -199% | 2.63 -119% | 1 17% | 1.3 -8% | 3.4 -183% | 1.9 -58% |
| Colorchecker dE 2000 max. * | 2.5 | 7.02 -181% | 4.07 -63% | 2.4 4% | 2.5 -0% | 9.2 -268% | 4.7 -88% |
| Colorchecker dE 2000 calibrated * | 1 | 0.99 1% | 0.6 40% | 0.7 30% | 1.3 -30% | 1.3 -30% | |
| Greyscale dE 2000 * | 1.4 | 3.1 -121% | 2.69 -92% | 1.6 -14% | 2.1 -50% | 3.4 -143% | 2.4 -71% |
| Gamma | 2.25 98% | 2.13 103% | 2.48 89% | 2.29 96% | 2.26 97% | 2.16 102% | 2.24 98% |
| CCT | 6682 97% | 6448 101% | 6907 94% | 6458 101% | 6437 101% | 7462 87% | 6377 102% |
| Moyenne finale (programmes/paramètres) | 12% /
-24% | 19% /
-5% | 12% /
7% | 9% /
1% | -22% /
-47% | -58% /
-38% |
* ... Moindre est la valeur, meilleures sont les performances
Chaque écran du ThinkPad P1 Gen 6 est calibré en usine et les clients peuvent choisir parmi une variété de profils de couleurs. Le profil par défaut présente d'excellentes valeurs, comme le montre notre analyse à l'aide du logiciel professionnel CalMAN. Ces valeurs sont déjà très impressionnantes, aucun écart DeltaE-2000 ne dépassant 3, que ce soit en niveaux de gris ou en couleurs. Le seul petit bémol concerne la température des couleurs en niveaux de gris, qui pourrait être un peu plus chaude. Il s'agit d'un problème insignifiant, et les utilisateurs ne sont pas tenus de procéder à un étalonnage supplémentaire. Nous avons pu minimiser légèrement les écarts de couleur et rapprocher la température de couleur de la valeur optimale en utilisant notre propre étalonnage (le profil correspondant est disponible en téléchargement gratuit ci-dessus).

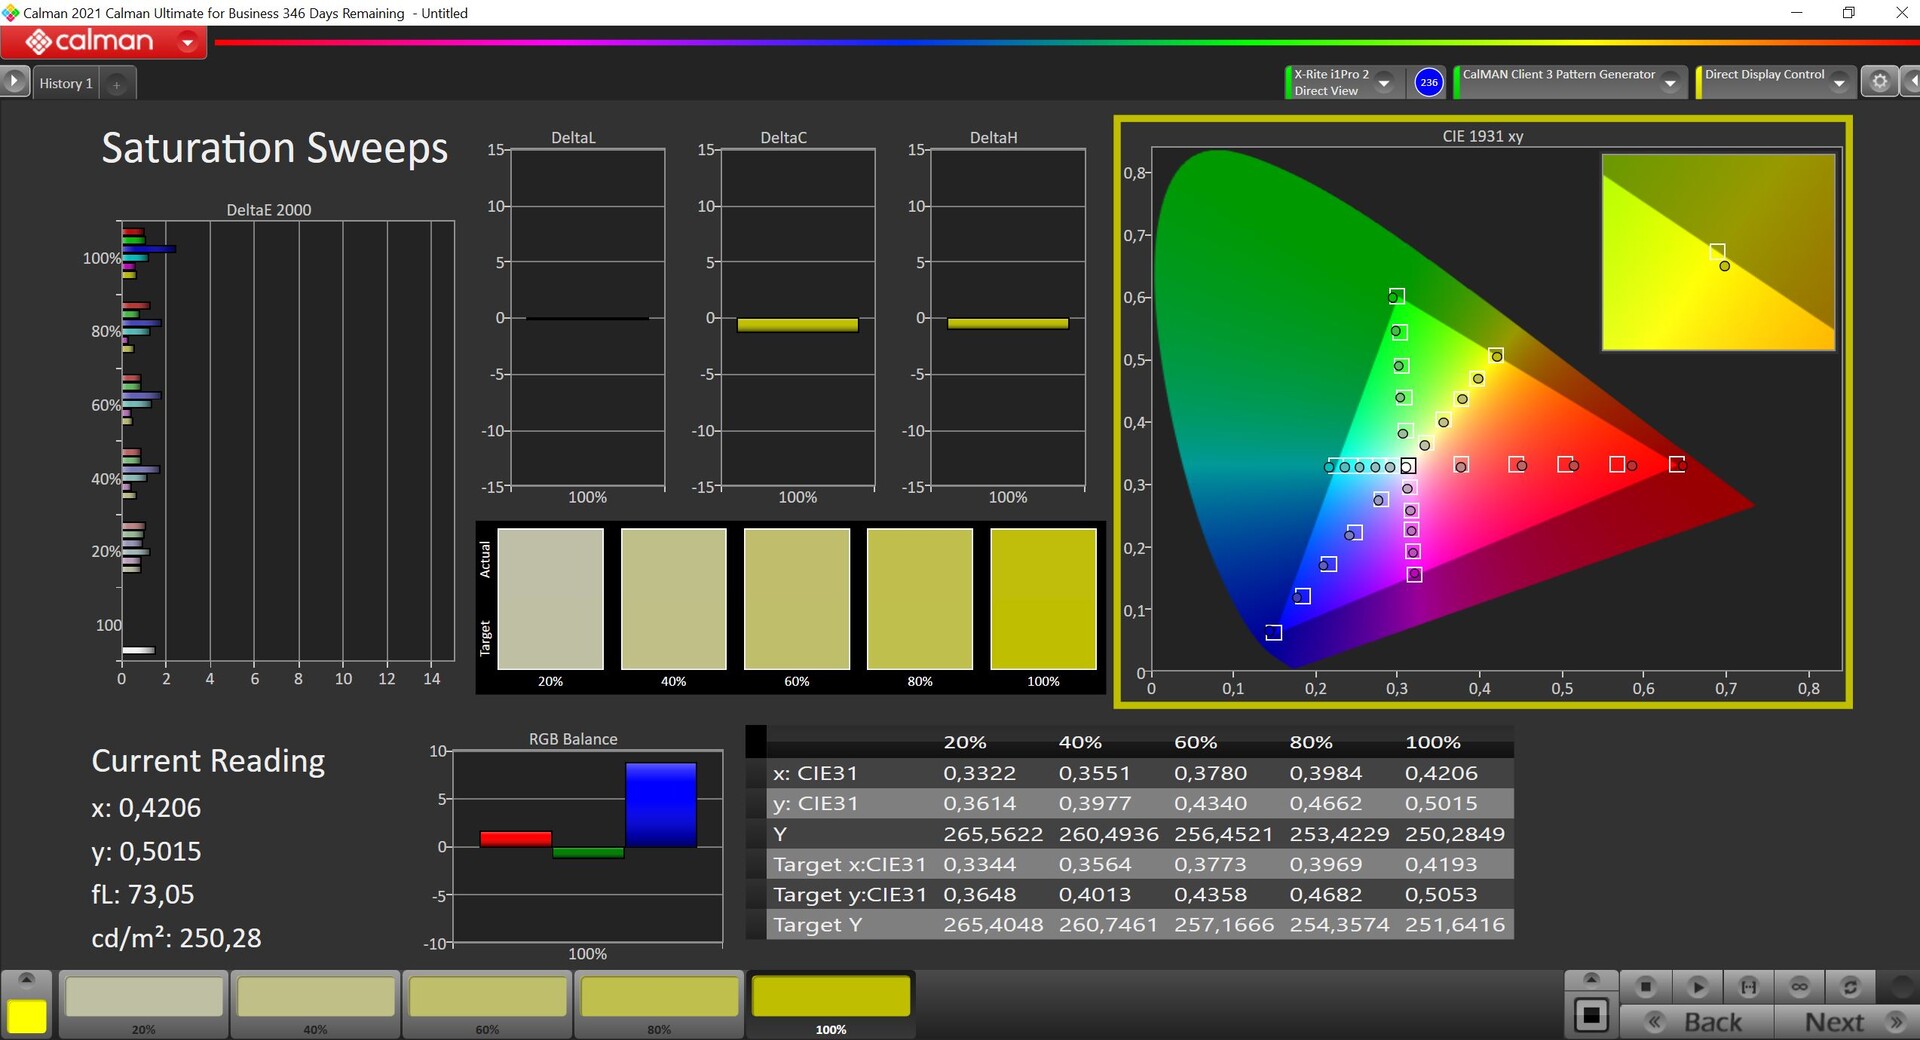

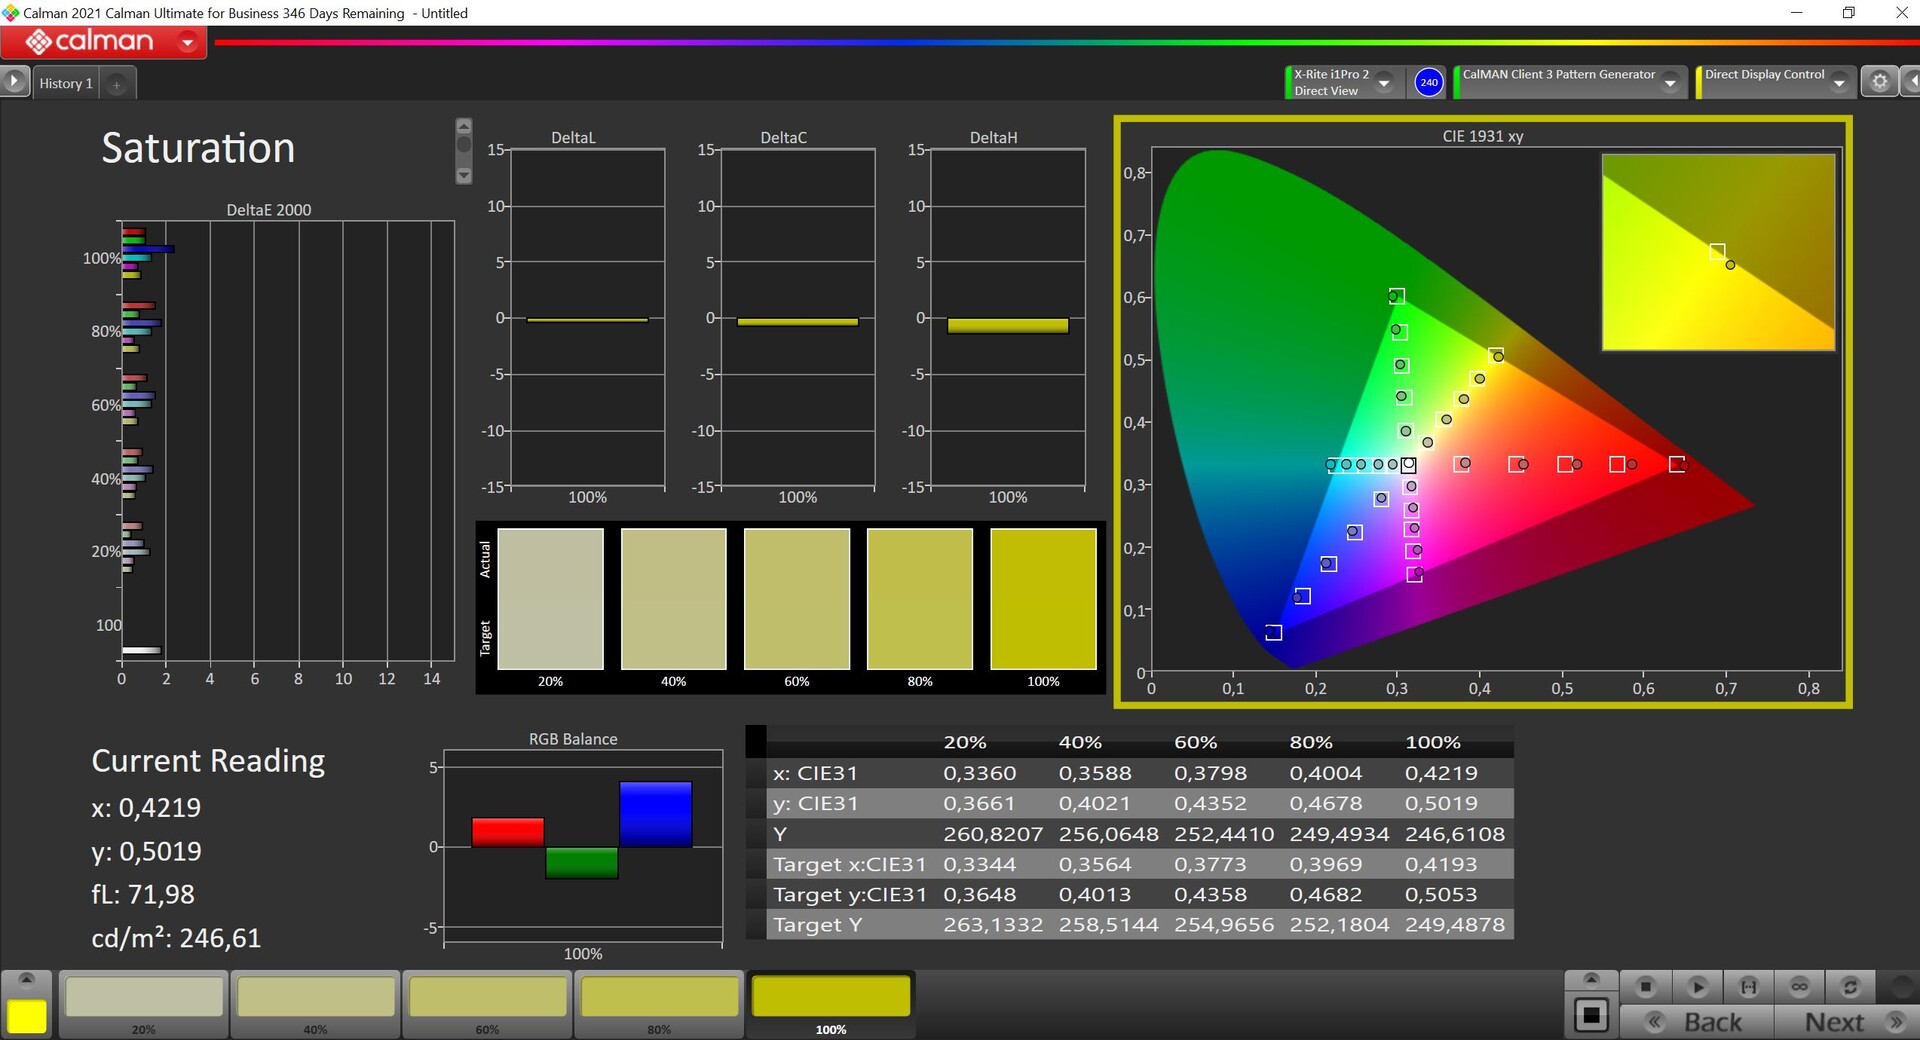
L'écran couvre entièrement l'espace colorimétrique sRGB, ce qui est suffisant pour de nombreuses applications. Si vous avez besoin de l'espace colorimétrique P3 plus large, vous devrez utiliser le panneau OLED, mais nous recommandons généralement le panneau 165 Hz en raison des inconvénients de l'OLED tels que le PWM et la consommation d'énergie plus élevée.
Temps de réponse de l'écran
| ↔ Temps de réponse noir à blanc | ||
|---|---|---|
| 9.6 ms ... hausse ↗ et chute ↘ combinées | ↗ 4.8 ms hausse | 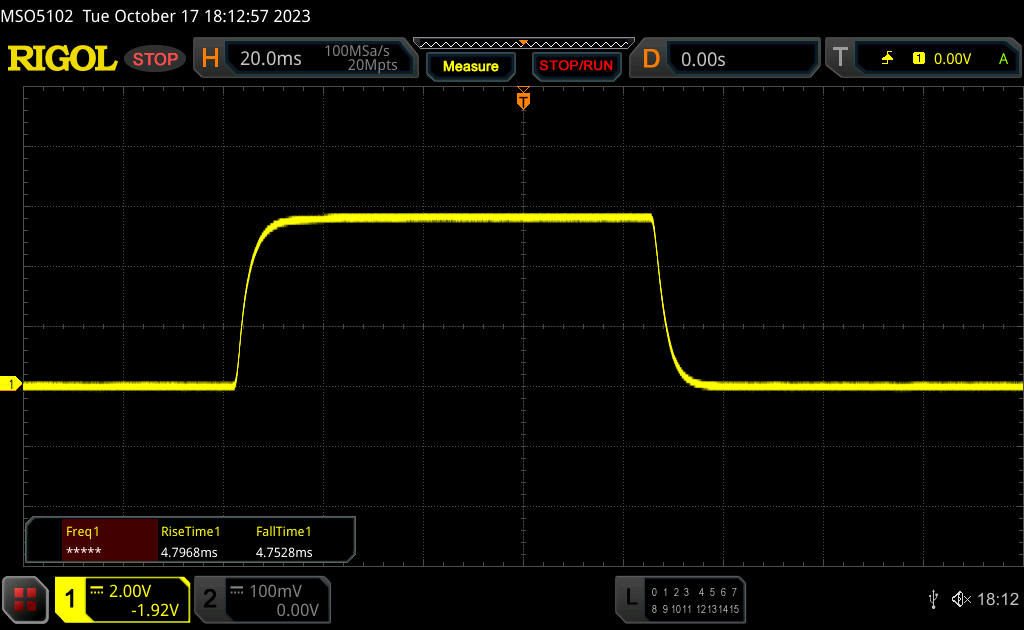 |
| ↘ 4.8 ms chute | ||
| L'écran montre de faibles temps de réponse, un bon écran pour jouer. En comparaison, tous les appareils testés affichent entre 0.1 (minimum) et 240 (maximum) ms. » 26 % des appareils testés affichent de meilleures performances. Cela signifie que les latences relevées sont meilleures que la moyenne (19.8 ms) de tous les appareils testés. | ||
| ↔ Temps de réponse gris 50% à gris 80% | ||
| 13.7 ms ... hausse ↗ et chute ↘ combinées | ↗ 6.7 ms hausse | 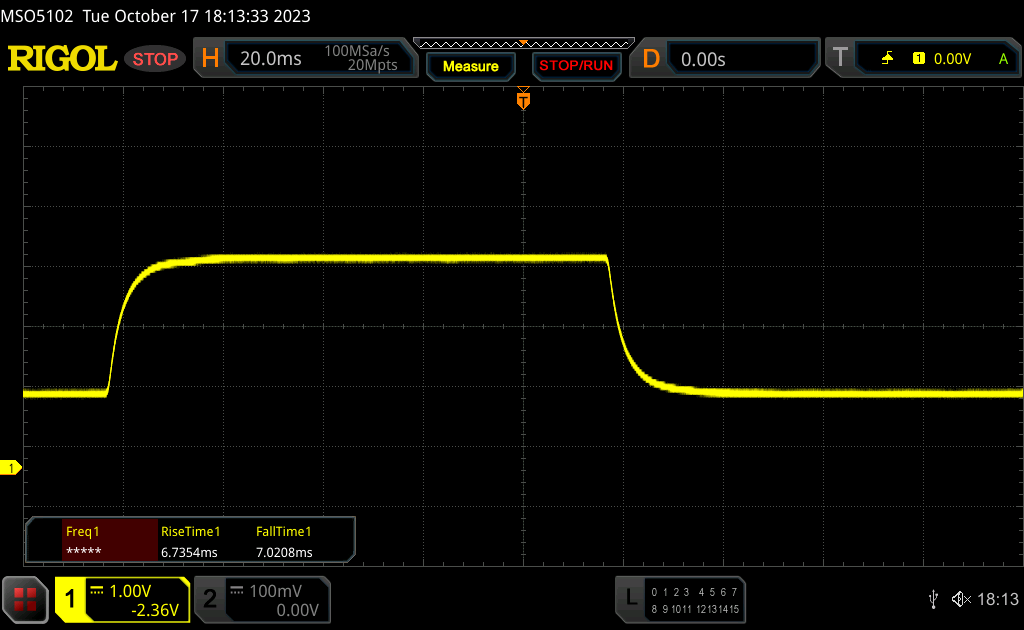 |
| ↘ 7 ms chute | ||
| L'écran montre de bons temps de réponse, mais insuffisant pour du jeu compétitif. En comparaison, tous les appareils testés affichent entre 0.165 (minimum) et 636 (maximum) ms. » 28 % des appareils testés affichent de meilleures performances. Cela signifie que les latences relevées sont meilleures que la moyenne (30.9 ms) de tous les appareils testés. | ||
Scintillement / MLI (Modulation de largeur d'impulsion)
| Scintillement / MLI (Modulation de largeur d'impulsion) non décelé |  | ||
En comparaison, 52 % des appareils testés n'emploient pas MDI pour assombrir leur écran. Nous avons relevé une moyenne à 7741 (minimum : 5 - maximum : 343500) Hz dans le cas où une MDI était active. | |||
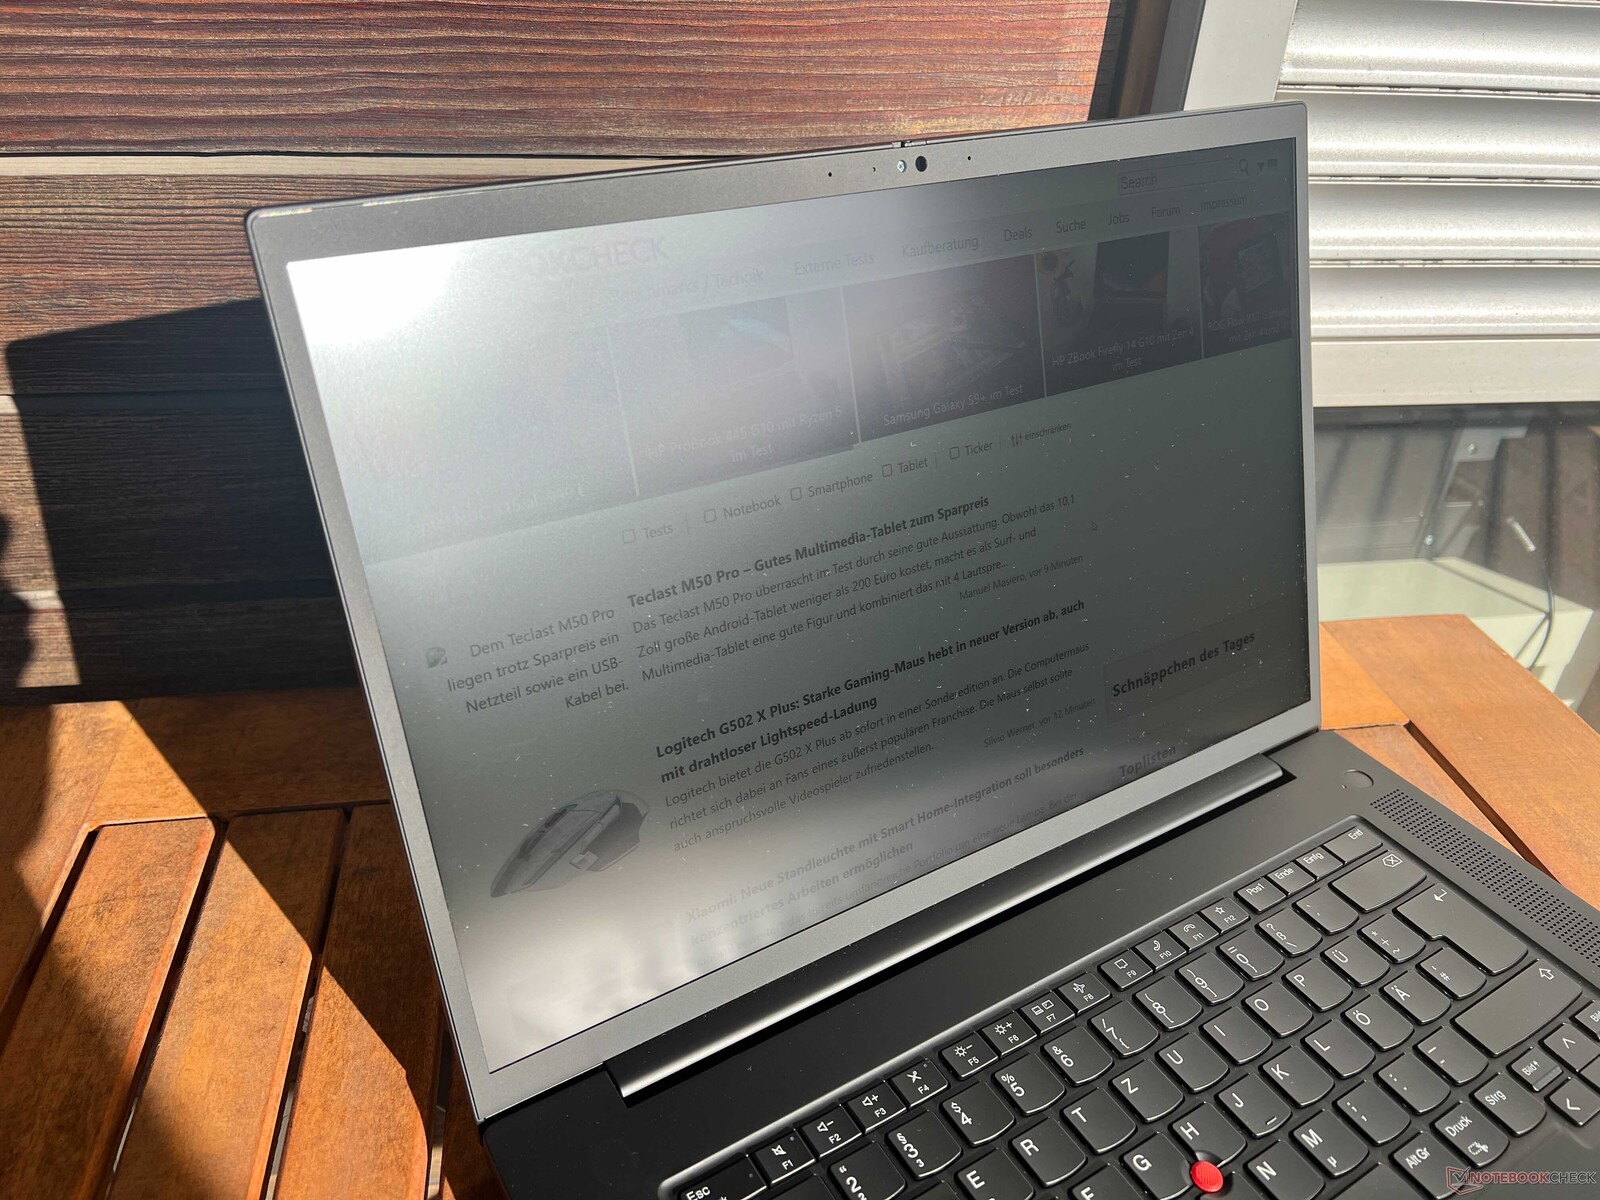
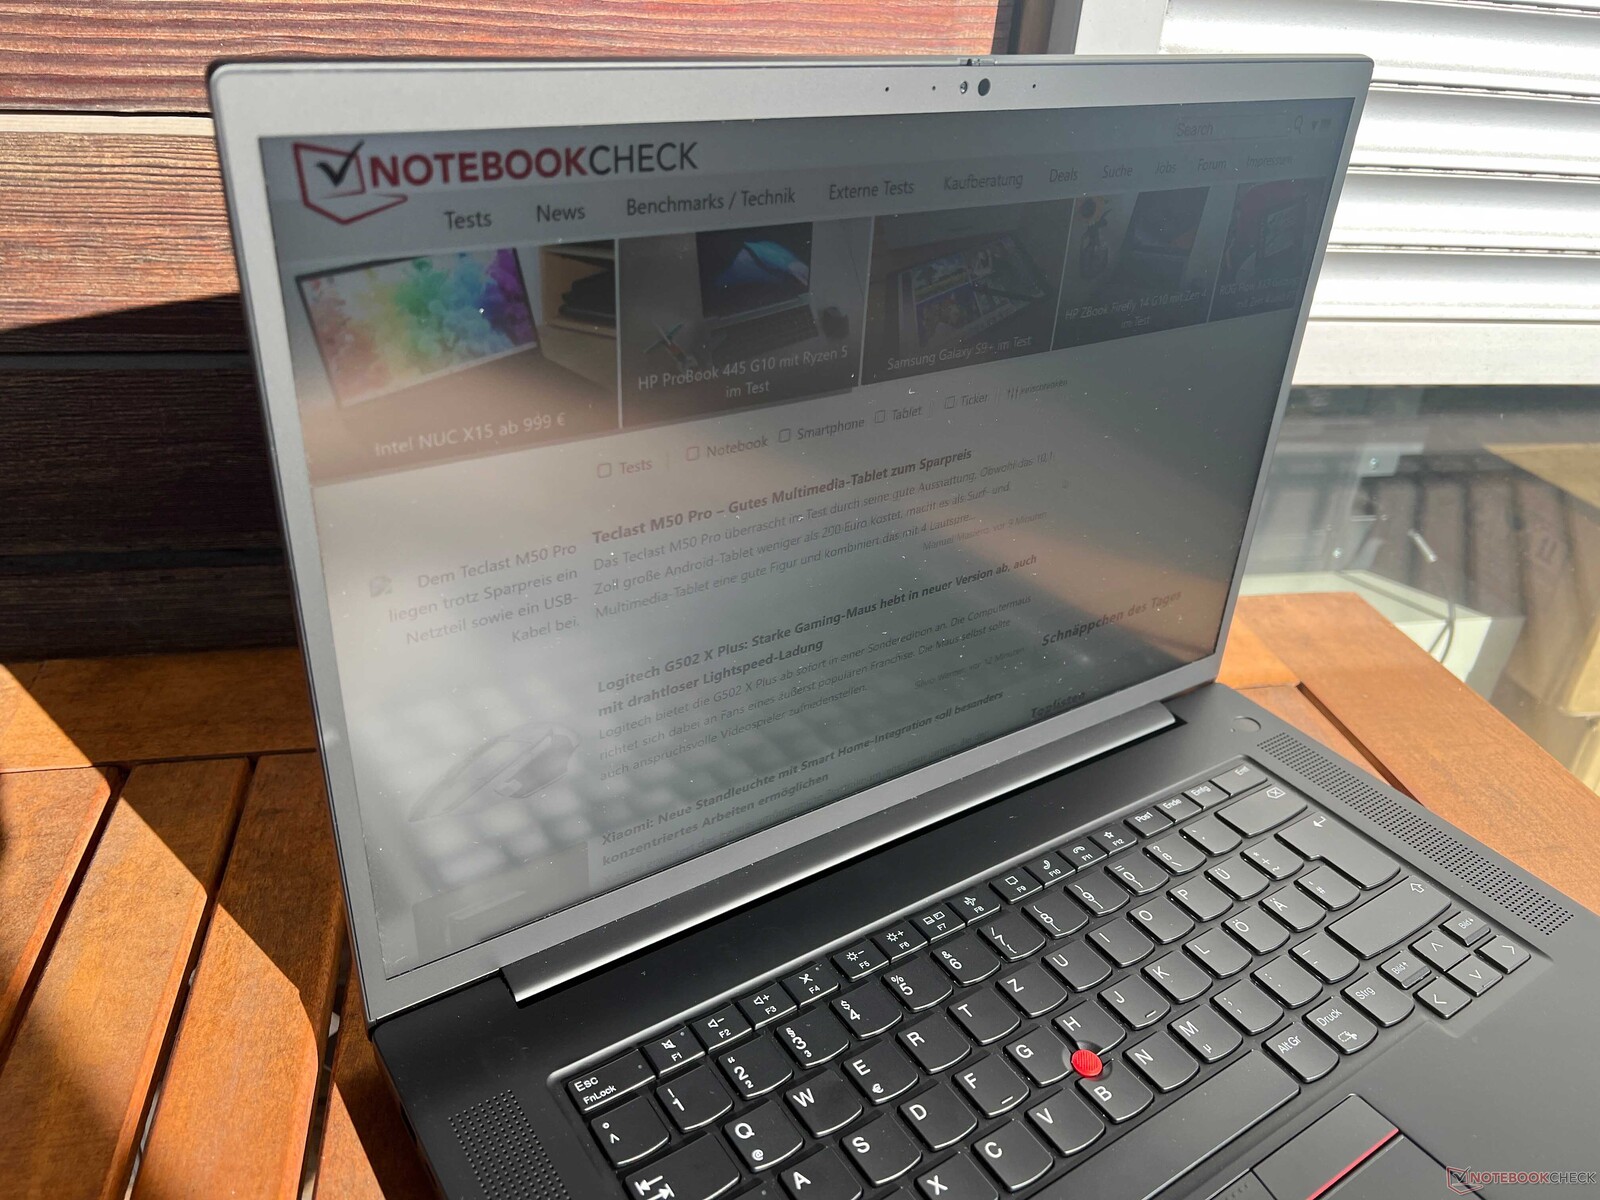
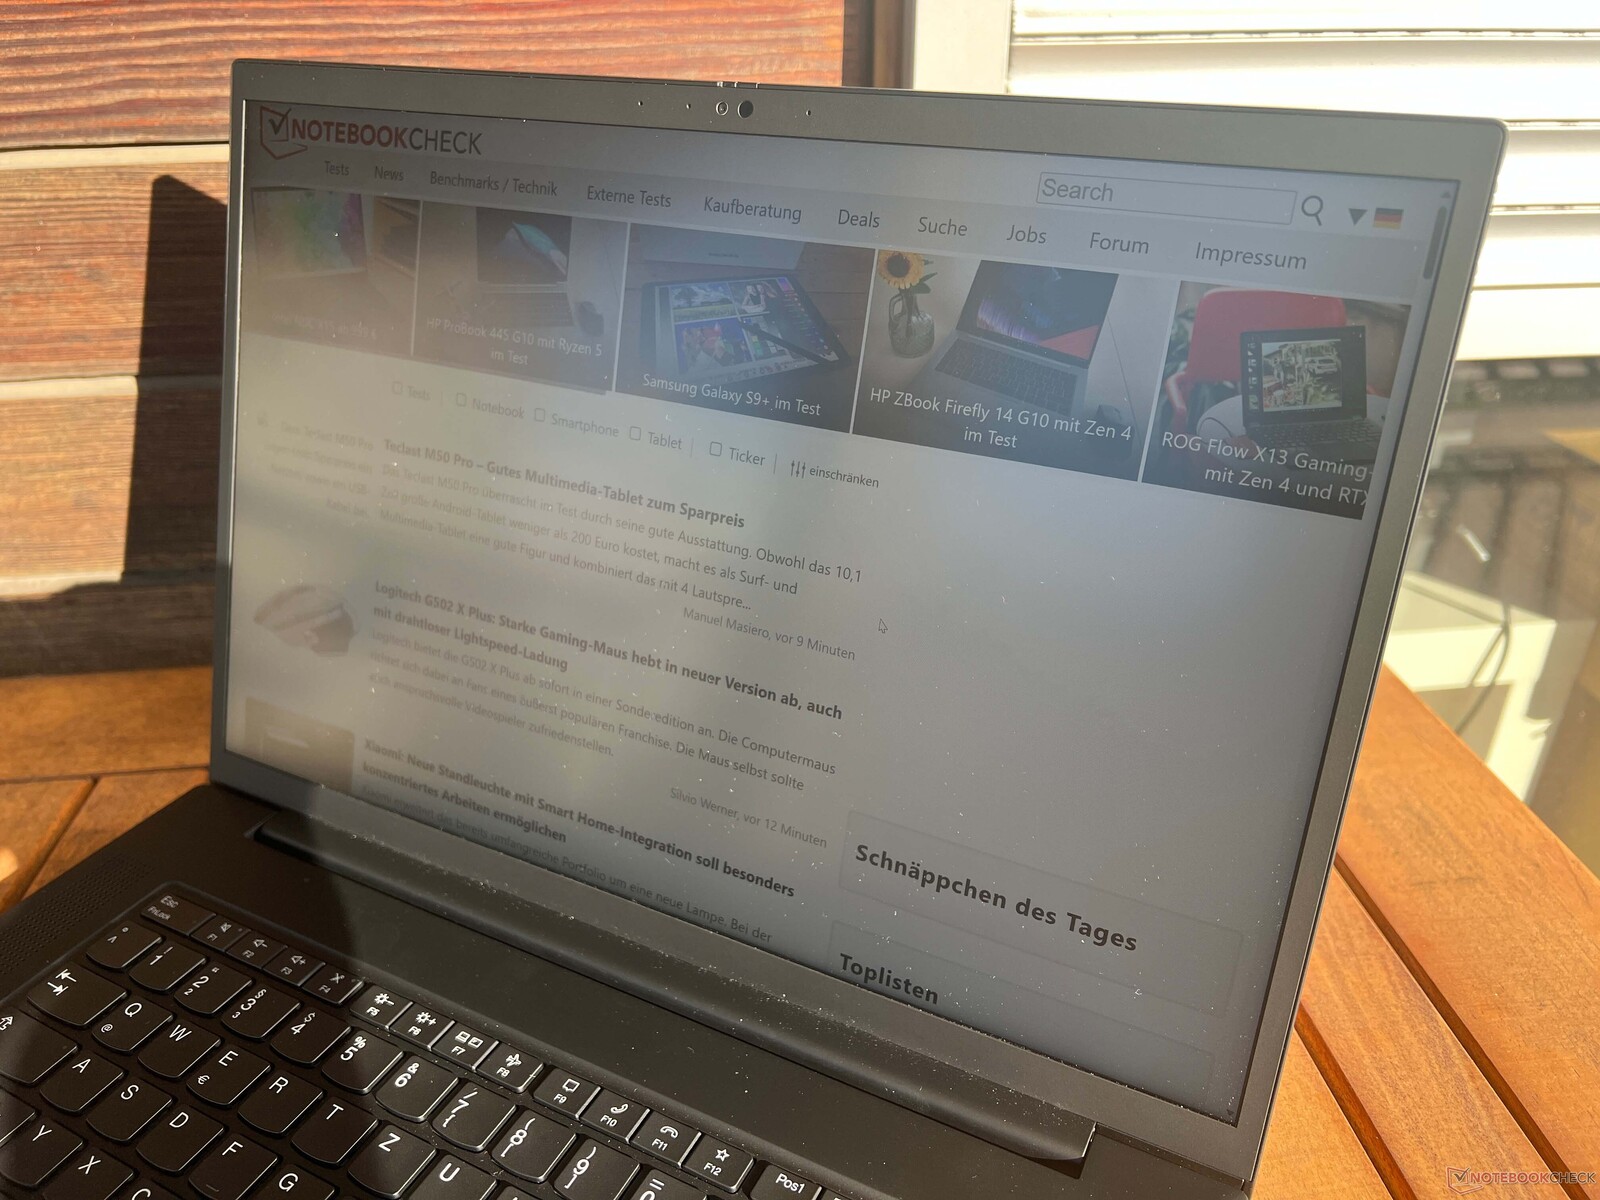
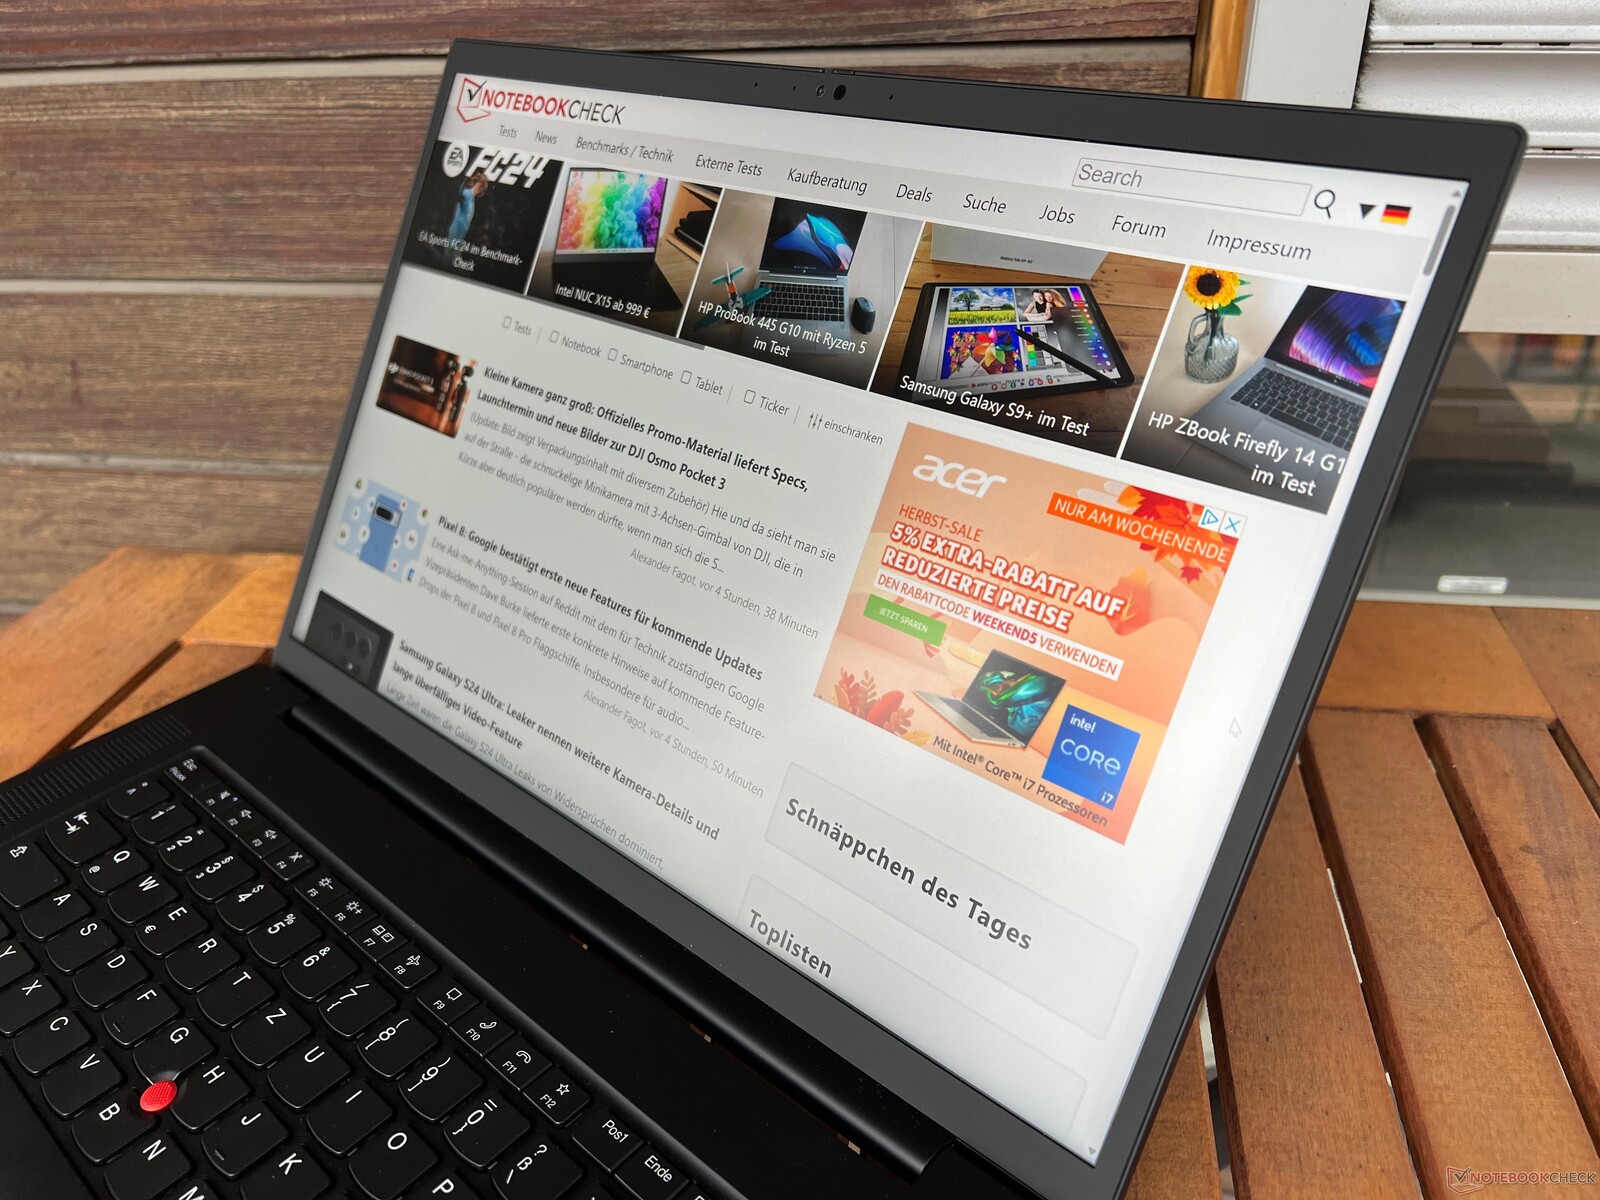
L'écran mat est utilisable en extérieur, bien qu'il devienne difficile à utiliser en plein soleil. Le panneau IPS offre une excellente stabilité de l'angle de vision.

Performance - Raptor Lake et Ada Lovelace
Conditions d'essai
Lenovo n'utilise plus de profils d'alimentation distincts sur les modèles ThinkPad depuis un certain temps. Les paramètres Smart Cooling sont directement liés aux profils d'alimentation standard de Windows. Pour les tests et mesures suivants, nous avons utilisé le profil Meilleures performances comme paramètre par défaut.
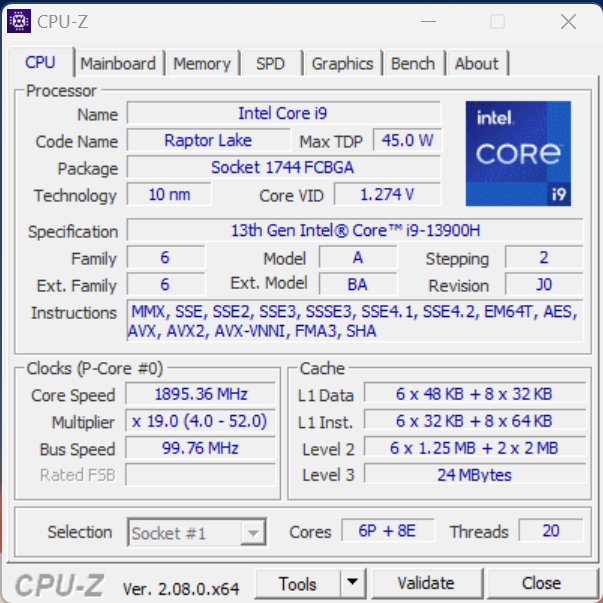
Processeur - Core i7-13900H
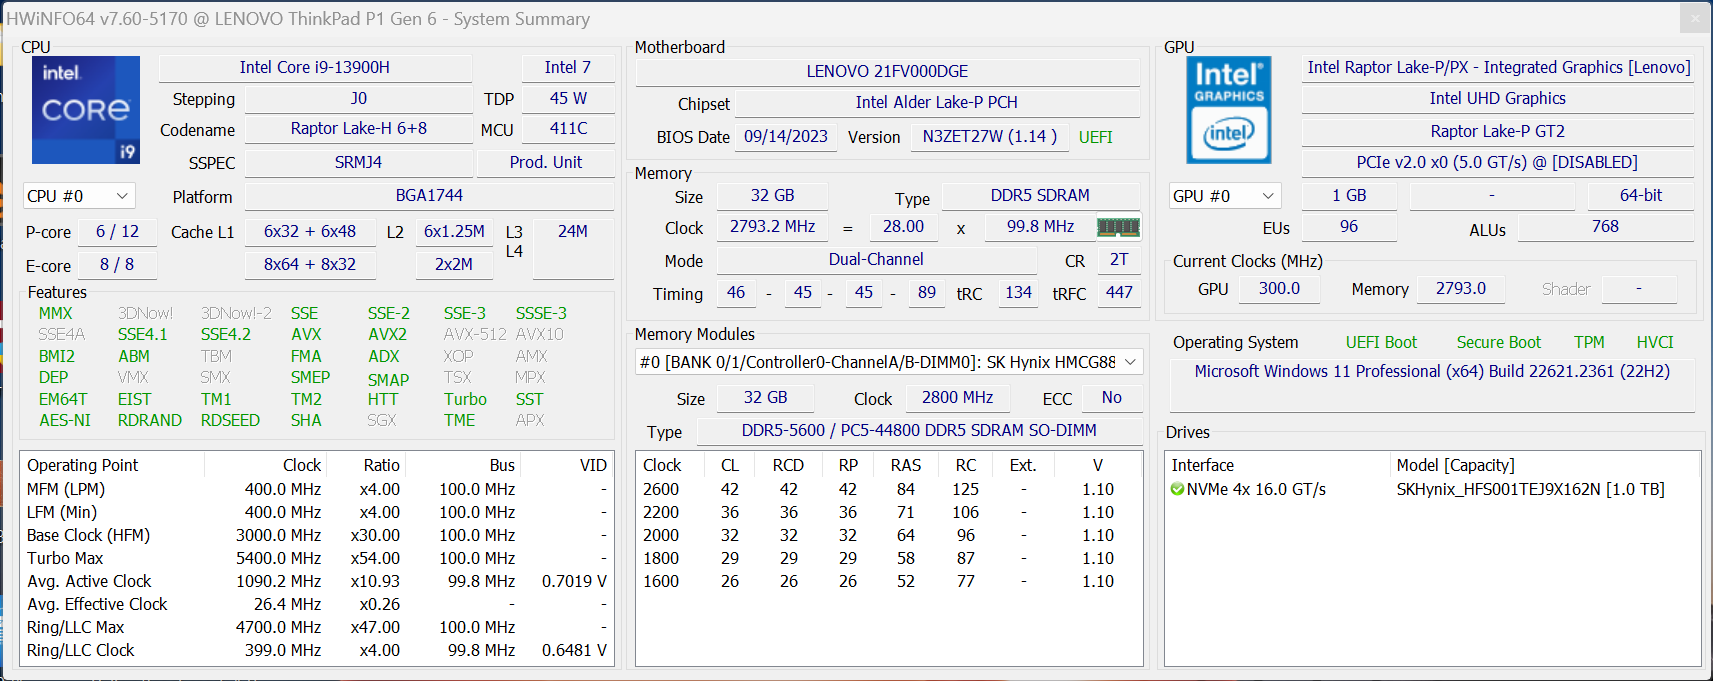
Le Intel Core i9-13900H de la génération Raptor-Lake possède 6 cœurs de haute performance et 8 cœurs d'efficacité et peut gérer jusqu'à 20 threads. Sa vitesse d'horloge maximale est nettement plus élevée que celle du Core i7-13700H et prend en charge les capacités vPro. Bien qu'il y ait eu des changements mineurs dans notre test en boucle Cinebench, le processeur de notre ThinkPad P1 Gen 6 peut consommer jusqu'à 96 watts temporairement et environ 84 watts continuellement. Dans l'ensemble, les résultats obtenus avec un seul cœur sont bons, mais les performances multicœurs ont plus de potentiel. Il est concevable que les processeurs dotés de la chambre à vapeur offrent de meilleures performances. Lorsqu'il fonctionne sur batterie, le processeur est limité à 57 watts d'utilisation maximale, ce qui se traduit par des performances multicœurs inférieures d'environ 25 %. Vous trouverez d'autres points de référence pour le processeur dans notresection technique.
Cinebench R15 Multi Loop
Cinebench R23: Multi Core | Single Core
Cinebench R20: CPU (Multi Core) | CPU (Single Core)
Cinebench R15: CPU Multi 64Bit | CPU Single 64Bit
Blender: v2.79 BMW27 CPU
7-Zip 18.03: 7z b 4 | 7z b 4 -mmt1
Geekbench 5.5: Multi-Core | Single-Core
HWBOT x265 Benchmark v2.2: 4k Preset
LibreOffice : 20 Documents To PDF
R Benchmark 2.5: Overall mean
| CPU Performance rating | |
| Moyenne de la classe Workstation | |
| Dell Precision 5000 5680 | |
| Lenovo ThinkPad P1 G6-21FV000DGE | |
| HP ZBook Studio 16 G9 62U04EA | |
| Lenovo ThinkPad X1 Extreme G5-21DE003RGE | |
| Moyenne Intel Core i9-13900H | |
| MSI CreatorPro Z16P B12UKST | |
| Schenker VISION 16 Pro (M23) | |
| Samsung Galaxy Book3 Ultra 16, i9-13900H RTX 4070 | |
| Cinebench R23 / Multi Core | |
| Moyenne de la classe Workstation (14621 - 38520, n=23, 2 dernières années) | |
| Dell Precision 5000 5680 | |
| Lenovo ThinkPad P1 G6-21FV000DGE | |
| Lenovo ThinkPad X1 Extreme G5-21DE003RGE | |
| MSI CreatorPro Z16P B12UKST | |
| Moyenne Intel Core i9-13900H (11997 - 20385, n=28) | |
| HP ZBook Studio 16 G9 62U04EA | |
| Schenker VISION 16 Pro (M23) | |
| Samsung Galaxy Book3 Ultra 16, i9-13900H RTX 4070 | |
| Cinebench R23 / Single Core | |
| Lenovo ThinkPad P1 G6-21FV000DGE | |
| Moyenne de la classe Workstation (1712 - 2228, n=23, 2 dernières années) | |
| Dell Precision 5000 5680 | |
| Moyenne Intel Core i9-13900H (1297 - 2054, n=26) | |
| Schenker VISION 16 Pro (M23) | |
| HP ZBook Studio 16 G9 62U04EA | |
| Lenovo ThinkPad X1 Extreme G5-21DE003RGE | |
| MSI CreatorPro Z16P B12UKST | |
| Samsung Galaxy Book3 Ultra 16, i9-13900H RTX 4070 | |
| Cinebench R20 / CPU (Multi Core) | |
| Moyenne de la classe Workstation (5760 - 15043, n=23, 2 dernières années) | |
| Dell Precision 5000 5680 | |
| Lenovo ThinkPad P1 G6-21FV000DGE | |
| Lenovo ThinkPad X1 Extreme G5-21DE003RGE | |
| MSI CreatorPro Z16P B12UKST | |
| Moyenne Intel Core i9-13900H (4935 - 7716, n=25) | |
| HP ZBook Studio 16 G9 62U04EA | |
| Schenker VISION 16 Pro (M23) | |
| Samsung Galaxy Book3 Ultra 16, i9-13900H RTX 4070 | |
| Cinebench R20 / CPU (Single Core) | |
| Lenovo ThinkPad P1 G6-21FV000DGE | |
| Dell Precision 5000 5680 | |
| Moyenne de la classe Workstation (671 - 857, n=23, 2 dernières années) | |
| Schenker VISION 16 Pro (M23) | |
| Moyenne Intel Core i9-13900H (428 - 792, n=25) | |
| HP ZBook Studio 16 G9 62U04EA | |
| Lenovo ThinkPad X1 Extreme G5-21DE003RGE | |
| MSI CreatorPro Z16P B12UKST | |
| Samsung Galaxy Book3 Ultra 16, i9-13900H RTX 4070 | |
| Cinebench R15 / CPU Multi 64Bit | |
| Moyenne de la classe Workstation (2489 - 5810, n=23, 2 dernières années) | |
| Lenovo ThinkPad X1 Extreme G5-21DE003RGE | |
| Moyenne Intel Core i9-13900H (2061 - 3100, n=26) | |
| Lenovo ThinkPad P1 G6-21FV000DGE | |
| HP ZBook Studio 16 G9 62U04EA | |
| Dell Precision 5000 5680 | |
| Schenker VISION 16 Pro (M23) | |
| MSI CreatorPro Z16P B12UKST | |
| Samsung Galaxy Book3 Ultra 16, i9-13900H RTX 4070 | |
| Cinebench R15 / CPU Single 64Bit | |
| Moyenne de la classe Workstation (191.4 - 328, n=23, 2 dernières années) | |
| Dell Precision 5000 5680 | |
| Lenovo ThinkPad P1 G6-21FV000DGE | |
| Schenker VISION 16 Pro (M23) | |
| HP ZBook Studio 16 G9 62U04EA | |
| Moyenne Intel Core i9-13900H (211 - 297, n=26) | |
| Lenovo ThinkPad X1 Extreme G5-21DE003RGE | |
| MSI CreatorPro Z16P B12UKST | |
| Samsung Galaxy Book3 Ultra 16, i9-13900H RTX 4070 | |
| Blender / v2.79 BMW27 CPU | |
| Samsung Galaxy Book3 Ultra 16, i9-13900H RTX 4070 | |
| Schenker VISION 16 Pro (M23) | |
| Moyenne Intel Core i9-13900H (166 - 268, n=24) | |
| MSI CreatorPro Z16P B12UKST | |
| Dell Precision 5000 5680 | |
| Lenovo ThinkPad P1 G6-21FV000DGE | |
| HP ZBook Studio 16 G9 62U04EA | |
| Lenovo ThinkPad X1 Extreme G5-21DE003RGE | |
| Moyenne de la classe Workstation (91 - 222, n=23, 2 dernières années) | |
| 7-Zip 18.03 / 7z b 4 | |
| Moyenne de la classe Workstation (60489 - 116969, n=23, 2 dernières années) | |
| Lenovo ThinkPad P1 G6-21FV000DGE | |
| Dell Precision 5000 5680 | |
| HP ZBook Studio 16 G9 62U04EA | |
| MSI CreatorPro Z16P B12UKST | |
| Moyenne Intel Core i9-13900H (45045 - 79032, n=25) | |
| Lenovo ThinkPad X1 Extreme G5-21DE003RGE | |
| Schenker VISION 16 Pro (M23) | |
| Samsung Galaxy Book3 Ultra 16, i9-13900H RTX 4070 | |
| 7-Zip 18.03 / 7z b 4 -mmt1 | |
| Lenovo ThinkPad P1 G6-21FV000DGE | |
| Moyenne de la classe Workstation (5126 - 6960, n=23, 2 dernières années) | |
| Schenker VISION 16 Pro (M23) | |
| Dell Precision 5000 5680 | |
| Moyenne Intel Core i9-13900H (3665 - 6600, n=25) | |
| HP ZBook Studio 16 G9 62U04EA | |
| Lenovo ThinkPad X1 Extreme G5-21DE003RGE | |
| MSI CreatorPro Z16P B12UKST | |
| Samsung Galaxy Book3 Ultra 16, i9-13900H RTX 4070 | |
| Geekbench 5.5 / Multi-Core | |
| Moyenne de la classe Workstation (11542 - 25554, n=23, 2 dernières années) | |
| Dell Precision 5000 5680 | |
| HP ZBook Studio 16 G9 62U04EA | |
| Moyenne Intel Core i9-13900H (9094 - 15410, n=26) | |
| MSI CreatorPro Z16P B12UKST | |
| Schenker VISION 16 Pro (M23) | |
| Lenovo ThinkPad X1 Extreme G5-21DE003RGE | |
| Lenovo ThinkPad P1 G6-21FV000DGE | |
| Samsung Galaxy Book3 Ultra 16, i9-13900H RTX 4070 | |
| Geekbench 5.5 / Single-Core | |
| Moyenne de la classe Workstation (1783 - 2183, n=23, 2 dernières années) | |
| Dell Precision 5000 5680 | |
| Lenovo ThinkPad P1 G6-21FV000DGE | |
| Moyenne Intel Core i9-13900H (1140 - 2043, n=26) | |
| Schenker VISION 16 Pro (M23) | |
| HP ZBook Studio 16 G9 62U04EA | |
| Lenovo ThinkPad X1 Extreme G5-21DE003RGE | |
| MSI CreatorPro Z16P B12UKST | |
| Samsung Galaxy Book3 Ultra 16, i9-13900H RTX 4070 | |
| HWBOT x265 Benchmark v2.2 / 4k Preset | |
| Moyenne de la classe Workstation (17.8 - 40.5, n=23, 2 dernières années) | |
| Dell Precision 5000 5680 | |
| HP ZBook Studio 16 G9 62U04EA | |
| MSI CreatorPro Z16P B12UKST | |
| Lenovo ThinkPad P1 G6-21FV000DGE | |
| Moyenne Intel Core i9-13900H (14.1 - 22.3, n=25) | |
| Lenovo ThinkPad X1 Extreme G5-21DE003RGE | |
| Schenker VISION 16 Pro (M23) | |
| Samsung Galaxy Book3 Ultra 16, i9-13900H RTX 4070 | |
| LibreOffice / 20 Documents To PDF | |
| Samsung Galaxy Book3 Ultra 16, i9-13900H RTX 4070 | |
| Moyenne de la classe Workstation (37.1 - 74.7, n=23, 2 dernières années) | |
| Schenker VISION 16 Pro (M23) | |
| Moyenne Intel Core i9-13900H (34.4 - 82.8, n=25) | |
| Lenovo ThinkPad P1 G6-21FV000DGE | |
| HP ZBook Studio 16 G9 62U04EA | |
| Lenovo ThinkPad X1 Extreme G5-21DE003RGE | |
| Dell Precision 5000 5680 | |
| MSI CreatorPro Z16P B12UKST | |
| R Benchmark 2.5 / Overall mean | |
| Samsung Galaxy Book3 Ultra 16, i9-13900H RTX 4070 | |
| Lenovo ThinkPad X1 Extreme G5-21DE003RGE | |
| MSI CreatorPro Z16P B12UKST | |
| Moyenne Intel Core i9-13900H (0.4052 - 0.723, n=25) | |
| HP ZBook Studio 16 G9 62U04EA | |
| Moyenne de la classe Workstation (0.3825 - 0.603, n=23, 2 dernières années) | |
| Schenker VISION 16 Pro (M23) | |
| Lenovo ThinkPad P1 G6-21FV000DGE | |
| Dell Precision 5000 5680 | |
* ... Moindre est la valeur, meilleures sont les performances
AIDA64: FP32 Ray-Trace | FPU Julia | CPU SHA3 | CPU Queen | FPU SinJulia | FPU Mandel | CPU AES | CPU ZLib | FP64 Ray-Trace | CPU PhotoWorxx
| Performance rating | |
| Moyenne de la classe Workstation | |
| MSI CreatorPro Z16P B12UKST | |
| Dell Precision 5000 5680 | |
| Lenovo ThinkPad P1 G6-21FV000DGE | |
| Moyenne Intel Core i9-13900H | |
| HP ZBook Studio 16 G9 62U04EA | |
| Lenovo ThinkPad X1 Extreme G5-21DE003RGE | |
| Schenker VISION 16 Pro (M23) | |
| Samsung Galaxy Book3 Ultra 16, i9-13900H RTX 4070 | |
| AIDA64 / FP32 Ray-Trace | |
| Moyenne de la classe Workstation (16730 - 61611, n=23, 2 dernières années) | |
| Lenovo ThinkPad P1 G6-21FV000DGE | |
| Lenovo ThinkPad X1 Extreme G5-21DE003RGE | |
| Dell Precision 5000 5680 | |
| HP ZBook Studio 16 G9 62U04EA | |
| Moyenne Intel Core i9-13900H (6788 - 19557, n=25) | |
| Samsung Galaxy Book3 Ultra 16, i9-13900H RTX 4070 | |
| MSI CreatorPro Z16P B12UKST | |
| Schenker VISION 16 Pro (M23) | |
| AIDA64 / FPU Julia | |
| Moyenne de la classe Workstation (89597 - 186971, n=23, 2 dernières années) | |
| Lenovo ThinkPad P1 G6-21FV000DGE | |
| Lenovo ThinkPad X1 Extreme G5-21DE003RGE | |
| HP ZBook Studio 16 G9 62U04EA | |
| Dell Precision 5000 5680 | |
| Moyenne Intel Core i9-13900H (22551 - 95579, n=25) | |
| MSI CreatorPro Z16P B12UKST | |
| Schenker VISION 16 Pro (M23) | |
| Samsung Galaxy Book3 Ultra 16, i9-13900H RTX 4070 | |
| AIDA64 / CPU SHA3 | |
| Moyenne de la classe Workstation (4178 - 8975, n=23, 2 dernières années) | |
| Lenovo ThinkPad X1 Extreme G5-21DE003RGE | |
| Lenovo ThinkPad P1 G6-21FV000DGE | |
| HP ZBook Studio 16 G9 62U04EA | |
| MSI CreatorPro Z16P B12UKST | |
| Moyenne Intel Core i9-13900H (2491 - 4270, n=25) | |
| Dell Precision 5000 5680 | |
| Samsung Galaxy Book3 Ultra 16, i9-13900H RTX 4070 | |
| Schenker VISION 16 Pro (M23) | |
| AIDA64 / CPU Queen | |
| Dell Precision 5000 5680 | |
| Lenovo ThinkPad P1 G6-21FV000DGE | |
| Moyenne de la classe Workstation (60778 - 144411, n=23, 2 dernières années) | |
| HP ZBook Studio 16 G9 62U04EA | |
| Moyenne Intel Core i9-13900H (65121 - 120936, n=25) | |
| Lenovo ThinkPad X1 Extreme G5-21DE003RGE | |
| MSI CreatorPro Z16P B12UKST | |
| Schenker VISION 16 Pro (M23) | |
| Samsung Galaxy Book3 Ultra 16, i9-13900H RTX 4070 | |
| AIDA64 / FPU SinJulia | |
| Moyenne de la classe Workstation (8165 - 29343, n=23, 2 dernières années) | |
| Lenovo ThinkPad P1 G6-21FV000DGE | |
| Dell Precision 5000 5680 | |
| Lenovo ThinkPad X1 Extreme G5-21DE003RGE | |
| Moyenne Intel Core i9-13900H (6108 - 11631, n=25) | |
| HP ZBook Studio 16 G9 62U04EA | |
| MSI CreatorPro Z16P B12UKST | |
| Schenker VISION 16 Pro (M23) | |
| Samsung Galaxy Book3 Ultra 16, i9-13900H RTX 4070 | |
| AIDA64 / FPU Mandel | |
| Moyenne de la classe Workstation (44497 - 98153, n=23, 2 dernières années) | |
| Lenovo ThinkPad P1 G6-21FV000DGE | |
| Lenovo ThinkPad X1 Extreme G5-21DE003RGE | |
| Dell Precision 5000 5680 | |
| HP ZBook Studio 16 G9 62U04EA | |
| Moyenne Intel Core i9-13900H (11283 - 48474, n=25) | |
| Samsung Galaxy Book3 Ultra 16, i9-13900H RTX 4070 | |
| MSI CreatorPro Z16P B12UKST | |
| Schenker VISION 16 Pro (M23) | |
| AIDA64 / CPU AES | |
| MSI CreatorPro Z16P B12UKST | |
| Moyenne de la classe Workstation (73133 - 187841, n=23, 2 dernières années) | |
| Moyenne Intel Core i9-13900H (3691 - 149377, n=25) | |
| Lenovo ThinkPad X1 Extreme G5-21DE003RGE | |
| Lenovo ThinkPad P1 G6-21FV000DGE | |
| HP ZBook Studio 16 G9 62U04EA | |
| Dell Precision 5000 5680 | |
| Schenker VISION 16 Pro (M23) | |
| Samsung Galaxy Book3 Ultra 16, i9-13900H RTX 4070 | |
| AIDA64 / CPU ZLib | |
| Moyenne de la classe Workstation (929 - 2148, n=23, 2 dernières années) | |
| Lenovo ThinkPad P1 G6-21FV000DGE | |
| Lenovo ThinkPad X1 Extreme G5-21DE003RGE | |
| HP ZBook Studio 16 G9 62U04EA | |
| Moyenne Intel Core i9-13900H (789 - 1254, n=25) | |
| MSI CreatorPro Z16P B12UKST | |
| Dell Precision 5000 5680 | |
| Samsung Galaxy Book3 Ultra 16, i9-13900H RTX 4070 | |
| Schenker VISION 16 Pro (M23) | |
| AIDA64 / FP64 Ray-Trace | |
| Moyenne de la classe Workstation (8545 - 32891, n=23, 2 dernières années) | |
| Lenovo ThinkPad P1 G6-21FV000DGE | |
| Lenovo ThinkPad X1 Extreme G5-21DE003RGE | |
| HP ZBook Studio 16 G9 62U04EA | |
| Dell Precision 5000 5680 | |
| Moyenne Intel Core i9-13900H (3655 - 10716, n=25) | |
| MSI CreatorPro Z16P B12UKST | |
| Schenker VISION 16 Pro (M23) | |
| Samsung Galaxy Book3 Ultra 16, i9-13900H RTX 4070 | |
| AIDA64 / CPU PhotoWorxx | |
| Moyenne de la classe Workstation (37151 - 93684, n=23, 2 dernières années) | |
| Samsung Galaxy Book3 Ultra 16, i9-13900H RTX 4070 | |
| Dell Precision 5000 5680 | |
| Schenker VISION 16 Pro (M23) | |
| MSI CreatorPro Z16P B12UKST | |
| Moyenne Intel Core i9-13900H (10871 - 50488, n=25) | |
| HP ZBook Studio 16 G9 62U04EA | |
| Lenovo ThinkPad P1 G6-21FV000DGE | |
| Lenovo ThinkPad X1 Extreme G5-21DE003RGE | |
Performance du système
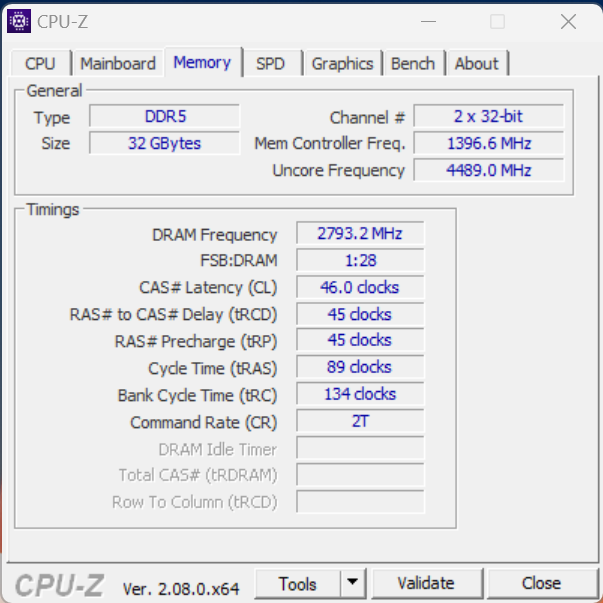
Les performances du système du ThinkPad P1 Gen 6 sont exceptionnelles, comme le montrent à la fois les tests synthétiques et notre évaluation subjective des performances. Comme prévu, les performances de la mémoire vive sont légèrement inférieures en raison de la configuration monocanal de la mémoire, par rapport aux modèles dotés d'une mémoire vive bicanal. Tout au long du test, il n'y a eu aucun problème de gel ou de bégaiement.
CrossMark: Overall | Productivity | Creativity | Responsiveness
| PCMark 10 / Score | |
| Dell Precision 5000 5680 | |
| Moyenne de la classe Workstation (6563 - 10409, n=19, 2 dernières années) | |
| Lenovo ThinkPad P1 G6-21FV000DGE | |
| Moyenne Intel Core i9-13900H, NVIDIA RTX 2000 Ada Generation Laptop (n=1) | |
| Schenker VISION 16 Pro (M23) | |
| Lenovo ThinkPad X1 Extreme G5-21DE003RGE | |
| MSI CreatorPro Z16P B12UKST | |
| HP ZBook Studio 16 G9 62U04EA | |
| Samsung Galaxy Book3 Ultra 16, i9-13900H RTX 4070 | |
| PCMark 10 / Essentials | |
| Dell Precision 5000 5680 | |
| Lenovo ThinkPad P1 G6-21FV000DGE | |
| Moyenne Intel Core i9-13900H, NVIDIA RTX 2000 Ada Generation Laptop (n=1) | |
| Schenker VISION 16 Pro (M23) | |
| MSI CreatorPro Z16P B12UKST | |
| Lenovo ThinkPad X1 Extreme G5-21DE003RGE | |
| Moyenne de la classe Workstation (9622 - 11157, n=19, 2 dernières années) | |
| HP ZBook Studio 16 G9 62U04EA | |
| Samsung Galaxy Book3 Ultra 16, i9-13900H RTX 4070 | |
| PCMark 10 / Productivity | |
| Moyenne de la classe Workstation (8789 - 20616, n=19, 2 dernières années) | |
| Dell Precision 5000 5680 | |
| Lenovo ThinkPad P1 G6-21FV000DGE | |
| Moyenne Intel Core i9-13900H, NVIDIA RTX 2000 Ada Generation Laptop (n=1) | |
| Schenker VISION 16 Pro (M23) | |
| Lenovo ThinkPad X1 Extreme G5-21DE003RGE | |
| MSI CreatorPro Z16P B12UKST | |
| Samsung Galaxy Book3 Ultra 16, i9-13900H RTX 4070 | |
| HP ZBook Studio 16 G9 62U04EA | |
| PCMark 10 / Digital Content Creation | |
| Dell Precision 5000 5680 | |
| Moyenne de la classe Workstation (8108 - 15631, n=19, 2 dernières années) | |
| Schenker VISION 16 Pro (M23) | |
| Lenovo ThinkPad P1 G6-21FV000DGE | |
| Moyenne Intel Core i9-13900H, NVIDIA RTX 2000 Ada Generation Laptop (n=1) | |
| Lenovo ThinkPad X1 Extreme G5-21DE003RGE | |
| MSI CreatorPro Z16P B12UKST | |
| HP ZBook Studio 16 G9 62U04EA | |
| Samsung Galaxy Book3 Ultra 16, i9-13900H RTX 4070 | |
| CrossMark / Overall | |
| MSI CreatorPro Z16P B12UKST | |
| Moyenne de la classe Workstation (1307 - 2267, n=22, 2 dernières années) | |
| Dell Precision 5000 5680 | |
| Schenker VISION 16 Pro (M23) | |
| Lenovo ThinkPad P1 G6-21FV000DGE | |
| Moyenne Intel Core i9-13900H, NVIDIA RTX 2000 Ada Generation Laptop (n=1) | |
| HP ZBook Studio 16 G9 62U04EA | |
| Lenovo ThinkPad X1 Extreme G5-21DE003RGE | |
| Samsung Galaxy Book3 Ultra 16, i9-13900H RTX 4070 | |
| CrossMark / Productivity | |
| MSI CreatorPro Z16P B12UKST | |
| Schenker VISION 16 Pro (M23) | |
| Dell Precision 5000 5680 | |
| Lenovo ThinkPad P1 G6-21FV000DGE | |
| Moyenne Intel Core i9-13900H, NVIDIA RTX 2000 Ada Generation Laptop (n=1) | |
| Moyenne de la classe Workstation (1130 - 2122, n=22, 2 dernières années) | |
| HP ZBook Studio 16 G9 62U04EA | |
| Lenovo ThinkPad X1 Extreme G5-21DE003RGE | |
| Samsung Galaxy Book3 Ultra 16, i9-13900H RTX 4070 | |
| CrossMark / Creativity | |
| Moyenne de la classe Workstation (1657 - 2725, n=22, 2 dernières années) | |
| Dell Precision 5000 5680 | |
| HP ZBook Studio 16 G9 62U04EA | |
| MSI CreatorPro Z16P B12UKST | |
| Lenovo ThinkPad P1 G6-21FV000DGE | |
| Moyenne Intel Core i9-13900H, NVIDIA RTX 2000 Ada Generation Laptop (n=1) | |
| Schenker VISION 16 Pro (M23) | |
| Lenovo ThinkPad X1 Extreme G5-21DE003RGE | |
| Samsung Galaxy Book3 Ultra 16, i9-13900H RTX 4070 | |
| CrossMark / Responsiveness | |
| MSI CreatorPro Z16P B12UKST | |
| Schenker VISION 16 Pro (M23) | |
| Moyenne de la classe Workstation (993 - 2096, n=22, 2 dernières années) | |
| Lenovo ThinkPad P1 G6-21FV000DGE | |
| Moyenne Intel Core i9-13900H, NVIDIA RTX 2000 Ada Generation Laptop (n=1) | |
| Dell Precision 5000 5680 | |
| HP ZBook Studio 16 G9 62U04EA | |
| Lenovo ThinkPad X1 Extreme G5-21DE003RGE | |
| Samsung Galaxy Book3 Ultra 16, i9-13900H RTX 4070 | |
| PCMark 10 Score | 7522 points | |
Aide | ||
| AIDA64 / Memory Copy | |
| Moyenne de la classe Workstation (56003 - 164795, n=23, 2 dernières années) | |
| Dell Precision 5000 5680 | |
| Samsung Galaxy Book3 Ultra 16, i9-13900H RTX 4070 | |
| Schenker VISION 16 Pro (M23) | |
| MSI CreatorPro Z16P B12UKST | |
| HP ZBook Studio 16 G9 62U04EA | |
| Moyenne Intel Core i9-13900H (37448 - 74486, n=25) | |
| Lenovo ThinkPad P1 G6-21FV000DGE | |
| Lenovo ThinkPad X1 Extreme G5-21DE003RGE | |
| AIDA64 / Memory Read | |
| Moyenne de la classe Workstation (55795 - 121563, n=23, 2 dernières années) | |
| Schenker VISION 16 Pro (M23) | |
| Samsung Galaxy Book3 Ultra 16, i9-13900H RTX 4070 | |
| Dell Precision 5000 5680 | |
| MSI CreatorPro Z16P B12UKST | |
| HP ZBook Studio 16 G9 62U04EA | |
| Moyenne Intel Core i9-13900H (41599 - 75433, n=25) | |
| Lenovo ThinkPad P1 G6-21FV000DGE | |
| Lenovo ThinkPad X1 Extreme G5-21DE003RGE | |
| AIDA64 / Memory Write | |
| Samsung Galaxy Book3 Ultra 16, i9-13900H RTX 4070 | |
| Moyenne de la classe Workstation (55663 - 214520, n=23, 2 dernières années) | |
| Dell Precision 5000 5680 | |
| Schenker VISION 16 Pro (M23) | |
| MSI CreatorPro Z16P B12UKST | |
| Moyenne Intel Core i9-13900H (36152 - 88505, n=25) | |
| HP ZBook Studio 16 G9 62U04EA | |
| Lenovo ThinkPad P1 G6-21FV000DGE | |
| Lenovo ThinkPad X1 Extreme G5-21DE003RGE | |
| AIDA64 / Memory Latency | |
| Moyenne de la classe Workstation (84.5 - 165.2, n=23, 2 dernières années) | |
| Samsung Galaxy Book3 Ultra 16, i9-13900H RTX 4070 | |
| MSI CreatorPro Z16P B12UKST | |
| Dell Precision 5000 5680 | |
| HP ZBook Studio 16 G9 62U04EA | |
| Moyenne Intel Core i9-13900H (75.8 - 102.3, n=25) | |
| Lenovo ThinkPad X1 Extreme G5-21DE003RGE | |
| Schenker VISION 16 Pro (M23) | |
| Lenovo ThinkPad P1 G6-21FV000DGE | |
* ... Moindre est la valeur, meilleures sont les performances
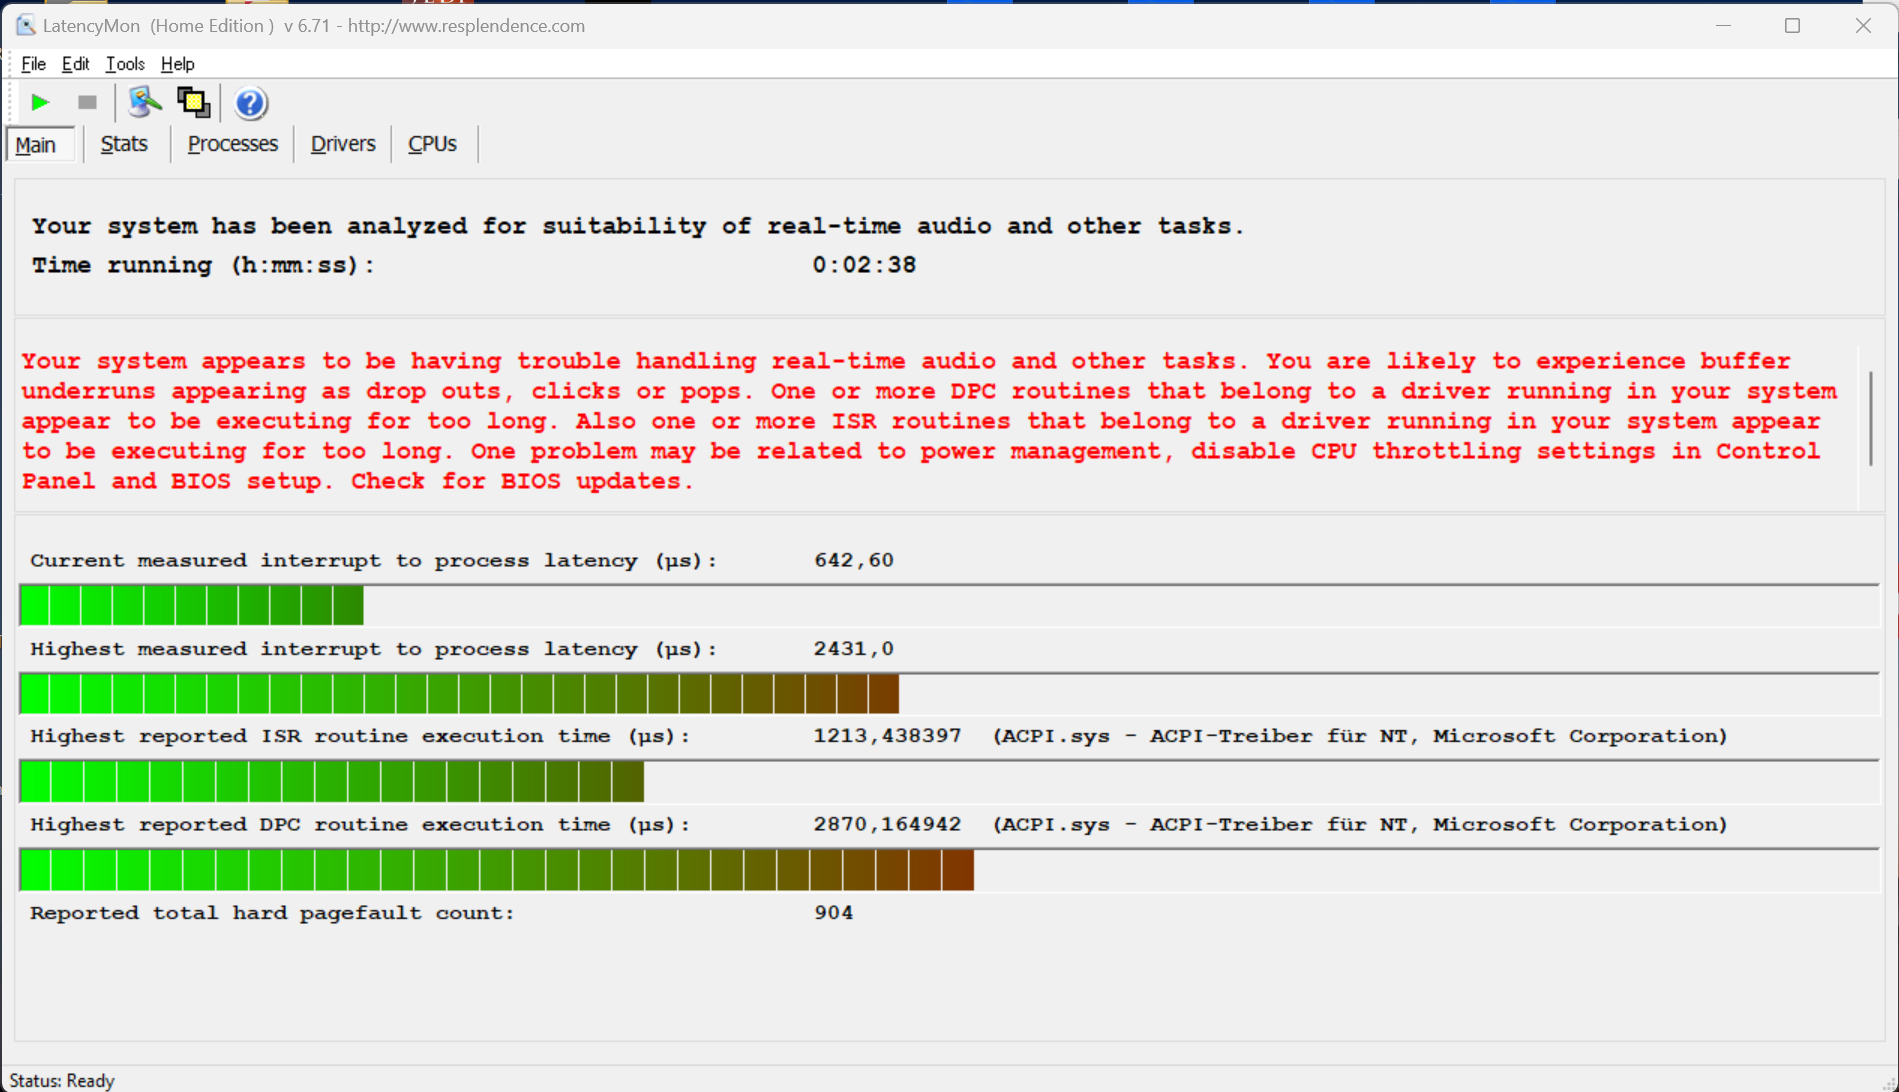
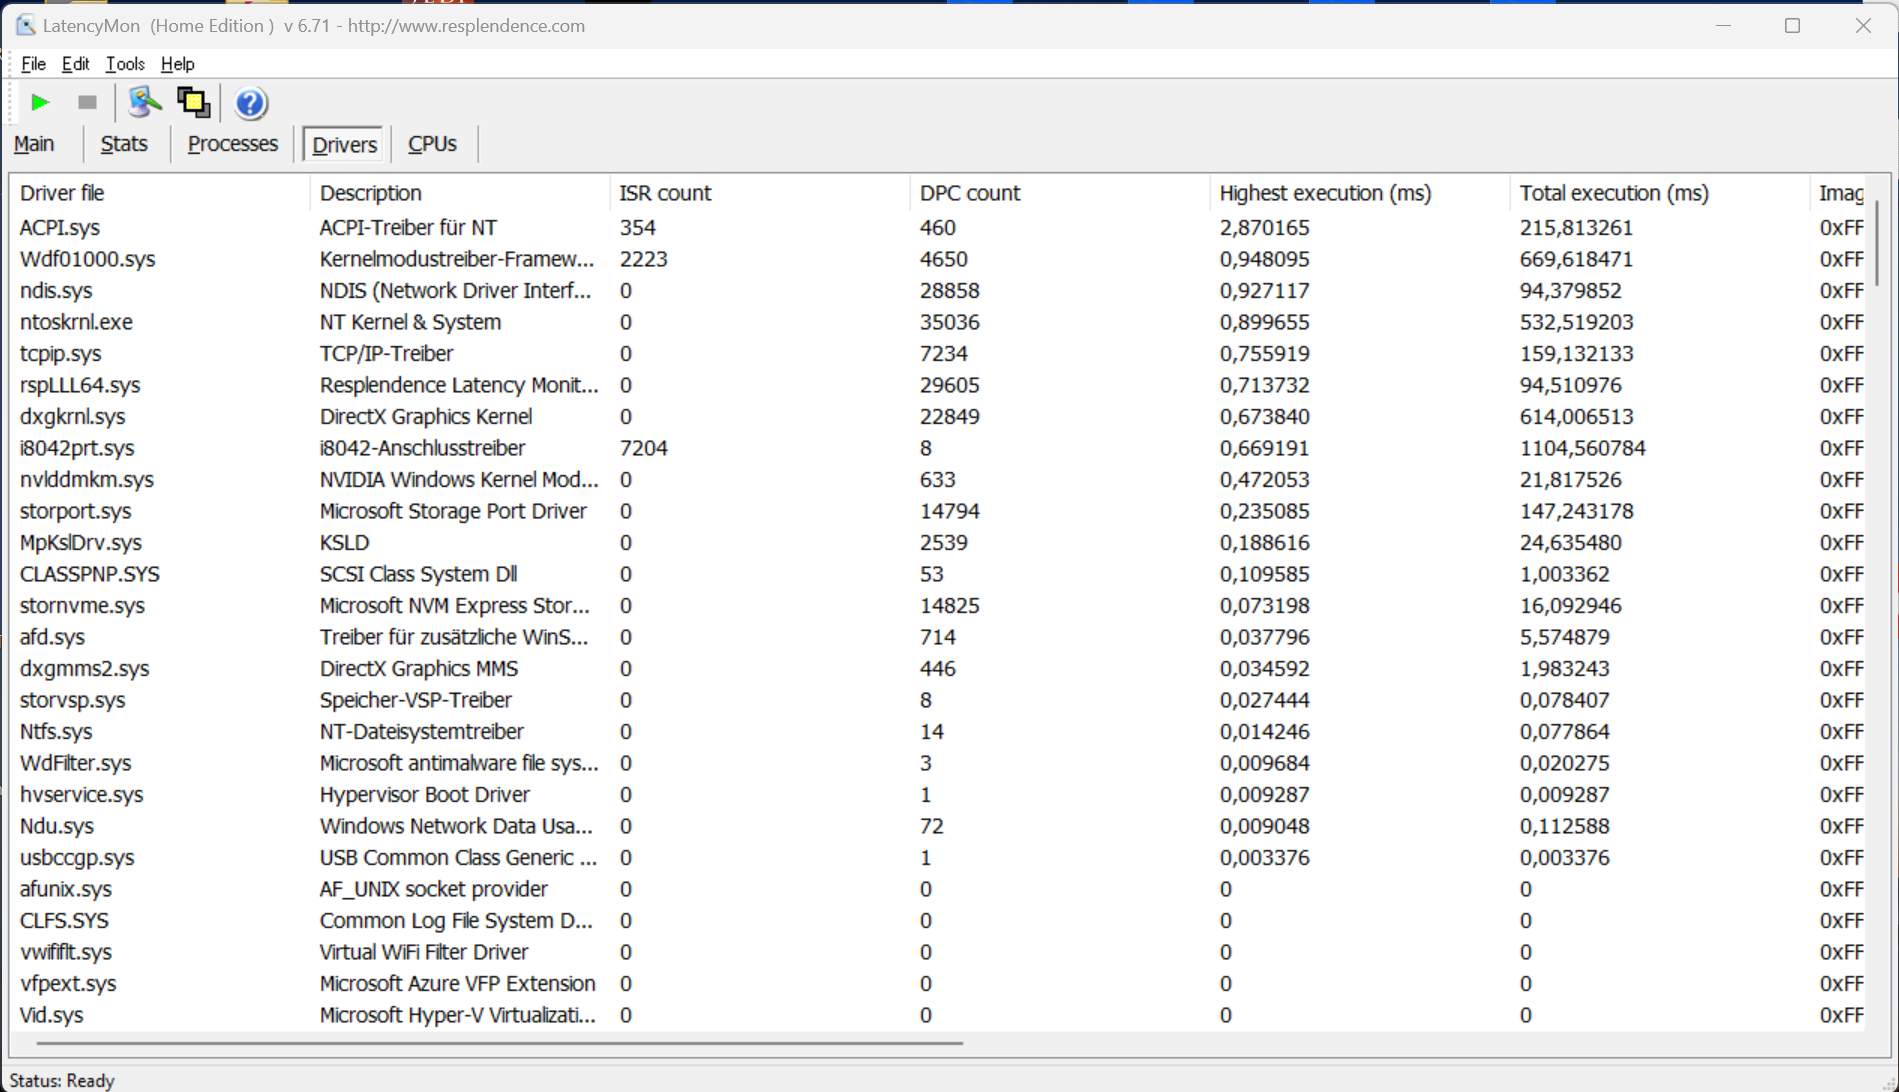
Latence DPC
Notre appareil de test a montré des difficultés dans les applications audio en temps réel avec la version actuelle du BIOS (1.14) dans notre test de latence standardisé, qui comprenait la navigation sur le web, le streaming YouTube 4K et la charge du processeur. En revanche, aucune image n'a été perdue lors de la lecture de vidéos.
| DPC Latencies / LatencyMon - interrupt to process latency (max), Web, Youtube, Prime95 | |
| Samsung Galaxy Book3 Ultra 16, i9-13900H RTX 4070 | |
| Lenovo ThinkPad P1 G6-21FV000DGE | |
| Dell Precision 5000 5680 | |
| Lenovo ThinkPad X1 Extreme G5-21DE003RGE | |
| HP ZBook Studio 16 G9 62U04EA | |
| Schenker VISION 16 Pro (M23) | |
| MSI CreatorPro Z16P B12UKST | |
* ... Moindre est la valeur, meilleures sont les performances
Dispositifs de stockage
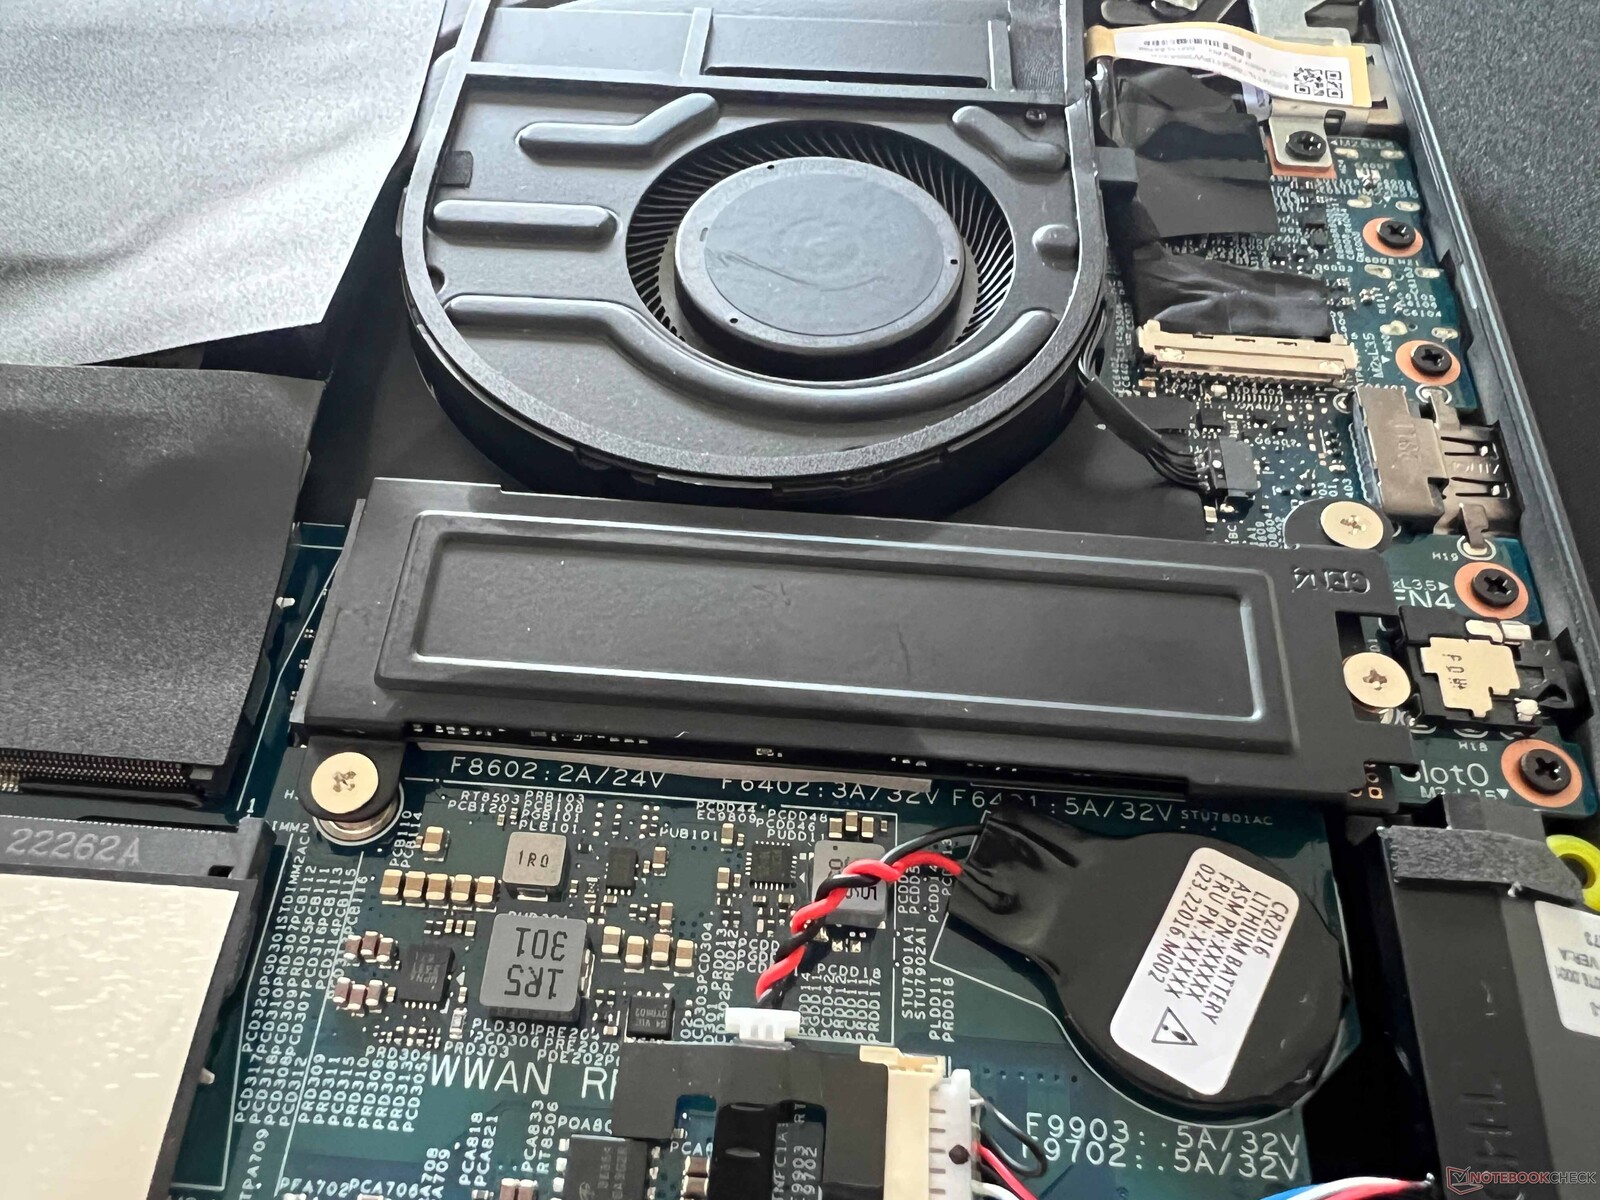
Deux emplacements PCIe 4.0 rapides sont disponibles dans les configurations P1 G6 avec refroidissement conventionnel. Notre appareil de test est équipé d'un disque dur SK Hynix PC711 de 1 To, qui offre 897 Go de RAM libre après la première configuration. Le SSD PCIe 4.0 a des taux de transfert exceptionnels, atteignant plus de 7 Go/s en performance maximale. Lenovo ajoute également une plaque métallique au SSD afin de garantir des performances constantes, même en cas d'utilisation constante. Vous trouverez d'autres tests de performance pour les disques durs SSD ici.

* ... Moindre est la valeur, meilleures sont les performances
Continuous power read: DiskSpd Read Loop, Queue Depth 8
Carte graphique - RTX 2000 Ada
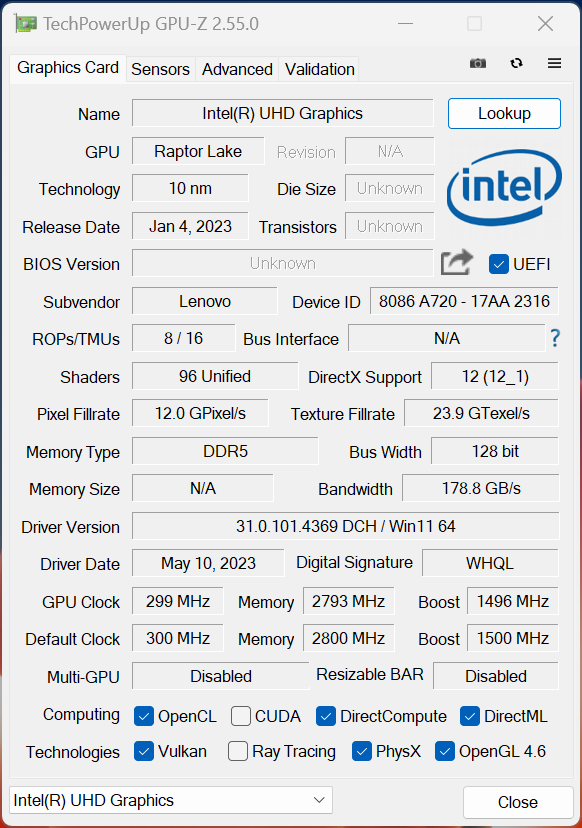
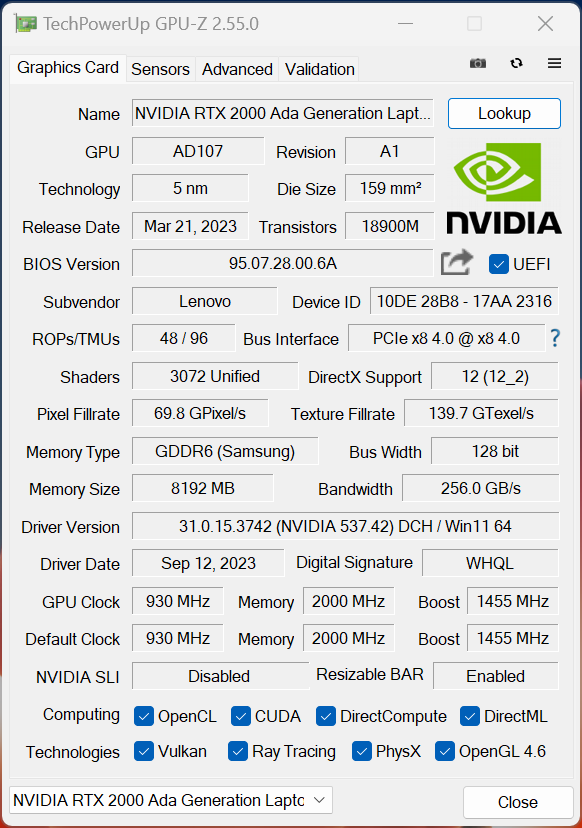
Lenovo intègre désormais les derniers GPU Ada Lovelace de Nvidia. En plus des modèles GeForce Ordinateur portable RTX 4060, RTX 4080 Laptopet RTX 4090 Laptop (chacun avec une variante de 80 watts, comme indiqué dans la fiche technique), elle propose également de nouveaux modèles professionnels tels que la RTX 1000 Ada (65 watts), RTX 2000 Ada (65 watts), RTX 3500 Ada, RTX 4000 Adaet le vaisseau amiral RTX 5000 Ada (80 watts TGP).
Étonnamment, la RTX 2000 Ada de notre échantillon est basée sur l'ordinateur portable GeForce RTX 4060, et Lenovo a opté pour un refroidissement conventionnel. Par conséquent, il fonctionne à "seulement" 65 watts (y compris 15 watts Dynamic Boost). Dans les tests 3DMark, la RTX 2000 Ada surpasse de quelques points de pourcentage l'ordinateur portable GeForce RTX 4060 du ROG Flow Z13 d'Asus, où le GPU est également autorisé à consommer 65 watts (dont 15 watts de Dynamic Boost). En termes de performances pures, le GPU représente une avancée significative, dépassant l'ancienne RTX A3000 et la RTX 3060 de l'ordinateur portable ThinkPad X1 Extreme. En outre, l'avantage par rapport à l'ancienne RTX A2000 est de près de 70 %.
Dans les benchmarks professionnels, la RTX 2000 Ada surpasse systématiquement l'ancienne
RTX A3000et elle laisse souvent derrière elle la version 50 watts de la RTX 3000 Ada dans la version plus compacte de l'ordinateur de bureau Dell Precision 5480.La constance des performances du GPU, même en cas de sollicitation soutenue, est un atout majeur. Lorsqu'elle est alimentée par une batterie, la RTX 2000 Ada est limitée à une utilisation maximale de 45 watts, ce qui se traduit par des performances graphiques inférieures d'environ 15 % (7 107 points @ Time Spy Graphics). Vous trouverez d'autres tests de performance du GPU ici.
| 3DMark 06 Standard Score | 53707 points | |
| 3DMark Vantage P Result | 37844 points | |
| 3DMark 11 Performance | 27558 points | |
| 3DMark Fire Strike Score | 19987 points | |
| 3DMark Time Spy Score | 8849 points | |
Aide | ||
| Geekbench 6.7 - GPU OpenCL | |
| HP ZBook Fury 16 G10 | |
| Dell Precision 5000 5680 | |
| Dell Precision 5480 | |
| Lenovo ThinkPad P1 G6-21FV000DGE | |
| Blender / v3.3 Classroom OPTIX/RTX | |
| HP ZBook Studio 16 G9 62U04EA | |
| Lenovo ThinkPad X1 Extreme G5-21DE003RGE | |
| MSI CreatorPro Z16P B12UKST | |
| Lenovo ThinkPad P1 G6-21FV000DGE | |
| Moyenne NVIDIA RTX 2000 Ada Generation Laptop (25 - 31, n=4) | |
| Samsung Galaxy Book3 Ultra 16, i9-13900H RTX 4070 | |
| Schenker VISION 16 Pro (M23) | |
| Moyenne de la classe Workstation (10 - 43, n=17, 2 dernières années) | |
| Dell Precision 5000 5680 | |
| Blender / v3.3 Classroom CUDA | |
| HP ZBook Studio 16 G9 62U04EA | |
| Moyenne NVIDIA RTX 2000 Ada Generation Laptop (51 - 155, n=4) | |
| Lenovo ThinkPad X1 Extreme G5-21DE003RGE | |
| MSI CreatorPro Z16P B12UKST | |
| Lenovo ThinkPad P1 G6-21FV000DGE | |
| Samsung Galaxy Book3 Ultra 16, i9-13900H RTX 4070 | |
| Moyenne de la classe Workstation (16 - 74, n=17, 2 dernières années) | |
| Schenker VISION 16 Pro (M23) | |
| Dell Precision 5000 5680 | |
| Blender / v3.3 Classroom CPU | |
| Samsung Galaxy Book3 Ultra 16, i9-13900H RTX 4070 | |
| Schenker VISION 16 Pro (M23) | |
| Dell Precision 5000 5680 | |
| MSI CreatorPro Z16P B12UKST | |
| HP ZBook Studio 16 G9 62U04EA | |
| Lenovo ThinkPad P1 G6-21FV000DGE | |
| Lenovo ThinkPad X1 Extreme G5-21DE003RGE | |
| Moyenne NVIDIA RTX 2000 Ada Generation Laptop (291 - 347, n=4) | |
| Moyenne de la classe Workstation (148 - 364, n=23, 2 dernières années) | |
* ... Moindre est la valeur, meilleures sont les performances
Performances des jeux
Nous n'avons rencontré aucun problème avec le pilote professionnel lors de nos benchmarks de jeu, et les performances sont comparables à celles d'un ordinateur portable GeForce Ordinateur portable RTX 4060 avec des taux de TGP comparables. Par conséquent, les jeux actuels tels que Star Wars Jedi Survivor, Assassins' Creed Mirage ou Cyberpunk peuvent être joués sans problème avec les paramètres maximums et une résolution de 1080p. Pour une résolution WQHD native, les utilisateurs devront recourir à des méthodes d'upscaling telles que DLSS de Nvidia. Il est important de noter que les performances restent stables même lors de sessions de jeu prolongées.
| Far Cry 6 | |
| 1920x1080 High Graphics Quality AA:T | |
| Lenovo ThinkPad P1 G6-21FV000DGE | |
| Moyenne NVIDIA RTX 2000 Ada Generation Laptop (n=1) | |
| 1920x1080 Ultra Graphics Quality + HD Textures AA:T | |
| Lenovo ThinkPad P1 G6-21FV000DGE | |
| Moyenne NVIDIA RTX 2000 Ada Generation Laptop (n=1) | |
| Star Wars Jedi Survivor | |
| 1920x1080 High Preset | |
| Schenker VISION 16 Pro (M23) | |
| Lenovo ThinkPad P1 G6-21FV000DGE | |
| Moyenne NVIDIA RTX 2000 Ada Generation Laptop (n=1) | |
| 1920x1080 Epic Preset | |
| Schenker VISION 16 Pro (M23) | |
| Lenovo ThinkPad P1 G6-21FV000DGE | |
| Moyenne NVIDIA RTX 2000 Ada Generation Laptop (n=1) | |
| Hogwarts Legacy | |
| 1920x1080 High Preset AA:High T | |
| Lenovo ThinkPad P1 G6-21FV000DGE | |
| Moyenne NVIDIA RTX 2000 Ada Generation Laptop (n=1) | |
| Samsung Galaxy Book3 Ultra 16, i9-13900H RTX 4070 | |
| 1920x1080 Ultra Preset AA:High T | |
| Lenovo ThinkPad P1 G6-21FV000DGE | |
| Moyenne NVIDIA RTX 2000 Ada Generation Laptop (n=1) | |
| Samsung Galaxy Book3 Ultra 16, i9-13900H RTX 4070 | |
| F1 23 | |
| 1920x1080 High Preset AA:T AF:16x | |
| Moyenne NVIDIA RTX 2000 Ada Generation Laptop (142.1 - 147, n=2) | |
| Lenovo ThinkPad P1 G6-21FV000DGE | |
| 1920x1080 Ultra High Preset AA:T AF:16x | |
| Moyenne NVIDIA RTX 2000 Ada Generation Laptop (44.4 - 49.2, n=2) | |
| Lenovo ThinkPad P1 G6-21FV000DGE | |
Witcher 3 FPS chart
| Bas | Moyen | Élevé | Ultra | QHD | |
|---|---|---|---|---|---|
| GTA V (2015) | 173 | 101.6 | 74.6 | ||
| The Witcher 3 (2015) | 390 | 261 | 164 | 79.6 | 65 |
| Dota 2 Reborn (2015) | 178.4 | 153.1 | 143.9 | 133.4 | |
| Final Fantasy XV Benchmark (2018) | 111.2 | 83.5 | 63.7 | ||
| X-Plane 11.11 (2018) | 149.2 | 131.6 | 108.9 | ||
| Far Cry 5 (2018) | 175 | 130 | 120 | 113 | 81 |
| Strange Brigade (2018) | 459 | 228 | 182.5 | 158.2 | 107.5 |
| F1 2021 (2021) | 353 | 230 | 186.6 | 99.2 | 74.9 |
| Far Cry 6 (2021) | 157 | 121 | 104 | 87 | 63 |
| Cyberpunk 2077 1.6 (2022) | 101 | 81 | 72 | 65 | 41 |
| F1 22 (2022) | 213 | 193.2 | 138.5 | 52.8 | 34.2 |
| Hogwarts Legacy (2023) | 101 | 80 | 64 | 53 | 38 |
| Star Wars Jedi Survivor (2023) | 49 | 45 | 42 | 40 | 27 |
| F1 23 (2023) | 202 | 192.1 | 142.1 | 44.4 | 27.6 |
| Assassin's Creed Mirage (2023) | 113 | 103 | 97 | 76 | 58 |
Émissions - Le ThinkPad reste souvent silencieux au quotidien
Bruit du système
Lors des tâches de base, les deux ventilateurs du ThinkPad restent souvent complètement inactifs. Ils ne deviennent audibles que lorsque le processeur ou la carte graphique dédiée sont activés. Il est intéressant de noter que lorsqu'ils sont activés, les ventilateurs fonctionnent instantanément à une vitesse élevée, sans accumulation progressive. Dans les scénarios de jeu, nous avons mesuré des niveaux de bruit allant d'environ 41 à 48 dB(A), 48 dB(A) représentant le volume maximal des ventilateurs pendant les tests de stress. Dans les deux modes de performance les plus efficaces, le niveau sonore atteint un maximum de 40,7 dB(A). Il est à noter qu'aucun autre bruit électronique n'a été détecté dans notre appareil de test.
Degré de la nuisance sonore
| Au repos |
| 24.5 / 24.5 / 24.5 dB(A) |
| Fortement sollicité |
| 48 / 48 dB(A) |
 | ||
30 dB silencieux 40 dB(A) audible 50 dB(A) bruyant |
||
min: | ||
| Lenovo ThinkPad P1 G6-21FV000DGE RTX 2000 Ada Generation Laptop, i9-13900H, SK Hynix PC711 1TB HFS001TDE9X084N | Dell Precision 5000 5680 RTX 5000 Ada Generation Laptop, i9-13900H, 2x SK hynix PC801 HFS512GEJ9X101N RAID 0 | Samsung Galaxy Book3 Ultra 16, i9-13900H RTX 4070 GeForce RTX 4070 Laptop GPU, i9-13900H, Samsung PM9A1 MZVL21T0HCLR | HP ZBook Studio 16 G9 62U04EA RTX A2000 Laptop GPU, i7-12800H, Micron 3400 1TB MTFDKBA1T0TFH | MSI CreatorPro Z16P B12UKST RTX A3000 Laptop GPU, i7-12700H, Samsung PM9A1 MZVL21T0HCLR | Schenker VISION 16 Pro (M23) GeForce RTX 4070 Laptop GPU, i7-13700H, Samsung 990 Pro 1 TB | Lenovo ThinkPad X1 Extreme G5-21DE003RGE GeForce RTX 3060 Laptop GPU, i7-12700H, Micron 3400 1TB MTFDKBA1T0TFH | |
|---|---|---|---|---|---|---|---|
| Noise | 2% | -4% | -2% | -4% | -13% | 3% | |
| arrêt / environnement * (dB) | 24.5 | 22.8 7% | 25.2 -3% | 24 2% | 24.1 2% | 25.9 -6% | 23.2 5% |
| Idle Minimum * (dB) | 24.5 | 23 6% | 25.2 -3% | 24 2% | 27.1 -11% | 25.9 -6% | 23.2 5% |
| Idle Average * (dB) | 24.5 | 23 6% | 25.2 -3% | 27.7 -13% | 27.1 -11% | 25.9 -6% | 23.2 5% |
| Idle Maximum * (dB) | 24.5 | 23 6% | 31.3 -28% | 27.7 -13% | 27.1 -11% | 32 -31% | 23.2 5% |
| Load Average * (dB) | 48 | 37.2 22% | 38.8 19% | 39.8 17% | 42.9 11% | 47.2 2% | 45.5 5% |
| Witcher 3 ultra * (dB) | 40.7 | 51 -25% | 44.3 -9% | 44 -8% | 53.1 -30% | 45.5 -12% | |
| Load Maximum * (dB) | 48 | 51 -6% | 51.2 -7% | 47.7 1% | 47 2% | 53.1 -11% | 45.5 5% |
* ... Moindre est la valeur, meilleures sont les performances
Température
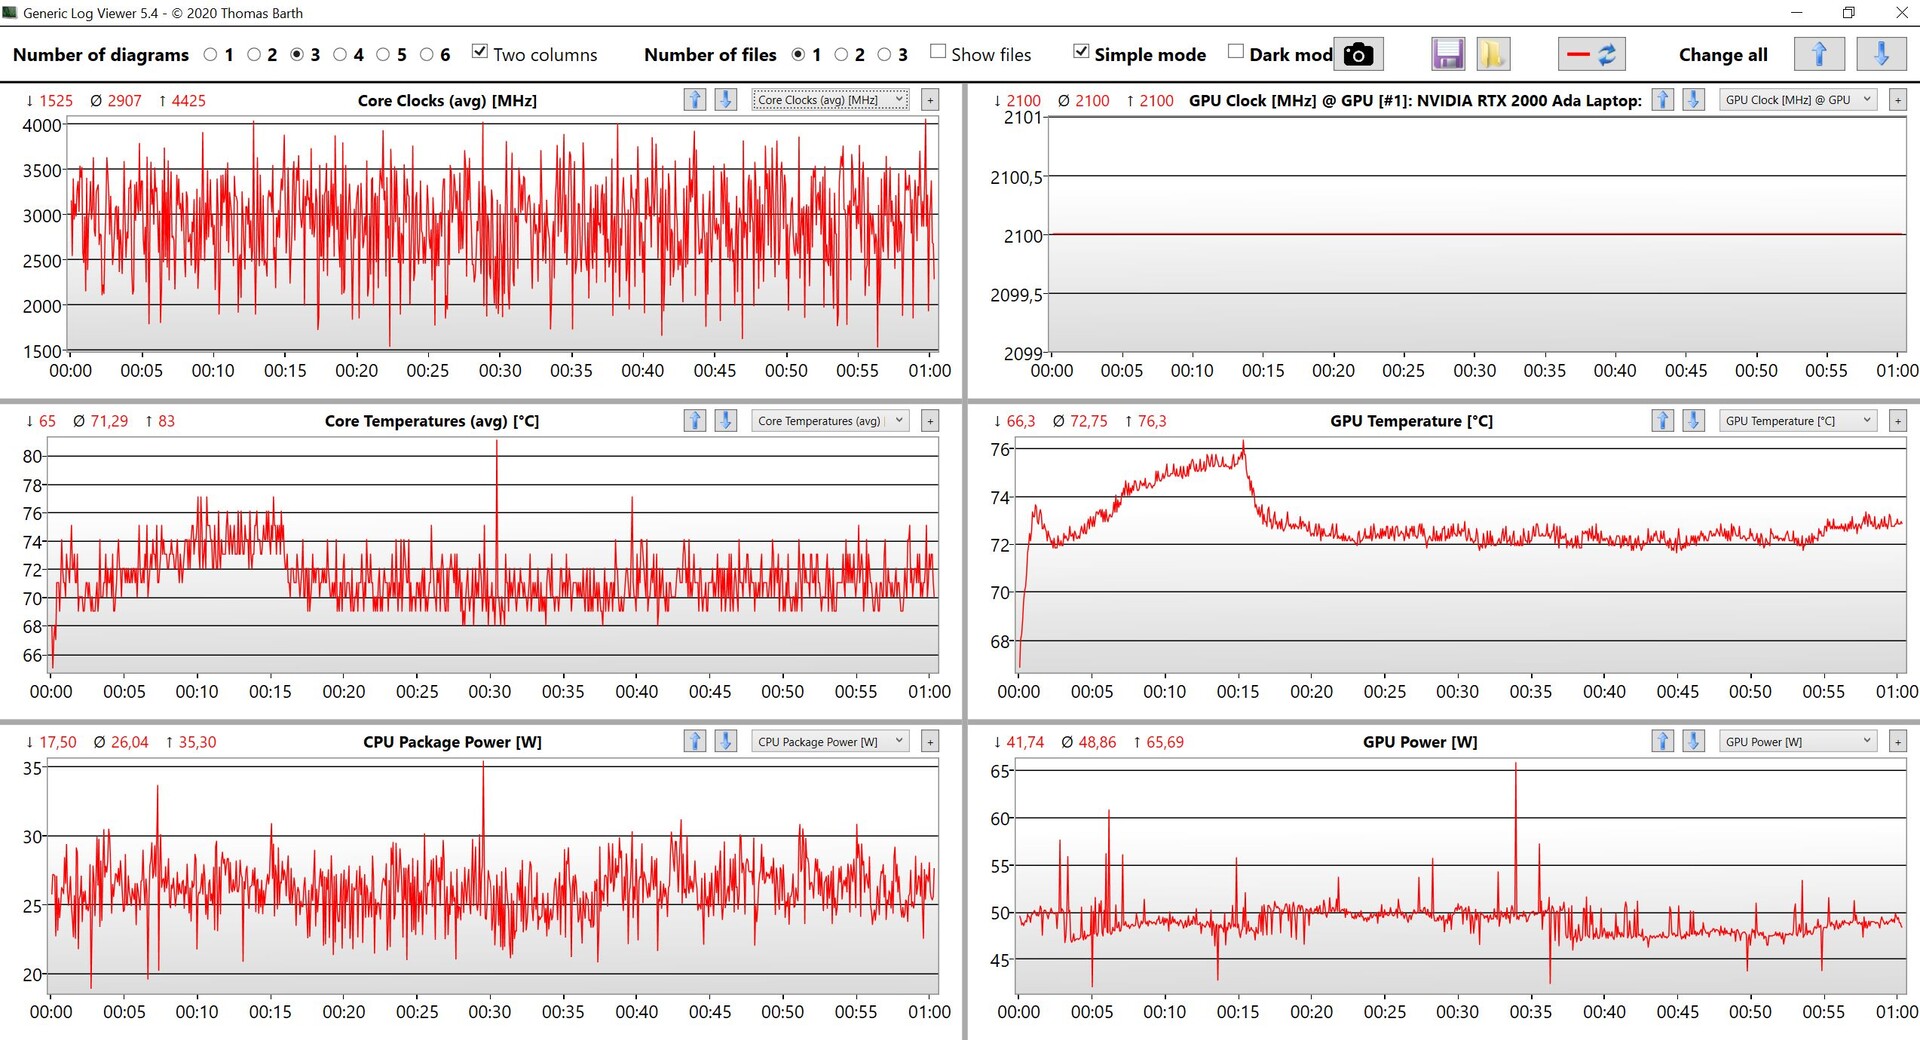
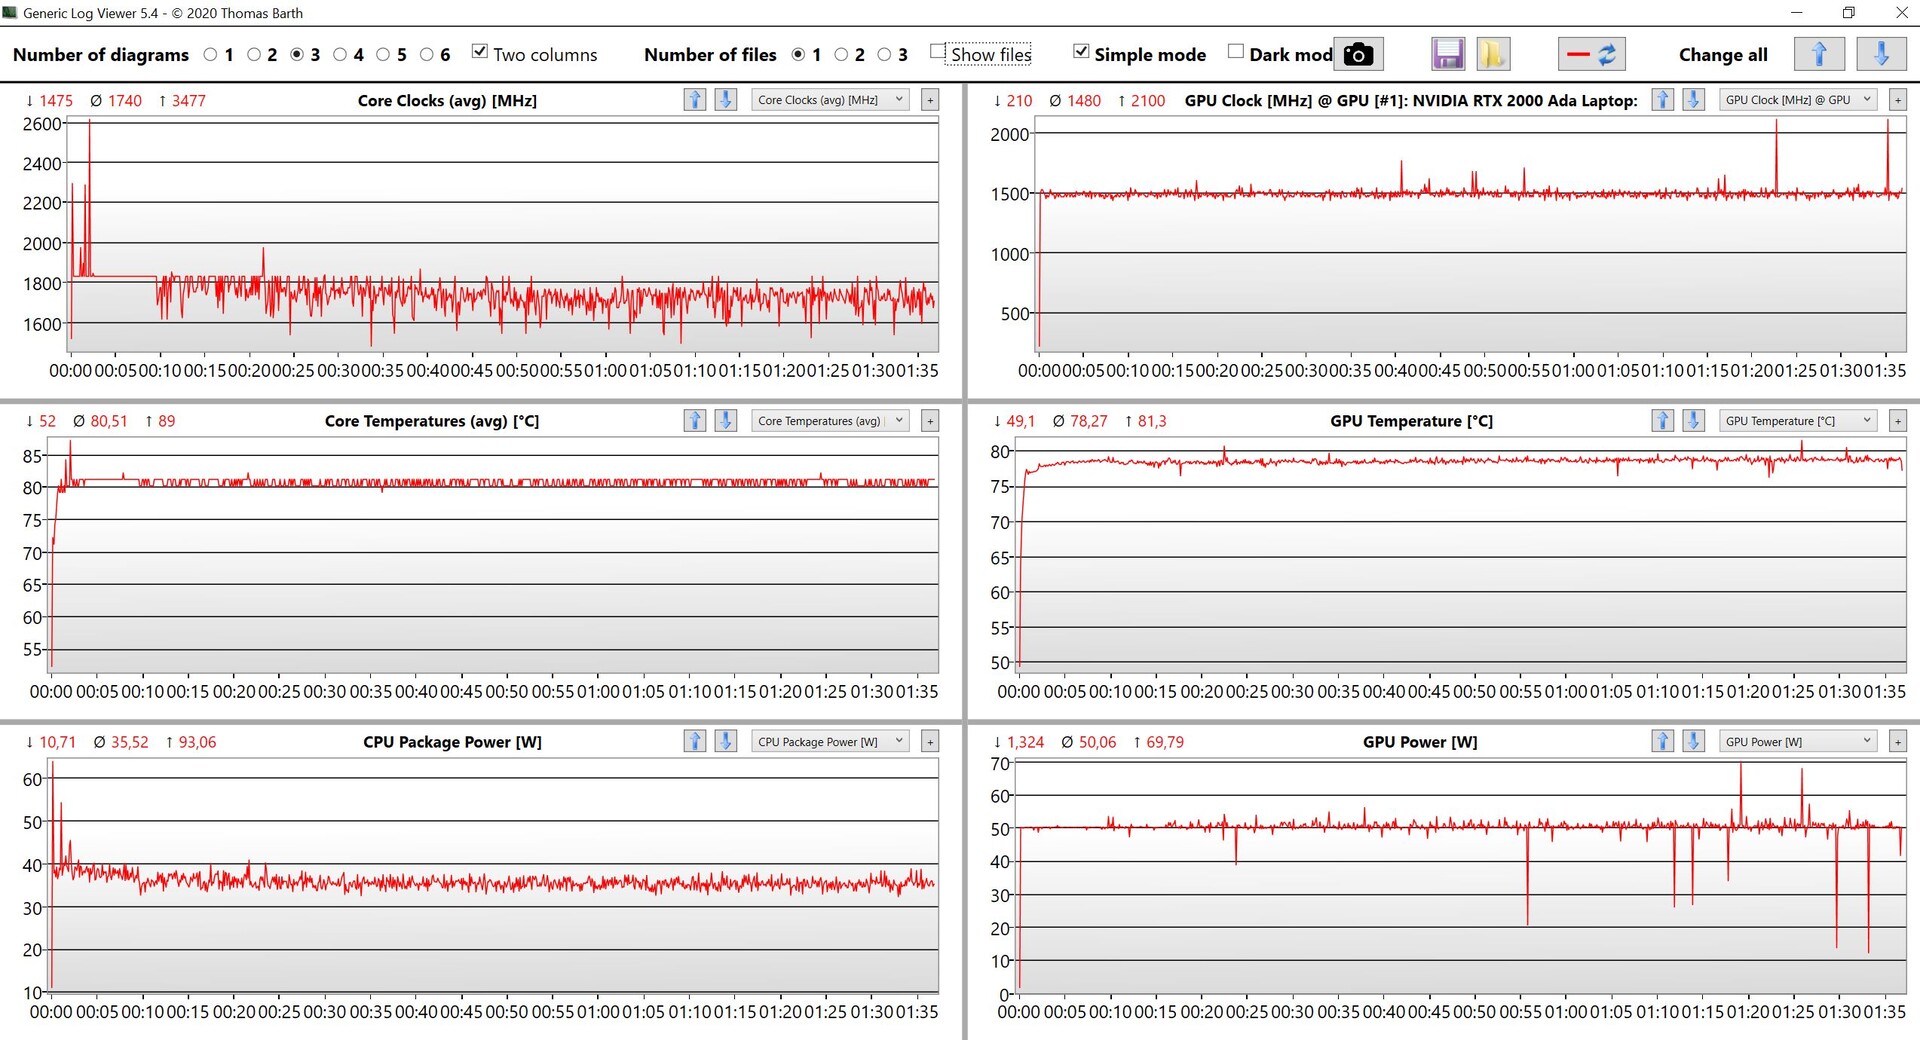
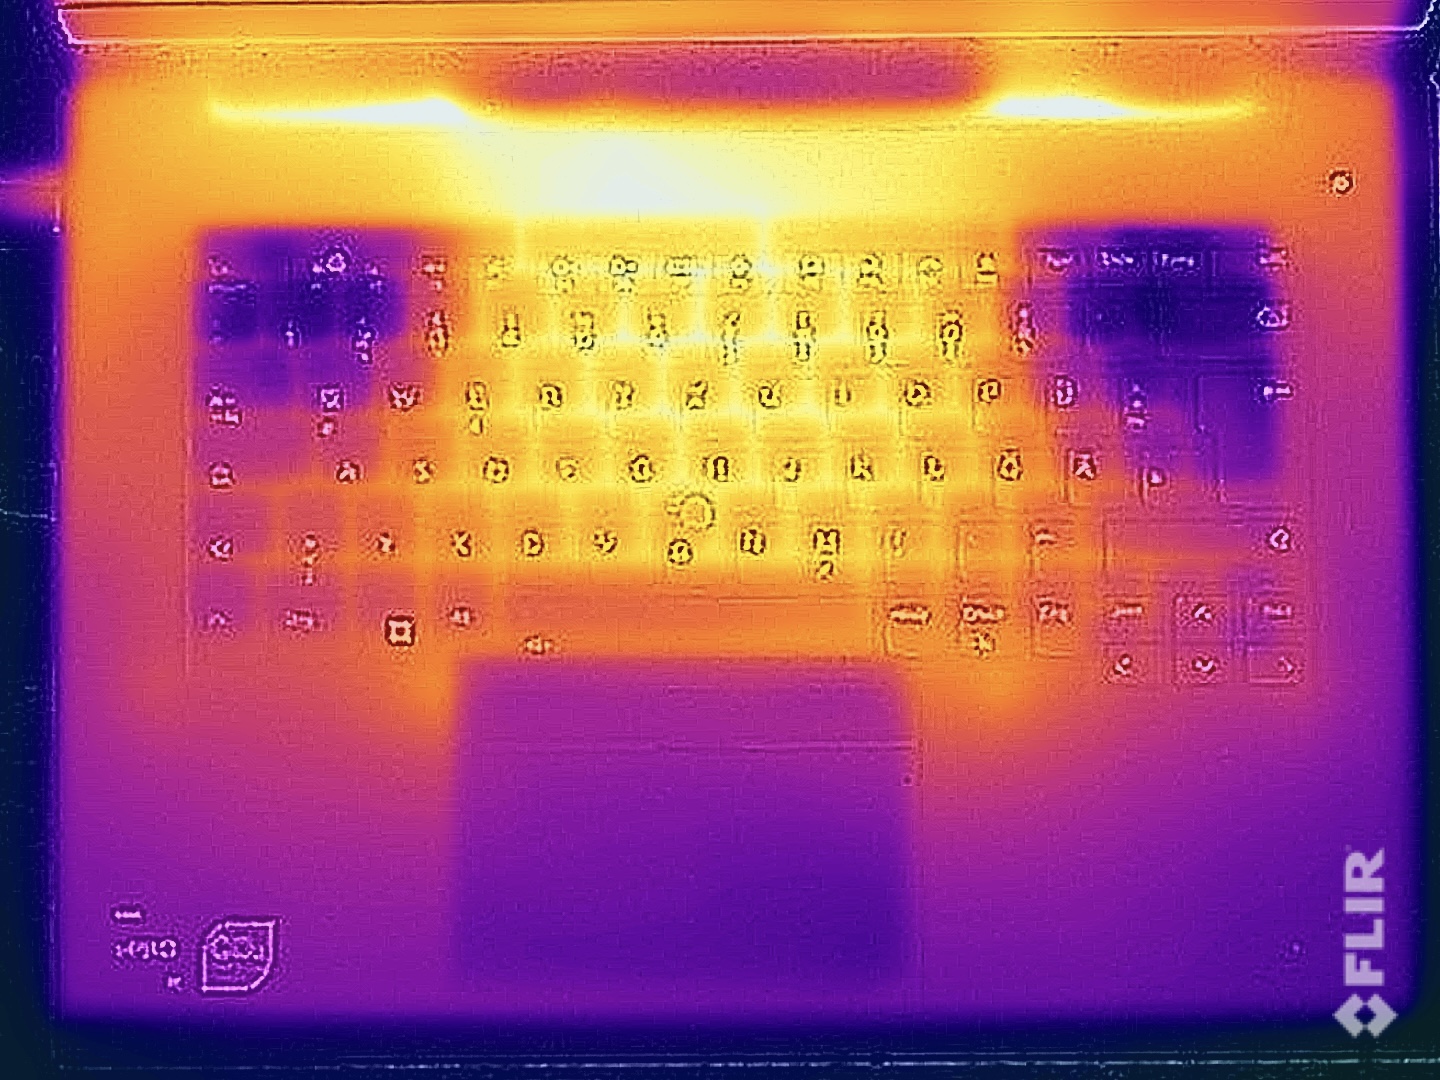
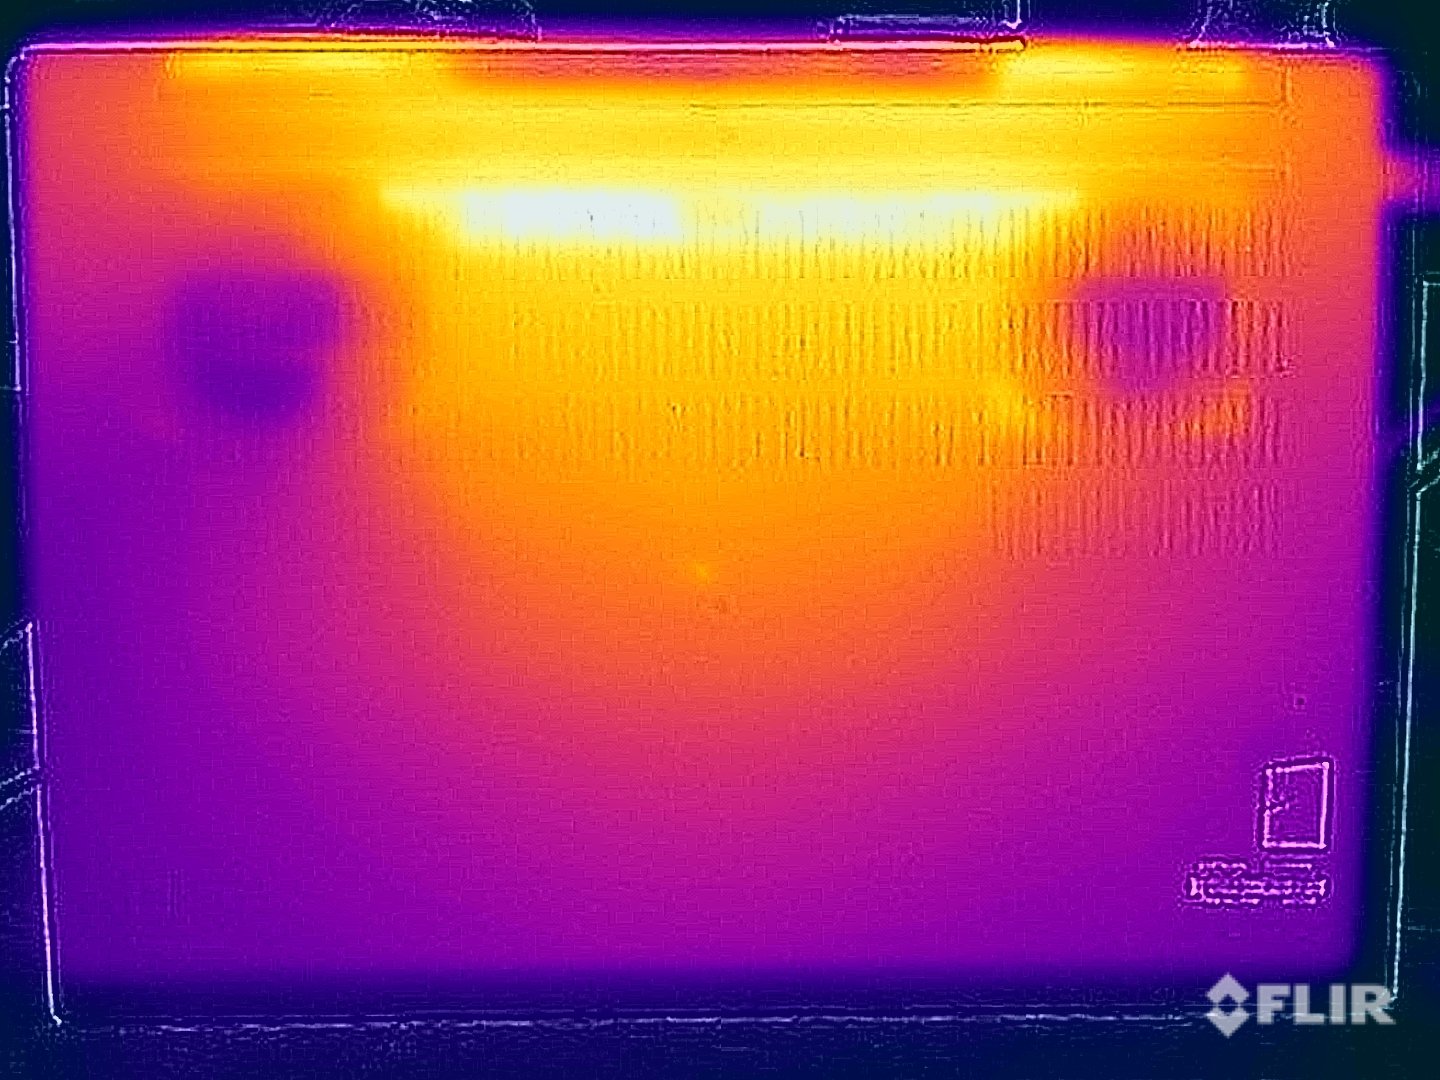
Les températures de surface restent tout à fait sûres lors de tâches simples, et le boîtier chauffe à peine. Semblable au modèle précédenten cas d'utilisation intensive, les températures dépassent les 50°C sur la face inférieure. Il est conseillé de ne pas poser l'appareil sur vos cuisses pendant ces périodes, même si, compte tenu de sa taille, ce scénario est peu probable. La zone du clavier peut également atteindre des températures de 47 °C, bien que nous ayons enregistré des températures encore plus élevées sur le modèle précédent. La frappe sous charge (ou pendant les jeux) peut provoquer des échauffements des doigts, mais il n'y a pas de gêne significative.
Pendant le test de stress, la carte graphique dédiée fonctionne à la puissance spécifiée de 50 watts, tandis que le processeur se stabilise à environ 35 watts. Le système peut supporter une charge de refroidissement totale de 85 watts en continu. À titre de comparaison, la génération G5 avec la chambre à vapeur gérait environ 100 watts au total (60 watts pour le GPU et 40 watts pour le CPU).
(-) La température maximale du côté supérieur est de 47.1 °C / 117 F, par rapport à la moyenne de 38.2 °C / 101 F, allant de 22.2 à 69.8 °C pour la classe Workstation.
(-) Le fond chauffe jusqu'à un maximum de 56.5 °C / 134 F, contre une moyenne de 41.1 °C / 106 F
(+) En utilisation inactive, la température moyenne du côté supérieur est de 26.4 °C / 80 F, par rapport à la moyenne du dispositif de 32 °C / 90 F.
(-) En jouant à The Witcher 3, la température moyenne du côté supérieur est de 39.1 °C / 102 F, alors que la moyenne de l'appareil est de 32 °C / 90 F.
(+) Les repose-poignets et le pavé tactile atteignent la température maximale de la peau (35.1 °C / 95.2 F) et ne sont donc pas chauds.
(-) La température moyenne de la zone de l'appui-paume de dispositifs similaires était de 27.8 °C / 82 F (-7.3 °C / #-13.2 F).
| Lenovo ThinkPad P1 G6-21FV000DGE Intel Core i9-13900H, NVIDIA RTX 2000 Ada Generation Laptop | Dell Precision 5000 5680 Intel Core i9-13900H, NVIDIA RTX 5000 Ada Generation Laptop | Samsung Galaxy Book3 Ultra 16, i9-13900H RTX 4070 Intel Core i9-13900H, NVIDIA GeForce RTX 4070 Laptop GPU | HP ZBook Studio 16 G9 62U04EA Intel Core i7-12800H, NVIDIA RTX A2000 Laptop GPU | MSI CreatorPro Z16P B12UKST Intel Core i7-12700H, NVIDIA RTX A3000 Laptop GPU | Schenker VISION 16 Pro (M23) Intel Core i7-13700H, NVIDIA GeForce RTX 4070 Laptop GPU | Lenovo ThinkPad X1 Extreme G5-21DE003RGE Intel Core i7-12700H, NVIDIA GeForce RTX 3060 Laptop GPU | |
|---|---|---|---|---|---|---|---|
| Heat | -3% | -6% | 3% | -6% | 4% | -1% | |
| Maximum Upper Side * (°C) | 47.1 | 50.2 -7% | 45.9 3% | 38.7 18% | 56.3 -20% | 46.7 1% | 52 -10% |
| Maximum Bottom * (°C) | 56.5 | 32 43% | 50.9 10% | 53.4 5% | 68.3 -21% | 54.1 4% | 56.4 -0% |
| Idle Upper Side * (°C) | 28.1 | 37.4 -33% | 31.6 -12% | 27.3 3% | 25.2 10% | 26.5 6% | 26.4 6% |
| Idle Bottom * (°C) | 27.6 | 31.2 -13% | 34.2 -24% | 31.6 -14% | 25.9 6% | 26.8 3% | 27.2 1% |
* ... Moindre est la valeur, meilleures sont les performances
Intervenants
Les caractéristiques des haut-parleurs restent similaires à celles de l'ancien modèle, et le volume maximal de près de 82 dB(A) est également comparable. Le P1 G6 actuel est légèrement plus performant dans nos mesures, peut-être grâce à des optimisations logicielles. Nous vous recommandons vivement d'activer l'application Dolby préchargée pour une meilleure expérience audio. Bien que les haut-parleurs stéréo offrent de bonnes performances globales, les concurrents dotés d'un plus grand nombre de haut-parleurs conservent un avantage dans ce domaine.
Lenovo ThinkPad P1 G6-21FV000DGE analyse audio
(±) | le niveau sonore du haut-parleur est moyen mais bon (81.8# dB)
Basses 100 - 315 Hz
(±) | basse réduite - en moyenne 8.9% inférieure à la médiane
(±) | la linéarité des basses est moyenne (12.3% delta à la fréquence précédente)
Médiums 400 - 2000 Hz
(+) | médiane équilibrée - seulement 4.7% de la médiane
(+) | les médiums sont linéaires (3.5% delta à la fréquence précédente)
Aiguës 2 - 16 kHz
(+) | des sommets équilibrés - à seulement 4.1% de la médiane
(+) | les aigus sont linéaires (6.1% delta à la fréquence précédente)
Globalement 100 - 16 000 Hz
(+) | le son global est linéaire (12.2% différence à la médiane)
Par rapport à la même classe
» 18% de tous les appareils testés de cette catégorie étaient meilleurs, 3% similaires, 79% pires
» Le meilleur avait un delta de 7%, la moyenne était de 17%, le pire était de 35%.
Par rapport à tous les appareils testés
» 10% de tous les appareils testés étaient meilleurs, 2% similaires, 88% pires
» Le meilleur avait un delta de 4%, la moyenne était de 23%, le pire était de 134%.
MSI CreatorPro Z16P B12UKST analyse audio
(+) | les haut-parleurs peuvent jouer relativement fort (83.3# dB)
Basses 100 - 315 Hz
(-) | presque aucune basse - en moyenne 18.7% plus bas que la médiane
(±) | la linéarité des basses est moyenne (7% delta à la fréquence précédente)
Médiums 400 - 2000 Hz
(+) | médiane équilibrée - seulement 3% de la médiane
(+) | les médiums sont linéaires (6.8% delta à la fréquence précédente)
Aiguës 2 - 16 kHz
(+) | des sommets équilibrés - à seulement 4.6% de la médiane
(+) | les aigus sont linéaires (6.4% delta à la fréquence précédente)
Globalement 100 - 16 000 Hz
(±) | la linéarité du son global est moyenne (15.2% de différence avec la médiane)
Par rapport à la même classe
» 33% de tous les appareils testés de cette catégorie étaient meilleurs, 10% similaires, 57% pires
» Le meilleur avait un delta de 7%, la moyenne était de 17%, le pire était de 35%.
Par rapport à tous les appareils testés
» 22% de tous les appareils testés étaient meilleurs, 4% similaires, 74% pires
» Le meilleur avait un delta de 4%, la moyenne était de 23%, le pire était de 134%.
Gestion de l'énergie - Bonne endurance avec l'écran IPS
Consommation électrique
Le ThinkPad P1 G6 équipé d'un écran WQHD affiche une efficacité nettement supérieure à celle de l'ancien ThinkPad X1 Extreme équipé d'un écran 4K. L'expérience suggère que l'écran OLED 4K en option nécessitera également beaucoup plus d'énergie. La consommation maximale en mode veille à 165 Hz est de 15,3 watts, et vous pouvez économiser environ 1,5 watts en mode 60 Hz. L'ordinateur portable reste assez efficace en charge ; pendant les jeux, nous avons mesuré un peu plus de 100 watts. Avec son prédécesseur, la consommation était d'environ 130 watts, malgré des performances moindres. Bien que nous ayons brièvement mesuré un maximum de 165 watts au début du test de stress, il s'est rapidement stabilisé autour de 110 watts. Le bloc d'alimentation de 170 watts fourni est plus que suffisant pour ces besoins.
| Éteint/en veille | |
| Au repos | |
| Fortement sollicité |
|
Légende:
min: | |
| Lenovo ThinkPad P1 G6-21FV000DGE i9-13900H, RTX 2000 Ada Generation Laptop, SK Hynix PC711 1TB HFS001TDE9X084N, IPS, 2560x1600, 16" | Dell Precision 5000 5680 i9-13900H, RTX 5000 Ada Generation Laptop, 2x SK hynix PC801 HFS512GEJ9X101N RAID 0, OLED, 3840x2400, 16" | Samsung Galaxy Book3 Ultra 16, i9-13900H RTX 4070 i9-13900H, GeForce RTX 4070 Laptop GPU, Samsung PM9A1 MZVL21T0HCLR, OLED / AMOLED, 2880x1800, 16" | HP ZBook Studio 16 G9 62U04EA i7-12800H, RTX A2000 Laptop GPU, Micron 3400 1TB MTFDKBA1T0TFH, IPS, 3840x2400, 16" | MSI CreatorPro Z16P B12UKST i7-12700H, RTX A3000 Laptop GPU, Samsung PM9A1 MZVL21T0HCLR, IPS, 2560x1600, 16" | Schenker VISION 16 Pro (M23) i7-13700H, GeForce RTX 4070 Laptop GPU, Samsung 990 Pro 1 TB, IPS, 2560x1600, 16" | Lenovo ThinkPad X1 Extreme G5-21DE003RGE i7-12700H, GeForce RTX 3060 Laptop GPU, Micron 3400 1TB MTFDKBA1T0TFH, IPS, 3840x2400, 16" | Moyenne NVIDIA RTX 2000 Ada Generation Laptop | Moyenne de la classe Workstation | |
|---|---|---|---|---|---|---|---|---|---|
| Power Consumption | -14% | 29% | -12% | -21% | -0% | -43% | 9% | -7% | |
| Idle Minimum * (Watt) | 8.3 | 8 4% | 4.3 48% | 7.2 13% | 10.8 -30% | 8.6 -4% | 11.8 -42% | 6.88 ? 17% | 9.11 ? -10% |
| Idle Average * (Watt) | 14.5 | 10.4 28% | 4.6 68% | 18.1 -25% | 16.3 -12% | 12 17% | 22.4 -54% | 12.1 ? 17% | 13.8 ? 5% |
| Idle Maximum * (Watt) | 15.3 | 30.5 -99% | 11.4 25% | 18.5 -21% | 16.9 -10% | 12.4 19% | 23.1 -51% | 14.5 ? 5% | 17.9 ? -17% |
| Load Average * (Watt) | 91.8 | 75.4 18% | 97 -6% | 112.8 -23% | 111.7 -22% | 80 13% | 138 -50% | 86.9 ? 5% | 96 ? -5% |
| Witcher 3 ultra * (Watt) | 104.7 | 134 -28% | 100.9 4% | 106.7 -2% | 152.1 -45% | 147.7 -41% | 129.9 -24% | ||
| Load Maximum * (Watt) | 164.5 | 175 -6% | 107 35% | 186 -13% | 177.4 -8% | 173.1 -5% | 225.6 -37% | 161.1 ? 2% | 180.3 ? -10% |
* ... Moindre est la valeur, meilleures sont les performances
Power consumption Witcher 3 / stress test
Power consumption with external monitor
Autonomie de la batterie
La batterie conserve sa capacité de 90 watts-heure, ce qui permet d'obtenir d'excellentes durées d'autonomie, notamment en mode 60 Hz. Lors de notre test WLAN, le ThinkPad P1 G6 atteint environ 9,5 heures à 150 cd/m² (équivalent à 63 % de la luminosité maximale de l'appareil de test) et 6 heures et 43 minutes à pleine luminosité. Compte tenu de la taille de l'écran et de la luminosité élevée de près de 500 cd/m², ces résultats sont assez impressionnants. L'écran dure près de 11 heures lors du test vidéo (également à 150 cd/m2), mais les durées d'utilisation sont plus courtes en mode 165 Hz, comme le montre le tableau ci-dessous :
| Mode | Test WLAN (150 cd/m²) | Test WLAN luminosité max. | Test vidéo (150 cd/m²) |
|---|---|---|---|
| 60 Hz | 567 minutes | 403 minutes | 674 minutes |
| 165 Hz | 500 minutes | 370 minutes | 548 minutes |
En cas d'utilisation intensive, la batterie peut s'épuiser en un peu plus d'une heure, et il faut environ 100 minutes pour la recharger complètement lorsque l'appareil est allumé. Une charge d'environ 45 % est disponible après un peu moins de 20 minutes, et de 80 % après 50 minutes.
| Lenovo ThinkPad P1 G6-21FV000DGE i9-13900H, RTX 2000 Ada Generation Laptop, 90 Wh | Dell Precision 5000 5680 i9-13900H, RTX 5000 Ada Generation Laptop, 98 Wh | Samsung Galaxy Book3 Ultra 16, i9-13900H RTX 4070 i9-13900H, GeForce RTX 4070 Laptop GPU, 76 Wh | HP ZBook Studio 16 G9 62U04EA i7-12800H, RTX A2000 Laptop GPU, 86 Wh | MSI CreatorPro Z16P B12UKST i7-12700H, RTX A3000 Laptop GPU, 90 Wh | Schenker VISION 16 Pro (M23) i7-13700H, GeForce RTX 4070 Laptop GPU, 80 Wh | Lenovo ThinkPad X1 Extreme G5-21DE003RGE i7-12700H, GeForce RTX 3060 Laptop GPU, 90 Wh | Moyenne de la classe Workstation | |
|---|---|---|---|---|---|---|---|---|
| Autonomie de la batterie | 30% | -18% | -19% | -39% | -10% | -3% | 4% | |
| H.264 (h) | 11.2 | 9 -20% | 8.5 -24% | 7.8 -30% | 7.3 -35% | 10.1 ? -10% | ||
| WiFi v1.3 (h) | 9.5 | 9.9 4% | 8 -16% | 6.3 -34% | 5.8 -39% | 7.8 -18% | 6.7 -29% | 8.55 ? -10% |
| Load (h) | 1.1 | 1.7 55% | 0.9 -18% | 1.1 0% | 1.3 18% | 1.7 55% | 1.441 ? 31% |
Points positifs
Points négatifs
Verdict - Très bonne station de travail mobile

Le nouveau ThinkPad P1 G6 répond aux attentes en conservant le même design de boîtier et en proposant deux types de refroidissement (classique avec caloducs ou chambre à vapeur) en fonction de la carte graphique dédiée. L'abandon du ThinkPad X1 Extreme n'est qu'une décision marketing, les deux modèles étant identiques. Outre les GPU professionnels de Nvidia, Lenovo propose également des variantes grand public, bien que les choix soient quelque peu limités aux modèles suivants RTX 4060 Laptop, 4080 Laptopet 4090 Laptop.
En ce qui concerne les performances du processeur, la puissance globale est excellente, le Core i9 excellant dans les tests à cœur unique. En outre, on soupçonne que les modèles plus puissants dotés d'un système de refroidissement par chambre à vapeur pourraient offrir des performances de processeur légèrement supérieures. La nouvelle RTX 2000 Ada se distingue par une mise à niveau significative, offrant des performances graphiques supérieures malgré sa puissance TGP relativement faible de 65 watts. Elle surpasse l'ancienne RTX A3000 et même l'ordinateur portable GeForce RTX 3060. Bien que le GPU soit similaire à celui de l'ordinateur portable GeForce RTX 4060, il fonctionne à 80 watts dans le ThinkPad P1 G6 avec un refroidissement par chambre à vapeur plus robuste. La différenciation de Lenovo à cet égard n'est pas tout à fait claire.
Le ThinkPad P1 G6 excelle en tant que station de travail mobile, privilégiant la mobilité aux performances brutes. Les GPU Nvidia Ada offrent des performances impressionnantes, et l'écran IPS optionnel avec une luminosité de 500 nits et un taux de rafraîchissement de 165 Hz est fortement recommandé, surtout si vous n'avez pas besoin d'un espace colorimétrique étendu.
Bien que l'écran soit exceptionnellement performant, son point faible réside dans la couverture de l'espace colorimétrique, limitée à la petite norme sRGB. Tous les autres aspects de l'écran sont excellents, ce qui en fait un choix préférable au modèle OLED optionnel. Le seul argument en faveur de l'écran OLED est sa plus grande couverture de l'espace colorimétrique. Il est regrettable que Lenovo ne propose plus l'écran IPS 4K avec l'espace colorimétrique Adobe RGB.
Le ThinkPad P1 G6 est un appareil bien conçu qui ne présente pas de défauts majeurs. Les améliorations pourraient inclure un lecteur de cartes plus rapide, le retour aux anciens claviers avec une course de 0,07 pouce, et le pré-acheminement des antennes pour les modules WWAN. En outre, l'optimisation du comportement du ventilateur améliorerait l'expérience globale de l'utilisateur. Le niveau sonore de l'appareil atteint 48 dB(A) en charge, ce qui le rend relativement bruyant. En comparaison, le refroidissement par chambre à vapeur de son prédécesseur était plus silencieux.
Prix et disponibilité
L'échantillon du ThinkPad P1 G6 que nous avons examiné peut être commandé sur Amazon au prix de 3 000 USD. Le P1 G6 peut également être configuré dans la boutique en ligne de Lenovo.
Lenovo ThinkPad P1 G6-21FV000DGE
- 10/19/2023 v7 (old)
Andreas Osthoff
Transparency
La sélection des appareils à examiner est effectuée par notre équipe éditoriale. L'échantillon de test a été prêté à l'auteur par le fabricant ou le détaillant pour les besoins de cet examen. Le prêteur n'a pas eu d'influence sur cette évaluation et le fabricant n'a pas reçu de copie de cette évaluation avant sa publication. Il n'y avait aucune obligation de publier cet article. En tant que média indépendant, Notebookcheck n'est pas soumis à l'autorité des fabricants, des détaillants ou des éditeurs.
Voici comment Notebookcheck teste
Chaque année, Notebookcheck examine de manière indépendante des centaines d'ordinateurs portables et de smartphones en utilisant des procédures standardisées afin de garantir que tous les résultats sont comparables. Nous avons continuellement développé nos méthodes de test depuis environ 20 ans et avons établi des normes industrielles dans le processus. Dans nos laboratoires de test, des équipements de mesure de haute qualité sont utilisés par des techniciens et des rédacteurs expérimentés. Ces tests impliquent un processus de validation en plusieurs étapes. Notre système d'évaluation complexe repose sur des centaines de mesures et de points de référence bien fondés, ce qui garantit l'objectivité.Price comparison

