Test du HP ZBook Fury 16 G10 : 100 W Nvidia RTX 5000 Ada

Le ZBook Fury 16 G10 succède directement au ZBook Fury 16 G9 de l'année dernière avec les nouveaux CPU Raptor Lake-HX de 13ème génération et les options GPU Nvidia RTX Ada pour remplacer les anciens processeurs Alder Lake et RTX Ampere de 12ème génération, respectivement. Le nouveau modèle est par ailleurs visuellement identique à la Fury 16 G9 notre revue du modèle de l'année dernière pour en savoir plus sur les caractéristiques physiques de la Fury 16 G10.
Notre unité de test spécifique est une configuration haut de gamme avec le Core i9-13950HX, Nvidia RTX 5000 Ada, et un écran IPS 2400p pour un prix de détail d'environ $5300 USD. Des configurations plus modestes sont disponibles à des prix de départ inférieurs, comme le montre la liste officielle des spécifications HP ( ).
Les alternatives au Fury 16 G10 comprennent d'autres stations de travail mobiles de 16 pouces comme le Dell Precision 5680, Lenovo ThinkPad P16 G1,MSI CreatorPro Z16Pou leAsus ProArt StudioBook 16.
Plus d'avis sur HP :
Comparaison avec les concurrents potentiels
Note | Date | Modèle | Poids | Épaisseur | Taille | Résolution | Prix |
|---|---|---|---|---|---|---|---|
| 92.3 % v7 (old) | 09/23 | HP ZBook Fury 16 G10 i9-13950HX, RTX 5000 Ada Generation Laptop | 2.6 kg | 28.5 mm | 16.00" | 3840x2400 | |
| 91 % v7 (old) | 06/23 | HP ZBook Fury 16 G9 i9-12950HX, RTX A5500 Laptop GPU | 2.6 kg | 28.5 mm | 16.00" | 3840x2400 | |
| 89 % v7 (old) | 08/23 | Dell Precision 5000 5680 i9-13900H, RTX 5000 Ada Generation Laptop | 2.3 kg | 22.17 mm | 16.00" | 3840x2400 | |
| 91 % v7 (old) | 02/23 | Lenovo ThinkPad P16 G1 RTX A5500 i9-12950HX, RTX A5500 Laptop GPU | 3 kg | 30.23 mm | 16.00" | 3840x2400 | |
| 84.3 % v7 (old) | 11/22 | MSI CreatorPro Z16P B12UKST i7-12700H, RTX A3000 Laptop GPU | 2.4 kg | 19 mm | 16.00" | 2560x1600 | |
v (old) | 12/21 | Asus ProArt StudioBook 16 W7600H5A-2BL2 W-11955M, RTX A5000 Laptop GPU | 2.4 kg | 21.4 mm | 16.00" | 3840x2400 |
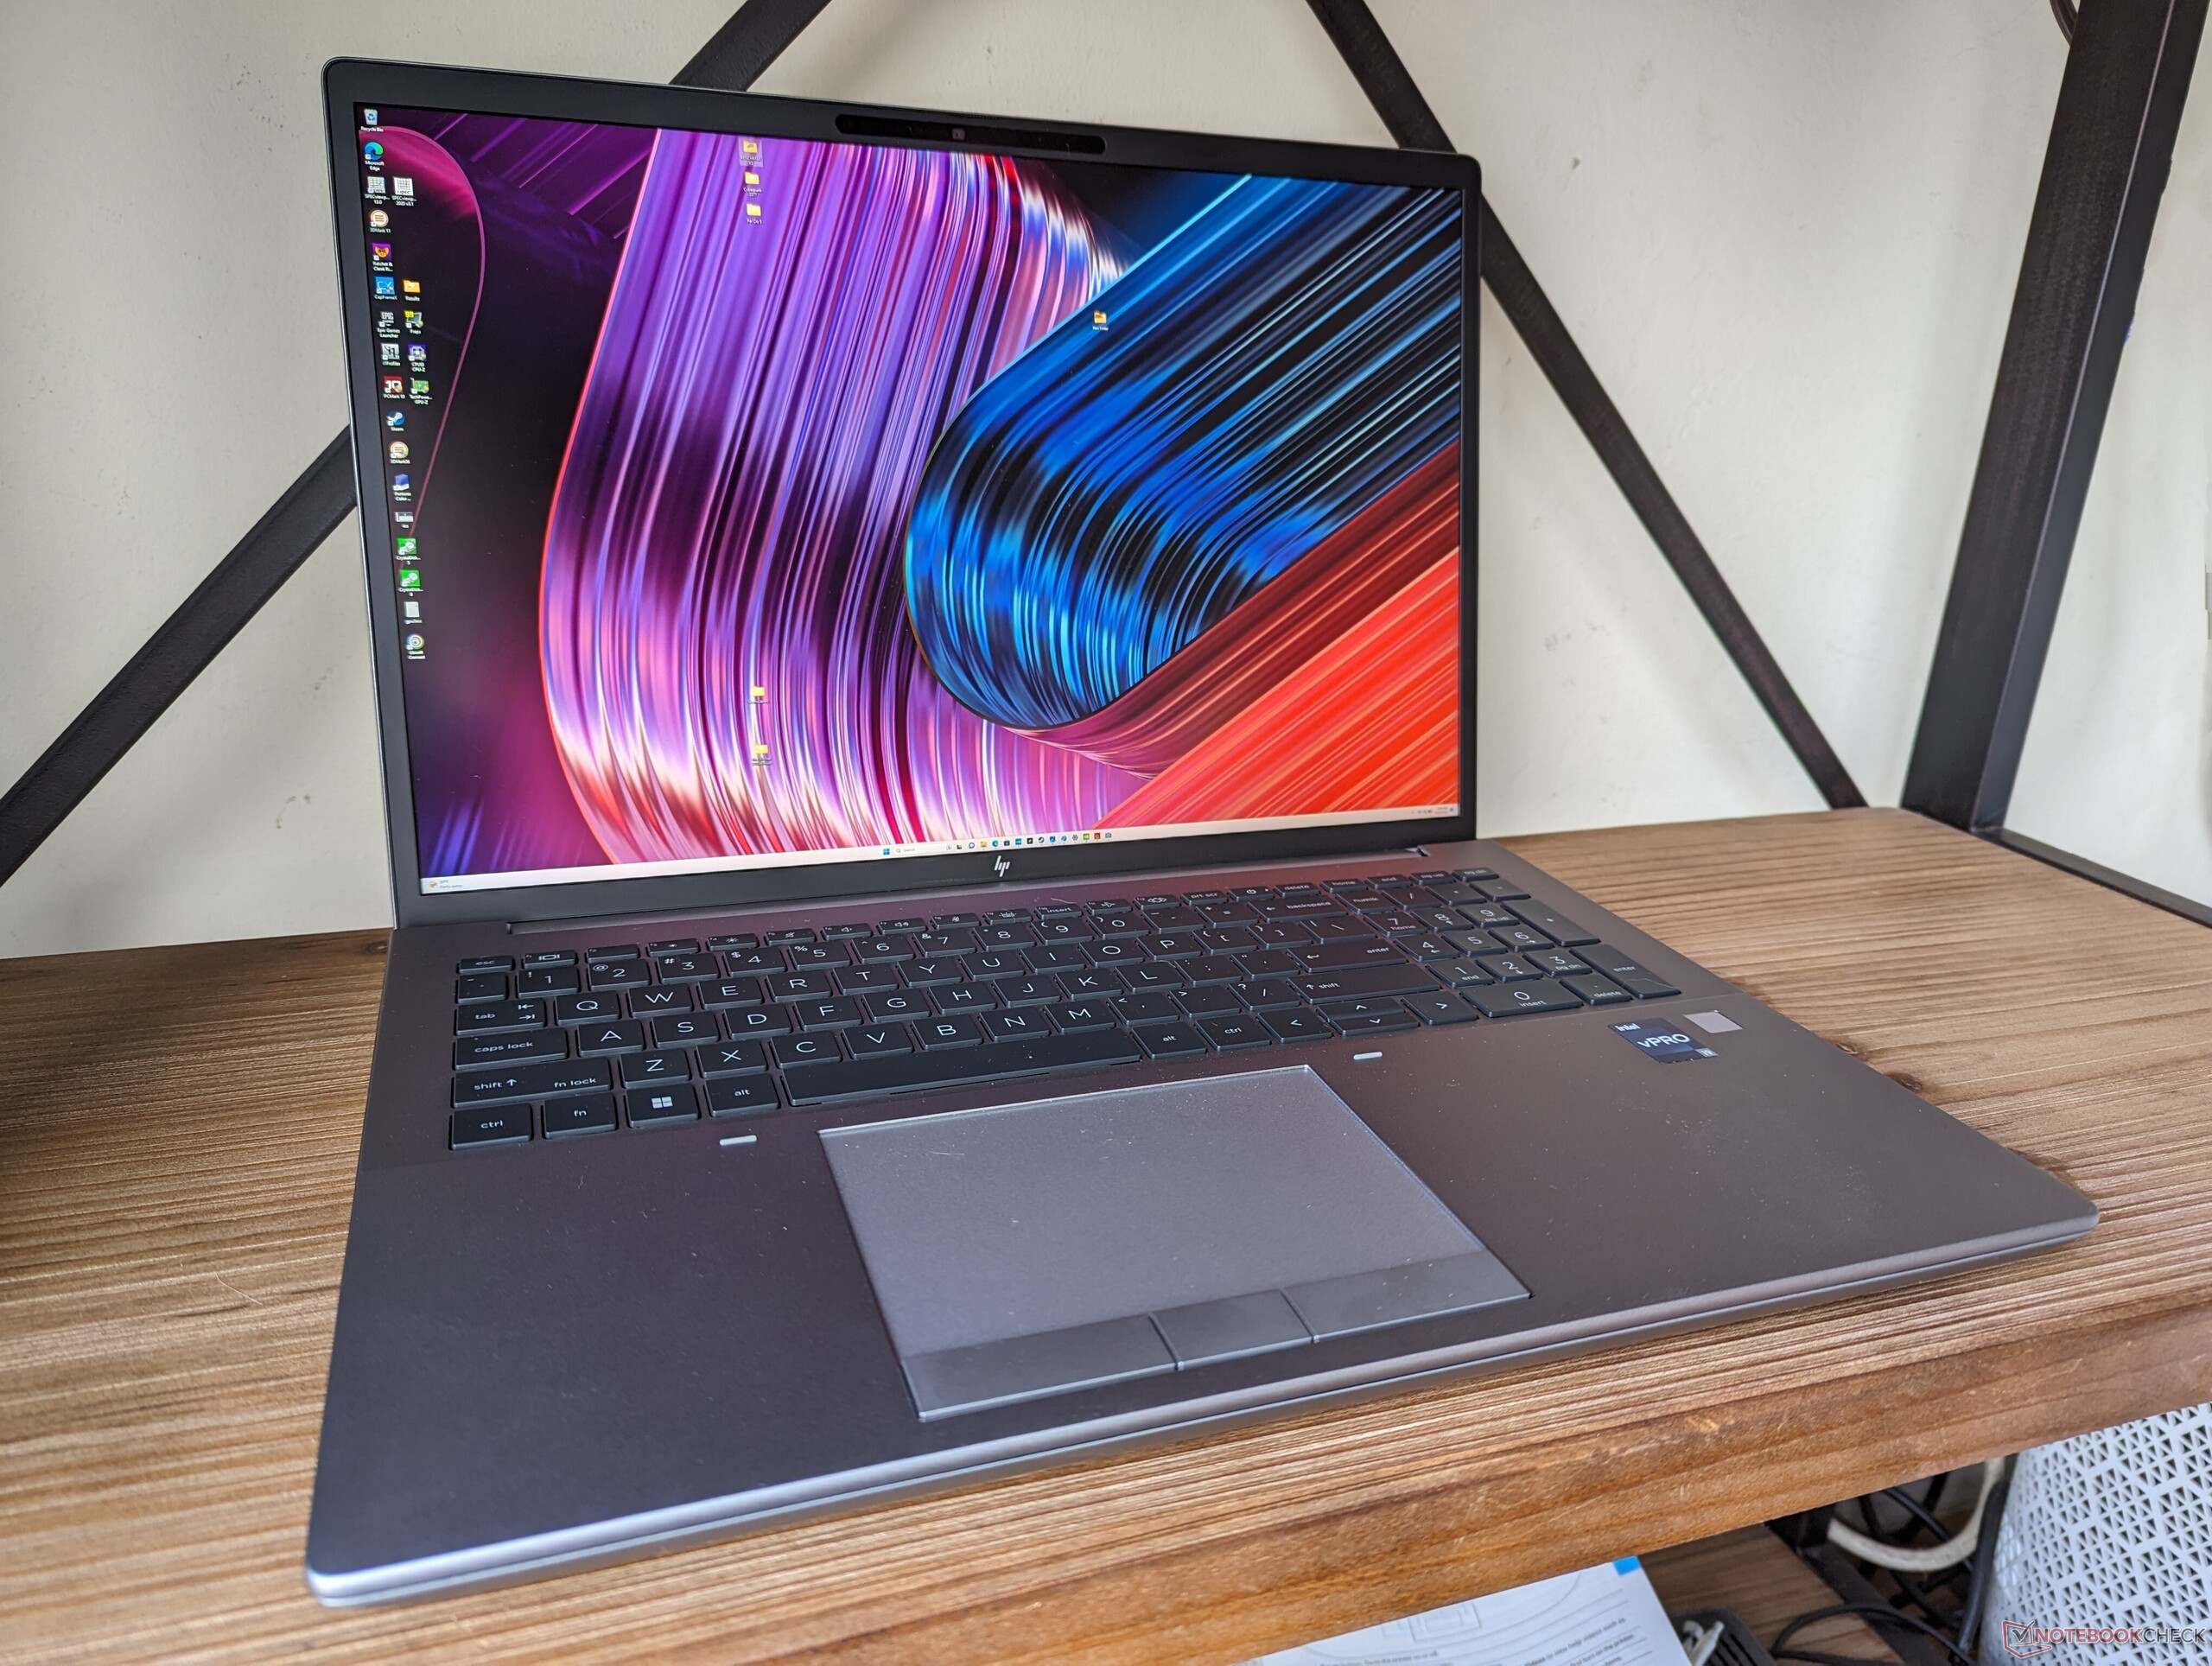
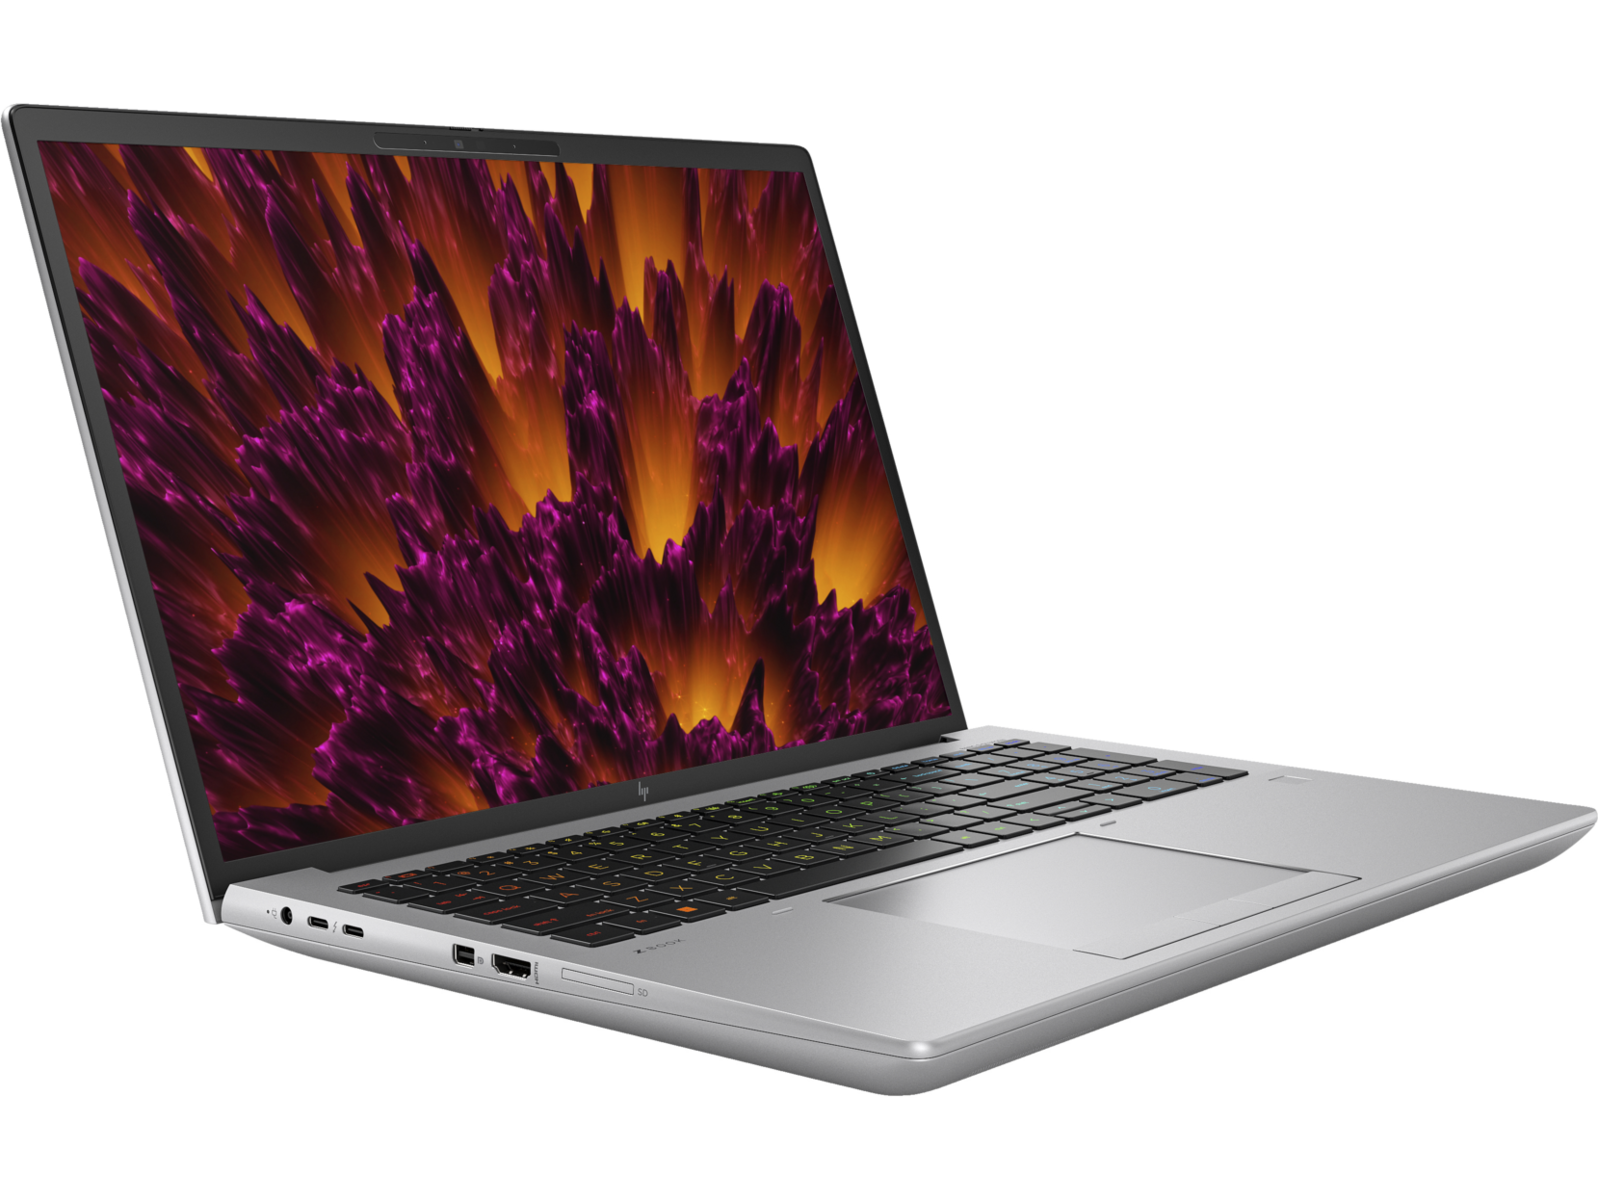
Boîtier - Design familier du ZBook Fury 16 G9
Lecteur de carte SD
| SD Card Reader | |
| average JPG Copy Test (av. of 3 runs) | |
| Dell Precision 5000 5680 (Toshiba Exceria Pro SDXC 64 GB UHS-II) | |
| MSI CreatorPro Z16P B12UKST (AV Pro V60) | |
| HP ZBook Fury 16 G10 (Toshiba Exceria Pro SDXC 64 GB UHS-II) | |
| HP ZBook Fury 16 G9 (PNY EliteX-PRO60) | |
| Lenovo ThinkPad P16 G1 RTX A5500 (Toshiba Exceria Pro SDXC 64 GB UHS-II) | |
| Asus ProArt StudioBook 16 W7600H5A-2BL2 (AV Pro SD microSD 128 GB V60) | |
| maximum AS SSD Seq Read Test (1GB) | |
| Dell Precision 5000 5680 (Toshiba Exceria Pro SDXC 64 GB UHS-II) | |
| HP ZBook Fury 16 G10 (Toshiba Exceria Pro SDXC 64 GB UHS-II) | |
| Asus ProArt StudioBook 16 W7600H5A-2BL2 (AV Pro SD microSD 128 GB V60) | |
| HP ZBook Fury 16 G9 (PNY EliteX-PRO60) | |
| MSI CreatorPro Z16P B12UKST (AV Pro V60) | |
| Lenovo ThinkPad P16 G1 RTX A5500 (Toshiba Exceria Pro SDXC 64 GB UHS-II) | |
Communication
| Networking | |
| iperf3 transmit AX12 | |
| Asus ProArt StudioBook 16 W7600H5A-2BL2 | |
| iperf3 receive AX12 | |
| Asus ProArt StudioBook 16 W7600H5A-2BL2 | |
| iperf3 transmit AXE11000 | |
| HP ZBook Fury 16 G10 | |
| Lenovo ThinkPad P16 G1 RTX A5500 | |
| Dell Precision 5000 5680 | |
| HP ZBook Fury 16 G9 | |
| iperf3 receive AXE11000 | |
| HP ZBook Fury 16 G9 | |
| HP ZBook Fury 16 G10 | |
| Lenovo ThinkPad P16 G1 RTX A5500 | |
| Dell Precision 5000 5680 | |
| iperf3 transmit AXE11000 6GHz | |
| MSI CreatorPro Z16P B12UKST | |
| Lenovo ThinkPad P16 G1 RTX A5500 | |
| HP ZBook Fury 16 G10 | |
| Dell Precision 5000 5680 | |
| iperf3 receive AXE11000 6GHz | |
| MSI CreatorPro Z16P B12UKST | |
| HP ZBook Fury 16 G10 | |
| Lenovo ThinkPad P16 G1 RTX A5500 | |
| Dell Precision 5000 5680 | |
Webcam
Les ordinateurs portables HP continuent d'être dotés de webcams à la résolution parmi les plus élevées du marché. Le capteur de 5 MP du Fury 16 G10 offre une image beaucoup plus nette que la webcam de 2 MP du Precision 5680.


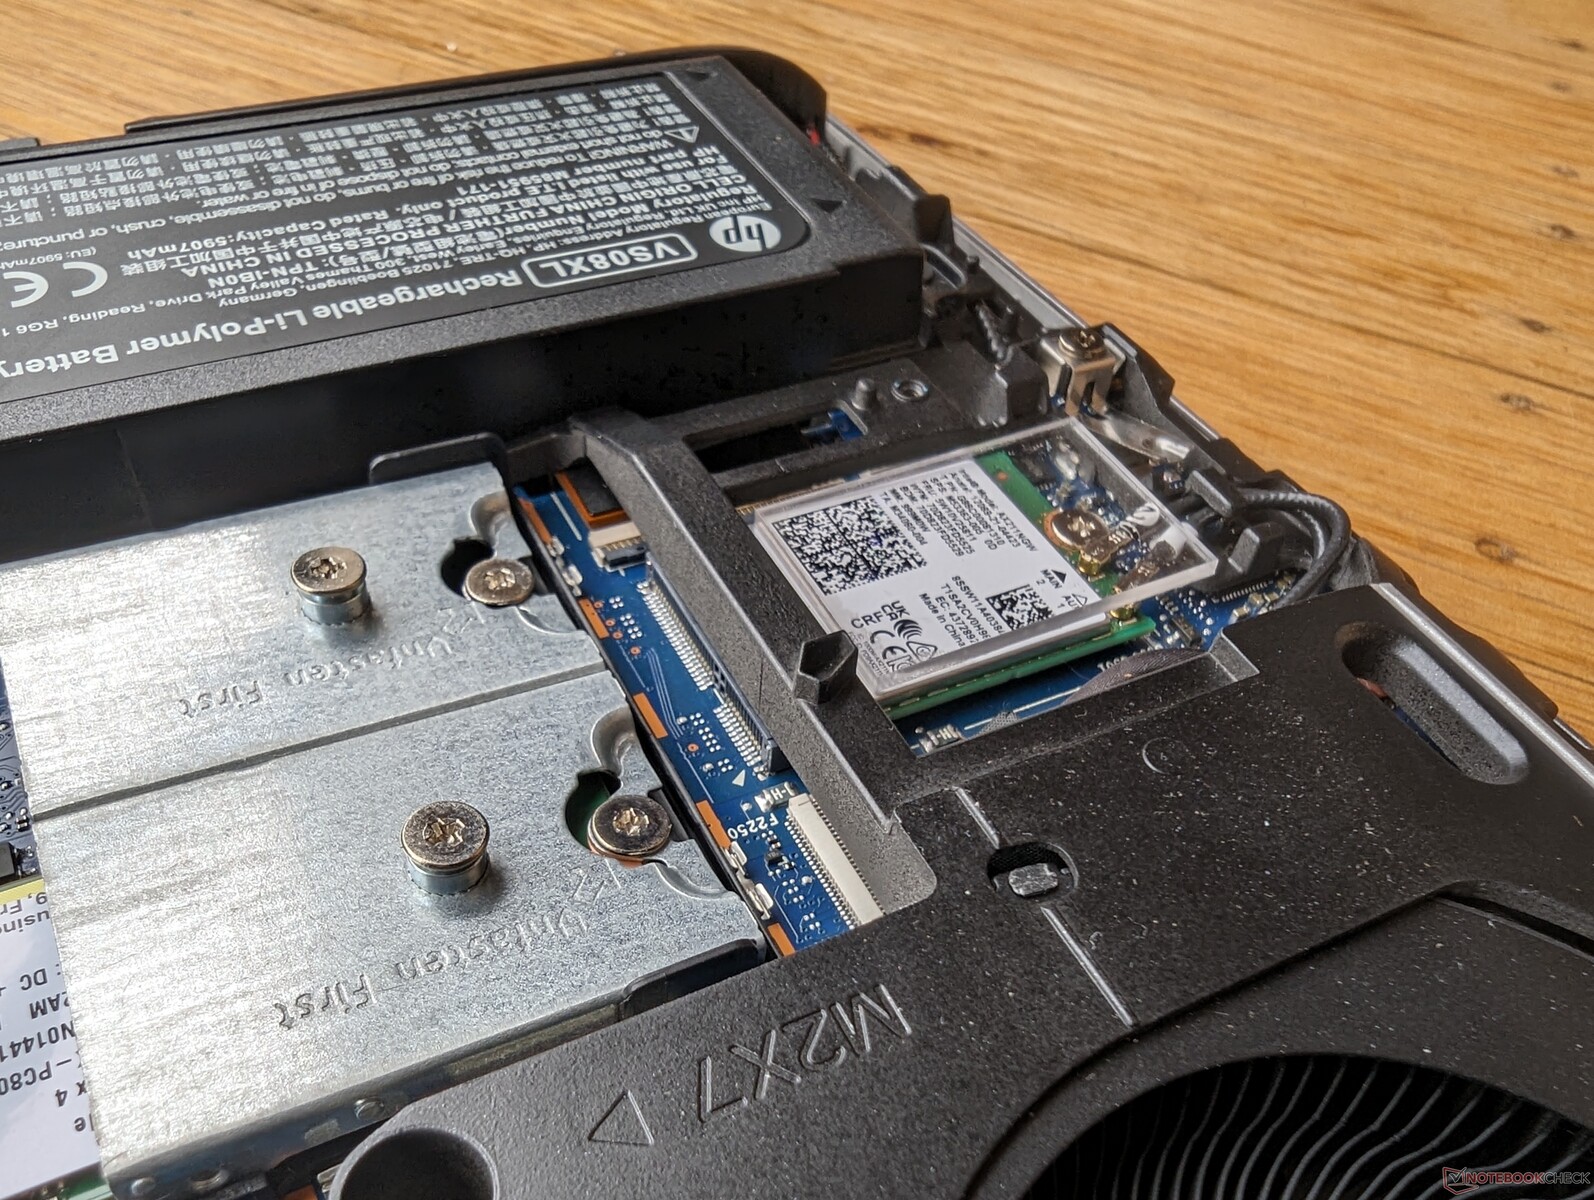
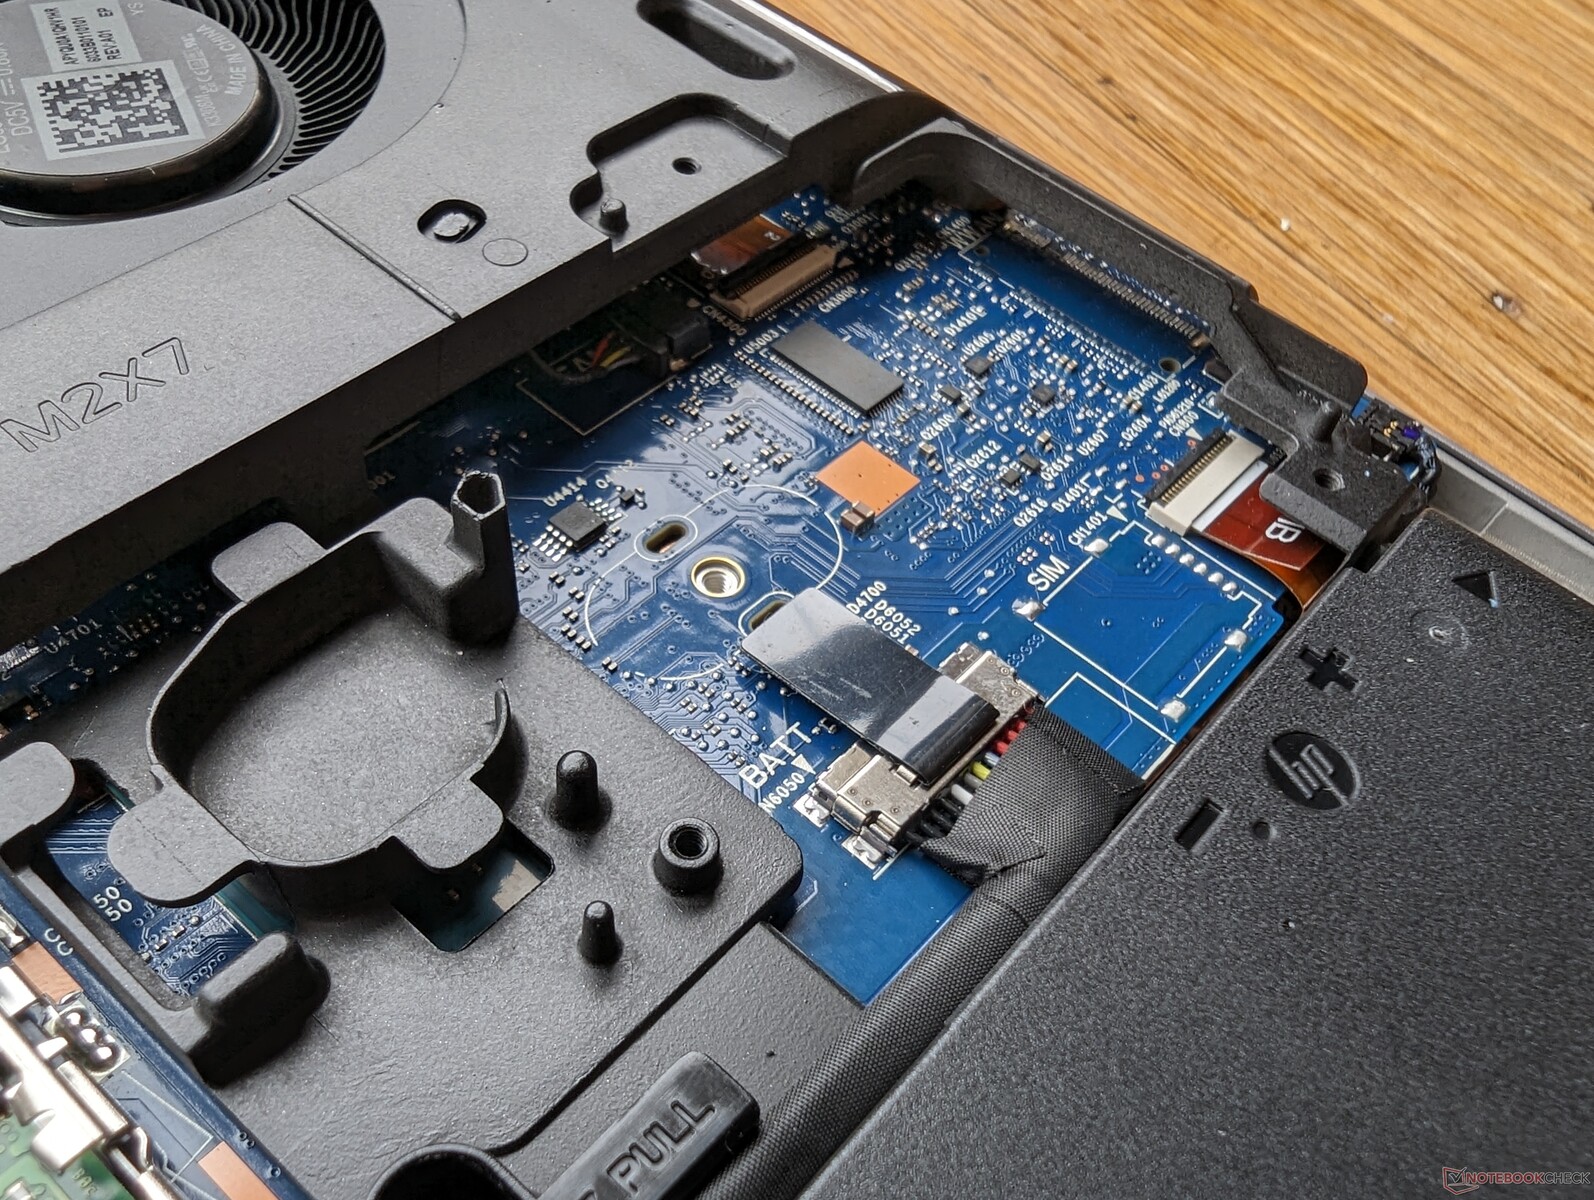
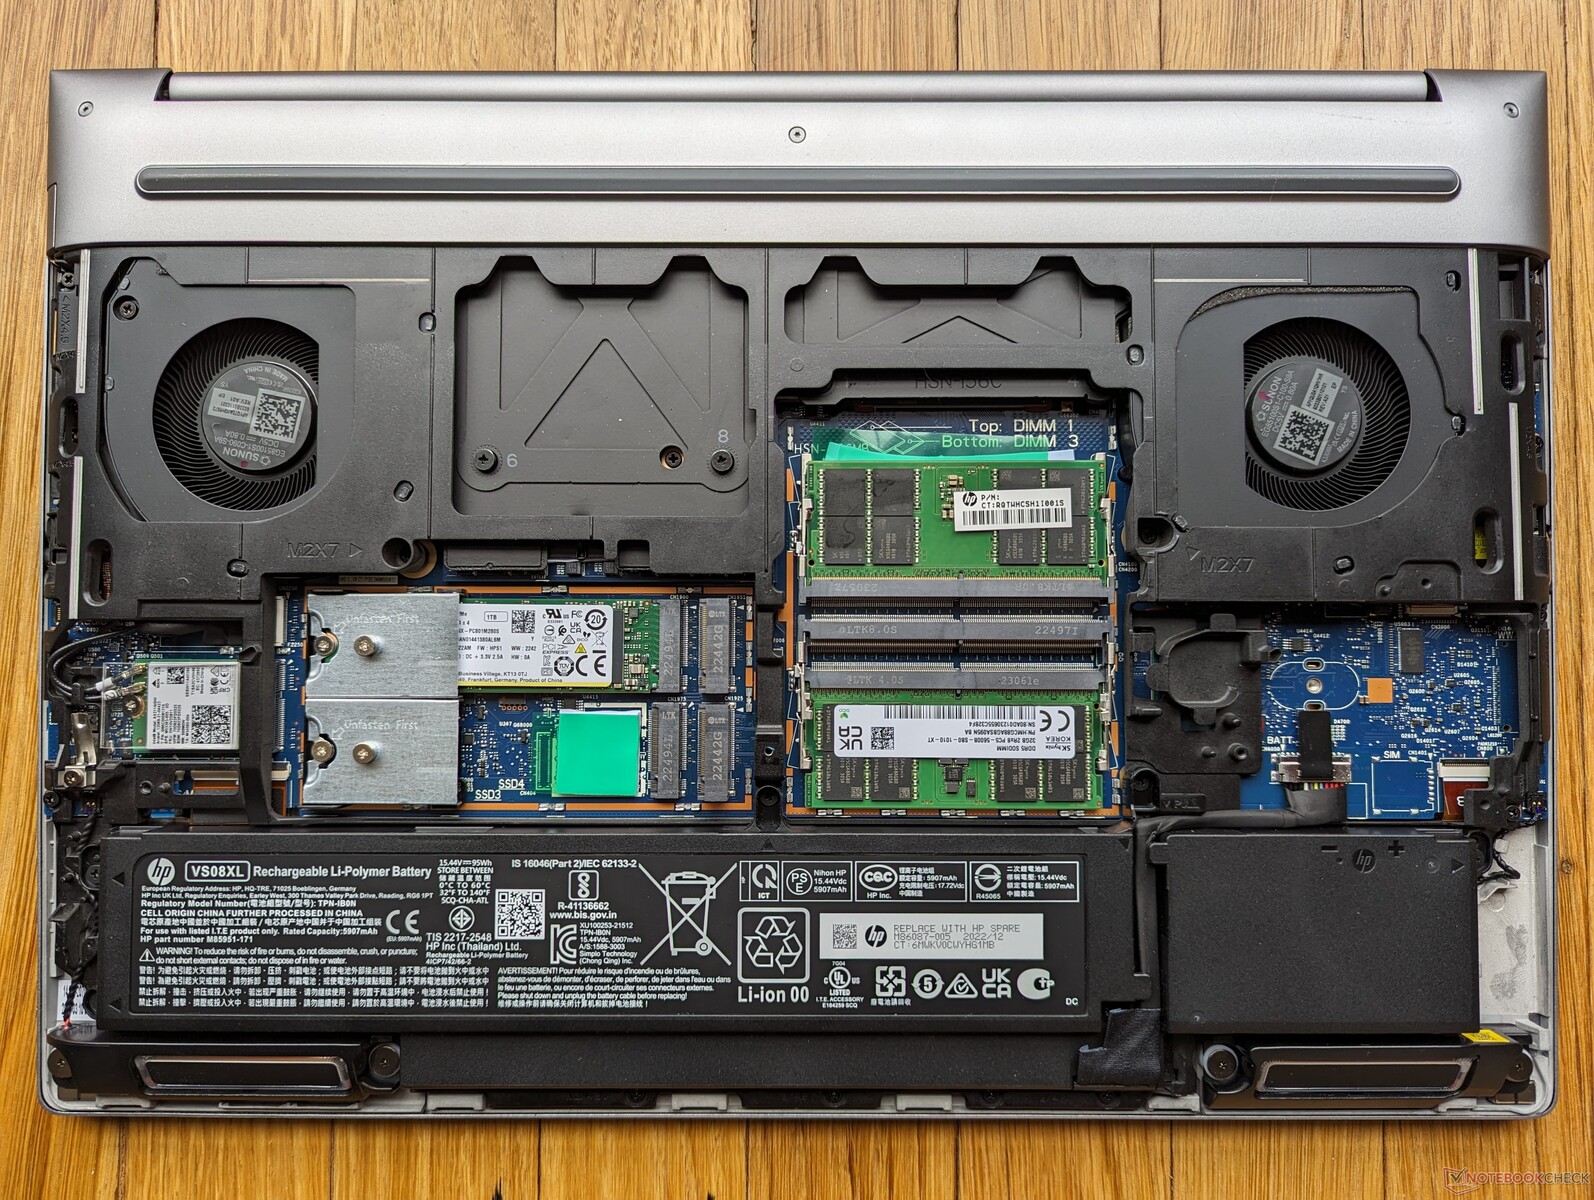
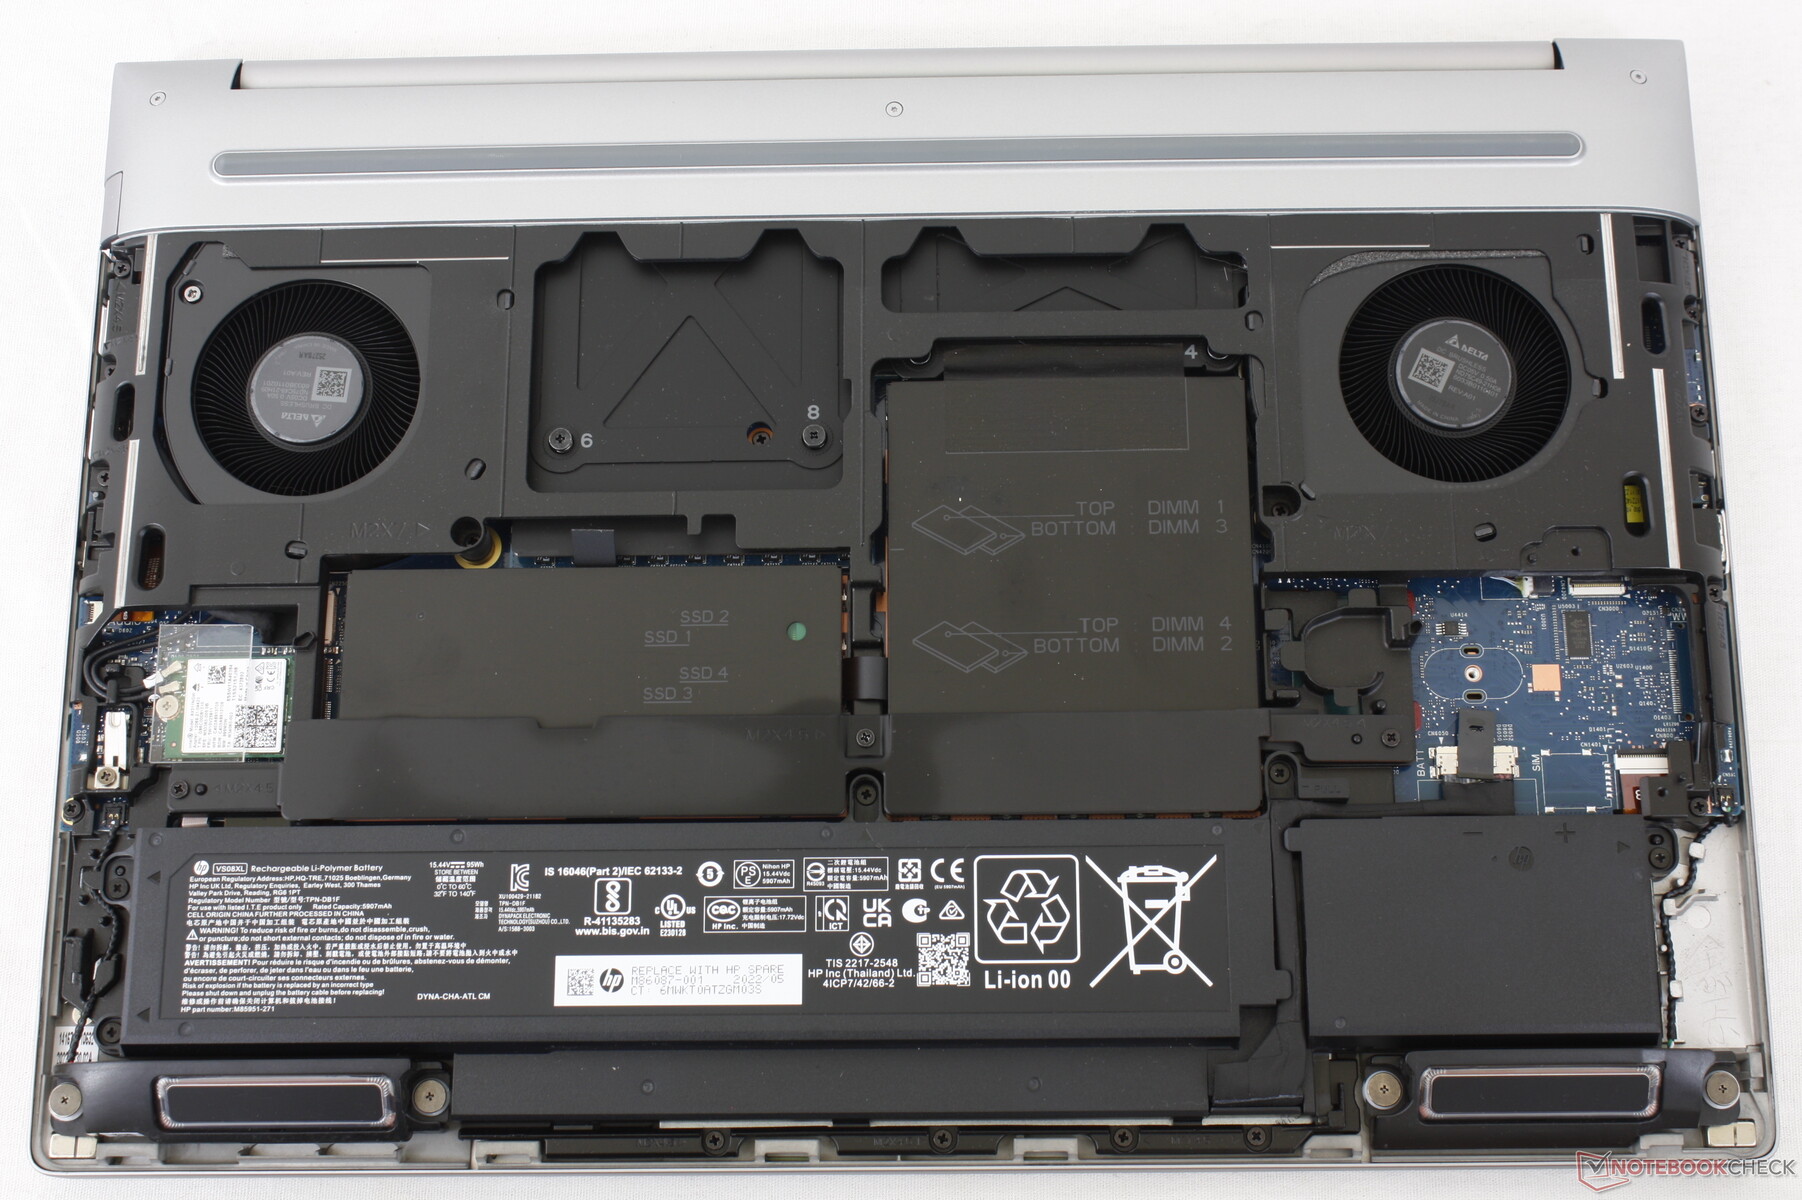
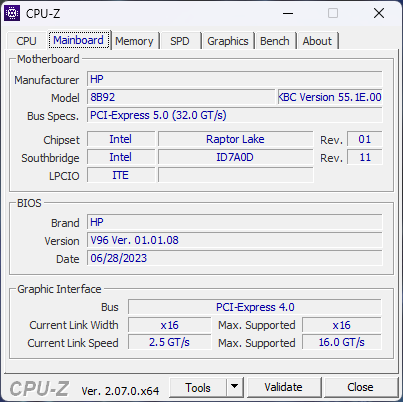
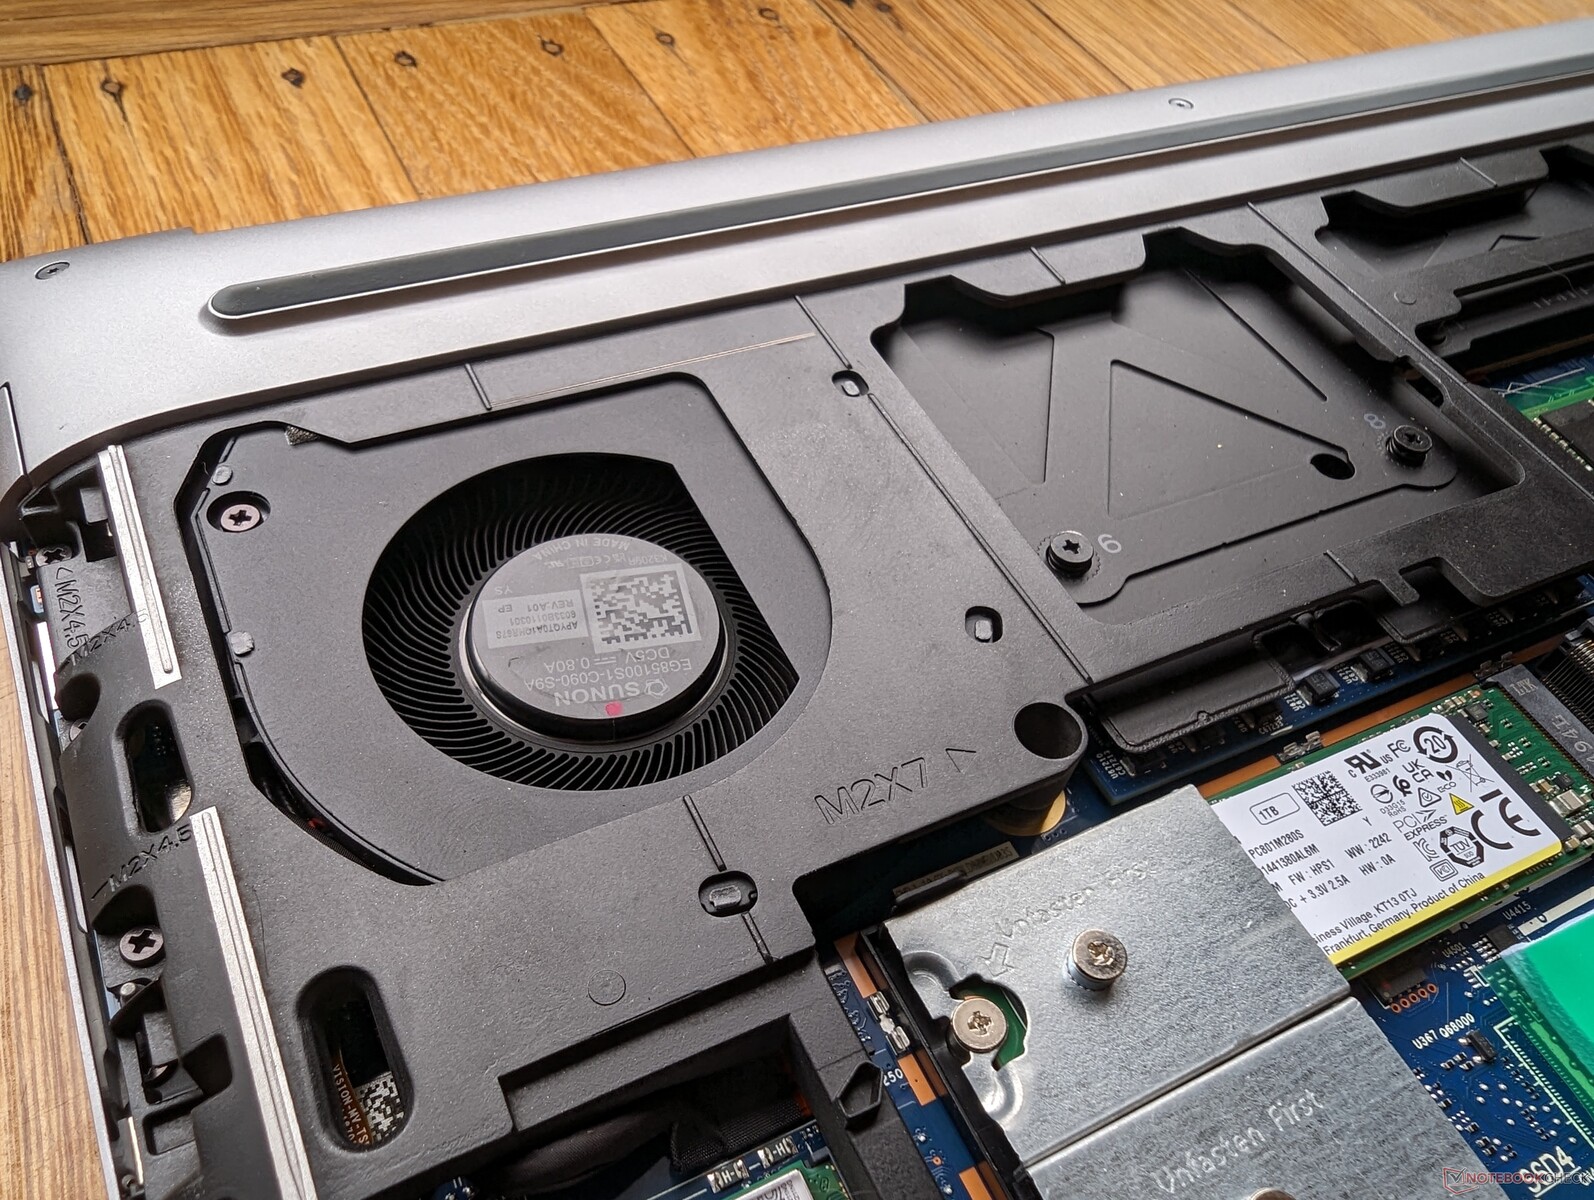
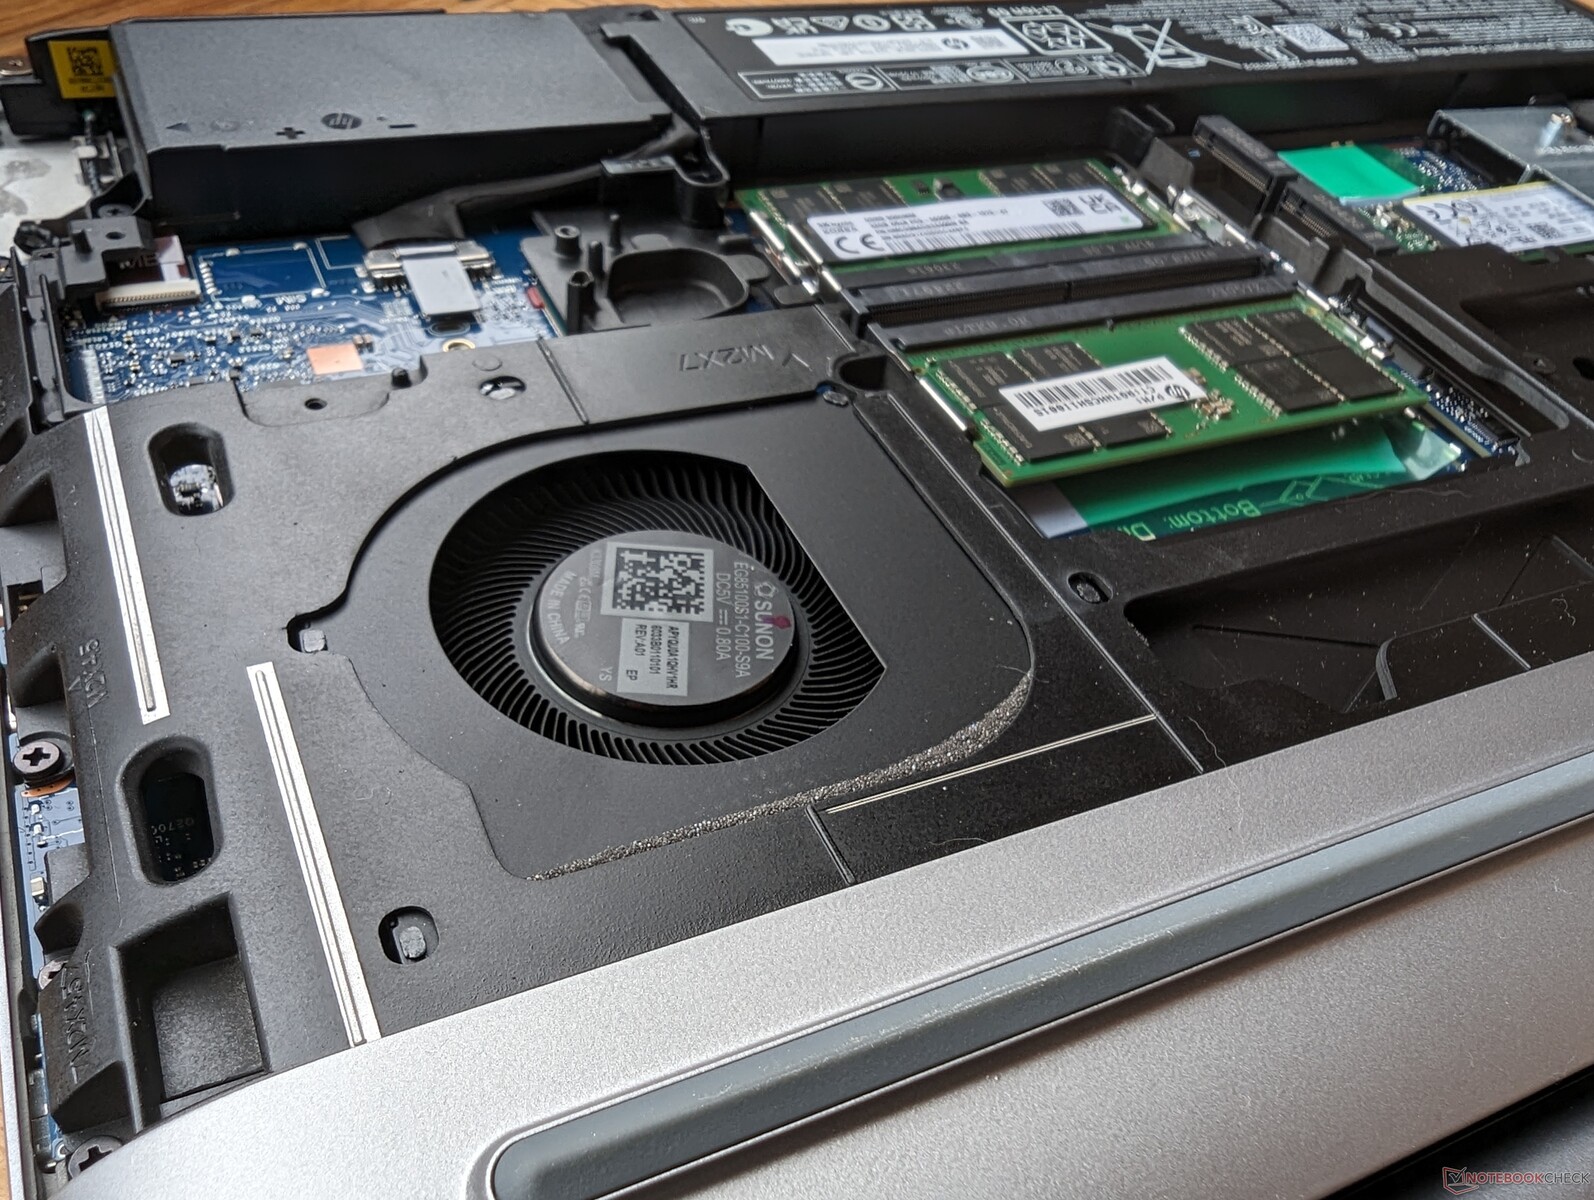
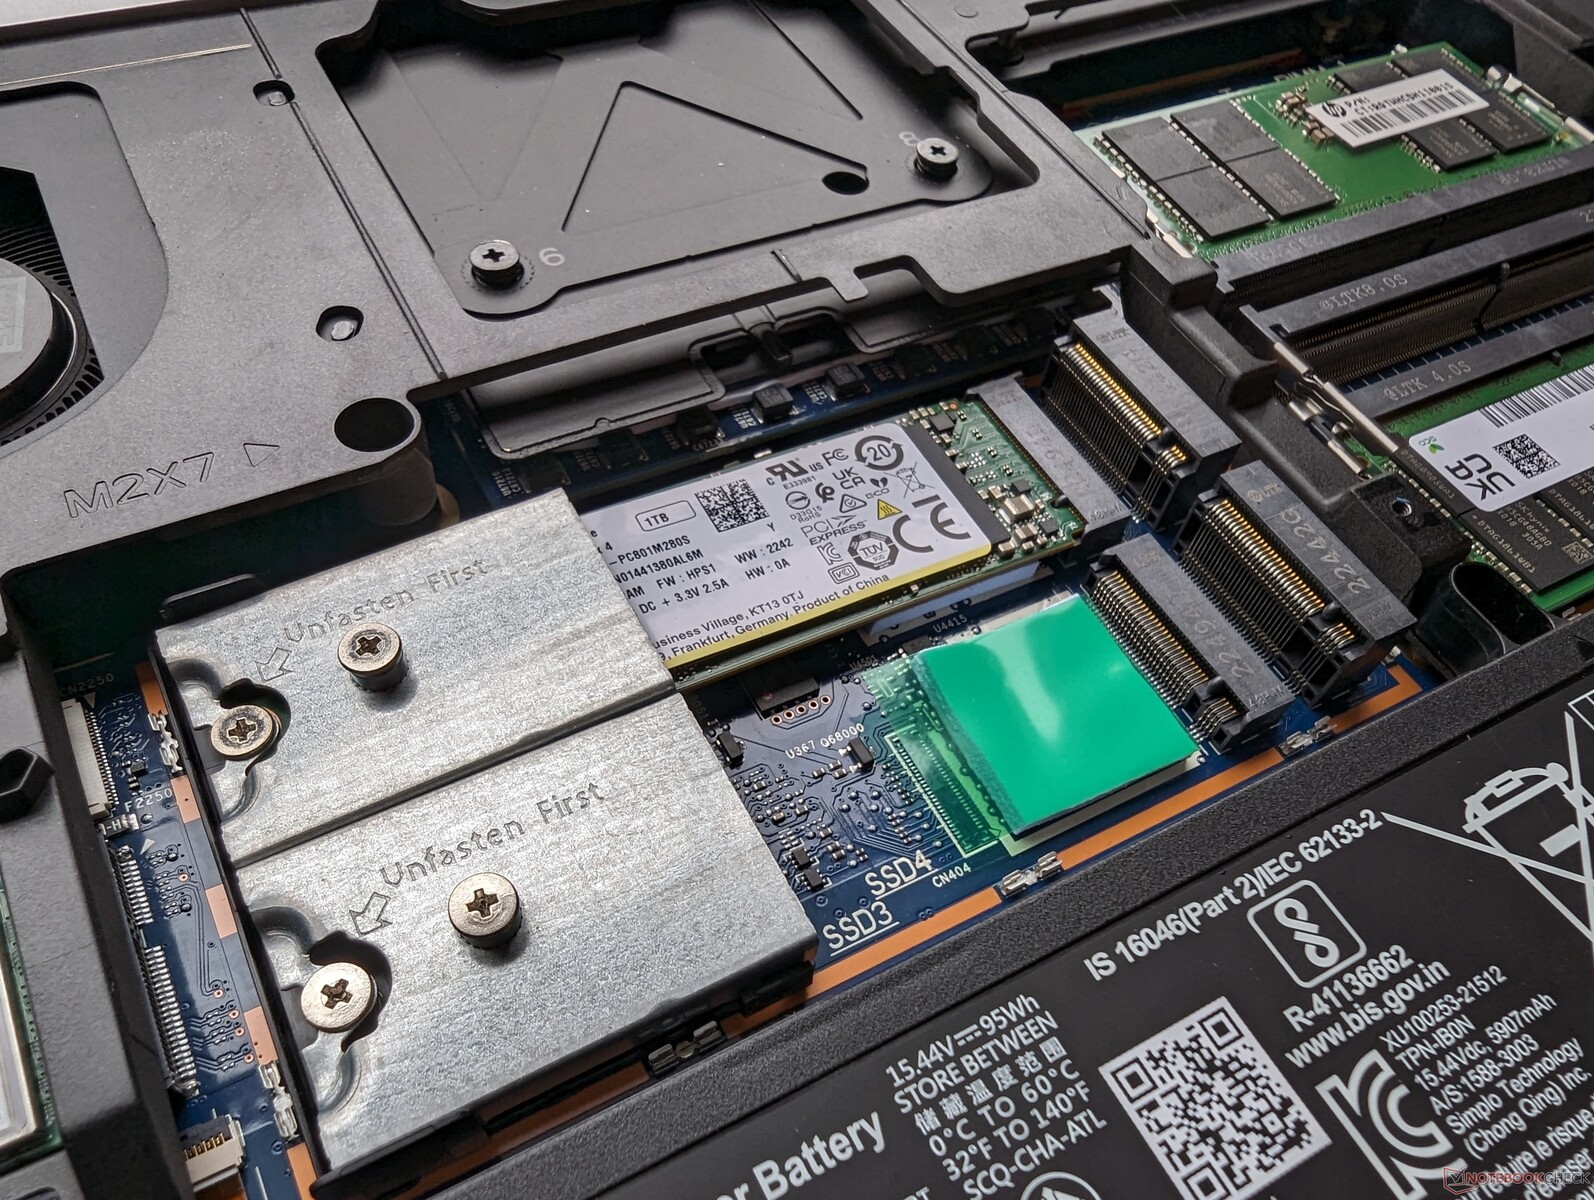
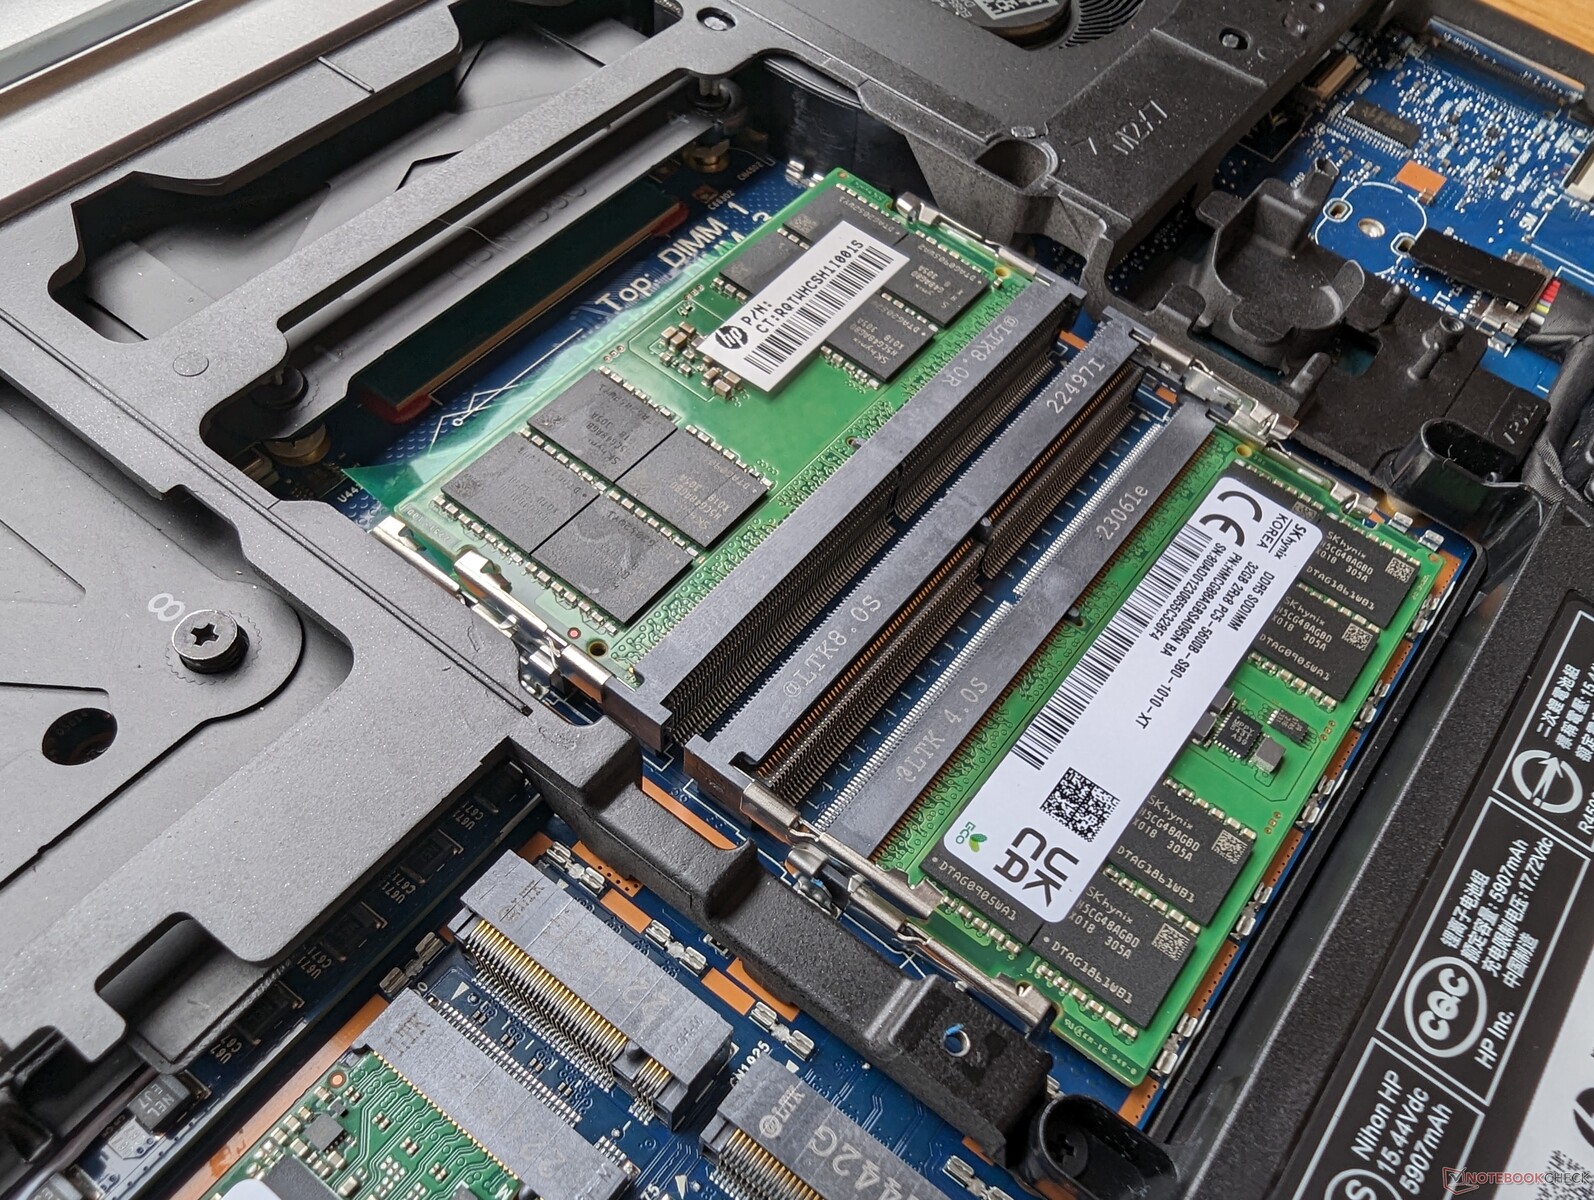
Maintenance
L'entretien se fait "sans outil" dans la mesure où le panneau inférieur peut être retiré sans aucun outil. Une fois à l'intérieur, cependant, un tournevis sera nécessaire pour retirer la plaque métallique protégeant les quatre disques SSD et les quatre modules de RAM. Vous aurez donc toujours besoin d'un tournevis pour effectuer des mises à niveau significatives.
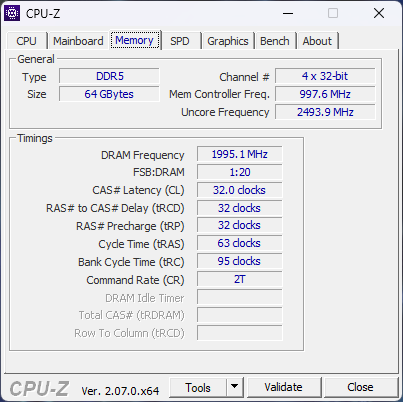
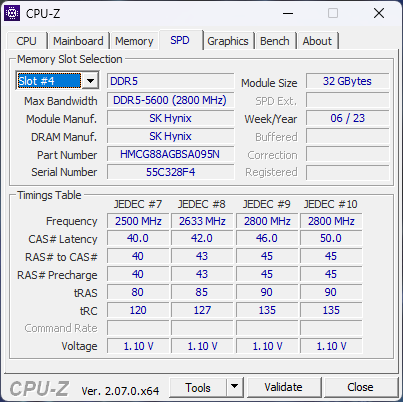
Jusqu'à 128 Go de RAM sont pris en charge, mais seulement jusqu'à 4000 MT/s.
Accessoires et garantie
La boîte ne contient pas d'autres éléments que l'adaptateur secteur et la documentation. HP offre une garantie limitée de trois ans en standard.
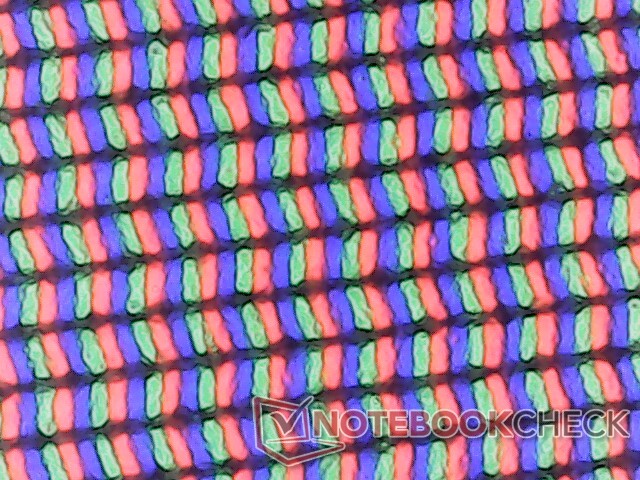
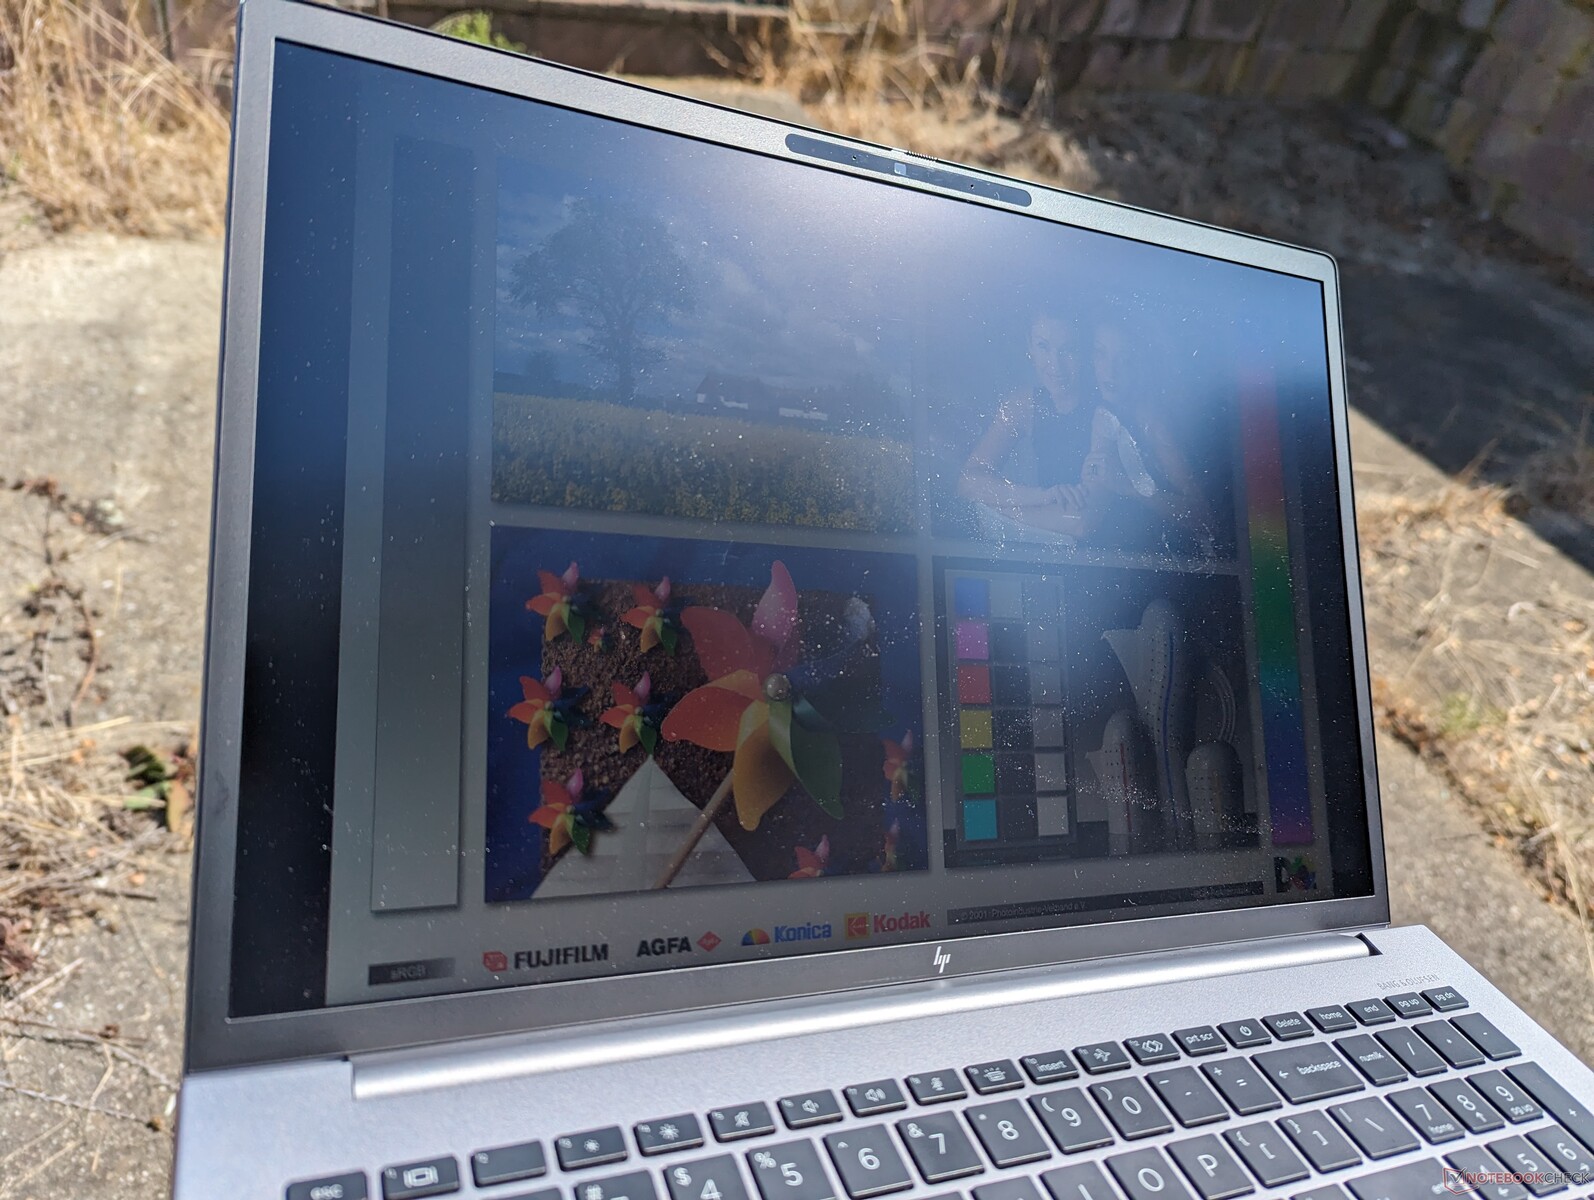
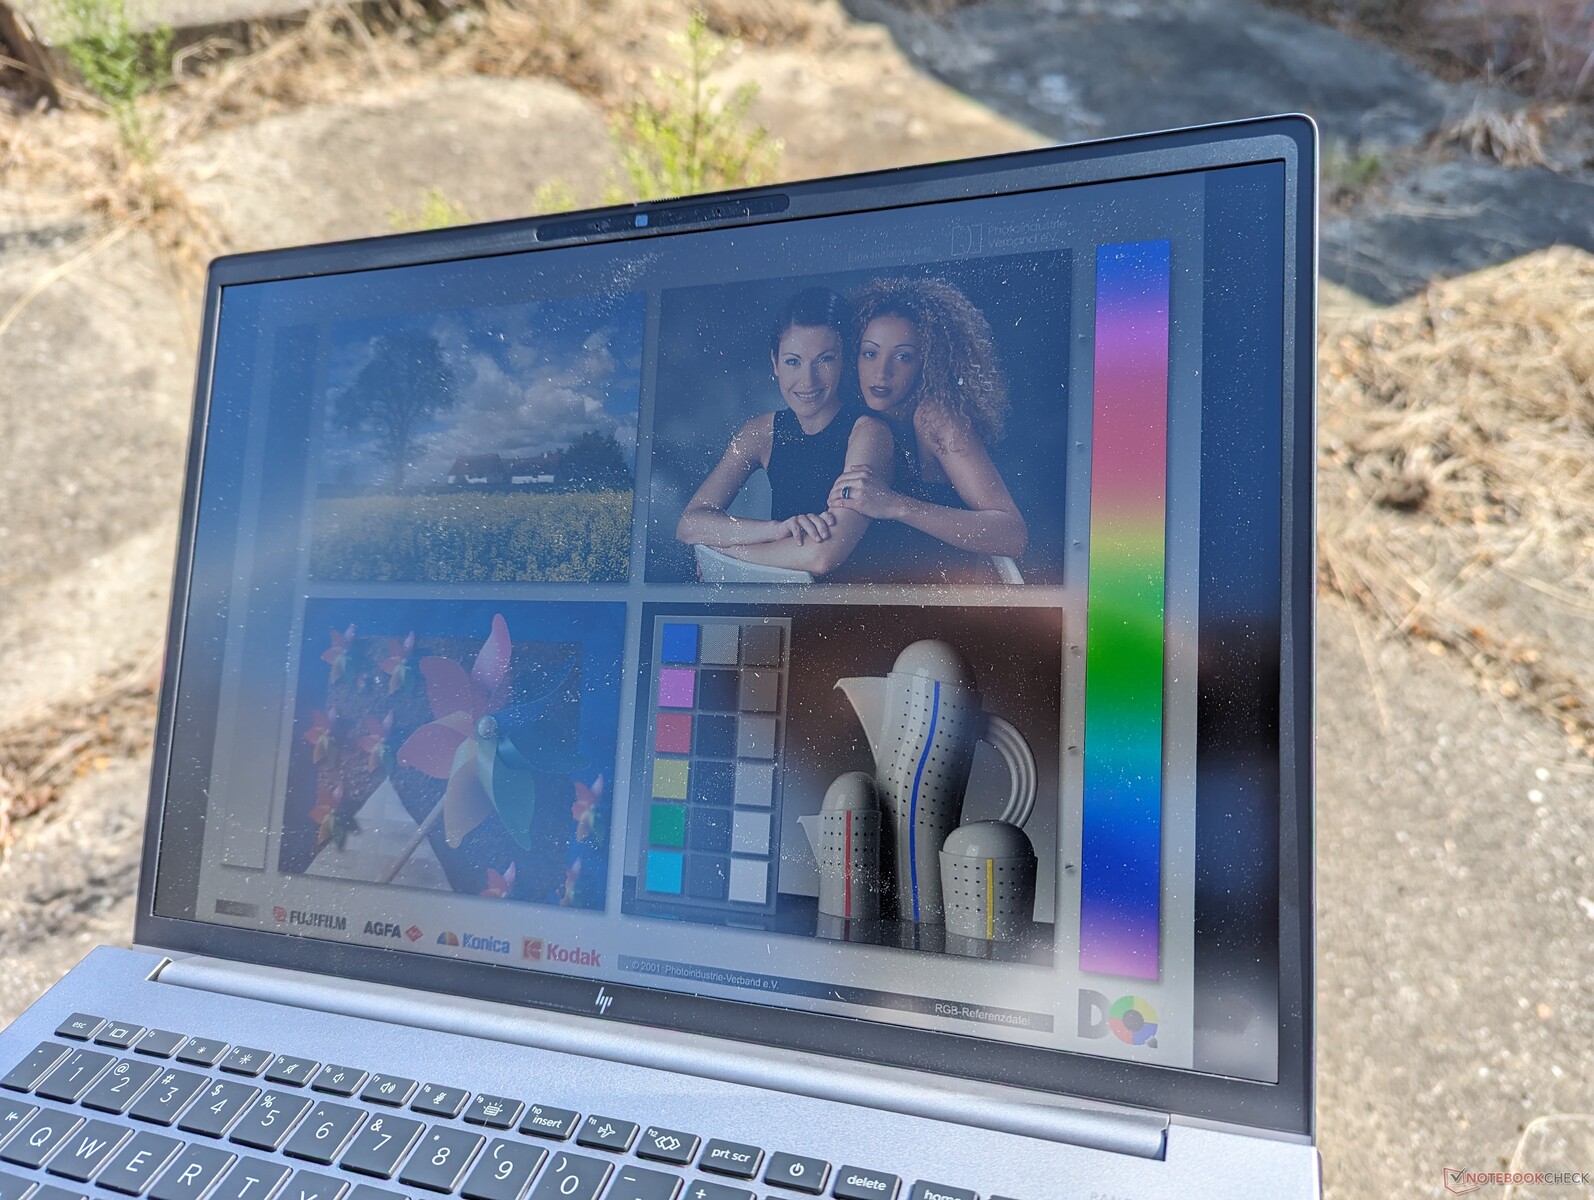
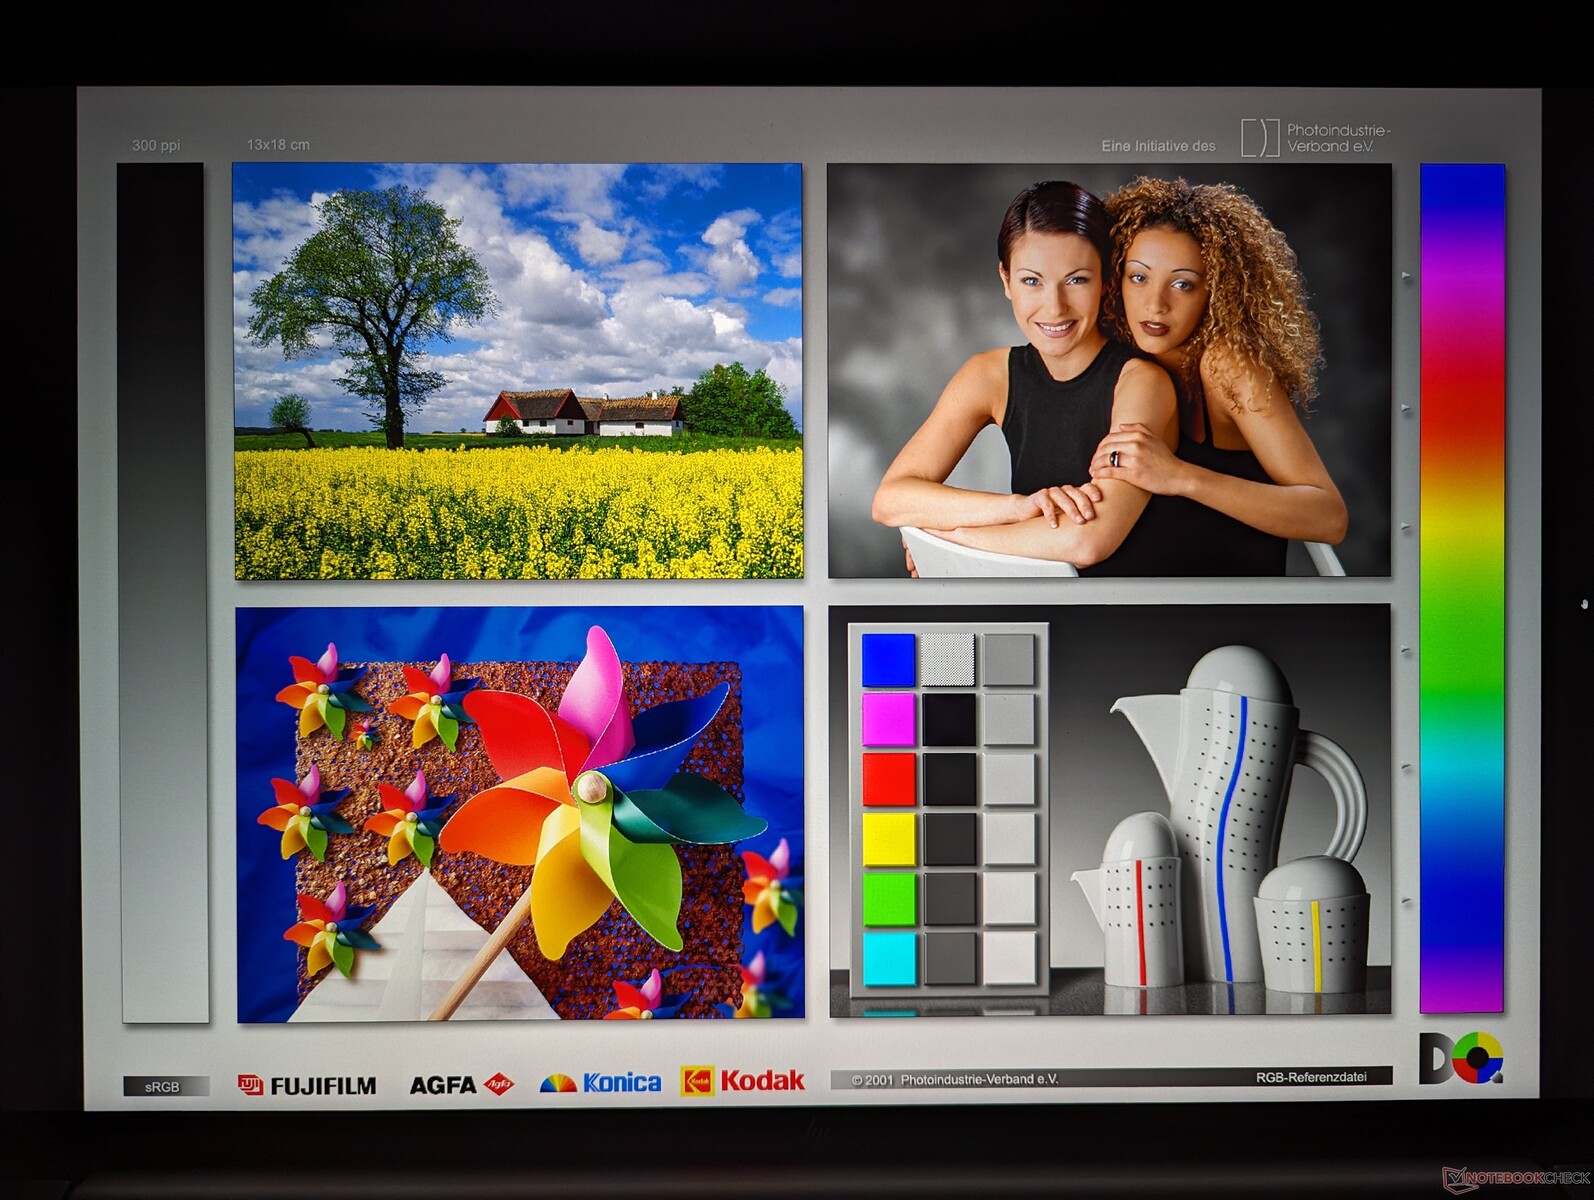
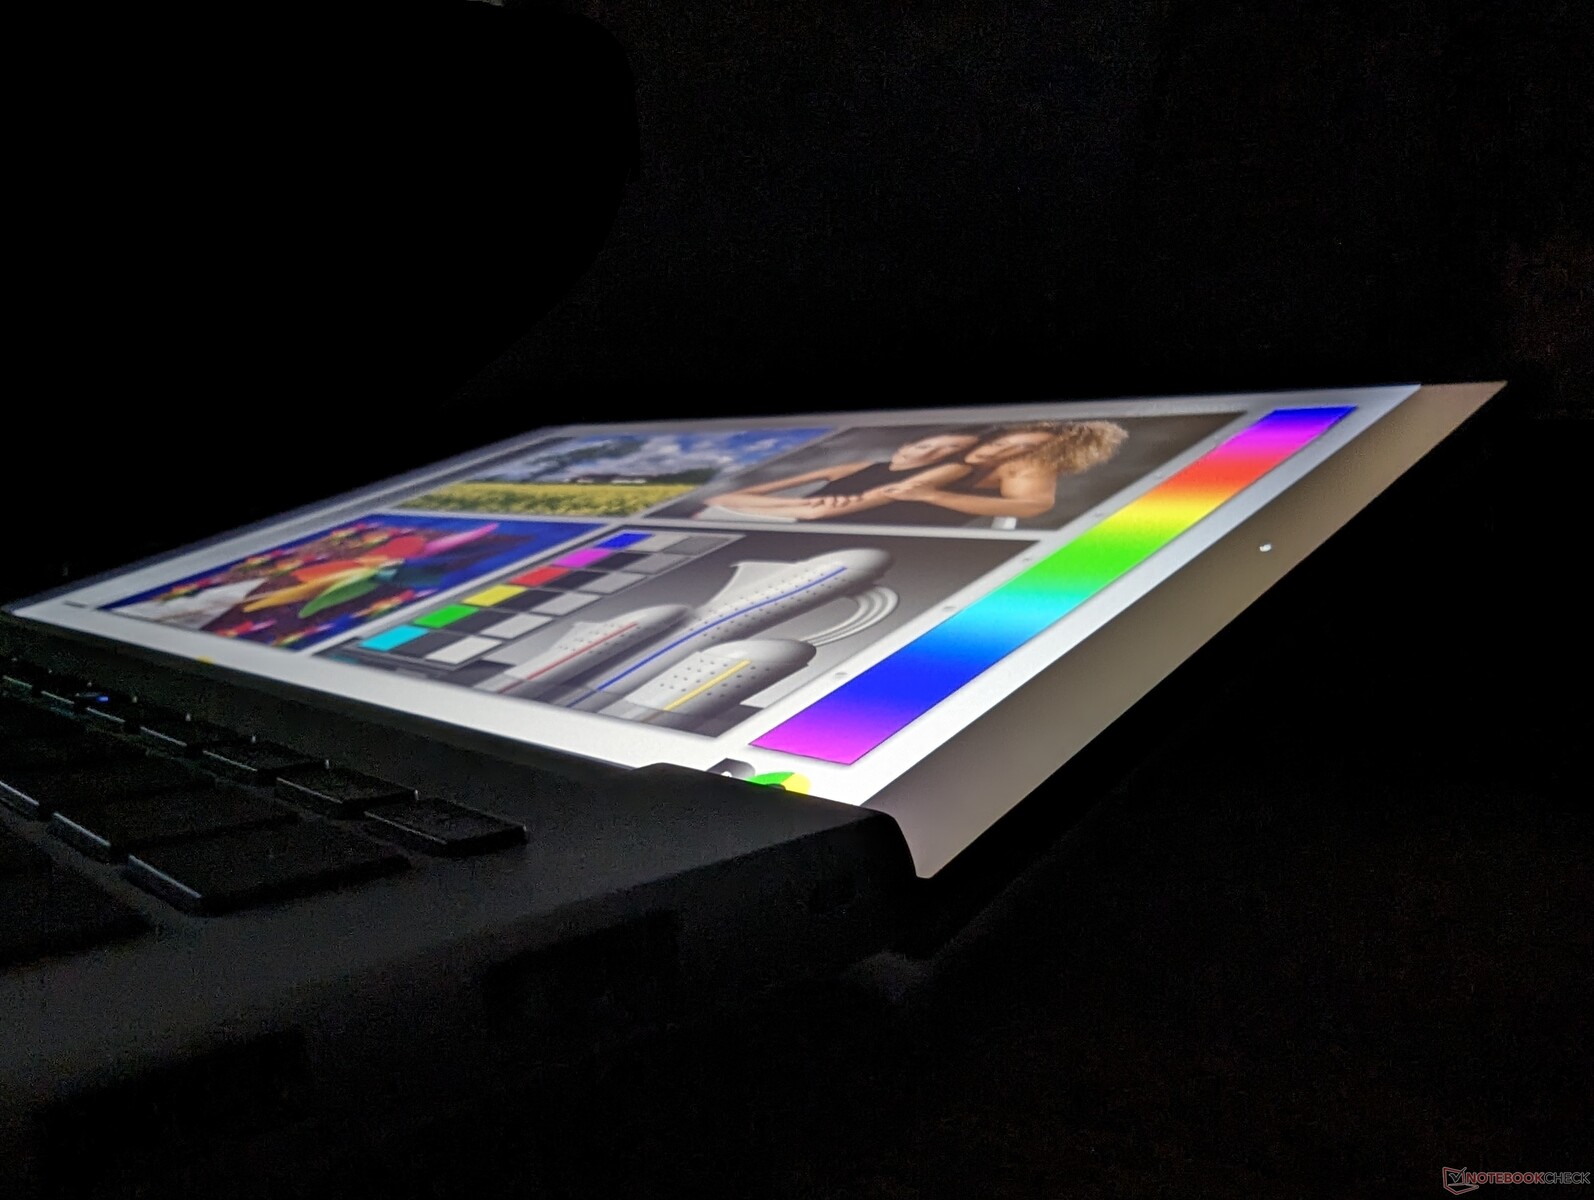
Affichage
Les trois options d'affichage eDP+PSR (Panel Self Refresh) suivantes sont disponibles pour le Fury 16 G10 de 16 pouces. Notre modèle d'évaluation a été configuré avec l'option en gras :
- 3840 x 2400, 60 Hz, OLED, écran tactile, 400 nits, 100 % DCI-P3, brillant
- 3840 x 2400, 120 Hz, IPS, non tactile, 500 nits, 100 % DCI-P3, mat
- 1920 x 1200, 60 Hz, IPS, non tactile, 1000 nits, 100% sRGB, mat
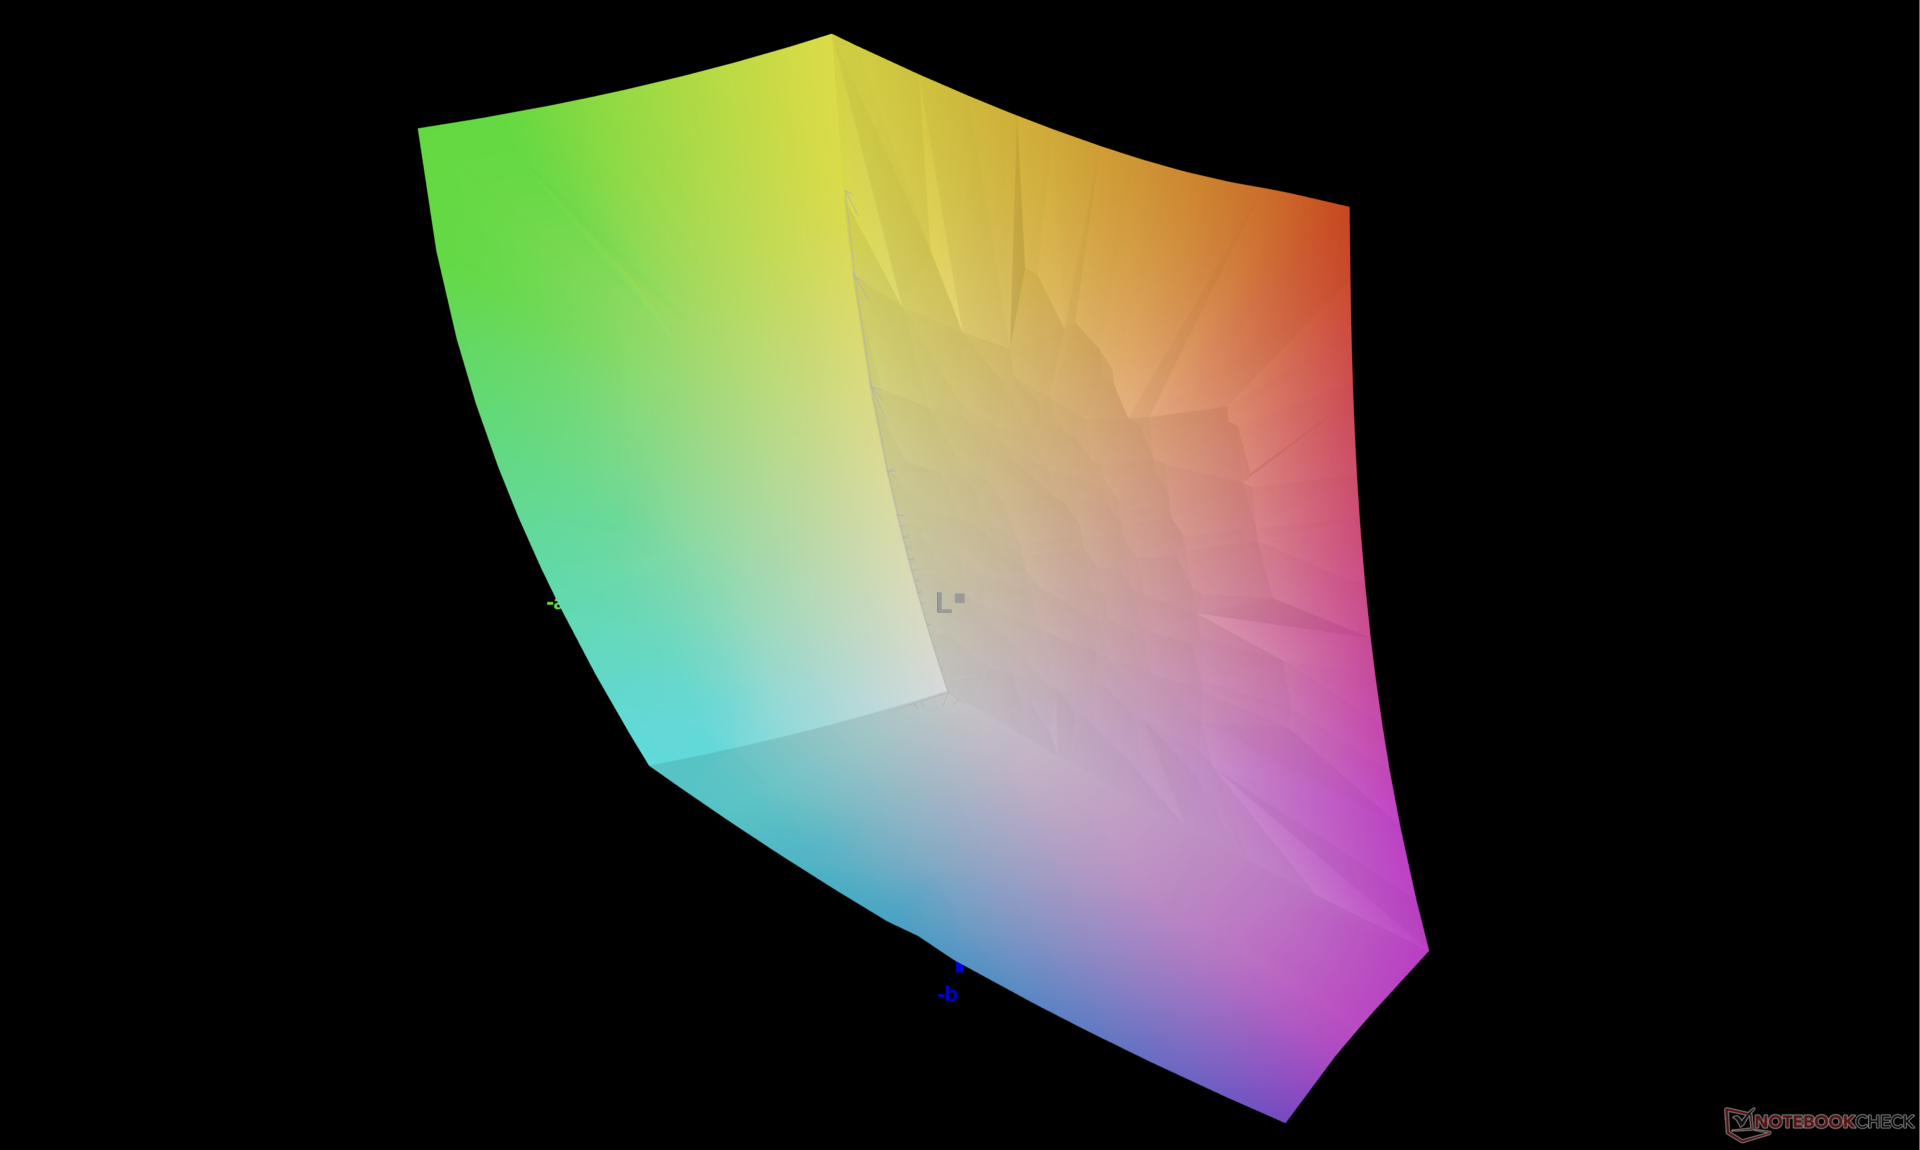
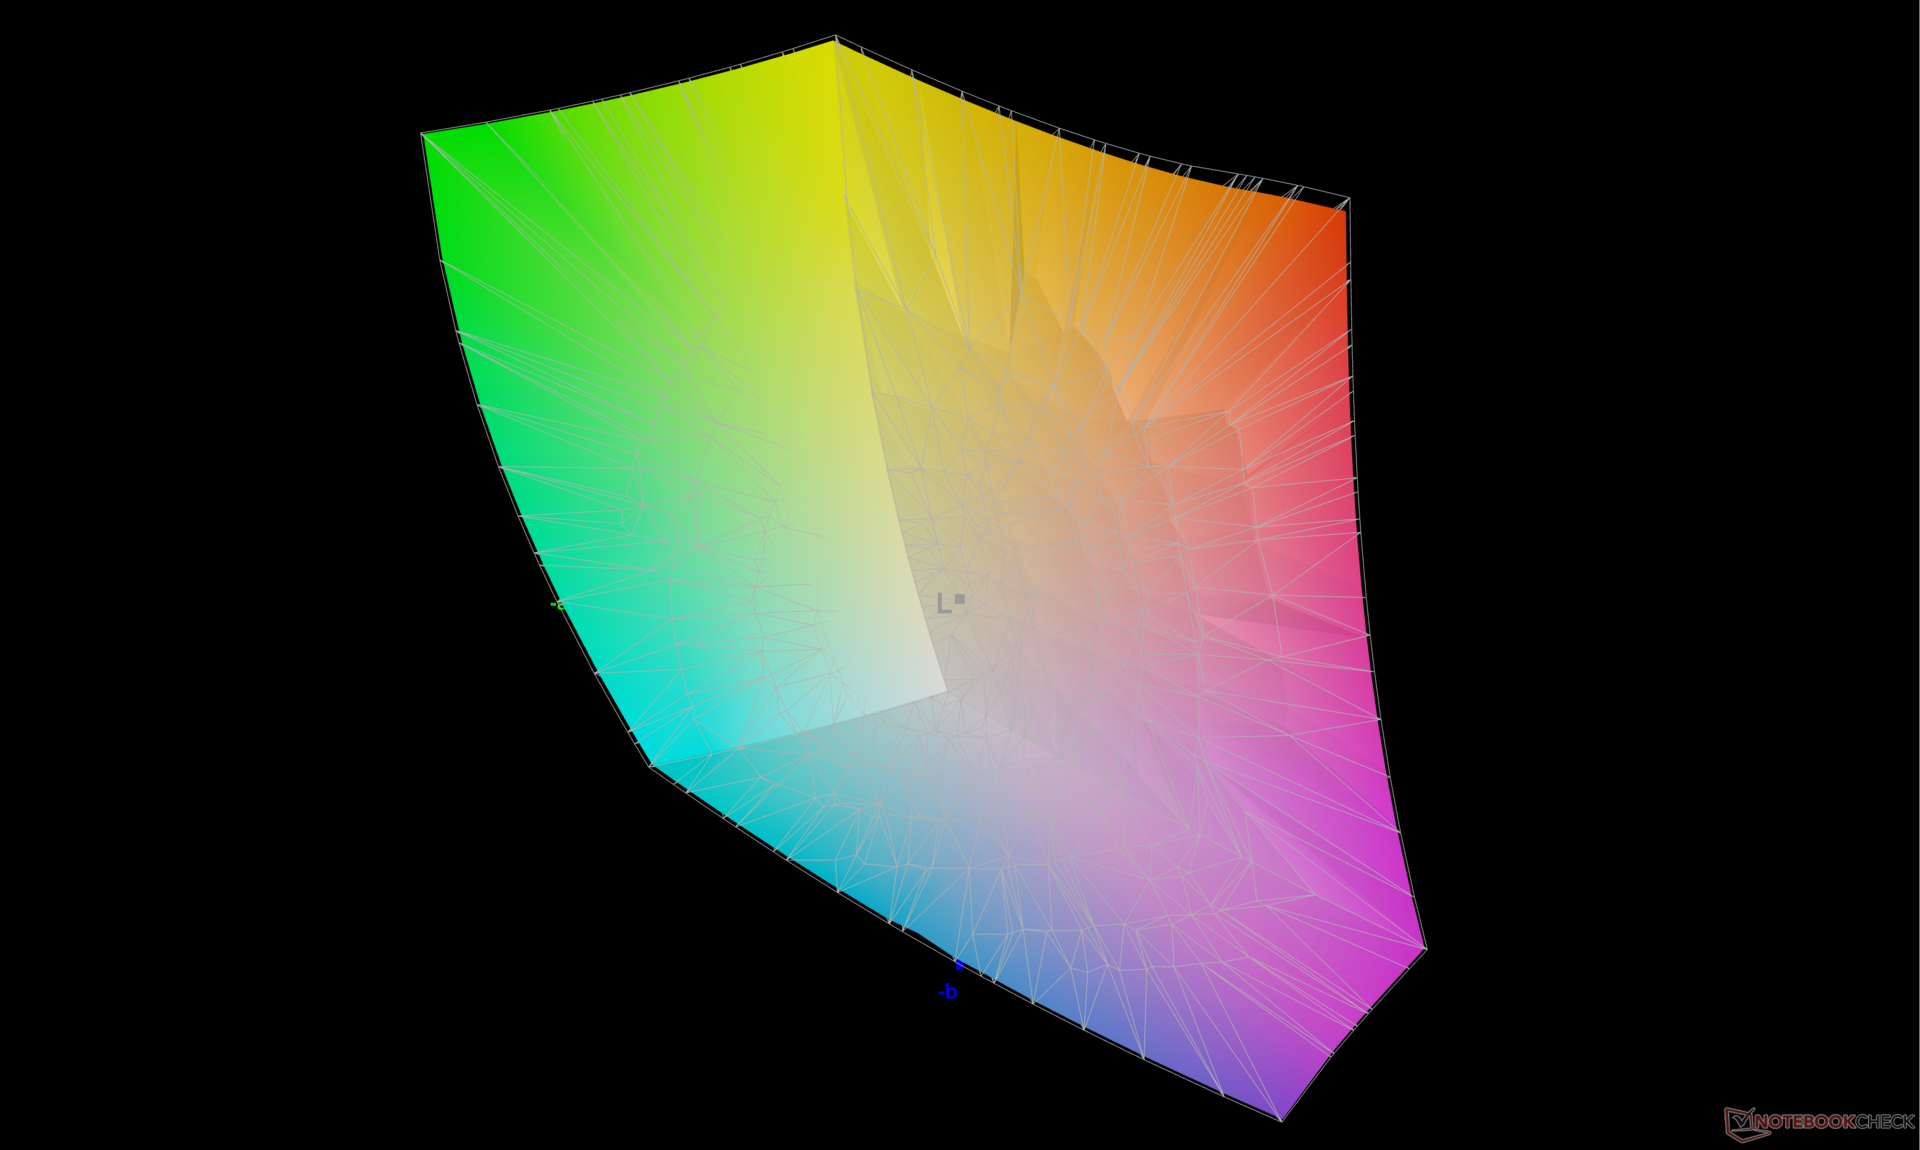
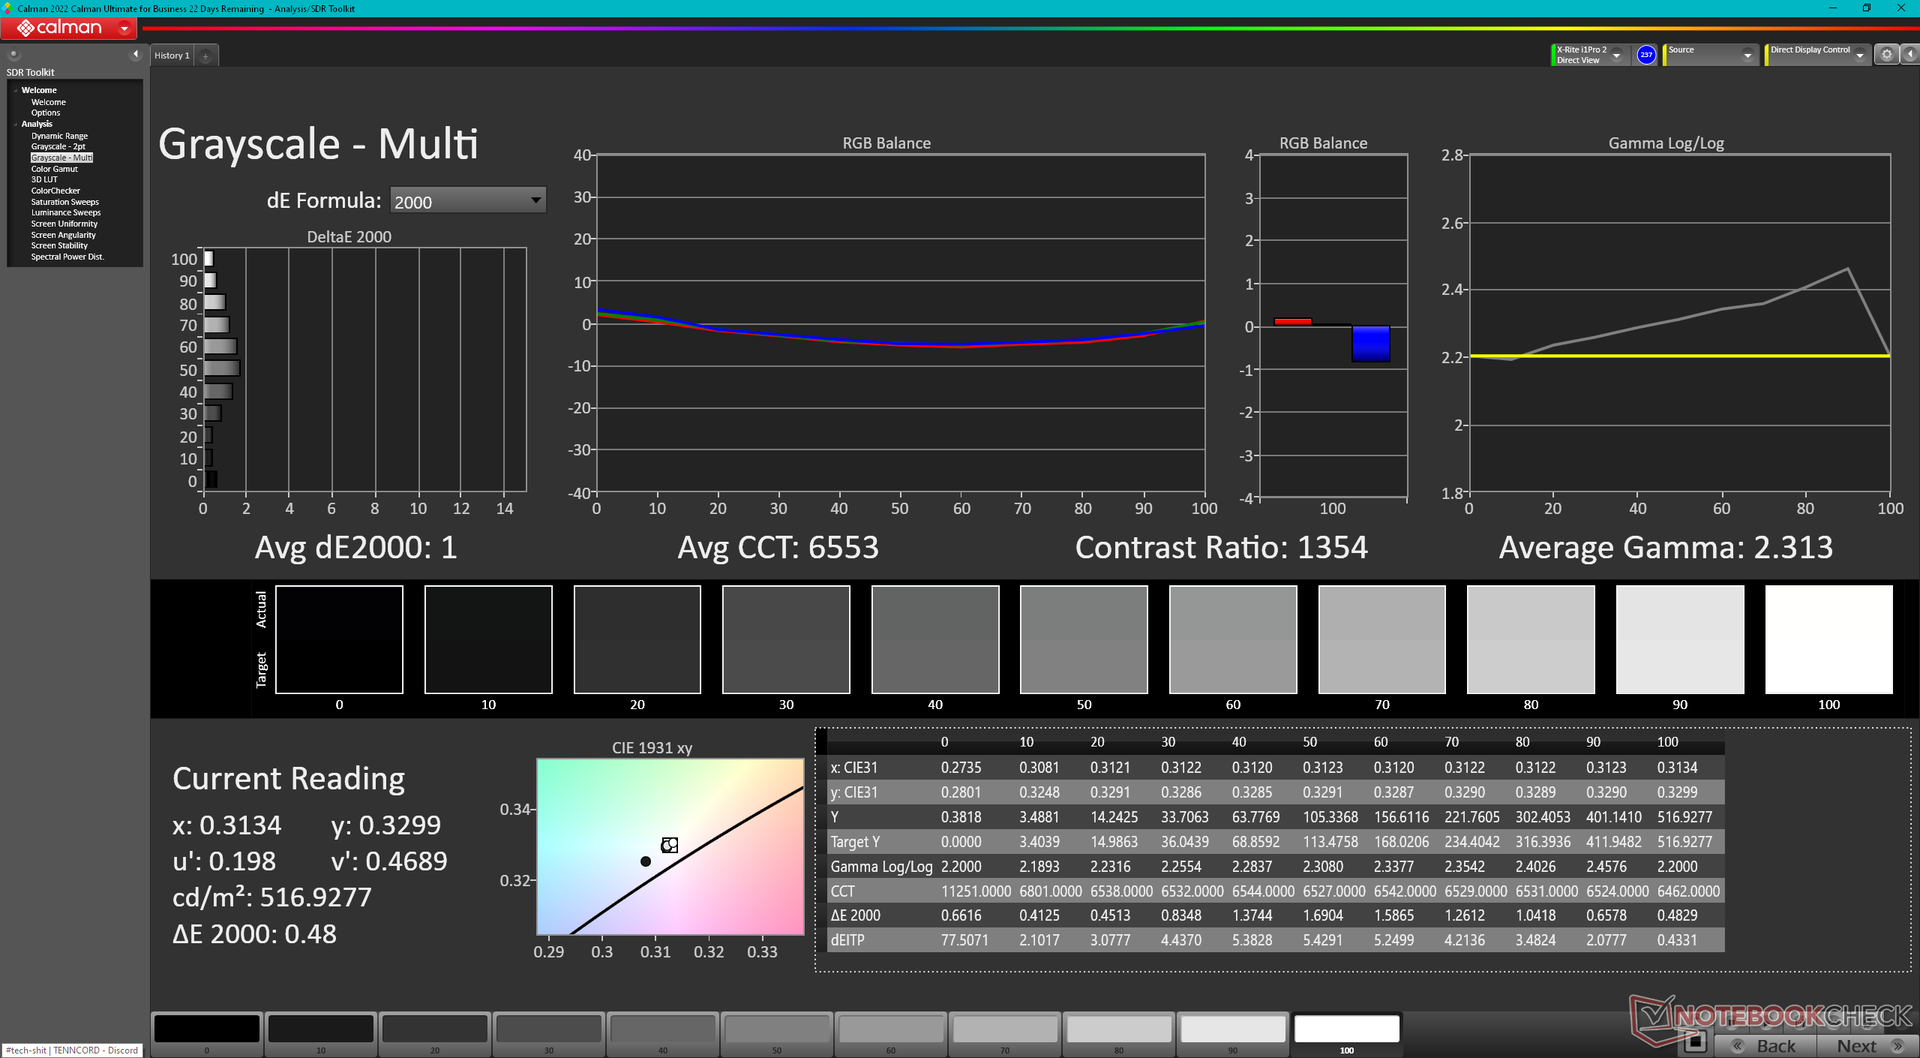
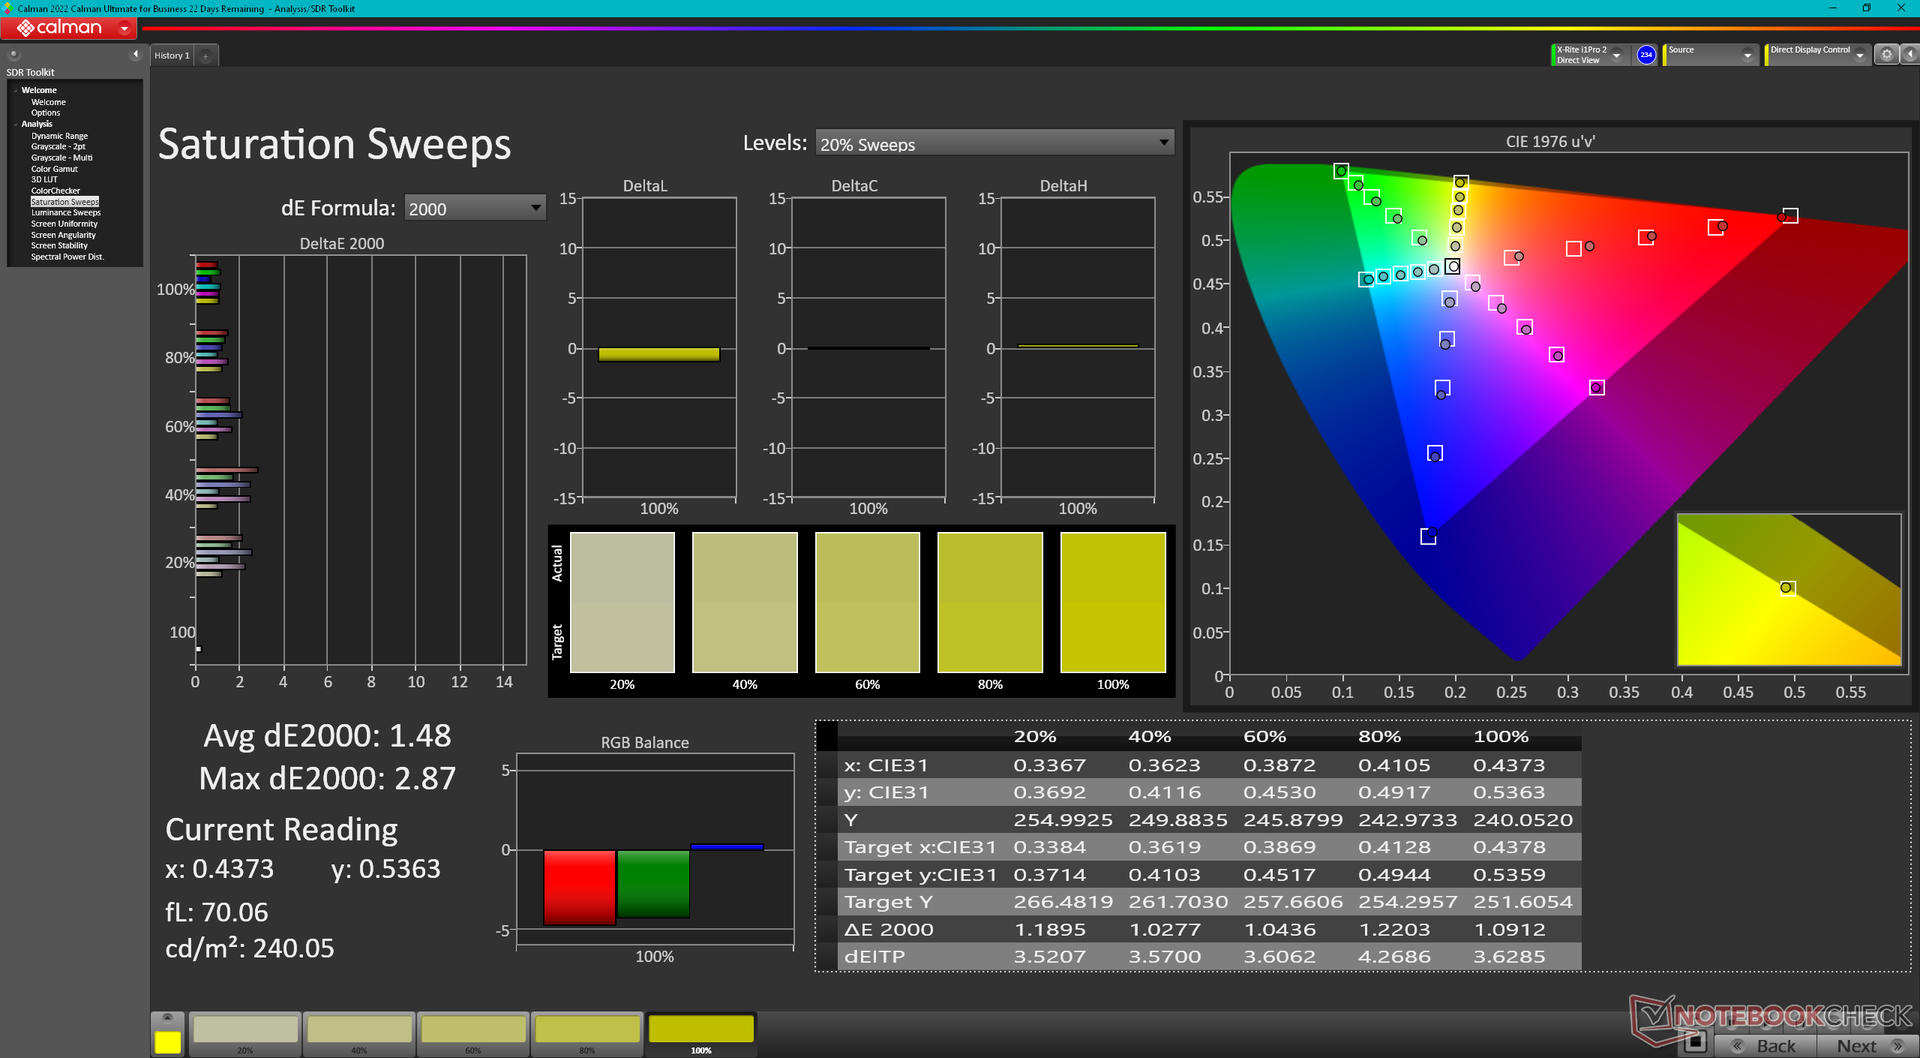
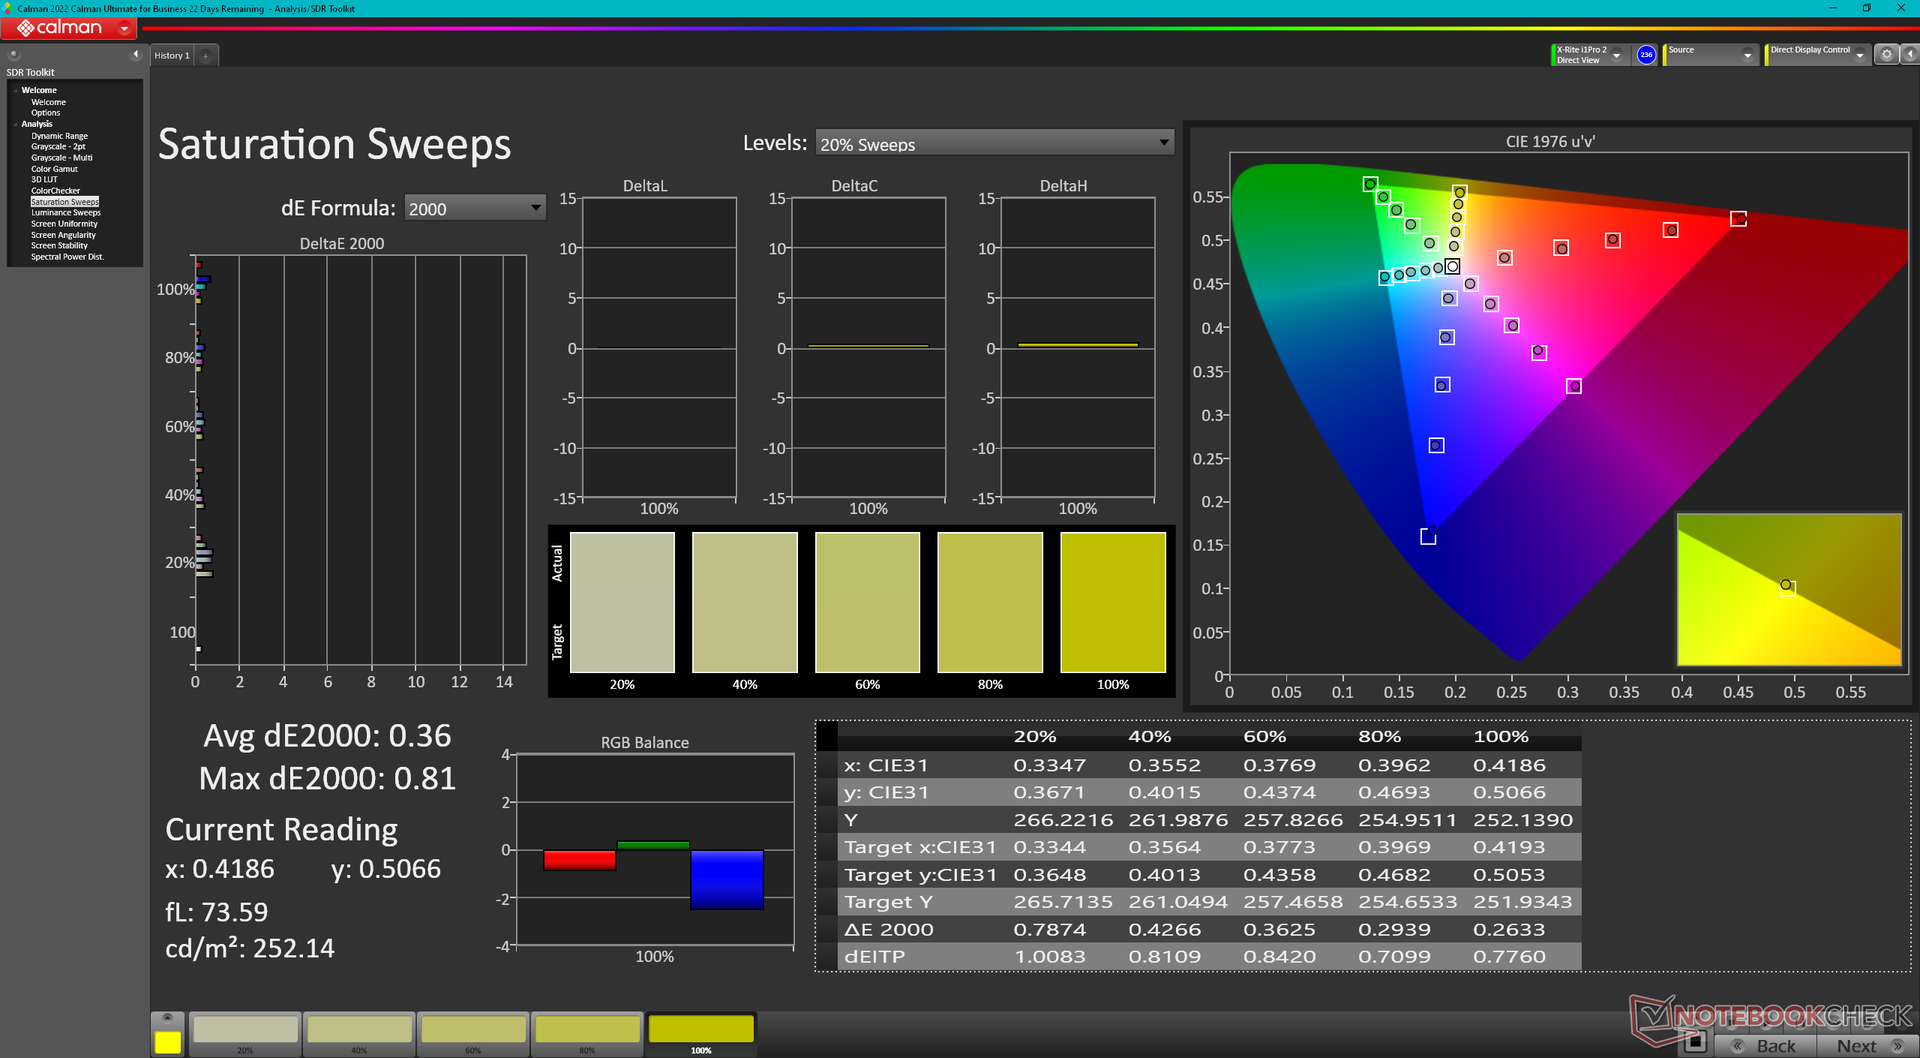
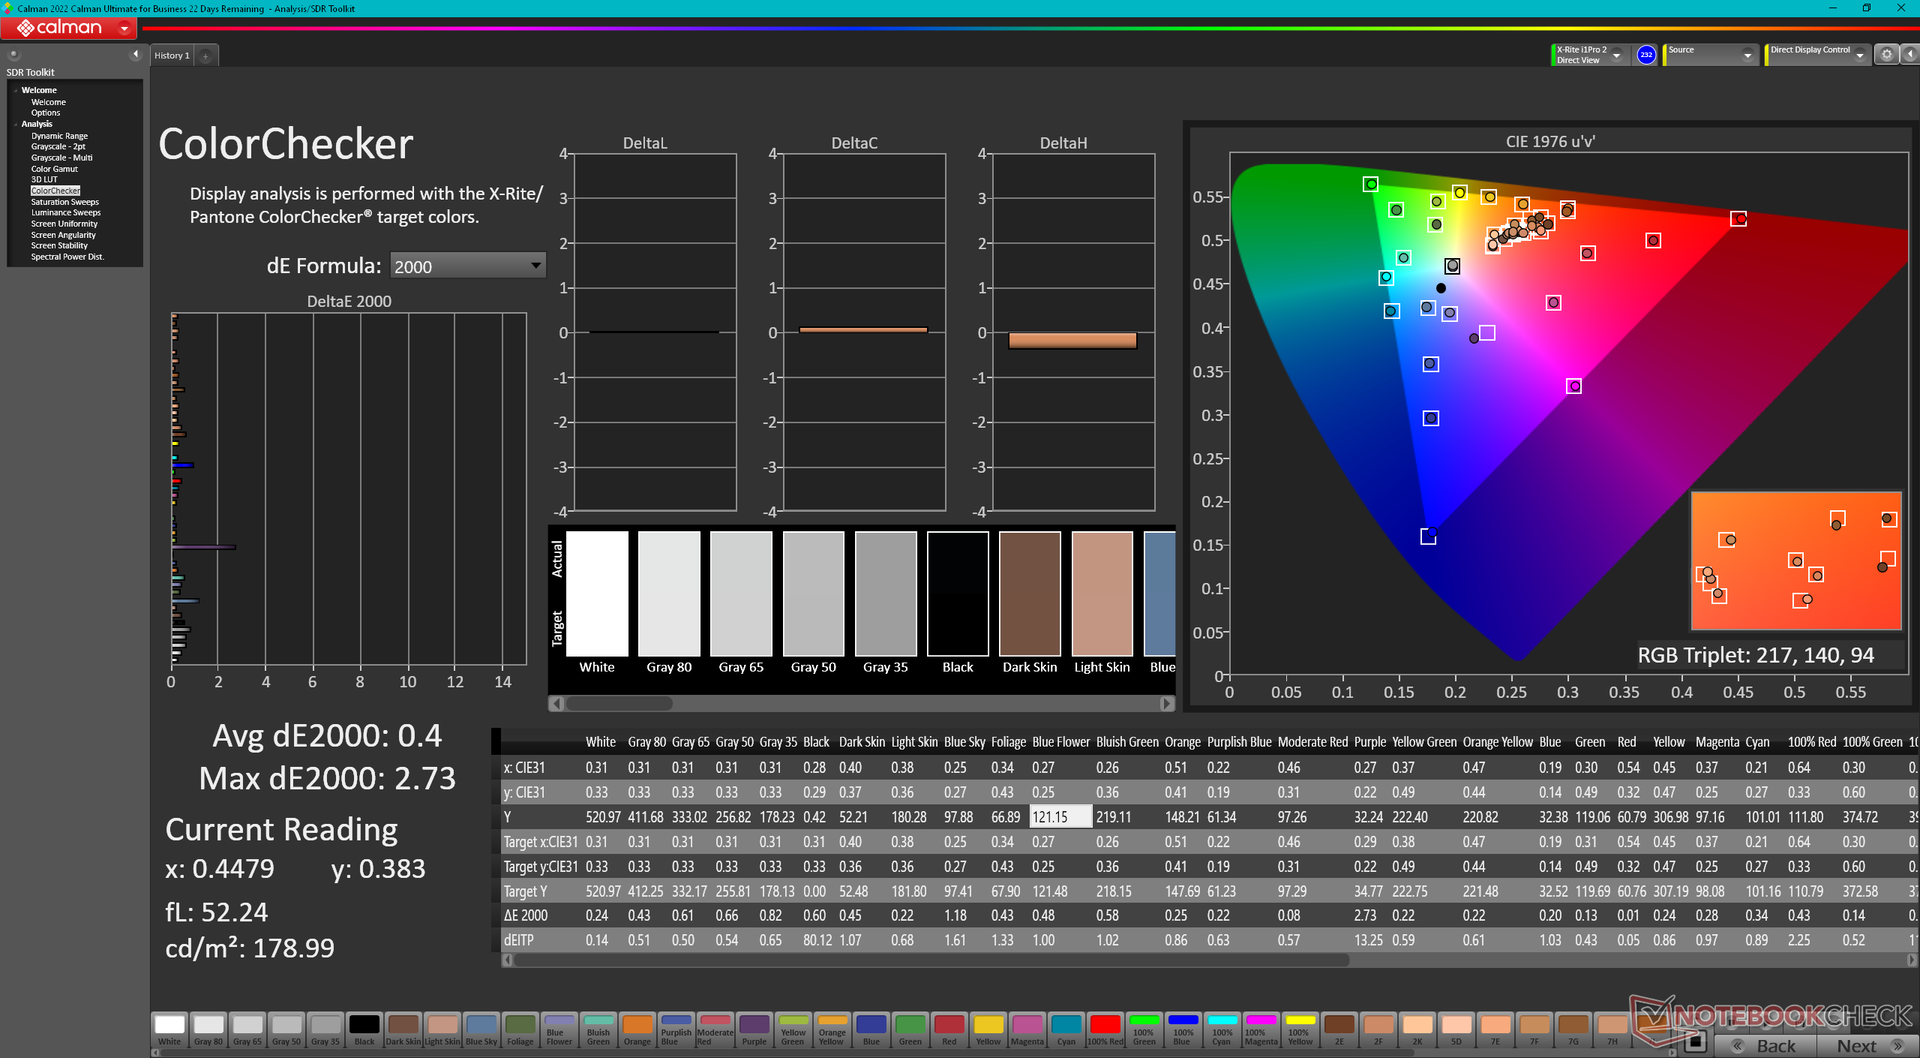
Nos mesures indépendantes avec un colorimètre X-Rite confirment à la fois la couverture P3 complète et la luminosité maximale de 500 nits, comme annoncé. Le taux de rafraîchissement de 120 Hz est également une amélioration notable par rapport au panneau de 60 Hz du Fury 16 G9 de l'année dernière. C'est l'une des rares stations de travail du marché à proposer une dalle IPS 4K avec des couleurs P3 et un taux de rafraîchissement rapide de 120 Hz.

| |||||||||||||||||||||||||
Homogénéité de la luminosité: 90 %
Valeur mesurée au centre, sur batterie: 514.6 cd/m²
Contraste: 1119:1 (Valeurs des noirs: 0.46 cd/m²)
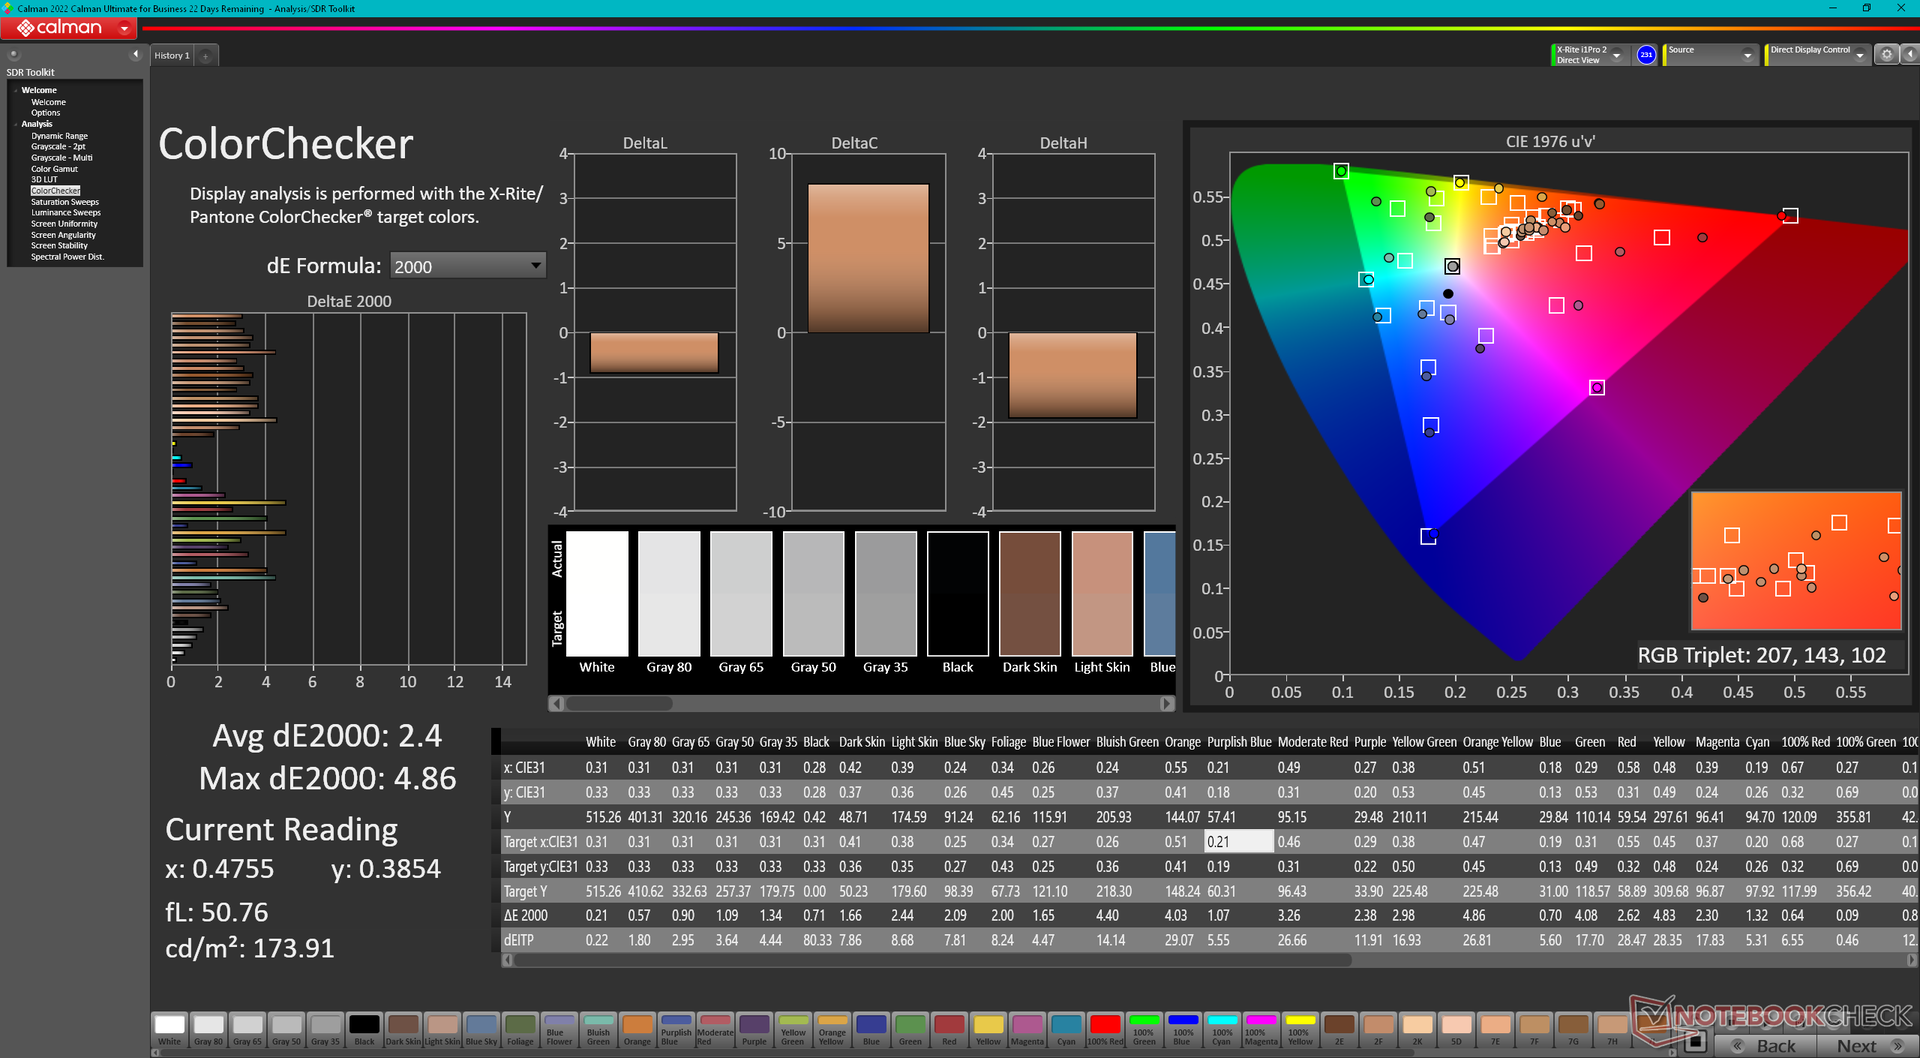
ΔE ColorChecker Calman: 2.4 | ∀{0.5-29.43 Ø4.71}
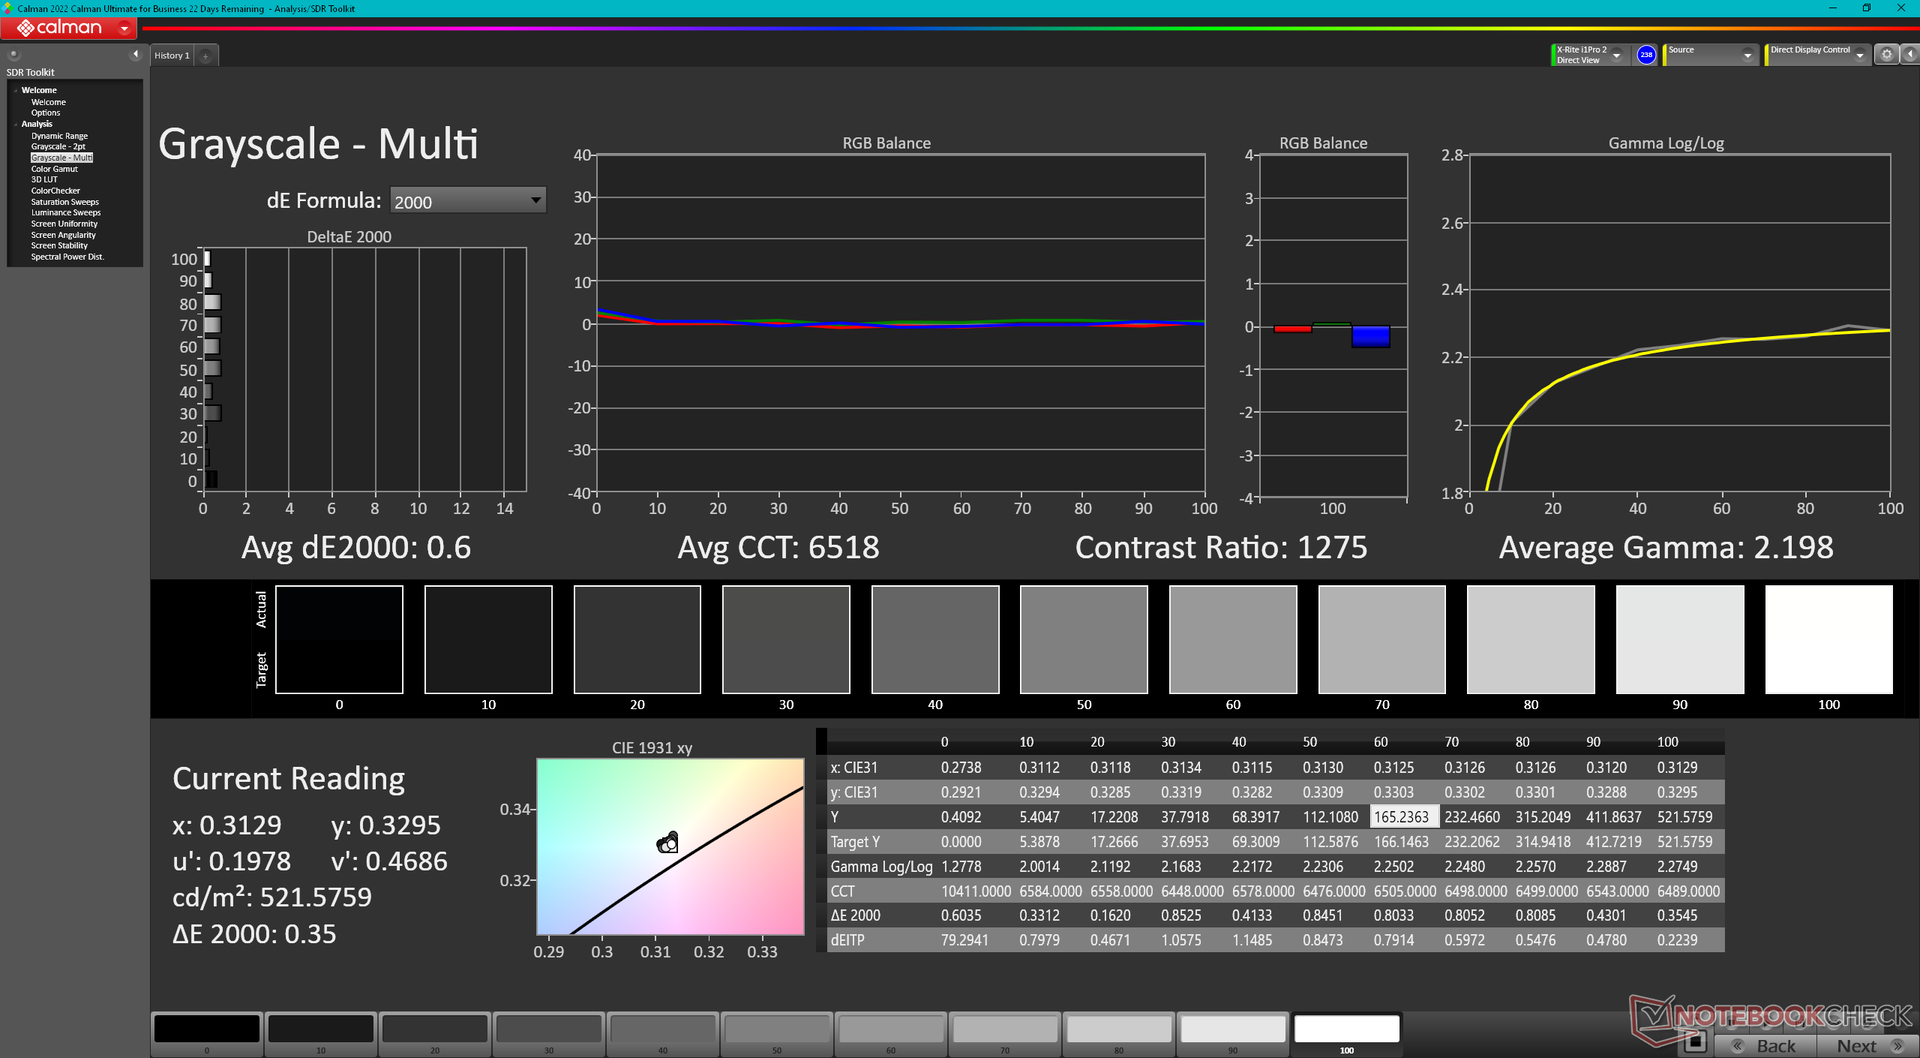
calibrated: 0.4
ΔE Greyscale Calman: 1 | ∀{0.09-98 Ø4.96}
86.2% AdobeRGB 1998 (Argyll 3D)
99.9% sRGB (Argyll 3D)
98% Display P3 (Argyll 3D)
Gamma: 2.3
CCT: 6553 K
| HP ZBook Fury 16 G10 AUO87A8, IPS, 3840x2400, 16" | HP ZBook Fury 16 G9 BOE0A52, IPS, 3840x2400, 16" | Dell Precision 5000 5680 Samsung 160YV03, OLED, 3840x2400, 16" | Lenovo ThinkPad P16 G1 RTX A5500 LP160UQ1-SPB1, IPS, 3840x2400, 16" | MSI CreatorPro Z16P B12UKST B160QAN02.N, IPS, 2560x1600, 16" | Asus ProArt StudioBook 16 W7600H5A-2BL2 ATNA60YV02-0, OLED, 3840x2400, 16" | |
|---|---|---|---|---|---|---|
| Display | -0% | 5% | -2% | 0% | 5% | |
| Display P3 Coverage (%) | 98 | 97.4 -1% | 99.9 2% | 82.9 -15% | 97.6 0% | 99.9 2% |
| sRGB Coverage (%) | 99.9 | 99.9 0% | 100 0% | 98.9 -1% | 99.9 0% | 100 0% |
| AdobeRGB 1998 Coverage (%) | 86.2 | 86.3 0% | 97.5 13% | 95.9 11% | 87.4 1% | 98.6 14% |
| Response Times | -3% | 84% | -283% | 8% | 81% | |
| Response Time Grey 50% / Grey 80% * (ms) | 11.9 ? | 13.7 ? -15% | 1.68 ? 86% | 45.6 ? -283% | 12.8 ? -8% | 2 ? 83% |
| Response Time Black / White * (ms) | 9.6 ? | 8.6 ? 10% | 1.77 ? 82% | 36.8 ? -283% | 7.4 ? 23% | 2 ? 79% |
| PWM Frequency (Hz) | 60 ? | 240 ? | ||||
| Screen | -141% | -72% | -16% | -12% | -102% | |
| Brightness middle (cd/m²) | 514.6 | 530.5 3% | 345.7 -33% | 601.9 17% | 407 -21% | 353 -31% |
| Brightness (cd/m²) | 495 | 476 -4% | 349 -29% | 569 15% | 388 -22% | 360 -27% |
| Brightness Distribution (%) | 90 | 83 -8% | 98 9% | 77 -14% | 88 -2% | 96 7% |
| Black Level * (cd/m²) | 0.46 | 0.57 -24% | 0.47 -2% | 0.36 22% | ||
| Contrast (:1) | 1119 | 931 -17% | 1281 14% | 1131 1% | ||
| Colorchecker dE 2000 * | 2.4 | 2.26 6% | 3.59 -50% | 2.45 -2% | 1.3 46% | 2.45 -2% |
| Colorchecker dE 2000 max. * | 4.86 | 7.02 -44% | 4.46 8% | 2.5 49% | 3.75 23% | |
| Colorchecker dE 2000 calibrated * | 0.4 | 4.73 -1083% | 0.99 -147% | 0.7 -75% | 2.77 -593% | |
| Greyscale dE 2000 * | 1 | 1 -0% | 3.1 -210% | 2.6 -160% | 2.1 -110% | 1.88 -88% |
| Gamma | 2.3 96% | 2.28 96% | 2.13 103% | 2.3 96% | 2.26 97% | 2.31 95% |
| CCT | 6553 99% | 6543 99% | 6448 101% | 6805 96% | 6437 101% | 6441 101% |
| Moyenne finale (programmes/paramètres) | -48% /
-87% | 6% /
-27% | -100% /
-53% | -1% /
-7% | -5% /
-44% |
* ... Moindre est la valeur, meilleures sont les performances
L'écran est bien calibré par rapport à la norme P3 et un calibrage par l'utilisateur final n'est donc pas nécessaire.
Temps de réponse de l'écran
| ↔ Temps de réponse noir à blanc | ||
|---|---|---|
| 9.6 ms ... hausse ↗ et chute ↘ combinées | ↗ 5.1 ms hausse | 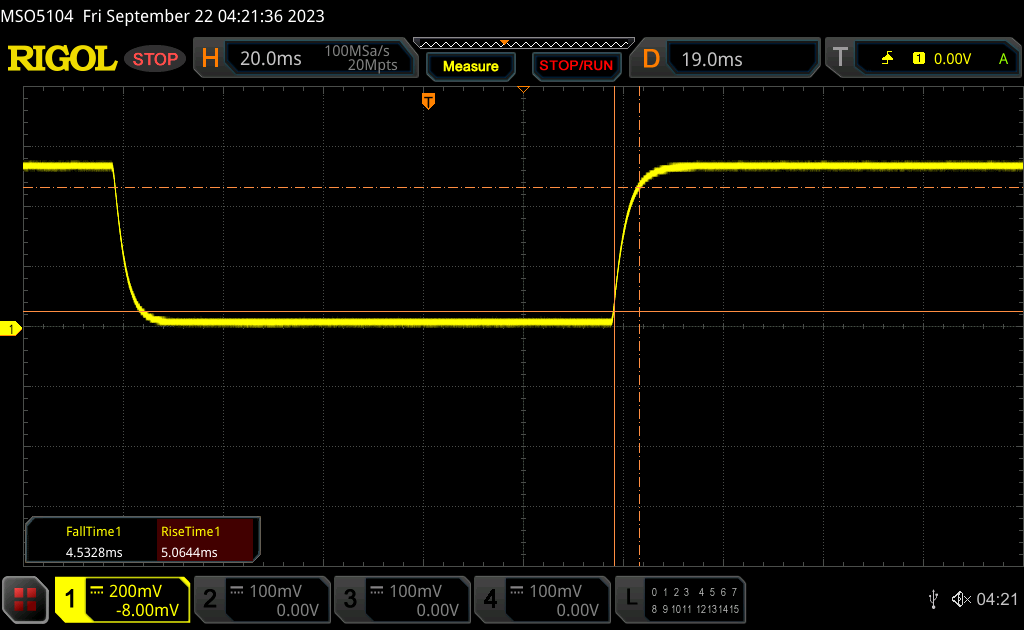 |
| ↘ 4.5 ms chute | ||
| L'écran montre de faibles temps de réponse, un bon écran pour jouer. En comparaison, tous les appareils testés affichent entre 0.1 (minimum) et 240 (maximum) ms. » 26 % des appareils testés affichent de meilleures performances. Cela signifie que les latences relevées sont meilleures que la moyenne (19.8 ms) de tous les appareils testés. | ||
| ↔ Temps de réponse gris 50% à gris 80% | ||
| 11.9 ms ... hausse ↗ et chute ↘ combinées | ↗ 5.9 ms hausse | 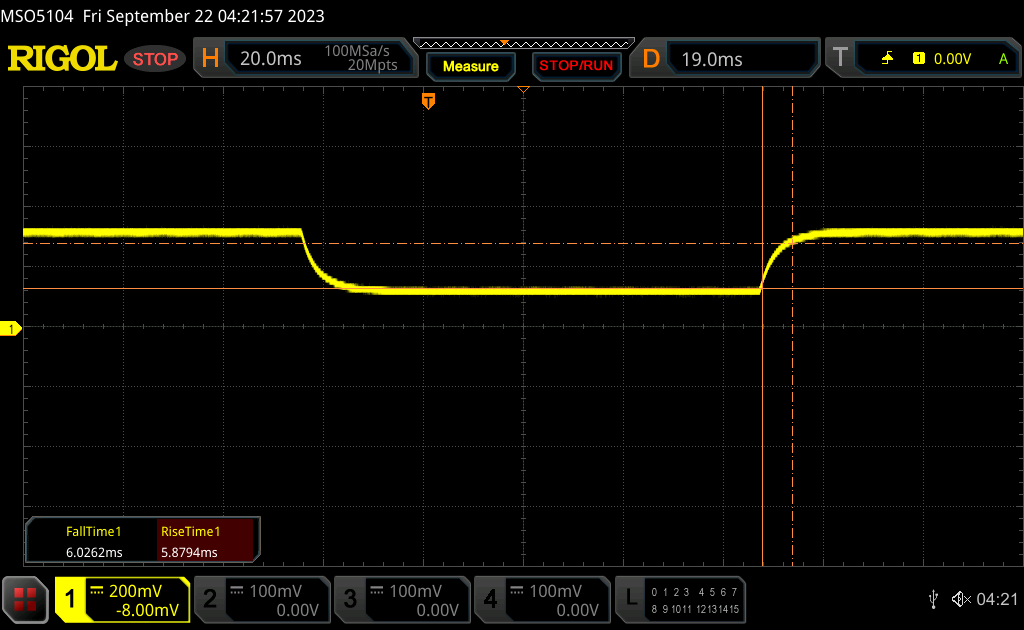 |
| ↘ 6 ms chute | ||
| L'écran montre de bons temps de réponse, mais insuffisant pour du jeu compétitif. En comparaison, tous les appareils testés affichent entre 0.165 (minimum) et 636 (maximum) ms. » 25 % des appareils testés affichent de meilleures performances. Cela signifie que les latences relevées sont meilleures que la moyenne (31 ms) de tous les appareils testés. | ||
Scintillement / MLI (Modulation de largeur d'impulsion)
| Scintillement / MLI (Modulation de largeur d'impulsion) non décelé | 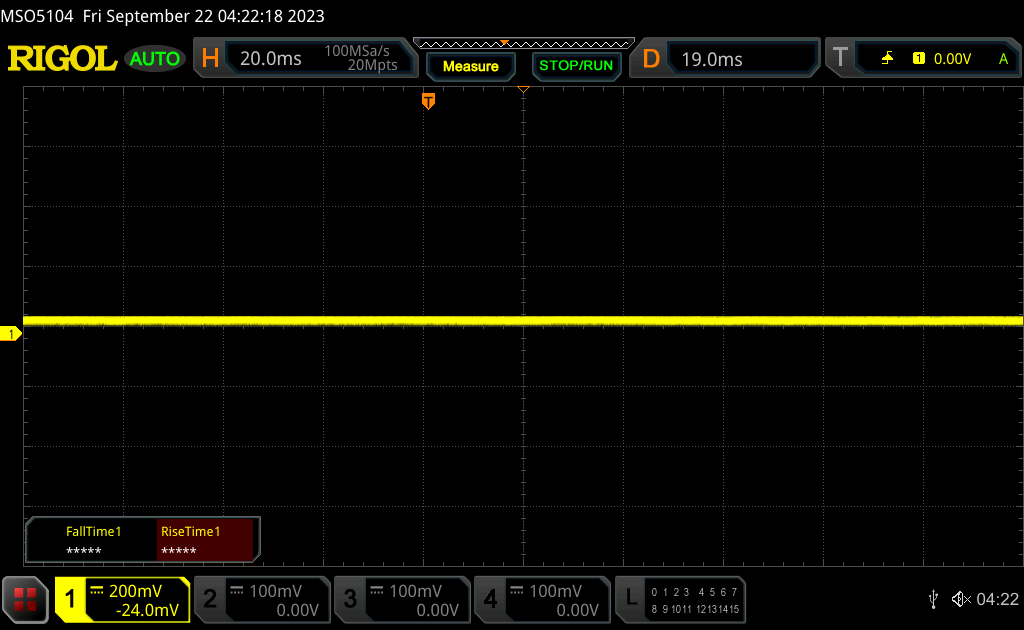 | ||
En comparaison, 52 % des appareils testés n'emploient pas MDI pour assombrir leur écran. Nous avons relevé une moyenne à 7757 (minimum : 5 - maximum : 343500) Hz dans le cas où une MDI était active. | |||


Performance
Conditions d'essai
Nous avons réglé Windows sur le mode Performance avant d'effectuer les tests ci-dessous.
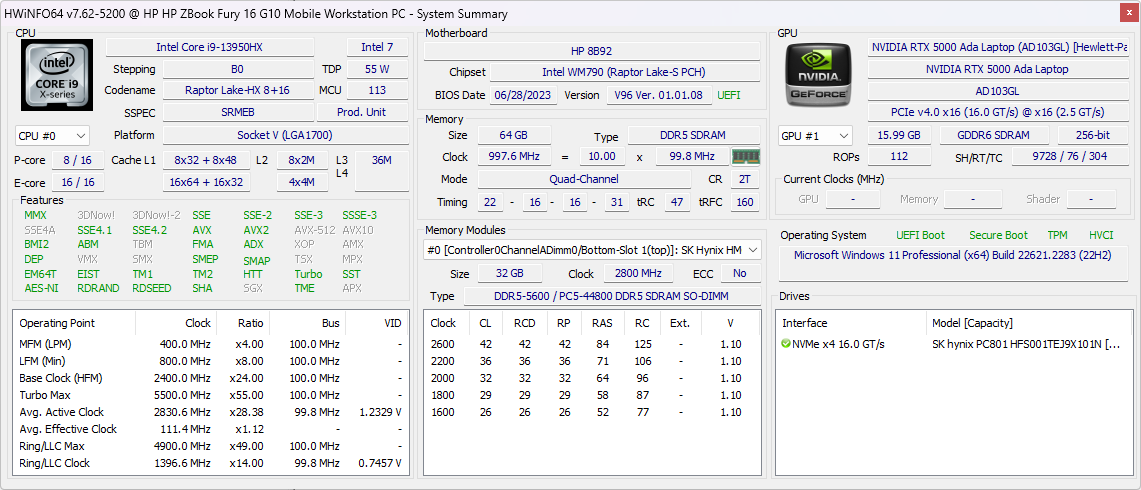
Advanced Optimus, MUX et les CPU Intel Xeon ne sont pas pris en charge. Cependant, il est intéressant de noter que le modèle prend officiellement en charge la RAM DDR5 ECC malgré l'absence d'options Xeon, une caractéristique que l'on ne retrouve pas sur la plupart des autres stations de travail mobiles.
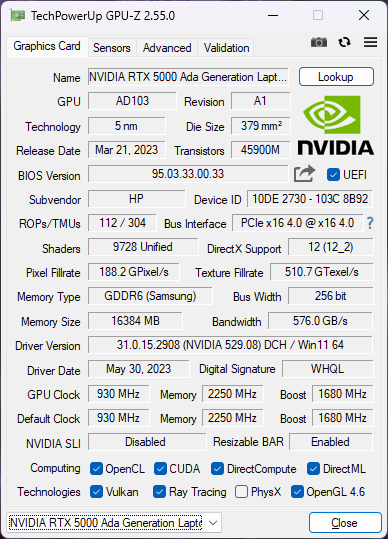
Le mode ECC VRAM peut être activé ou désactivé, comme sur les autres GPU Ada Lovelace conçus pour les stations de travail. L'activation de ce mode réduit la VRAM maximale utilisable de 16 Go à 15 Go.
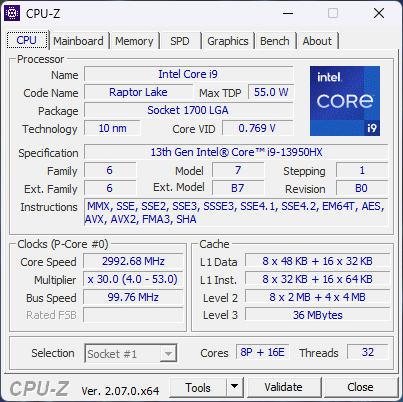
Processeur
Les performances du processeur sont mitigées. D'une part, les performances multithread sont environ 25 à 30 % plus rapides que celles des processeurs Core i9-12950HX du Fury 16 G9 de l'année dernière. D'autre part, les performances sont en moyenne 15 % plus lentes que sur d'autres ordinateurs portables équipés du mêmeCore i9-13950HX que notre HP. Le même processeur dans le plus grandRazer Blade 18 et le MSI GE78HXpar exemple, sont toujours plus rapides que notre HP. Cela ne veut pas dire que le Fury 16 G10 est lent, mais cela montre que le CPU est légèrement plus lent que prévu.
Cinebench R15 Multi Loop
Cinebench R23: Multi Core | Single Core
Cinebench R20: CPU (Multi Core) | CPU (Single Core)
Cinebench R15: CPU Multi 64Bit | CPU Single 64Bit
Blender: v2.79 BMW27 CPU
7-Zip 18.03: 7z b 4 | 7z b 4 -mmt1
Geekbench 5.5: Multi-Core | Single-Core
HWBOT x265 Benchmark v2.2: 4k Preset
LibreOffice : 20 Documents To PDF
R Benchmark 2.5: Overall mean
| CPU Performance rating | |
| Moyenne Intel Core i9-13950HX | |
| HP ZBook Fury 16 G10 | |
| Lenovo ThinkPad P16 G1 RTX A5500 | |
| Dell Precision 5000 5680 | |
| HP ZBook Fury 16 G9 | |
| Lenovo ThinkPad P16 G1 21D6001DMB | |
| HP ZBook Studio 16 G9 62U04EA | |
| MSI CreatorPro Z16P B12UKST | |
| Asus ProArt StudioBook 16 W7600H5A-2BL2 | |
| Lenovo ThinkPad P1 G4-20Y4Z9DVUS | |
| Cinebench R23 / Multi Core | |
| Moyenne Intel Core i9-13950HX (24560 - 33277, n=7) | |
| HP ZBook Fury 16 G10 | |
| Lenovo ThinkPad P16 G1 RTX A5500 | |
| HP ZBook Fury 16 G9 | |
| Dell Precision 5000 5680 | |
| Lenovo ThinkPad P16 G1 21D6001DMB | |
| MSI CreatorPro Z16P B12UKST | |
| HP ZBook Studio 16 G9 62U04EA | |
| Lenovo ThinkPad P1 G4-20Y4Z9DVUS | |
| Asus ProArt StudioBook 16 W7600H5A-2BL2 | |
| Cinebench R23 / Single Core | |
| HP ZBook Fury 16 G10 | |
| Moyenne Intel Core i9-13950HX (1952 - 2113, n=7) | |
| Dell Precision 5000 5680 | |
| HP ZBook Fury 16 G9 | |
| Lenovo ThinkPad P16 G1 RTX A5500 | |
| HP ZBook Studio 16 G9 62U04EA | |
| Lenovo ThinkPad P16 G1 21D6001DMB | |
| MSI CreatorPro Z16P B12UKST | |
| Lenovo ThinkPad P1 G4-20Y4Z9DVUS | |
| Asus ProArt StudioBook 16 W7600H5A-2BL2 | |
| Cinebench R20 / CPU (Multi Core) | |
| Moyenne Intel Core i9-13950HX (8697 - 12648, n=7) | |
| HP ZBook Fury 16 G10 | |
| Lenovo ThinkPad P16 G1 RTX A5500 | |
| HP ZBook Fury 16 G9 | |
| Dell Precision 5000 5680 | |
| Lenovo ThinkPad P16 G1 21D6001DMB | |
| MSI CreatorPro Z16P B12UKST | |
| HP ZBook Studio 16 G9 62U04EA | |
| Lenovo ThinkPad P1 G4-20Y4Z9DVUS | |
| Asus ProArt StudioBook 16 W7600H5A-2BL2 | |
| Cinebench R20 / CPU (Single Core) | |
| HP ZBook Fury 16 G10 | |
| Moyenne Intel Core i9-13950HX (742 - 816, n=7) | |
| Dell Precision 5000 5680 | |
| HP ZBook Fury 16 G9 | |
| Lenovo ThinkPad P16 G1 RTX A5500 | |
| HP ZBook Studio 16 G9 62U04EA | |
| Lenovo ThinkPad P16 G1 21D6001DMB | |
| MSI CreatorPro Z16P B12UKST | |
| Lenovo ThinkPad P1 G4-20Y4Z9DVUS | |
| Asus ProArt StudioBook 16 W7600H5A-2BL2 | |
| Cinebench R15 / CPU Multi 64Bit | |
| Moyenne Intel Core i9-13950HX (3625 - 5227, n=7) | |
| HP ZBook Fury 16 G10 | |
| Lenovo ThinkPad P16 G1 RTX A5500 | |
| Lenovo ThinkPad P16 G1 21D6001DMB | |
| HP ZBook Studio 16 G9 62U04EA | |
| HP ZBook Fury 16 G9 | |
| Dell Precision 5000 5680 | |
| MSI CreatorPro Z16P B12UKST | |
| Lenovo ThinkPad P1 G4-20Y4Z9DVUS | |
| Asus ProArt StudioBook 16 W7600H5A-2BL2 | |
| Cinebench R15 / CPU Single 64Bit | |
| HP ZBook Fury 16 G10 | |
| Moyenne Intel Core i9-13950HX (274 - 303, n=7) | |
| Dell Precision 5000 5680 | |
| Lenovo ThinkPad P16 G1 RTX A5500 | |
| HP ZBook Studio 16 G9 62U04EA | |
| Lenovo ThinkPad P16 G1 21D6001DMB | |
| MSI CreatorPro Z16P B12UKST | |
| Lenovo ThinkPad P1 G4-20Y4Z9DVUS | |
| Asus ProArt StudioBook 16 W7600H5A-2BL2 | |
| HP ZBook Fury 16 G9 | |
| Blender / v2.79 BMW27 CPU | |
| Asus ProArt StudioBook 16 W7600H5A-2BL2 | |
| Lenovo ThinkPad P1 G4-20Y4Z9DVUS | |
| MSI CreatorPro Z16P B12UKST | |
| Dell Precision 5000 5680 | |
| HP ZBook Studio 16 G9 62U04EA | |
| Lenovo ThinkPad P16 G1 21D6001DMB | |
| HP ZBook Fury 16 G9 | |
| Lenovo ThinkPad P16 G1 RTX A5500 | |
| HP ZBook Fury 16 G10 | |
| Moyenne Intel Core i9-13950HX (100 - 137, n=7) | |
| 7-Zip 18.03 / 7z b 4 | |
| Moyenne Intel Core i9-13950HX (99351 - 127295, n=7) | |
| HP ZBook Fury 16 G10 | |
| Lenovo ThinkPad P16 G1 RTX A5500 | |
| HP ZBook Fury 16 G9 | |
| Dell Precision 5000 5680 | |
| Lenovo ThinkPad P16 G1 21D6001DMB | |
| HP ZBook Studio 16 G9 62U04EA | |
| MSI CreatorPro Z16P B12UKST | |
| Lenovo ThinkPad P1 G4-20Y4Z9DVUS | |
| Asus ProArt StudioBook 16 W7600H5A-2BL2 | |
| 7-Zip 18.03 / 7z b 4 -mmt1 | |
| Moyenne Intel Core i9-13950HX (6445 - 7064, n=7) | |
| HP ZBook Fury 16 G10 | |
| Dell Precision 5000 5680 | |
| Lenovo ThinkPad P16 G1 RTX A5500 | |
| HP ZBook Fury 16 G9 | |
| HP ZBook Studio 16 G9 62U04EA | |
| Lenovo ThinkPad P16 G1 21D6001DMB | |
| MSI CreatorPro Z16P B12UKST | |
| Lenovo ThinkPad P1 G4-20Y4Z9DVUS | |
| Asus ProArt StudioBook 16 W7600H5A-2BL2 | |
| Geekbench 5.5 / Multi-Core | |
| Moyenne Intel Core i9-13950HX (16776 - 21853, n=7) | |
| HP ZBook Fury 16 G10 | |
| Lenovo ThinkPad P16 G1 RTX A5500 | |
| Dell Precision 5000 5680 | |
| HP ZBook Fury 16 G9 | |
| Lenovo ThinkPad P16 G1 21D6001DMB | |
| HP ZBook Studio 16 G9 62U04EA | |
| MSI CreatorPro Z16P B12UKST | |
| Asus ProArt StudioBook 16 W7600H5A-2BL2 | |
| Lenovo ThinkPad P1 G4-20Y4Z9DVUS | |
| Geekbench 5.5 / Single-Core | |
| HP ZBook Fury 16 G10 | |
| Dell Precision 5000 5680 | |
| Moyenne Intel Core i9-13950HX (1805 - 2097, n=7) | |
| HP ZBook Fury 16 G9 | |
| Lenovo ThinkPad P16 G1 RTX A5500 | |
| HP ZBook Studio 16 G9 62U04EA | |
| MSI CreatorPro Z16P B12UKST | |
| Lenovo ThinkPad P16 G1 21D6001DMB | |
| Lenovo ThinkPad P1 G4-20Y4Z9DVUS | |
| Asus ProArt StudioBook 16 W7600H5A-2BL2 | |
| HWBOT x265 Benchmark v2.2 / 4k Preset | |
| Moyenne Intel Core i9-13950HX (26 - 34.5, n=7) | |
| HP ZBook Fury 16 G10 | |
| Lenovo ThinkPad P16 G1 RTX A5500 | |
| Dell Precision 5000 5680 | |
| HP ZBook Fury 16 G9 | |
| HP ZBook Studio 16 G9 62U04EA | |
| MSI CreatorPro Z16P B12UKST | |
| Lenovo ThinkPad P16 G1 21D6001DMB | |
| Lenovo ThinkPad P1 G4-20Y4Z9DVUS | |
| Asus ProArt StudioBook 16 W7600H5A-2BL2 | |
| LibreOffice / 20 Documents To PDF | |
| Lenovo ThinkPad P1 G4-20Y4Z9DVUS | |
| Lenovo ThinkPad P16 G1 21D6001DMB | |
| Moyenne Intel Core i9-13950HX (32.8 - 52.1, n=7) | |
| HP ZBook Fury 16 G10 | |
| HP ZBook Studio 16 G9 62U04EA | |
| Dell Precision 5000 5680 | |
| Lenovo ThinkPad P16 G1 RTX A5500 | |
| MSI CreatorPro Z16P B12UKST | |
| HP ZBook Fury 16 G9 | |
| Asus ProArt StudioBook 16 W7600H5A-2BL2 | |
| R Benchmark 2.5 / Overall mean | |
| Asus ProArt StudioBook 16 W7600H5A-2BL2 | |
| Lenovo ThinkPad P1 G4-20Y4Z9DVUS | |
| MSI CreatorPro Z16P B12UKST | |
| Lenovo ThinkPad P16 G1 21D6001DMB | |
| HP ZBook Studio 16 G9 62U04EA | |
| Lenovo ThinkPad P16 G1 RTX A5500 | |
| HP ZBook Fury 16 G9 | |
| Dell Precision 5000 5680 | |
| Moyenne Intel Core i9-13950HX (0.3823 - 0.4121, n=7) | |
| HP ZBook Fury 16 G10 | |
* ... Moindre est la valeur, meilleures sont les performances
AIDA64: FP32 Ray-Trace | FPU Julia | CPU SHA3 | CPU Queen | FPU SinJulia | FPU Mandel | CPU AES | CPU ZLib | FP64 Ray-Trace | CPU PhotoWorxx
| Performance rating | |
| Moyenne Intel Core i9-13950HX | |
| HP ZBook Fury 16 G10 | |
| Lenovo ThinkPad P16 G1 RTX A5500 | |
| HP ZBook Fury 16 G9 | |
| Dell Precision 5000 5680 | |
| MSI CreatorPro Z16P B12UKST | |
| AIDA64 / FP32 Ray-Trace | |
| Moyenne Intel Core i9-13950HX (17993 - 28957, n=9) | |
| HP ZBook Fury 16 G10 | |
| Lenovo ThinkPad P16 G1 RTX A5500 | |
| HP ZBook Fury 16 G9 | |
| Dell Precision 5000 5680 | |
| MSI CreatorPro Z16P B12UKST | |
| AIDA64 / FPU Julia | |
| Moyenne Intel Core i9-13950HX (89362 - 144303, n=9) | |
| HP ZBook Fury 16 G10 | |
| HP ZBook Fury 16 G9 | |
| Lenovo ThinkPad P16 G1 RTX A5500 | |
| Dell Precision 5000 5680 | |
| MSI CreatorPro Z16P B12UKST | |
| AIDA64 / CPU SHA3 | |
| Moyenne Intel Core i9-13950HX (4518 - 7093, n=9) | |
| HP ZBook Fury 16 G10 | |
| Lenovo ThinkPad P16 G1 RTX A5500 | |
| HP ZBook Fury 16 G9 | |
| MSI CreatorPro Z16P B12UKST | |
| Dell Precision 5000 5680 | |
| AIDA64 / CPU Queen | |
| Moyenne Intel Core i9-13950HX (131931 - 140103, n=8) | |
| HP ZBook Fury 16 G10 | |
| Dell Precision 5000 5680 | |
| Lenovo ThinkPad P16 G1 RTX A5500 | |
| HP ZBook Fury 16 G9 | |
| MSI CreatorPro Z16P B12UKST | |
| AIDA64 / FPU SinJulia | |
| Moyenne Intel Core i9-13950HX (12318 - 17057, n=9) | |
| HP ZBook Fury 16 G10 | |
| Lenovo ThinkPad P16 G1 RTX A5500 | |
| HP ZBook Fury 16 G9 | |
| Dell Precision 5000 5680 | |
| MSI CreatorPro Z16P B12UKST | |
| AIDA64 / FPU Mandel | |
| Moyenne Intel Core i9-13950HX (44372 - 71038, n=9) | |
| HP ZBook Fury 16 G10 | |
| HP ZBook Fury 16 G9 | |
| Lenovo ThinkPad P16 G1 RTX A5500 | |
| Dell Precision 5000 5680 | |
| MSI CreatorPro Z16P B12UKST | |
| AIDA64 / CPU AES | |
| Moyenne Intel Core i9-13950HX (99981 - 204491, n=9) | |
| MSI CreatorPro Z16P B12UKST | |
| HP ZBook Fury 16 G10 | |
| HP ZBook Fury 16 G9 | |
| Lenovo ThinkPad P16 G1 RTX A5500 | |
| Dell Precision 5000 5680 | |
| AIDA64 / CPU ZLib | |
| Moyenne Intel Core i9-13950HX (1263 - 2069, n=9) | |
| HP ZBook Fury 16 G10 | |
| Lenovo ThinkPad P16 G1 RTX A5500 | |
| HP ZBook Fury 16 G9 | |
| MSI CreatorPro Z16P B12UKST | |
| Dell Precision 5000 5680 | |
| AIDA64 / FP64 Ray-Trace | |
| Moyenne Intel Core i9-13950HX (9649 - 15573, n=9) | |
| HP ZBook Fury 16 G10 | |
| Lenovo ThinkPad P16 G1 RTX A5500 | |
| HP ZBook Fury 16 G9 | |
| Dell Precision 5000 5680 | |
| MSI CreatorPro Z16P B12UKST | |
| AIDA64 / CPU PhotoWorxx | |
| Dell Precision 5000 5680 | |
| Moyenne Intel Core i9-13950HX (40233 - 50864, n=9) | |
| MSI CreatorPro Z16P B12UKST | |
| Lenovo ThinkPad P16 G1 RTX A5500 | |
| HP ZBook Fury 16 G10 | |
| HP ZBook Fury 16 G9 | |
Performance du système
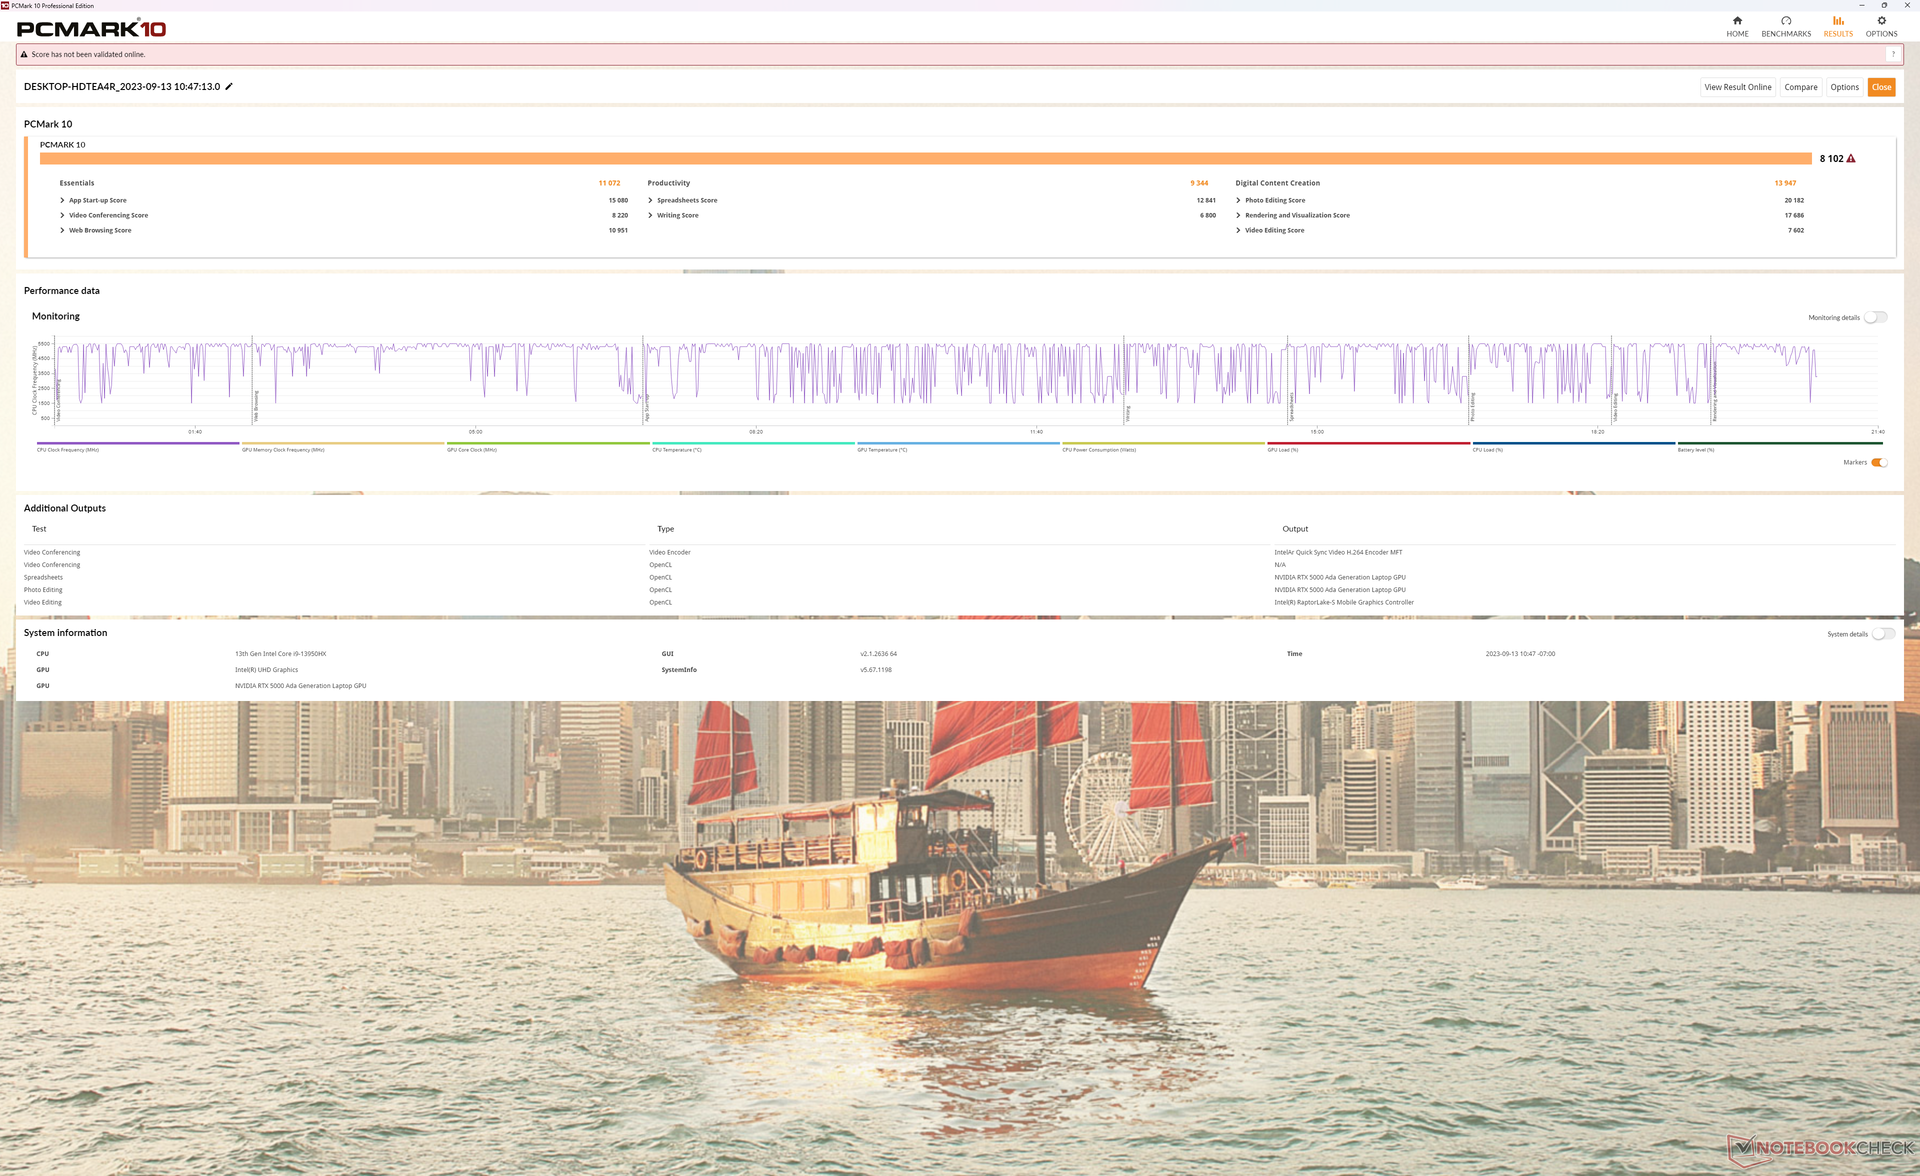
Les scores PCMark sont supérieurs à ceux de la Fury 16 G9 de l'année dernière, en particulier dans le sous-test de création de contenu numérique, en raison de l'augmentation significative des performances du GPU. Par ailleurs, la carte Precision 5680 obtient de meilleurs résultats en Productivité grâce à ses disques SSD RAID 0. Bien entendu, notre HP peut également être configuré avec RAID si vous le souhaitez.
CrossMark: Overall | Productivity | Creativity | Responsiveness
| PCMark 10 / Score | |
| Dell Precision 5000 5680 | |
| HP ZBook Fury 16 G10 | |
| Moyenne Intel Core i9-13950HX, NVIDIA RTX 5000 Ada Generation Laptop (n=1) | |
| Lenovo ThinkPad P16 G1 RTX A5500 | |
| MSI CreatorPro Z16P B12UKST | |
| Asus ProArt StudioBook 16 W7600H5A-2BL2 | |
| HP ZBook Fury 16 G9 | |
| PCMark 10 / Essentials | |
| Dell Precision 5000 5680 | |
| HP ZBook Fury 16 G10 | |
| Moyenne Intel Core i9-13950HX, NVIDIA RTX 5000 Ada Generation Laptop (n=1) | |
| HP ZBook Fury 16 G9 | |
| Lenovo ThinkPad P16 G1 RTX A5500 | |
| MSI CreatorPro Z16P B12UKST | |
| Asus ProArt StudioBook 16 W7600H5A-2BL2 | |
| PCMark 10 / Productivity | |
| Dell Precision 5000 5680 | |
| Lenovo ThinkPad P16 G1 RTX A5500 | |
| MSI CreatorPro Z16P B12UKST | |
| HP ZBook Fury 16 G10 | |
| Moyenne Intel Core i9-13950HX, NVIDIA RTX 5000 Ada Generation Laptop (n=1) | |
| Asus ProArt StudioBook 16 W7600H5A-2BL2 | |
| HP ZBook Fury 16 G9 | |
| PCMark 10 / Digital Content Creation | |
| HP ZBook Fury 16 G10 | |
| Moyenne Intel Core i9-13950HX, NVIDIA RTX 5000 Ada Generation Laptop (n=1) | |
| Dell Precision 5000 5680 | |
| Asus ProArt StudioBook 16 W7600H5A-2BL2 | |
| Lenovo ThinkPad P16 G1 RTX A5500 | |
| MSI CreatorPro Z16P B12UKST | |
| HP ZBook Fury 16 G9 | |
| CrossMark / Overall | |
| MSI CreatorPro Z16P B12UKST | |
| Dell Precision 5000 5680 | |
| HP ZBook Fury 16 G10 | |
| Moyenne Intel Core i9-13950HX, NVIDIA RTX 5000 Ada Generation Laptop (n=1) | |
| HP ZBook Fury 16 G9 | |
| Lenovo ThinkPad P16 G1 RTX A5500 | |
| CrossMark / Productivity | |
| HP ZBook Fury 16 G10 | |
| Moyenne Intel Core i9-13950HX, NVIDIA RTX 5000 Ada Generation Laptop (n=1) | |
| MSI CreatorPro Z16P B12UKST | |
| Dell Precision 5000 5680 | |
| HP ZBook Fury 16 G9 | |
| Lenovo ThinkPad P16 G1 RTX A5500 | |
| CrossMark / Creativity | |
| Lenovo ThinkPad P16 G1 RTX A5500 | |
| Dell Precision 5000 5680 | |
| HP ZBook Fury 16 G9 | |
| HP ZBook Fury 16 G10 | |
| Moyenne Intel Core i9-13950HX, NVIDIA RTX 5000 Ada Generation Laptop (n=1) | |
| MSI CreatorPro Z16P B12UKST | |
| CrossMark / Responsiveness | |
| MSI CreatorPro Z16P B12UKST | |
| HP ZBook Fury 16 G10 | |
| Moyenne Intel Core i9-13950HX, NVIDIA RTX 5000 Ada Generation Laptop (n=1) | |
| HP ZBook Fury 16 G9 | |
| Dell Precision 5000 5680 | |
| Lenovo ThinkPad P16 G1 RTX A5500 | |
| PCMark 10 Score | 8102 points | |
Aide | ||
| AIDA64 / Memory Copy | |
| Dell Precision 5000 5680 | |
| Lenovo ThinkPad P16 G1 RTX A5500 | |
| MSI CreatorPro Z16P B12UKST | |
| HP ZBook Fury 16 G10 | |
| HP ZBook Fury 16 G9 | |
| AIDA64 / Memory Read | |
| Dell Precision 5000 5680 | |
| MSI CreatorPro Z16P B12UKST | |
| Lenovo ThinkPad P16 G1 RTX A5500 | |
| HP ZBook Fury 16 G10 | |
| HP ZBook Fury 16 G9 | |
| AIDA64 / Memory Write | |
| Dell Precision 5000 5680 | |
| MSI CreatorPro Z16P B12UKST | |
| Lenovo ThinkPad P16 G1 RTX A5500 | |
| HP ZBook Fury 16 G10 | |
| HP ZBook Fury 16 G9 | |
* ... Moindre est la valeur, meilleures sont les performances
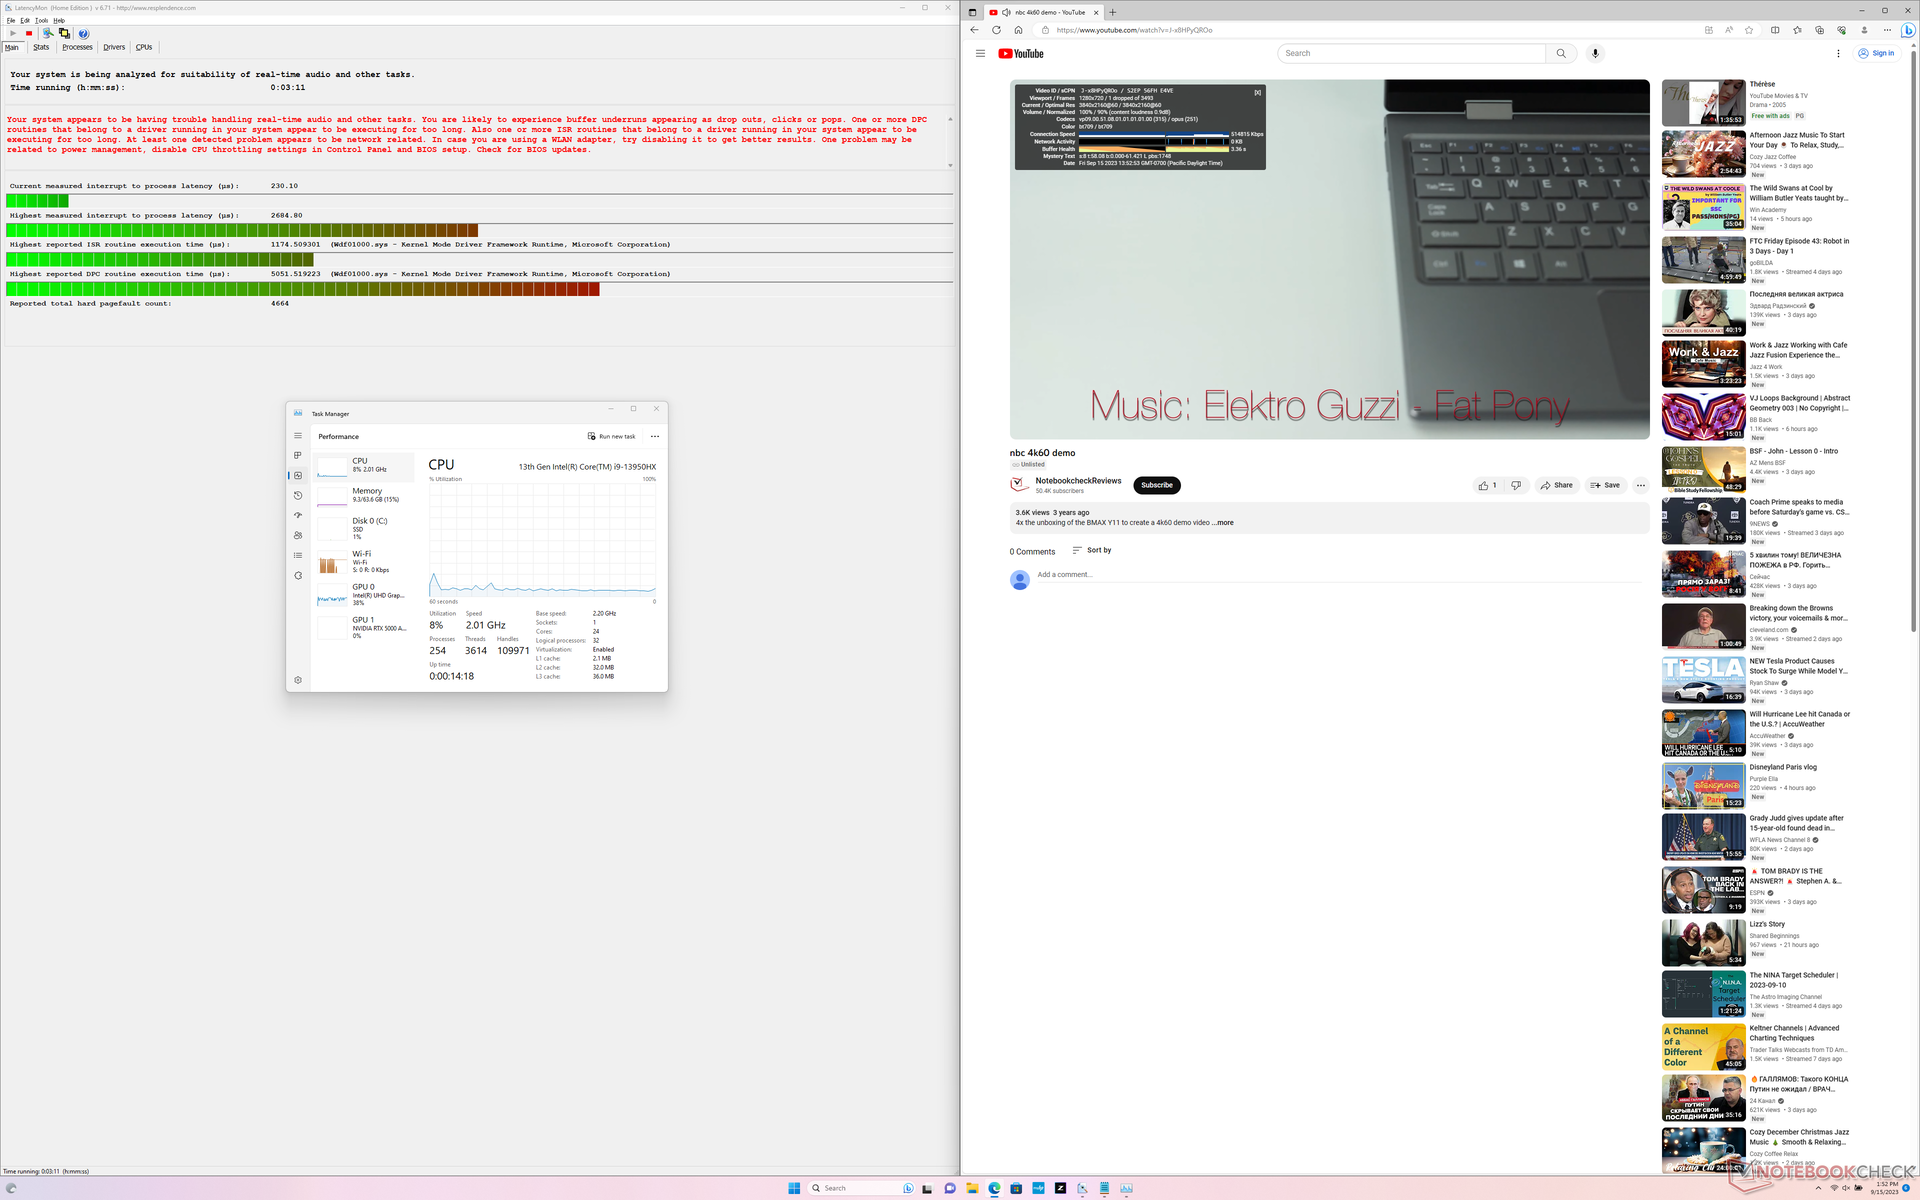
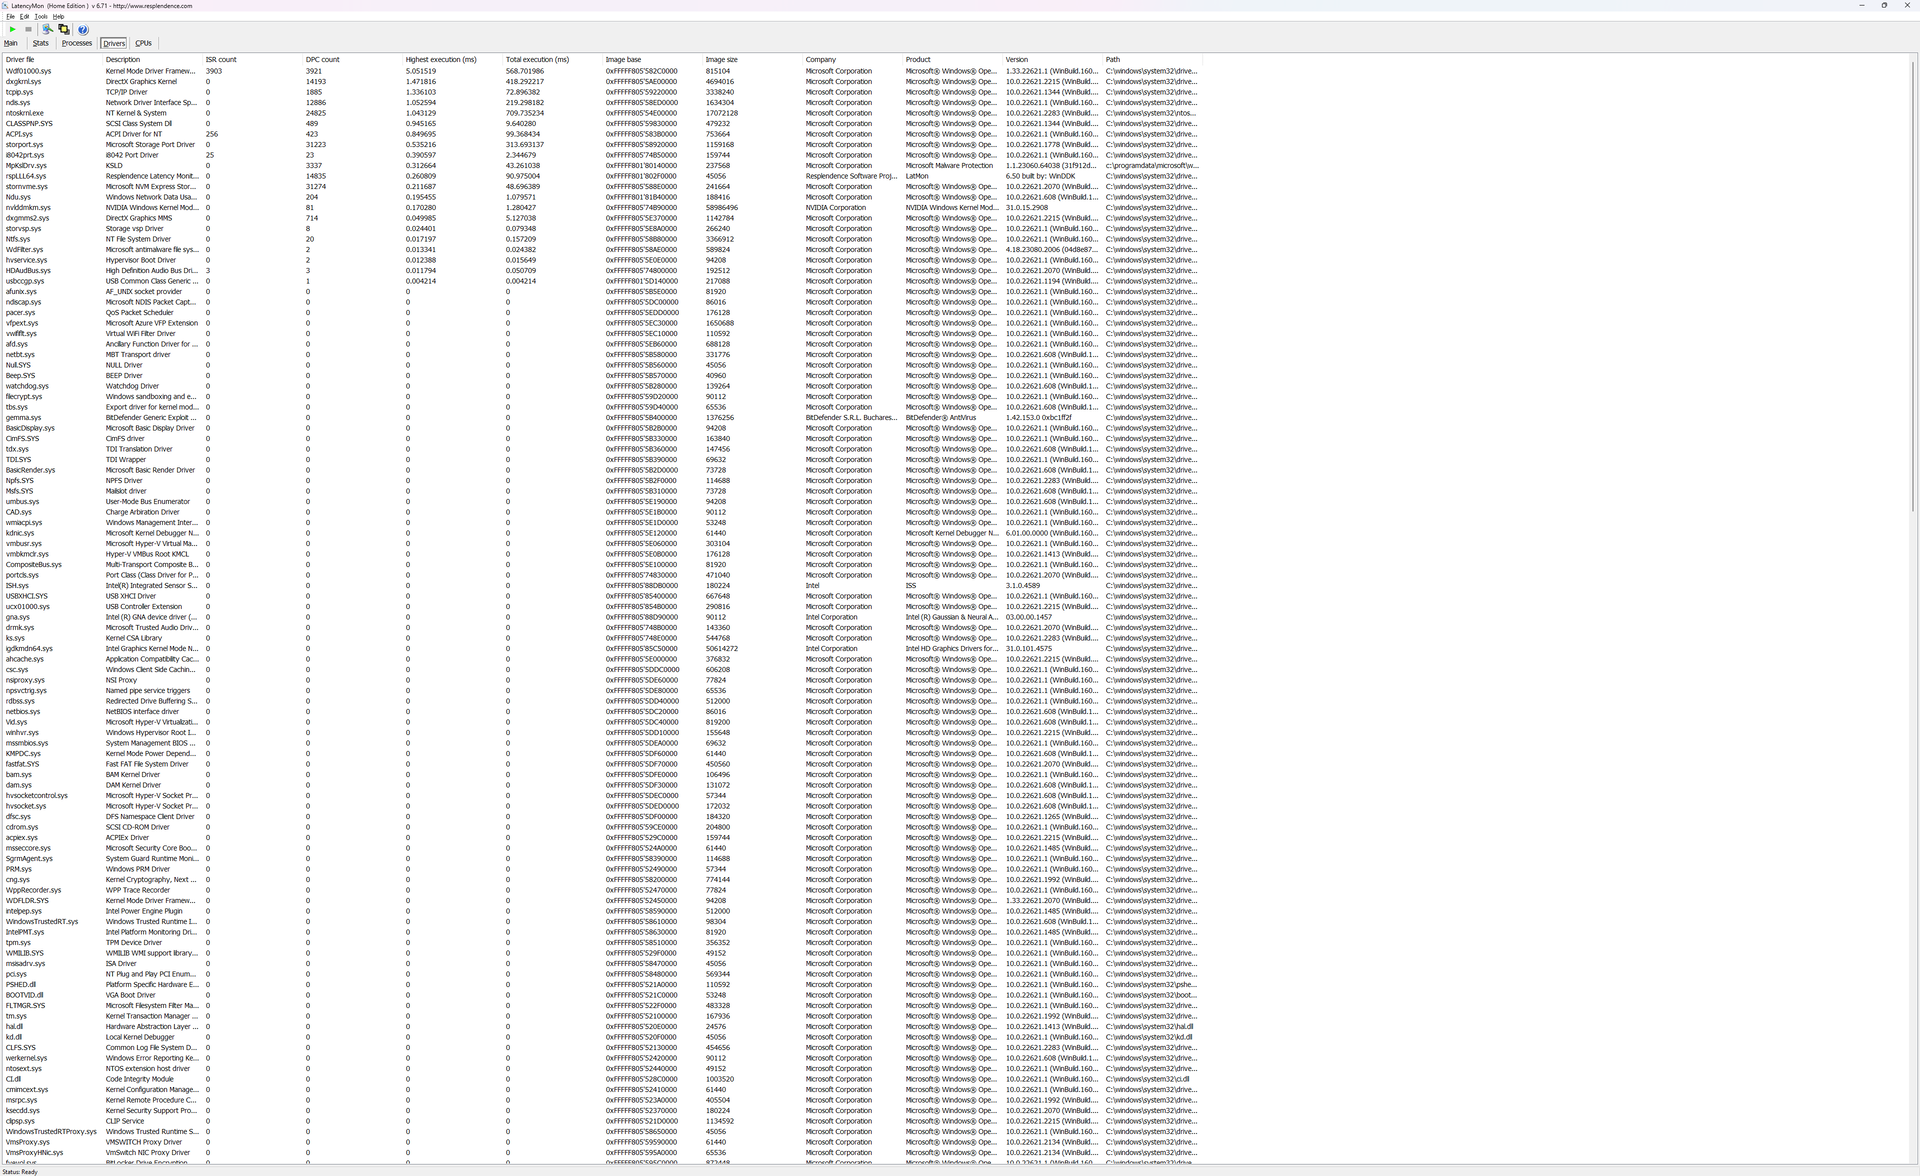
Latence DPC
LatencyMon révèle des problèmes de DPC lors de l'ouverture de plusieurs onglets de notre page d'accueil. la lecture de vidéos 4K à 60 FPS est presque parfaite, avec une seule image perdue enregistrée pendant un intervalle de 60 secondes.
| DPC Latencies / LatencyMon - interrupt to process latency (max), Web, Youtube, Prime95 | |
| HP ZBook Fury 16 G10 | |
| HP ZBook Fury 16 G9 | |
| Dell Precision 5000 5680 | |
| Lenovo ThinkPad P16 G1 RTX A5500 | |
| Asus ProArt StudioBook 16 W7600H5A-2BL2 | |
| MSI CreatorPro Z16P B12UKST | |
* ... Moindre est la valeur, meilleures sont les performances
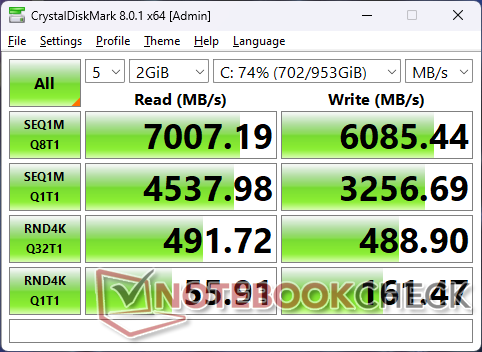
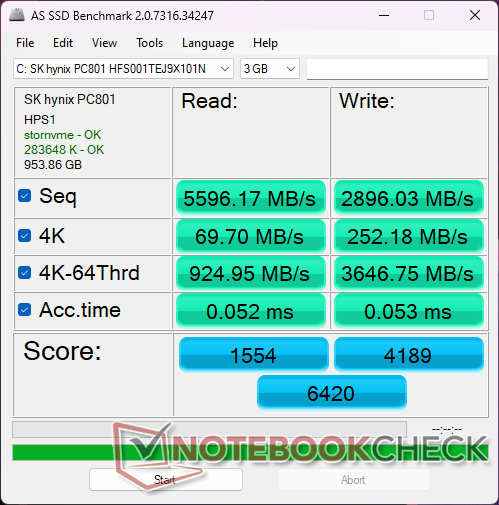
Dispositifs de stockage
Notre unité de test est livrée avec un SK hynix PC801 PCIe4 x4 NVMe SSD alors que notre ancienne Fury G16 G9 était livrée avec un Micron 3400. Malheureusement, les performances ont chuté à 3400 Mo/s après environ une minute de notre test de stress, comme le montre le graphique ci-dessous. Il est clair que les quatre slots SSD M.2 pourraient bénéficier d'un meilleur refroidissement pour améliorer la régularité des performances.

* ... Moindre est la valeur, meilleures sont les performances
Disk Throttling: DiskSpd Read Loop, Queue Depth 8
Performances du GPU - Mobile Monster
Le RTX 5000 Ada de notre système HP est 10 à 20 % plus rapide que le même GPU sur le Dell Precision 5680. Ses avantages en termes de performances, légers mais constants, peuvent être attribués au plafond TGP plus élevé, alors que le GPU du système Dell susmentionné fonctionnerait à une enveloppe de puissance plus faible. La section "Stress Test" ci-dessous détaille nos observations.
Les performances globales sont bien supérieures à celles de laRTX A5500 de la Fury 16 G9 de l'année dernière, jusqu'à 40 %, voire 80 %, selon l'application.
| 3DMark Performance rating - Percent | |
| HP ZBook Fury 16 G10 | |
| Moyenne NVIDIA RTX 5000 Ada Generation Laptop | |
| Dell Precision 5000 5680 | |
| Lenovo ThinkPad P16 G1 RTX A5500 | |
| Asus ProArt StudioBook 16 W7600H5A-2BL2 -20! | |
| HP ZBook Fury 16 G9 | |
| Dell Precision 5480 -2! | |
| MSI CreatorPro Z16P B12UKST -17! | |
| HP ZBook Studio 16 G9 62U04EA -10! | |
| Lenovo ThinkPad P16 G1 21D6001DMB -18! | |
| Lenovo ThinkPad P1 G4-20Y4Z9DVUS -18! | |
| 3DMark 11 - 1280x720 Performance GPU | |
| HP ZBook Fury 16 G10 | |
| Moyenne NVIDIA RTX 5000 Ada Generation Laptop (49833 - 54334, n=3) | |
| Dell Precision 5000 5680 | |
| Lenovo ThinkPad P16 G1 RTX A5500 | |
| HP ZBook Fury 16 G9 | |
| Dell Precision 5480 | |
| MSI CreatorPro Z16P B12UKST | |
| HP ZBook Studio 16 G9 62U04EA | |
| Lenovo ThinkPad P16 G1 21D6001DMB | |
| Lenovo ThinkPad P1 G4-20Y4Z9DVUS | |
| 3DMark 11 Performance | 39530 points | |
| 3DMark Fire Strike Score | 28837 points | |
| 3DMark Time Spy Score | 15989 points | |
Aide | ||
* ... Moindre est la valeur, meilleures sont les performances
Witcher 3 FPS Chart
| Bas | Moyen | Élevé | Ultra | QHD | 4K | |
|---|---|---|---|---|---|---|
| The Witcher 3 (2015) | 510.5 | 430.3 | 298.1 | 156.5 | 105.2 | |
| Dota 2 Reborn (2015) | 211 | 191.7 | 188.2 | 166.7 | 157.3 | |
| Final Fantasy XV Benchmark (2018) | 196.9 | 179.9 | 149.1 | 120 | 68.7 | |
| X-Plane 11.11 (2018) | 175.5 | 153.9 | 122.4 | 102.6 | ||
| Far Cry 5 (2018) | 158 | 144 | 138 | 131 | 129 | |
| Strange Brigade (2018) | 411 | 337 | 306 | 283 | 216 | 105.1 |
| Cyberpunk 2077 1.6 (2022) | 110.5 | 106.8 | 104.9 | 103.8 | 74.7 | 37 |
| Tiny Tina's Wonderlands (2022) | 267.5 | 227.7 | 171.7 | 139.4 | 99.4 | 53.9 |
| F1 22 (2022) | 249 | 246 | 211 | 86.2 | 64.4 | 33.4 |
| Ratchet & Clank Rift Apart (2023) | 118 | 93.9 | 69.4 | 54.5 | 43.4 | 33.3 |
Émissions
Bruit du système
Caractéristiques du ventilateur dans des conditions d'utilisation normales, bruit dans différents scénarios de charge selon les mesures, bruits gênants (de transistors, par exemple) et autres irrégularités (disque dur à rotation rapide, ODD, ventilateur instable, etc.)
Analyser les caractéristiques du bruit - y a-t-il des anomalies ? Brève analyse : brève analyse des émissions sonores, comparaison avec la concurrence. 500 caractères
Degré de la nuisance sonore
| Au repos |
| 22.9 / 22.9 / 28.5 dB(A) |
| Fortement sollicité |
| 40.6 / 45.8 dB(A) |
 | ||
30 dB silencieux 40 dB(A) audible 50 dB(A) bruyant |
||
min: | ||
| HP ZBook Fury 16 G10 RTX 5000 Ada Generation Laptop, i9-13950HX, SK hynix PC801 HFS001TEJ9X101N | HP ZBook Fury 16 G9 RTX A5500 Laptop GPU, i9-12950HX, Micron 3400 1TB MTFDKBA1T0TFH | Dell Precision 5000 5680 RTX 5000 Ada Generation Laptop, i9-13900H, 2x SK hynix PC801 HFS512GEJ9X101N RAID 0 | Lenovo ThinkPad P16 G1 RTX A5500 RTX A5500 Laptop GPU, i9-12950HX, WDC PC SN810 2TB | MSI CreatorPro Z16P B12UKST RTX A3000 Laptop GPU, i7-12700H, Samsung PM9A1 MZVL21T0HCLR | Asus ProArt StudioBook 16 W7600H5A-2BL2 RTX A5000 Laptop GPU, W-11955M, 2x Micron 2300 2TB MTFDHBA2T0TDV (RAID 0) | |
|---|---|---|---|---|---|---|
| Noise | -1% | 0% | 2% | -6% | -5% | |
| arrêt / environnement * (dB) | 22.9 | 22.6 1% | 22.8 -0% | 23.1 -1% | 24.1 -5% | 26 -14% |
| Idle Minimum * (dB) | 22.9 | 22.7 1% | 23 -0% | 23.1 -1% | 27.1 -18% | 26 -14% |
| Idle Average * (dB) | 22.9 | 22.7 1% | 23 -0% | 23.1 -1% | 27.1 -18% | 26 -14% |
| Idle Maximum * (dB) | 28.5 | 28.8 -1% | 23 19% | 23.1 19% | 27.1 5% | 26.5 7% |
| Load Average * (dB) | 40.6 | 36.2 11% | 37.2 8% | 28.9 29% | 42.9 -6% | 42 -3% |
| Witcher 3 ultra * (dB) | 44.1 | 49.5 -12% | 51 -16% | 51.6 -17% | 44 -0% | |
| Load Maximum * (dB) | 45.8 | 49.3 -8% | 51 -11% | 51.4 -12% | 47 -3% | 43 6% |
* ... Moindre est la valeur, meilleures sont les performances
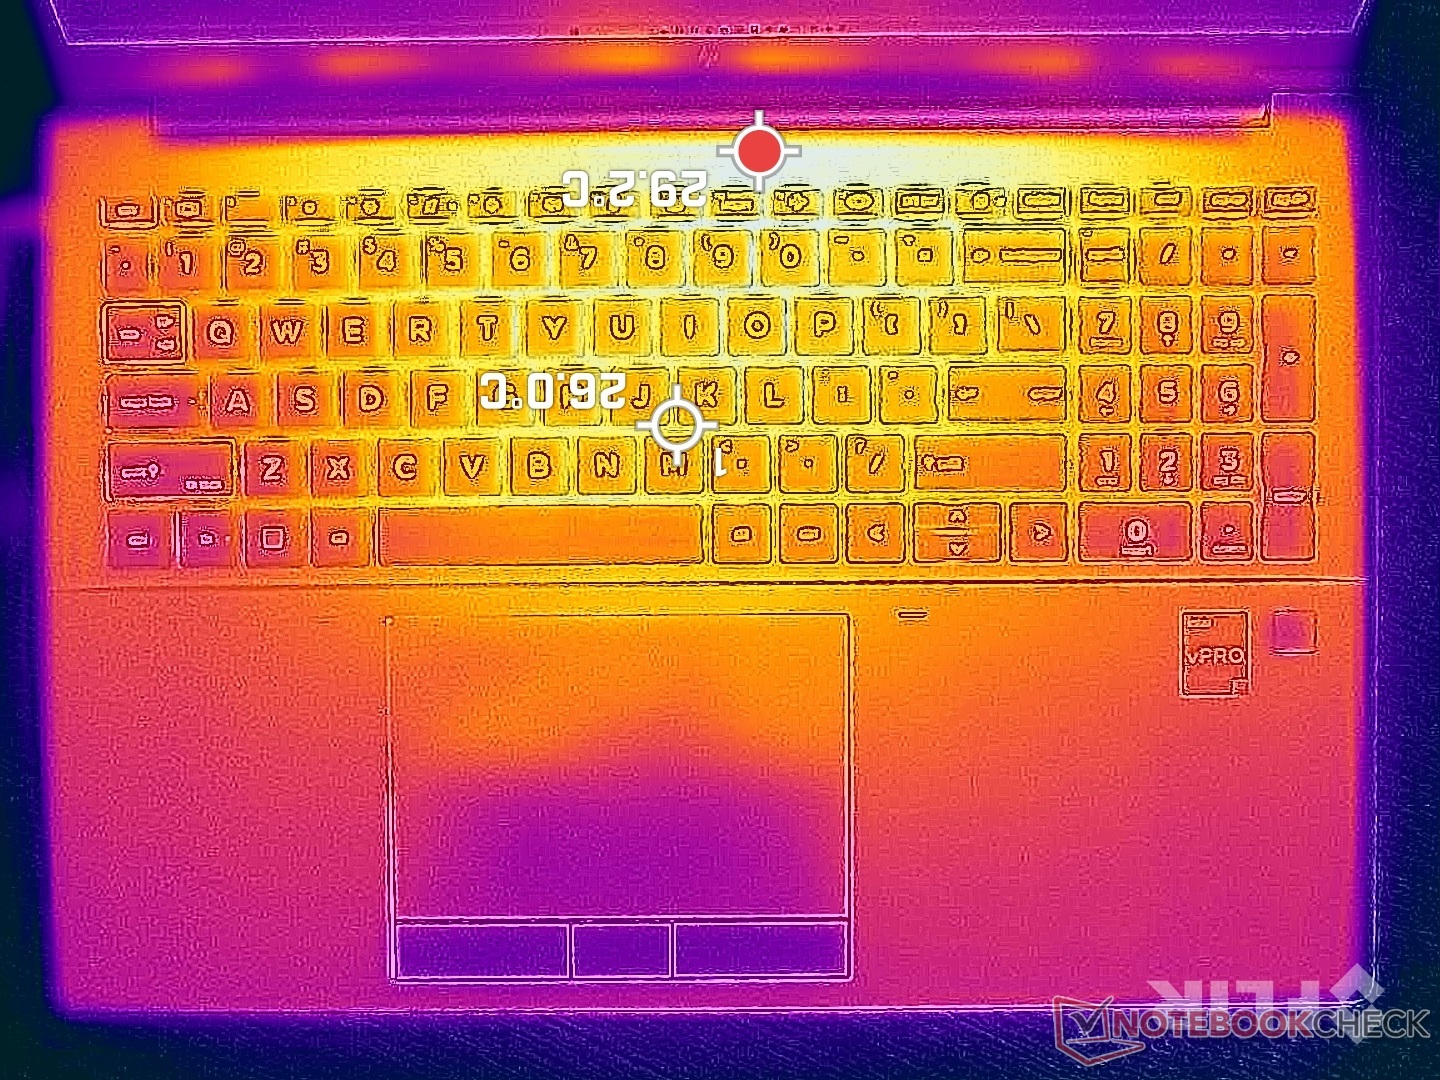
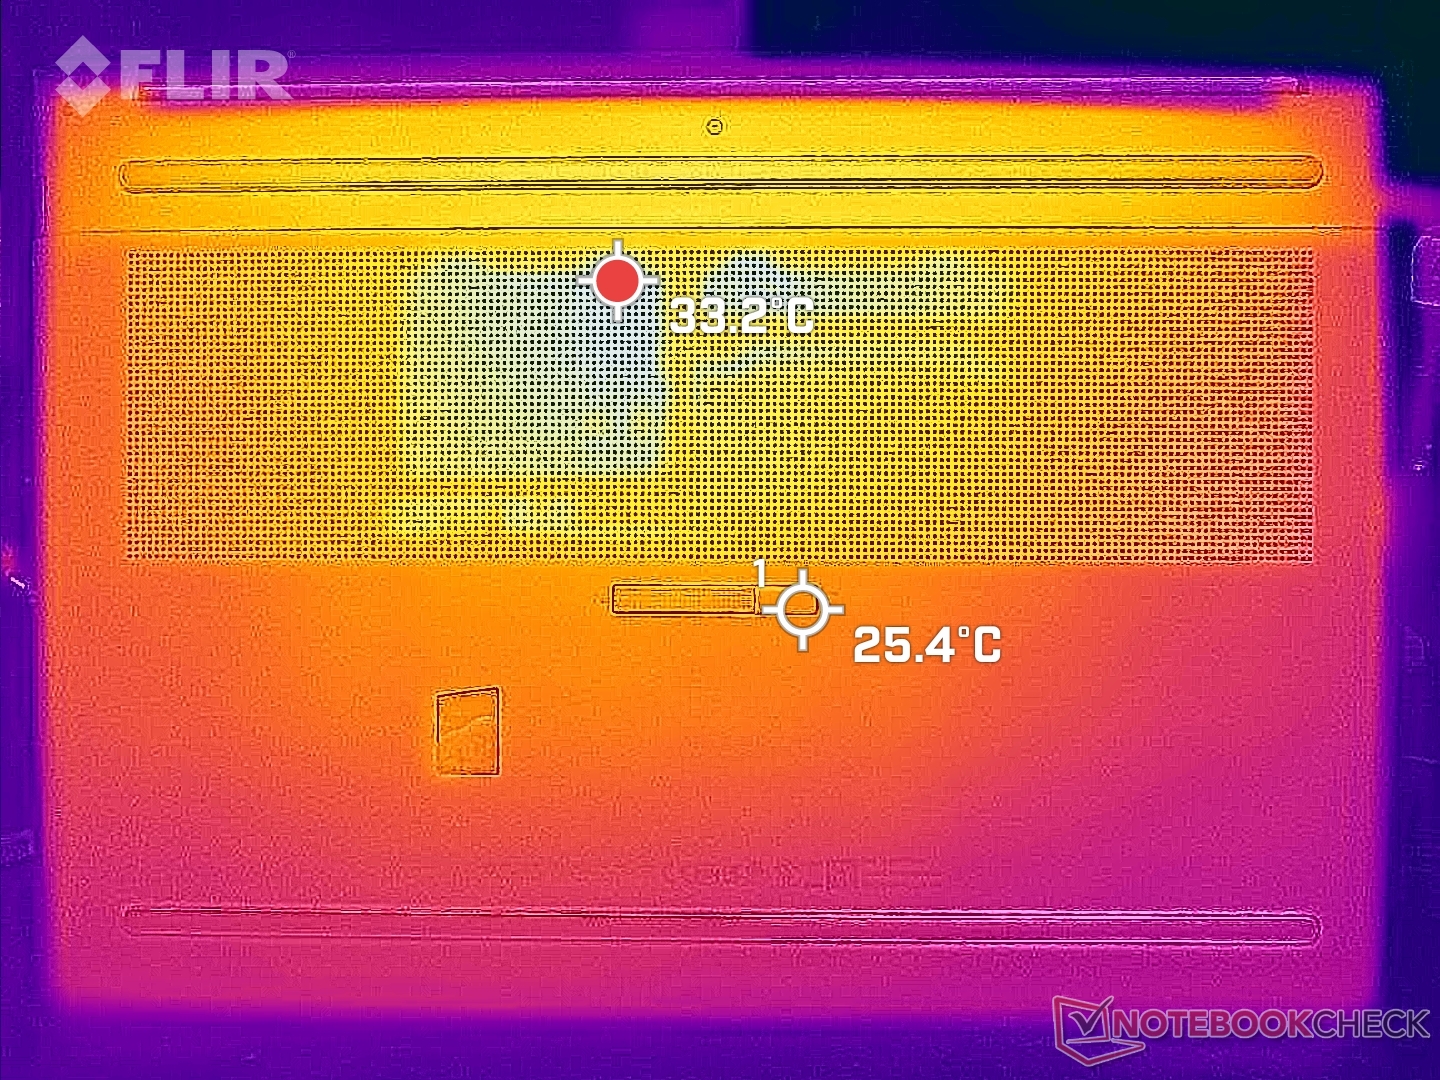
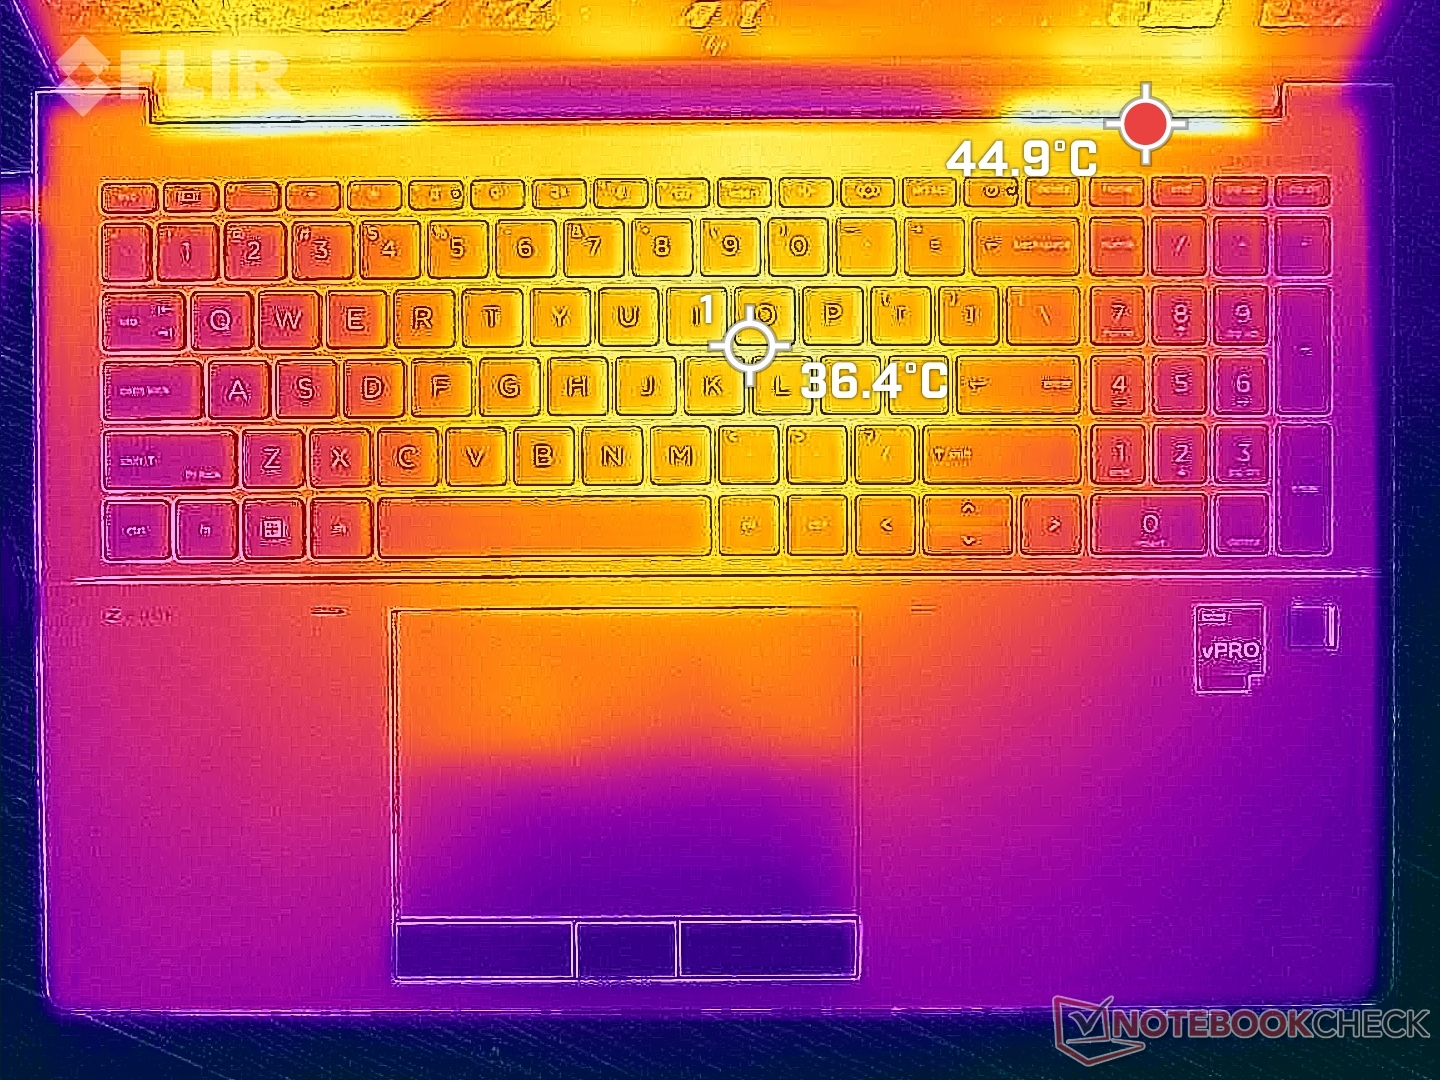
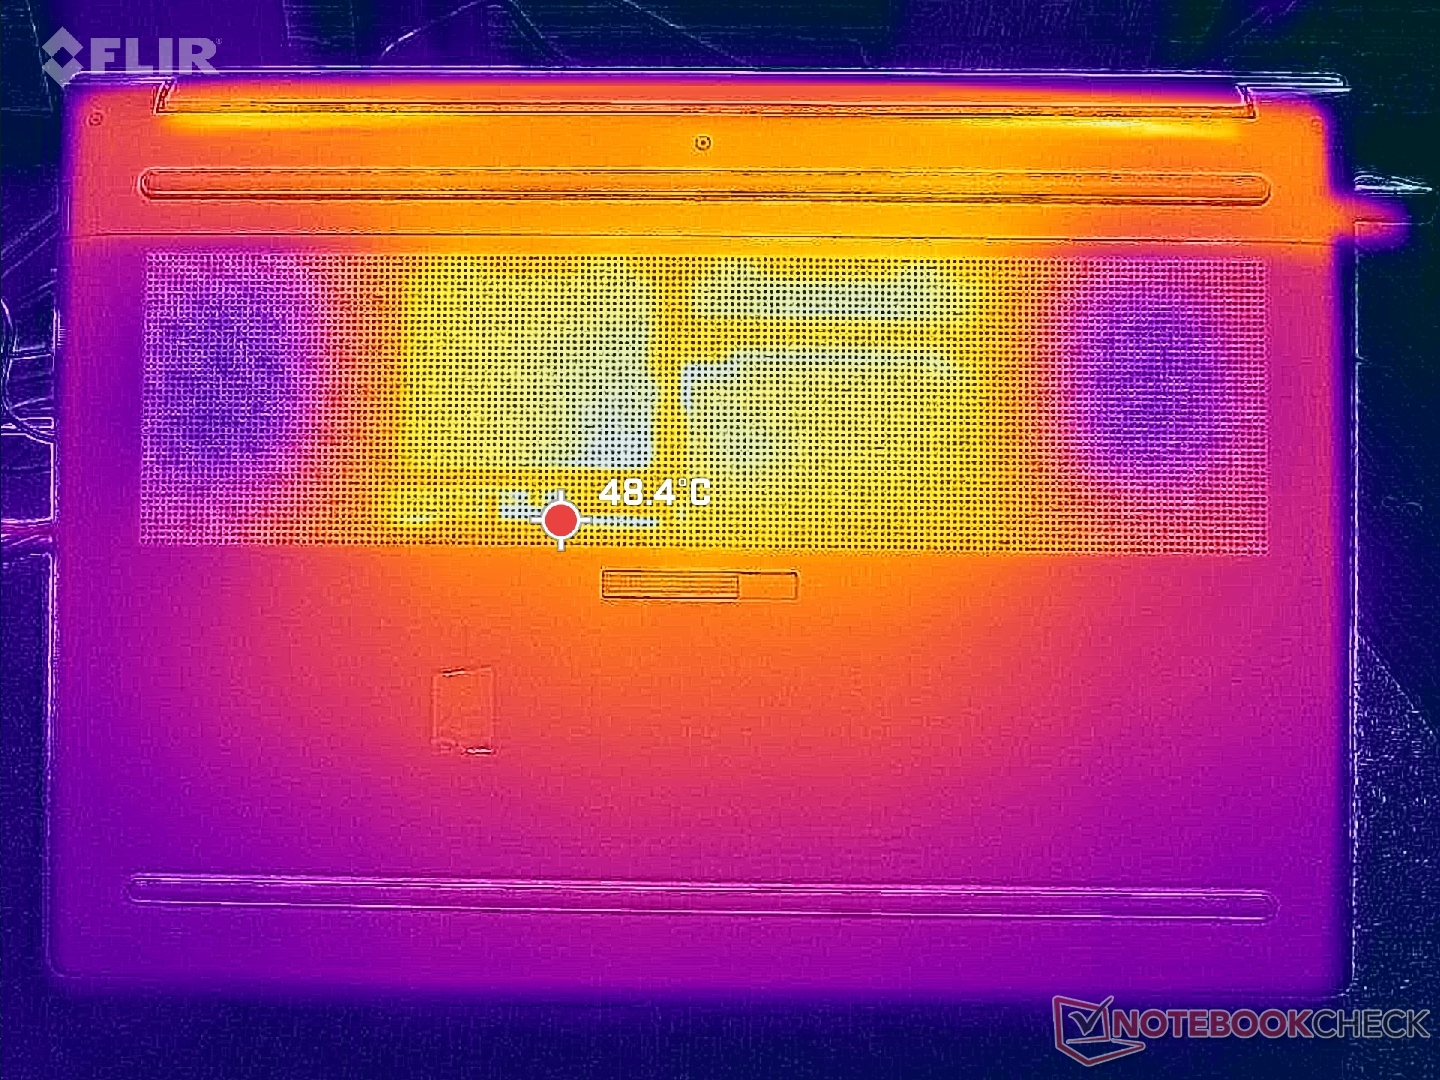
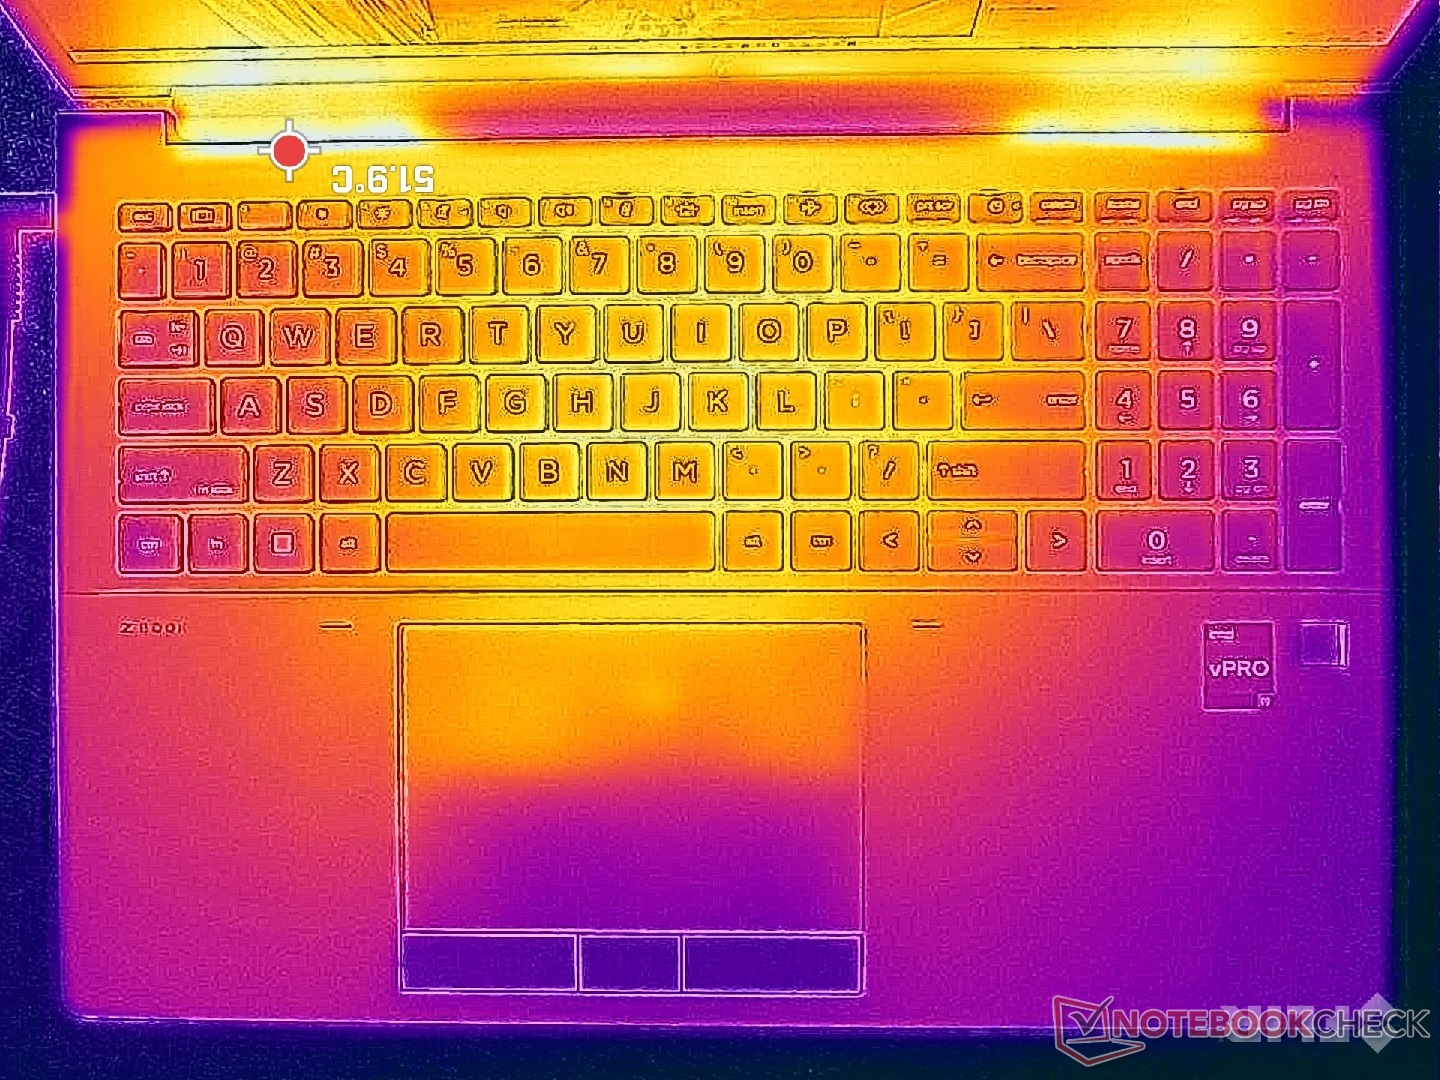
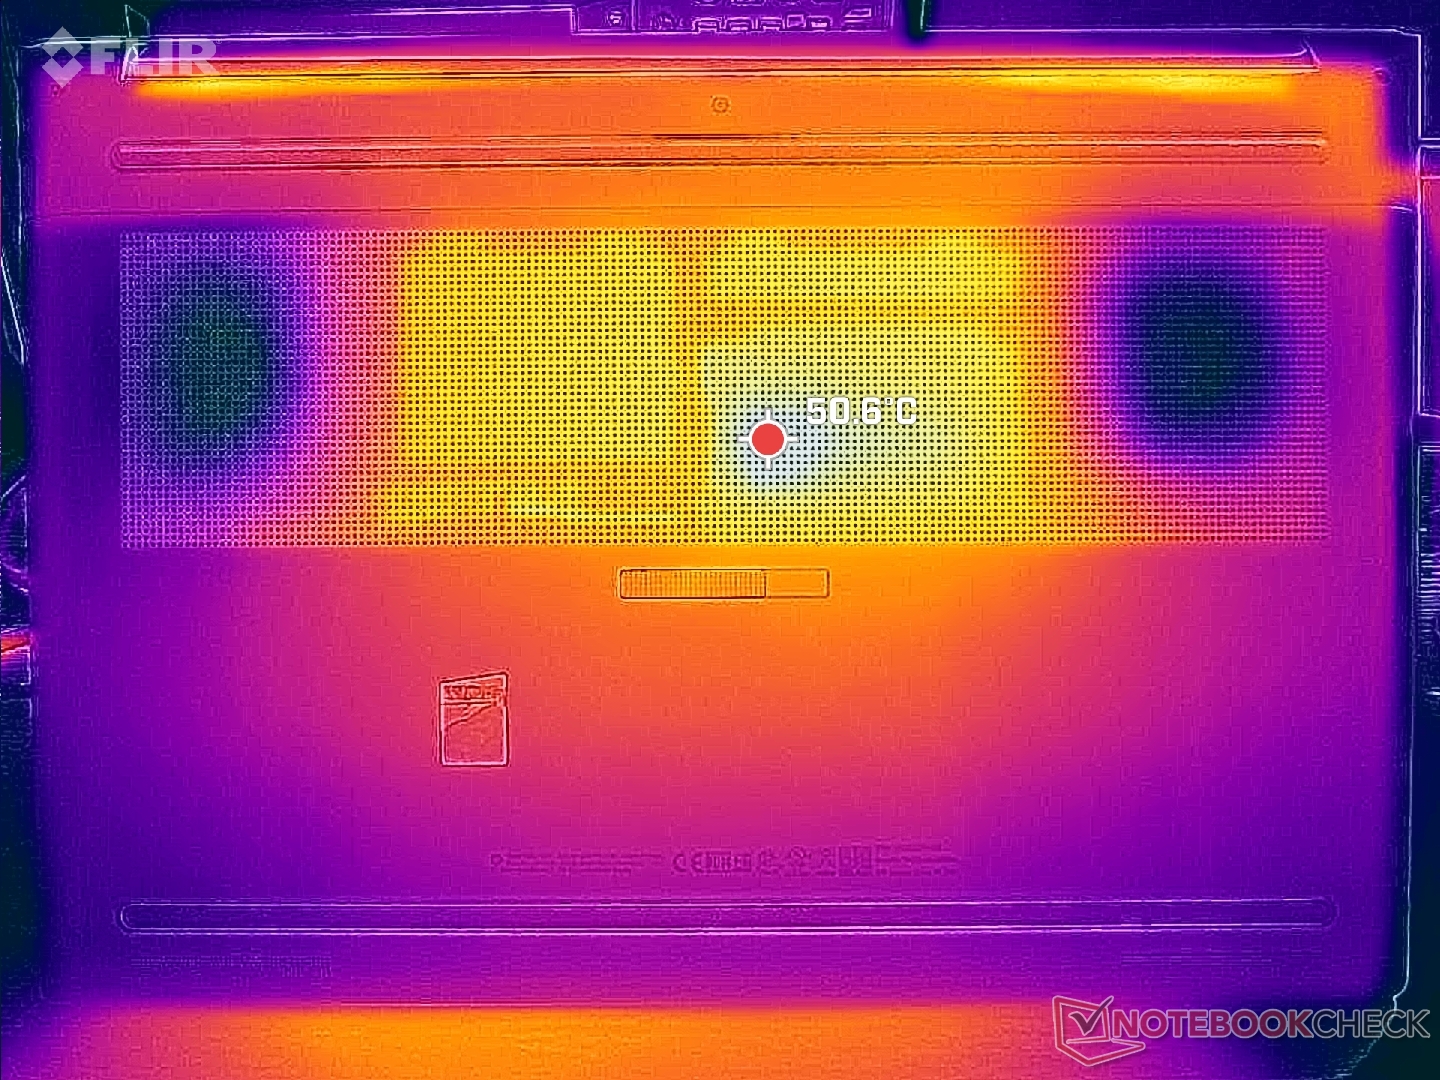
Température
Les températures de surface peuvent atteindre plus de 36°C au centre du clavier ou 45°C à l'arrière lorsque la charge est élevée. Il est intéressant de noter que le système est plus froid que le Precision 5680 sur le clavier, mais l'inverse est vrai pour les surfaces inférieures.
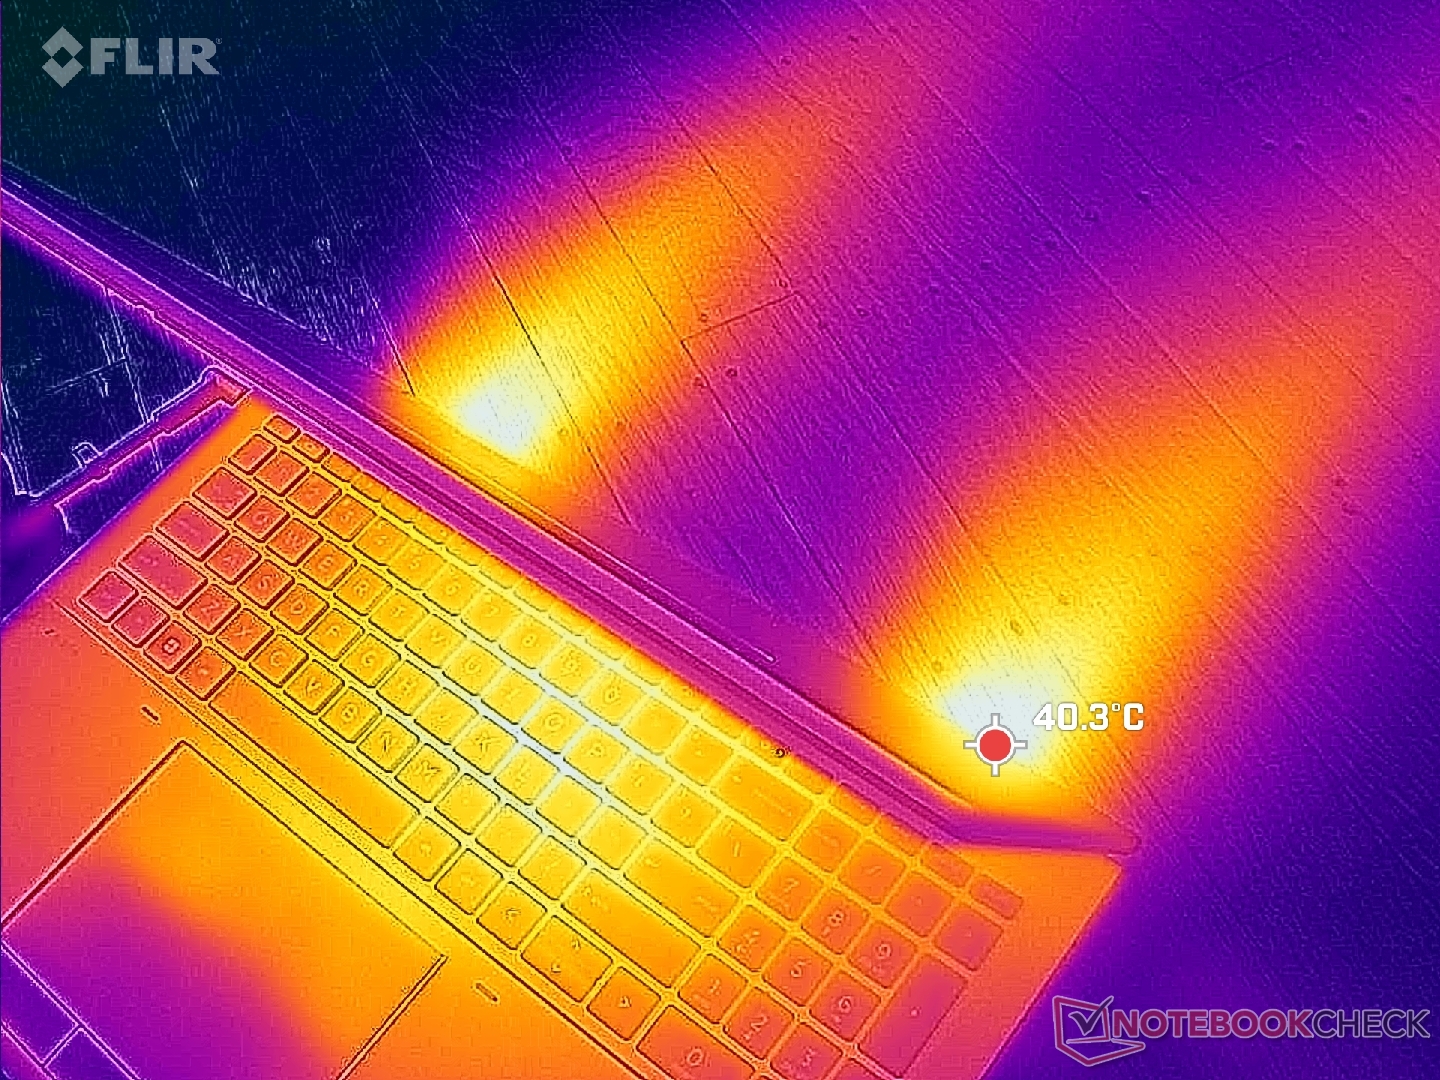
(±) La température maximale du côté supérieur est de 44.8 °C / 113 F, par rapport à la moyenne de 38.2 °C / 101 F, allant de 22.2 à 69.8 °C pour la classe Workstation.
(-) Le fond chauffe jusqu'à un maximum de 50 °C / 122 F, contre une moyenne de 41.1 °C / 106 F
(+) En utilisation inactive, la température moyenne du côté supérieur est de 30.6 °C / 87 F, par rapport à la moyenne du dispositif de 32 °C / 90 F.
(±) En jouant à The Witcher 3, la température moyenne du côté supérieur est de 34.7 °C / 94 F, alors que la moyenne de l'appareil est de 32 °C / 90 F.
(±) Les repose-poignets et le pavé tactile peuvent devenir très chauds au toucher, avec un maximum de 39.2 °C / 102.6# F.
(-) La température moyenne de la zone de l'appui-paume de dispositifs similaires était de 27.8 °C / 82 F (-11.4 °C / #-20.6 F).
| HP ZBook Fury 16 G10 Intel Core i9-13950HX, NVIDIA RTX 5000 Ada Generation Laptop | HP ZBook Fury 16 G9 Intel Core i9-12950HX, NVIDIA RTX A5500 Laptop GPU | Dell Precision 5000 5680 Intel Core i9-13900H, NVIDIA RTX 5000 Ada Generation Laptop | Lenovo ThinkPad P16 G1 RTX A5500 Intel Core i9-12950HX, NVIDIA RTX A5500 Laptop GPU | MSI CreatorPro Z16P B12UKST Intel Core i7-12700H, NVIDIA RTX A3000 Laptop GPU | Asus ProArt StudioBook 16 W7600H5A-2BL2 Intel Xeon W-11955M, NVIDIA RTX A5000 Laptop GPU | |
|---|---|---|---|---|---|---|
| Heat | 8% | 4% | -3% | -4% | -3% | |
| Maximum Upper Side * (°C) | 44.8 | 43.2 4% | 50.2 -12% | 44.8 -0% | 56.3 -26% | 45.7 -2% |
| Maximum Bottom * (°C) | 50 | 50.4 -1% | 32 36% | 49.8 -0% | 68.3 -37% | 48.3 3% |
| Idle Upper Side * (°C) | 34.4 | 28.6 17% | 37.4 -9% | 30.6 11% | 25.2 27% | 35.3 -3% |
| Idle Bottom * (°C) | 31.8 | 28.2 11% | 31.2 2% | 38.6 -21% | 25.9 19% | 34.4 -8% |
* ... Moindre est la valeur, meilleures sont les performances
Test de stress
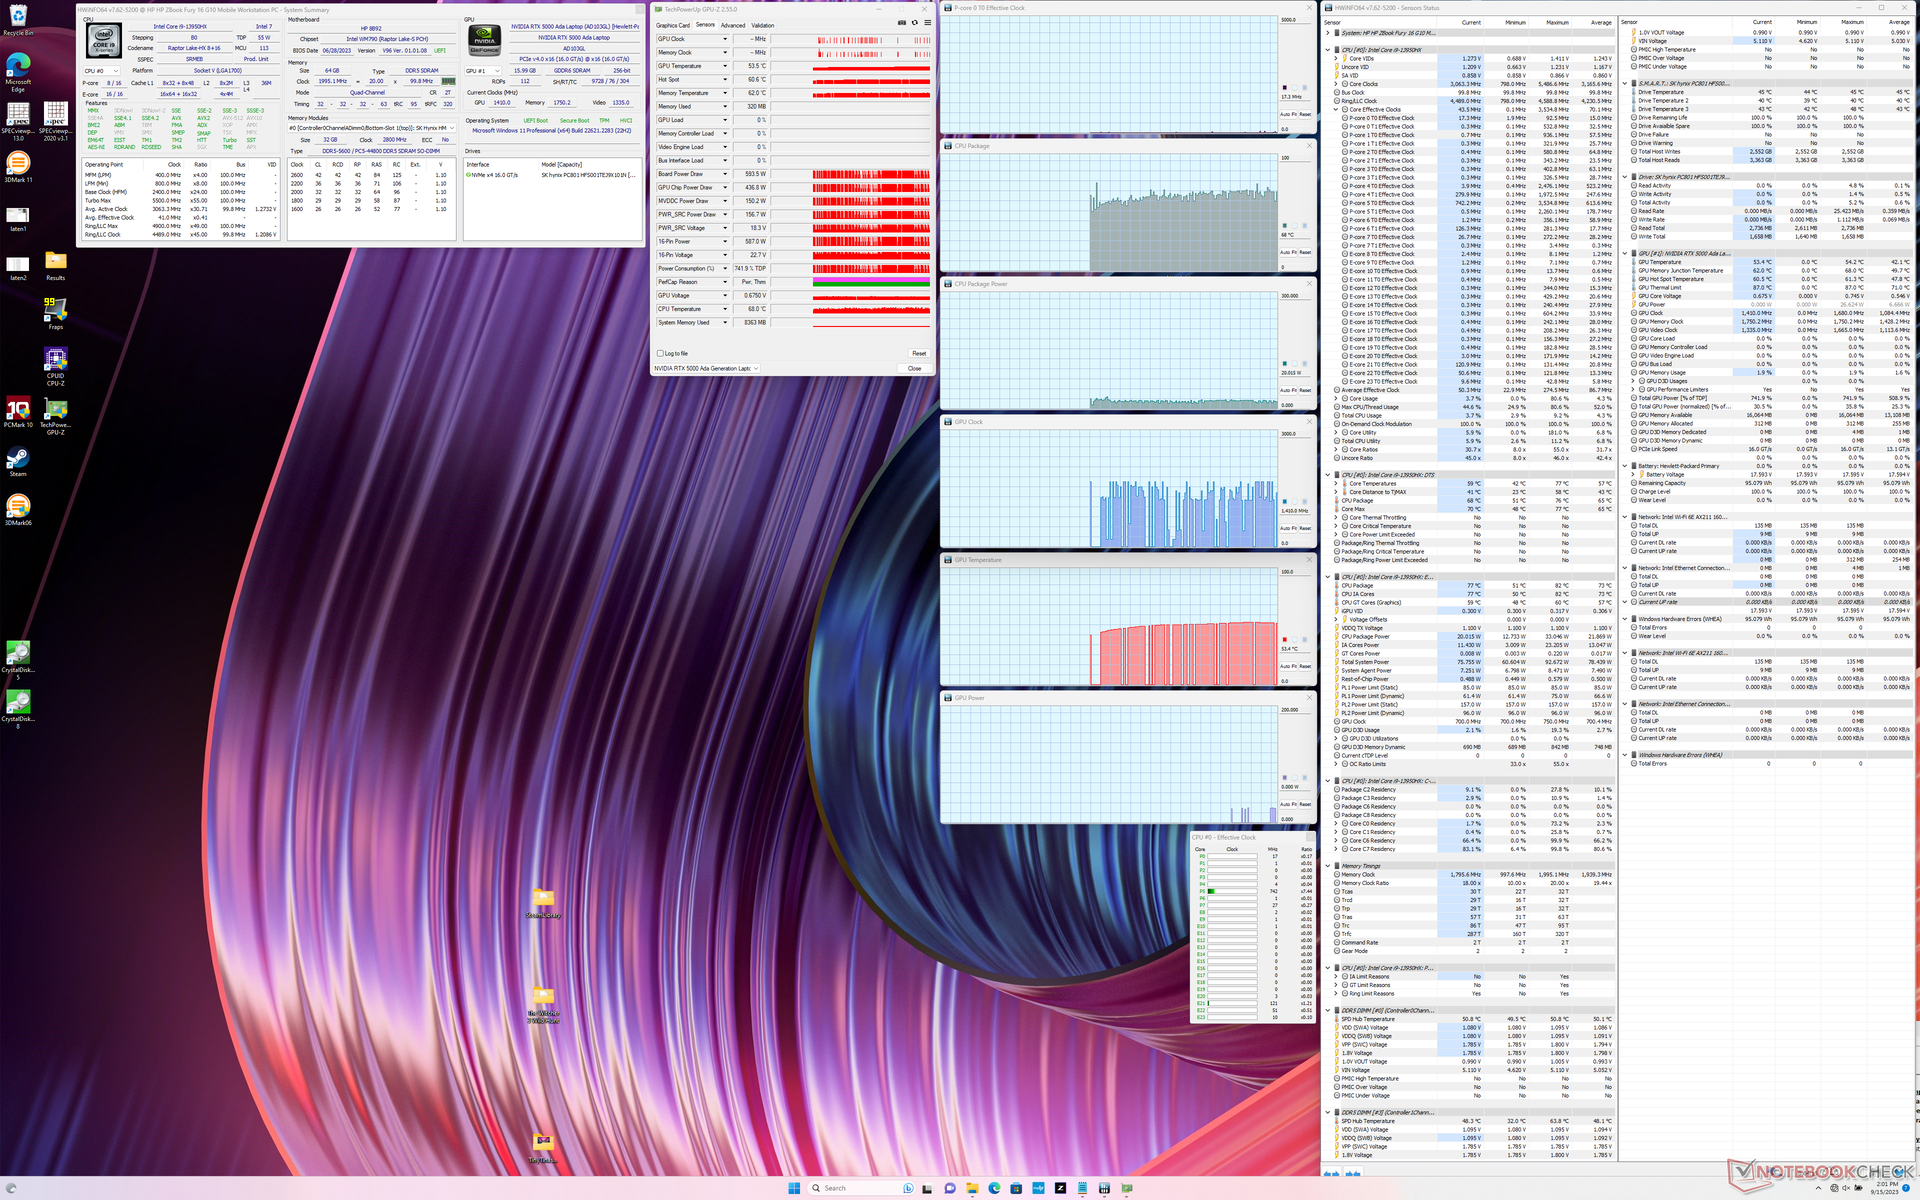
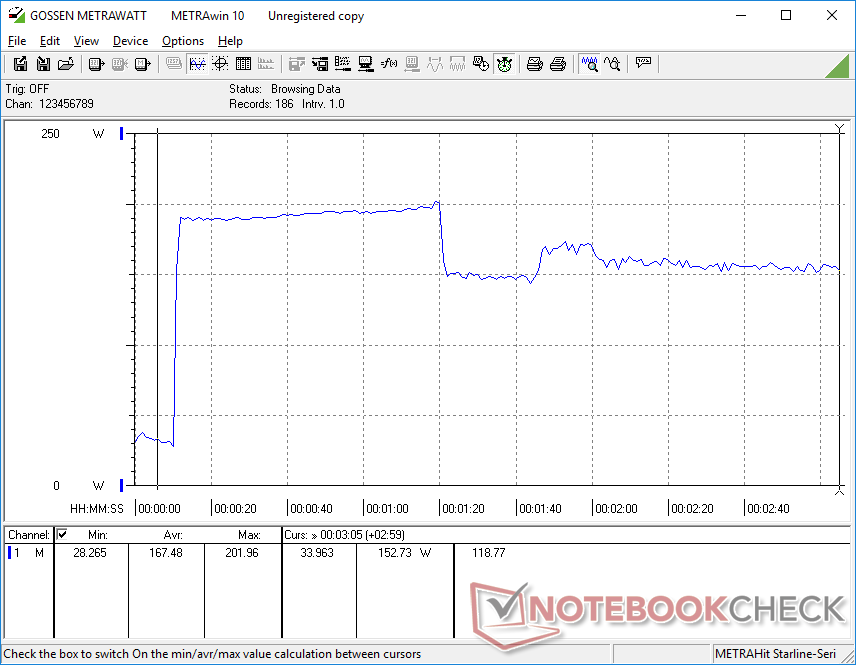
La fréquence d'horloge moyenne du CPU et la consommation d'énergie de la carte lors de l'exécution de Prime95 se stabilisent à 1,5 GHz et 48 W, respectivement, par rapport à 2,9 GHz et 115 W sur le Razer Blade 18 équipé du même CPU Core i9-13950HX. La température du cœur serait plus basse d'environ 8°C sur le HP, ce qui suggère que le Fury 16 G10 donne la priorité au contrôle de la température plutôt qu'à des performances plus rapides.
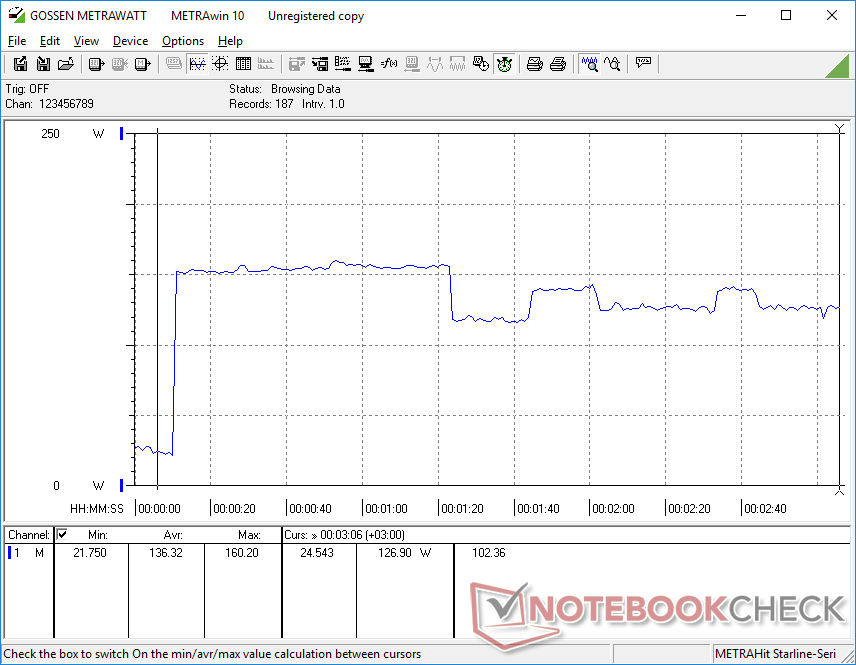
L'exécution en mode équilibré réduit les performances graphiques. Par exemple, les fréquences d'horloge du GPU et la consommation d'énergie sur Witcher 3 se stabilisent respectivement à 1845 MHz et 102 W, contre 1770 MHz et 94 W en mode équilibré. Quoi qu'il en soit, le système HP atteint des valeurs TGP réelles plus élevées que le même GPU dans le modèle Precision 5680 où la consommation n'est que de 72 W.
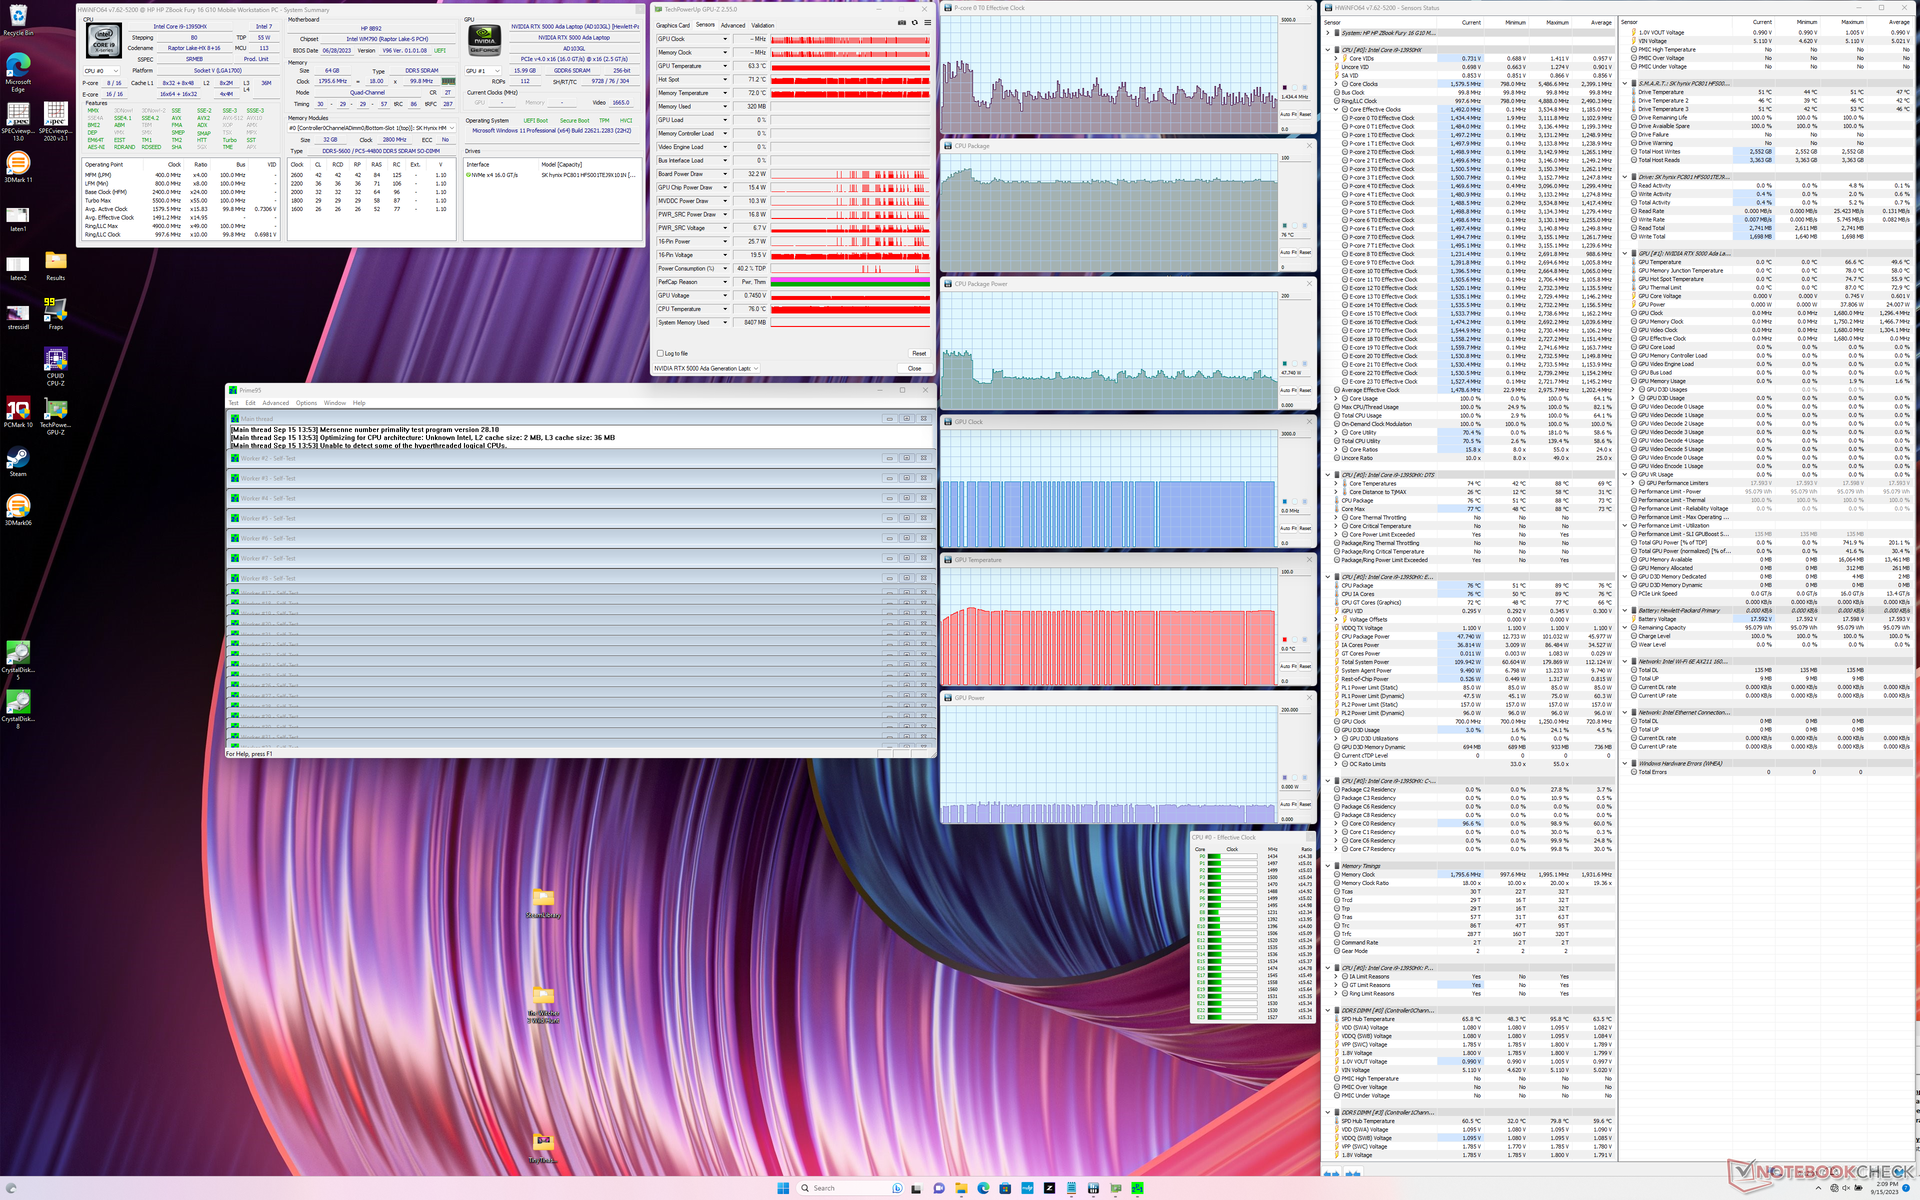
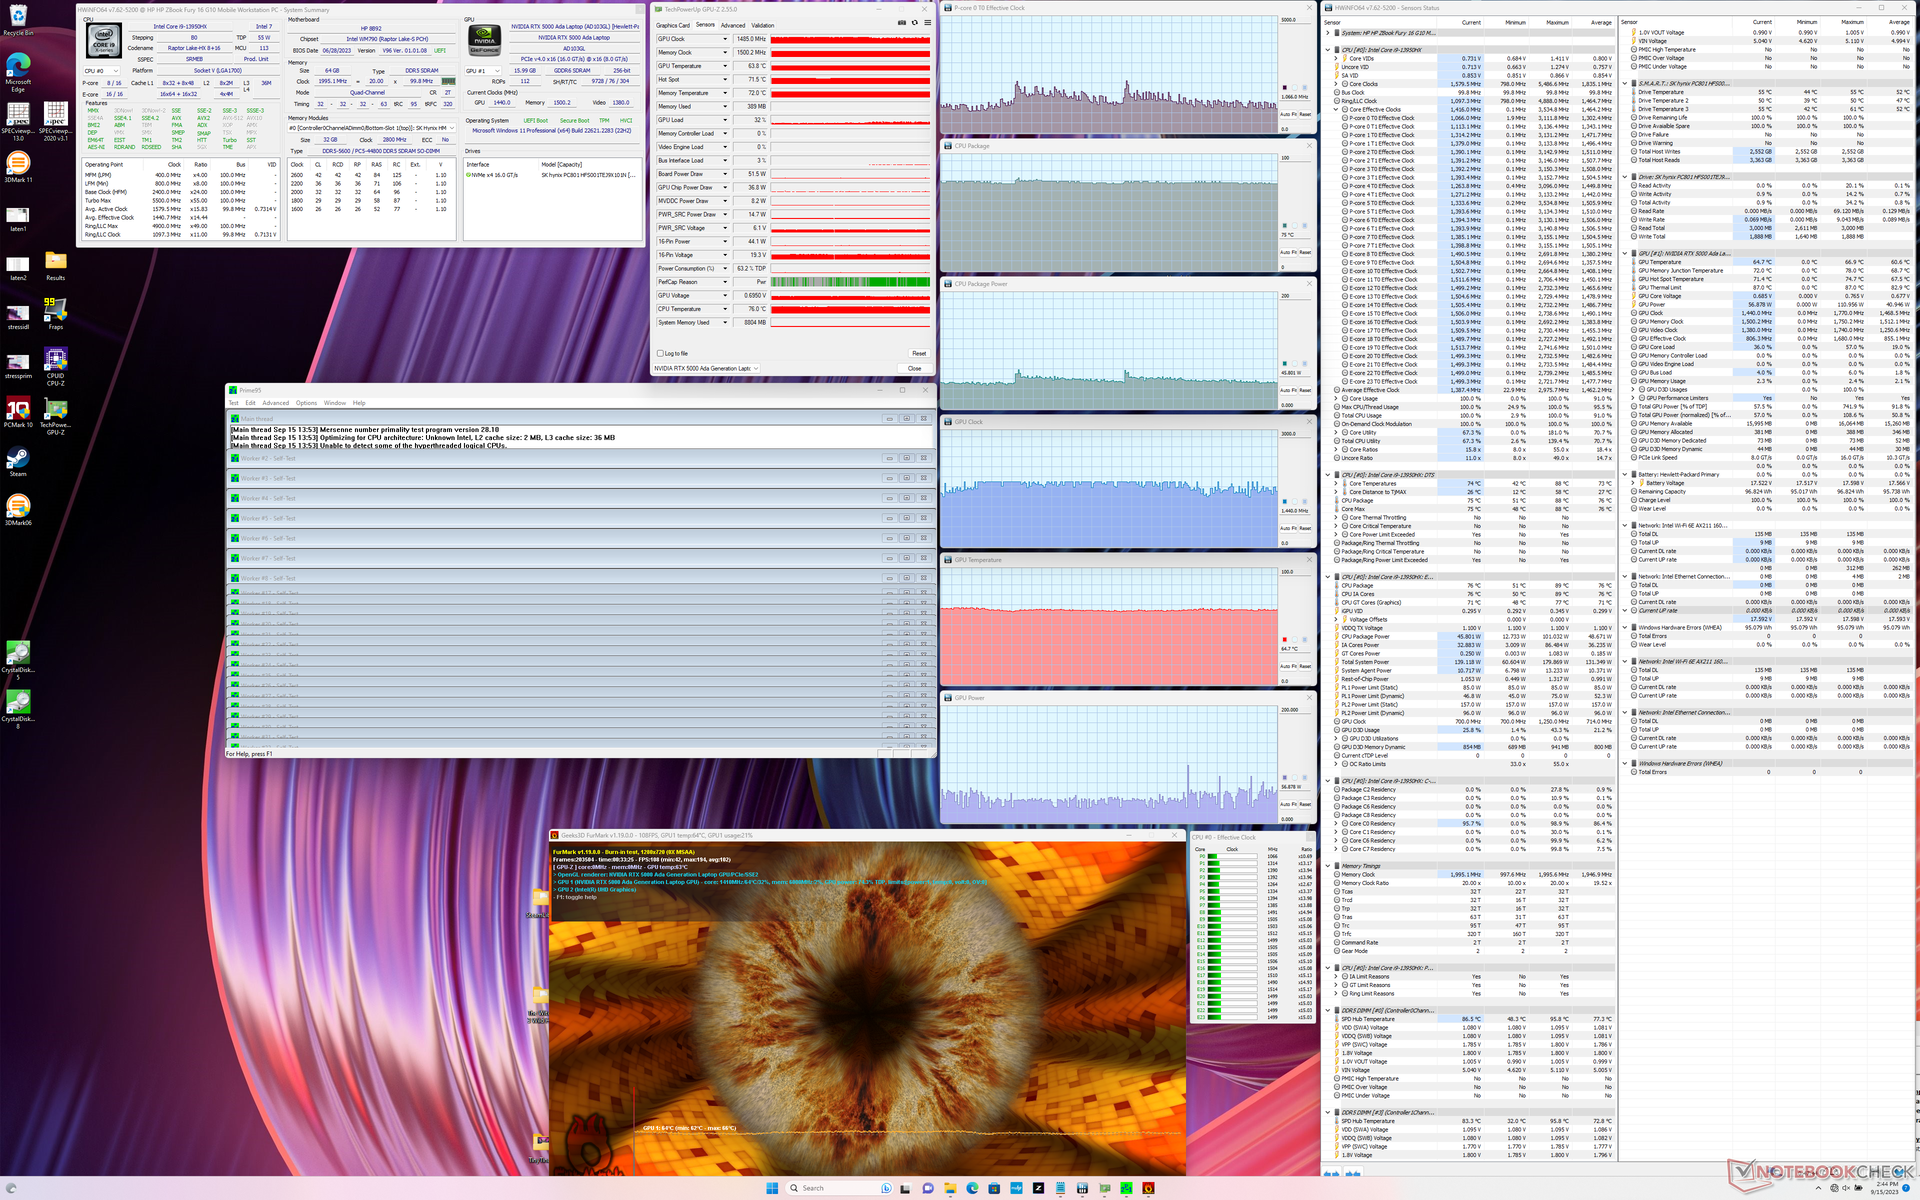

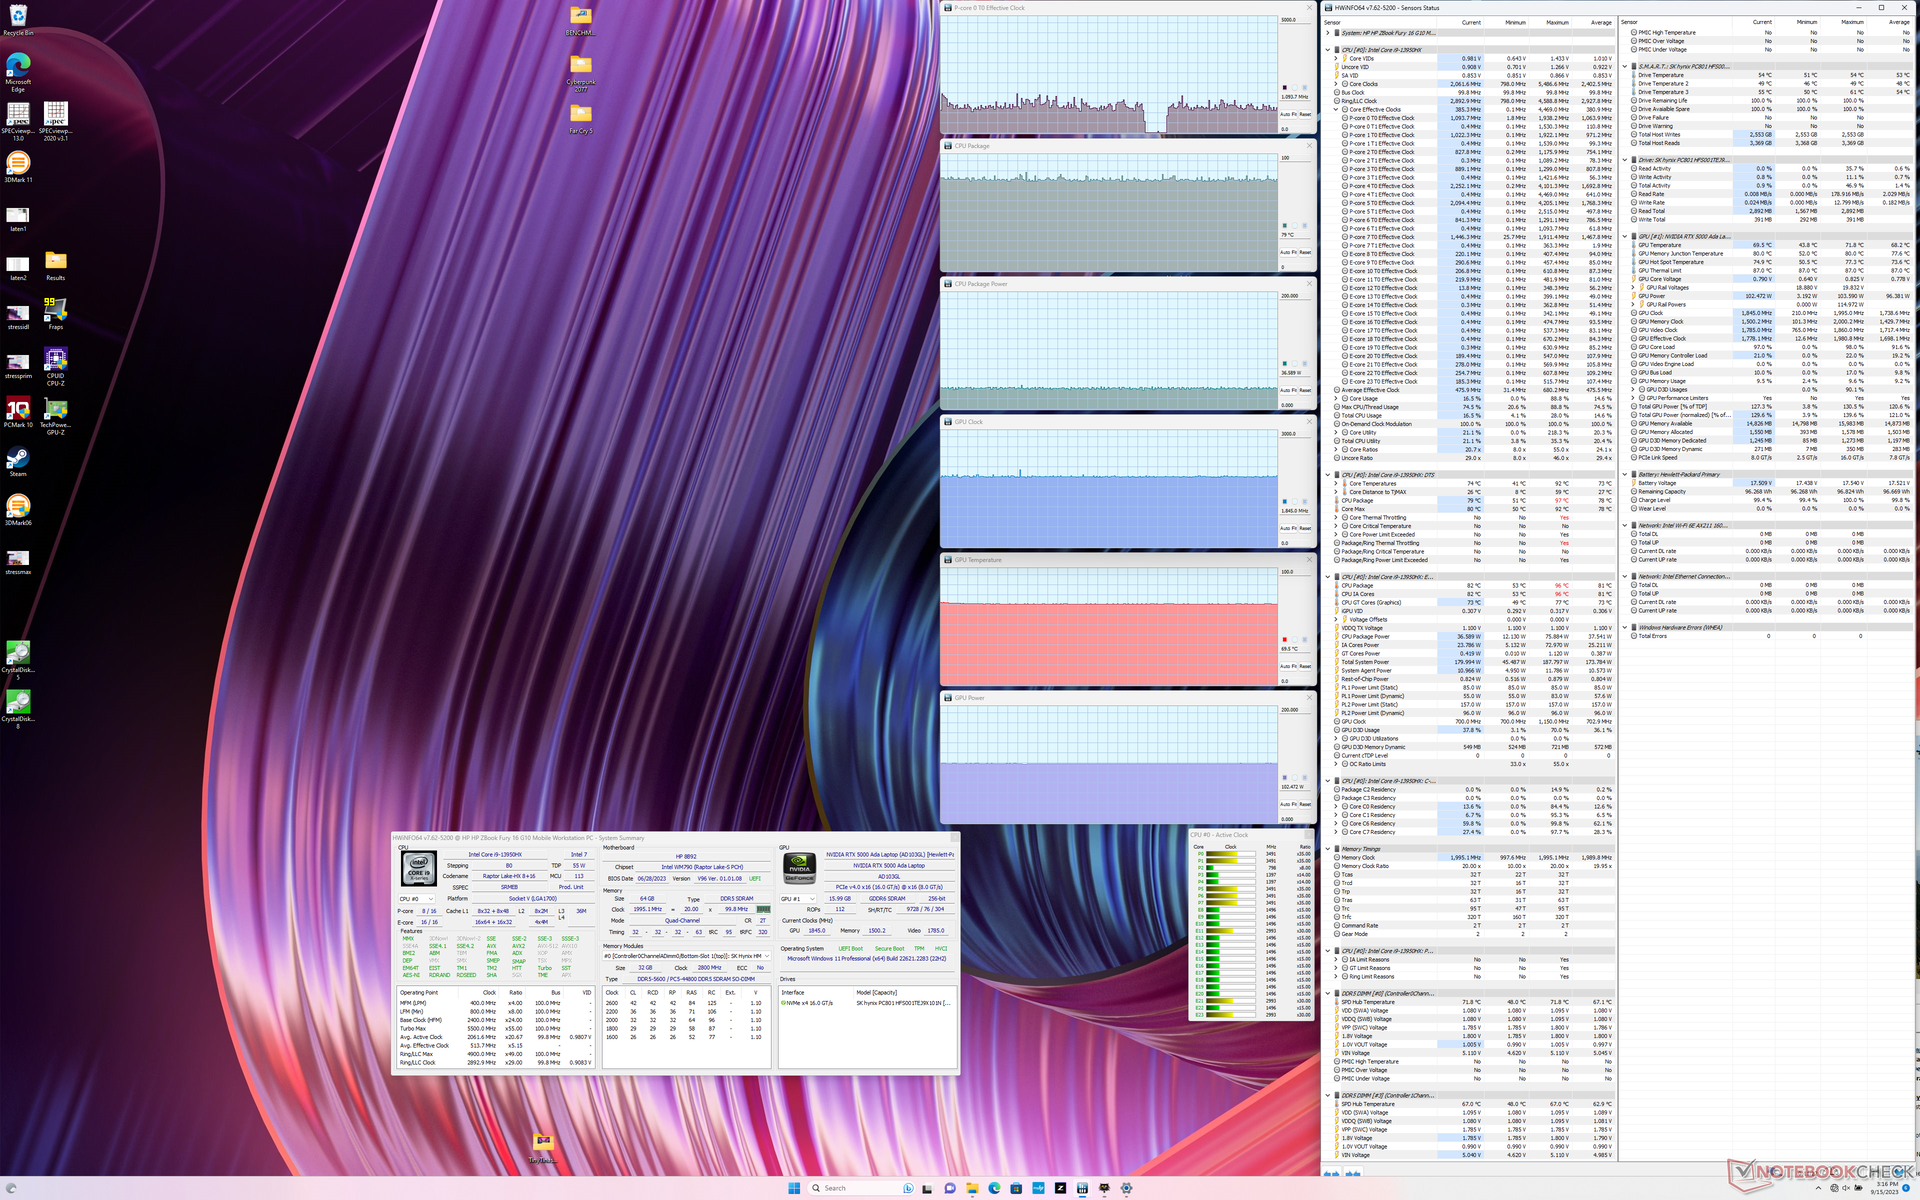
| Horloge du CPU (GHz) | Horloge du GPU (MHz) | Température moyenne du CPU (°C) | Température moyenne du GPU (°C) | |
| Système en veille | -- | -- | 68 | 54 |
| Prime95 Stress | ~1.7 | -- | 76 | 63 |
| Prime95 + FurMark Stress | ~1.1 | 1440 | 75 | 65 |
| Witcher 3 Stress(mode équilibré) | ~1.1 | 1770 | 78 | 70 |
| Witcher 3 Stress (mode Performance) | ~1.1 | 1845 | 79 | 70 |
Intervenants
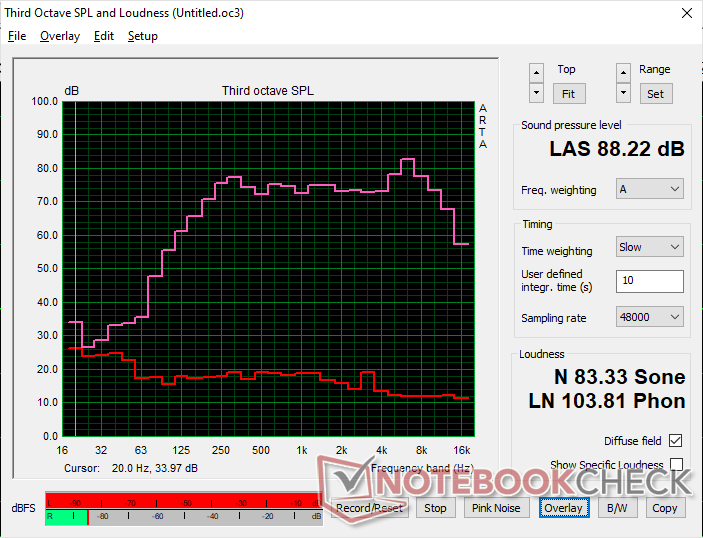
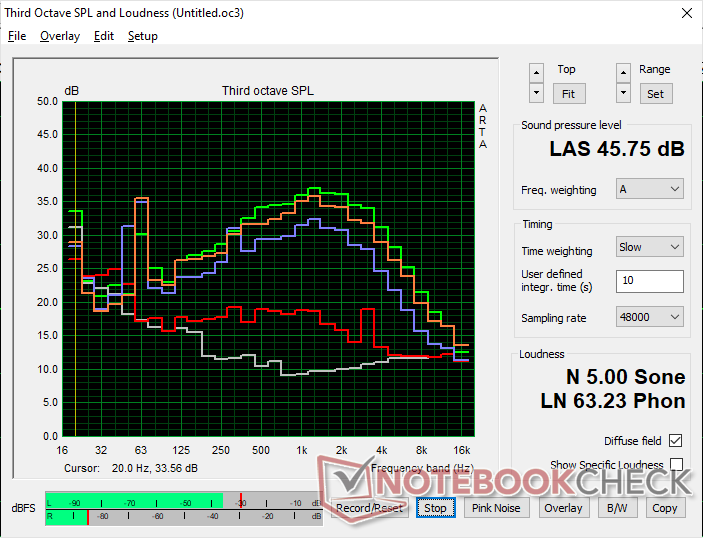
HP ZBook Fury 16 G10 analyse audio
(+) | les haut-parleurs peuvent jouer relativement fort (88.2# dB)
Basses 100 - 315 Hz
(±) | basse réduite - en moyenne 7.7% inférieure à la médiane
(±) | la linéarité des basses est moyenne (8.7% delta à la fréquence précédente)
Médiums 400 - 2000 Hz
(+) | médiane équilibrée - seulement 1.2% de la médiane
(+) | les médiums sont linéaires (3.3% delta à la fréquence précédente)
Aiguës 2 - 16 kHz
(+) | des sommets équilibrés - à seulement 2.8% de la médiane
(+) | les aigus sont linéaires (5.2% delta à la fréquence précédente)
Globalement 100 - 16 000 Hz
(+) | le son global est linéaire (8.6% différence à la médiane)
Par rapport à la même classe
» 2% de tous les appareils testés de cette catégorie étaient meilleurs, 1% similaires, 96% pires
» Le meilleur avait un delta de 7%, la moyenne était de 17%, le pire était de 35%.
Par rapport à tous les appareils testés
» 2% de tous les appareils testés étaient meilleurs, 1% similaires, 97% pires
» Le meilleur avait un delta de 4%, la moyenne était de 23%, le pire était de 134%.
Apple MacBook Pro 16 2021 M1 Pro analyse audio
(+) | les haut-parleurs peuvent jouer relativement fort (84.7# dB)
Basses 100 - 315 Hz
(+) | bonne basse - seulement 3.8% loin de la médiane
(+) | les basses sont linéaires (5.2% delta à la fréquence précédente)
Médiums 400 - 2000 Hz
(+) | médiane équilibrée - seulement 1.3% de la médiane
(+) | les médiums sont linéaires (2.1% delta à la fréquence précédente)
Aiguës 2 - 16 kHz
(+) | des sommets équilibrés - à seulement 1.9% de la médiane
(+) | les aigus sont linéaires (2.7% delta à la fréquence précédente)
Globalement 100 - 16 000 Hz
(+) | le son global est linéaire (4.6% différence à la médiane)
Par rapport à la même classe
» 0% de tous les appareils testés de cette catégorie étaient meilleurs, 0% similaires, 100% pires
» Le meilleur avait un delta de 5%, la moyenne était de 17%, le pire était de 45%.
Par rapport à tous les appareils testés
» 0% de tous les appareils testés étaient meilleurs, 0% similaires, 100% pires
» Le meilleur avait un delta de 4%, la moyenne était de 23%, le pire était de 134%.
Gestion de l'énergie
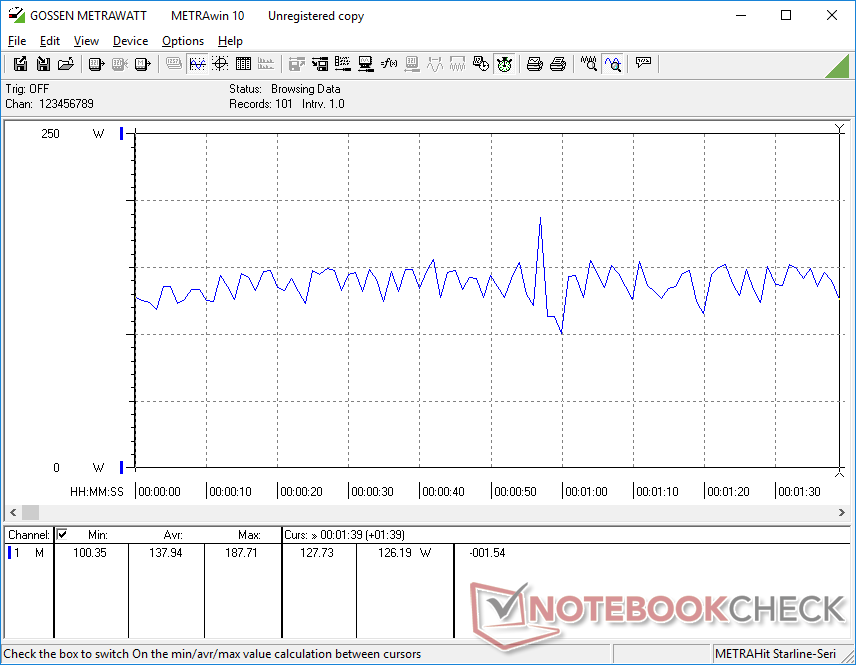
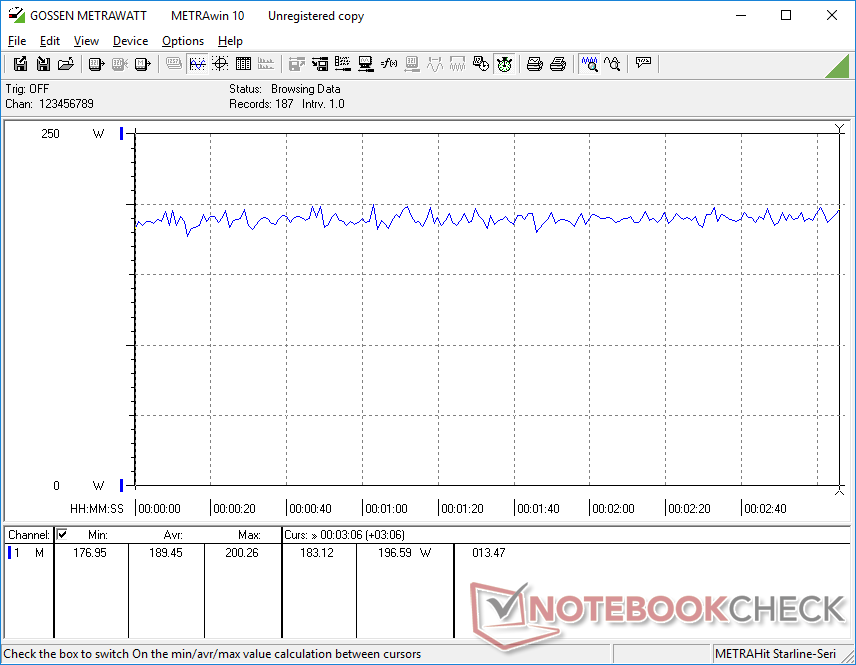
Consommation électrique
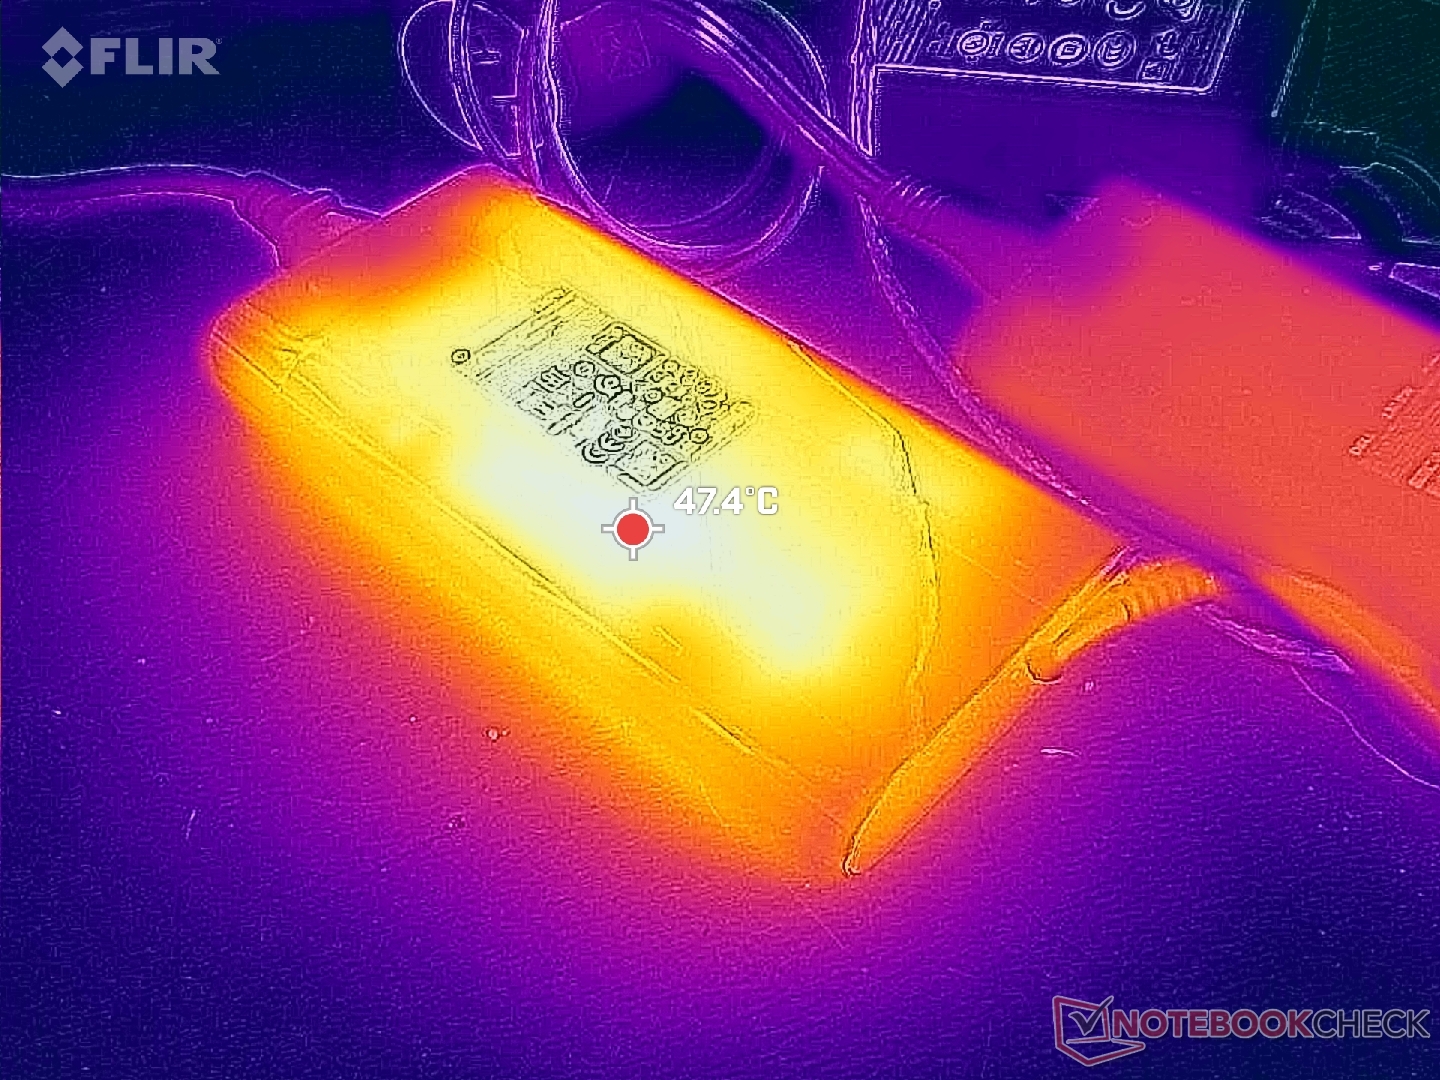
La consommation d'énergie en charge reste à peu près la même que sur le modèle de l'année dernière, malgré les améliorations du CPU et du GPU pour des performances par watt beaucoup plus élevées. Elle est aussi généralement plus élevée que sur le Precision 5680 en raison des objectifs TGP plus élevés du modèle HP.
Il est à noter que notre Fury 16 G10 consomme nettement plus d'énergie que le modèle Precision 5680 configuré de la même manière lorsqu'il exécute des charges élevées telles que des jeux, principalement en raison des objectifs de puissance maximale plus élevés du modèle HP. Le HP est livré avec un adaptateur secteur de 230 W alors que le Dell serait livré avec un adaptateur secteur USB-C plus petit de 165 W à la place.
| Éteint/en veille | |
| Au repos | |
| Fortement sollicité |
|
Légende:
min: | |
| HP ZBook Fury 16 G10 i9-13950HX, RTX 5000 Ada Generation Laptop, SK hynix PC801 HFS001TEJ9X101N, IPS, 3840x2400, 16" | HP ZBook Fury 16 G9 i9-12950HX, RTX A5500 Laptop GPU, Micron 3400 1TB MTFDKBA1T0TFH, IPS, 3840x2400, 16" | Dell Precision 5000 5680 i9-13900H, RTX 5000 Ada Generation Laptop, 2x SK hynix PC801 HFS512GEJ9X101N RAID 0, OLED, 3840x2400, 16" | Lenovo ThinkPad P16 G1 RTX A5500 i9-12950HX, RTX A5500 Laptop GPU, WDC PC SN810 2TB, IPS, 3840x2400, 16" | MSI CreatorPro Z16P B12UKST i7-12700H, RTX A3000 Laptop GPU, Samsung PM9A1 MZVL21T0HCLR, IPS, 2560x1600, 16" | Asus ProArt StudioBook 16 W7600H5A-2BL2 W-11955M, RTX A5000 Laptop GPU, 2x Micron 2300 2TB MTFDHBA2T0TDV (RAID 0), OLED, 3840x2400, 16" | |
|---|---|---|---|---|---|---|
| Power Consumption | -24% | 28% | -9% | 22% | 18% | |
| Idle Minimum * (Watt) | 15.3 | 19.5 -27% | 8 48% | 7.5 51% | 10.8 29% | 12.4 19% |
| Idle Average * (Watt) | 18.2 | 29 -59% | 10.4 43% | 20.1 -10% | 16.3 10% | 16.5 9% |
| Idle Maximum * (Watt) | 28 | 40.7 -45% | 30.5 -9% | 40 -43% | 16.9 40% | 25 11% |
| Load Average * (Watt) | 137.9 | 142.1 -3% | 75.4 45% | 137 1% | 111.7 19% | 132 4% |
| Witcher 3 ultra * (Watt) | 189.4 | 188.6 -0% | 134 29% | 208 -10% | 152.1 20% | 132 30% |
| Load Maximum * (Watt) | 202 | 224.4 -11% | 175 13% | 285.9 -42% | 177.4 12% | 134 34% |
* ... Moindre est la valeur, meilleures sont les performances
Power Consumption Witcher 3 / Stresstest
Power Consumption external Monitor
Autonomie de la batterie
L'autonomie générale n'est pas plus courte que sur le modèle de l'année dernière malgré l'augmentation des performances du CPU, du GPU et du taux de rafraîchissement de l'écran. Nous avons pu enregistrer un peu plus de 7 heures de navigation WLAN en mode équilibré, soit près d'une heure de plus que sur le Fury 16 G9 de l'année dernière.
L'adaptateur secteur fourni permet de recharger l'appareil en moins de 90 minutes, de l'état vide à l'état plein. Le système peut également être chargé via des adaptateurs USB-C tiers, bien que plus lentement.
| HP ZBook Fury 16 G10 i9-13950HX, RTX 5000 Ada Generation Laptop, 95 Wh | HP ZBook Fury 16 G9 i9-12950HX, RTX A5500 Laptop GPU, 95 Wh | Dell Precision 5000 5680 i9-13900H, RTX 5000 Ada Generation Laptop, 98 Wh | Lenovo ThinkPad P16 G1 RTX A5500 i9-12950HX, RTX A5500 Laptop GPU, 94 Wh | MSI CreatorPro Z16P B12UKST i7-12700H, RTX A3000 Laptop GPU, 90 Wh | Asus ProArt StudioBook 16 W7600H5A-2BL2 W-11955M, RTX A5000 Laptop GPU, 90 Wh | |
|---|---|---|---|---|---|---|
| Autonomie de la batterie | -18% | 36% | -21% | -21% | -32% | |
| WiFi v1.3 (h) | 7.3 | 6 -18% | 9.9 36% | 5.8 -21% | 5.8 -21% | 5 -32% |
| Reader / Idle (h) | 5.3 | 17.9 | ||||
| Load (h) | 1.2 | 1.7 | ||||
| H.264 (h) | 1.8 | |||||
| Witcher 3 ultra (h) | 1.6 |
Points positifs
Points négatifs
Verdict - La station de travail HP à acheter pour les chasseurs de graphiques
Parfois, les mises à jour des processeurs d'une année sur l'autre sont relativement mineures. D'autres fois, en revanche, elles peuvent être très importantes. Le ZBook Fury 16 G10 fait partie de cette dernière catégorie, car son processeur de 13e génération et ses options de GPU Nvidia RTX Ada peuvent offrir des performances nettement supérieures à celles du ZBook Fury 16 G9, en particulier en ce qui concerne les graphismes. Si vous appréciez la RAM ECC et l'optimisation de la puissance du GPU avec des limites TGP plus élevées, alors le Fury 16 G10 vaut absolument la peine d'être considéré par rapport à n'importe quelle autre station de travail de 16 pouces du moment, y compris les modèles Precision 5680 qui propose les mêmes options de GPU mais avec des objectifs TGP plus bas.
Le ZBook Fury 16 G10 maximise la puissance du GPU pour devenir l'une des stations de travail mobiles les plus rapides en matière de graphisme. Cependant, cela semble se faire au détriment des performances du SSD et du CPU.
Quelques problèmes empêchent le HP d'être "parfait". Le SSD est encore étranglé et le CPU est plus lent que prévu, même en mode Performance. Ces problèmes seraient plus faciles à pardonner sur des stations de travail plus minces ou plus petites, mais le Fury 16 G10 est tout sauf mince et léger.
Prix et disponibilité
HP livre maintenant son ZBook Fury 16 G10 à partir de 2700 USD pour la configuration de base et jusqu'à plus de 4200 USD lorsqu'il est entièrement configuré avec un Core i9 et une RTX 5000 Ada.
HP ZBook Fury 16 G10
- 09/23/2023 v7 (old)
Allen Ngo
Transparency
La sélection des appareils à examiner est effectuée par notre équipe éditoriale. L'échantillon de test a été prêté à l'auteur par le fabricant ou le détaillant pour les besoins de cet examen. Le prêteur n'a pas eu d'influence sur cette évaluation et le fabricant n'a pas reçu de copie de cette évaluation avant sa publication. Il n'y avait aucune obligation de publier cet article. En tant que média indépendant, Notebookcheck n'est pas soumis à l'autorité des fabricants, des détaillants ou des éditeurs.
Voici comment Notebookcheck teste
Chaque année, Notebookcheck examine de manière indépendante des centaines d'ordinateurs portables et de smartphones en utilisant des procédures standardisées afin de garantir que tous les résultats sont comparables. Nous avons continuellement développé nos méthodes de test depuis environ 20 ans et avons établi des normes industrielles dans le processus. Dans nos laboratoires de test, des équipements de mesure de haute qualité sont utilisés par des techniciens et des rédacteurs expérimentés. Ces tests impliquent un processus de validation en plusieurs étapes. Notre système d'évaluation complexe repose sur des centaines de mesures et de points de référence bien fondés, ce qui garantit l'objectivité.Price comparison

