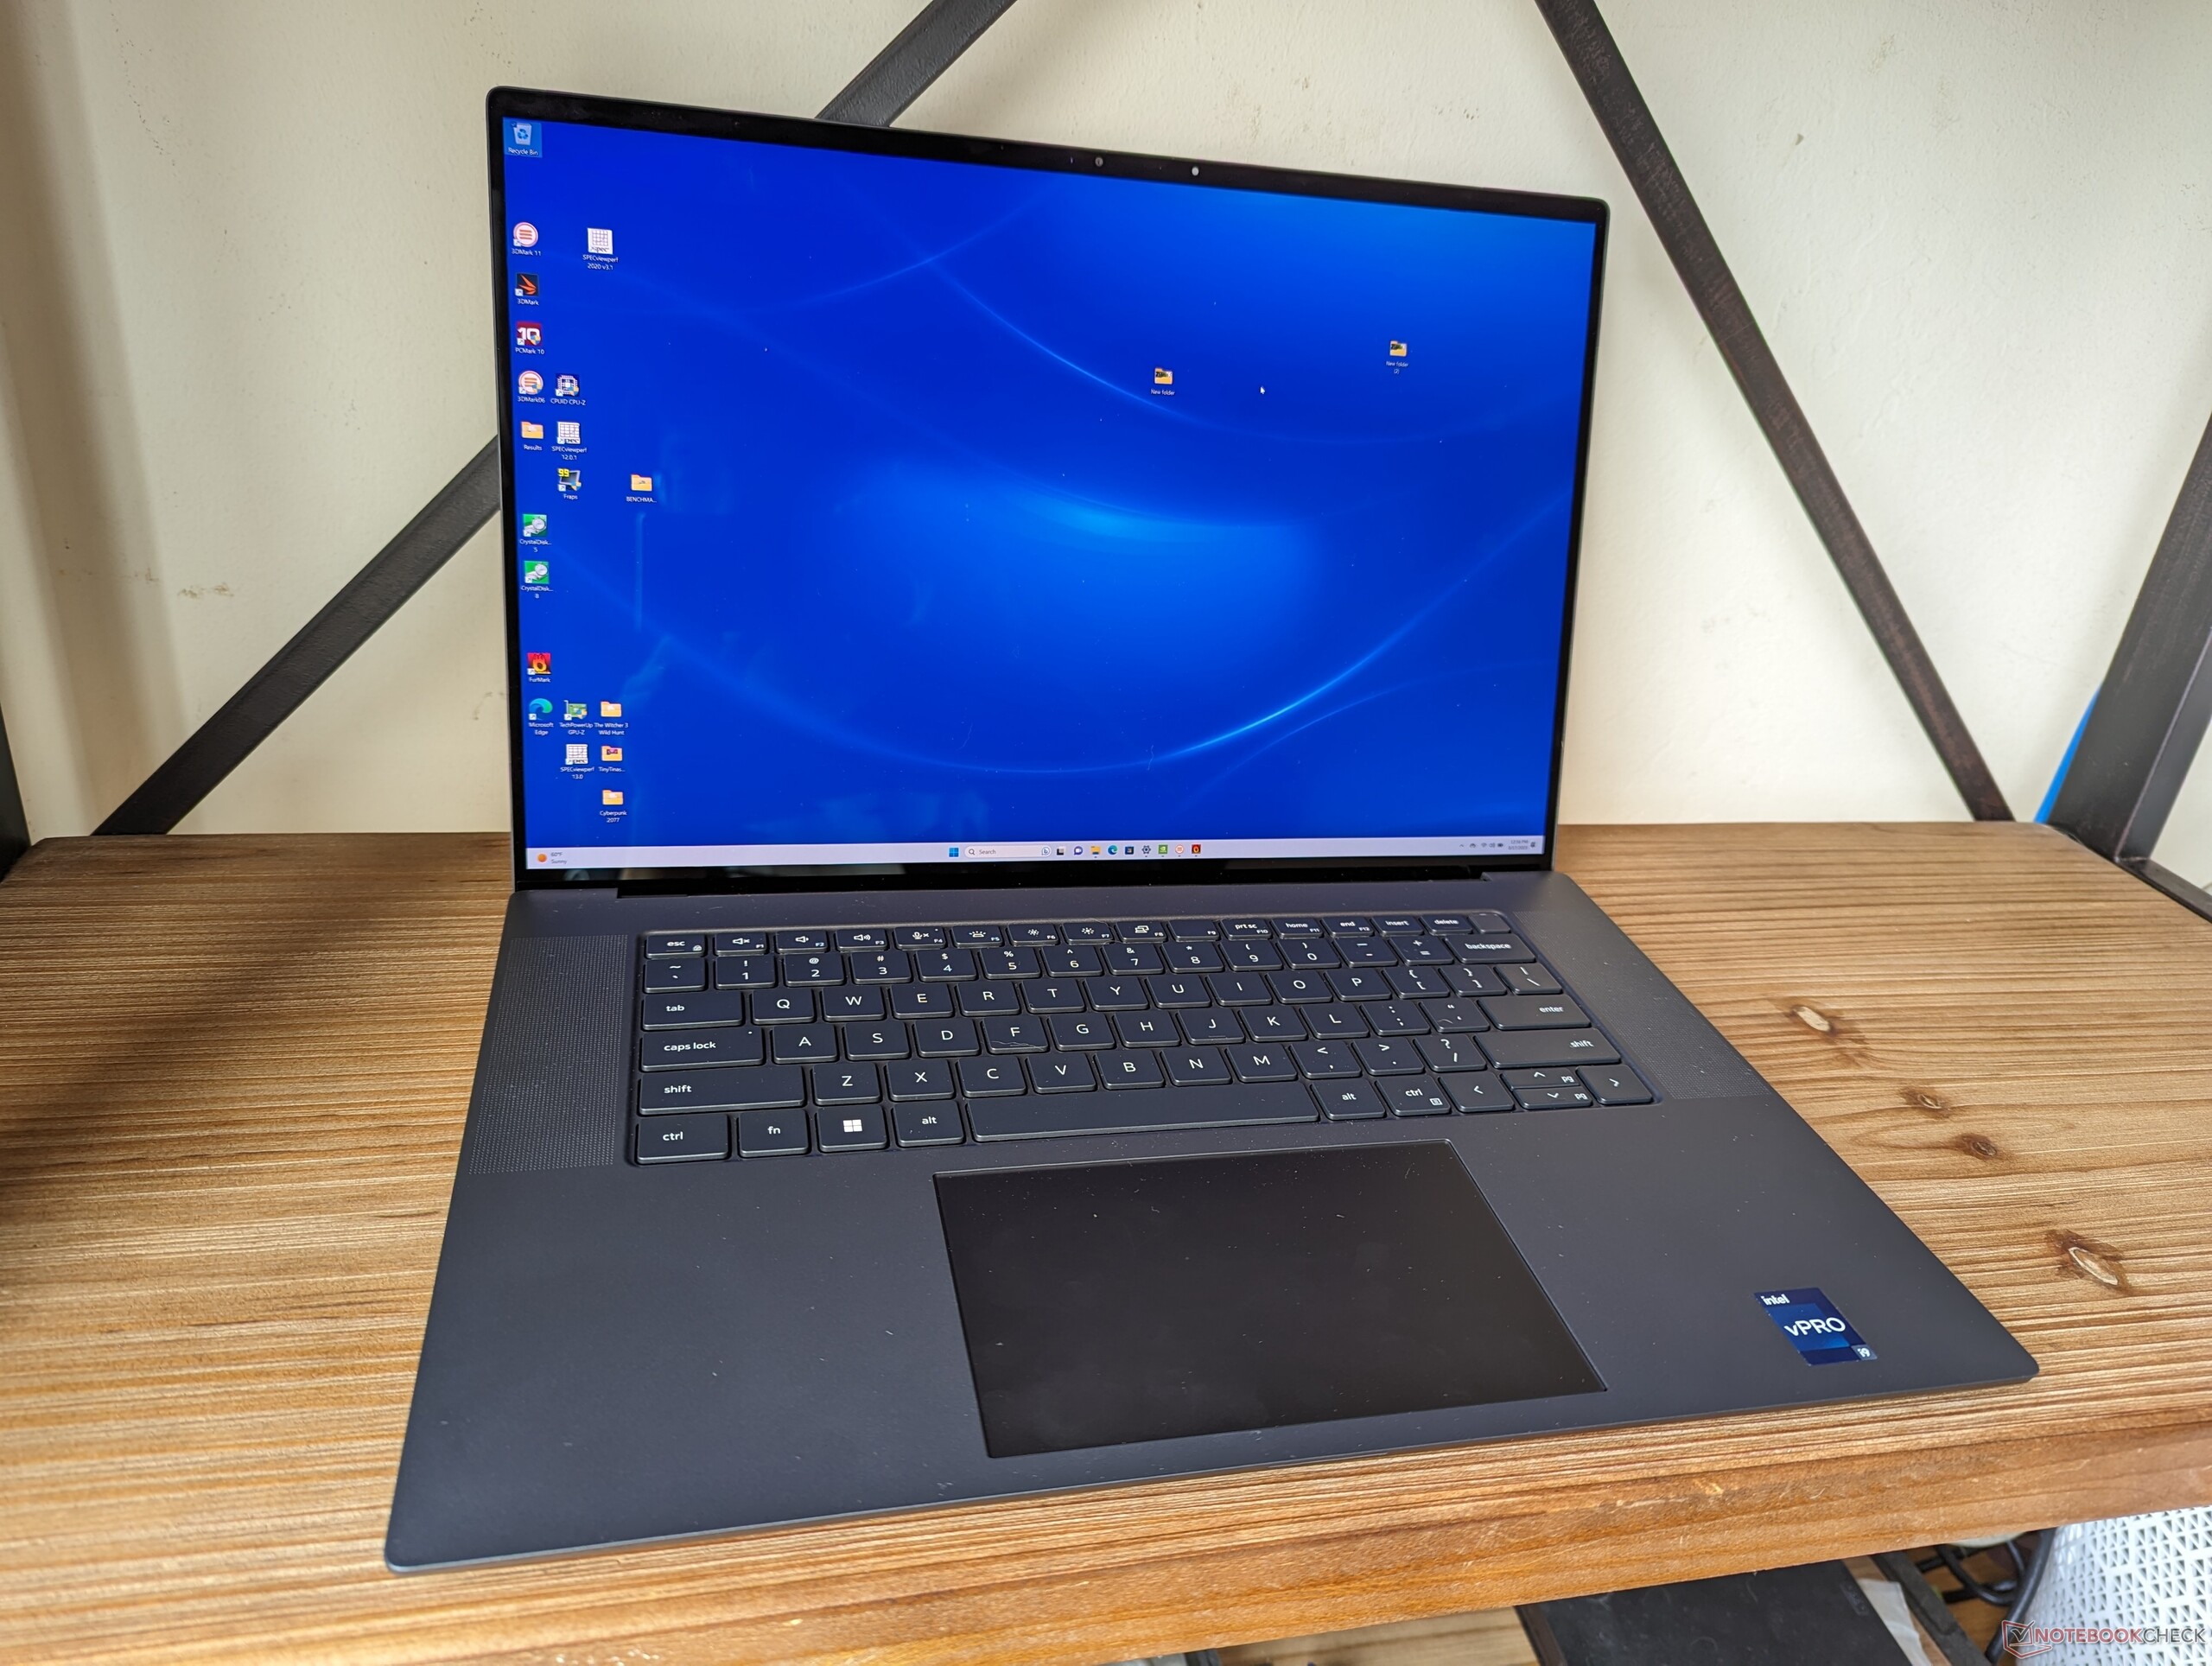
Test du Dell Precision 5680 : Ada Lovelace domine les stations de travail

Le Precision 5680 est le premier modèle 16 pouces de la série Precision 5000 et vient compléter le modèle 14 pouces existant, le Precision 5470de 14 pouces, le Precision 5560et 17 pouces Precision 5750. Il s'agit d'une station de travail mobile haut de gamme, plus fine et plus légère qu'un modèle 7000 Precision modèle 7000 mais avec moins de fonctions auxiliaires intégrées.
Notre unité de test est une configuration haut de gamme avec le CPU Core i9-13900H Raptor Lake-H de 13ème génération, un GPU Nvidia RTX 5000 de 75 W et un écran tactile OLED 2400p pour un prix d'environ 6500 USD. Des SKU moins chers sont disponibles avec le Core i5-13600H, sans GPU discret, et un écran IPS 1200p pour un prix de départ plus bas d'environ 2490 USD.
Il s'agit également de l'une des premières stations de travail à être livrée avec le GPU mobile RTX 5000 Ada Lovelace, qu'il ne faut pas confondre avec le GPU Turing Quadro RTX 5000 ou la RTX A5000.
Les concurrents dans ce domaine comprennent d'autres stations de travail de 16 pouces comme leHP ZBook Fury 16 G9,Lenovo ThinkPad P16 G1,MSI CreatorPro Z16Pou la série Asus ProArt StudioBook 16 series.
Plus d'avis sur Dell :
Comparaison avec les concurrents potentiels
Note | Date | Modèle | Poids | Épaisseur | Taille | Résolution | Prix |
|---|---|---|---|---|---|---|---|
| 89 % v7 (old) | 08/23 | Dell Precision 5000 5680 i9-13900H, RTX 5000 Ada Generation Laptop | 2.3 kg | 22.17 mm | 16.00" | 3840x2400 | |
| 89.1 % v7 (old) | 12/22 | Dell Precision 7000 7670 Performance i9-12950HX, RTX A5500 Laptop GPU | 2.8 kg | 25.95 mm | 16.00" | 3840x2400 | |
| 91 % v7 (old) | 06/23 | HP ZBook Fury 16 G9 i9-12950HX, RTX A5500 Laptop GPU | 2.6 kg | 28.5 mm | 16.00" | 3840x2400 | |
| 91 % v7 (old) | 02/23 | Lenovo ThinkPad P16 G1 RTX A5500 i9-12950HX, RTX A5500 Laptop GPU | 3 kg | 30.23 mm | 16.00" | 3840x2400 | |
| 84.3 % v7 (old) | 11/22 | MSI CreatorPro Z16P B12UKST i7-12700H, RTX A3000 Laptop GPU | 2.4 kg | 19 mm | 16.00" | 2560x1600 | |
| 89.6 % v7 (old) | 01/23 | Asus ExpertBook B6 Flip B6602FC2 i9-12950HX, RTX A2000 Laptop GPU | 2.8 kg | 27.2 mm | 16.00" | 2560x1600 |
Boîtier - XPS Roots
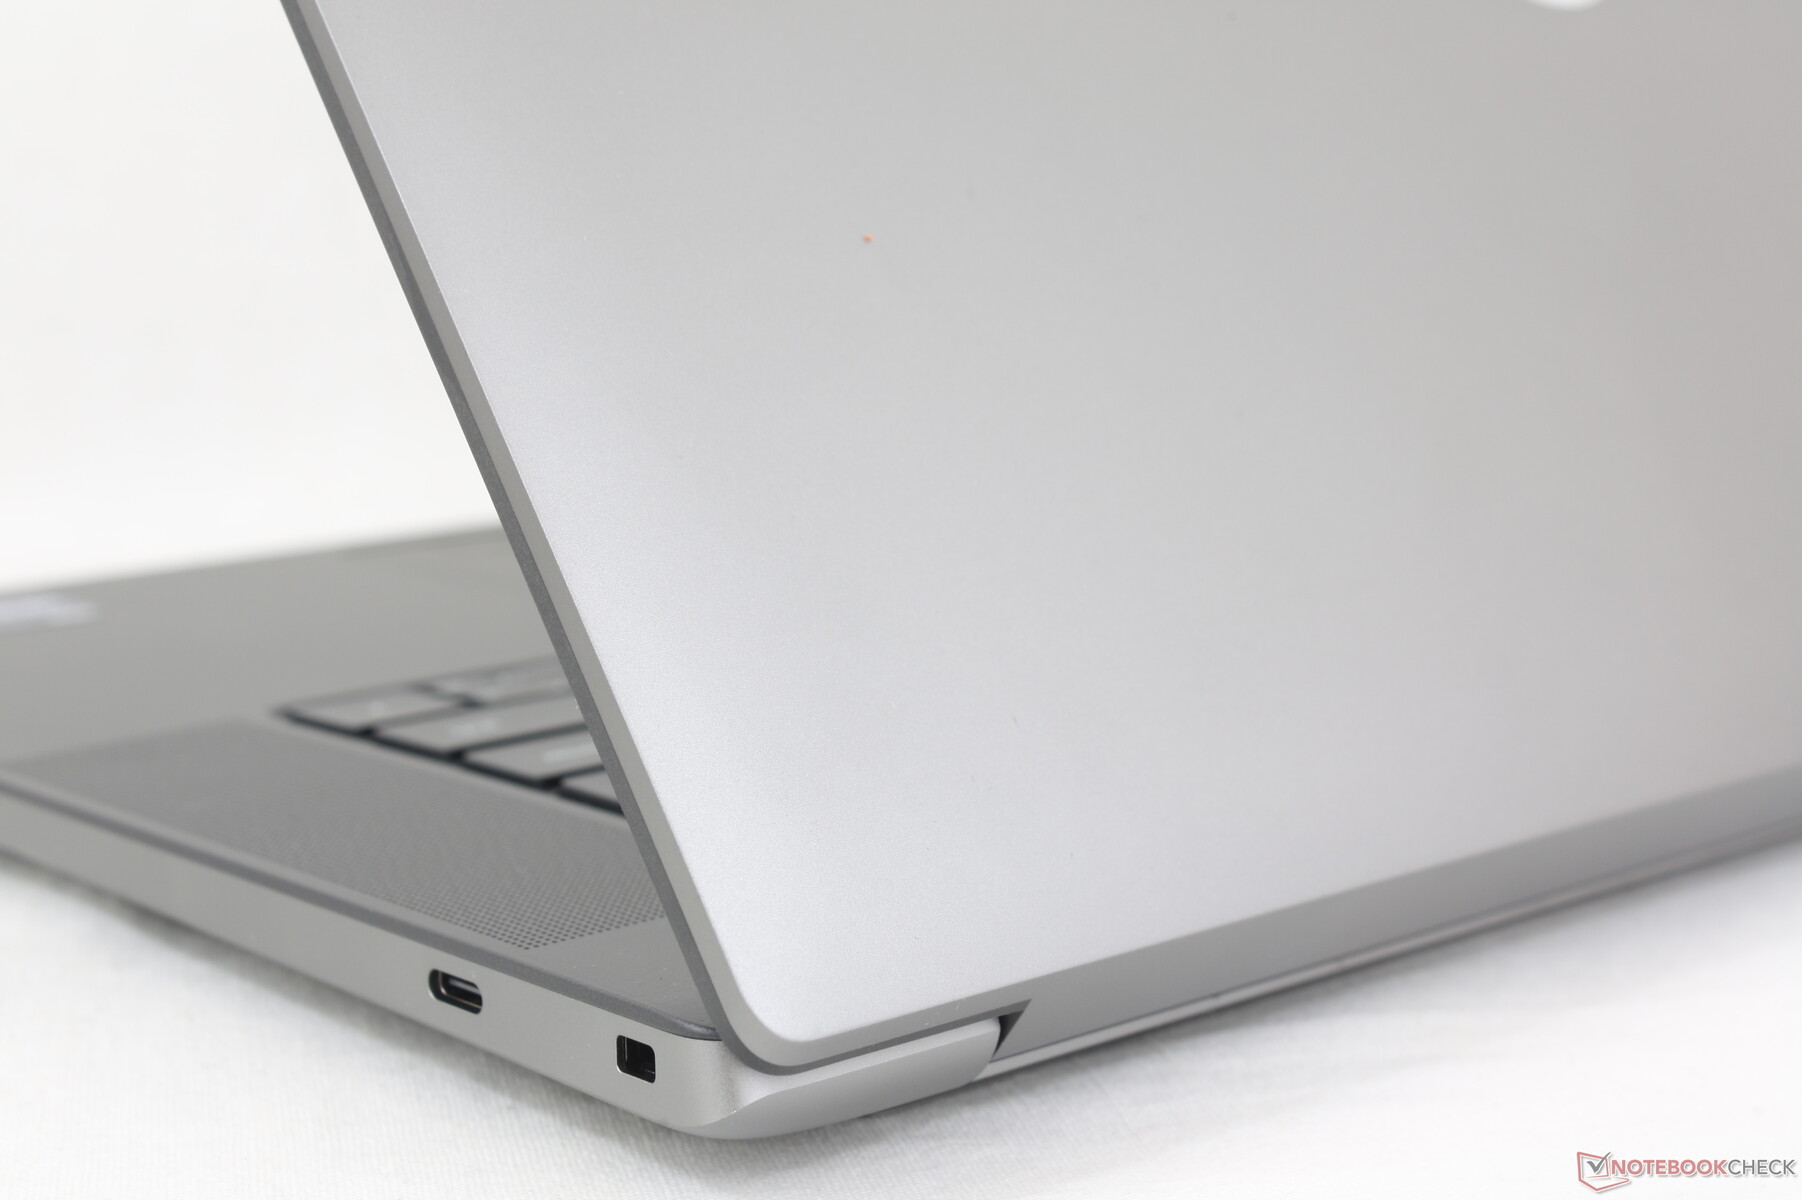
L'inspiration pour le design du Precision 5680 est évidente puisqu'il s'agit essentiellement de la version 16 pouces du 15 pouces XPS 15 de 15 pouces et du XPS 17. Si vous avez déjà utilisé un modèle XPS, le Precision 5680 devrait vous sembler immédiatement familier. Il semble précéder un hypothétique "XPS 16" et nous ne serions pas surpris de voir un tel modèle dans un avenir proche avec un châssis basé sur le Precision 5680.
La qualité de construction se compare favorablement à des alternatives comme le ZBook Fury 16 G9 ou leCreatorPro Z16P qui sont également constitués principalement d'alliages métalliques, ce qui donne une bonne première impression.
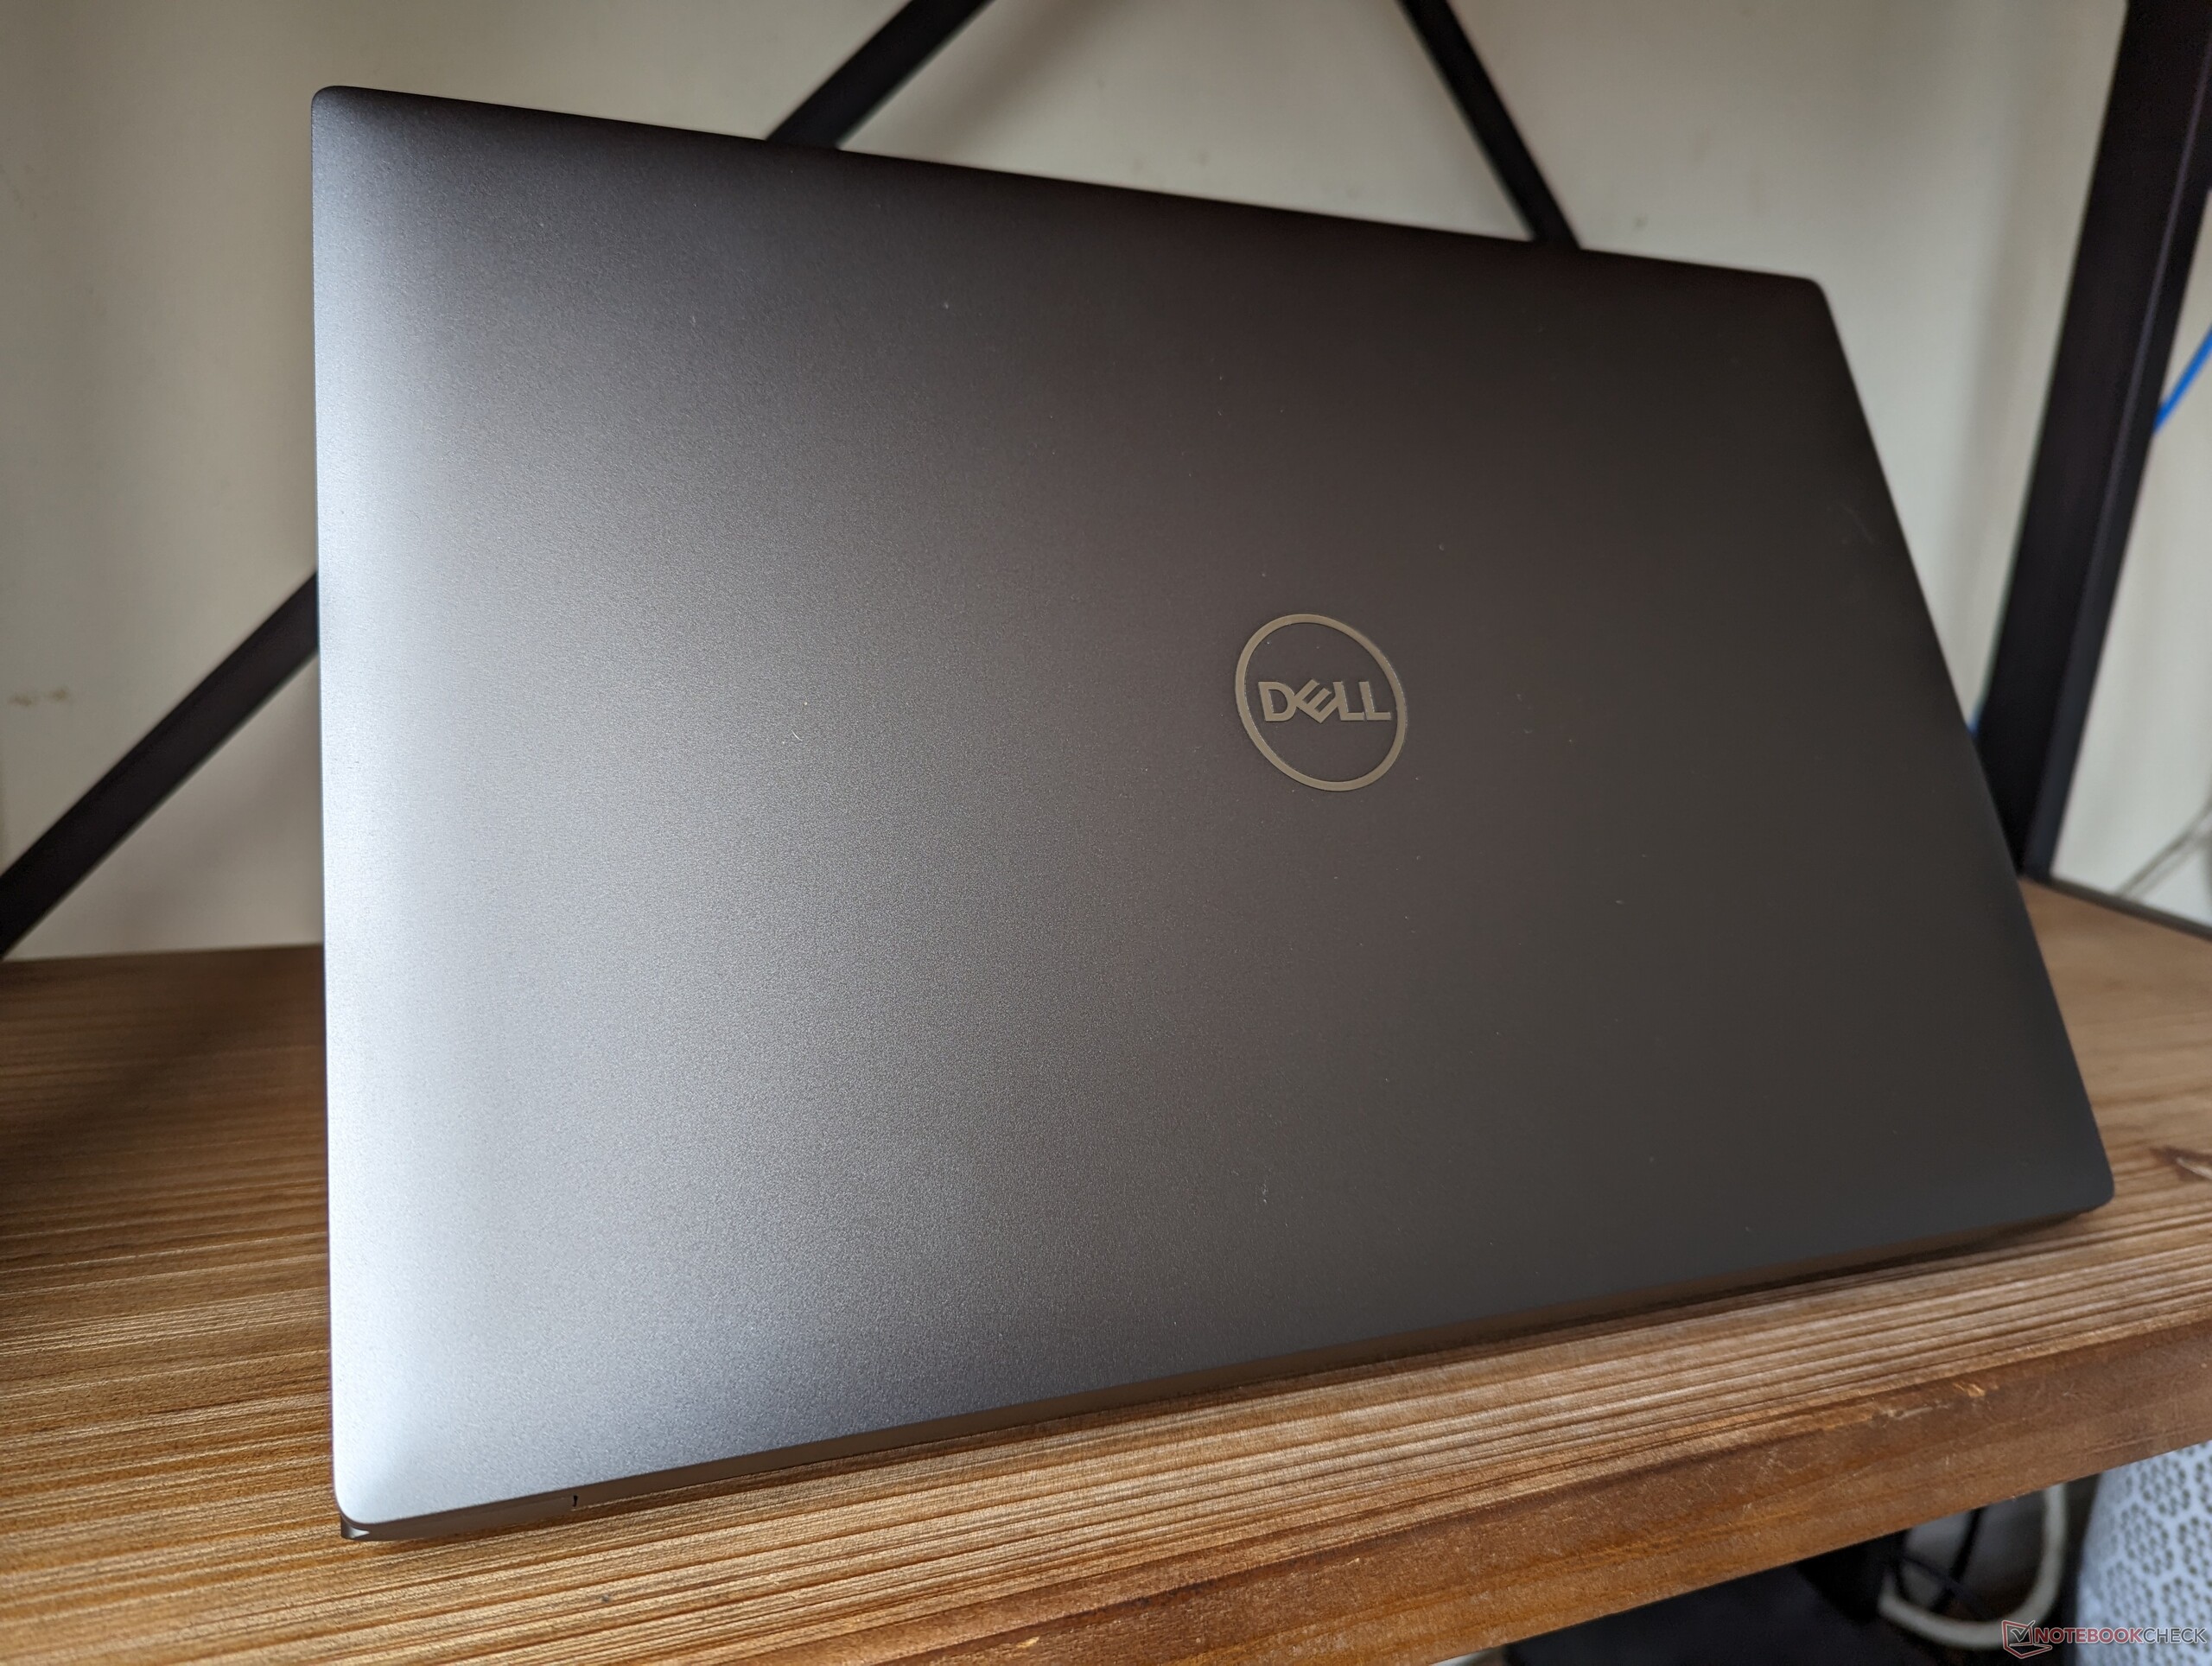
Avec seulement 2,3 kg, la station de travail Precision 5680 est l'une des stations de travail de 16 pouces les plus légères du marché. Le CreatorPro Z16P et leHP ZBook Fury 16 G9par exemple, pèsent respectivement 100 g et 300 g de plus, tout en étant plus volumineux que notre Dell. Le Precision 5680 est étonnamment portable compte tenu de ses performances.
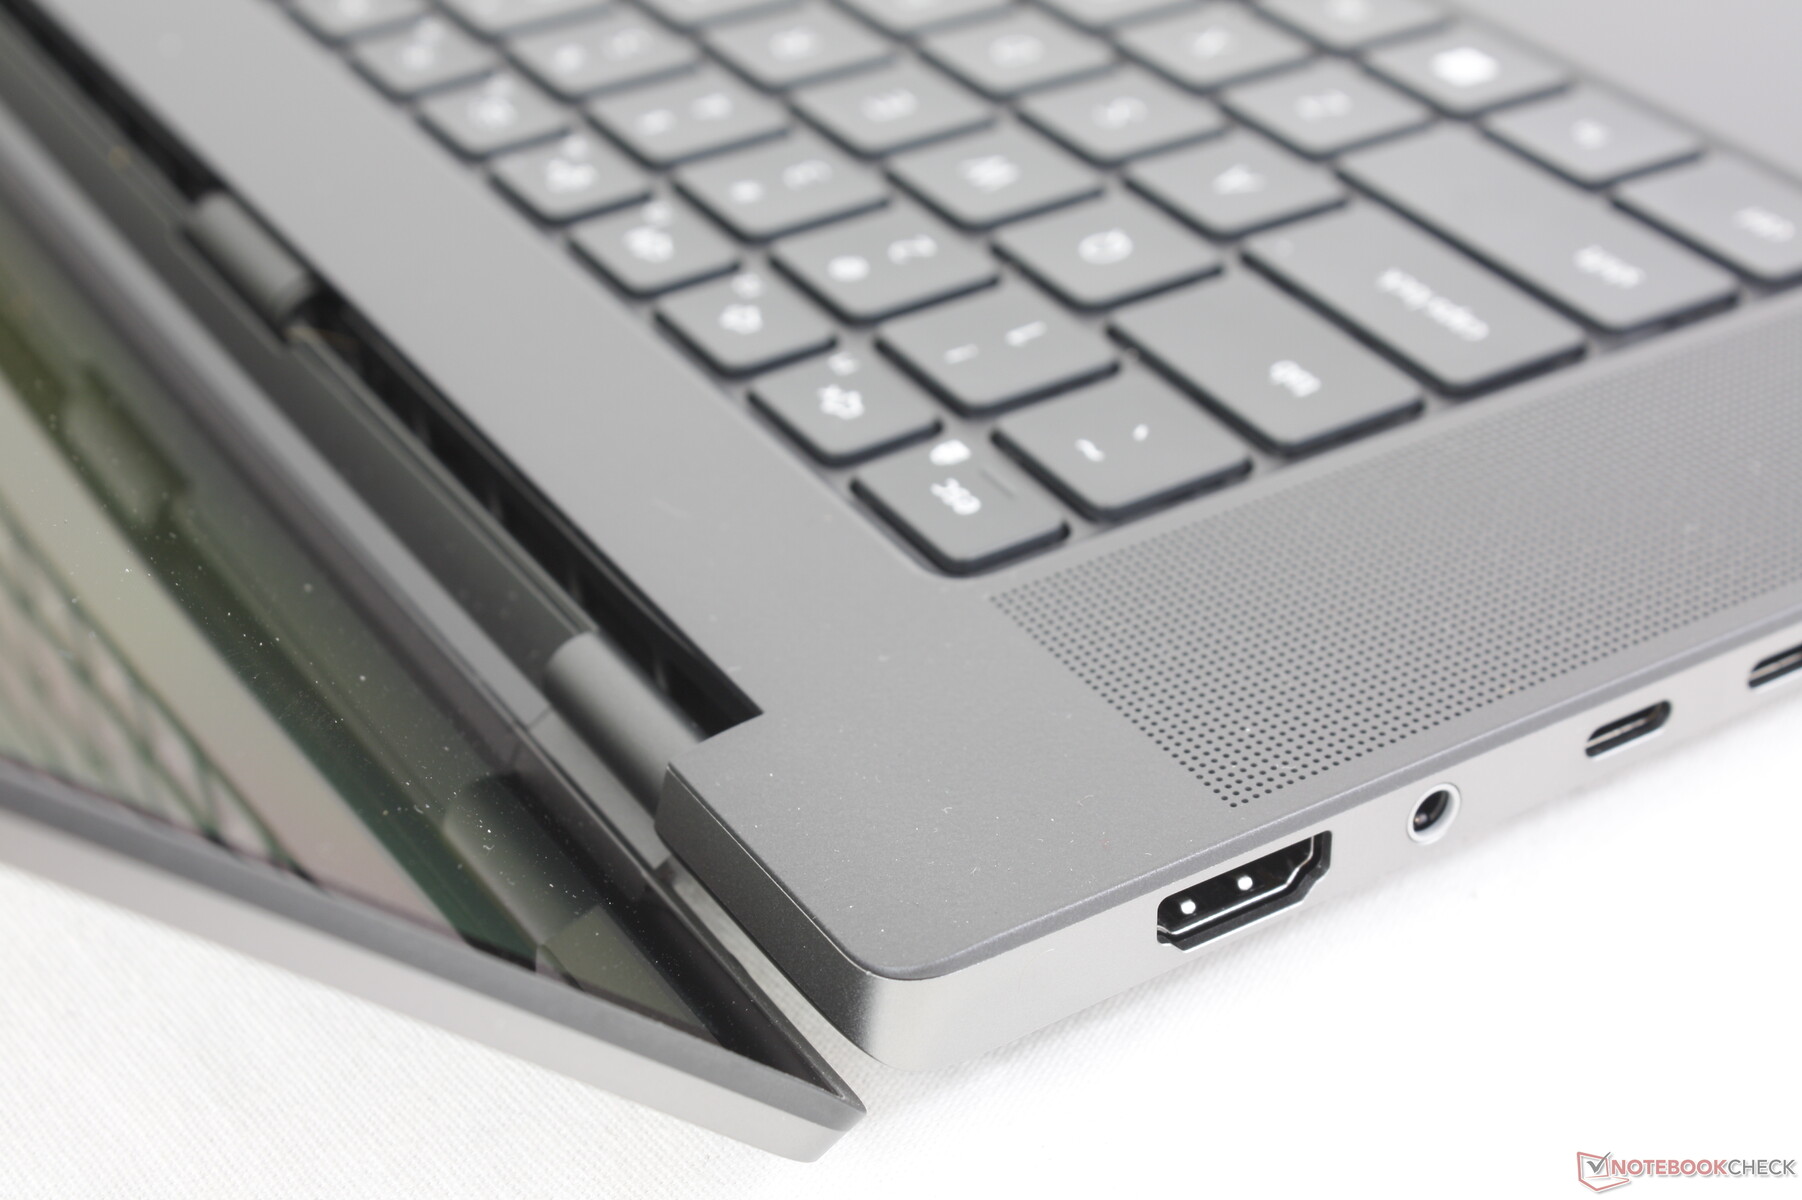
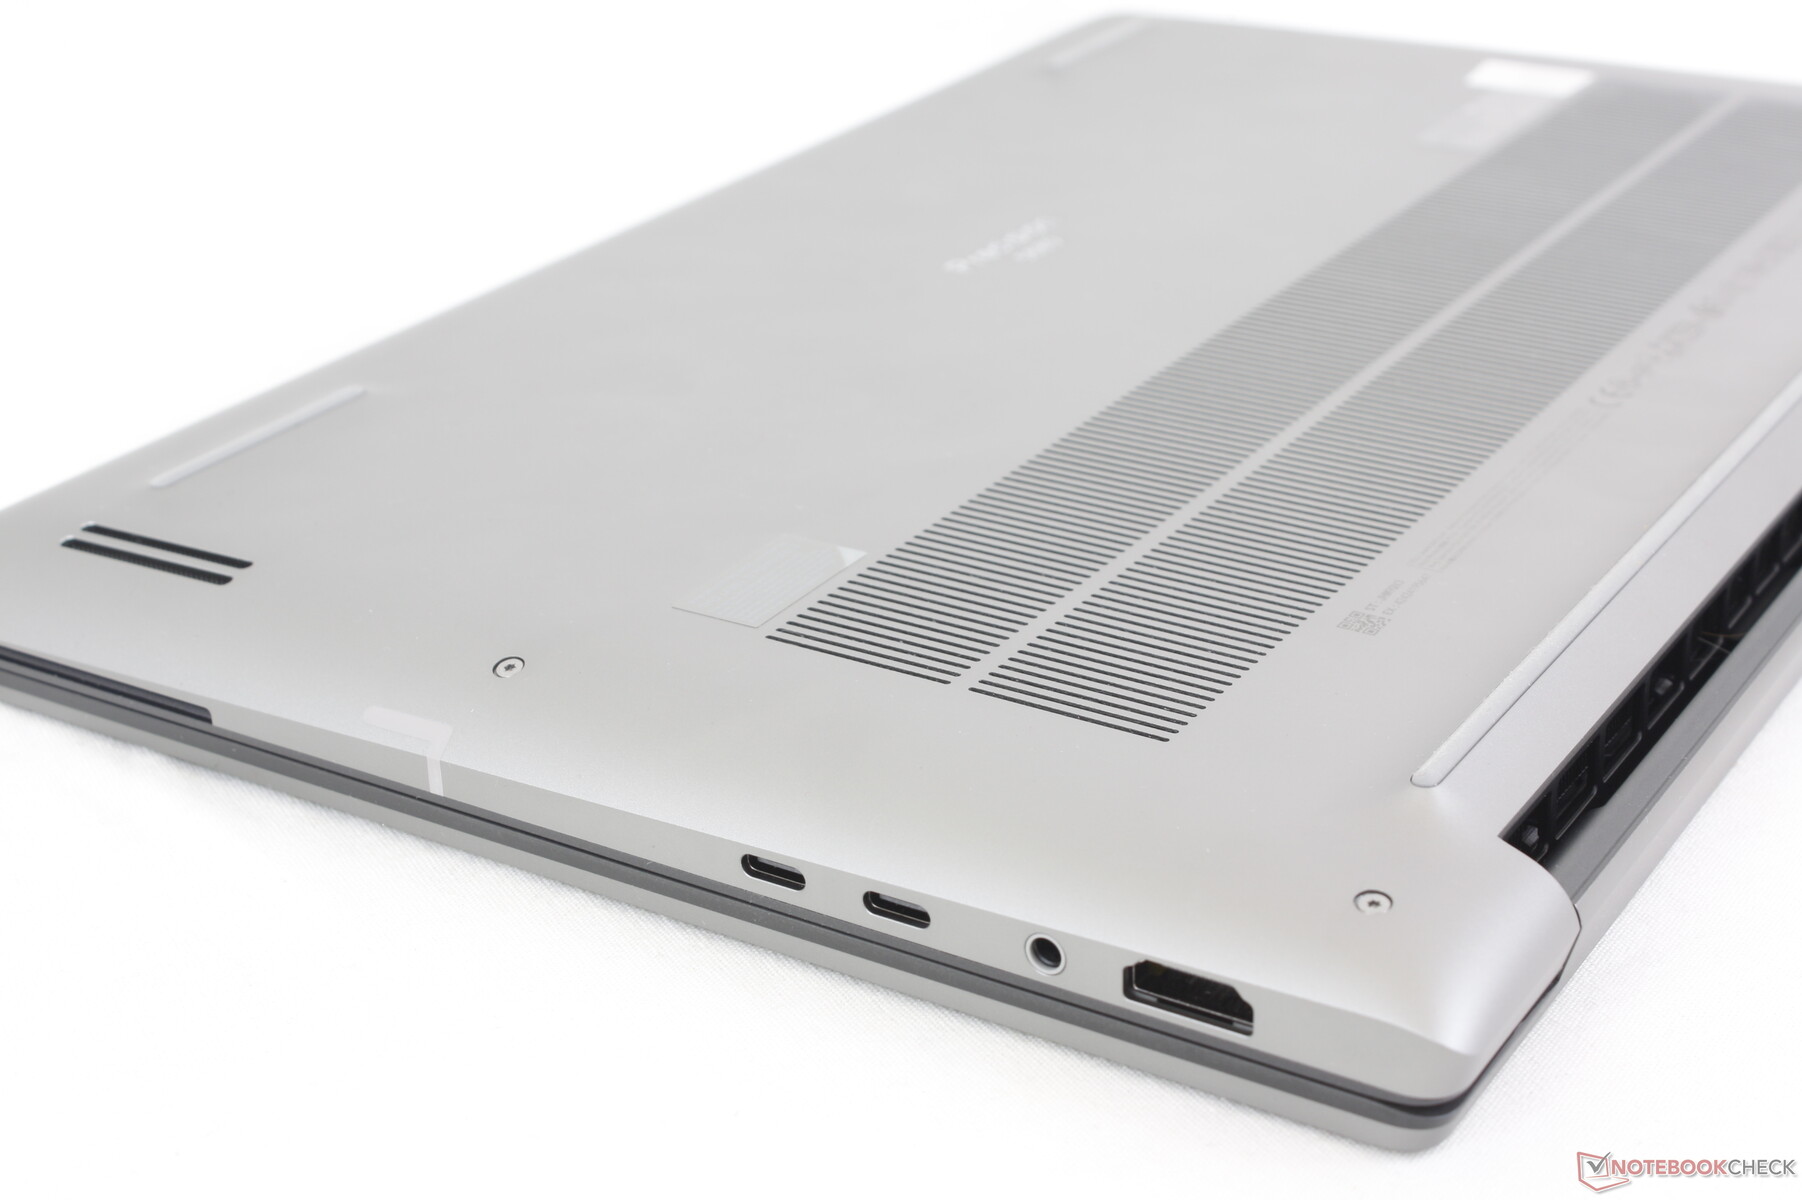
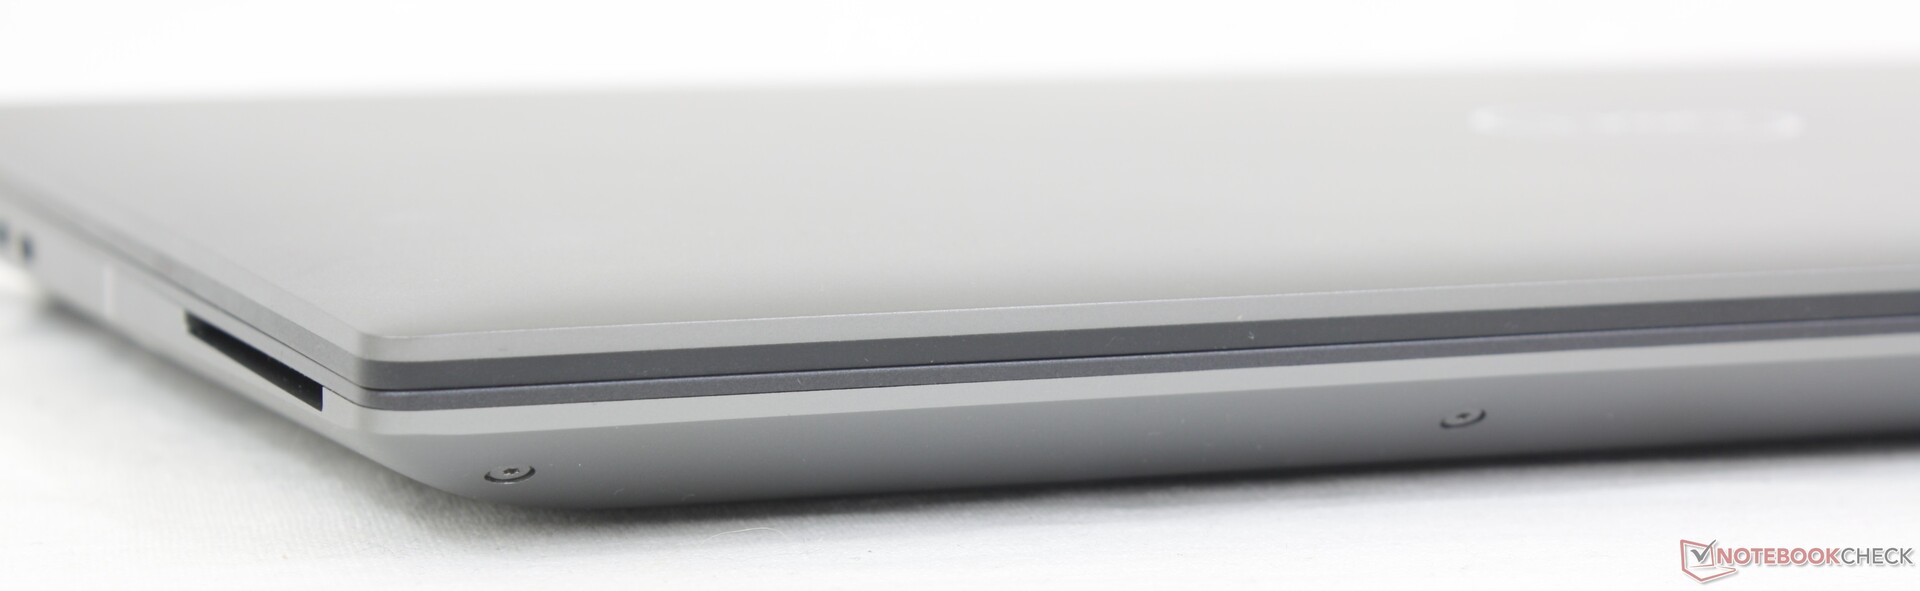
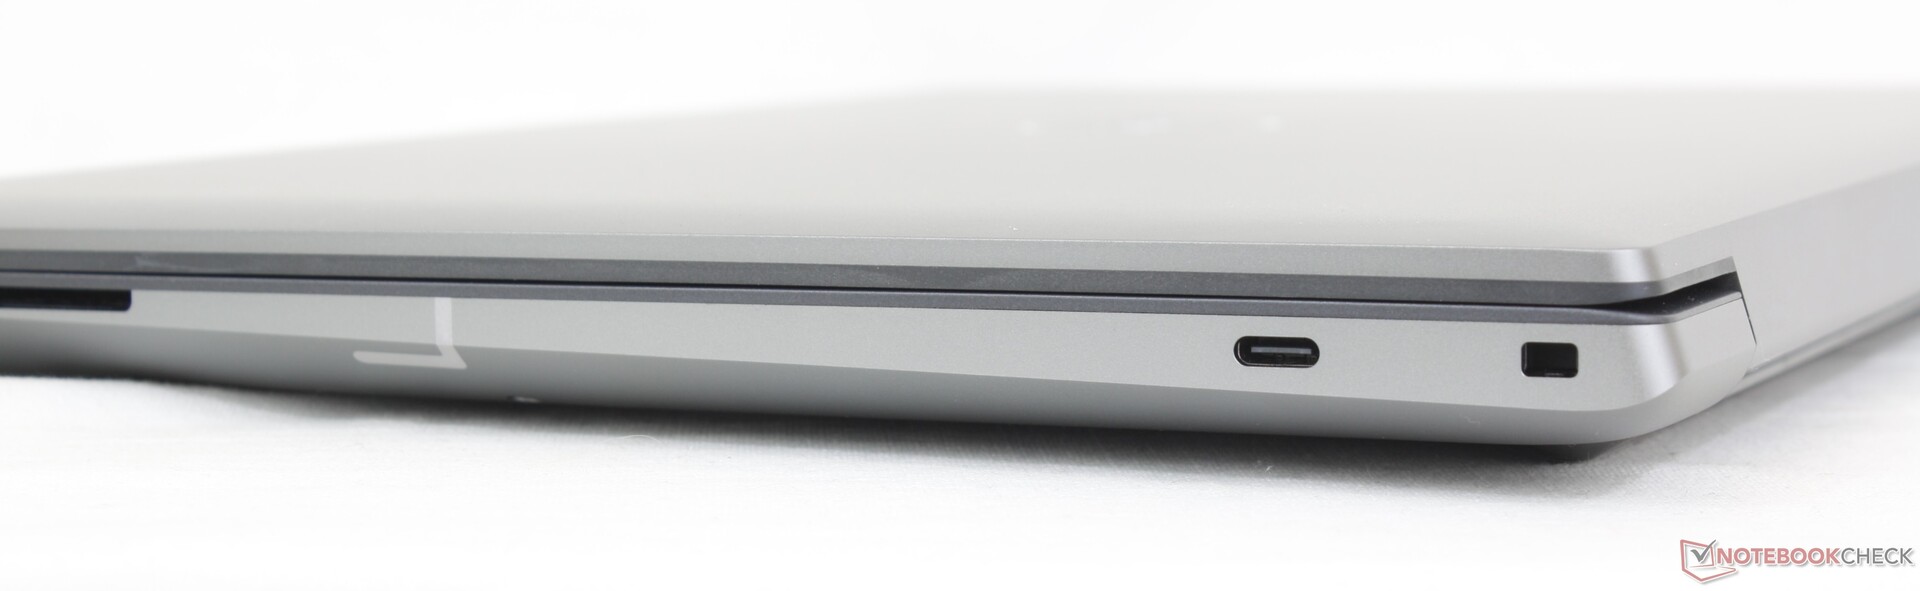
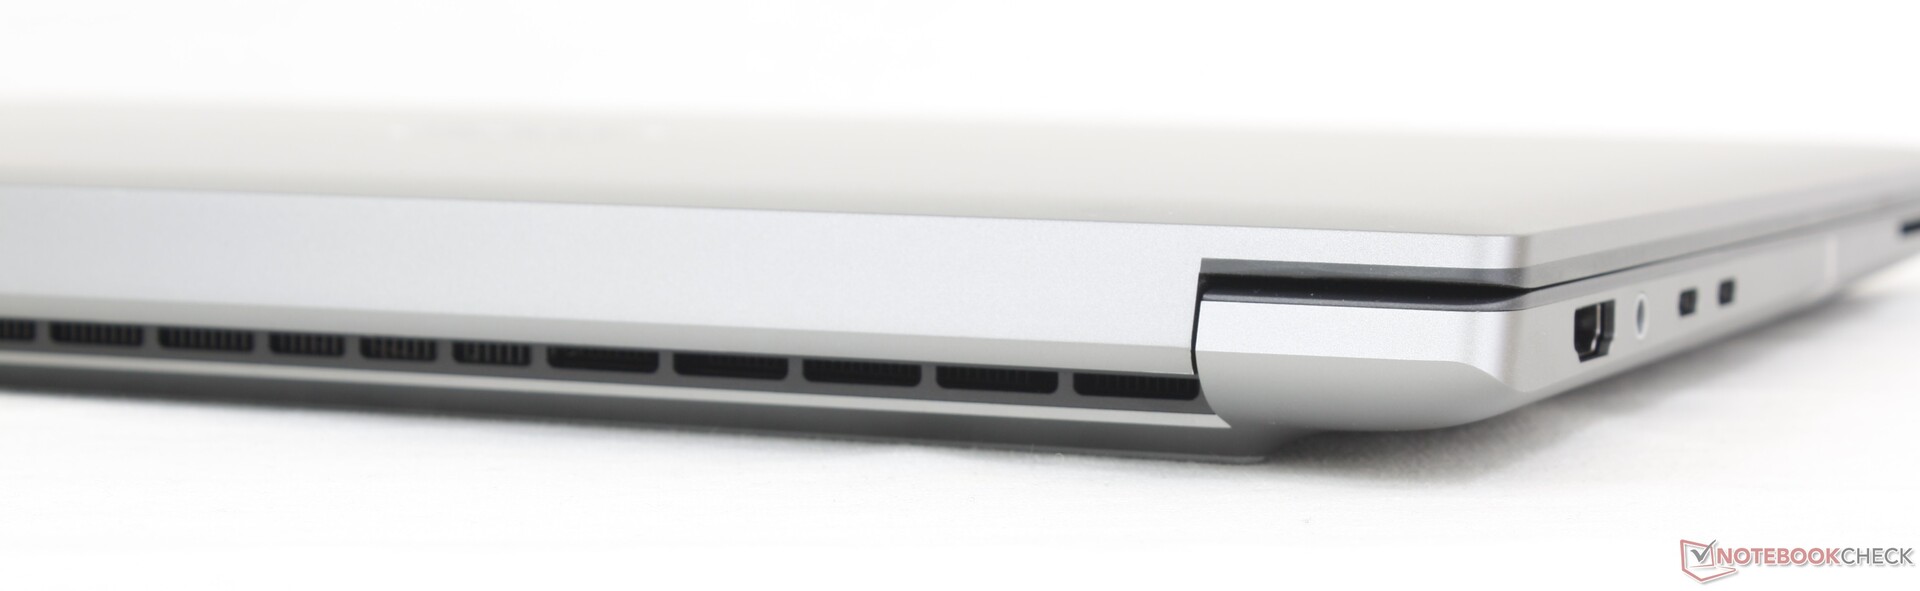
Connectivité - Peu de choses pour une station de travail
Les options de port sont avant-gardistes, pour le meilleur et pour le pire. C'est mieux dans le sens où chaque port est très polyvalent lorsqu'il s'agit d'adaptateurs et de périphériques, mais c'est aussi pire dans le sens où il n'y a pas de ports de base tels que les ports USB ou RJ-45. Des alternatives comme le ThinkPad P1 G4 ou le ExpertBook B6 Flip offrent une plus grande variété de ports que notre Dell. Il faut donc se préparer à utiliser des adaptateurs ou des stations d'accueil lors de l'utilisation du Precision 5680.
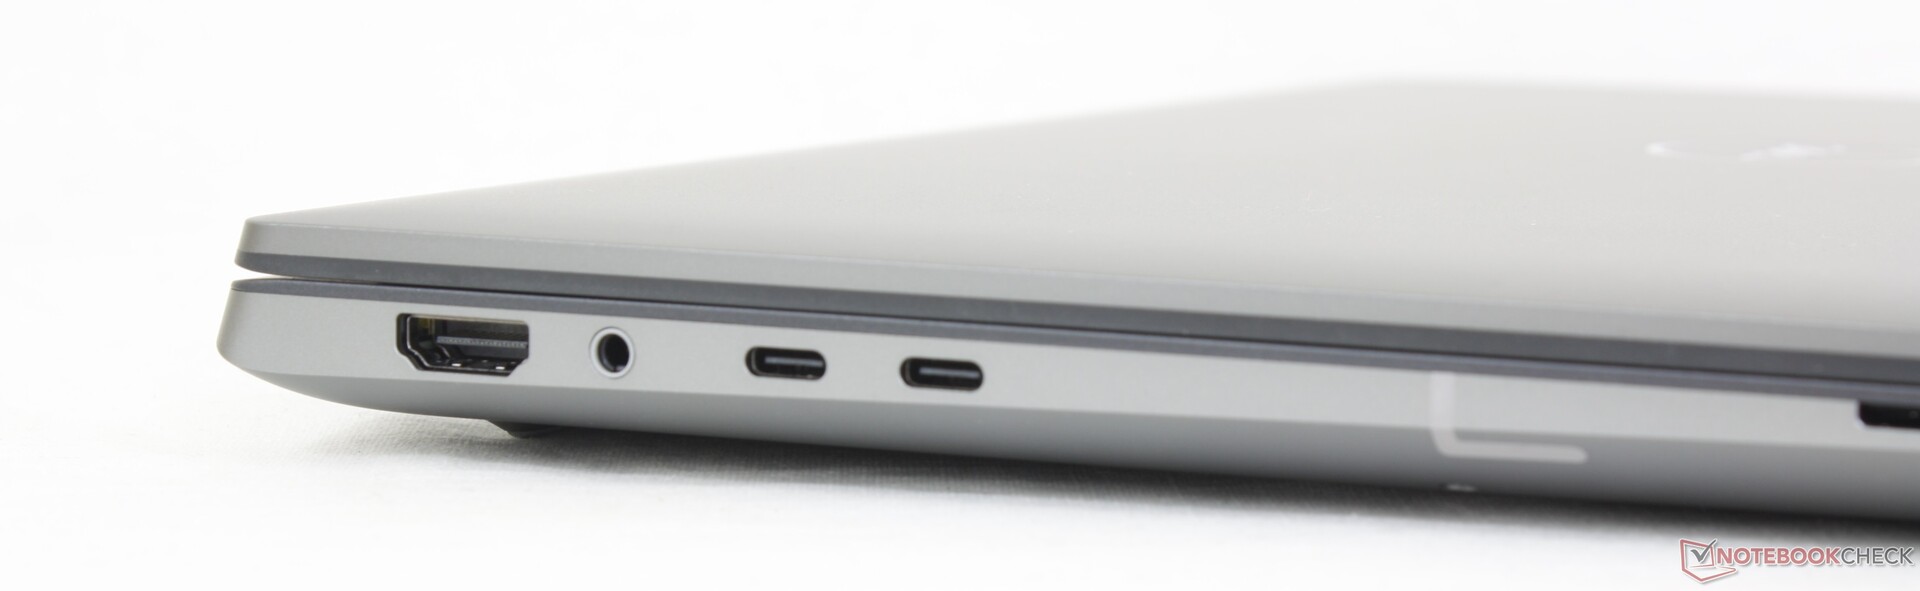
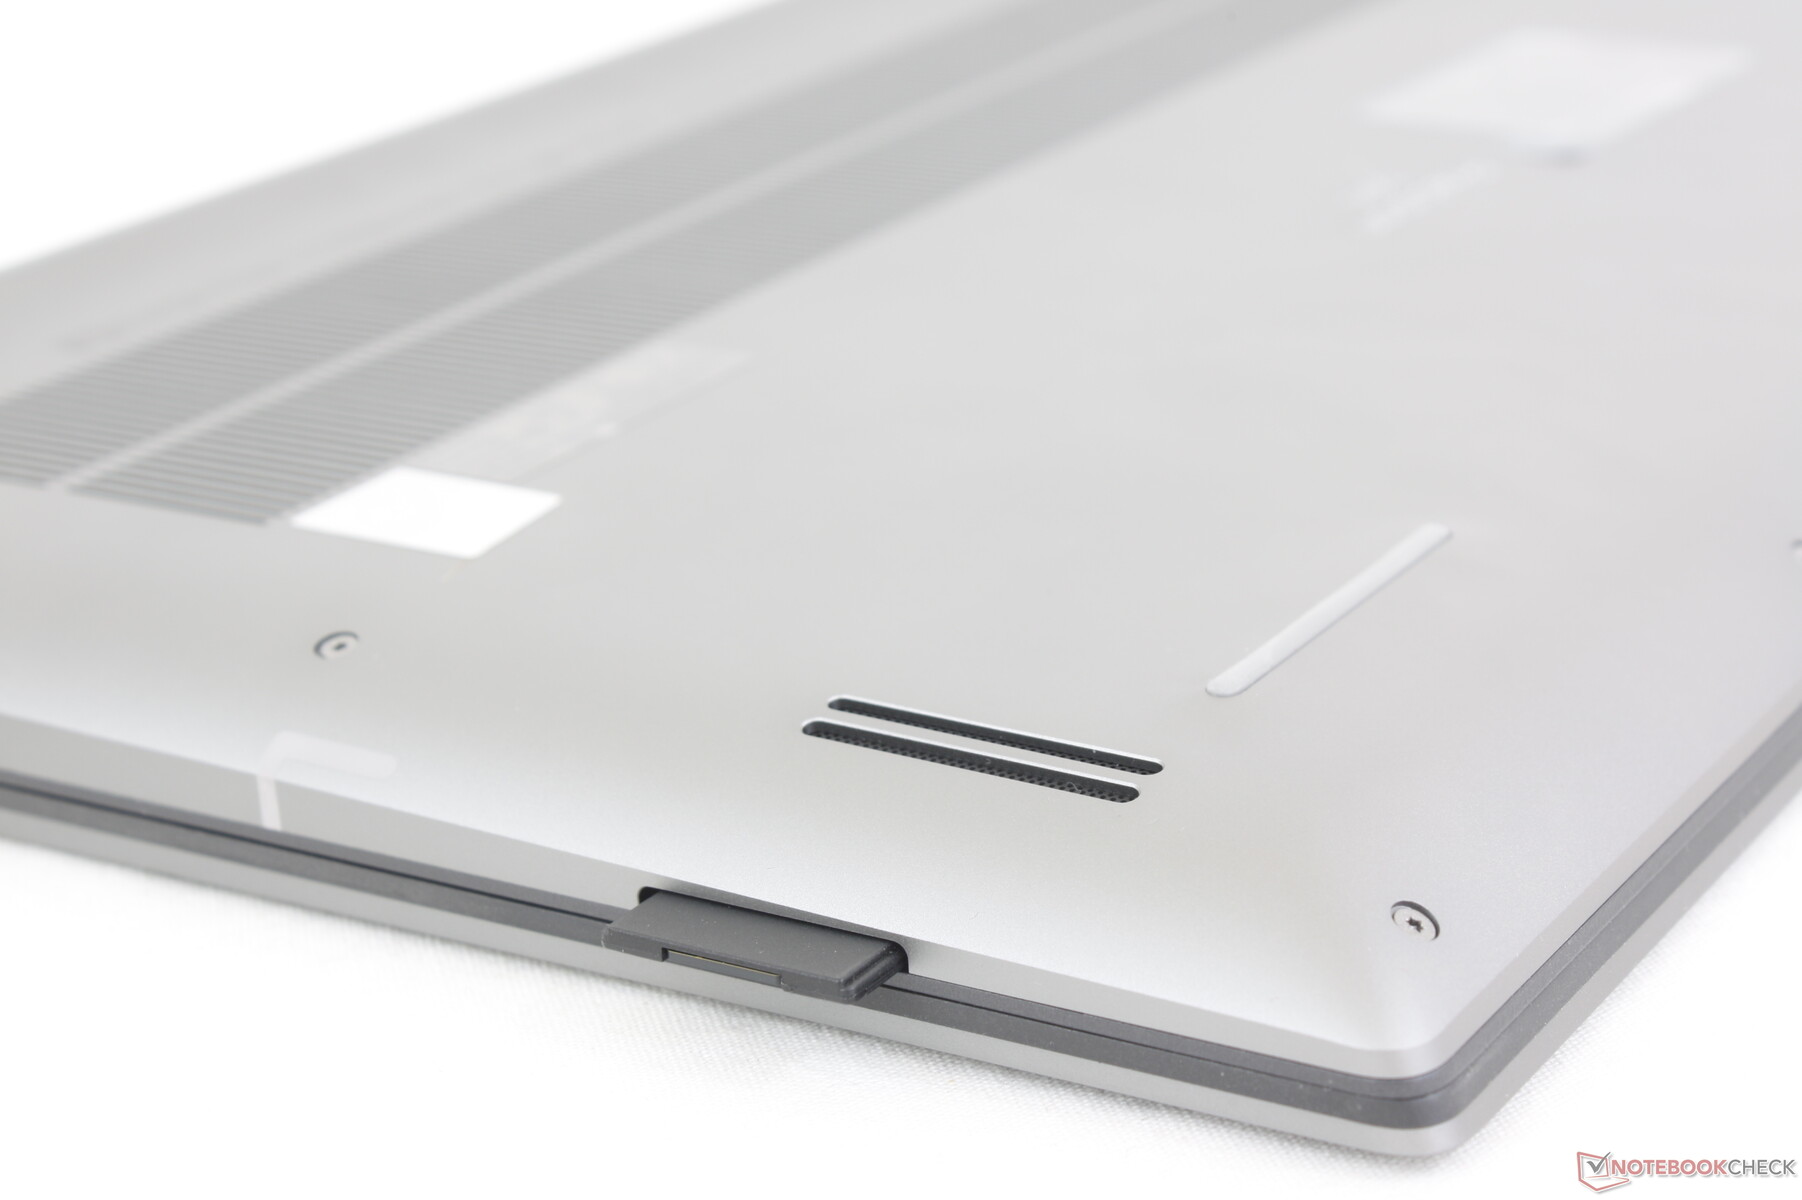
Lecteur de carte SD
Les modèles XPS et Precision ont des lecteurs de cartes SD intégrés parmi les plus rapides et cela reste vrai pour notre Precision 5680. Les taux de lecture sont plus de deux fois plus rapides que sur le ZBook Fury 16 G9 ou le ThinkPad P16 G1 et il ne faut que 5 à 6 secondes pour transférer 1 Go de données de notre carte de test UHS-II vers l'ordinateur de bureau.
| SD Card Reader | |
| average JPG Copy Test (av. of 3 runs) | |
| Dell Precision 5000 5680 (Toshiba Exceria Pro SDXC 64 GB UHS-II) | |
| Dell Precision 7000 7670 Performance (Toshiba Exceria Pro SDXC 64 GB UHS-II) | |
| MSI CreatorPro Z16P B12UKST (AV Pro V60) | |
| HP ZBook Fury 16 G9 (PNY EliteX-PRO60) | |
| Lenovo ThinkPad P16 G1 RTX A5500 (Toshiba Exceria Pro SDXC 64 GB UHS-II) | |
| maximum AS SSD Seq Read Test (1GB) | |
| Dell Precision 7000 7670 Performance (Toshiba Exceria Pro SDXC 64 GB UHS-II) | |
| Dell Precision 5000 5680 (Toshiba Exceria Pro SDXC 64 GB UHS-II) | |
| HP ZBook Fury 16 G9 (PNY EliteX-PRO60) | |
| MSI CreatorPro Z16P B12UKST (AV Pro V60) | |
| Lenovo ThinkPad P16 G1 RTX A5500 (Toshiba Exceria Pro SDXC 64 GB UHS-II) | |
Communication
Un Intel AX211 est fourni en standard pour la connectivité Wi-Fi 6E et Bluetooth 5.3. Les taux de transfert sont stables lorsqu'ils sont couplés à notre réseau Asus AXE11000 6GHz.
Les options WAN ne sont malheureusement pas prises en charge, contrairement au ZBook Fury 16 G9.
Webcam
Dell a augmenté la webcam de 1 MP sur le Precision 5550 à 2 MP sur notre Precision 5680. Malgré cela, il est regrettable qu'il n'y ait toujours pas de volet de confidentialité intégré.


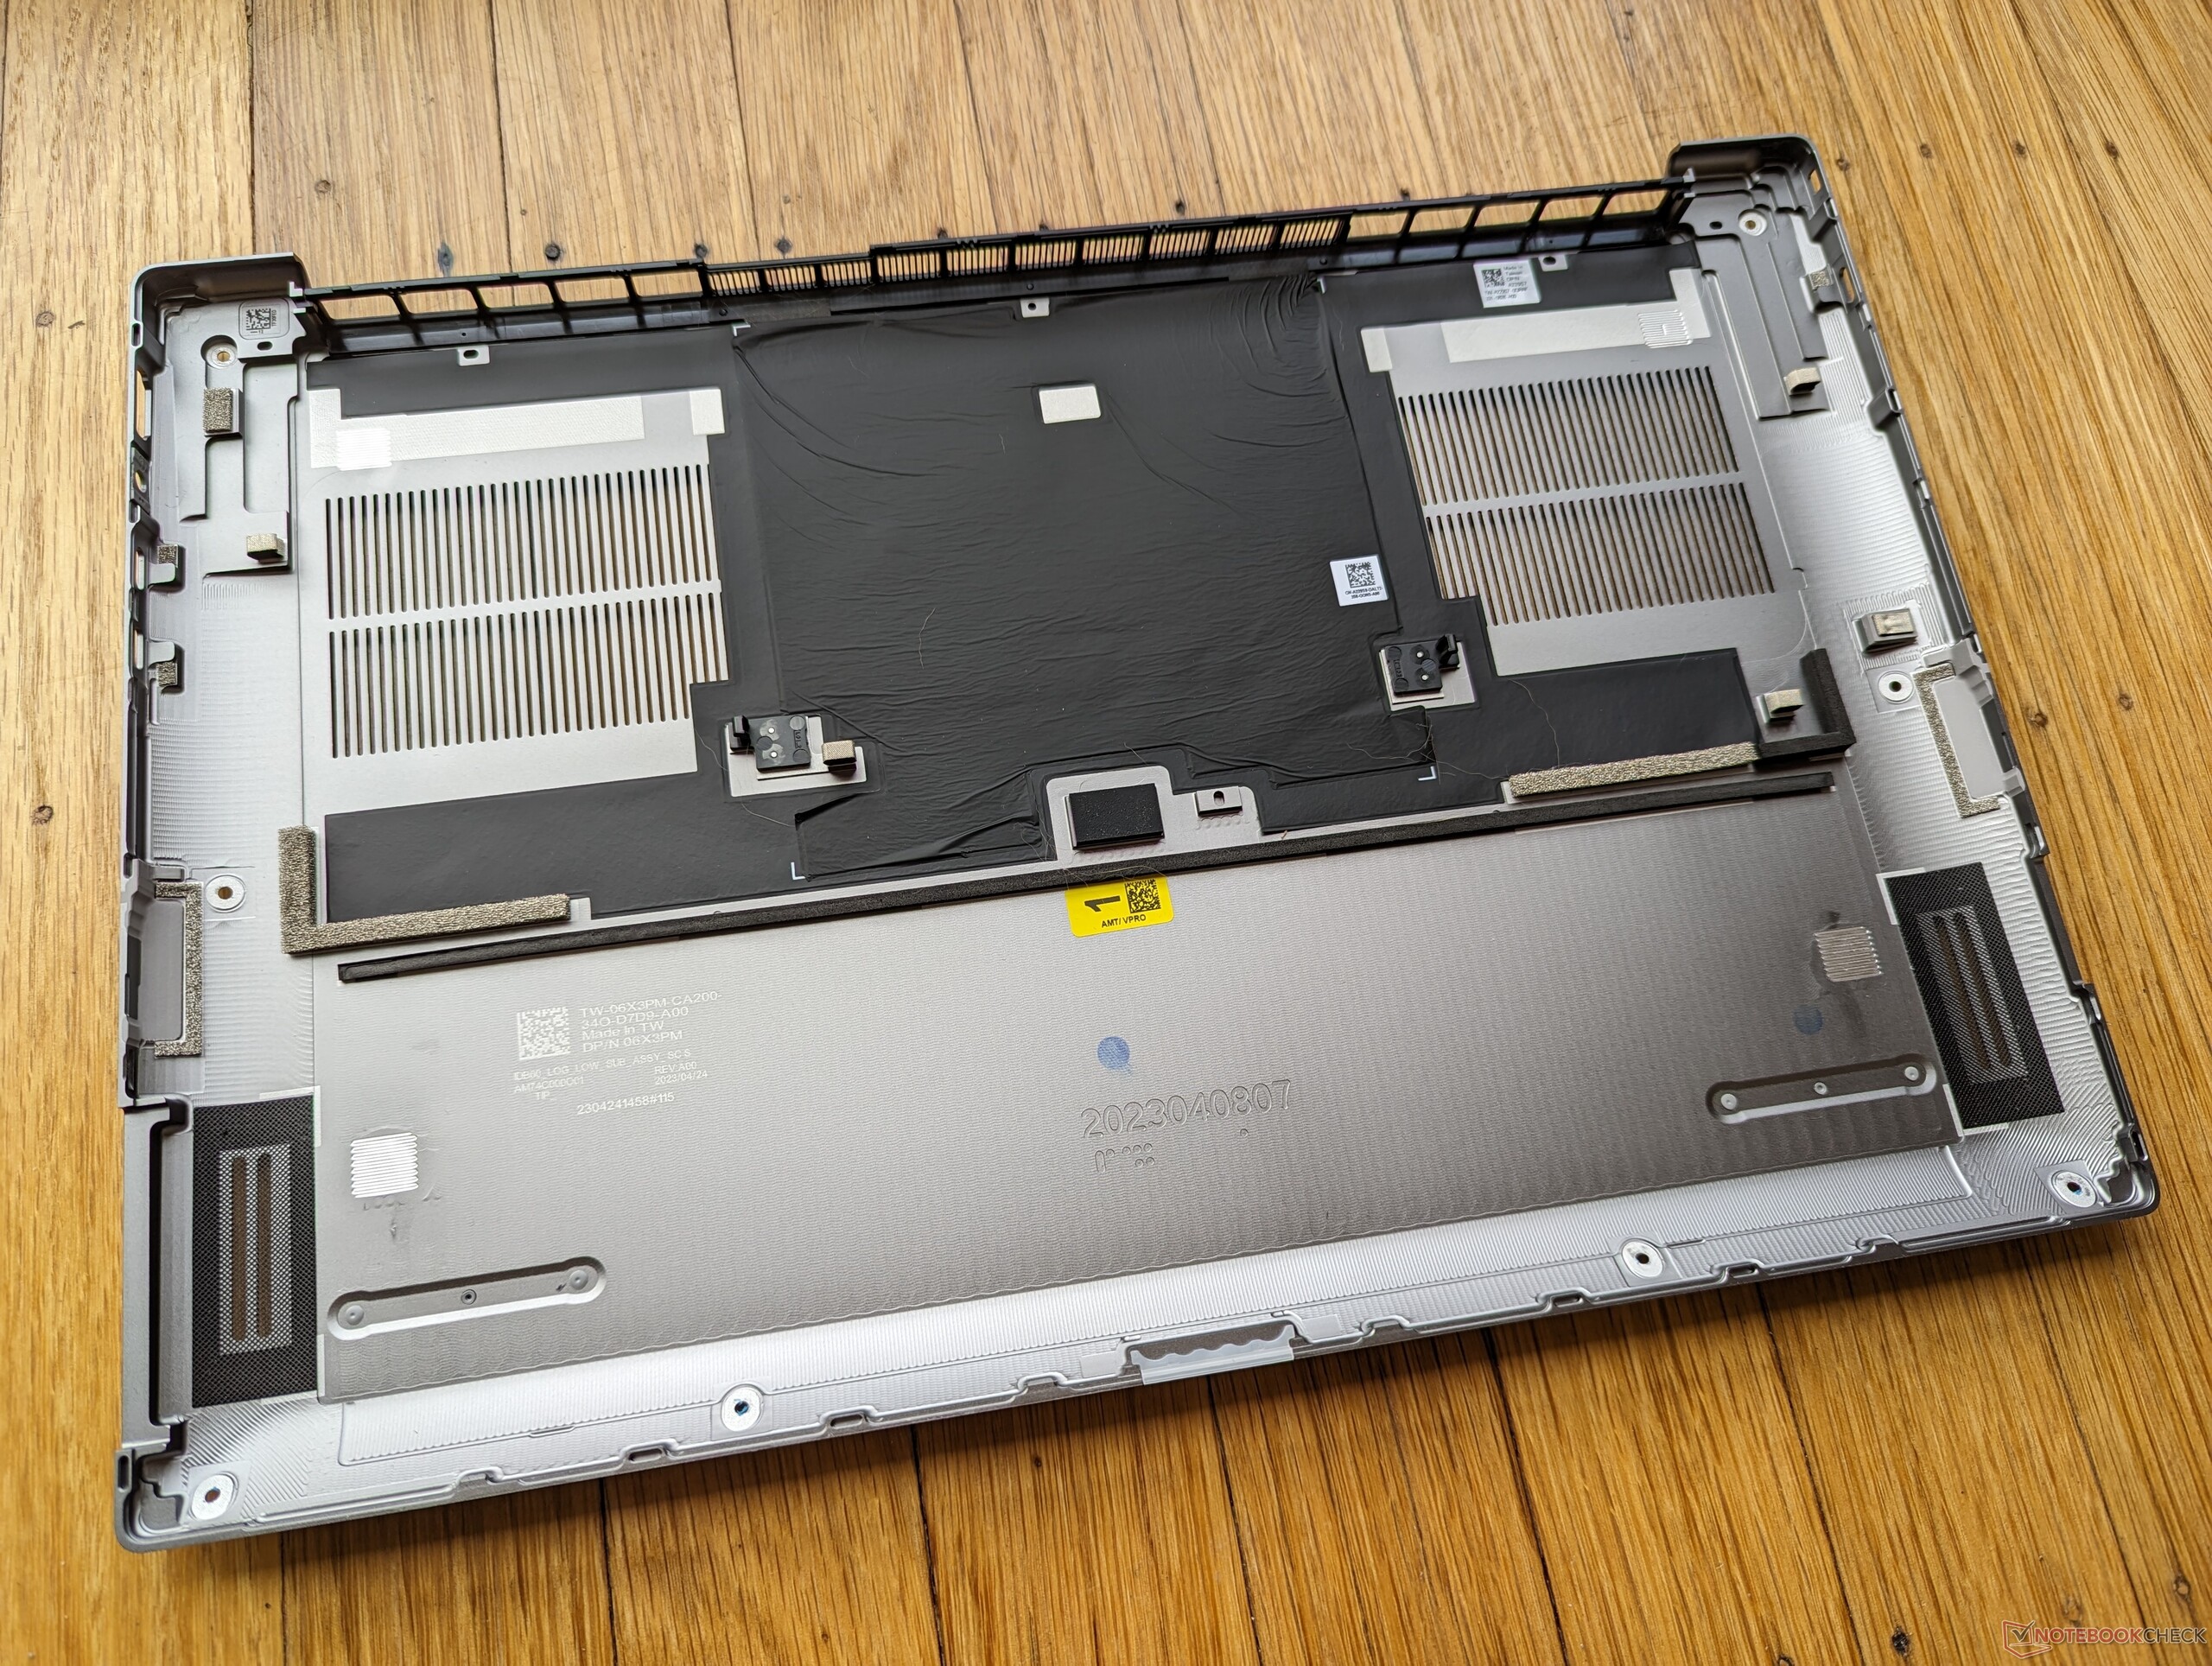
Maintenance
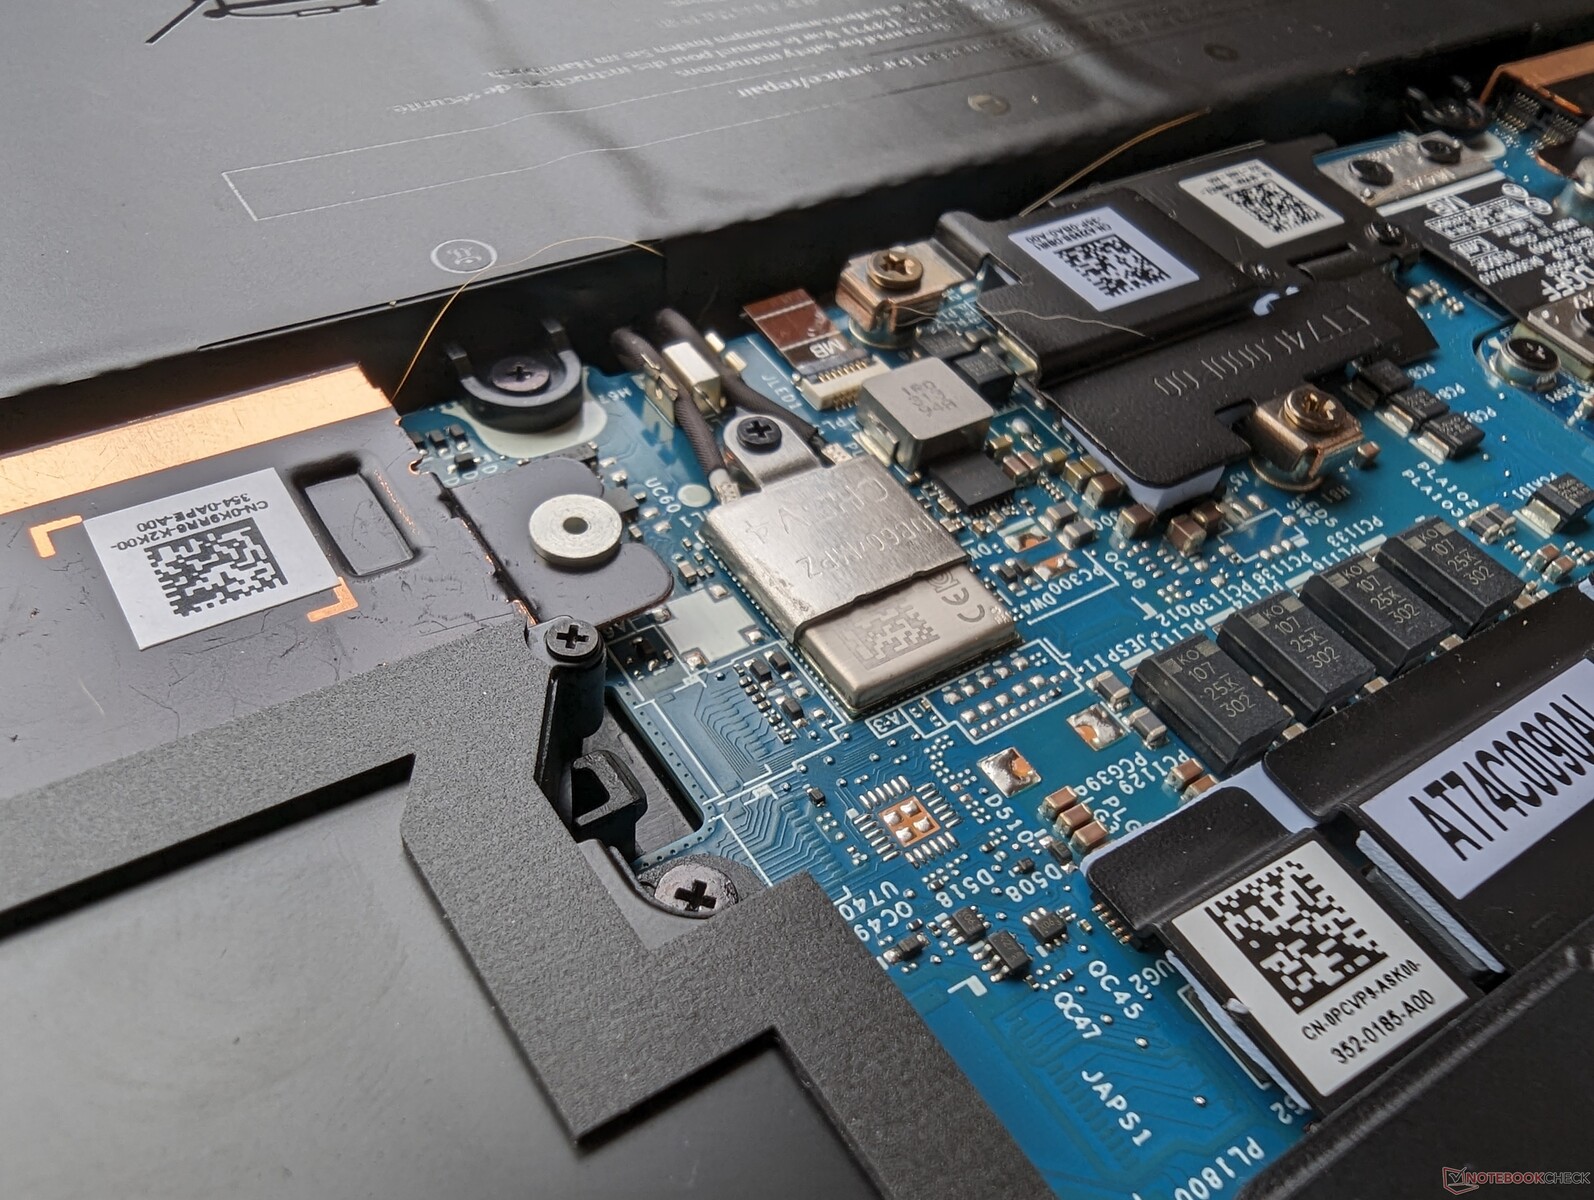
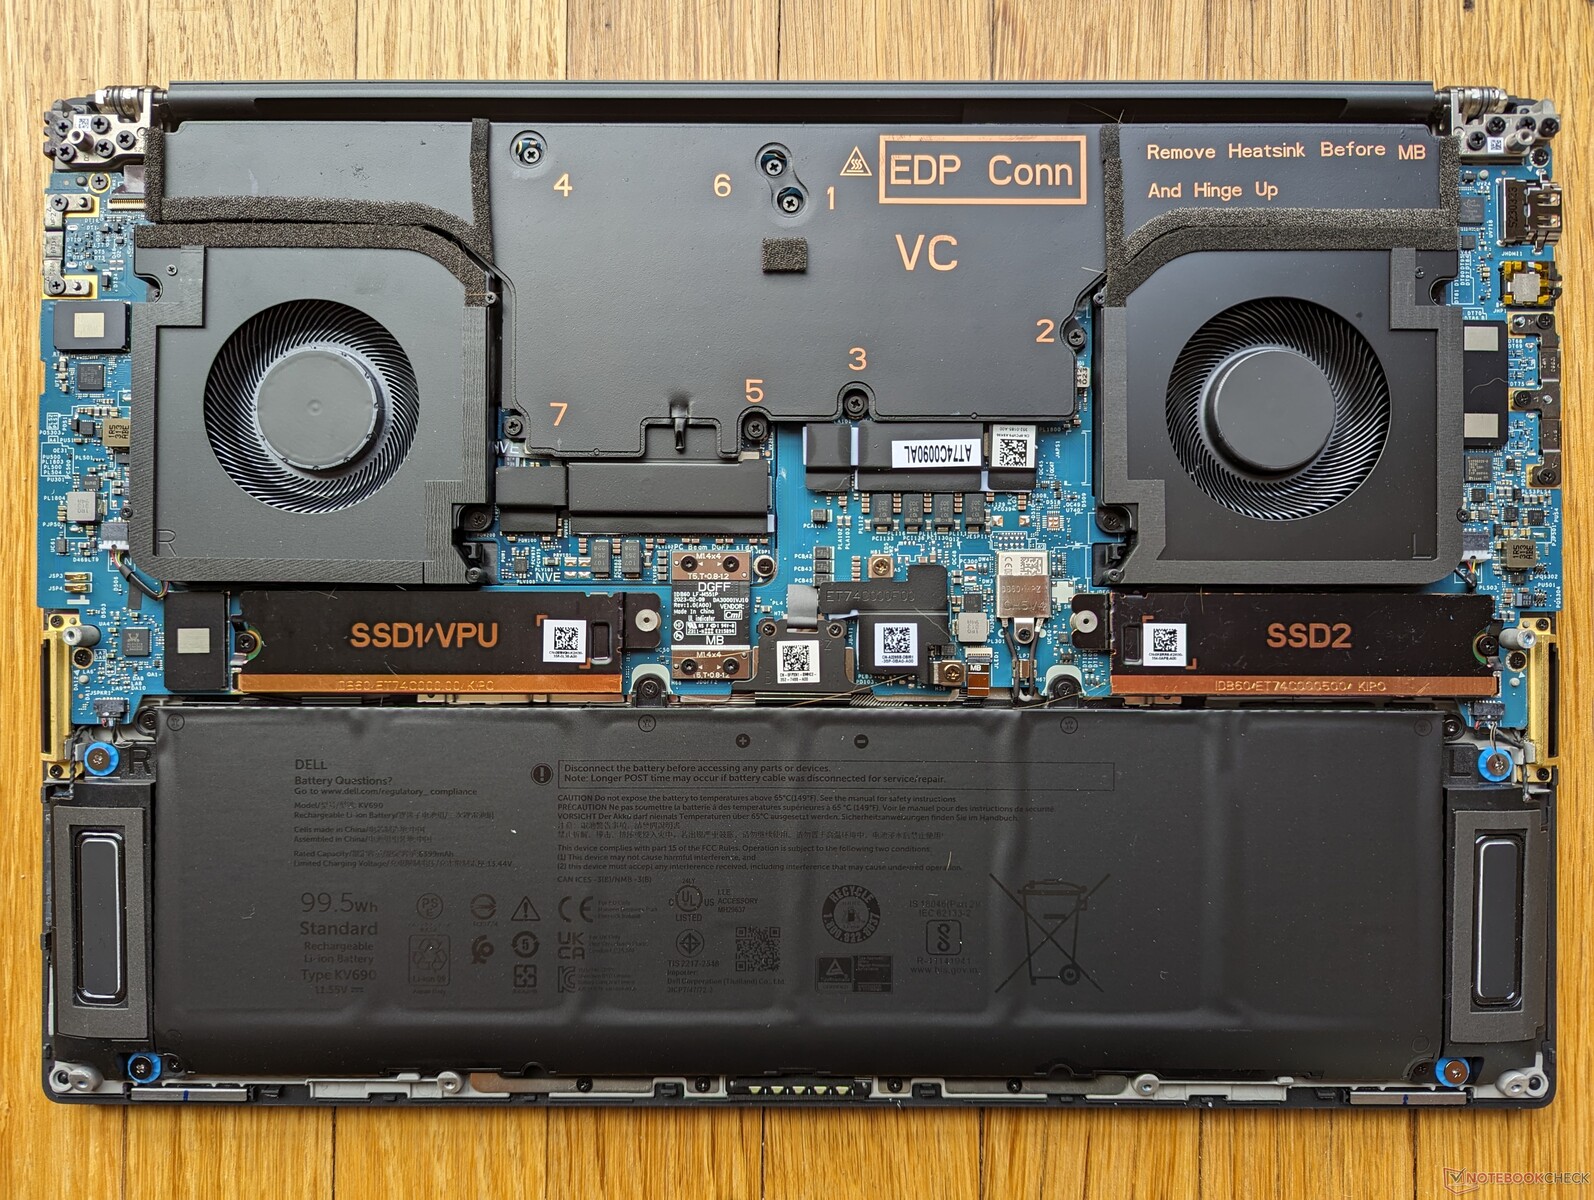
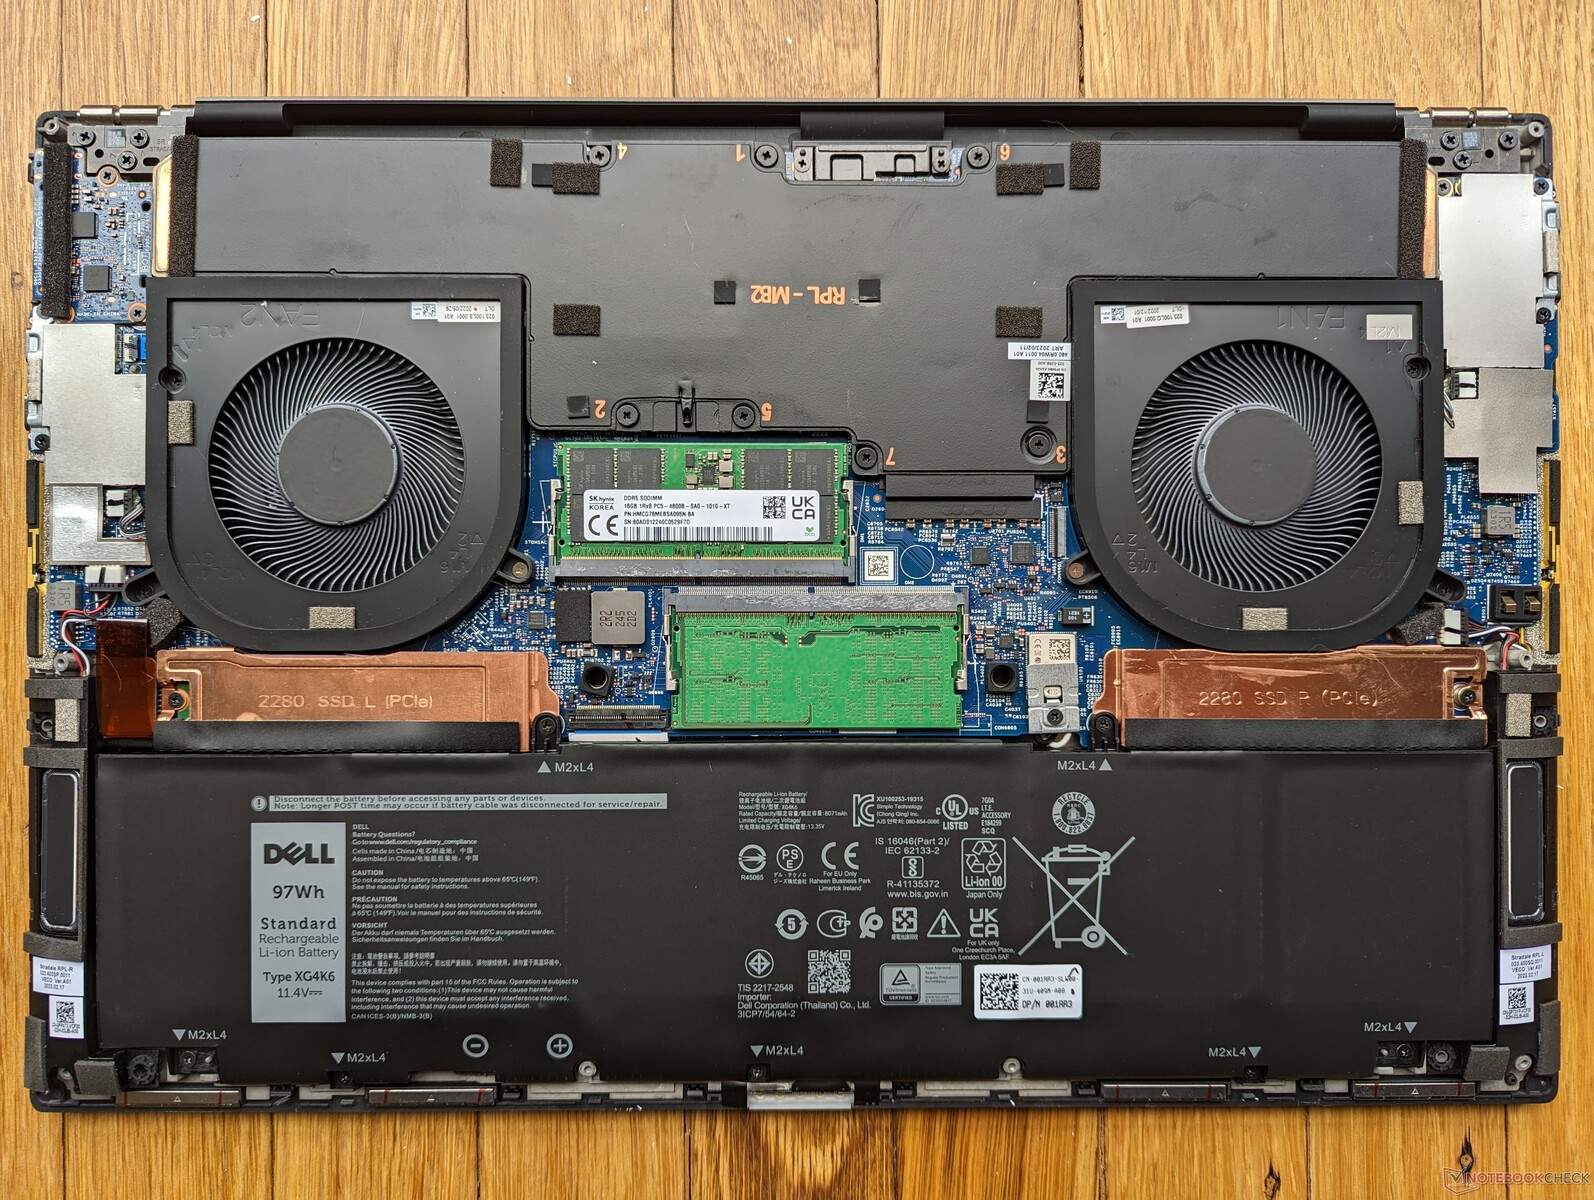
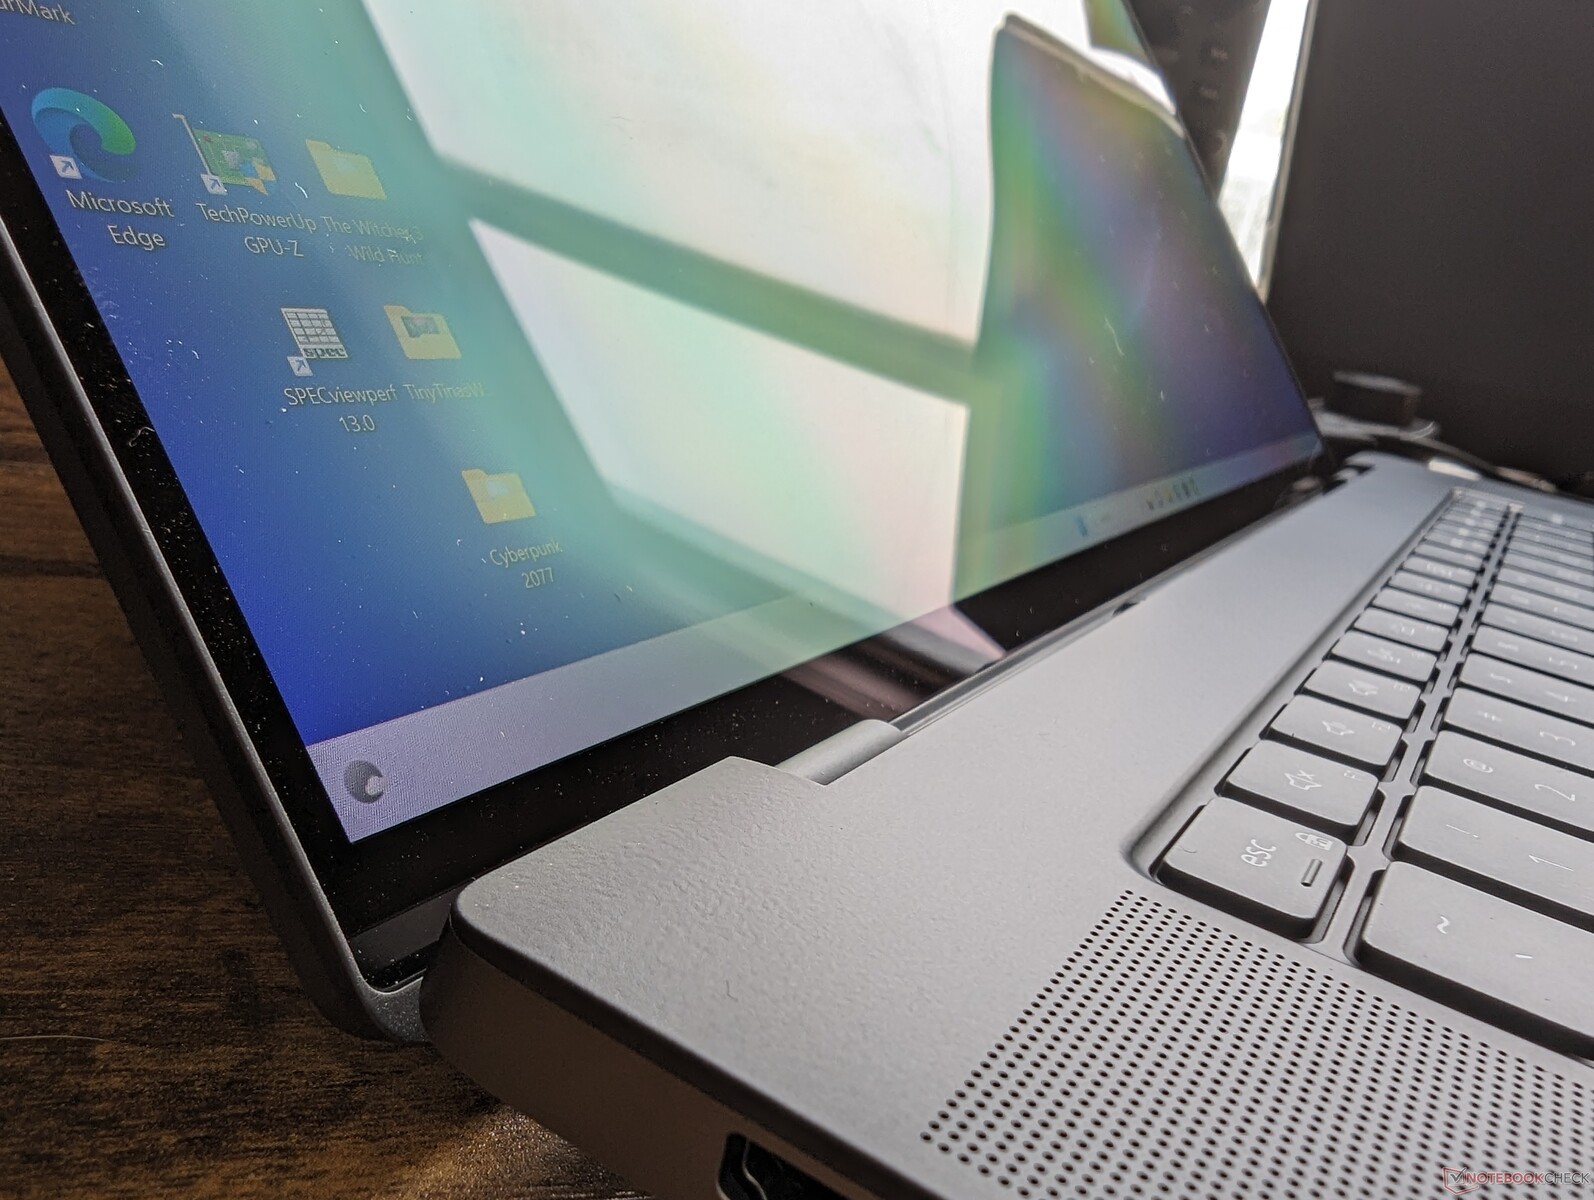
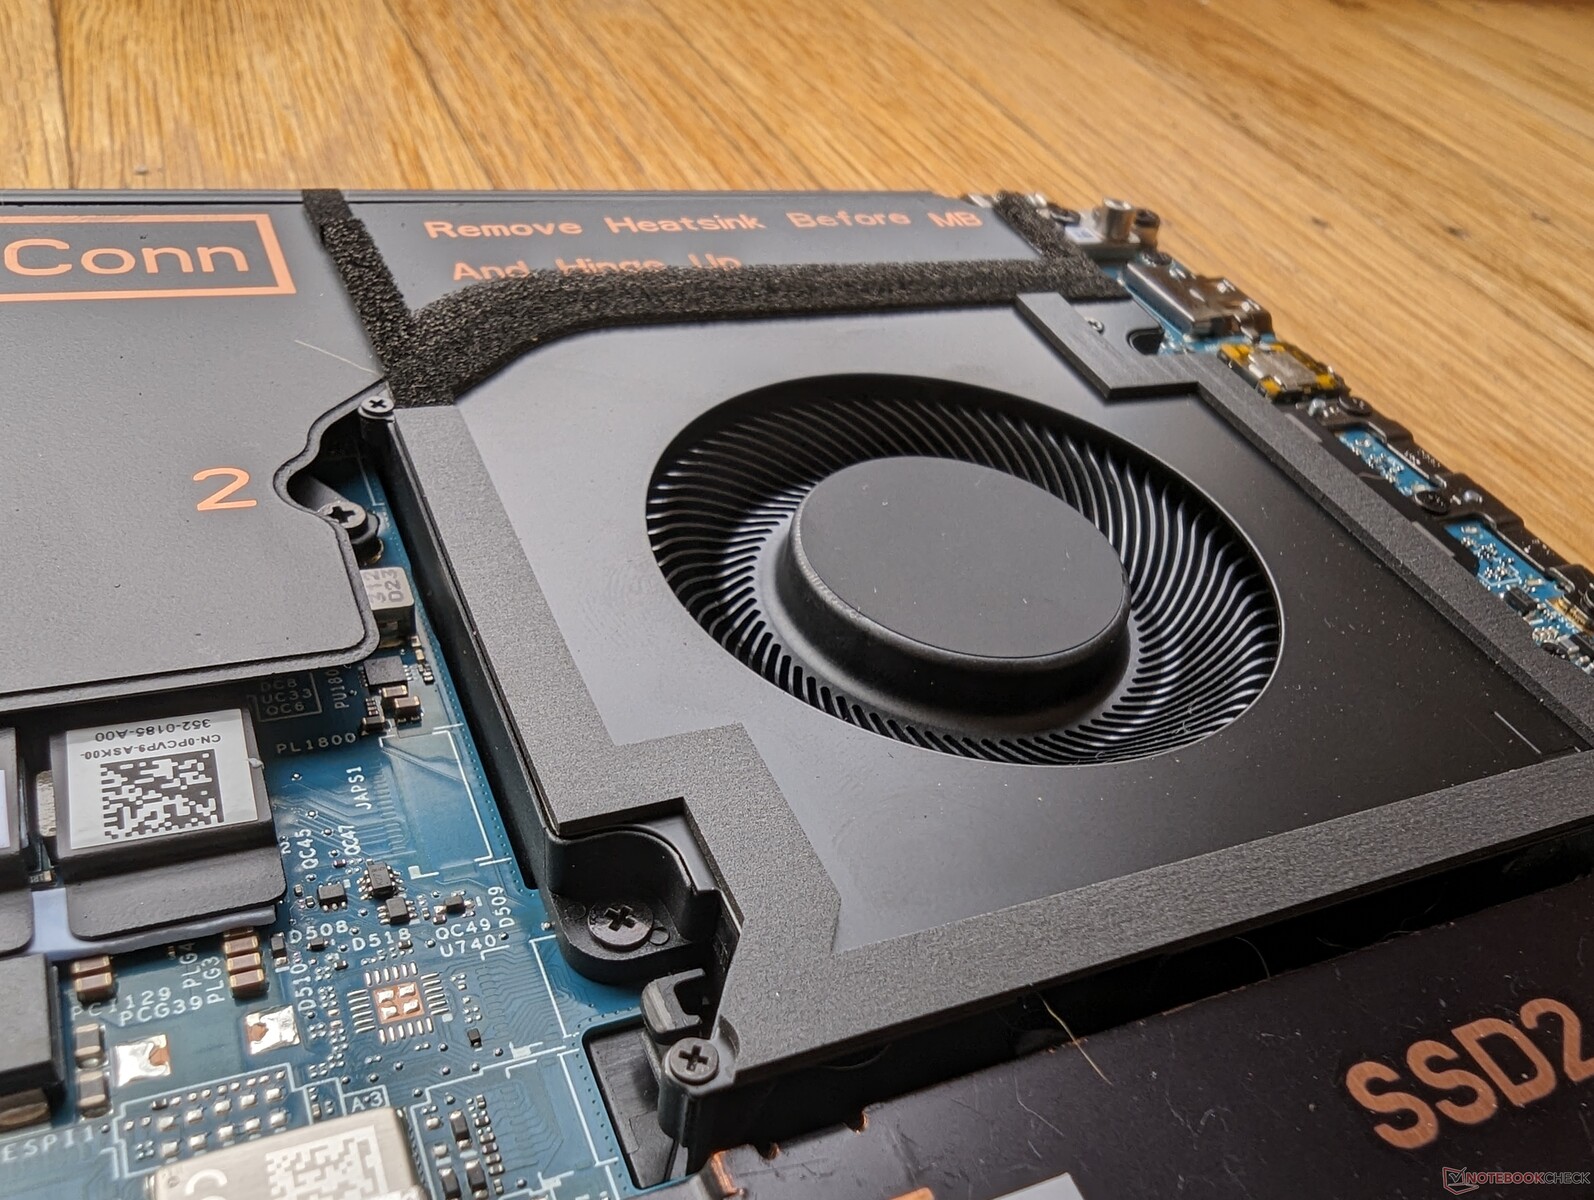
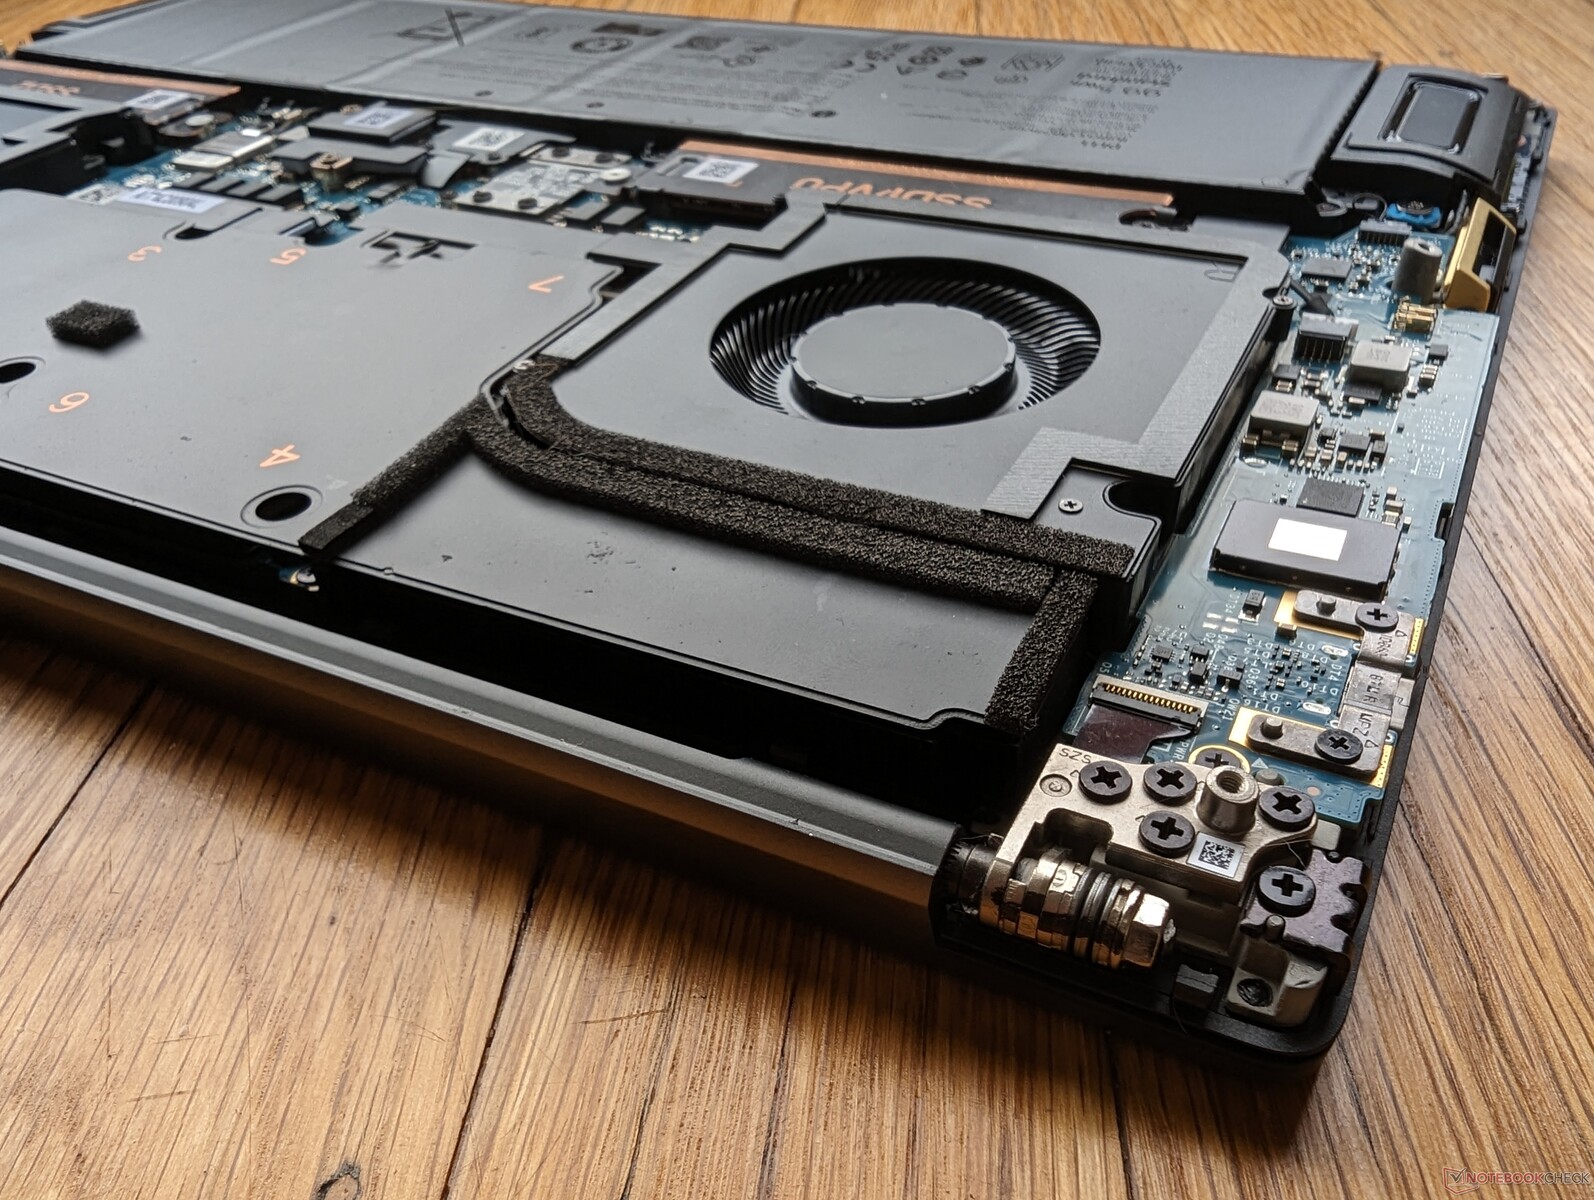
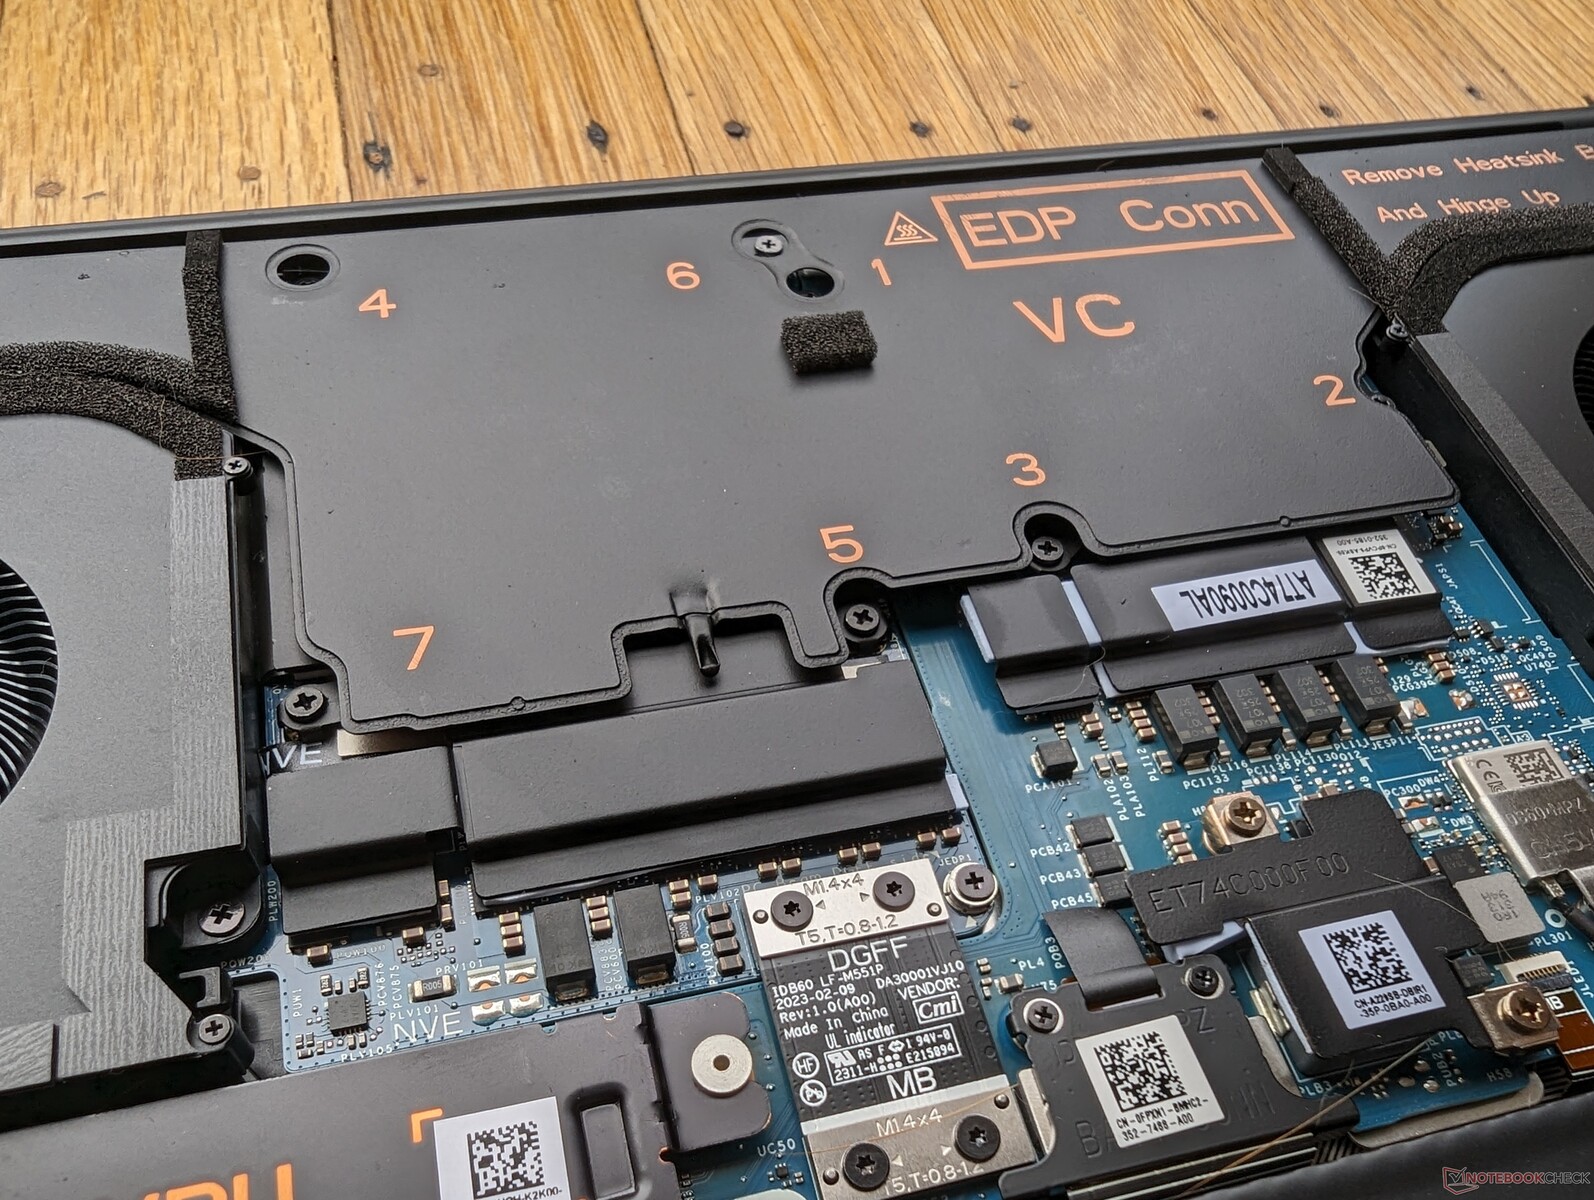
Le panneau inférieur est légèrement plus difficile à retirer que prévu, car les bords de la plaque métallique sont à la fois tranchants et étroitement verrouillés, comme sur le XPS 15 ou le XPS 17. Il est recommandé d'utiliser une vis Torx et un bord plat pour l'entretien du système.
Les modules WLAN et RAM sont soudés, contrairement à la plupart des autres stations de travail de cette taille d'écran. Les modules hautement intégrés et les options de port limitées sont probablement des inconvénients par rapport au design élégant et au poids relativement faible.
Accessoires et garantie
La boîte de vente au détail comprend un petit adaptateur USB-C vers USB-A pour compenser le fait qu'il n'y a pas de ports USB de taille normale sur le système.
Une garantie de base limitée de trois ans du fabricant avec réparation sur site s'applique si l'achat a lieu aux États-Unis.
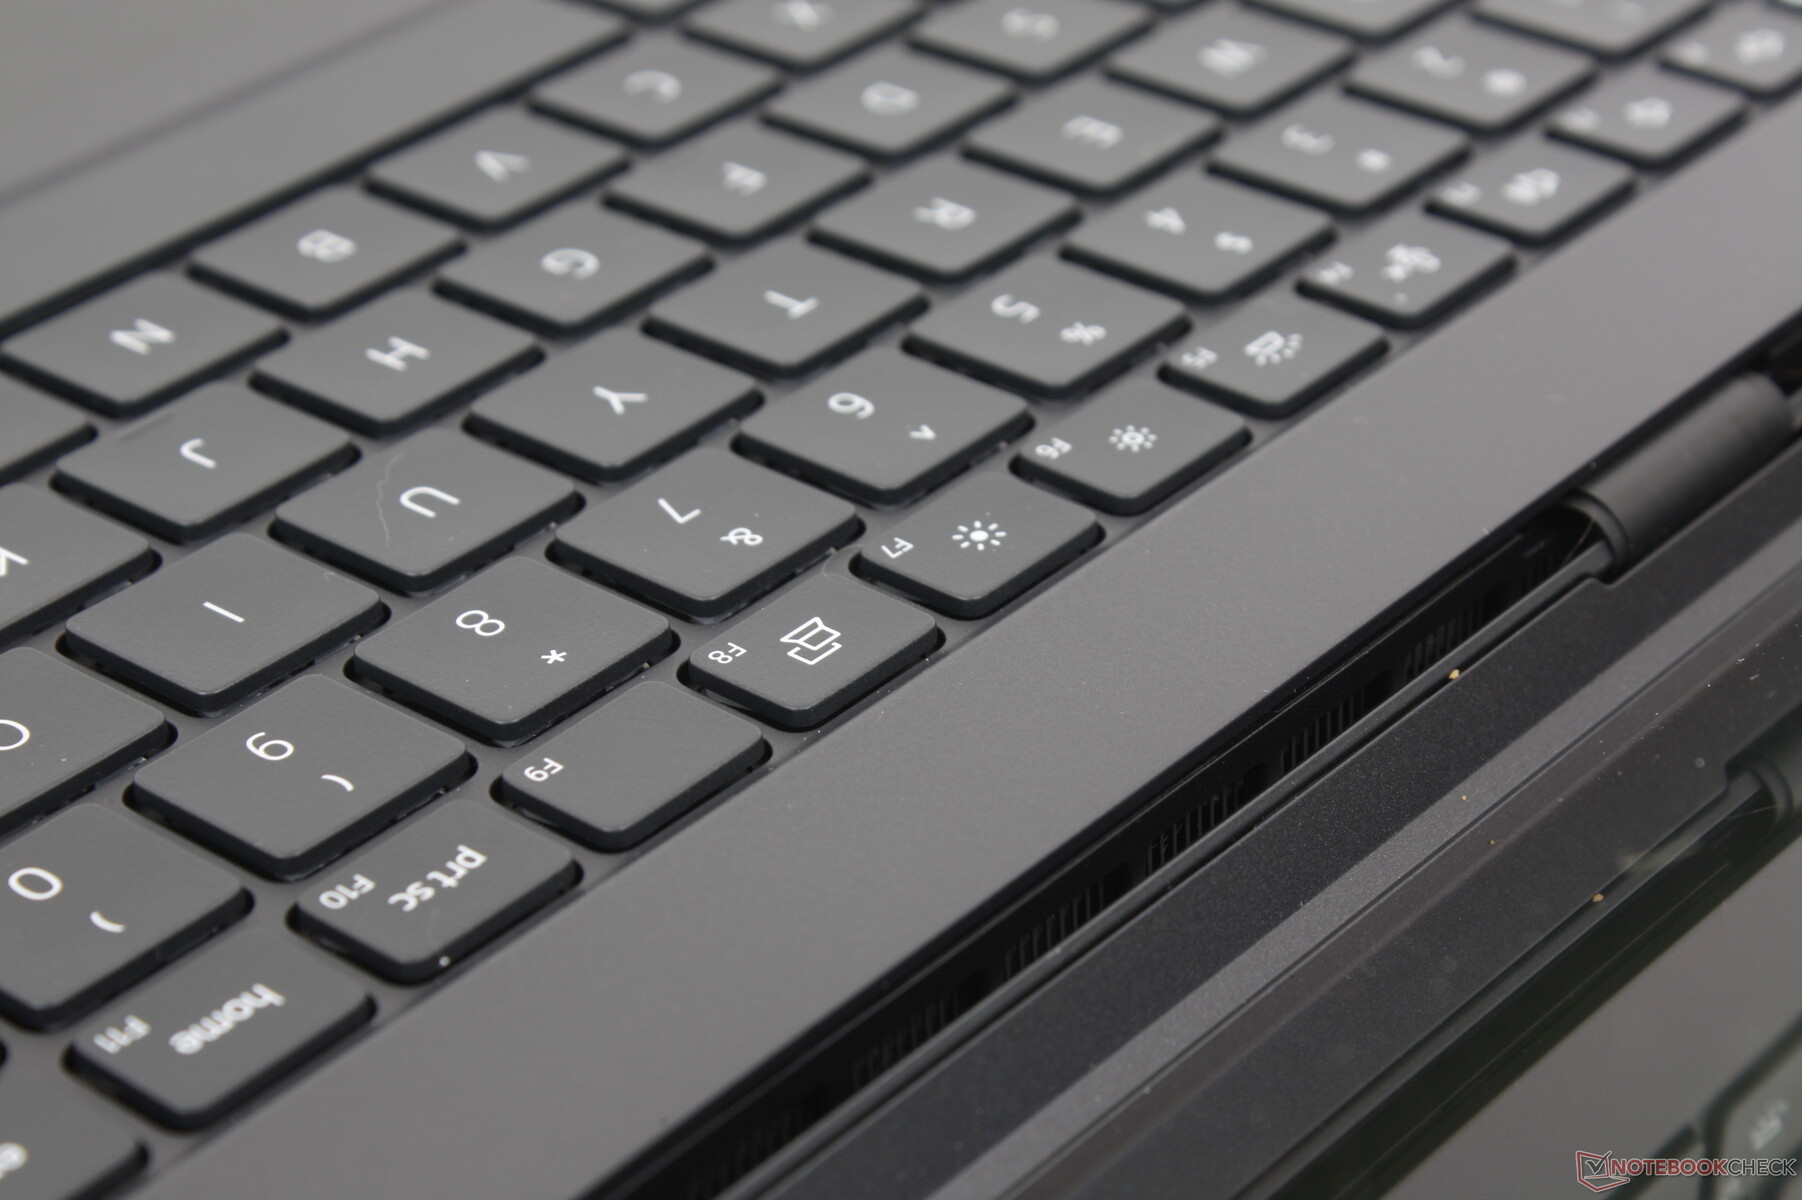
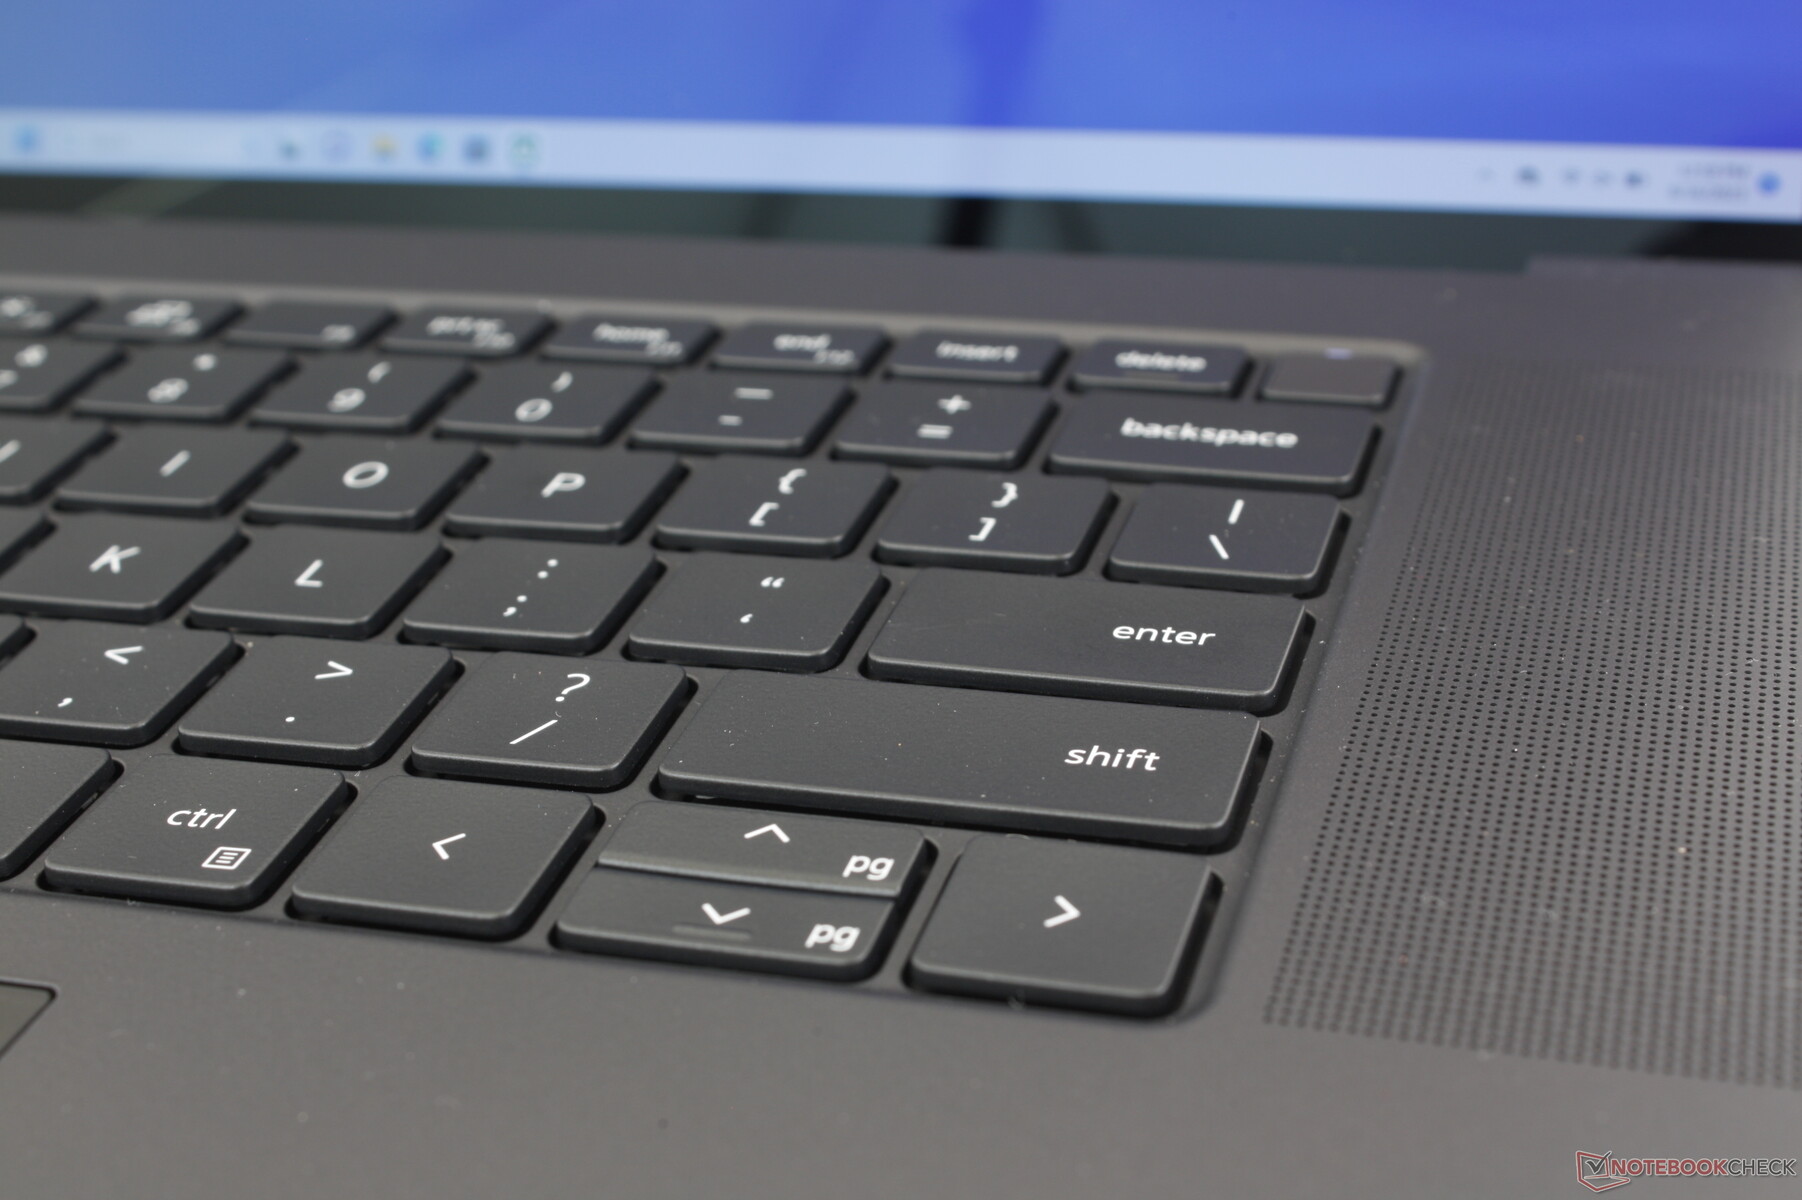
Périphériques d'entrée - légèrement différents de ceux du XPS
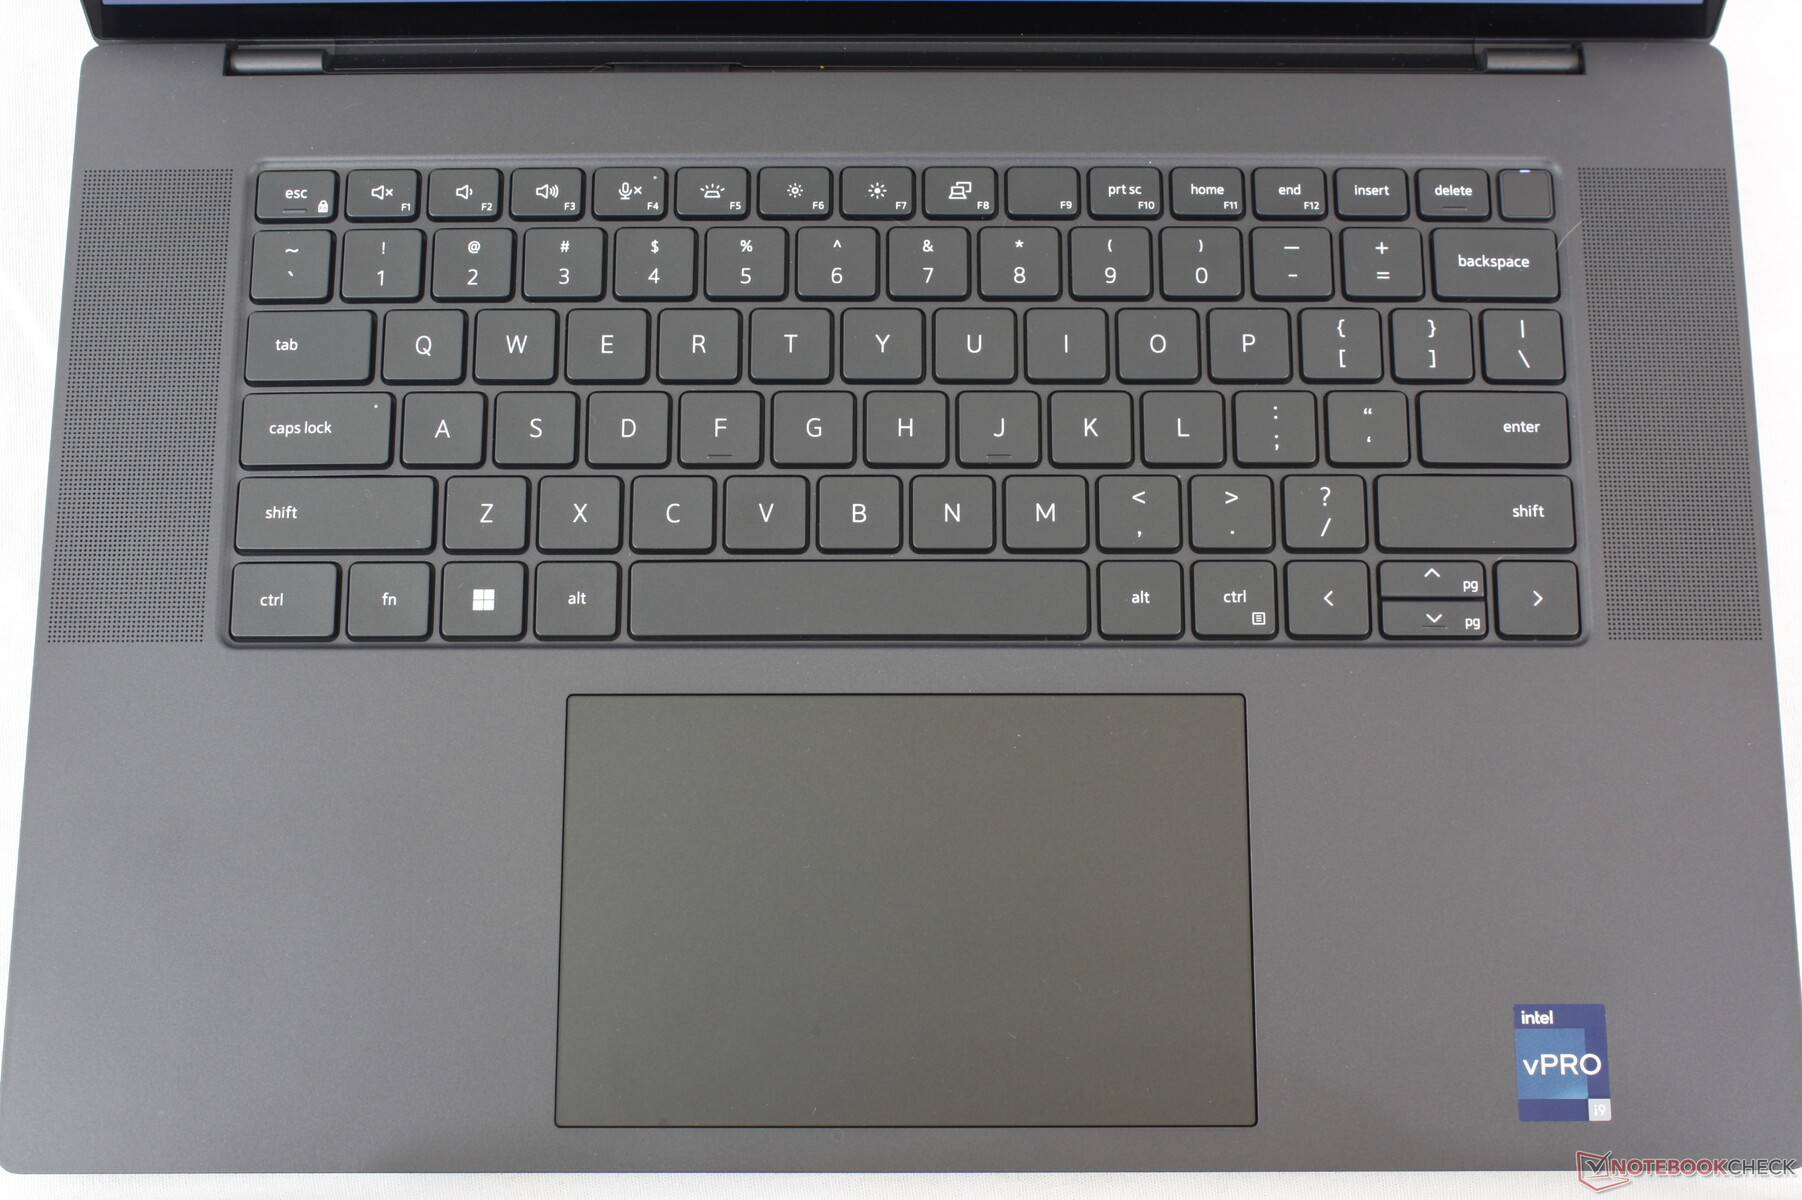
Clavier
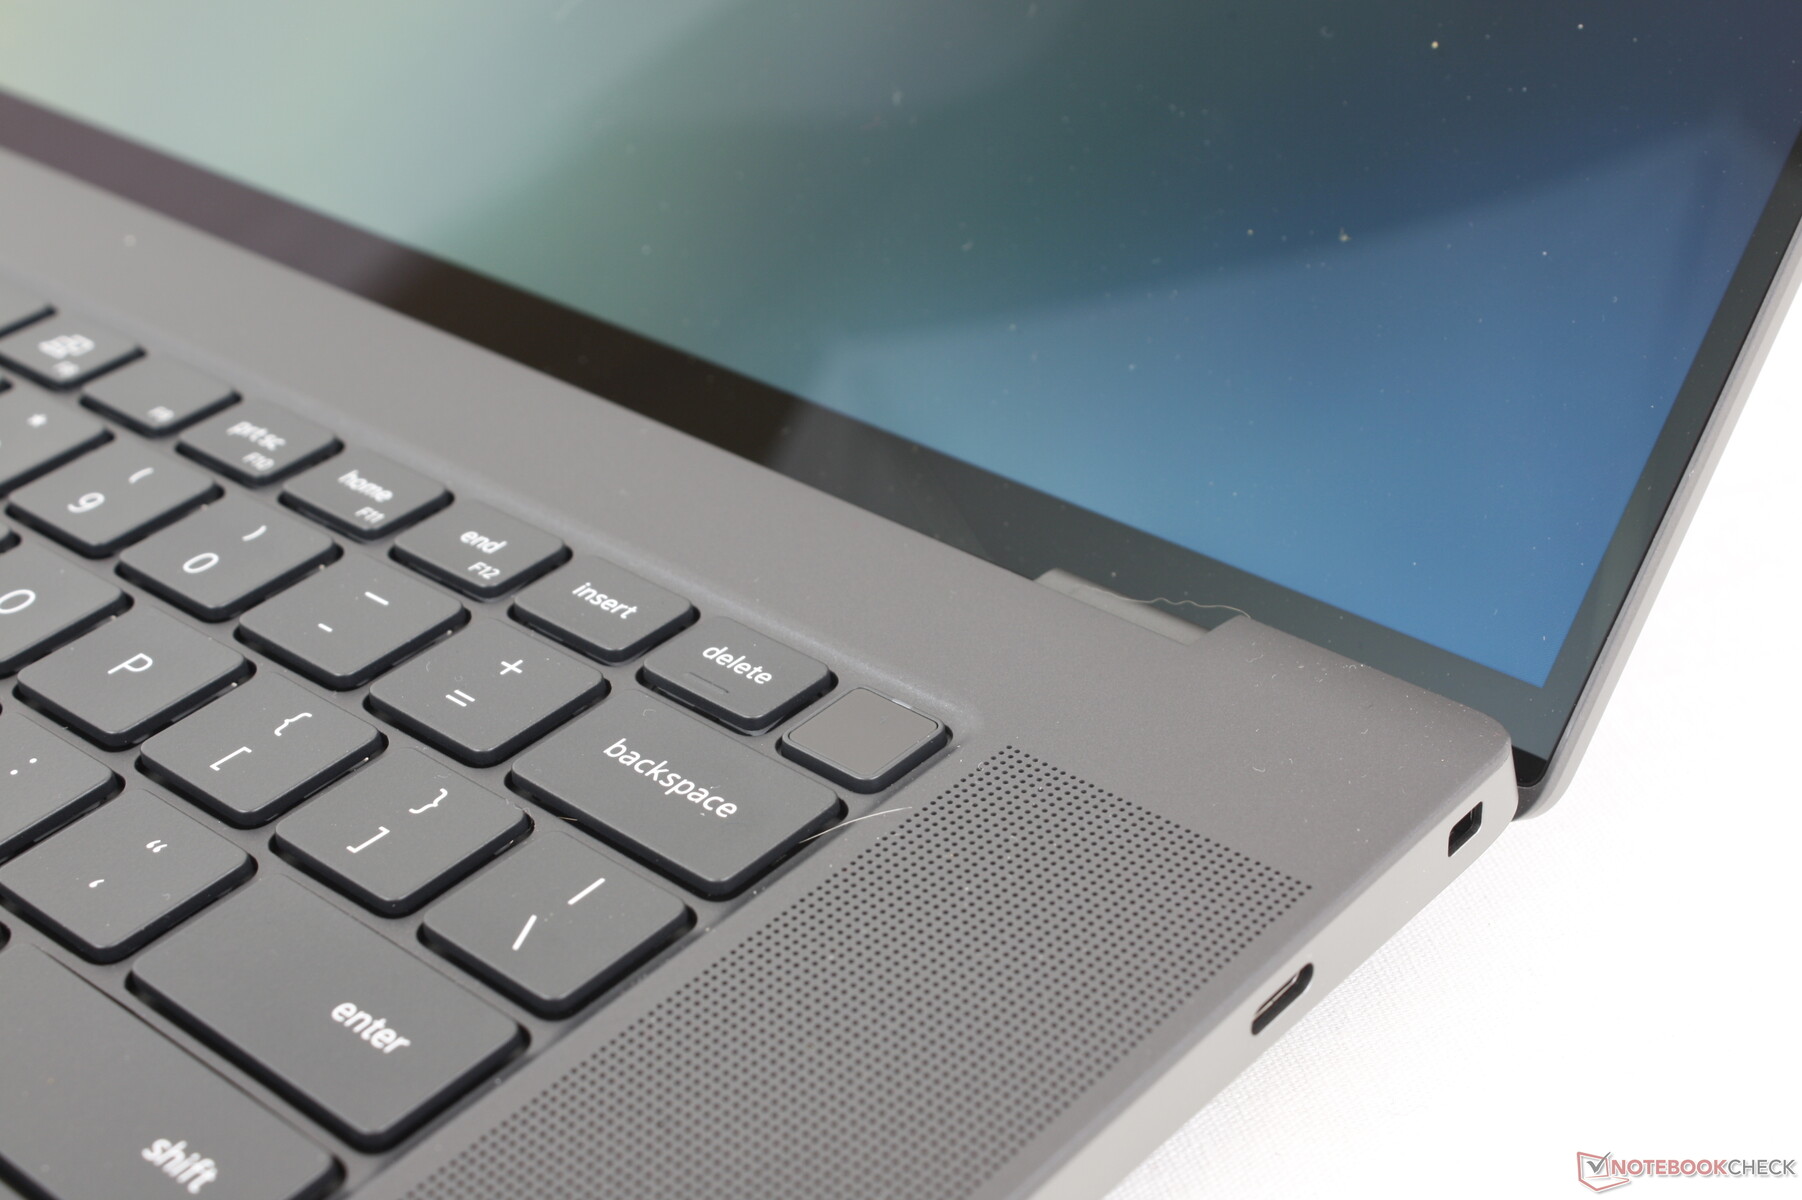
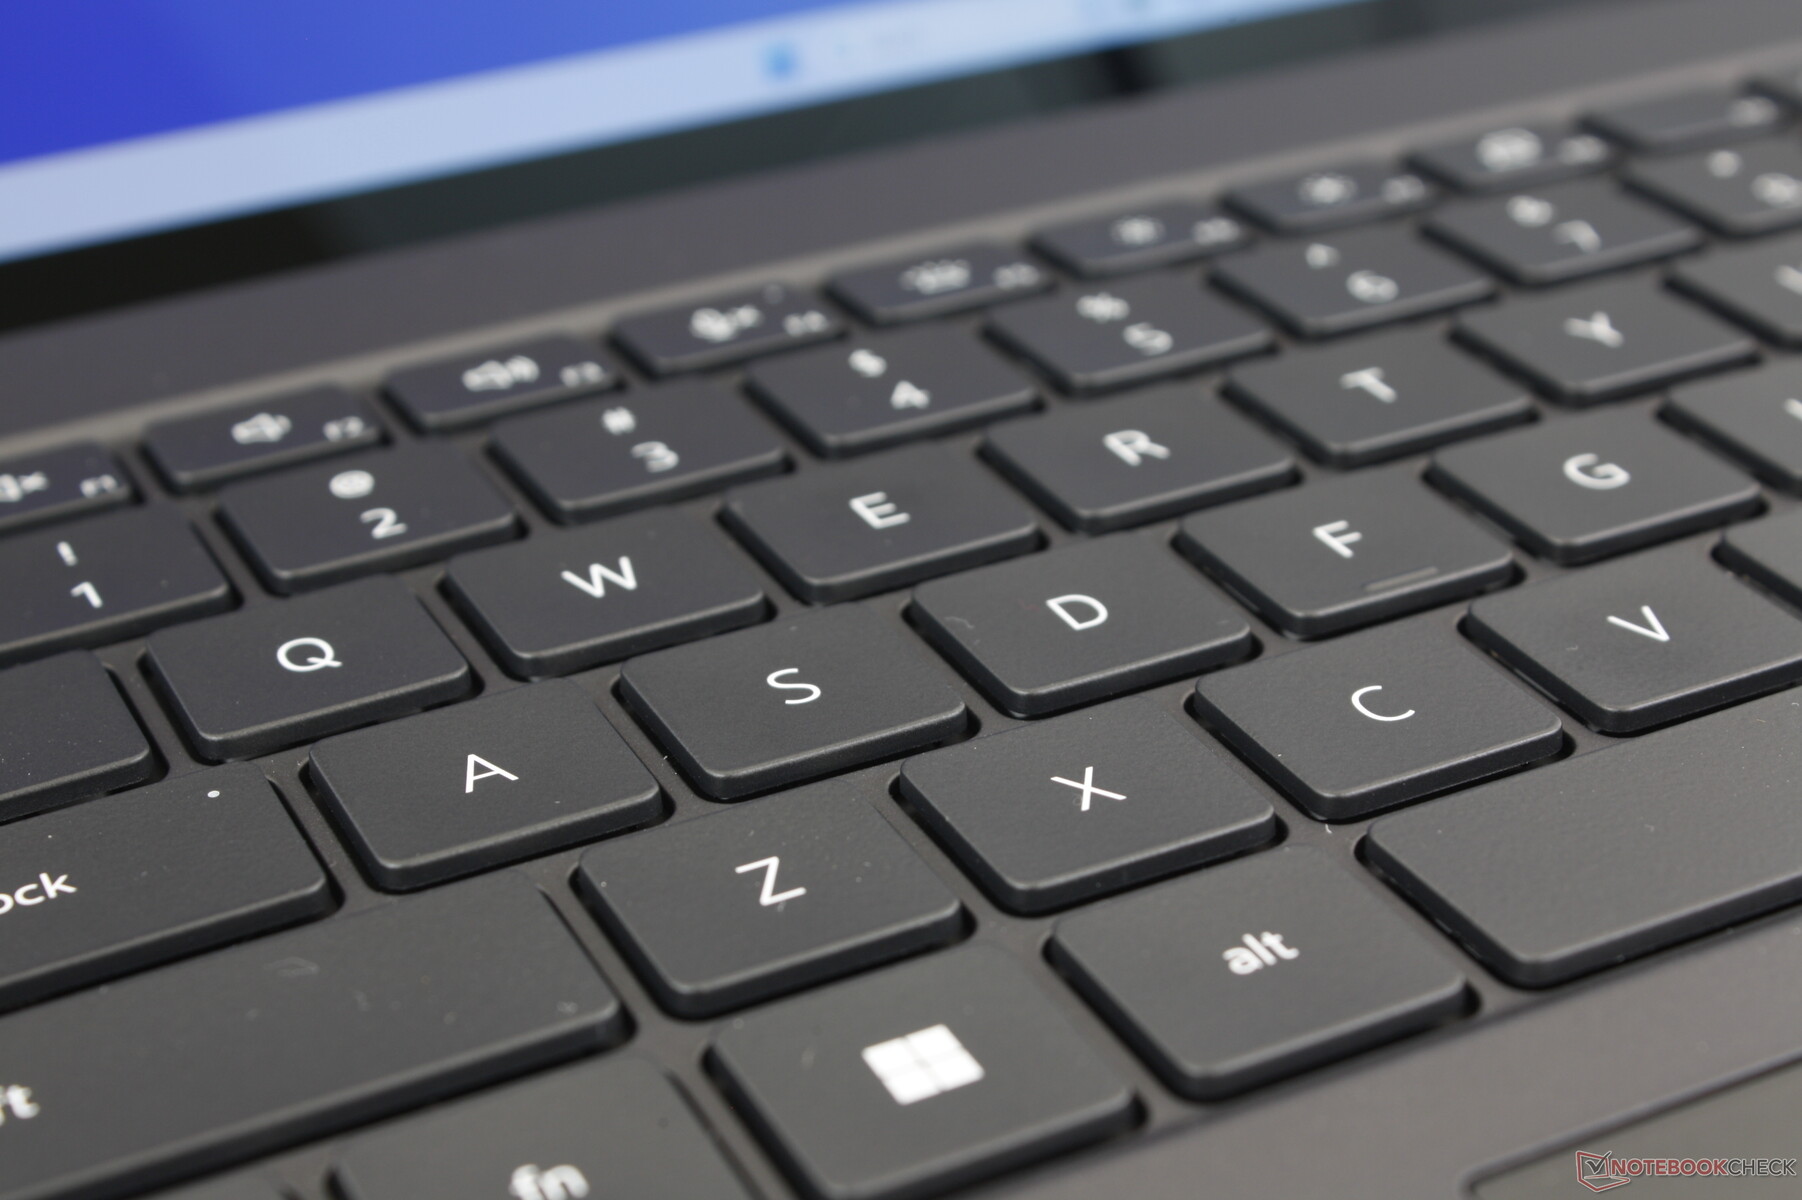
Le clavier peut sembler identique à celui du XPS 15 ou du Precision 5550 à première vue, mais il y a quelques changements importants. Tout d'abord, la rangée supérieure de touches de fonction est désormais plus large, car certains propriétaires de XPS 15 se sont plaints qu'elles étaient trop étroites. D'autre part, certaines touches situées sur les bords sont désormais légèrement plus courtes, notamment les touches Retour arrière, Entrée, Majuscule, Tabulation, Ctrl et Majuscule. Pour le reste, l'expérience de frappe reste la même, pour une sensation XPS familière.
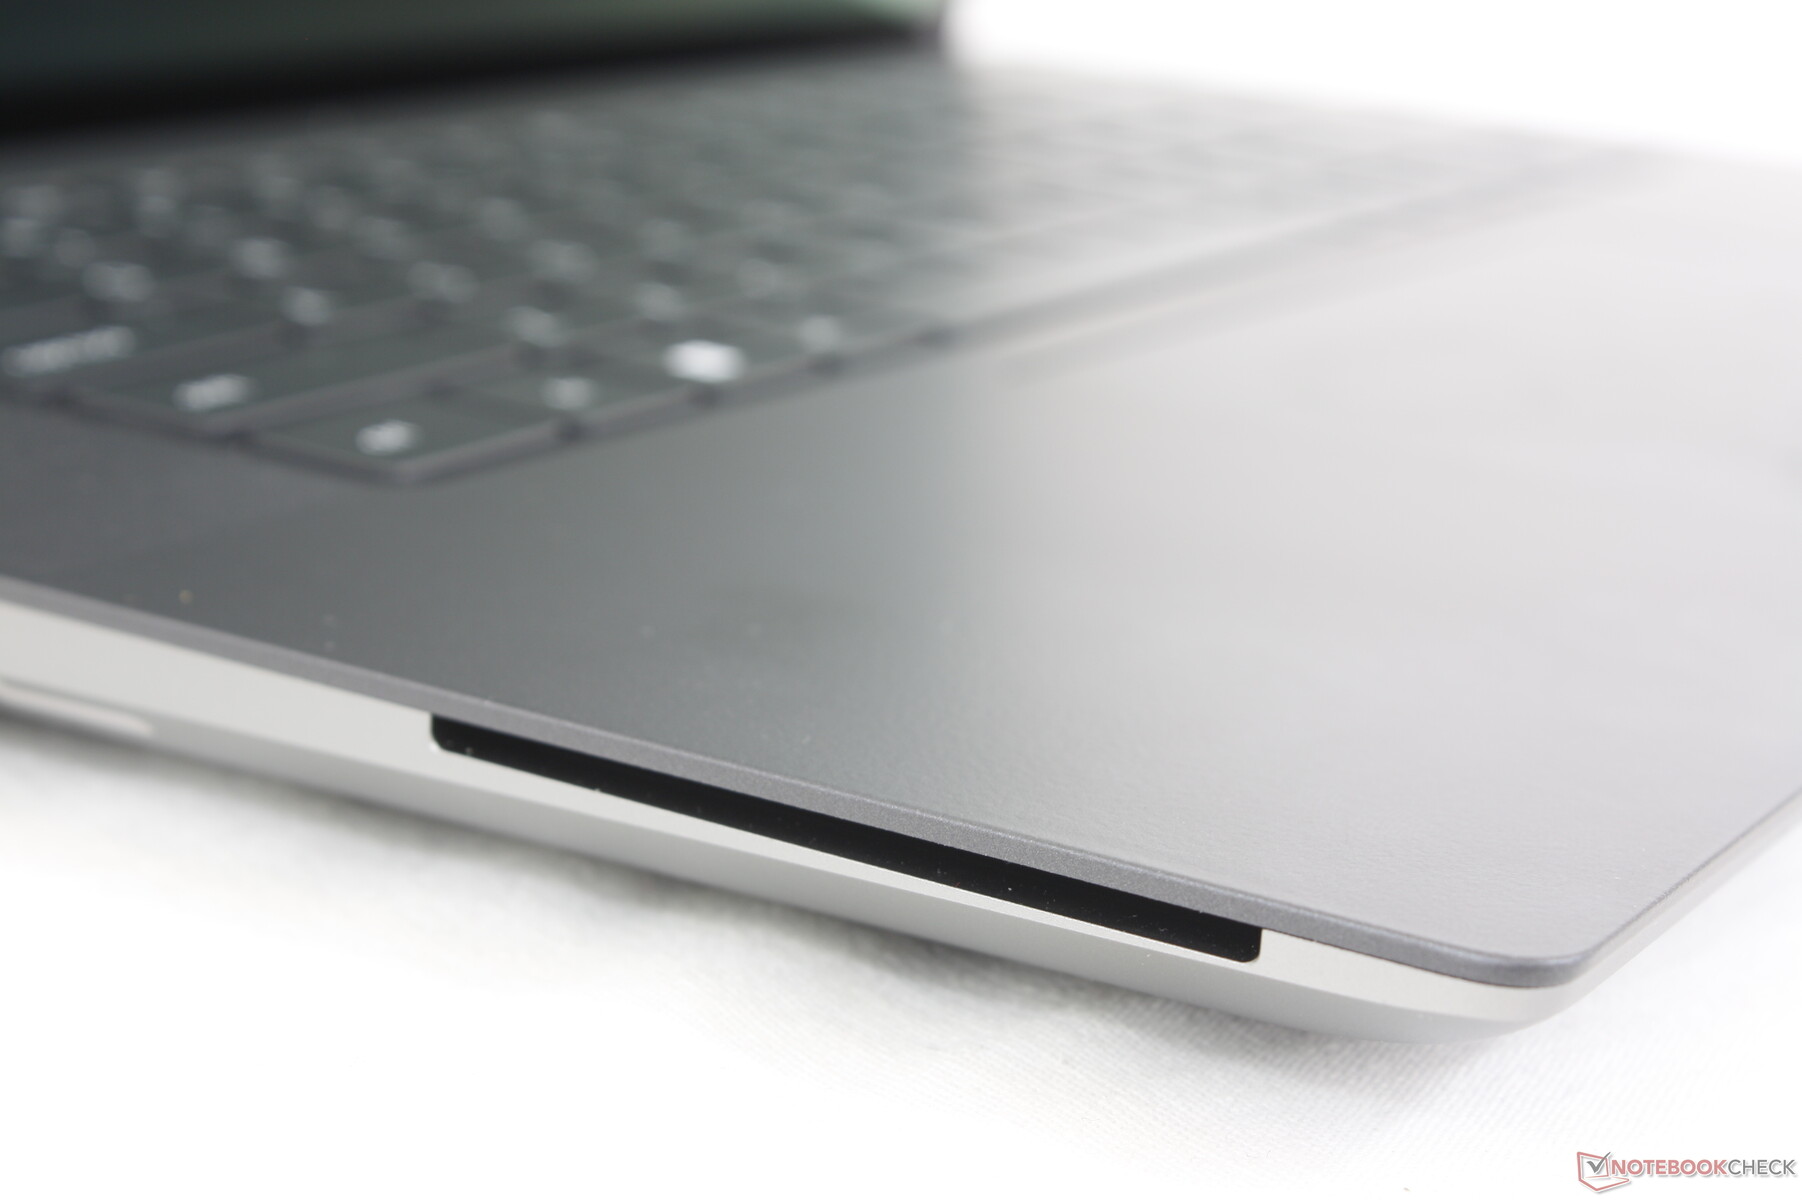
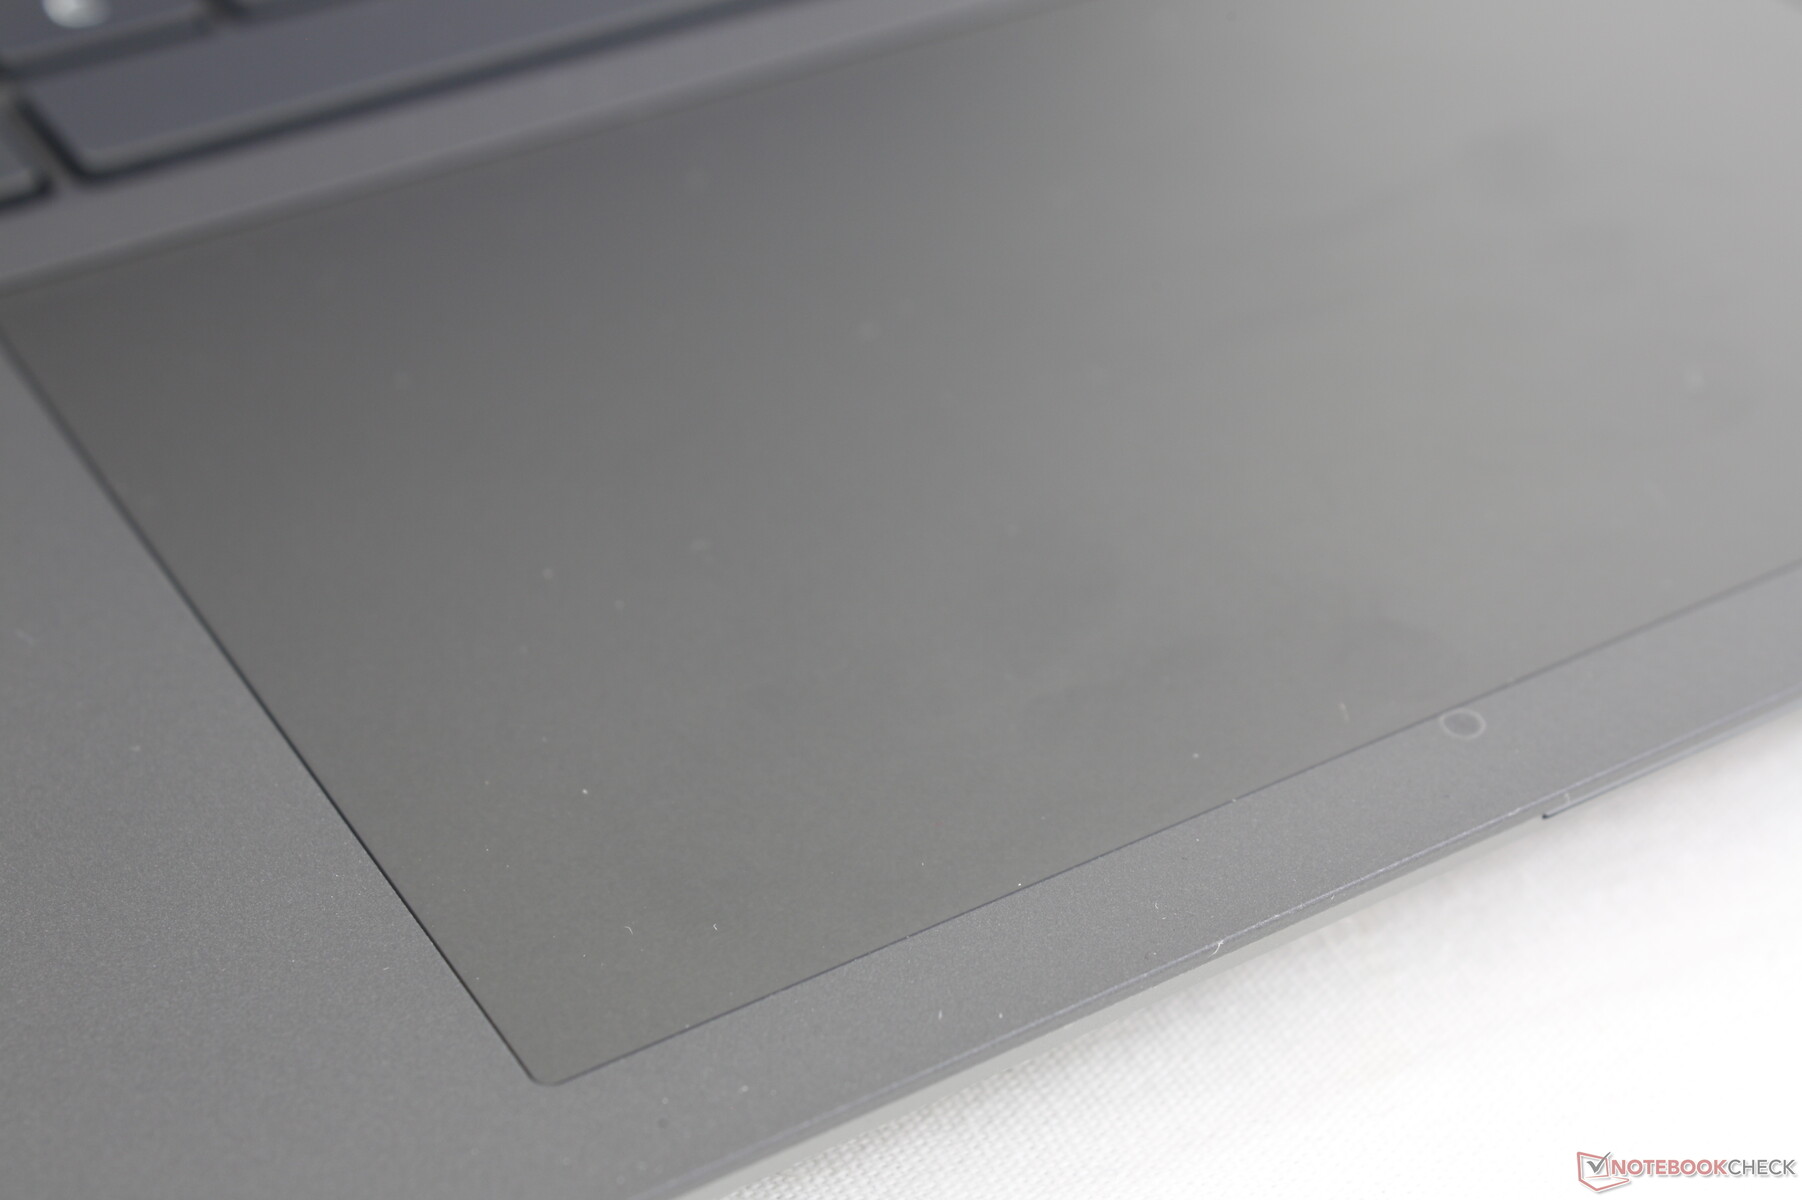
Pavé tactile
Le clavier est en fait plus petit que celui de l'ordinateur de 15 pouces Precision 5550 (13,7 x 8,5 cm contre 15,1 x 9 cm), malgré la taille plus grande de l'écran. Malgré cela, il reste spacieux et offre des propriétés de glissement fluides et fiables, comme sur un XPS 15.
Malheureusement, le retour d'information lorsque l'on clique sur le pavé tactile haptique est quasiment inexistant. En fait, il n'y a pratiquement pas de déplacement ou de retour audible. Une souris est fortement recommandée pour des actions de glisser-déposer plus précises.
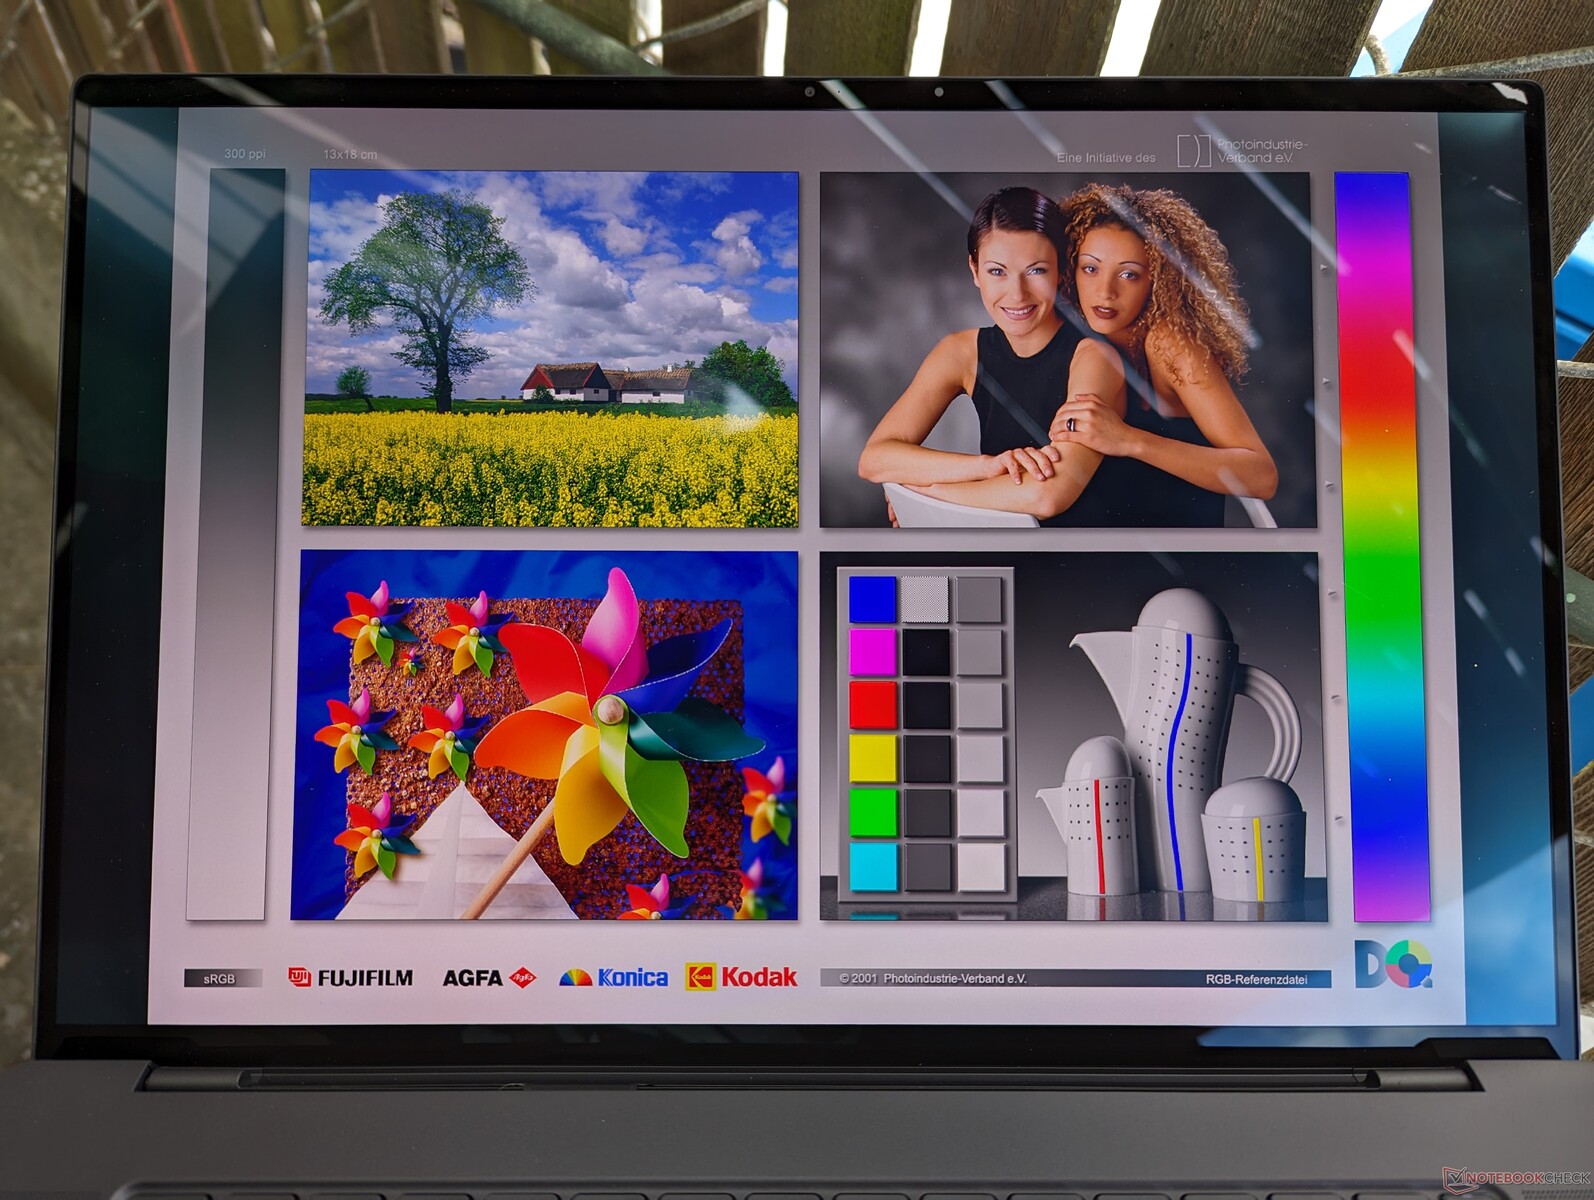
Affichage
Dell utilise le même panneau OLED Samsung 160YV03 pour ses écrans 16 pouces Precision 5680 et 16 pouces Precision 7670. Ainsi, les deux modèles offrent la même expérience visuelle, avec des temps de réponse similaires, des couleurs DCI-P3 complètes et des niveaux de luminosité identiques, comme le montre le tableau comparatif ci-dessous. Espérons que des options avec un taux de rafraîchissement plus élevé seront disponibles dans un avenir proche.
| |||||||||||||||||||||||||
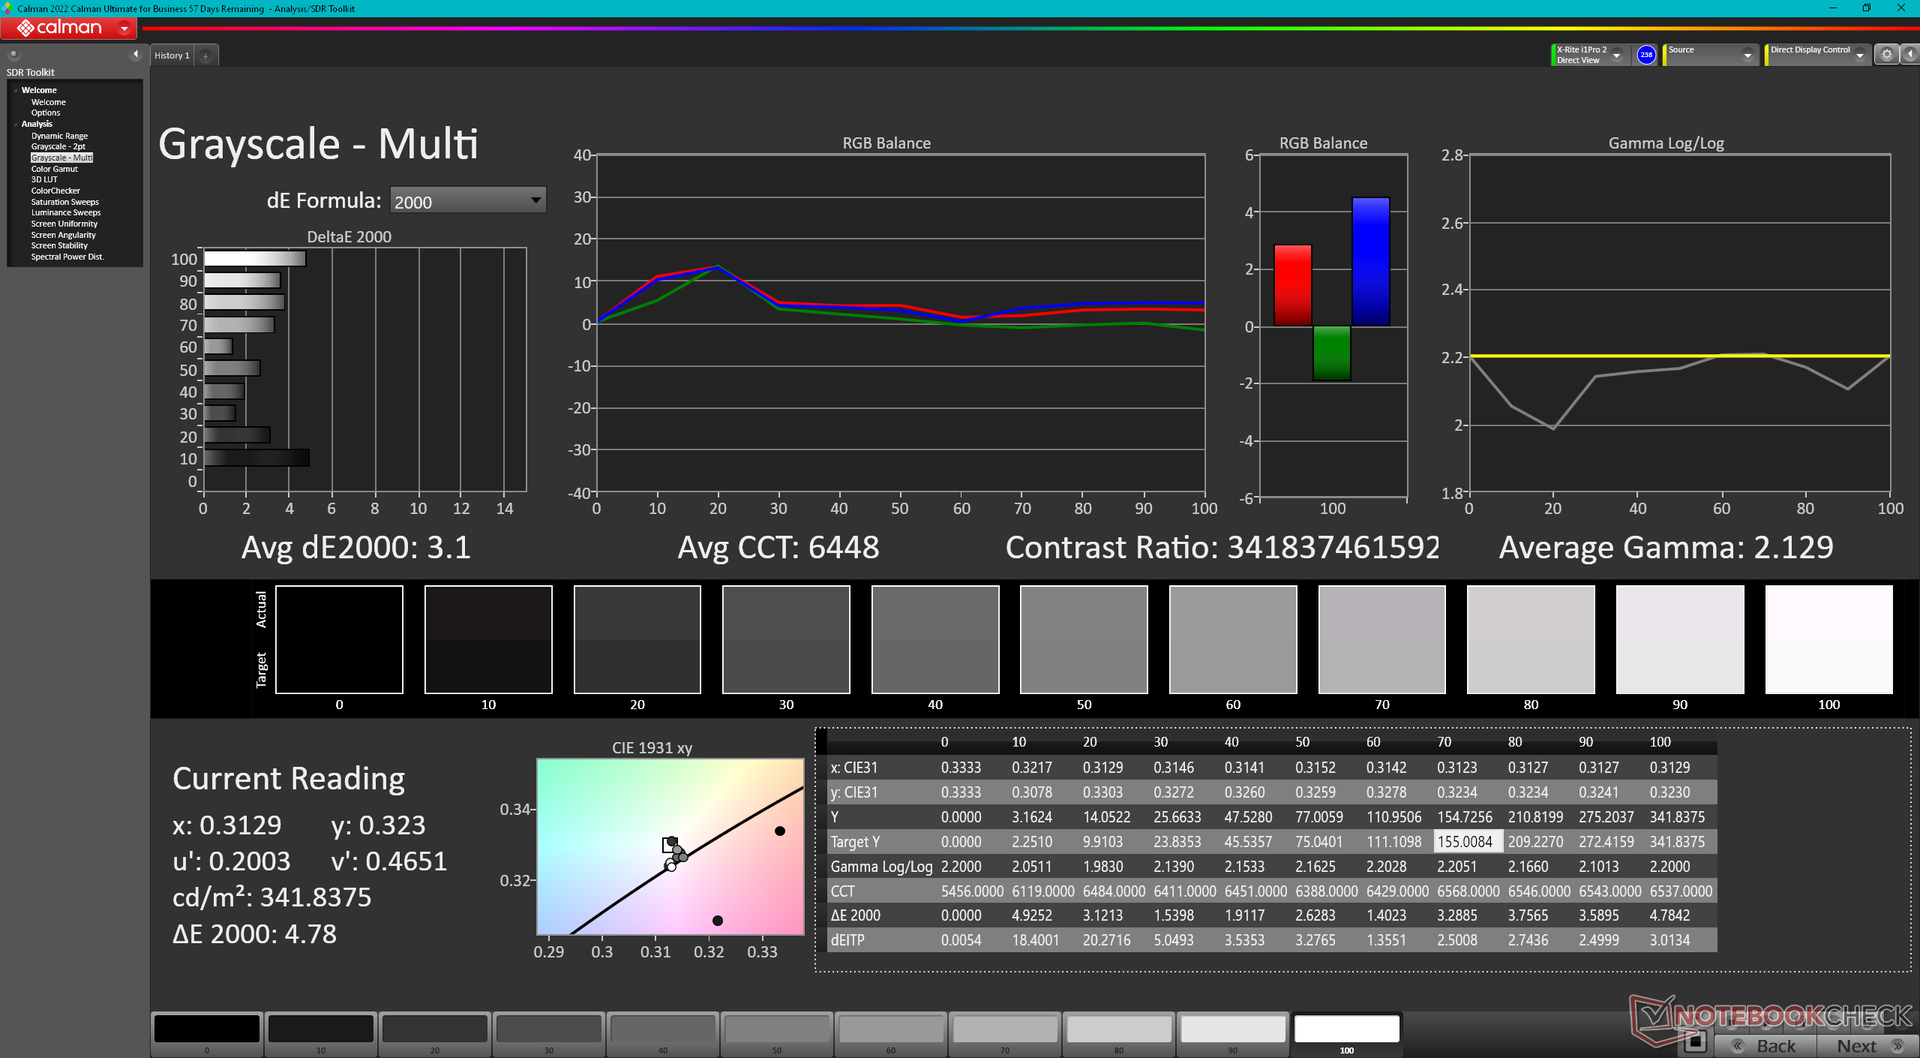
Homogénéité de la luminosité: 98 %
Valeur mesurée au centre, sur batterie: 345.7 cd/m²
Contraste: ∞:1 (Valeurs des noirs: 0 cd/m²)
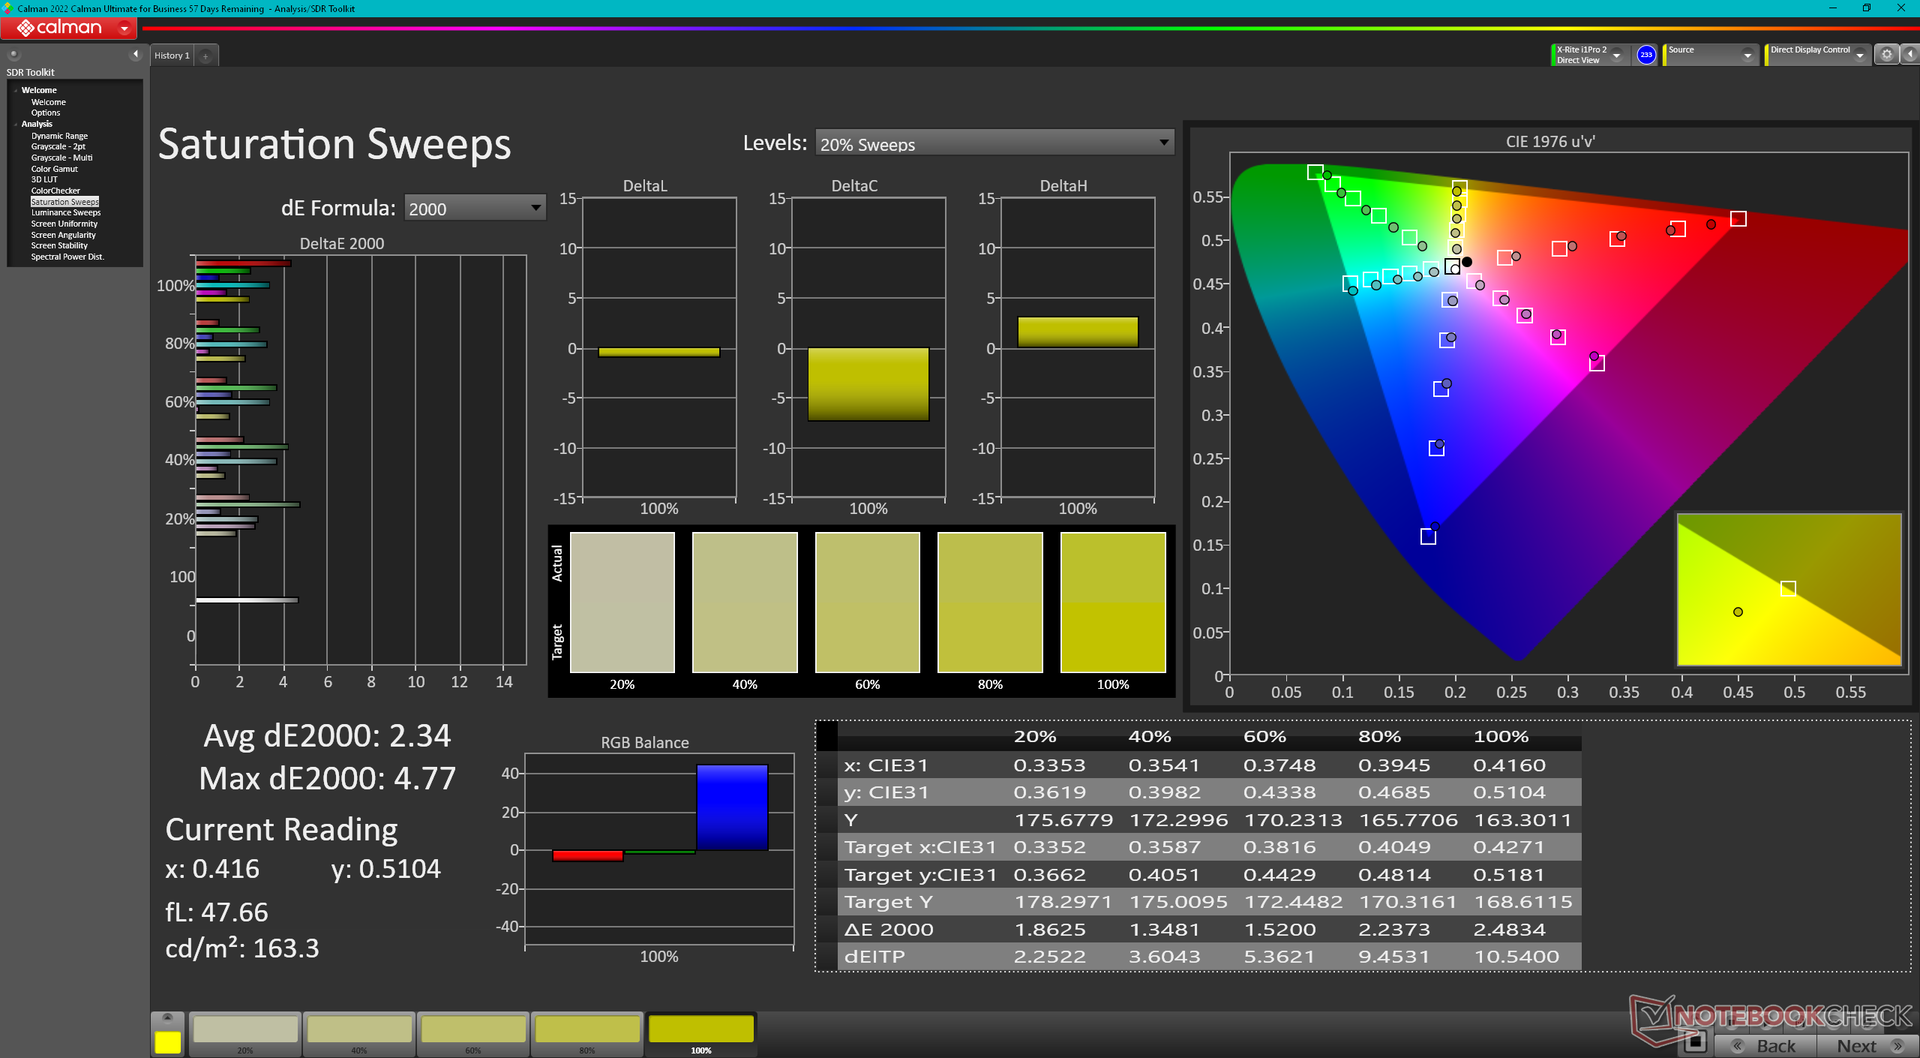
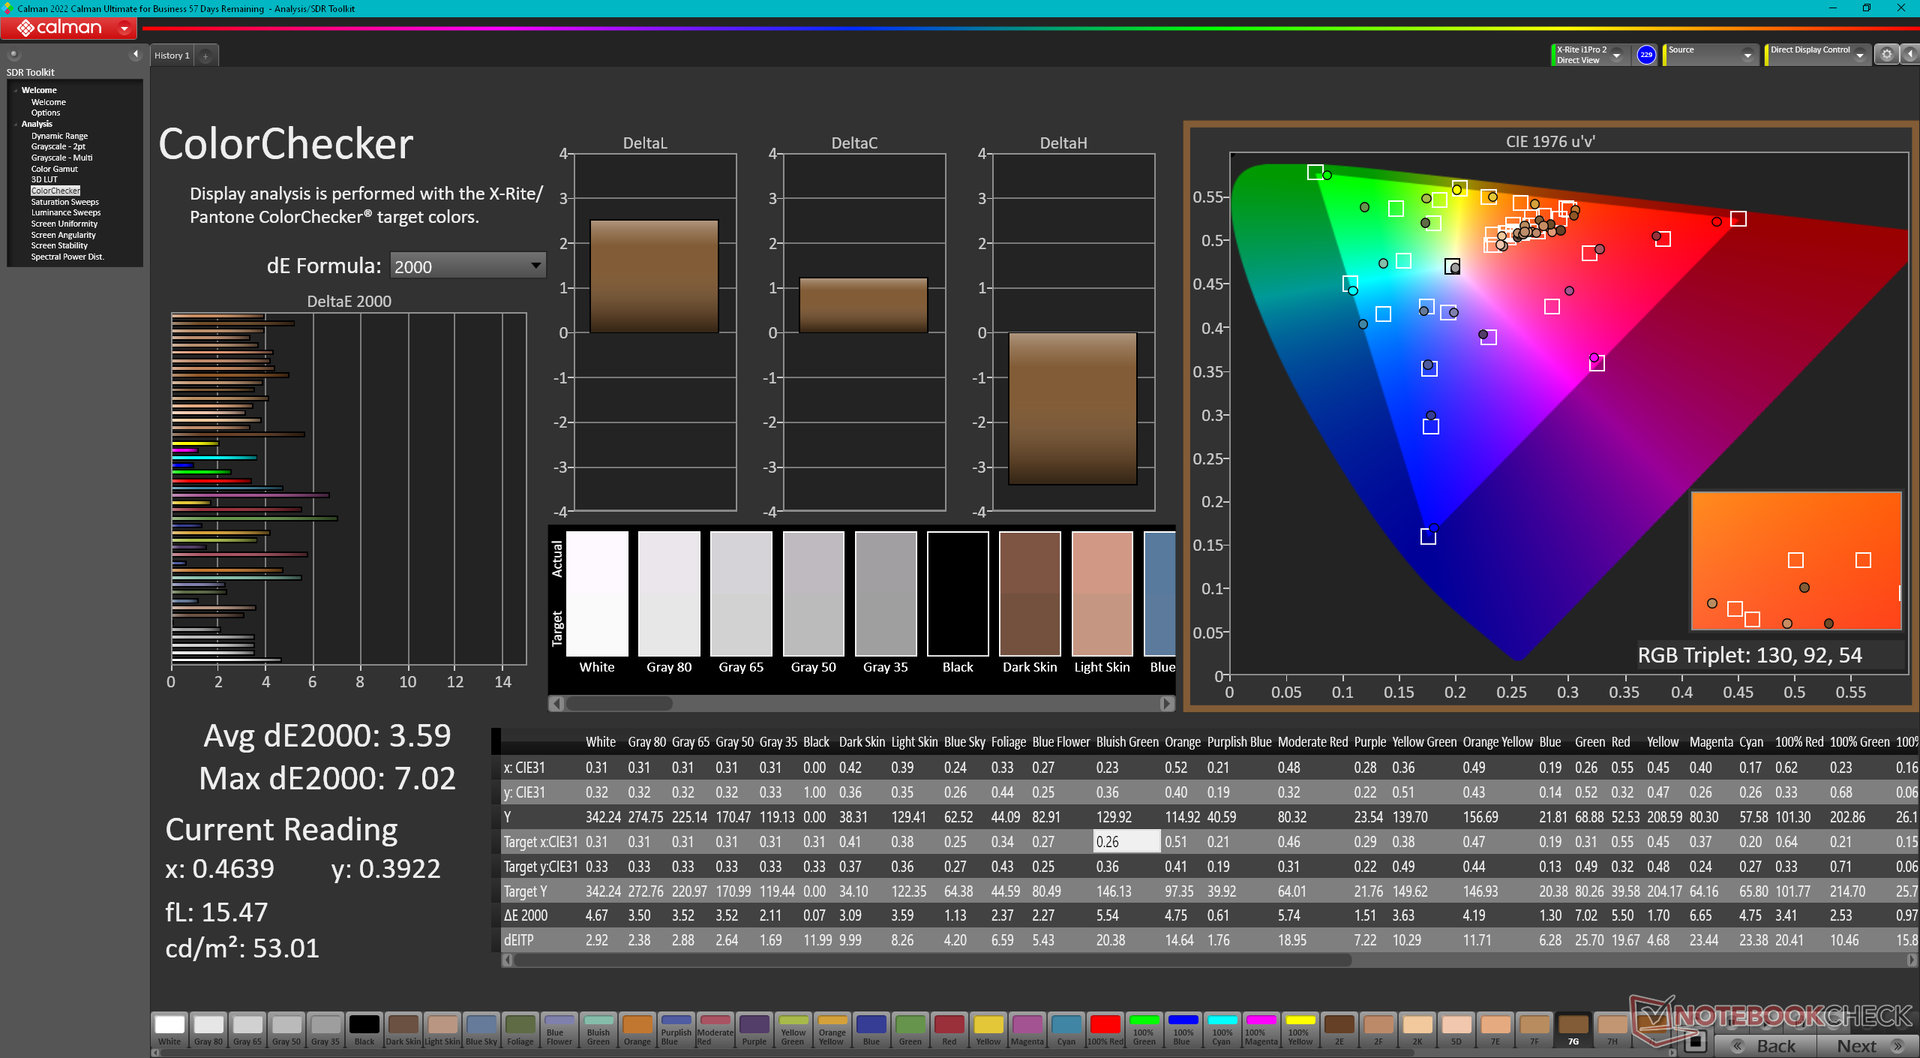
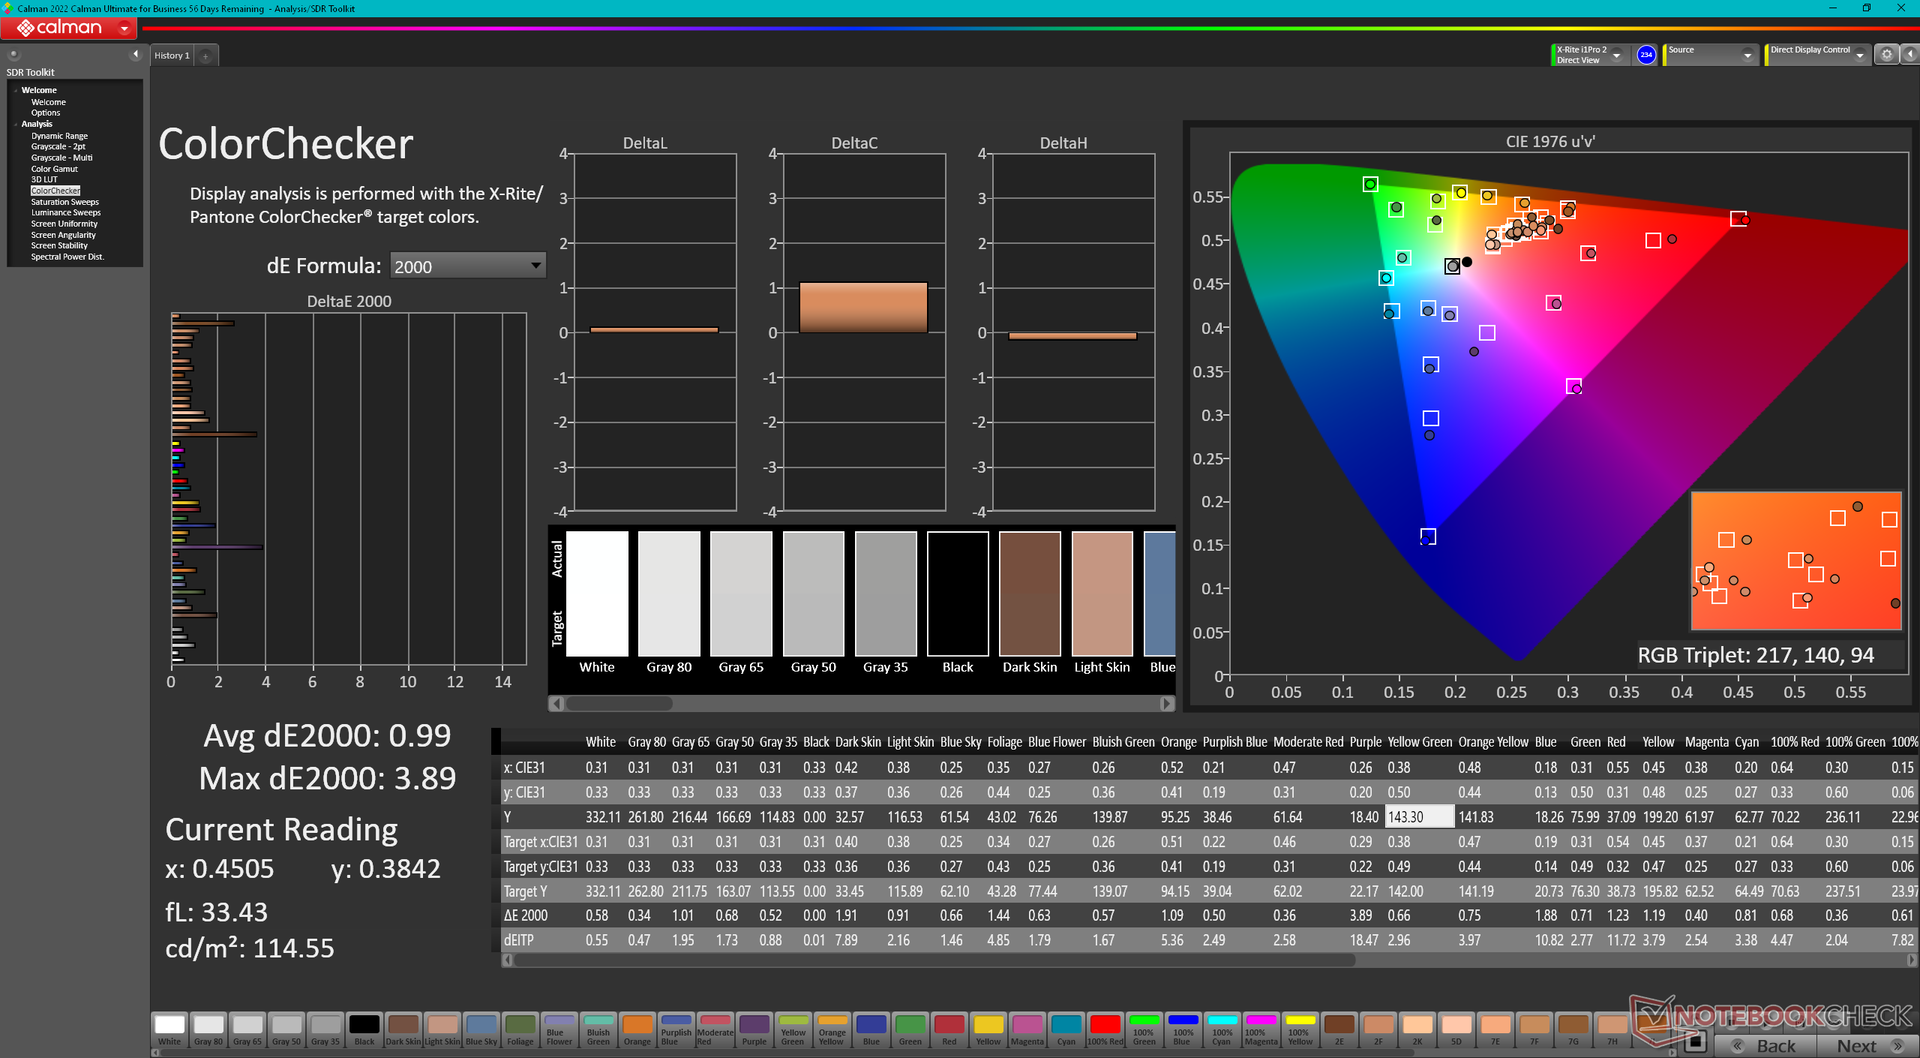
ΔE ColorChecker Calman: 3.59 | ∀{0.5-29.43 Ø4.72}
calibrated: 0.99
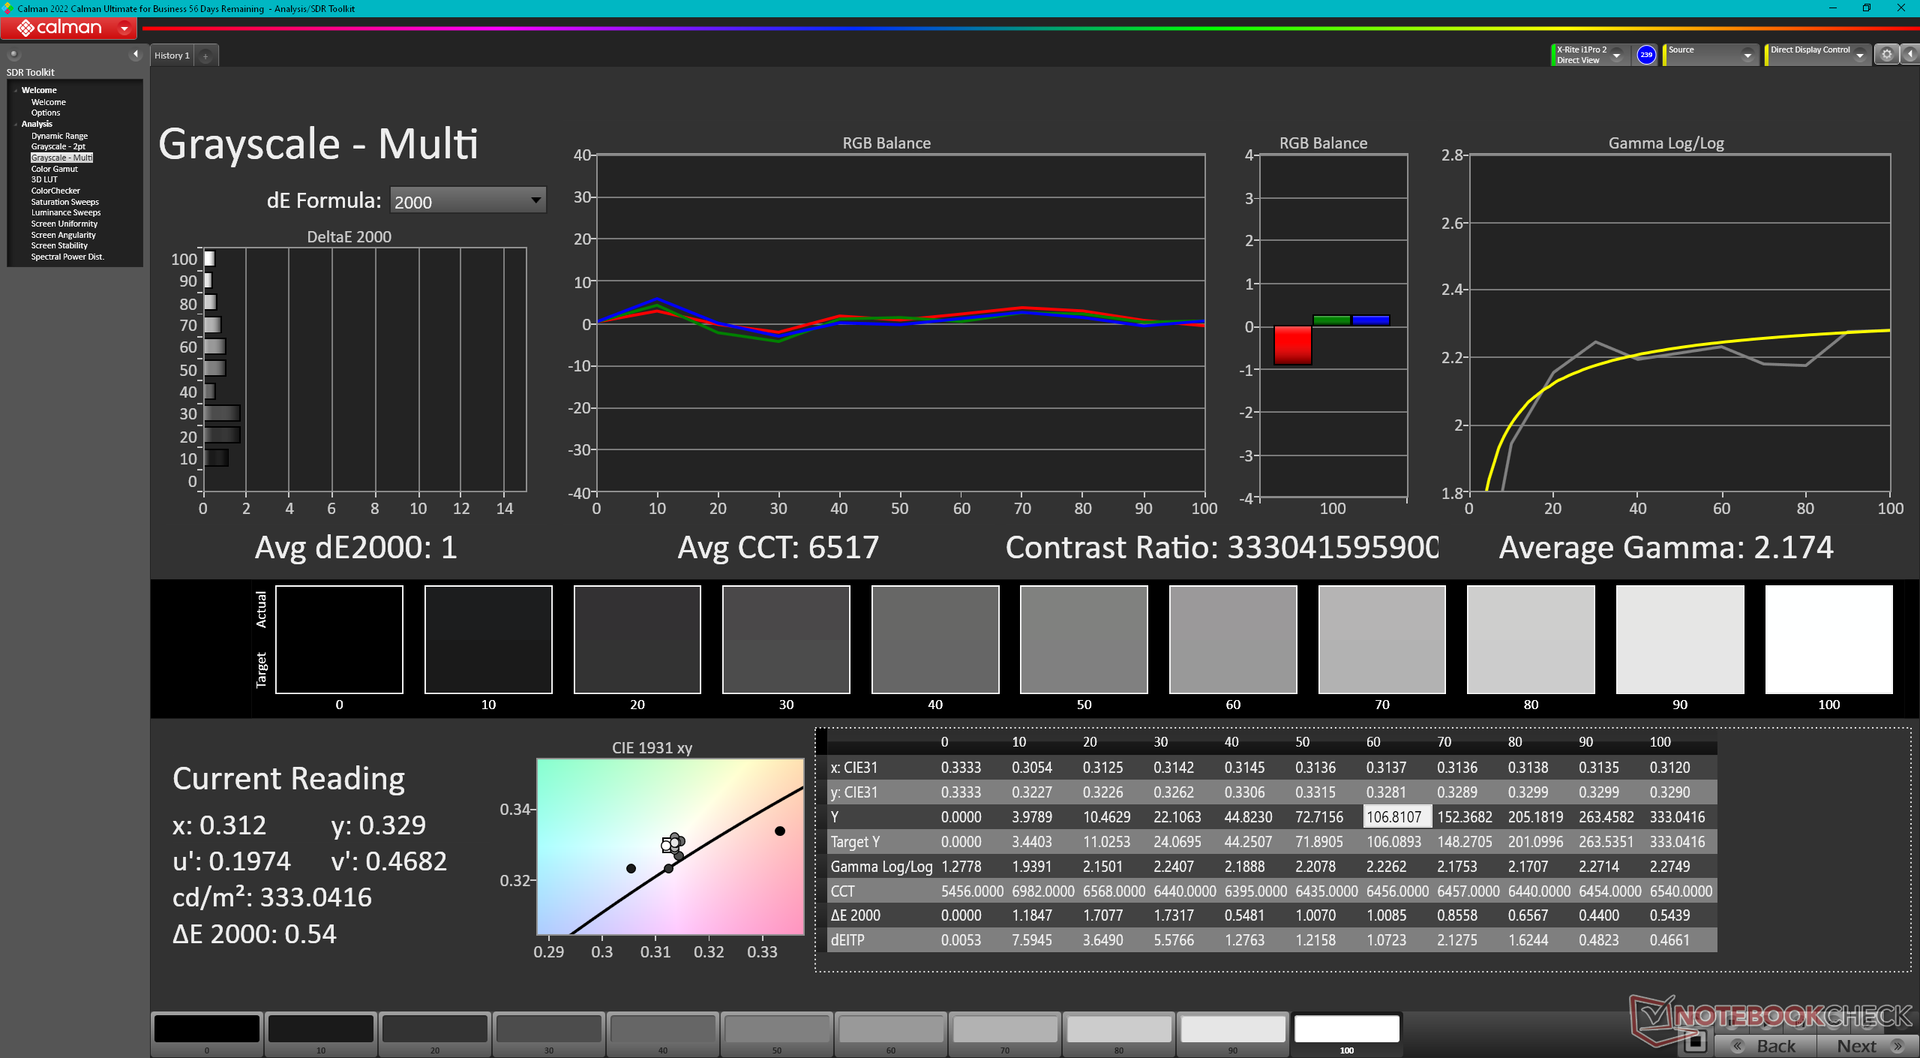
ΔE Greyscale Calman: 3.1 | ∀{0.09-98 Ø4.97}
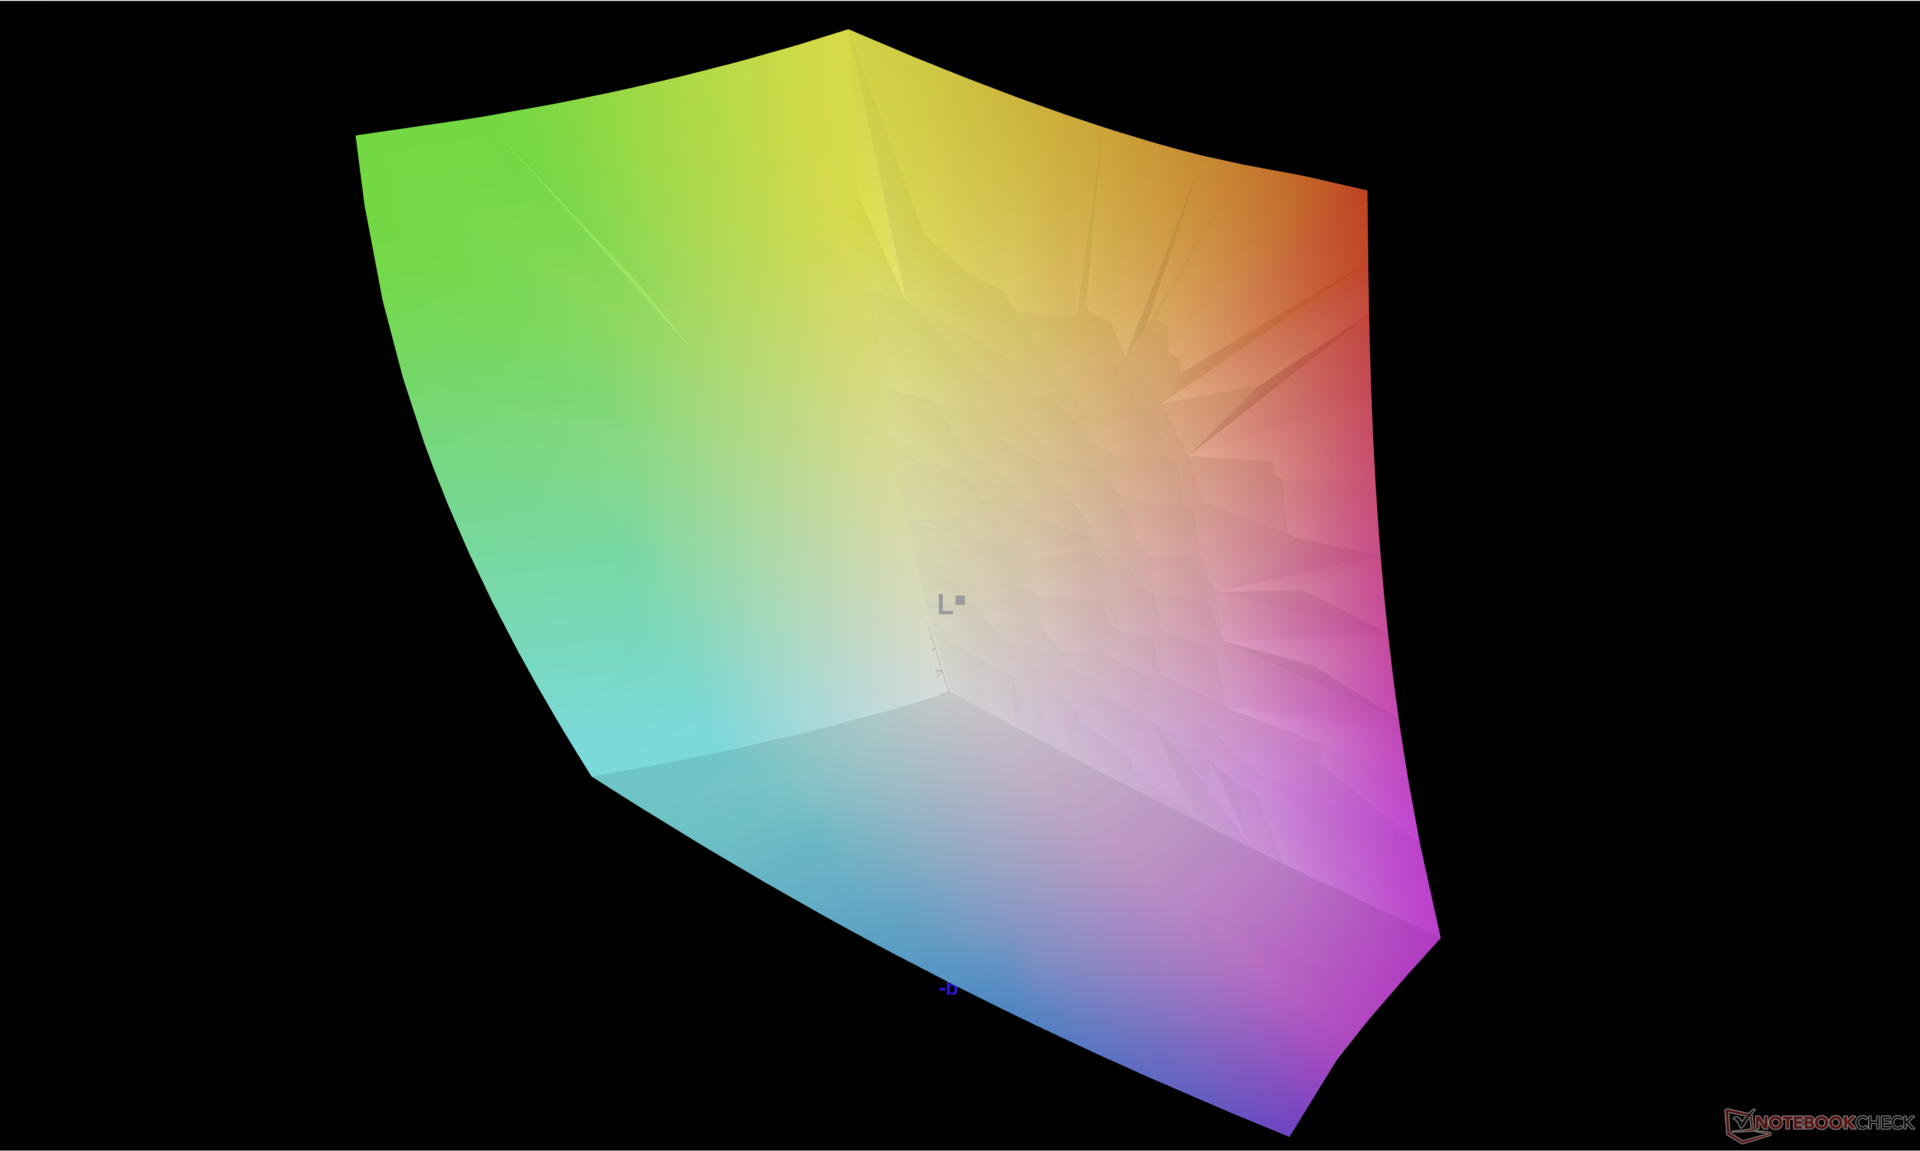
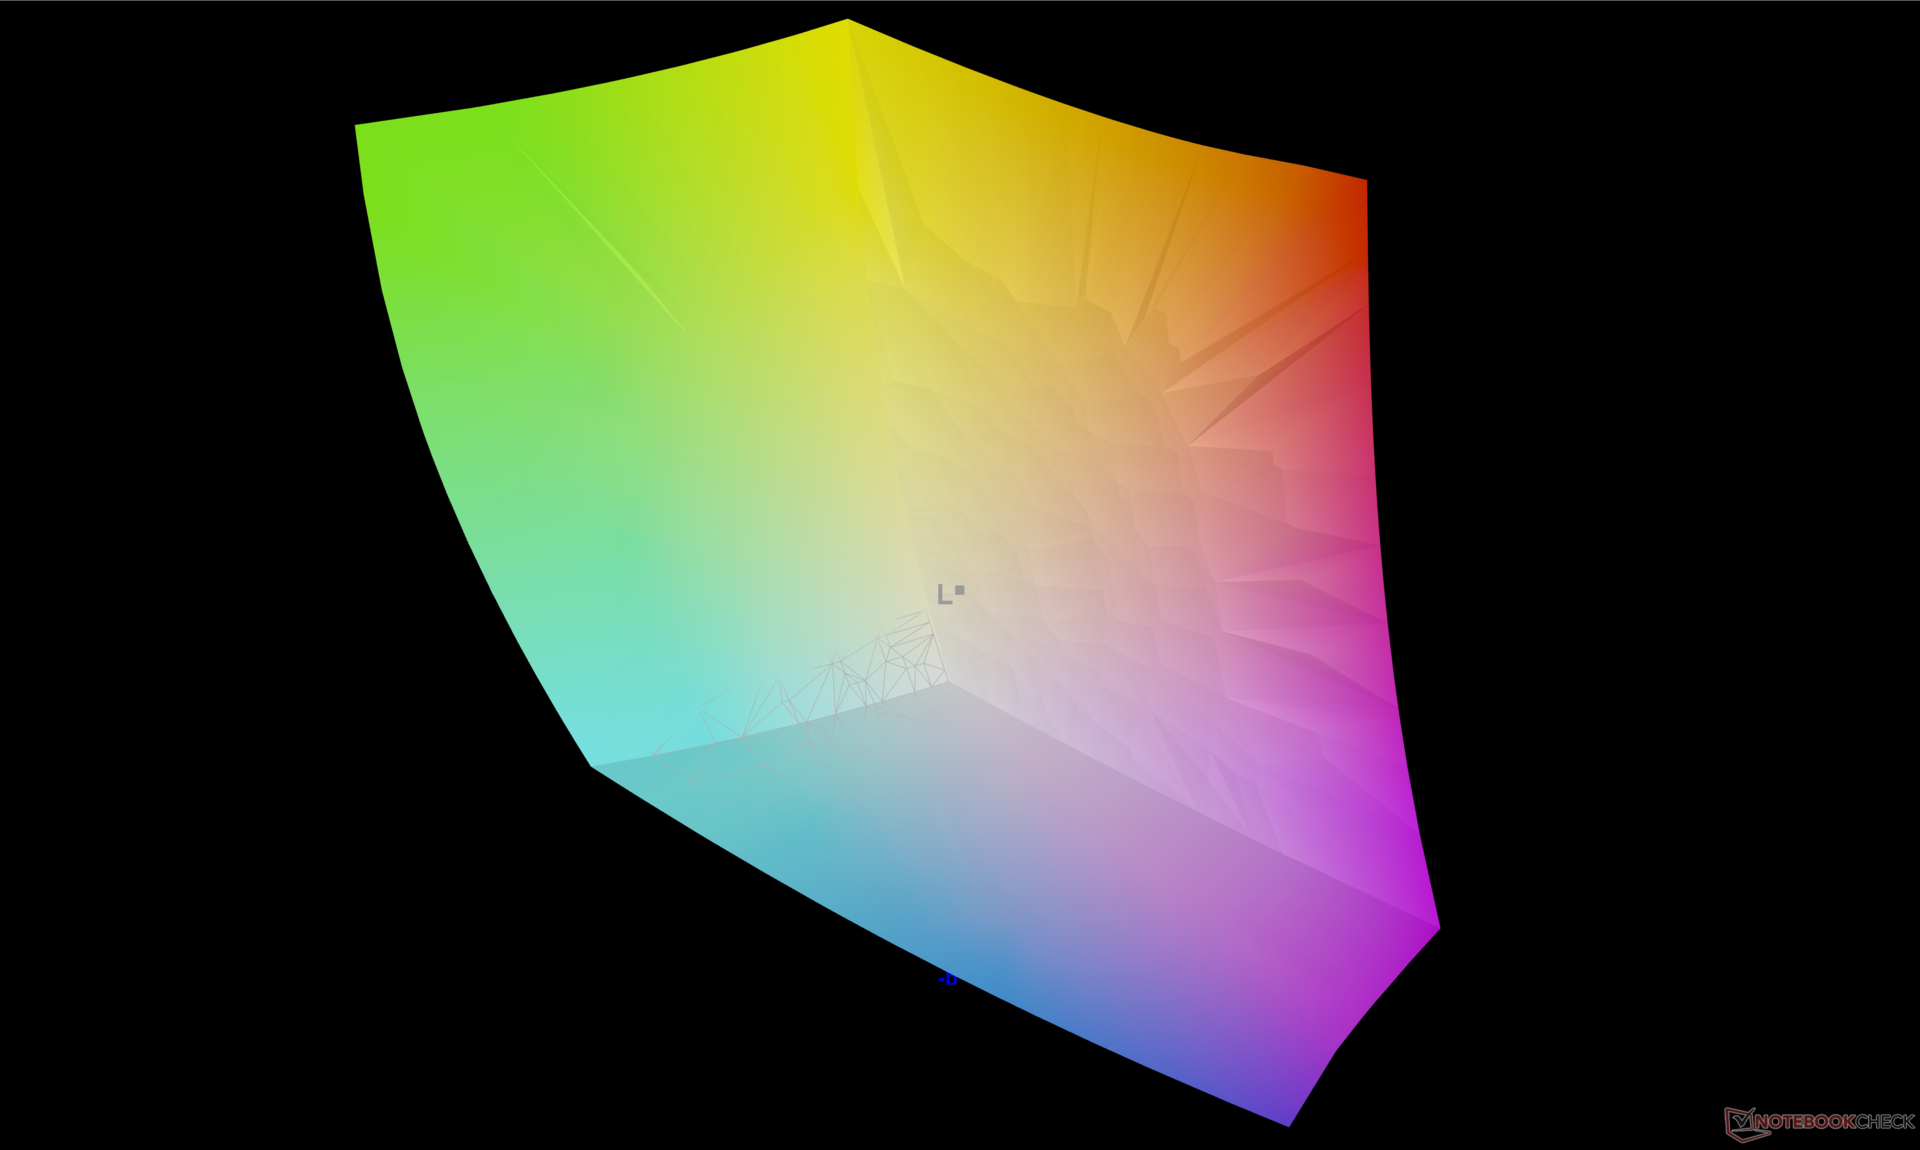
97.5% AdobeRGB 1998 (Argyll 3D)
100% sRGB (Argyll 3D)
99.9% Display P3 (Argyll 3D)
Gamma: 2.13
CCT: 6448 K
| Dell Precision 5000 5680 Samsung 160YV03, OLED, 3840x2400, 16" | Dell Precision 7000 7670 Performance Samsung 160YV03, OLED, 3840x2400, 16" | HP ZBook Fury 16 G9 BOE0A52, IPS, 3840x2400, 16" | Lenovo ThinkPad P16 G1 RTX A5500 LP160UQ1-SPB1, IPS, 3840x2400, 16" | MSI CreatorPro Z16P B12UKST B160QAN02.N, IPS, 2560x1600, 16" | Asus ExpertBook B6 Flip B6602FC2 AU Optronics Model: AUOE495, IPS, 2560x1600, 16" | |
|---|---|---|---|---|---|---|
| Display | 0% | -5% | -7% | -4% | -5% | |
| Display P3 Coverage (%) | 99.9 | 99.9 0% | 97.4 -3% | 82.9 -17% | 97.6 -2% | 97.9 -2% |
| sRGB Coverage (%) | 100 | 100 0% | 99.9 0% | 98.9 -1% | 99.9 0% | 99.89 0% |
| AdobeRGB 1998 Coverage (%) | 97.5 | 98.1 1% | 86.3 -11% | 95.9 -2% | 87.4 -10% | 85.52 -12% |
| Response Times | -9% | -551% | -2297% | -490% | -1452% | |
| Response Time Grey 50% / Grey 80% * (ms) | 1.68 ? | 1.84 ? -10% | 13.7 ? -715% | 45.6 ? -2614% | 12.8 ? -662% | 36 ? -2043% |
| Response Time Black / White * (ms) | 1.77 ? | 1.92 ? -8% | 8.6 ? -386% | 36.8 ? -1979% | 7.4 ? -318% | 17 ? -860% |
| PWM Frequency (Hz) | 60 ? | 59.52 ? | ||||
| Screen | -5% | -33% | 33% | 30% | -6% | |
| Brightness middle (cd/m²) | 345.7 | 325.2 -6% | 530.5 53% | 601.9 74% | 407 18% | 440 27% |
| Brightness (cd/m²) | 349 | 328 -6% | 476 36% | 569 63% | 388 11% | 418 20% |
| Brightness Distribution (%) | 98 | 97 -1% | 83 -15% | 77 -21% | 88 -10% | 82 -16% |
| Black Level * (cd/m²) | 0.57 | 0.47 | 0.36 | 0.3 | ||
| Colorchecker dE 2000 * | 3.59 | 4.59 -28% | 2.26 37% | 2.45 32% | 1.3 64% | 2.81 22% |
| Colorchecker dE 2000 max. * | 7.02 | 7.65 -9% | 4.46 36% | 2.5 64% | 4.62 34% | |
| Colorchecker dE 2000 calibrated * | 0.99 | 4.73 -378% | 0.7 29% | 2.99 -202% | ||
| Greyscale dE 2000 * | 3.1 | 2.5 19% | 1 68% | 2.6 16% | 2.1 32% | 0.91 71% |
| Gamma | 2.13 103% | 2.1 105% | 2.28 96% | 2.3 96% | 2.26 97% | 2.2 100% |
| CCT | 6448 101% | 6541 99% | 6543 99% | 6805 96% | 6437 101% | 6600 98% |
| Contrast (:1) | 931 | 1281 | 1131 | 1467 | ||
| Moyenne finale (programmes/paramètres) | -5% /
-4% | -196% /
-119% | -757% /
-401% | -155% /
-65% | -488% /
-247% |
* ... Moindre est la valeur, meilleures sont les performances
L'écran est convenablement calibré dès sa sortie de l'emballage, avec des valeurs moyennes de deltaE comprises entre 3 et 4. Notre profil ICM calibré peut être téléchargé gratuitement ci-dessus.
Temps de réponse de l'écran
| ↔ Temps de réponse noir à blanc | ||
|---|---|---|
| 1.77 ms ... hausse ↗ et chute ↘ combinées | ↗ 0.8 ms hausse |  |
| ↘ 0.97 ms chute | ||
| L'écran montre de très faibles temps de réponse, parfait pour le jeu. En comparaison, tous les appareils testés affichent entre 0.1 (minimum) et 240 (maximum) ms. » 10 % des appareils testés affichent de meilleures performances. Cela signifie que les latences relevées sont meilleures que la moyenne (19.8 ms) de tous les appareils testés. | ||
| ↔ Temps de réponse gris 50% à gris 80% | ||
| 1.68 ms ... hausse ↗ et chute ↘ combinées | ↗ 0.97 ms hausse |  |
| ↘ 0.71 ms chute | ||
| L'écran montre de très faibles temps de réponse, parfait pour le jeu. En comparaison, tous les appareils testés affichent entre 0.165 (minimum) et 636 (maximum) ms. » 8 % des appareils testés affichent de meilleures performances. Cela signifie que les latences relevées sont meilleures que la moyenne (31 ms) de tous les appareils testés. | ||
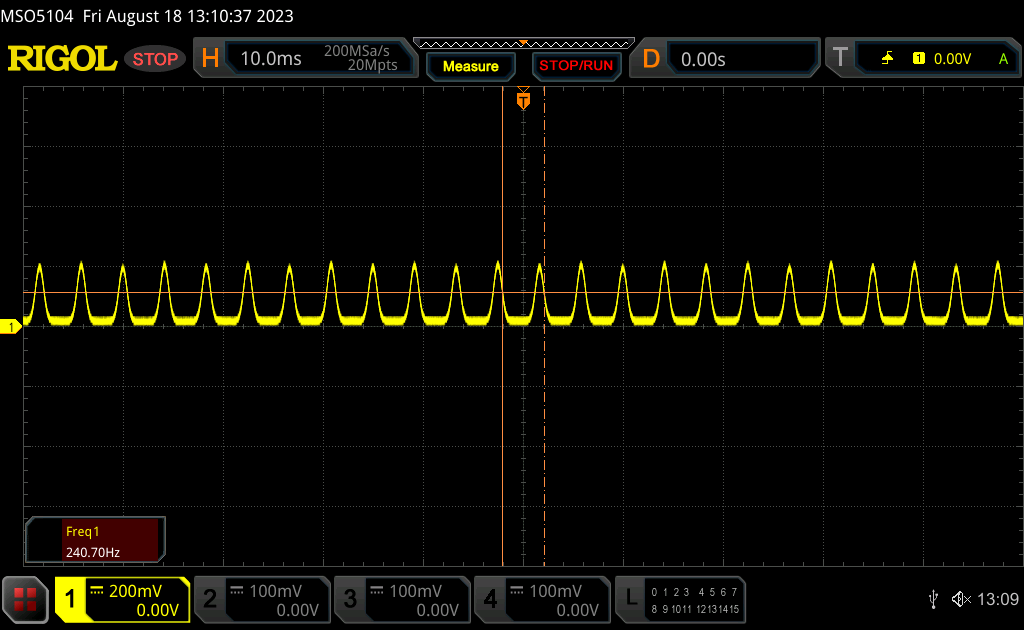
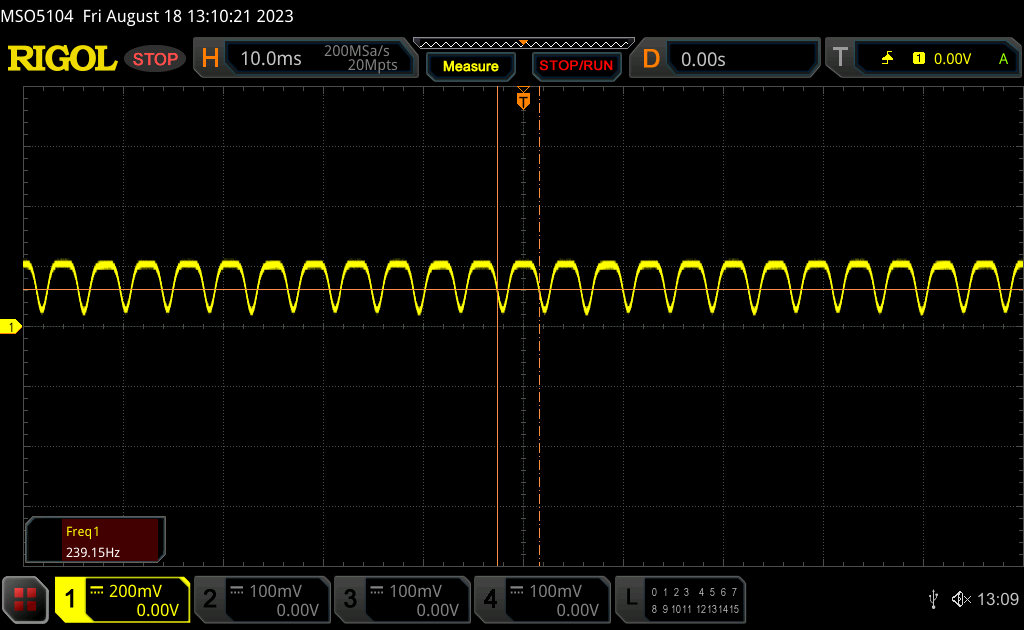
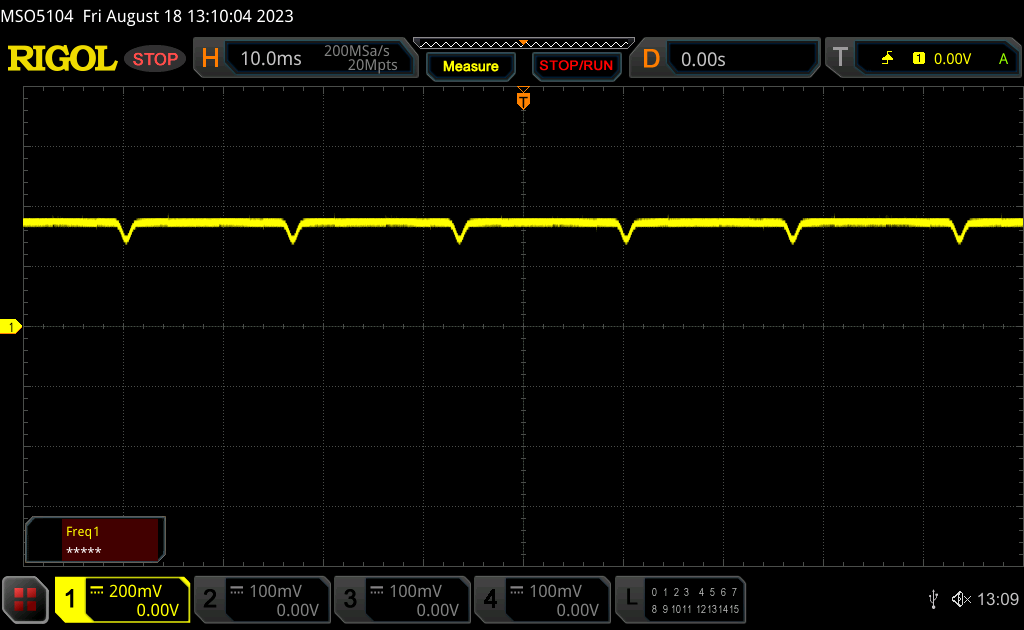
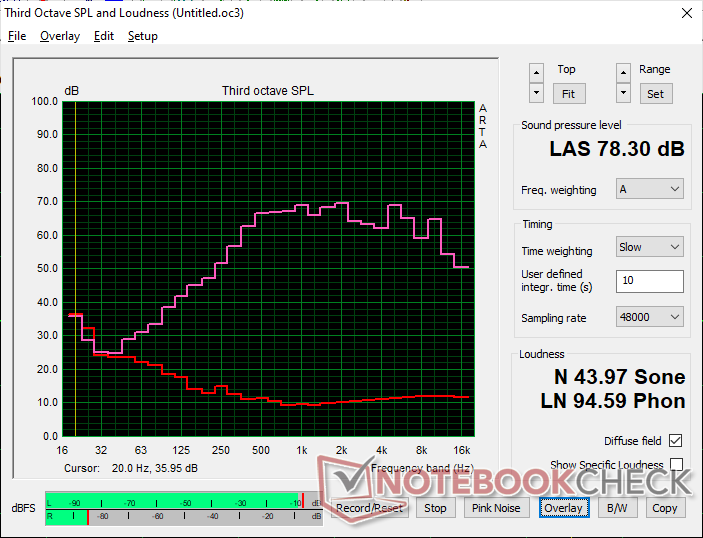
Scintillement / MLI (Modulation de largeur d'impulsion)
| Scintillement / MLI (Modulation de largeur d'impulsion) décelé | 60 Hz | ≤ 100 Niveau de luminosité |  |
Le rétroéclairage de l'écran scintille à la fréquence de 60 Hz (certainement du fait de l'utilisation d'une MDI - Modulation de largeur d'impulsion) à un niveau de luminosité inférieur ou égal à 100 % . Aucun scintillement ne devrait être perceptible au-dessus de cette valeur. La fréquence de rafraîchissement de 60 Hz est extrêmement faible, de grands risques de fatigue oculaire accrue et de maux de tête en cas d'utilisation prolongée. En comparaison, 52 % des appareils testés n'emploient pas MDI pour assombrir leur écran. Nous avons relevé une moyenne à 7750 (minimum : 5 - maximum : 343500) Hz dans le cas où une MDI était active. | |||
Le scintillement est présent à tous les niveaux de luminosité, comme sur les smartphones et autres ordinateurs portables équipés de panneaux OLED. La fréquence serait stable à 239 Hz de 0 à 54 % de luminosité et à 60 Hz de 55 à 100 % de luminosité.
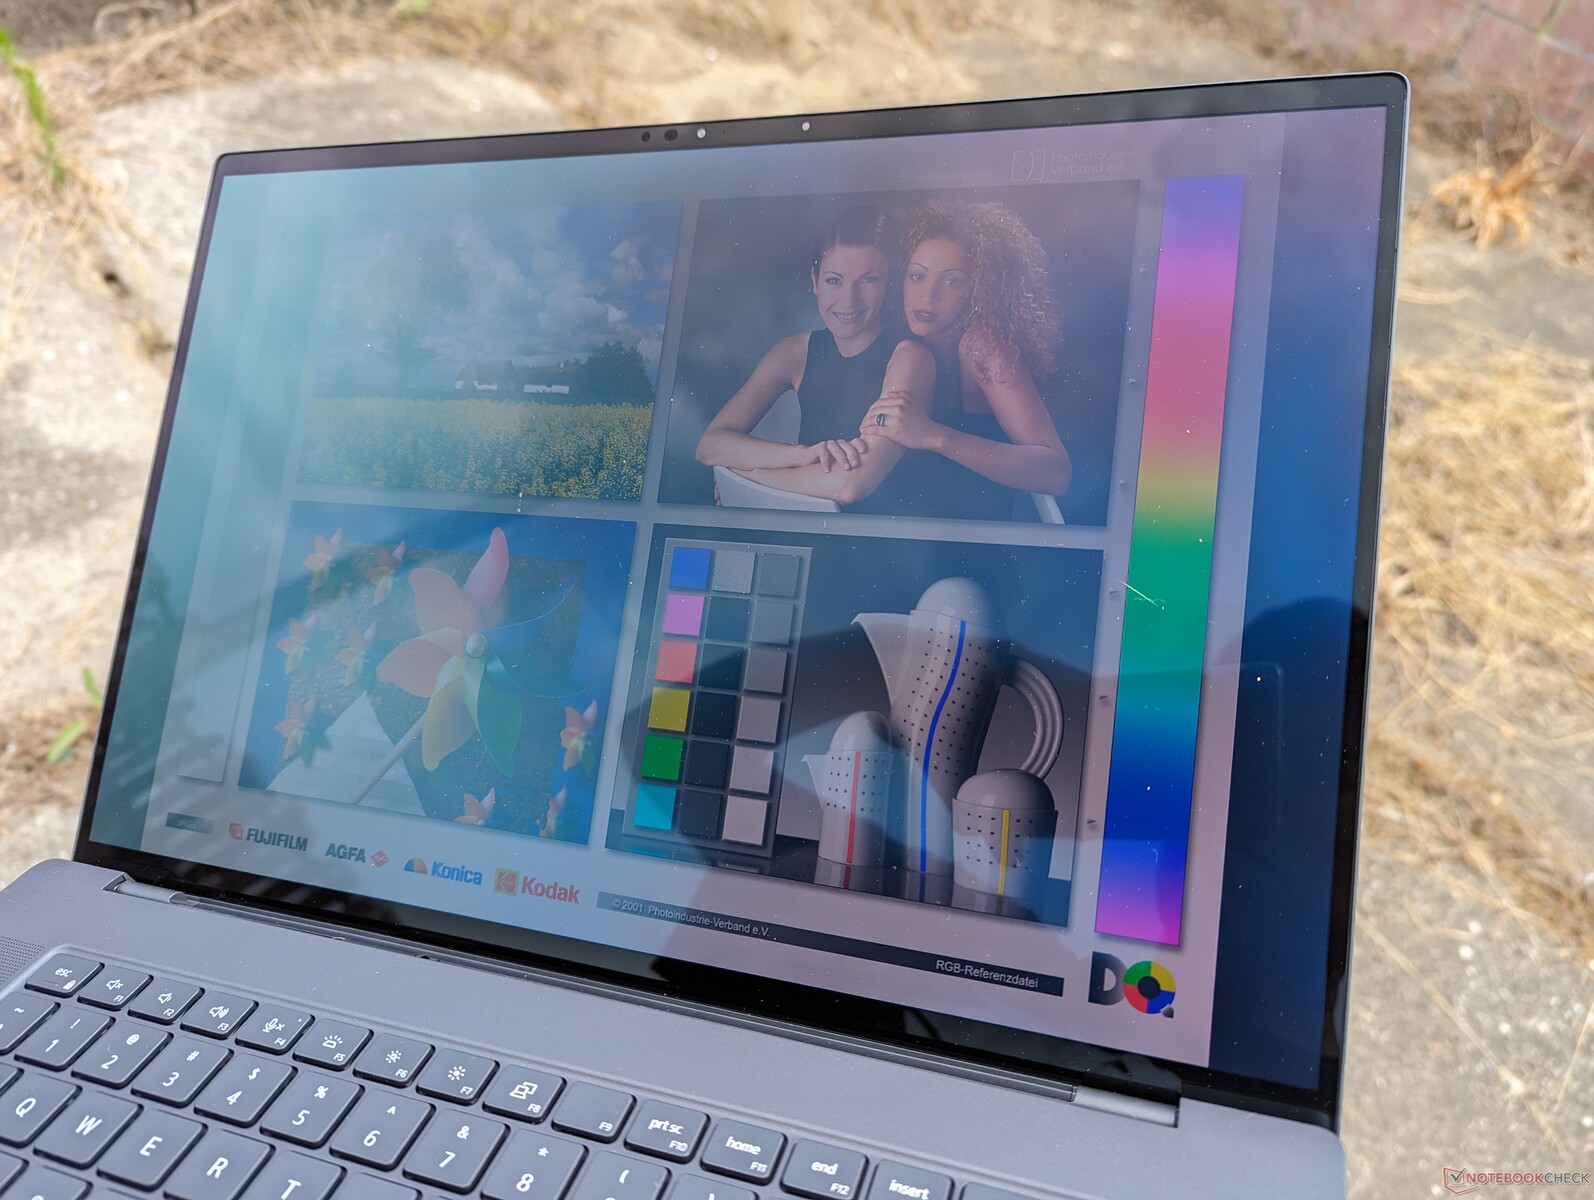
La visibilité en extérieur est au mieux moyenne, car l'écran tactile OLED brillant de 350 nits est loin d'être aussi lumineux que les écrans IPS du ZBook Fury 16 G9 ou du ThinkPad P16 G1 qui peuvent approcher les 500 à 600 nits.
Performance - Intel 13th Gen Raptor Lake-H
Conditions d'essai
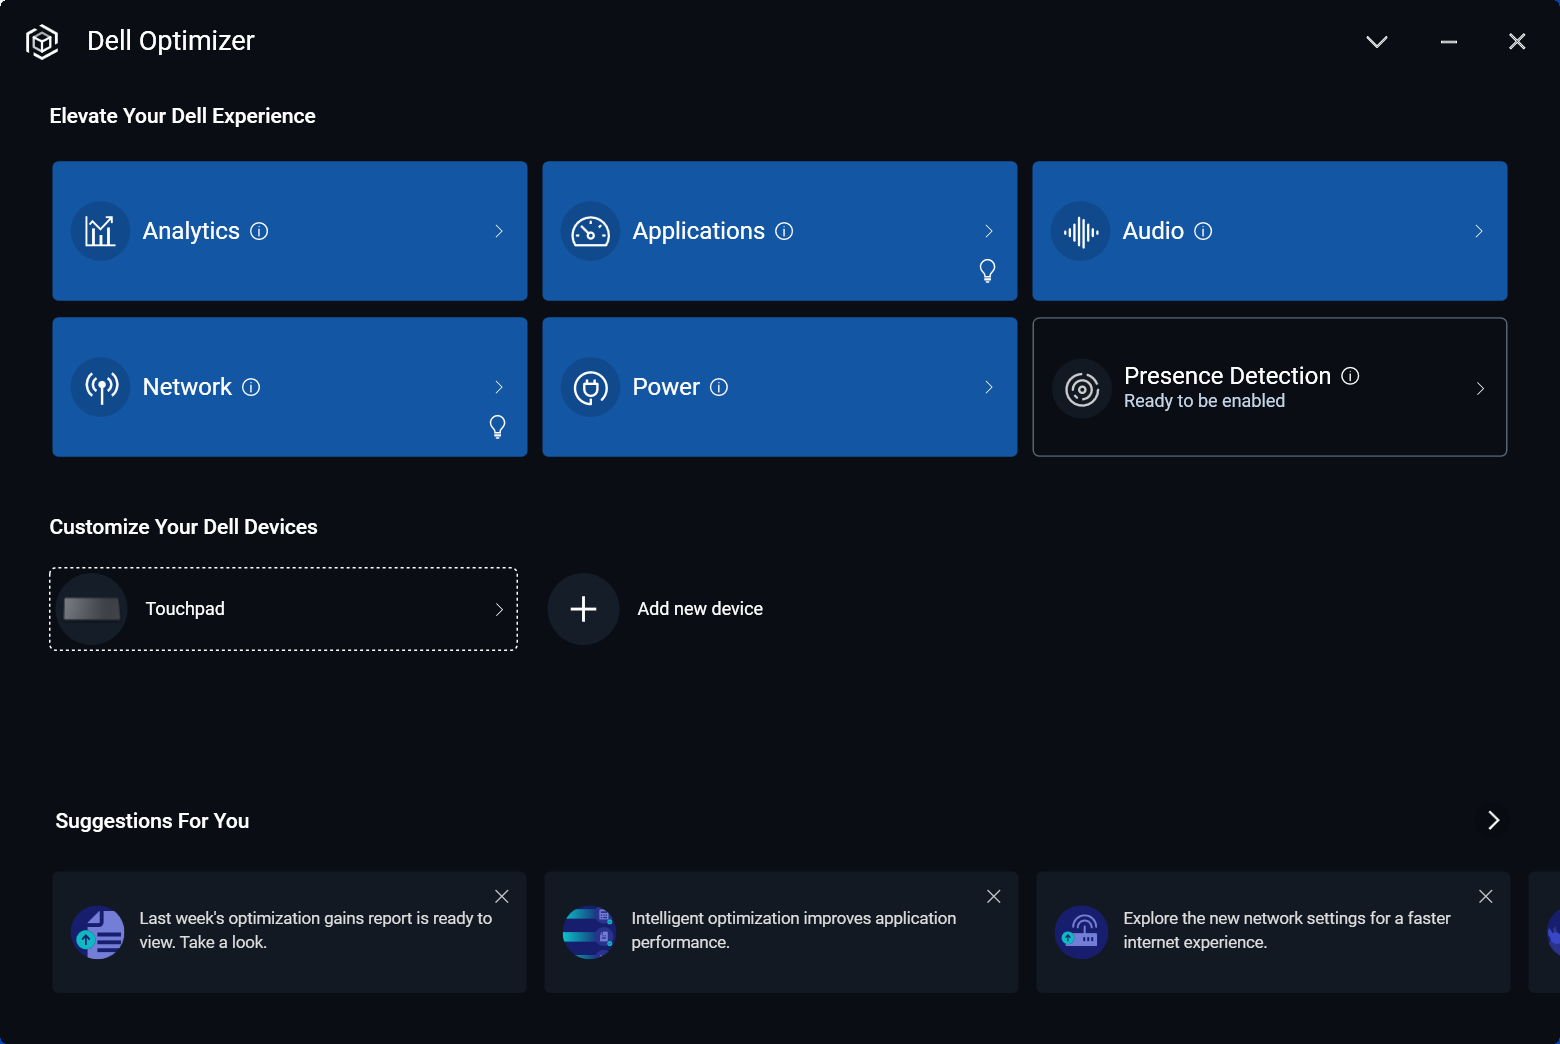
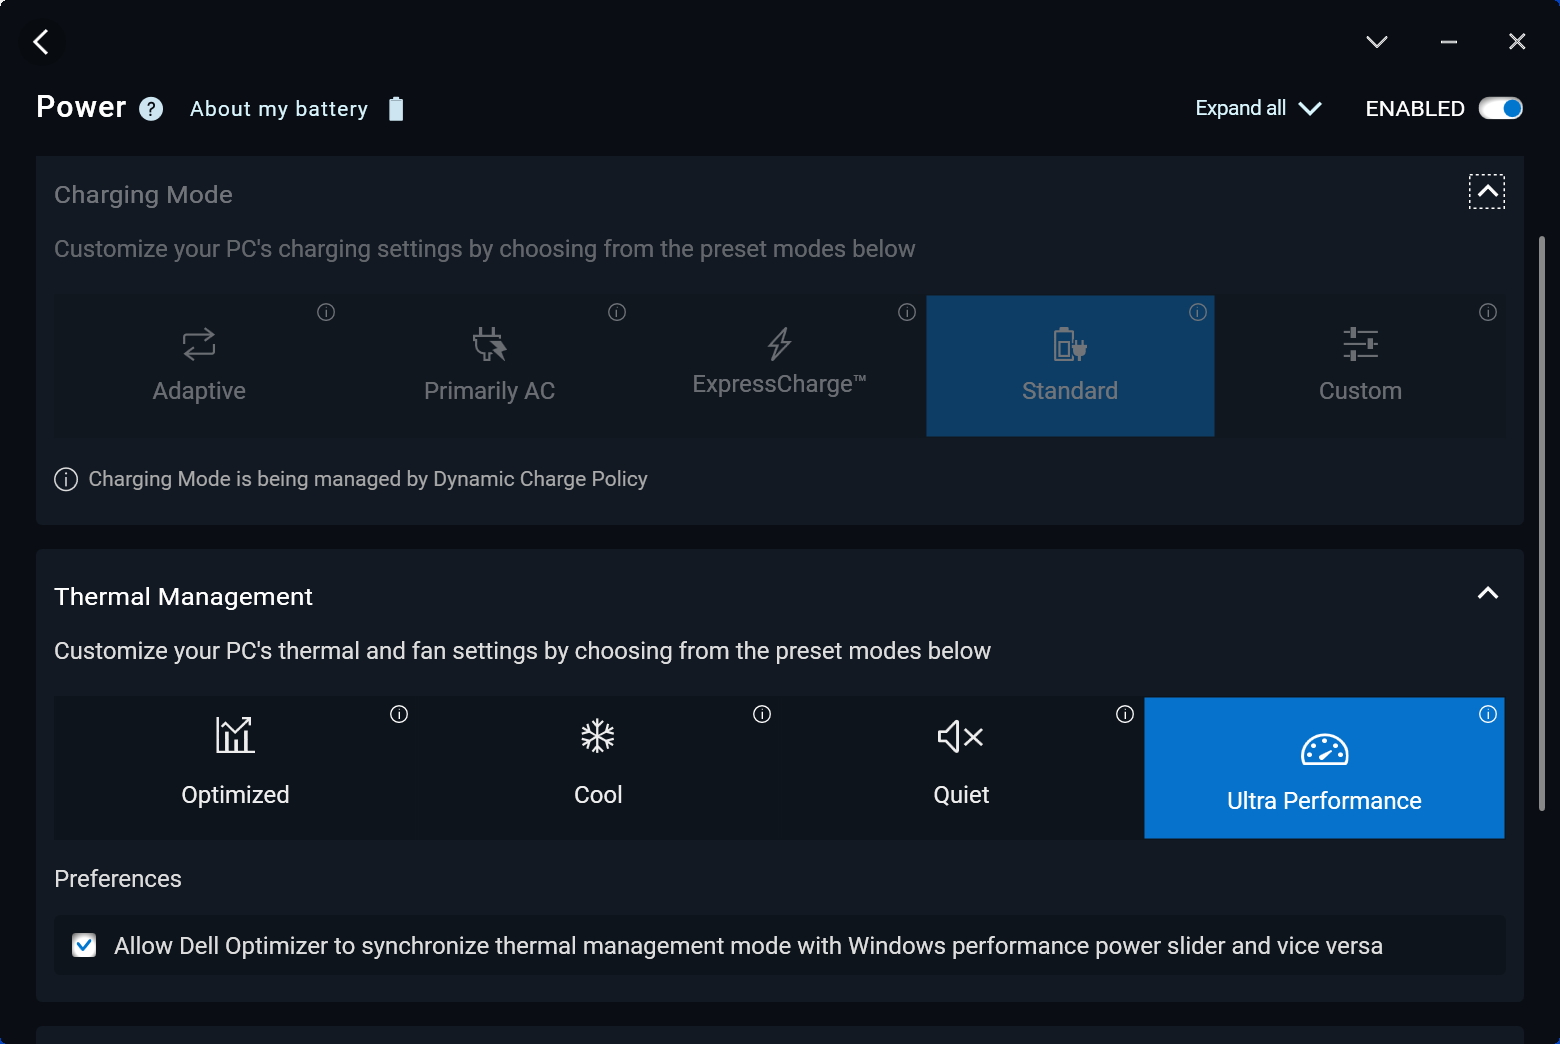
Nous avons réglé notre appareil en mode Ultra Performance via le logiciel Dell Optimizer avant d'effectuer les tests de référence ci-dessous. Les profils d'alimentation de l'Optimizer peuvent être synchronisés avec les profils d'alimentation de Windows, contrairement aux profils d'alimentation spécialisés de la plupart des autres fabricants.
Advanced Optimus ou Optimus 2.0 n'est pas pris en charge. Cependant, les GPU pour stations de travail Ada Lovelace sont dotés d'un nouveau mode ECC VRAM qui peut être activé ou désactivé via le panneau de configuration Nvidia. Un redémarrage est nécessaire pour activer cette fonction.
Processeur
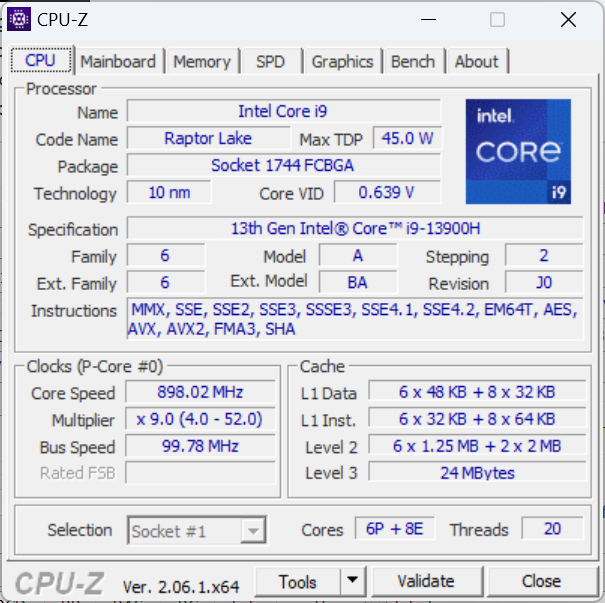
Le Core i9-13900H de 13e génération Core i9-13900H est décevant en ce sens qu'il ne constitue pas une avancée notable par rapport au Core i9-13900H de 12e génération de l'année dernière Core i9-12900H. Les performances, par exemple, seraient essentiellement identiques à celles du Core i9-13900H de l'année dernière.Asus ProArt StudioBook 16 fonctionnant avec l'ancien Core i9-12900H, à l'exception d'une légère augmentation de 5 à 10 % pour les opérations à un seul fil. Il est dommage que le site Precision 5680 n'offre pas un processeur Core i9-13900HX qui aurait permis d'améliorer les performances de manière bien plus significative que n'importe quel processeur mobile Alder Lake-H.
Notez qu'il n'y a pas non plus d'options de processeurs Xeon ou W-class, ce qui signifie qu'il n'y a pas de prise en charge de la RAM ECC sur la série Precision 5680.
La rétrogradation vers le Core i7-13700H de notre i9-13900H devrait réduire les performances multithread d'environ 20 pour cent, d'après notre expérience avec le processeurSchenker Vision 16 Pro.
Cinebench R15 Multi Loop
Cinebench R23: Multi Core | Single Core
Cinebench R20: CPU (Multi Core) | CPU (Single Core)
Cinebench R15: CPU Multi 64Bit | CPU Single 64Bit
Blender: v2.79 BMW27 CPU
7-Zip 18.03: 7z b 4 | 7z b 4 -mmt1
Geekbench 5.5: Multi-Core | Single-Core
HWBOT x265 Benchmark v2.2: 4k Preset
LibreOffice : 20 Documents To PDF
R Benchmark 2.5: Overall mean
| HWBOT x265 Benchmark v2.2 / 4k Preset | |
| Lenovo Legion Pro 7 16IRX8H | |
| Lenovo ThinkPad P16 G1 RTX A5500 | |
| Asus ProArt StudioBook 16 H7600ZW | |
| Asus ExpertBook B6 Flip B6602FC2 | |
| Dell Precision 5000 5680 | |
| MSI CreatorPro Z16P B12UKST | |
| Dell Precision 7000 7670 Performance | |
| Moyenne Intel Core i9-13900H (14.1 - 22.3, n=25) | |
| Lenovo ThinkPad P16 G1 21D6001DMB | |
| Schenker VISION 16 Pro (M23) | |
| HP ZBook Studio 15 G8 | |
| Lenovo ThinkPad P1 G4-20Y4Z9DVUS | |
| Asus ProArt StudioBook 16 W7600H5A-2BL2 | |
| Lenovo ThinkPad P15v G3 21EM001AGE | |
| HP ZBook Studio G7 | |
Cinebench R23: Multi Core | Single Core
Cinebench R20: CPU (Multi Core) | CPU (Single Core)
Cinebench R15: CPU Multi 64Bit | CPU Single 64Bit
Blender: v2.79 BMW27 CPU
7-Zip 18.03: 7z b 4 | 7z b 4 -mmt1
Geekbench 5.5: Multi-Core | Single-Core
HWBOT x265 Benchmark v2.2: 4k Preset
LibreOffice : 20 Documents To PDF
R Benchmark 2.5: Overall mean
* ... Moindre est la valeur, meilleures sont les performances
AIDA64: FP32 Ray-Trace | FPU Julia | CPU SHA3 | CPU Queen | FPU SinJulia | FPU Mandel | CPU AES | CPU ZLib | FP64 Ray-Trace | CPU PhotoWorxx
| Performance rating | |
| Lenovo ThinkPad P16 G1 RTX A5500 | |
| HP ZBook Fury 16 G9 | |
| Dell Precision 5000 5680 | |
| MSI CreatorPro Z16P B12UKST | |
| Asus ExpertBook B6 Flip B6602FC2 | |
| Moyenne Intel Core i9-13900H | |
| Dell Precision 7000 7670 Performance | |
| AIDA64 / FP32 Ray-Trace | |
| Lenovo ThinkPad P16 G1 RTX A5500 | |
| HP ZBook Fury 16 G9 | |
| Asus ExpertBook B6 Flip B6602FC2 | |
| Dell Precision 5000 5680 | |
| Dell Precision 7000 7670 Performance | |
| Moyenne Intel Core i9-13900H (6788 - 19557, n=25) | |
| MSI CreatorPro Z16P B12UKST | |
| AIDA64 / FPU Julia | |
| HP ZBook Fury 16 G9 | |
| Lenovo ThinkPad P16 G1 RTX A5500 | |
| Asus ExpertBook B6 Flip B6602FC2 | |
| Dell Precision 5000 5680 | |
| Dell Precision 7000 7670 Performance | |
| Moyenne Intel Core i9-13900H (22551 - 95579, n=25) | |
| MSI CreatorPro Z16P B12UKST | |
| AIDA64 / CPU SHA3 | |
| Lenovo ThinkPad P16 G1 RTX A5500 | |
| HP ZBook Fury 16 G9 | |
| MSI CreatorPro Z16P B12UKST | |
| Moyenne Intel Core i9-13900H (2491 - 4270, n=25) | |
| Dell Precision 5000 5680 | |
| Asus ExpertBook B6 Flip B6602FC2 | |
| Dell Precision 7000 7670 Performance | |
| AIDA64 / CPU Queen | |
| Dell Precision 5000 5680 | |
| Moyenne Intel Core i9-13900H (65121 - 120936, n=25) | |
| Lenovo ThinkPad P16 G1 RTX A5500 | |
| Dell Precision 7000 7670 Performance | |
| Asus ExpertBook B6 Flip B6602FC2 | |
| HP ZBook Fury 16 G9 | |
| MSI CreatorPro Z16P B12UKST | |
| AIDA64 / FPU SinJulia | |
| Lenovo ThinkPad P16 G1 RTX A5500 | |
| HP ZBook Fury 16 G9 | |
| Asus ExpertBook B6 Flip B6602FC2 | |
| Dell Precision 7000 7670 Performance | |
| Dell Precision 5000 5680 | |
| Moyenne Intel Core i9-13900H (6108 - 11631, n=25) | |
| MSI CreatorPro Z16P B12UKST | |
| AIDA64 / FPU Mandel | |
| HP ZBook Fury 16 G9 | |
| Lenovo ThinkPad P16 G1 RTX A5500 | |
| Asus ExpertBook B6 Flip B6602FC2 | |
| Dell Precision 5000 5680 | |
| Moyenne Intel Core i9-13900H (11283 - 48474, n=25) | |
| Dell Precision 7000 7670 Performance | |
| MSI CreatorPro Z16P B12UKST | |
| AIDA64 / CPU AES | |
| MSI CreatorPro Z16P B12UKST | |
| HP ZBook Fury 16 G9 | |
| Lenovo ThinkPad P16 G1 RTX A5500 | |
| Moyenne Intel Core i9-13900H (3691 - 149377, n=25) | |
| Asus ExpertBook B6 Flip B6602FC2 | |
| Dell Precision 7000 7670 Performance | |
| Dell Precision 5000 5680 | |
| AIDA64 / CPU ZLib | |
| Lenovo ThinkPad P16 G1 RTX A5500 | |
| HP ZBook Fury 16 G9 | |
| Moyenne Intel Core i9-13900H (789 - 1254, n=25) | |
| Asus ExpertBook B6 Flip B6602FC2 | |
| MSI CreatorPro Z16P B12UKST | |
| Dell Precision 5000 5680 | |
| Dell Precision 7000 7670 Performance | |
| AIDA64 / FP64 Ray-Trace | |
| Lenovo ThinkPad P16 G1 RTX A5500 | |
| HP ZBook Fury 16 G9 | |
| Asus ExpertBook B6 Flip B6602FC2 | |
| Dell Precision 5000 5680 | |
| Dell Precision 7000 7670 Performance | |
| Moyenne Intel Core i9-13900H (3655 - 10716, n=25) | |
| MSI CreatorPro Z16P B12UKST | |
| AIDA64 / CPU PhotoWorxx | |
| Dell Precision 5000 5680 | |
| MSI CreatorPro Z16P B12UKST | |
| Dell Precision 7000 7670 Performance | |
| Lenovo ThinkPad P16 G1 RTX A5500 | |
| Moyenne Intel Core i9-13900H (10871 - 50488, n=25) | |
| HP ZBook Fury 16 G9 | |
| Asus ExpertBook B6 Flip B6602FC2 | |
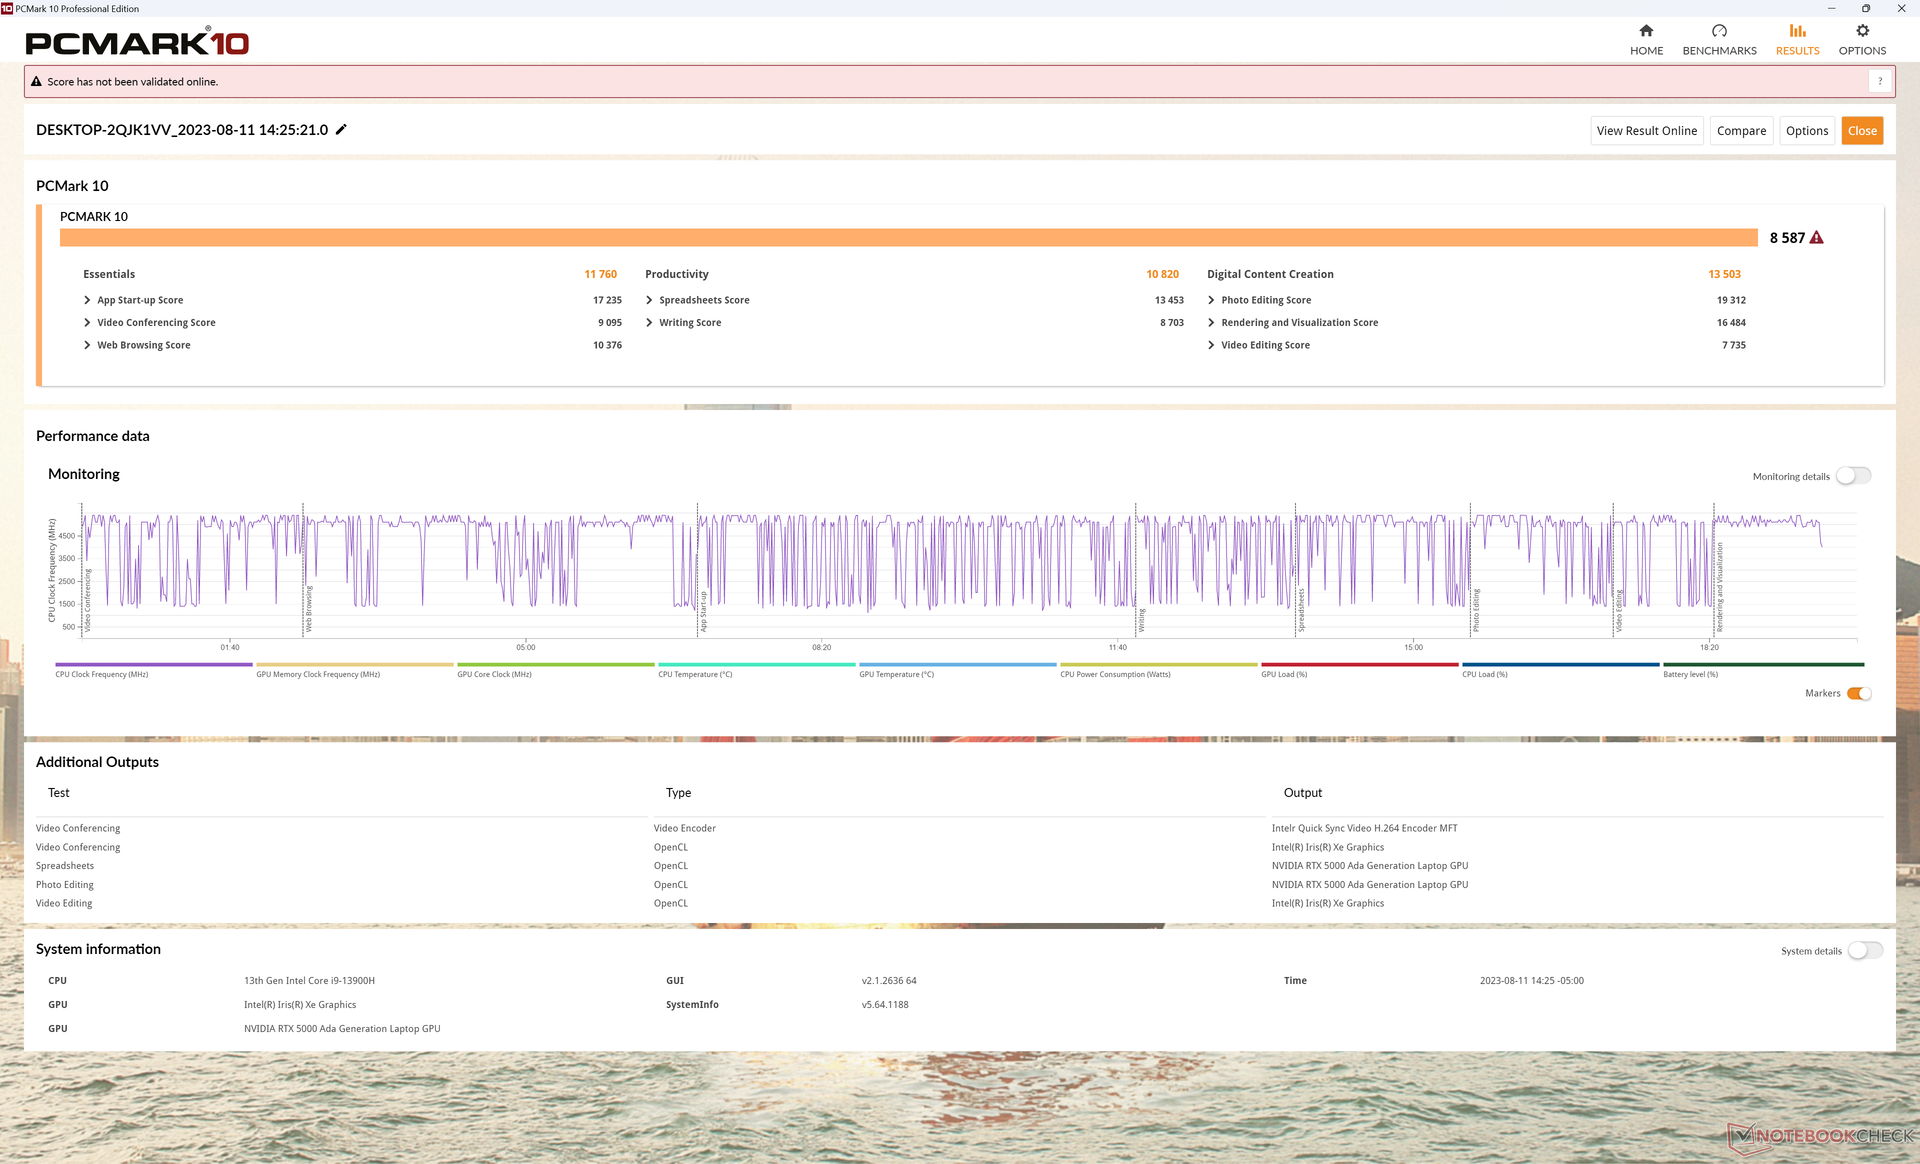
Performance du système
Les scores PCMark sont plus élevés que ceux de la plupart des autres stations de travail, avec des marges relativement importantes, y compris pour certaines stations puissantes comme le HP ZBook Fury 16 G9 ou lePrecision performances du 7670. Ceci peut être attribué à notre configuration SSD RAID 0 et à notre GPU RTX 5000 alors que la plupart des autres stations de travail fonctionnent avec des SSD simples et des GPU d'ancienne génération.
CrossMark: Overall | Productivity | Creativity | Responsiveness
| PCMark 10 / Score | |
| Dell Precision 5000 5680 | |
| Moyenne Intel Core i9-13900H, NVIDIA RTX 5000 Ada Generation Laptop (n=1) | |
| Asus ExpertBook B6 Flip B6602FC2 | |
| Lenovo ThinkPad P16 G1 RTX A5500 | |
| MSI CreatorPro Z16P B12UKST | |
| HP ZBook Fury 16 G9 | |
| Dell Precision 7000 7670 Performance | |
| PCMark 10 / Essentials | |
| Dell Precision 5000 5680 | |
| Moyenne Intel Core i9-13900H, NVIDIA RTX 5000 Ada Generation Laptop (n=1) | |
| Dell Precision 7000 7670 Performance | |
| HP ZBook Fury 16 G9 | |
| Lenovo ThinkPad P16 G1 RTX A5500 | |
| Asus ExpertBook B6 Flip B6602FC2 | |
| MSI CreatorPro Z16P B12UKST | |
| PCMark 10 / Productivity | |
| Dell Precision 5000 5680 | |
| Moyenne Intel Core i9-13900H, NVIDIA RTX 5000 Ada Generation Laptop (n=1) | |
| Asus ExpertBook B6 Flip B6602FC2 | |
| Lenovo ThinkPad P16 G1 RTX A5500 | |
| MSI CreatorPro Z16P B12UKST | |
| HP ZBook Fury 16 G9 | |
| Dell Precision 7000 7670 Performance | |
| PCMark 10 / Digital Content Creation | |
| Dell Precision 5000 5680 | |
| Moyenne Intel Core i9-13900H, NVIDIA RTX 5000 Ada Generation Laptop (n=1) | |
| Lenovo ThinkPad P16 G1 RTX A5500 | |
| MSI CreatorPro Z16P B12UKST | |
| Dell Precision 7000 7670 Performance | |
| HP ZBook Fury 16 G9 | |
| Asus ExpertBook B6 Flip B6602FC2 | |
| CrossMark / Overall | |
| Asus ExpertBook B6 Flip B6602FC2 | |
| MSI CreatorPro Z16P B12UKST | |
| Dell Precision 5000 5680 | |
| Moyenne Intel Core i9-13900H, NVIDIA RTX 5000 Ada Generation Laptop (n=1) | |
| HP ZBook Fury 16 G9 | |
| Lenovo ThinkPad P16 G1 RTX A5500 | |
| Dell Precision 7000 7670 Performance | |
| CrossMark / Productivity | |
| Asus ExpertBook B6 Flip B6602FC2 | |
| MSI CreatorPro Z16P B12UKST | |
| Dell Precision 5000 5680 | |
| Moyenne Intel Core i9-13900H, NVIDIA RTX 5000 Ada Generation Laptop (n=1) | |
| HP ZBook Fury 16 G9 | |
| Lenovo ThinkPad P16 G1 RTX A5500 | |
| Dell Precision 7000 7670 Performance | |
| CrossMark / Creativity | |
| Lenovo ThinkPad P16 G1 RTX A5500 | |
| Dell Precision 5000 5680 | |
| Moyenne Intel Core i9-13900H, NVIDIA RTX 5000 Ada Generation Laptop (n=1) | |
| Asus ExpertBook B6 Flip B6602FC2 | |
| HP ZBook Fury 16 G9 | |
| MSI CreatorPro Z16P B12UKST | |
| Dell Precision 7000 7670 Performance | |
| CrossMark / Responsiveness | |
| MSI CreatorPro Z16P B12UKST | |
| Asus ExpertBook B6 Flip B6602FC2 | |
| HP ZBook Fury 16 G9 | |
| Dell Precision 5000 5680 | |
| Moyenne Intel Core i9-13900H, NVIDIA RTX 5000 Ada Generation Laptop (n=1) | |
| Dell Precision 7000 7670 Performance | |
| Lenovo ThinkPad P16 G1 RTX A5500 | |
| PCMark 10 Score | 8587 points | |
Aide | ||
| AIDA64 / Memory Copy | |
| Dell Precision 5000 5680 | |
| Dell Precision 7000 7670 Performance | |
| Lenovo ThinkPad P16 G1 RTX A5500 | |
| MSI CreatorPro Z16P B12UKST | |
| Moyenne Intel Core i9-13900H (37448 - 74486, n=25) | |
| HP ZBook Fury 16 G9 | |
| Asus ExpertBook B6 Flip B6602FC2 | |
| AIDA64 / Memory Read | |
| Dell Precision 7000 7670 Performance | |
| Dell Precision 5000 5680 | |
| MSI CreatorPro Z16P B12UKST | |
| Lenovo ThinkPad P16 G1 RTX A5500 | |
| Moyenne Intel Core i9-13900H (41599 - 75433, n=25) | |
| Asus ExpertBook B6 Flip B6602FC2 | |
| HP ZBook Fury 16 G9 | |
| AIDA64 / Memory Write | |
| Dell Precision 5000 5680 | |
| MSI CreatorPro Z16P B12UKST | |
| Dell Precision 7000 7670 Performance | |
| Moyenne Intel Core i9-13900H (36152 - 88505, n=25) | |
| Lenovo ThinkPad P16 G1 RTX A5500 | |
| Asus ExpertBook B6 Flip B6602FC2 | |
| HP ZBook Fury 16 G9 | |
| AIDA64 / Memory Latency | |
| MSI CreatorPro Z16P B12UKST | |
| Asus ExpertBook B6 Flip B6602FC2 | |
| Dell Precision 5000 5680 | |
| HP ZBook Fury 16 G9 | |
| Lenovo ThinkPad P16 G1 RTX A5500 | |
| Moyenne Intel Core i9-13900H (75.8 - 102.3, n=25) | |
| Dell Precision 7000 7670 Performance | |
* ... Moindre est la valeur, meilleures sont les performances
Latence DPC
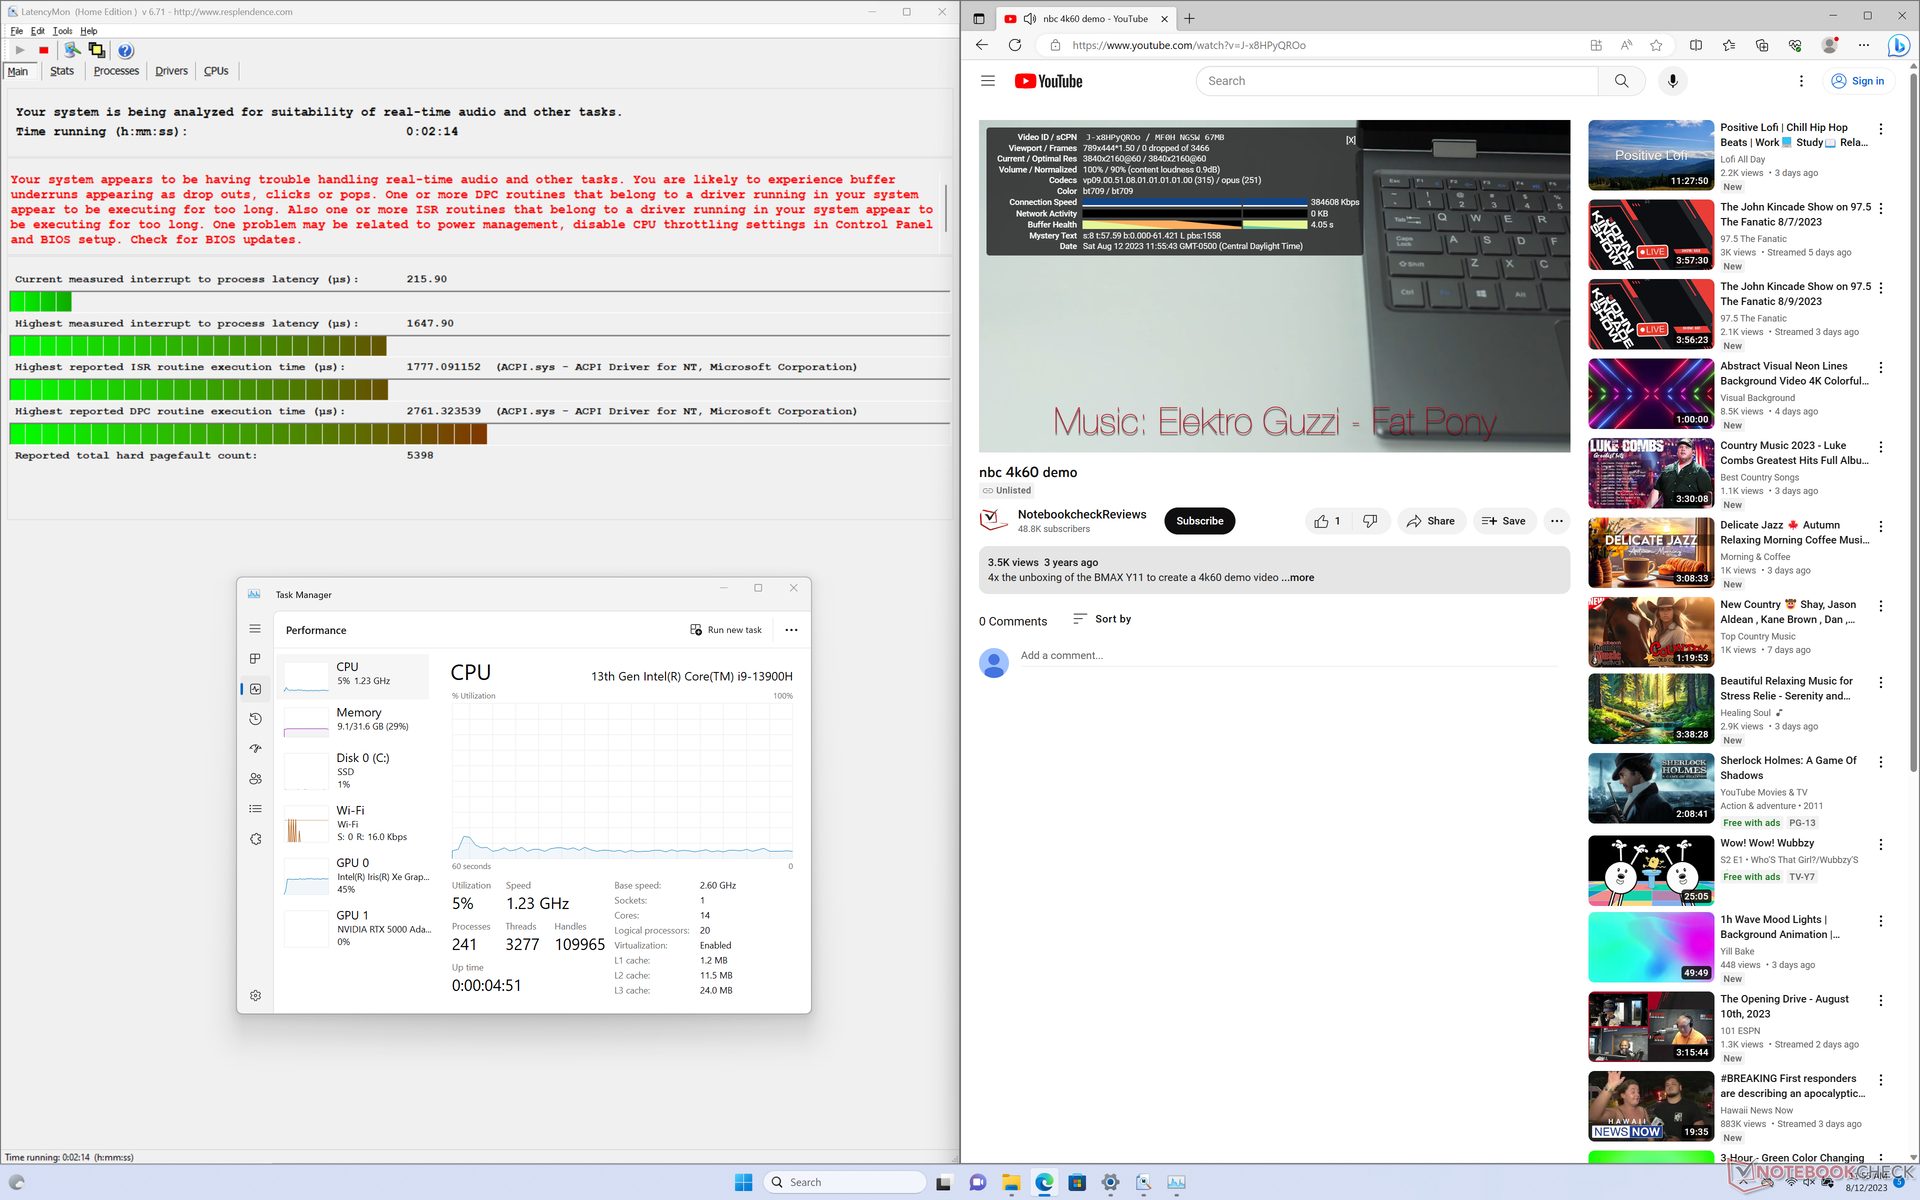
LatencyMon révèle de légers problèmes de DPC lors de l'ouverture de plusieurs onglets de notre page d'accueil, similaires à ce que nous avons observé sur le Precision 7670. la lecture vidéo 4K à 60 FPS est par ailleurs parfaite, sans aucune perte d'images.
| DPC Latencies / LatencyMon - interrupt to process latency (max), Web, Youtube, Prime95 | |
| HP ZBook Fury 16 G9 | |
| Asus ExpertBook B6 Flip B6602FC2 | |
| Dell Precision 7000 7670 Performance | |
| Dell Precision 5000 5680 | |
| Lenovo ThinkPad P16 G1 RTX A5500 | |
| MSI CreatorPro Z16P B12UKST | |
* ... Moindre est la valeur, meilleures sont les performances
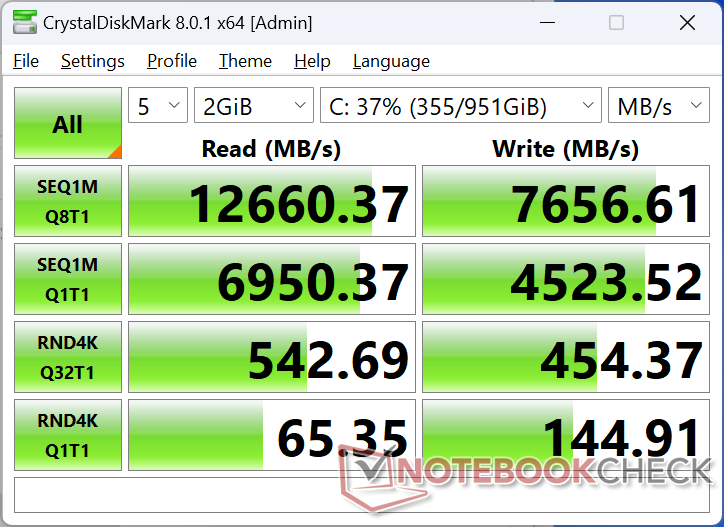
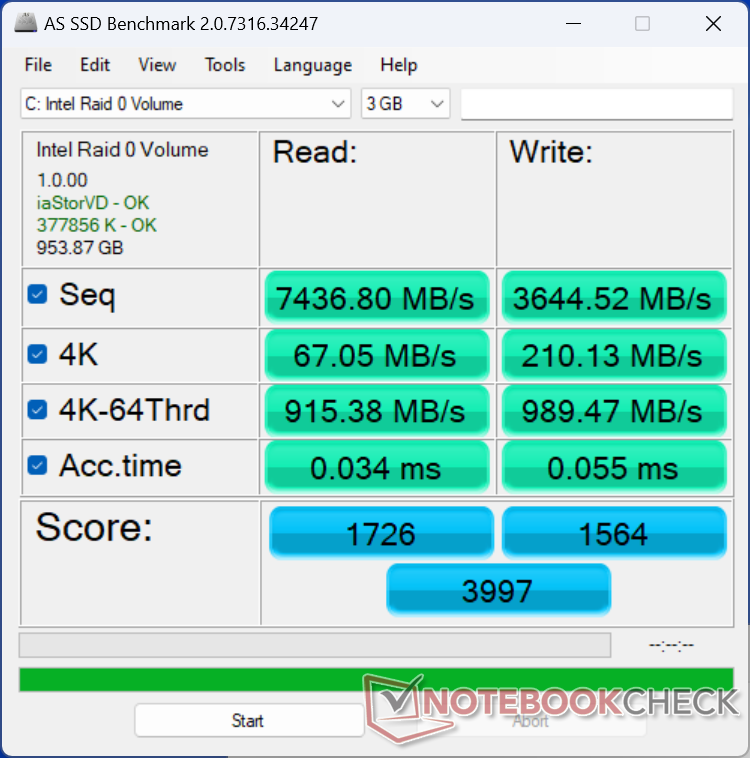
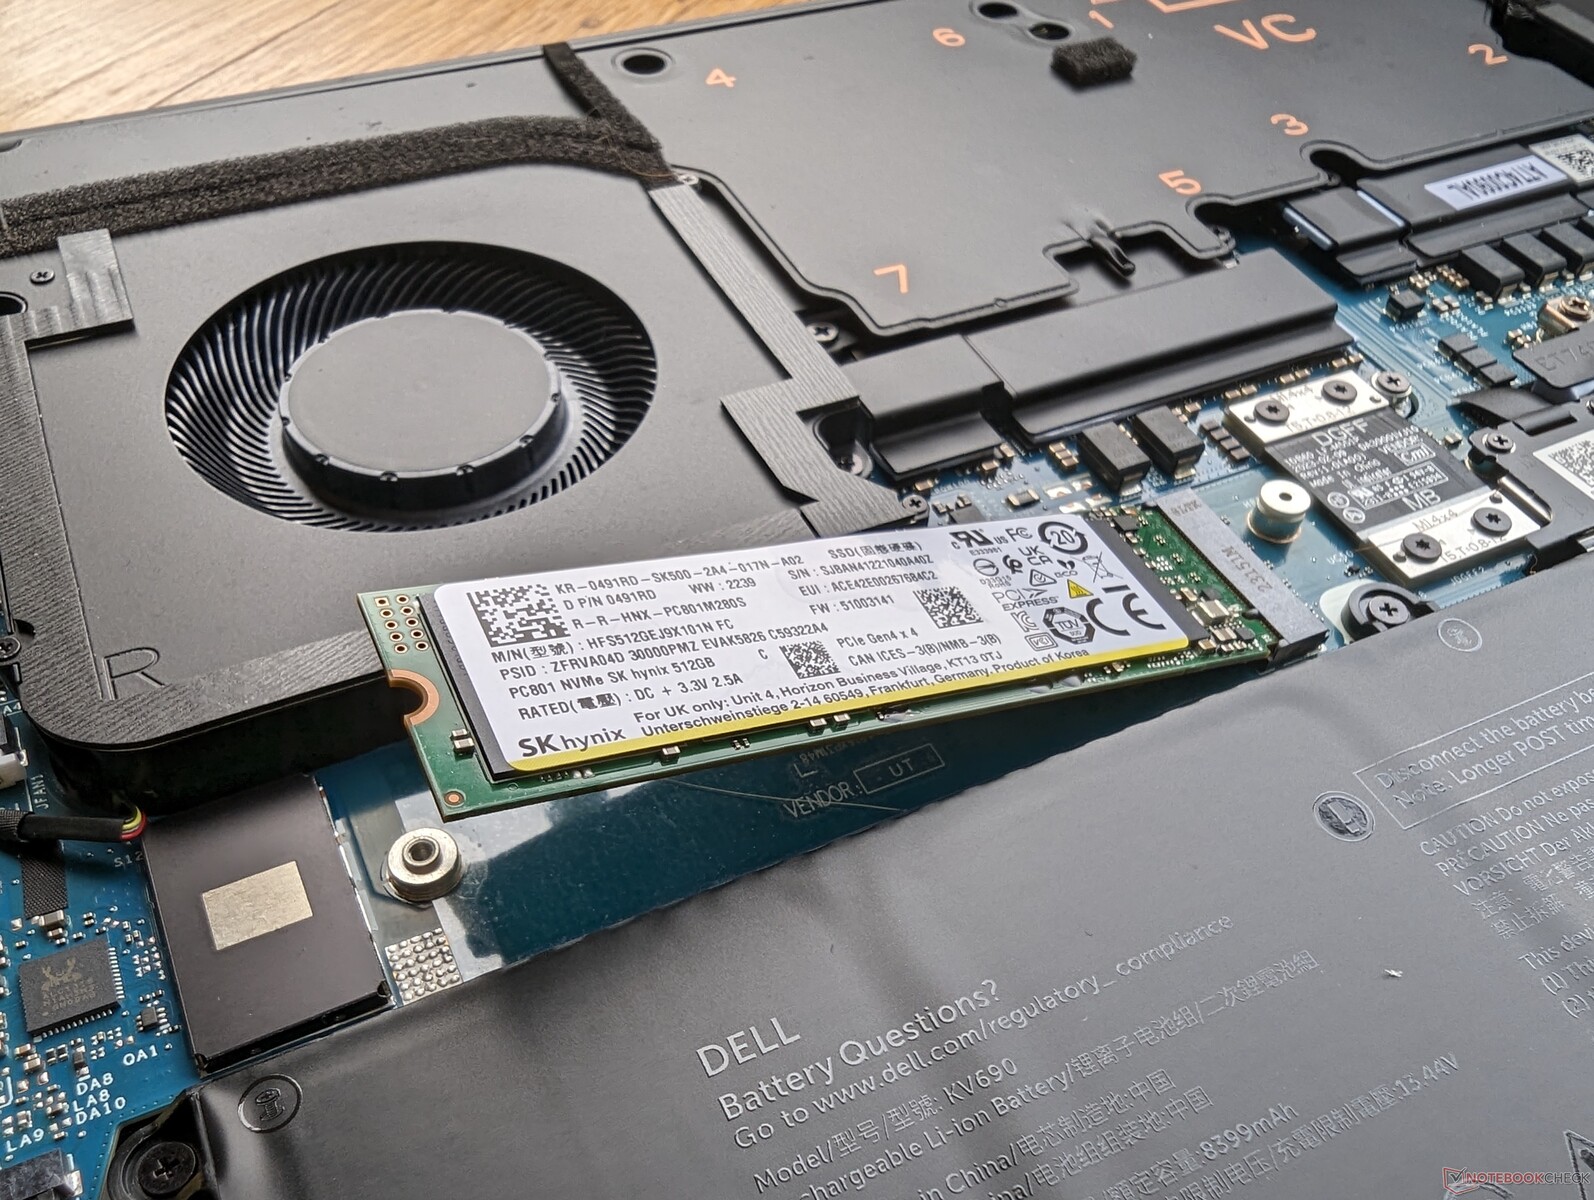
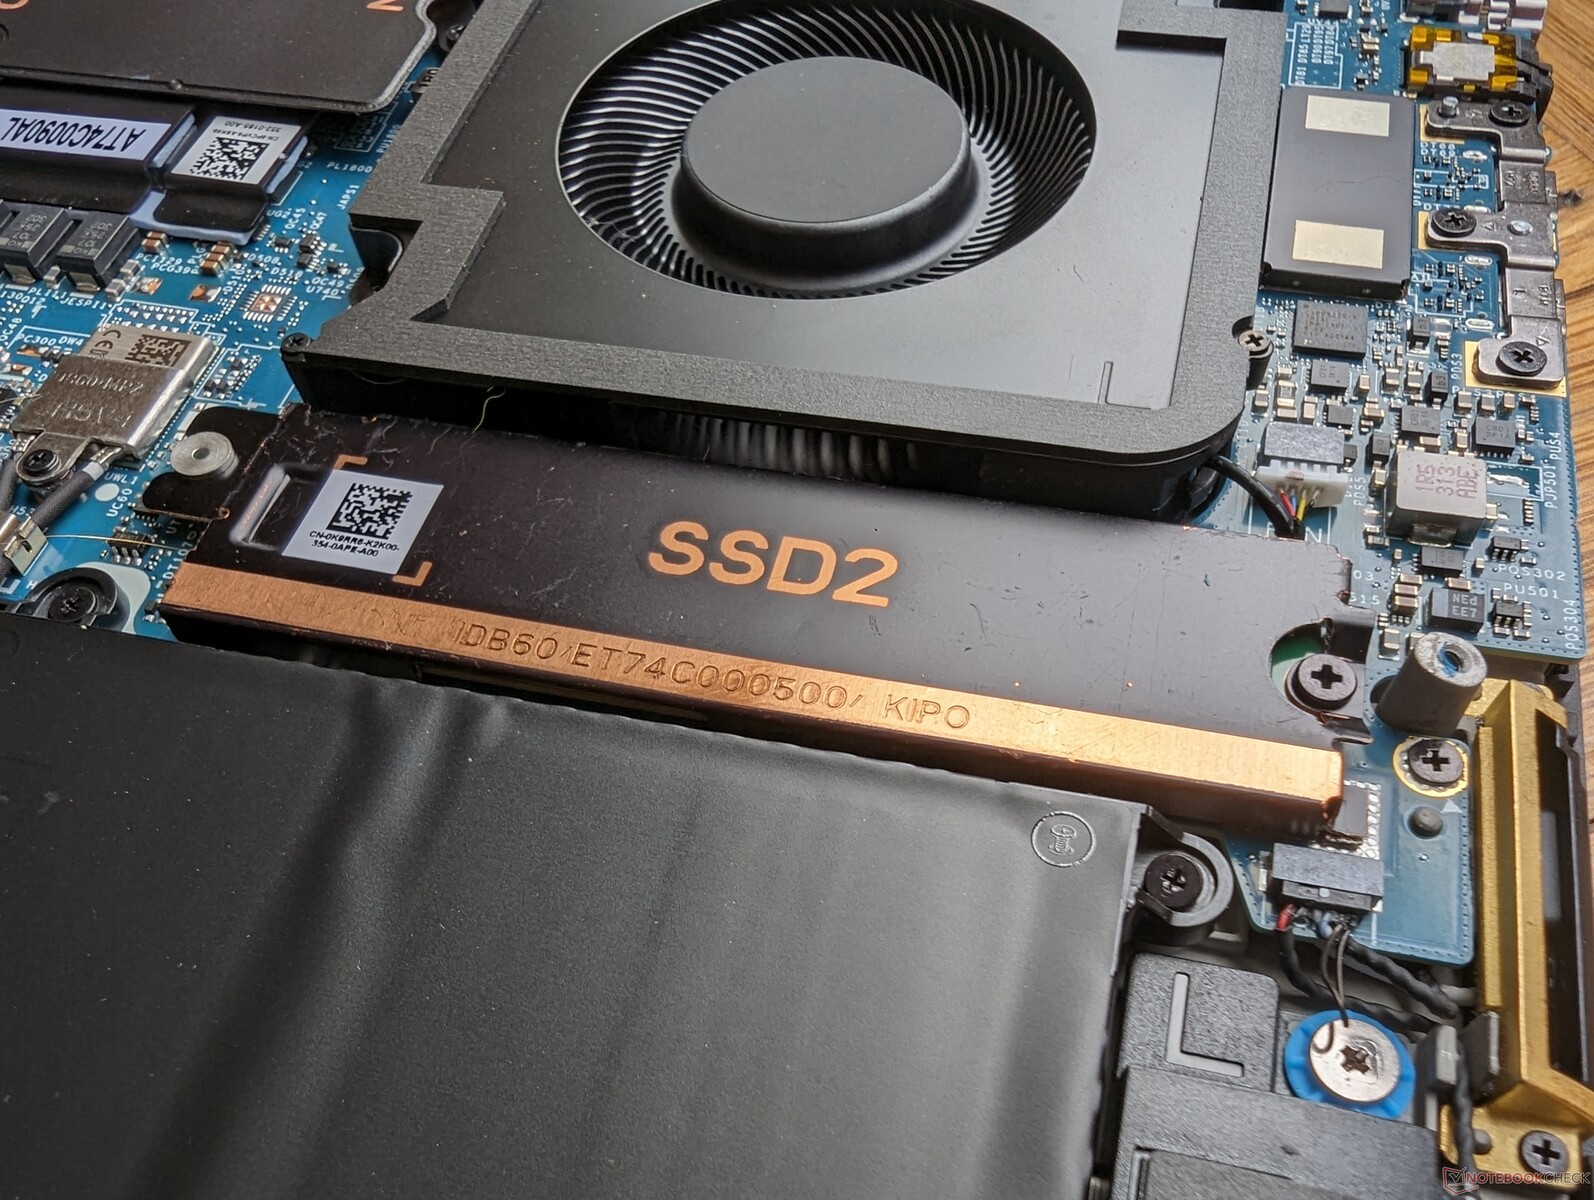
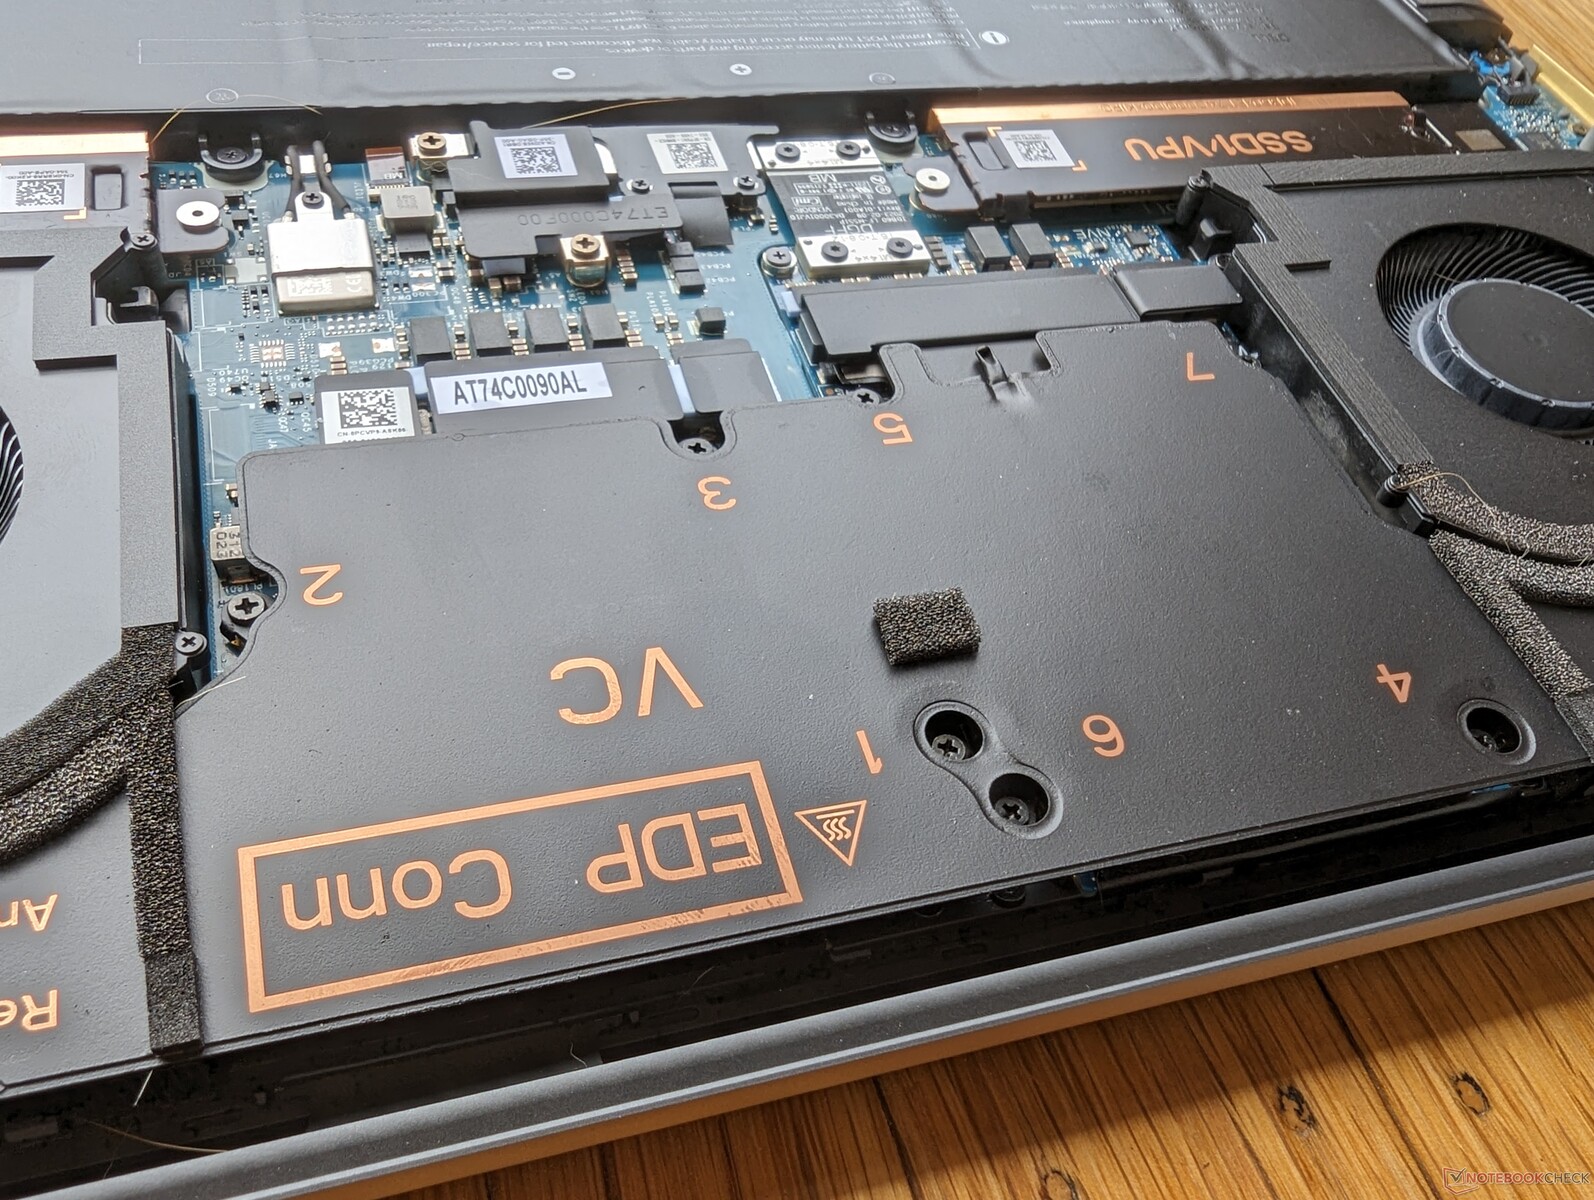
Périphériques de stockage - Jusqu'à deux disques SSD NVMe PCIe4 x4
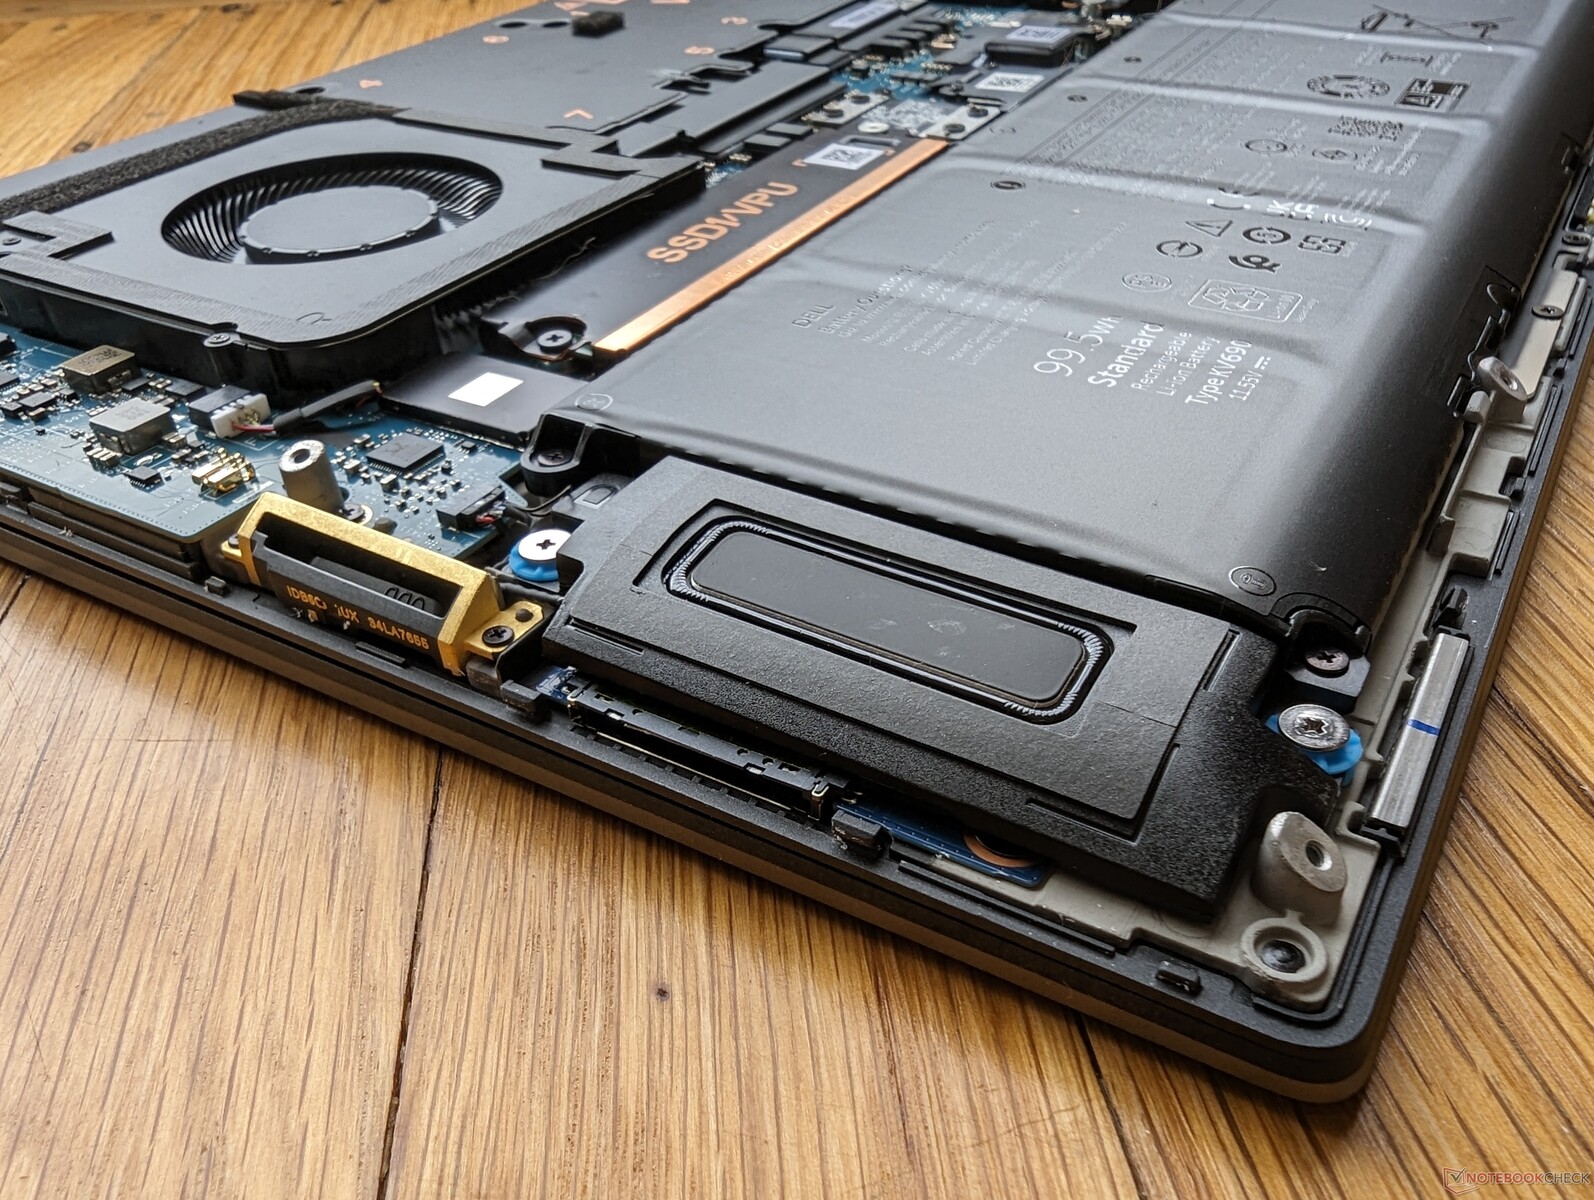
Notre unité de test est livrée avec le même SK hynix PC801 PCIe4 x4 NVMe en configuration RAID 0 que l'on trouve sur la série Precision 7670. Bien que le support PCIe5 comme dans certains ordinateurs portables de jeu aurait été appréciable, il ne s'agit pas d'une caractéristique importante pour le moment, étant donné la rareté des SSD PCIe5. Dell propose des options de SSD auto-cryptés pour plus de sécurité.
Chaque emplacement de SSD M.2 est équipé d'un répartiteur de chaleur en cuivre, comme illustré ci-dessous, pour faciliter le refroidissement. Chaque disque de notre unité n'a eu aucun problème à maintenir des taux de transfert élevés de ~5400 Mo/s sur de longues périodes et n'a montré aucun problème majeur d'étranglement.

* ... Moindre est la valeur, meilleures sont les performances
Disk Throttling: DiskSpd Read Loop, Queue Depth 8
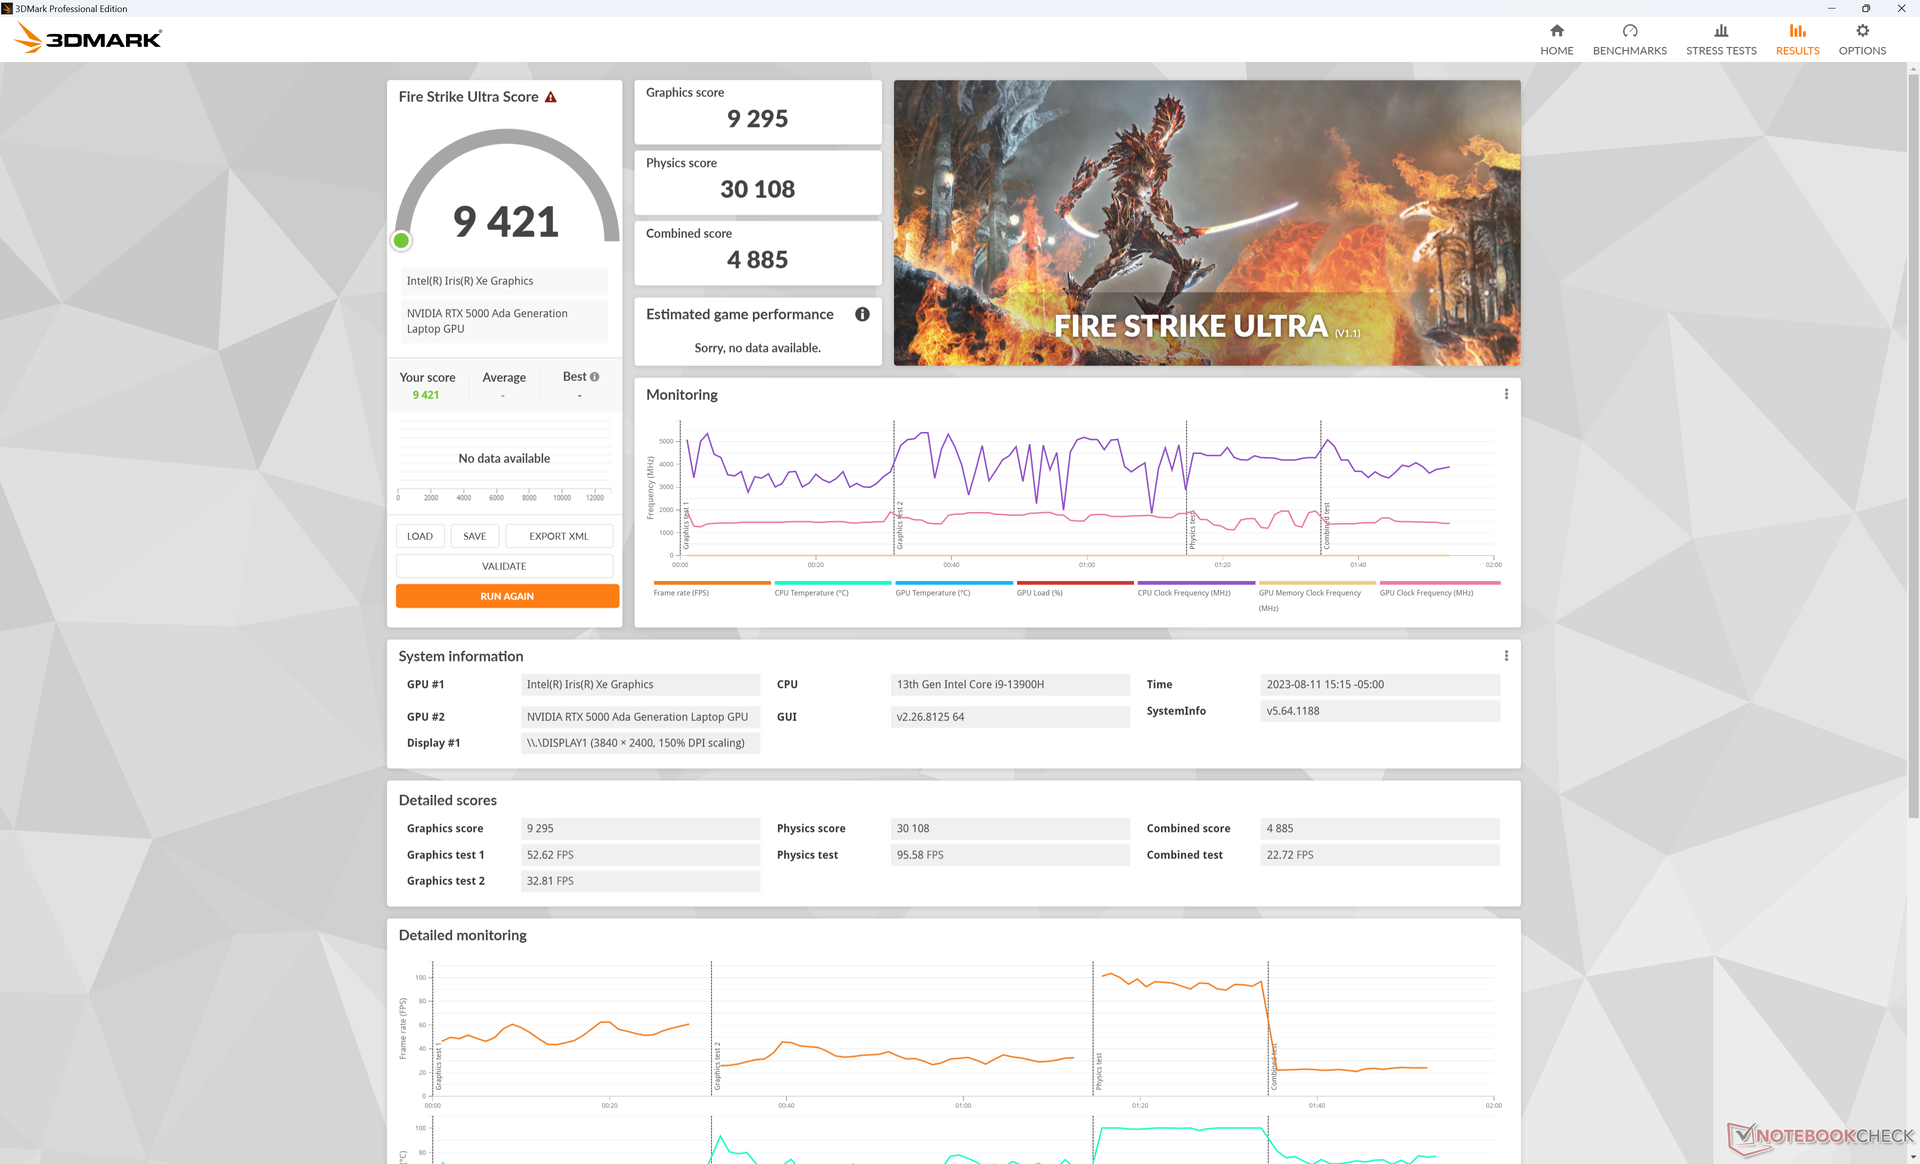
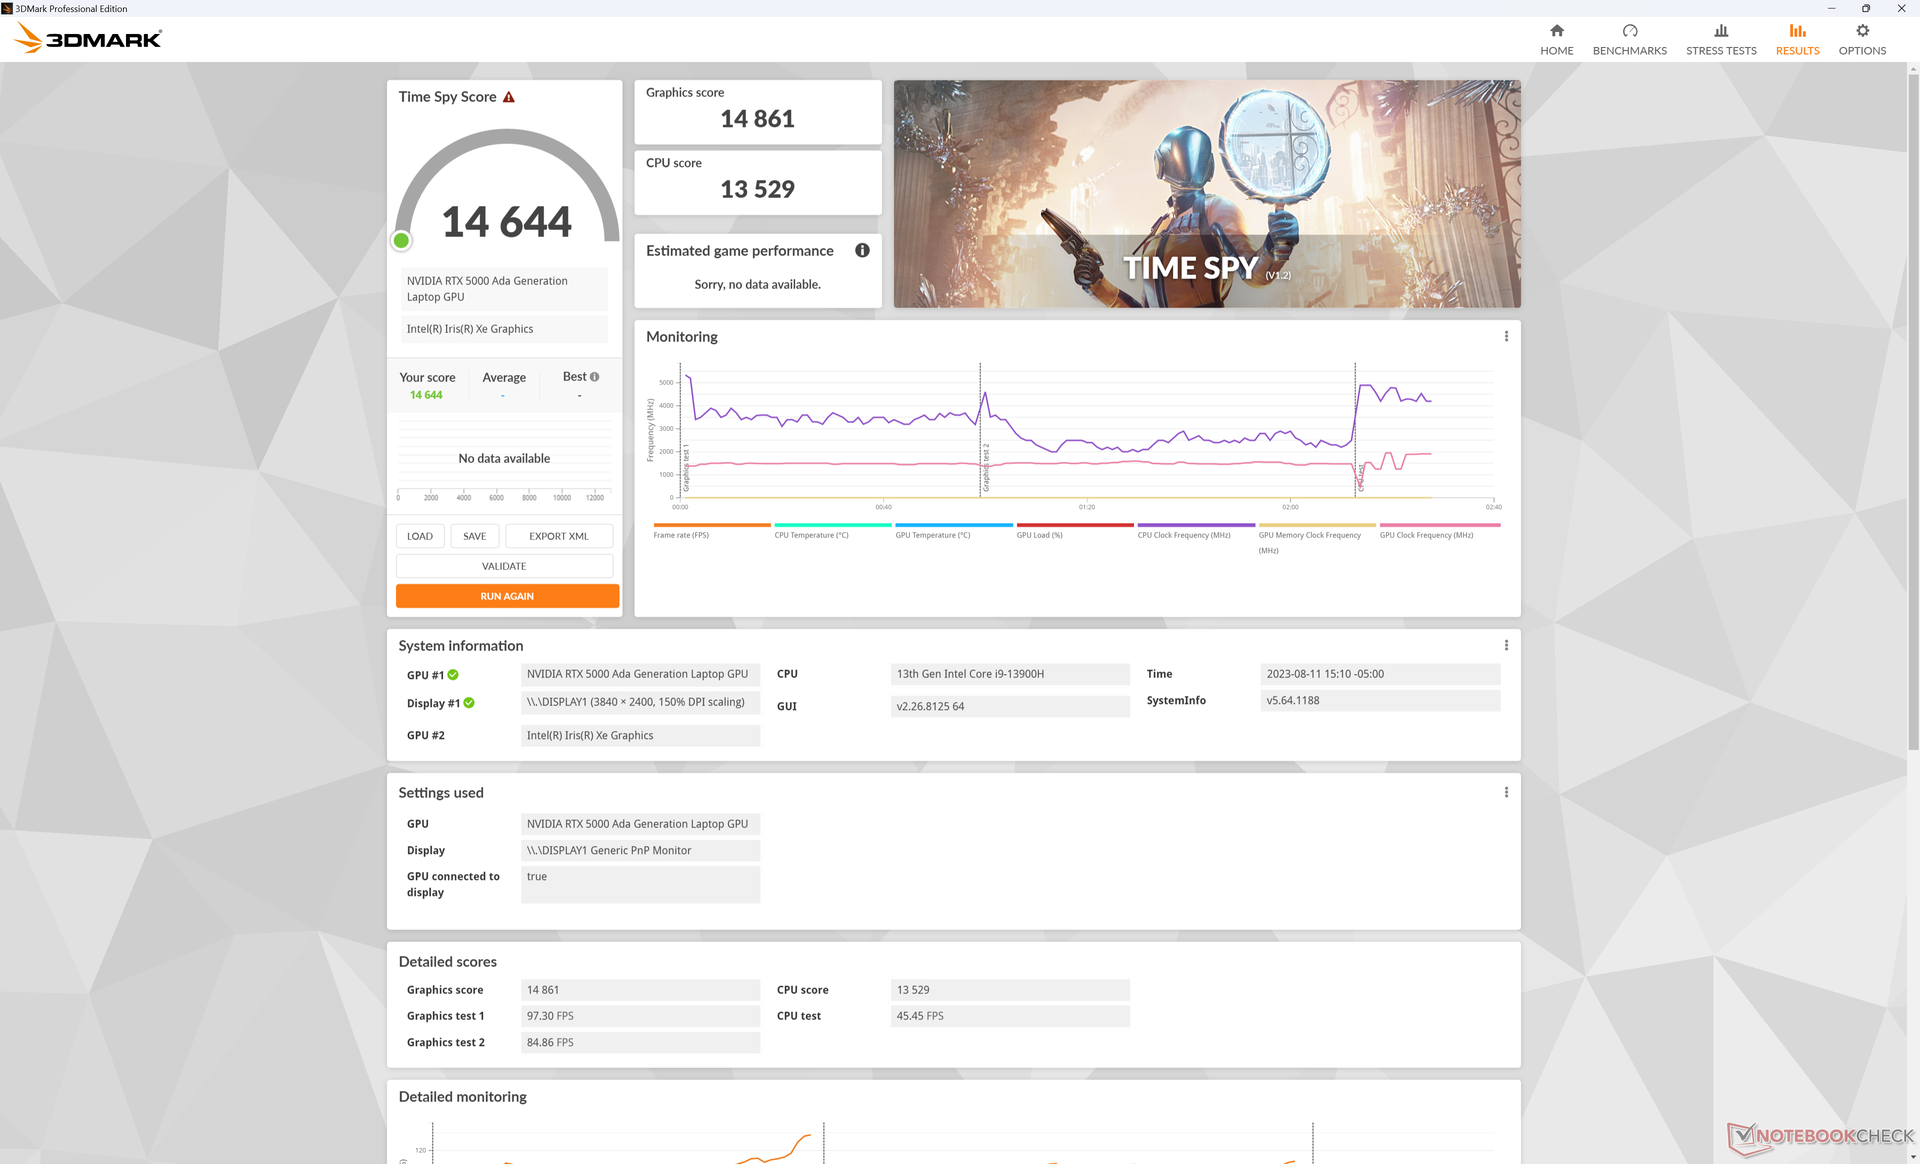
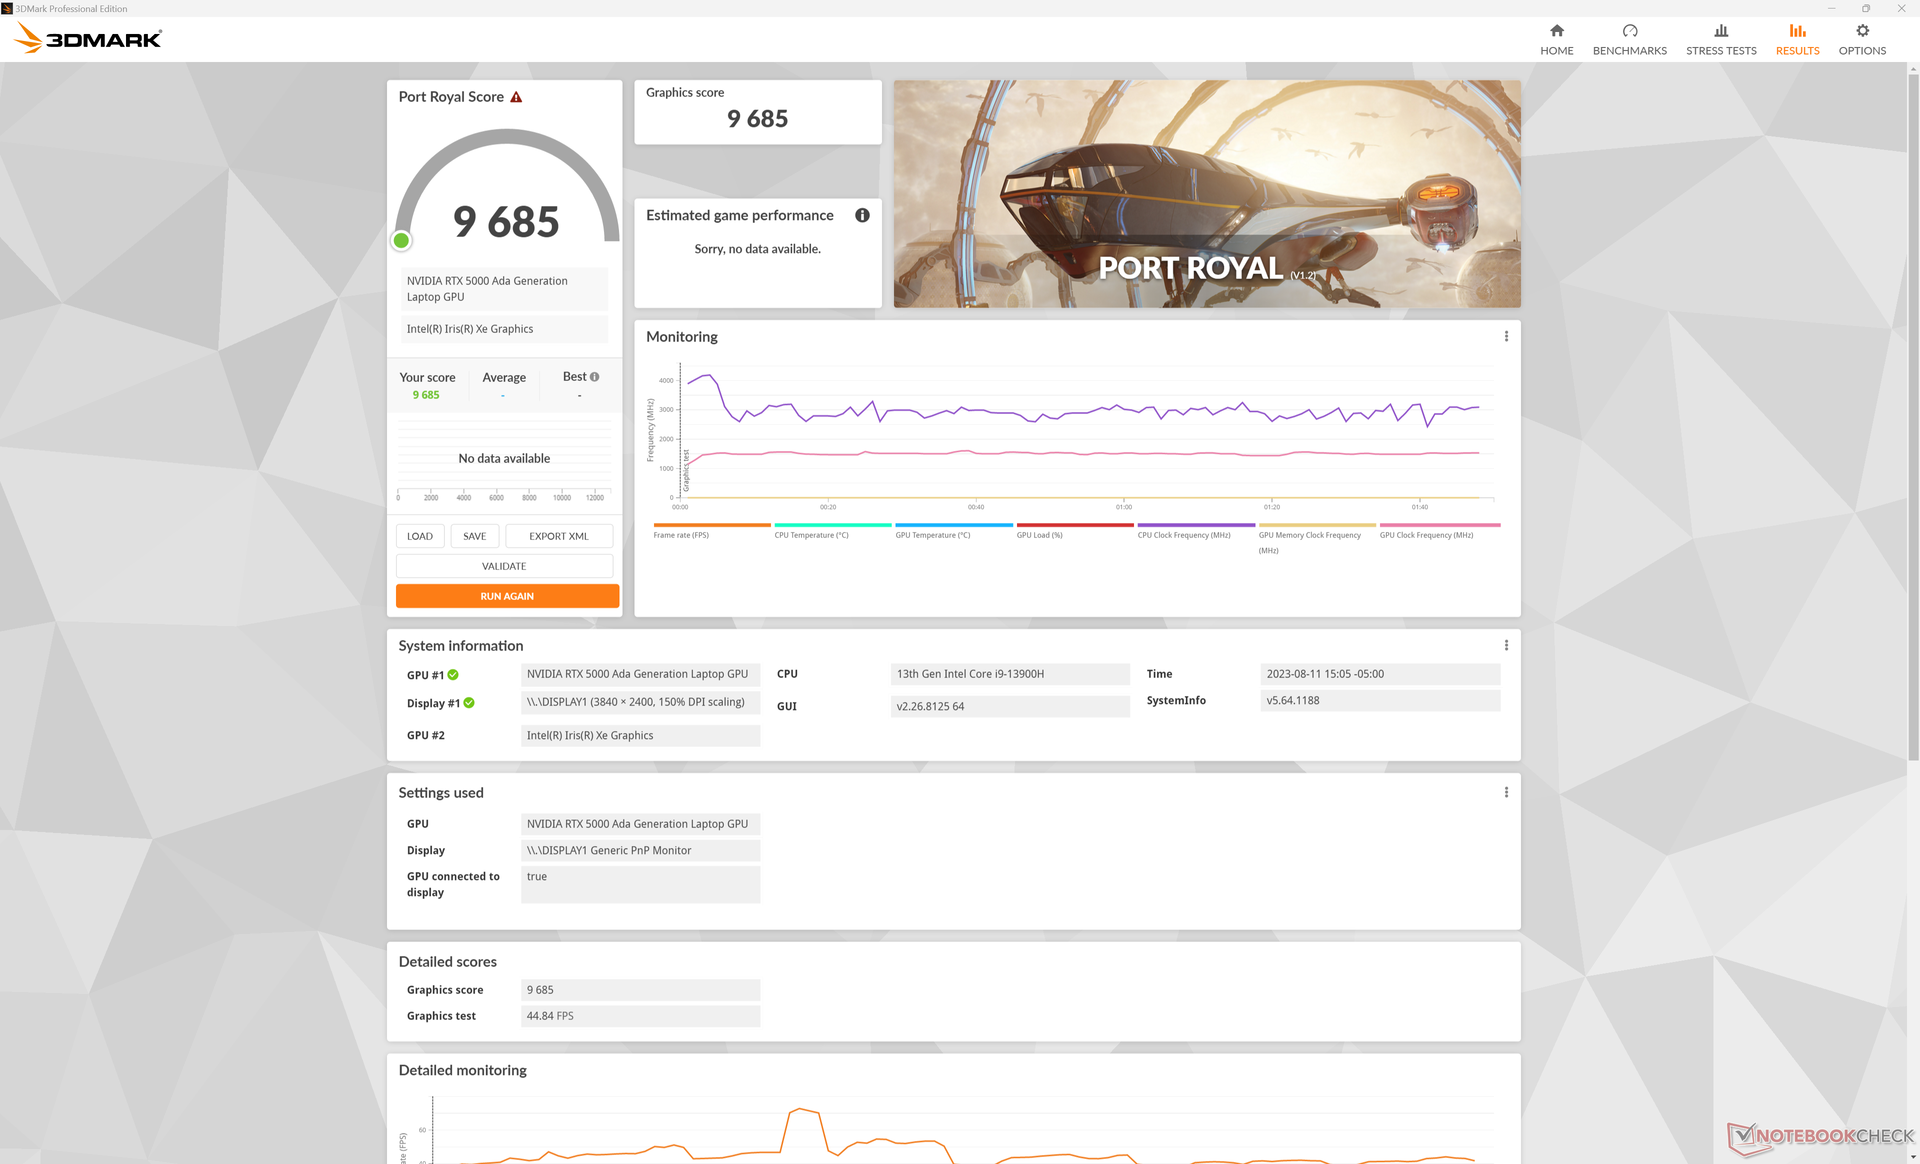
Performances du GPU - 70 W Nvidia Ada Lovelace
La nouvelle RTX 5000 offre des avantages notables en termes de performances par rapport à la RTX A5000 et A5500 en particulier dans les applications DX12 et l'accélération CUDA de Blender. Time Spy la RTX 5000, par exemple, obtiendrait un score de 30 à 40 % plus élevé sur notre site Precision que sur la carte graphique MSI WE76.MSI WE76 ou le Lenovo ThinkPad P16 G1, qui fonctionnent tous deux avec des GPU Ampere plus anciens. Les avantages s'étendent également à la plupart des sous-tests de Specviewperf.
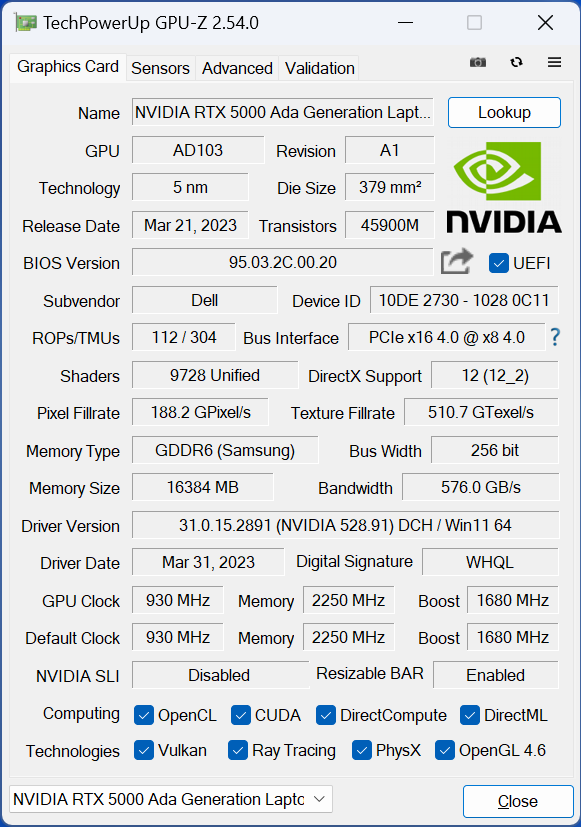
L'activation du mode VRAM ECC ne semble pas avoir d'impact sur les fréquences d'horloge de la mémoire, mais la VRAM maximale disponible passerait de 16384 Mo à 15360 Mo selon GPU-Z.
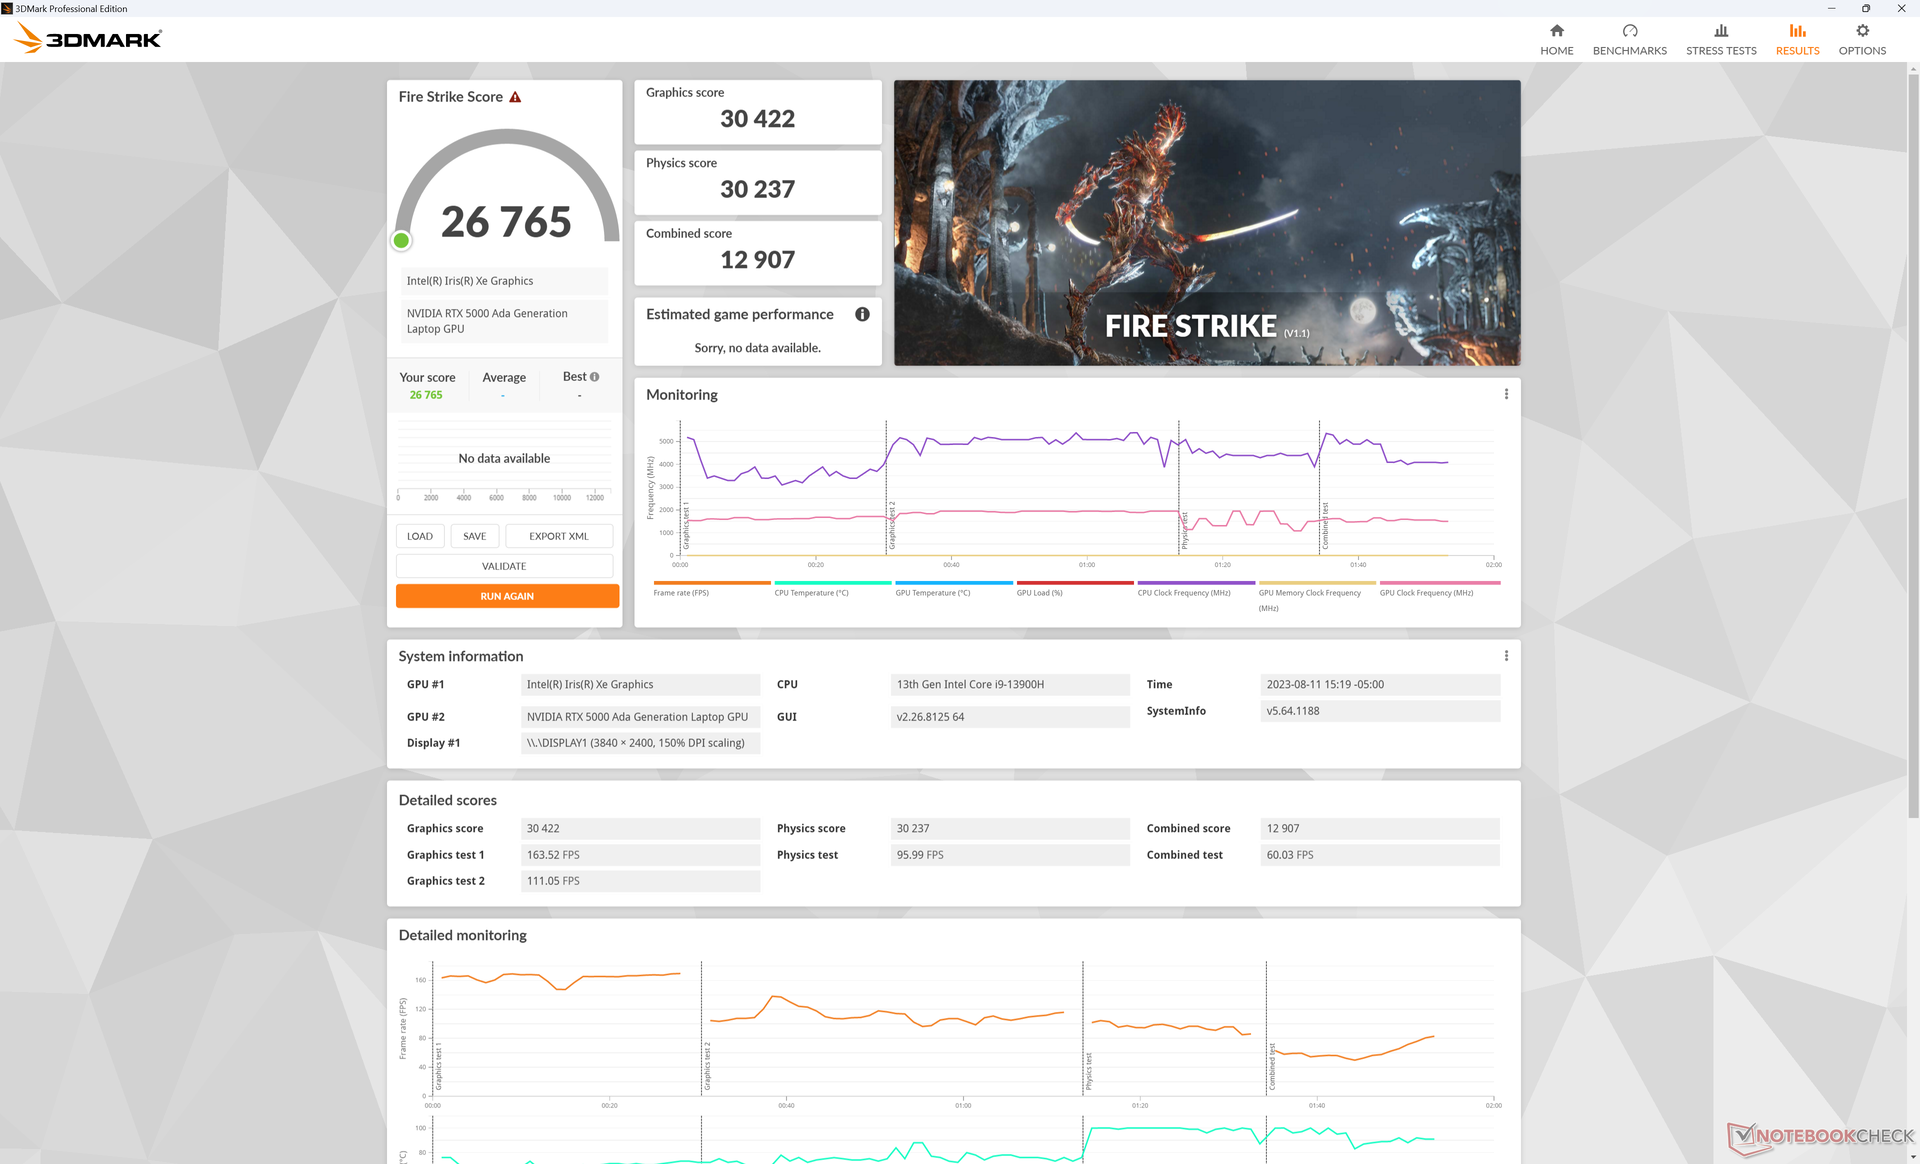
Notez qu'il n'y a pas d'impact majeur sur les performances du GPU lorsque l'on passe du mode Performance au mode Équilibré, comme le montrent les résultats du site Fire Strike ci-dessous. En revanche, les performances de l'unité centrale (CPU) sont sensiblement affectées.
| Profil de puissance | Score physique | Score graphique | Score combiné |
| Puissance de la batterie | 20938 (-31%) | 27514 (-10%) | 8910 (-31%) |
| Mode équilibré | 24828 (-18%) | 30588 (-0%) | 11365 (-12%) |
| Mode Performance | 30237 | 30422 | 12907 |
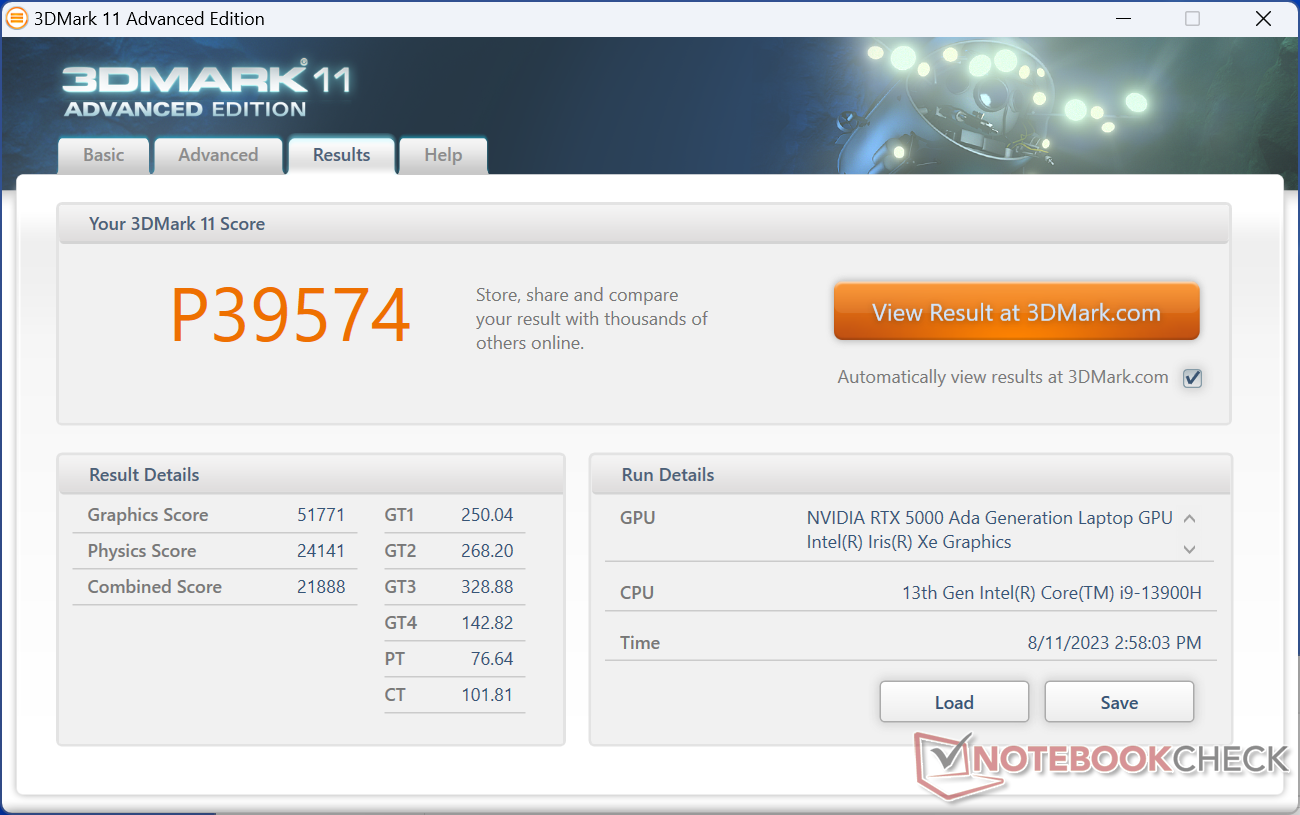
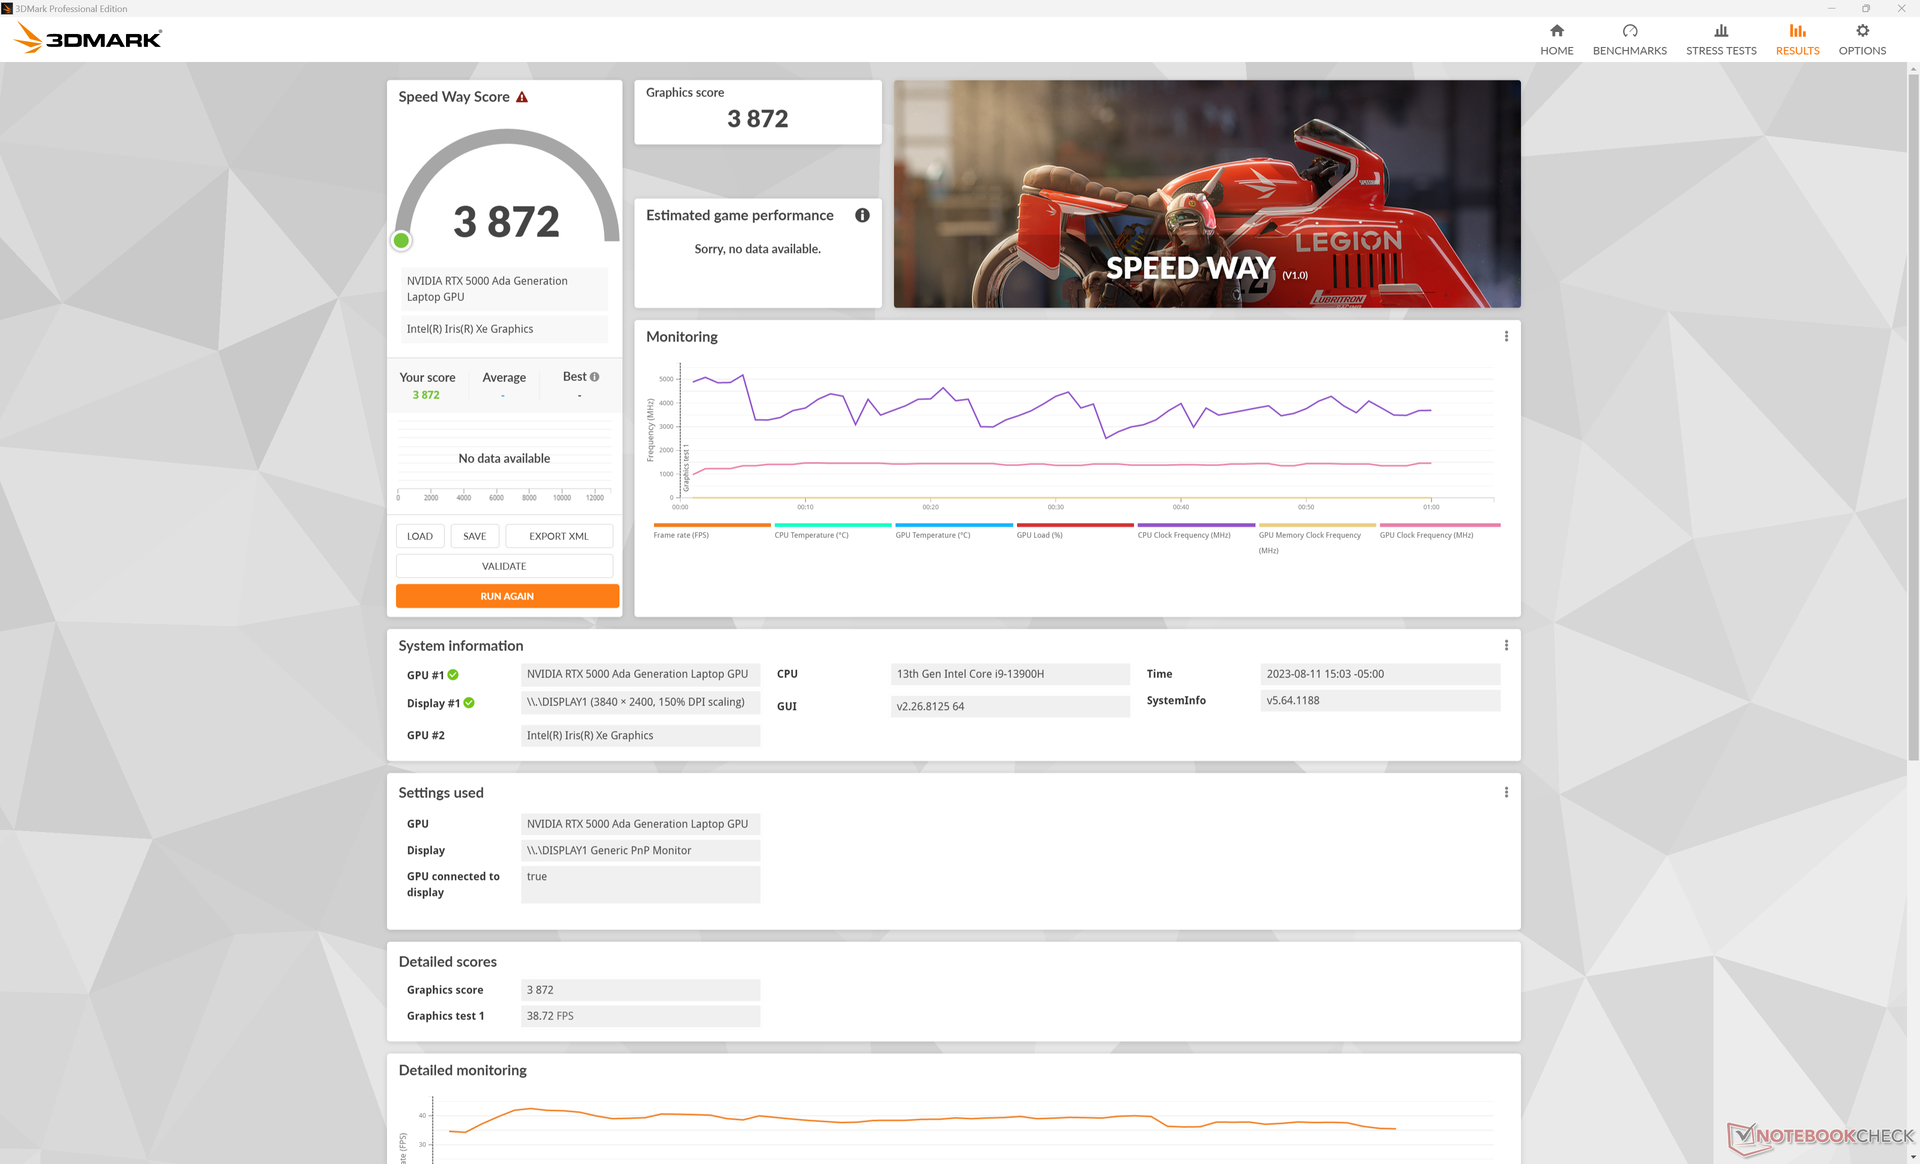
| 3DMark 11 Performance | 39574 points | |
| 3DMark Fire Strike Score | 26765 points | |
| 3DMark Time Spy Score | 14644 points | |
Aide | ||
* ... Moindre est la valeur, meilleures sont les performances
Performance des jeux
Bien qu'il ne s'agisse pas d'un ordinateur portable de jeu, le Precision 5680 est tout à fait capable de jouer aux titres les plus récents et les plus exigeants, sans aucun problème de compatibilité pendant les tests. Les performances de jeu globales se situent entre les cartes mobiles GeForce RTX 4060 et rTX 4070 mobile que l'on trouve sur les ordinateurs portables dédiés au jeu comme le HP Omen Transcend 16.
Witcher 3 FPS Chart
| Bas | Moyen | Élevé | Ultra | QHD | 4K | |
|---|---|---|---|---|---|---|
| GTA V (2015) | 185.4 | 179.7 | 175.3 | 117.1 | 106.6 | 108 |
| The Witcher 3 (2015) | 412.7 | 329.6 | 256 | 137 | 97 | |
| Dota 2 Reborn (2015) | 178 | 161.7 | 154 | 144 | 142.5 | |
| Final Fantasy XV Benchmark (2018) | 196.3 | 165.6 | 127.4 | 100.8 | 60.4 | |
| X-Plane 11.11 (2018) | 155.3 | 133 | 102.4 | 86.2 | ||
| Far Cry 5 (2018) | 145 | 132 | 129 | 132 | 114 | 70 |
| Cyberpunk 2077 1.6 (2022) | 124.9 | 122.7 | 107.7 | 100 | 66.2 | 32.2 |
| Tiny Tina's Wonderlands (2022) | 220 | 202.3 | 152.6 | 125 | 90.1 | 50.9 |
| F1 22 (2022) | 232 | 218 | 202 | 84.5 | 56.1 | 28.8 |
| Returnal (2023) | 98 | 94 | 90 | 81 | 60 | 34 |
Émissions - Silencieuses la plupart du temps
Bruit du système
Les niveaux sonores sont très proches de ceux duPrecision 5550 même si notre Precision 5680 est équipé d'un GPU beaucoup plus rapide. Les ventilateurs ont tendance à osciller entre 20 et 20 dB(A) lors de l'exécution de charges peu exigeantes comme les navigateurs web, tandis que des charges plus exigeantes induisent un bruit régulier de 51 dB(A).
Il est intéressant de noter que le niveau de bruit maximum des ventilateurs en mode équilibré est le même qu'en mode performance.
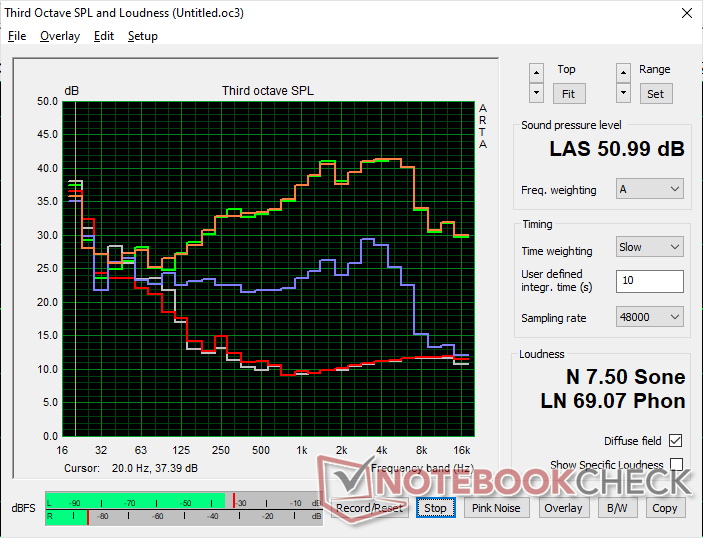
Degré de la nuisance sonore
| Au repos |
| 23 / 23 / 23 dB(A) |
| Fortement sollicité |
| 37.2 / 51 dB(A) |
 | ||
30 dB silencieux 40 dB(A) audible 50 dB(A) bruyant |
||
min: | ||
| Dell Precision 5000 5680 RTX 5000 Ada Generation Laptop, i9-13900H, 2x SK hynix PC801 HFS512GEJ9X101N RAID 0 | Dell Precision 7000 7670 Performance RTX A5500 Laptop GPU, i9-12950HX | HP ZBook Fury 16 G9 RTX A5500 Laptop GPU, i9-12950HX, Micron 3400 1TB MTFDKBA1T0TFH | Lenovo ThinkPad P16 G1 RTX A5500 RTX A5500 Laptop GPU, i9-12950HX, WDC PC SN810 2TB | MSI CreatorPro Z16P B12UKST RTX A3000 Laptop GPU, i7-12700H, Samsung PM9A1 MZVL21T0HCLR | Asus ExpertBook B6 Flip B6602FC2 RTX A2000 Laptop GPU, i9-12950HX, Samsung PM9A1 MZVL21T0HCLR | |
|---|---|---|---|---|---|---|
| Noise | -11% | -2% | 3% | -8% | -30% | |
| arrêt / environnement * (dB) | 22.8 | 23.9 -5% | 22.6 1% | 23.1 -1% | 24.1 -6% | 26 -14% |
| Idle Minimum * (dB) | 23 | 24 -4% | 22.7 1% | 23.1 -0% | 27.1 -18% | 32.4 -41% |
| Idle Average * (dB) | 23 | 24 -4% | 22.7 1% | 23.1 -0% | 27.1 -18% | 32.4 -41% |
| Idle Maximum * (dB) | 23 | 38 -65% | 28.8 -25% | 23.1 -0% | 27.1 -18% | 32.4 -41% |
| Load Average * (dB) | 37.2 | 46.3 -24% | 36.2 3% | 28.9 22% | 42.9 -15% | 51.9 -40% |
| Witcher 3 ultra * (dB) | 51 | 41.9 18% | 49.5 3% | 51.6 -1% | 44 14% | |
| Load Maximum * (dB) | 51 | 47.9 6% | 49.3 3% | 51.4 -1% | 47 8% | 52.1 -2% |
* ... Moindre est la valeur, meilleures sont les performances
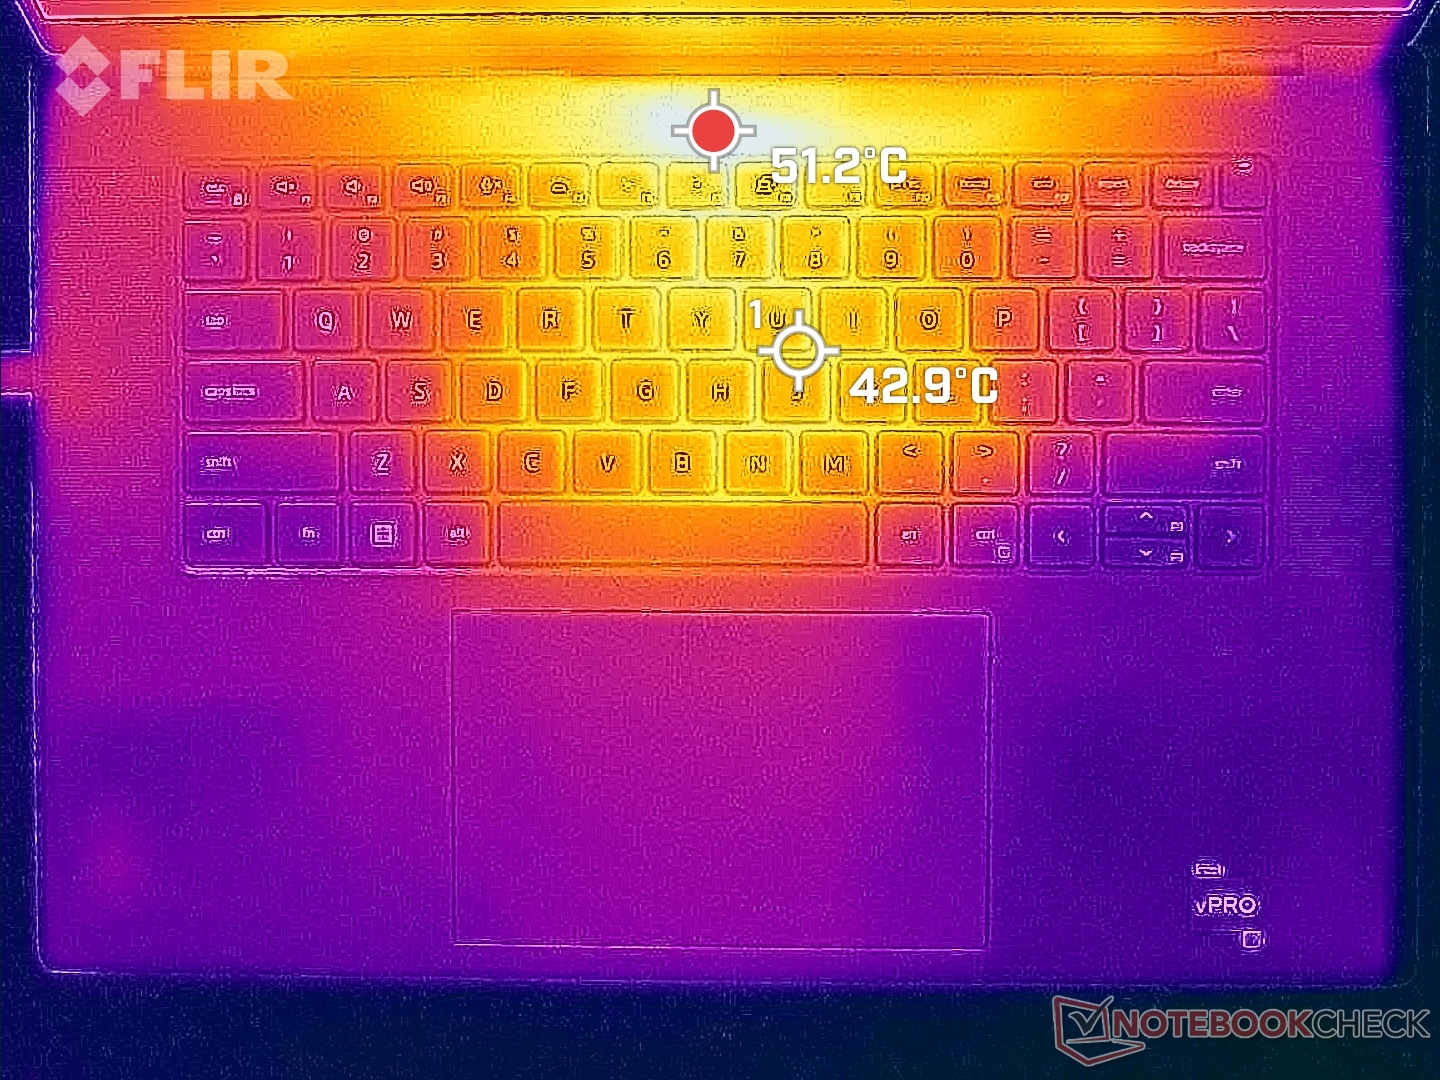
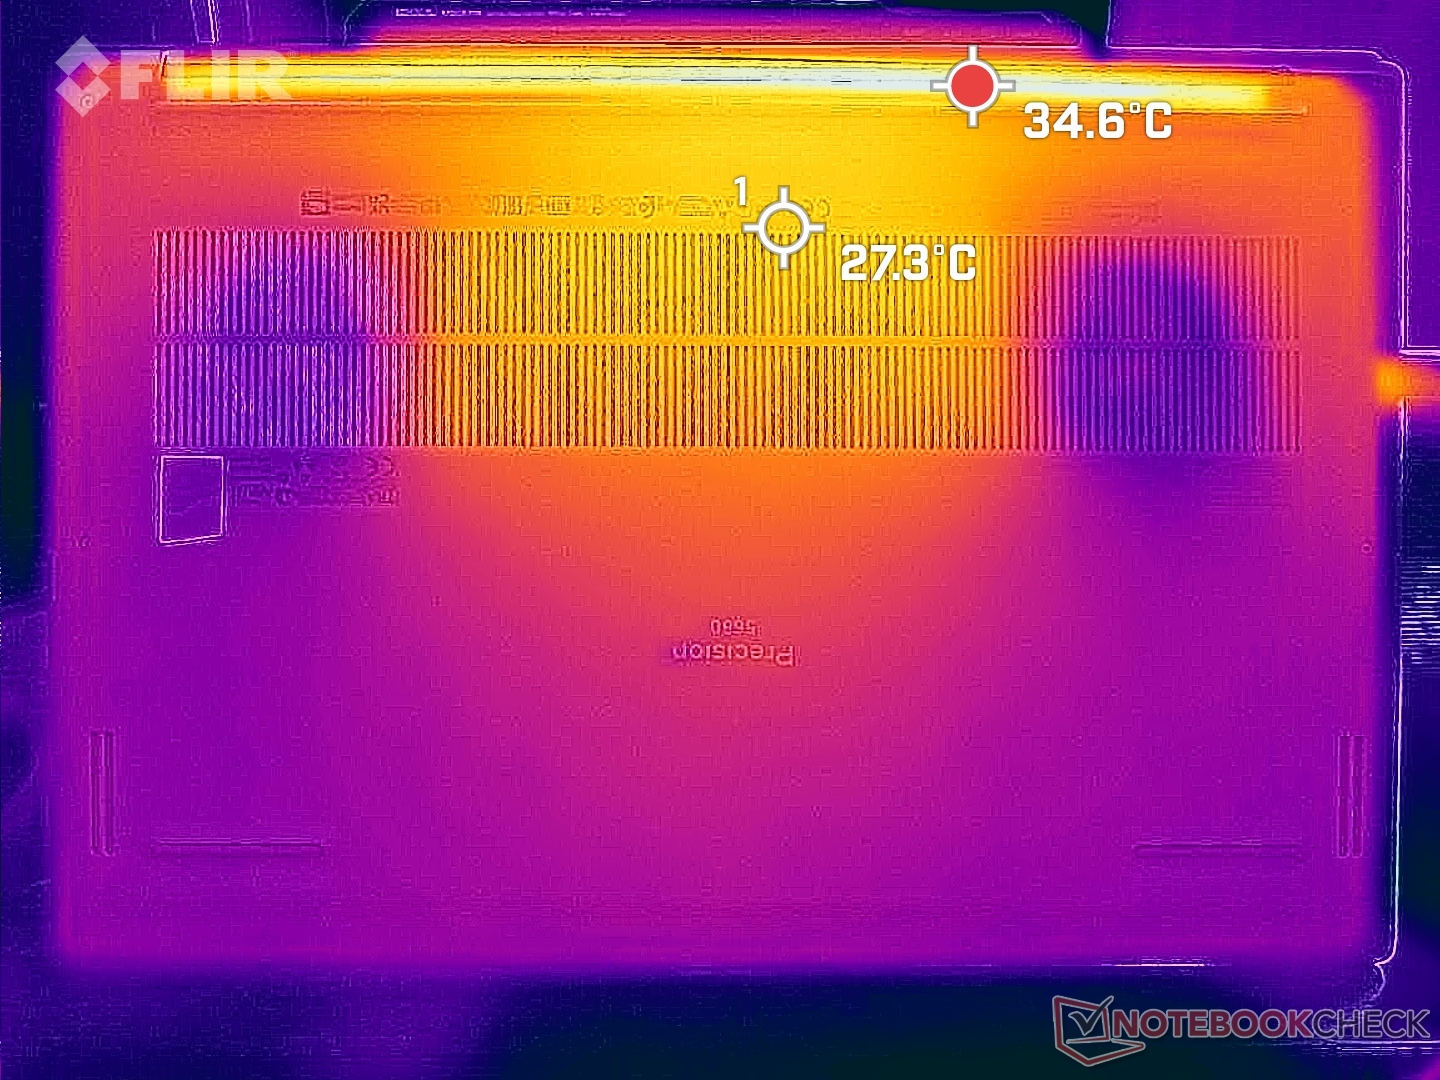
Température
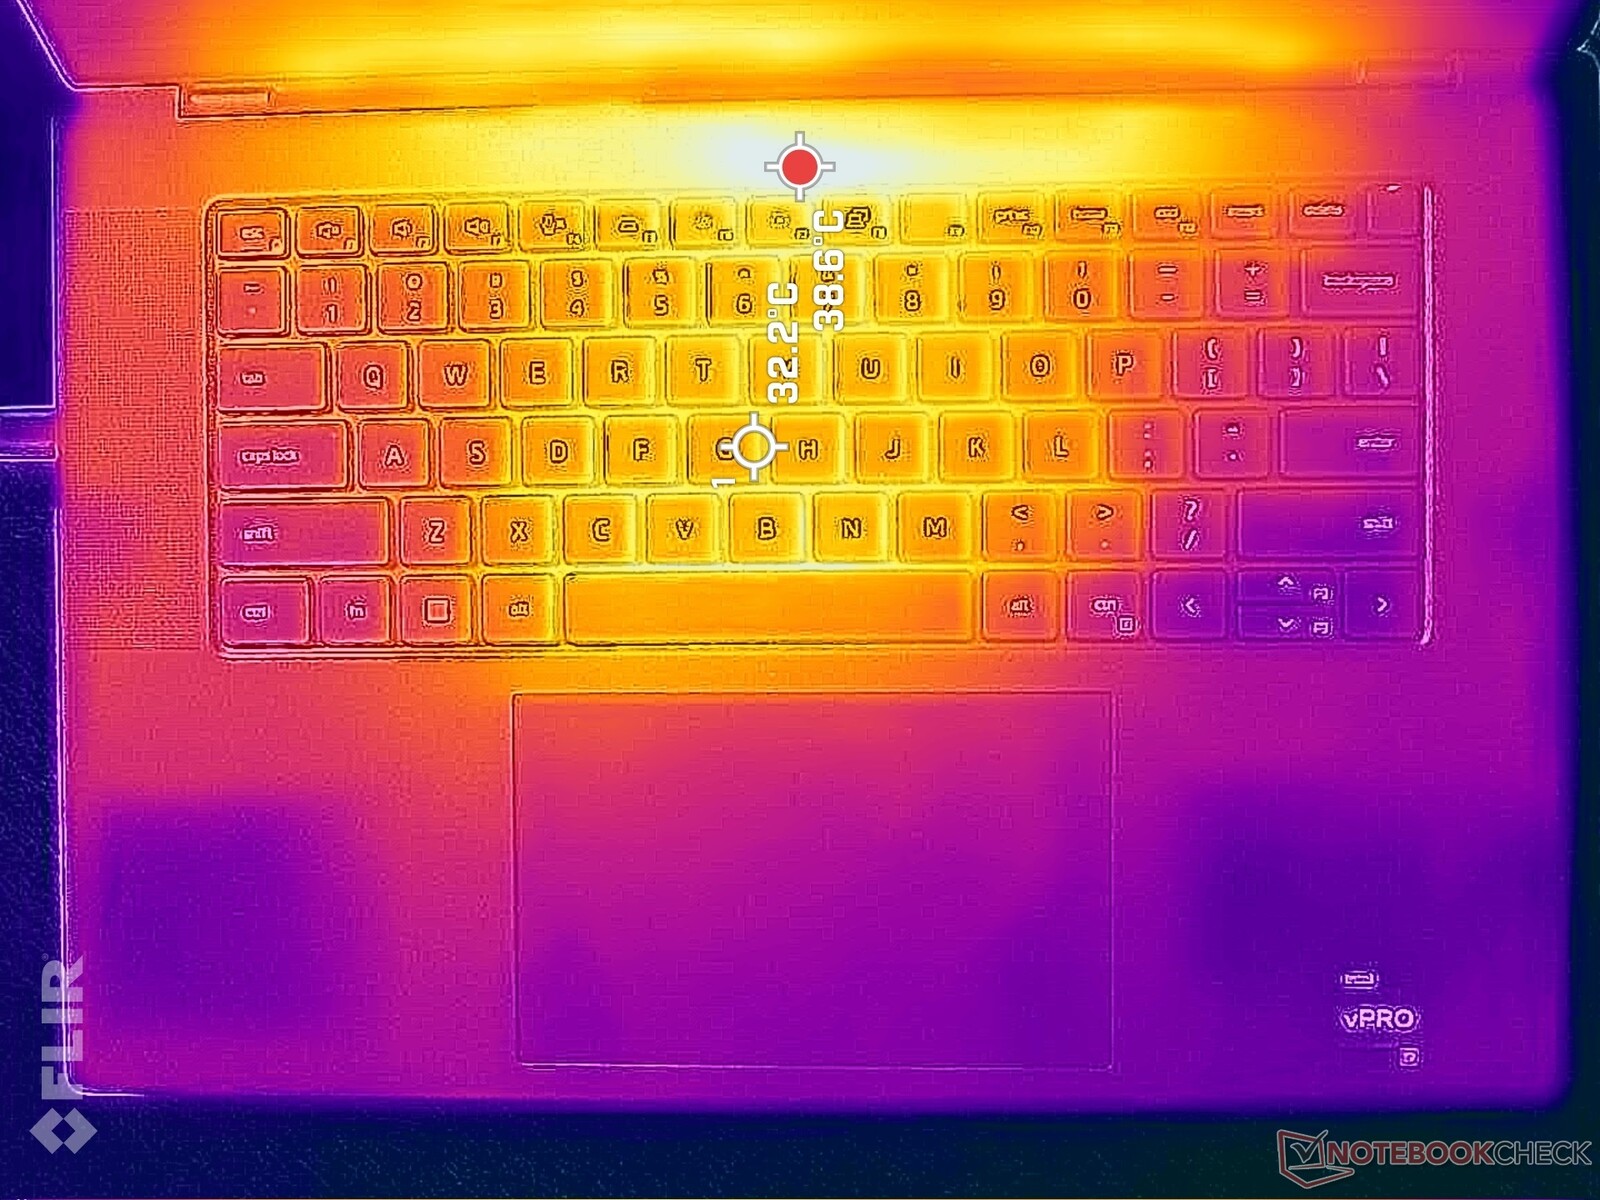
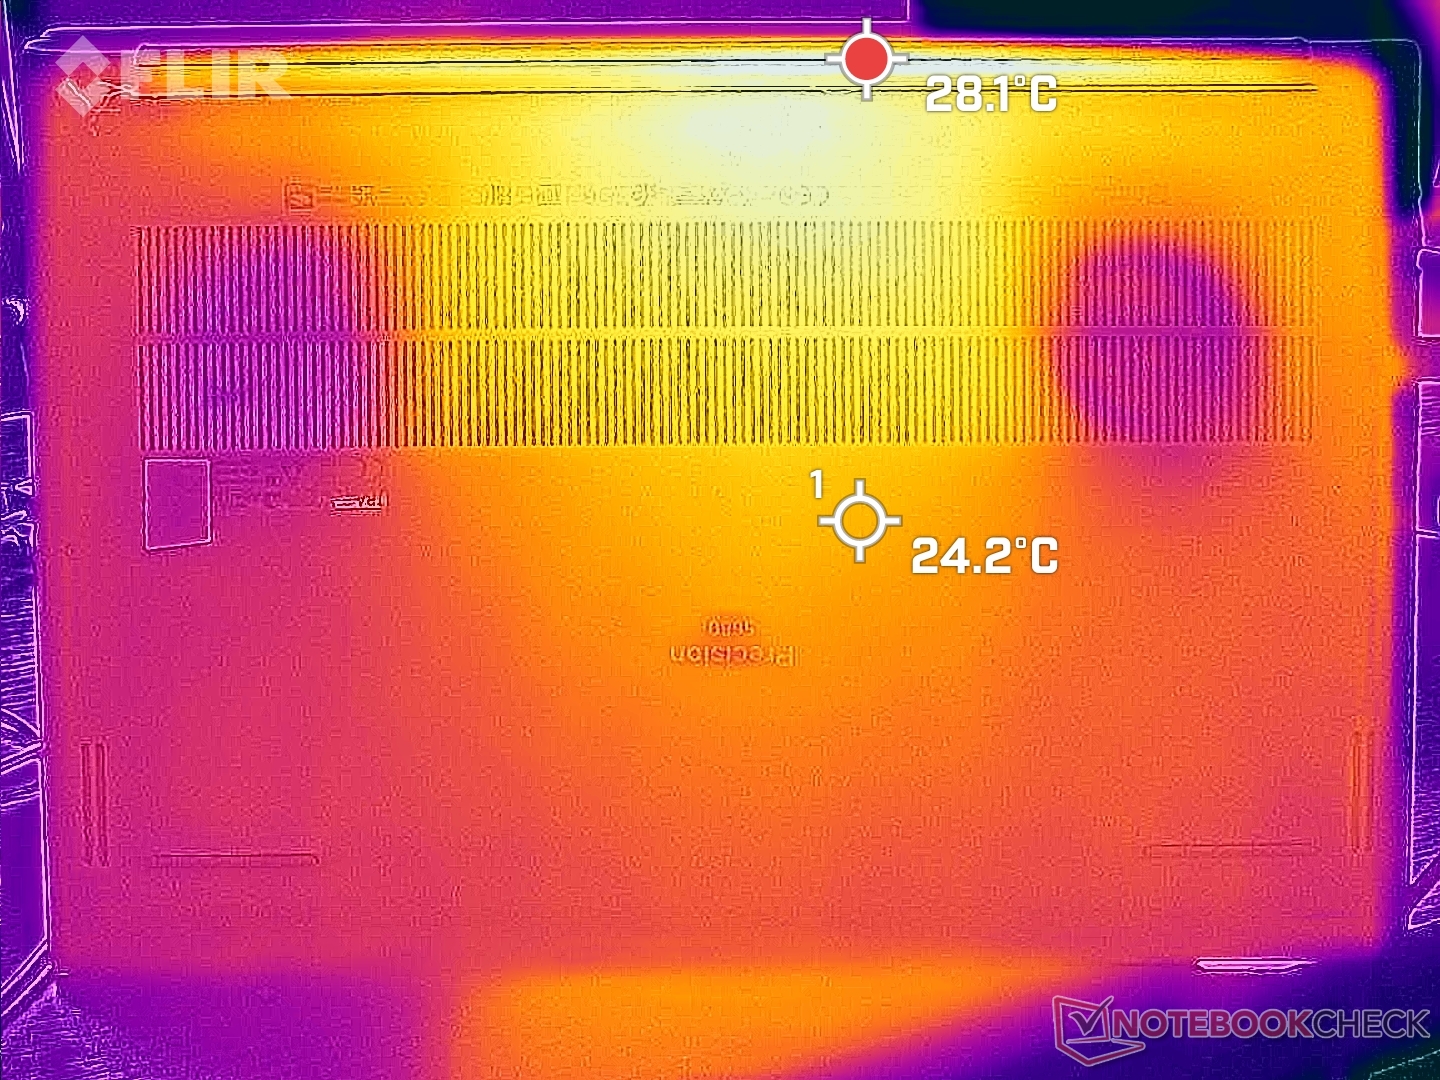
Les températures de surface au ralenti sont plus élevées que prévu, car les ventilateurs ont tendance à tourner au ralenti jusqu'à ce qu'on en ait besoin. Les points chauds peuvent atteindre 37 °C et 32 °C sur les faces supérieure et inférieure, respectivement, contre moins de 30 °C sur la face inférieure.ExpertBook B6 Flip.
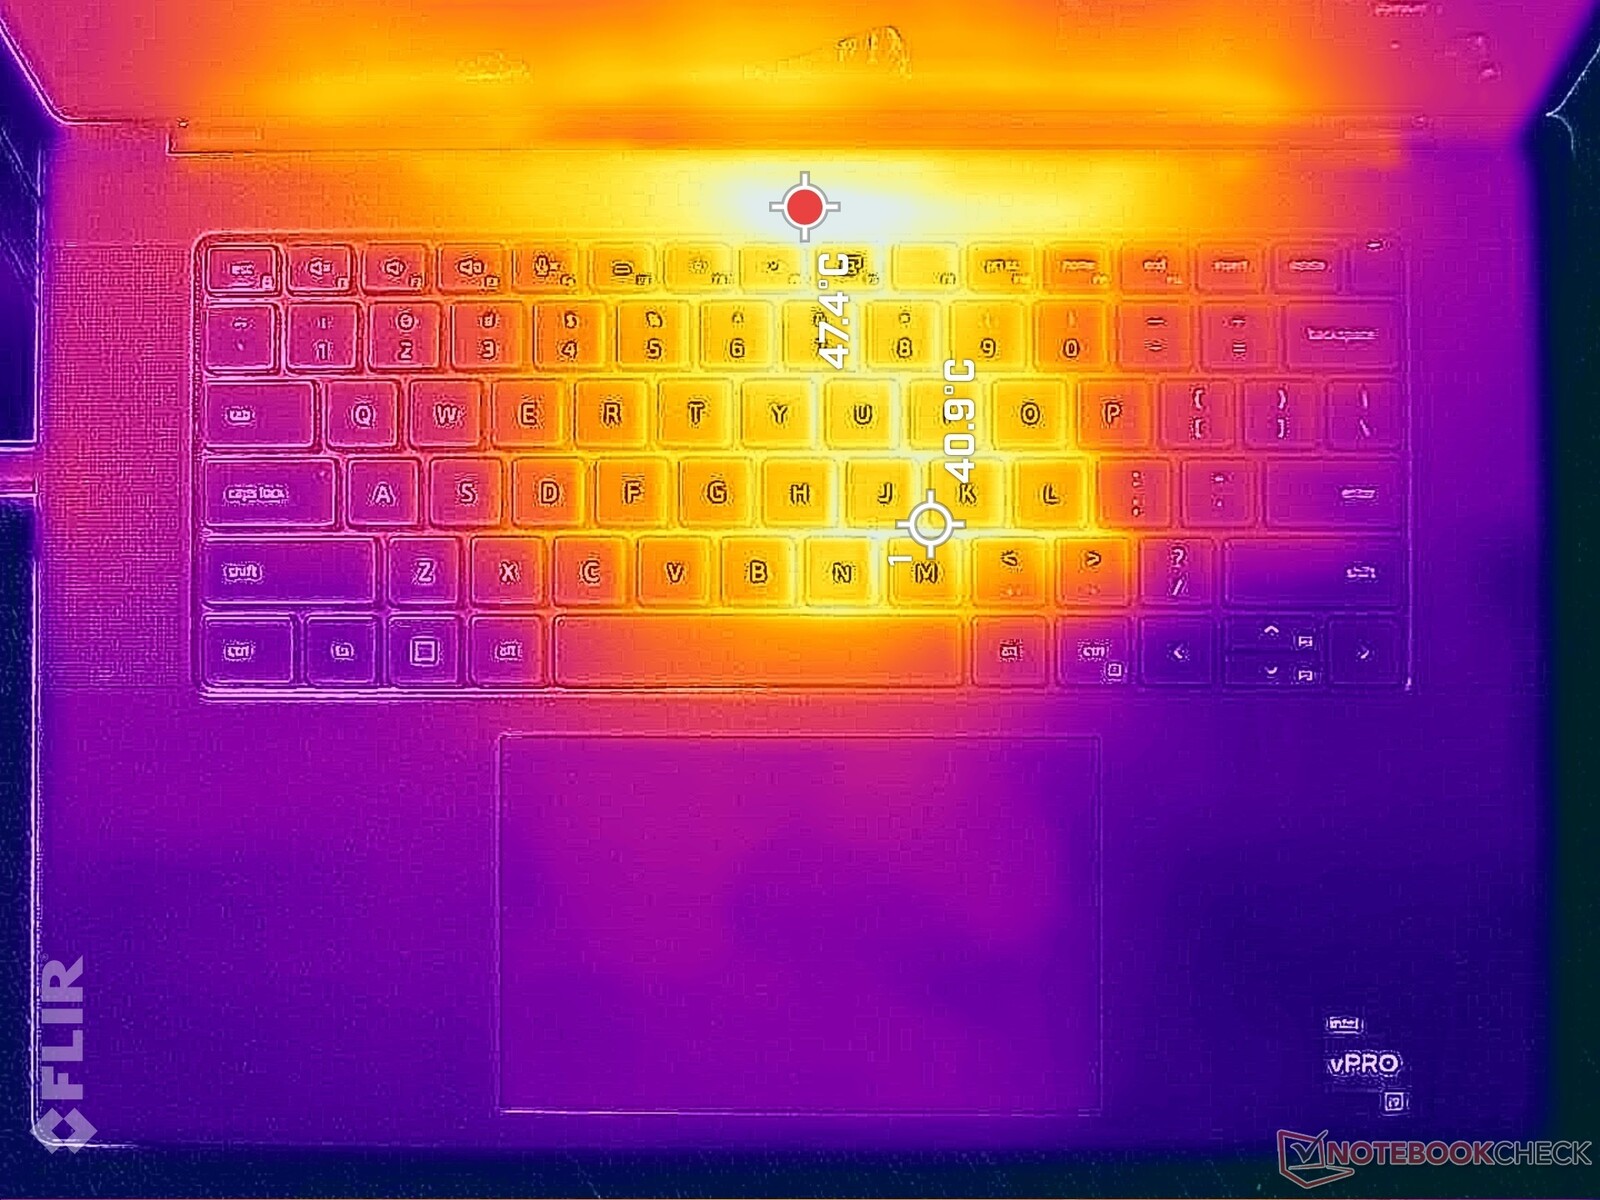
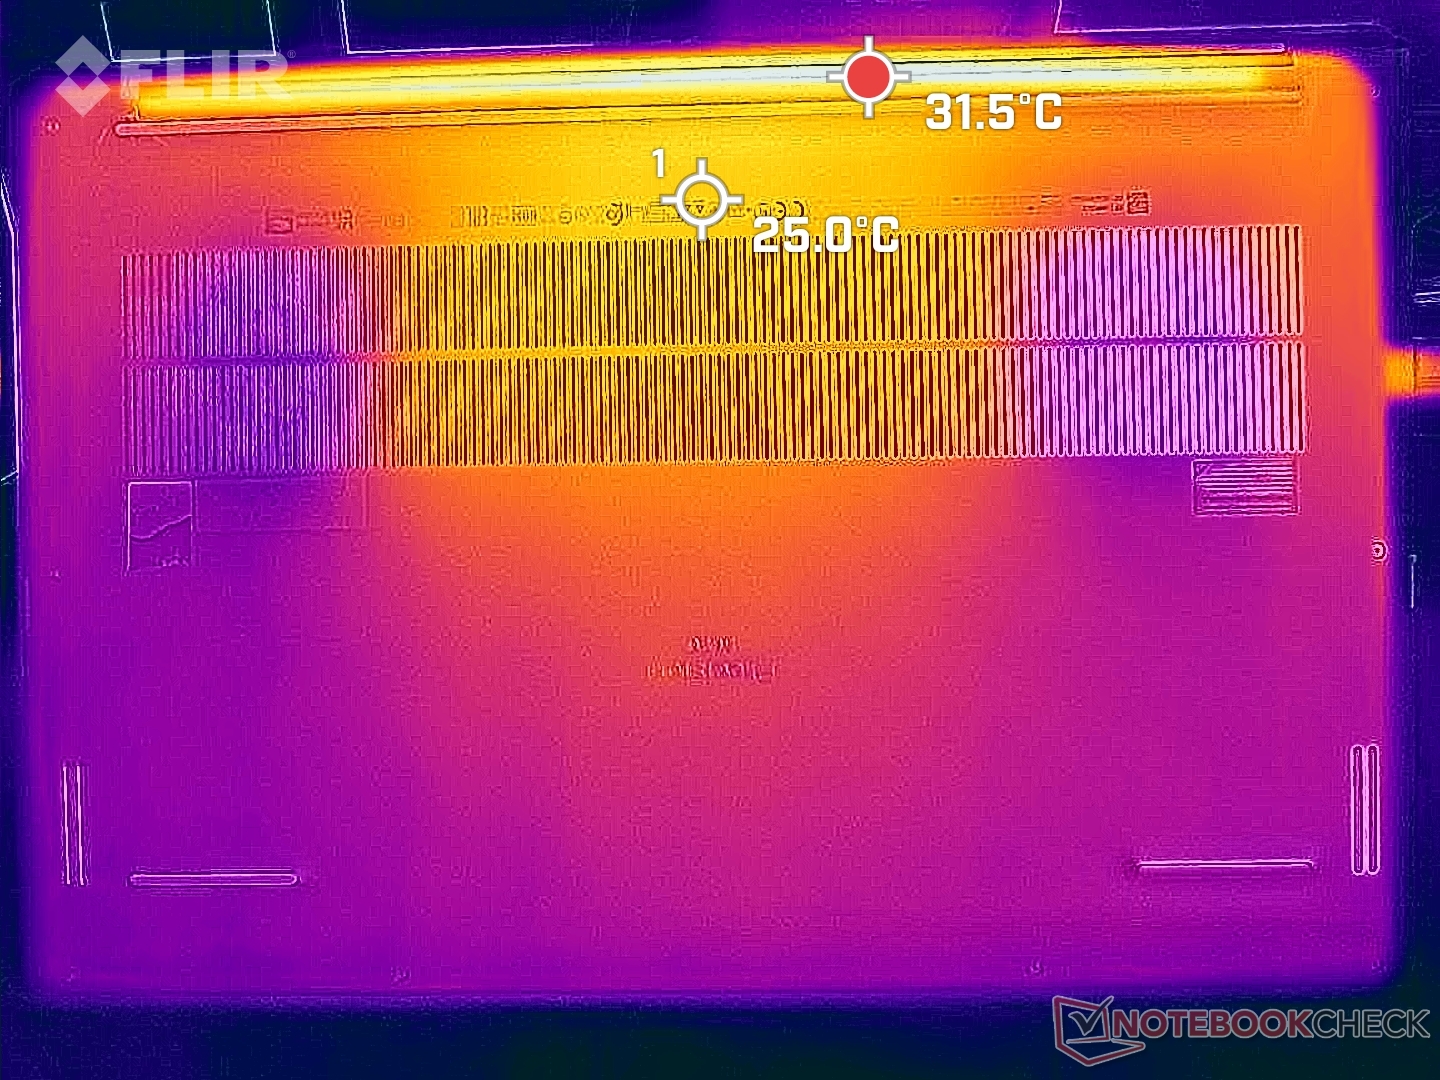
Lors de l'exécution de charges plus exigeantes, le centre du clavier peut atteindre plus de 50°C alors que la surface inférieure se réchauffe à peine, en partie à cause des isolants Gore. Les doigts et les paumes ne touchent que rarement le centre du clavier, de sorte que les points chauds n'ont généralement pas d'impact sur le confort.
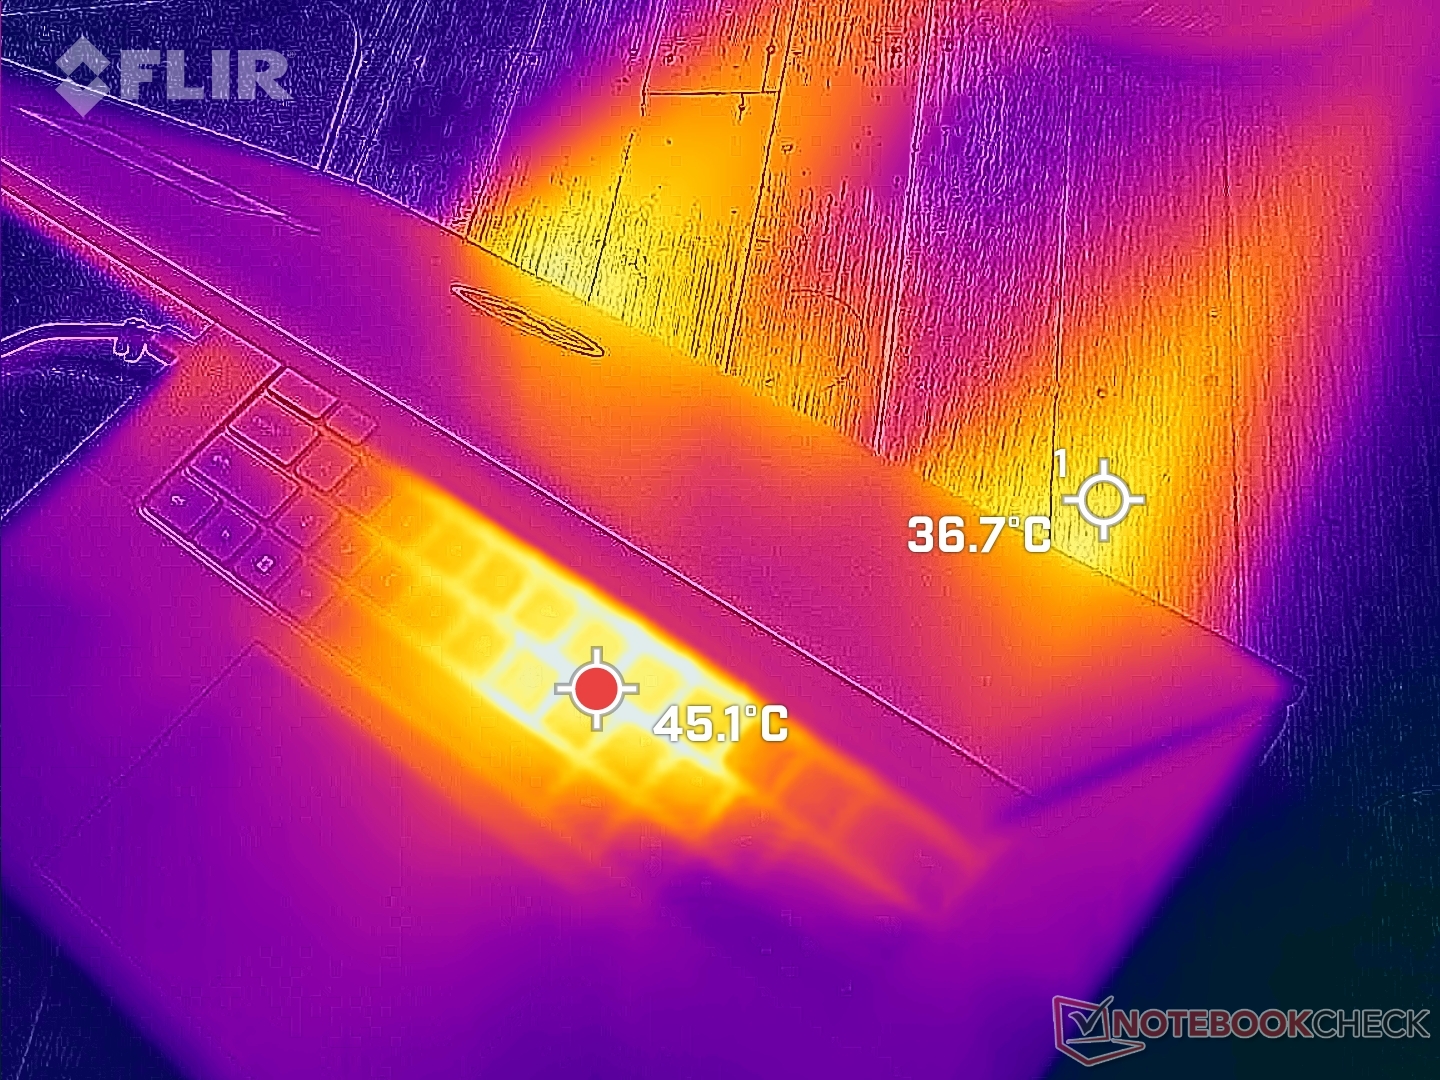
(-) La température maximale du côté supérieur est de 50.2 °C / 122 F, par rapport à la moyenne de 38.2 °C / 101 F, allant de 22.2 à 69.8 °C pour la classe Workstation.
(+) Le fond chauffe jusqu'à un maximum de 32 °C / 90 F, contre une moyenne de 41.1 °C / 106 F
(+) En utilisation inactive, la température moyenne du côté supérieur est de 30.1 °C / 86 F, par rapport à la moyenne du dispositif de 32 °C / 90 F.
(±) En jouant à The Witcher 3, la température moyenne du côté supérieur est de 34.6 °C / 94 F, alors que la moyenne de l'appareil est de 32 °C / 90 F.
(+) Les repose-poignets et le pavé tactile sont plus froids que la température de la peau avec un maximum de 27.6 °C / 81.7 F et sont donc froids au toucher.
(±) La température moyenne de la zone de l'appui-paume de dispositifs similaires était de 27.8 °C / 82 F (+0.2 °C / #0.3 F).
| Dell Precision 5000 5680 Intel Core i9-13900H, NVIDIA RTX 5000 Ada Generation Laptop | Dell Precision 7000 7670 Performance Intel Core i9-12950HX, NVIDIA RTX A5500 Laptop GPU | HP ZBook Fury 16 G9 Intel Core i9-12950HX, NVIDIA RTX A5500 Laptop GPU | Lenovo ThinkPad P16 G1 RTX A5500 Intel Core i9-12950HX, NVIDIA RTX A5500 Laptop GPU | MSI CreatorPro Z16P B12UKST Intel Core i7-12700H, NVIDIA RTX A3000 Laptop GPU | Asus ExpertBook B6 Flip B6602FC2 Intel Core i9-12950HX, NVIDIA RTX A2000 Laptop GPU | |
|---|---|---|---|---|---|---|
| Heat | -12% | -3% | -13% | -19% | -8% | |
| Maximum Upper Side * (°C) | 50.2 | 53 -6% | 43.2 14% | 44.8 11% | 56.3 -12% | 48.4 4% |
| Maximum Bottom * (°C) | 32 | 43.2 -35% | 50.4 -58% | 49.8 -56% | 68.3 -113% | 52.3 -63% |
| Idle Upper Side * (°C) | 37.4 | 36.8 2% | 28.6 24% | 30.6 18% | 25.2 33% | 27.8 26% |
| Idle Bottom * (°C) | 31.2 | 33.8 -8% | 28.2 10% | 38.6 -24% | 25.9 17% | 30.3 3% |
* ... Moindre est la valeur, meilleures sont les performances
Test de stress
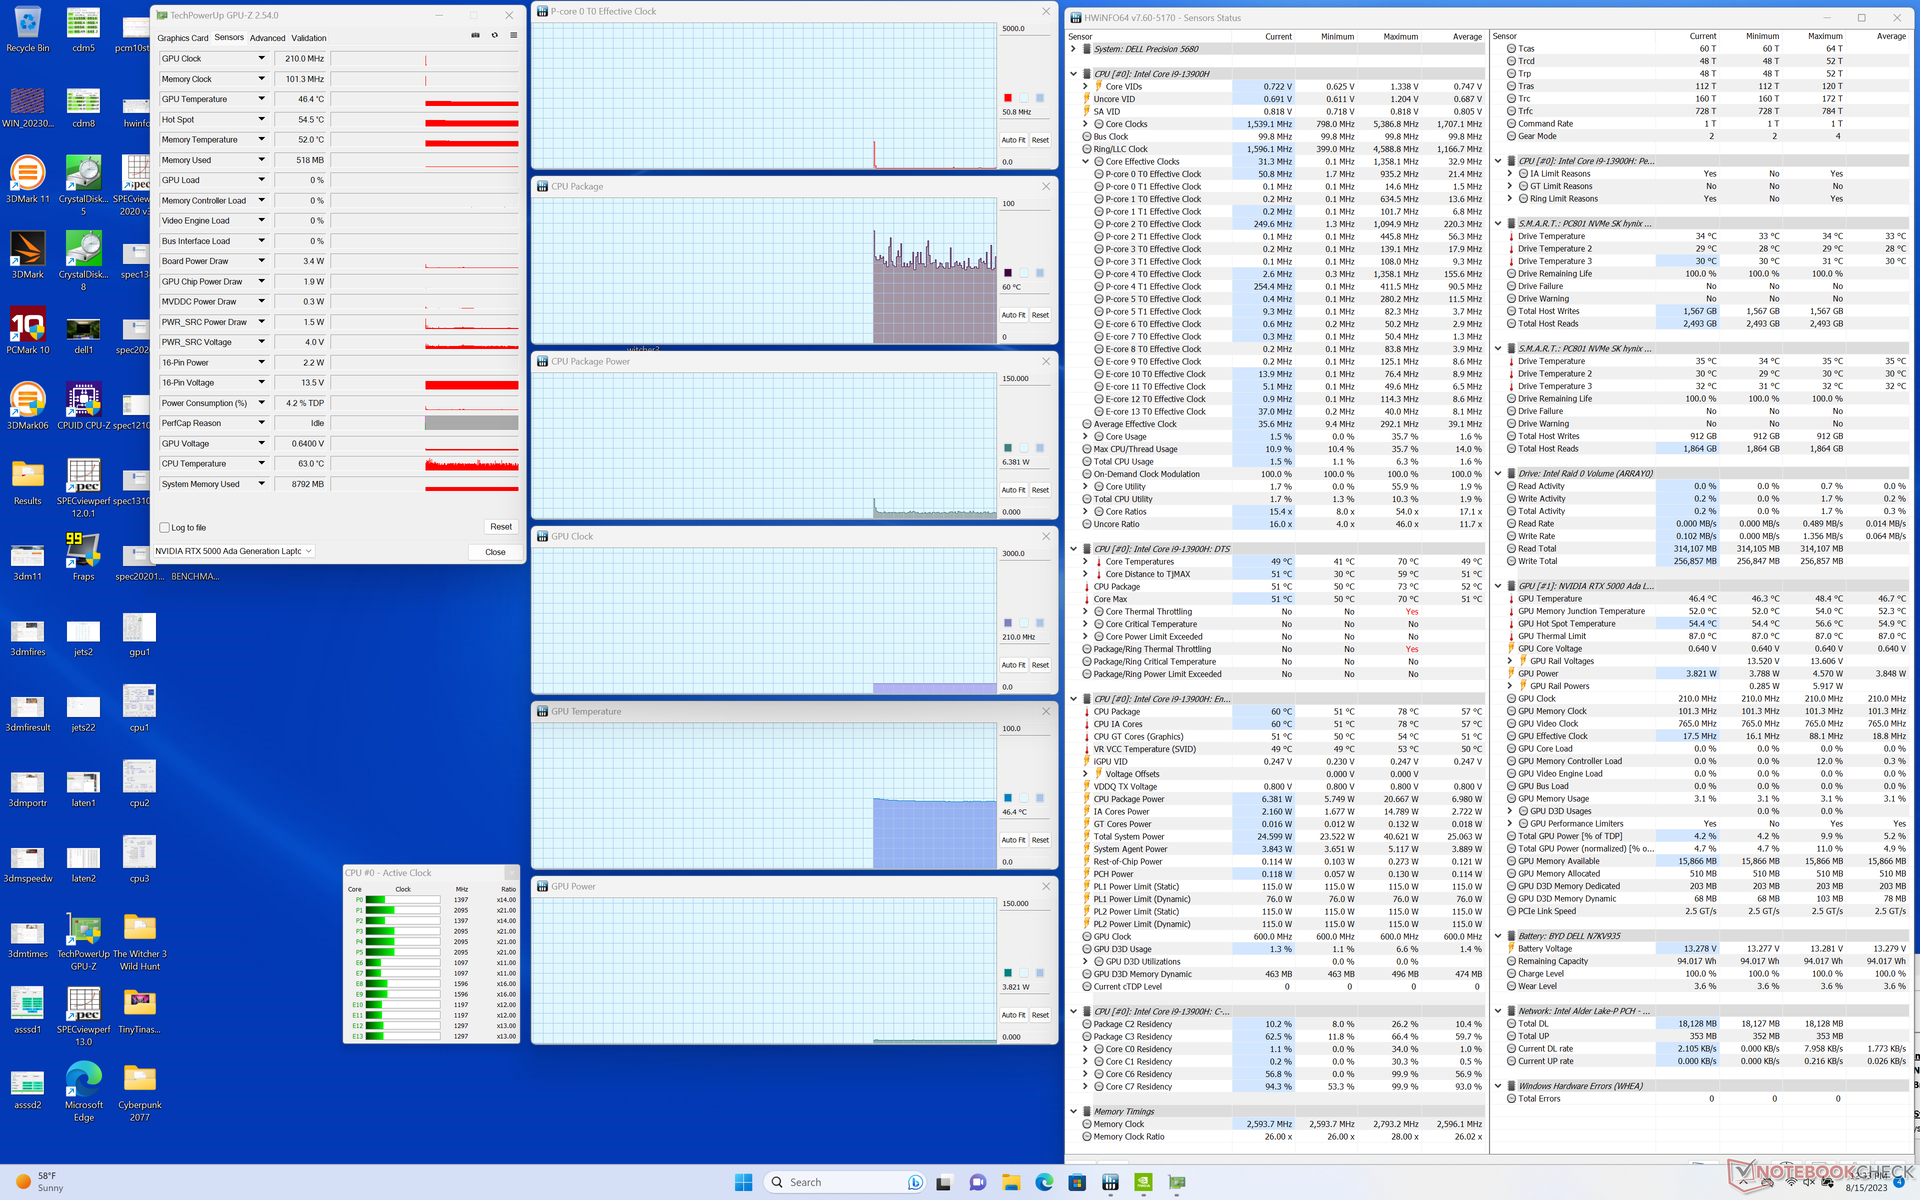
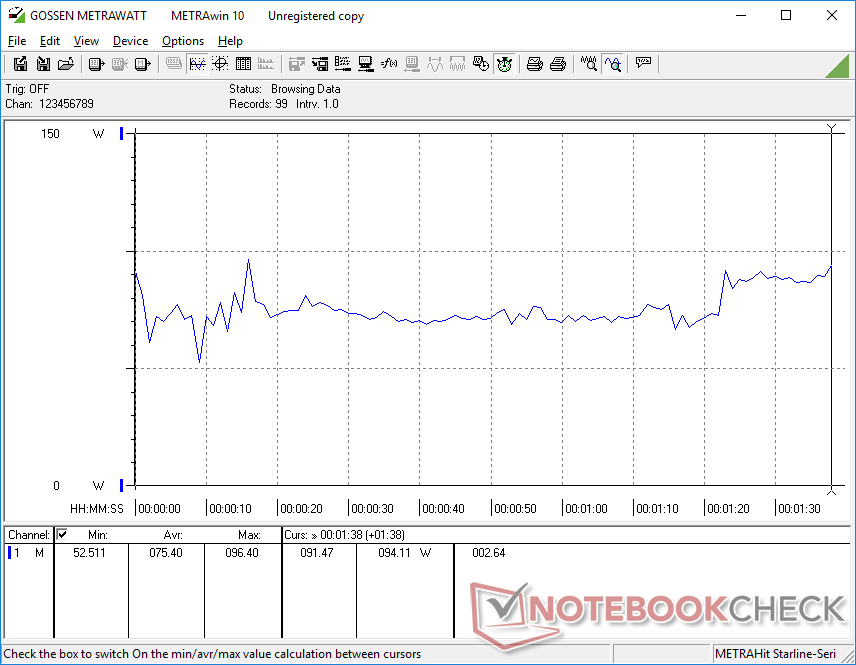
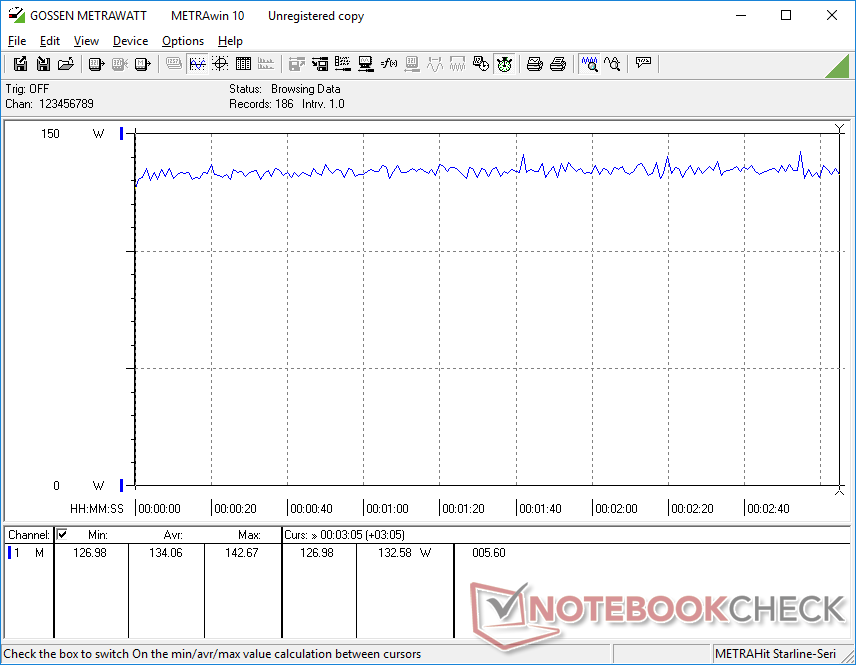
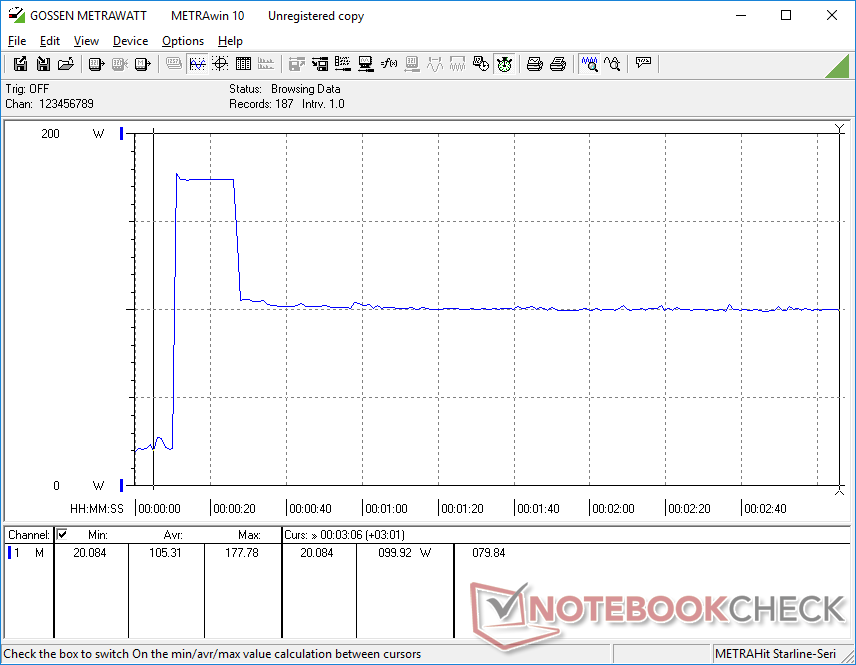
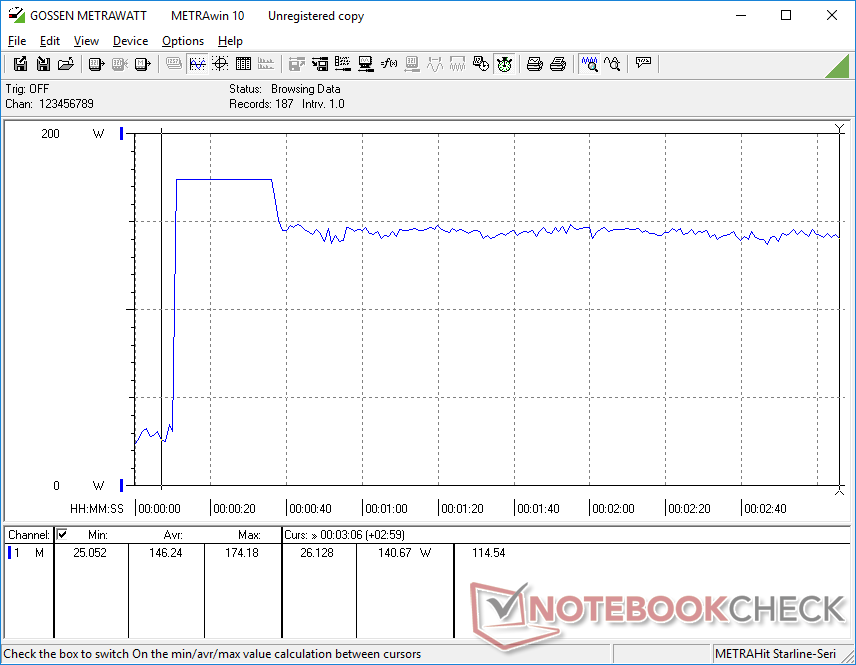
Lors de l'exécution de Prime95, le processeur atteignait 3,9 GHz, 117 W et 100 C pendant seulement 15 secondes environ. Par la suite, le potentiel de Turbo Boost diminue puis se stabilise à environ 2,8 GHz et 56 W pour une température plus raisonnable de 75 C. Le Turbo Boost maximal n'est donc pas viable sur le site Precision 5680, même en mode Performance.
L'utilisation du mode équilibré au lieu du mode performance n'a pas d'impact négatif sur les performances du GPU, comme indiqué ci-dessus. L'horloge, la température et la consommation d'énergie du GPU en mode Performance se stabilisent à 15 minutes Witcher 3 en mode Performance se stabilisent respectivement à 1560 MHz, 72 C et 63 W, contre 1665 MHz, 65 C et 69 W en mode Equilibré. La plus grande différence entre les modes Équilibré et Performance semble être la température du CPU qui peut atteindre plus de 100°C en mode Performance pour un potentiel Turbo Boost plus élevé, contre seulement 80°C en mode Équilibré.
Notez que nous n'avons pu atteindre qu'une consommation maximale de 75 W sur la carte graphique, alors que le TGP cible est de 95 W selon le panneau de contrôle de Nvidia.
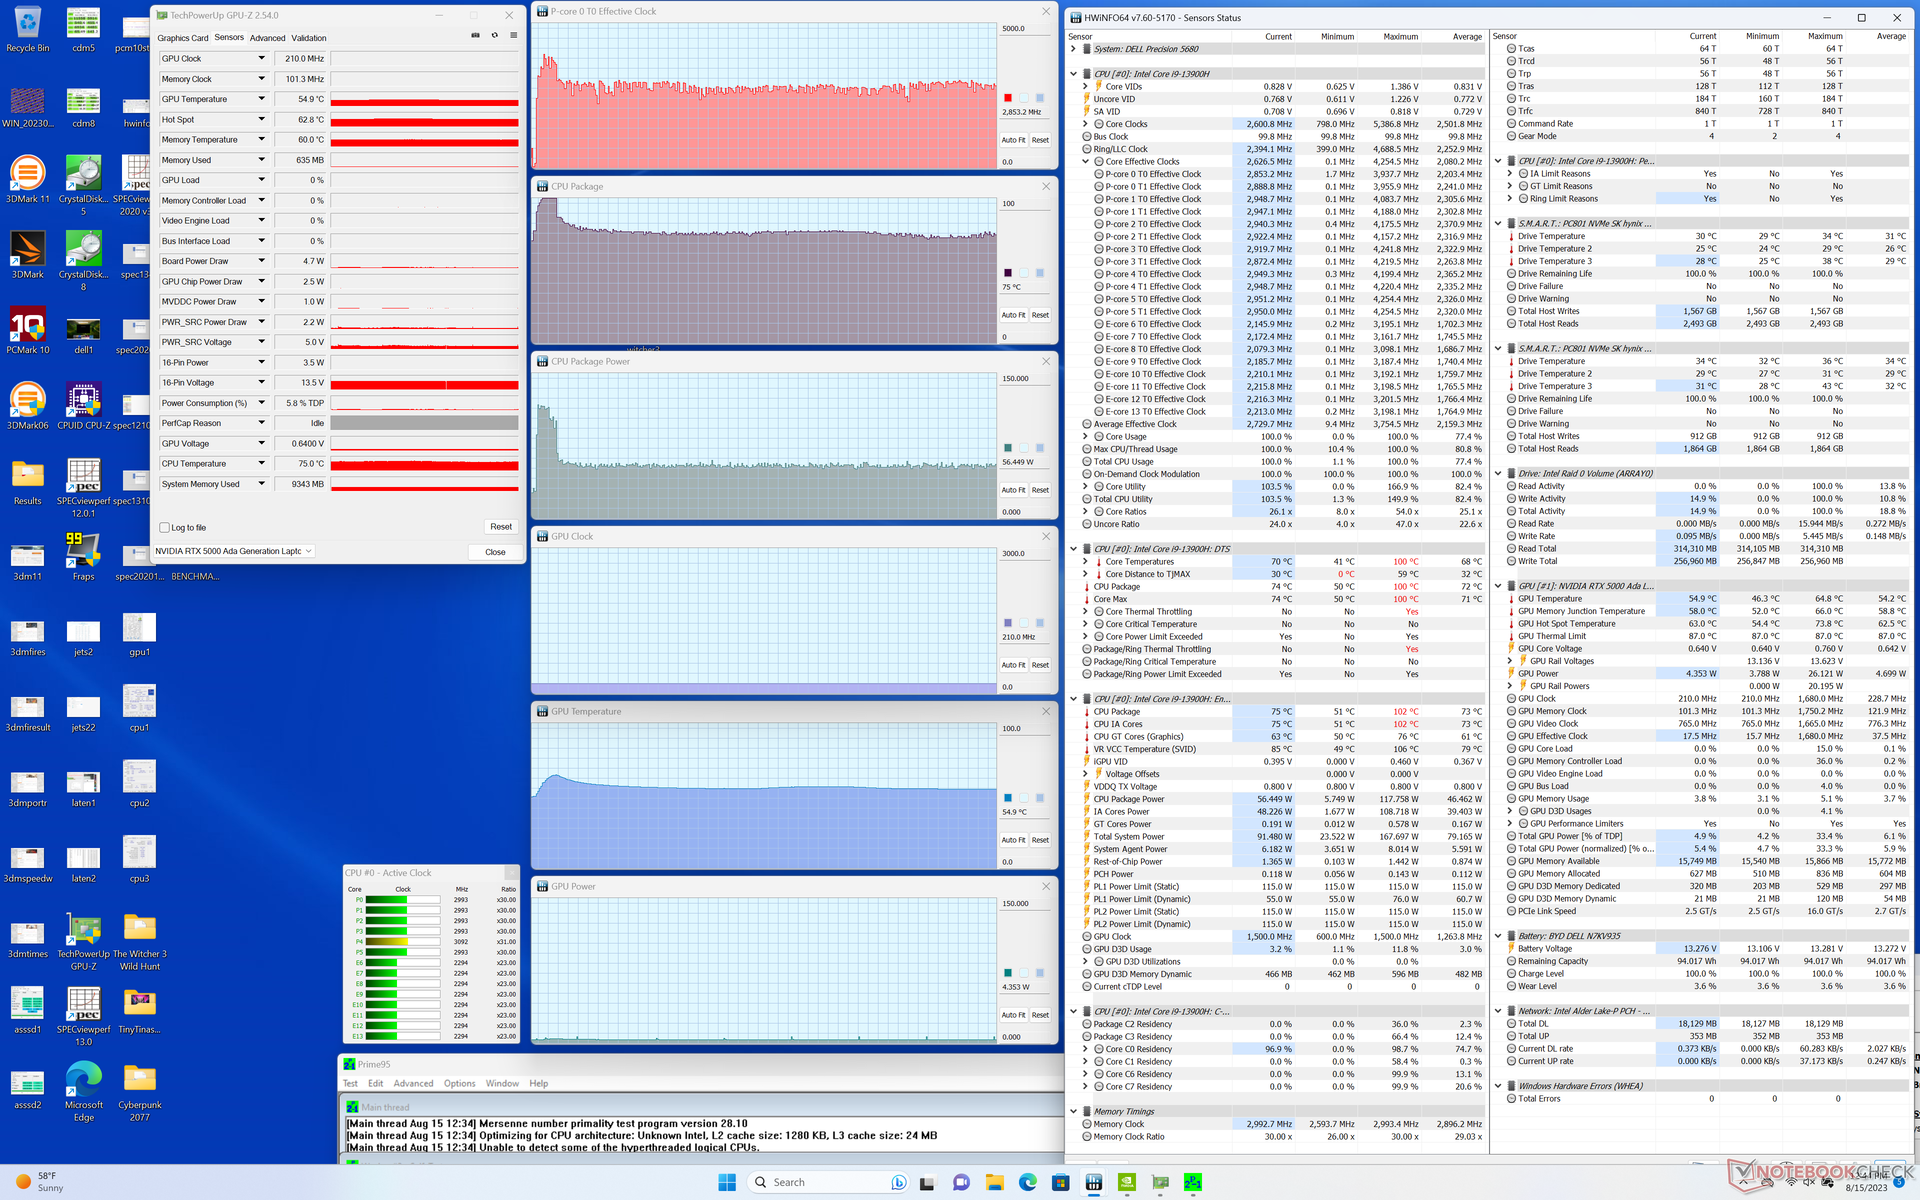
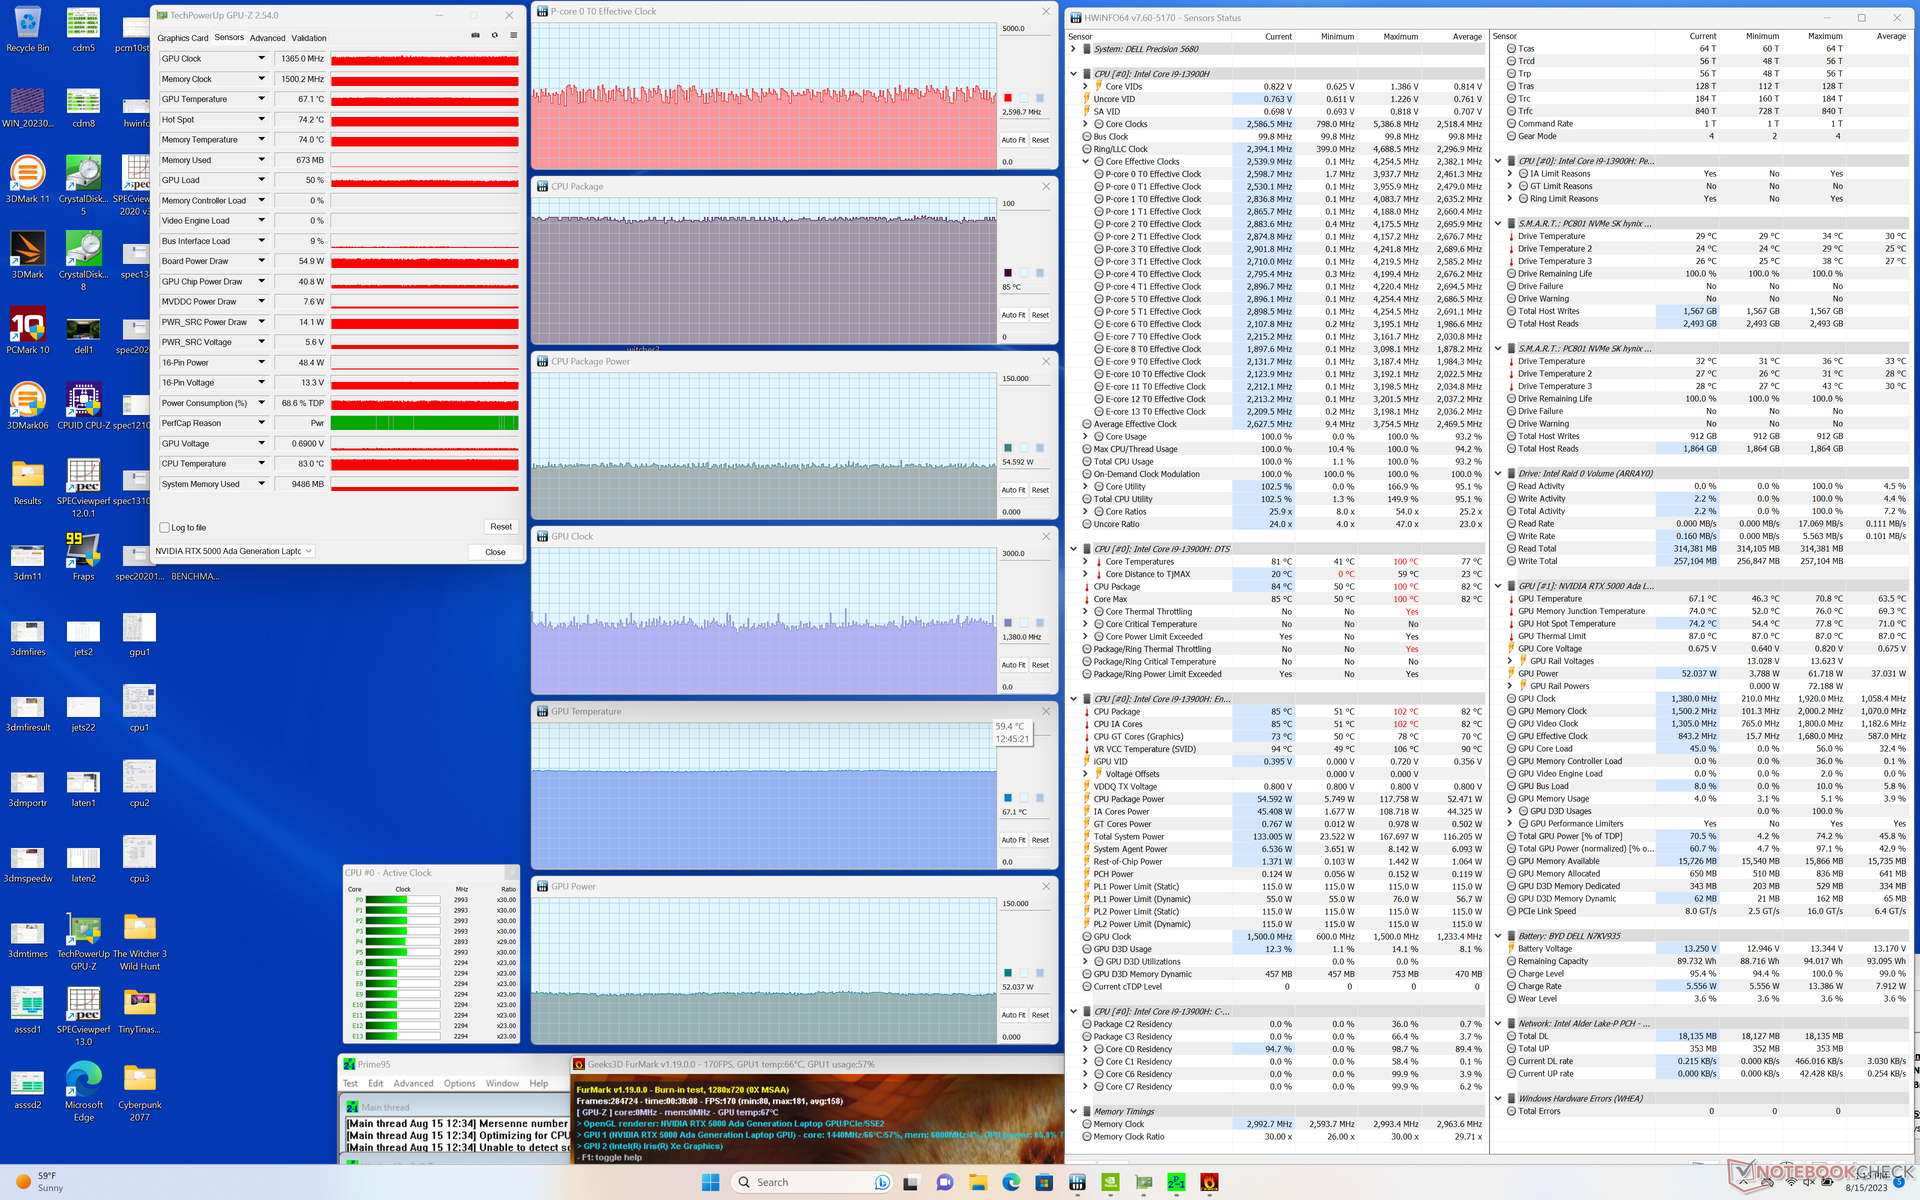
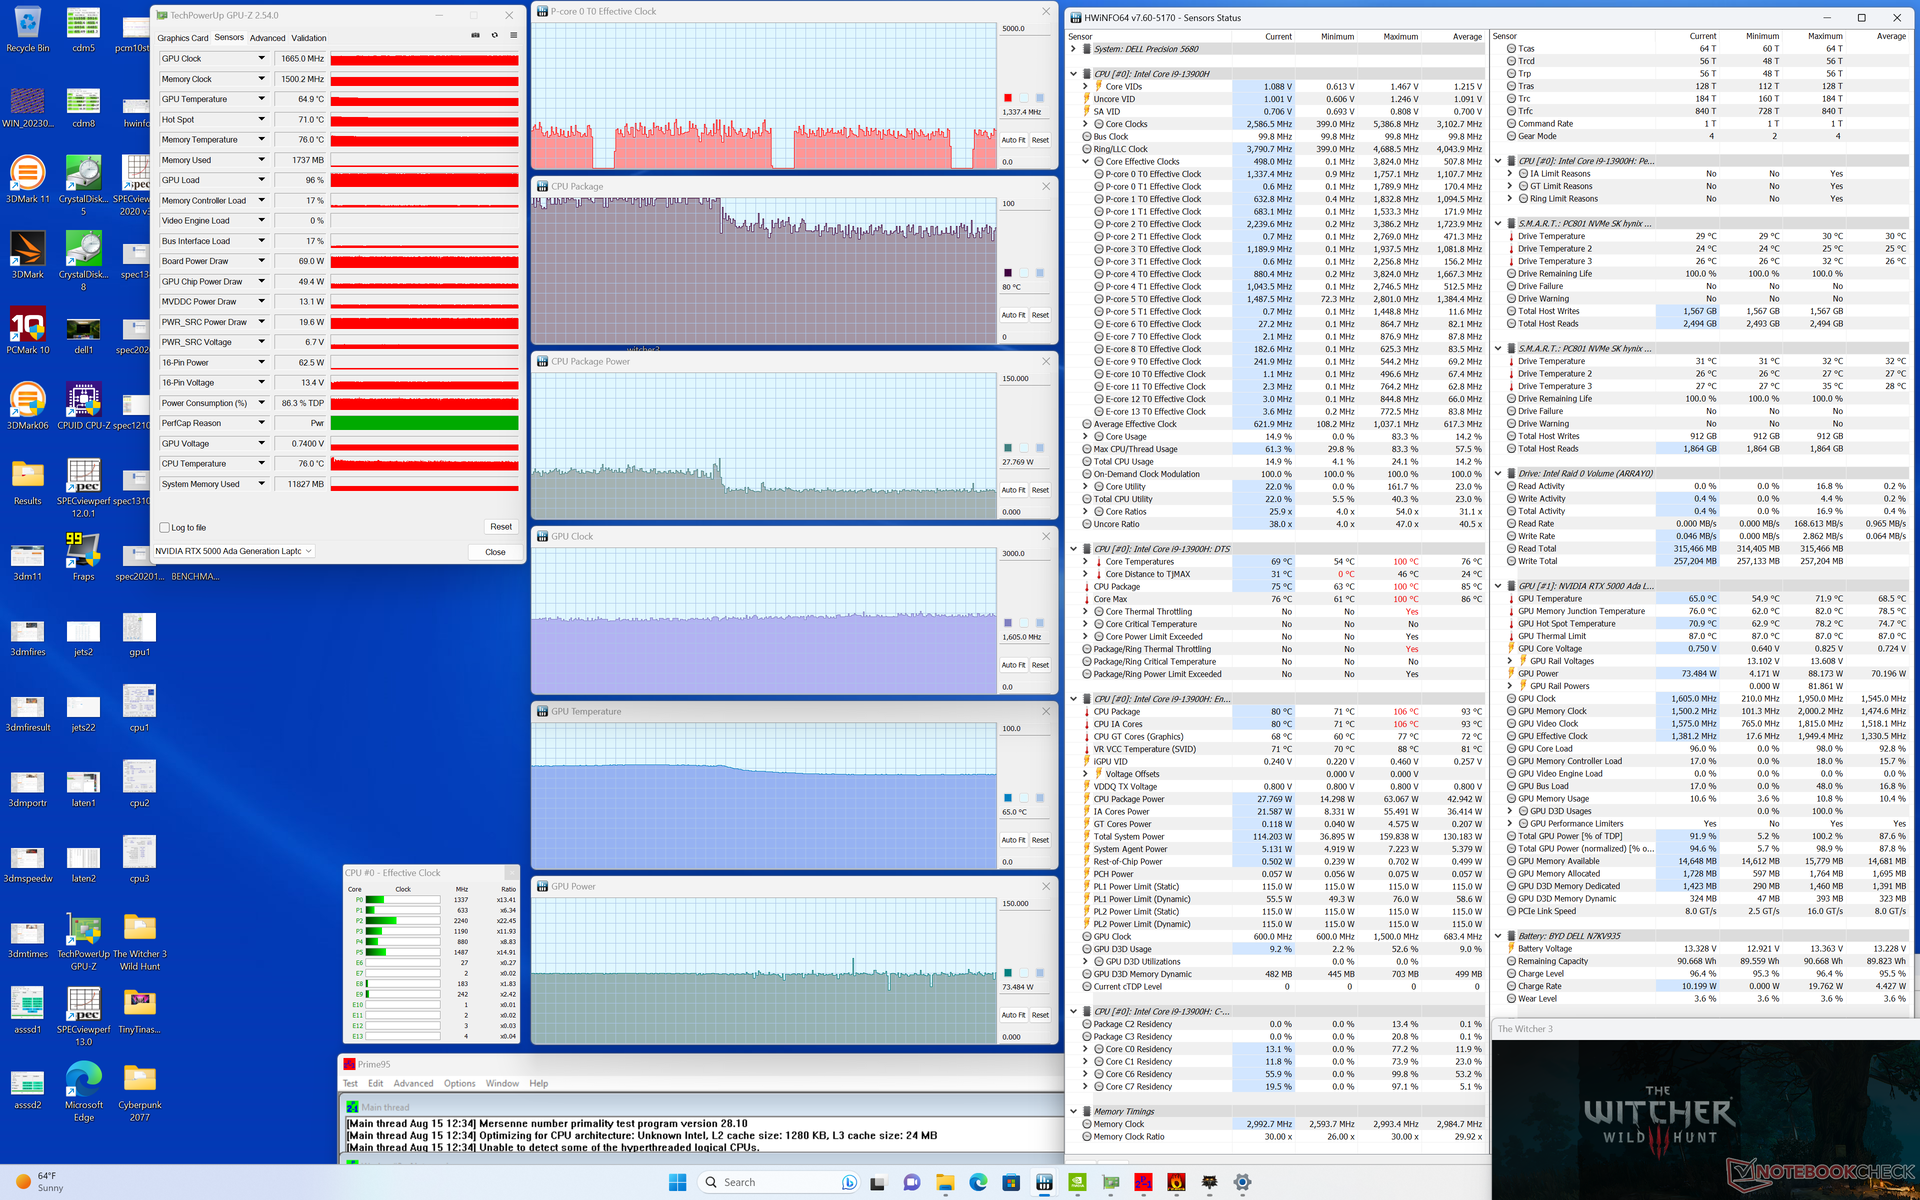
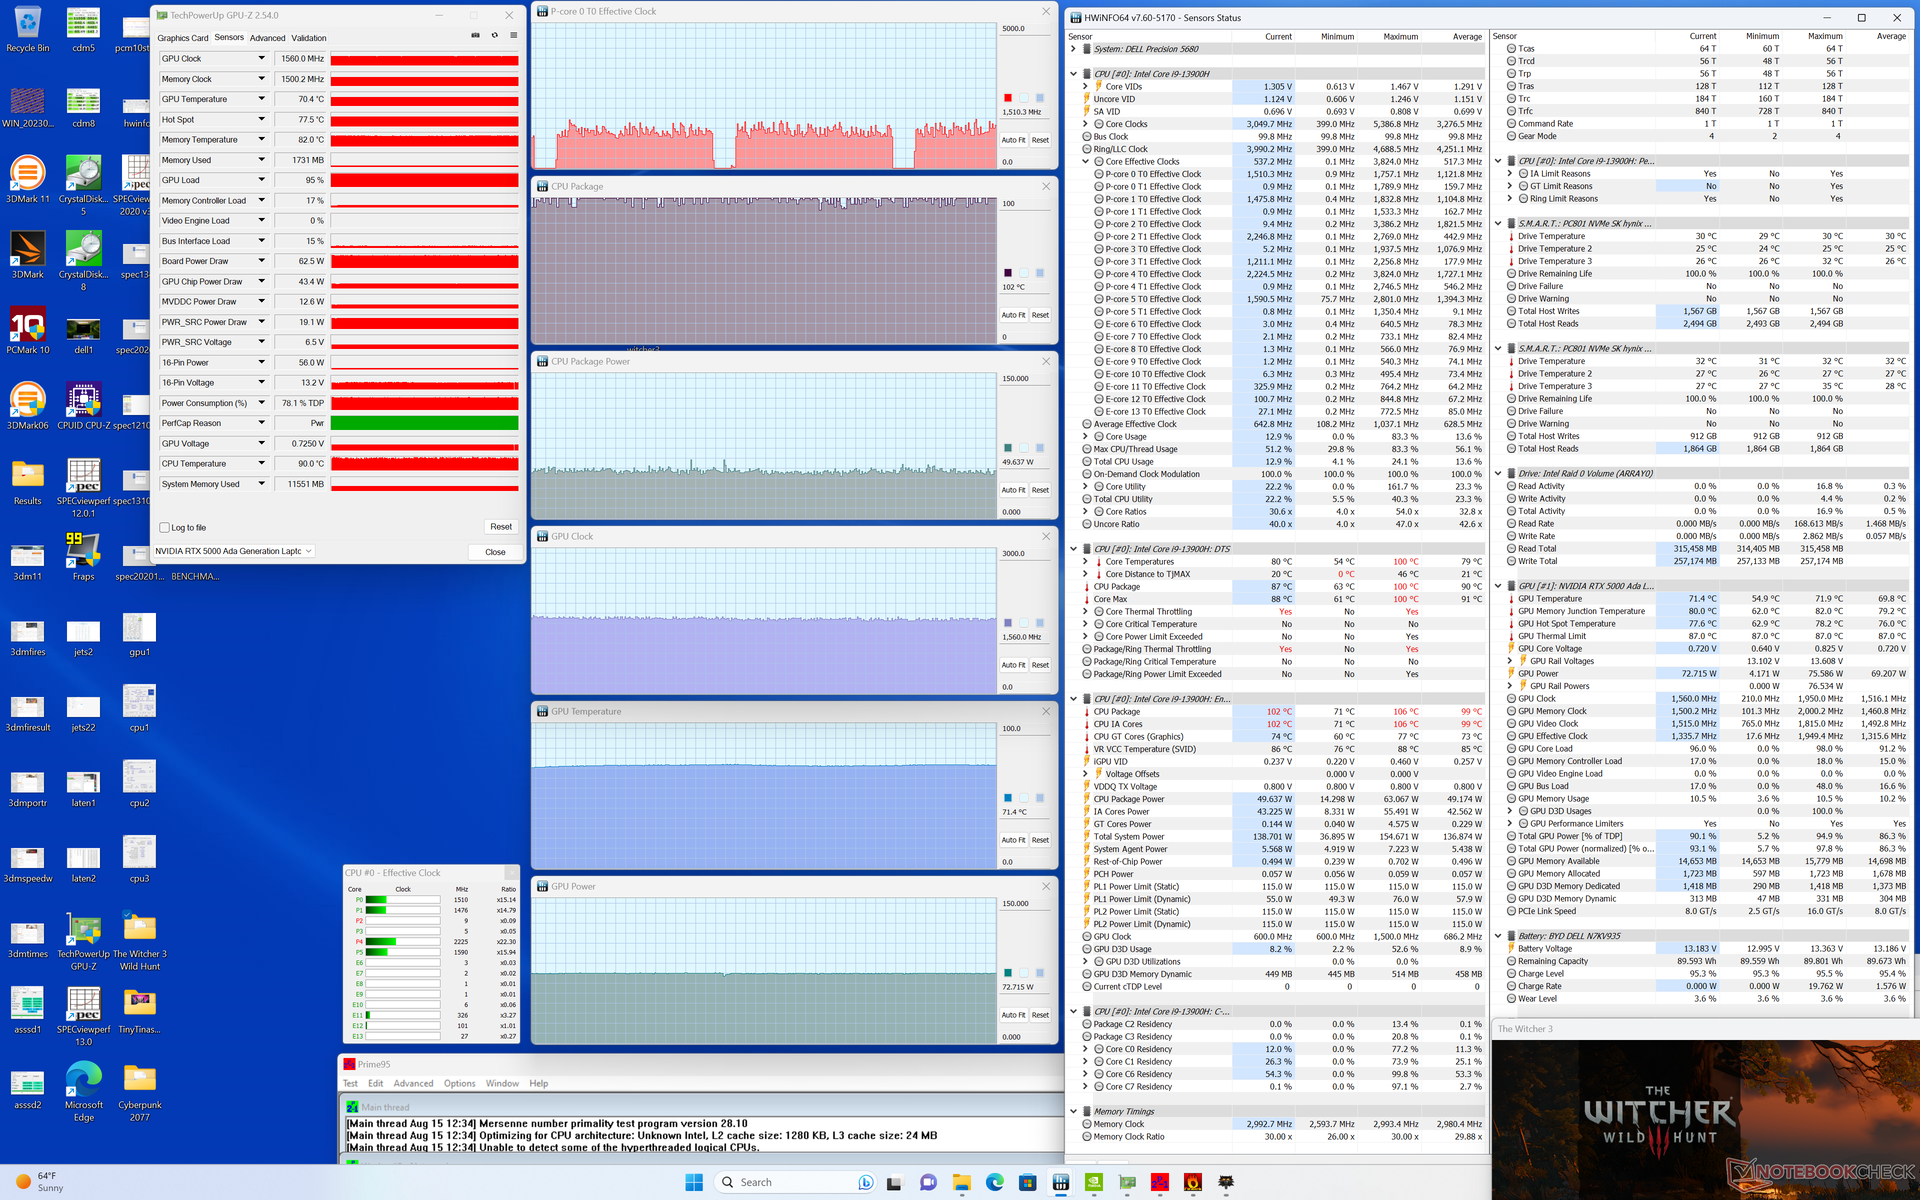
| Horloge du CPU (GHz) | Horloge du GPU (MHz) | Température moyenne du CPU (°C) | Température moyenne du GPU (°C) | |
| Système en veille | -- | -- | 60 | 46 |
| Prime95 Stress | ~2.8 | -- | 75 | 55 |
| Prime95 + FurMark Stress | ~2.6 | 1365 | 85 | 67 |
| Witcher 3 Stress(mode Performance) | ~1,5 | 1560 | 100 | 72 |
| Witcher 3 Stress (mode équilibré) | ~1,3 | 1665 | 80 | 65 |
Intervenants
Dell Precision 5000 5680 analyse audio
(±) | le niveau sonore du haut-parleur est moyen mais bon (78.3# dB)
Basses 100 - 315 Hz
(-) | presque aucune basse - en moyenne 16.4% plus bas que la médiane
(±) | la linéarité des basses est moyenne (7.5% delta à la fréquence précédente)
Médiums 400 - 2000 Hz
(+) | médiane équilibrée - seulement 3.9% de la médiane
(+) | les médiums sont linéaires (4.5% delta à la fréquence précédente)
Aiguës 2 - 16 kHz
(+) | des sommets équilibrés - à seulement 2.2% de la médiane
(±) | la linéarité des aigus est moyenne (8.3% delta à la fréquence précédente)
Globalement 100 - 16 000 Hz
(±) | la linéarité du son global est moyenne (15.5% de différence avec la médiane)
Par rapport à la même classe
» 35% de tous les appareils testés de cette catégorie étaient meilleurs, 10% similaires, 55% pires
» Le meilleur avait un delta de 7%, la moyenne était de 17%, le pire était de 35%.
Par rapport à tous les appareils testés
» 23% de tous les appareils testés étaient meilleurs, 4% similaires, 73% pires
» Le meilleur avait un delta de 4%, la moyenne était de 23%, le pire était de 134%.
Apple MacBook Pro 16 2021 M1 Pro analyse audio
(+) | les haut-parleurs peuvent jouer relativement fort (84.7# dB)
Basses 100 - 315 Hz
(+) | bonne basse - seulement 3.8% loin de la médiane
(+) | les basses sont linéaires (5.2% delta à la fréquence précédente)
Médiums 400 - 2000 Hz
(+) | médiane équilibrée - seulement 1.3% de la médiane
(+) | les médiums sont linéaires (2.1% delta à la fréquence précédente)
Aiguës 2 - 16 kHz
(+) | des sommets équilibrés - à seulement 1.9% de la médiane
(+) | les aigus sont linéaires (2.7% delta à la fréquence précédente)
Globalement 100 - 16 000 Hz
(+) | le son global est linéaire (4.6% différence à la médiane)
Par rapport à la même classe
» 0% de tous les appareils testés de cette catégorie étaient meilleurs, 0% similaires, 100% pires
» Le meilleur avait un delta de 5%, la moyenne était de 17%, le pire était de 45%.
Par rapport à tous les appareils testés
» 0% de tous les appareils testés étaient meilleurs, 0% similaires, 100% pires
» Le meilleur avait un delta de 4%, la moyenne était de 23%, le pire était de 134%.
Gestion de l'énergie - Ada Lovelace brille
Consommation électrique
Les performances par watt sont nettement supérieures à celles de la plupart des autres stations de travail, car notre site Precision utilise un GPU Ada Lovelace de dernière génération. L'exécution Witcher 3par exemple, ne consommerait que 134 W sur notre système, contre 159 W et 189 W sur le GPU Ada Lovelace Precision 7670 Performance et HP ZBook Fury 16 G9, respectivement, même si notre GPU RTX 5000 serait plus performant que leurs GPU RTX A5500, comme indiqué ci-dessus.
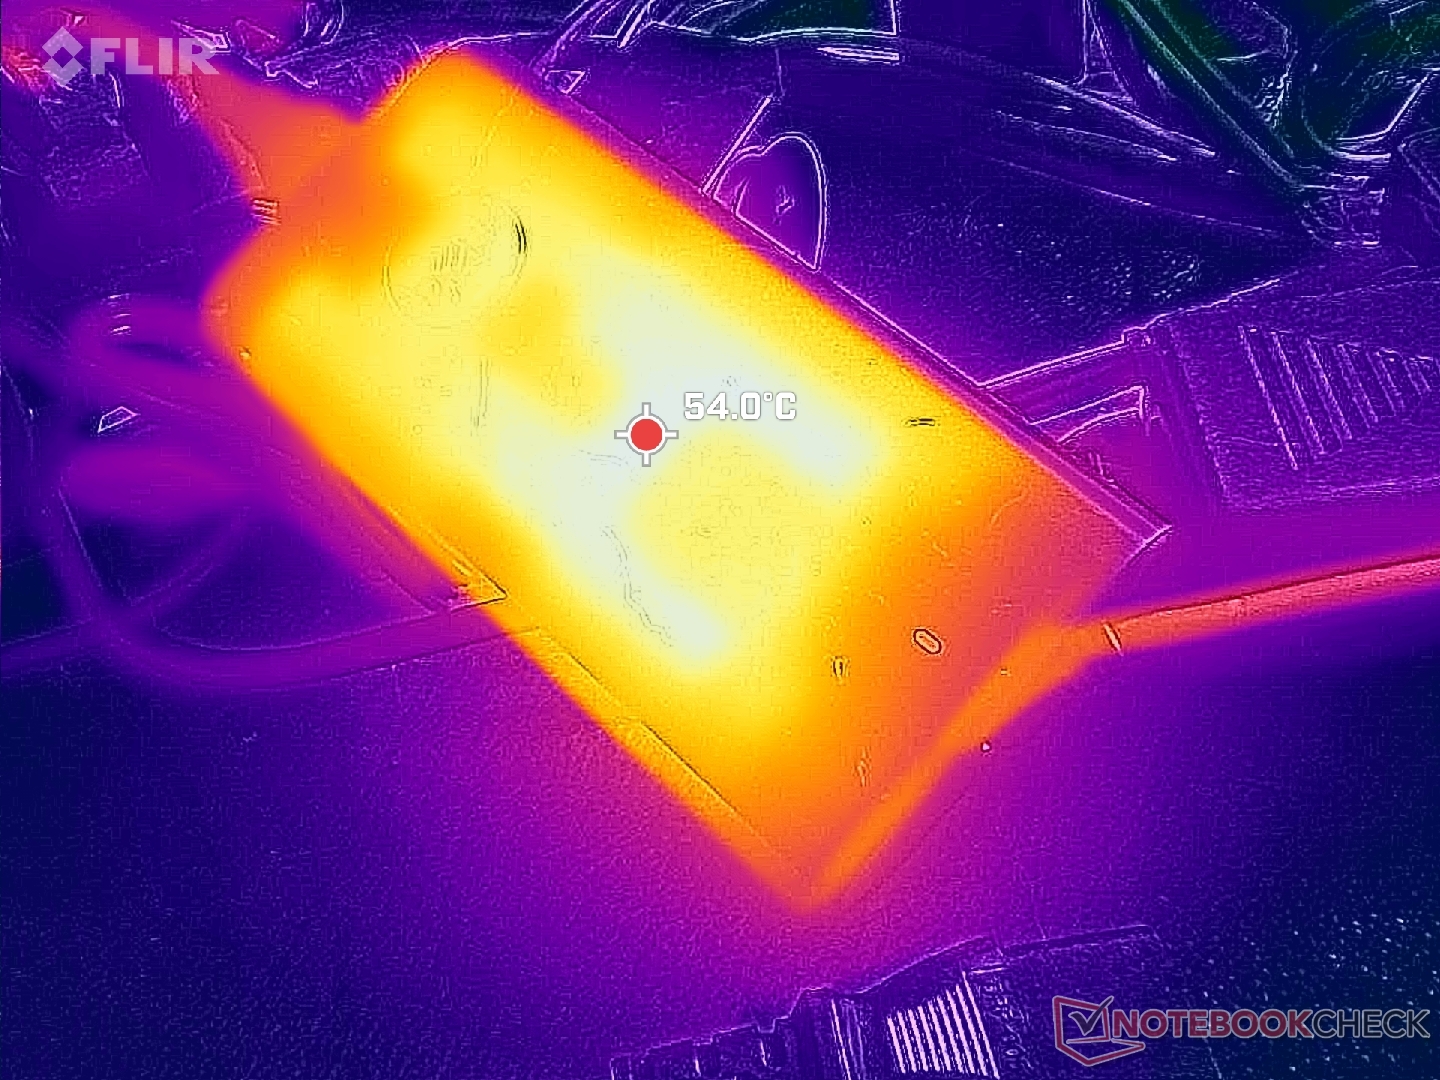
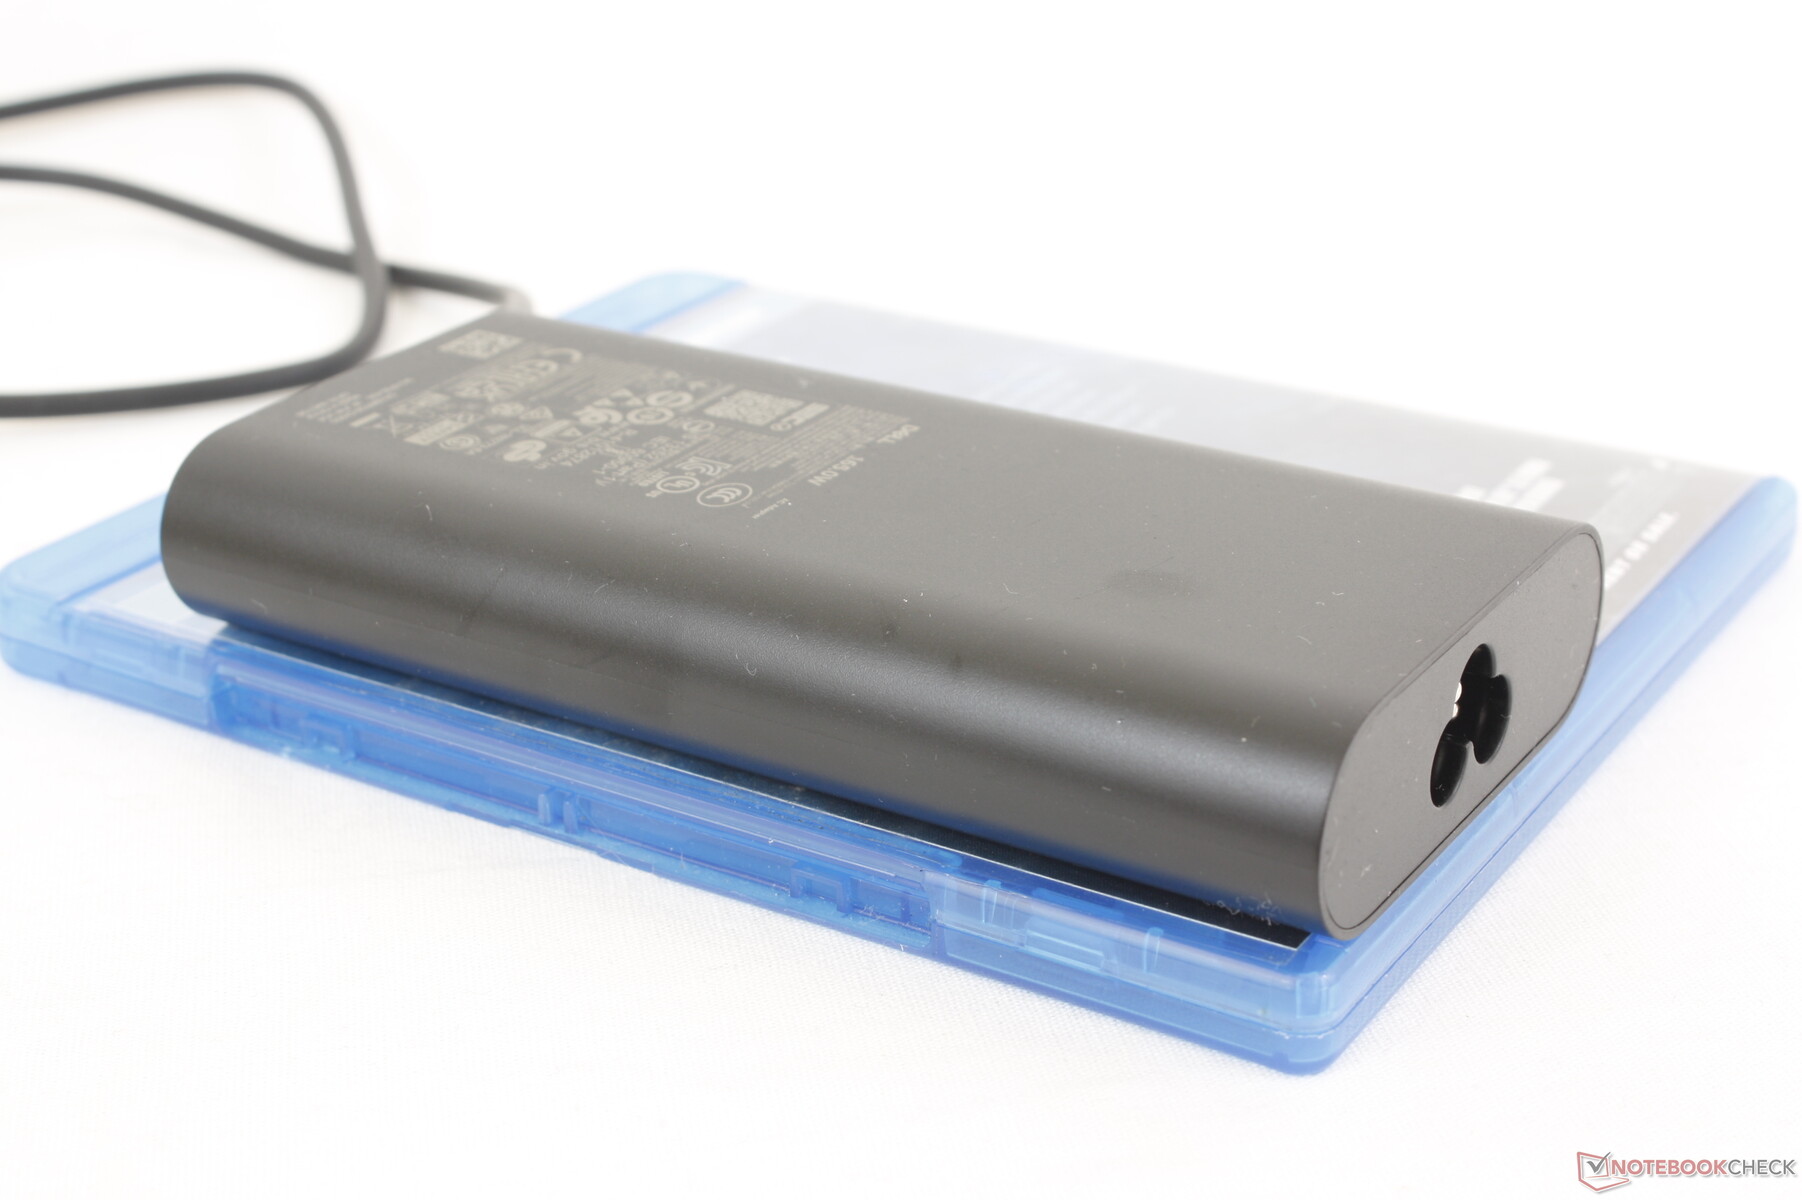
L'adaptateur secteur USB-C 165 W, relativement petit (~13,5 x 6,5 x 2,2 cm), mérite également une mention pour sa puissance élevée. La plupart des adaptateurs USB-C existants sont limités à seulement 100 W à 140 W au maximum, ce qui fait de notre adaptateur de 165 W l'un des plus polyvalents. Ce nouvel adaptateur résout directement les problèmes de charge de la batterie que nous avons rencontrés sur l'ancien modèle Precision 7000 qui était livré avec un adaptateur USB-C de 130 W moins performant.
| Éteint/en veille | |
| Au repos | |
| Fortement sollicité |
|
Légende:
min: | |
| Dell Precision 5000 5680 i9-13900H, RTX 5000 Ada Generation Laptop, 2x SK hynix PC801 HFS512GEJ9X101N RAID 0, OLED, 3840x2400, 16" | Dell Precision 7000 7670 Performance i9-12950HX, RTX A5500 Laptop GPU, , OLED, 3840x2400, 16" | HP ZBook Fury 16 G9 i9-12950HX, RTX A5500 Laptop GPU, Micron 3400 1TB MTFDKBA1T0TFH, IPS, 3840x2400, 16" | Lenovo ThinkPad P16 G1 RTX A5500 i9-12950HX, RTX A5500 Laptop GPU, WDC PC SN810 2TB, IPS, 3840x2400, 16" | MSI CreatorPro Z16P B12UKST i7-12700H, RTX A3000 Laptop GPU, Samsung PM9A1 MZVL21T0HCLR, IPS, 2560x1600, 16" | Asus ExpertBook B6 Flip B6602FC2 i9-12950HX, RTX A2000 Laptop GPU, Samsung PM9A1 MZVL21T0HCLR, IPS, 2560x1600, 16" | |
|---|---|---|---|---|---|---|
| Power Consumption | -99% | -86% | -53% | -18% | -35% | |
| Idle Minimum * (Watt) | 8 | 16.4 -105% | 19.5 -144% | 7.5 6% | 10.8 -35% | 10.5 -31% |
| Idle Average * (Watt) | 10.4 | 35.9 -245% | 29 -179% | 20.1 -93% | 16.3 -57% | 11.9 -14% |
| Idle Maximum * (Watt) | 30.5 | 47 -54% | 40.7 -33% | 40 -31% | 16.9 45% | 18 41% |
| Load Average * (Watt) | 75.4 | 147.1 -95% | 142.1 -88% | 137 -82% | 111.7 -48% | 182 -141% |
| Witcher 3 ultra * (Watt) | 134 | 158.8 -19% | 188.6 -41% | 208 -55% | 152.1 -14% | 177.5 -32% |
| Load Maximum * (Watt) | 175 | 311 -78% | 224.4 -28% | 285.9 -63% | 177.4 -1% | 229 -31% |
* ... Moindre est la valeur, meilleures sont les performances
Power Consumption Witcher 3 / Stresstest
Power Consumption external Monitor
Autonomie de la batterie
L'autonomie de la batterie est excellente compte tenu des performances élevées et de l'exigeant panneau OLED 4K. Nous avons pu enregistrer près de 10 heures de navigation WLAN en mode équilibré avec l'iGPU actif, contre près de la moitié avec des alternatives comme le Lenovo ThinkPad P16 G1 ou le MSI CreatorPro Z16PU.MSI CreatorPro Z16P.
La charge du vide à la pleine capacité prend environ 2 heures avec l'adaptateur secteur 165 W inclus. Notre adaptateur USB-C tiers de 65 W peut également recharger le système, mais à un rythme plus lent.
| Dell Precision 5000 5680 i9-13900H, RTX 5000 Ada Generation Laptop, 98 Wh | Dell Precision 7000 7670 Performance i9-12950HX, RTX A5500 Laptop GPU, 93 Wh | HP ZBook Fury 16 G9 i9-12950HX, RTX A5500 Laptop GPU, 95 Wh | Lenovo ThinkPad P16 G1 RTX A5500 i9-12950HX, RTX A5500 Laptop GPU, 94 Wh | MSI CreatorPro Z16P B12UKST i7-12700H, RTX A3000 Laptop GPU, 90 Wh | Asus ExpertBook B6 Flip B6602FC2 i9-12950HX, RTX A2000 Laptop GPU, 90 Wh | |
|---|---|---|---|---|---|---|
| Autonomie de la batterie | -53% | -46% | -41% | -41% | -14% | |
| Reader / Idle (h) | 17.9 | 5.3 -70% | 12.5 -30% | |||
| WiFi v1.3 (h) | 9.9 | 4.7 -53% | 6 -39% | 5.8 -41% | 5.8 -41% | 8.7 -12% |
| Load (h) | 1.7 | 1.2 -29% | 1.7 0% | |||
| H.264 (h) | 5.8 |
Points positifs
Points négatifs
Verdict - Plus puissant qu'il n'y paraît
Le Precision 5680 est sans conteste l'une des stations de travail mobiles les plus légères et les plus rapides de toute la gamme Dell. Le design portable, l'adaptateur USB-C de 165 W, l'excellent écran OLED 4K et le puissant GPU RTX 5000 se distinguent tous comme les caractéristiques les plus fortes du modèle. Ce dernier en particulier est responsable d'une grande partie des boosts de performance et des avantages en termes d'autonomie de la batterie par rapport à la plupart des autres stations de travail, en raison de son architecture Ada Lovelace et de ses performances par watt très élevées.
Le Precision 5680 offre des performances par watt parmi les plus élevées dans la catégorie croissante des stations de travail fines et légères.
Les utilisateurs invétérés de stations de travail préféreront peut-être encore des modèles plus grands et plus épais tels que le HP ZBook Fury 16 ou le Precision 7670 car le modèle mince Precision 5680 renonce à certaines fonctionnalités clés telles que la RAM extensible, le WAN, la RAM ECC et des options de port plus larges. Son terrible clickpad est loin d'être aussi précis que les pavés tactiles des HP ou des Lenovo ThinkPad P16 qui disposent de véritables boutons de souris pour un meilleur contrôle.
Prix et disponibilité
Dell livre maintenant le Precision 5680 à partir de 2490 USD et jusqu'à plus de 6500 USD, comme indiqué dans l'article.
Dell Precision 5000 5680
- 08/18/2023 v7 (old)
Allen Ngo
Transparency
La sélection des appareils à examiner est effectuée par notre équipe éditoriale. L'échantillon de test a été prêté à l'auteur par le fabricant ou le détaillant pour les besoins de cet examen. Le prêteur n'a pas eu d'influence sur cette évaluation et le fabricant n'a pas reçu de copie de cette évaluation avant sa publication. Il n'y avait aucune obligation de publier cet article. En tant que média indépendant, Notebookcheck n'est pas soumis à l'autorité des fabricants, des détaillants ou des éditeurs.
Voici comment Notebookcheck teste
Chaque année, Notebookcheck examine de manière indépendante des centaines d'ordinateurs portables et de smartphones en utilisant des procédures standardisées afin de garantir que tous les résultats sont comparables. Nous avons continuellement développé nos méthodes de test depuis environ 20 ans et avons établi des normes industrielles dans le processus. Dans nos laboratoires de test, des équipements de mesure de haute qualité sont utilisés par des techniciens et des rédacteurs expérimentés. Ces tests impliquent un processus de validation en plusieurs étapes. Notre système d'évaluation complexe repose sur des centaines de mesures et de points de référence bien fondés, ce qui garantit l'objectivité.Price comparison

