Test du Dell Precision 5480 : la station de travail inaugure la Nvidia RTX 3000 Ada

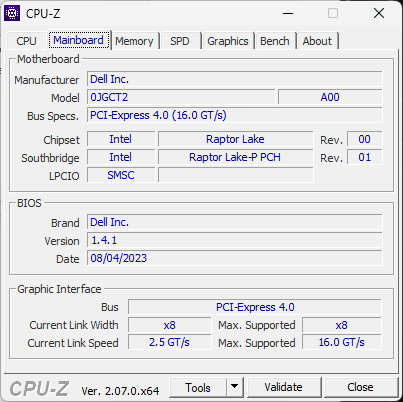
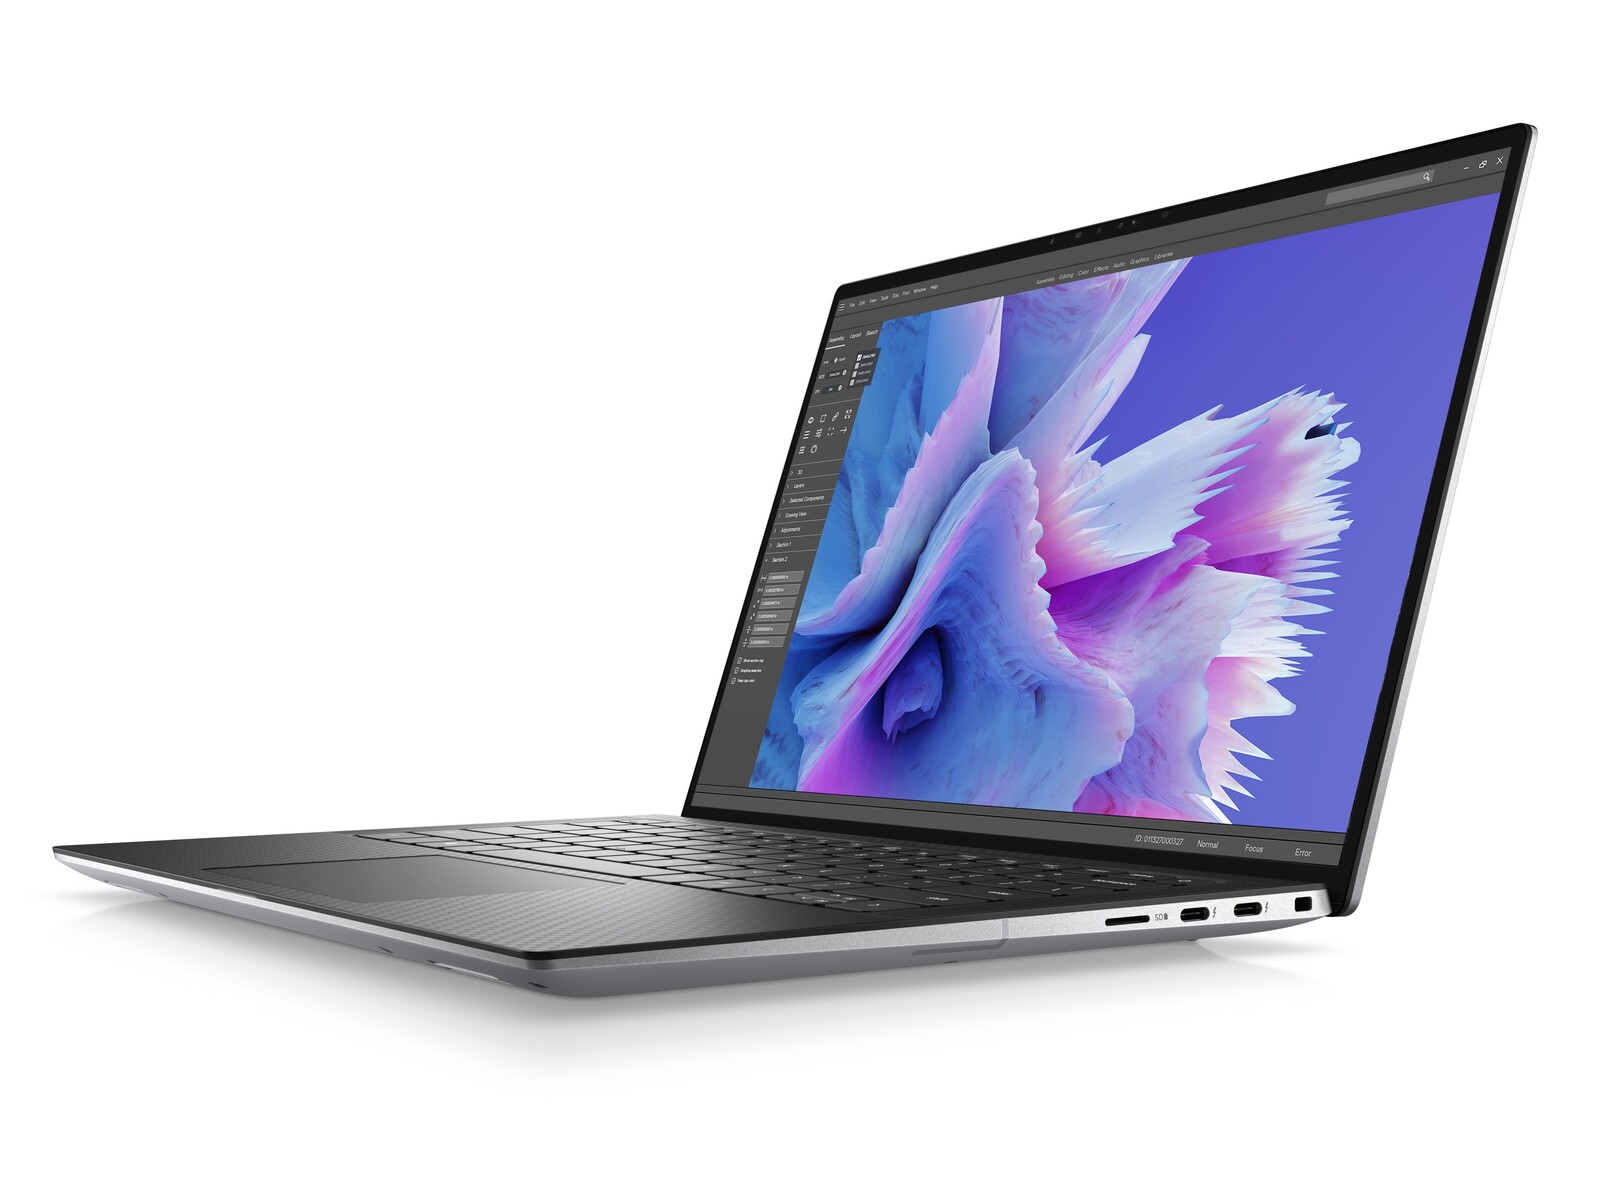
Le Precision 5480 succède directement au Precision 5470 de l'année dernière en mettant à jour le CPU Alder Lake-H de 12e génération et le GPU Nvidia Ampere avec les options Raptor Lake-H et Ada Lovelace de 13e génération, respectivement. Il s'agit également de l'une des premières stations de travail mobiles à intégrer la RTX 3000 Ada. Le châssis ou squelette reste le même que sur le Precision 5470 et nous vous recommandons de consulter notre avis sur le modèle de l'année dernière pour en savoir plus sur les caractéristiques physiques du Precision 5480.
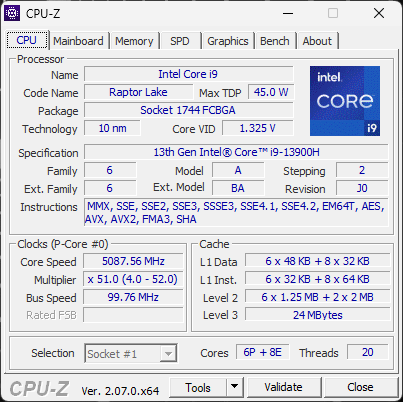
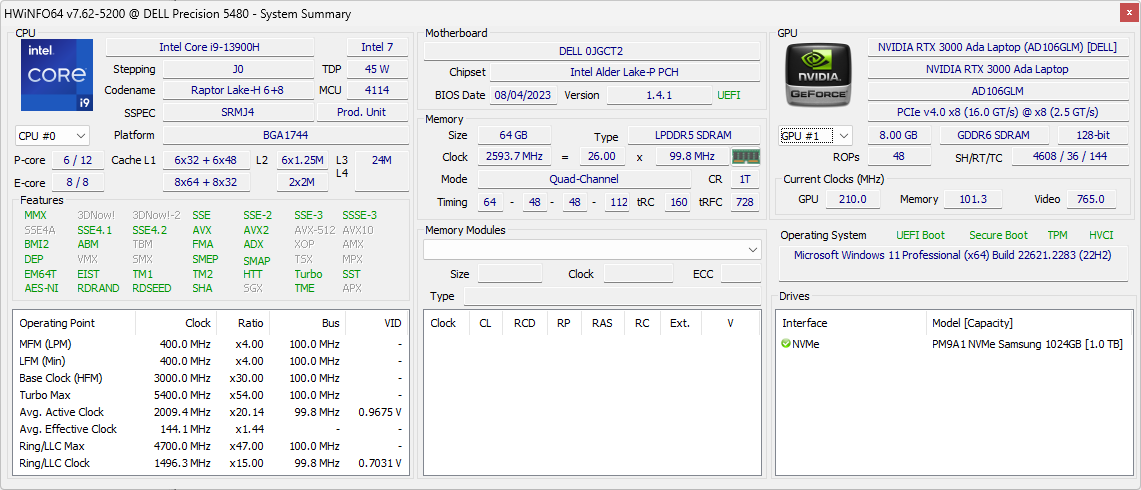
Notre unité de test spécifique est une configuration haut de gamme avec le CPU Core i9-13900H, le GPU RTX 3000 Ada, et l'écran tactile QHD+ pour environ 4400 USD. Des SKUs moins chers avec le Core i5-13500H, la carte graphique Iris Xe intégrée et un écran FHD+ non tactile sont également disponibles à partir de $2300.
L'espace de travail des subnotebooks de 14 pouces est relativement restreint, mais il existe encore quelques alternatives, notamment leLenovo ThinkPad P14s et les HP ZBook Firefly 14 series.
Plus d'avis sur Dell :
Comparaison avec les concurrents potentiels
Note | Date | Modèle | Poids | Épaisseur | Taille | Résolution | Prix |
|---|---|---|---|---|---|---|---|
| 89.6 % v7 (old) | 09/23 | Dell Precision 5480 i9-13900H, RTX 3000 Ada Generation Laptop | 1.6 kg | 18.95 mm | 14.00" | 2560x1600 | |
| 87.6 % v7 (old) | 09/22 | Dell Precision 5000 5470 i9-12900H, RTX A1000 Laptop GPU | 1.6 kg | 18.95 mm | 14.00" | 2560x1600 | |
| 88.3 % v7 (old) | 10/21 | Dell Precision 5000 5560 i7-11850H, RTX A2000 Laptop GPU | 2 kg | 18 mm | 15.60" | 3840x2400 | |
| 86.9 % v7 (old) | 04/23 | Lenovo ThinkPad P14s G3 AMD 21J6S05000 R7 PRO 6850U, Radeon 680M | 1.5 kg | 17.9 mm | 14.00" | 1920x1200 | |
| 87.4 % v7 (old) | HP ZBook Firefly 14 G9-6B8A2EA i7-1265U, T550 Laptop GPU | 1.5 kg | 19.9 mm | 14.00" | 1920x1200 | ||
| 87.8 % v7 (old) | 04/23 | Lenovo ThinkPad P15v G3 21EM001AGE R7 PRO 6850H, RTX A2000 Laptop GPU | 2.2 kg | 22.7 mm | 15.60" | 3840x2160 |
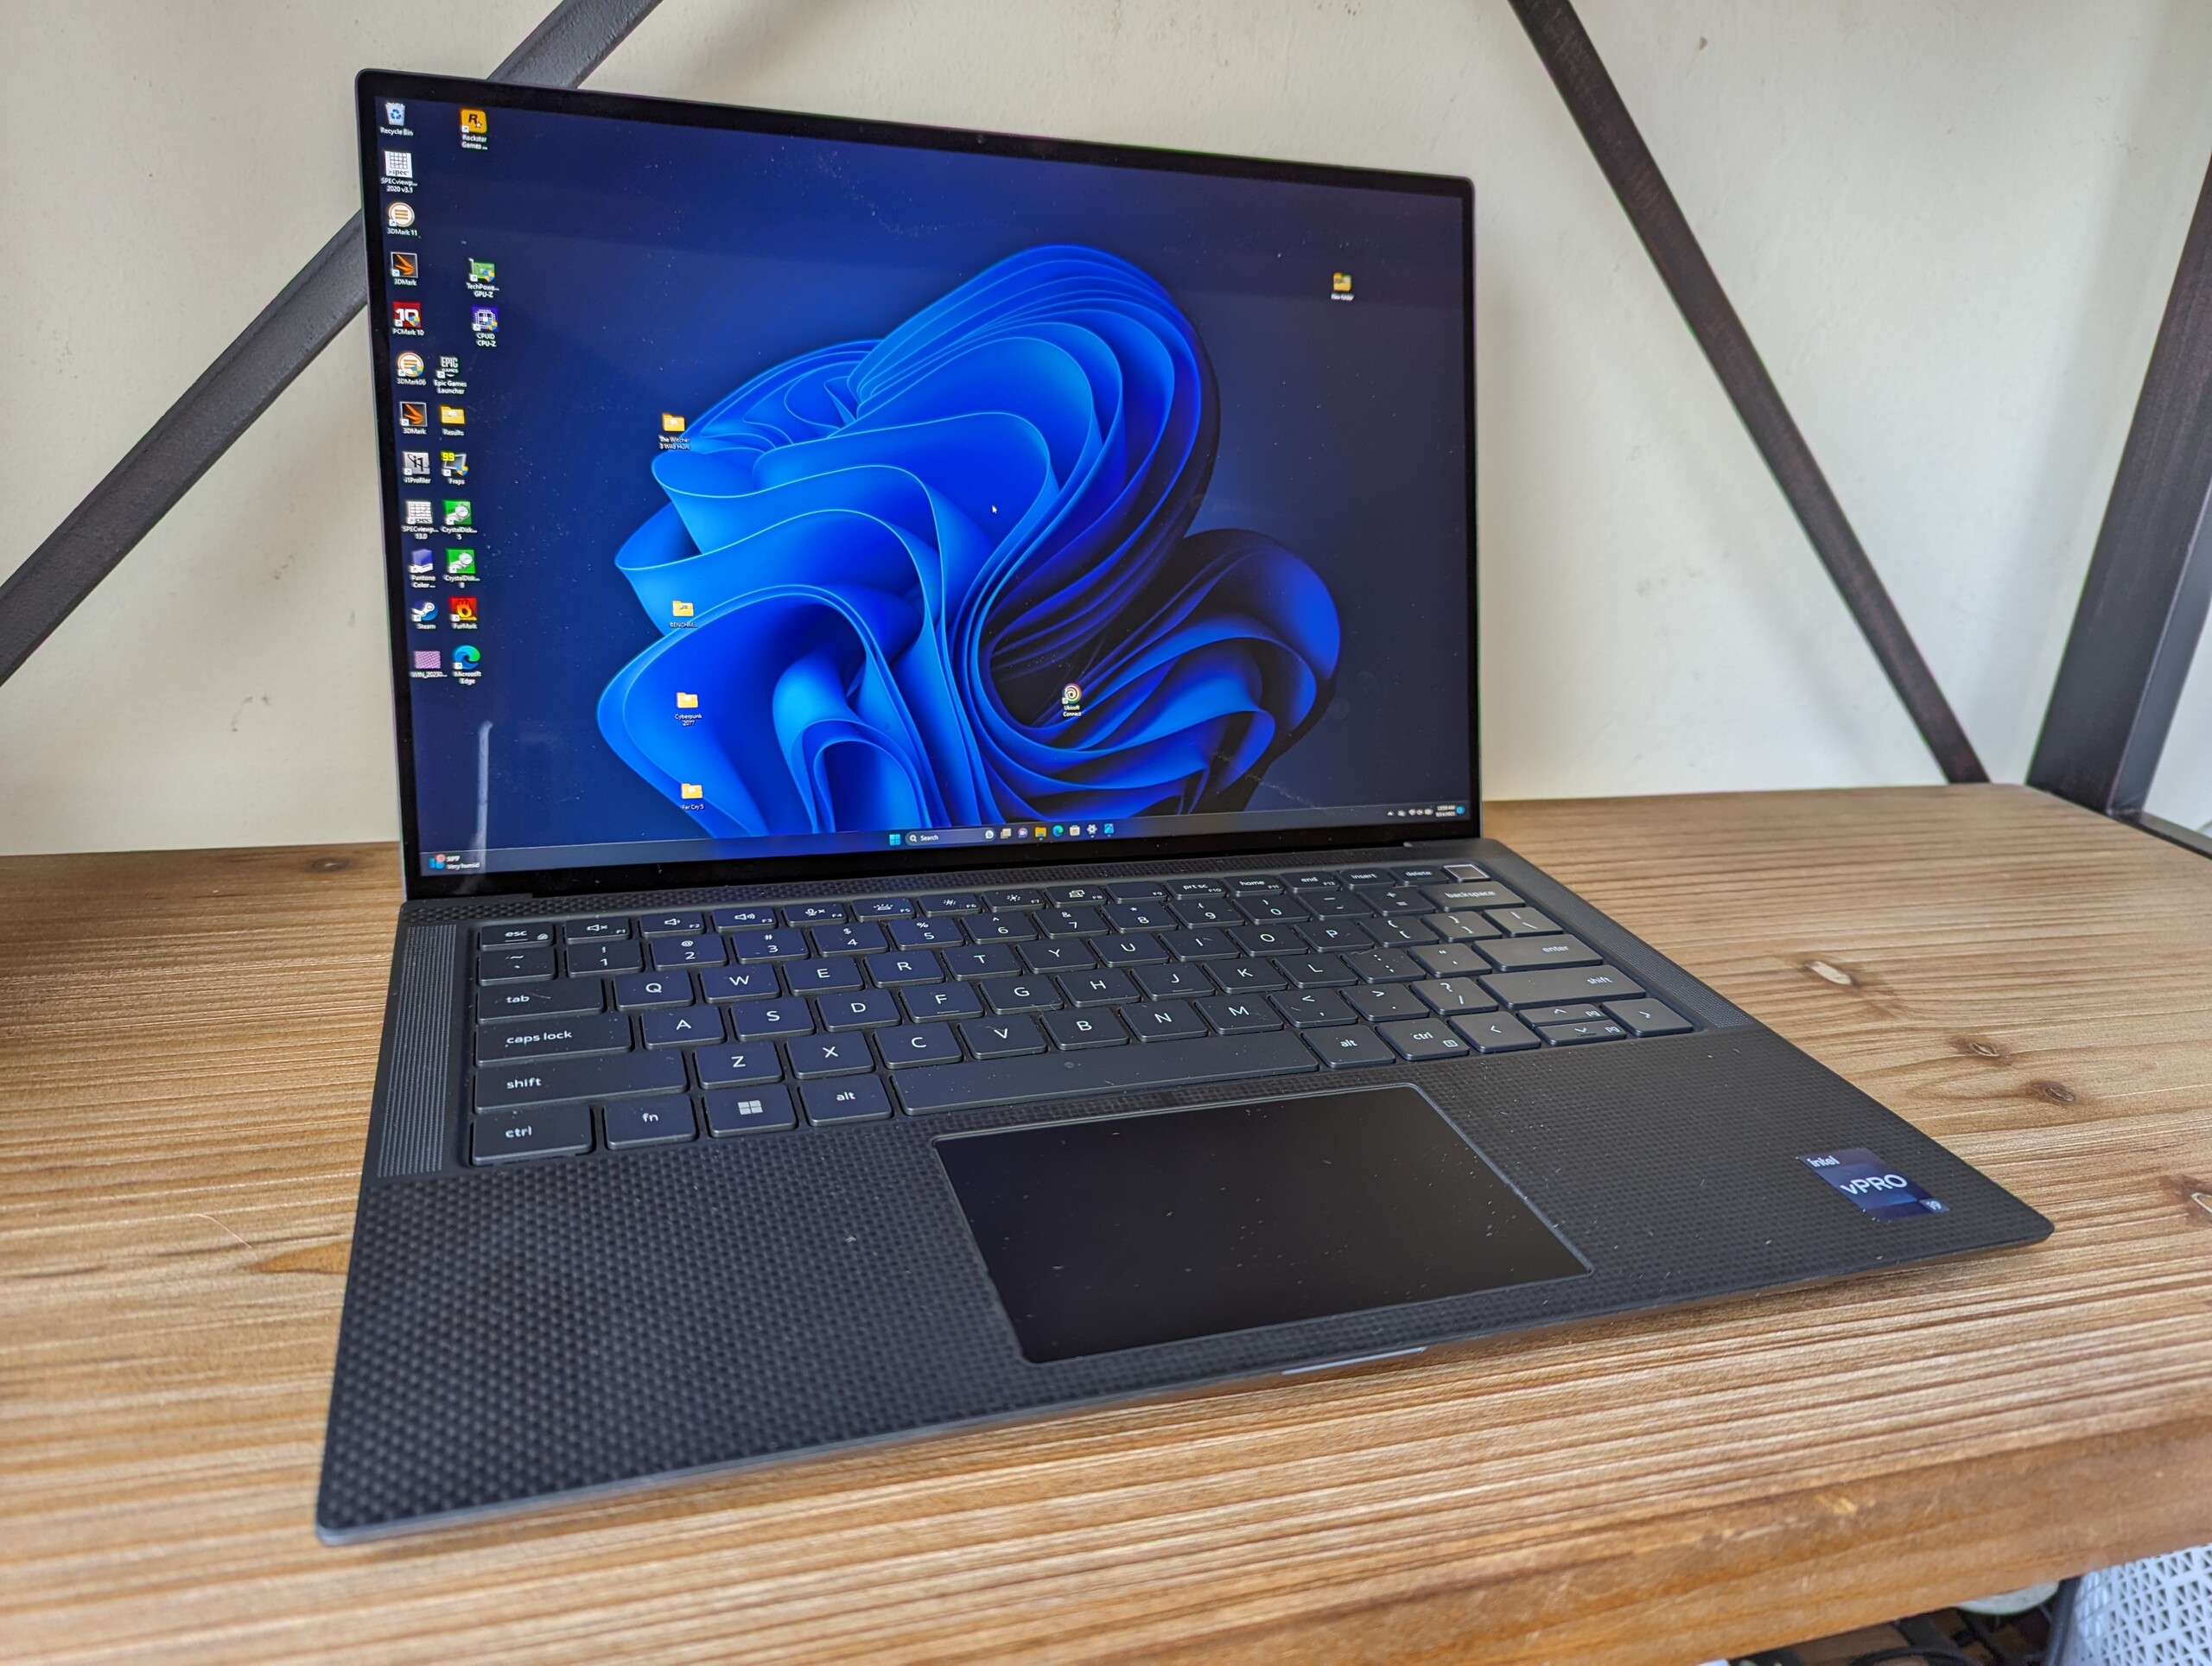
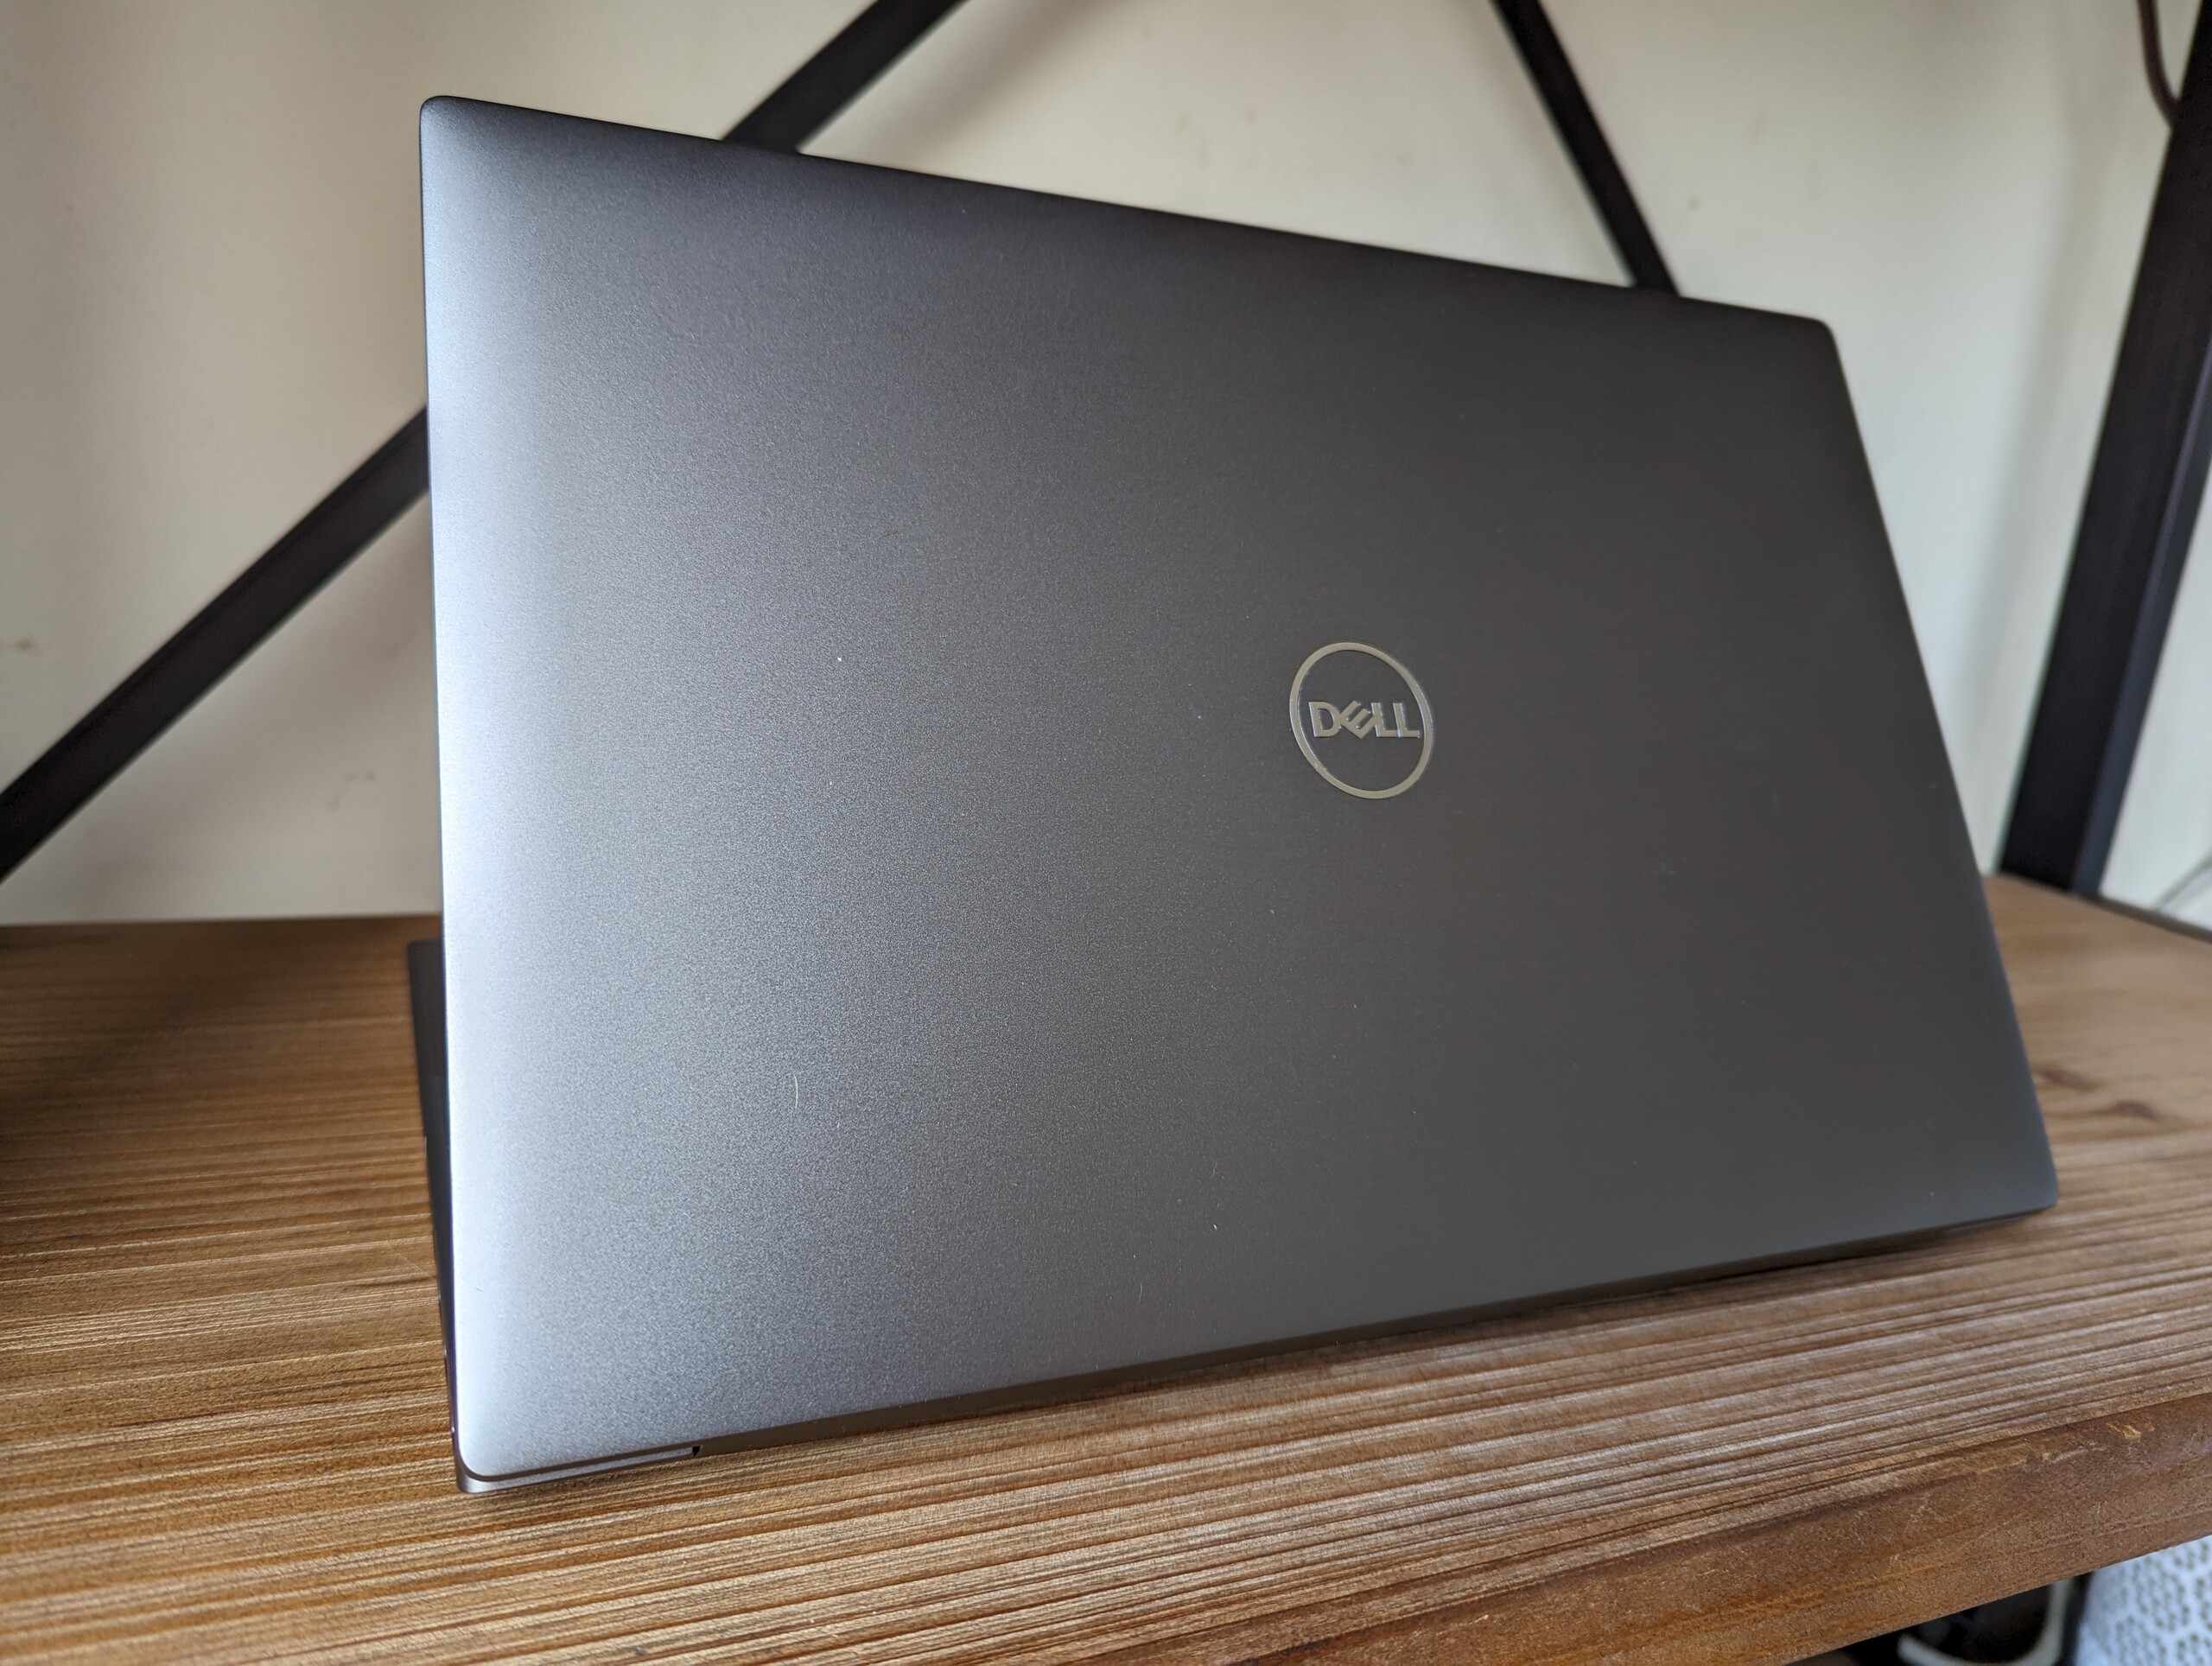
Boîtier - Inspiré par le XPS
Lecteur de carte SD
| SD Card Reader | |
| average JPG Copy Test (av. of 3 runs) | |
| Dell Precision 5000 5560 (AV Pro V60) | |
| Lenovo ThinkPad P15v G3 21EM001AGE (AV Pro V60) | |
| Dell Precision 5000 5470 (AV Pro V60) | |
| Dell Precision 5480 (AV Pro V60) | |
| maximum AS SSD Seq Read Test (1GB) | |
| Dell Precision 5000 5470 (AV Pro V60) | |
| Lenovo ThinkPad P15v G3 21EM001AGE (AV Pro V60) | |
| Dell Precision 5000 5560 (AV Pro V60) | |
| Dell Precision 5480 (AV Pro V60) | |
Communication
| Networking | |
| iperf3 transmit AX12 | |
| Dell Precision 5000 5560 | |
| iperf3 receive AX12 | |
| Dell Precision 5000 5560 | |
| iperf3 transmit AXE11000 | |
| Dell Precision 5480 | |
| Lenovo ThinkPad P14s G3 AMD 21J6S05000 | |
| Lenovo ThinkPad P15v G3 21EM001AGE | |
| iperf3 receive AXE11000 | |
| Lenovo ThinkPad P14s G3 AMD 21J6S05000 | |
| Lenovo ThinkPad P15v G3 21EM001AGE | |
| Dell Precision 5480 | |
| iperf3 transmit AXE11000 6GHz | |
| Dell Precision 5480 | |
| Lenovo ThinkPad P14s G3 AMD 21J6S05000 | |
| Dell Precision 5000 5470 | |
| Lenovo ThinkPad P15v G3 21EM001AGE | |
| iperf3 receive AXE11000 6GHz | |
| Lenovo ThinkPad P14s G3 AMD 21J6S05000 | |
| Lenovo ThinkPad P15v G3 21EM001AGE | |
| Dell Precision 5480 | |
| Dell Precision 5000 5470 | |
Webcam
Dell fournit encore des webcams 720p sur plusieurs de ses produits phares, notamment la série XPS et les ordinateurs portables Precision basés sur le design XPS. D'autres fabricants sont déjà passés à des capteurs de 2 ou 5 mégapixels et nous pensons que Dell fera de même lors de ses prochaines refontes.


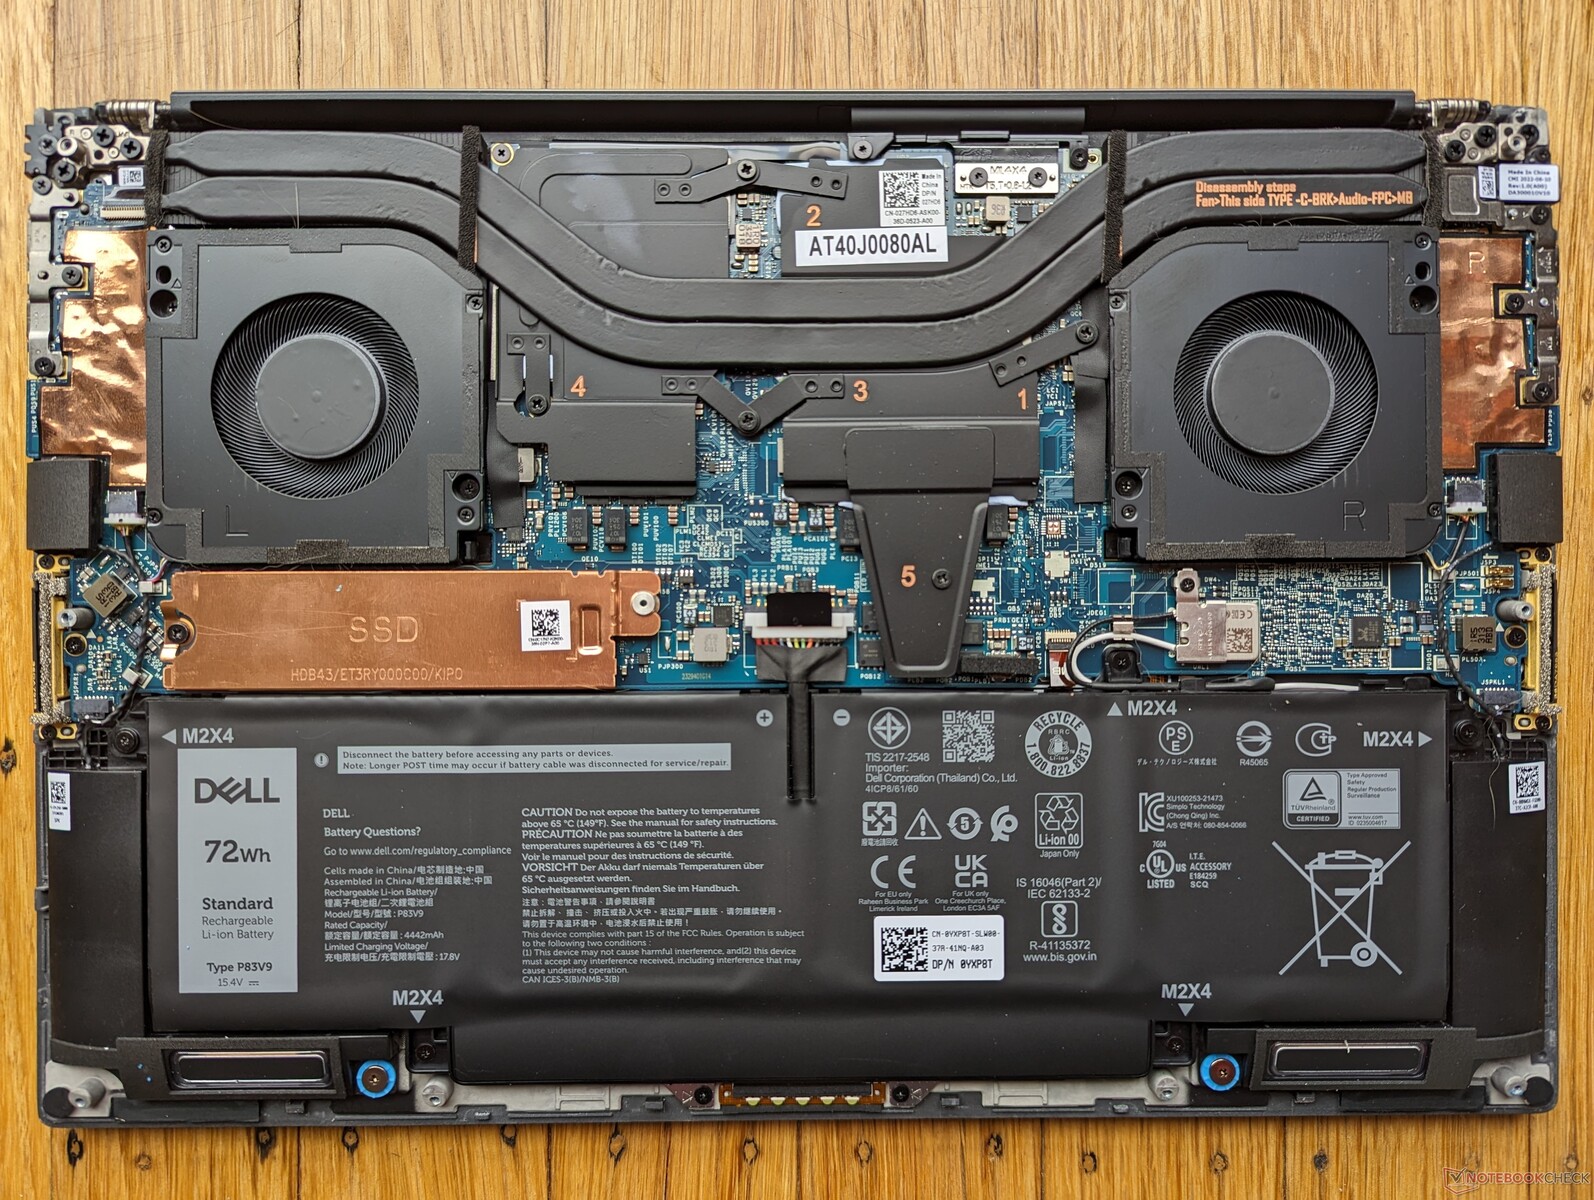
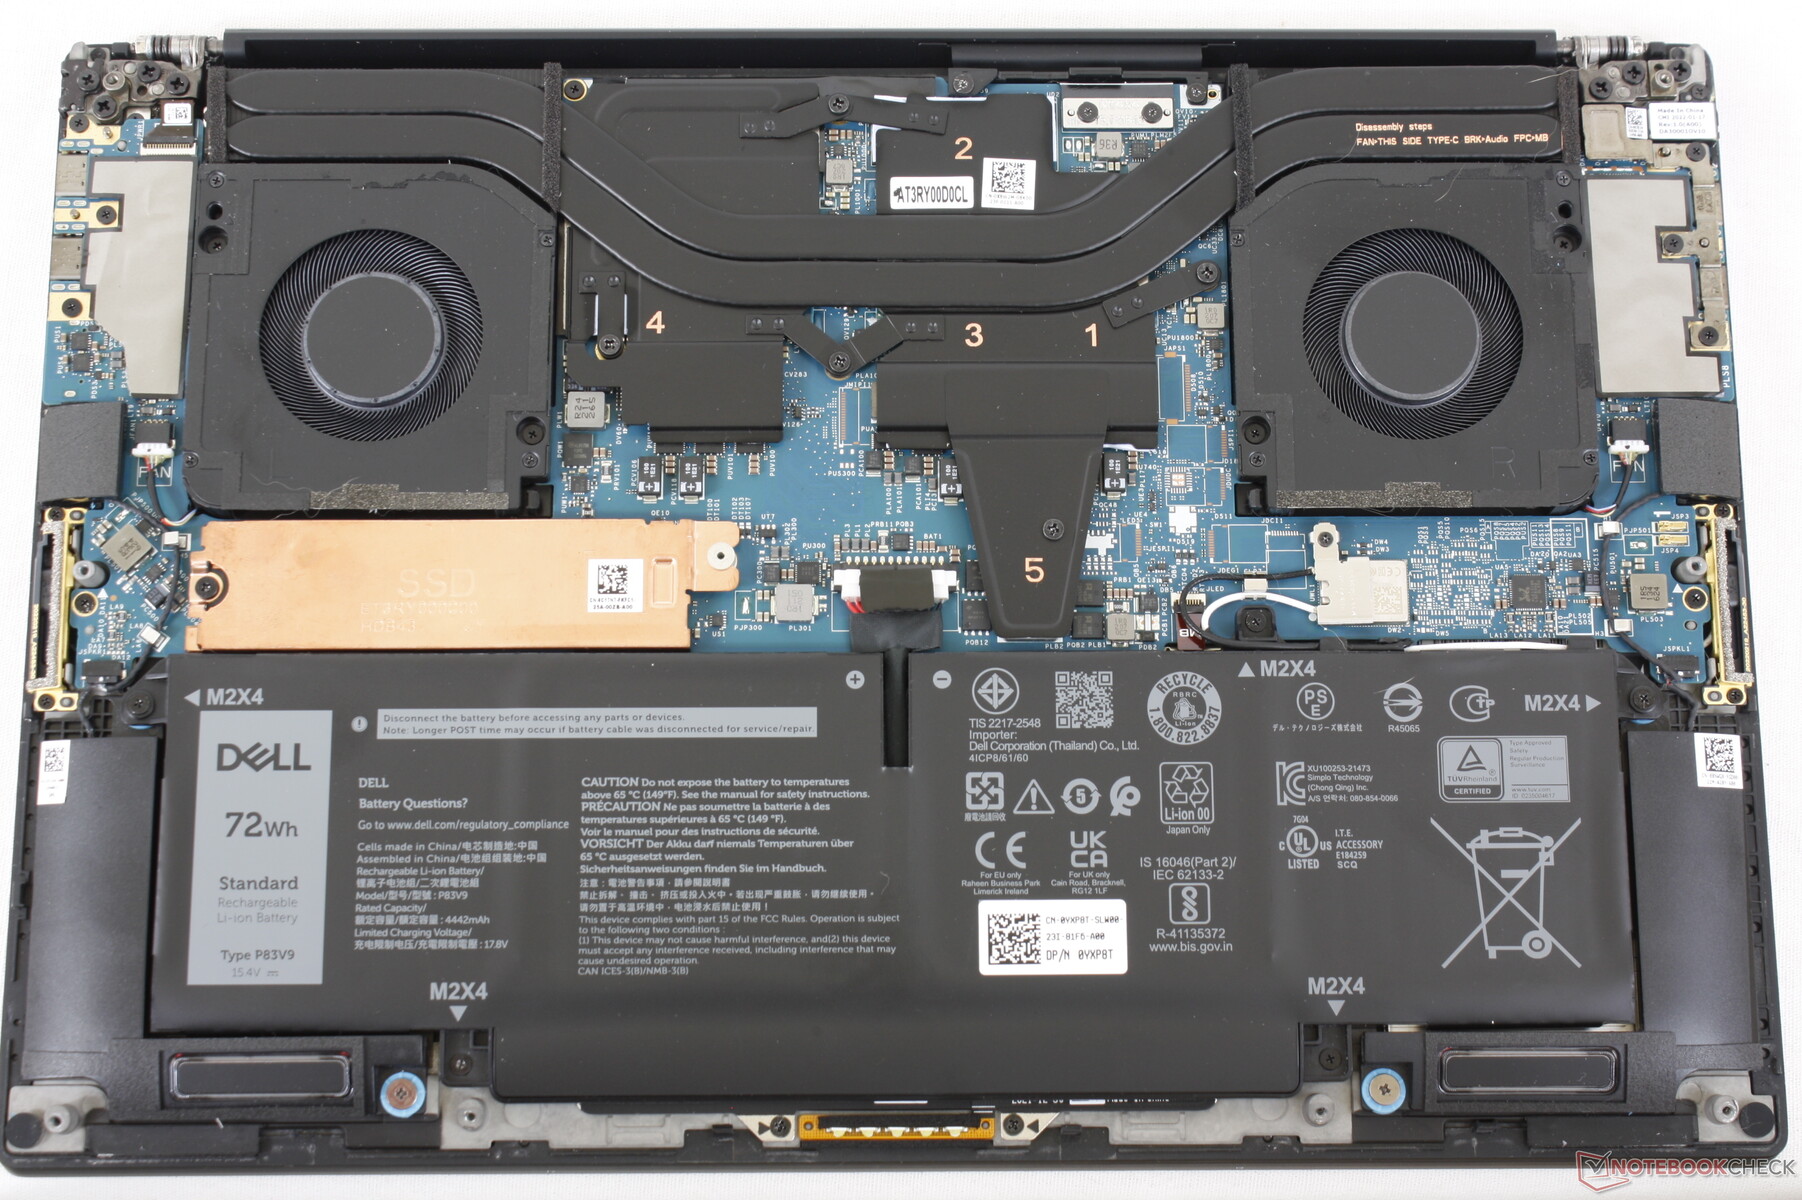
Maintenance
Accessoires et garantie
La boîte de détail comprend le même adaptateur USB-C vers HDMI et USB-A que sur le modèle de l'année dernière, en plus des papiers et de l'adaptateur secteur USB-C de 130 W. Dell propose également un adaptateur secteur USB-C plus petit de 100 W qui devrait suffire pour les configurations sans carte graphique Nvidia discrète.
Une garantie de trois ans est offerte en standard si l'appareil est acheté auprès de Dell aux États-Unis, comme c'est le cas pour la série Precision 7000.
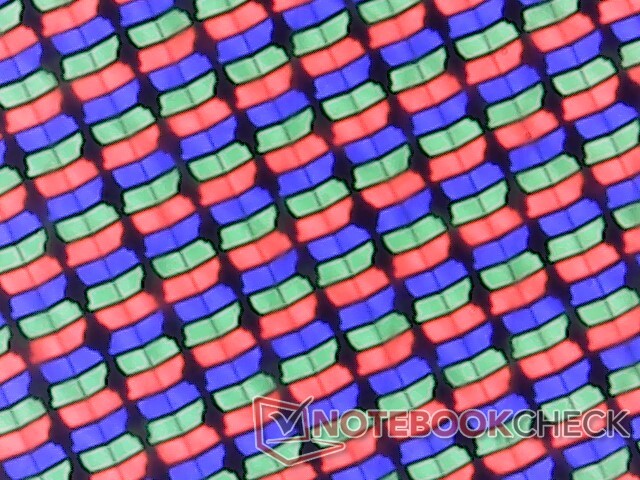
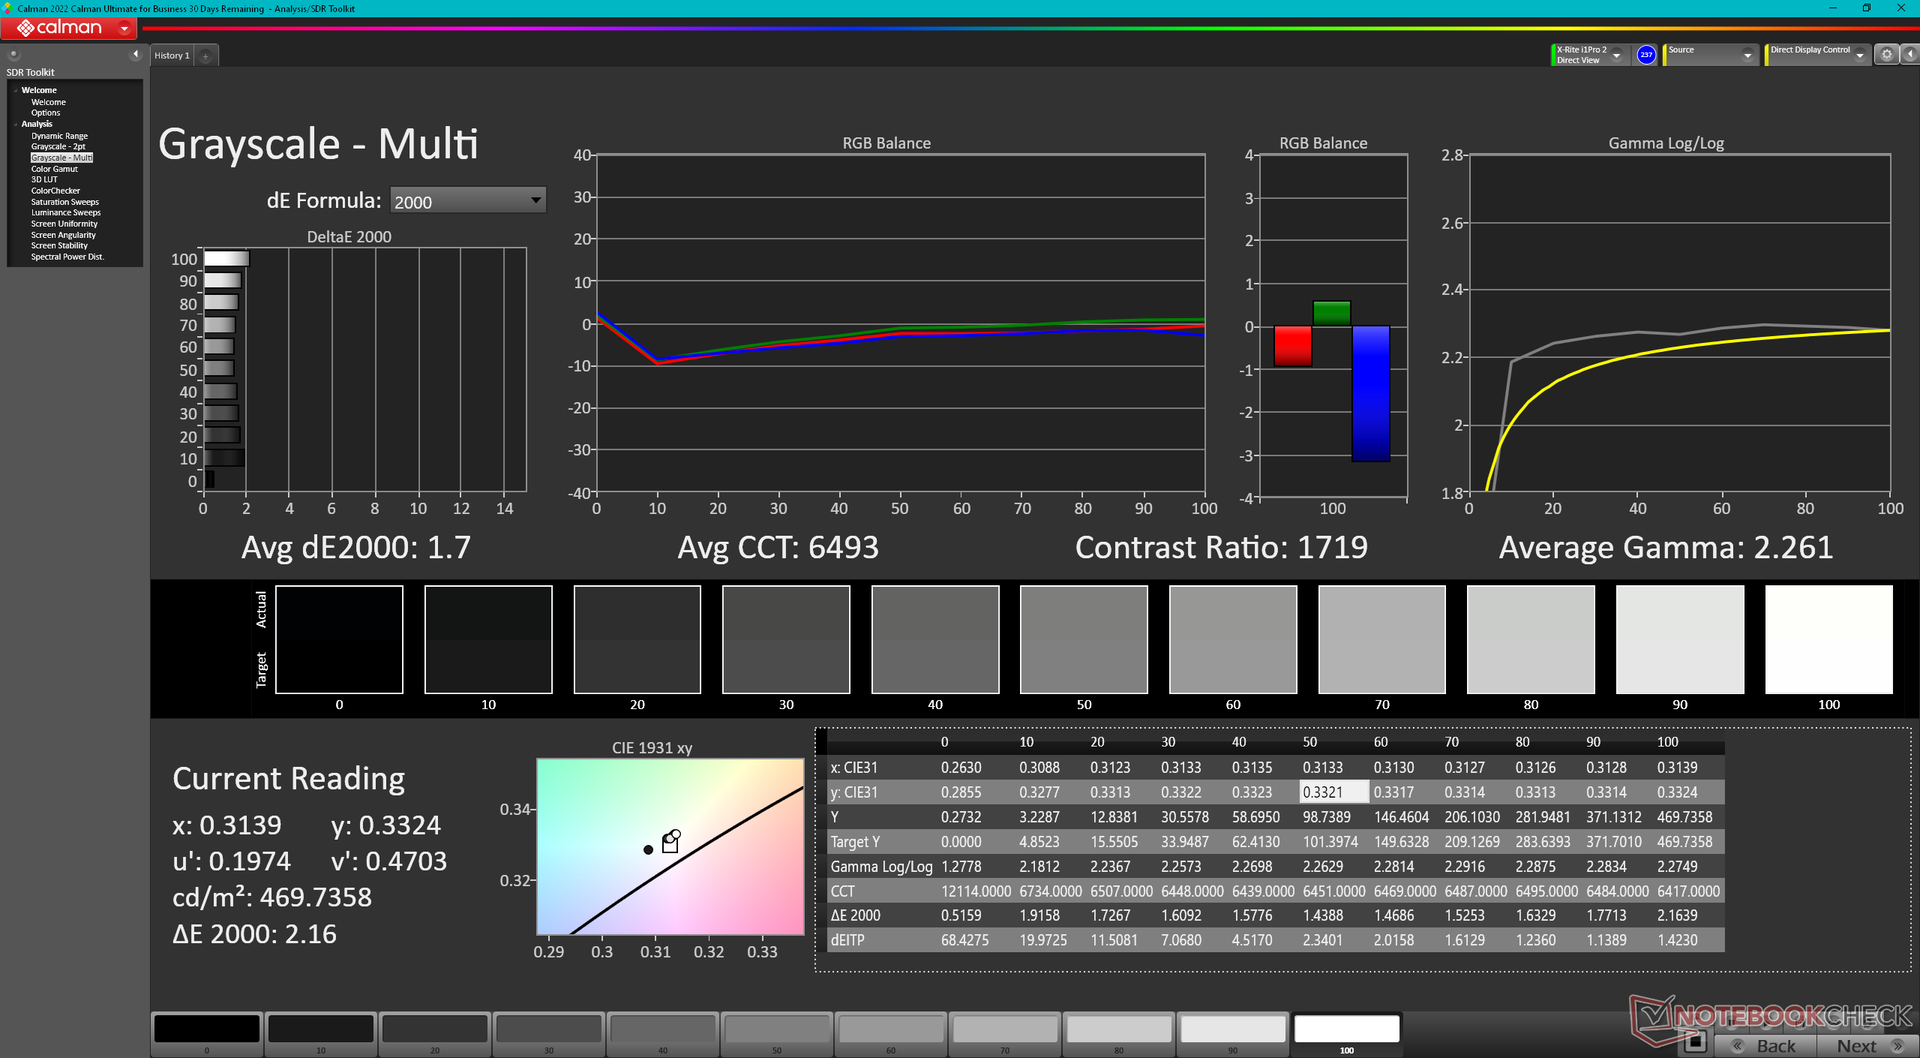
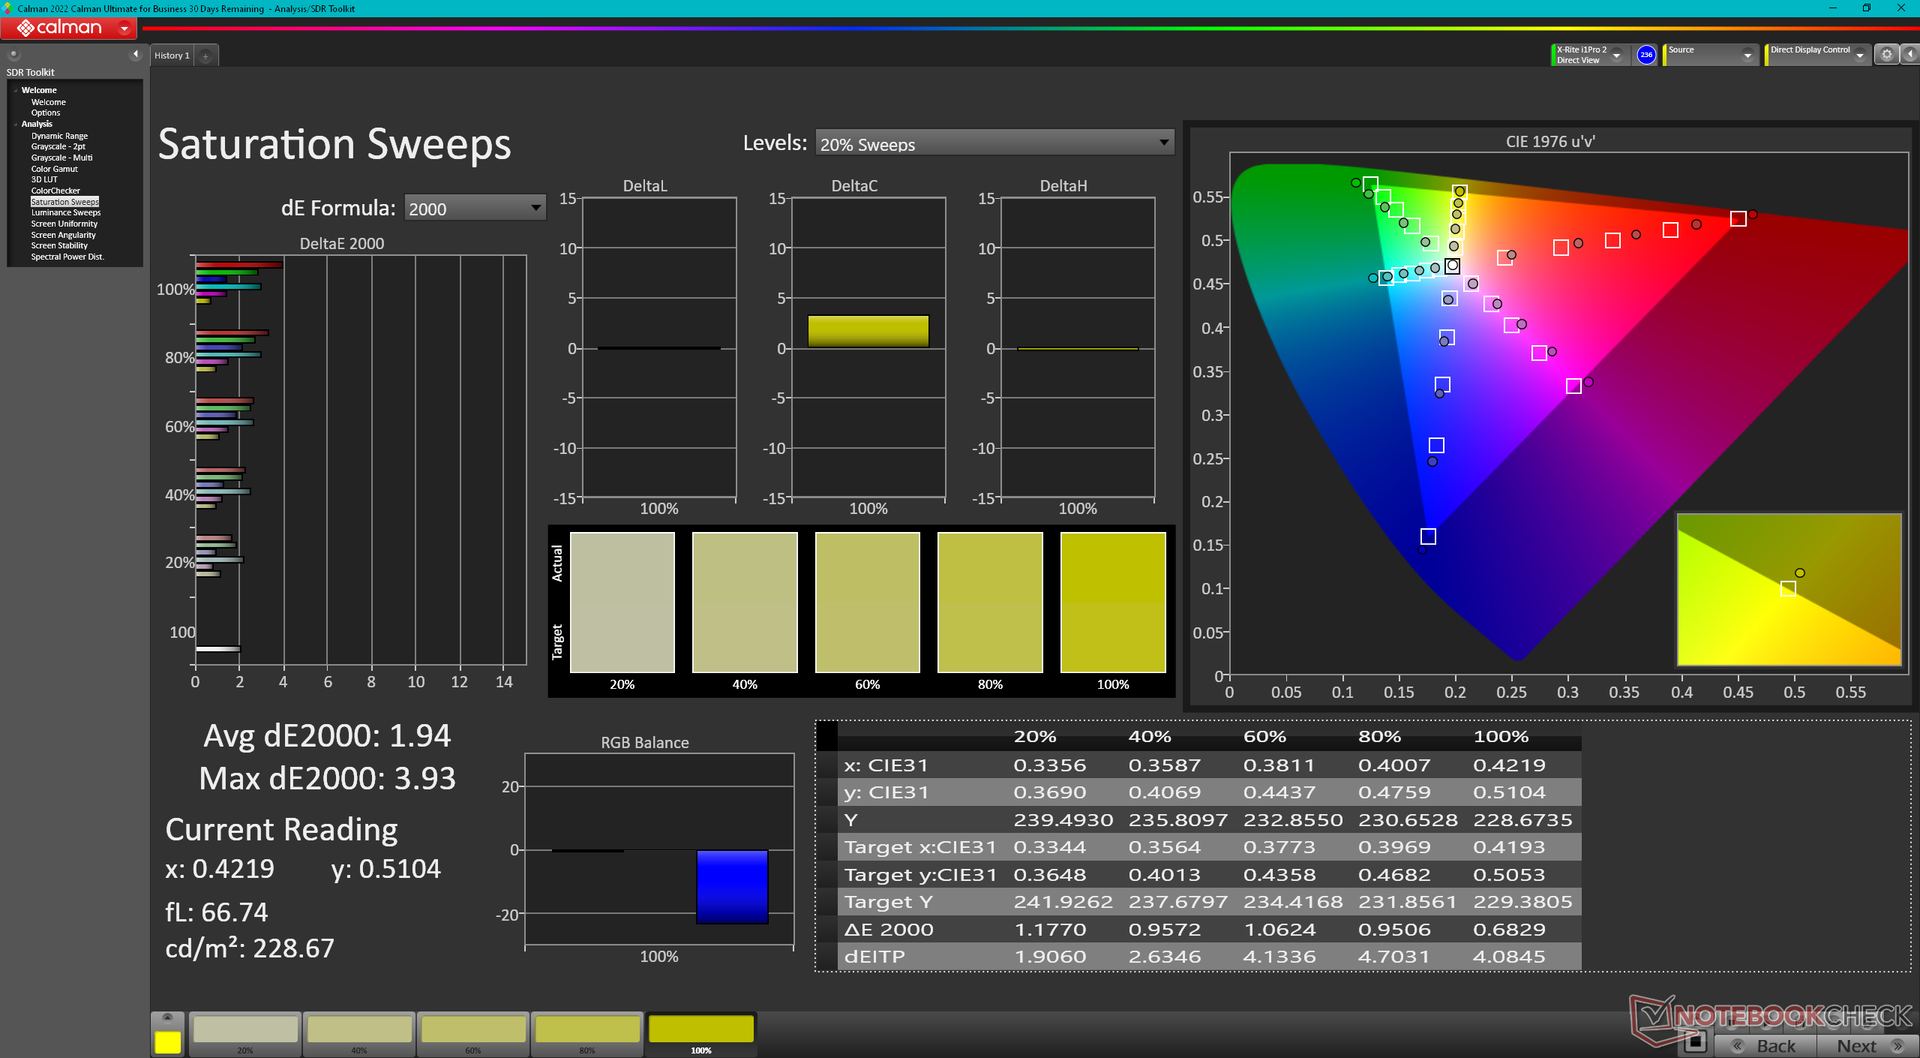
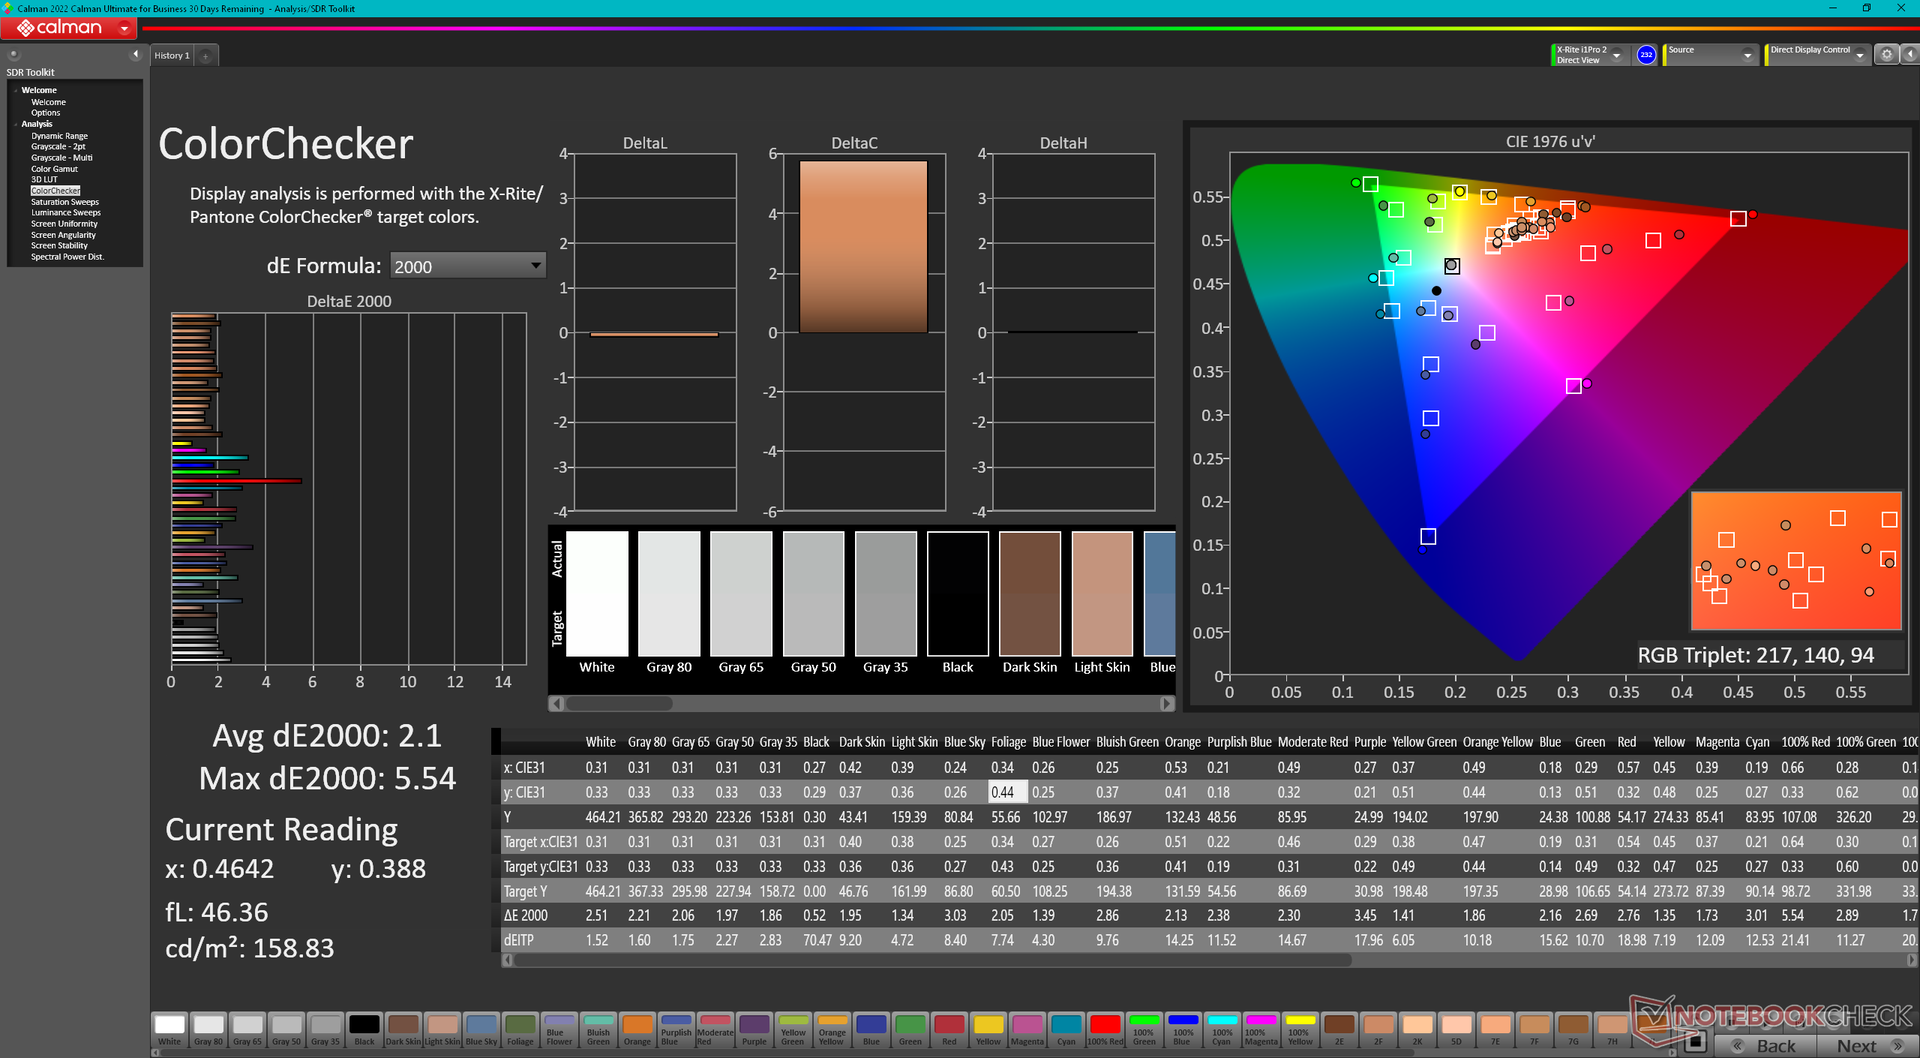
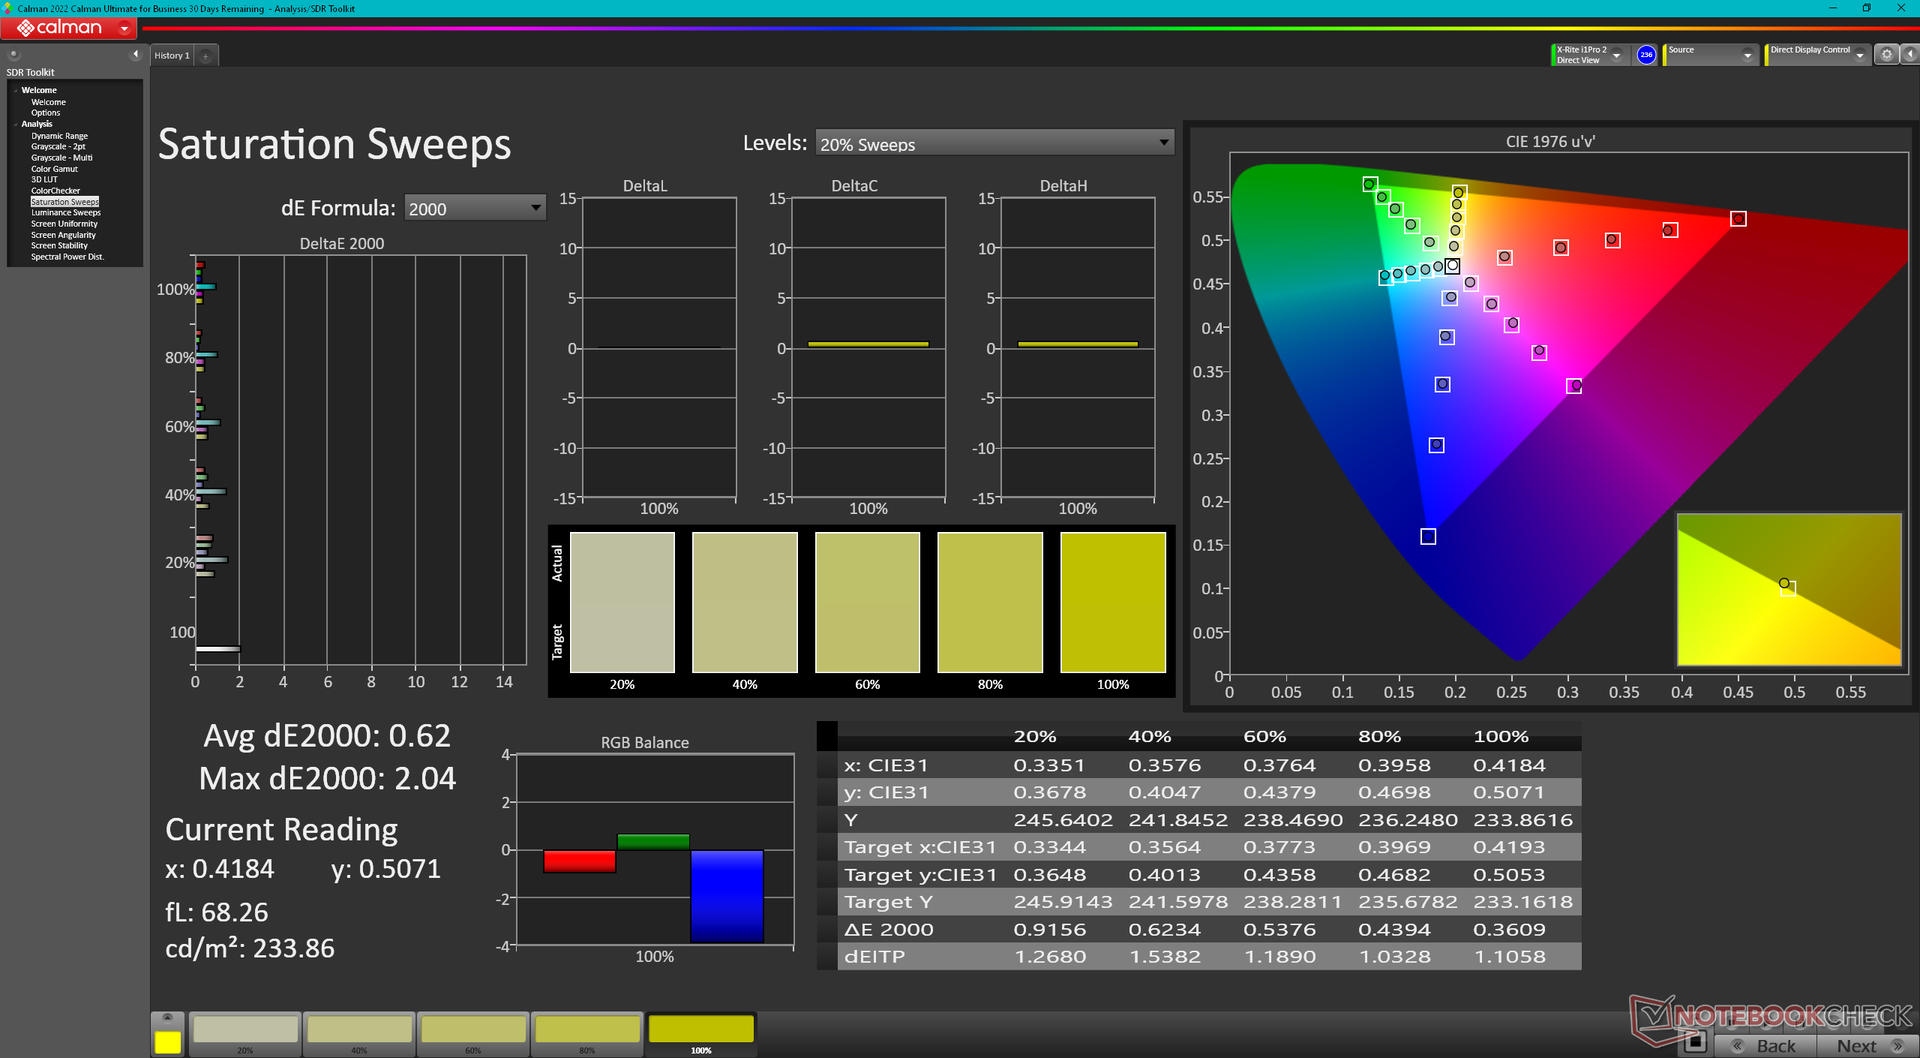
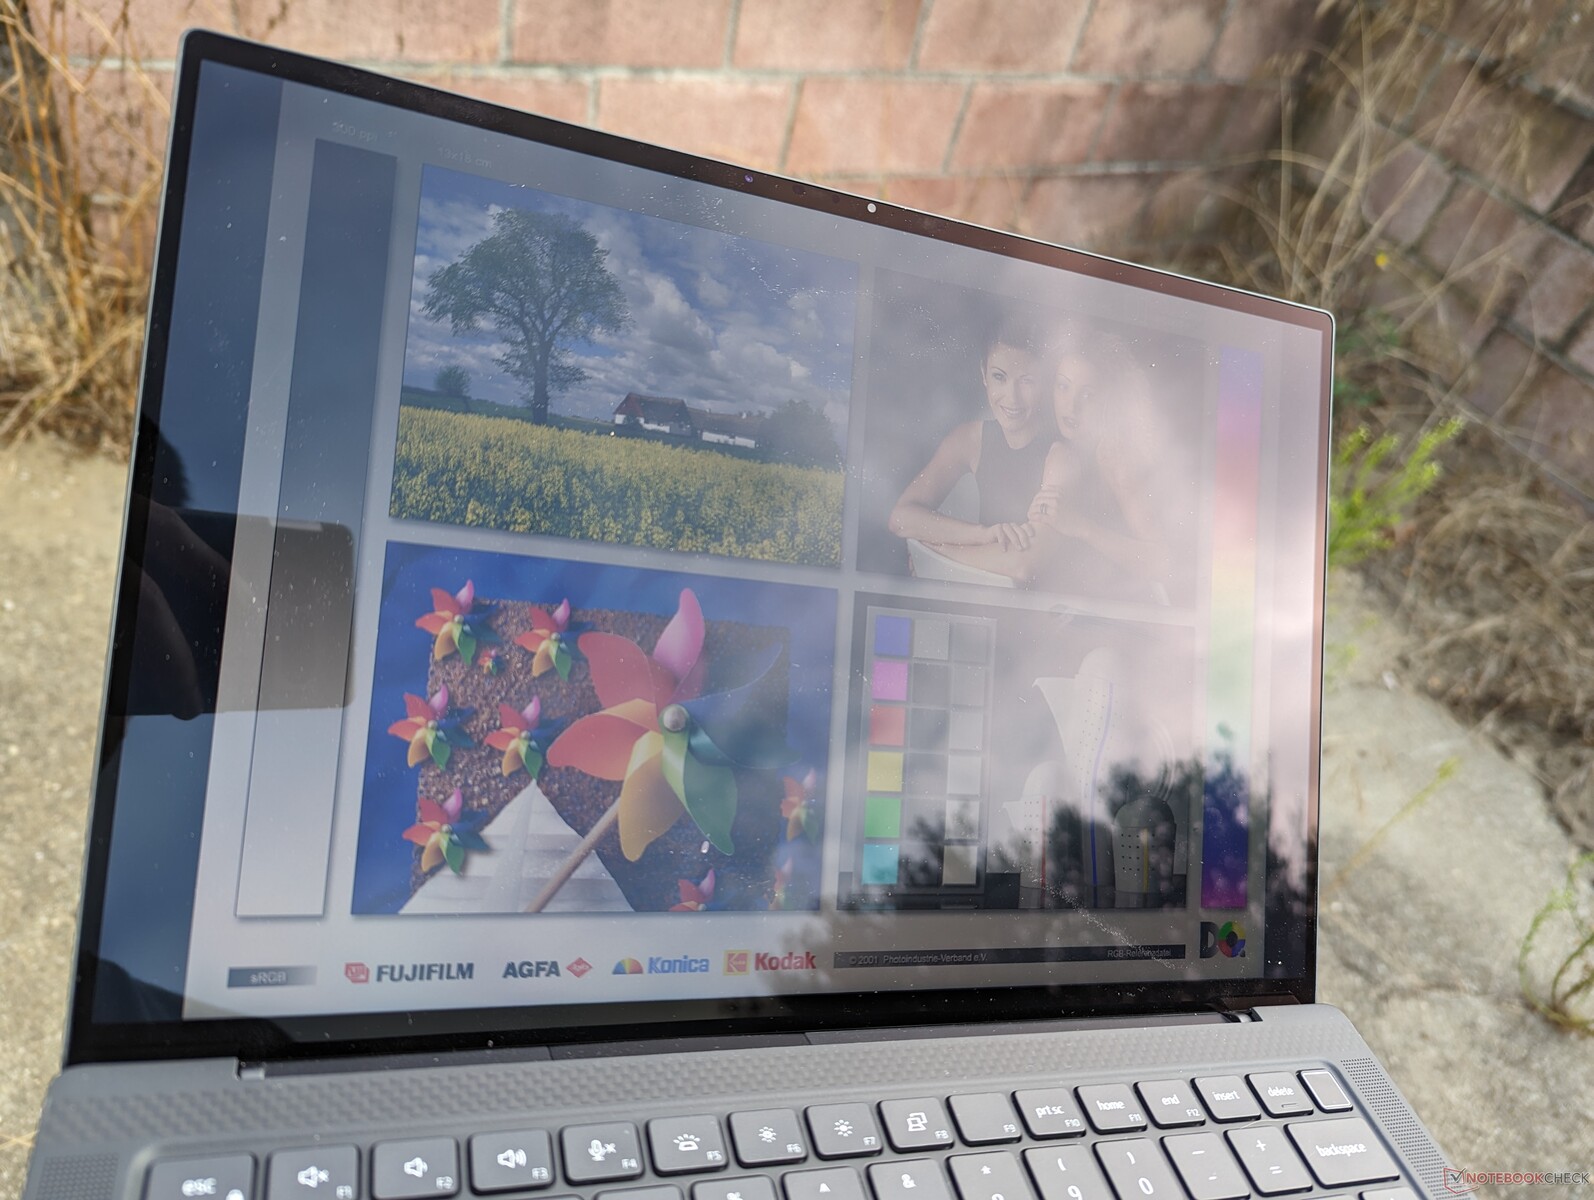
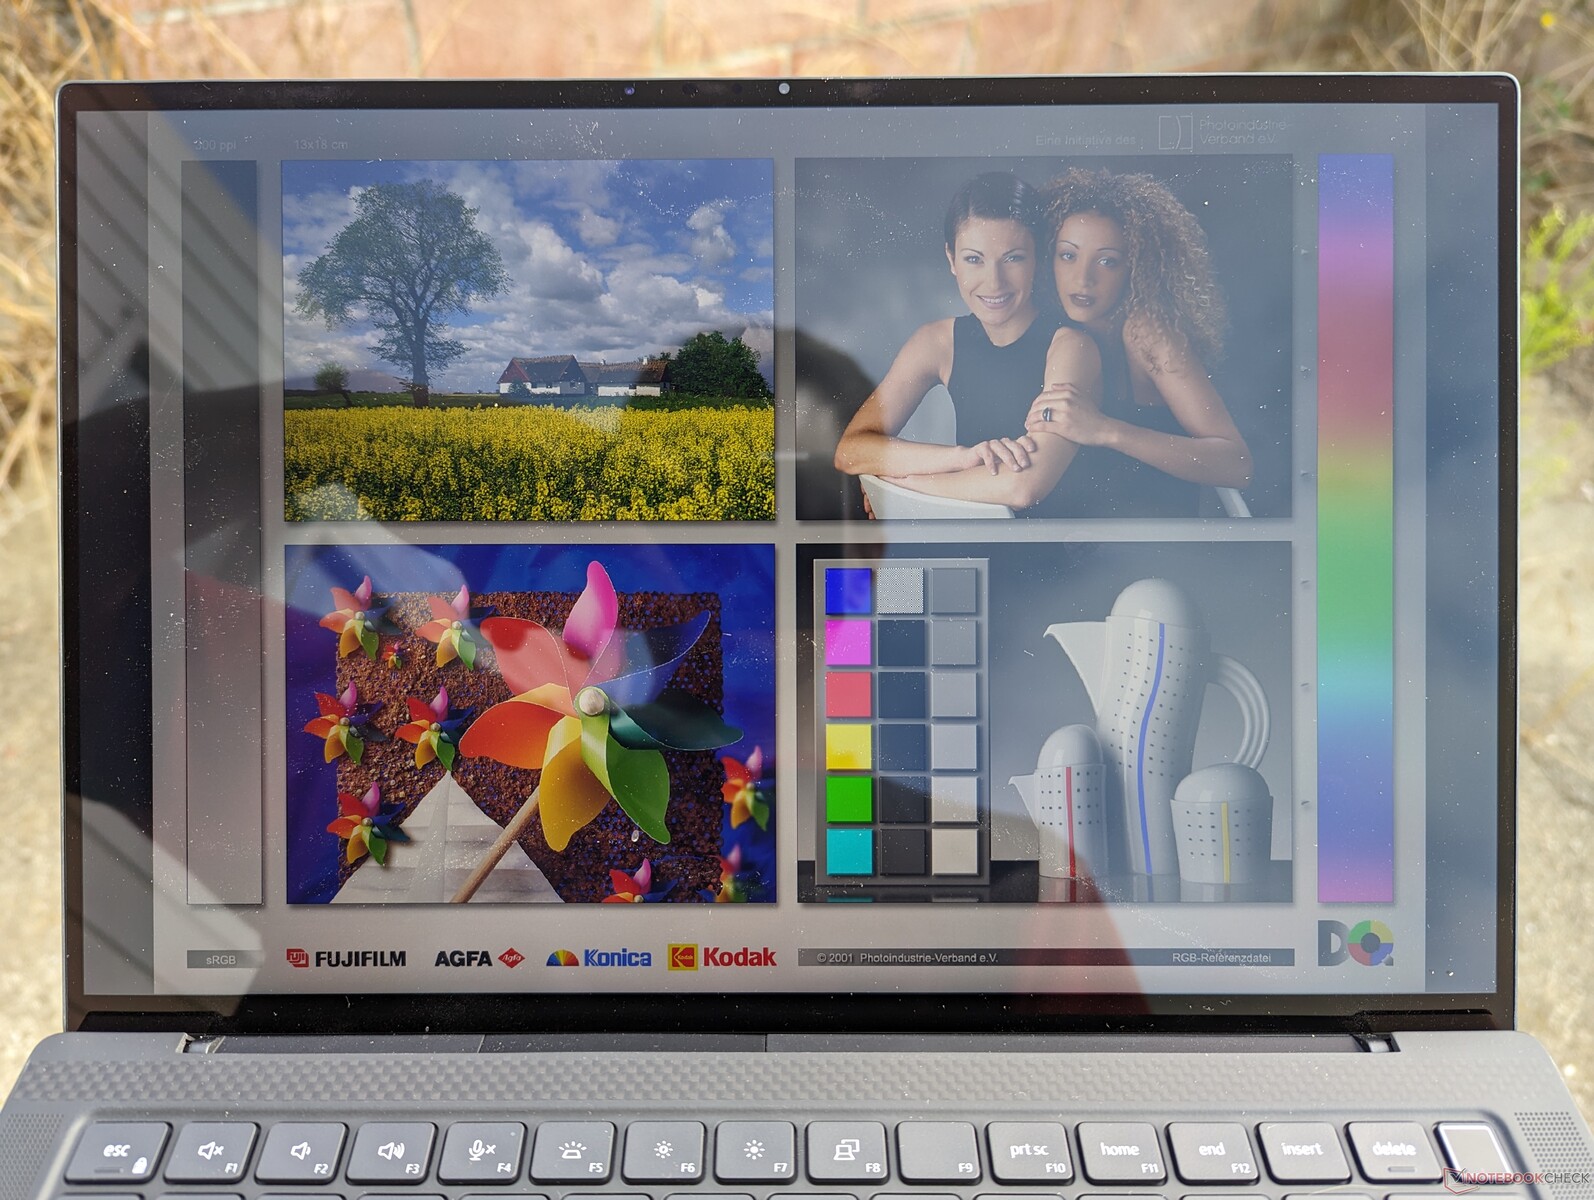
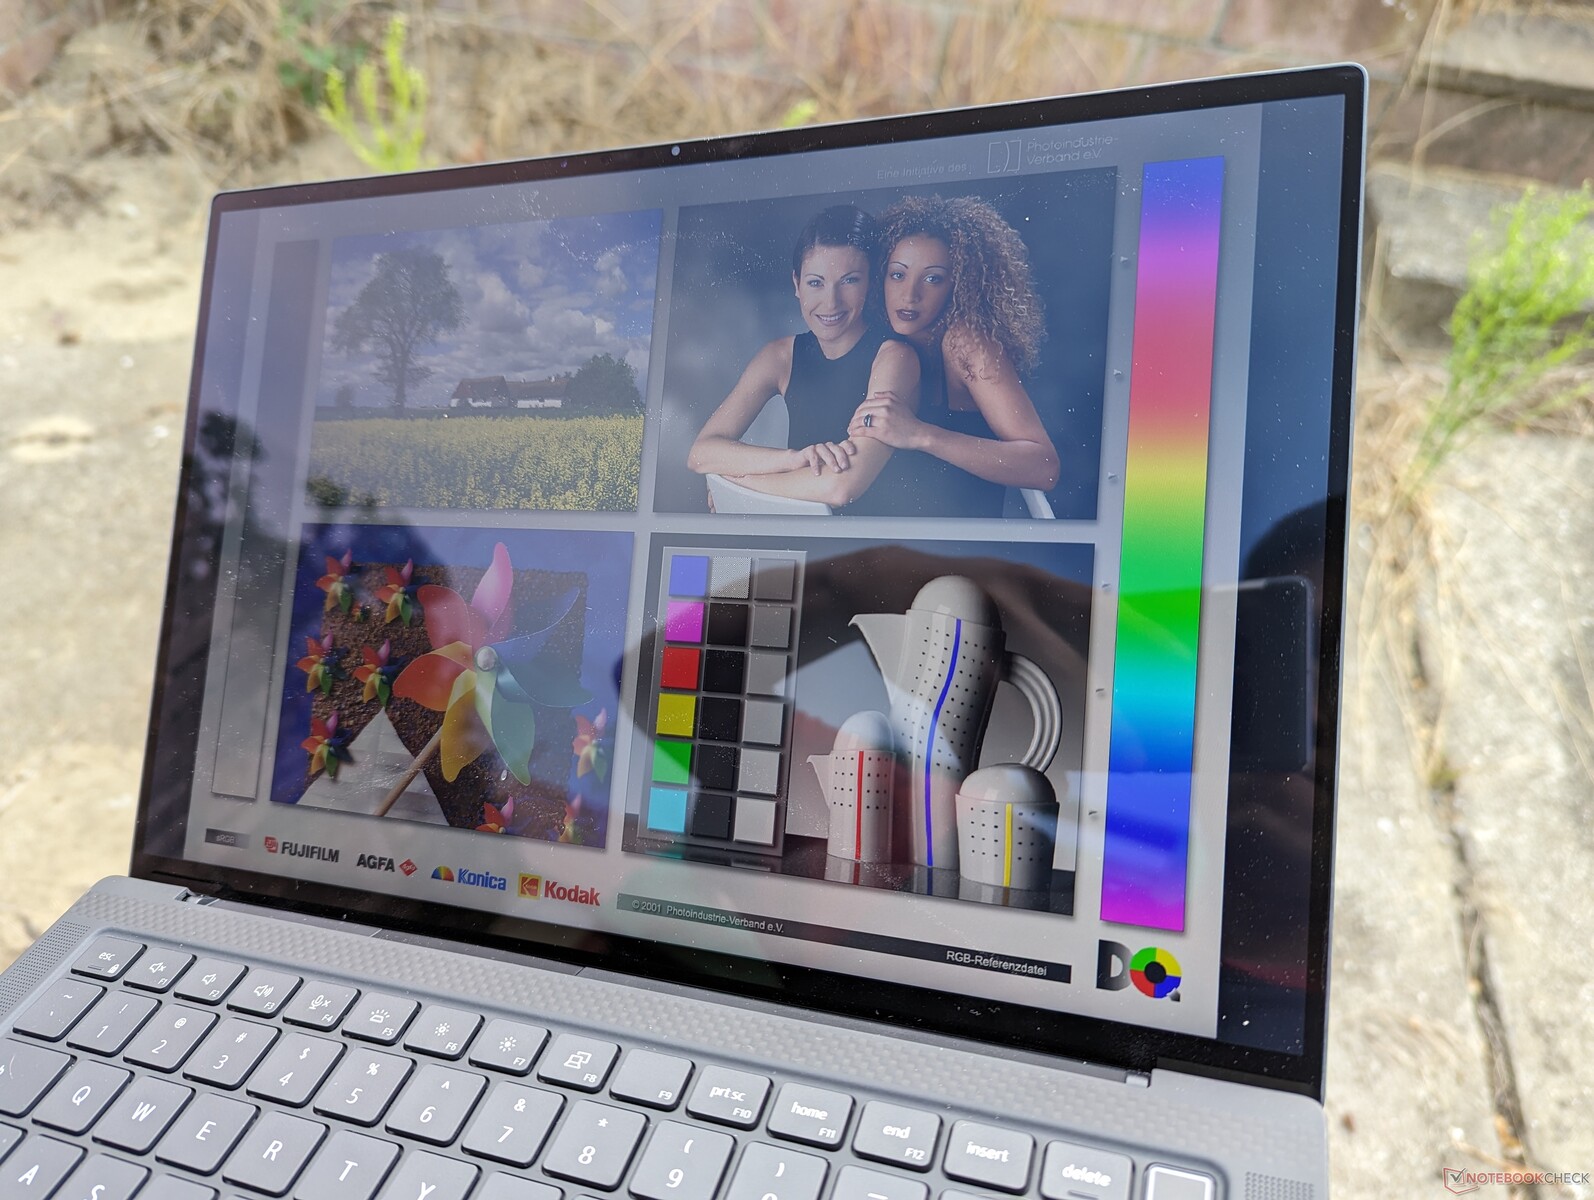
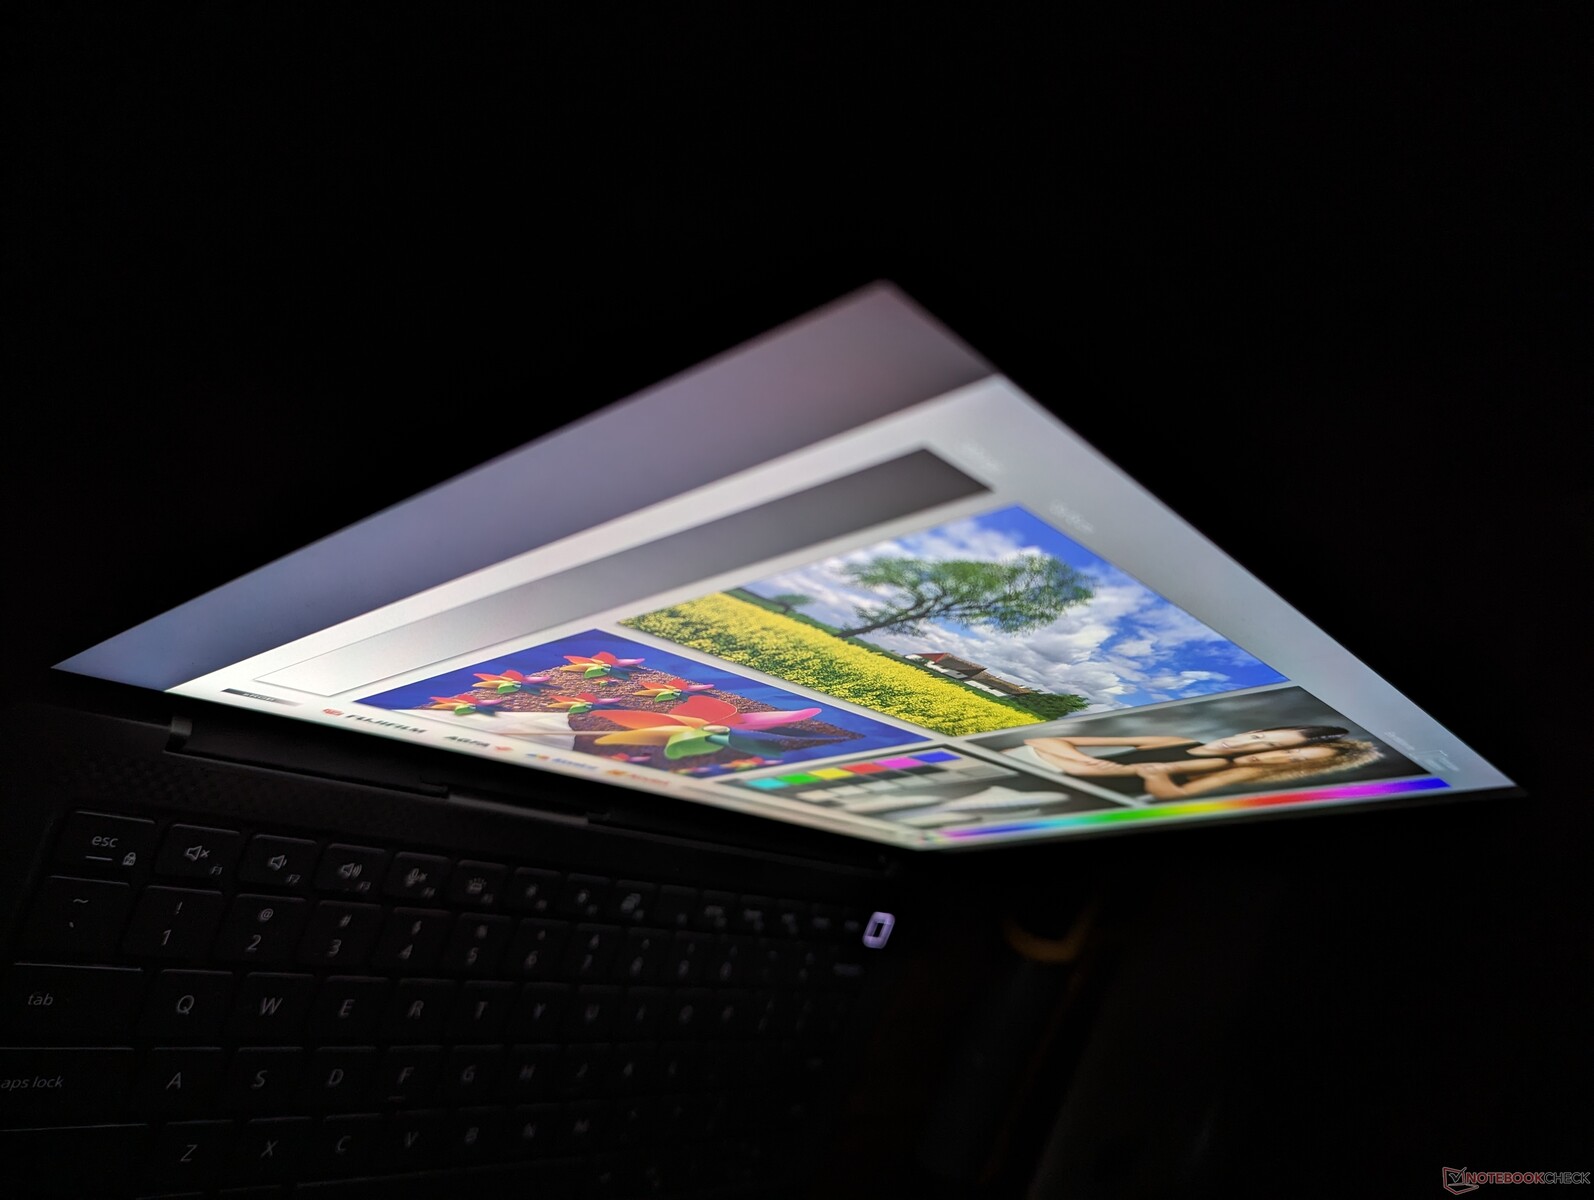
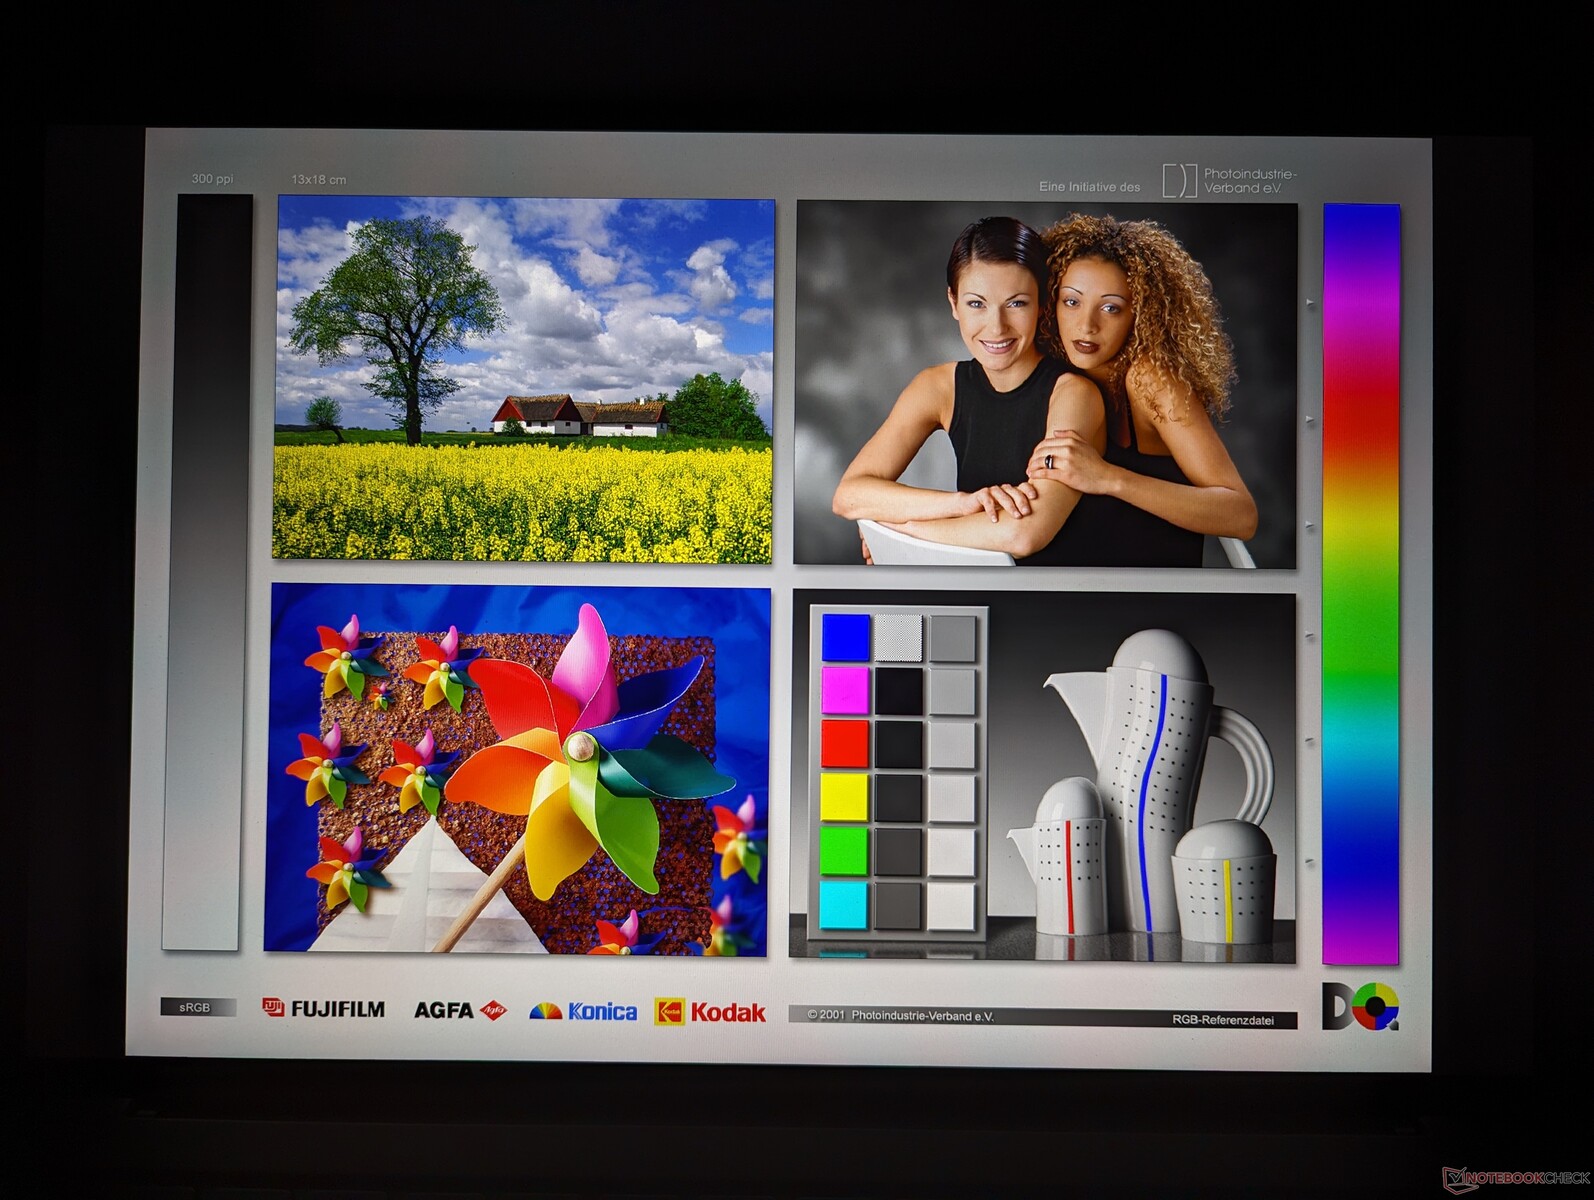
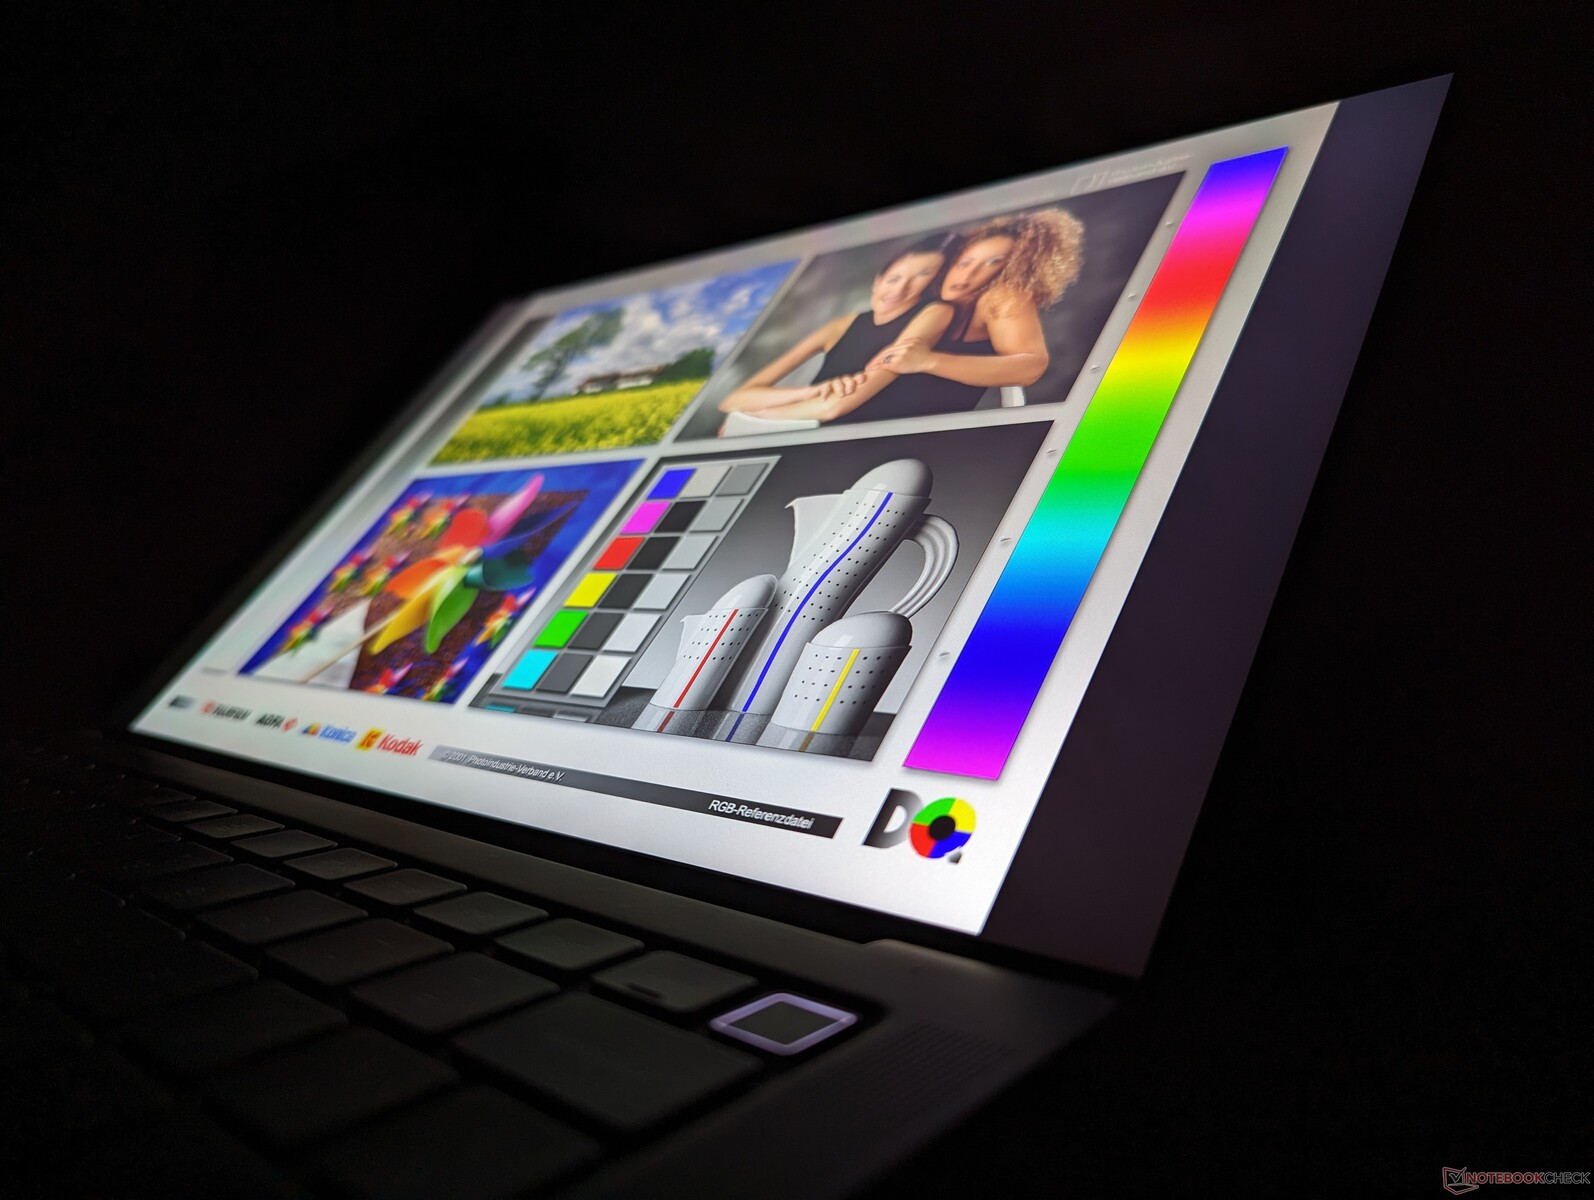
Écran - QHD+ avec couleurs sRGB complètes
Notre unité de test est livrée avec la même dalle IPS AU Optronics B140QAN que celle du modèle de l'année dernière. Dell ne propose pas de nouvelles options pour le rafraîchissement de cette année, ce qui signifie que les couleurs DCi-P3 ou l'OLED sont toujours hors de portée.
| |||||||||||||||||||||||||
Homogénéité de la luminosité: 87 %
Valeur mesurée au centre, sur batterie: 472.8 cd/m²
Contraste: 1351:1 (Valeurs des noirs: 0.35 cd/m²)
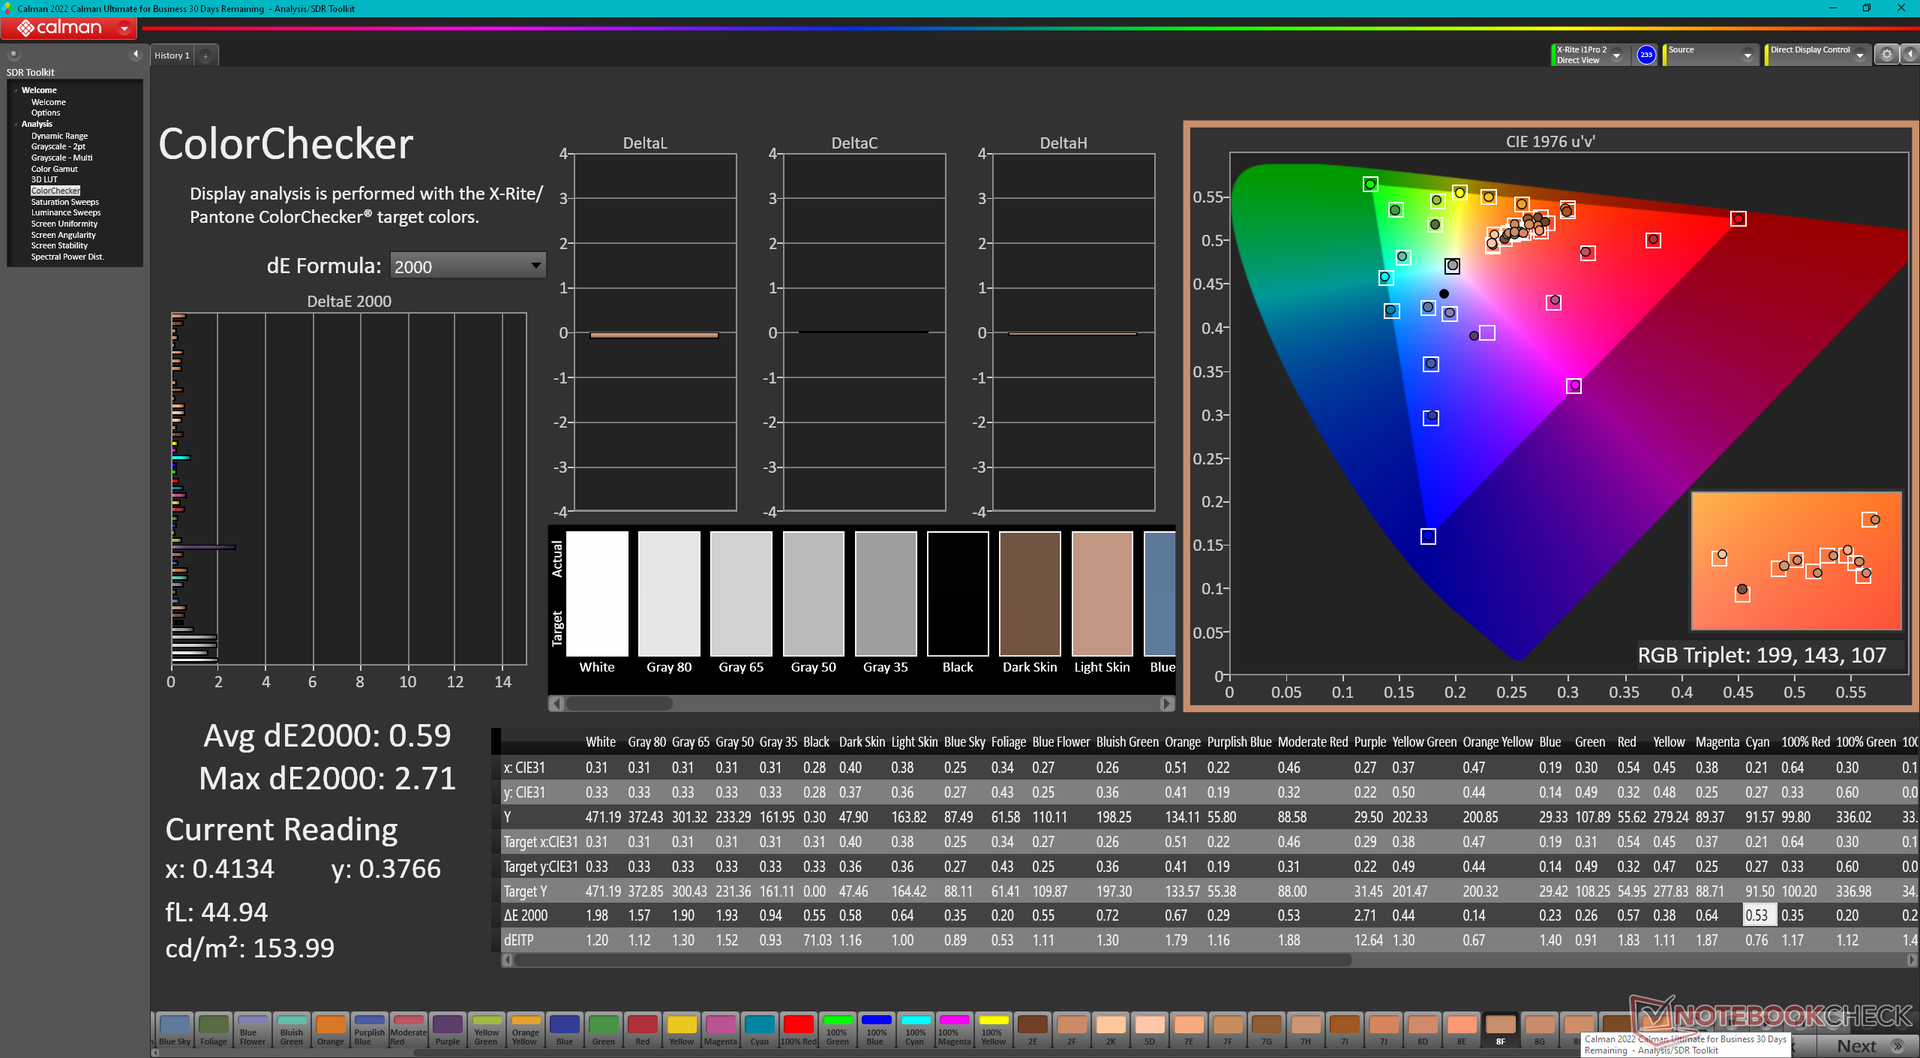
ΔE ColorChecker Calman: 2.1 | ∀{0.5-29.43 Ø4.72}
calibrated: 0.59
ΔE Greyscale Calman: 1.7 | ∀{0.09-98 Ø4.97}
78% AdobeRGB 1998 (Argyll 3D)
99.8% sRGB (Argyll 3D)
77.6% Display P3 (Argyll 3D)
Gamma: 2.26
CCT: 6493 K
| Dell Precision 5480 AU Optronics B140QAN, IPS, 2560x1600, 14" | Dell Precision 5000 5470 AU Optronics B140QAN, IPS, 2560x1600, 14" | Dell Precision 5000 5560 Sharp LQ156R1, IPS, 3840x2400, 15.6" | Lenovo ThinkPad P14s G3 AMD 21J6S05000 LP140WU1-SPB2, IPS LED, 1920x1200, 14" | Lenovo ThinkPad P15v G3 21EM001AGE NE156QUM-N6C, IPS LED, 3840x2160, 15.6" | HP ZBook Firefly 14 G9-6B8A2EA CMN1435, IPS, 1920x1200, 14" | |
|---|---|---|---|---|---|---|
| Display | 1% | 17% | -11% | 15% | -6% | |
| Display P3 Coverage (%) | 77.6 | 79.3 2% | 94.9 22% | 65.9 -15% | 89.9 16% | 69.6 -10% |
| sRGB Coverage (%) | 99.8 | 100 0% | 100 0% | 94.3 -6% | 100 0% | 99.9 0% |
| AdobeRGB 1998 Coverage (%) | 78 | 78.7 1% | 100 28% | 68.2 -13% | 99.9 28% | 71.1 -9% |
| Response Times | -24% | -14% | 13% | -7% | -16% | |
| Response Time Grey 50% / Grey 80% * (ms) | 43.9 ? | 52.4 ? -19% | 47.2 ? -8% | 33.5 ? 24% | 46.7 ? -6% | 56.3 ? -28% |
| Response Time Black / White * (ms) | 25.3 ? | 32.4 ? -28% | 30.4 ? -20% | 24.9 ? 2% | 27.3 ? -8% | 26.2 ? -4% |
| PWM Frequency (Hz) | ||||||
| Screen | -8% | -35% | -13% | -55% | -26% | |
| Brightness middle (cd/m²) | 472.8 | 537 14% | 501.5 6% | 448 -5% | 588 24% | 432 -9% |
| Brightness (cd/m²) | 469 | 518 10% | 467 0% | 422 -10% | 536 14% | 407 -13% |
| Brightness Distribution (%) | 87 | 94 8% | 83 -5% | 85 -2% | 83 -5% | 91 5% |
| Black Level * (cd/m²) | 0.35 | 0.33 6% | 0.44 -26% | 0.23 34% | 0.38 -9% | 0.28 20% |
| Contrast (:1) | 1351 | 1627 20% | 1140 -16% | 1948 44% | 1547 15% | 1543 14% |
| Colorchecker dE 2000 * | 2.1 | 2.97 -41% | 4.73 -125% | 2.5 -19% | 3.9 -86% | 3.1 -48% |
| Colorchecker dE 2000 max. * | 5.54 | 5.33 4% | 8.45 -53% | 3.7 33% | 8.8 -59% | 5.6 -1% |
| Colorchecker dE 2000 calibrated * | 0.59 | 0.88 -49% | 0.51 14% | 1.3 -120% | 1 -69% | 0.8 -36% |
| Greyscale dE 2000 * | 1.7 | 2.4 -41% | 3.6 -112% | 2.9 -71% | 7.1 -318% | 4.5 -165% |
| Gamma | 2.26 97% | 2.06 107% | 2.08 106% | 2.03 108% | 2.12 104% | 2 110% |
| CCT | 6493 100% | 6668 97% | 6447 101% | 6840 95% | 7268 89% | 6528 100% |
| Moyenne finale (programmes/paramètres) | -10% /
-8% | -11% /
-21% | -4% /
-9% | -16% /
-33% | -16% /
-20% |
* ... Moindre est la valeur, meilleures sont les performances
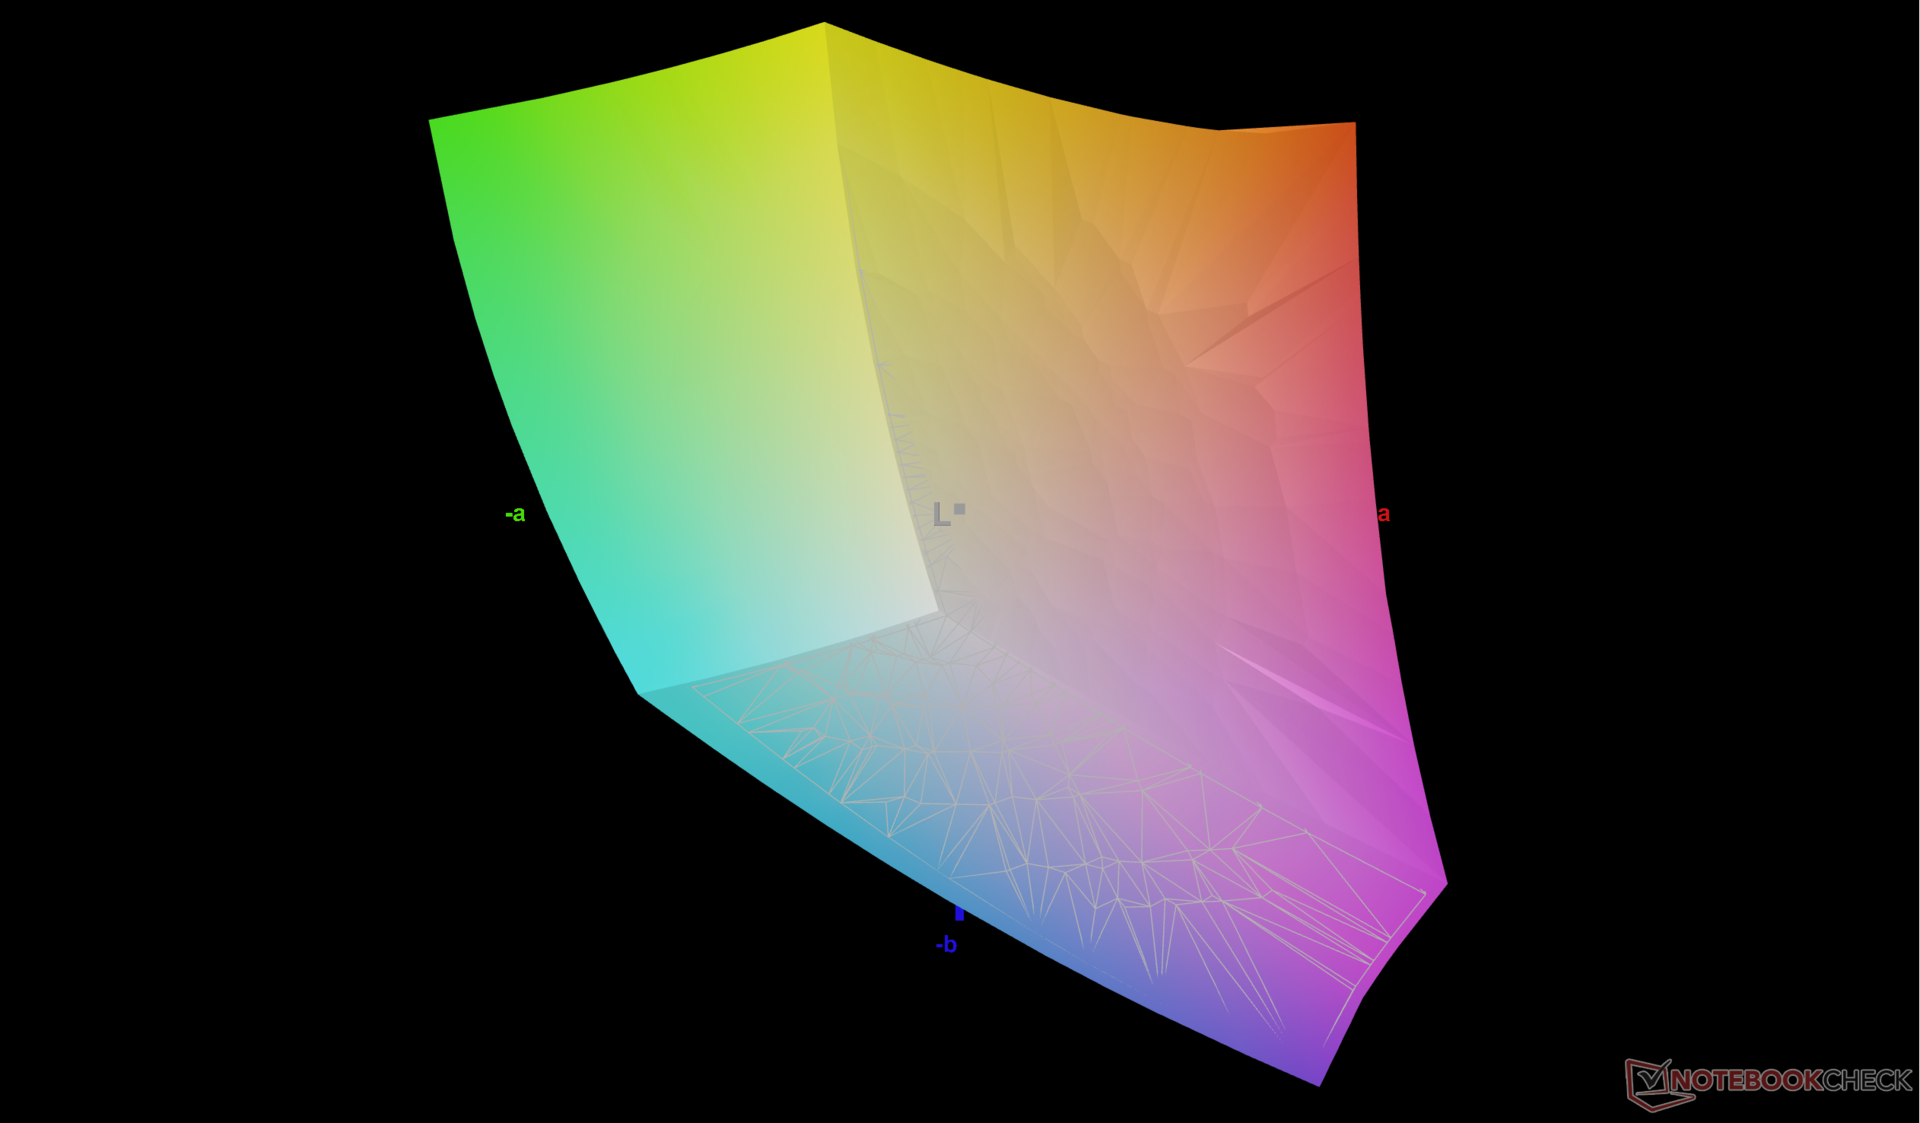
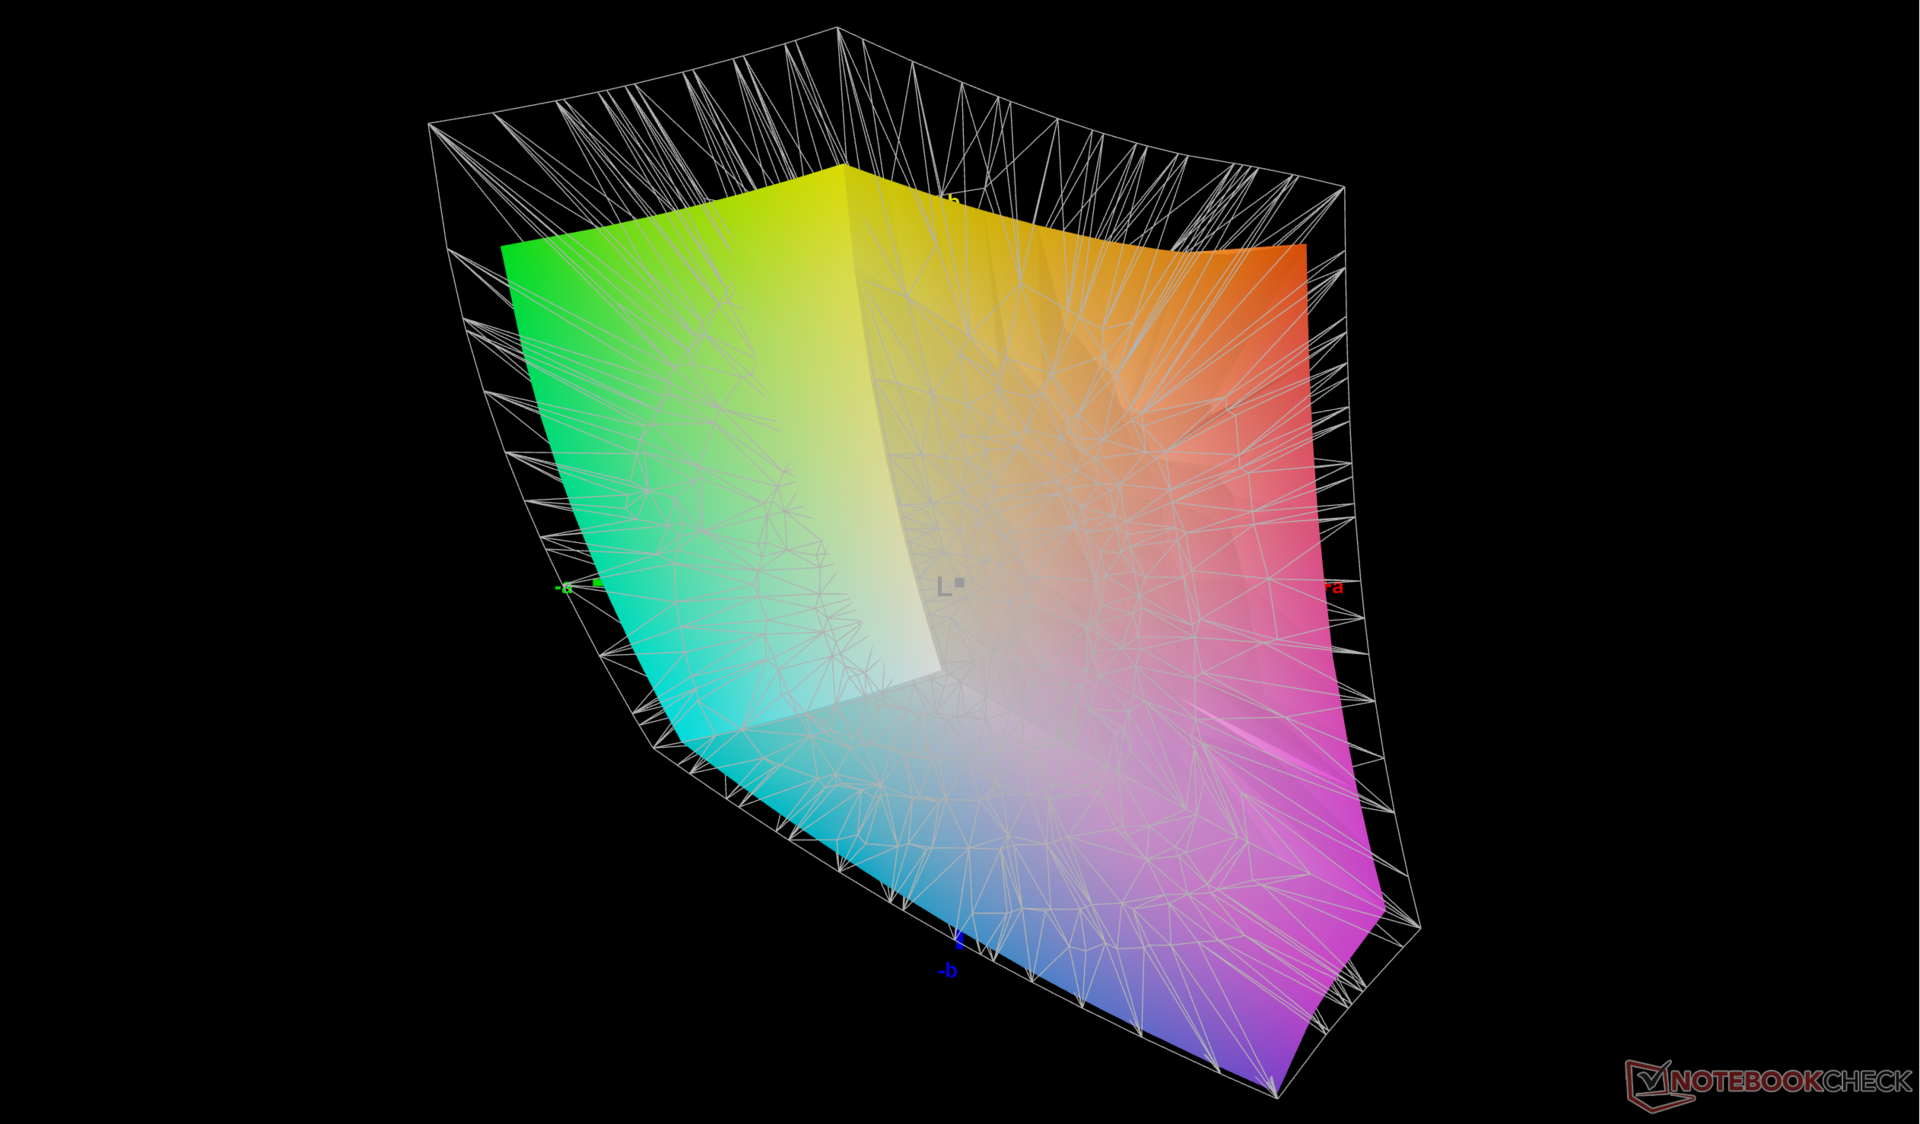
L'écran est toujours bien calibré, avec des valeurs moyennes de deltaE en niveaux de gris et en couleurs de seulement 1,7 et 2,1, respectivement. Un étalonnage par l'utilisateur final est possible mais pas nécessaire.

Temps de réponse de l'écran
| ↔ Temps de réponse noir à blanc | ||
|---|---|---|
| 25.3 ms ... hausse ↗ et chute ↘ combinées | ↗ 12.6 ms hausse | 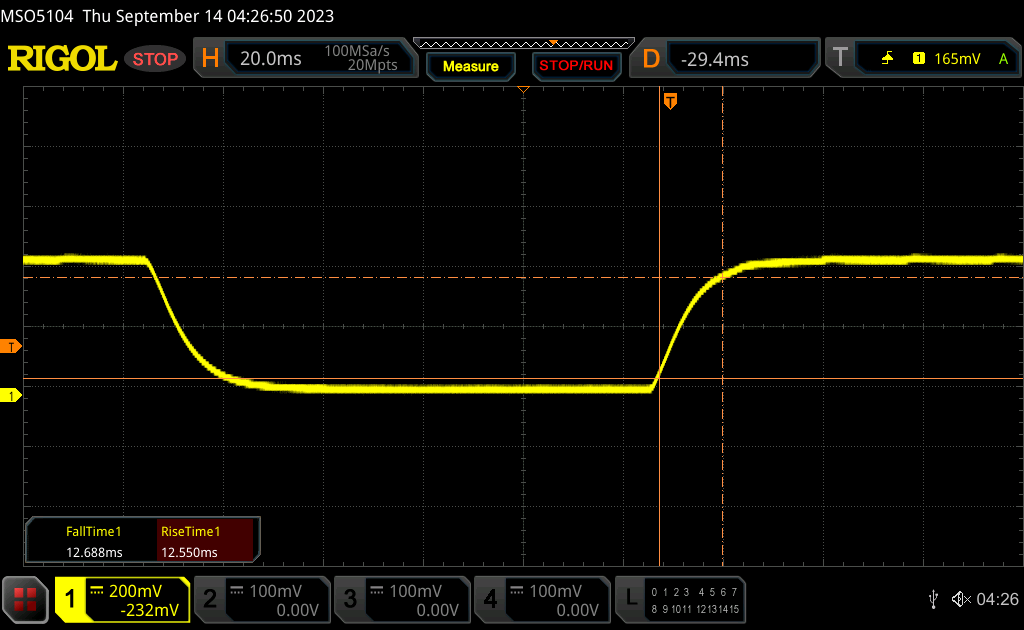 |
| ↘ 12.7 ms chute | ||
| L'écran souffre de latences relativement élevées, insuffisant pour le jeu. En comparaison, tous les appareils testés affichent entre 0.1 (minimum) et 240 (maximum) ms. » 61 % des appareils testés affichent de meilleures performances. Cela signifie que les latences relevées sont moins bonnes que la moyenne (19.8 ms) de tous les appareils testés. | ||
| ↔ Temps de réponse gris 50% à gris 80% | ||
| 43.9 ms ... hausse ↗ et chute ↘ combinées | ↗ 19.2 ms hausse | 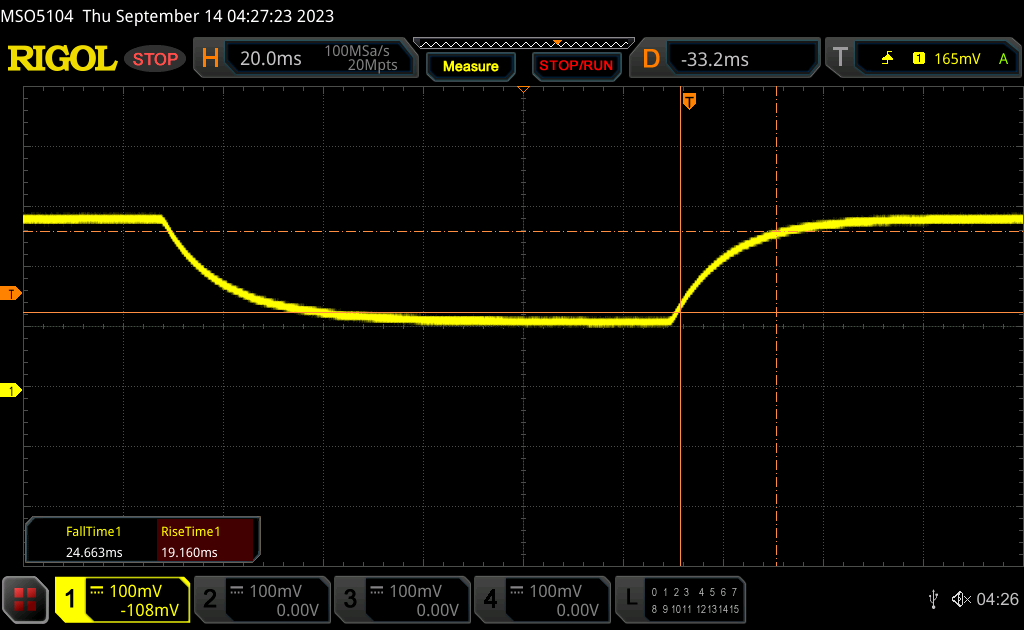 |
| ↘ 24.7 ms chute | ||
| L'écran souffre de latences très élevées, à éviter pour le jeu. En comparaison, tous les appareils testés affichent entre 0.165 (minimum) et 636 (maximum) ms. » 73 % des appareils testés affichent de meilleures performances. Cela signifie que les latences relevées sont moins bonnes que la moyenne (31 ms) de tous les appareils testés. | ||
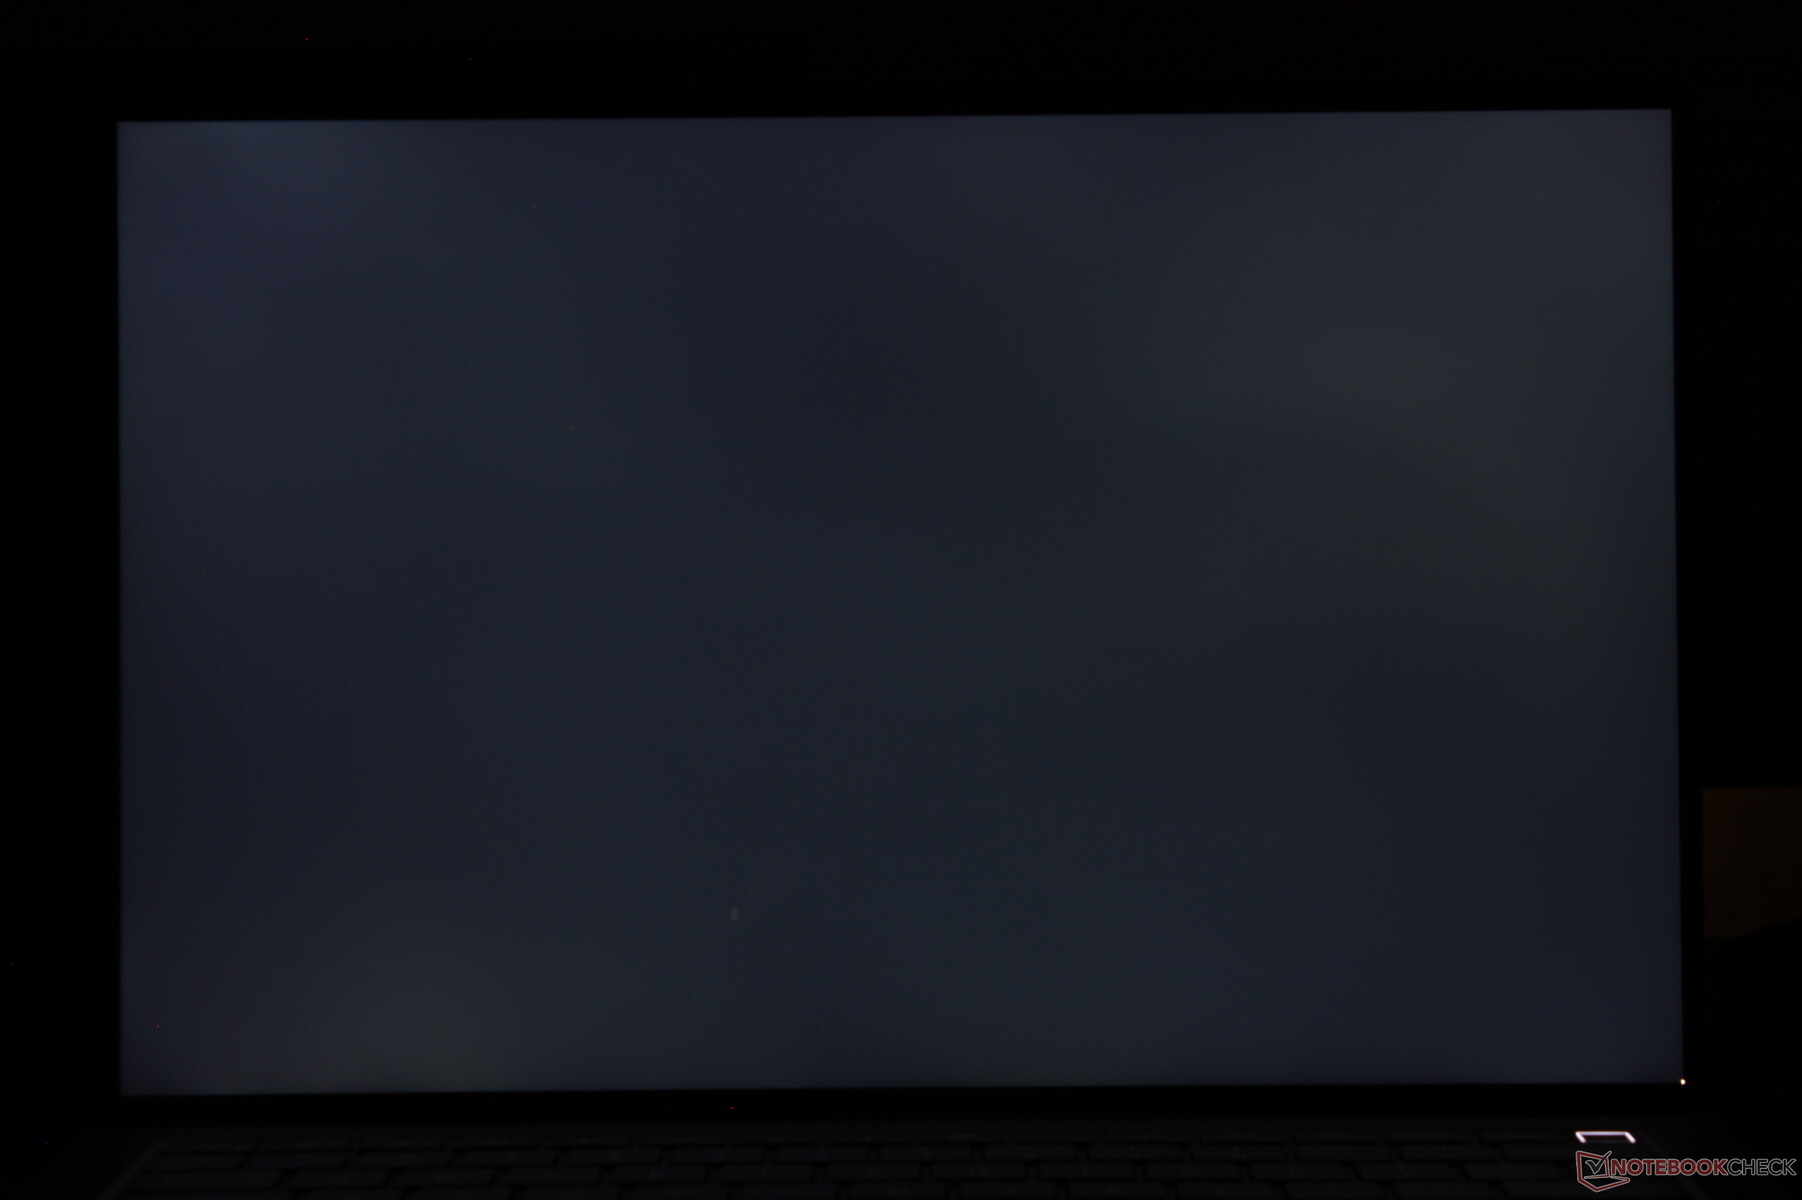
Scintillement / MLI (Modulation de largeur d'impulsion)
| Scintillement / MLI (Modulation de largeur d'impulsion) non décelé | 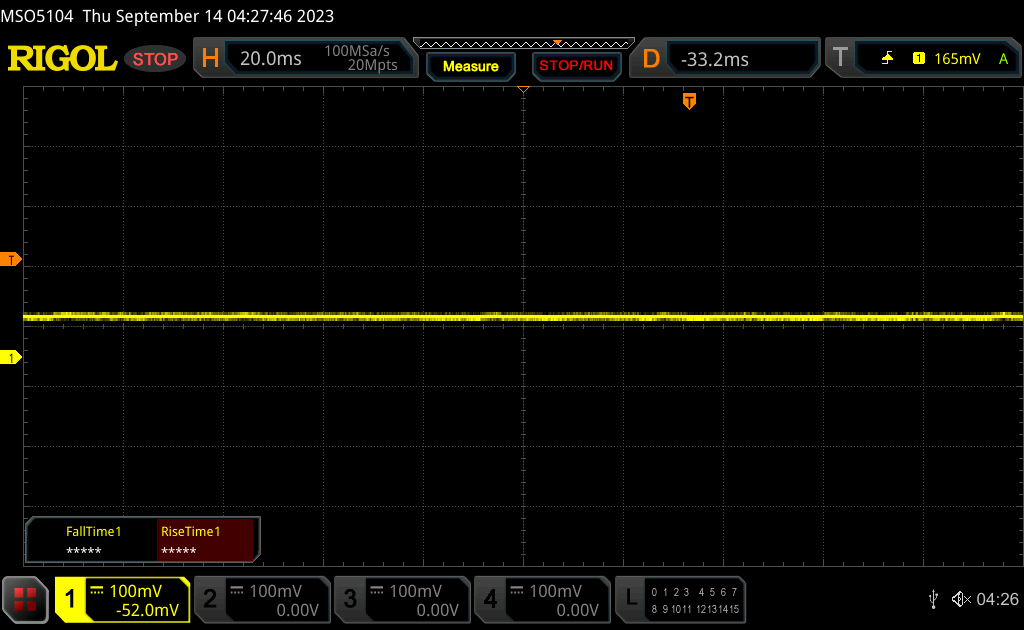 | ||
En comparaison, 52 % des appareils testés n'emploient pas MDI pour assombrir leur écran. Nous avons relevé une moyenne à 7781 (minimum : 5 - maximum : 343500) Hz dans le cas où une MDI était active. | |||
Performance - 13th Gen Raptor Lake-H
Conditions d'essai
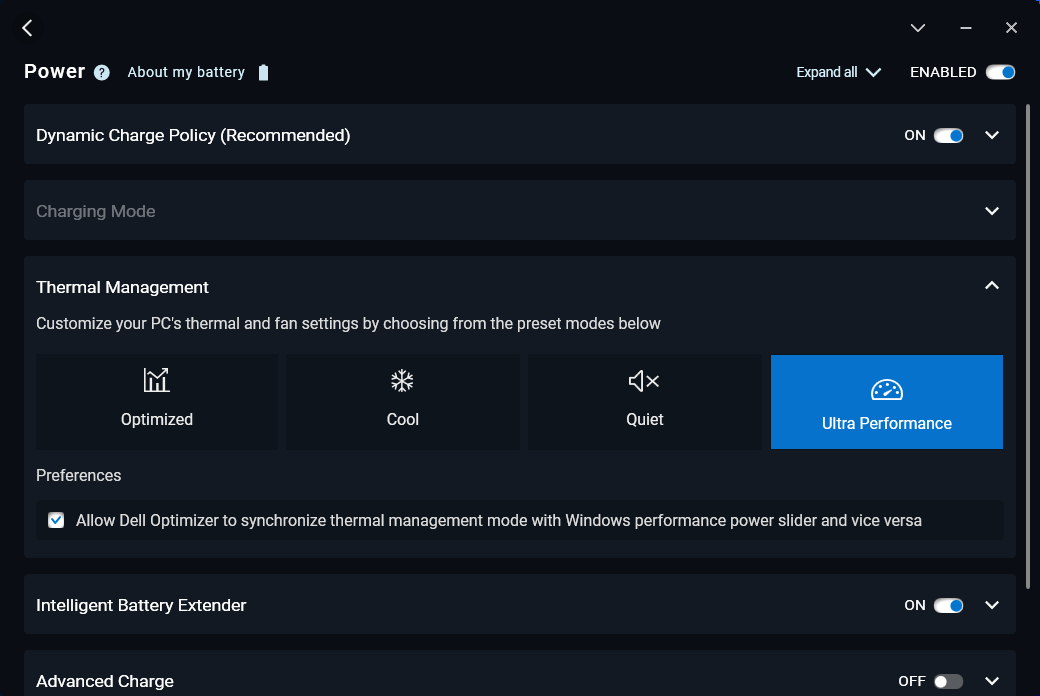
Nous avons réglé notre appareil en mode Ultra Performance via Dell Optimizer avant d'effectuer les tests ci-dessous. Les profils d'alimentation de l'Optimizer peuvent se synchroniser avec les profils d'alimentation de Windows, contrairement à la plupart des autres ordinateurs portables.
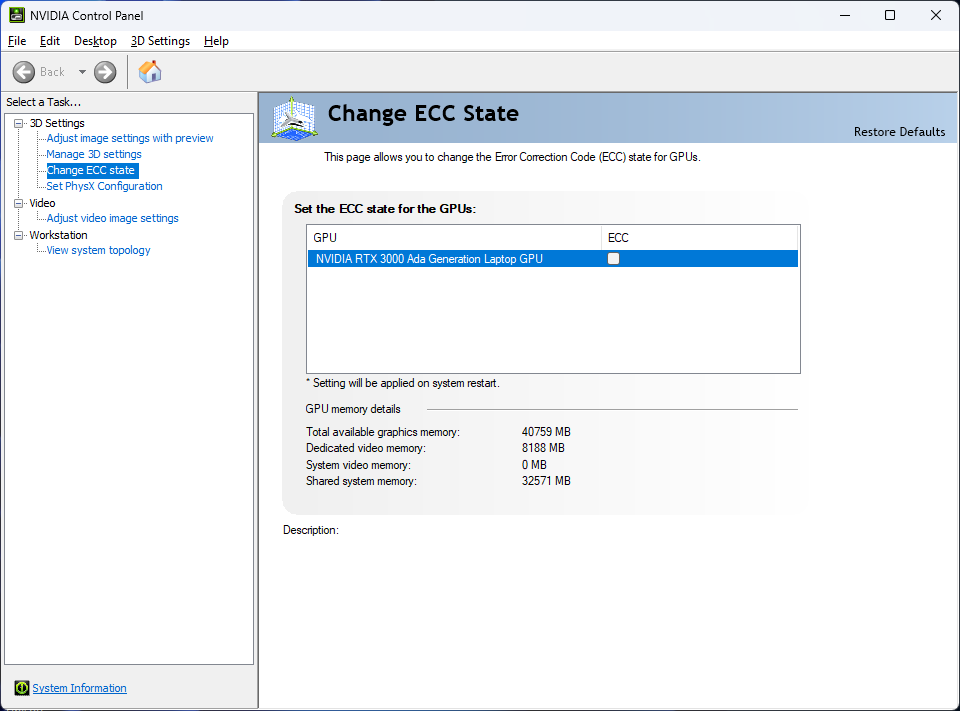
Advanced Optimus, MUX et G-Sync ne sont pas pris en charge sur l'écran interne. Le mode VRAM ECC peut être activé ou désactivé via le panneau de configuration Nvidia, comme sur d'autres GPU RTX de classe station de travail de la génération Ada Lovelace.
Processeur
Notre Core i9-13900H offre des performances multithread jusqu'à 25 à 35 % supérieures à celles du Core i9-12900H de l'ordinateur Precision 5470 de l'année dernière. Cette amélioration notable peut être attribuée aux performances Turbo Boost plus stables du Precision 5480 par rapport au Precision 5470, comme le montrent les résultats de notre test en boucle CineBench R15 xT ci-dessous.
Les performances moyennes sont encore plus lentes que prévu pour un ordinateur portable équipé d'un Core i9-13900H, probablement en raison de la petite taille du Precision 5480. La plus grande carte Precision 5680plus grand, par exemple, est équipé du même processeur, mais ses performances sont environ 15 % plus élevées.
Cinebench R15 Multi Loop
Cinebench R23: Multi Core | Single Core
Cinebench R20: CPU (Multi Core) | CPU (Single Core)
Cinebench R15: CPU Multi 64Bit | CPU Single 64Bit
Blender: v2.79 BMW27 CPU
7-Zip 18.03: 7z b 4 | 7z b 4 -mmt1
Geekbench 5.5: Multi-Core | Single-Core
HWBOT x265 Benchmark v2.2: 4k Preset
LibreOffice : 20 Documents To PDF
R Benchmark 2.5: Overall mean
| CPU Performance rating | |
| Asus ExpertBook B6 Flip B6602FC2 | |
| Dell Precision 5000 5680 | |
| HP ZBook Fury 16 G9 | |
| Dell Precision 5480 | |
| Moyenne Intel Core i9-13900H | |
| Dell Precision 5000 5470 | |
| Lenovo ThinkPad P1 G4-20Y4Z9DVUS | |
| Lenovo ThinkPad P14s G3 AMD 21J6S05000 | |
| HP ZBook Firefly 14 G9-6B8A2EA | |
| Dell Precision 5000 5560 -2! | |
| Lenovo ThinkPad P15v G3 21EM001AGE | |
| Lenovo ThinkPad P15v G2 21A9000XGE -1! | |
| Cinebench R23 / Multi Core | |
| Asus ExpertBook B6 Flip B6602FC2 | |
| HP ZBook Fury 16 G9 | |
| Dell Precision 5000 5680 | |
| Moyenne Intel Core i9-13900H (11997 - 20385, n=28) | |
| Dell Precision 5480 | |
| Dell Precision 5000 5470 | |
| Lenovo ThinkPad P15v G3 21EM001AGE | |
| Lenovo ThinkPad P1 G4-20Y4Z9DVUS | |
| Lenovo ThinkPad P14s G3 AMD 21J6S05000 | |
| Lenovo ThinkPad P15v G2 21A9000XGE | |
| Dell Precision 5000 5560 | |
| HP ZBook Firefly 14 G9-6B8A2EA | |
| Cinebench R23 / Single Core | |
| Dell Precision 5000 5680 | |
| Dell Precision 5480 | |
| HP ZBook Fury 16 G9 | |
| Moyenne Intel Core i9-13900H (1297 - 2054, n=26) | |
| Asus ExpertBook B6 Flip B6602FC2 | |
| Dell Precision 5000 5470 | |
| HP ZBook Firefly 14 G9-6B8A2EA | |
| Lenovo ThinkPad P14s G3 AMD 21J6S05000 | |
| Dell Precision 5000 5560 | |
| Lenovo ThinkPad P1 G4-20Y4Z9DVUS | |
| Lenovo ThinkPad P15v G3 21EM001AGE | |
| Cinebench R20 / CPU (Multi Core) | |
| Asus ExpertBook B6 Flip B6602FC2 | |
| HP ZBook Fury 16 G9 | |
| Dell Precision 5000 5680 | |
| Moyenne Intel Core i9-13900H (4935 - 7716, n=25) | |
| Dell Precision 5480 | |
| Lenovo ThinkPad P15v G3 21EM001AGE | |
| Lenovo ThinkPad P15v G3 21EM001AGE | |
| Lenovo ThinkPad P1 G4-20Y4Z9DVUS | |
| Dell Precision 5000 5470 | |
| Lenovo ThinkPad P14s G3 AMD 21J6S05000 | |
| Dell Precision 5000 5560 | |
| Lenovo ThinkPad P15v G2 21A9000XGE | |
| HP ZBook Firefly 14 G9-6B8A2EA | |
| Cinebench R20 / CPU (Single Core) | |
| Dell Precision 5000 5680 | |
| Dell Precision 5480 | |
| HP ZBook Fury 16 G9 | |
| Asus ExpertBook B6 Flip B6602FC2 | |
| Moyenne Intel Core i9-13900H (428 - 792, n=25) | |
| Dell Precision 5000 5470 | |
| HP ZBook Firefly 14 G9-6B8A2EA | |
| Lenovo ThinkPad P14s G3 AMD 21J6S05000 | |
| Lenovo ThinkPad P1 G4-20Y4Z9DVUS | |
| Dell Precision 5000 5560 | |
| Lenovo ThinkPad P15v G3 21EM001AGE | |
| Lenovo ThinkPad P15v G3 21EM001AGE | |
| Lenovo ThinkPad P15v G2 21A9000XGE | |
| Cinebench R15 / CPU Multi 64Bit | |
| Asus ExpertBook B6 Flip B6602FC2 | |
| Moyenne Intel Core i9-13900H (2061 - 3100, n=26) | |
| HP ZBook Fury 16 G9 | |
| Dell Precision 5480 | |
| Dell Precision 5000 5680 | |
| Dell Precision 5000 5470 | |
| Lenovo ThinkPad P1 G4-20Y4Z9DVUS | |
| Lenovo ThinkPad P15v G3 21EM001AGE | |
| Lenovo ThinkPad P14s G3 AMD 21J6S05000 | |
| Lenovo ThinkPad P15v G2 21A9000XGE | |
| Dell Precision 5000 5560 | |
| HP ZBook Firefly 14 G9-6B8A2EA | |
| Cinebench R15 / CPU Single 64Bit | |
| Dell Precision 5000 5680 | |
| Dell Precision 5480 | |
| Asus ExpertBook B6 Flip B6602FC2 | |
| Moyenne Intel Core i9-13900H (211 - 297, n=26) | |
| HP ZBook Firefly 14 G9-6B8A2EA | |
| Dell Precision 5000 5470 | |
| Lenovo ThinkPad P14s G3 AMD 21J6S05000 | |
| Dell Precision 5000 5560 | |
| Lenovo ThinkPad P1 G4-20Y4Z9DVUS | |
| Lenovo ThinkPad P15v G2 21A9000XGE | |
| HP ZBook Fury 16 G9 | |
| Lenovo ThinkPad P15v G3 21EM001AGE | |
| Blender / v2.79 BMW27 CPU | |
| HP ZBook Firefly 14 G9-6B8A2EA | |
| Lenovo ThinkPad P15v G2 21A9000XGE | |
| Dell Precision 5000 5560 | |
| Lenovo ThinkPad P14s G3 AMD 21J6S05000 | |
| Lenovo ThinkPad P1 G4-20Y4Z9DVUS | |
| Dell Precision 5000 5470 | |
| Lenovo ThinkPad P15v G3 21EM001AGE | |
| Dell Precision 5480 | |
| Moyenne Intel Core i9-13900H (166 - 268, n=24) | |
| Dell Precision 5000 5680 | |
| Asus ExpertBook B6 Flip B6602FC2 | |
| HP ZBook Fury 16 G9 | |
| 7-Zip 18.03 / 7z b 4 | |
| HP ZBook Fury 16 G9 | |
| Asus ExpertBook B6 Flip B6602FC2 | |
| Dell Precision 5000 5680 | |
| Moyenne Intel Core i9-13900H (45045 - 79032, n=25) | |
| Dell Precision 5480 | |
| Lenovo ThinkPad P15v G3 21EM001AGE | |
| Dell Precision 5000 5470 | |
| Lenovo ThinkPad P1 G4-20Y4Z9DVUS | |
| Lenovo ThinkPad P14s G3 AMD 21J6S05000 | |
| Dell Precision 5000 5560 | |
| Lenovo ThinkPad P15v G2 21A9000XGE | |
| HP ZBook Firefly 14 G9-6B8A2EA | |
| 7-Zip 18.03 / 7z b 4 -mmt1 | |
| Asus ExpertBook B6 Flip B6602FC2 | |
| Dell Precision 5000 5680 | |
| Dell Precision 5480 | |
| Moyenne Intel Core i9-13900H (3665 - 6600, n=25) | |
| HP ZBook Fury 16 G9 | |
| Dell Precision 5000 5560 | |
| HP ZBook Firefly 14 G9-6B8A2EA | |
| Lenovo ThinkPad P1 G4-20Y4Z9DVUS | |
| Dell Precision 5000 5470 | |
| Lenovo ThinkPad P15v G3 21EM001AGE | |
| Lenovo ThinkPad P15v G2 21A9000XGE | |
| Lenovo ThinkPad P14s G3 AMD 21J6S05000 | |
| Geekbench 5.5 / Multi-Core | |
| Asus ExpertBook B6 Flip B6602FC2 | |
| Dell Precision 5000 5680 | |
| HP ZBook Fury 16 G9 | |
| Dell Precision 5480 | |
| Moyenne Intel Core i9-13900H (9094 - 15410, n=26) | |
| Dell Precision 5000 5470 | |
| HP ZBook Firefly 14 G9-6B8A2EA | |
| Lenovo ThinkPad P1 G4-20Y4Z9DVUS | |
| Lenovo ThinkPad P15v G3 21EM001AGE | |
| Lenovo ThinkPad P14s G3 AMD 21J6S05000 | |
| Lenovo ThinkPad P15v G2 21A9000XGE | |
| Geekbench 5.5 / Single-Core | |
| Dell Precision 5000 5680 | |
| HP ZBook Fury 16 G9 | |
| Dell Precision 5480 | |
| Moyenne Intel Core i9-13900H (1140 - 2043, n=26) | |
| Asus ExpertBook B6 Flip B6602FC2 | |
| Dell Precision 5000 5470 | |
| HP ZBook Firefly 14 G9-6B8A2EA | |
| Lenovo ThinkPad P1 G4-20Y4Z9DVUS | |
| Lenovo ThinkPad P14s G3 AMD 21J6S05000 | |
| Lenovo ThinkPad P15v G2 21A9000XGE | |
| Lenovo ThinkPad P15v G3 21EM001AGE | |
| HWBOT x265 Benchmark v2.2 / 4k Preset | |
| Asus ExpertBook B6 Flip B6602FC2 | |
| Dell Precision 5000 5680 | |
| HP ZBook Fury 16 G9 | |
| Moyenne Intel Core i9-13900H (14.1 - 22.3, n=25) | |
| Dell Precision 5480 | |
| Lenovo ThinkPad P1 G4-20Y4Z9DVUS | |
| Dell Precision 5000 5470 | |
| Lenovo ThinkPad P14s G3 AMD 21J6S05000 | |
| Lenovo ThinkPad P15v G3 21EM001AGE | |
| Dell Precision 5000 5560 | |
| Lenovo ThinkPad P15v G2 21A9000XGE | |
| HP ZBook Firefly 14 G9-6B8A2EA | |
| LibreOffice / 20 Documents To PDF | |
| Lenovo ThinkPad P15v G3 21EM001AGE | |
| Lenovo ThinkPad P14s G3 AMD 21J6S05000 | |
| Lenovo ThinkPad P15v G2 21A9000XGE | |
| Lenovo ThinkPad P1 G4-20Y4Z9DVUS | |
| Dell Precision 5000 5560 | |
| Moyenne Intel Core i9-13900H (34.4 - 82.8, n=25) | |
| Dell Precision 5000 5470 | |
| Dell Precision 5480 | |
| HP ZBook Firefly 14 G9-6B8A2EA | |
| Asus ExpertBook B6 Flip B6602FC2 | |
| Dell Precision 5000 5680 | |
| HP ZBook Fury 16 G9 | |
| R Benchmark 2.5 / Overall mean | |
| Lenovo ThinkPad P15v G2 21A9000XGE | |
| Lenovo ThinkPad P1 G4-20Y4Z9DVUS | |
| Dell Precision 5000 5560 | |
| Lenovo ThinkPad P14s G3 AMD 21J6S05000 | |
| Lenovo ThinkPad P15v G3 21EM001AGE | |
| HP ZBook Firefly 14 G9-6B8A2EA | |
| Dell Precision 5000 5470 | |
| Dell Precision 5480 | |
| Asus ExpertBook B6 Flip B6602FC2 | |
| Moyenne Intel Core i9-13900H (0.4052 - 0.723, n=25) | |
| HP ZBook Fury 16 G9 | |
| Dell Precision 5000 5680 | |
* ... Moindre est la valeur, meilleures sont les performances
AIDA64: FP32 Ray-Trace | FPU Julia | CPU SHA3 | CPU Queen | FPU SinJulia | FPU Mandel | CPU AES | CPU ZLib | FP64 Ray-Trace | CPU PhotoWorxx
| Performance rating | |
| Lenovo ThinkPad P15v G3 21EM001AGE | |
| Dell Precision 5480 | |
| Moyenne Intel Core i9-13900H | |
| Lenovo ThinkPad P14s G3 AMD 21J6S05000 | |
| Dell Precision 5000 5470 | |
| HP ZBook Firefly 14 G9-6B8A2EA | |
| AIDA64 / FP32 Ray-Trace | |
| Dell Precision 5480 | |
| Moyenne Intel Core i9-13900H (6788 - 19557, n=25) | |
| Lenovo ThinkPad P15v G3 21EM001AGE | |
| Dell Precision 5000 5470 | |
| Lenovo ThinkPad P14s G3 AMD 21J6S05000 | |
| HP ZBook Firefly 14 G9-6B8A2EA | |
| AIDA64 / FPU Julia | |
| Lenovo ThinkPad P15v G3 21EM001AGE | |
| Lenovo ThinkPad P14s G3 AMD 21J6S05000 | |
| Dell Precision 5480 | |
| Moyenne Intel Core i9-13900H (22551 - 95579, n=25) | |
| Dell Precision 5000 5470 | |
| HP ZBook Firefly 14 G9-6B8A2EA | |
| AIDA64 / CPU SHA3 | |
| Moyenne Intel Core i9-13900H (2491 - 4270, n=25) | |
| Dell Precision 5480 | |
| Lenovo ThinkPad P15v G3 21EM001AGE | |
| Dell Precision 5000 5470 | |
| Lenovo ThinkPad P14s G3 AMD 21J6S05000 | |
| HP ZBook Firefly 14 G9-6B8A2EA | |
| AIDA64 / CPU Queen | |
| Dell Precision 5480 | |
| Dell Precision 5000 5470 | |
| Moyenne Intel Core i9-13900H (65121 - 120936, n=25) | |
| Lenovo ThinkPad P15v G3 21EM001AGE | |
| Lenovo ThinkPad P14s G3 AMD 21J6S05000 | |
| HP ZBook Firefly 14 G9-6B8A2EA | |
| AIDA64 / FPU SinJulia | |
| Lenovo ThinkPad P15v G3 21EM001AGE | |
| Lenovo ThinkPad P14s G3 AMD 21J6S05000 | |
| Dell Precision 5480 | |
| Moyenne Intel Core i9-13900H (6108 - 11631, n=25) | |
| Dell Precision 5000 5470 | |
| HP ZBook Firefly 14 G9-6B8A2EA | |
| AIDA64 / FPU Mandel | |
| Lenovo ThinkPad P15v G3 21EM001AGE | |
| Lenovo ThinkPad P14s G3 AMD 21J6S05000 | |
| Dell Precision 5480 | |
| Moyenne Intel Core i9-13900H (11283 - 48474, n=25) | |
| Dell Precision 5000 5470 | |
| HP ZBook Firefly 14 G9-6B8A2EA | |
| AIDA64 / CPU AES | |
| Lenovo ThinkPad P15v G3 21EM001AGE | |
| Moyenne Intel Core i9-13900H (3691 - 149377, n=25) | |
| Dell Precision 5480 | |
| Lenovo ThinkPad P14s G3 AMD 21J6S05000 | |
| HP ZBook Firefly 14 G9-6B8A2EA | |
| Dell Precision 5000 5470 | |
| AIDA64 / CPU ZLib | |
| Moyenne Intel Core i9-13900H (789 - 1254, n=25) | |
| Dell Precision 5480 | |
| Lenovo ThinkPad P15v G3 21EM001AGE | |
| Lenovo ThinkPad P14s G3 AMD 21J6S05000 | |
| HP ZBook Firefly 14 G9-6B8A2EA | |
| Dell Precision 5000 5470 | |
| AIDA64 / FP64 Ray-Trace | |
| Moyenne Intel Core i9-13900H (3655 - 10716, n=25) | |
| Dell Precision 5480 | |
| Lenovo ThinkPad P15v G3 21EM001AGE | |
| Dell Precision 5000 5470 | |
| Lenovo ThinkPad P14s G3 AMD 21J6S05000 | |
| HP ZBook Firefly 14 G9-6B8A2EA | |
| AIDA64 / CPU PhotoWorxx | |
| Dell Precision 5480 | |
| Dell Precision 5000 5470 | |
| HP ZBook Firefly 14 G9-6B8A2EA | |
| Moyenne Intel Core i9-13900H (10871 - 50488, n=25) | |
| Lenovo ThinkPad P14s G3 AMD 21J6S05000 | |
| Lenovo ThinkPad P15v G3 21EM001AGE | |
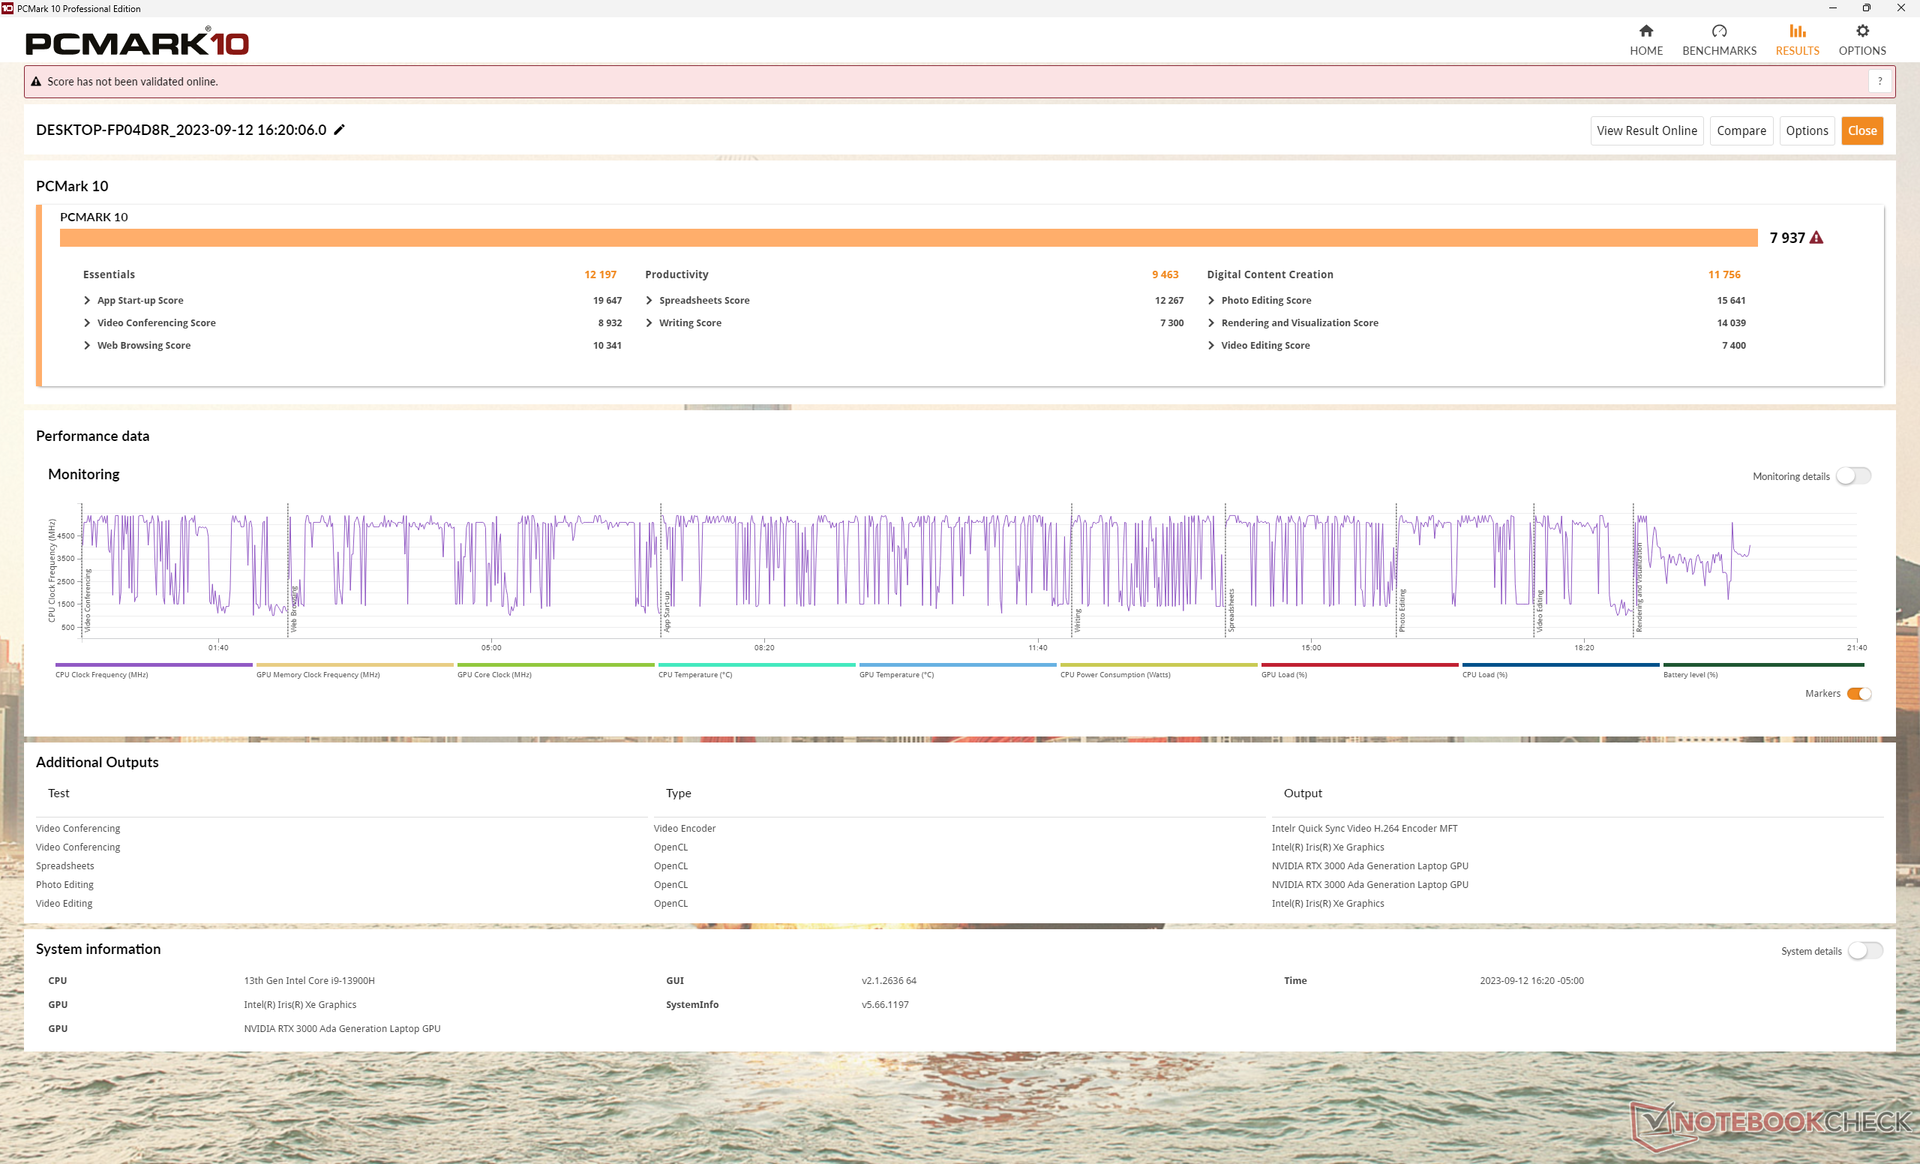
Performance du système
Les scores PCMark sont plus élevés que ceux des autres stations de travail de 14 pouces que nous avons testées jusqu'à présent. Une grande partie de ce gain peut être attribuée au nouveau GPU RTX 3000 Ada qui offre des avantages significatifs en termes de performances par rapport aux options Ampere de l'année dernière, comme le montre notre section sur les performances du GPU ci-dessous.
CrossMark: Overall | Productivity | Creativity | Responsiveness
| PCMark 10 / Score | |
| Dell Precision 5480 | |
| Dell Precision 5000 5470 | |
| Dell Precision 5000 5560 | |
| Lenovo ThinkPad P15 G2-20YQ001JGE | |
| Lenovo ThinkPad P15v G3 21EM001AGE | |
| HP ZBook Firefly 14 G9-6B8A2EA | |
| Lenovo ThinkPad P14s G3 AMD 21J6S05000 | |
| PCMark 10 / Essentials | |
| Dell Precision 5480 | |
| Dell Precision 5000 5470 | |
| Dell Precision 5000 5560 | |
| Lenovo ThinkPad P15 G2-20YQ001JGE | |
| HP ZBook Firefly 14 G9-6B8A2EA | |
| Lenovo ThinkPad P15v G3 21EM001AGE | |
| Lenovo ThinkPad P14s G3 AMD 21J6S05000 | |
| PCMark 10 / Productivity | |
| HP ZBook Firefly 14 G9-6B8A2EA | |
| Dell Precision 5480 | |
| Dell Precision 5000 5560 | |
| Lenovo ThinkPad P15v G3 21EM001AGE | |
| Dell Precision 5000 5470 | |
| Lenovo ThinkPad P14s G3 AMD 21J6S05000 | |
| Lenovo ThinkPad P15 G2-20YQ001JGE | |
| PCMark 10 / Digital Content Creation | |
| Dell Precision 5480 | |
| Dell Precision 5000 5470 | |
| Lenovo ThinkPad P15 G2-20YQ001JGE | |
| Lenovo ThinkPad P15v G3 21EM001AGE | |
| Dell Precision 5000 5560 | |
| Lenovo ThinkPad P14s G3 AMD 21J6S05000 | |
| HP ZBook Firefly 14 G9-6B8A2EA | |
| CrossMark / Overall | |
| Dell Precision 5480 | |
| Dell Precision 5000 5470 | |
| HP ZBook Firefly 14 G9-6B8A2EA | |
| Lenovo ThinkPad P15v G3 21EM001AGE | |
| Lenovo ThinkPad P14s G3 AMD 21J6S05000 | |
| CrossMark / Productivity | |
| Dell Precision 5480 | |
| Dell Precision 5000 5470 | |
| HP ZBook Firefly 14 G9-6B8A2EA | |
| Lenovo ThinkPad P15v G3 21EM001AGE | |
| Lenovo ThinkPad P14s G3 AMD 21J6S05000 | |
| CrossMark / Creativity | |
| Dell Precision 5480 | |
| Dell Precision 5000 5470 | |
| HP ZBook Firefly 14 G9-6B8A2EA | |
| Lenovo ThinkPad P15v G3 21EM001AGE | |
| Lenovo ThinkPad P14s G3 AMD 21J6S05000 | |
| CrossMark / Responsiveness | |
| Dell Precision 5480 | |
| Dell Precision 5000 5470 | |
| HP ZBook Firefly 14 G9-6B8A2EA | |
| Lenovo ThinkPad P15v G3 21EM001AGE | |
| Lenovo ThinkPad P14s G3 AMD 21J6S05000 | |
| PCMark 10 Score | 7937 points | |
Aide | ||
| AIDA64 / Memory Copy | |
| Dell Precision 5480 | |
| Dell Precision 5000 5470 | |
| Moyenne Intel Core i9-13900H (37448 - 74486, n=25) | |
| HP ZBook Firefly 14 G9-6B8A2EA | |
| Lenovo ThinkPad P14s G3 AMD 21J6S05000 | |
| Lenovo ThinkPad P15v G3 21EM001AGE | |
| AIDA64 / Memory Read | |
| Dell Precision 5000 5470 | |
| Dell Precision 5480 | |
| HP ZBook Firefly 14 G9-6B8A2EA | |
| Moyenne Intel Core i9-13900H (41599 - 75433, n=25) | |
| Lenovo ThinkPad P14s G3 AMD 21J6S05000 | |
| Lenovo ThinkPad P15v G3 21EM001AGE | |
| AIDA64 / Memory Write | |
| Dell Precision 5480 | |
| Moyenne Intel Core i9-13900H (36152 - 88505, n=25) | |
| HP ZBook Firefly 14 G9-6B8A2EA | |
| Dell Precision 5000 5470 | |
| Lenovo ThinkPad P14s G3 AMD 21J6S05000 | |
| Lenovo ThinkPad P15v G3 21EM001AGE | |
| AIDA64 / Memory Latency | |
| Lenovo ThinkPad P14s G3 AMD 21J6S05000 | |
| Dell Precision 5000 5470 | |
| Lenovo ThinkPad P15v G3 21EM001AGE | |
| Dell Precision 5480 | |
| Moyenne Intel Core i9-13900H (75.8 - 102.3, n=25) | |
| HP ZBook Firefly 14 G9-6B8A2EA | |
* ... Moindre est la valeur, meilleures sont les performances
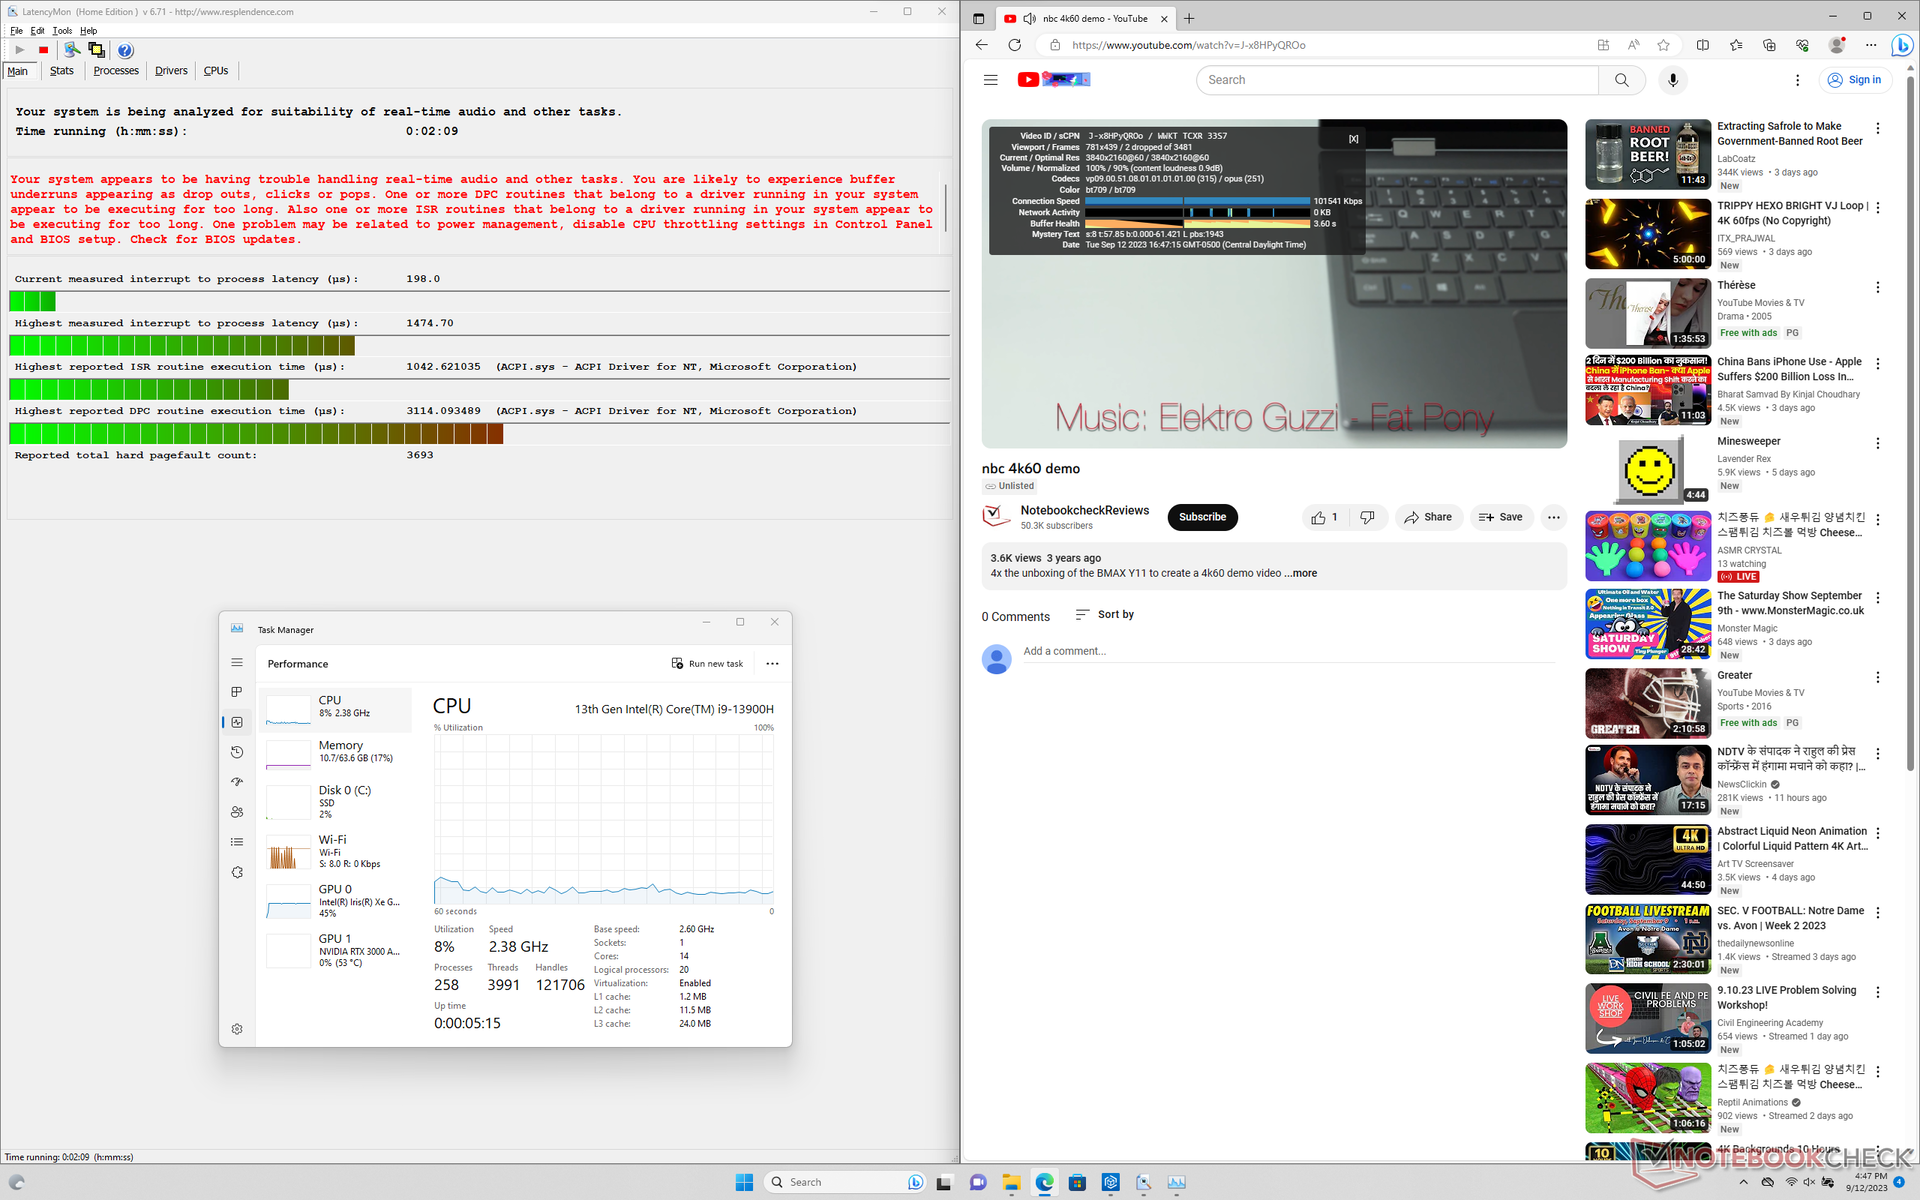
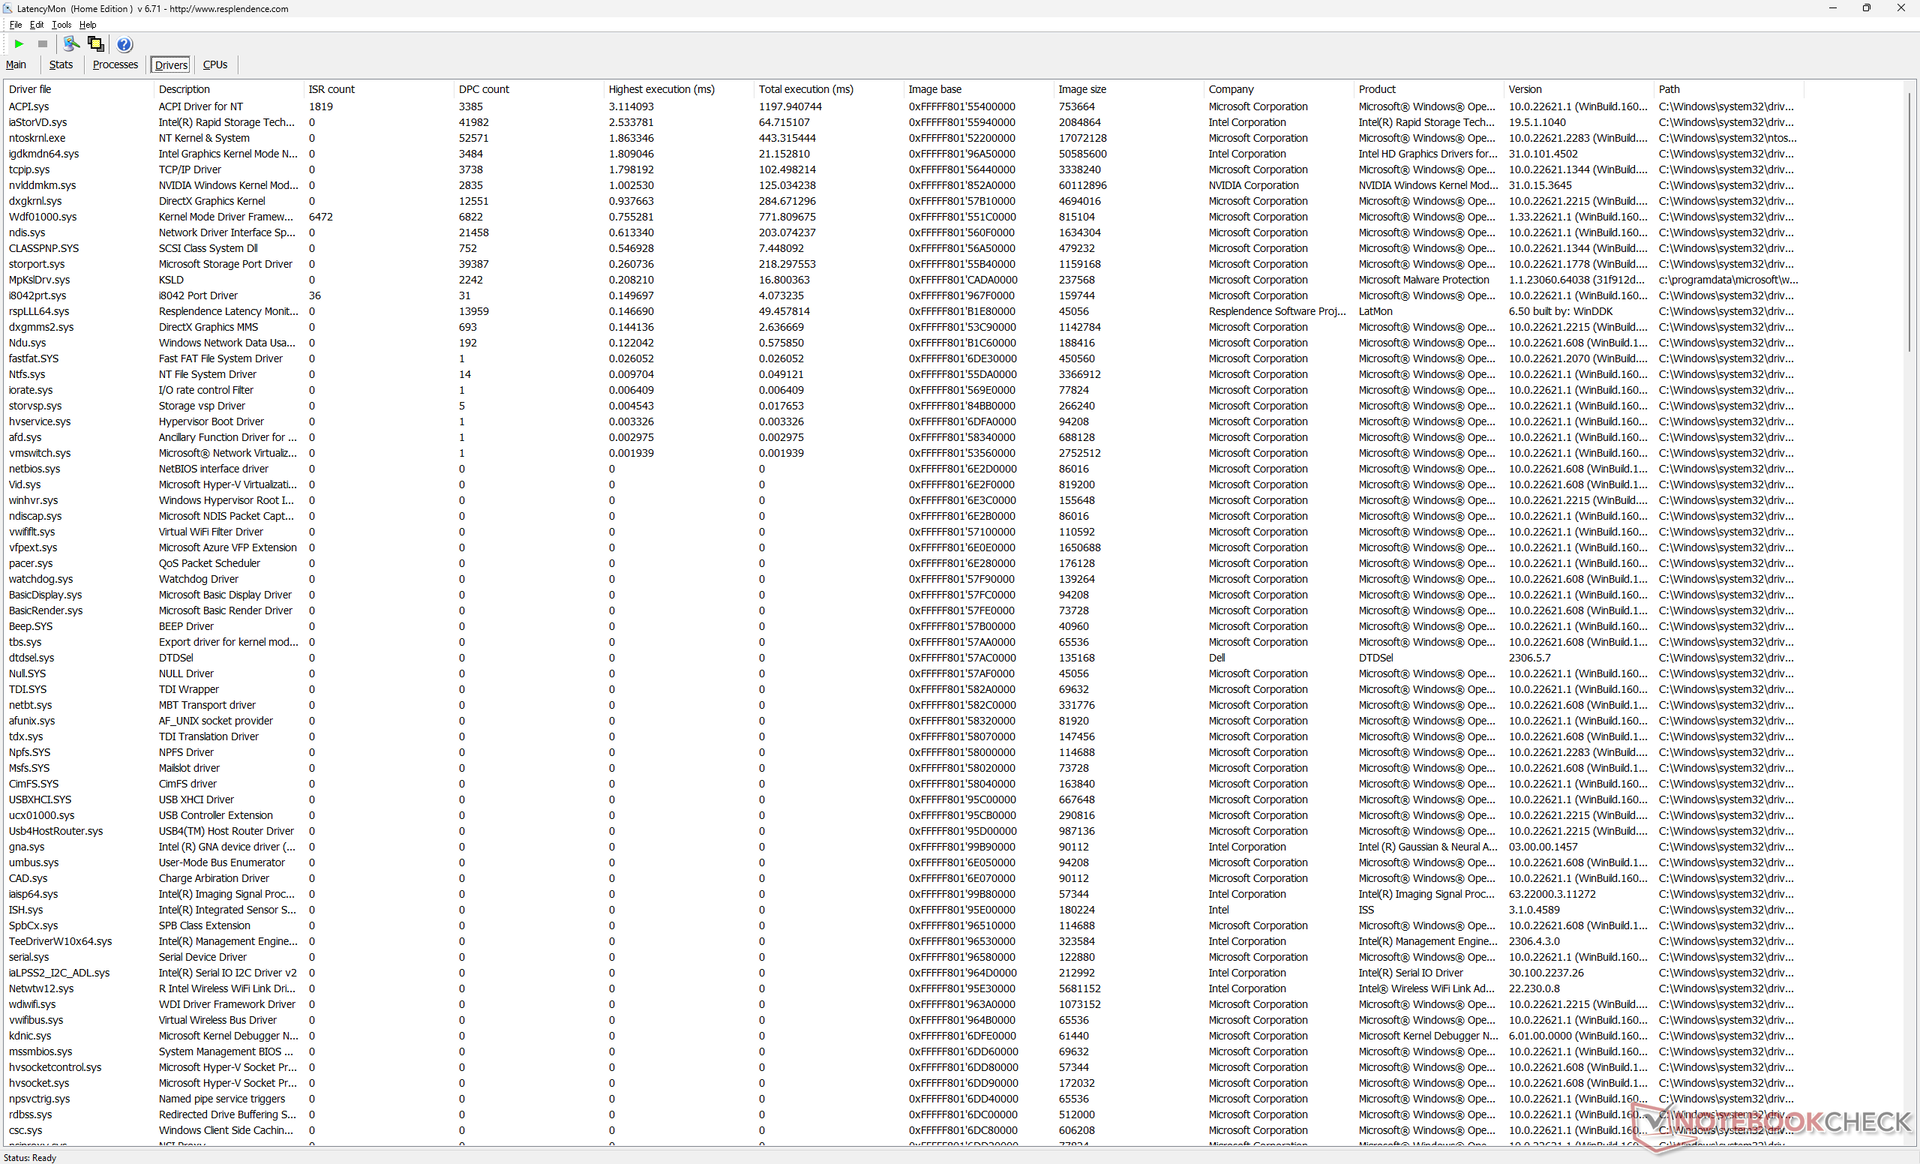
Latence DPC
LatencyMon révèle des problèmes de DPC lors de l'ouverture de plusieurs onglets de notre page d'accueil. Nous avons également pu enregistrer 2 images perdues au cours d'une vidéo 4K60 d'une minute, ce qui est regrettable sur un poste de travail mobile.
| DPC Latencies / LatencyMon - interrupt to process latency (max), Web, Youtube, Prime95 | |
| Dell Precision 5480 | |
| Dell Precision 5000 5470 | |
| Lenovo ThinkPad P14s G3 AMD 21J6S05000 | |
| Dell Precision 5000 5560 | |
| Lenovo ThinkPad P15v G3 21EM001AGE | |
* ... Moindre est la valeur, meilleures sont les performances
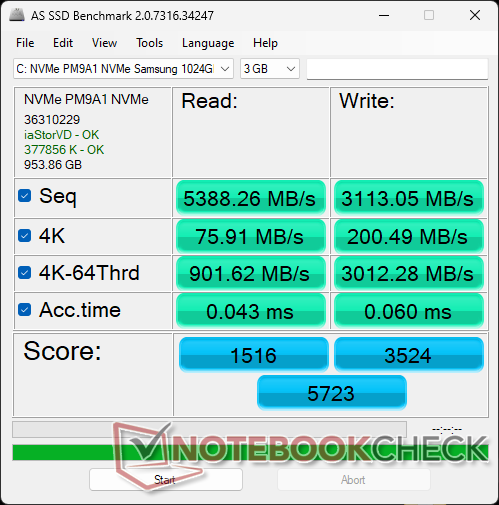
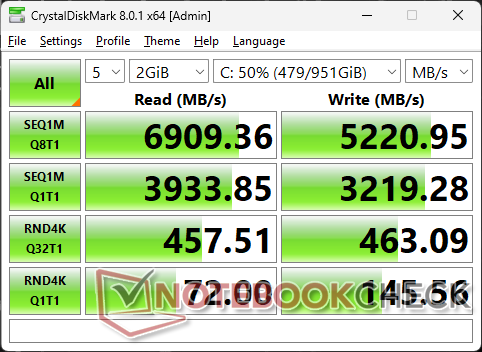
Dispositifs de stockage
Dell semble utiliser Samsung PM9A1 SSD Samsung PM9A1 pour la plupart de ses modèles Precision, y compris les Precision 5470 et 5560. Les taux de transfert maximum sont stables à environ 6900 MB/s sans problème d'étranglement.
Dell propose en option des disques à cryptage automatique, mais le modèle ne peut prendre en charge qu'un seul disque SSD interne.

| Drive Performance rating - Percent | |
| Lenovo ThinkPad P14s G3 AMD 21J6S05000 | |
| Moyenne Samsung PM9A1 MZVL21T0HCLR | |
| Dell Precision 5000 5560 | |
| Dell Precision 5480 | |
| Lenovo ThinkPad P15v G3 21EM001AGE | |
| Dell Precision 5000 5470 | |
| HP ZBook Firefly 14 G9-6B8A2EA -11! | |
* ... Moindre est la valeur, meilleures sont les performances
Disk Throttling: DiskSpd Read Loop, Queue Depth 8
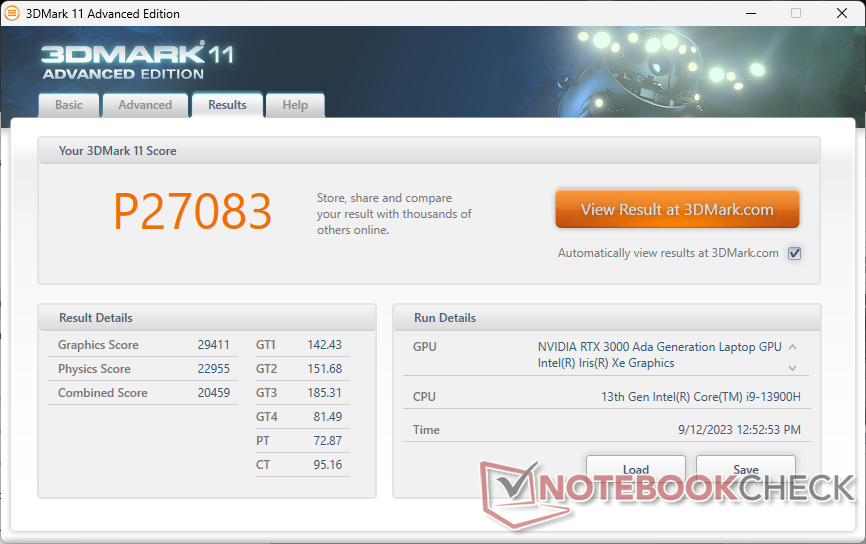
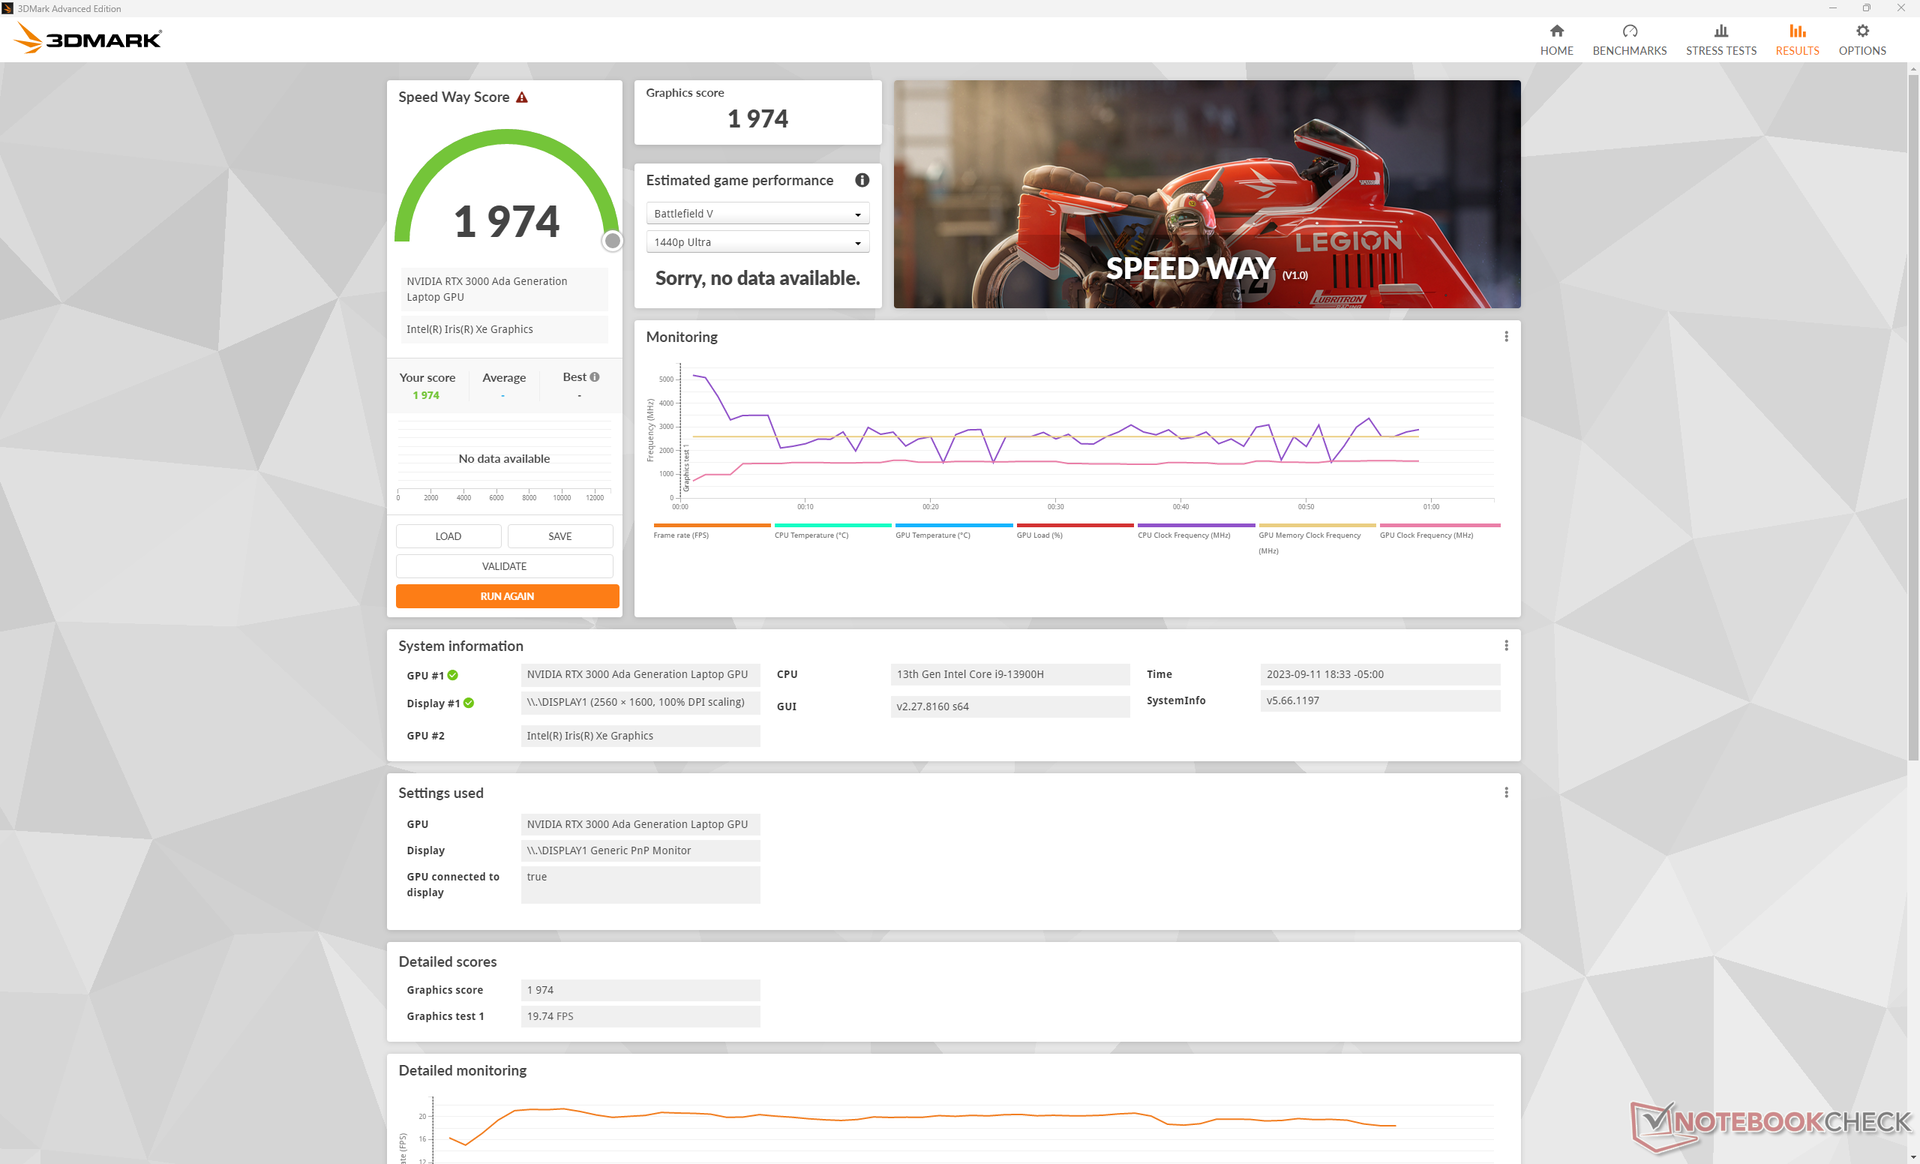
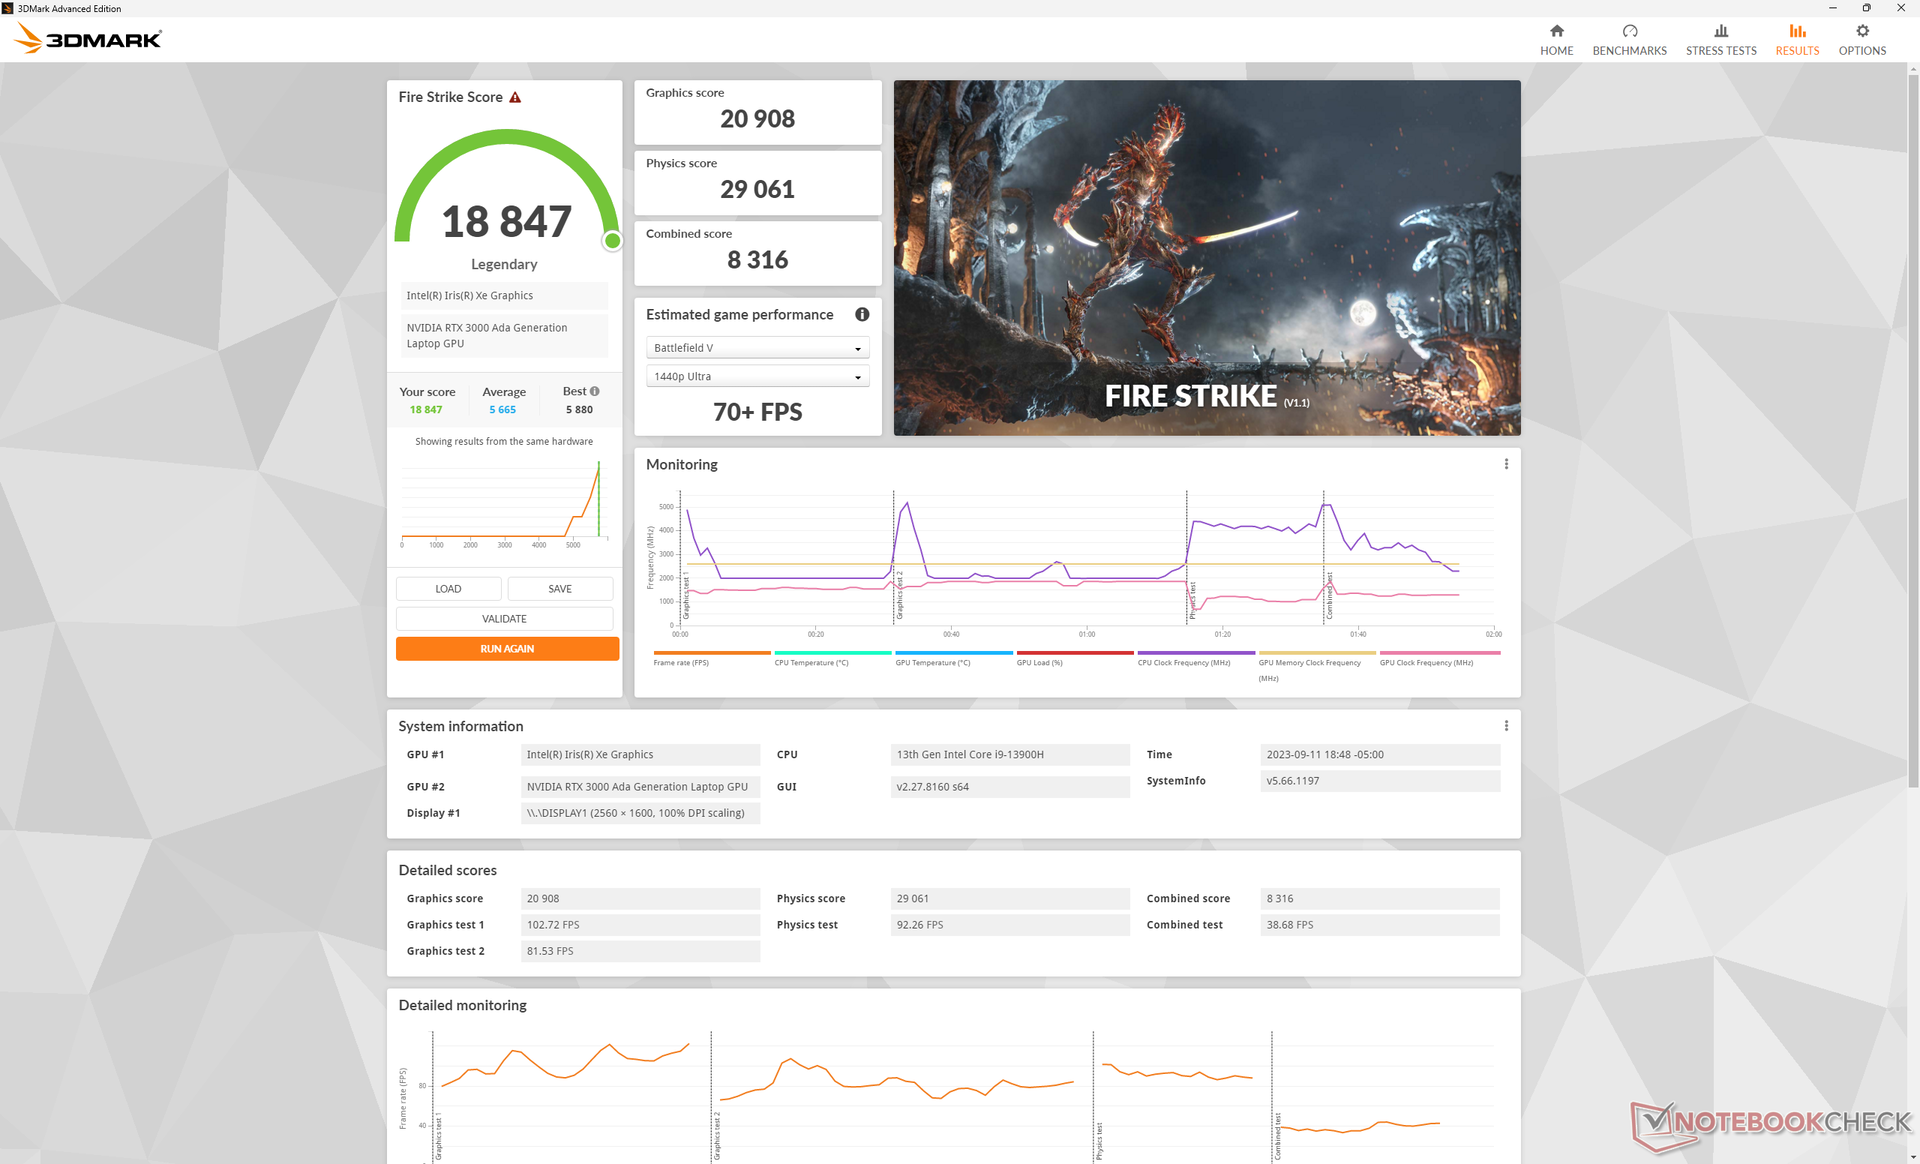
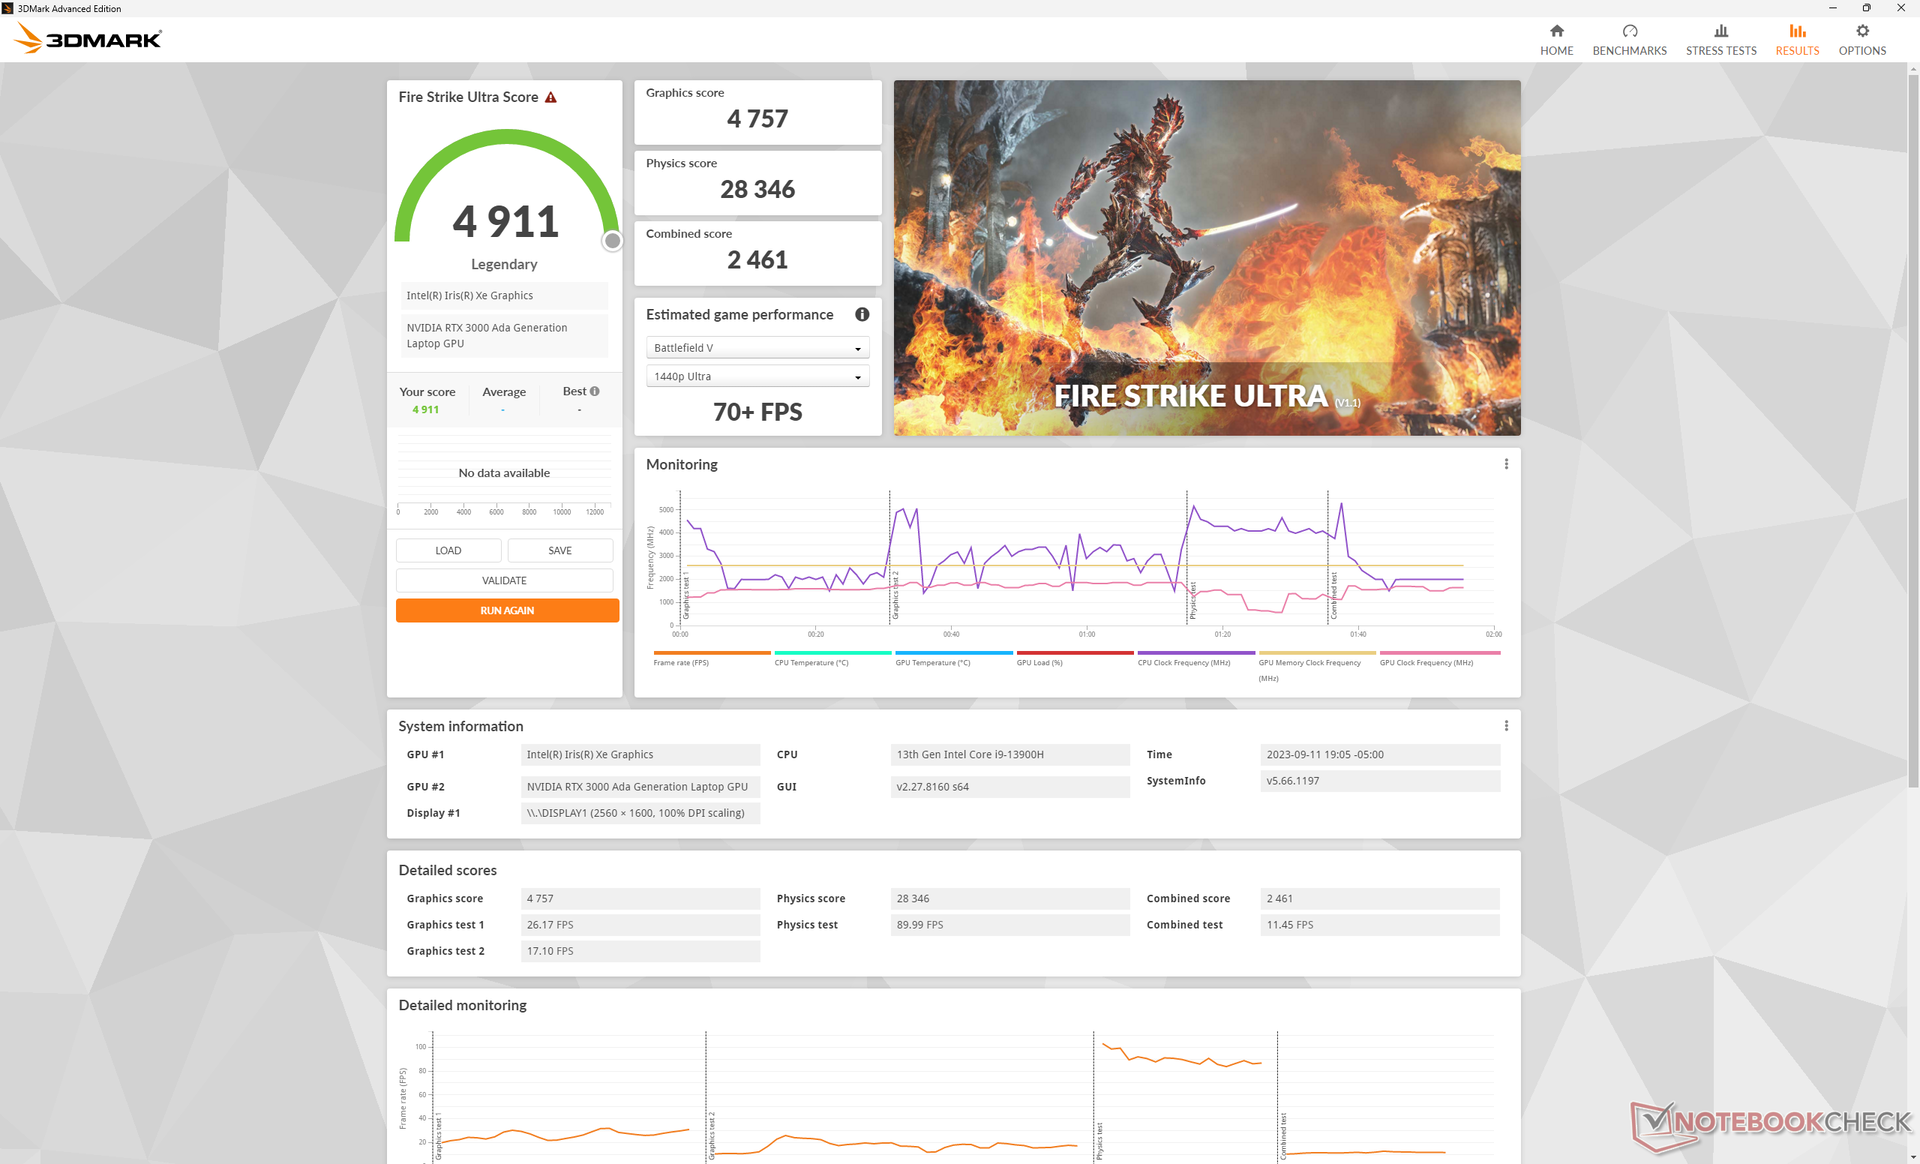
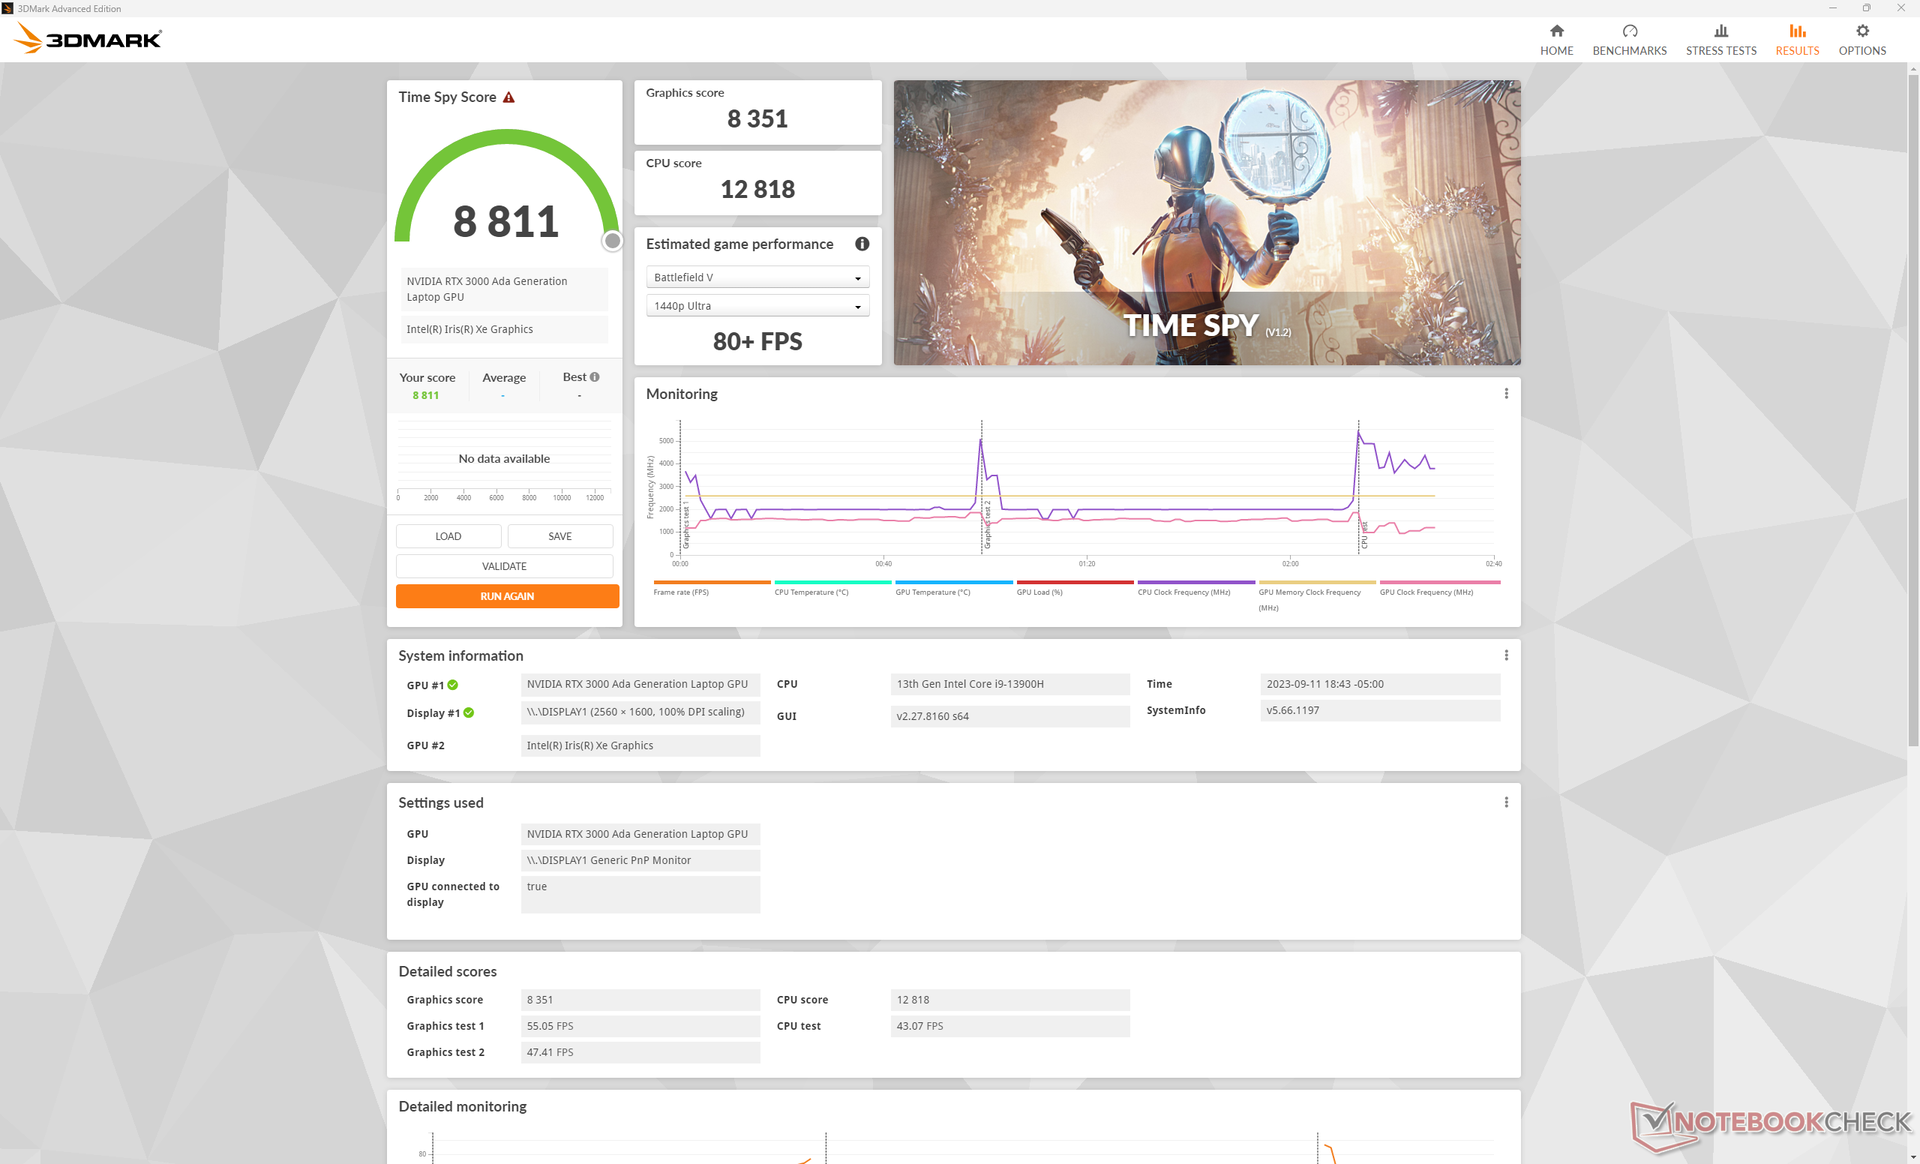
Performance du GPU
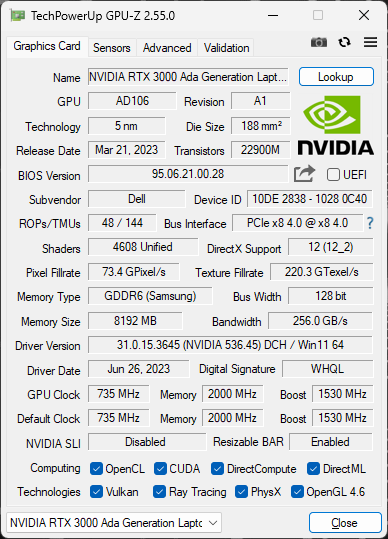
La RTX 3000 Ada est environ 60 à 80 % plus rapide que la RTX A1000 sur le site Precision 5470 de l'année dernière ou de 10 à 15 % plus rapide que la RTX A3000 qu'elle remplace directement. Le nouveau GPU vise un TGP légèrement plus élevé de 50 W alors que le GPU du Precision 5470 était limité à 40 W.
La RTX A1000 de la dernière génération est toujours configurable sur le Precision 5480, mais la RTX 3000 Ada est fortement recommandée pour ses performances accrues. Le nouveau GPU Ada n'est que légèrement en retrait par rapport à l'ancien GPU ampère RTX A5500 que l'on trouve sur des stations de travail beaucoup plus grandes comme leHP ZBook Fury 16 G9.
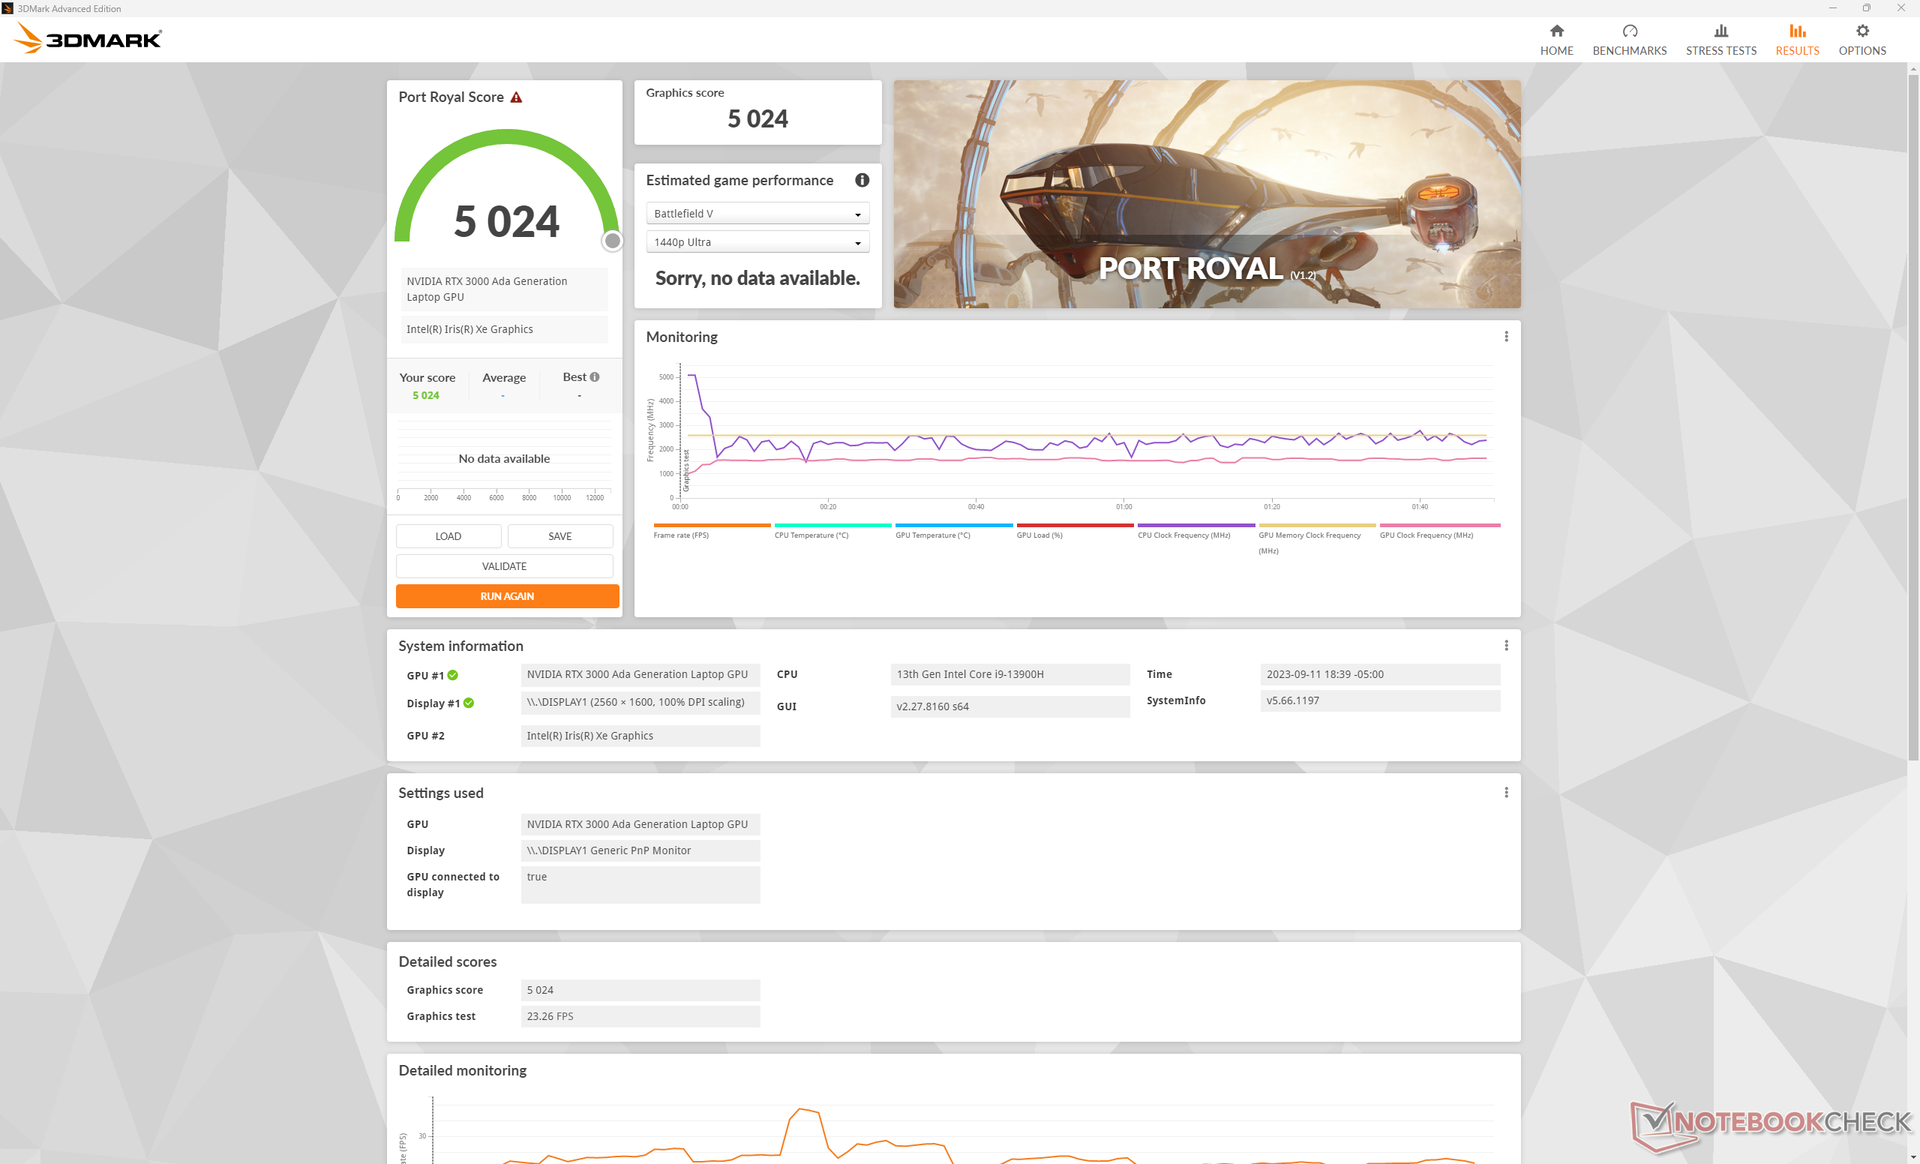
L'exécution en mode équilibré a plus d'impact sur les performances du CPU que sur celles du GPU, comme le montrent les résultats de notre site Fire Strike dans le tableau ci-dessous. Les déficits sont relativement mineurs et se situent dans un pourcentage à un chiffre, même en mode batterie.
Il est intéressant de noter que deux sous-tests de SpecViewPerf 12 (énergie et médical) plantaient toujours sur notre appareil et que ces scores ont donc été omis dans les graphiques ci-dessous.
| Profil de puissance | Score physique | Score graphique | Score combiné |
| Mode Performance | 29061 | 20908 | 8316 |
| Mode équilibré | 26880 (-8%) | 20411 (-2%) | 7633 (-8%) |
| Mode batterie | 27852 (-4%) | 19755 (-6%) | 7569 (-9%) |
| 3DMark 11 - 1280x720 Performance GPU | |
| Dell Precision 5000 5680 | |
| HP ZBook Fury 16 G9 | |
| Moyenne NVIDIA RTX 3000 Ada Generation Laptop (28283 - 33802, n=3) | |
| Dell Precision 5480 | |
| Lenovo ThinkPad P15 G2-20YQ001JGE | |
| Asus ExpertBook B6 Flip B6602FC2 | |
| Dell Precision 5000 5560 | |
| Lenovo ThinkPad P15v G3 21EM001AGE | |
| Dell Precision 5000 5470 | |
| Lenovo ThinkPad P1 G4-20Y4Z9DVUS | |
| Lenovo ThinkPad P15v G2 21A9000XGE | |
| Lenovo ThinkPad P14s G3 AMD 21J6S05000 | |
| HP ZBook Firefly 14 G9-6B8A2EA | |
| 3DMark 11 Performance | 27083 points | |
| 3DMark Fire Strike Score | 18847 points | |
| 3DMark Time Spy Score | 8811 points | |
Aide | ||
* ... Moindre est la valeur, meilleures sont les performances
Performance des jeux
Les performances de jeu sont très similaires à celles des ordinateurs portables fonctionnant avec la RTX 4060 ( GeForce ), comme le récent Inspiron 16 Plus 7630. Notre station de travail est capable de faire tourner des titres exigeants comme Cyberpunk 2077 en 1080p très bien alors que le QHD+ natif nécessitera des paramètres plus bas ou DLSS pour maintenir les taux d'images à flot.
Witcher 3 FPS Chart
| Bas | Moyen | Élevé | Ultra | |
|---|---|---|---|---|
| GTA V (2015) | 183.2 | 177 | 164.1 | 88.2 |
| The Witcher 3 (2015) | 364.1 | 242.5 | 150.1 | 78.7 |
| Dota 2 Reborn (2015) | 175.7 | 160.8 | 151.5 | 142.9 |
| Final Fantasy XV Benchmark (2018) | 155.1 | 108 | 78.9 | |
| X-Plane 11.11 (2018) | 152 | 126.8 | 102 | |
| Far Cry 5 (2018) | 155 | 116 | 106 | 101 |
| Strange Brigade (2018) | 400 | 191.3 | 160.1 | 140.7 |
| Cyberpunk 2077 1.6 (2022) | 92.3 | 72.4 | 61.2 | 56.2 |
| Tiny Tina's Wonderlands (2022) | 156 | 131.4 | 88 | 69 |
| F1 22 (2022) | 162.7 | 159.6 | 133.4 | 51.1 |
Émissions
Bruit du système
Le bruit et le comportement du ventilateur n'ont pas vraiment changé par rapport au modèle de l'année dernière. Des charges plus élevées équivalentes à des jeux induisent un bruit de ventilateur d'un peu plus de 50 dB(A), ce qui en fait l'une des stations de travail de 14 pouces les plus bruyantes du marché. Il est intéressant de noter que ce maximum reste le même en mode équilibré et en mode performance, et qu'il n'y a donc que peu ou pas d'avantage à fonctionner en mode équilibré en termes de bruit.
Degré de la nuisance sonore
| Au repos |
| 23.5 / 23.5 / 23.5 dB(A) |
| Fortement sollicité |
| 39.9 / 51 dB(A) |
 | ||
30 dB silencieux 40 dB(A) audible 50 dB(A) bruyant |
||
min: | ||
| Dell Precision 5480 RTX 3000 Ada Generation Laptop, i9-13900H, Samsung PM9A1 MZVL21T0HCLR | Dell Precision 5000 5470 RTX A1000 Laptop GPU, i9-12900H, Samsung PM9A1 MZVL21T0HCLR | Dell Precision 5000 5560 RTX A2000 Laptop GPU, i7-11850H, Samsung PM9A1 MZVL22T0HBLB | Lenovo ThinkPad P14s G3 AMD 21J6S05000 Radeon 680M, R7 PRO 6850U, Samsung PM9A1 MZVL21T0HCLR | HP ZBook Firefly 14 G9-6B8A2EA T550 Laptop GPU, i7-1265U, Micron 3400 1TB MTFDKBA1T0TFH | Lenovo ThinkPad P15v G3 21EM001AGE RTX A2000 Laptop GPU, R7 PRO 6850H, SK Hynix PC711 1TB HFS001TDE9X081N | |
|---|---|---|---|---|---|---|
| Noise | -2% | 11% | 11% | 4% | 9% | |
| arrêt / environnement * (dB) | 23.5 | 23 2% | 23.4 -0% | 22.9 3% | 23.6 -0% | 23.2 1% |
| Idle Minimum * (dB) | 23.5 | 23.3 1% | 23.6 -0% | 22.9 3% | 23.6 -0% | 23.2 1% |
| Idle Average * (dB) | 23.5 | 23.3 1% | 23.6 -0% | 22.9 3% | 23.6 -0% | 23.2 1% |
| Idle Maximum * (dB) | 23.5 | 23.3 1% | 23.6 -0% | 22.9 3% | 23.6 -0% | 23.2 1% |
| Load Average * (dB) | 39.9 | 48.5 -22% | 25.8 35% | 30.8 23% | 42.5 -7% | 35 12% |
| Witcher 3 ultra * (dB) | 50.1 | 48.6 3% | 40.1 20% | 39.4 21% | 42.5 15% | 37.9 24% |
| Load Maximum * (dB) | 51 | 50.4 1% | 41.4 19% | 39.5 23% | 42.5 17% | 37.5 26% |
* ... Moindre est la valeur, meilleures sont les performances
Température
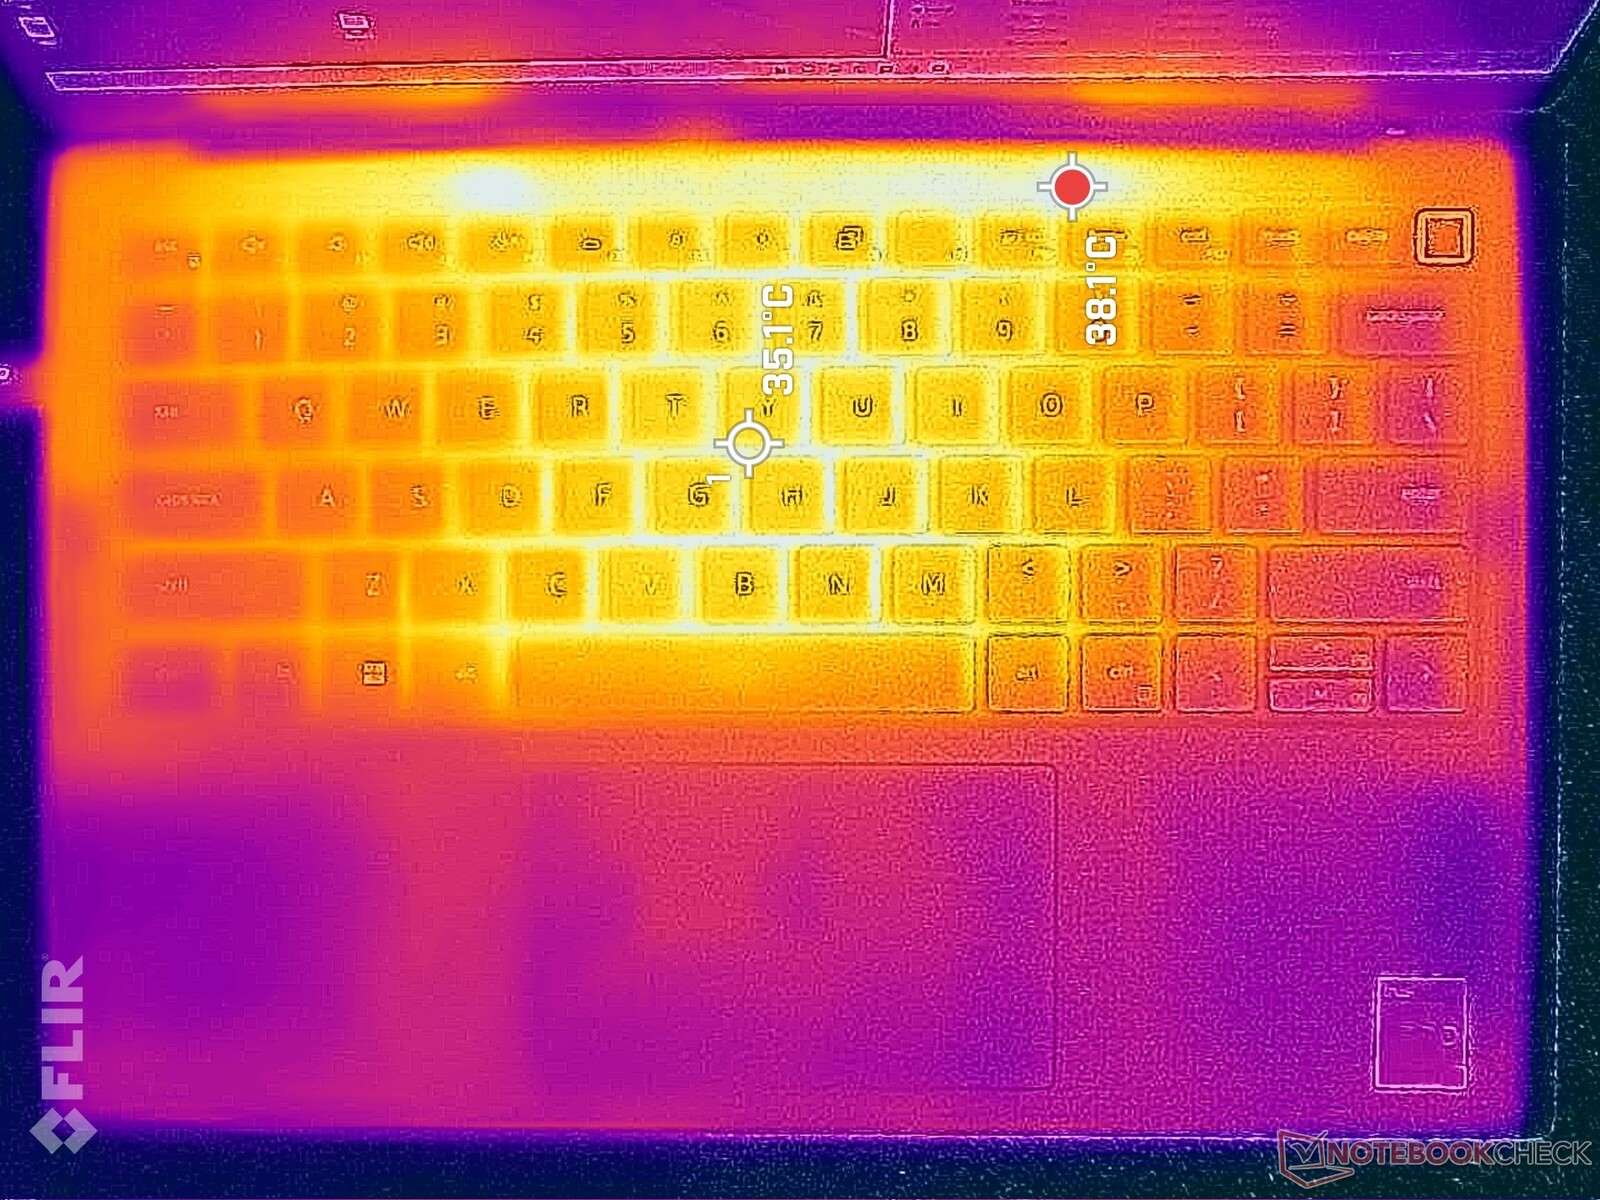
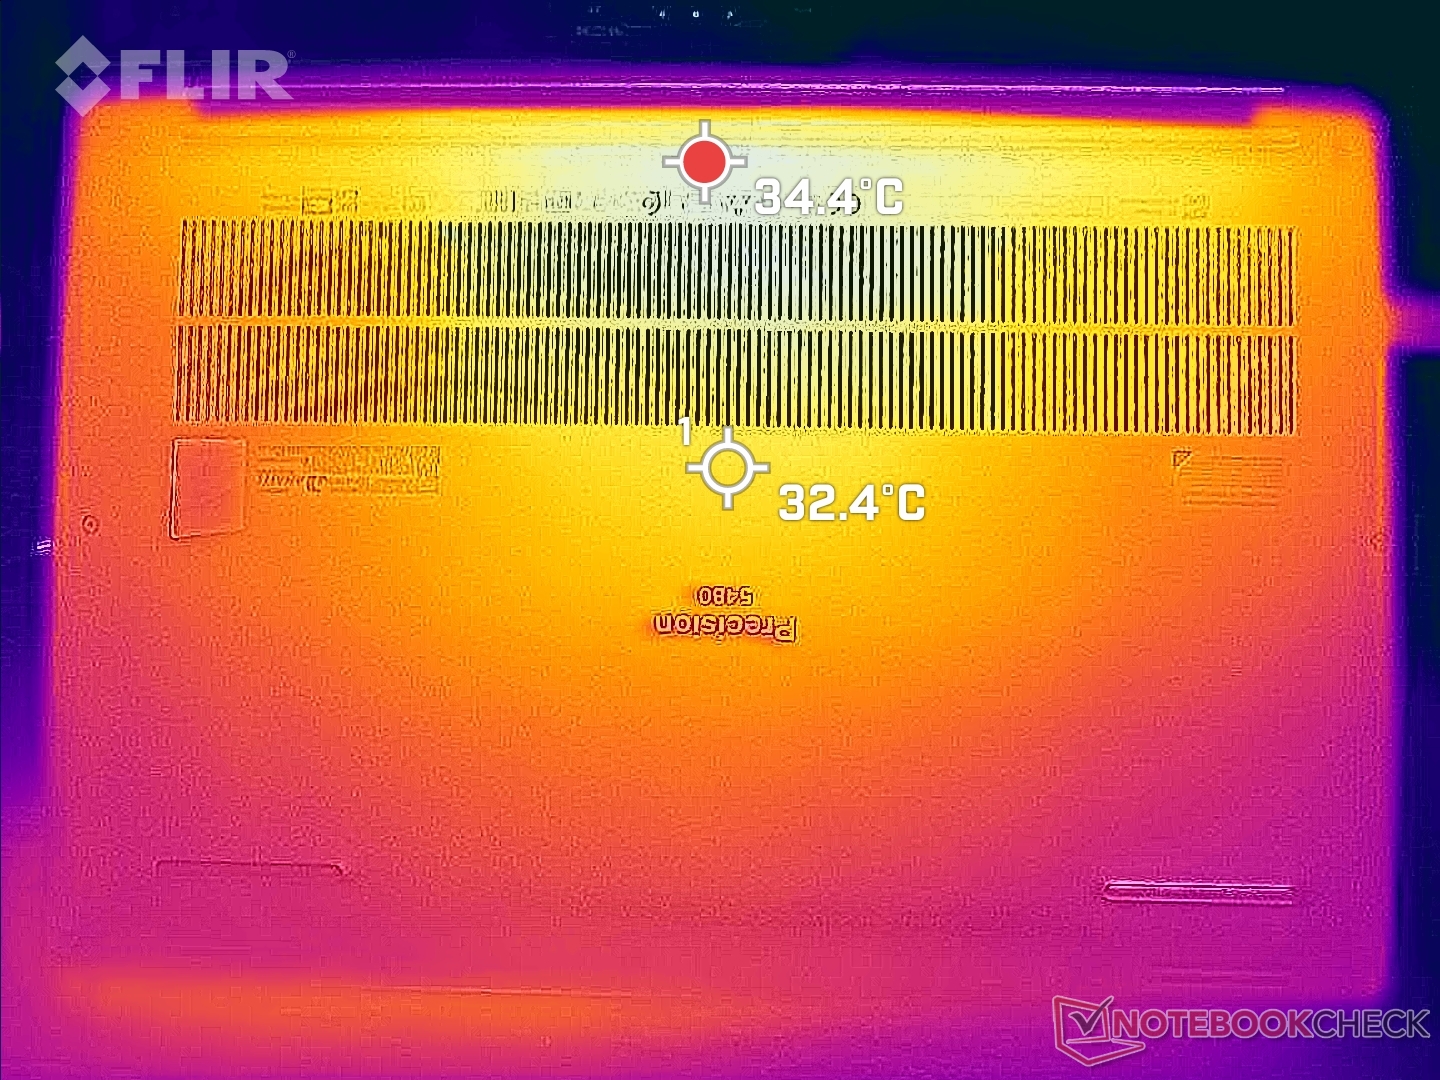
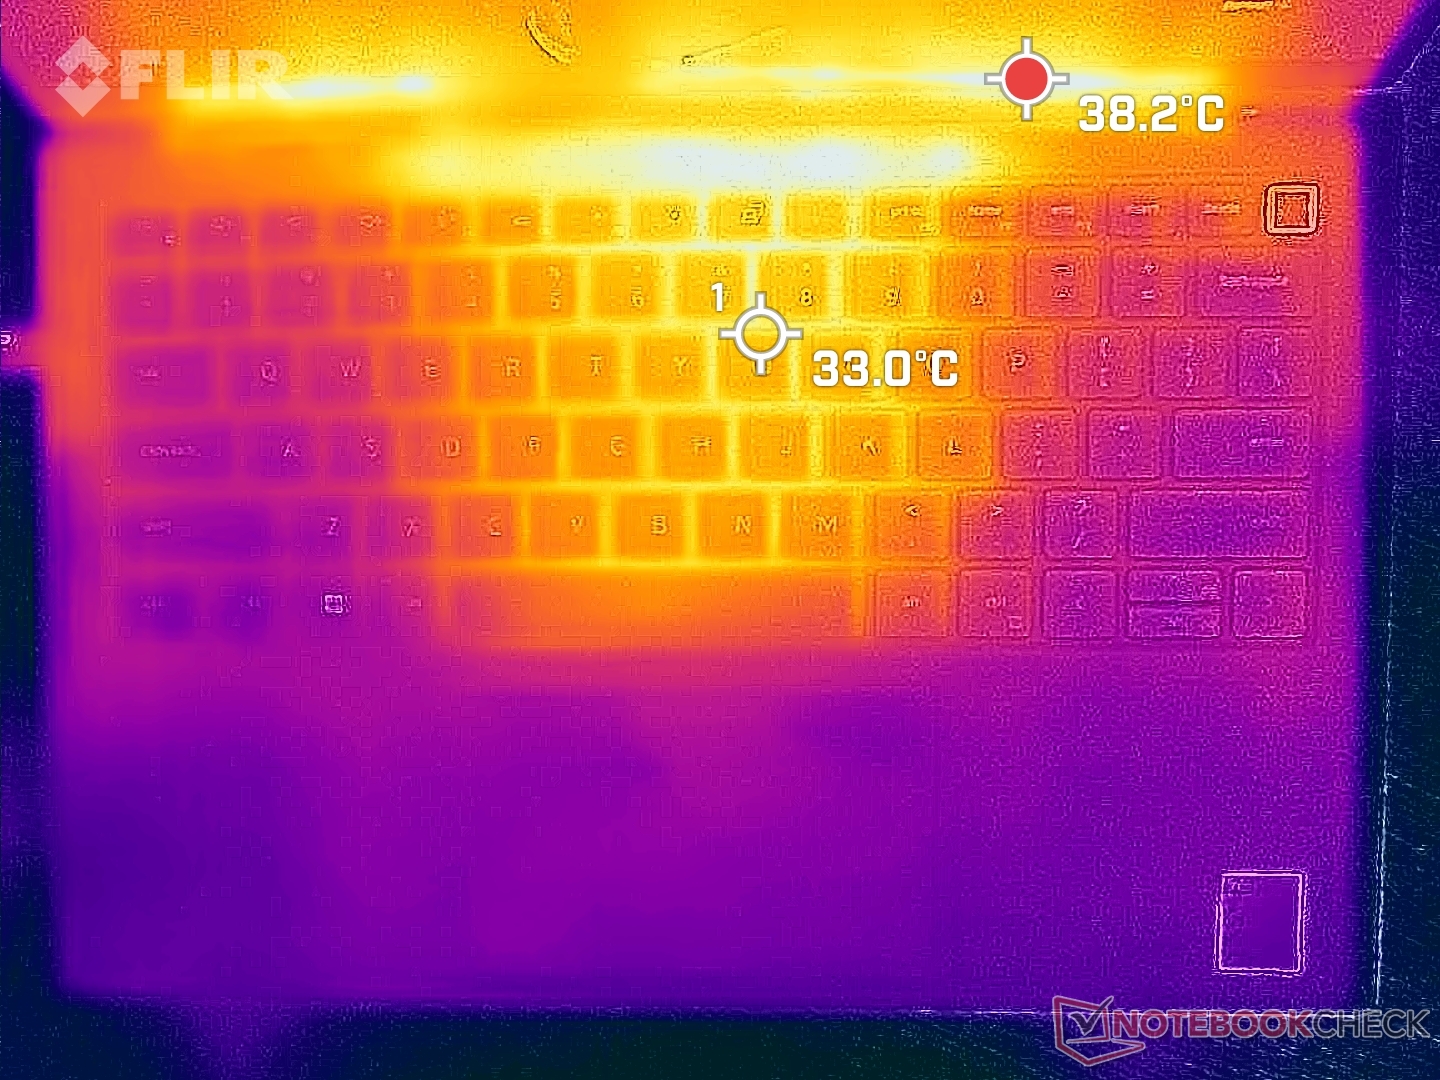
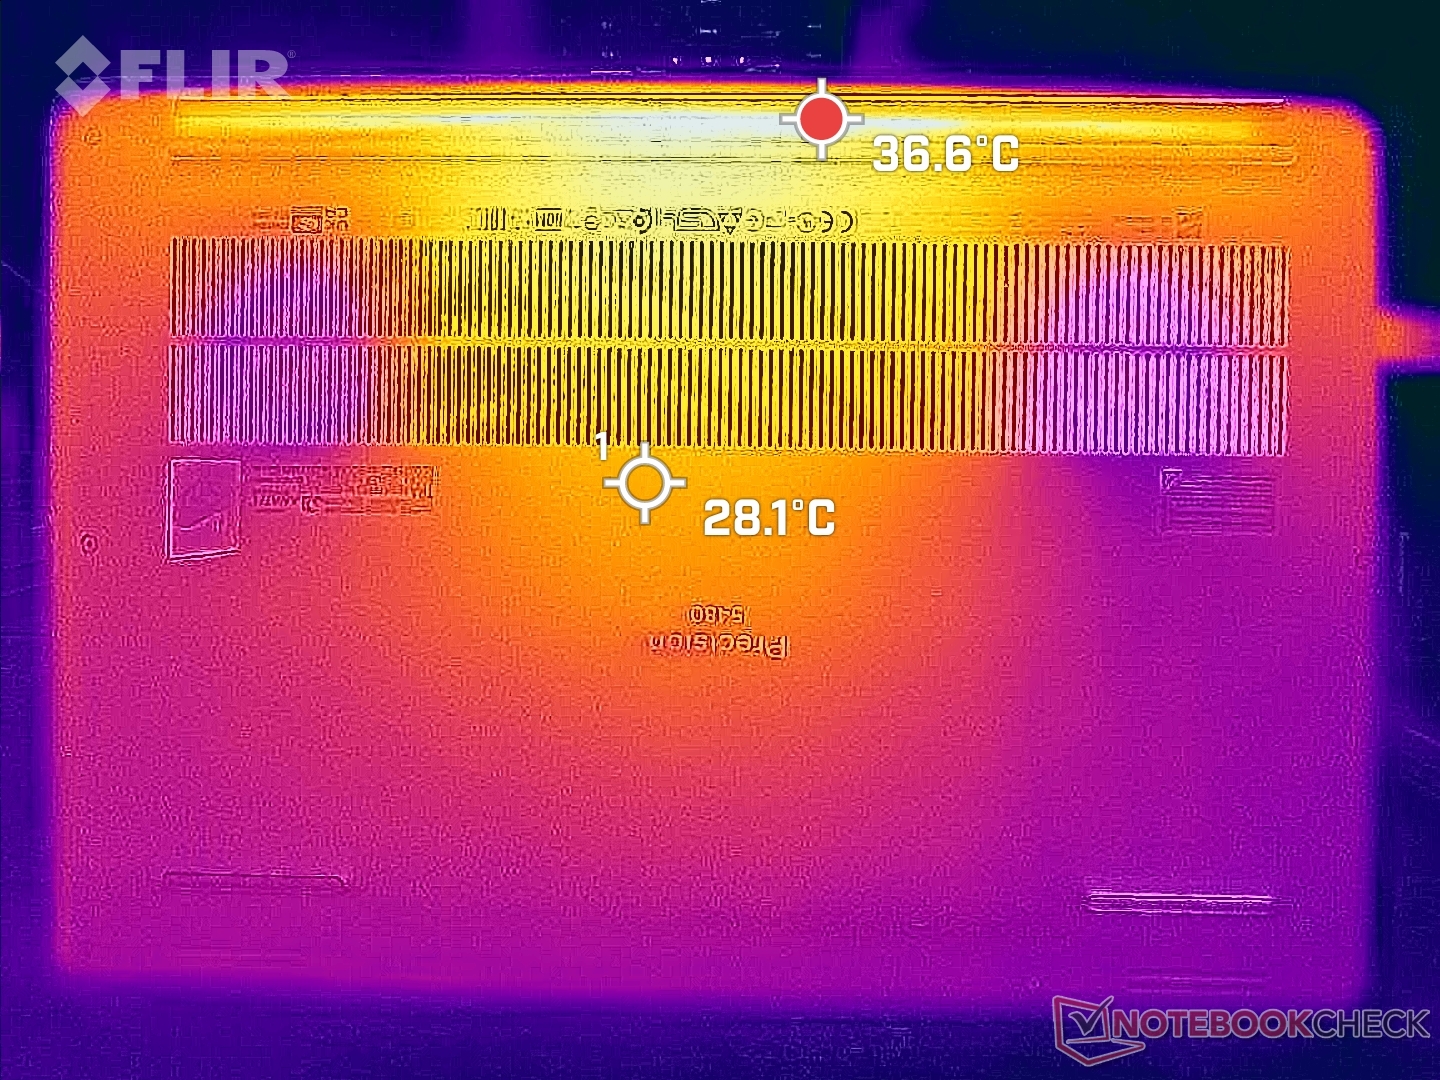
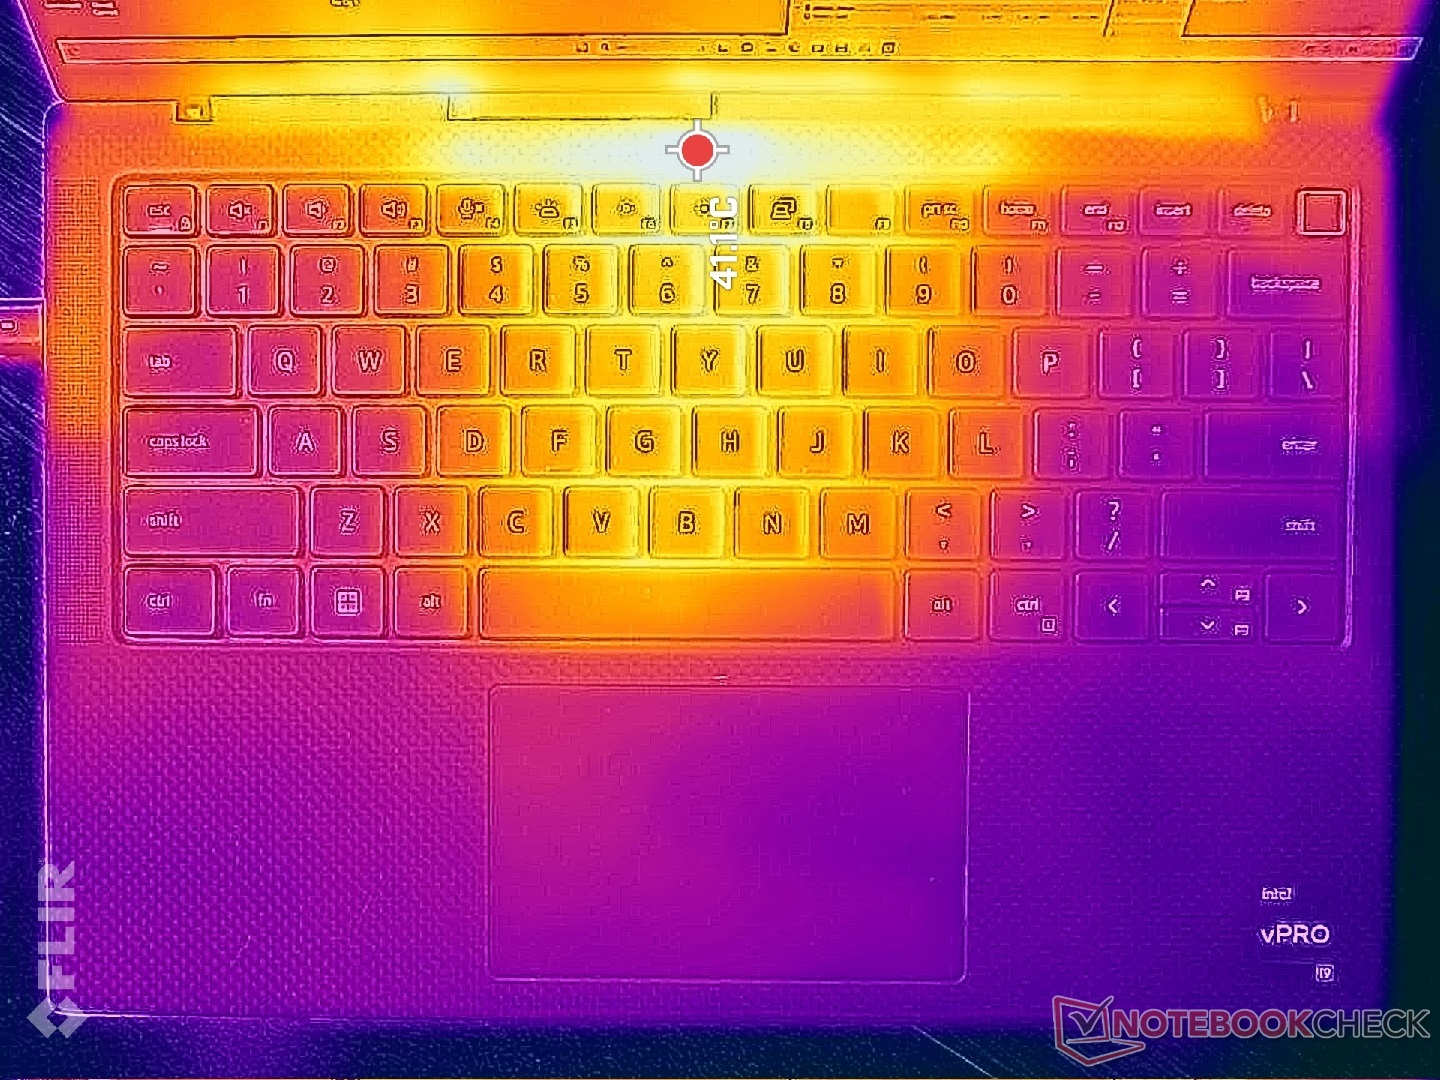
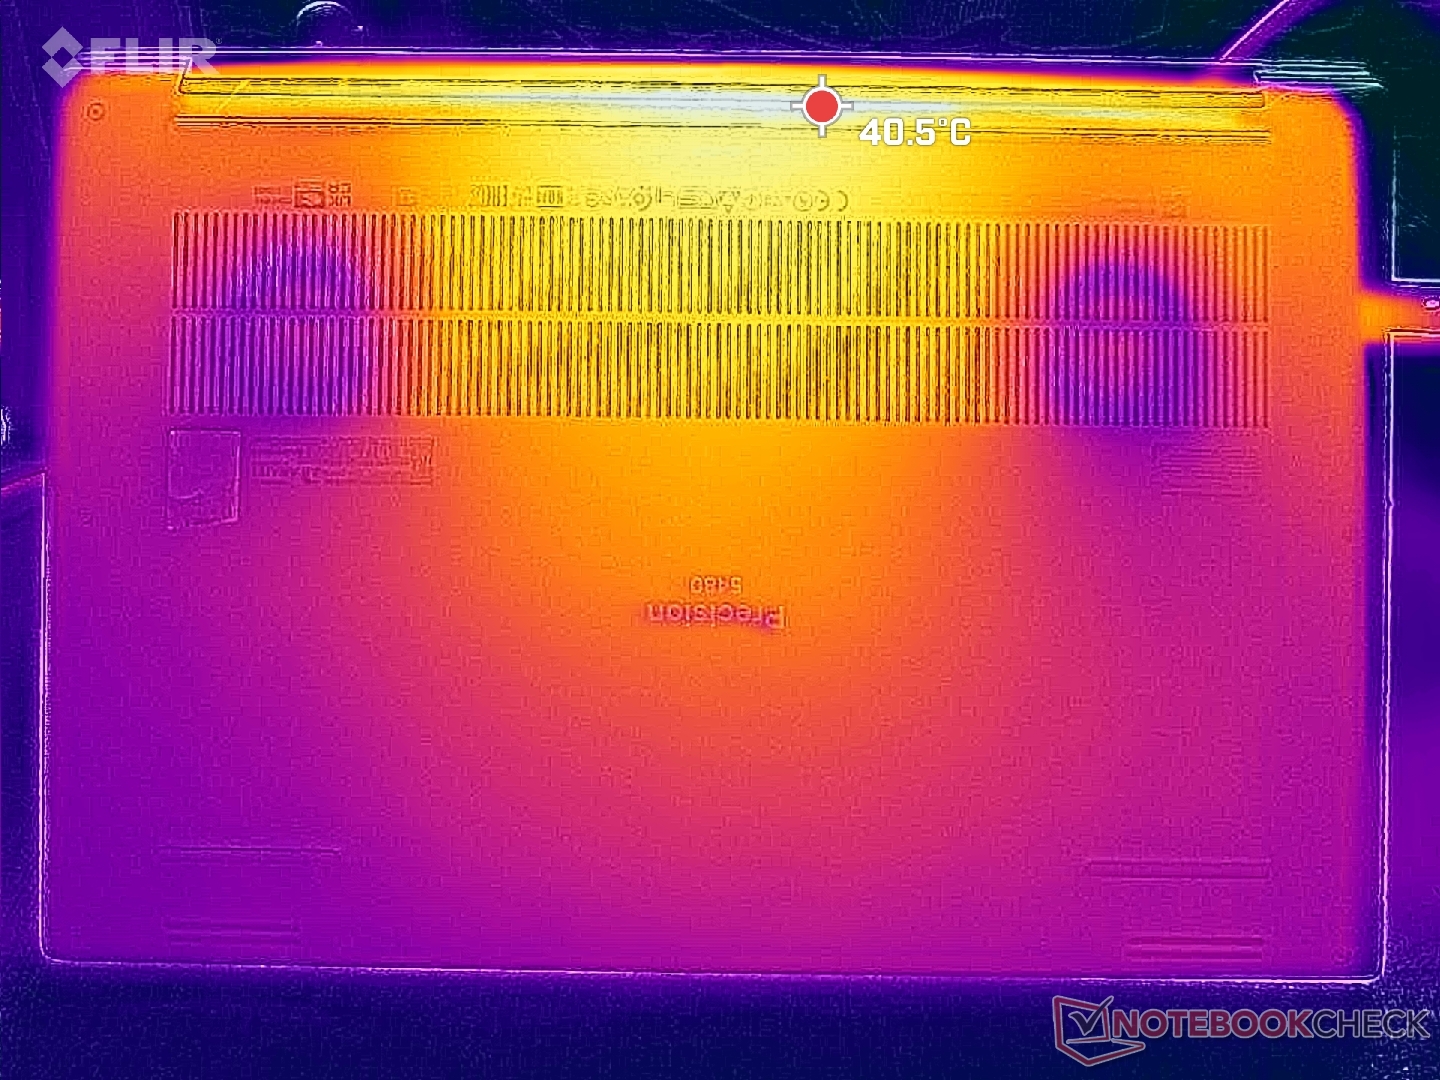
Les températures de surface sont plus chaudes que d'habitude près du centre de l'unité lorsqu'elle tourne au ralenti sur le bureau, en raison des ventilateurs inertes. Ainsi, le coût du silence lors de l'exécution de charges peu exigeantes se traduit par des températures de surface chaudes qui peuvent ou non gêner certains utilisateurs.
Les points chauds peuvent atteindre plus de 40°C sur les faces supérieure et inférieure du châssis lorsque Prime95 et FurMark sont exécutés simultanément. Ils sont concentrés à l'arrière de l'appareil et les repose-poignets en fibre de carbone restent confortables au toucher, mais la plus grande partie de la base métallique sera très chaude.
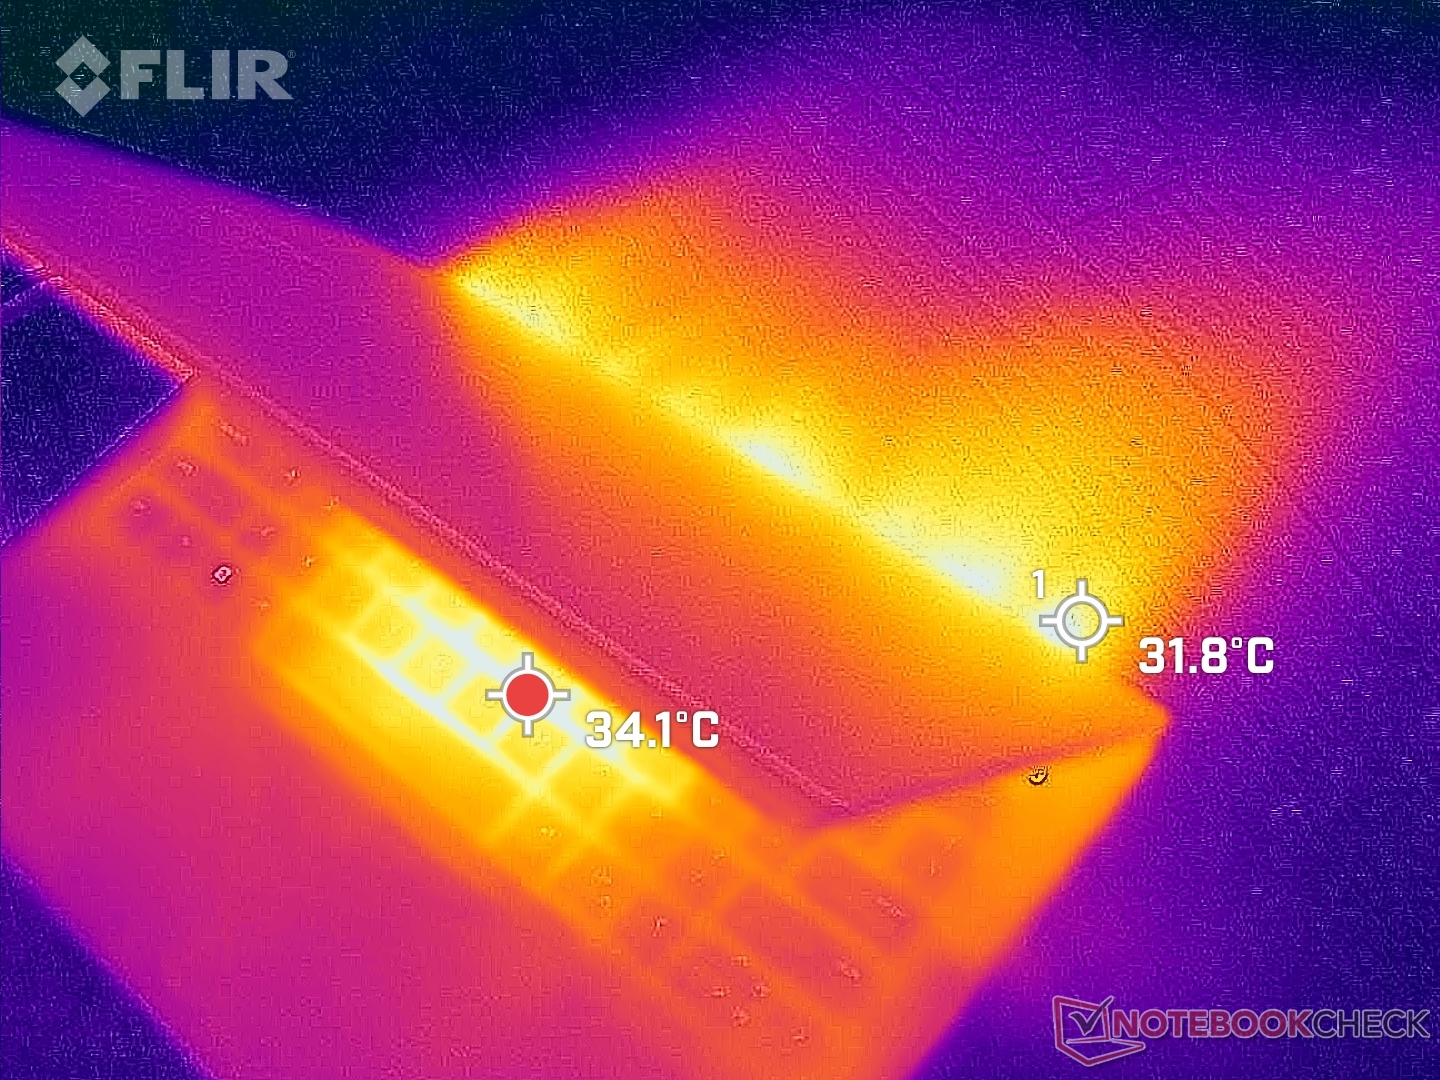
(±) La température maximale du côté supérieur est de 44 °C / 111 F, par rapport à la moyenne de 38.2 °C / 101 F, allant de 22.2 à 69.8 °C pour la classe Workstation.
(+) Le fond chauffe jusqu'à un maximum de 38.2 °C / 101 F, contre une moyenne de 41.1 °C / 106 F
(±) En utilisation inactive, la température moyenne du côté supérieur est de 34.2 °C / 94 F, par rapport à la moyenne du dispositif de 32 °C / 90 F.
(±) En jouant à The Witcher 3, la température moyenne du côté supérieur est de 32 °C / 90 F, alors que la moyenne de l'appareil est de 32 °C / 90 F.
(+) Les repose-poignets et le pavé tactile sont plus froids que la température de la peau avec un maximum de 29.6 °C / 85.3 F et sont donc froids au toucher.
(±) La température moyenne de la zone de l'appui-paume de dispositifs similaires était de 27.8 °C / 82 F (-1.8 °C / #-3.3 F).
| Dell Precision 5480 Intel Core i9-13900H, NVIDIA RTX 3000 Ada Generation Laptop | Dell Precision 5000 5470 Intel Core i9-12900H, NVIDIA RTX A1000 Laptop GPU | Dell Precision 5000 5560 Intel Core i7-11850H, NVIDIA RTX A2000 Laptop GPU | Lenovo ThinkPad P14s G3 AMD 21J6S05000 AMD Ryzen 7 PRO 6850U, AMD Radeon 680M | Lenovo ThinkPad P15v G3 21EM001AGE AMD Ryzen 7 PRO 6850H, NVIDIA RTX A2000 Laptop GPU | HP ZBook Firefly 14 G9-6B8A2EA Intel Core i7-1265U, NVIDIA T550 Laptop GPU | |
|---|---|---|---|---|---|---|
| Heat | 9% | -1% | 14% | 7% | 11% | |
| Maximum Upper Side * (°C) | 44 | 41.8 5% | 48.2 -10% | 42.7 3% | 48.7 -11% | 41.2 6% |
| Maximum Bottom * (°C) | 38.2 | 36 6% | 42.6 -12% | 43.1 -13% | 50.5 -32% | 47.9 -25% |
| Idle Upper Side * (°C) | 38.8 | 34.6 11% | 34.8 10% | 25.7 34% | 25 36% | 26.5 32% |
| Idle Bottom * (°C) | 38.6 | 33.6 13% | 35.2 9% | 26.4 32% | 25.4 34% | 27 30% |
* ... Moindre est la valeur, meilleures sont les performances
Test de stress
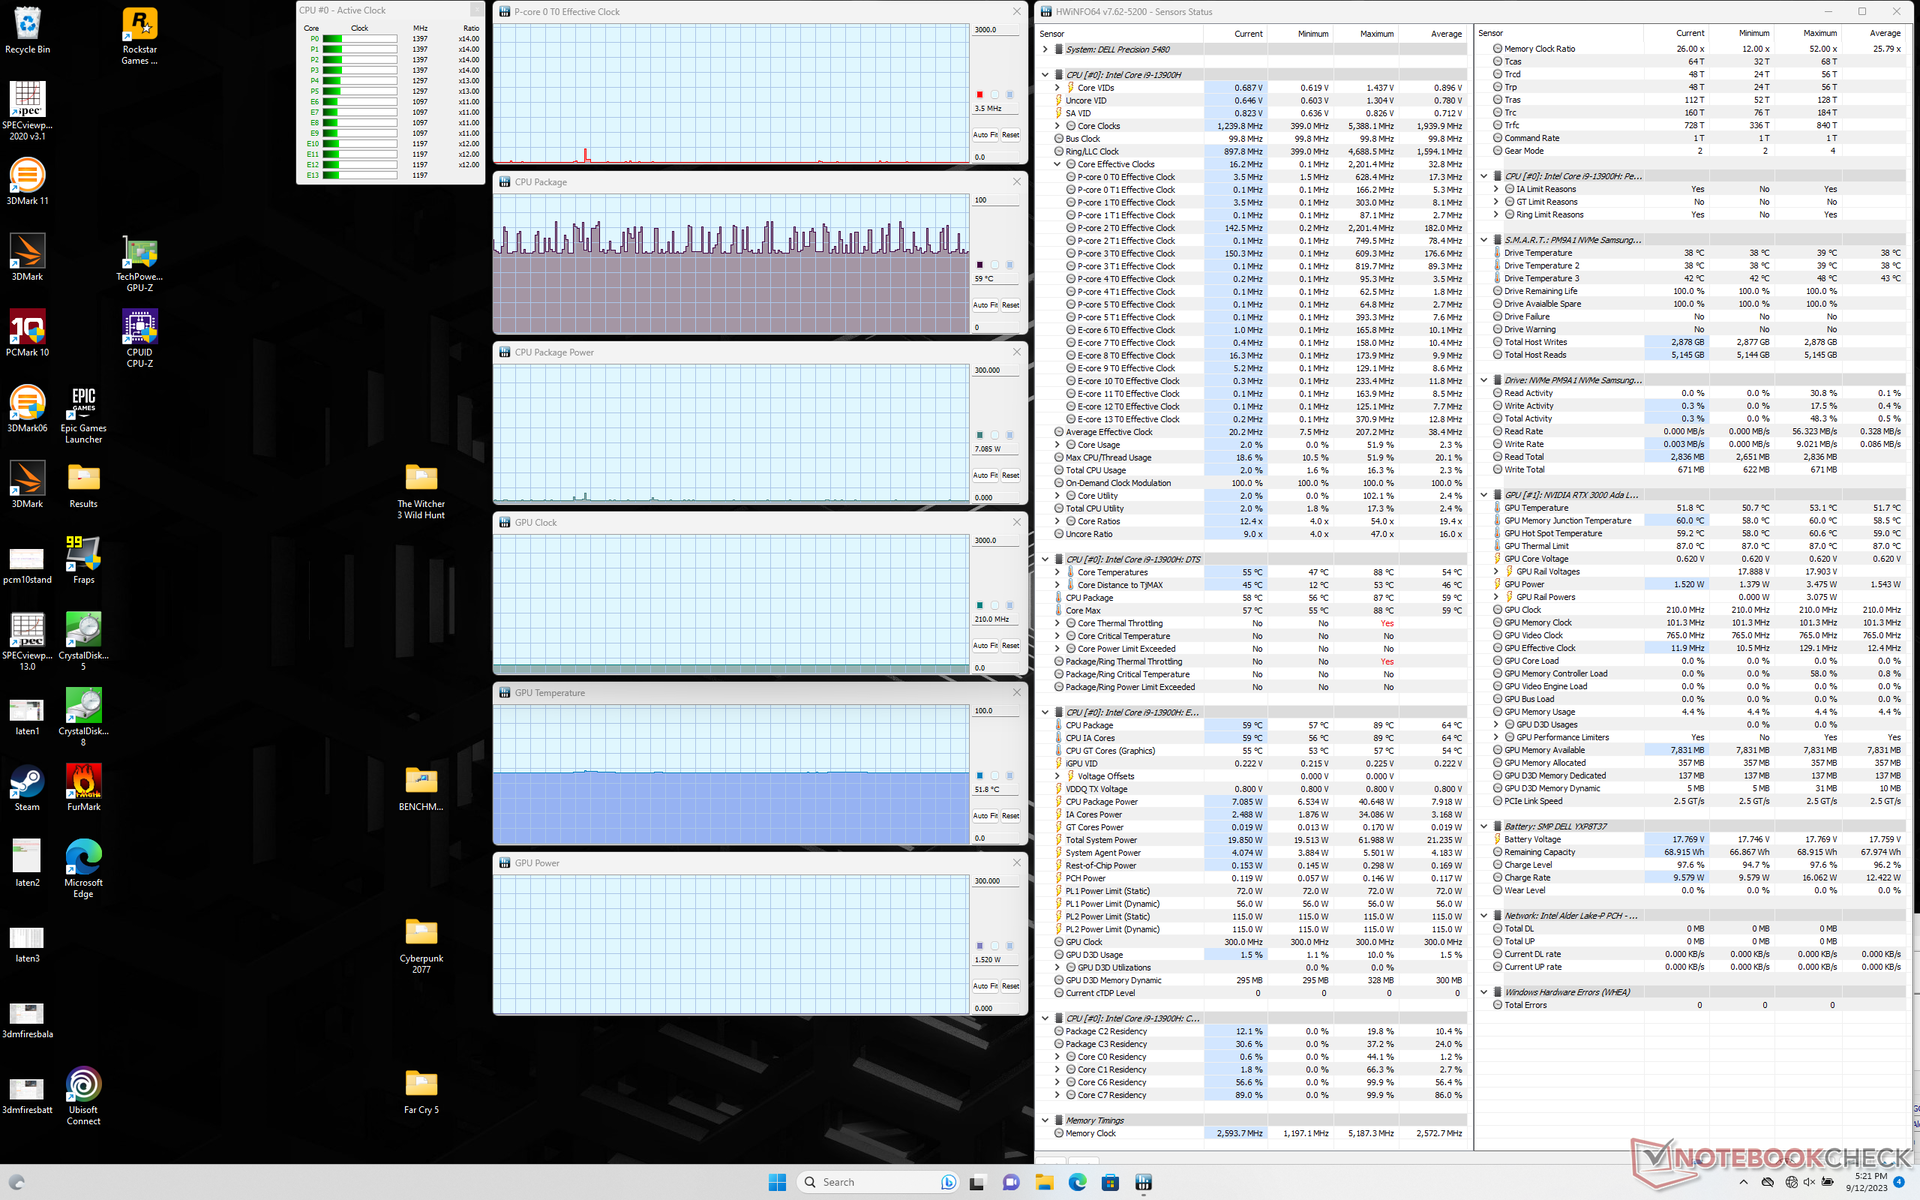
Lors de l'exécution du stress Prime95, le CPU atteignait 3,4 GHz, 88 W et 100 C pendant quelques minutes seulement. Il finit par se stabiliser à environ 2,4 GHz et 51 W afin de maintenir une température légèrement plus froide mais plus gérable de 93 C. Le Turbo Boost maximum n'est donc pas indéfini mais reste assez bon si l'on considère le petit facteur de forme de 14 pouces.
Le CPU et le GPU se stabilisent à environ 64°C chacun lorsqu'ils tournent à l'adresse Witcher 3 pour représenter des charges élevées. Il est intéressant de noter que cela ne change pas lorsque l'on passe du mode équilibré au mode performance, ce qui suggère que le mode équilibré devrait être suffisant pour la plupart des types de charges de travail. Notez que la consommation d'énergie de la carte GPU est plus élevée, de l'ordre de 45 à 50 W, contre 36 W seulement pour la carte Precision 5470. Les températures des cœurs devraient néanmoins être inférieures à celles du modèle de l'année dernière sous des charges de travail similaires à celles des jeux.
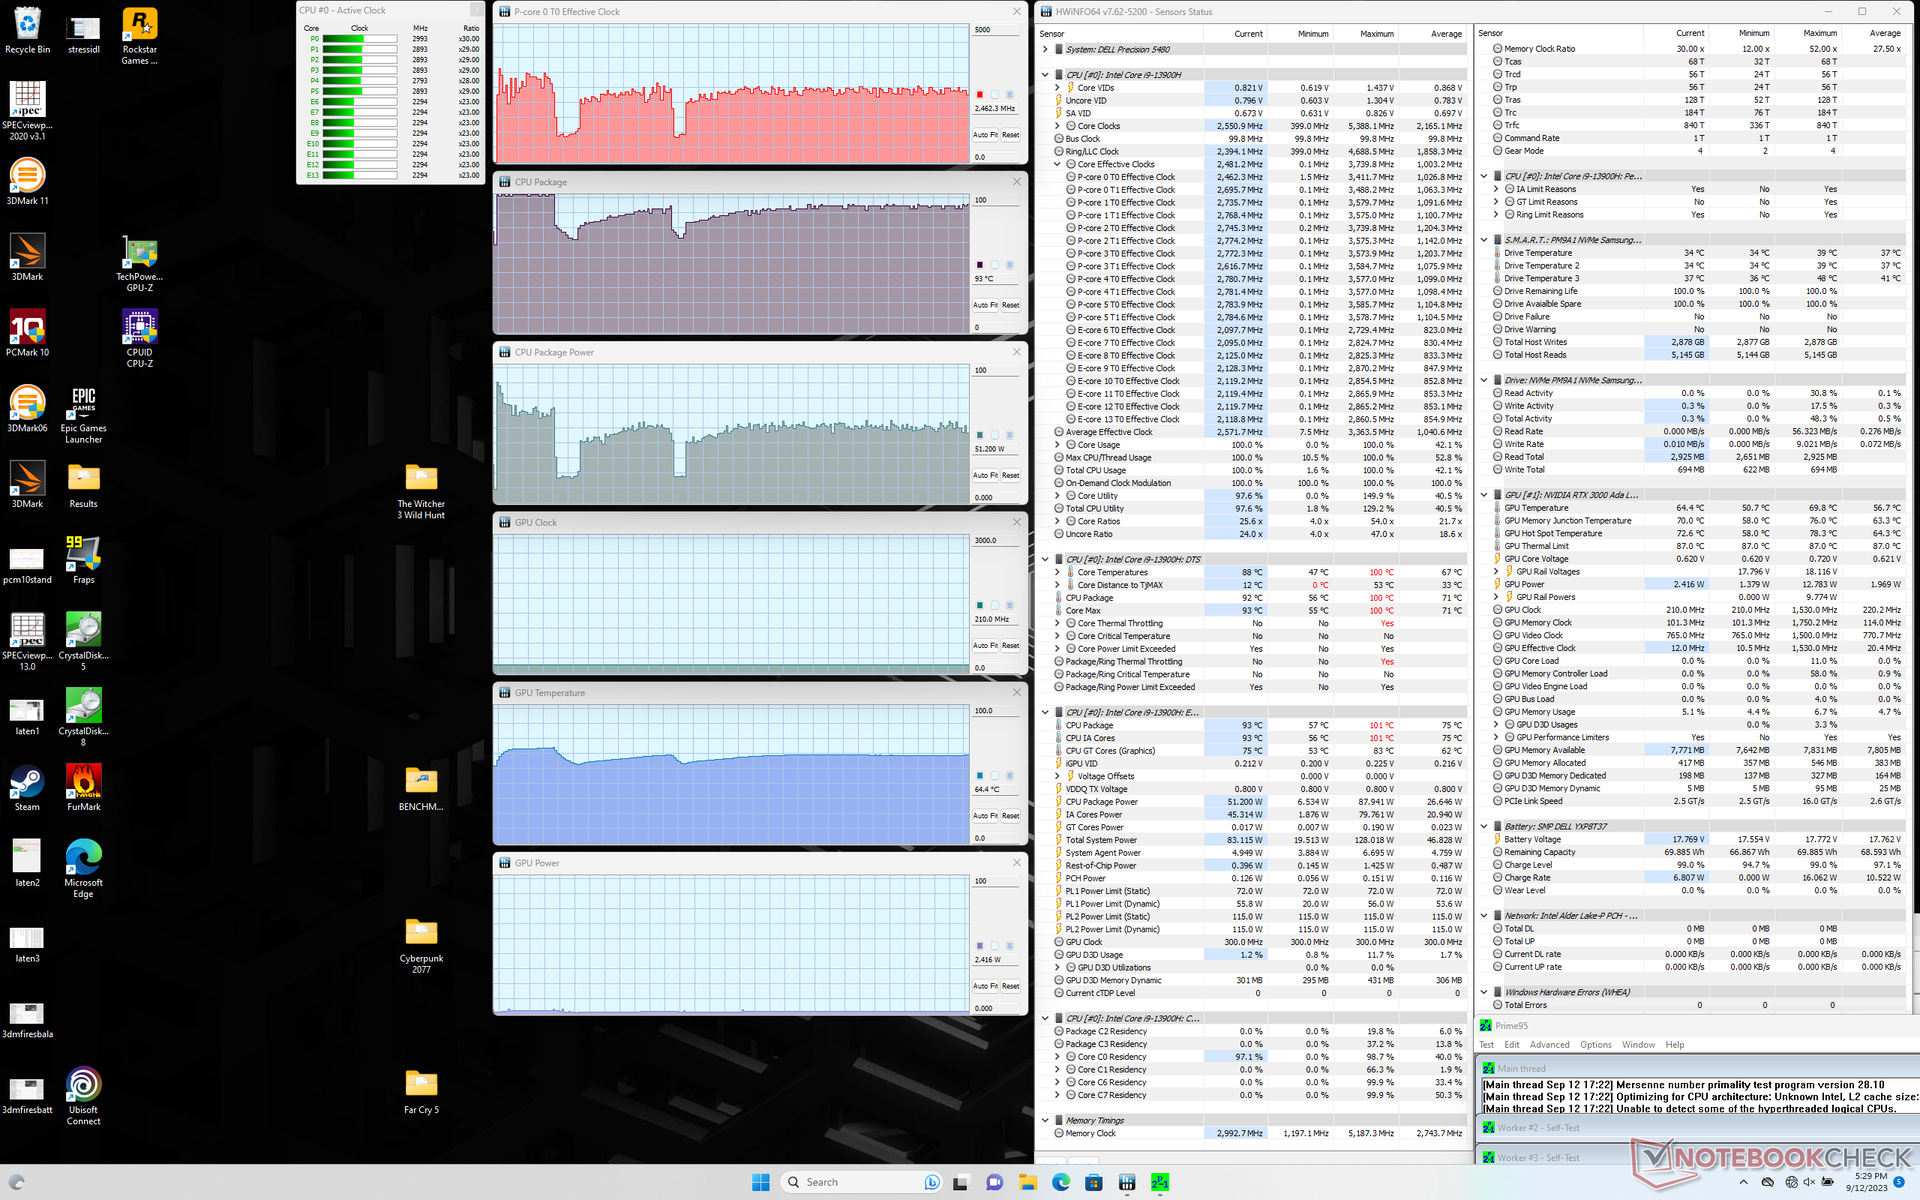
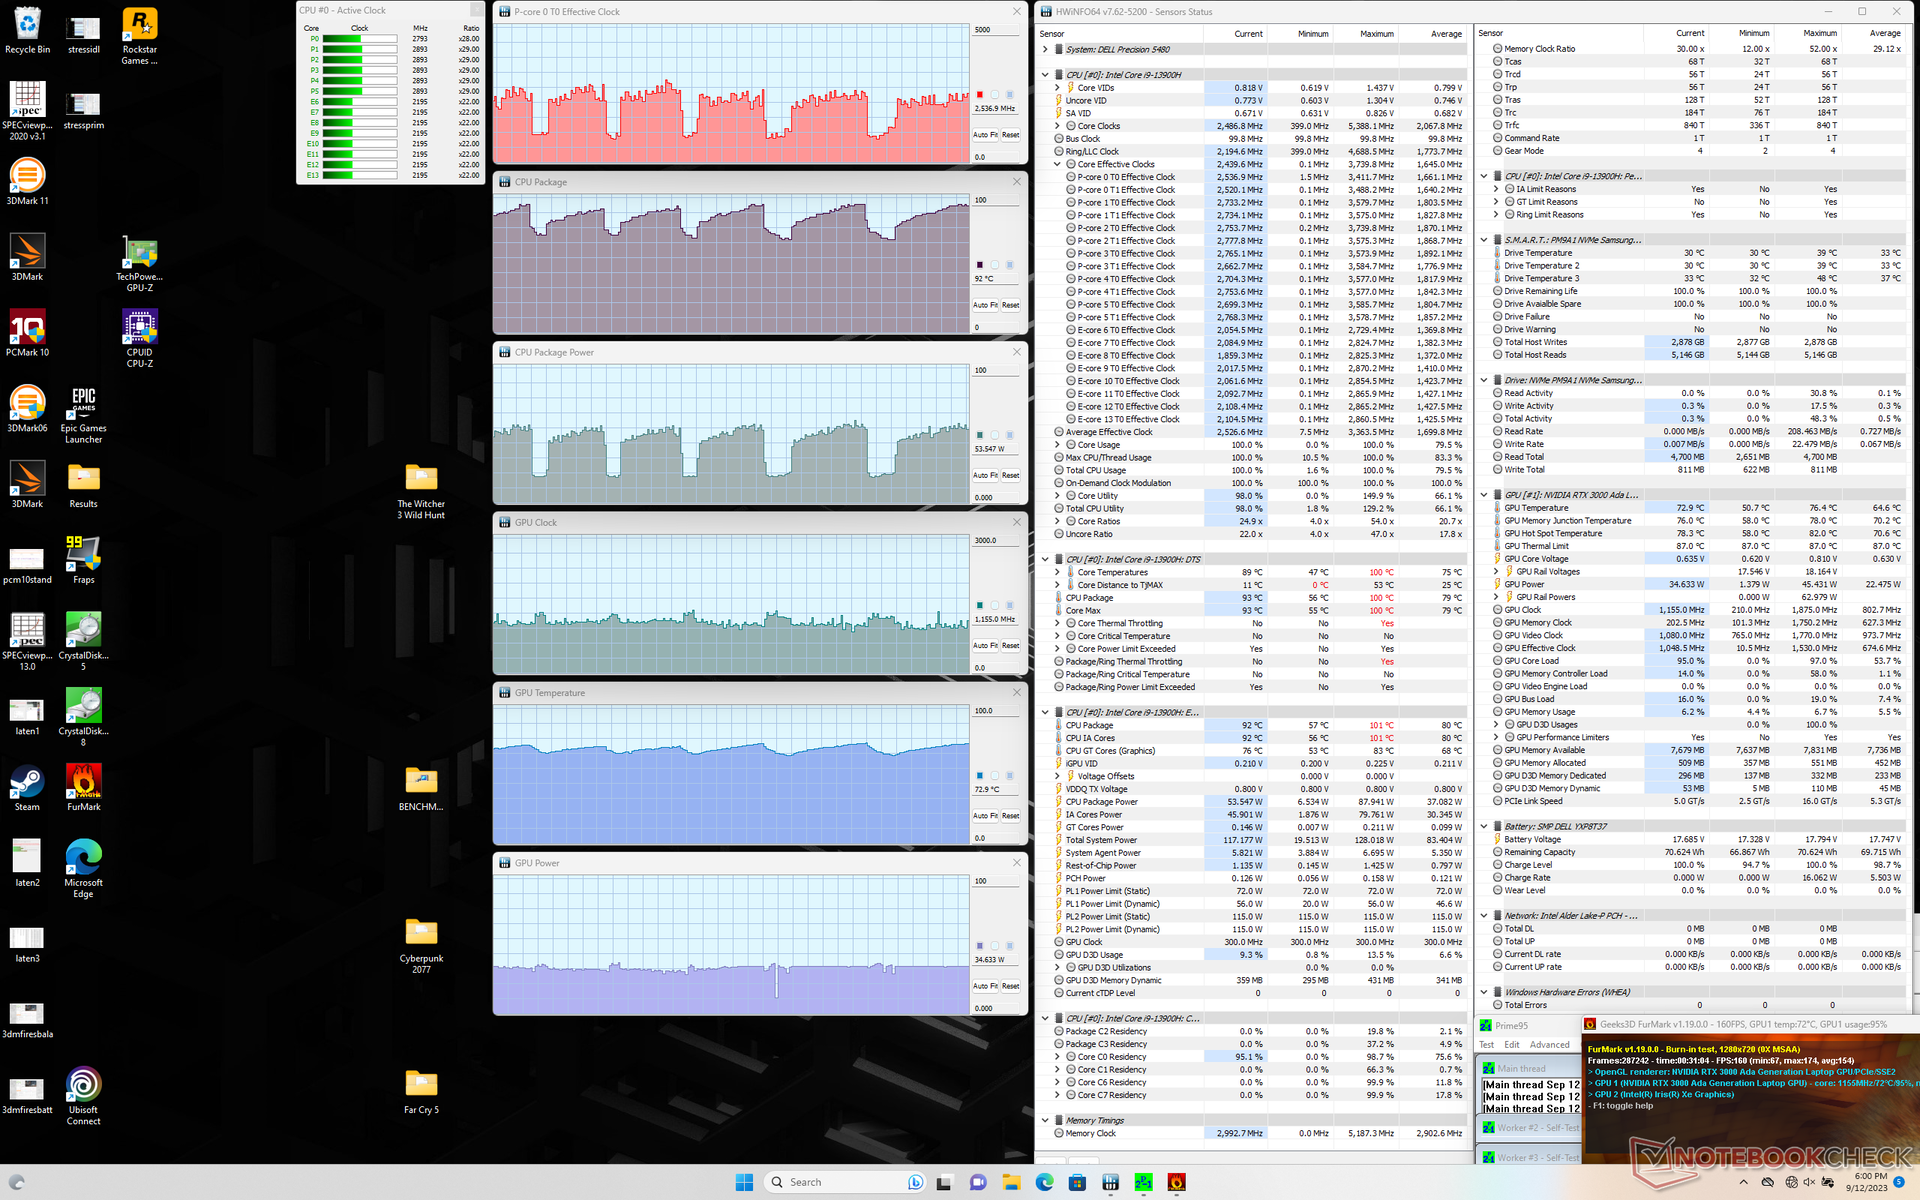
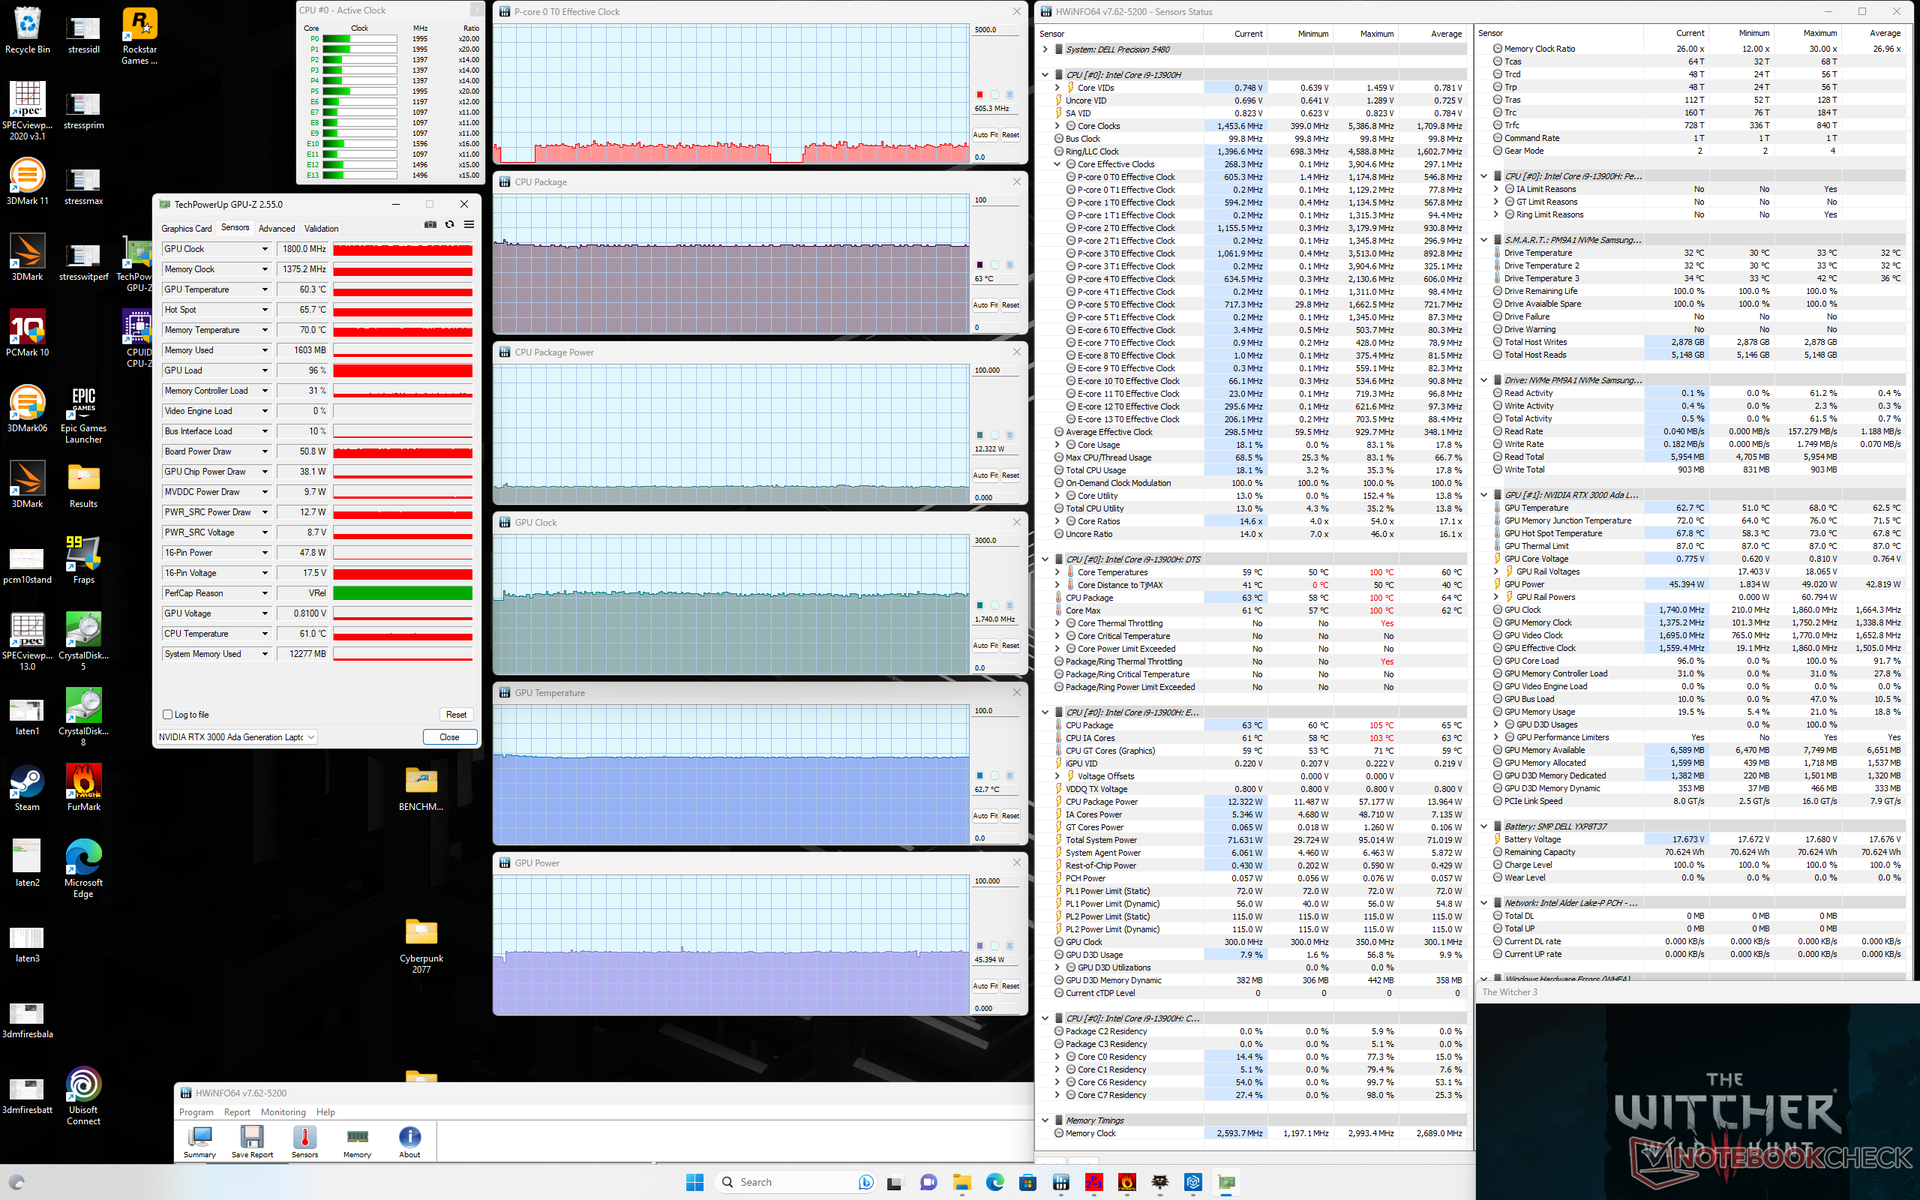
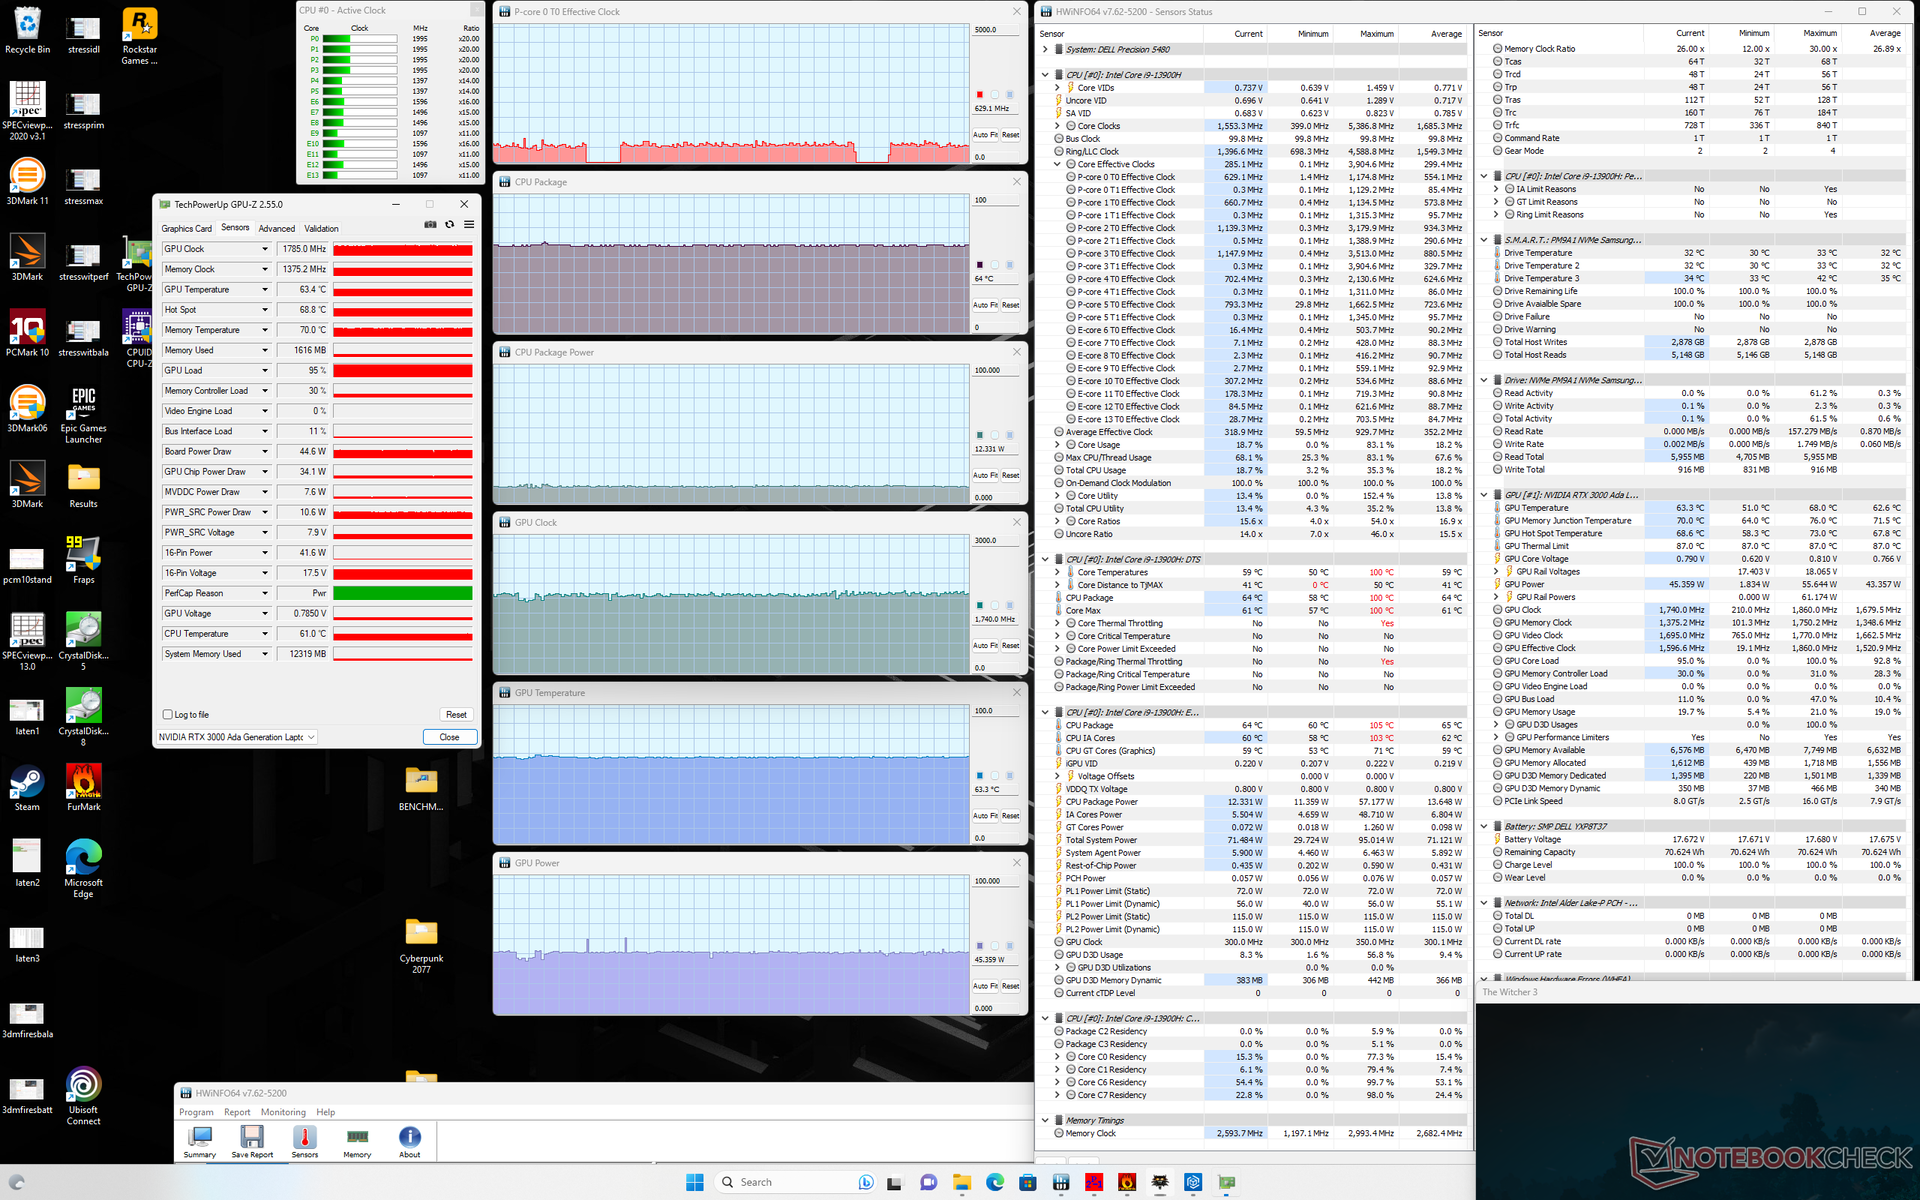
| Horloge du CPU (GHz) | Horloge du GPU (MHz) | Température moyenne du CPU (°C) | Température moyenne du GPU (°C) | |
| Système au repos | -- | -- | 59 | 52 |
| Prime95 Stress | 2.5 | -- | 93 | 65 |
| Prime95 + FurMark Stress | 1.0 - 2.6 | 1155 | 69 - 92 | 66 - 73 |
| Witcher 3 Stress(mode équilibré) | 0.6 | 1740 | 63 | 63 |
| Witcher 3 Stress (mode Performance) | 0,6 | 1740 | 64 | 63 |
Intervenants
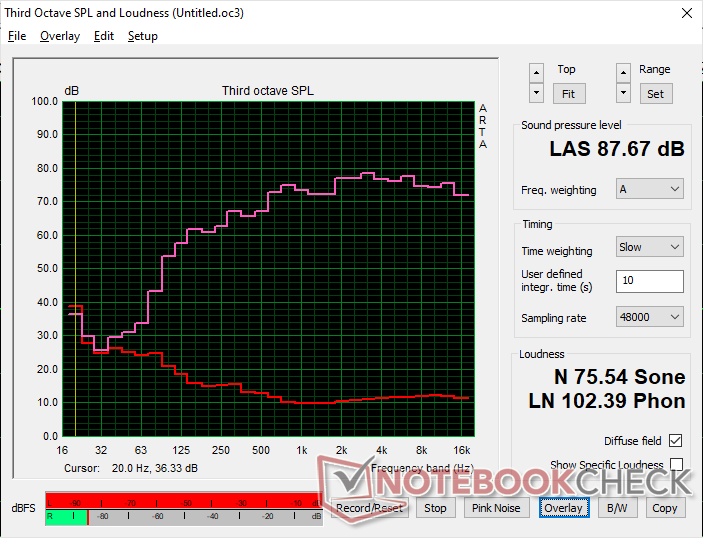
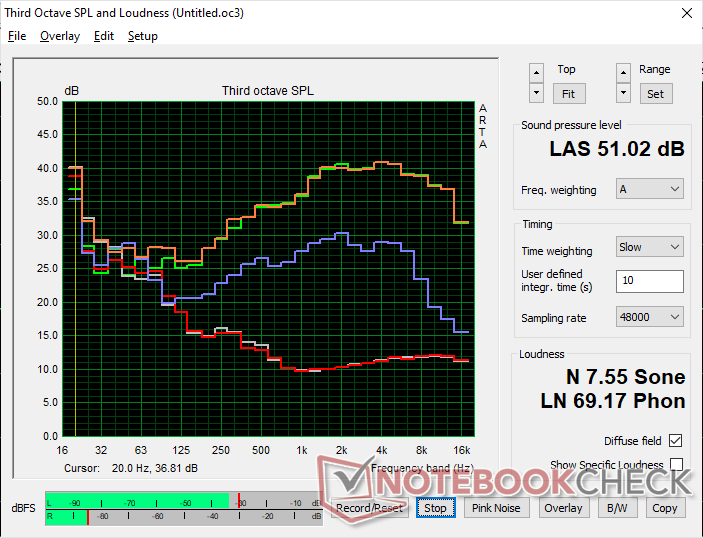
Dell Precision 5480 analyse audio
(+) | les haut-parleurs peuvent jouer relativement fort (87.7# dB)
Basses 100 - 315 Hz
(±) | basse réduite - en moyenne 12.9% inférieure à la médiane
(±) | la linéarité des basses est moyenne (7% delta à la fréquence précédente)
Médiums 400 - 2000 Hz
(+) | médiane équilibrée - seulement 2.8% de la médiane
(+) | les médiums sont linéaires (3.6% delta à la fréquence précédente)
Aiguës 2 - 16 kHz
(+) | des sommets équilibrés - à seulement 2.9% de la médiane
(+) | les aigus sont linéaires (2% delta à la fréquence précédente)
Globalement 100 - 16 000 Hz
(+) | le son global est linéaire (9% différence à la médiane)
Par rapport à la même classe
» 4% de tous les appareils testés de cette catégorie étaient meilleurs, 2% similaires, 94% pires
» Le meilleur avait un delta de 7%, la moyenne était de 17%, le pire était de 35%.
Par rapport à tous les appareils testés
» 3% de tous les appareils testés étaient meilleurs, 1% similaires, 96% pires
» Le meilleur avait un delta de 4%, la moyenne était de 24%, le pire était de 134%.
Apple MacBook Pro 16 2021 M1 Pro analyse audio
(+) | les haut-parleurs peuvent jouer relativement fort (84.7# dB)
Basses 100 - 315 Hz
(+) | bonne basse - seulement 3.8% loin de la médiane
(+) | les basses sont linéaires (5.2% delta à la fréquence précédente)
Médiums 400 - 2000 Hz
(+) | médiane équilibrée - seulement 1.3% de la médiane
(+) | les médiums sont linéaires (2.1% delta à la fréquence précédente)
Aiguës 2 - 16 kHz
(+) | des sommets équilibrés - à seulement 1.9% de la médiane
(+) | les aigus sont linéaires (2.7% delta à la fréquence précédente)
Globalement 100 - 16 000 Hz
(+) | le son global est linéaire (4.6% différence à la médiane)
Par rapport à la même classe
» 0% de tous les appareils testés de cette catégorie étaient meilleurs, 0% similaires, 100% pires
» Le meilleur avait un delta de 5%, la moyenne était de 17%, le pire était de 45%.
Par rapport à tous les appareils testés
» 0% de tous les appareils testés étaient meilleurs, 0% similaires, 100% pires
» Le meilleur avait un delta de 4%, la moyenne était de 24%, le pire était de 134%.
Gestion de l'énergie
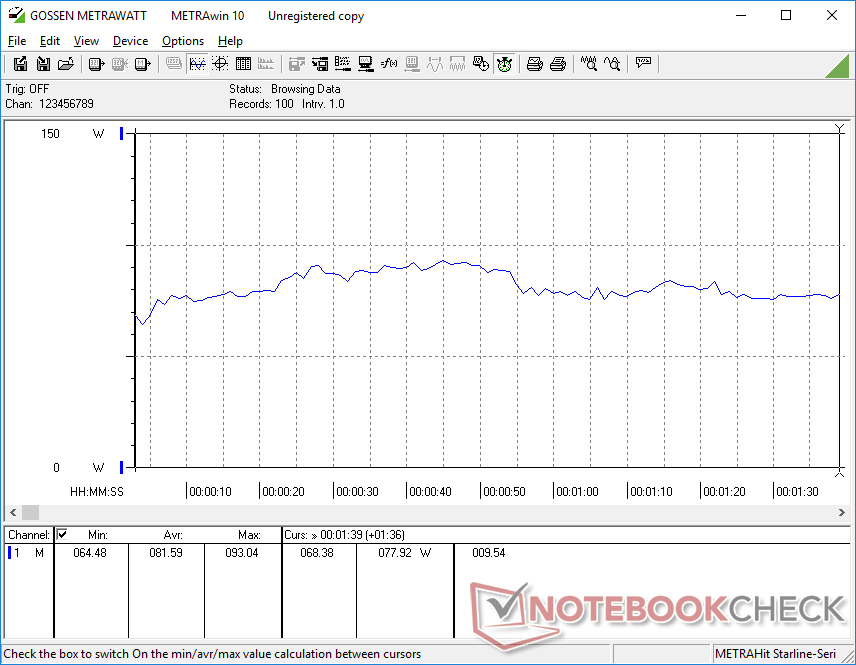
Consommation électrique
Le modèle Precision 5480 est plus exigeant que le modèle sortant Precision 5470 lorsqu'il est soumis à des charges élevées. Witcher 3 l'utilisation de Prime95, par exemple, consommerait environ 90 W contre 83 W pour le modèle de l'année dernière, mais la légère augmentation de la consommation est éclipsée par l'augmentation significative des performances, comme indiqué ci-dessus.
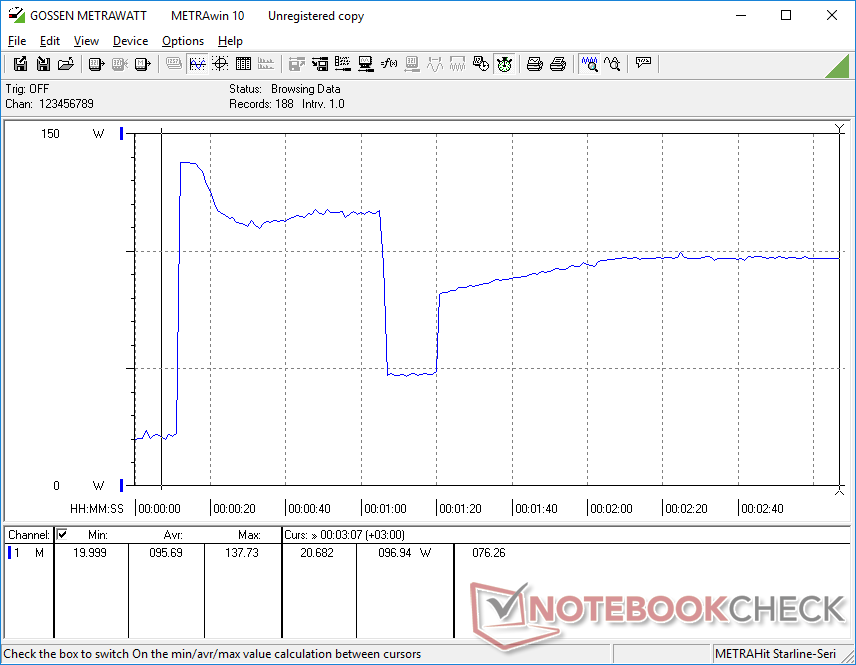
Il est intéressant de noter que la consommation d'énergie lors de l'exécution de Prime95 serait plus de deux fois supérieure à celle du modèle de l'année dernière (98 W contre 42 W) après avoir pris en compte tout ce qui concerne la limitation des performances, comme le montrent les graphiques ci-dessous. L'augmentation des performances du processeur d'une année sur l'autre a donc un prix beaucoup plus élevé que l'augmentation des performances graphiques.
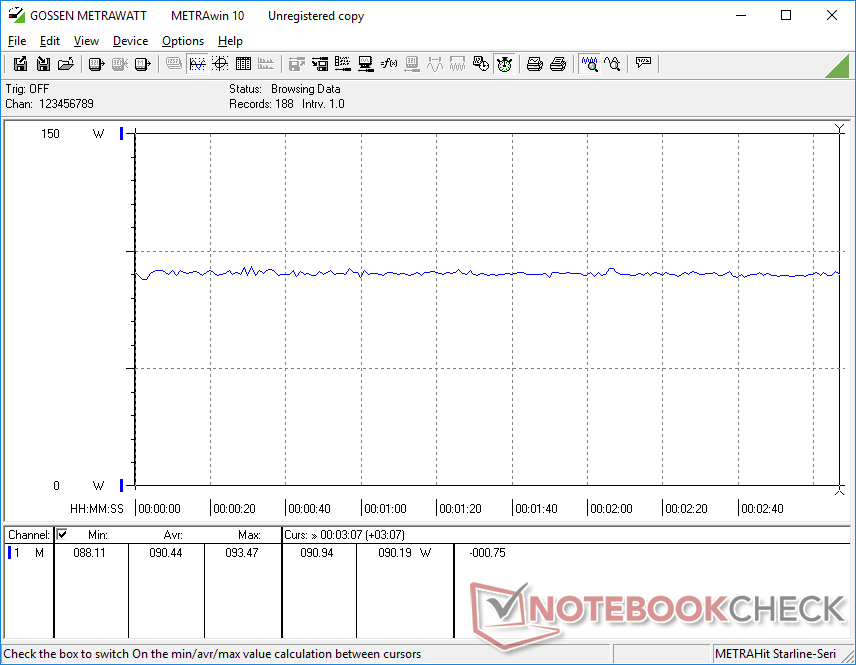
Il convient également de mentionner que notre appareil consommait plus d'énergie que prévu lorsqu'il tournait au ralenti sur le bureau sans aucune application en cours, ce qui peut expliquer en partie les températures de surface généralement plus chaudes, comme nous l'avons indiqué plus haut.
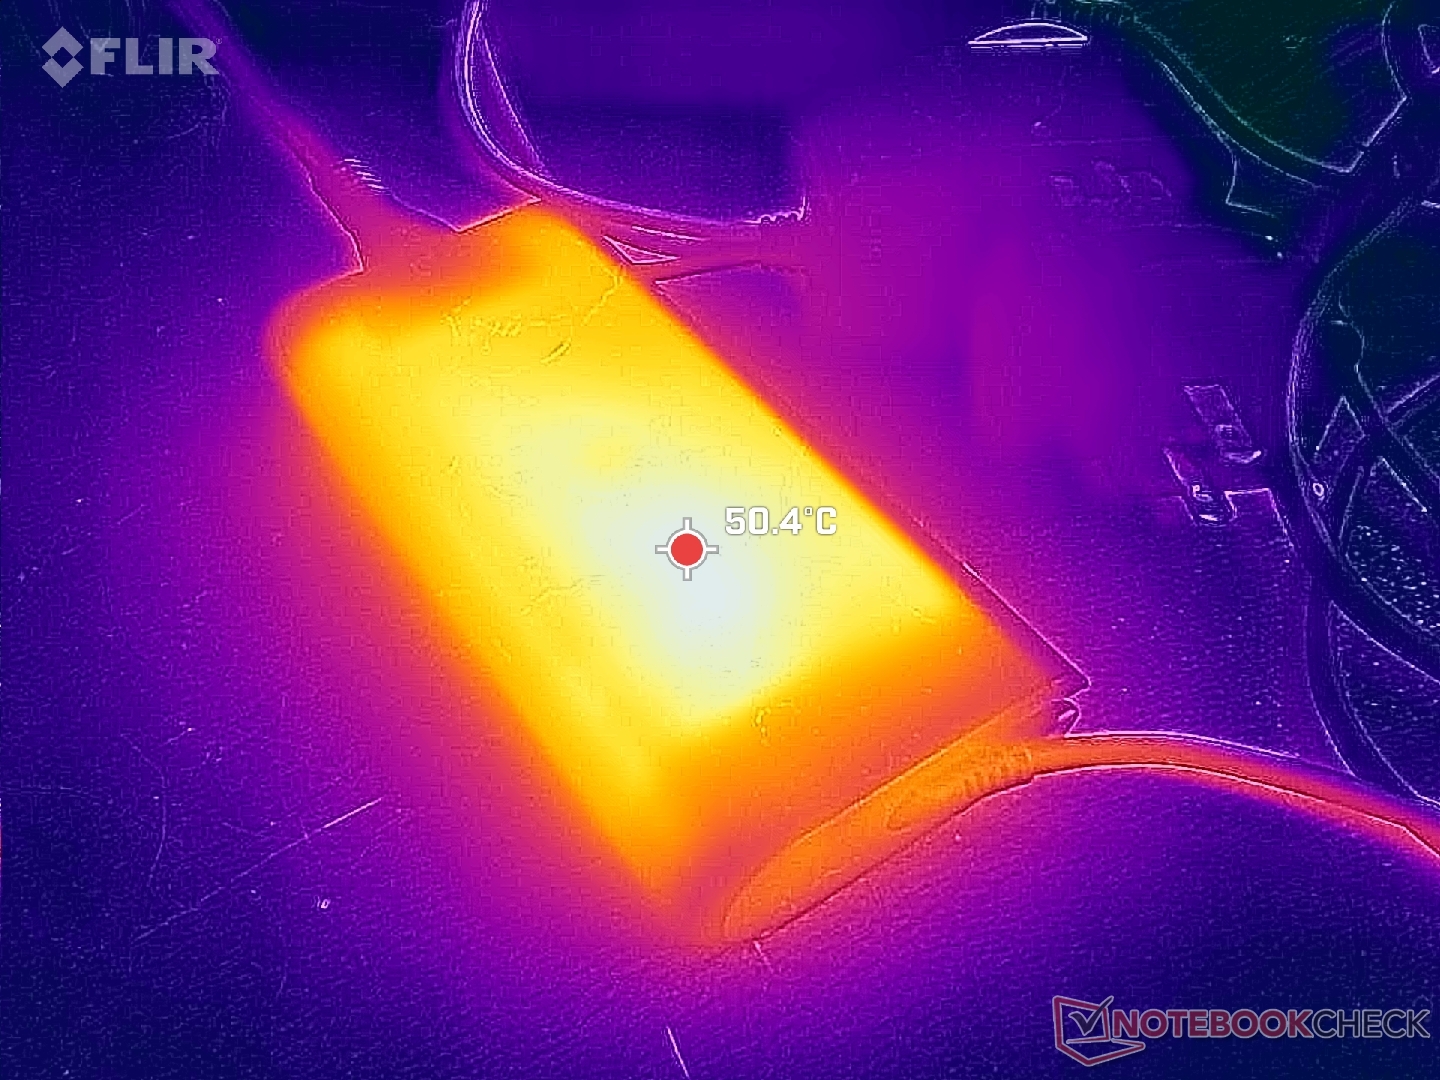
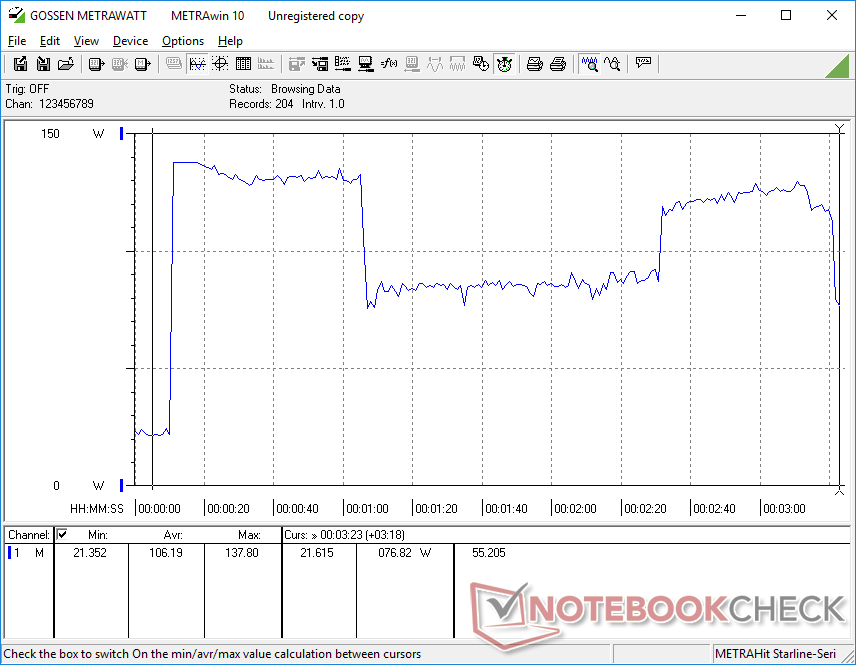
Nous sommes en mesure de mesurer une consommation maximale temporaire de 138 W à partir de l'adaptateur secteur USB-C 130 W de petite-moyenne taille (~14,3 x 6,5 x 2,1 cm) lorsque le CPU et le GPU sont pleinement sollicités. Ce taux de consommation élevé n'est pas constant puisqu'il oscille entre 76 W et 138 W toutes les minutes environ, comme le montre le graphique ci-dessous qui est en corrélation avec les fréquences d'horloge.
| Éteint/en veille | |
| Au repos | |
| Fortement sollicité |
|
Légende:
min: | |
| Dell Precision 5480 i9-13900H, RTX 3000 Ada Generation Laptop, Samsung PM9A1 MZVL21T0HCLR, IPS, 2560x1600, 14" | Dell Precision 5000 5470 i9-12900H, RTX A1000 Laptop GPU, Samsung PM9A1 MZVL21T0HCLR, IPS, 2560x1600, 14" | Dell Precision 5000 5560 i7-11850H, RTX A2000 Laptop GPU, Samsung PM9A1 MZVL22T0HBLB, IPS, 3840x2400, 15.6" | Lenovo ThinkPad P14s G3 AMD 21J6S05000 R7 PRO 6850U, Radeon 680M, Samsung PM9A1 MZVL21T0HCLR, IPS LED, 1920x1200, 14" | Lenovo ThinkPad P15v G3 21EM001AGE R7 PRO 6850H, RTX A2000 Laptop GPU, SK Hynix PC711 1TB HFS001TDE9X081N, IPS LED, 3840x2160, 15.6" | HP ZBook Firefly 14 G9-6B8A2EA i7-1265U, T550 Laptop GPU, Micron 3400 1TB MTFDKBA1T0TFH, IPS, 1920x1200, 14" | |
|---|---|---|---|---|---|---|
| Power Consumption | 25% | 15% | 63% | 24% | 60% | |
| Idle Minimum * (Watt) | 14.9 | 4.3 71% | 6.2 58% | 2.6 83% | 6.3 58% | 4.2 72% |
| Idle Average * (Watt) | 19.5 | 8.9 54% | 13.9 29% | 5 74% | 13.9 29% | 6.5 67% |
| Idle Maximum * (Watt) | 27.2 | 18.9 31% | 23.8 12% | 5.6 79% | 14.5 47% | 7.2 74% |
| Load Average * (Watt) | 81.6 | 94 -15% | 95.7 -17% | 49.7 39% | 82.8 -1% | 47.7 42% |
| Witcher 3 ultra * (Watt) | 90.4 | 83.2 8% | 87 4% | 50.6 44% | 88.8 2% | 42.9 53% |
| Load Maximum * (Watt) | 137.8 | 137.5 -0% | 132.6 4% | 61.1 56% | 124.8 9% | 68.2 51% |
* ... Moindre est la valeur, meilleures sont les performances
Power Consumption Witcher 3 / Stresstest
Power Consumption external Monitor
Autonomie de la batterie
L'autonomie du réseau local sans fil est légèrement supérieure à celle du modèle de l'année dernière, d'environ 1 à 2 heures, ce qui est plutôt satisfaisant si l'on considère les avantages en termes de performances d'une année sur l'autre. Par ailleurs, il faut un peu plus de 2 heures pour recharger l'appareil de sa capacité maximale à vide.
| Dell Precision 5480 i9-13900H, RTX 3000 Ada Generation Laptop, 72 Wh | Dell Precision 5000 5470 i9-12900H, RTX A1000 Laptop GPU, 72 Wh | Dell Precision 5000 5560 i7-11850H, RTX A2000 Laptop GPU, 86 Wh | Lenovo ThinkPad P14s G3 AMD 21J6S05000 R7 PRO 6850U, Radeon 680M, 52.5 Wh | Lenovo ThinkPad P15v G3 21EM001AGE R7 PRO 6850H, RTX A2000 Laptop GPU, 68 Wh | HP ZBook Firefly 14 G9-6B8A2EA i7-1265U, T550 Laptop GPU, 51 Wh | |
|---|---|---|---|---|---|---|
| Autonomie de la batterie | 5% | 29% | 17% | 32% | -19% | |
| WiFi v1.3 (h) | 10.9 | 9.6 -12% | 6.3 -42% | 12.2 12% | 6.9 -37% | 8.8 -19% |
| Load (h) | 0.9 | 1.1 22% | 1.8 100% | 1.1 22% | 1.8 100% | |
| Reader / Idle (h) | 14.7 | 12 | ||||
| H.264 (h) | 12 | 10.7 |
Points positifs
Points négatifs
Verdict - La RTX 3000 Ada impressionne
Le Precision 5480 est une amélioration interne du Precision 5470 de l'année dernière. Les performances du processeur sont plus rapides et plus stables qu'auparavant, tandis que le GPU Ada est la véritable star du spectacle et la principale raison d'acheter le Precision 5480 plutôt que l'ancien Precision 5470. La consommation d'énergie est peut-être un peu plus élevée, mais l'autonomie de la batterie n'a pas changé de manière significative et l'augmentation des performances en vaut la peine pour les utilisateurs exigeants.
Le plus gros inconvénient de ce système est peut-être le bruit qu'il peut faire lorsqu'on appuie sur la pédale d'accélérateur. Bien que les performances par volume soient très élevées, toute cette puissance dans un boîtier aussi petit et portable a pour prix le bruit des ventilateurs. D'autres stations de travail de 14 pouces, comme le
Lenovo ThinkPad P14s ou leHP ZBook Firefly 14 G9 fonctionnent beaucoup plus silencieusement, mais vous devrez sacrifier une grande partie des performances graphiques en cours de route.L'ordinateur de 14 pouces Precision 5480 est destiné aux utilisateurs nomades qui savent qu'ils peuvent exploiter pleinement le GPU RTX 3000 Ada. Sinon, les alternatives de Lenovo et HP ont tendance à fonctionner beaucoup plus silencieusement et plus discrètement.
Prix et disponibilité
Dell commercialise désormais sa station de travail Precision 5480 à partir de 2070 USD pour la configuration Core i5 de base sans graphiques discrets et jusqu'à plus de 4400 USD pour notre configuration Core i7 RTX 3000 Ada.
Dell Precision 5480
- 09/15/2023 v7 (old)
Allen Ngo
Transparency
La sélection des appareils à examiner est effectuée par notre équipe éditoriale. L'échantillon de test a été prêté à l'auteur par le fabricant ou le détaillant pour les besoins de cet examen. Le prêteur n'a pas eu d'influence sur cette évaluation et le fabricant n'a pas reçu de copie de cette évaluation avant sa publication. Il n'y avait aucune obligation de publier cet article. En tant que média indépendant, Notebookcheck n'est pas soumis à l'autorité des fabricants, des détaillants ou des éditeurs.
Voici comment Notebookcheck teste
Chaque année, Notebookcheck examine de manière indépendante des centaines d'ordinateurs portables et de smartphones en utilisant des procédures standardisées afin de garantir que tous les résultats sont comparables. Nous avons continuellement développé nos méthodes de test depuis environ 20 ans et avons établi des normes industrielles dans le processus. Dans nos laboratoires de test, des équipements de mesure de haute qualité sont utilisés par des techniciens et des rédacteurs expérimentés. Ces tests impliquent un processus de validation en plusieurs étapes. Notre système d'évaluation complexe repose sur des centaines de mesures et de points de référence bien fondés, ce qui garantit l'objectivité.Price comparison

