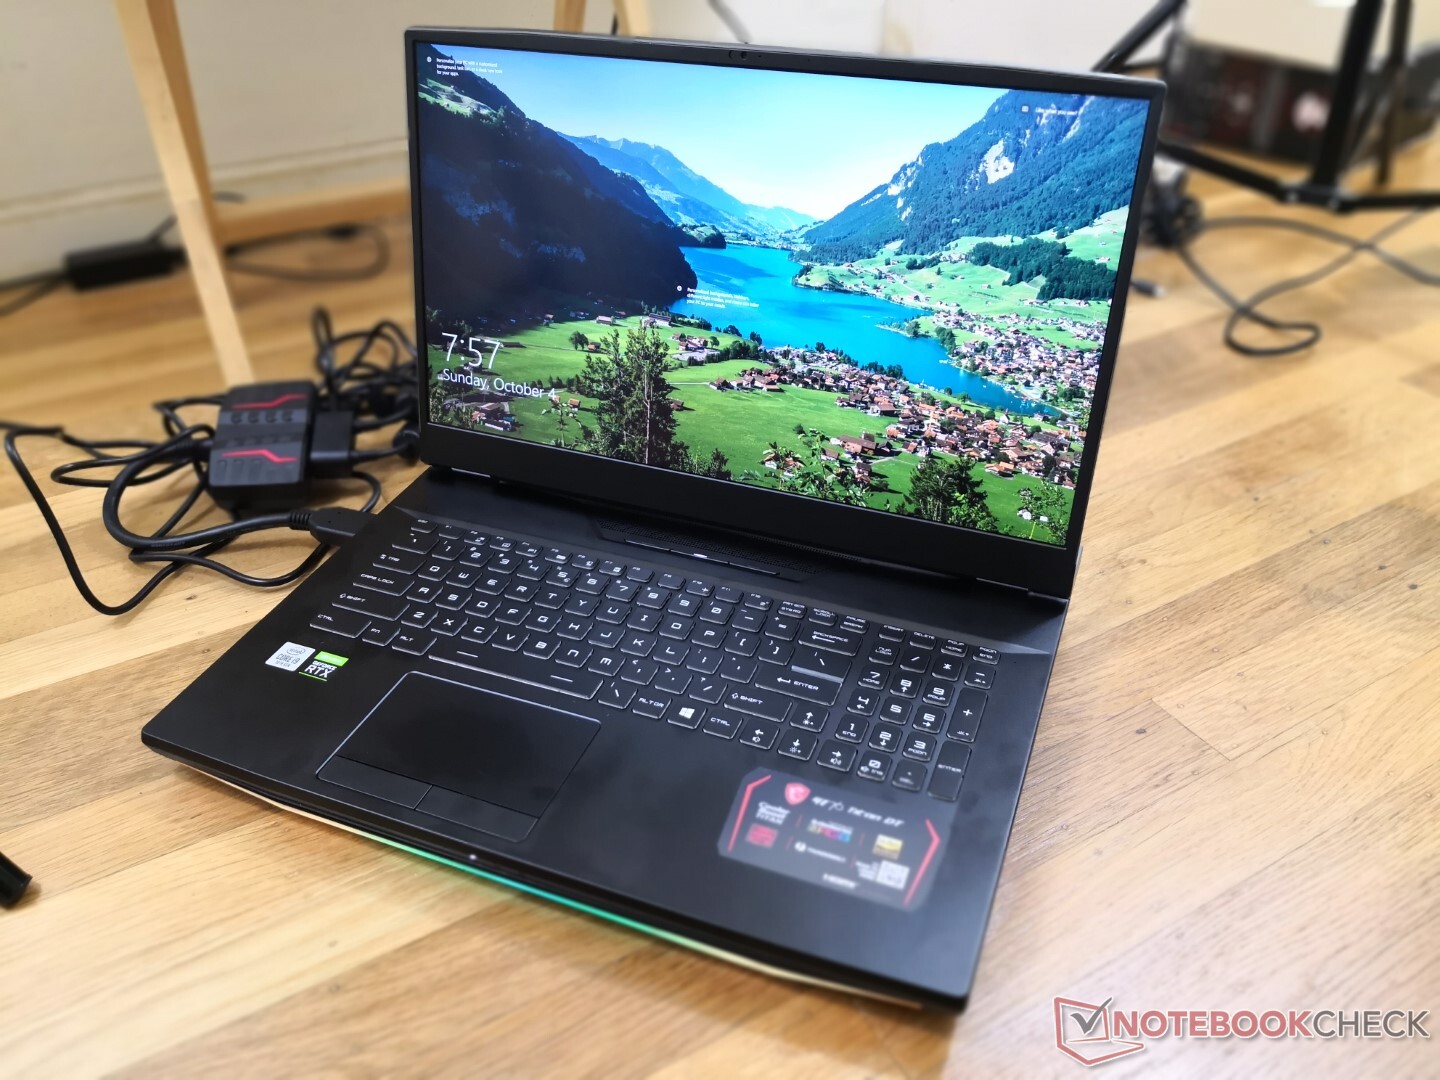
Test du MSI GT76 Titan DT 10SGS (i9-10900K, RTX 2080 Super, 4K UHD) : PC de jeu exotique daté
Note | Date | Modèle | Poids | Épaisseur | Taille | Résolution | Prix |
|---|---|---|---|---|---|---|---|
| 87.4 % v7 (old) | 10/20 | MSI GT76 Titan DT 10SGS i9-10900K, GeForce RTX 2080 Super Mobile | 4.2 kg | 42 mm | 17.30" | 3840x2160 | |
| 85.8 % v7 (old) | 10/19 | Asus ROG G703GXR i7-9750H, GeForce RTX 2080 Mobile | 4.7 kg | 48 mm | 17.30" | 1920x1080 | |
| 85.8 % v7 (old) | 04/19 | Alienware Area-51m i9-9900K RTX 2080 i9-9900K, GeForce RTX 2080 Mobile | 3.9 kg | 42 mm | 17.30" | 1920x1080 | |
| 82.7 % v7 (old) | 08/20 | Asus Strix Scar 17 G732LXS i9-10980HK, GeForce RTX 2080 Super Mobile | 2.9 kg | 26.5 mm | 17.30" | 1920x1080 | |
| 83.2 % v7 (old) | 03/20 | Schenker XMG Pro 17 PB71RD-G i7-9750H, GeForce RTX 2060 Mobile | 2.8 kg | 30 mm | 17.30" | 1920x1080 |
| SD Card Reader | |
| average JPG Copy Test (av. of 3 runs) | |
| Schenker XMG Pro 17 PB71RD-G (Toshiba Exceria Pro SDXC 64 GB UHS-II) | |
| Asus ROG G703GXR (Toshiba Exceria Pro SDXC 64 GB UHS-II) | |
| MSI GT76 Titan DT 10SGS (Toshiba Exceria Pro M501 UHS-II) | |
| MSI GE75 9SG (Toshiba Exceria Pro SDXC 64 GB UHS-II) | |
| maximum AS SSD Seq Read Test (1GB) | |
| Asus ROG G703GXR (Toshiba Exceria Pro SDXC 64 GB UHS-II) | |
| Schenker XMG Pro 17 PB71RD-G (Toshiba Exceria Pro SDXC 64 GB UHS-II) | |
| MSI GT76 Titan DT 10SGS (Toshiba Exceria Pro M501 UHS-II) | |
| MSI GE75 9SG (Toshiba Exceria Pro SDXC 64 GB UHS-II) | |

")
")
| |||||||||||||||||||||||||
Homogénéité de la luminosité: 93 %
Valeur mesurée au centre, sur batterie: 419.5 cd/m²
Contraste: 1049:1 (Valeurs des noirs: 0.4 cd/m²)
ΔE ColorChecker Calman: 3.4 | ∀{0.5-29.43 Ø4.71}
calibrated: 3.28
ΔE Greyscale Calman: 2 | ∀{0.09-98 Ø4.96}
97.9% sRGB (Argyll 1.6.3 3D)
84.6% AdobeRGB 1998 (Argyll 1.6.3 3D)
96.6% AdobeRGB 1998 (Argyll 3D)
98% sRGB (Argyll 3D)
82.5% Display P3 (Argyll 3D)
Gamma: 2.14
CCT: 6858 K
| MSI GT76 Titan DT 10SGS AU Optronics B173ZAN03.3, IPS, 17.3", 3840x2160 | Asus ROG G703GXR AU Optronics B173HAN04.0 (AUO409D), IPS, 17.3", 1920x1080 | Alienware Area-51m i9-9900K RTX 2080 LG Philips 173WFG, IPS, 17.3", 1920x1080 | Asus Strix Scar 17 G732LXS LQ173M1JW03 (SHP14DC), IPS, 17.3", 1920x1080 | Schenker XMG Pro 17 PB71RD-G AU Optronics B173HAN04.0 (AUO409D), IPS, 17.3", 1920x1080 | MSI GE75 9SG Chi Mei N173HCE-G33, AHVA, 17.3", 1920x1080 | MSI GT76 Titan DT 9SG Chi Mei N173HCE-G33 (CMN175C), IPS, 17.3", 1920x1080 | |
|---|---|---|---|---|---|---|---|
| Display | -21% | -17% | -13% | -22% | -22% | -21% | |
| Display P3 Coverage (%) | 82.5 | 63.2 -23% | 66.3 -20% | 71 -14% | 62.8 -24% | 61.5 -25% | 62.3 -24% |
| sRGB Coverage (%) | 98 | 92 -6% | 96.9 -1% | 99 1% | 89.8 -8% | 92 -6% | 93.4 -5% |
| AdobeRGB 1998 Coverage (%) | 96.6 | 64.7 -33% | 66.5 -31% | 71.6 -26% | 64.2 -34% | 63.5 -34% | 64.3 -33% |
| Response Times | 31% | 25% | 52% | 13% | 56% | 40% | |
| Response Time Grey 50% / Grey 80% * (ms) | 23.2 ? | 6.4 ? 72% | 13.2 ? 43% | 5.8 ? 75% | 16.8 ? 28% | 7.2 ? 69% | 8 ? 66% |
| Response Time Black / White * (ms) | 11.6 ? | 12.8 ? -10% | 10.8 ? 7% | 8.4 ? 28% | 12 ? -3% | 6.6 ? 43% | 10 ? 14% |
| PWM Frequency (Hz) | 26040 ? | 26040 ? | |||||
| Screen | -19% | -14% | -13% | -21% | 16% | 9% | |
| Brightness middle (cd/m²) | 419.5 | 290 -31% | 335.2 -20% | 310 -26% | 274 -35% | 400.7 -4% | 396 -6% |
| Brightness (cd/m²) | 413 | 281 -32% | 297 -28% | 311 -25% | 273 -34% | 372 -10% | 373 -10% |
| Brightness Distribution (%) | 93 | 91 -2% | 82 -12% | 82 -12% | 95 2% | 89 -4% | 89 -4% |
| Black Level * (cd/m²) | 0.4 | 0.2 50% | 0.66 -65% | 0.41 -2% | 0.26 35% | 0.34 15% | 0.33 17% |
| Contrast (:1) | 1049 | 1450 38% | 508 -52% | 756 -28% | 1054 0% | 1179 12% | 1200 14% |
| Colorchecker dE 2000 * | 3.4 | 4.77 -40% | 2.02 41% | 2.41 29% | 4.62 -36% | 1.33 61% | 2.04 40% |
| Colorchecker dE 2000 max. * | 7.4 | 9.08 -23% | 7.23 2% | 8.59 -16% | 7.66 -4% | 3.51 53% | 3.85 48% |
| Colorchecker dE 2000 calibrated * | 3.28 | 1.46 55% | 1.17 64% | 1.13 66% | 1.93 41% | 1.39 58% | 0.82 75% |
| Greyscale dE 2000 * | 2 | 5.83 -192% | 3.2 -60% | 4.3 -115% | 5.3 -165% | 1.3 35% | 2.83 -42% |
| Gamma | 2.14 103% | 2.47 89% | 2.16 102% | 2.149 102% | 2.34 94% | 2.24 98% | 2.49 88% |
| CCT | 6858 95% | 8076 80% | 6746 96% | 7059 92% | 7619 85% | 6735 97% | 7113 91% |
| Color Space (Percent of AdobeRGB 1998) (%) | 84.6 | 59 -30% | 61.3 -28% | 72 -15% | 58 -31% | 58.2 -31% | 59 -30% |
| Color Space (Percent of sRGB) (%) | 97.9 | 92 -6% | 96.9 -1% | 94 -4% | 90 -8% | 92.1 -6% | 94 -4% |
| Moyenne finale (programmes/paramètres) | -3% /
-13% | -2% /
-10% | 9% /
-5% | -10% /
-17% | 17% /
14% | 9% /
7% |
* ... Moindre est la valeur, meilleures sont les performances
Temps de réponse de l'écran
| ↔ Temps de réponse noir à blanc | ||
|---|---|---|
| 11.6 ms ... hausse ↗ et chute ↘ combinées | ↗ 6.4 ms hausse | 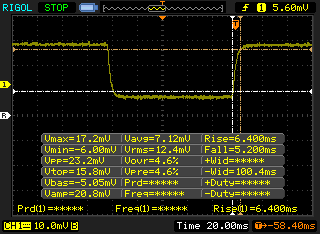 |
| ↘ 5.2 ms chute | ||
| L'écran montre de bons temps de réponse, mais insuffisant pour du jeu compétitif. En comparaison, tous les appareils testés affichent entre 0.1 (minimum) et 240 (maximum) ms. » 31 % des appareils testés affichent de meilleures performances. Cela signifie que les latences relevées sont meilleures que la moyenne (19.8 ms) de tous les appareils testés. | ||
| ↔ Temps de réponse gris 50% à gris 80% | ||
| 23.2 ms ... hausse ↗ et chute ↘ combinées | ↗ 12.4 ms hausse | 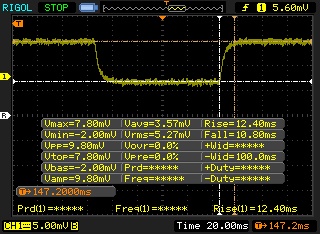 |
| ↘ 10.8 ms chute | ||
| L'écran montre de bons temps de réponse, mais insuffisant pour du jeu compétitif. En comparaison, tous les appareils testés affichent entre 0.165 (minimum) et 636 (maximum) ms. » 34 % des appareils testés affichent de meilleures performances. Cela signifie que les latences relevées sont meilleures que la moyenne (31 ms) de tous les appareils testés. | ||
Scintillement / MLI (Modulation de largeur d'impulsion)
| Scintillement / MLI (Modulation de largeur d'impulsion) non décelé |  | ||
En comparaison, 52 % des appareils testés n'emploient pas MDI pour assombrir leur écran. Nous avons relevé une moyenne à 7754 (minimum : 5 - maximum : 343500) Hz dans le cas où une MDI était active. | |||
Cinebench R15: CPU Multi 64Bit | CPU Single 64Bit
Blender: v2.79 BMW27 CPU
7-Zip 18.03: 7z b 4 -mmt1 | 7z b 4
Geekbench 5.5: Single-Core | Multi-Core
HWBOT x265 Benchmark v2.2: 4k Preset
LibreOffice : 20 Documents To PDF
R Benchmark 2.5: Overall mean
| Cinebench R20 / CPU (Multi Core) | |
| KFA2 GeForce GTX 1650 EX One Click Plus | |
| MSI GT76 Titan DT 10SGS | |
| Moyenne Intel Core i9-10900K (5825 - 6381, n=3) | |
| MSI GT76 Titan DT 9SG | |
| Eluktronics RP-17 | |
| Alienware m17 R3 P45E | |
| Eurocom Sky X4C i9-9900KS | |
| Asus Zephyrus G14 GA401IV | |
| Alienware m17 R2 P41E | |
| MSI GE65 Raider 9SF-049US | |
| Gigabyte Aero 15-Y9 | |
| Cinebench R20 / CPU (Single Core) | |
| Moyenne Intel Core i9-10900K (493 - 532, n=3) | |
| MSI GT76 Titan DT 9SG | |
| Eurocom Sky X4C i9-9900KS | |
| KFA2 GeForce GTX 1650 EX One Click Plus | |
| Asus Zephyrus G14 GA401IV | |
| MSI GT76 Titan DT 10SGS | |
| Eluktronics RP-17 | |
| Alienware m17 R2 P41E | |
| MSI GE65 Raider 9SF-049US | |
| Alienware m17 R3 P45E | |
| Gigabyte Aero 15-Y9 | |
| Cinebench R15 / CPU Multi 64Bit | |
| KFA2 GeForce GTX 1650 EX One Click Plus | |
| Moyenne Intel Core i9-10900K (2513 - 2620, n=3) | |
| MSI GT76 Titan DT 10SGS | |
| MSI GT76 Titan DT 9SG | |
| Eurocom Sky X4C i9-9900KS | |
| Eluktronics RP-17 | |
| Asus Zephyrus G14 GA401IV | |
| Alienware m17 R3 P45E | |
| Alienware m17 R2 P41E | |
| MSI GE65 Raider 9SF-049US | |
| Gigabyte Aero 15-Y9 | |
| Cinebench R15 / CPU Single 64Bit | |
| Moyenne Intel Core i9-10900K (206 - 224, n=3) | |
| Eurocom Sky X4C i9-9900KS | |
| MSI GT76 Titan DT 9SG | |
| Alienware m17 R3 P45E | |
| MSI GT76 Titan DT 10SGS | |
| KFA2 GeForce GTX 1650 EX One Click Plus | |
| MSI GE65 Raider 9SF-049US | |
| Alienware m17 R2 P41E | |
| Gigabyte Aero 15-Y9 | |
| Asus Zephyrus G14 GA401IV | |
| Eluktronics RP-17 | |
| Blender / v2.79 BMW27 CPU | |
| Asus Zephyrus G14 GA401IV | |
| Eluktronics RP-17 | |
| Eurocom Sky X4C i9-9900KS | |
| Alienware m17 R3 P45E | |
| MSI GT76 Titan DT 10SGS | |
| Moyenne Intel Core i9-10900K (167.3 - 190, n=3) | |
| KFA2 GeForce GTX 1650 EX One Click Plus | |
| 7-Zip 18.03 / 7z b 4 -mmt1 | |
| Moyenne Intel Core i9-10900K (5349 - 5954, n=3) | |
| Eurocom Sky X4C i9-9900KS | |
| Alienware m17 R3 P45E | |
| MSI GT76 Titan DT 10SGS | |
| KFA2 GeForce GTX 1650 EX One Click Plus | |
| Asus Zephyrus G14 GA401IV | |
| Eluktronics RP-17 | |
| 7-Zip 18.03 / 7z b 4 | |
| KFA2 GeForce GTX 1650 EX One Click Plus | |
| Moyenne Intel Core i9-10900K (67252 - 70968, n=3) | |
| MSI GT76 Titan DT 10SGS | |
| Eurocom Sky X4C i9-9900KS | |
| Eluktronics RP-17 | |
| Asus Zephyrus G14 GA401IV | |
| Alienware m17 R3 P45E | |
| Geekbench 5.5 / Single-Core | |
| Moyenne Intel Core i9-10900K (1336 - 1449, n=3) | |
| Eurocom Sky X4C i9-9900KS | |
| Alienware m17 R3 P45E | |
| MSI GT76 Titan DT 10SGS | |
| MSI GT76 Titan DT 9SG | |
| KFA2 GeForce GTX 1650 EX One Click Plus | |
| KFA2 GeForce GTX 1650 EX One Click Plus | |
| Asus Zephyrus G14 GA401IV | |
| Eluktronics RP-17 | |
| Geekbench 5.5 / Multi-Core | |
| Moyenne Intel Core i9-10900K (10725 - 11414, n=3) | |
| KFA2 GeForce GTX 1650 EX One Click Plus | |
| KFA2 GeForce GTX 1650 EX One Click Plus | |
| MSI GT76 Titan DT 10SGS | |
| Eurocom Sky X4C i9-9900KS | |
| MSI GT76 Titan DT 9SG | |
| Alienware m17 R3 P45E | |
| Eluktronics RP-17 | |
| Asus Zephyrus G14 GA401IV | |
| HWBOT x265 Benchmark v2.2 / 4k Preset | |
| KFA2 GeForce GTX 1650 EX One Click Plus | |
| MSI GT76 Titan DT 10SGS | |
| Moyenne Intel Core i9-10900K (18.2 - 21, n=3) | |
| Eurocom Sky X4C i9-9900KS | |
| Alienware m17 R3 P45E | |
| Eluktronics RP-17 | |
| Asus Zephyrus G14 GA401IV | |
| LibreOffice / 20 Documents To PDF | |
| Eluktronics RP-17 | |
| KFA2 GeForce GTX 1650 EX One Click Plus | |
| Moyenne Intel Core i9-10900K (46.2 - 76, n=3) | |
| Alienware m17 R3 P45E | |
| MSI GT76 Titan DT 10SGS | |
| R Benchmark 2.5 / Overall mean | |
| Eluktronics RP-17 | |
| MSI GT76 Titan DT 10SGS | |
| Alienware m17 R3 P45E | |
| Moyenne Intel Core i9-10900K (0.528 - 0.567, n=3) | |
| KFA2 GeForce GTX 1650 EX One Click Plus | |
* ... Moindre est la valeur, meilleures sont les performances
| PCMark 8 | |
| Home Score Accelerated v2 | |
| Alienware Area-51m i9-9900K RTX 2080 | |
| Moyenne de la classe Gaming (n=12 dernières années) | |
| MSI GT76 Titan DT 10SGS | |
| MSI GE75 9SG | |
| Work Score Accelerated v2 | |
| Alienware Area-51m i9-9900K RTX 2080 | |
| MSI GE75 9SG | |
| MSI GT76 Titan DT 10SGS | |
| Moyenne de la classe Gaming (n=12 dernières années) | |
| PCMark 8 Home Score Accelerated v2 | 4678 points | |
| PCMark 8 Work Score Accelerated v2 | 4889 points | |
| PCMark 10 Score | 7358 points | |
Aide | ||
| DPC Latencies / LatencyMon - interrupt to process latency (max), Web, Youtube, Prime95 | |
| MSI GT76 Titan DT 10SGS | |
| Asus Strix Scar 17 G732LXS | |
| Asus Zephyrus G14 GA401IV | |
| Eluktronics RP-17 | |
| Alienware m17 R3 P45E | |
* ... Moindre est la valeur, meilleures sont les performances
| MSI GT76 Titan DT 10SGS 2x WDC PC SN730 SDBPNTY-1T00 (RAID 0) | Alienware Area-51m i9-9900K RTX 2080 2x SK Hynix PC400 512GB (RAID 0) | Asus Strix Scar 17 G732LXS 2x Intel SSD 660p 1TB SSDPEKNW010T8 (RAID 0) | MSI GE75 9SG Samsung SSD PM981 MZVLB1T0HALR | MSI GT76 Titan DT 9SG 2x Samsung PM961 MZVLW256HEHP (RAID 0) | |
|---|---|---|---|---|---|
| AS SSD | -20% | -29% | -11% | -16% | |
| Seq Read (MB/s) | 2406 | 2082 -13% | 2450 2% | 1358 -44% | 2646 10% |
| Seq Write (MB/s) | 2867 | 2335 -19% | 1436 -50% | 2381 -17% | 2214 -23% |
| 4K Read (MB/s) | 41.51 | 24.14 -42% | 49.48 19% | 27.02 -35% | 30.42 -27% |
| 4K Write (MB/s) | 108.8 | 91.8 -16% | 119.4 10% | 89.2 -18% | 95.9 -12% |
| 4K-64 Read (MB/s) | 1525 | 1561 2% | 1032 -32% | 1642 8% | 1609 6% |
| 4K-64 Write (MB/s) | 1424 | 1350 -5% | 1229 -14% | 1799 26% | 1573 10% |
| Access Time Read * (ms) | 0.041 | 0.121 -195% | 0.145 -254% | 0.067 -63% | 0.128 -212% |
| Access Time Write * (ms) | 0.102 | 0.039 62% | 0.036 65% | 0.05 51% | 0.039 62% |
| Score Read (Points) | 1807 | 1793 -1% | 1327 -27% | 1805 0% | 1904 5% |
| Score Write (Points) | 1819 | 1675 -8% | 1492 -18% | 2127 17% | 1890 4% |
| Score Total (Points) | 4573 | 4390 -4% | 3456 -24% | 4899 7% | 4740 4% |
| Copy ISO MB/s (MB/s) | 2605 | 2175 -17% | 3193 23% | ||
| Copy Program MB/s (MB/s) | 651 | 582 -11% | 198.2 -70% | ||
| Copy Game MB/s (MB/s) | 1709 | 1479 -13% | 1054 -38% | ||
| CrystalDiskMark 5.2 / 6 | 3% | -7% | -16% | -12% | |
| Write 4K (MB/s) | 116.4 | 111.1 -5% | 125.8 8% | 116.1 0% | 101.4 -13% |
| Read 4K (MB/s) | 43.85 | 45.47 4% | 52.9 21% | 44.98 3% | 40.57 -7% |
| Write Seq (MB/s) | 2927 | 2454 -16% | 1795 -39% | 2370 -19% | 2229 -24% |
| Read Seq (MB/s) | 1997 | 2212 11% | 2315 16% | 1465 -27% | 2528 27% |
| Write 4K Q32T1 (MB/s) | 467.6 | 622 33% | 407.1 -13% | 337.5 -28% | 379.6 -19% |
| Read 4K Q32T1 (MB/s) | 538 | 695 29% | 411.9 -23% | 453.6 -16% | 421.9 -22% |
| Write Seq Q32T1 (MB/s) | 3362 | 2675 -20% | 2844 -15% | 2399 -29% | 2439 -27% |
| Read Seq Q32T1 (MB/s) | 3558 | 3184 -11% | 3130 -12% | 3087 -13% | 3199 -10% |
| Moyenne finale (programmes/paramètres) | -9% /
-12% | -18% /
-20% | -14% /
-13% | -14% /
-14% |
* ... Moindre est la valeur, meilleures sont les performances

Disk Throttling: DiskSpd Read Loop, Queue Depth 8
| 3DMark 11 Performance | 29634 points | |
| 3DMark Cloud Gate Standard Score | 56456 points | |
| 3DMark Fire Strike Score | 21653 points | |
| 3DMark Time Spy Score | 11010 points | |
Aide | ||
| GTA V | |
| 1920x1080 Lowest Settings possible | |
| MSI GT76 Titan DT 10SGS | |
| Moyenne NVIDIA GeForce RTX 2080 Super Mobile (182 - 185, n=2) | |
| Asus Strix Scar 17 G732LXS | |
| Aorus 17G XB | |
| 3840x2160 Highest AA:4xMSAA + FX AF:16x | |
| Moyenne NVIDIA GeForce RTX 2080 Super Mobile (47.9 - 49.3, n=3) | |
| MSI GT76 Titan DT 10SGS | |
| 3840x2160 High/On (Advanced Graphics Off) AA:FX AF:8x | |
| KFA2 GeForce RTX 2080 Ti EX | |
| Asus ROG Strix RTX 2080 OC | |
| Nvidia GeForce RTX 2080 Super | |
| Asus ROG Strix RTX 2070 OC | |
| Nvidia GeForce RTX 2070 Super | |
| Moyenne NVIDIA GeForce RTX 2080 Super Mobile (96 - 98.9, n=2) | |
| MSI GT76 Titan DT 10SGS | |
| Gigabyte Aero 15-Y9 | |
| Strange Brigade | |
| 1280x720 lowest AF:1 | |
| MSI GT76 Titan DT 10SGS | |
| Moyenne NVIDIA GeForce RTX 2080 Super Mobile (n=1) | |
| KFA2 GeForce GTX 1650 EX One Click Plus | |
| 1920x1080 high AA:high AF:8 | |
| MSI GT76 Titan DT 10SGS | |
| Moyenne NVIDIA GeForce RTX 2080 Super Mobile (n=1) | |
| KFA2 GeForce GTX 1650 EX One Click Plus | |
| 1920x1080 ultra AA:ultra AF:16 | |
| MSI GT76 Titan DT 10SGS | |
| Moyenne NVIDIA GeForce RTX 2080 Super Mobile (n=1) | |
| KFA2 GeForce GTX 1650 EX One Click Plus | |
| Bas | Moyen | Élevé | Ultra | QHD | 4K | |
|---|---|---|---|---|---|---|
| GTA V (2015) | 185 | 183 | 176 | 101 | 90.2 | 96 |
| The Witcher 3 (2015) | 471.7 | 332 | 223.2 | 113.2 | 80.5 | |
| Dota 2 Reborn (2015) | 179 | 163 | 158 | 148 | 136 | |
| Final Fantasy XV Benchmark (2018) | 196 | 140 | 107 | 80.2 | 47 | |
| X-Plane 11.11 (2018) | 138 | 122 | 98 | 84.2 | ||
| Strange Brigade (2018) | 515 | 265 | 217 | 183 | 137 | 78.4 |
| MSI GT76 Titan DT 10SGS GeForce RTX 2080 Super Mobile, i9-10900K, 2x WDC PC SN730 SDBPNTY-1T00 (RAID 0) | Asus ROG G703GXR GeForce RTX 2080 Mobile, i7-9750H, Samsung SSD PM981 MZVLB512HAJQ | Alienware Area-51m i9-9900K RTX 2080 GeForce RTX 2080 Mobile, i9-9900K, 2x SK Hynix PC400 512GB (RAID 0) | Asus Strix Scar 17 G732LXS GeForce RTX 2080 Super Mobile, i9-10980HK, 2x Intel SSD 660p 1TB SSDPEKNW010T8 (RAID 0) | Schenker XMG Pro 17 PB71RD-G GeForce RTX 2060 Mobile, i7-9750H, Samsung SSD 970 EVO Plus 500GB | MSI GE75 9SG GeForce RTX 2080 Mobile, i9-9880H, Samsung SSD PM981 MZVLB1T0HALR | MSI GT76 Titan DT 9SG GeForce RTX 2080 Mobile, i9-9900K, 2x Samsung PM961 MZVLW256HEHP (RAID 0) | |
|---|---|---|---|---|---|---|---|
| Noise | -9% | -16% | -21% | -15% | -5% | -19% | |
| arrêt / environnement * (dB) | 26.4 | 30 -14% | 28.1 -6% | 25 5% | 30 -14% | 28.2 -7% | 30 -14% |
| Idle Minimum * (dB) | 27.5 | 33 -20% | 28.1 -2% | 33 -20% | 30 -9% | 30.4 -11% | 33 -20% |
| Idle Average * (dB) | 27.5 | 34 -24% | 28.6 -4% | 38 -38% | 32 -16% | 30.4 -11% | 34 -24% |
| Idle Maximum * (dB) | 29.8 | 35 -17% | 51 -71% | 45 -51% | 39 -31% | 33.4 -12% | 44 -48% |
| Load Average * (dB) | 30.9 | 38 -23% | 51 -65% | 54 -75% | 51 -65% | 37.1 -20% | 47 -52% |
| Witcher 3 ultra * (dB) | 60.7 | 50 18% | 51 16% | 50 18% | 54 11% | 54.2 11% | 53 13% |
| Load Maximum * (dB) | 66.6 | 54 19% | 51 23% | 55 17% | 54 19% | 56.4 15% | 59 11% |
* ... Moindre est la valeur, meilleures sont les performances
Degré de la nuisance sonore
| Au repos |
| 27.5 / 27.5 / 29.8 dB(A) |
| Fortement sollicité |
| 30.9 / 66.6 dB(A) |
 | ||
30 dB silencieux 40 dB(A) audible 50 dB(A) bruyant |
||
min: | ||
(+) La température maximale du côté supérieur est de 36.4 °C / 98 F, par rapport à la moyenne de 40.4 °C / 105 F, allant de 21.2 à 68.8 °C pour la classe Gaming.
(±) Le fond chauffe jusqu'à un maximum de 43 °C / 109 F, contre une moyenne de 43.2 °C / 110 F
(+) En utilisation inactive, la température moyenne du côté supérieur est de 27.3 °C / 81 F, par rapport à la moyenne du dispositif de 33.9 °C / 93 F.
(±) En jouant à The Witcher 3, la température moyenne du côté supérieur est de 34.8 °C / 95 F, alors que la moyenne de l'appareil est de 33.9 °C / 93 F.
(+) Les repose-poignets et le pavé tactile sont plus froids que la température de la peau avec un maximum de 31.6 °C / 88.9 F et sont donc froids au toucher.
(-) La température moyenne de la zone de l'appui-paume de dispositifs similaires était de 28.8 °C / 83.8 F (-2.8 °C / #-5.1 F).
MSI GT76 Titan DT 10SGS analyse audio
(+) | les haut-parleurs peuvent jouer relativement fort (83.2# dB)
Basses 100 - 315 Hz
(±) | basse réduite - en moyenne 8.6% inférieure à la médiane
(±) | la linéarité des basses est moyenne (11% delta à la fréquence précédente)
Médiums 400 - 2000 Hz
(+) | médiane équilibrée - seulement 3.1% de la médiane
(+) | les médiums sont linéaires (6.9% delta à la fréquence précédente)
Aiguës 2 - 16 kHz
(+) | des sommets équilibrés - à seulement 3% de la médiane
(+) | les aigus sont linéaires (5.5% delta à la fréquence précédente)
Globalement 100 - 16 000 Hz
(+) | le son global est linéaire (9.9% différence à la médiane)
Par rapport à la même classe
» 5% de tous les appareils testés de cette catégorie étaient meilleurs, 2% similaires, 94% pires
» Le meilleur avait un delta de 6%, la moyenne était de 18%, le pire était de 132%.
Par rapport à tous les appareils testés
» 4% de tous les appareils testés étaient meilleurs, 1% similaires, 95% pires
» Le meilleur avait un delta de 4%, la moyenne était de 23%, le pire était de 134%.
Apple MacBook 12 (Early 2016) 1.1 GHz analyse audio
(+) | les haut-parleurs peuvent jouer relativement fort (83.6# dB)
Basses 100 - 315 Hz
(±) | basse réduite - en moyenne 11.3% inférieure à la médiane
(±) | la linéarité des basses est moyenne (14.2% delta à la fréquence précédente)
Médiums 400 - 2000 Hz
(+) | médiane équilibrée - seulement 2.4% de la médiane
(+) | les médiums sont linéaires (5.5% delta à la fréquence précédente)
Aiguës 2 - 16 kHz
(+) | des sommets équilibrés - à seulement 2% de la médiane
(+) | les aigus sont linéaires (4.5% delta à la fréquence précédente)
Globalement 100 - 16 000 Hz
(+) | le son global est linéaire (10.2% différence à la médiane)
Par rapport à la même classe
» 7% de tous les appareils testés de cette catégorie étaient meilleurs, 2% similaires, 90% pires
» Le meilleur avait un delta de 5%, la moyenne était de 18%, le pire était de 53%.
Par rapport à tous les appareils testés
» 5% de tous les appareils testés étaient meilleurs, 1% similaires, 94% pires
» Le meilleur avait un delta de 4%, la moyenne était de 23%, le pire était de 134%.
| Éteint/en veille | |
| Au repos | |
| Fortement sollicité |
|
Légende:
min: | |
| MSI GT76 Titan DT 10SGS i9-10900K, GeForce RTX 2080 Super Mobile, 2x WDC PC SN730 SDBPNTY-1T00 (RAID 0), IPS, 3840x2160, 17.3" | Asus ROG G703GXR i7-9750H, GeForce RTX 2080 Mobile, Samsung SSD PM981 MZVLB512HAJQ, IPS, 1920x1080, 17.3" | Alienware Area-51m i9-9900K RTX 2080 i9-9900K, GeForce RTX 2080 Mobile, 2x SK Hynix PC400 512GB (RAID 0), IPS, 1920x1080, 17.3" | Asus Strix Scar 17 G732LXS i9-10980HK, GeForce RTX 2080 Super Mobile, 2x Intel SSD 660p 1TB SSDPEKNW010T8 (RAID 0), IPS, 1920x1080, 17.3" | Schenker XMG Pro 17 PB71RD-G i7-9750H, GeForce RTX 2060 Mobile, Samsung SSD 970 EVO Plus 500GB, IPS, 1920x1080, 17.3" | MSI GE75 9SG i9-9880H, GeForce RTX 2080 Mobile, Samsung SSD PM981 MZVLB1T0HALR, AHVA, 1920x1080, 17.3" | MSI GT76 Titan DT 9SG i9-9900K, GeForce RTX 2080 Mobile, 2x Samsung PM961 MZVLW256HEHP (RAID 0), IPS, 1920x1080, 17.3" | |
|---|---|---|---|---|---|---|---|
| Power Consumption | 13% | 7% | 22% | 48% | 38% | 30% | |
| Idle Minimum * (Watt) | 25.9 | 27 -4% | 23.3 10% | 16 38% | 11 58% | 13.9 46% | 14 46% |
| Idle Average * (Watt) | 38 | 32 16% | 33.5 12% | 25 34% | 18 53% | 18.8 51% | 18 53% |
| Idle Maximum * (Watt) | 53.2 | 39 27% | 38.4 28% | 35 34% | 28 47% | 23.1 57% | 23 57% |
| Load Average * (Watt) | 123.8 | 124 -0% | 114.1 8% | 177 -43% | 99 20% | 112.3 9% | 114 8% |
| Witcher 3 ultra * (Watt) | 312.5 | 274 12% | 339.5 -9% | 227 27% | 146 53% | 231 26% | 283 9% |
| Load Maximum * (Watt) | 459.8 | 338 26% | 485.1 -6% | 280 39% | 210 54% | 291.5 37% | 443 4% |
* ... Moindre est la valeur, meilleures sont les performances
| MSI GT76 Titan DT 10SGS i9-10900K, GeForce RTX 2080 Super Mobile, 90 Wh | Asus ROG G703GXR i7-9750H, GeForce RTX 2080 Mobile, 96 Wh | Alienware Area-51m i9-9900K RTX 2080 i9-9900K, GeForce RTX 2080 Mobile, 90 Wh | Asus Strix Scar 17 G732LXS i9-10980HK, GeForce RTX 2080 Super Mobile, 66 Wh | Schenker XMG Pro 17 PB71RD-G i7-9750H, GeForce RTX 2060 Mobile, 62 Wh | MSI GE75 9SG i9-9880H, GeForce RTX 2080 Mobile, 65 Wh | MSI GT76 Titan DT 9SG i9-9900K, GeForce RTX 2080 Mobile, 90 Wh | |
|---|---|---|---|---|---|---|---|
| Autonomie de la batterie | 154% | -12% | 146% | 71% | 104% | 108% | |
| WiFi v1.3 (h) | 2.4 | 6.1 154% | 2.1 -12% | 5.9 146% | 4.1 71% | 4.9 104% | 5 108% |
| Reader / Idle (h) | 8.1 | 2.6 | 10 | 5.2 | 6.8 | ||
| Load (h) | 1 | 1.1 | 1.5 | 1.3 | 0.9 |
Points positifs
Points négatifs
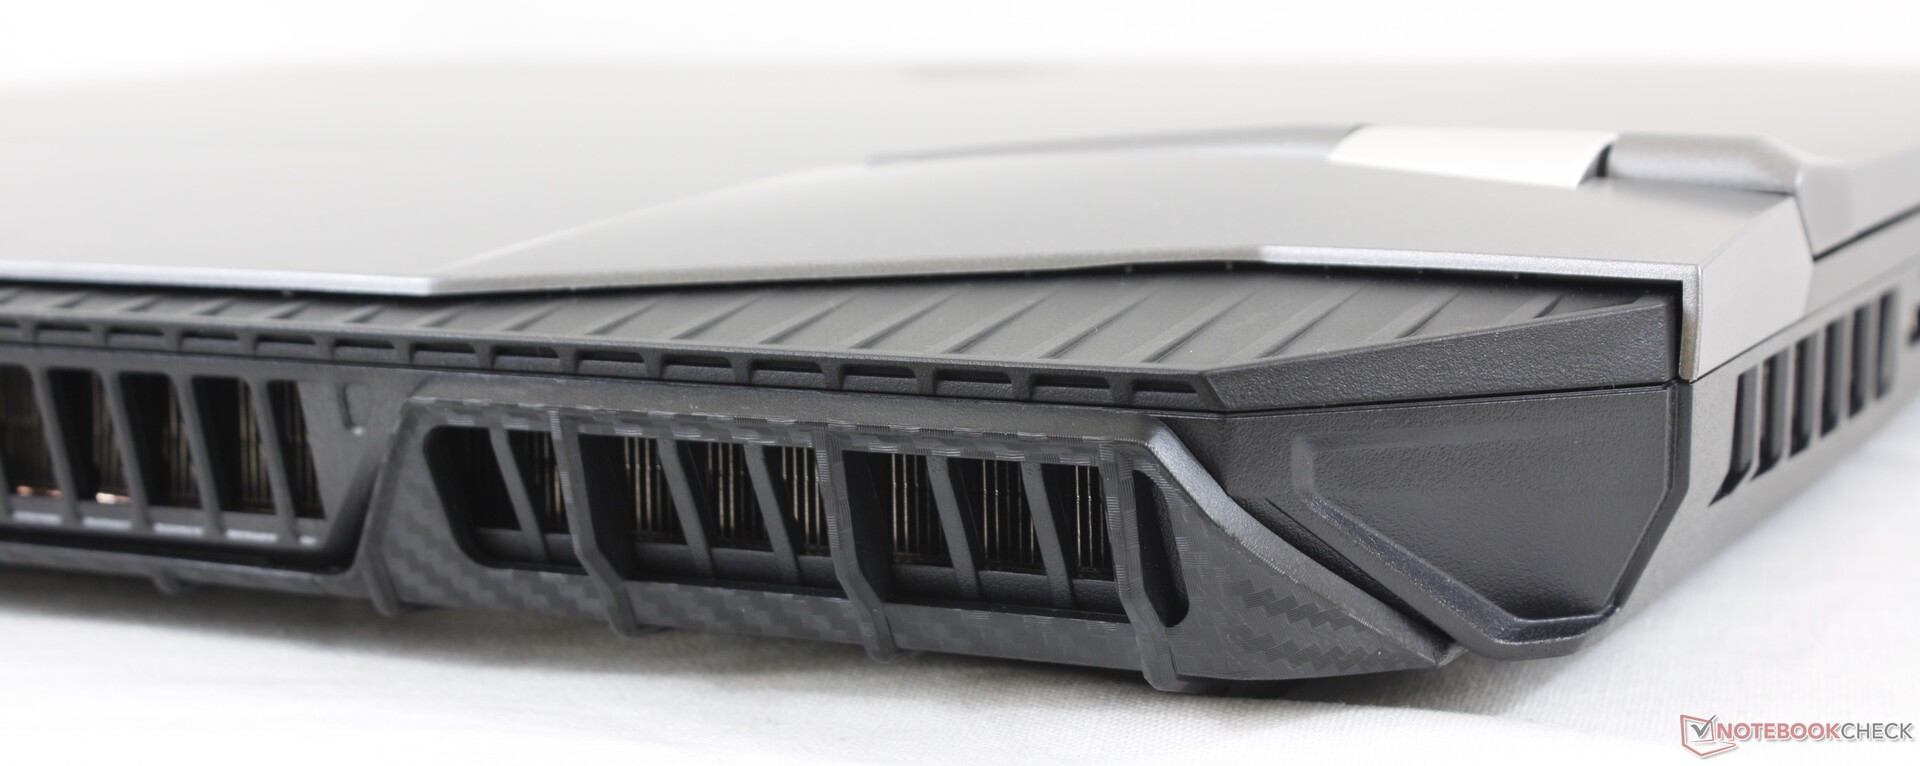
Le GT76 Titan possède un avantage sur le Dell Alienware Area-51m et sur l'Asus ROG G703 : les températures internes. Le système MSI fait moins chauffer son processeur lors de tâches exigeantes comme le jeu, ce qui n'est pas complètement surprenant : le réseau de 11 caloducs internes est ce que nous avons vu de plus complet sur un PC de 17,3 pouces. Le processeur et la carte graphique sont refroidis indépendamment, sans caloducs qui se superposent, permettant de soutenir l'overclocking.
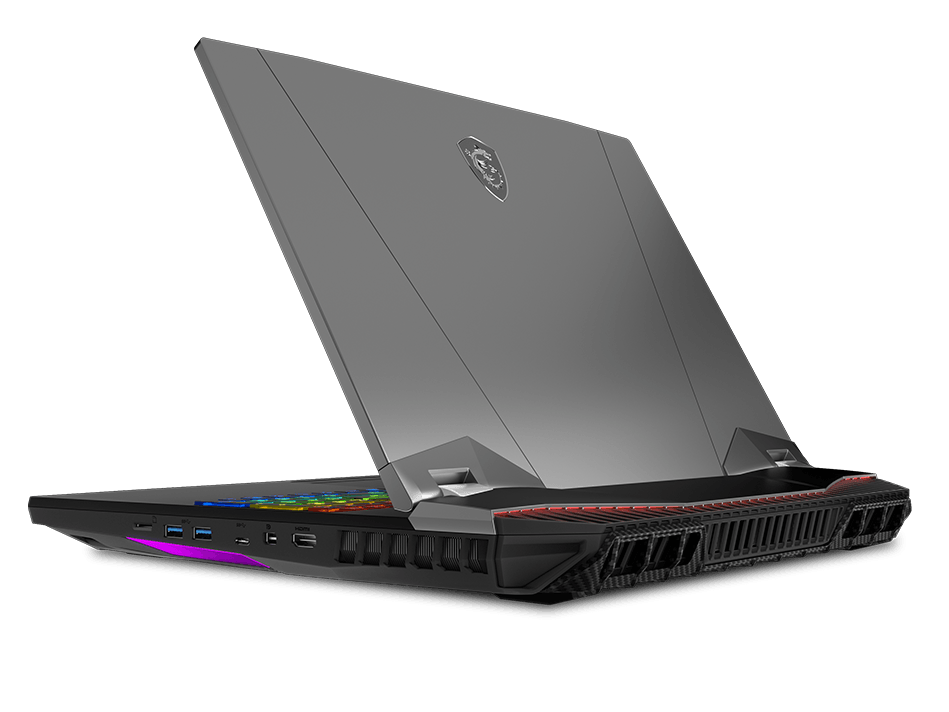
Parmi les autres points du PC, on notera un châssis robuste, une maintenance aisée, et l'écran 4K UHD 120 Hz, qui n'est pas encore très répandu.
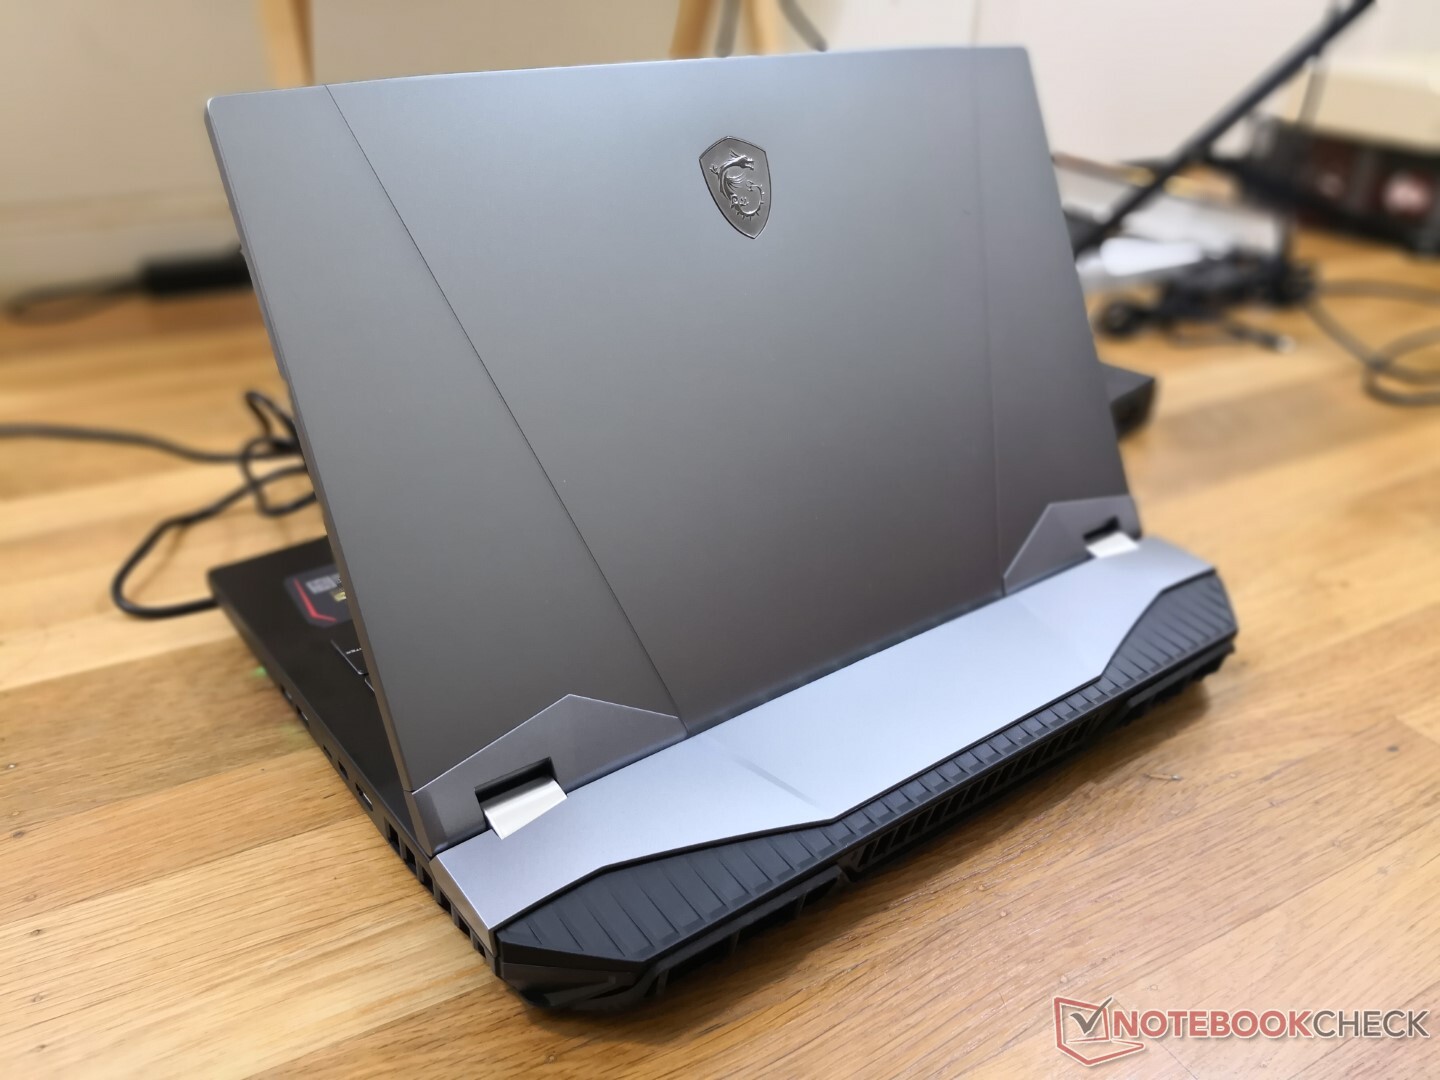
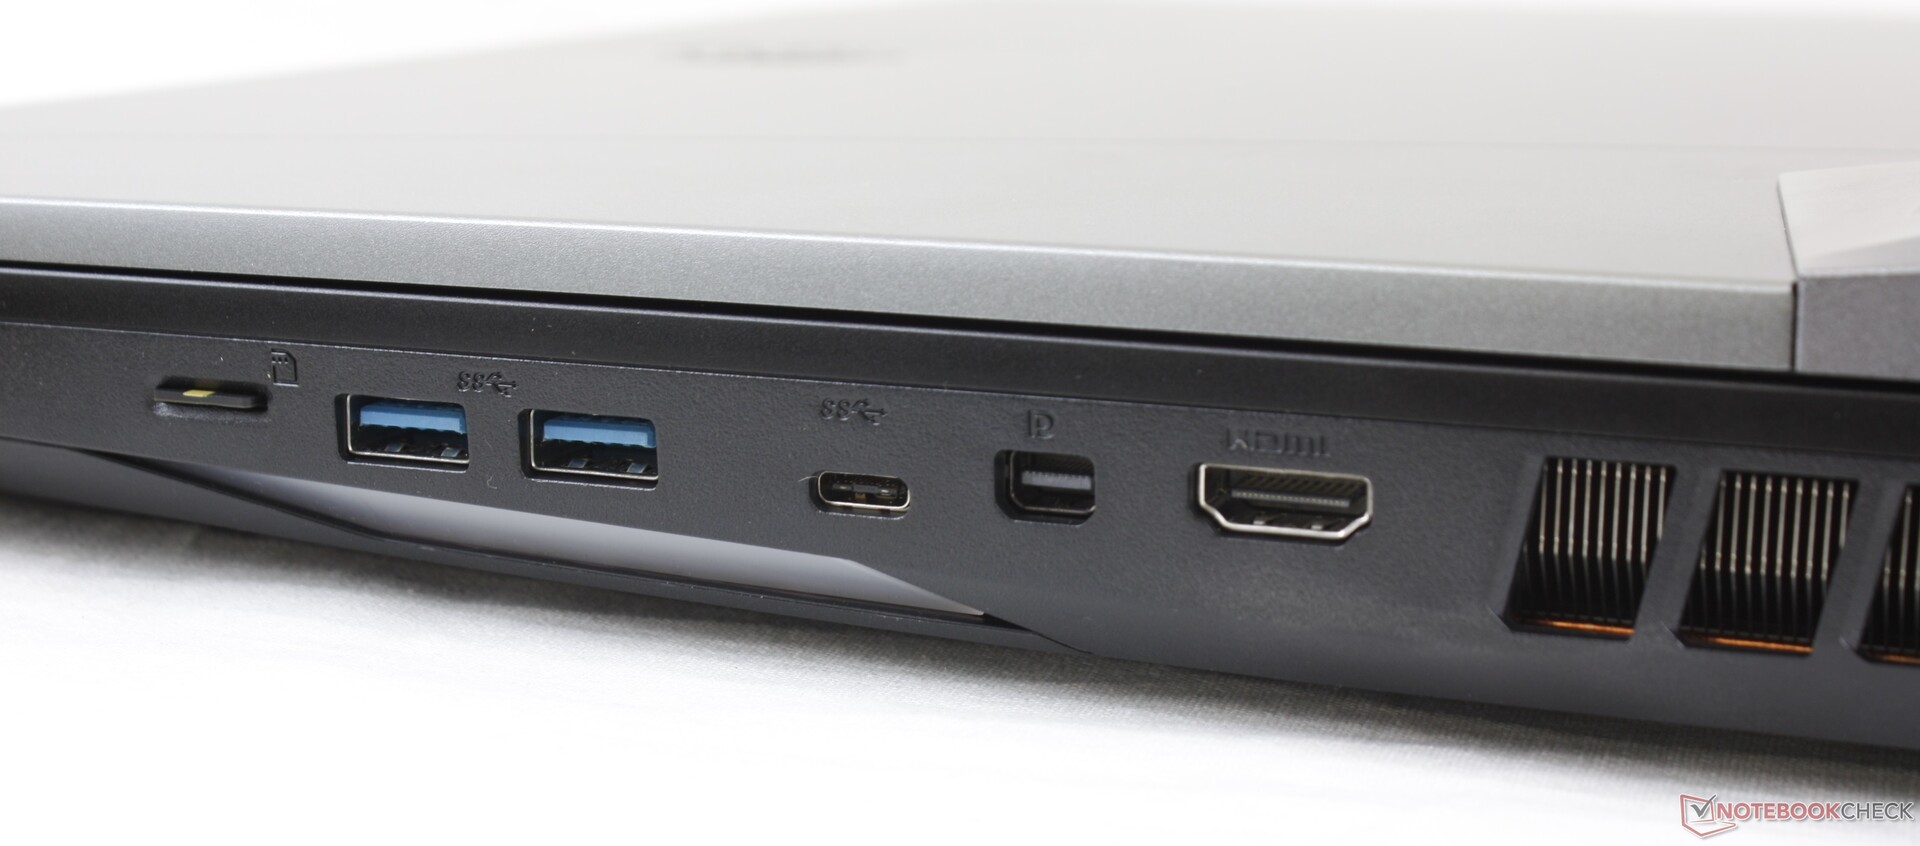
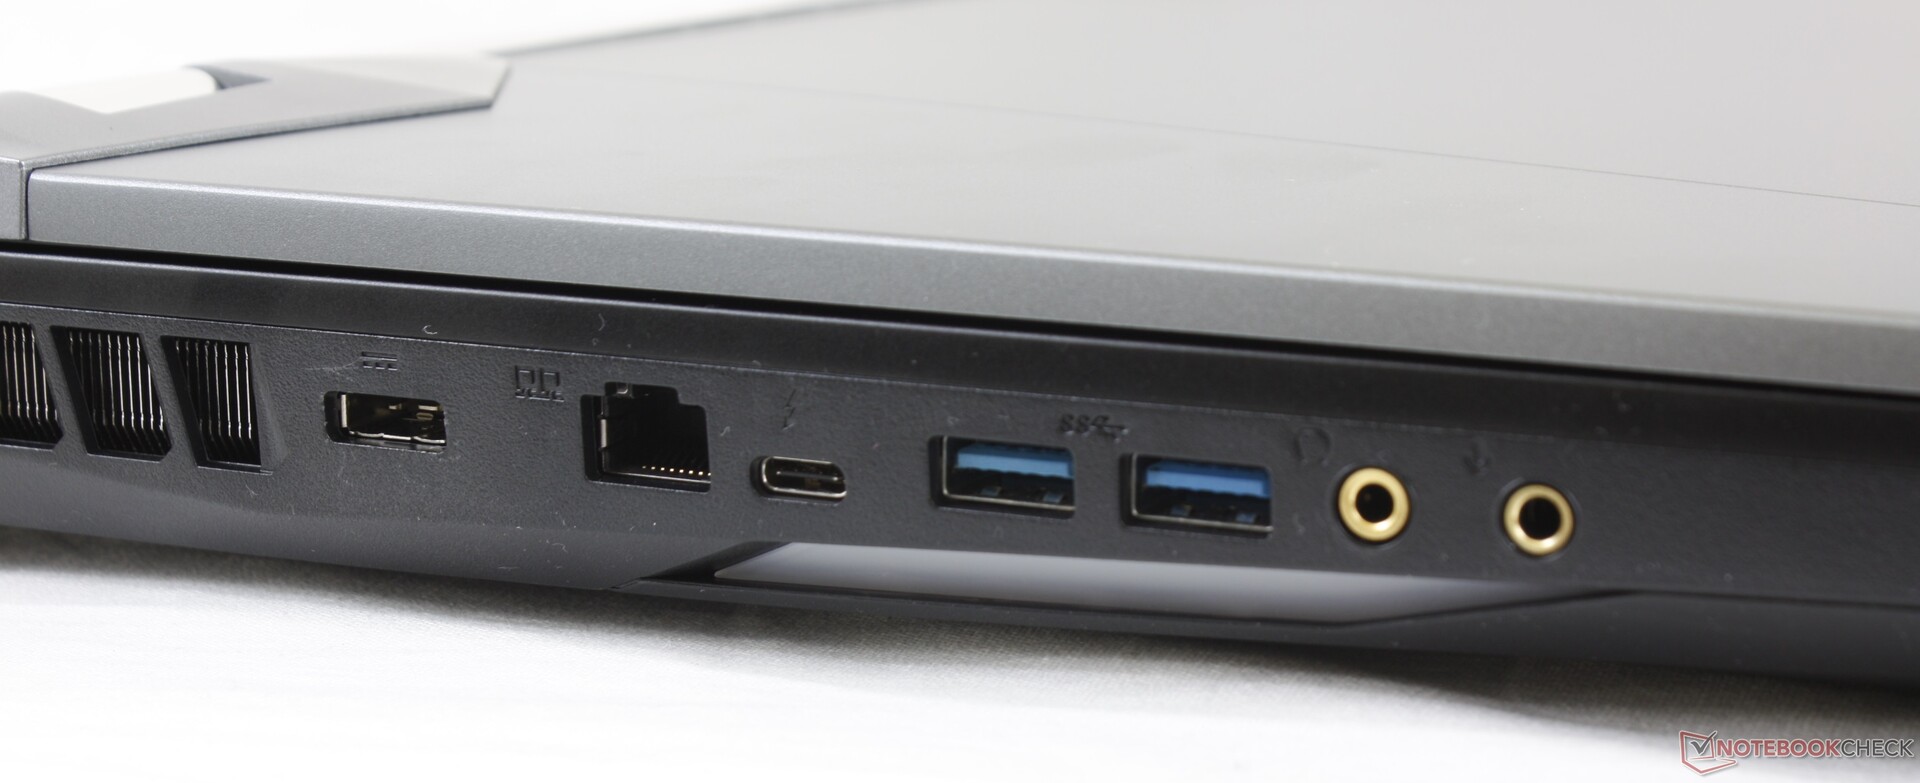
Il faut également noter des défauts. Le bruit des ventilateurs reste élevé en cas de grosses sollicitations, et les deux adaptateurs secteurs et les câbles peuvent être plus gênants à transporter que le portable lui-même. La taille de ce dernier peut être gênante, même pour la catégorie, à cause de l'arrière qui dépasse et la grosse solution de refroidissement. La coque inférieure peut être difficile à remettre en place, et l'absence de charge USB C et de G-Sync est dommage.
Les températures internes sont inférieures à celles de nombreux concurrents de cette catégorie, avec le même Core i9 de bureau et les cartes RTX Super. Il faudra passer outre les ventilateurs bruyants et les chargeur encombrants pour être satisfaits de cette machine.
L’intégralité de cette critique est disponible en anglais en suivant ce lien.
MSI GT76 Titan DT 10SGS
- 10/05/2020 v7 (old)
Allen Ngo
Price comparison
