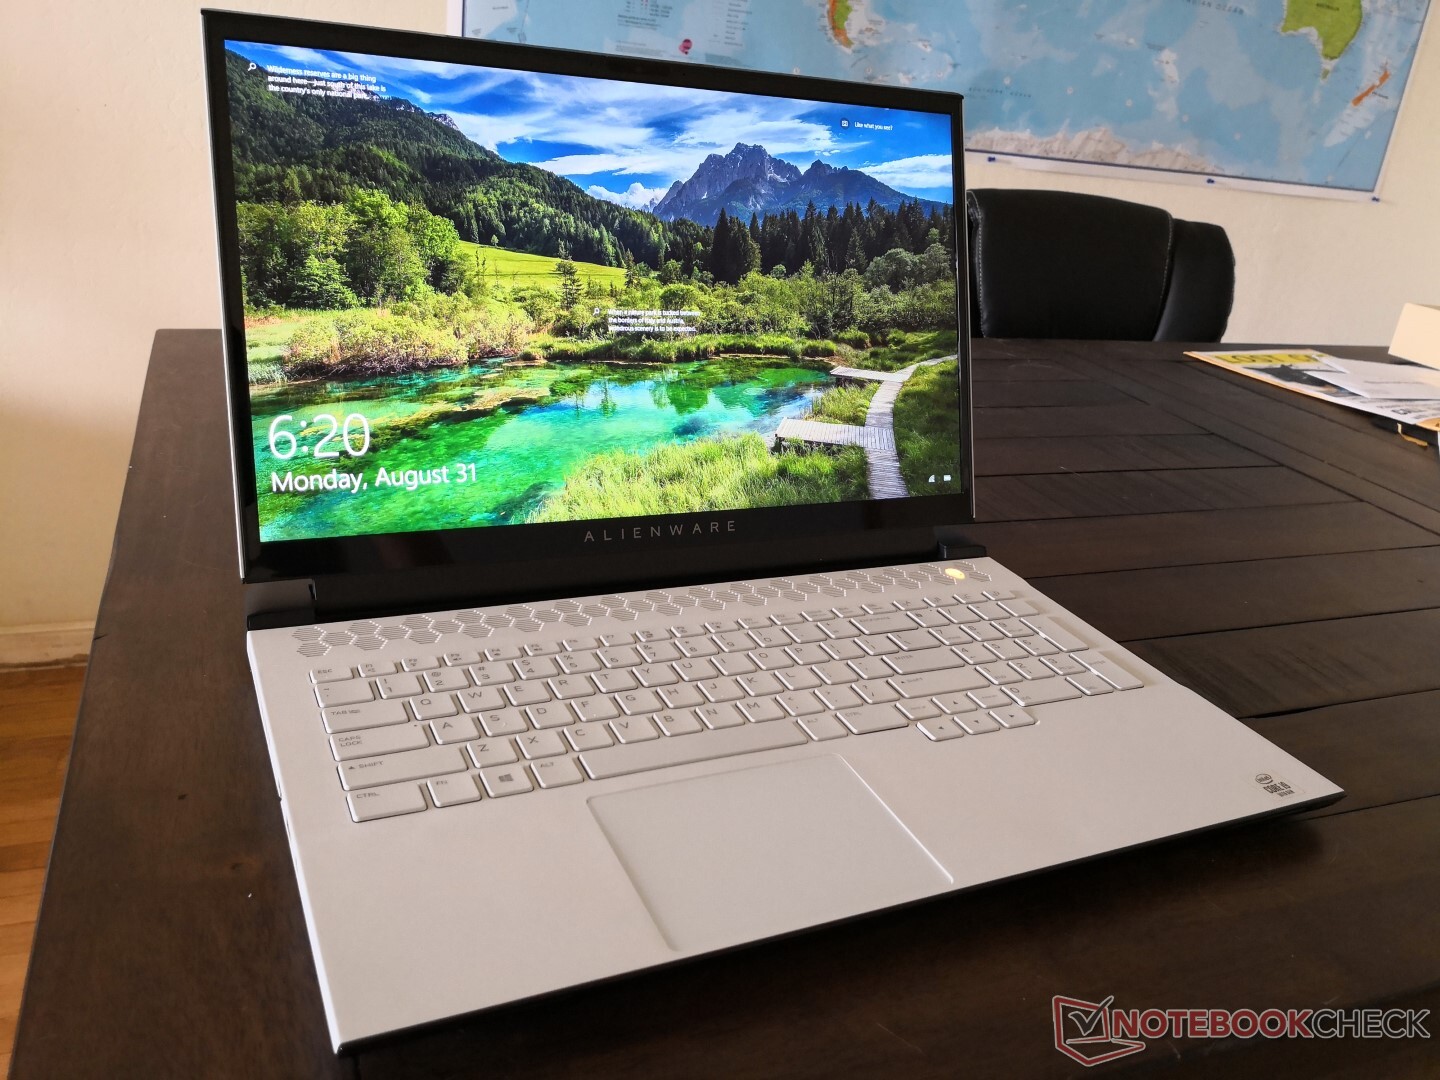
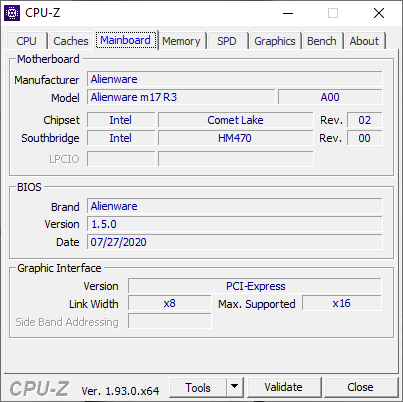
Test du Dell Alienware m17 R3 (i9-10980HK, RTX 2080 Super, FHD, 300 Hz) : good-bye, Max-Q
Note | Date | Modèle | Poids | Épaisseur | Taille | Résolution | Prix |
|---|---|---|---|---|---|---|---|
| 85.3 % v7 (old) | 09/20 | Alienware m17 R3 P45E i9-10980HK, GeForce RTX 2080 Super Mobile | 3 kg | 20.7 mm | 17.30" | 1920x1080 | |
| 84.3 % v7 (old) | 09/20 | Eluktronics RP-17 R7 4800H, GeForce RTX 2060 Mobile | 2.6 kg | 30 mm | 17.30" | 1920x1080 | |
| 83.7 % v7 (old) | 09/20 | MSI GS75 10SF-609US i7-10875H, GeForce RTX 2070 Max-Q | 2.3 kg | 18.9 mm | 17.30" | 1920x1080 | |
| 82.7 % v7 (old) | 08/20 | Asus Strix Scar 17 G732LXS i9-10980HK, GeForce RTX 2080 Super Mobile | 2.9 kg | 26.5 mm | 17.30" | 1920x1080 | |
| 85.1 % v7 (old) | 08/20 | MSI GE75 Raider 10SE-008US i7-10750H, GeForce RTX 2060 Mobile | 2.6 kg | 27.5 mm | 17.30" | 1920x1080 | |
| 87.4 % v7 (old) | 08/20 | Razer Blade Pro 17 RTX 2070 Max-Q 300 Hz i7-10875H, GeForce RTX 2070 Max-Q | 2.7 kg | 19.9 mm | 17.30" | 1920x1080 |
| SD Card Reader | |
| average JPG Copy Test (av. of 3 runs) | |
| Alienware m17 R3 P45E (Toshiba Exceria Pro M501 UHS-II) | |
| Razer Blade Pro 17 RTX 2070 Max-Q 300 Hz (Toshiba Exceria Pro SDXC 64 GB UHS-II) | |
| MSI GS75 10SF-609US (Toshiba Exceria Pro M501 UHS-II) | |
| Eluktronics RP-17 (Toshiba Exceria Pro SDXC 64 GB UHS-II) | |
| MSI GE75 Raider 10SE-008US (Toshiba Exceria Pro SDXC 64 GB UHS-II) | |
| maximum AS SSD Seq Read Test (1GB) | |
| Alienware m17 R3 P45E (Toshiba Exceria Pro M501 UHS-II) | |
| MSI GS75 10SF-609US (Toshiba Exceria Pro M501 UHS-II) | |
| Razer Blade Pro 17 RTX 2070 Max-Q 300 Hz (Toshiba Exceria Pro SDXC 64 GB UHS-II) | |
| Eluktronics RP-17 (Toshiba Exceria Pro SDXC 64 GB UHS-II) | |
| MSI GE75 Raider 10SE-008US (Toshiba Exceria Pro SDXC 64 GB UHS-II) | |

")
")
| |||||||||||||||||||||||||
Homogénéité de la luminosité: 91 %
Valeur mesurée au centre, sur batterie: 338.3 cd/m²
Contraste: 1253:1 (Valeurs des noirs: 0.27 cd/m²)
ΔE ColorChecker Calman: 1.88 | ∀{0.5-29.43 Ø4.71}
calibrated: 1.32
ΔE Greyscale Calman: 2.4 | ∀{0.09-98 Ø4.96}
97.8% sRGB (Argyll 1.6.3 3D)
64.7% AdobeRGB 1998 (Argyll 1.6.3 3D)
71.4% AdobeRGB 1998 (Argyll 3D)
97.9% sRGB (Argyll 3D)
69.2% Display P3 (Argyll 3D)
Gamma: 2.39
CCT: 6572 K
| Alienware m17 R3 P45E AU Optronics B173HAN, IPS, 17.3", 1920x1080 | Eluktronics RP-17 BOE NV173FHM-N44, IPS, 17.3", 1920x1080 | MSI GS75 10SF-609US Sharp LQ173M1JW05, IPS, 17.3", 1920x1080 | Asus Strix Scar 17 G732LXS LQ173M1JW03 (SHP14DC), IPS, 17.3", 1920x1080 | MSI GE75 Raider 10SE-008US Chi Mei N173HCE-G33, IPS, 17.3", 1920x1080 | Razer Blade Pro 17 RTX 2070 Max-Q 300 Hz Sharp LQ173M1JW02, IPS, 17.3", 1920x1080 | |
|---|---|---|---|---|---|---|
| Display | -7% | 5% | 1% | -3% | 2% | |
| Display P3 Coverage (%) | 69.2 | 64.7 -7% | 75.6 9% | 71 3% | 65.6 -5% | 72.2 4% |
| sRGB Coverage (%) | 97.9 | 92 -6% | 99.8 2% | 99 1% | 98.1 0% | 98.5 1% |
| AdobeRGB 1998 Coverage (%) | 71.4 | 65.8 -8% | 75.1 5% | 71.6 0% | 67.8 -5% | 73 2% |
| Response Times | -10% | 62% | 53% | 49% | 49% | |
| Response Time Grey 50% / Grey 80% * (ms) | 16.8 ? | 22.4 ? -33% | 5 ? 70% | 5.8 ? 65% | 6.8 ? 60% | 5.6 ? 67% |
| Response Time Black / White * (ms) | 14 ? | 12 ? 14% | 6.6 ? 53% | 8.4 ? 40% | 8.8 ? 37% | 9.6 ? 31% |
| PWM Frequency (Hz) | 943 | 25000 ? | ||||
| Screen | -43% | -10% | -33% | -5% | -59% | |
| Brightness middle (cd/m²) | 338.3 | 311.5 -8% | 299.4 -11% | 310 -8% | 337.9 0% | 328 -3% |
| Brightness (cd/m²) | 325 | 301 -7% | 299 -8% | 311 -4% | 305 -6% | 329 1% |
| Brightness Distribution (%) | 91 | 91 0% | 84 -8% | 82 -10% | 81 -11% | 78 -14% |
| Black Level * (cd/m²) | 0.27 | 0.31 -15% | 0.31 -15% | 0.41 -52% | 0.29 -7% | 0.35 -30% |
| Contrast (:1) | 1253 | 1005 -20% | 966 -23% | 756 -40% | 1165 -7% | 937 -25% |
| Colorchecker dE 2000 * | 1.88 | 4.13 -120% | 1.82 3% | 2.41 -28% | 2.18 -16% | 4.74 -152% |
| Colorchecker dE 2000 max. * | 3.23 | 7.32 -127% | 3.91 -21% | 8.59 -166% | 3.9 -21% | 8.99 -178% |
| Colorchecker dE 2000 calibrated * | 1.32 | 2.93 -122% | 1.59 -20% | 1.13 14% | 0.69 48% | 2.12 -61% |
| Greyscale dE 2000 * | 2.4 | 3.3 -38% | 2.7 -13% | 4.3 -79% | 3.1 -29% | 6.8 -183% |
| Gamma | 2.39 92% | 2.17 101% | 2.18 101% | 2.149 102% | 2.07 106% | 2.2 100% |
| CCT | 6572 99% | 7157 91% | 6837 95% | 7059 92% | 6882 94% | 6446 101% |
| Color Space (Percent of AdobeRGB 1998) (%) | 64.7 | 59.5 -8% | 67.1 4% | 72 11% | 62 -4% | 64.8 0% |
| Color Space (Percent of sRGB) (%) | 97.8 | 91.6 -6% | 99.8 2% | 94 -4% | 98.2 0% | 98.6 1% |
| Moyenne finale (programmes/paramètres) | -20% /
-32% | 19% /
2% | 7% /
-16% | 14% /
2% | -3% /
-34% |
* ... Moindre est la valeur, meilleures sont les performances
Temps de réponse de l'écran
| ↔ Temps de réponse noir à blanc | ||
|---|---|---|
| 14 ms ... hausse ↗ et chute ↘ combinées | ↗ 7.6 ms hausse | 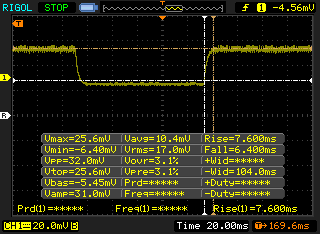 |
| ↘ 6.4 ms chute | ||
| L'écran montre de bons temps de réponse, mais insuffisant pour du jeu compétitif. En comparaison, tous les appareils testés affichent entre 0.1 (minimum) et 240 (maximum) ms. » 34 % des appareils testés affichent de meilleures performances. Cela signifie que les latences relevées sont meilleures que la moyenne (19.8 ms) de tous les appareils testés. | ||
| ↔ Temps de réponse gris 50% à gris 80% | ||
| 16.8 ms ... hausse ↗ et chute ↘ combinées | ↗ 11.6 ms hausse | 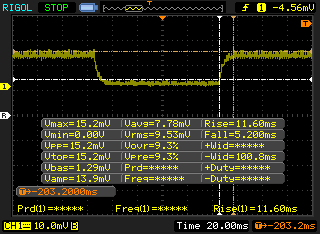 |
| ↘ 5.2 ms chute | ||
| L'écran montre de bons temps de réponse, mais insuffisant pour du jeu compétitif. En comparaison, tous les appareils testés affichent entre 0.165 (minimum) et 636 (maximum) ms. » 31 % des appareils testés affichent de meilleures performances. Cela signifie que les latences relevées sont meilleures que la moyenne (30.9 ms) de tous les appareils testés. | ||
Scintillement / MLI (Modulation de largeur d'impulsion)
| Scintillement / MLI (Modulation de largeur d'impulsion) non décelé |  | ||
En comparaison, 52 % des appareils testés n'emploient pas MDI pour assombrir leur écran. Nous avons relevé une moyenne à 7744 (minimum : 5 - maximum : 343500) Hz dans le cas où une MDI était active. | |||
Cinebench R15: CPU Multi 64Bit | CPU Single 64Bit
Blender: v2.79 BMW27 CPU
7-Zip 18.03: 7z b 4 -mmt1 | 7z b 4
Geekbench 5.5: Single-Core | Multi-Core
HWBOT x265 Benchmark v2.2: 4k Preset
LibreOffice : 20 Documents To PDF
R Benchmark 2.5: Overall mean
| Cinebench R20 / CPU (Multi Core) | |
| Intel Core i9-10900K | |
| MSI GT76 Titan DT 9SG | |
| Eluktronics RP-17 | |
| Alienware m17 R3 P45E | |
| Asus Zephyrus G14 GA401IV | |
| Alienware m17 R2 P41E | |
| Moyenne Intel Core i9-10980HK (3526 - 4487, n=13) | |
| MSI GS75 10SF-609US | |
| MSI GE75 9SG | |
| MSI GE75 Raider 10SE-008US | |
| Medion Erazer X15805 | |
| Schenker XMG Pro 17 PB71RD-G | |
| Cinebench R20 / CPU (Single Core) | |
| Intel Core i9-10900K | |
| MSI GT76 Titan DT 9SG | |
| Medion Erazer X15805 | |
| Asus Zephyrus G14 GA401IV | |
| Moyenne Intel Core i9-10980HK (465 - 507, n=13) | |
| Eluktronics RP-17 | |
| Alienware m17 R2 P41E | |
| MSI GS75 10SF-609US | |
| Alienware m17 R3 P45E | |
| MSI GE75 Raider 10SE-008US | |
| MSI GE75 9SG | |
| Schenker XMG Pro 17 PB71RD-G | |
| Cinebench R15 / CPU Multi 64Bit | |
| Intel Core i9-10900K | |
| MSI GT76 Titan DT 9SG | |
| Eluktronics RP-17 | |
| Asus Zephyrus G14 GA401IV | |
| Alienware m17 R3 P45E | |
| Alienware m17 R2 P41E | |
| Moyenne Intel Core i9-10980HK (1606 - 1862, n=15) | |
| MSI GE75 9SG | |
| MSI GS75 10SF-609US | |
| MSI GE75 Raider 10SE-008US | |
| Medion Erazer X15805 | |
| Schenker XMG Pro 17 PB71RD-G | |
| Cinebench R15 / CPU Single 64Bit | |
| Intel Core i9-10900K | |
| MSI GT76 Titan DT 9SG | |
| Alienware m17 R3 P45E | |
| Moyenne Intel Core i9-10980HK (198 - 219, n=15) | |
| Medion Erazer X15805 | |
| MSI GS75 10SF-609US | |
| Alienware m17 R2 P41E | |
| Asus Zephyrus G14 GA401IV | |
| MSI GE75 9SG | |
| MSI GE75 Raider 10SE-008US | |
| Eluktronics RP-17 | |
| Schenker XMG Pro 17 PB71RD-G | |
| Blender / v2.79 BMW27 CPU | |
| Schenker XMG Pro 17 PB71RD-G | |
| MSI GE75 Raider 10SE-008US | |
| Asus Zephyrus G14 GA401IV | |
| MSI GE75 9SG | |
| MSI GS75 10SF-609US | |
| Moyenne Intel Core i9-10980HK (239 - 299, n=13) | |
| Eluktronics RP-17 | |
| Alienware m17 R3 P45E | |
| Intel Core i9-10900K | |
| 7-Zip 18.03 / 7z b 4 -mmt1 | |
| Intel Core i9-10900K | |
| Alienware m17 R3 P45E | |
| Moyenne Intel Core i9-10980HK (5081 - 5542, n=13) | |
| MSI GS75 10SF-609US | |
| MSI GE75 Raider 10SE-008US | |
| MSI GE75 9SG | |
| Asus Zephyrus G14 GA401IV | |
| Eluktronics RP-17 | |
| Schenker XMG Pro 17 PB71RD-G | |
| 7-Zip 18.03 / 7z b 4 | |
| Intel Core i9-10900K | |
| Eluktronics RP-17 | |
| Asus Zephyrus G14 GA401IV | |
| MSI GS75 10SF-609US | |
| Moyenne Intel Core i9-10980HK (43786 - 49275, n=13) | |
| Alienware m17 R3 P45E | |
| MSI GE75 9SG | |
| MSI GE75 Raider 10SE-008US | |
| Schenker XMG Pro 17 PB71RD-G | |
| Geekbench 5.5 / Single-Core | |
| Intel Core i9-10900K | |
| Alienware m17 R3 P45E | |
| Moyenne Intel Core i9-10980HK (1283 - 1401, n=12) | |
| MSI GT76 Titan DT 9SG | |
| MSI GS75 10SF-609US | |
| MSI GE75 Raider 10SE-008US | |
| Asus Zephyrus G14 GA401IV | |
| Eluktronics RP-17 | |
| Schenker XMG Pro 17 PB71RD-G | |
| Geekbench 5.5 / Multi-Core | |
| Intel Core i9-10900K | |
| MSI GT76 Titan DT 9SG | |
| MSI GS75 10SF-609US | |
| Moyenne Intel Core i9-10980HK (7634 - 8666, n=12) | |
| Alienware m17 R3 P45E | |
| Eluktronics RP-17 | |
| Asus Zephyrus G14 GA401IV | |
| MSI GE75 Raider 10SE-008US | |
| Schenker XMG Pro 17 PB71RD-G | |
| HWBOT x265 Benchmark v2.2 / 4k Preset | |
| Intel Core i9-10900K | |
| Alienware m17 R3 P45E | |
| Eluktronics RP-17 | |
| Moyenne Intel Core i9-10980HK (12 - 14.6, n=13) | |
| MSI GS75 10SF-609US | |
| Asus Zephyrus G14 GA401IV | |
| MSI GE75 9SG | |
| MSI GE75 Raider 10SE-008US | |
| Schenker XMG Pro 17 PB71RD-G | |
| LibreOffice / 20 Documents To PDF | |
| Intel Core i9-10900K | |
| Eluktronics RP-17 | |
| MSI GE75 Raider 10SE-008US | |
| Moyenne Intel Core i9-10980HK (44 - 89, n=13) | |
| MSI GS75 10SF-609US | |
| Alienware m17 R3 P45E | |
| R Benchmark 2.5 / Overall mean | |
| Schenker XMG Pro 17 PB71RD-G | |
| MSI GE75 Raider 10SE-008US | |
| MSI GS75 10SF-609US | |
| Eluktronics RP-17 | |
| Moyenne Intel Core i9-10980HK (0.561 - 0.596, n=13) | |
| Alienware m17 R3 P45E | |
| Intel Core i9-10900K | |
* ... Moindre est la valeur, meilleures sont les performances
| PCMark 8 Home Score Accelerated v2 | 5881 points | |
| PCMark 8 Work Score Accelerated v2 | 6589 points | |
| PCMark 10 Score | 6594 points | |
Aide | ||
| DPC Latencies / LatencyMon - interrupt to process latency (max), Web, Youtube, Prime95 | |
| Asus Strix Scar 17 G732LXS | |
| MSI GE75 Raider 10SE-008US | |
| Eluktronics RP-17 | |
| Razer Blade Pro 17 RTX 2070 Max-Q 300 Hz | |
| Alienware m17 R3 P45E | |
| MSI GS75 10SF-609US | |
* ... Moindre est la valeur, meilleures sont les performances
| Alienware m17 R3 P45E 2x Micron 2200S 512 GB (RAID 0) | Eluktronics RP-17 Phison PS5013 PRO-X-1TB-G2R NVMe SSD | MSI GS75 10SF-609US WDC PC SN730 SDBPNTY-512G | Asus Strix Scar 17 G732LXS 2x Intel SSD 660p 1TB SSDPEKNW010T8 (RAID 0) | MSI GE75 Raider 10SE-008US Samsung SSD PM981 MZVLB512HAJQ | Razer Blade Pro 17 RTX 2070 Max-Q 300 Hz Lite-On CA5-8D512 | |
|---|---|---|---|---|---|---|
| AS SSD | 23% | 17% | -2% | 21% | -10% | |
| Seq Read (MB/s) | 2060 | 1689 -18% | 2327 13% | 2450 19% | 2036 -1% | 2019 -2% |
| Seq Write (MB/s) | 2297 | 1695 -26% | 2479 8% | 1436 -37% | 1835 -20% | 1314 -43% |
| 4K Read (MB/s) | 35.39 | 50 41% | 45.46 28% | 49.48 40% | 60.6 71% | 46.61 32% |
| 4K Write (MB/s) | 63.1 | 182.9 190% | 157.4 149% | 119.4 89% | 127.2 102% | 90.2 43% |
| 4K-64 Read (MB/s) | 1337 | 1043 -22% | 1050 -21% | 1032 -23% | 1601 20% | 665 -50% |
| 4K-64 Write (MB/s) | 1307 | 1841 41% | 938 -28% | 1229 -6% | 1734 33% | 813 -38% |
| Access Time Read * (ms) | 0.057 | 0.04 30% | 0.076 -33% | 0.145 -154% | 0.049 14% | 0.058 -2% |
| Access Time Write * (ms) | 0.411 | 0.102 75% | 0.071 83% | 0.036 91% | 0.09 78% | 0.167 59% |
| Score Read (Points) | 1578 | 1262 -20% | 1328 -16% | 1327 -16% | 1865 18% | 913 -42% |
| Score Write (Points) | 1600 | 2194 37% | 1343 -16% | 1492 -7% | 2045 28% | 1034 -35% |
| Score Total (Points) | 3997 | 4112 3% | 3366 -16% | 3456 -14% | 4863 22% | 2392 -40% |
| Copy ISO MB/s (MB/s) | 1728 | 2124 23% | 3092 79% | 1900 10% | 1715 -1% | |
| Copy Program MB/s (MB/s) | 727 | 579 -20% | 733 1% | 205.5 -72% | 622 -14% | |
| Copy Game MB/s (MB/s) | 1585 | 1304 -18% | 1683 6% | 1419 -10% | 1506 -5% | |
| CrystalDiskMark 5.2 / 6 | 21% | 25% | 8% | 12% | 11% | |
| Write 4K (MB/s) | 68 | 226.1 233% | 177.9 162% | 125.8 85% | 139.2 105% | 119 75% |
| Read 4K (MB/s) | 42.04 | 54.7 30% | 47.42 13% | 52.9 26% | 53 26% | 51.9 23% |
| Write Seq (MB/s) | 2221 | 1868 -16% | 2707 22% | 1795 -19% | 1950 -12% | 2258 2% |
| Read Seq (MB/s) | 2202 | 1648 -25% | 2369 8% | 2315 5% | 2328 6% | 2283 4% |
| Write 4K Q32T1 (MB/s) | 494.5 | 429.9 -13% | 427.8 -13% | 407.1 -18% | 408.9 -17% | 491 -1% |
| Read 4K Q32T1 (MB/s) | 540 | 521 -4% | 543 1% | 411.9 -24% | 551 2% | 540 0% |
| Write Seq Q32T1 (MB/s) | 2623 | 2248 -14% | 2703 3% | 2844 8% | 1938 -26% | 2253 -14% |
| Read Seq Q32T1 (MB/s) | 3159 | 2484 -21% | 3387 7% | 3130 -1% | 3467 10% | 3172 0% |
| Moyenne finale (programmes/paramètres) | 22% /
22% | 21% /
20% | 3% /
2% | 17% /
18% | 1% /
-2% |
* ... Moindre est la valeur, meilleures sont les performances

Disk Throttling: DiskSpd Read Loop, Queue Depth 8
| 3DMark 11 Performance | 27300 points | |
| 3DMark Cloud Gate Standard Score | 54828 points | |
| 3DMark Fire Strike Score | 21102 points | |
| 3DMark Time Spy Score | 9921 points | |
Aide | ||
| Bas | Moyen | Élevé | Ultra | |
|---|---|---|---|---|
| The Witcher 3 (2015) | 389.7 | 274.2 | 186.2 | 97.7 |
| Dota 2 Reborn (2015) | 150 | 140 | 134 | 127 |
| Final Fantasy XV Benchmark (2018) | 193 | 134 | 103 | |
| X-Plane 11.11 (2018) | 128 | 114 | 93.8 |
| Alienware m17 R3 P45E GeForce RTX 2080 Super Mobile, i9-10980HK, 2x Micron 2200S 512 GB (RAID 0) | Eluktronics RP-17 GeForce RTX 2060 Mobile, R7 4800H, Phison PS5013 PRO-X-1TB-G2R NVMe SSD | MSI GS75 10SF-609US GeForce RTX 2070 Max-Q, i7-10875H, WDC PC SN730 SDBPNTY-512G | Asus Strix Scar 17 G732LXS GeForce RTX 2080 Super Mobile, i9-10980HK, 2x Intel SSD 660p 1TB SSDPEKNW010T8 (RAID 0) | MSI GE75 Raider 10SE-008US GeForce RTX 2060 Mobile, i7-10750H, Samsung SSD PM981 MZVLB512HAJQ | Razer Blade Pro 17 RTX 2070 Max-Q 300 Hz GeForce RTX 2070 Max-Q, i7-10875H, Lite-On CA5-8D512 | |
|---|---|---|---|---|---|---|
| Noise | 7% | -6% | -15% | -0% | 1% | |
| arrêt / environnement * (dB) | 26.5 | 26.2 1% | 26.2 1% | 25 6% | 28.4 -7% | 28.2 -6% |
| Idle Minimum * (dB) | 27.8 | 26.2 6% | 31.2 -12% | 33 -19% | 30.2 -9% | 28.2 -1% |
| Idle Average * (dB) | 27.8 | 26.2 6% | 31.4 -13% | 38 -37% | 30.2 -9% | 28.2 -1% |
| Idle Maximum * (dB) | 27.8 | 30 -8% | 34 -22% | 45 -62% | 32 -15% | 30.5 -10% |
| Load Average * (dB) | 52.1 | 38.5 26% | 49.5 5% | 54 -4% | 33.2 36% | 42.2 19% |
| Witcher 3 ultra * (dB) | 51.8 | 47.2 9% | 50.6 2% | 50 3% | 55 -6% | 53 -2% |
| Load Maximum * (dB) | 59.1 | 54.6 8% | 60.7 -3% | 55 7% | 55 7% | 55.5 6% |
* ... Moindre est la valeur, meilleures sont les performances
Degré de la nuisance sonore
| Au repos |
| 27.8 / 27.8 / 27.8 dB(A) |
| Fortement sollicité |
| 52.1 / 59.1 dB(A) |
 | ||
30 dB silencieux 40 dB(A) audible 50 dB(A) bruyant |
||
min: | ||
(-) La température maximale du côté supérieur est de 54 °C / 129 F, par rapport à la moyenne de 40.4 °C / 105 F, allant de 21.2 à 68.8 °C pour la classe Gaming.
(-) Le fond chauffe jusqu'à un maximum de 58.4 °C / 137 F, contre une moyenne de 43.2 °C / 110 F
(±) En utilisation inactive, la température moyenne du côté supérieur est de 33.2 °C / 92 F, par rapport à la moyenne du dispositif de 33.9 °C / 93 F.
(-) En jouant à The Witcher 3, la température moyenne du côté supérieur est de 39.1 °C / 102 F, alors que la moyenne de l'appareil est de 33.9 °C / 93 F.
(+) Les repose-poignets et le pavé tactile sont plus froids que la température de la peau avec un maximum de 31.2 °C / 88.2 F et sont donc froids au toucher.
(-) La température moyenne de la zone de l'appui-paume de dispositifs similaires était de 28.8 °C / 83.8 F (-2.4 °C / #-4.4 F).
Alienware m17 R3 P45E analyse audio
(+) | les haut-parleurs peuvent jouer relativement fort (87.5# dB)
Basses 100 - 315 Hz
(-) | presque aucune basse - en moyenne 17.9% plus bas que la médiane
(±) | la linéarité des basses est moyenne (9.6% delta à la fréquence précédente)
Médiums 400 - 2000 Hz
(±) | médiane supérieure - en moyenne 5.6% supérieure à la médiane
(+) | les médiums sont linéaires (4.5% delta à la fréquence précédente)
Aiguës 2 - 16 kHz
(±) | sommets plus élevés - en moyenne 5% plus élevés que la médiane
(+) | les aigus sont linéaires (4.7% delta à la fréquence précédente)
Globalement 100 - 16 000 Hz
(±) | la linéarité du son global est moyenne (16.2% de différence avec la médiane)
Par rapport à la même classe
» 40% de tous les appareils testés de cette catégorie étaient meilleurs, 7% similaires, 53% pires
» Le meilleur avait un delta de 6%, la moyenne était de 18%, le pire était de 132%.
Par rapport à tous les appareils testés
» 26% de tous les appareils testés étaient meilleurs, 6% similaires, 68% pires
» Le meilleur avait un delta de 4%, la moyenne était de 23%, le pire était de 134%.
Apple MacBook 12 (Early 2016) 1.1 GHz analyse audio
(+) | les haut-parleurs peuvent jouer relativement fort (83.6# dB)
Basses 100 - 315 Hz
(±) | basse réduite - en moyenne 11.3% inférieure à la médiane
(±) | la linéarité des basses est moyenne (14.2% delta à la fréquence précédente)
Médiums 400 - 2000 Hz
(+) | médiane équilibrée - seulement 2.4% de la médiane
(+) | les médiums sont linéaires (5.5% delta à la fréquence précédente)
Aiguës 2 - 16 kHz
(+) | des sommets équilibrés - à seulement 2% de la médiane
(+) | les aigus sont linéaires (4.5% delta à la fréquence précédente)
Globalement 100 - 16 000 Hz
(+) | le son global est linéaire (10.2% différence à la médiane)
Par rapport à la même classe
» 7% de tous les appareils testés de cette catégorie étaient meilleurs, 2% similaires, 90% pires
» Le meilleur avait un delta de 5%, la moyenne était de 18%, le pire était de 53%.
Par rapport à tous les appareils testés
» 5% de tous les appareils testés étaient meilleurs, 1% similaires, 94% pires
» Le meilleur avait un delta de 4%, la moyenne était de 23%, le pire était de 134%.
| Éteint/en veille | |
| Au repos | |
| Fortement sollicité |
|
Légende:
min: | |
| Alienware m17 R3 P45E i9-10980HK, GeForce RTX 2080 Super Mobile, 2x Micron 2200S 512 GB (RAID 0), IPS, 1920x1080, 17.3" | Eluktronics RP-17 R7 4800H, GeForce RTX 2060 Mobile, Phison PS5013 PRO-X-1TB-G2R NVMe SSD, IPS, 1920x1080, 17.3" | MSI GS75 10SF-609US i7-10875H, GeForce RTX 2070 Max-Q, WDC PC SN730 SDBPNTY-512G, IPS, 1920x1080, 17.3" | Asus Strix Scar 17 G732LXS i9-10980HK, GeForce RTX 2080 Super Mobile, 2x Intel SSD 660p 1TB SSDPEKNW010T8 (RAID 0), IPS, 1920x1080, 17.3" | MSI GE75 Raider 10SE-008US i7-10750H, GeForce RTX 2060 Mobile, Samsung SSD PM981 MZVLB512HAJQ, IPS, 1920x1080, 17.3" | Razer Blade Pro 17 RTX 2070 Max-Q 300 Hz i7-10875H, GeForce RTX 2070 Max-Q, Lite-On CA5-8D512, IPS, 1920x1080, 17.3" | |
|---|---|---|---|---|---|---|
| Power Consumption | 36% | 35% | 21% | 41% | 35% | |
| Idle Minimum * (Watt) | 33.6 | 20.2 40% | 19.2 43% | 16 52% | 14.7 56% | 19.6 42% |
| Idle Average * (Watt) | 43.9 | 24.5 44% | 22.4 49% | 25 43% | 20.4 54% | 21.7 51% |
| Idle Maximum * (Watt) | 59 | 28.7 51% | 34.7 41% | 35 41% | 26.9 54% | 36.1 39% |
| Load Average * (Watt) | 134.9 | 110.4 18% | 106.7 21% | 177 -31% | 93.2 31% | 115.6 14% |
| Witcher 3 ultra * (Watt) | 242 | 166.3 31% | 160.5 34% | 227 6% | 185.4 23% | 157 35% |
| Load Maximum * (Watt) | 320 | 217.4 32% | 248.7 22% | 280 12% | 237.8 26% | 219.9 31% |
* ... Moindre est la valeur, meilleures sont les performances
| Alienware m17 R3 P45E i9-10980HK, GeForce RTX 2080 Super Mobile, 86 Wh | Eluktronics RP-17 R7 4800H, GeForce RTX 2060 Mobile, 62 Wh | MSI GS75 10SF-609US i7-10875H, GeForce RTX 2070 Max-Q, 80.25 Wh | Asus Strix Scar 17 G732LXS i9-10980HK, GeForce RTX 2080 Super Mobile, 66 Wh | MSI GE75 Raider 10SE-008US i7-10750H, GeForce RTX 2060 Mobile, 65 Wh | Razer Blade Pro 17 RTX 2070 Max-Q 300 Hz i7-10875H, GeForce RTX 2070 Max-Q, 70 Wh | |
|---|---|---|---|---|---|---|
| Autonomie de la batterie | 48% | 224% | 123% | 16% | 53% | |
| Reader / Idle (h) | 3.7 | 8.6 132% | 10 170% | |||
| WiFi v1.3 (h) | 3.2 | 4.4 38% | 4.9 53% | 5.9 84% | 3.7 16% | 4.9 53% |
| Load (h) | 0.7 | 1.1 57% | 4.1 486% | 1.5 114% |
Points positifs
Points négatifs
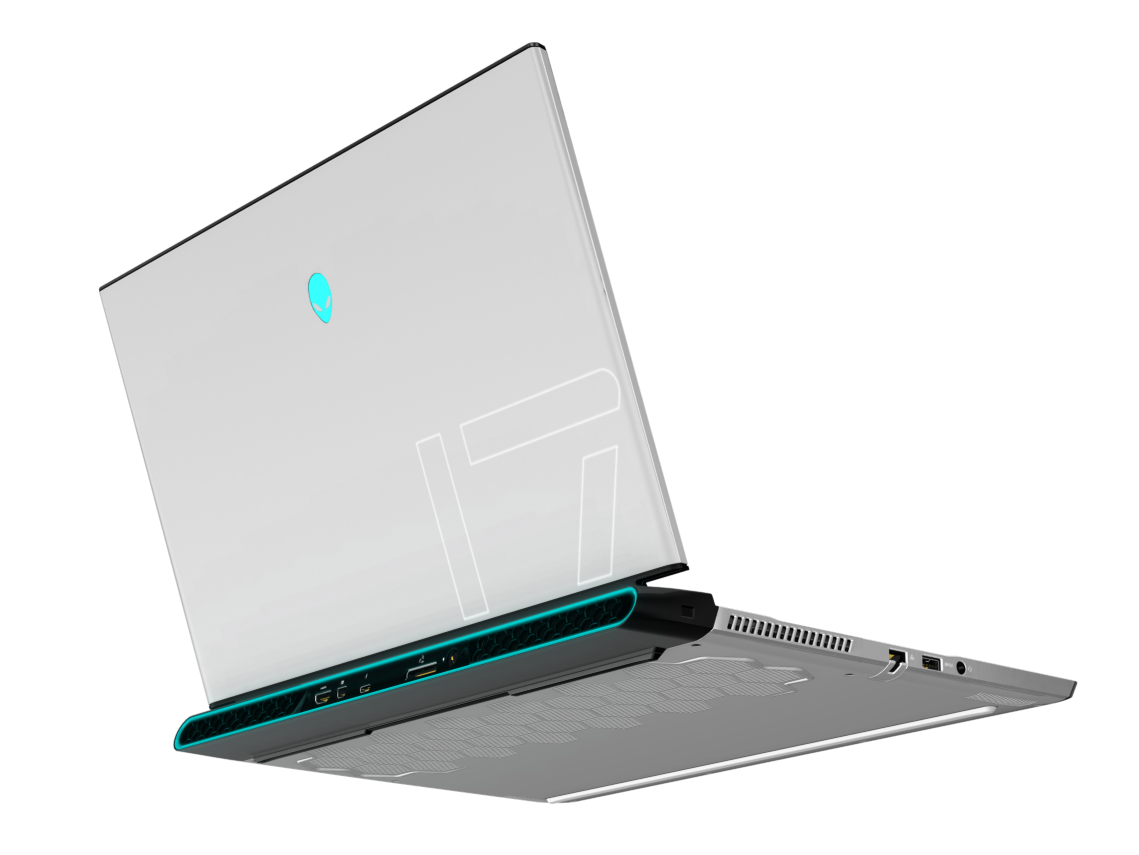
A la différence du MSI GS75 ou du Razer Blade Pro, qui reposent sur des cartes graphiques Max-Q, l'Alienware m17 R3 parvient à embarquer une GeForce RTX 2080 Super portable non bridée, lui fournissant des performances supérieures en jeu. Les fans de jeu 1080p à 60 FPS et plus apprécieront le surplus de performances que l'Alienware peut fournir par rapport à la plupart des autres PC portables de jeu ultrafins. Les fréquences de Turbo Boost sont stables, ce qui est impressionnant pour un PC de jeu ultrafin intégrant à la fois un processeur Core i9 et un GPU GeForce Super.
Parmi les défauts majeurs, on note le poids et le niveau sonore des ventilateurs, même pour un portable de jeu de 17,3 pouces. Le m17 R3 n'est en aucun cas plus silencieux, plus frais, plus autonome ou plus léger que le m17 R2 malgré leur châssis identique. Il est plus puissant, mais tous ses désavantages sont amplifiés. Mais pour les inconditionnels du jeu, cela en vaut la chandelle.
L'Alienware m17 R3 est le PC de jeu de 17,3 pouces le plus puissants pour cette taille, la plupart des concurrents dans cette catégorie n'intégrant que des GPU Max-Q. Cette approche des performances à tout prix fonctionne, tant que l'on a conscience du poids et du niveau sonore des ventilateurs de la machine.
L’intégralité de cette critique est disponible en anglais en suivant ce lien.
Alienware m17 R3 P45E
- 09/04/2020 v7 (old)
Allen Ngo
Price comparison
