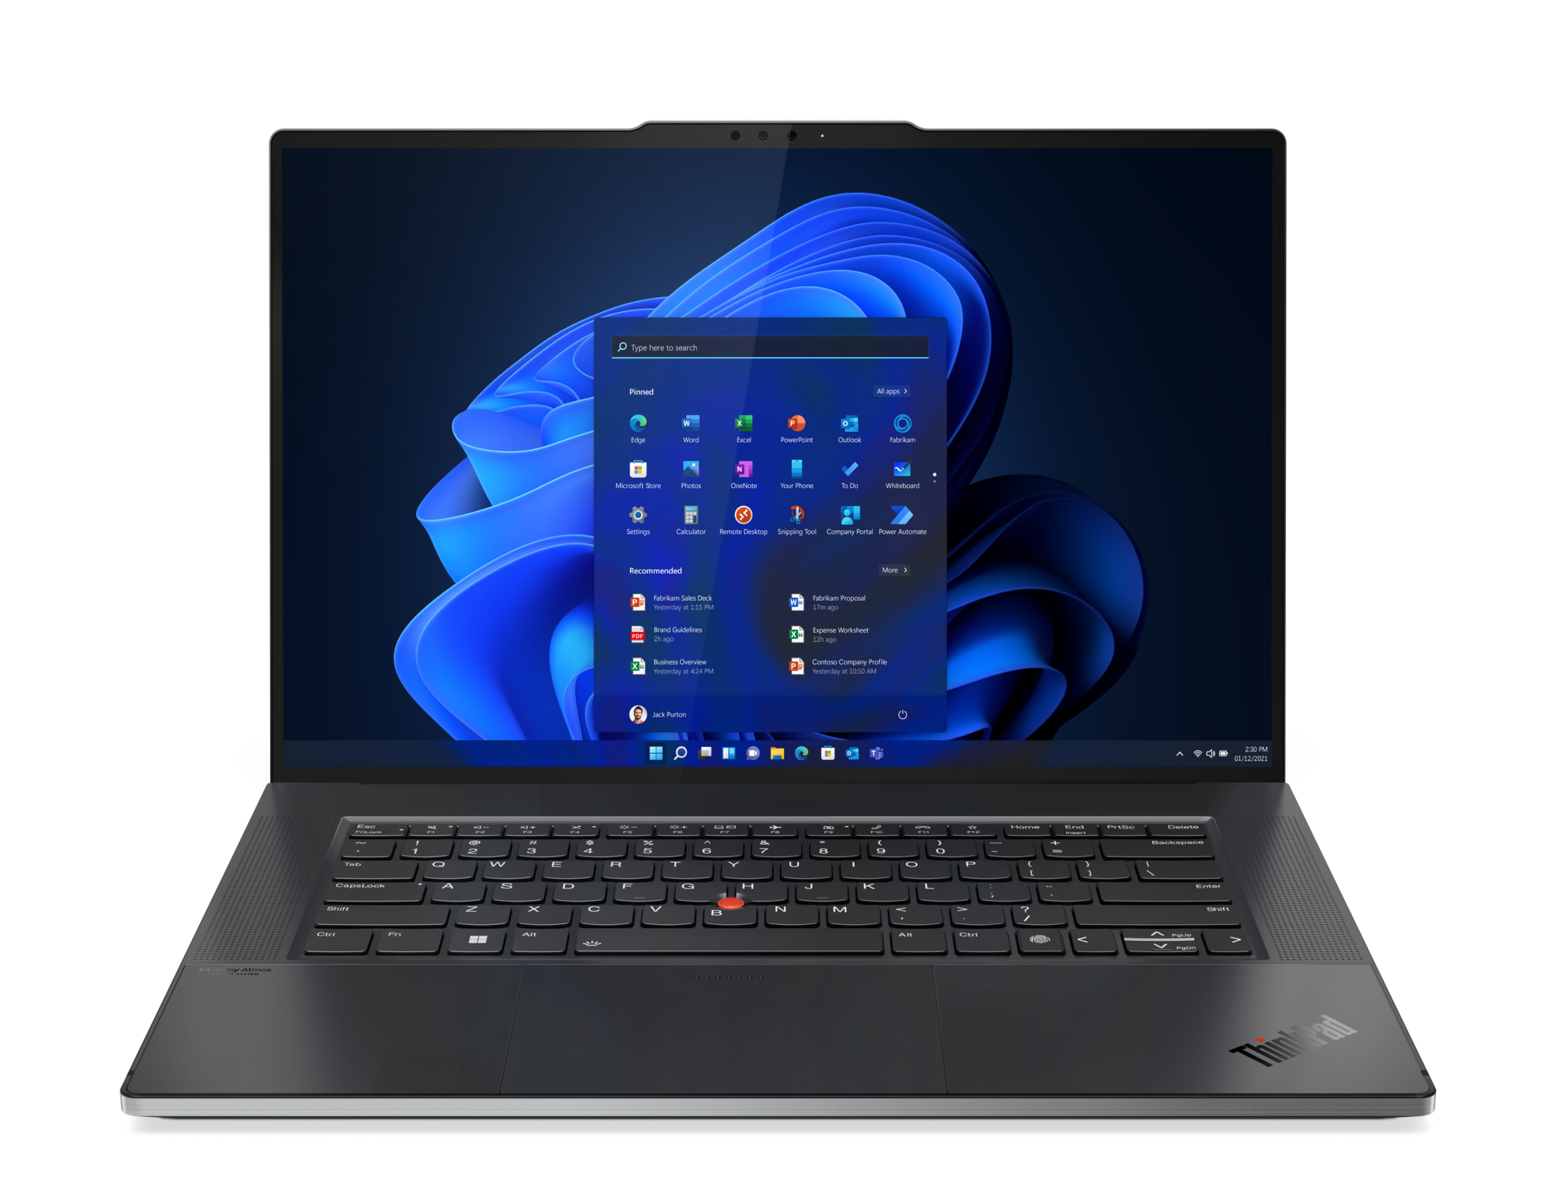
Test du Lenovo ThinkPad Z16 Gen 2 : les débuts de la Radeon RX 6550M

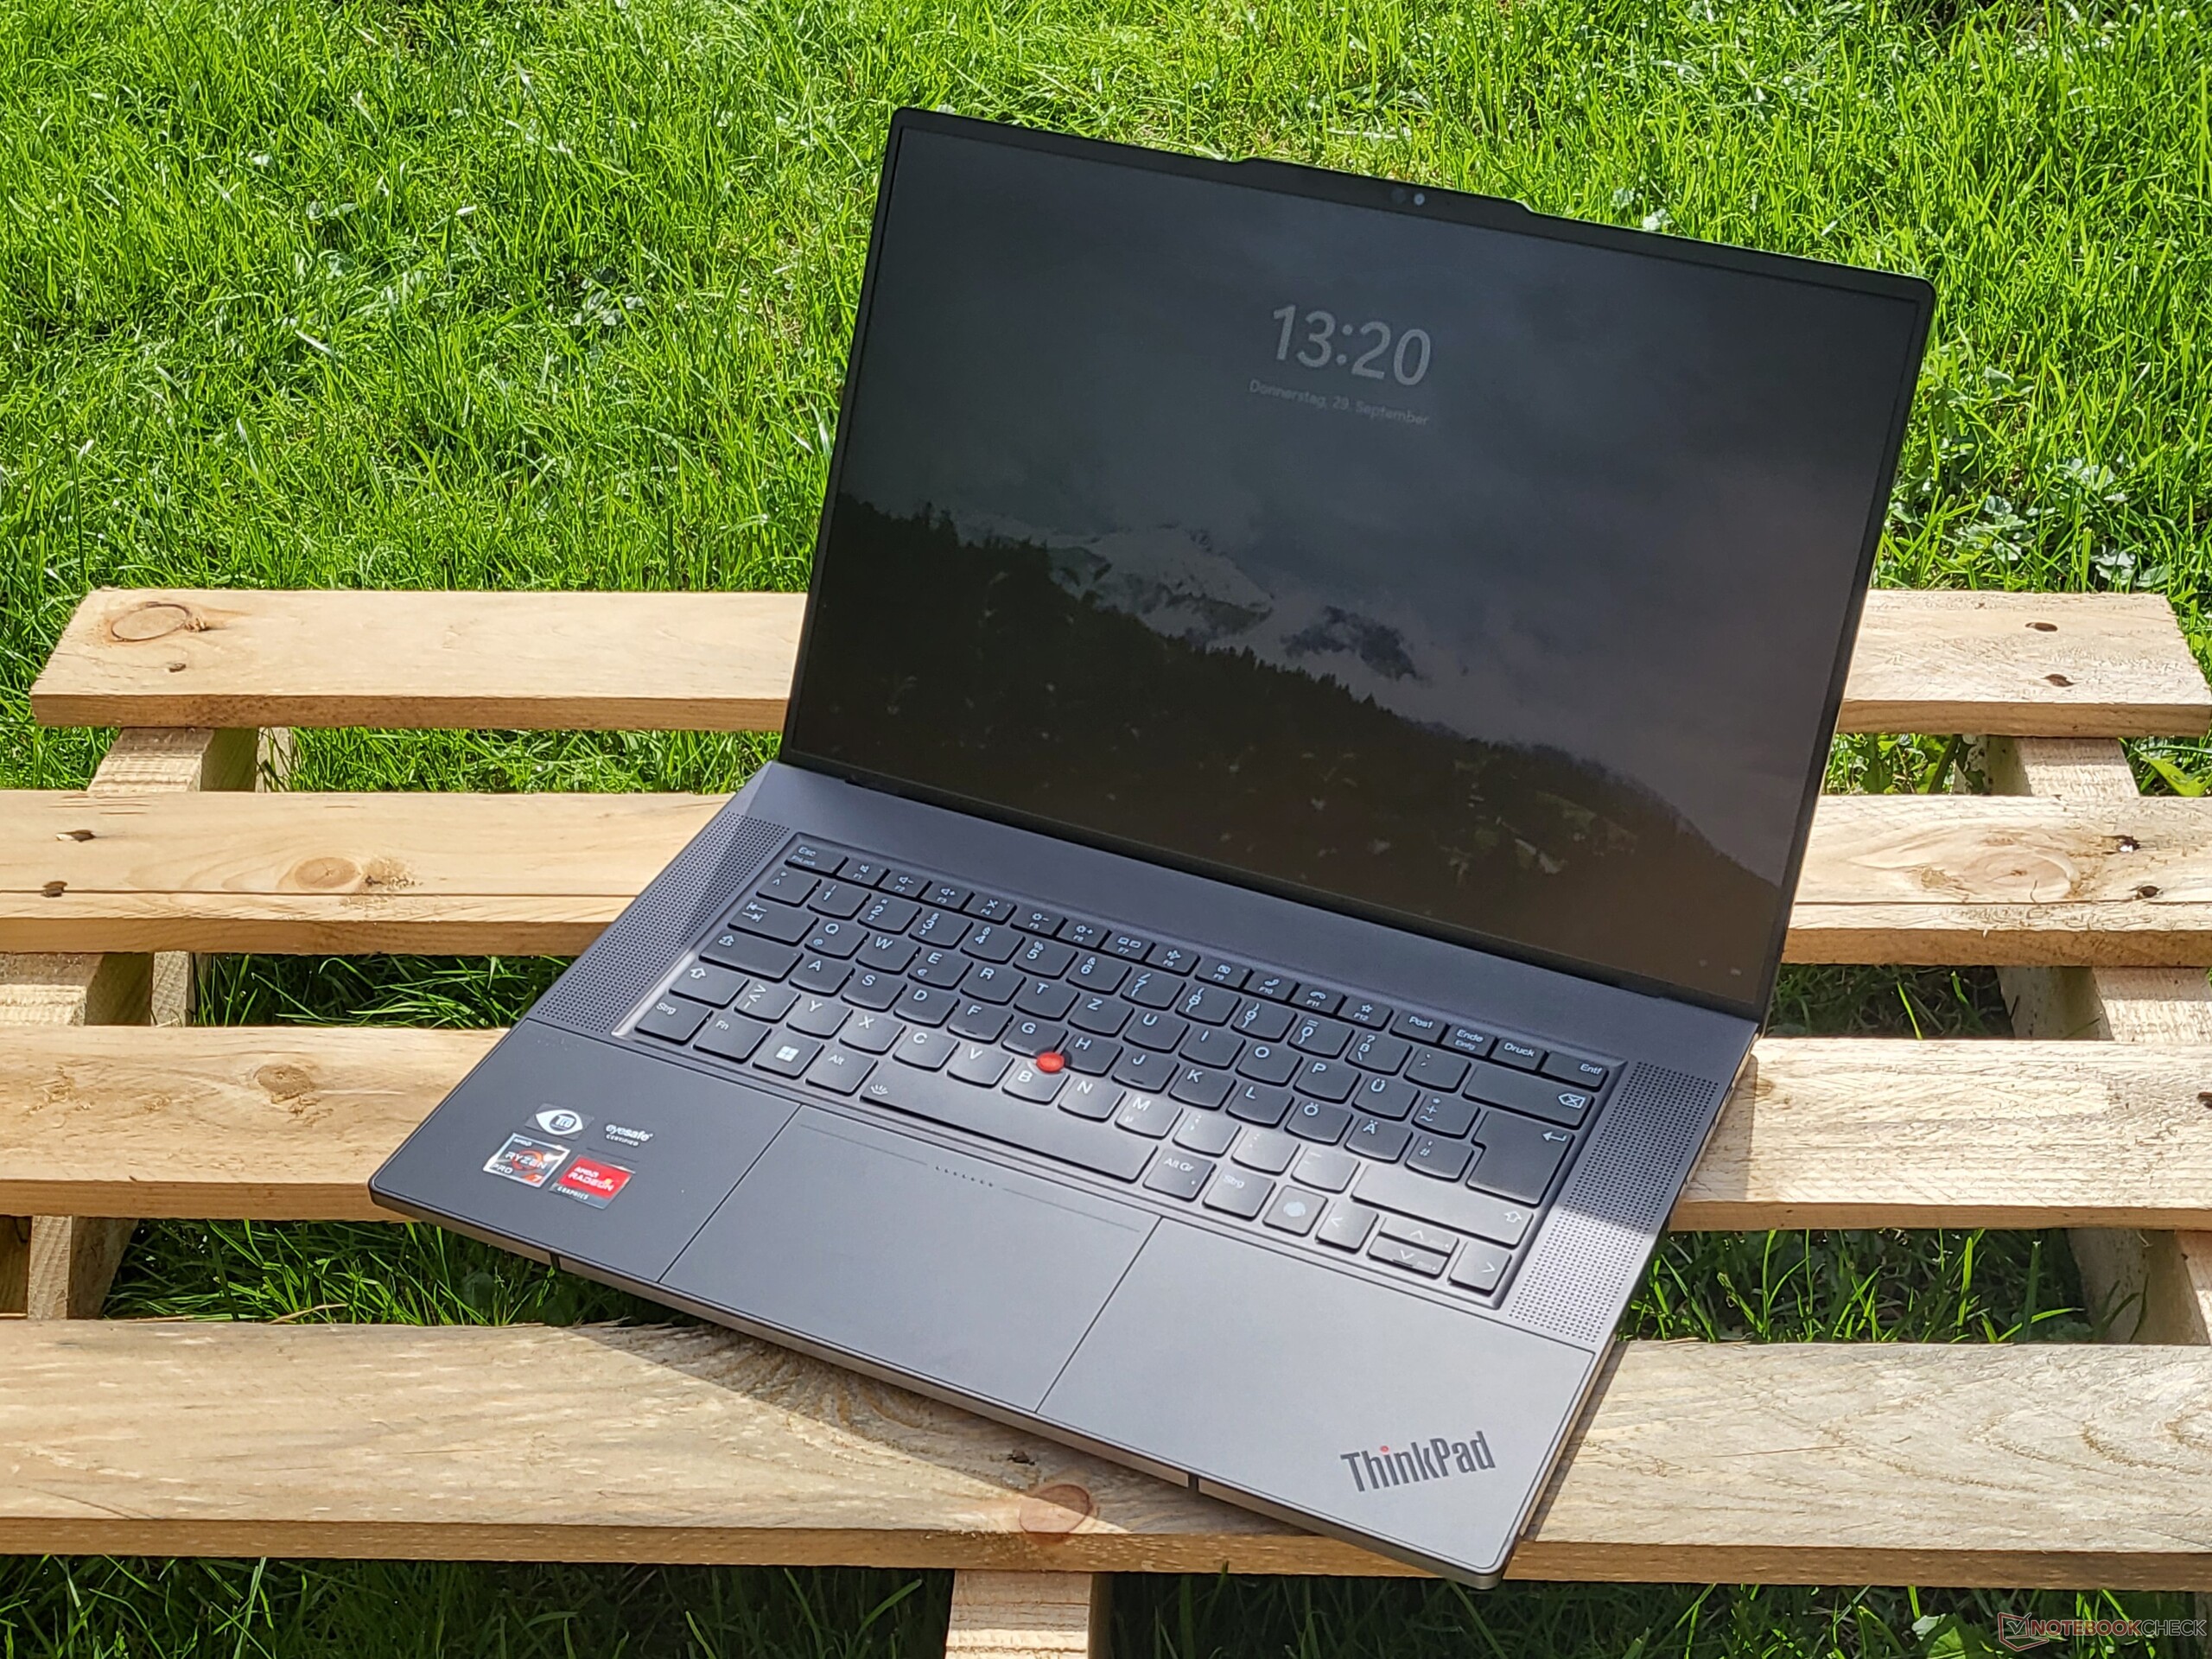
Le ThinkPad Z16 G2 succède au ThinkPad Z16 G1, vieux d'un an, avec de nouvelles options de processeurs AMD Zen 4, des cartes graphiques Radeon RX plus rapides et un nouvel écran tactile OLED 2400p. Il s'agit également de l'un des rares ordinateurs portables équipés de la Radeon RX 6550M, une carte graphique d'entrée de gamme peu commune. Le châssis est par ailleurs identique à celui du ThinkPad Z16 G1 notre article sur le modèle de première génération pour en savoir plus sur les caractéristiques physiques et les options de connectivité de la série.
Le ThinkPad Z16 G1 que nous avons testé est la configuration la plus haut de gamme avec Ryzen 9 Pro 7940HS, Radeon RX 6550M, écran tactile OLED et 64 Go de RAM pour un prix d'environ 2600 USD. Les SKU moins chers commencent avec le Ryzen 5 Pro 7640HS, une carte graphique intégrée et un écran IPS 1200p pour 1600 USD. Le ThinkPad Z16 peut être considéré comme un ordinateur portable semi-professionnel destiné au multimédia ou à la création de contenu, puisqu'il est équipé de processeurs Ryzen Pro au lieu des options non Pro habituelles.
Les alternatives au ThinkPad Z16 G2 comprennent d'autres ordinateurs portables haut de gamme de 16 pouces destinés à la création de contenu, comme le MSI Creator Z16P, Apple MacBook Pro 16, Asus Vivobook Pro 16Xou la série Série Dell XPS.
Plus de commentaires sur Lenovo :
Comparaison avec les concurrents potentiels
Note | Date | Modèle | Poids | Épaisseur | Taille | Résolution | Prix |
|---|---|---|---|---|---|---|---|
| 88.6 % v7 (old) | 12/23 | Lenovo ThinkPad Z16 Gen 2 R9 PRO 7940HS, Radeon RX 6550M | 1.8 kg | 15.8 mm | 16.00" | 3840x2400 | |
| 87.3 % v7 (old) | 10/22 | Lenovo ThinkPad Z16 G1 21D5S00T00 R7 PRO 6850H, Radeon RX 6500M | 1.9 kg | 15.8 mm | 16.00" | 1920x1200 | |
| 85.7 % v7 (old) | 11/23 | Lenovo ThinkBook 16 G6 ABP R5 7530U, Vega 7 | 1.8 kg | 17.5 mm | 16.00" | 1920x1200 | |
| 83.7 % v7 (old) | 06/22 | MSI Creator Z16P B12UHST i9-12900H, GeForce RTX 3080 Ti Laptop GPU | 2.4 kg | 20.4 mm | 16.00" | 2560x1600 | |
| 93.7 % v7 (old) | 11/23 | Apple MacBook Pro 16 2023 M3 Pro Apple M3 Pro 12-Core, M3 Pro 18-Core GPU | 2.1 kg | 16.9 mm | 16.20" | 3456x2234 | |
| 86.2 % v7 (old) | 07/23 | Asus Vivobook Pro 16X K6604JV-MX016W i9-13980HX, GeForce RTX 4060 Laptop GPU | 2.1 kg | 22.8 mm | 16.00" | 3200x2000 |
Cas
Lecteur de carte SD
| SD Card Reader | |
| average JPG Copy Test (av. of 3 runs) | |
| Lenovo ThinkPad Z16 Gen 2 (Toshiba Exceria Pro SDXC 64 GB UHS-II) | |
| Asus Vivobook Pro 16X K6604JV-MX016W | |
| Lenovo ThinkPad Z16 G1 21D5S00T00 | |
| Lenovo ThinkBook 16 G6 ABP (Angelbird AV Pro V60) | |
| MSI Creator Z16P B12UHST (AV PRO microSD 128 GB V60) | |
| maximum AS SSD Seq Read Test (1GB) | |
| Lenovo ThinkPad Z16 G1 21D5S00T00 | |
| Lenovo ThinkPad Z16 Gen 2 (Toshiba Exceria Pro SDXC 64 GB UHS-II) | |
| Asus Vivobook Pro 16X K6604JV-MX016W | |
| Lenovo ThinkBook 16 G6 ABP (Angelbird AV Pro V60) | |
Communication
Lenovo a remplacé le Qualcomm WCN685x du modèle de l'année dernière par un MediaTek MT7922 sur le modèle de cette année. Les taux de transfert restent stables et excellents lorsque l'appareil est couplé à nos réseaux Wi-Fi 6 ou Wi-Fi 6E.
| Networking | |
| iperf3 transmit AXE11000 | |
| Lenovo ThinkPad Z16 G1 21D5S00T00 | |
| Asus Vivobook Pro 16X K6604JV-MX016W | |
| Lenovo ThinkPad Z16 Gen 2 | |
| Lenovo ThinkBook 16 G6 ABP | |
| iperf3 receive AXE11000 | |
| Lenovo ThinkPad Z16 G1 21D5S00T00 | |
| Asus Vivobook Pro 16X K6604JV-MX016W | |
| MSI Creator Z16P B12UHST | |
| Lenovo ThinkPad Z16 Gen 2 | |
| Lenovo ThinkBook 16 G6 ABP | |
| iperf3 transmit AXE11000 6GHz | |
| Lenovo ThinkPad Z16 G1 21D5S00T00 | |
| Asus Vivobook Pro 16X K6604JV-MX016W | |
| Lenovo ThinkPad Z16 Gen 2 | |
| iperf3 receive AXE11000 6GHz | |
| Lenovo ThinkPad Z16 G1 21D5S00T00 | |
| Asus Vivobook Pro 16X K6604JV-MX016W | |
| Lenovo ThinkPad Z16 Gen 2 | |
Webcam
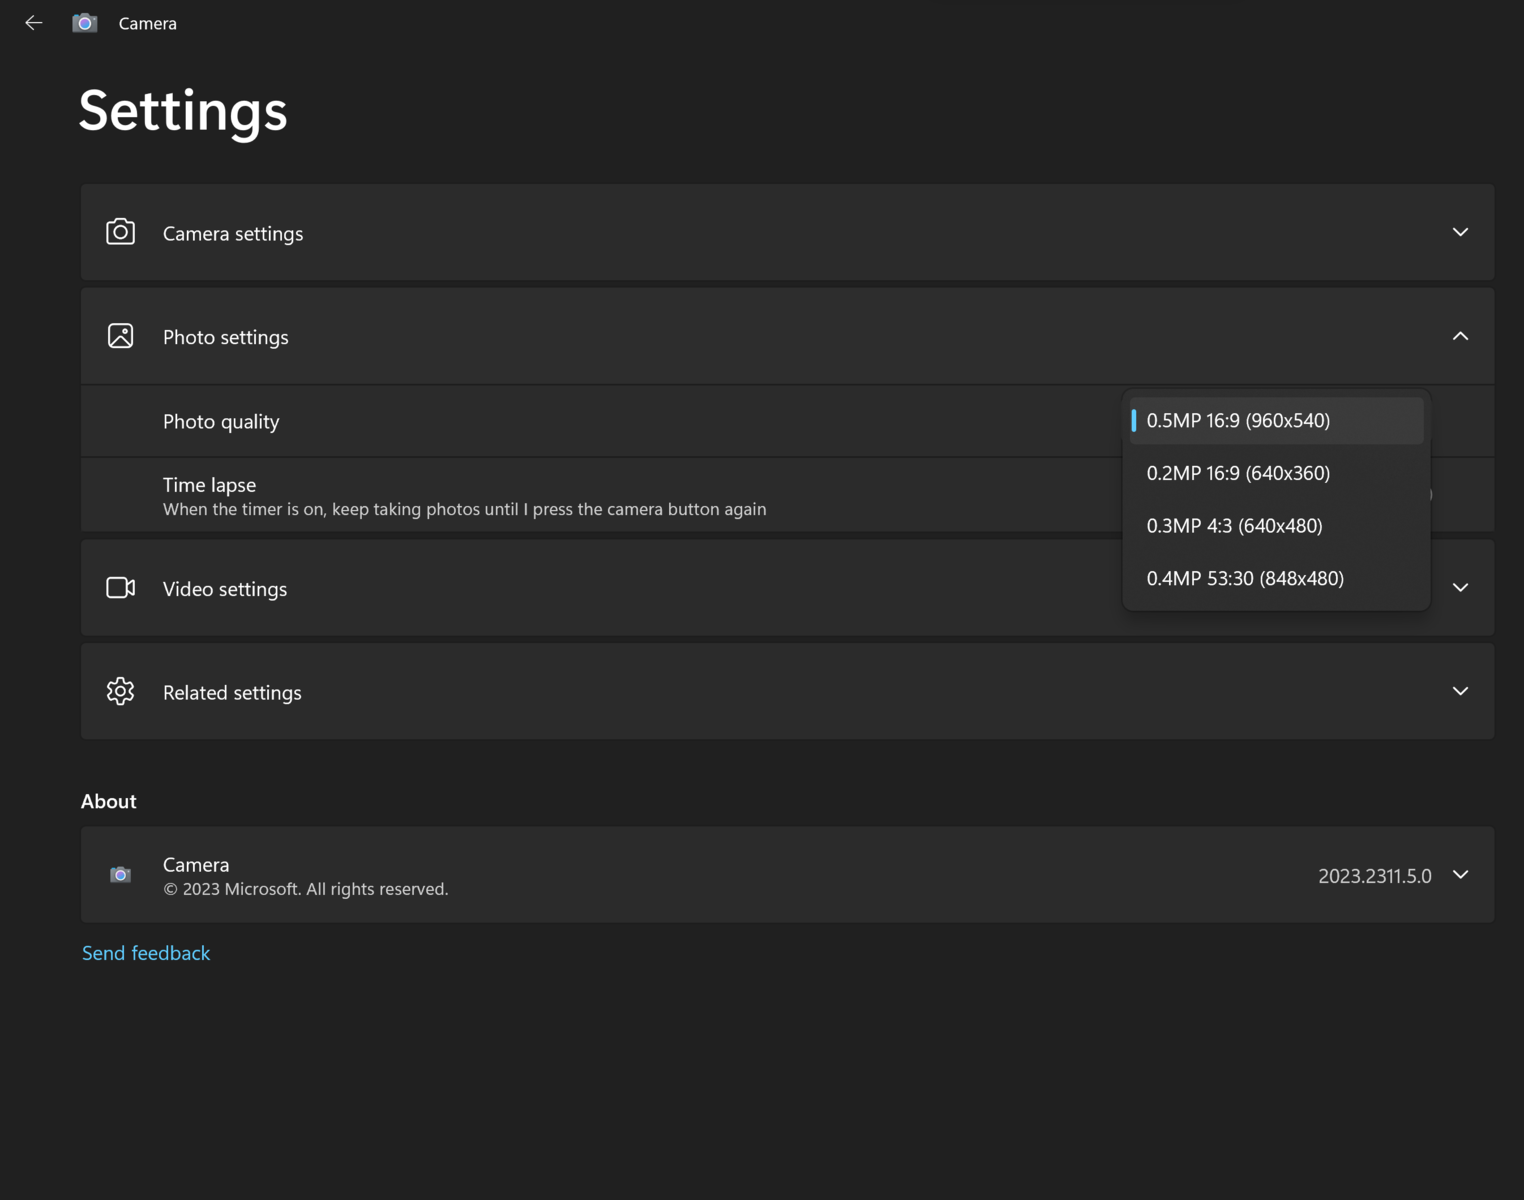
Bien que Lenovo annonce une webcam de 2 MP, nous ne pouvons sélectionner que 0,5 MP avec l'application caméra intégrée, comme le montre la capture d'écran ci-contre. Nous avons informé Lenovo de ce bogue et mettrons à jour cette section si nous recevons une réponse.


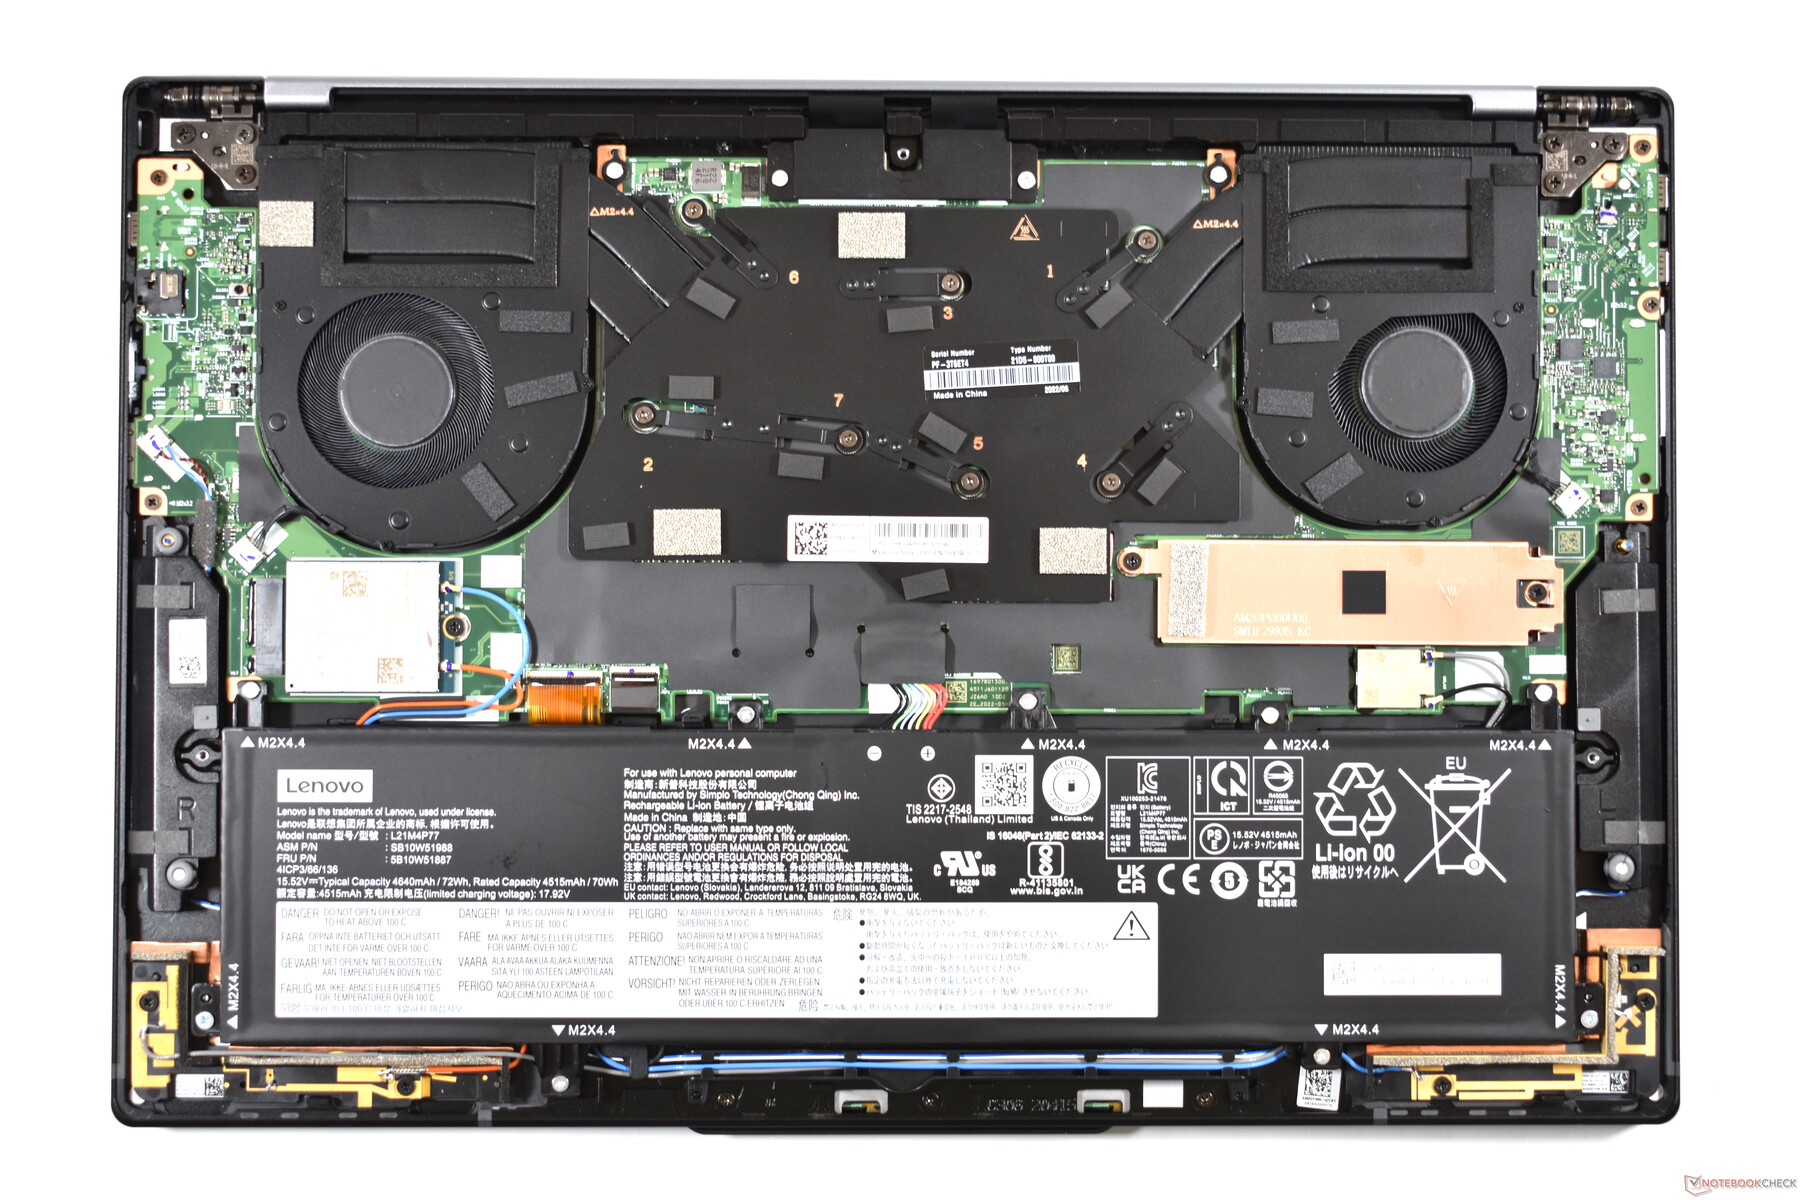
Maintenance
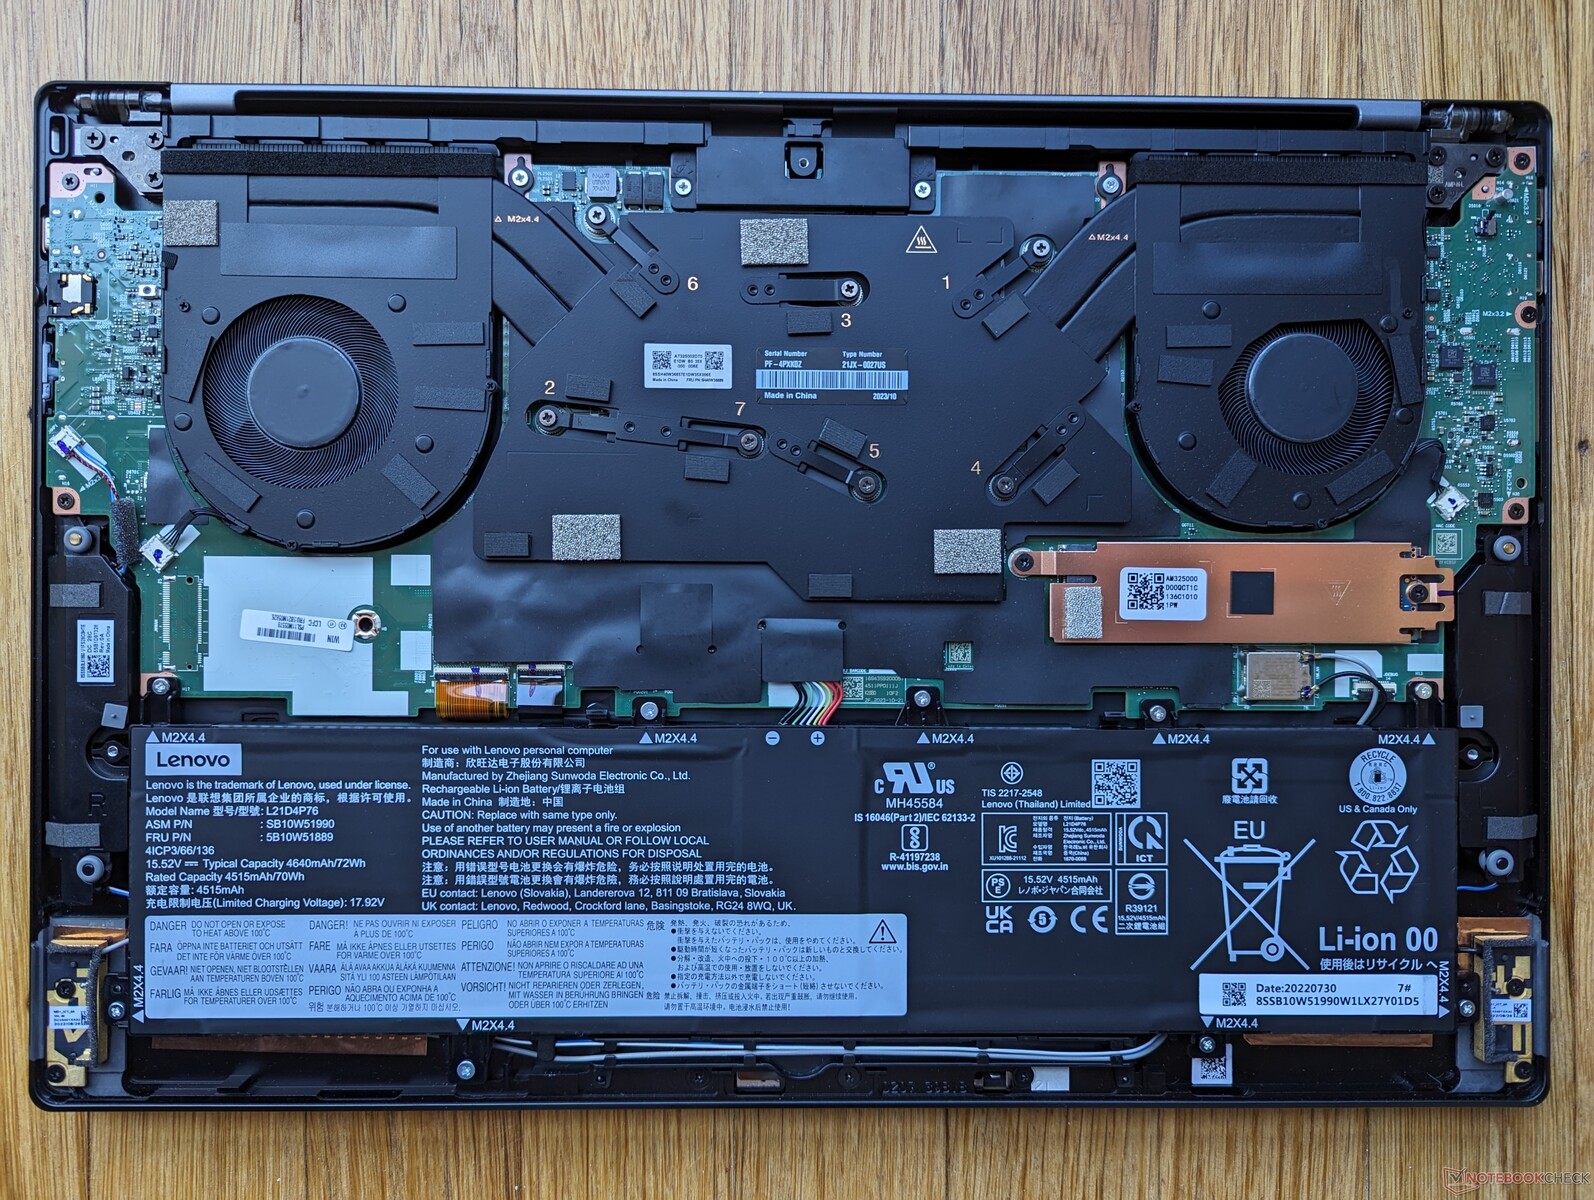
Le retrait du panneau inférieur ne révèle aucune différence interne majeure entre les versions Gen 1 et Gen 2. Notre configuration Gen 2, cependant, n'inclut pas le support WAN et donc le slot WAN M.2 et l'antenne sont absents. Cela signifie malheureusement que les utilisateurs ne peuvent pas acheter une UGS sans WAN avec l'intention d'ajouter un module WAN à l'avenir.
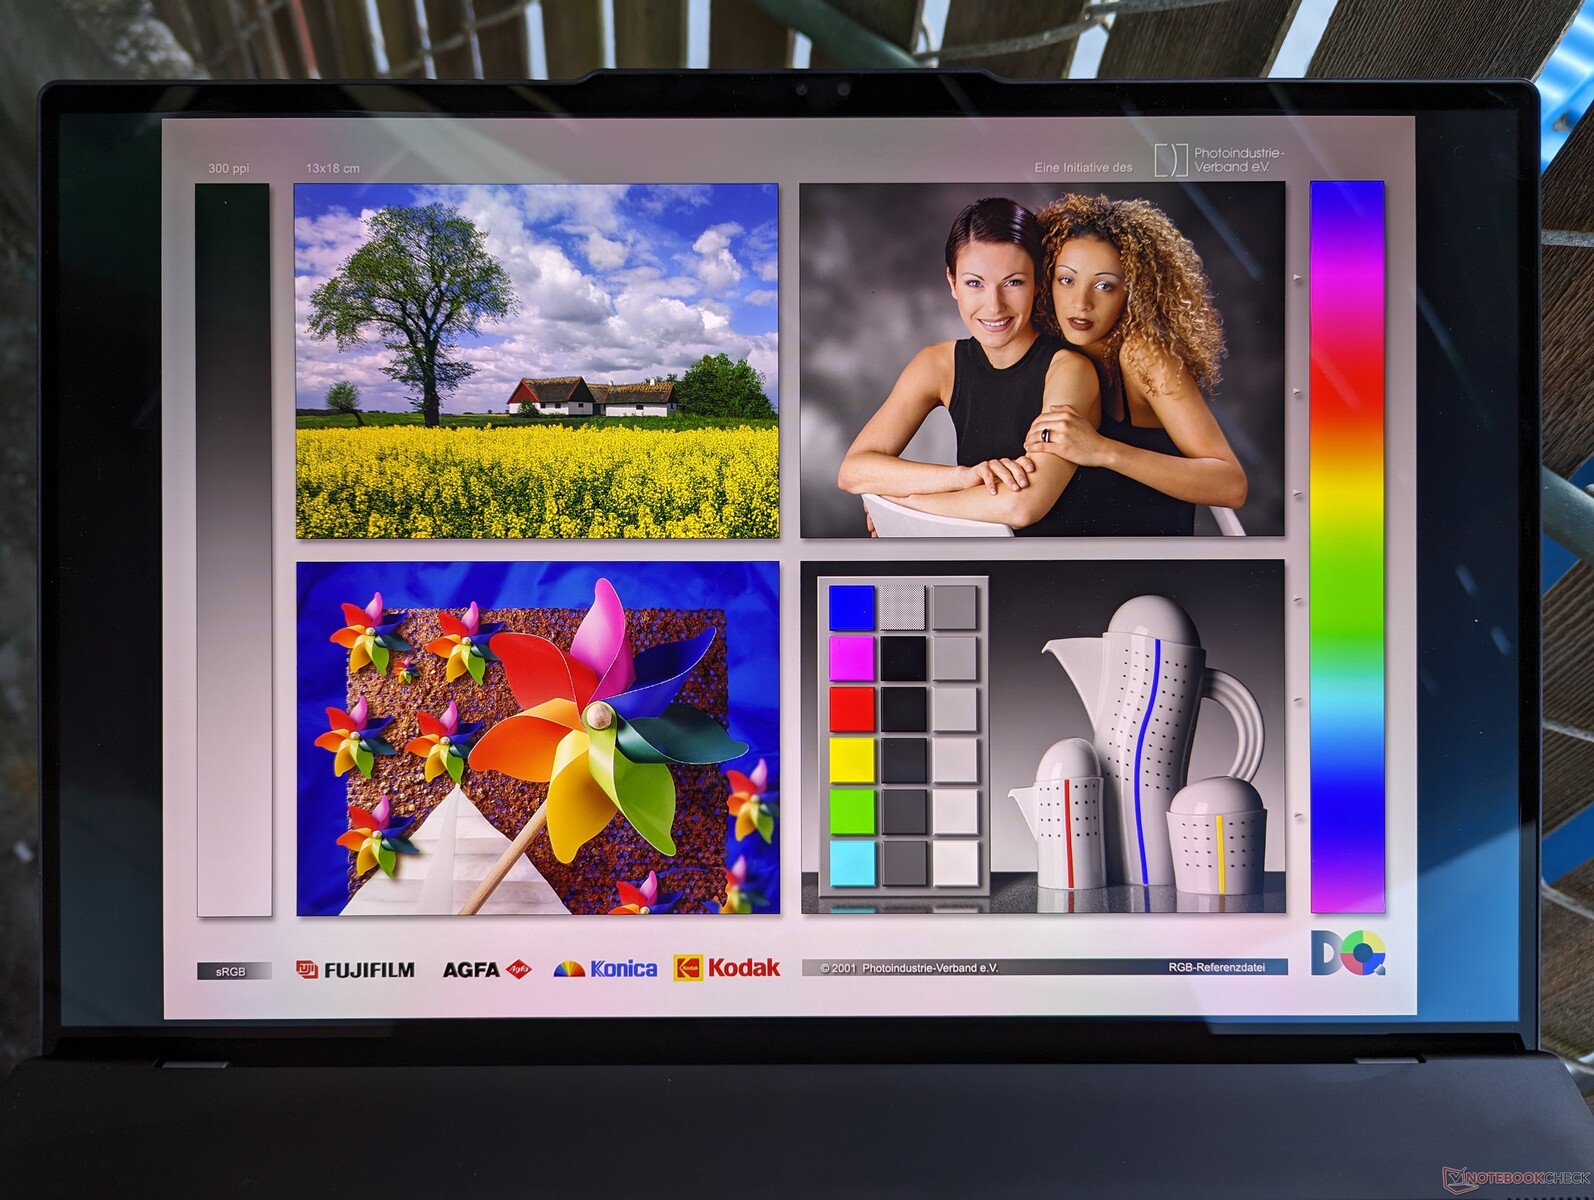
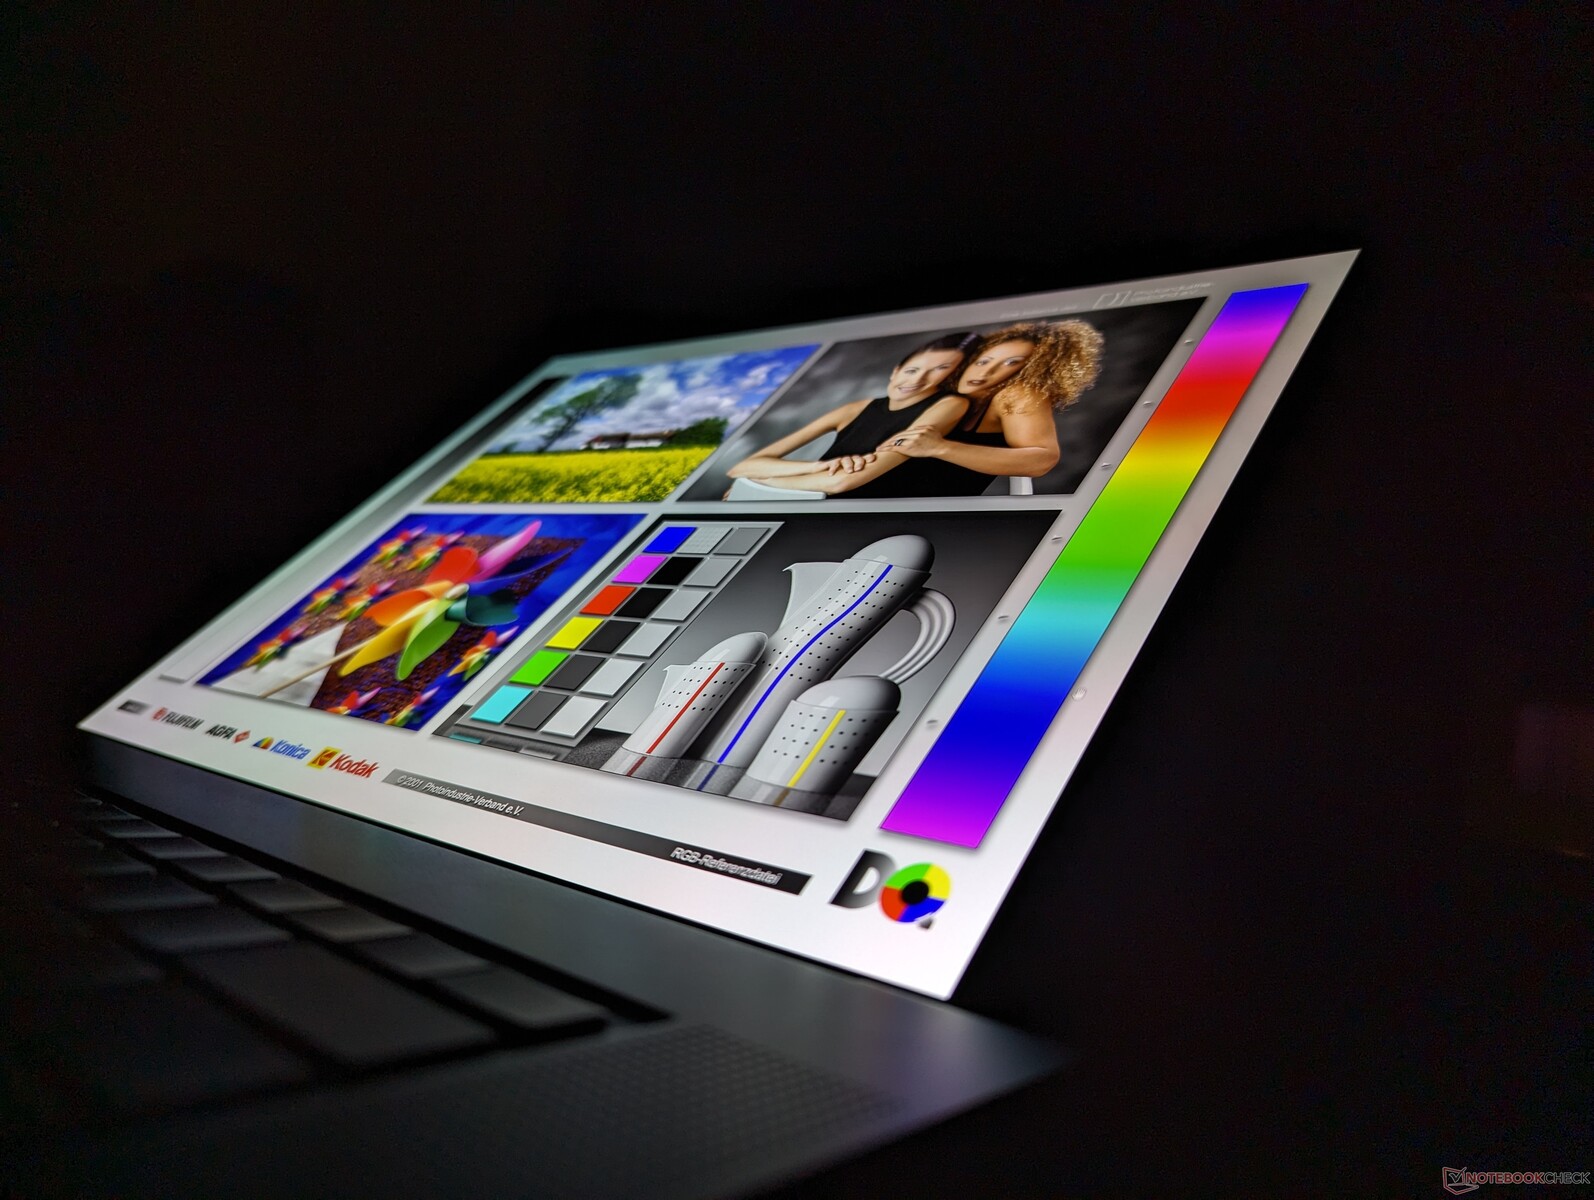
Affichage
Lenovo propose les quatre options d'affichage suivantes, toutes à 60 Hz uniquement et sans prise en charge de FreeSync :
- 1920 x 1200, IPS, mat, non tactile, 100% sRGB, 400 nits
- 1920 x 1200, IPS, brillant, tactile, 100% sRGB, 400 nits
- 3840 x 2400, OLED, brillant, tactile, 100% DCI-P3, 400 nits, HDR400
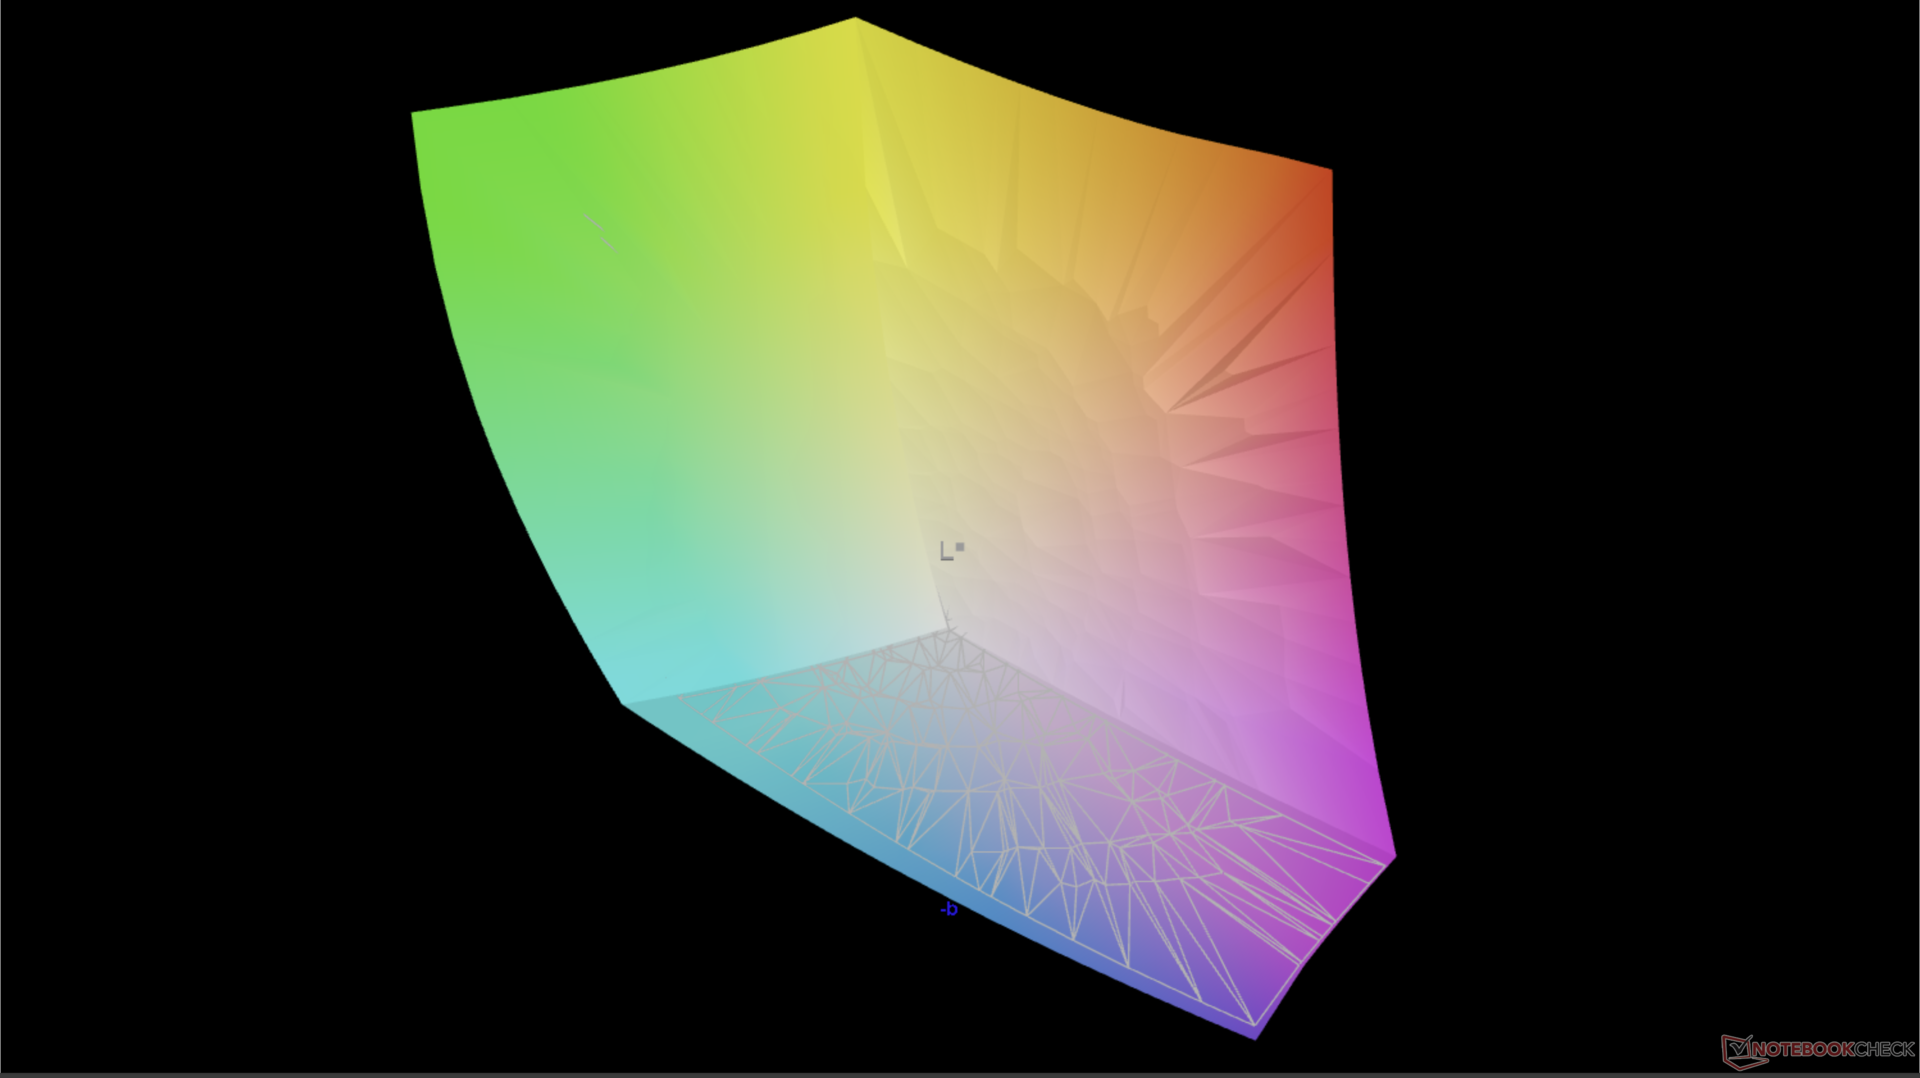
Le même panneau OLED Samsung ATNA60YV04-0 sur notre unité de test se trouve également sur le récent ThinkPad P1 G6 et l'expérience visuelle est donc similaire entre ces deux modèles. Il n'est pas rare qu'un fabricant déploie les mêmes options de panneau sur plusieurs modèles.
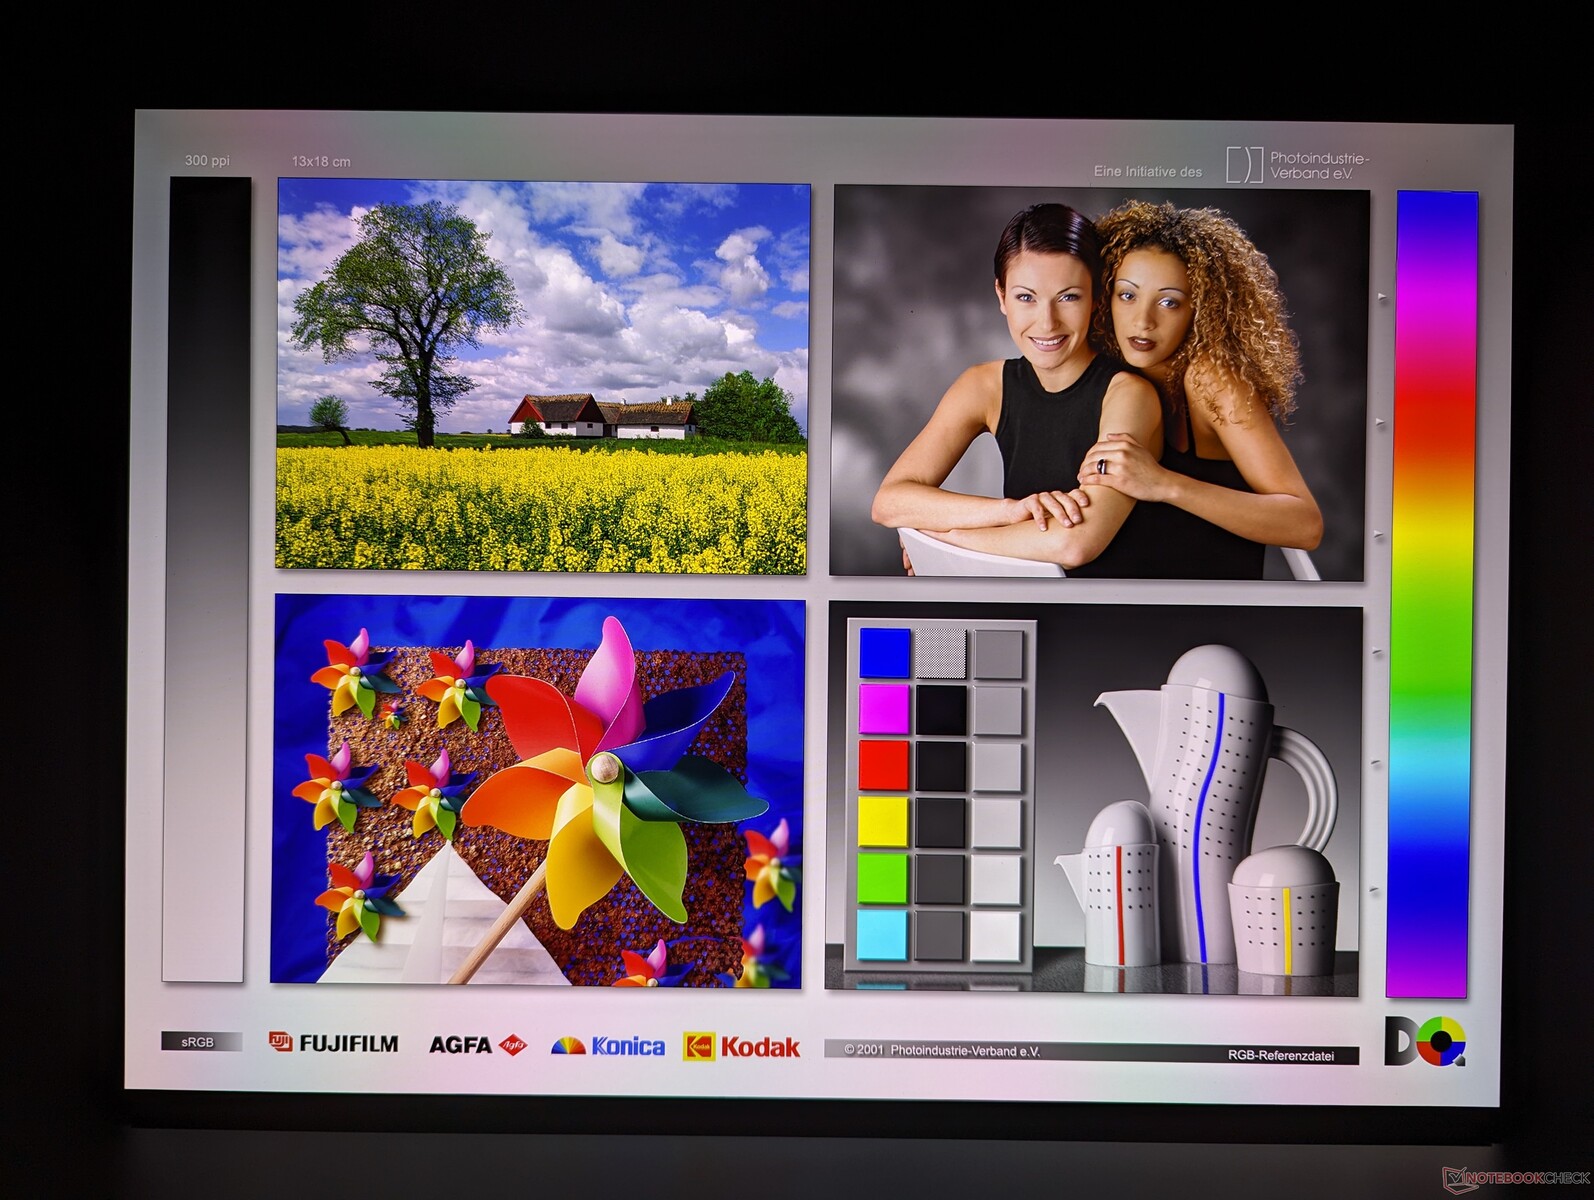
Par rapport à la dalle 1200p de notre modèle Gen 1, la dalle OLED offre des niveaux de noir plus profonds, la prise en charge du HDR, des temps de réponse noir-blanc plus rapides, des couleurs plus vives et une résolution native plus élevée. Quelle que soit l'option choisie, nous sommes heureux de constater que la couverture sRGB complète est standard et qu'il n'y a pas de SKU bas de gamme à éviter. Nous espérons que les prochaines révisions incluront des panneaux à haute fréquence de rafraîchissement, à l'instar de la série VivoBook d'Asus Test de l'Asus VivoBook Pro 16 (2023) : i9-13900H, RTX 4050, et OLED 3.2K pour les créatifs amateurs .

| |||||||||||||||||||||||||
Homogénéité de la luminosité: 97 %
Valeur mesurée au centre, sur batterie: 390.1 cd/m²
Contraste: ∞:1 (Valeurs des noirs: 0 cd/m²)
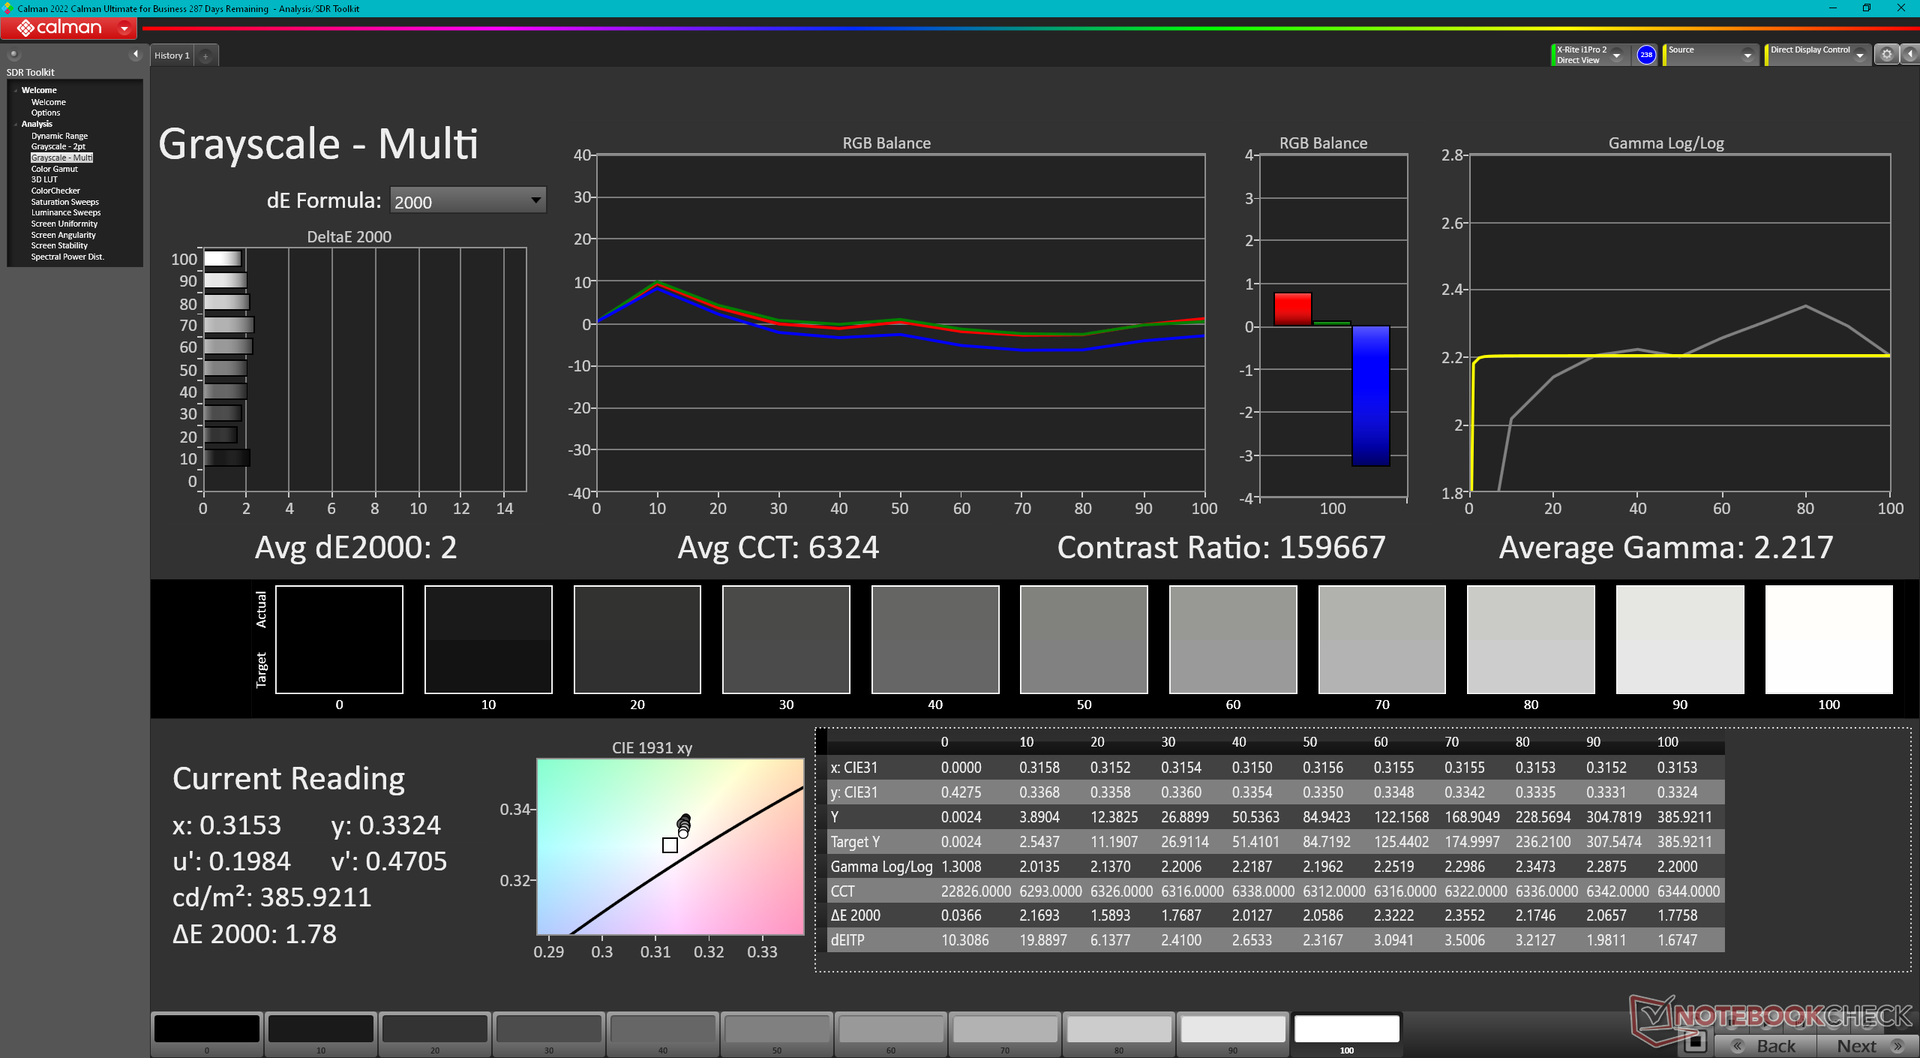
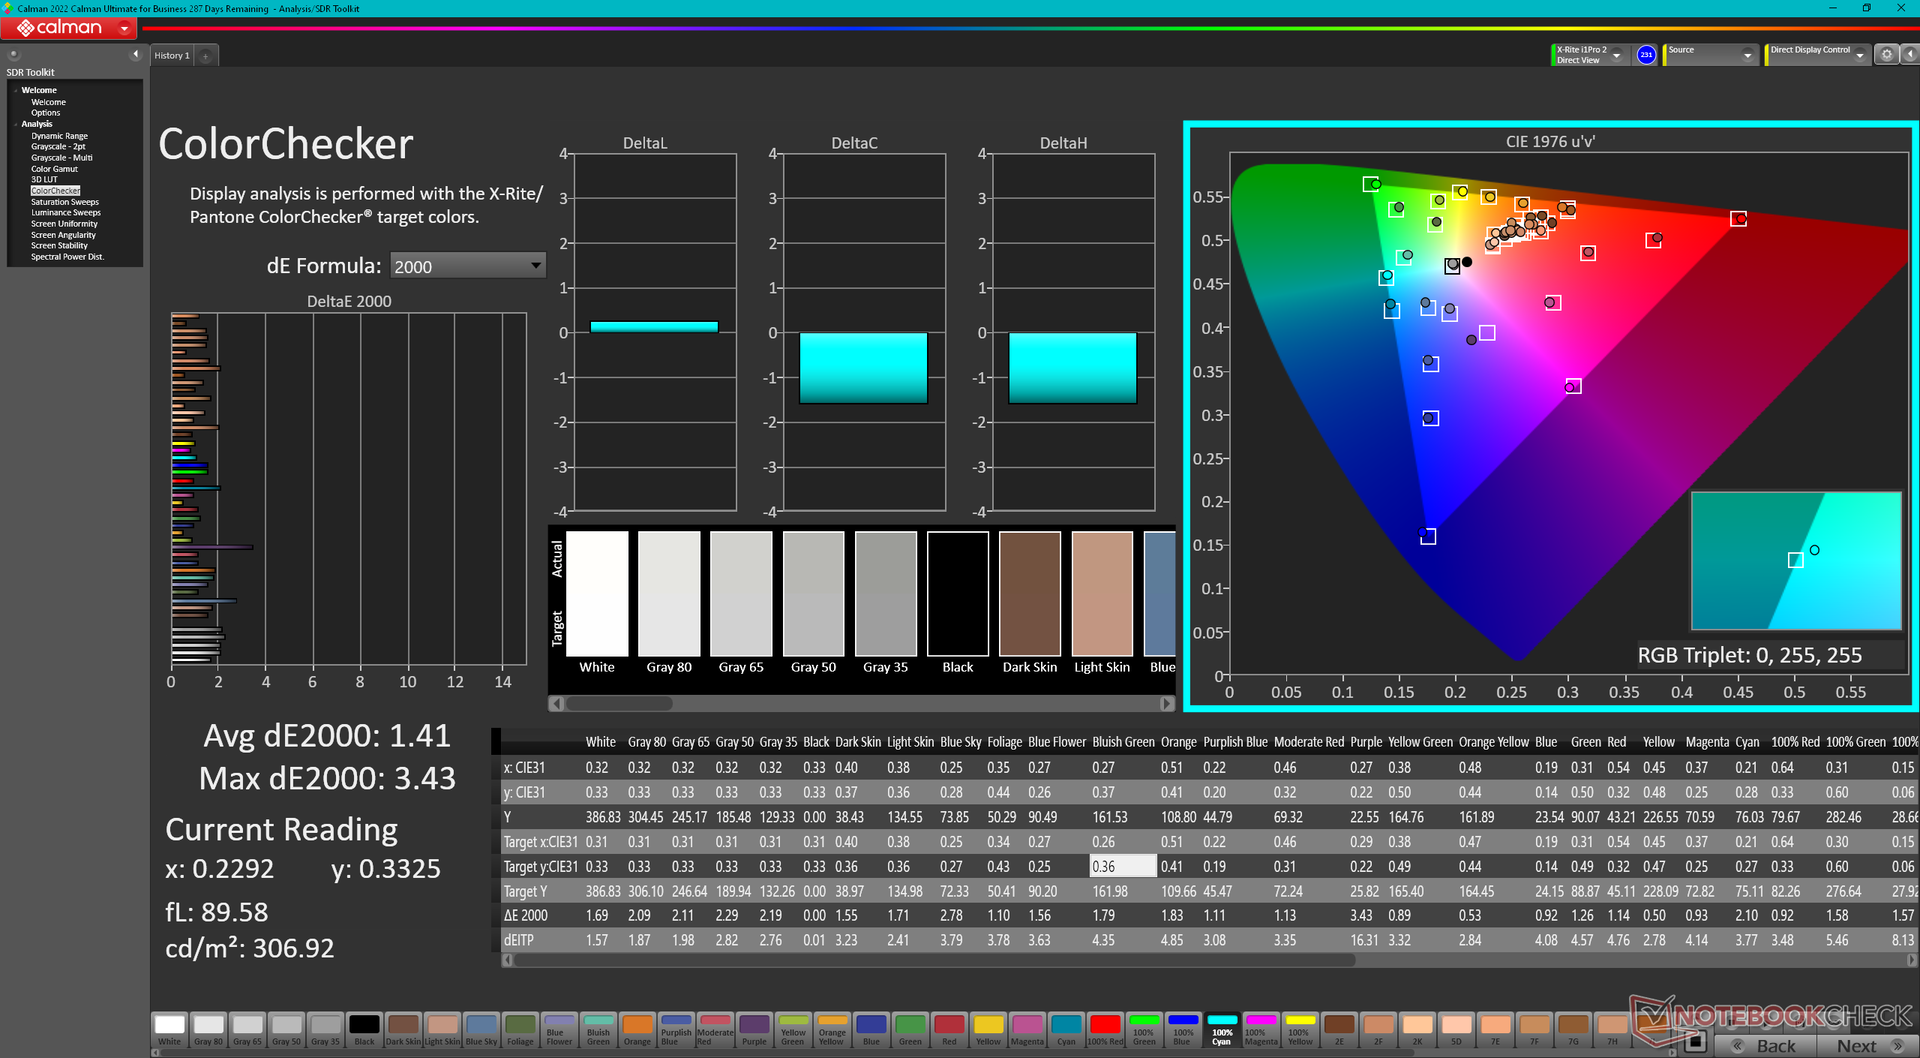
ΔE ColorChecker Calman: 1.41 | ∀{0.5-29.43 Ø4.73}
ΔE Greyscale Calman: 2 | ∀{0.09-98 Ø4.97}
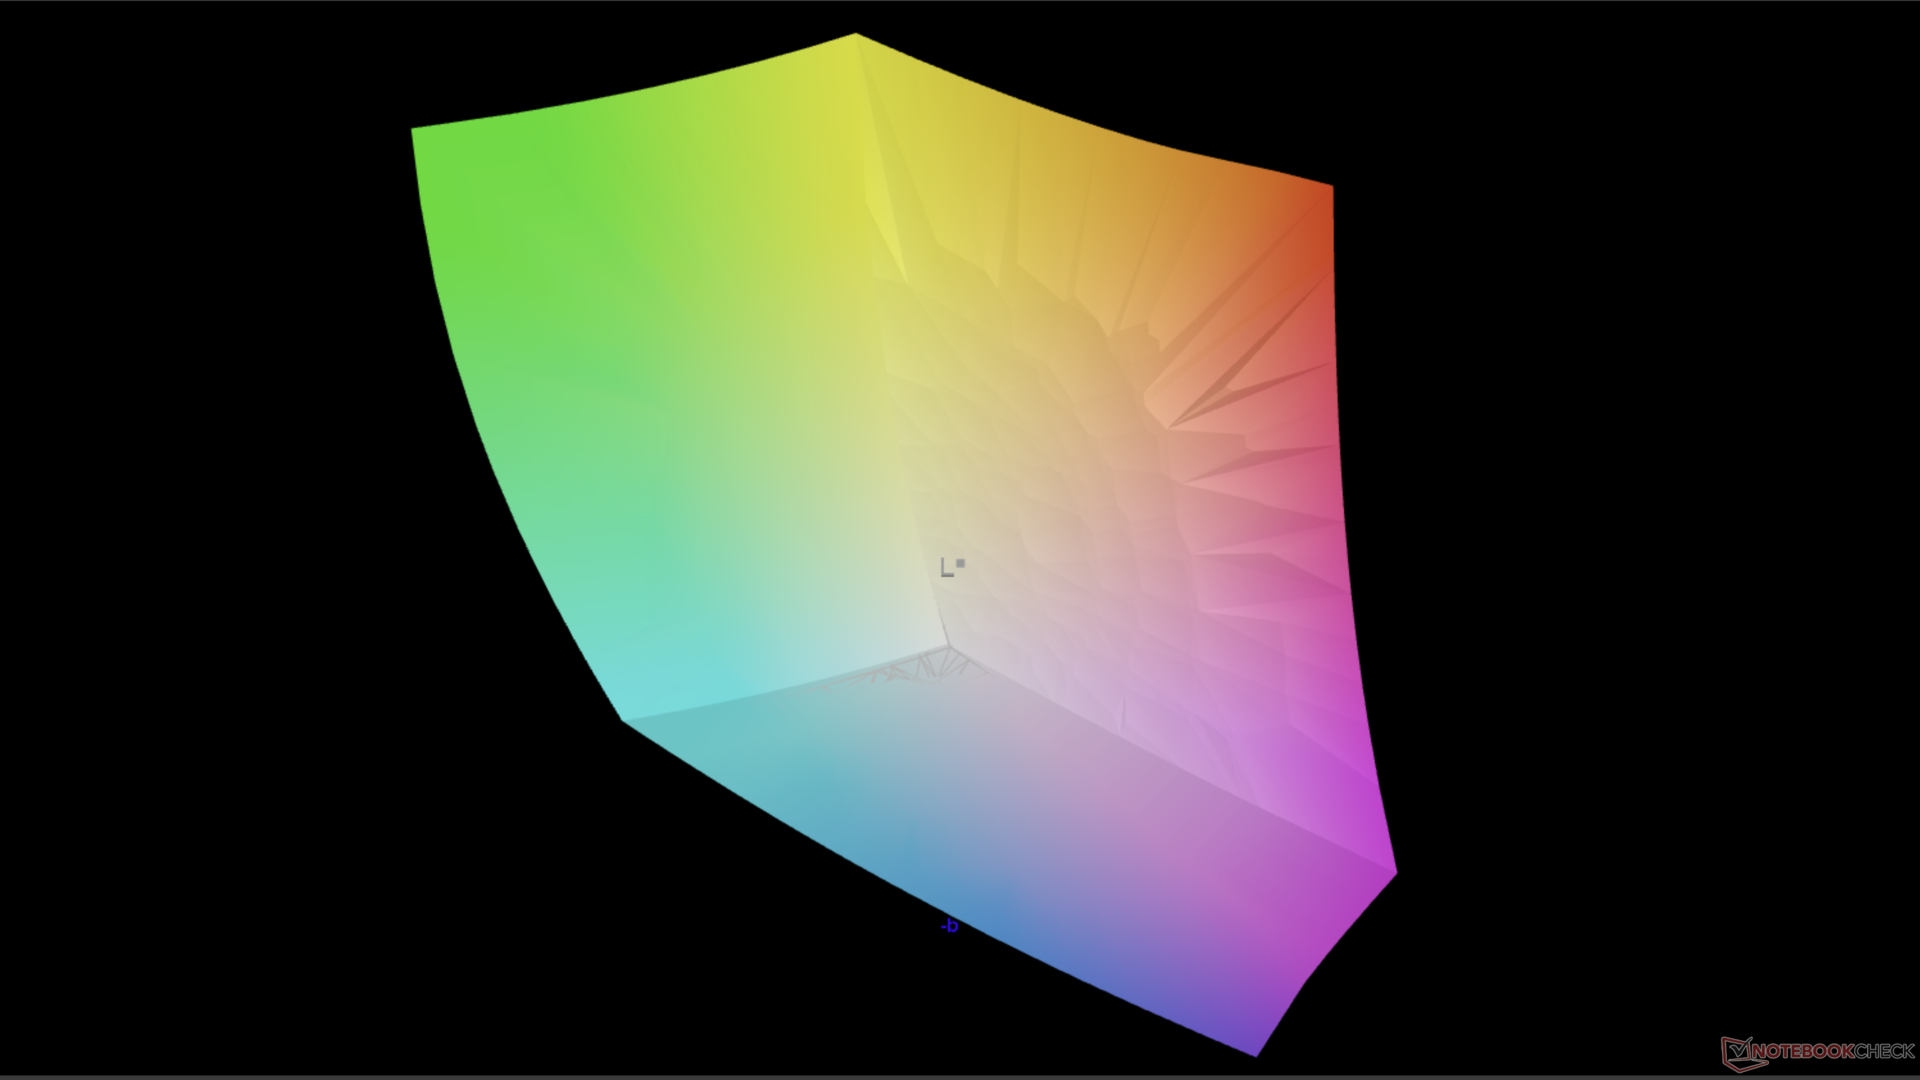
96.7% AdobeRGB 1998 (Argyll 3D)
100% sRGB (Argyll 3D)
99.7% Display P3 (Argyll 3D)
Gamma: 2.22
CCT: 6324 K
| Lenovo ThinkPad Z16 Gen 2 Samsung ATNA60YV04-0, OLED, 3840x2400, 16" | Lenovo ThinkPad Z16 G1 21D5S00T00 NE160WUM-N62 , IPS LED, 1920x1200, 16" | Lenovo ThinkBook 16 G6 ABP LEN160WUXGA, IPS, 1920x1200, 16" | MSI Creator Z16P B12UHST AUOD298, IPS True Pixel (~100% DCI-P3), 2560x1600, 16" | Asus Vivobook Pro 16X K6604JV-MX016W Samsung SDC4178 ATNA60BX01-1, OLED, 3200x2000, 16" | Apple MacBook Pro 16 2023 M3 Max Mini-LED, 3456x2234, 16" | |
|---|---|---|---|---|---|---|
| Display | -18% | -52% | -4% | -1% | -1% | |
| Display P3 Coverage (%) | 99.7 | 70 -30% | 40.4 -59% | 97.6 -2% | 98.4 -1% | 99.2 -1% |
| sRGB Coverage (%) | 100 | 99.7 0% | 59.8 -40% | 99.9 0% | 99.7 0% | |
| AdobeRGB 1998 Coverage (%) | 96.7 | 72.1 -25% | 42 -57% | 86.8 -10% | 95.8 -1% | |
| Response Times | -1637% | -1414% | -417% | 20% | -2852% | |
| Response Time Grey 50% / Grey 80% * (ms) | 1.86 ? | 40 ? -2051% | 32.8 ? -1663% | 12.9 ? -594% | 1.6 ? 14% | 66.9 ? -3497% |
| Response Time Black / White * (ms) | 1.89 ? | 25 ? -1223% | 23.9 ? -1165% | 6.4 ? -239% | 1.4 ? 26% | 43.6 ? -2207% |
| PWM Frequency (Hz) | 60 ? | 120 ? | 14877 | |||
| Screen | -3% | -185% | -23% | -5% | 25% | |
| Brightness middle (cd/m²) | 390.1 | 487 25% | 310 -21% | 428 10% | 347 -11% | 630 61% |
| Brightness (cd/m²) | 393 | 446 13% | 290 -26% | 394 0% | 346 -12% | 604 54% |
| Brightness Distribution (%) | 97 | 83 -14% | 86 -11% | 86 -11% | 97 0% | 94 -3% |
| Black Level * (cd/m²) | 0.31 | 0.22 | 0.42 | 0.06 | ||
| Colorchecker dE 2000 * | 1.41 | 1.8 -28% | 6.2 -340% | 1.67 -18% | 1.89 -34% | 1.2 15% |
| Colorchecker dE 2000 max. * | 3.43 | 3.3 4% | 24.7 -620% | 5.71 -66% | 3.26 5% | 2.8 18% |
| Greyscale dE 2000 * | 2 | 2.3 -15% | 3.8 -90% | 3.1 -55% | 1.55 22% | 1.9 5% |
| Gamma | 2.22 99% | 2.16 102% | 2.22 99% | 2.195 100% | 2.39 92% | 2.29 96% |
| CCT | 6324 103% | 6867 95% | 6011 108% | 6498 100% | 6458 101% | 6812 95% |
| Contrast (:1) | 1571 | 1409 | 1019 | 5783 | ||
| Colorchecker dE 2000 calibrated * | 0.8 | 5.3 | 0.71 | 1.97 | ||
| Moyenne finale (programmes/paramètres) | -553% /
-304% | -550% /
-372% | -148% /
-90% | 5% /
1% | -943% /
-617% |
* ... Moindre est la valeur, meilleures sont les performances
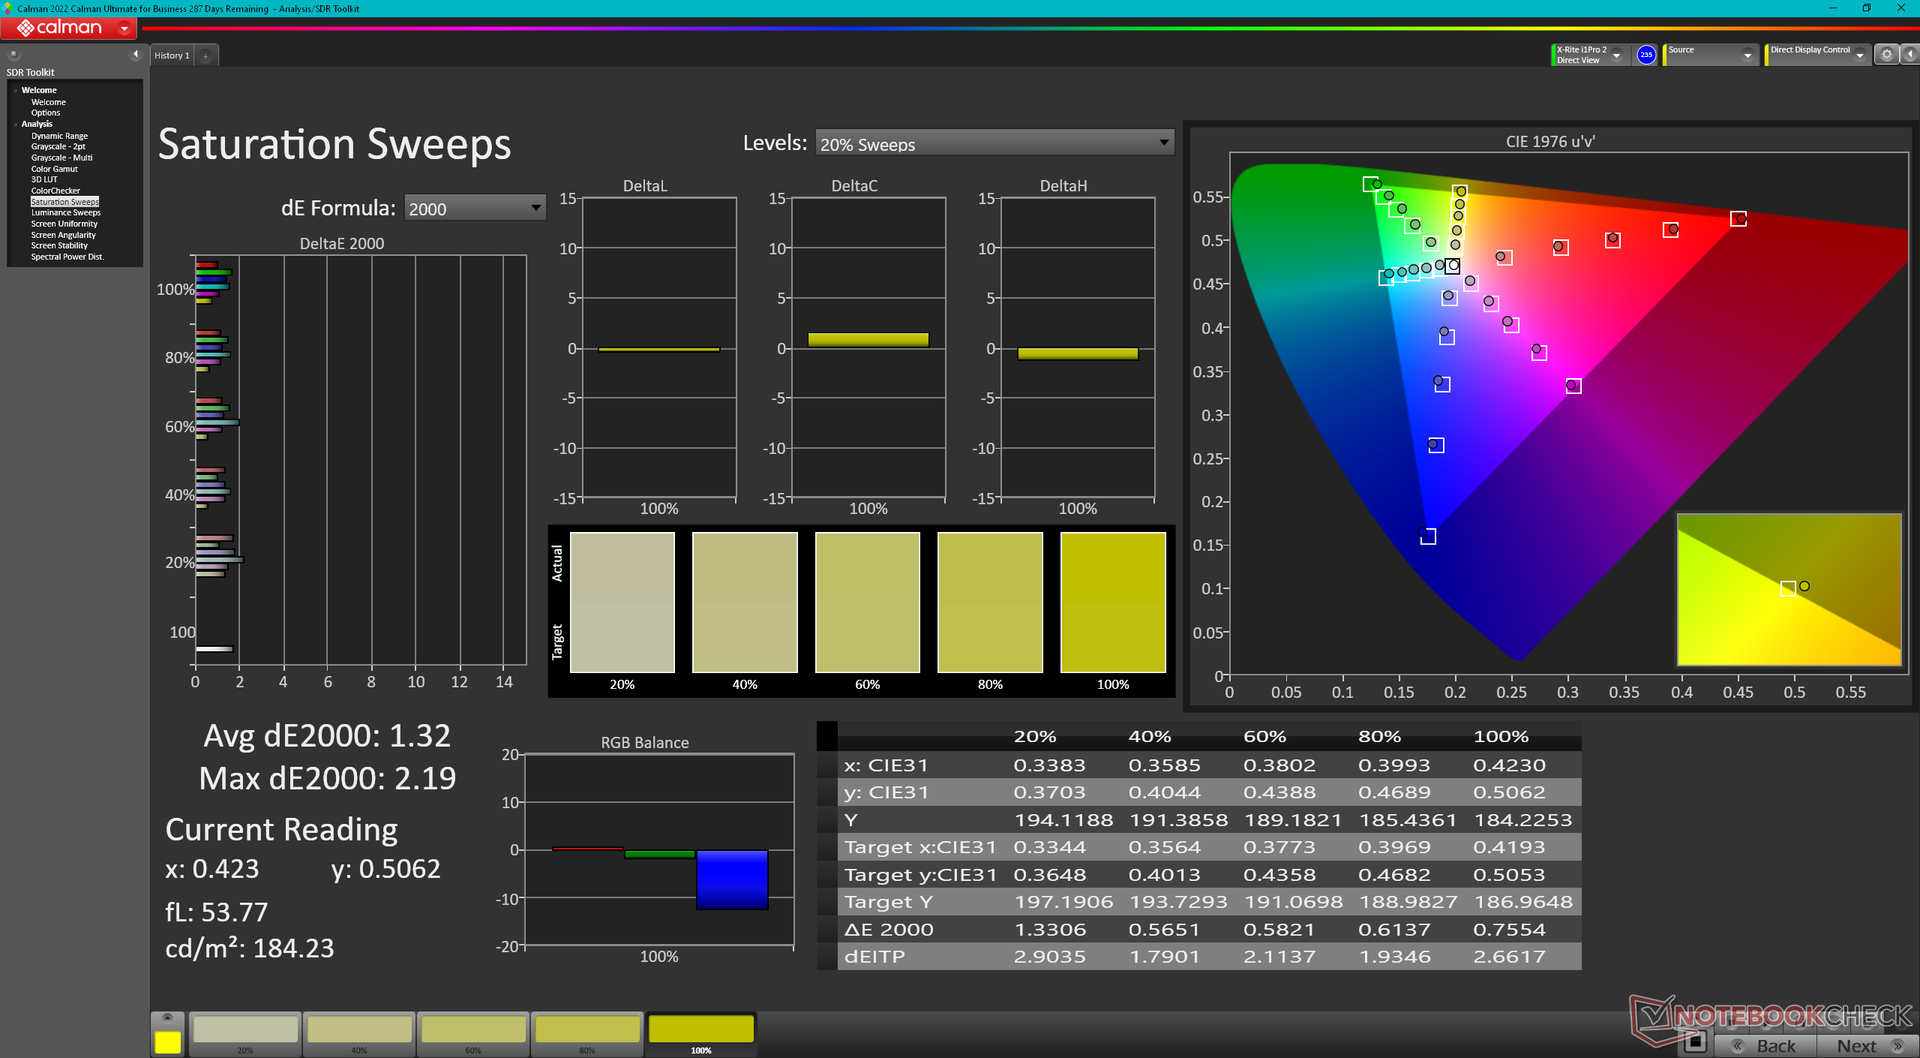
L'écran OLED est bien calibré dès sa sortie de l'emballage, avec des valeurs moyennes de deltaE en niveaux de gris et en couleurs de seulement 2,0 et 1,41, respectivement. Un étalonnage par l'utilisateur final n'est donc pas nécessaire pour la grande majorité des utilisateurs.
Temps de réponse de l'écran
| ↔ Temps de réponse noir à blanc | ||
|---|---|---|
| 1.89 ms ... hausse ↗ et chute ↘ combinées | ↗ ms hausse | 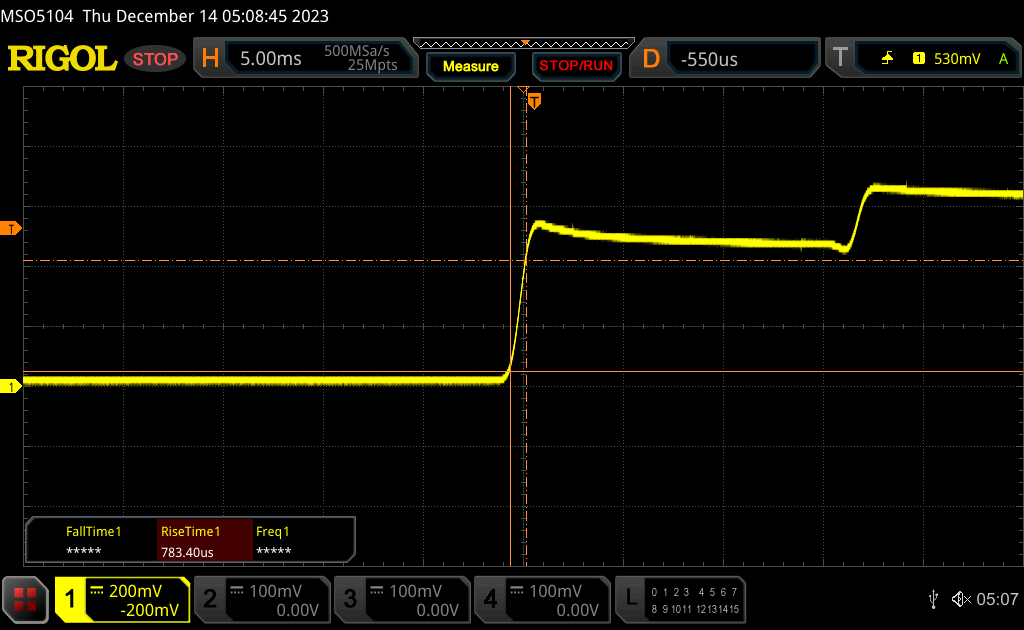 |
| ↘ 0.89 ms chute | ||
| L'écran montre de très faibles temps de réponse, parfait pour le jeu. En comparaison, tous les appareils testés affichent entre 0.1 (minimum) et 240 (maximum) ms. » 11 % des appareils testés affichent de meilleures performances. Cela signifie que les latences relevées sont meilleures que la moyenne (19.9 ms) de tous les appareils testés. | ||
| ↔ Temps de réponse gris 50% à gris 80% | ||
| 1.86 ms ... hausse ↗ et chute ↘ combinées | ↗ 0.96 ms hausse | 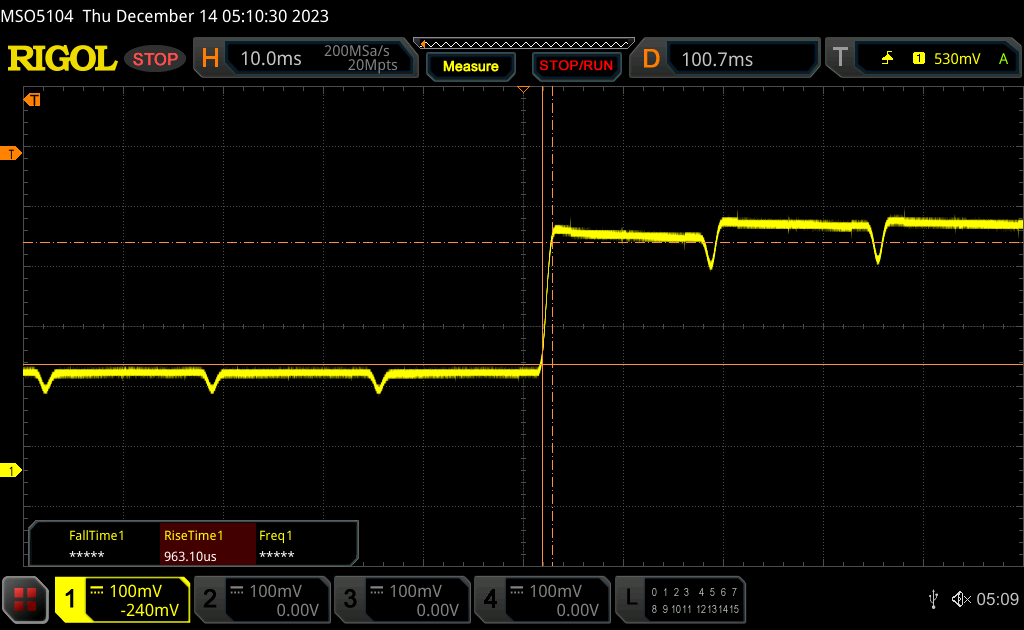 |
| ↘ 0.9 ms chute | ||
| L'écran montre de très faibles temps de réponse, parfait pour le jeu. En comparaison, tous les appareils testés affichent entre 0.165 (minimum) et 636 (maximum) ms. » 9 % des appareils testés affichent de meilleures performances. Cela signifie que les latences relevées sont meilleures que la moyenne (31.1 ms) de tous les appareils testés. | ||
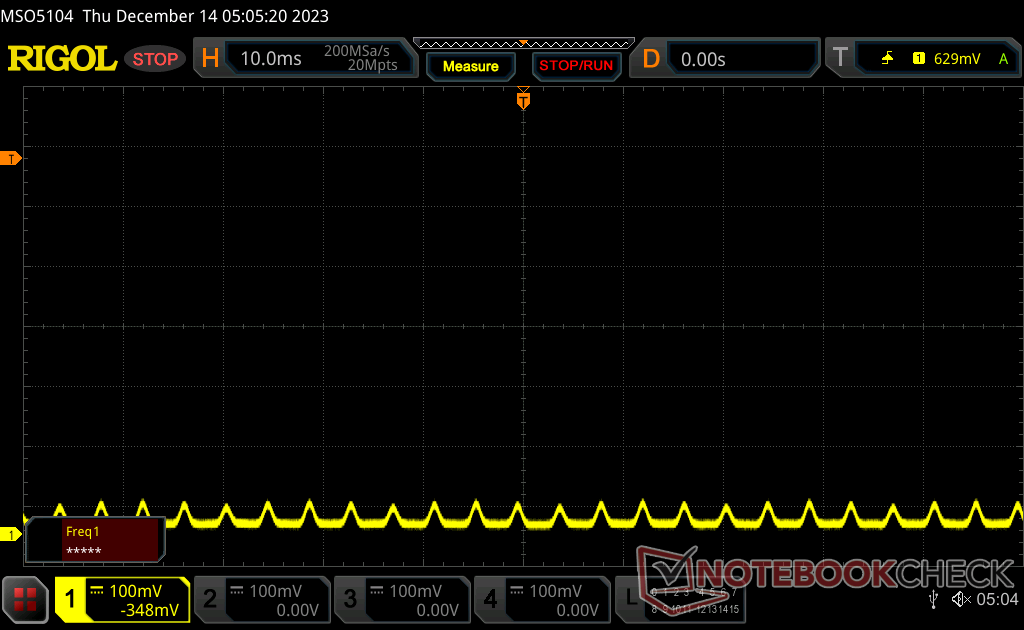
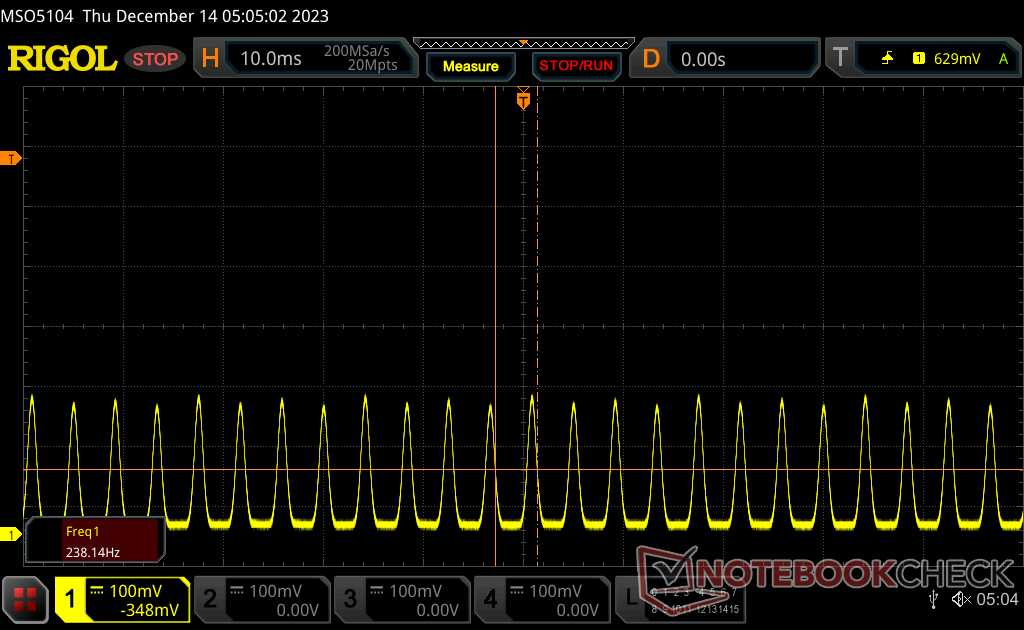
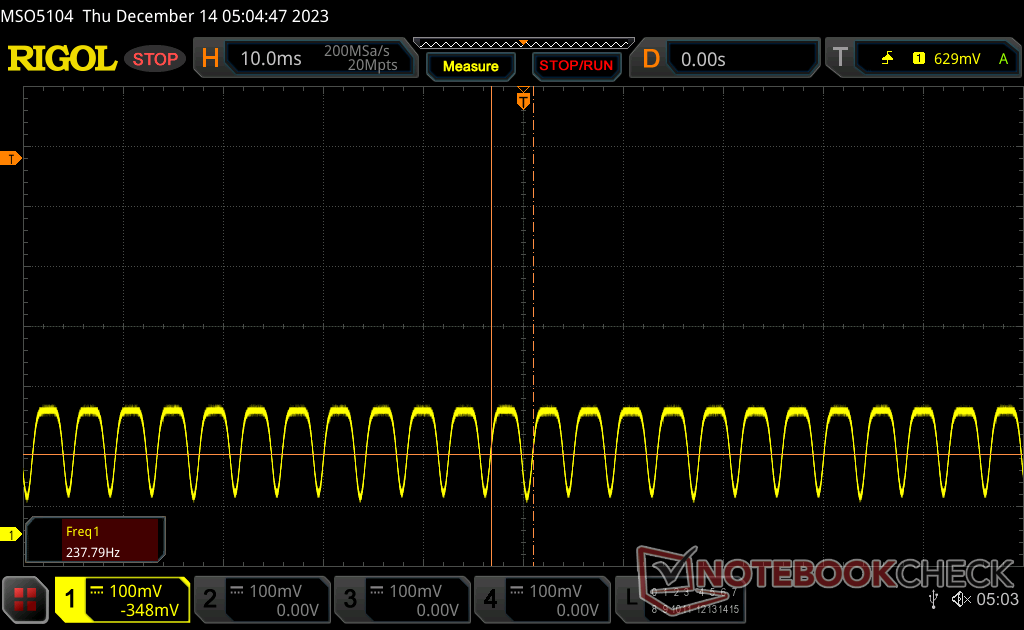
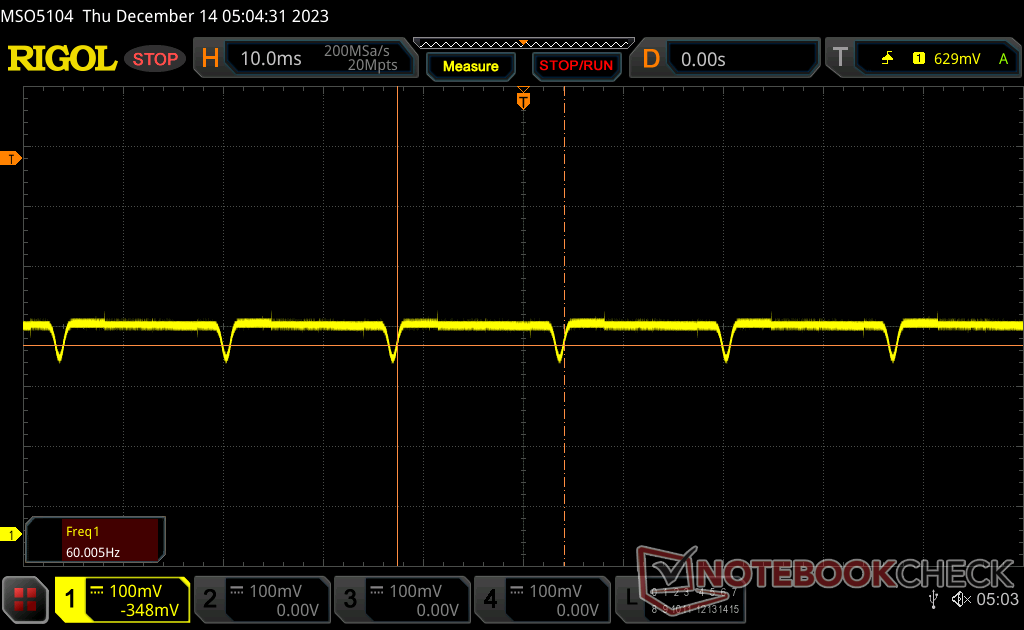
Scintillement / MLI (Modulation de largeur d'impulsion)
| Scintillement / MLI (Modulation de largeur d'impulsion) décelé | 60 Hz | ≤ 100 Niveau de luminosité | 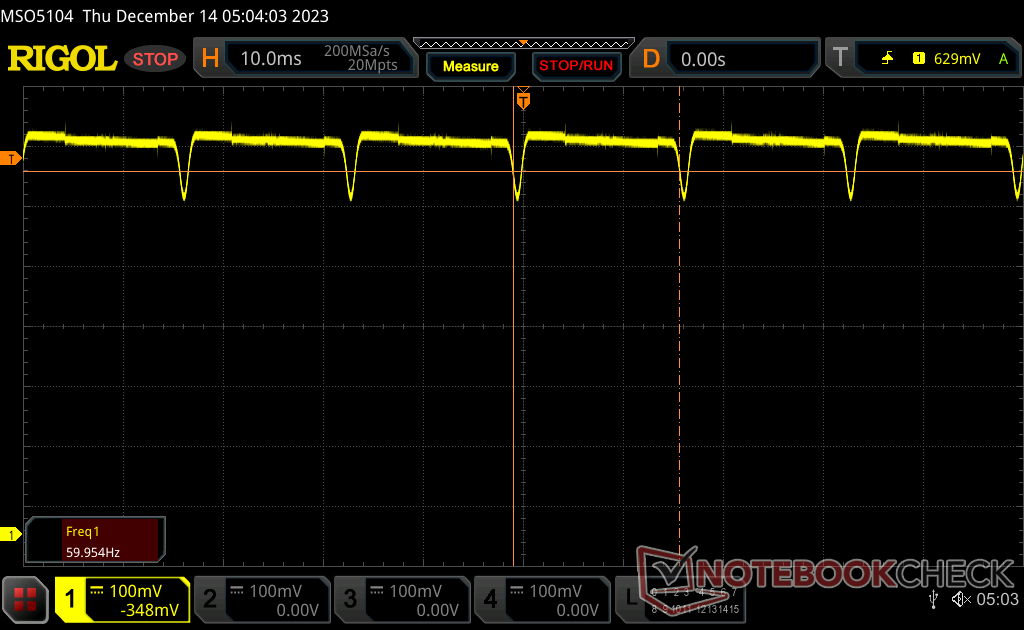 |
Le rétroéclairage de l'écran scintille à la fréquence de 60 Hz (certainement du fait de l'utilisation d'une MDI - Modulation de largeur d'impulsion) à un niveau de luminosité inférieur ou égal à 100 % . Aucun scintillement ne devrait être perceptible au-dessus de cette valeur. La fréquence de rafraîchissement de 60 Hz est extrêmement faible, de grands risques de fatigue oculaire accrue et de maux de tête en cas d'utilisation prolongée. En comparaison, 52 % des appareils testés n'emploient pas MDI pour assombrir leur écran. Nous avons relevé une moyenne à 7798 (minimum : 5 - maximum : 343500) Hz dans le cas où une MDI était active. | |||
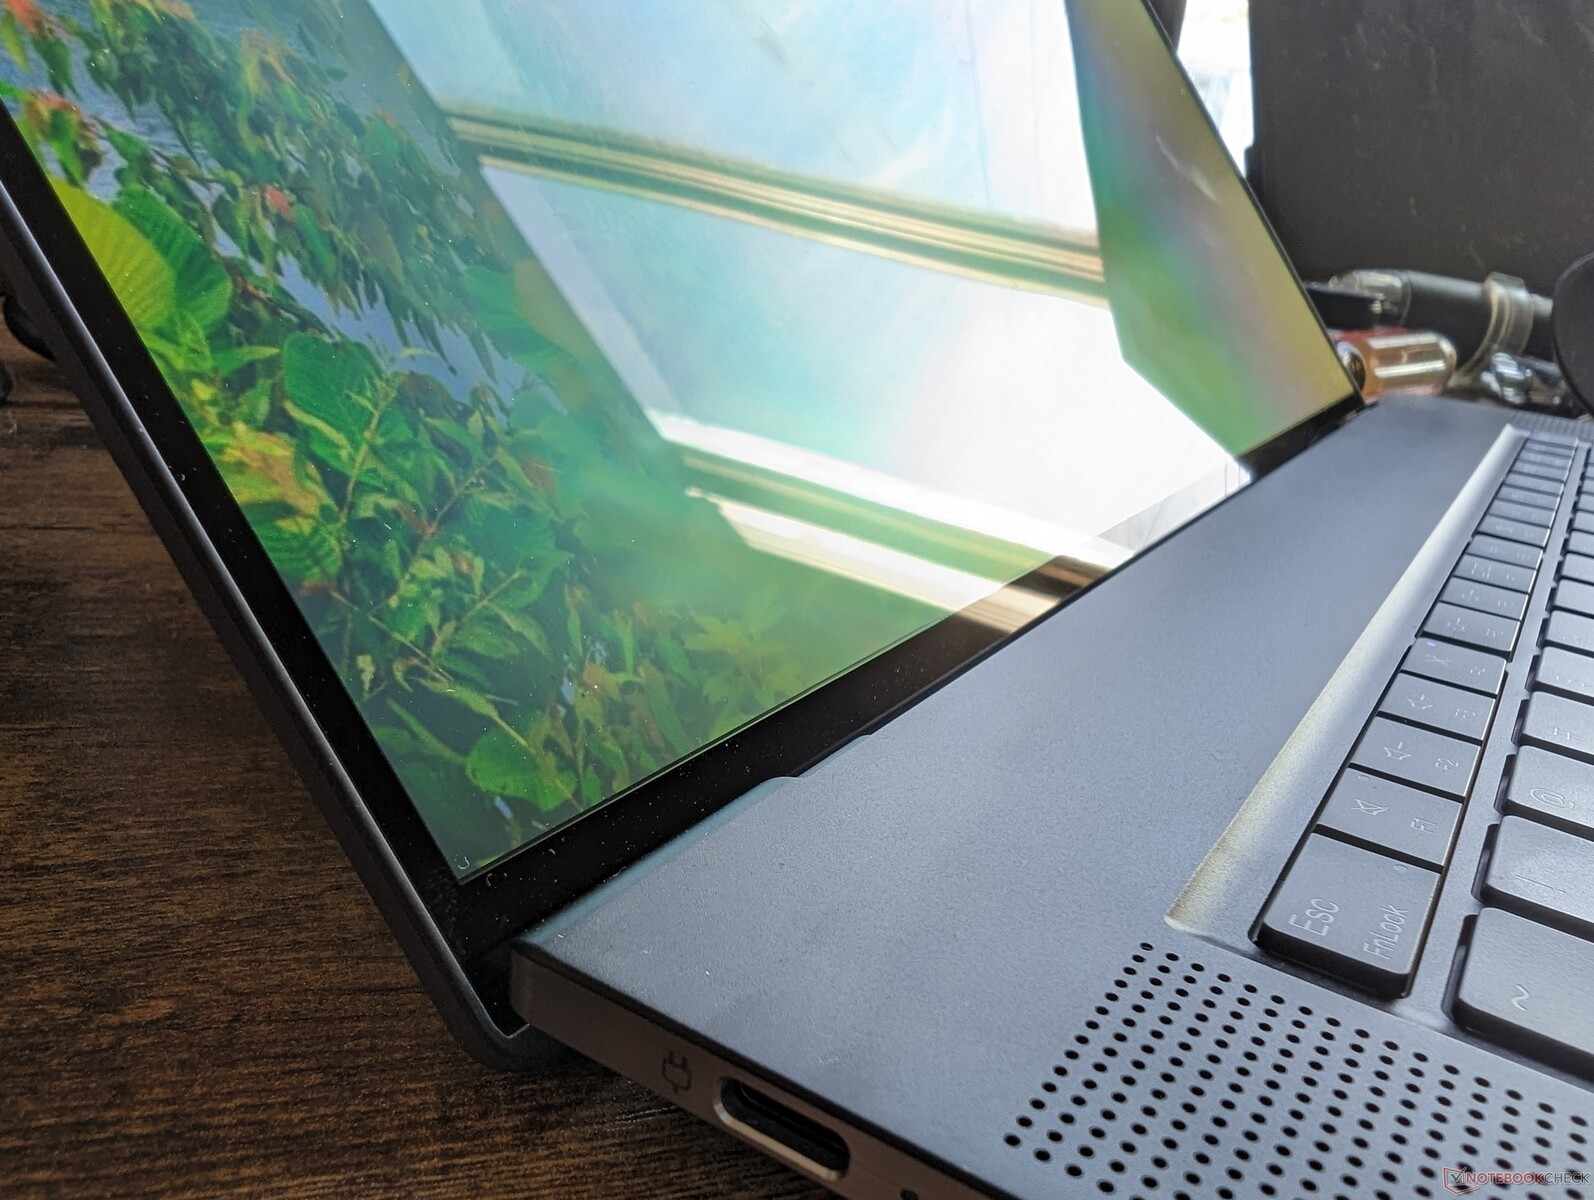
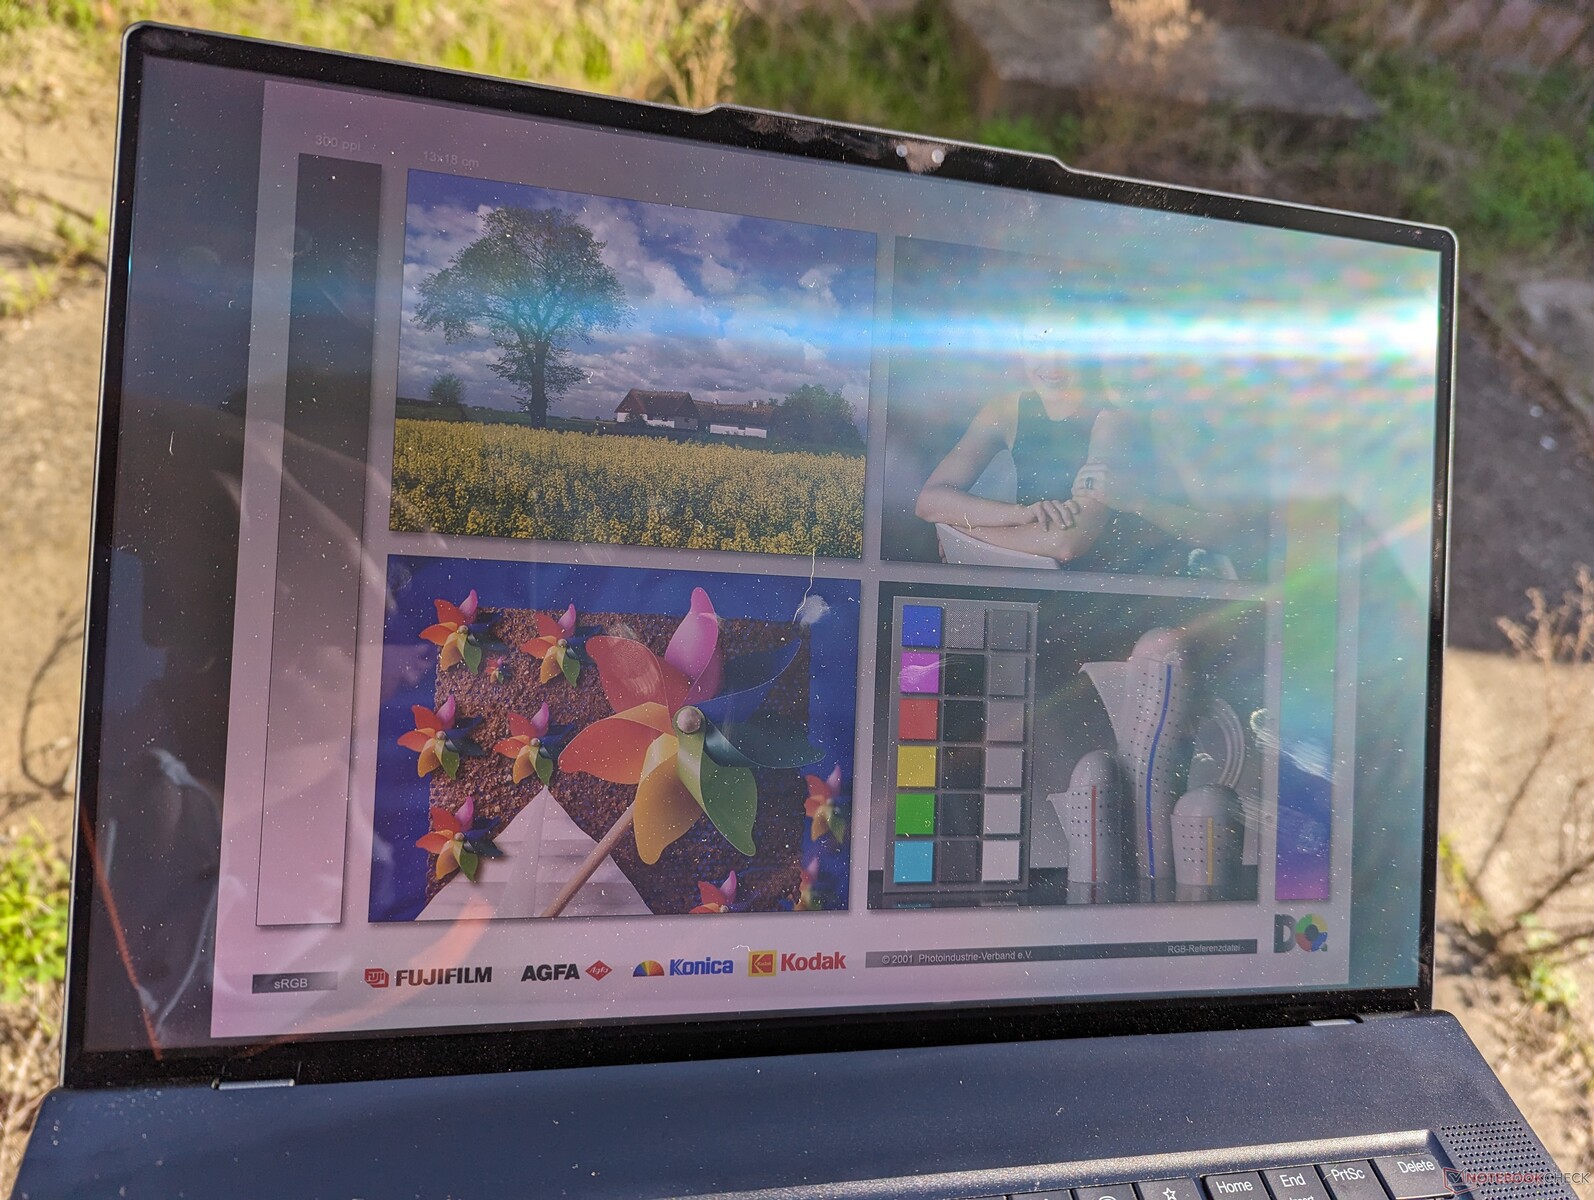
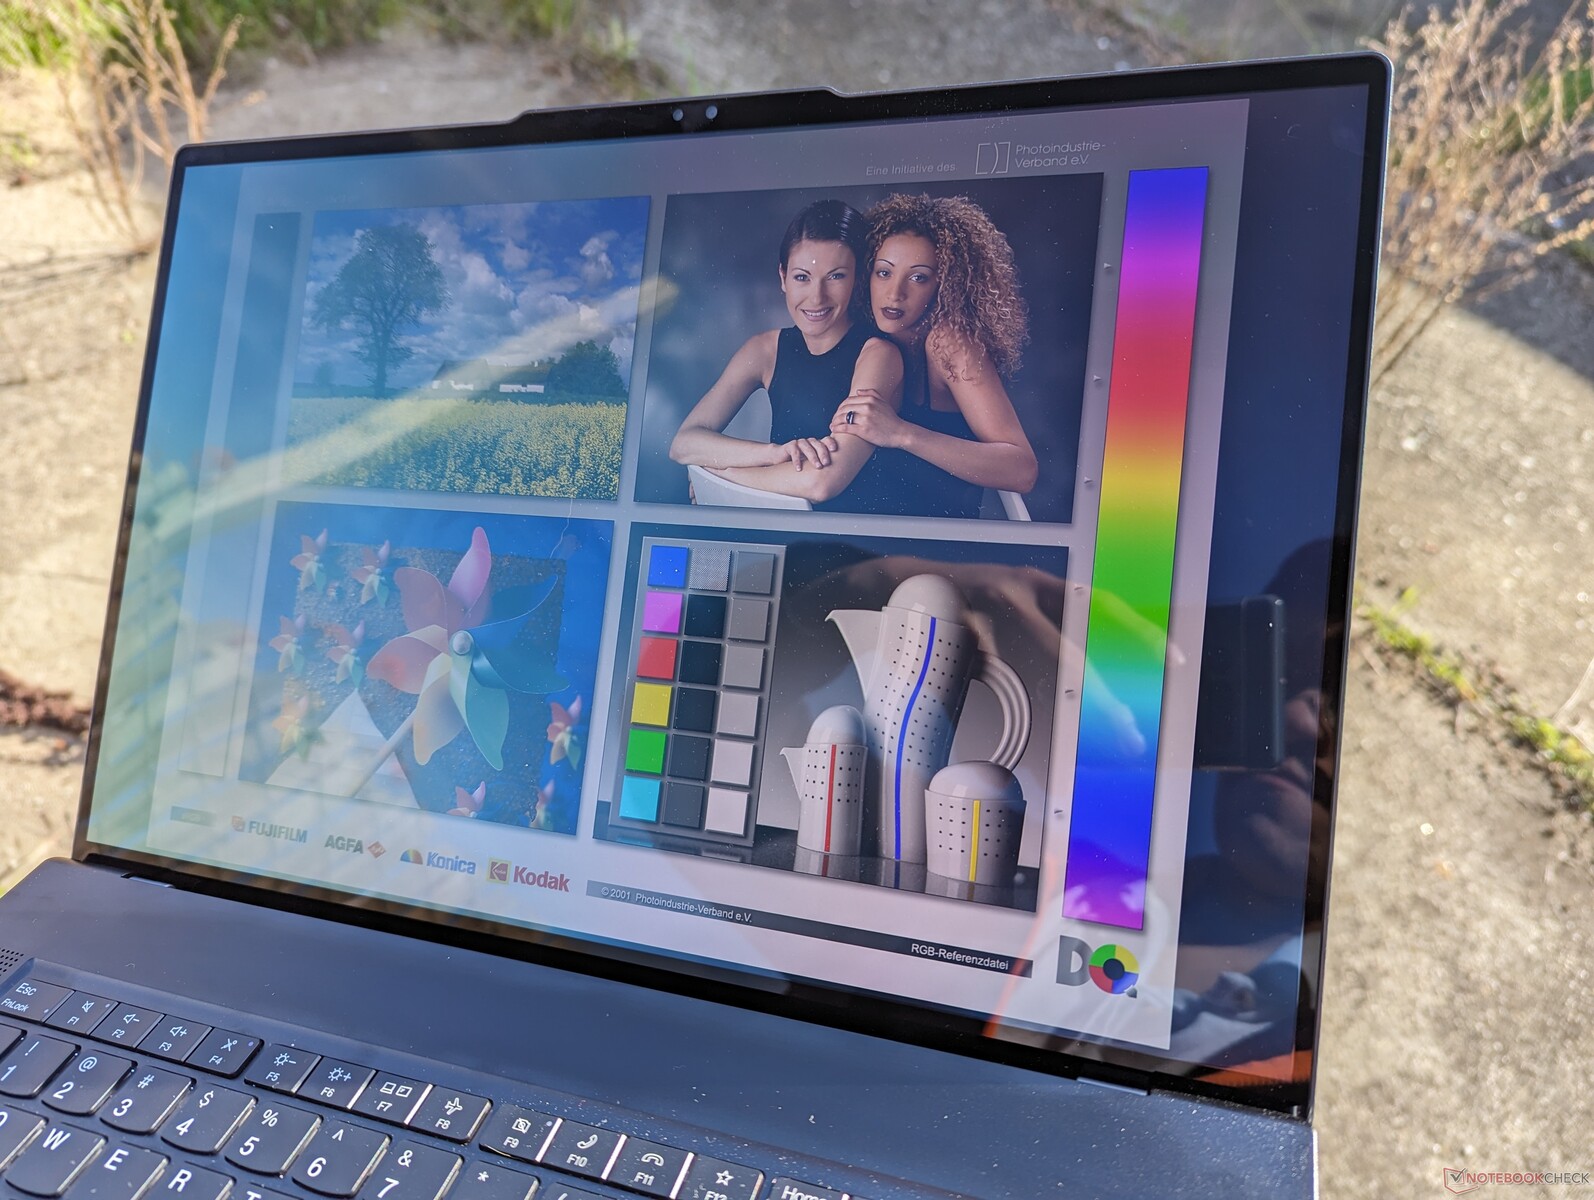
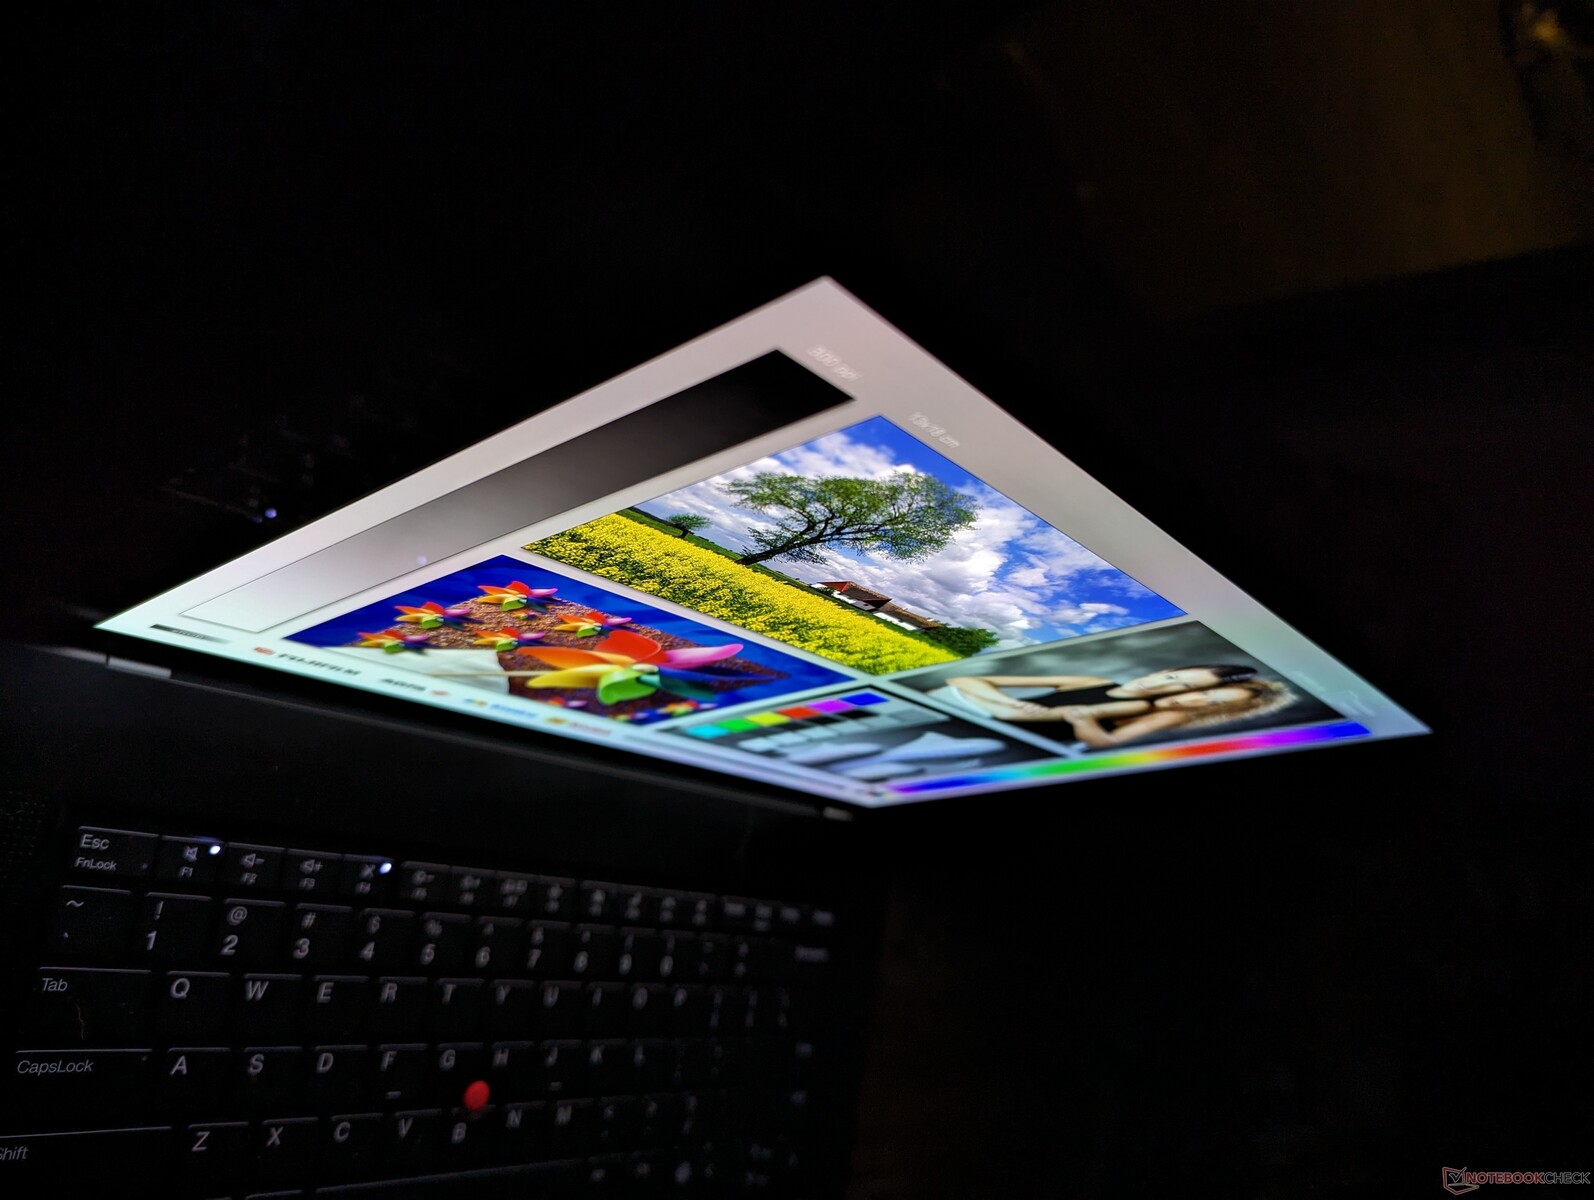
Les angles de vision sont plus larges que ceux de l'IPS et les niveaux de noir plus profonds permettent de conserver les couleurs sous un éclairage ambiant intense. Malgré cela, les reflets dus à la surface brillante sont inévitables et la luminosité maximale n'est pas plus élevée que celle de la configuration IPS 1200p de base. En comparaison, l'écran du MacBook Pro 16 est 50 % plus lumineux pour une meilleure visibilité en extérieur.
Performance
Conditions d'essai
Nous avons réglé Windows sur le mode Performance avant d'exécuter les tests de référence ci-dessous. Le logiciel Lenovo Commercial Vantage préinstallé n'inclut pas de paramètres de profil d'alimentation supplémentaires en plus de la sélection Windows habituelle. Il est néanmoins essentiel pour les mises à jour du BIOS et l'ajustement du comportement de charge de la batterie.
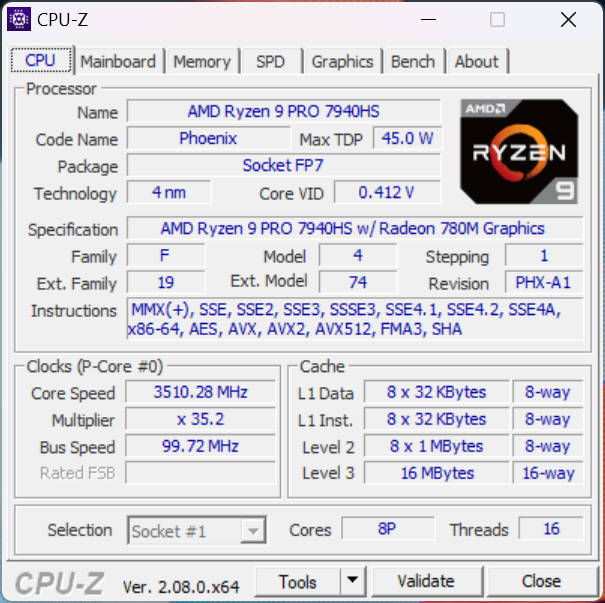
Processeur
Le Ryzen 9 Pro 7940HS a des performances identiques à celles du Ryzen 9 7940HS que l'on trouve sur le Asus TUF Gaming A16. Ainsi, les utilisateurs n'auront pas à sacrifier les performances pour profiter des fonctionnalités Pro. Les performances globales sont comparables à celles de la 12e génération de processeurs Core i9-12900H de 12ème génération de l'année dernière, à la fois dans les charges de travail mono et multithread.
Les différences de performances entre notre Ryzen 9 Pro 7940HS Zen 4 et le Ryzen 7 Pro 6850H Zen 3+ sont les suivantes Ryzen 7 Pro 6850H du ThinkPad Z16 Gen 1 de l'année dernière peuvent être très importantes, de 35 à 45 %, pour les charges de travail multithread, en raison du plus grand nombre de cœurs. Ainsi, l'amélioration des performances avec Zen 4 est l'une des principales raisons de choisir la version Gen 2 du ThinkPad Z16 au lieu de la Gen 1.
Les configurations d'entrée de gamme proposent le Ryzen 7 Pro 7840HS ou Ryzen 5 Pro 7640HS à la place. Les performances de l'option Ryzen 7 sont presque identiques à celles de l'option Ryzen 9, d'après notre expérience avec l'option Ryzen 9 Lenovo Legion Slim 5 16 il est donc recommandé d'opter pour une configuration Ryzen 7 afin de réduire les coûts. En fait, le Ryzen 7 Pro 7840HS partage exactement le même nombre de cœurs et de fonctionnalités que le Ryzen 9 Pro 7940HS, avec seulement des différences mineures de 100 à 200 MHz dans les fréquences d'horloge cibles.
Le passage à la configuration Ryzen 5 Pro 7640HS devrait avoir un impact plus important sur les performances du processeur, de l'ordre de 30 à 35 %, d'après notre expérience avec le HP ZBook Firefly 14 G10. Les écarts de performances entre les options Ryzen 5, Ryzen 7 et Ryzen 9 sont donc fortement biaisés entre les SKU Ryzen 5 et Ryzen 7.
Cinebench R15 Multi Loop
Cinebench R23: Multi Core | Single Core
Cinebench R20: CPU (Multi Core) | CPU (Single Core)
Cinebench R15: CPU Multi 64Bit | CPU Single 64Bit
Blender: v2.79 BMW27 CPU
7-Zip 18.03: 7z b 4 | 7z b 4 -mmt1
Geekbench 5.5: Multi-Core | Single-Core
HWBOT x265 Benchmark v2.2: 4k Preset
LibreOffice : 20 Documents To PDF
R Benchmark 2.5: Overall mean
* ... Moindre est la valeur, meilleures sont les performances
AIDA64: FP32 Ray-Trace | FPU Julia | CPU SHA3 | CPU Queen | FPU SinJulia | FPU Mandel | CPU AES | CPU ZLib | FP64 Ray-Trace | CPU PhotoWorxx
| Performance rating | |
| Lenovo ThinkPad Z16 Gen 2 | |
| Asus Vivobook Pro 16X K6604JV-MX016W | |
| Moyenne AMD Ryzen 9 PRO 7940HS | |
| Lenovo ThinkPad Z16 G1 21D5S00T00 | |
| MSI Creator Z16P B12UHST | |
| Lenovo ThinkBook 16 G6 ABP | |
| AIDA64 / FP32 Ray-Trace | |
| Lenovo ThinkPad Z16 Gen 2 | |
| Moyenne AMD Ryzen 9 PRO 7940HS (24034 - 27411, n=3) | |
| Asus Vivobook Pro 16X K6604JV-MX016W | |
| Lenovo ThinkPad Z16 G1 21D5S00T00 | |
| Lenovo ThinkBook 16 G6 ABP | |
| MSI Creator Z16P B12UHST | |
| AIDA64 / FPU Julia | |
| Lenovo ThinkPad Z16 Gen 2 | |
| Asus Vivobook Pro 16X K6604JV-MX016W | |
| Moyenne AMD Ryzen 9 PRO 7940HS (101262 - 116960, n=3) | |
| Lenovo ThinkPad Z16 G1 21D5S00T00 | |
| Lenovo ThinkBook 16 G6 ABP | |
| MSI Creator Z16P B12UHST | |
| AIDA64 / CPU SHA3 | |
| Asus Vivobook Pro 16X K6604JV-MX016W | |
| Lenovo ThinkPad Z16 Gen 2 | |
| Moyenne AMD Ryzen 9 PRO 7940HS (4418 - 4944, n=3) | |
| Lenovo ThinkPad Z16 G1 21D5S00T00 | |
| MSI Creator Z16P B12UHST | |
| Lenovo ThinkBook 16 G6 ABP | |
| AIDA64 / CPU Queen | |
| Asus Vivobook Pro 16X K6604JV-MX016W | |
| Lenovo ThinkPad Z16 Gen 2 | |
| Moyenne AMD Ryzen 9 PRO 7940HS (112873 - 124565, n=3) | |
| MSI Creator Z16P B12UHST | |
| Lenovo ThinkPad Z16 G1 21D5S00T00 | |
| Lenovo ThinkBook 16 G6 ABP | |
| AIDA64 / FPU SinJulia | |
| Lenovo ThinkPad Z16 Gen 2 | |
| Moyenne AMD Ryzen 9 PRO 7940HS (14147 - 15304, n=3) | |
| Asus Vivobook Pro 16X K6604JV-MX016W | |
| Lenovo ThinkPad Z16 G1 21D5S00T00 | |
| MSI Creator Z16P B12UHST | |
| Lenovo ThinkBook 16 G6 ABP | |
| AIDA64 / FPU Mandel | |
| Lenovo ThinkPad Z16 Gen 2 | |
| Moyenne AMD Ryzen 9 PRO 7940HS (54003 - 62357, n=3) | |
| Asus Vivobook Pro 16X K6604JV-MX016W | |
| Lenovo ThinkPad Z16 G1 21D5S00T00 | |
| Lenovo ThinkBook 16 G6 ABP | |
| MSI Creator Z16P B12UHST | |
| AIDA64 / CPU AES | |
| Asus Vivobook Pro 16X K6604JV-MX016W | |
| MSI Creator Z16P B12UHST | |
| Lenovo ThinkPad Z16 Gen 2 | |
| Moyenne AMD Ryzen 9 PRO 7940HS (76133 - 88705, n=3) | |
| Lenovo ThinkPad Z16 G1 21D5S00T00 | |
| Lenovo ThinkBook 16 G6 ABP | |
| AIDA64 / CPU ZLib | |
| Asus Vivobook Pro 16X K6604JV-MX016W | |
| MSI Creator Z16P B12UHST | |
| Lenovo ThinkPad Z16 Gen 2 | |
| Moyenne AMD Ryzen 9 PRO 7940HS (976 - 1079, n=3) | |
| Lenovo ThinkPad Z16 G1 21D5S00T00 | |
| Lenovo ThinkBook 16 G6 ABP | |
| AIDA64 / FP64 Ray-Trace | |
| Lenovo ThinkPad Z16 Gen 2 | |
| Moyenne AMD Ryzen 9 PRO 7940HS (12715 - 14590, n=3) | |
| Asus Vivobook Pro 16X K6604JV-MX016W | |
| Lenovo ThinkPad Z16 G1 21D5S00T00 | |
| Lenovo ThinkBook 16 G6 ABP | |
| MSI Creator Z16P B12UHST | |
| AIDA64 / CPU PhotoWorxx | |
| Asus Vivobook Pro 16X K6604JV-MX016W | |
| MSI Creator Z16P B12UHST | |
| Lenovo ThinkPad Z16 Gen 2 | |
| Moyenne AMD Ryzen 9 PRO 7940HS (24030 - 37800, n=3) | |
| Lenovo ThinkPad Z16 G1 21D5S00T00 | |
| Lenovo ThinkBook 16 G6 ABP | |
Performance du système
CrossMark: Overall | Productivity | Creativity | Responsiveness
WebXPRT 3: Overall
WebXPRT 4: Overall
Mozilla Kraken 1.1: Total
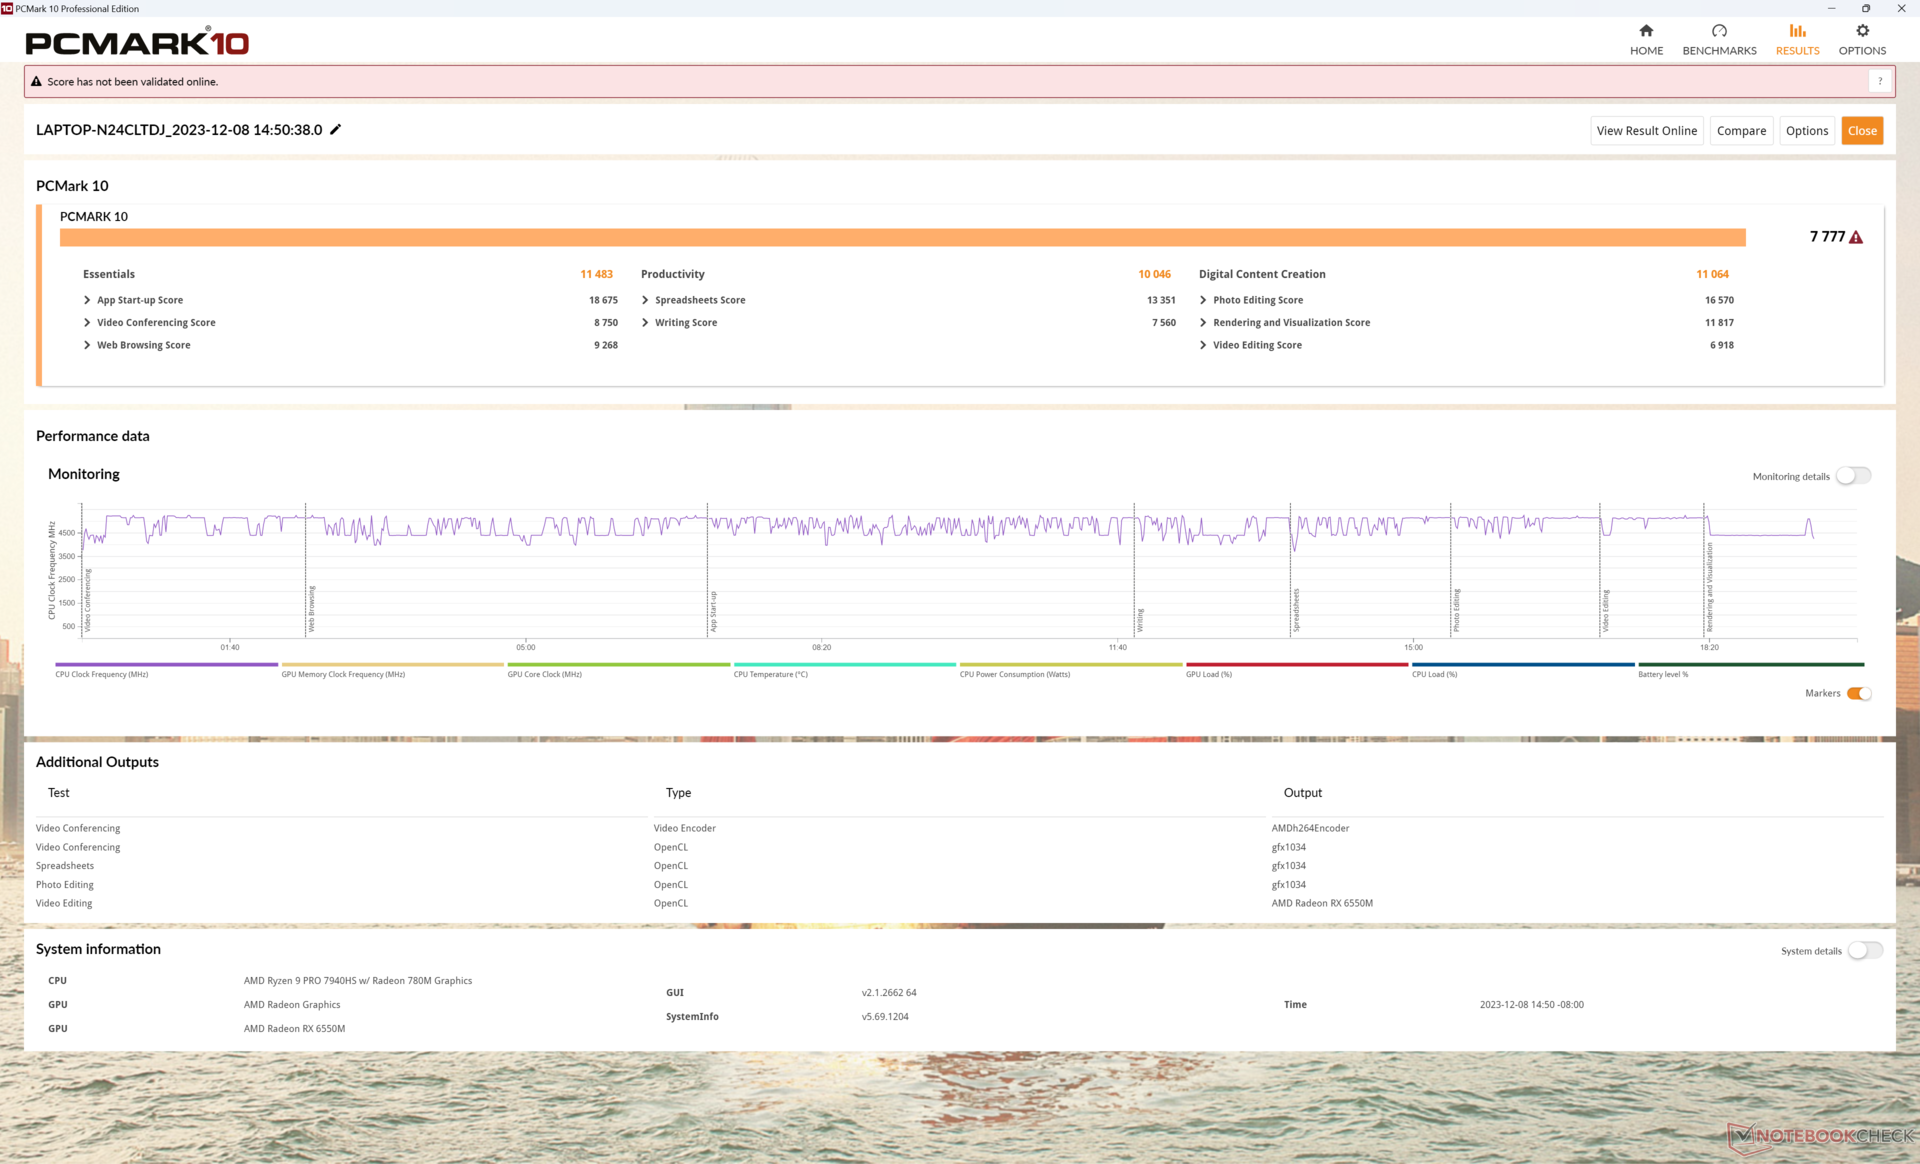
| PCMark 10 / Score | |
| MSI Creator Z16P B12UHST | |
| Lenovo ThinkPad Z16 Gen 2 | |
| Moyenne AMD Ryzen 9 PRO 7940HS, AMD Radeon RX 6550M (n=1) | |
| Asus Vivobook Pro 16X K6604JV-MX016W | |
| Lenovo ThinkPad Z16 G1 21D5S00T00 | |
| Lenovo ThinkBook 16 G6 ABP | |
| PCMark 10 / Essentials | |
| Lenovo ThinkPad Z16 Gen 2 | |
| Moyenne AMD Ryzen 9 PRO 7940HS, AMD Radeon RX 6550M (n=1) | |
| MSI Creator Z16P B12UHST | |
| Lenovo ThinkBook 16 G6 ABP | |
| Asus Vivobook Pro 16X K6604JV-MX016W | |
| Lenovo ThinkPad Z16 G1 21D5S00T00 | |
| PCMark 10 / Productivity | |
| MSI Creator Z16P B12UHST | |
| Lenovo ThinkPad Z16 Gen 2 | |
| Moyenne AMD Ryzen 9 PRO 7940HS, AMD Radeon RX 6550M (n=1) | |
| Lenovo ThinkBook 16 G6 ABP | |
| Asus Vivobook Pro 16X K6604JV-MX016W | |
| Lenovo ThinkPad Z16 G1 21D5S00T00 | |
| PCMark 10 / Digital Content Creation | |
| MSI Creator Z16P B12UHST | |
| Lenovo ThinkPad Z16 Gen 2 | |
| Moyenne AMD Ryzen 9 PRO 7940HS, AMD Radeon RX 6550M (n=1) | |
| Asus Vivobook Pro 16X K6604JV-MX016W | |
| Lenovo ThinkPad Z16 G1 21D5S00T00 | |
| Lenovo ThinkBook 16 G6 ABP | |
| CrossMark / Overall | |
| Asus Vivobook Pro 16X K6604JV-MX016W | |
| Apple MacBook Pro 16 2023 M3 Pro | |
| Lenovo ThinkPad Z16 Gen 2 | |
| Moyenne AMD Ryzen 9 PRO 7940HS, AMD Radeon RX 6550M (n=1) | |
| Lenovo ThinkPad Z16 G1 21D5S00T00 | |
| Lenovo ThinkBook 16 G6 ABP | |
| CrossMark / Productivity | |
| Asus Vivobook Pro 16X K6604JV-MX016W | |
| Apple MacBook Pro 16 2023 M3 Pro | |
| Lenovo ThinkPad Z16 Gen 2 | |
| Moyenne AMD Ryzen 9 PRO 7940HS, AMD Radeon RX 6550M (n=1) | |
| Lenovo ThinkPad Z16 G1 21D5S00T00 | |
| Lenovo ThinkBook 16 G6 ABP | |
| CrossMark / Creativity | |
| Apple MacBook Pro 16 2023 M3 Pro | |
| Asus Vivobook Pro 16X K6604JV-MX016W | |
| Lenovo ThinkPad Z16 Gen 2 | |
| Moyenne AMD Ryzen 9 PRO 7940HS, AMD Radeon RX 6550M (n=1) | |
| Lenovo ThinkPad Z16 G1 21D5S00T00 | |
| Lenovo ThinkBook 16 G6 ABP | |
| CrossMark / Responsiveness | |
| Asus Vivobook Pro 16X K6604JV-MX016W | |
| Apple MacBook Pro 16 2023 M3 Pro | |
| Lenovo ThinkPad Z16 Gen 2 | |
| Moyenne AMD Ryzen 9 PRO 7940HS, AMD Radeon RX 6550M (n=1) | |
| Lenovo ThinkPad Z16 G1 21D5S00T00 | |
| Lenovo ThinkBook 16 G6 ABP | |
| WebXPRT 3 / Overall | |
| Apple MacBook Pro 16 2023 M3 Pro | |
| MSI Creator Z16P B12UHST | |
| Lenovo ThinkPad Z16 Gen 2 | |
| Moyenne AMD Ryzen 9 PRO 7940HS, AMD Radeon RX 6550M (n=1) | |
| Asus Vivobook Pro 16X K6604JV-MX016W | |
| Lenovo ThinkBook 16 G6 ABP | |
| Lenovo ThinkPad Z16 G1 21D5S00T00 | |
| WebXPRT 4 / Overall | |
| Lenovo ThinkPad Z16 Gen 2 | |
| Moyenne AMD Ryzen 9 PRO 7940HS, AMD Radeon RX 6550M (n=1) | |
| Asus Vivobook Pro 16X K6604JV-MX016W | |
| Lenovo ThinkBook 16 G6 ABP | |
| Lenovo ThinkPad Z16 G1 21D5S00T00 | |
| Mozilla Kraken 1.1 / Total | |
| Lenovo ThinkBook 16 G6 ABP | |
| Lenovo ThinkPad Z16 G1 21D5S00T00 | |
| Lenovo ThinkPad Z16 Gen 2 | |
| Moyenne AMD Ryzen 9 PRO 7940HS, AMD Radeon RX 6550M (n=1) | |
| Asus Vivobook Pro 16X K6604JV-MX016W | |
| MSI Creator Z16P B12UHST | |
| Apple MacBook Pro 16 2023 M3 Pro | |
* ... Moindre est la valeur, meilleures sont les performances
| PCMark 10 Score | 7777 points | |
Aide | ||
| AIDA64 / Memory Copy | |
| Asus Vivobook Pro 16X K6604JV-MX016W | |
| Lenovo ThinkPad Z16 Gen 2 | |
| MSI Creator Z16P B12UHST | |
| Lenovo ThinkPad Z16 G1 21D5S00T00 | |
| Moyenne AMD Ryzen 9 PRO 7940HS (34339 - 66740, n=3) | |
| Lenovo ThinkBook 16 G6 ABP | |
| AIDA64 / Memory Read | |
| Asus Vivobook Pro 16X K6604JV-MX016W | |
| MSI Creator Z16P B12UHST | |
| Lenovo ThinkPad Z16 Gen 2 | |
| Lenovo ThinkPad Z16 G1 21D5S00T00 | |
| Lenovo ThinkBook 16 G6 ABP | |
| Moyenne AMD Ryzen 9 PRO 7940HS (30289 - 50398, n=3) | |
| AIDA64 / Memory Write | |
| Lenovo ThinkPad Z16 Gen 2 | |
| Asus Vivobook Pro 16X K6604JV-MX016W | |
| MSI Creator Z16P B12UHST | |
| Moyenne AMD Ryzen 9 PRO 7940HS (39877 - 91516, n=3) | |
| Lenovo ThinkPad Z16 G1 21D5S00T00 | |
| Lenovo ThinkBook 16 G6 ABP | |
| AIDA64 / Memory Latency | |
| Lenovo ThinkPad Z16 G1 21D5S00T00 | |
| Lenovo ThinkPad Z16 Gen 2 | |
| Moyenne AMD Ryzen 9 PRO 7940HS (102.2 - 121.3, n=3) | |
| Lenovo ThinkBook 16 G6 ABP | |
| MSI Creator Z16P B12UHST | |
| Asus Vivobook Pro 16X K6604JV-MX016W | |
* ... Moindre est la valeur, meilleures sont les performances
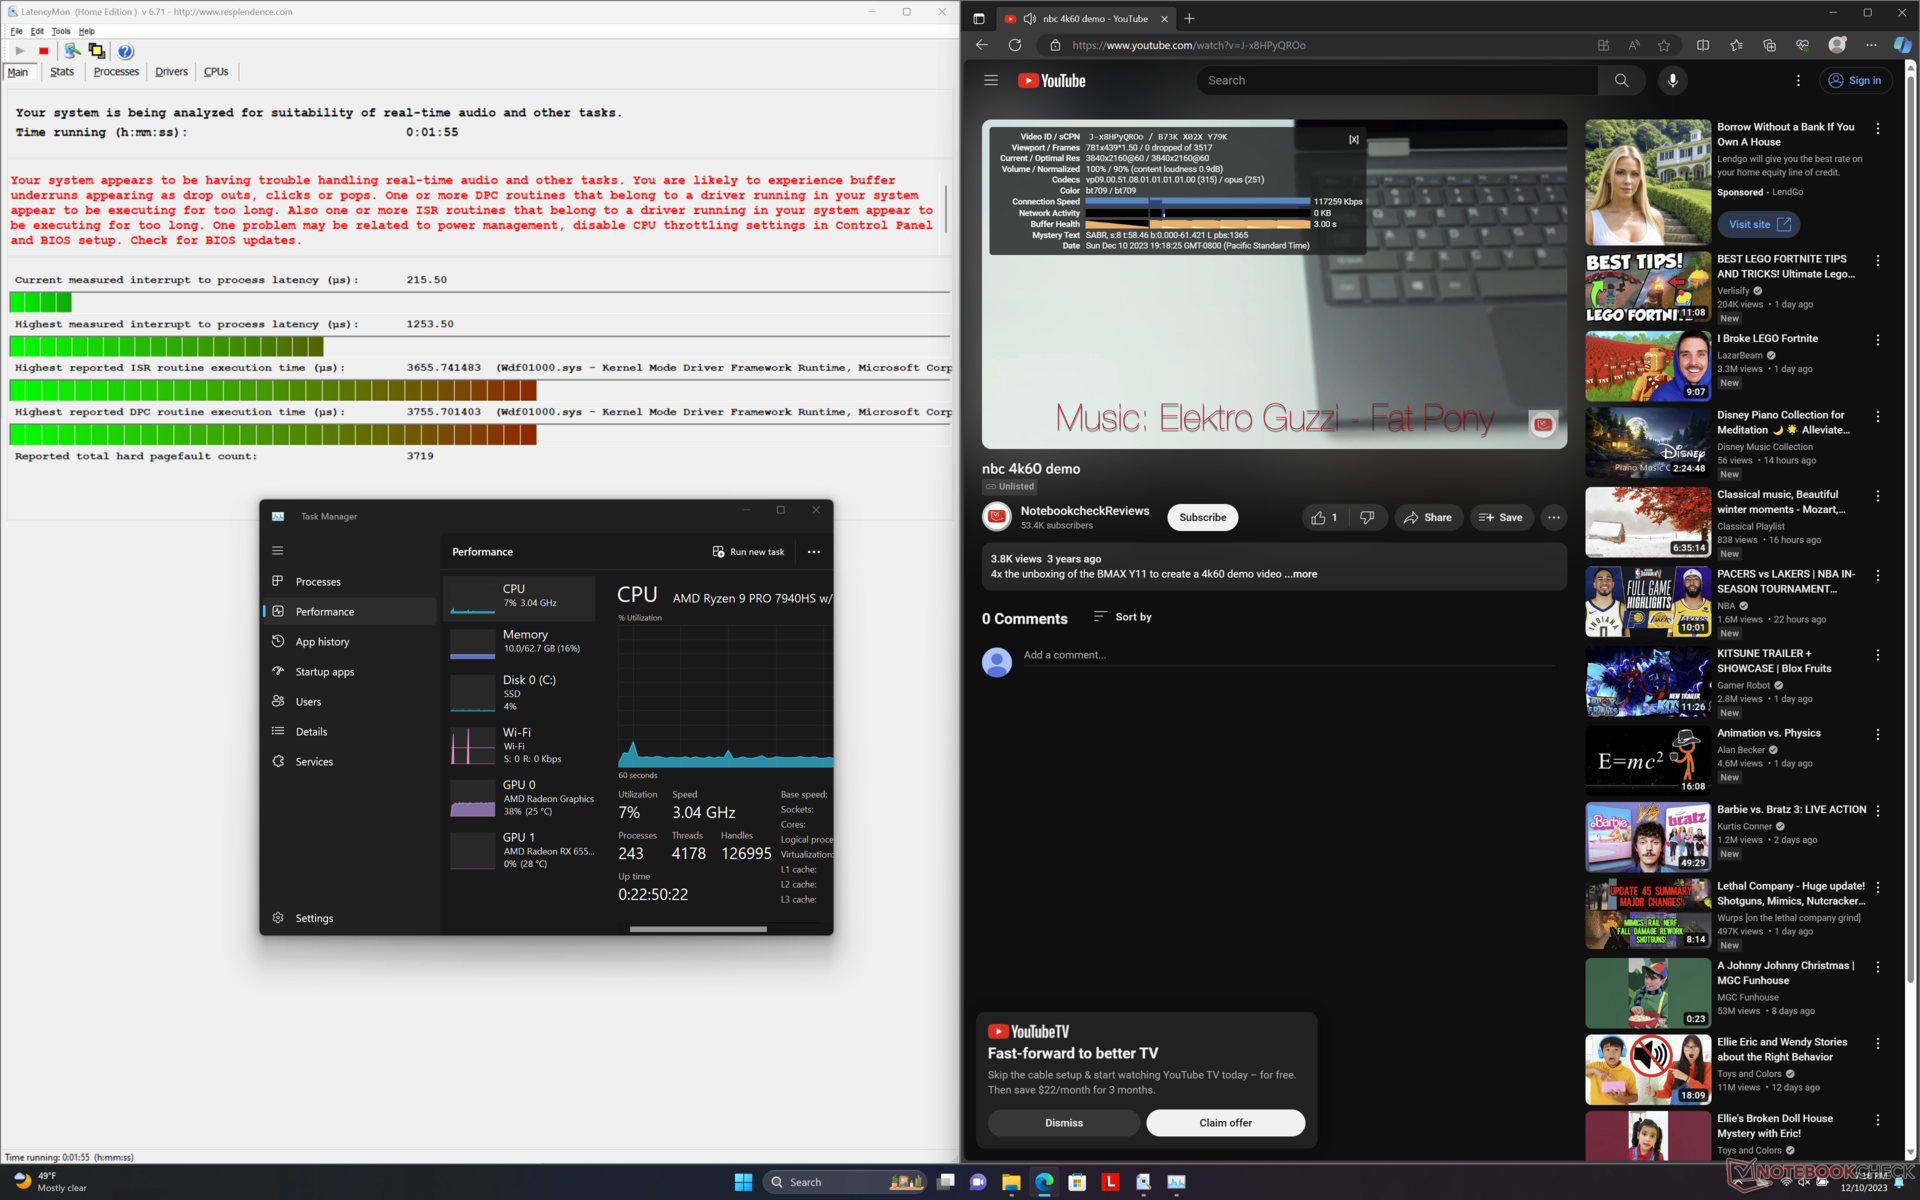
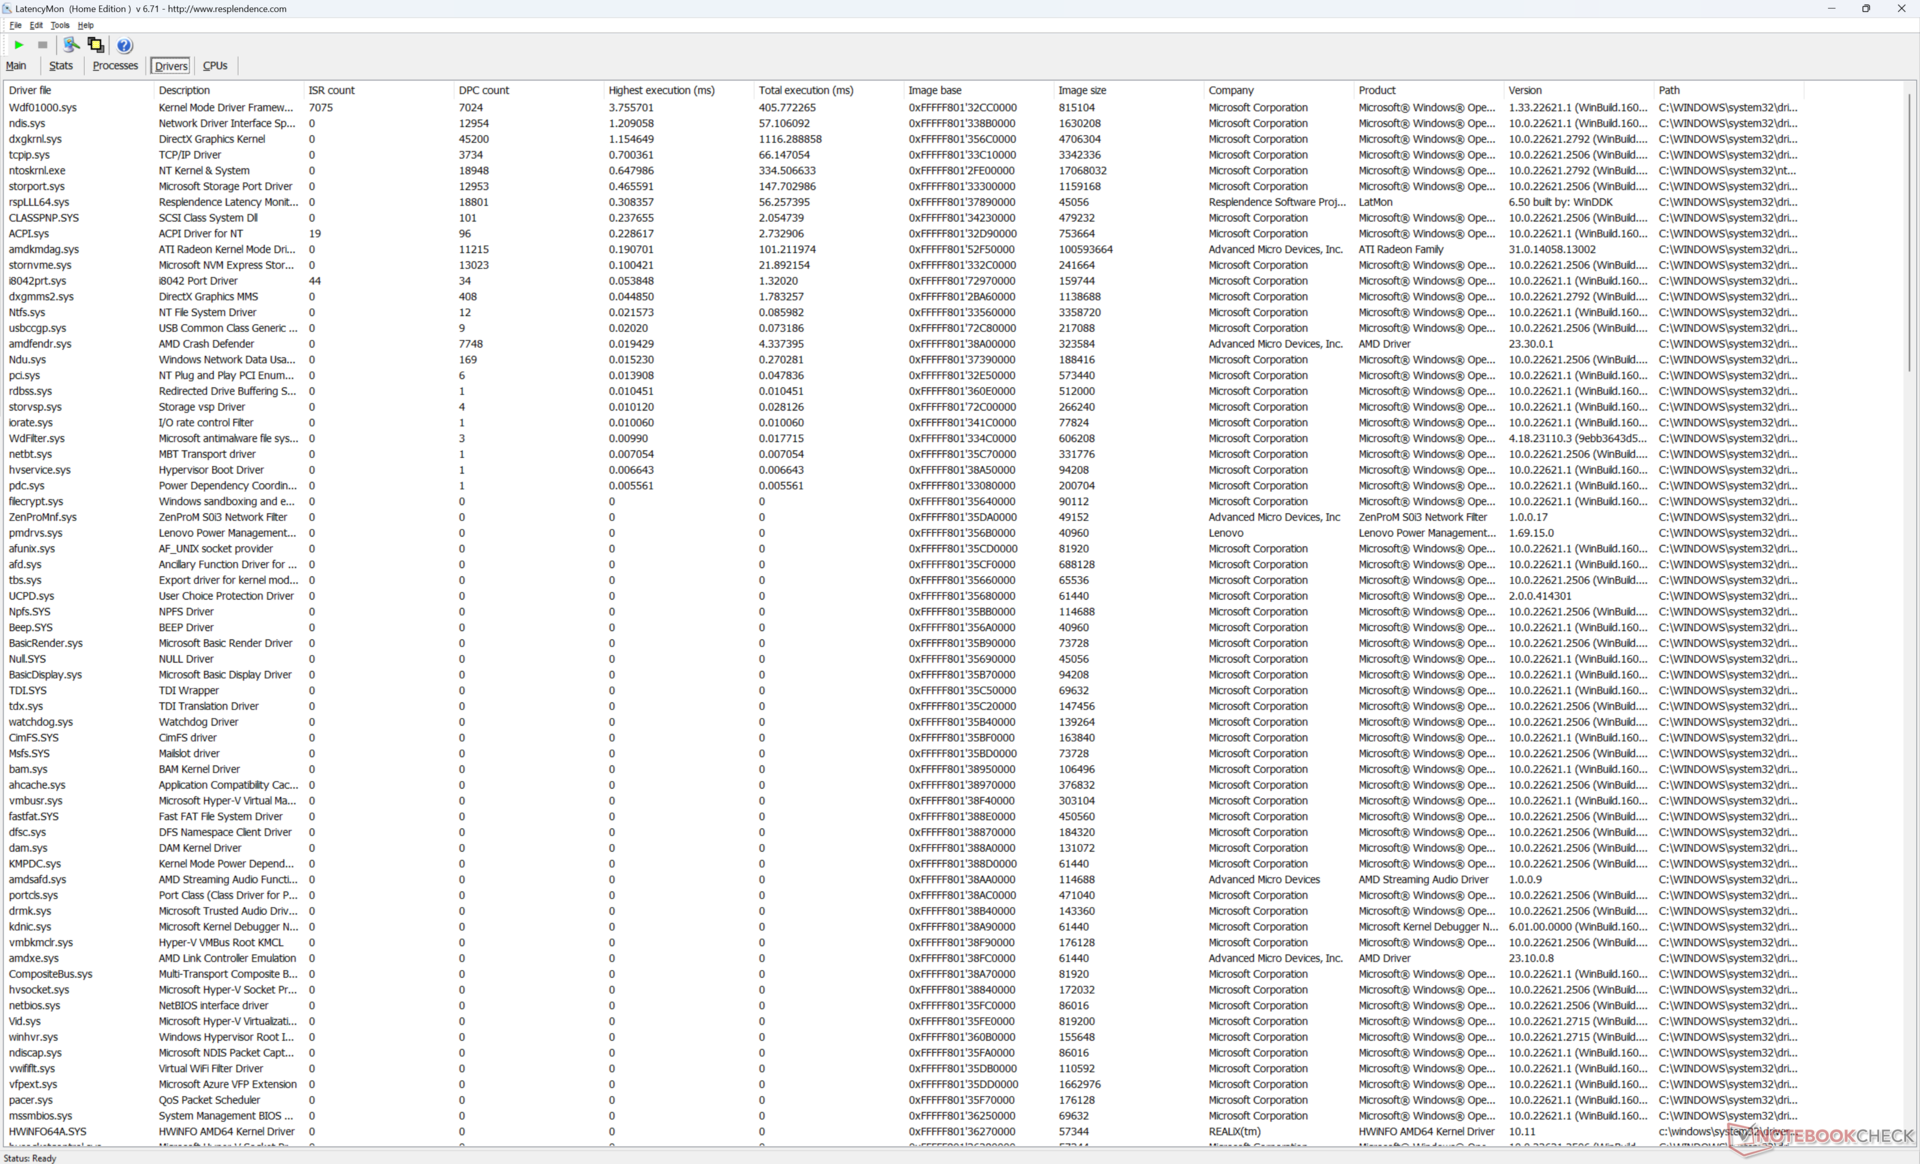
Latence DPC
LatencyMon montre des problèmes mineurs de DPC lors de l'ouverture de plusieurs onglets de notre page d'accueil. la lecture vidéo 4K à 60 FPS est par ailleurs parfaite, sans aucune perte d'images, contrairement à ce que nous avons constaté sur les récents ThinkPad P1 G6 équipés de processeurs Intel-Nvidia ThinkPad P1 G6.
| DPC Latencies / LatencyMon - interrupt to process latency (max), Web, Youtube, Prime95 | |
| Asus Vivobook Pro 16X K6604JV-MX016W | |
| Lenovo ThinkPad Z16 Gen 2 | |
| Lenovo ThinkBook 16 G6 ABP | |
| MSI Creator Z16P B12UHST | |
| Lenovo ThinkPad Z16 G1 21D5S00T00 | |
* ... Moindre est la valeur, meilleures sont les performances
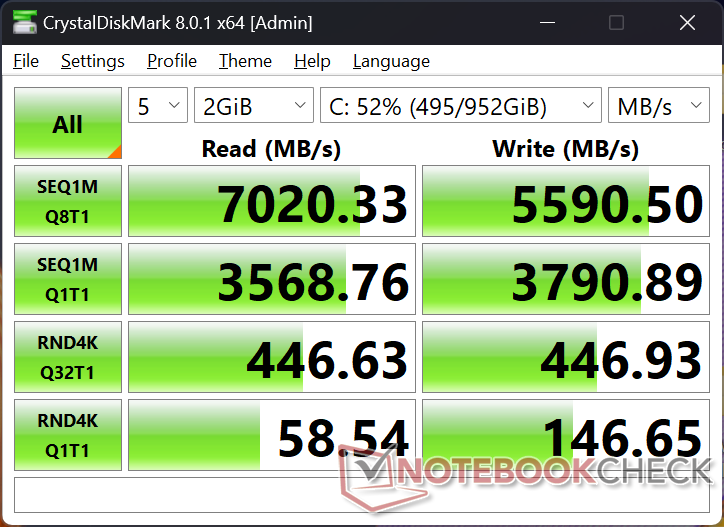
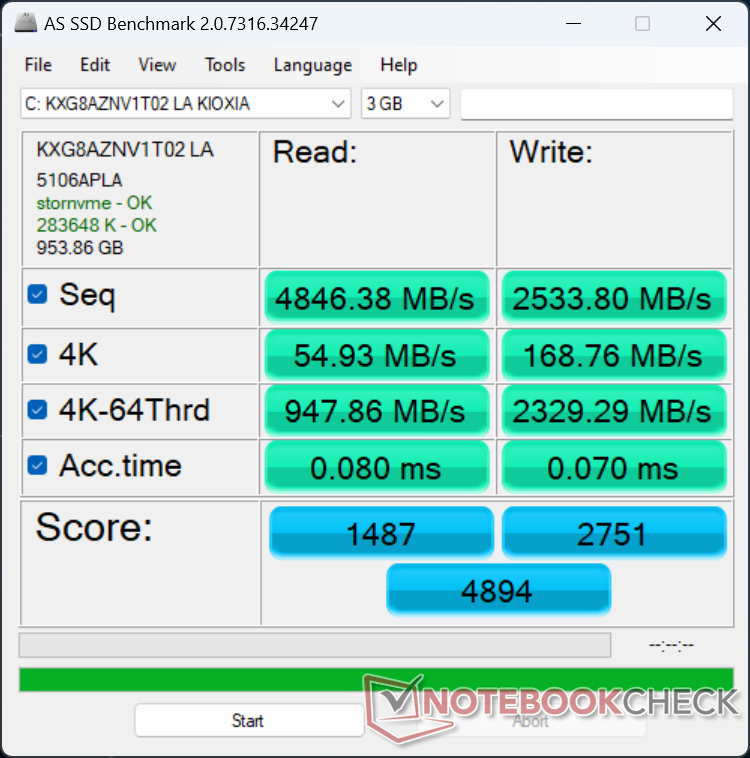
Dispositifs de stockage
Notre unité de test est livrée avec le Kioxia XG8 alors que notre ancien ThinkPad Z16 Gen 1 serait livré avec le Samsung PM9A1. Néanmoins, les deux disques SSD sont des disques NVMe PCIe4 x4 haut de gamme avec des taux de lecture maximum similaires de ~7000 Mo/s chacun.
Malheureusement, le disque Kioxia présente également des problèmes d'étranglement des performances après quelques minutes de stress, tout comme le disque Samsung sur notre ThinkPad Z16 Gen 1, comme le montre le graphique de comparaison ci-dessous. Les taux de lecture chutent de ~7000 Mo/s à ~5800 Mo/s au fil du temps, probablement en raison d'une dissipation thermique insuffisante. L'ajout d'un coussin thermique entre le SSD et le couvercle inférieur en métal pourrait améliorer les performances.
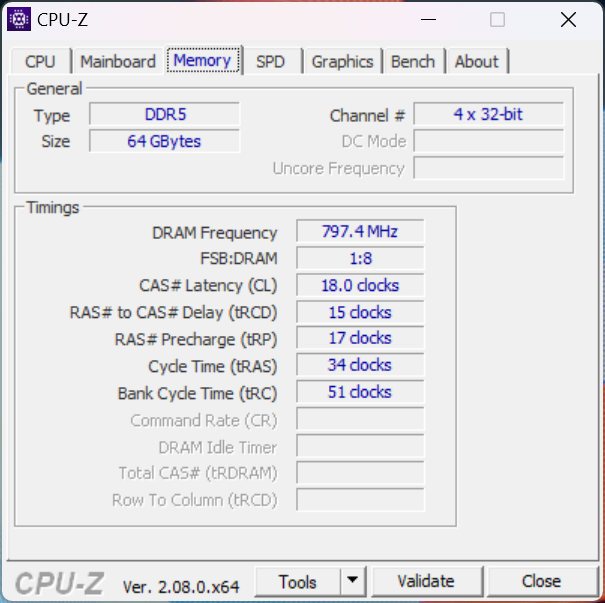
La RAM est soudée et il n'y a pas de support pour un second SSD contrairement au MSI Creator Z16P qui intègre deux emplacements de RAM et deux emplacements de SSD M.2.

| Drive Performance rating - Percent | |
| MSI Creator Z16P B12UHST | |
| Lenovo ThinkPad Z16 G1 21D5S00T00 | |
| Lenovo ThinkPad Z16 Gen 2 | |
| Lenovo ThinkBook 16 G6 ABP | |
| Asus Vivobook Pro 16X K6604JV-MX016W | |
* ... Moindre est la valeur, meilleures sont les performances
Disk Throttling: DiskSpd Read Loop, Queue Depth 8
Performance du GPU
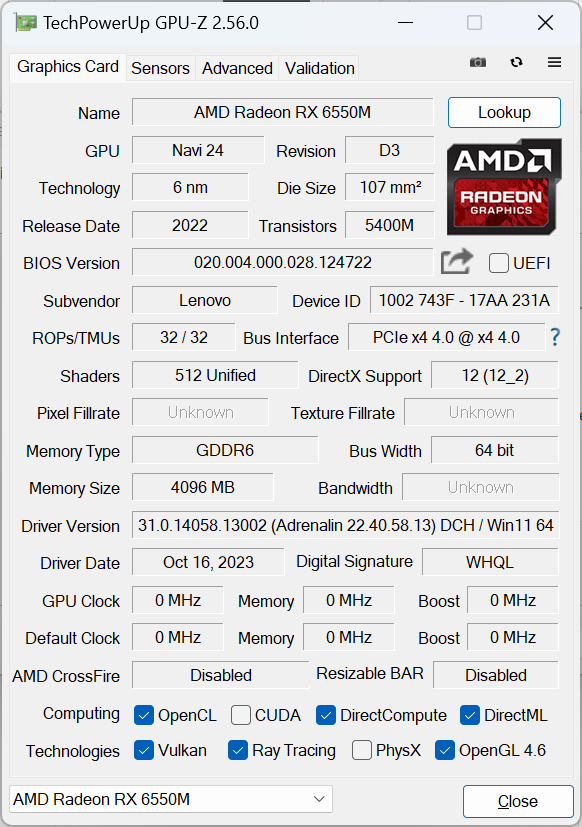
La relation entre la Radeon RX 6550M et la RX 6500M est similaire à celle qui existe entre la RTX 3050 Ti et la RTX 3050 sur le site GeForce: les différences sont mineures et se situent en moyenne à 10 points de pourcentage près. En effet, les deux GPU Radeon partagent la même largeur de bus mémoire de 64 bits, l'architecture RDNA2, 1024 processeurs de flux, 4 Go de VRAM GDDR6, etc. La Radeon RX 6550M atteint des fréquences d'horloge cibles (2560 MHz contre 2191 MHz) et un TGP maximum (60 W contre 55 W) légèrement supérieurs à ceux de la 6500M, mais c'est tout.
L'augmentation mineure des fréquences d'horloge entraîne des augmentations mineures des scores de référence, comme le montre le tableau de comparaison ci-dessous.
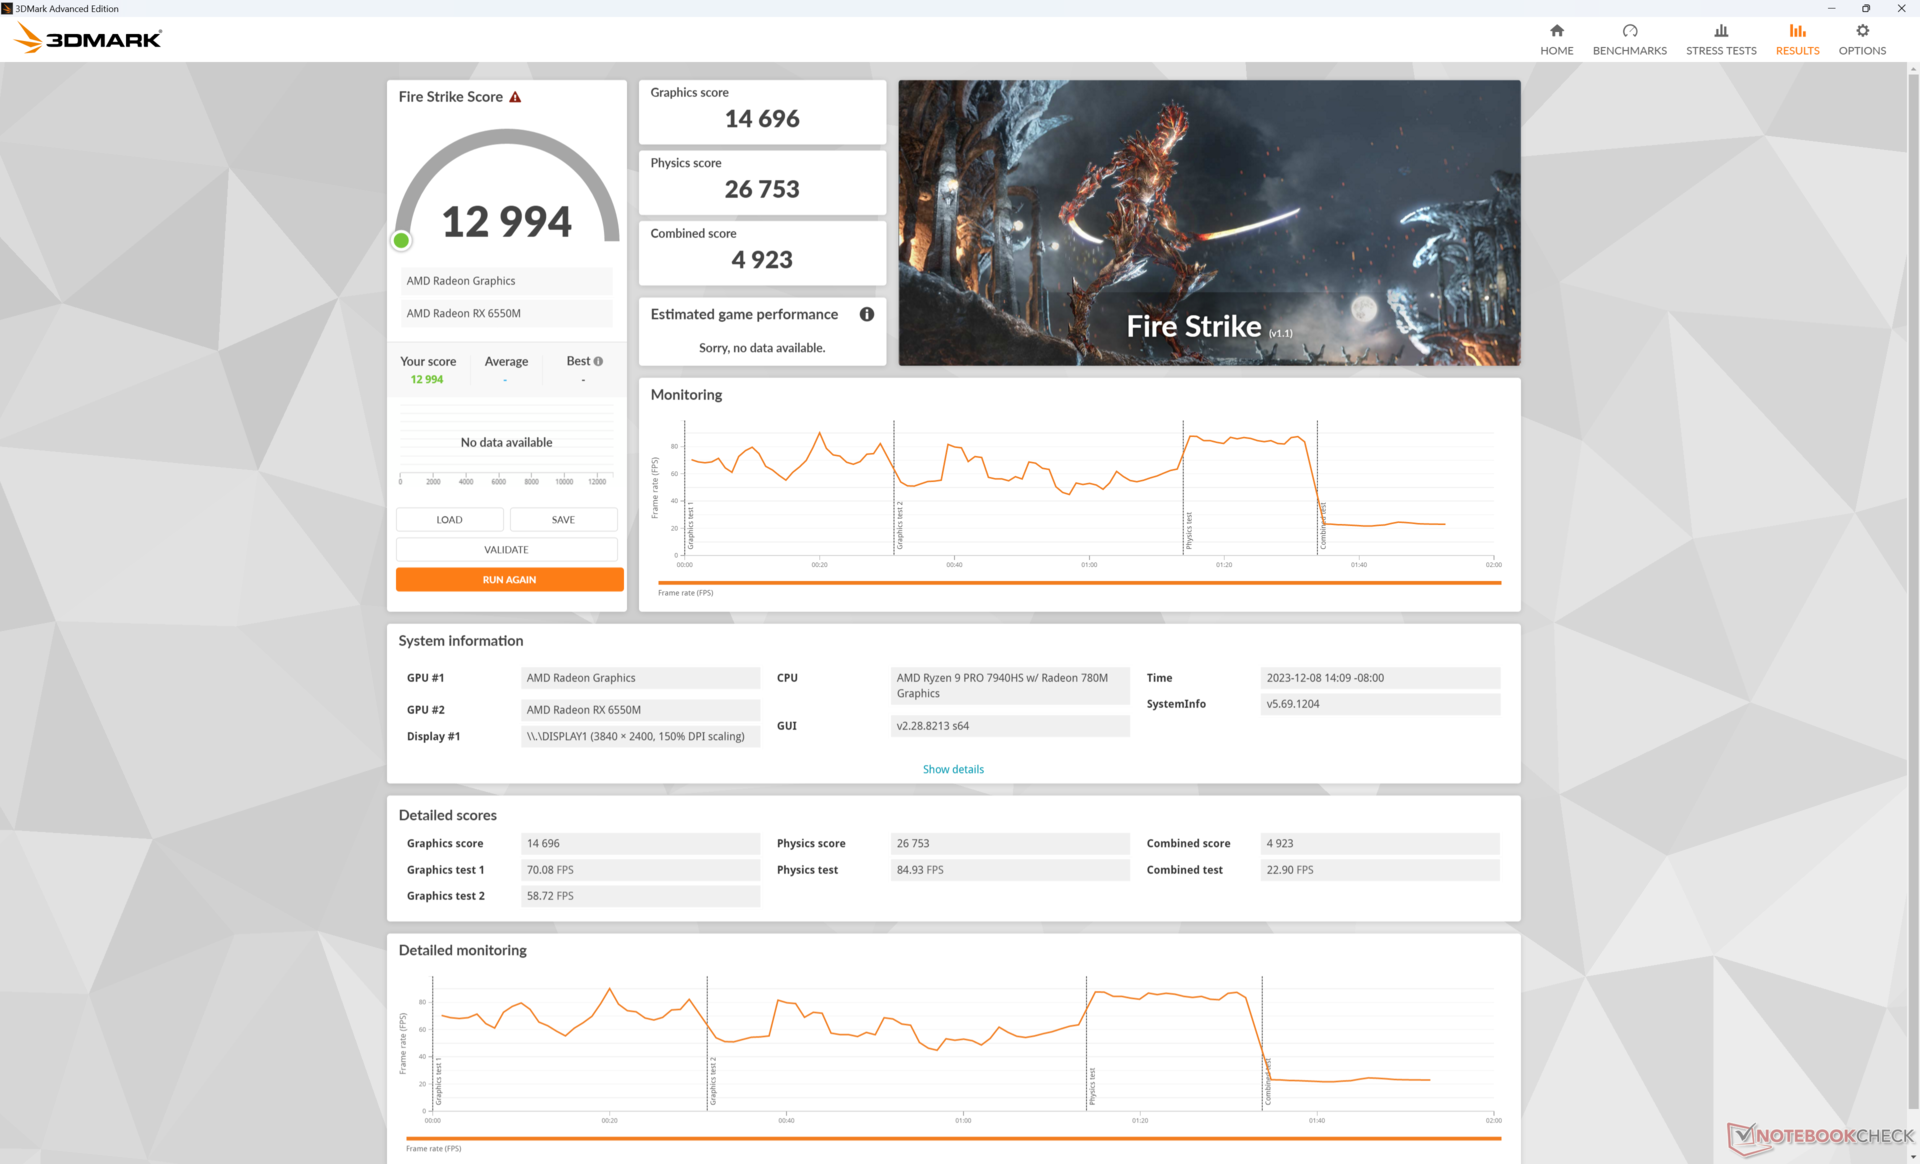
Le fait de fonctionner en mode équilibré au lieu du mode performance n'a qu'un léger impact sur les performances, comme le montrent les résultats de notre site Fire Strike dans le tableau ci-dessous. L'utilisation de la batterie réduirait les performances graphiques de manière beaucoup plus significative que les performances du processeur.
| Profil de puissance | Score physique | Score graphique | Score combiné |
| Mode Performance | 26753 | 14696 | 4923 |
| Mode équilibré | 26333 (-2%) | 13975 (-5%) | 4776 (-3%) |
| Alimentation par batterie | 25622 (-4%) | 9649 (-34%) | 3114 (-37%) |
Gardez à l'esprit que la Radeon RX 6550M basée sur RDNA2 arrive juste après le lancement de la Radeon RX 7900M haut de gamme basée sur RDNA3, ce qui signifie que d'autres GPU RDNA3 de milieu de gamme arriveront bientôt. RDNA3 est une amélioration significative par rapport à RDNA2 en termes de performances, de consommation d'énergie, de prise en charge de l'upscaling AI et surtout de capacités de ray-tracing.
| 3DMark Performance rating - Percent | |
| Asus Zephyrus Duo 16 GX650PY-NM006W | |
| Alienware m16 R1 AMD | |
| Lenovo ThinkPad P1 G6 21FV001KUS | |
| MSI Raider GE68 HX 13VG, i7-13700HX | |
| MSI Raider GE68HX 13VF | |
| HP Victus 16-r0076TX -1! | |
| MSI Creator Z16P B12UHST -1! | |
| Lenovo ThinkPad Z16 G1 21D5S00T00 -1! | |
| Asus VivoBook Pro 16 -1! | |
| Lenovo ThinkPad Z16 Gen 2 | |
| Moyenne AMD Radeon RX 6550M | |
| HP Victus 15 fa0020nr | |
| Asus VivoBook Pro 16X OLED N7600PC-L2026X -1! | |
| LG Gram 2in1 16 16T90R - G.AA78G -1! | |
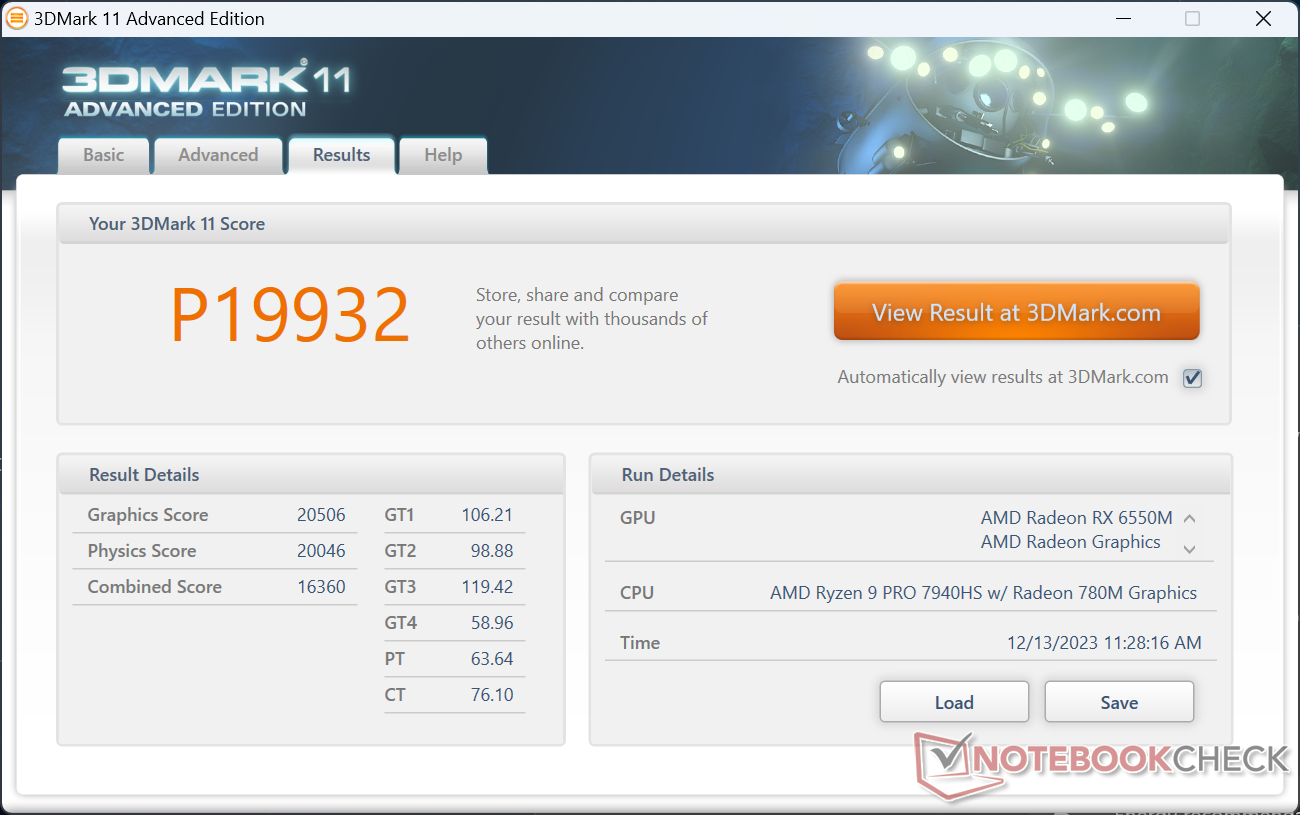
| 3DMark 11 Performance | 19932 points | |
| 3DMark Fire Strike Score | 12994 points | |
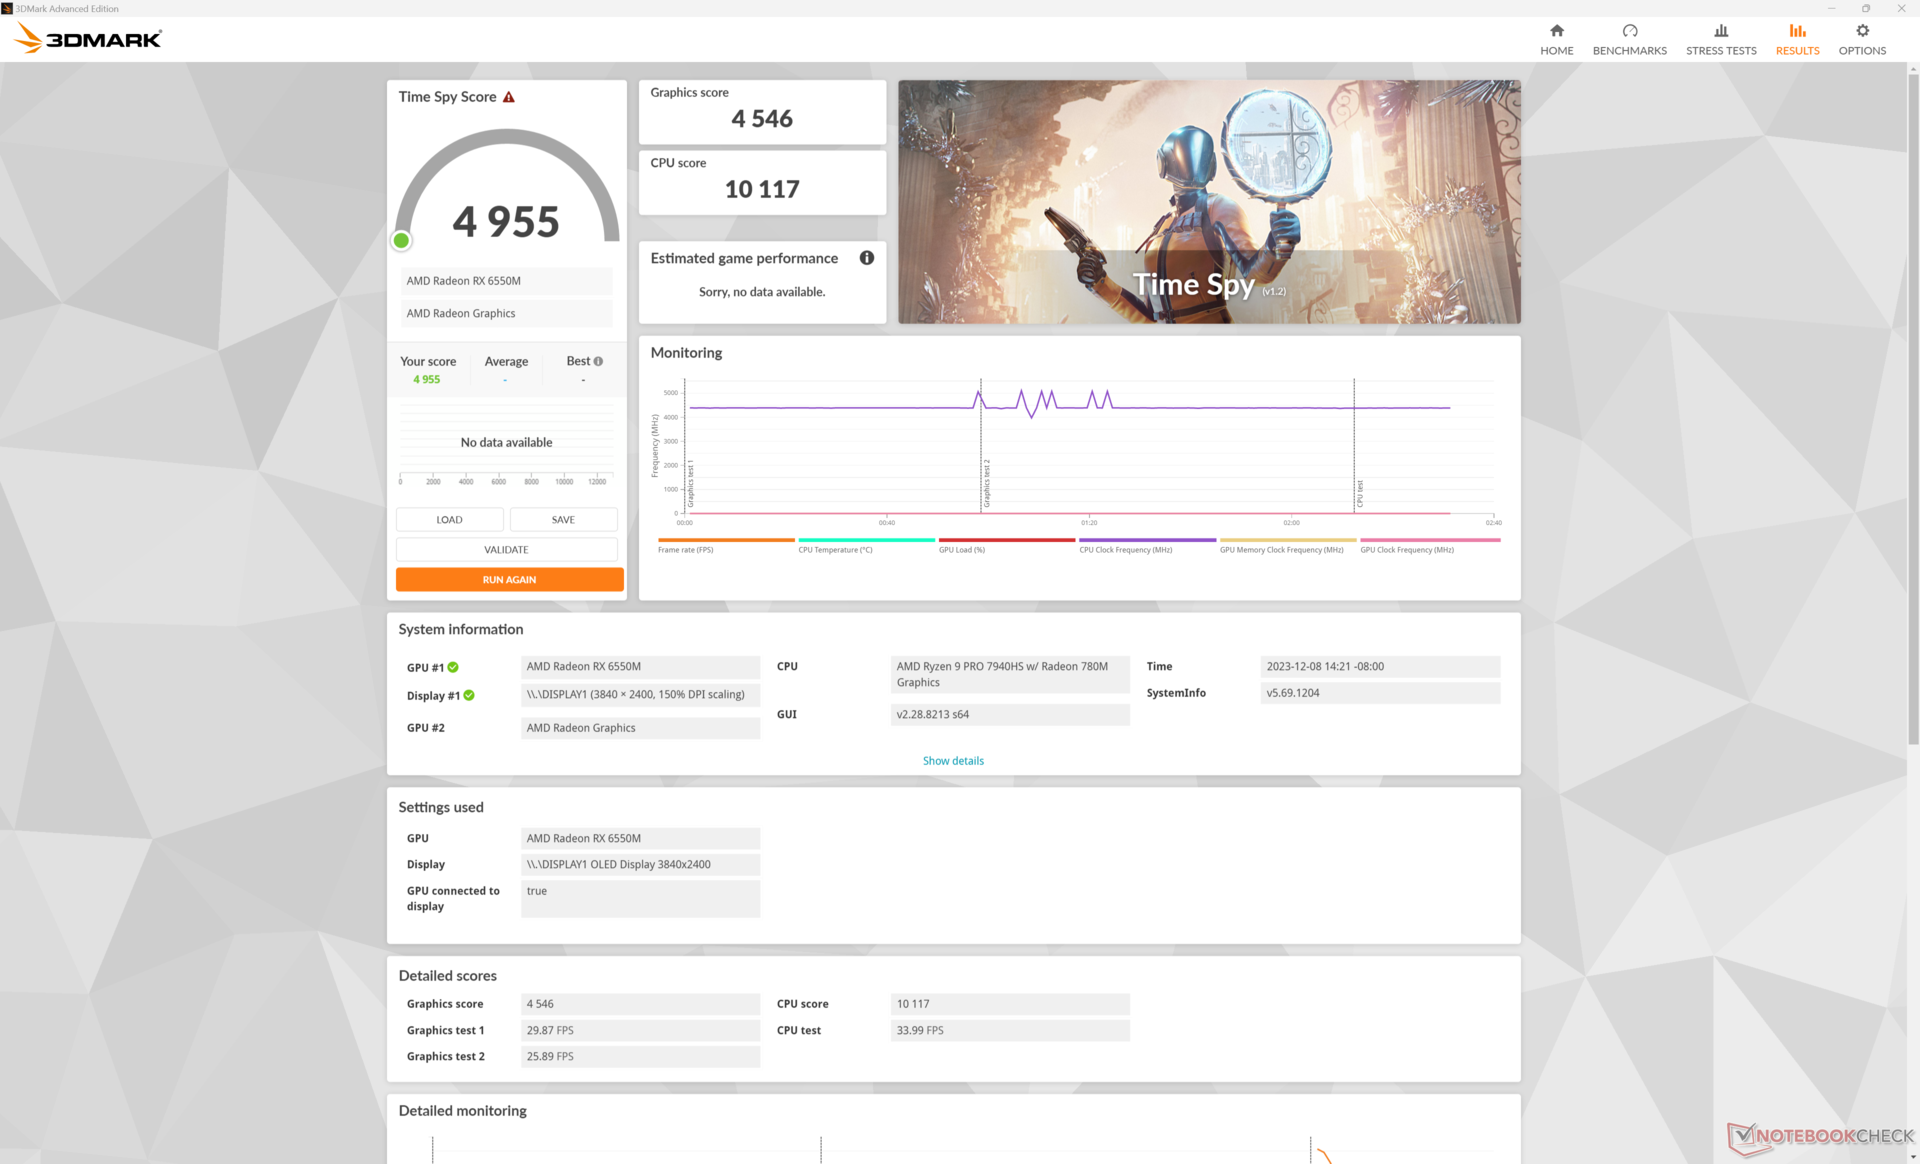
| 3DMark Time Spy Score | 4955 points | |
Aide | ||
| Blender | |
| v3.3 Classroom METAL | |
| Apple MacBook Pro 16 2023 M3 Pro | |
| v3.3 Classroom HIP/AMD | |
| Lenovo ThinkPad Z16 G1 21D5S00T00 | |
| v3.3 Classroom OPTIX/RTX | |
| Asus VivoBook Pro 16 | |
| HP Victus 16-r0076TX | |
| MSI Raider GE68HX 13VF | |
| MSI Raider GE68 HX 13VG, i7-13700HX | |
| Alienware m16 R1 AMD | |
| Lenovo ThinkPad P1 G6 21FV001KUS | |
| Asus Zephyrus Duo 16 GX650PY-NM006W | |
| v3.3 Classroom CUDA | |
| Asus VivoBook Pro 16 | |
| HP Victus 16-r0076TX | |
| MSI Raider GE68HX 13VF | |
| MSI Raider GE68 HX 13VG, i7-13700HX | |
| Lenovo ThinkPad P1 G6 21FV001KUS | |
| Alienware m16 R1 AMD | |
| Asus Zephyrus Duo 16 GX650PY-NM006W | |
| v3.3 Classroom CPU | |
| LG Gram 2in1 16 16T90R - G.AA78G | |
| Lenovo ThinkPad Z16 G1 21D5S00T00 | |
| Asus VivoBook Pro 16 | |
| HP Victus 16-r0076TX | |
| Lenovo ThinkPad P1 G6 21FV001KUS | |
| Apple MacBook Pro 16 2023 M3 Pro | |
| Lenovo ThinkPad Z16 Gen 2 | |
| Moyenne AMD Radeon RX 6550M (n=1) | |
| MSI Raider GE68 HX 13VG, i7-13700HX | |
| MSI Raider GE68HX 13VF | |
| Alienware m16 R1 AMD | |
| Asus Zephyrus Duo 16 GX650PY-NM006W | |
* ... Moindre est la valeur, meilleures sont les performances
Performances des jeux
Les performances dans les jeux peuvent être presque identiques à celles de la Radeon RX 6500M ou jusqu'à 30 % plus rapides, en fonction du titre et des paramètres. Par exemple, Final Fantasy XV fonctionnerait presque de la même manière avec nos Radeon RX 6550M et 6500M, tandis que d'autres titres comme Far Cry 5 ou F1 22 peuvent fonctionner de 15 à 30 % plus vite. Quant à Tiny Tina's Wonderlands, il peut tourner jusqu'à 30 % plus vite uniquement avec des paramètres graphiques plus élevés. Les résultats dépendent donc fortement de l'application, mais les avantages en termes de performances sont généralement supérieurs à ce que les scores 3DMark suggèrent, ce qui est une excellente nouvelle pour les joueurs.
Il est intéressant de noter que les performances globales sont au coude à coude avec celles du MacBook Pro 16 M3 Pro lors des tests de jeux plus récents comme Cyberpunk 2077 et Baldur's Gate 3. Si l'on considère que notre Radeon est un GPU discret plus grand, cela en dit long sur l'efficacité de la solution SoC intégrée Apple.
| Performance rating - Percent | |
| Asus Zephyrus Duo 16 GX650PY-NM006W | |
| Alienware m16 R1 AMD -1! | |
| Lenovo ThinkPad P1 G6 21FV001KUS -1! | |
| MSI Raider GE68 HX 13VG, i7-13700HX | |
| MSI Raider GE68HX 13VF -1! | |
| MSI Creator Z16P B12UHST | |
| HP Victus 16-r0076TX -1! | |
| Lenovo ThinkPad Z16 Gen 2 -1! | |
| Apple MacBook Pro 16 2023 M3 Pro -4! | |
| Lenovo ThinkPad Z16 G1 21D5S00T00 | |
| LG Gram 2in1 16 16T90R - G.AA78G | |
| The Witcher 3 - 1920x1080 Ultra Graphics & Postprocessing (HBAO+) | |
| Asus Zephyrus Duo 16 GX650PY-NM006W | |
| Alienware m16 R1 AMD | |
| Lenovo ThinkPad P1 G6 21FV001KUS | |
| MSI Raider GE68 HX 13VG, i7-13700HX | |
| MSI Raider GE68HX 13VF | |
| HP Victus 16-r0076TX | |
| MSI Creator Z16P B12UHST | |
| Lenovo ThinkPad Z16 Gen 2 | |
| Apple MacBook Pro 16 2023 M3 Pro | |
| Lenovo ThinkPad Z16 G1 21D5S00T00 | |
| LG Gram 2in1 16 16T90R - G.AA78G | |
| GTA V - 1920x1080 Highest AA:4xMSAA + FX AF:16x | |
| Asus Zephyrus Duo 16 GX650PY-NM006W | |
| Lenovo ThinkPad P1 G6 21FV001KUS | |
| MSI Raider GE68 HX 13VG, i7-13700HX | |
| MSI Creator Z16P B12UHST | |
| Apple MacBook Pro 16 2023 M3 Pro | |
| Lenovo ThinkPad Z16 G1 21D5S00T00 | |
| LG Gram 2in1 16 16T90R - G.AA78G | |
| Final Fantasy XV Benchmark - 1920x1080 High Quality | |
| Asus Zephyrus Duo 16 GX650PY-NM006W | |
| Alienware m16 R1 AMD | |
| Lenovo ThinkPad P1 G6 21FV001KUS | |
| MSI Raider GE68 HX 13VG, i7-13700HX | |
| MSI Raider GE68HX 13VF | |
| MSI Creator Z16P B12UHST | |
| HP Victus 16-r0076TX | |
| Lenovo ThinkPad Z16 Gen 2 | |
| Lenovo ThinkPad Z16 G1 21D5S00T00 | |
| LG Gram 2in1 16 16T90R - G.AA78G | |
| Strange Brigade - 1920x1080 ultra AA:ultra AF:16 | |
| Alienware m16 R1 AMD | |
| Asus Zephyrus Duo 16 GX650PY-NM006W | |
| MSI Raider GE68 HX 13VG, i7-13700HX | |
| MSI Raider GE68HX 13VF | |
| MSI Creator Z16P B12UHST | |
| HP Victus 16-r0076TX | |
| Lenovo ThinkPad Z16 Gen 2 | |
| Lenovo ThinkPad Z16 G1 21D5S00T00 | |
| LG Gram 2in1 16 16T90R - G.AA78G | |
| Dota 2 Reborn - 1920x1080 ultra (3/3) best looking | |
| MSI Raider GE68HX 13VF | |
| Asus Zephyrus Duo 16 GX650PY-NM006W | |
| MSI Raider GE68 HX 13VG, i7-13700HX | |
| Alienware m16 R1 AMD | |
| MSI Creator Z16P B12UHST | |
| Lenovo ThinkPad P1 G6 21FV001KUS | |
| HP Victus 16-r0076TX | |
| Lenovo ThinkPad Z16 Gen 2 | |
| Lenovo ThinkPad Z16 G1 21D5S00T00 | |
| LG Gram 2in1 16 16T90R - G.AA78G | |
| X-Plane 11.11 - 1920x1080 high (fps_test=3) | |
| MSI Raider GE68HX 13VF | |
| MSI Raider GE68 HX 13VG, i7-13700HX | |
| Lenovo ThinkPad P1 G6 21FV001KUS | |
| Asus Zephyrus Duo 16 GX650PY-NM006W | |
| Alienware m16 R1 AMD | |
| HP Victus 16-r0076TX | |
| MSI Creator Z16P B12UHST | |
| LG Gram 2in1 16 16T90R - G.AA78G | |
| Lenovo ThinkPad Z16 G1 21D5S00T00 | |
| Lenovo ThinkPad Z16 Gen 2 | |
| Cyberpunk 2077 | |
| 1280x720 Low Preset (FSR off) | |
| Lenovo ThinkPad Z16 Gen 2 | |
| Moyenne AMD Radeon RX 6550M (n=1) | |
| LG Gram 2in1 16 16T90R - G.AA78G | |
| 1920x1080 Low Preset (FSR off) | |
| Lenovo ThinkPad Z16 Gen 2 | |
| Moyenne AMD Radeon RX 6550M (n=1) | |
| Apple MacBook Pro 16 2023 M3 Pro | |
| LG Gram 2in1 16 16T90R - G.AA78G | |
| 1920x1080 Medium Preset (FSR off) | |
| Lenovo ThinkPad Z16 Gen 2 | |
| Moyenne AMD Radeon RX 6550M (n=1) | |
| Apple MacBook Pro 16 2023 M3 Pro | |
| LG Gram 2in1 16 16T90R - G.AA78G | |
| 1920x1080 High Preset (FSR off) | |
| Lenovo ThinkPad P1 G6 21FV001KUS | |
| Apple MacBook Pro 16 2023 M3 Pro | |
| Lenovo ThinkPad Z16 Gen 2 | |
| Moyenne AMD Radeon RX 6550M (n=1) | |
| LG Gram 2in1 16 16T90R - G.AA78G | |
| 1920x1080 Ultra Preset (FSR off) | |
| Lenovo ThinkPad P1 G6 21FV001KUS | |
| Apple MacBook Pro 16 2023 M3 Pro | |
| Lenovo ThinkPad Z16 Gen 2 | |
| Moyenne AMD Radeon RX 6550M (n=1) | |
| LG Gram 2in1 16 16T90R - G.AA78G | |
| 2560x1440 Ultra Preset (FSR off) | |
| Lenovo ThinkPad P1 G6 21FV001KUS | |
| Lenovo ThinkPad Z16 Gen 2 | |
| Moyenne AMD Radeon RX 6550M (n=1) | |
| Baldur's Gate 3 | |
| 1920x1080 Low Preset AA:SM | |
| Lenovo ThinkPad Z16 Gen 2 | |
| Moyenne AMD Radeon RX 6550M (n=1) | |
| 1920x1080 Medium Preset AA:T | |
| Lenovo ThinkPad Z16 Gen 2 | |
| Moyenne AMD Radeon RX 6550M (n=1) | |
| 1920x1080 High Preset AA:T | |
| Apple MacBook Pro 16 2023 M3 Pro | |
| Lenovo ThinkPad Z16 Gen 2 | |
| Moyenne AMD Radeon RX 6550M (n=1) | |
| 1920x1080 Ultra Preset AA:T | |
| Lenovo ThinkPad P1 G6 21FV001KUS | |
| Apple MacBook Pro 16 2023 M3 Pro | |
| Lenovo ThinkPad Z16 Gen 2 | |
| Moyenne AMD Radeon RX 6550M (n=1) | |
| 2560x1440 Ultra Preset AA:T | |
| Lenovo ThinkPad P1 G6 21FV001KUS | |
| Lenovo ThinkPad Z16 Gen 2 | |
| Moyenne AMD Radeon RX 6550M (n=1) | |
Witcher 3 FPS Chart
| Bas | Moyen | Élevé | Ultra | QHD | |
|---|---|---|---|---|---|
| The Witcher 3 (2015) | 277.2 | 171.5 | 83.2 | 49.4 | |
| Dota 2 Reborn (2015) | 137.1 | 127.3 | 112.3 | 103 | |
| Final Fantasy XV Benchmark (2018) | 129.3 | 67.4 | 47.8 | 31.2 | |
| X-Plane 11.11 (2018) | 53.7 | 41.2 | 33 | ||
| Far Cry 5 (2018) | 115 | 91 | 84 | 79 | |
| Strange Brigade (2018) | 319 | 122.5 | 101.1 | 88.4 | |
| Tiny Tina's Wonderlands (2022) | 124.1 | 95.5 | 59.7 | 30.3 | 27.2 |
| F1 22 (2022) | 132.5 | 120.8 | 87.5 | 19.3 | 11.3 |
| Baldur's Gate 3 (2023) | 61.6 | 52.9 | 44.7 | 43 | 29 |
| Cyberpunk 2077 (2023) | 62.8 | 45.9 | 34.7 | 28.6 | 17.3 |
Émissions
Bruit du système
Le bruit des ventilateurs dépend fortement du profil d'alimentation sélectionné. Par exemple, les ventilateurs ne sont vraiment silencieux que lorsqu'ils sont en mode économie d'énergie, car sinon ils sont toujours actifs à près de 30 dB(A), quelle que soit la charge à l'écran. De même, le bruit des ventilateurs en mode équilibré est de l'ordre de 41 à 45 dB(A) contre 52 dB(A) en mode Performance, ce qui constitue une différence significative malgré les différences mineures de performances entre les deux profils mentionnées ci-dessus. Le mode Performance en particulier est nettement plus bruyant que beaucoup d'autres ordinateurs portables de 16 pouces comme le MSI Creator Z16P ou le MacBook Pro 16.
Les pulsations du ventilateur sont par ailleurs réduites au minimum. Lors de l'exécution de 3DMark 06, par exemple, le bruit du ventilateur se maintient à 29,5 dB(A) tout au long de la première scène du benchmark, sans pic soudain.
Degré de la nuisance sonore
| Au repos |
| 22.9 / 29.4 / 29.4 dB(A) |
| Fortement sollicité |
| 29.5 / 52 dB(A) |
 | ||
30 dB silencieux 40 dB(A) audible 50 dB(A) bruyant |
||
min: | ||
| Lenovo ThinkPad Z16 Gen 2 Radeon RX 6550M, R9 PRO 7940HS, Kioxia XG8 KXG8AZNV1T02 | Lenovo ThinkPad Z16 G1 21D5S00T00 Radeon RX 6500M, R7 PRO 6850H, Samsung PM9A1 MZVL21T0HCLR | Lenovo ThinkBook 16 G6 ABP Vega 7, R5 7530U, SK hynix HFS512GEJ9X125N | MSI Creator Z16P B12UHST GeForce RTX 3080 Ti Laptop GPU, i9-12900H, Samsung PM9A1 MZVL22T0HBLB | Apple MacBook Pro 16 2023 M3 Pro M3 Pro 18-Core GPU, Apple M3 Pro 12-Core, Apple SSD AP0512Z | Asus Vivobook Pro 16X K6604JV-MX016W GeForce RTX 4060 Laptop GPU, i9-13980HX, Solidigm P41 Plus SSDPFKNU010TZ | |
|---|---|---|---|---|---|---|
| Noise | 9% | 11% | -8% | 12% | -18% | |
| arrêt / environnement * (dB) | 22.6 | 23.7 -5% | 24.3 -8% | 26 -15% | 24.4 -8% | 25.2 -12% |
| Idle Minimum * (dB) | 22.9 | 23.7 -3% | 24.3 -6% | 27 -18% | 24.4 -7% | 26.6 -16% |
| Idle Average * (dB) | 29.4 | 23.7 19% | 24.3 17% | 29 1% | 24.4 17% | 26.6 10% |
| Idle Maximum * (dB) | 29.4 | 23.7 19% | 24.3 17% | 31 -5% | 24.4 17% | 29.2 1% |
| Load Average * (dB) | 29.5 | 25.9 12% | 29.7 -1% | 43 -46% | 26.9 9% | 53.4 -81% |
| Witcher 3 ultra * (dB) | 52 | 46.9 10% | 32.1 38% | 43 17% | 25.1 52% | |
| Load Maximum * (dB) | 52 | 46.9 10% | 41.4 20% | 46 12% | 50.4 3% | 56.9 -9% |
* ... Moindre est la valeur, meilleures sont les performances
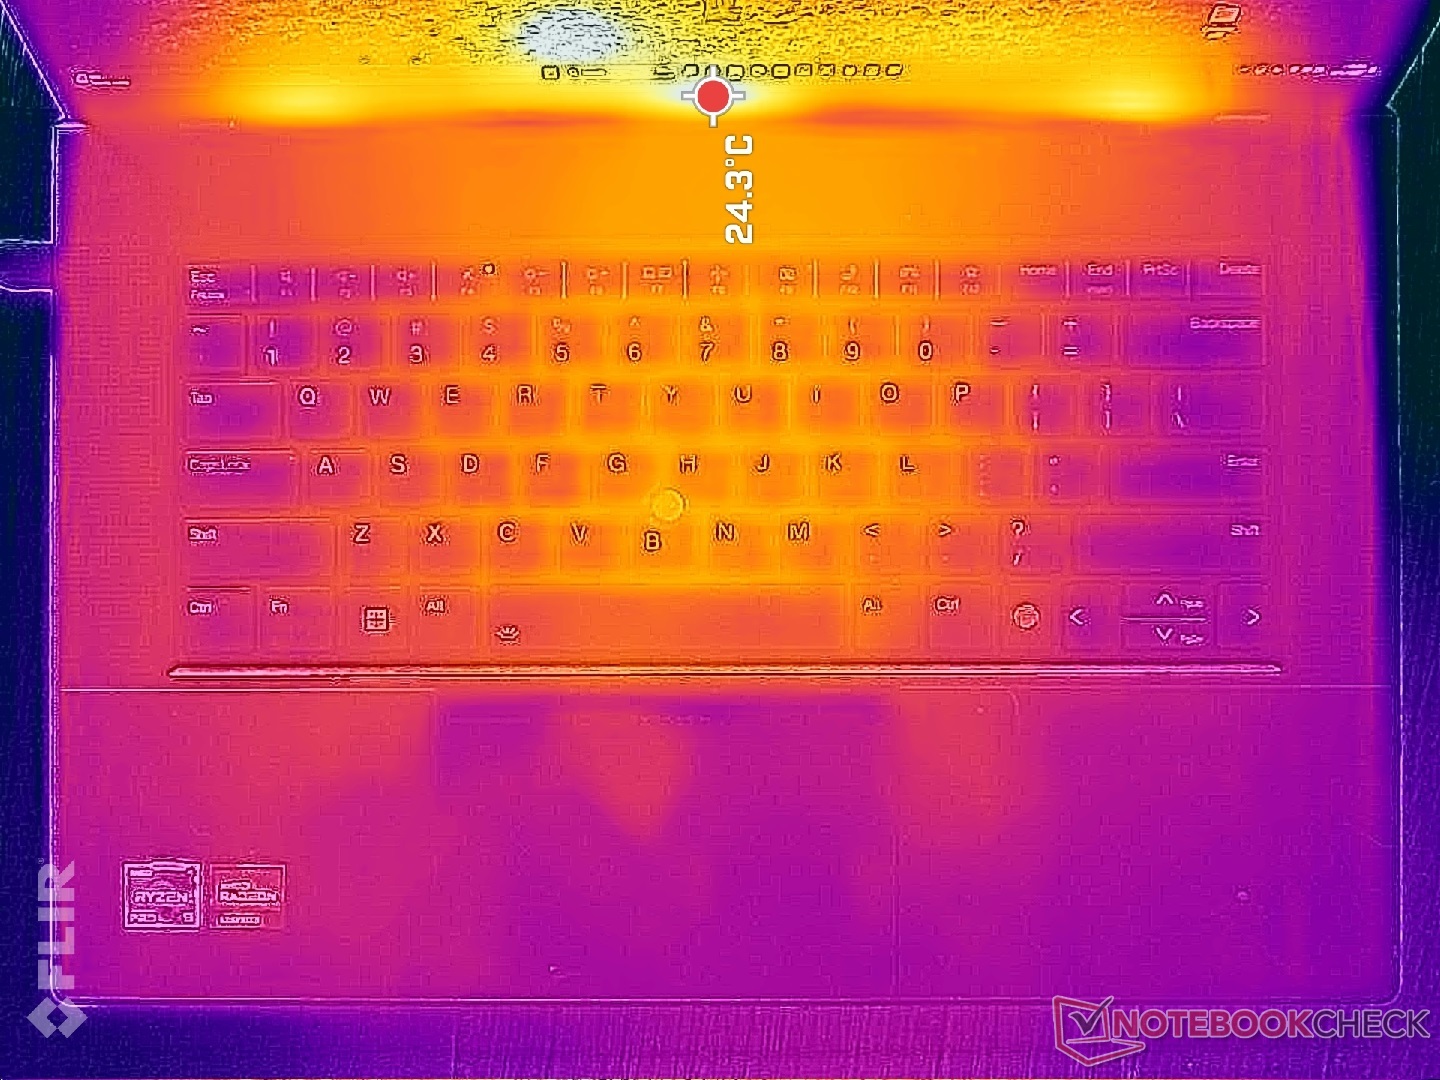
Température
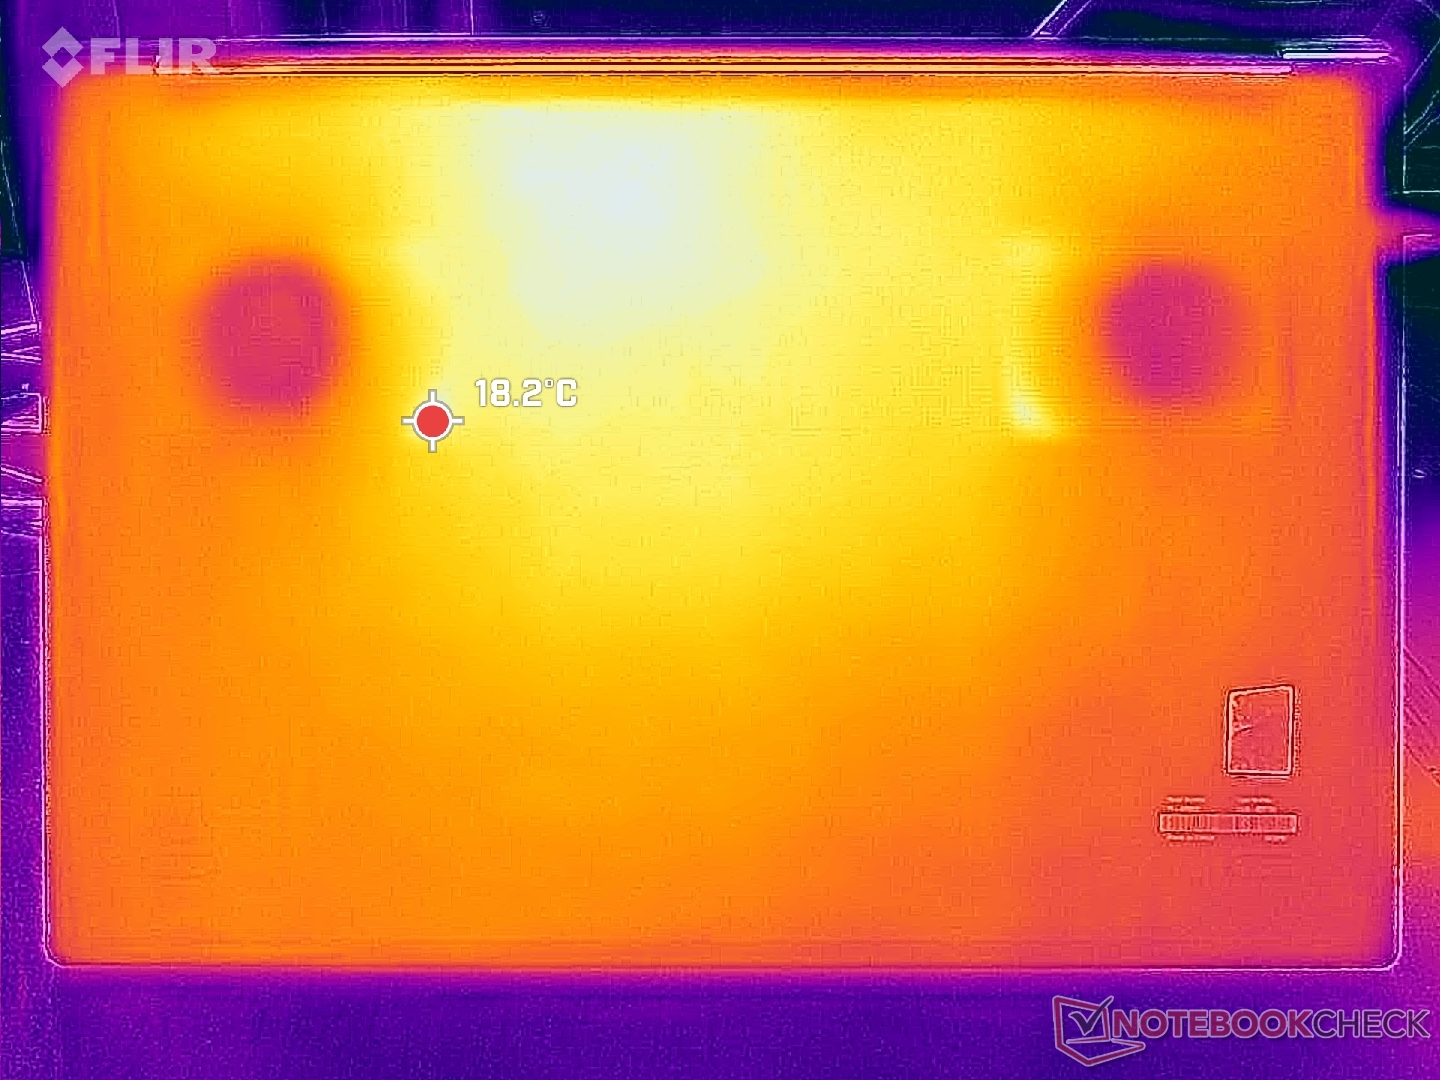
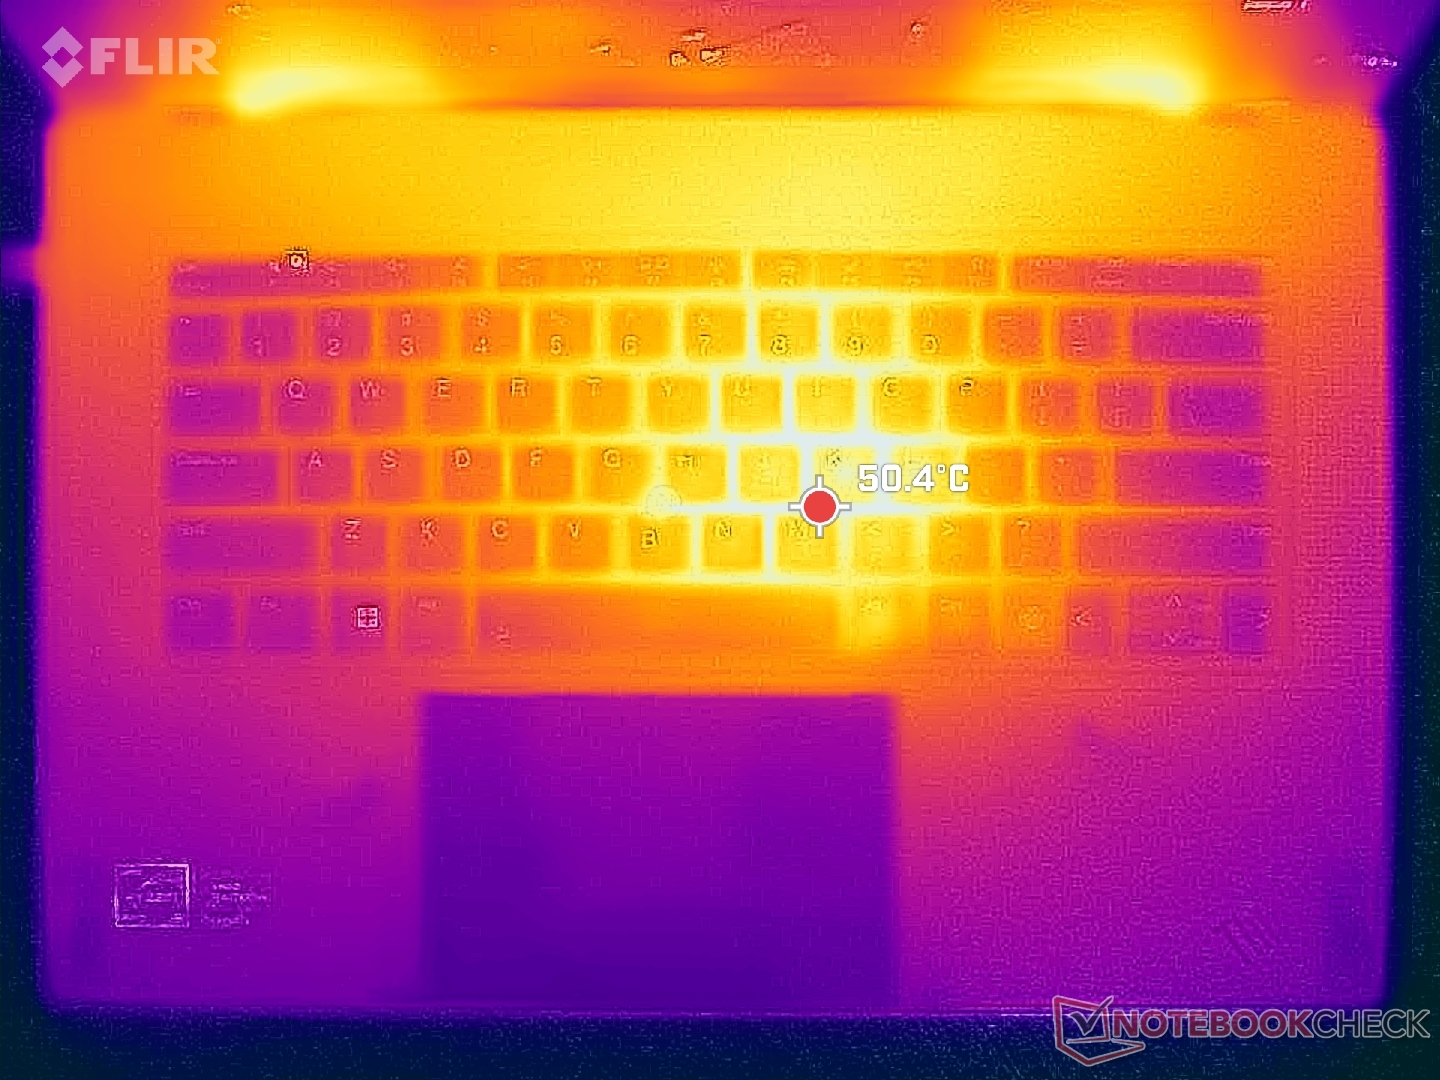
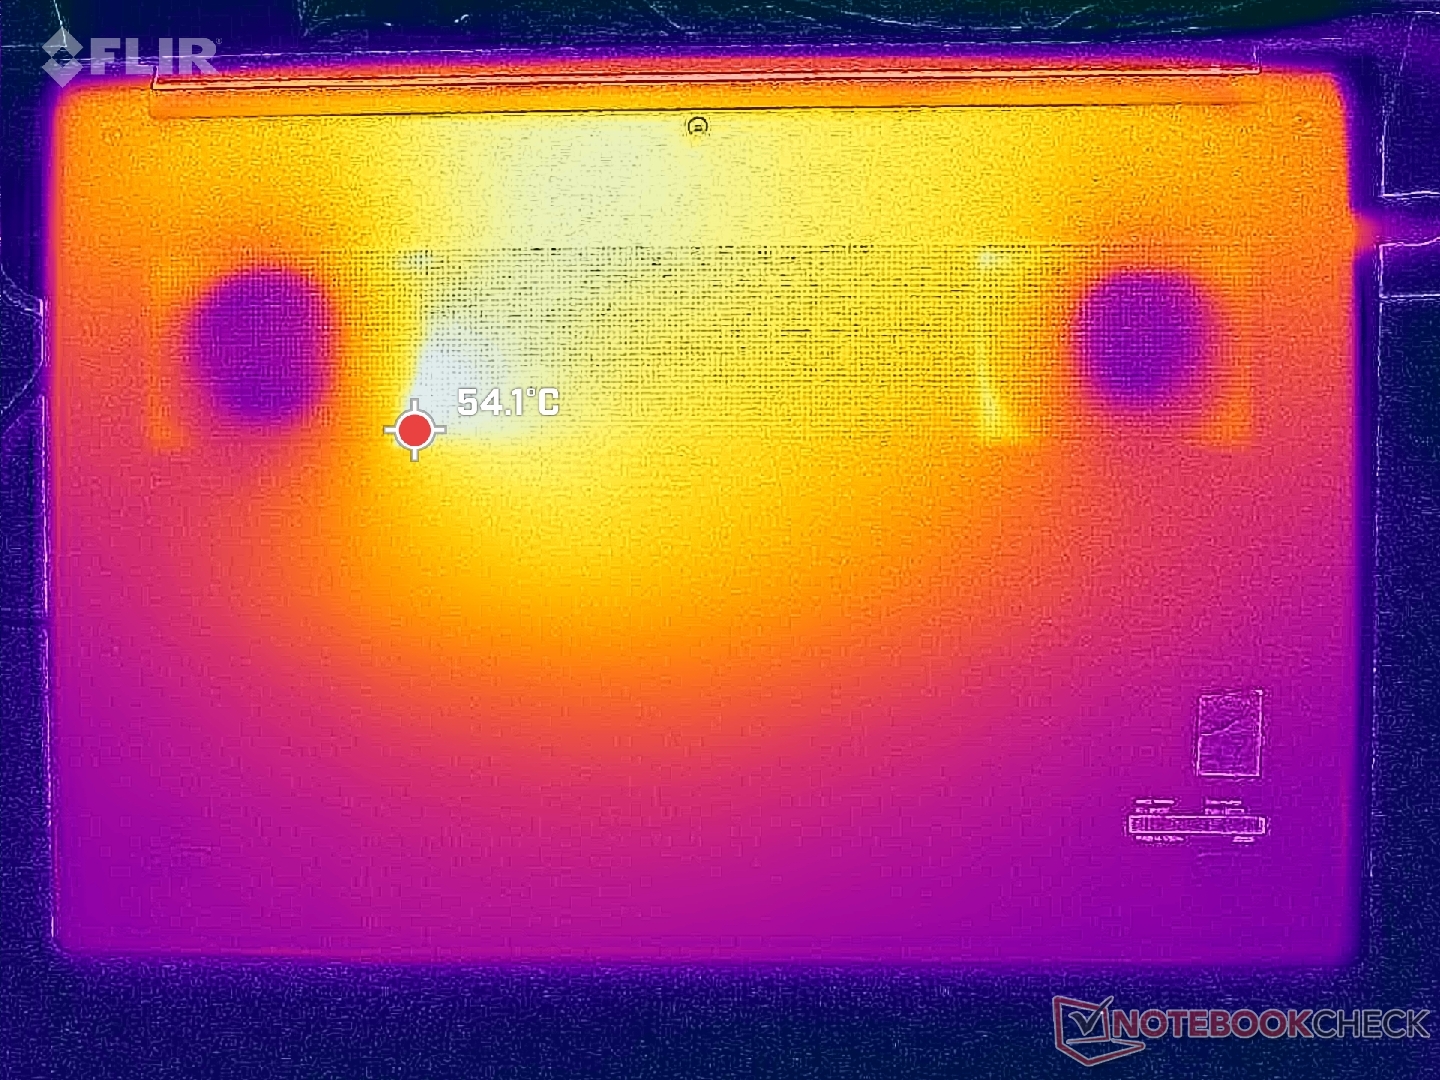
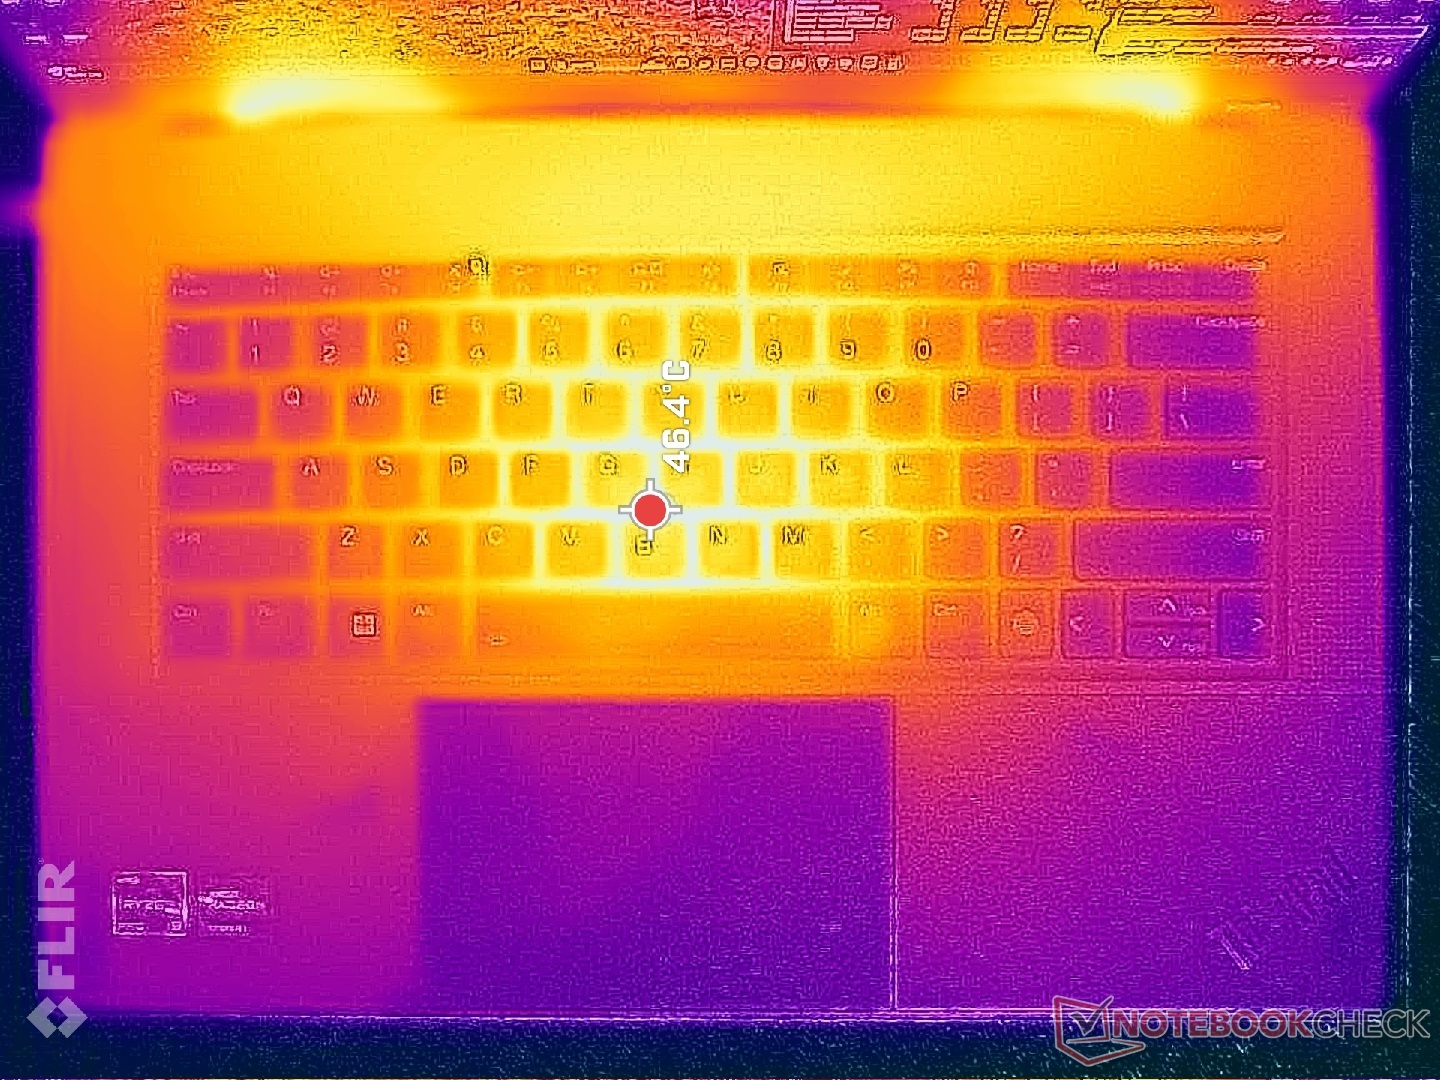
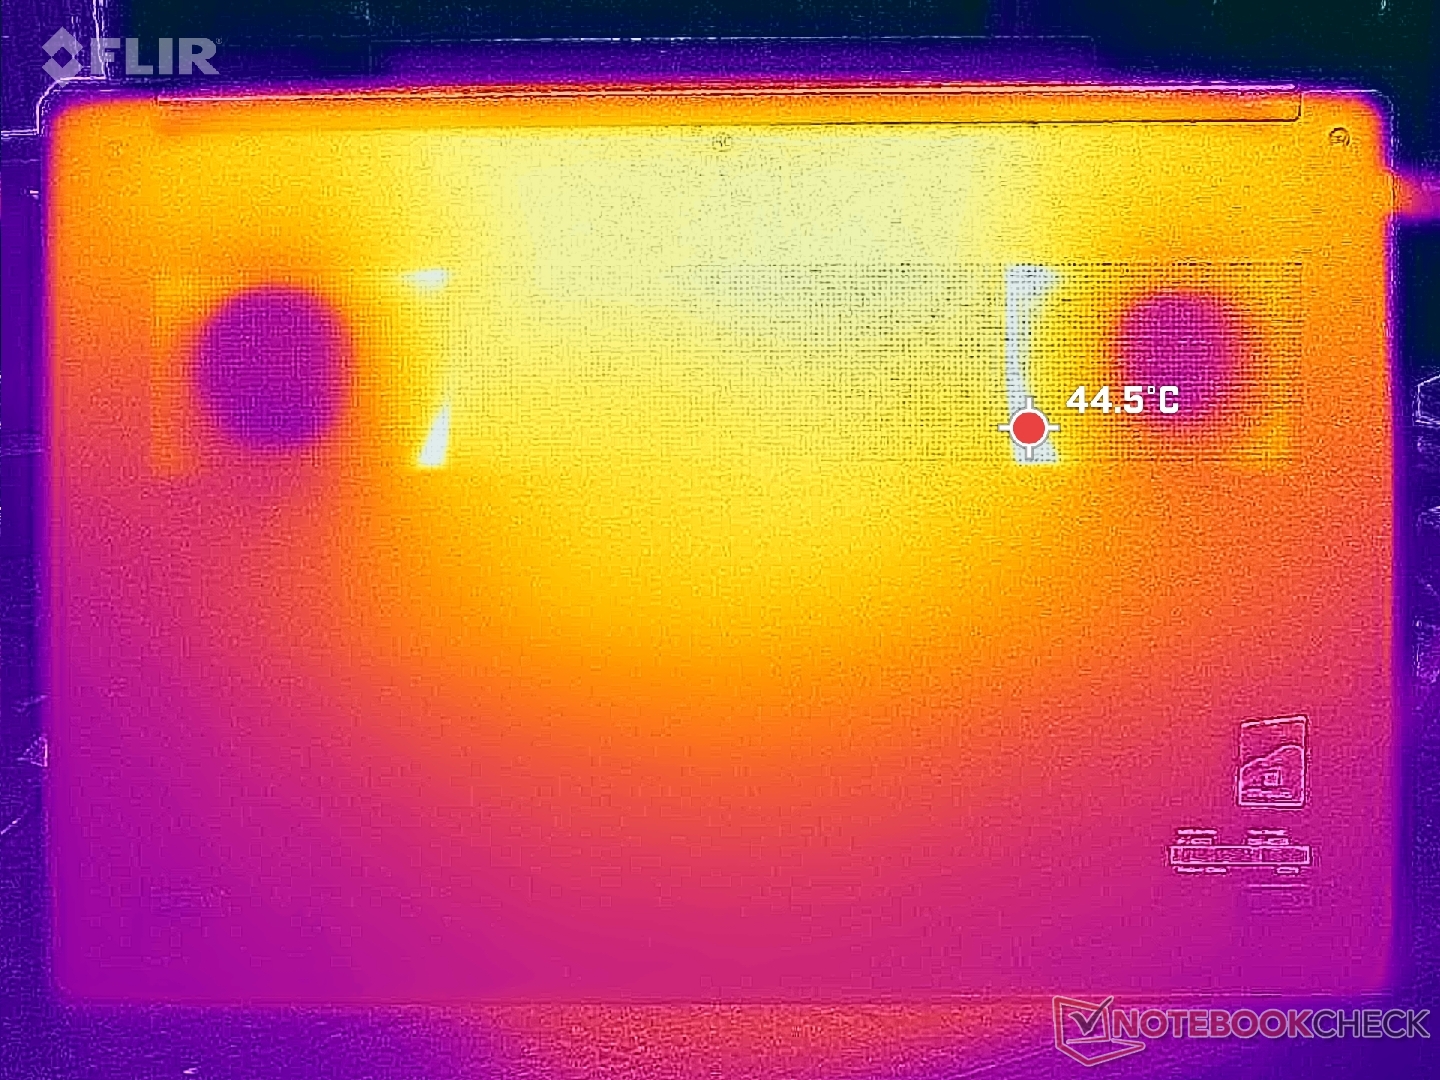
Les températures de surface augmentent et diminuent assez rapidement et par des extrêmes plus larges puisque la majeure partie du châssis est en métal. Lors de l'exécution de charges exigeantes comme les jeux, les points chauds peuvent atteindre 47 C et 43 C sur le centre du clavier et la plaque inférieure, respectivement, mais cela peut être encore plus chaud à plus de 50 C en fonction de la température ambiante comme ce que nous avons observé sur le ThinkPad Z16 Gen 1. Les résultats sont néanmoins beaucoup plus frais que ce que nous avons enregistré sur le MSI Creator Z16P qui devenait beaucoup trop chaud pour son propre bien.
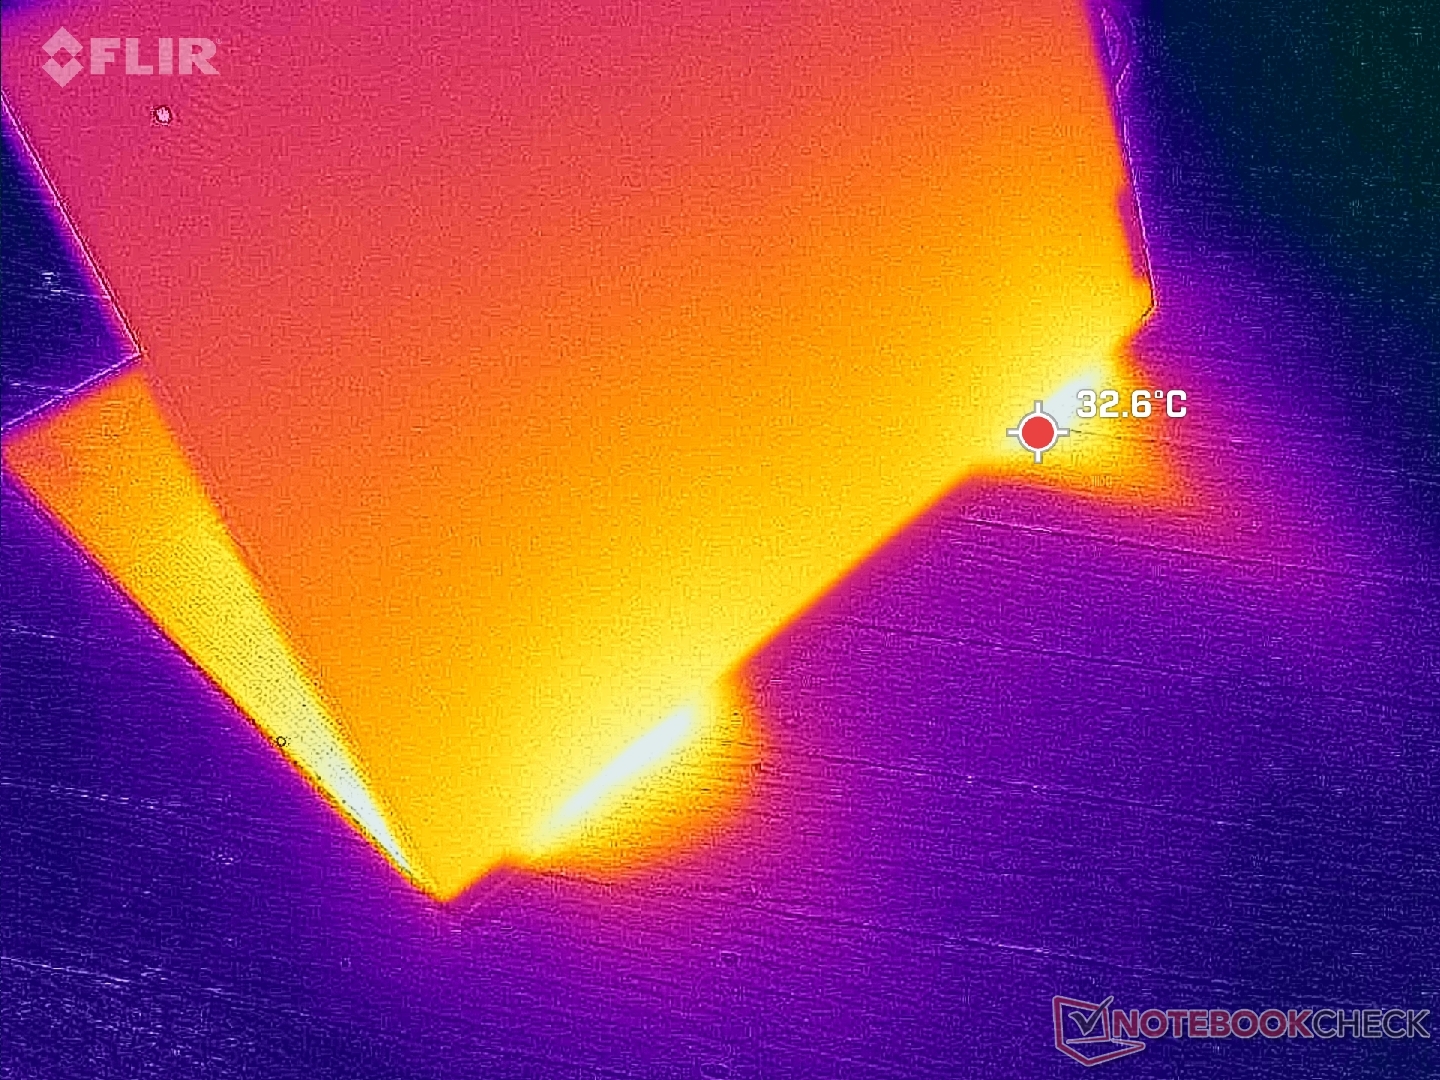
(±) La température maximale du côté supérieur est de 43 °C / 109 F, par rapport à la moyenne de 36.8 °C / 98 F, allant de 21 à 71 °C pour la classe Multimedia.
(±) Le fond chauffe jusqu'à un maximum de 41.6 °C / 107 F, contre une moyenne de 39.1 °C / 102 F
(+) En utilisation inactive, la température moyenne du côté supérieur est de 20.3 °C / 69 F, par rapport à la moyenne du dispositif de 31.3 °C / 88 F.
(-) En jouant à The Witcher 3, la température moyenne du côté supérieur est de 38.1 °C / 101 F, alors que la moyenne de l'appareil est de 31.3 °C / 88 F.
(+) Les repose-poignets et le pavé tactile sont plus froids que la température de la peau avec un maximum de 30 °C / 86 F et sont donc froids au toucher.
(±) La température moyenne de la zone de l'appui-paume de dispositifs similaires était de 28.7 °C / 83.7 F (-1.3 °C / #-2.3 F).
| Lenovo ThinkPad Z16 Gen 2 AMD Ryzen 9 PRO 7940HS, AMD Radeon RX 6550M | Lenovo ThinkPad Z16 G1 21D5S00T00 AMD Ryzen 7 PRO 6850H, AMD Radeon RX 6500M | Lenovo ThinkBook 16 G6 ABP AMD Ryzen 5 7530U, AMD Radeon RX Vega 7 | MSI Creator Z16P B12UHST Intel Core i9-12900H, NVIDIA GeForce RTX 3080 Ti Laptop GPU | Apple MacBook Pro 16 2023 M3 Pro Apple M3 Pro 12-Core, Apple M3 Pro 18-Core GPU | Asus Vivobook Pro 16X K6604JV-MX016W Intel Core i9-13980HX, NVIDIA GeForce RTX 4060 Laptop GPU | |
|---|---|---|---|---|---|---|
| Heat | -33% | -30% | -49% | -2% | -36% | |
| Maximum Upper Side * (°C) | 43 | 56.8 -32% | 40.8 5% | 67 -56% | 38.1 11% | 39.7 8% |
| Maximum Bottom * (°C) | 41.6 | 53.3 -28% | 50.5 -21% | 69 -66% | 37 11% | 60 -44% |
| Idle Upper Side * (°C) | 21.2 | 28.2 -33% | 29.3 -38% | 29 -37% | 24.2 -14% | 30.9 -46% |
| Idle Bottom * (°C) | 21.4 | 29.4 -37% | 35.2 -64% | 29 -36% | 24.6 -15% | 34.7 -62% |
* ... Moindre est la valeur, meilleures sont les performances
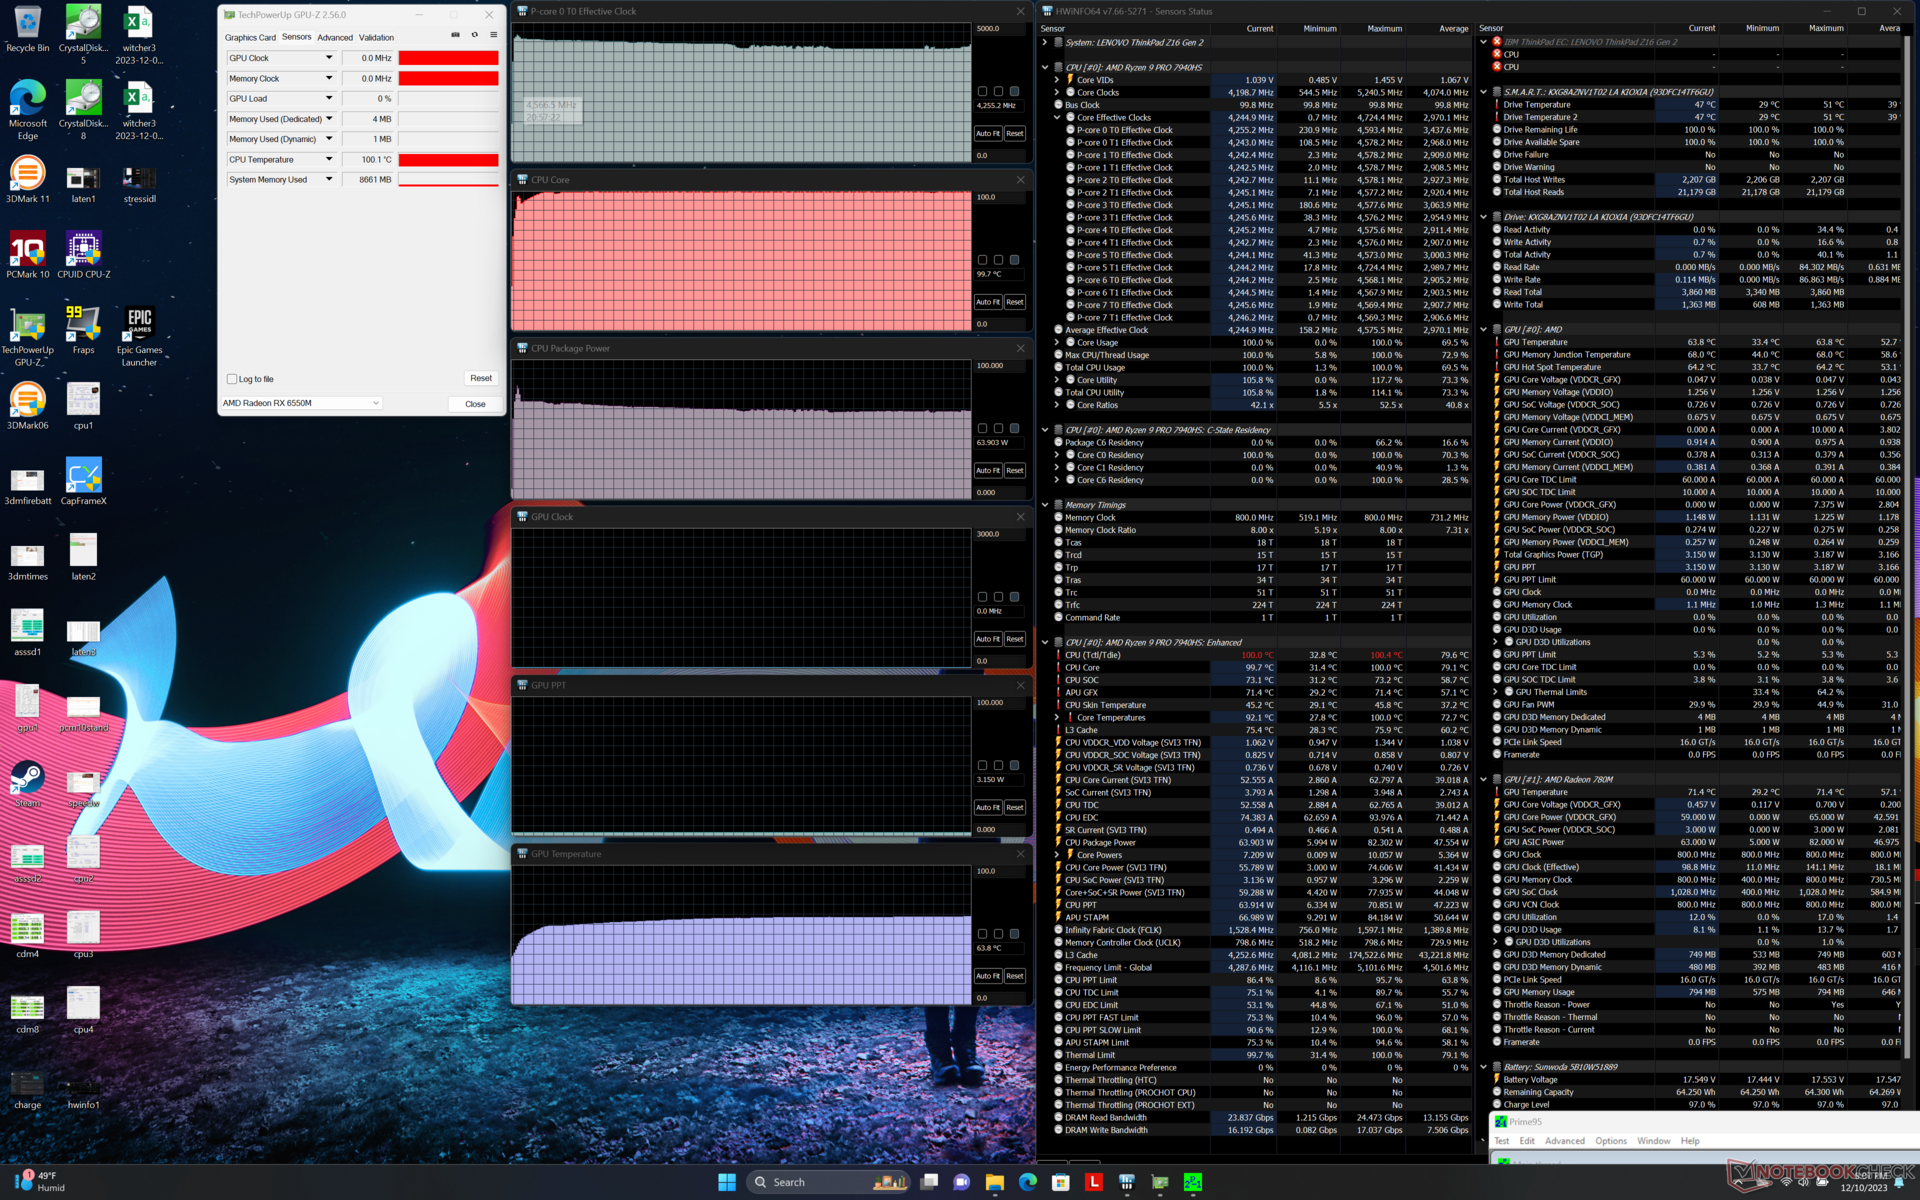
Test de stress
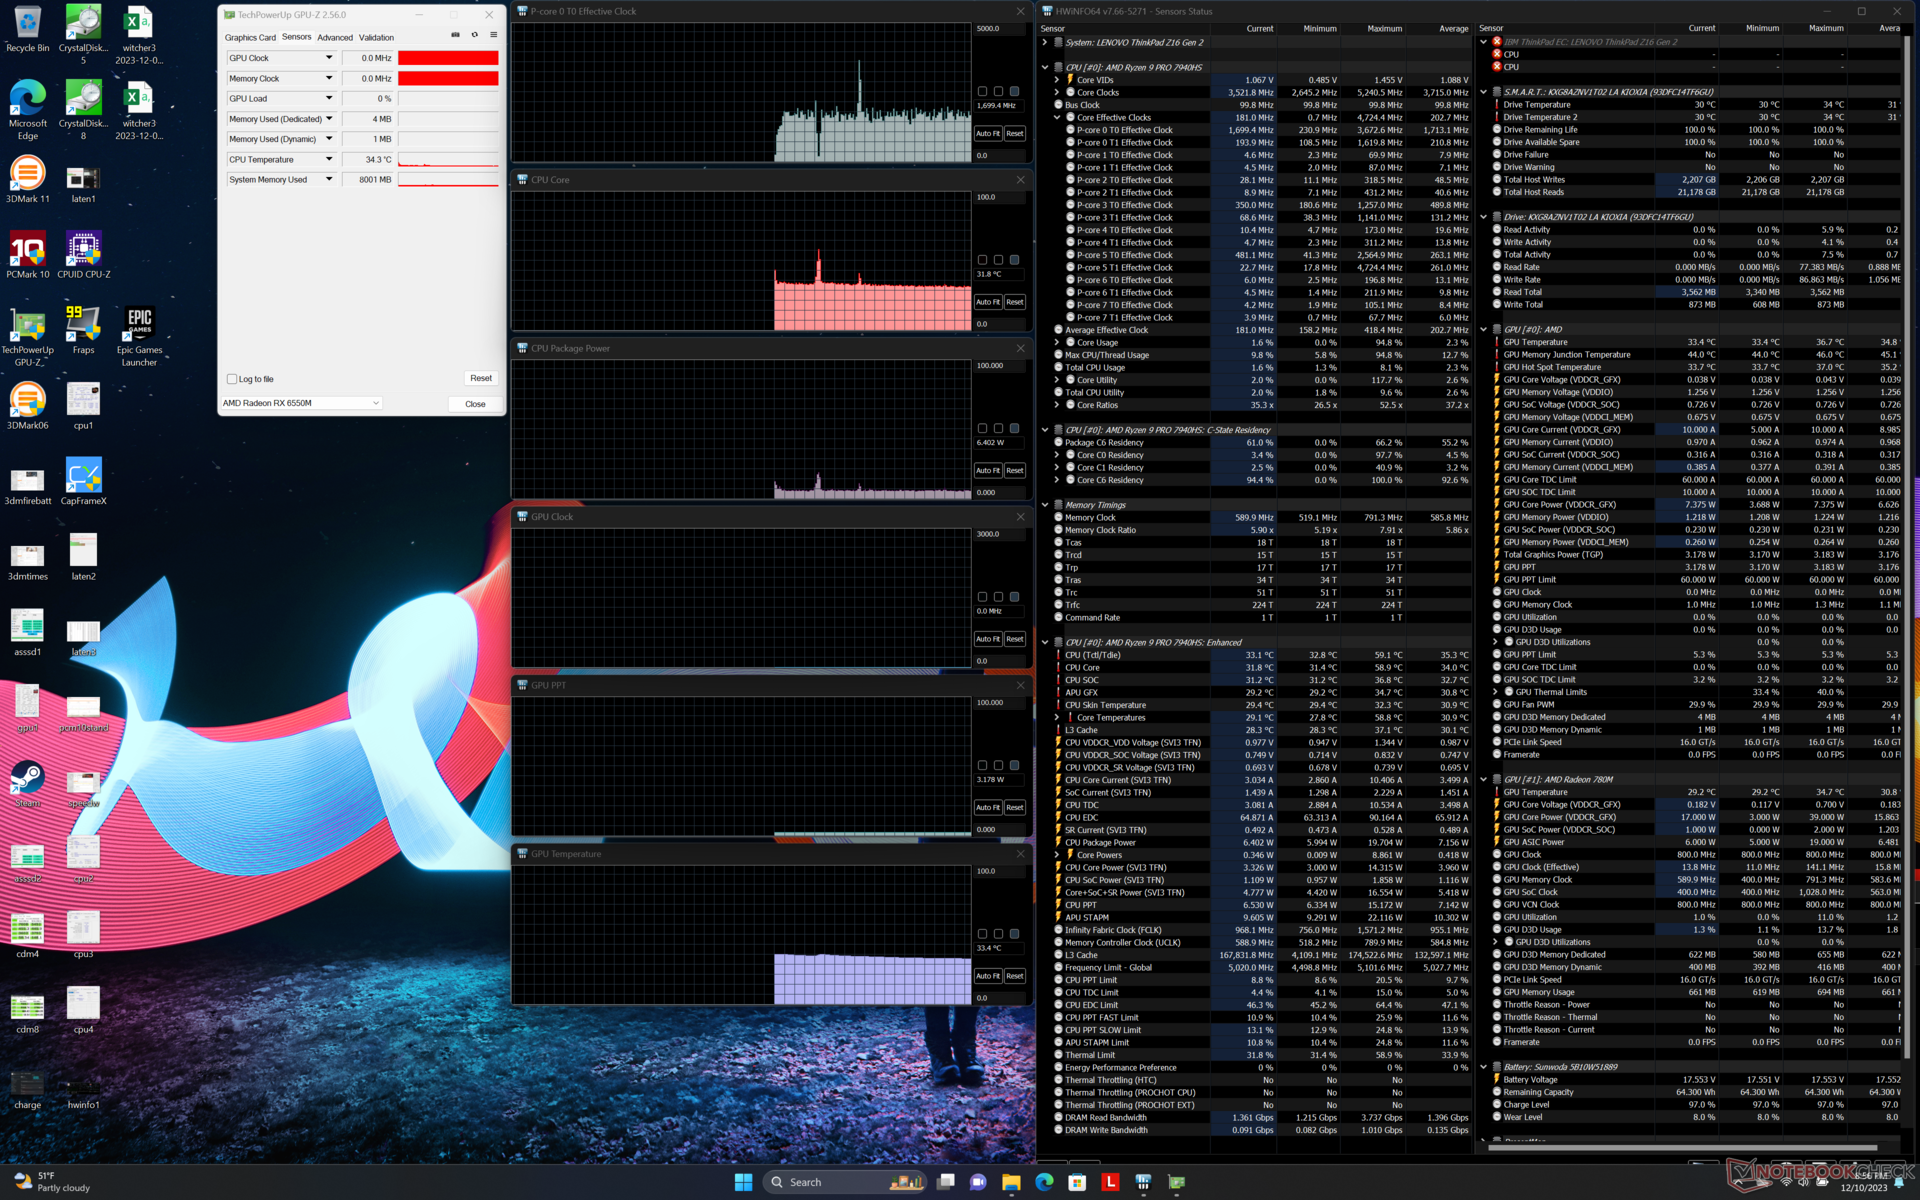
Lors de l'exécution du stress Prime95, le CPU a atteint 4,6 GHz et 82 W pendant quelques secondes avant de retomber et de se stabiliser à 4,4 GHz, 69 W et 100 C. Il est clair que le CPU fonctionne aussi vite qu'il le peut dans les limites de la solution de refroidissement qui le recouvre.
Les fréquences d'horloge du GPU et la consommation de la carte en mode Performance se stabilisent respectivement à 2630 MHz et 59 W, contre 2133 MHz et 39 W en mode Équilibré. Plus particulièrement, le déficit de performance entre les deux modes en mode Performance est minime à quelques images près, même si le mode Équilibré est le plus utilisé Witcher 3 est minime à quelques images près, même si les différences de bruit du ventilateur sont significatives. Ainsi, les utilisateurs peuvent envisager de jouer en mode équilibré pour les ventilateurs beaucoup plus silencieux et les températures de cœur légèrement plus froides.
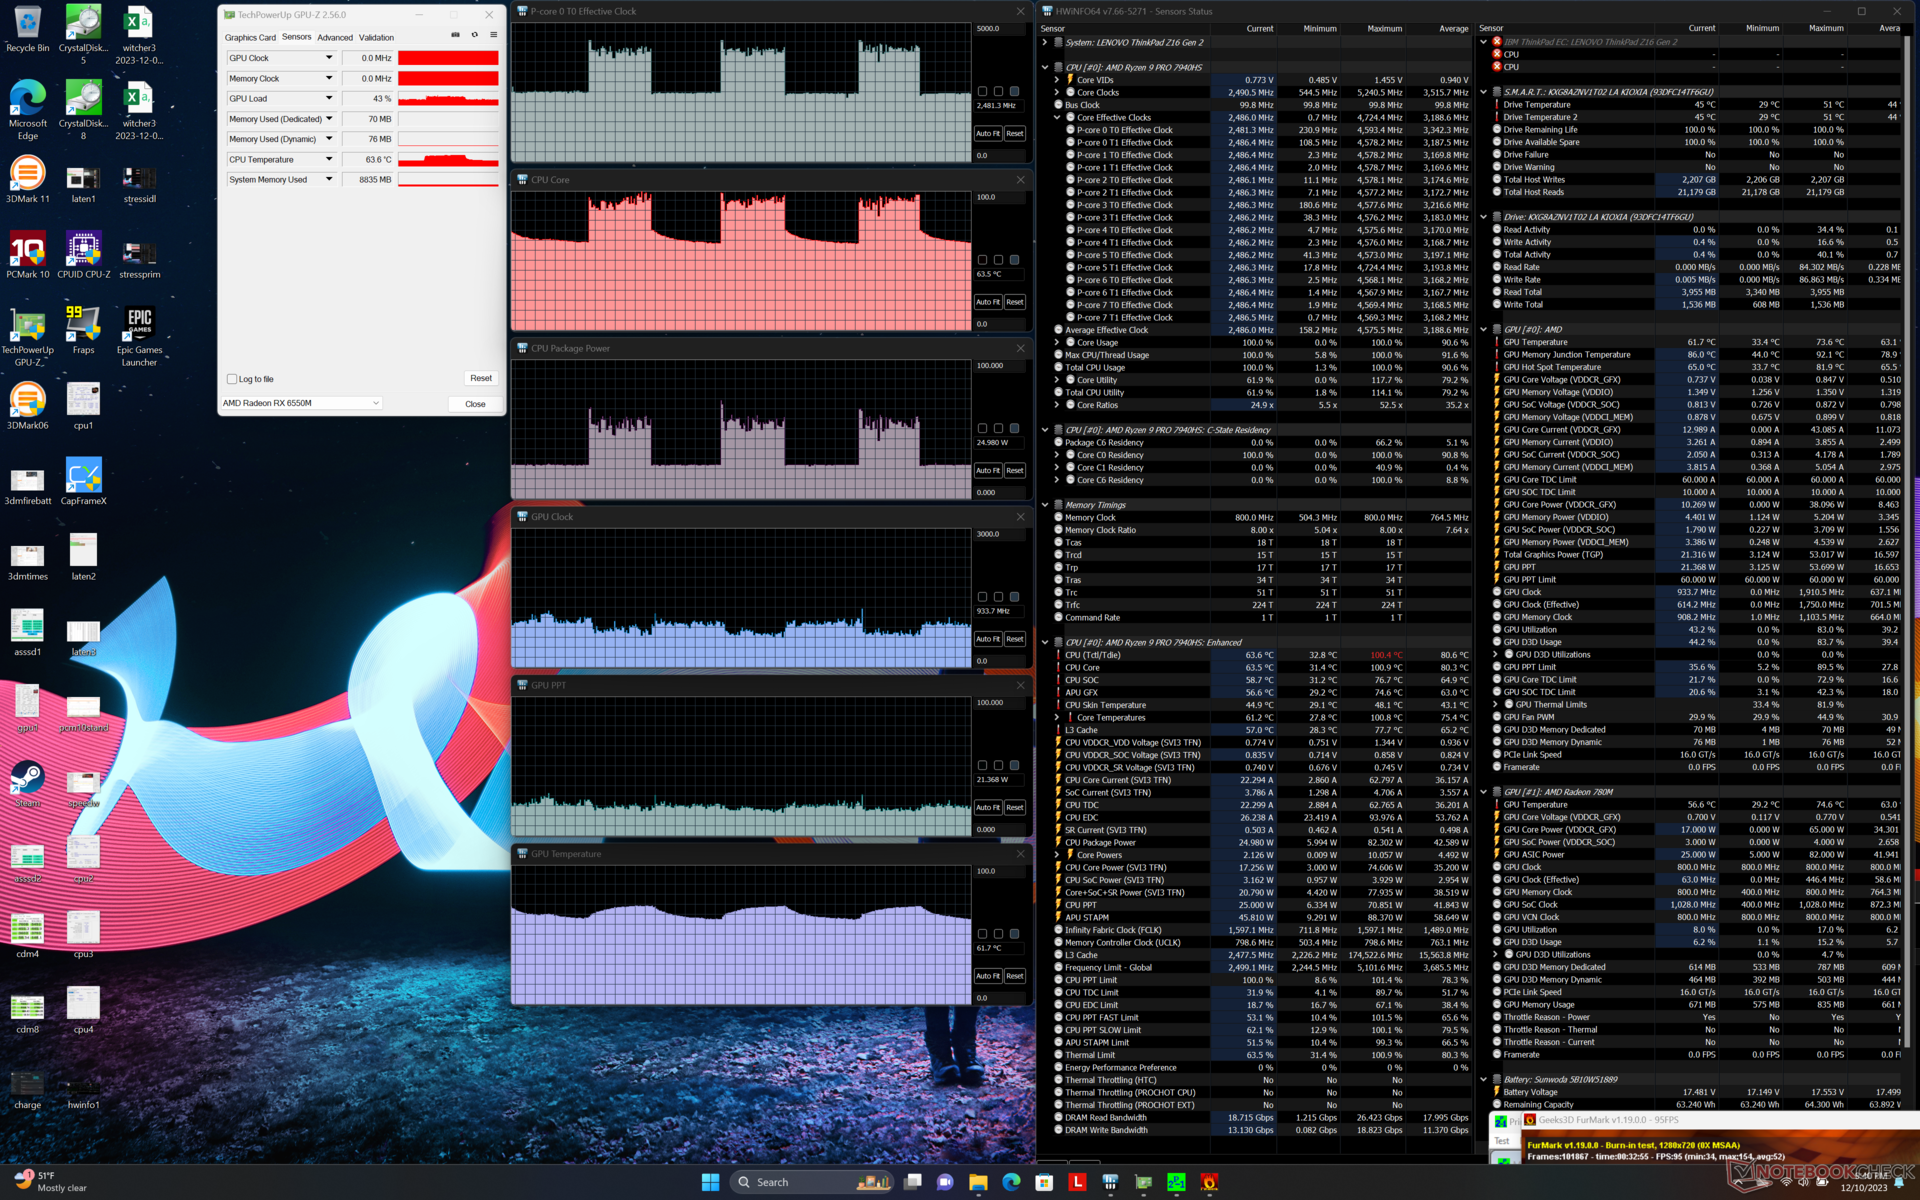
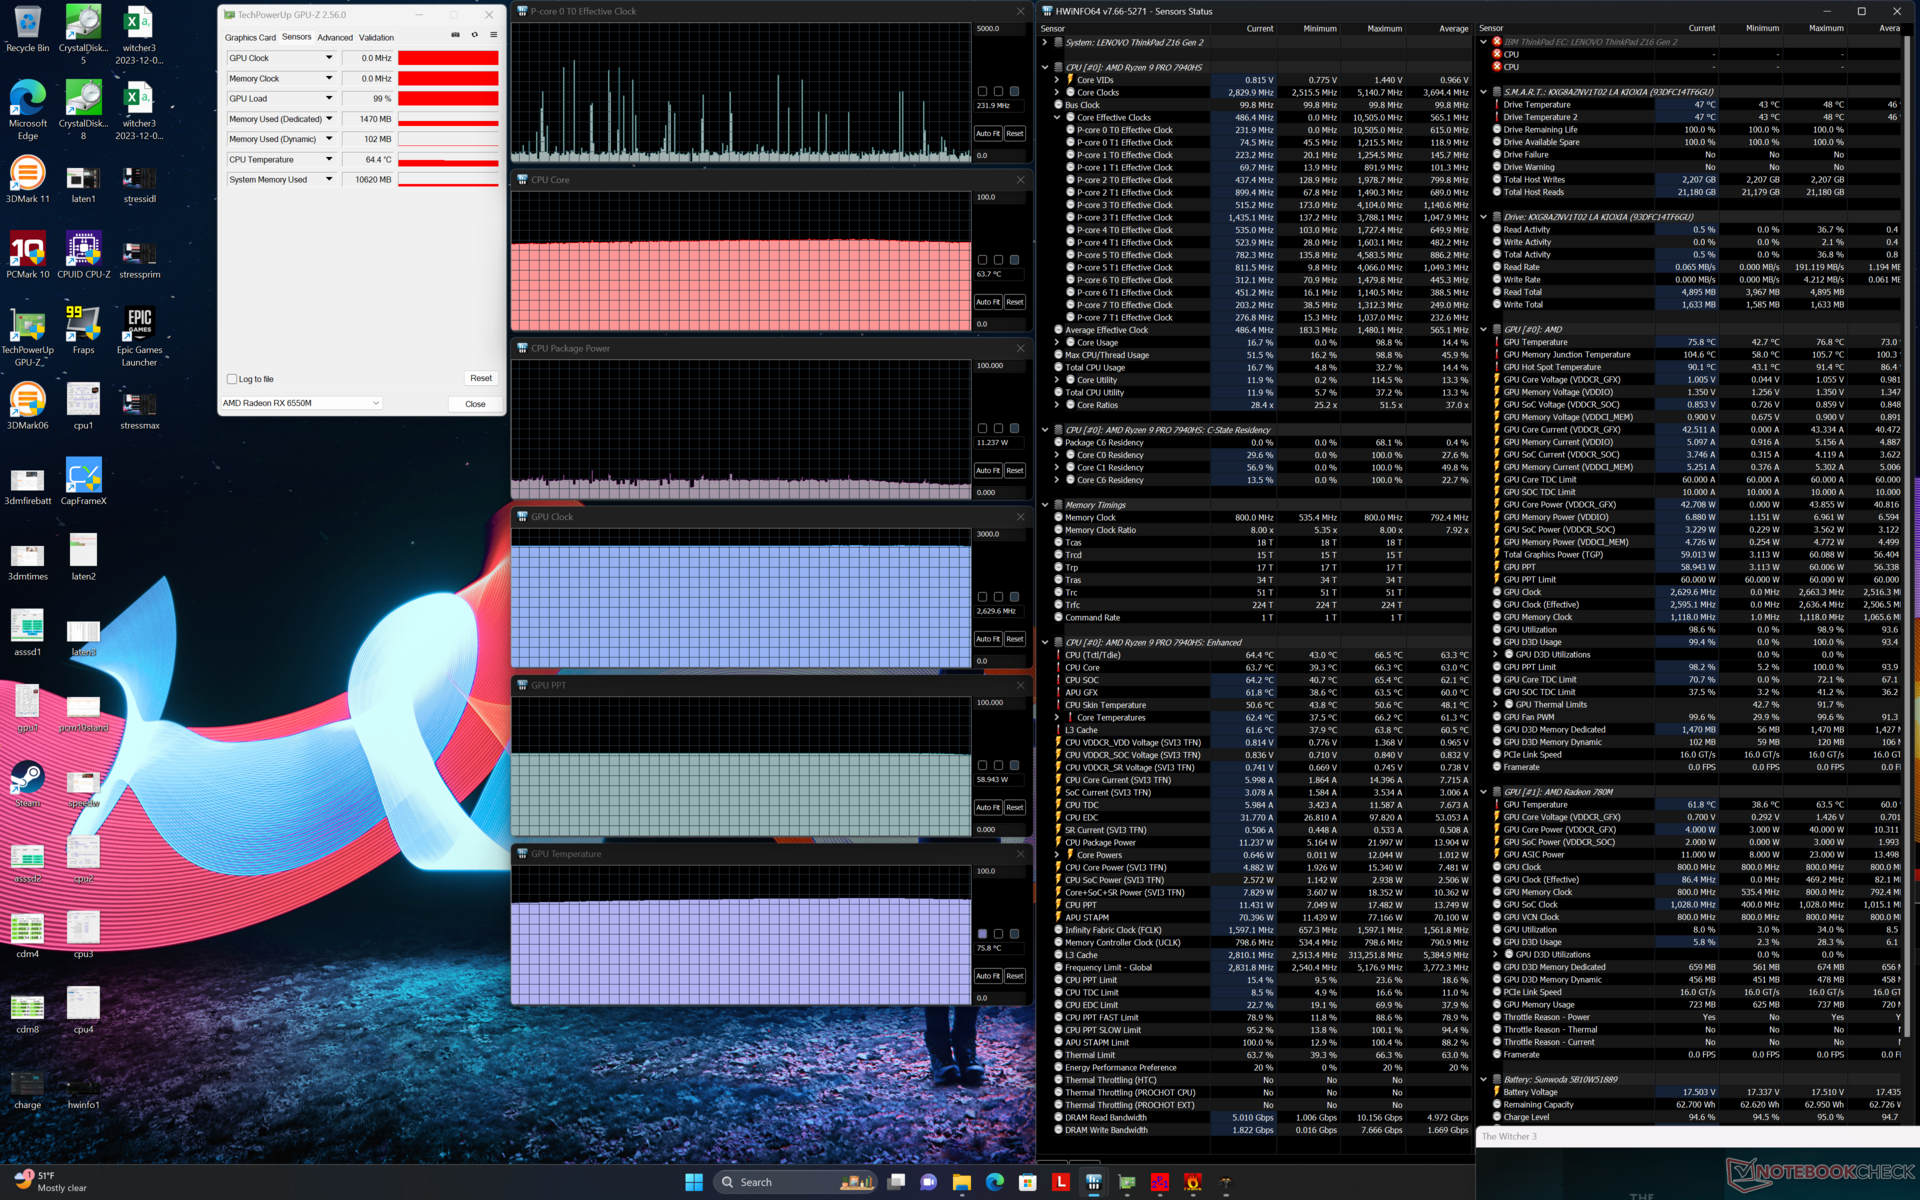
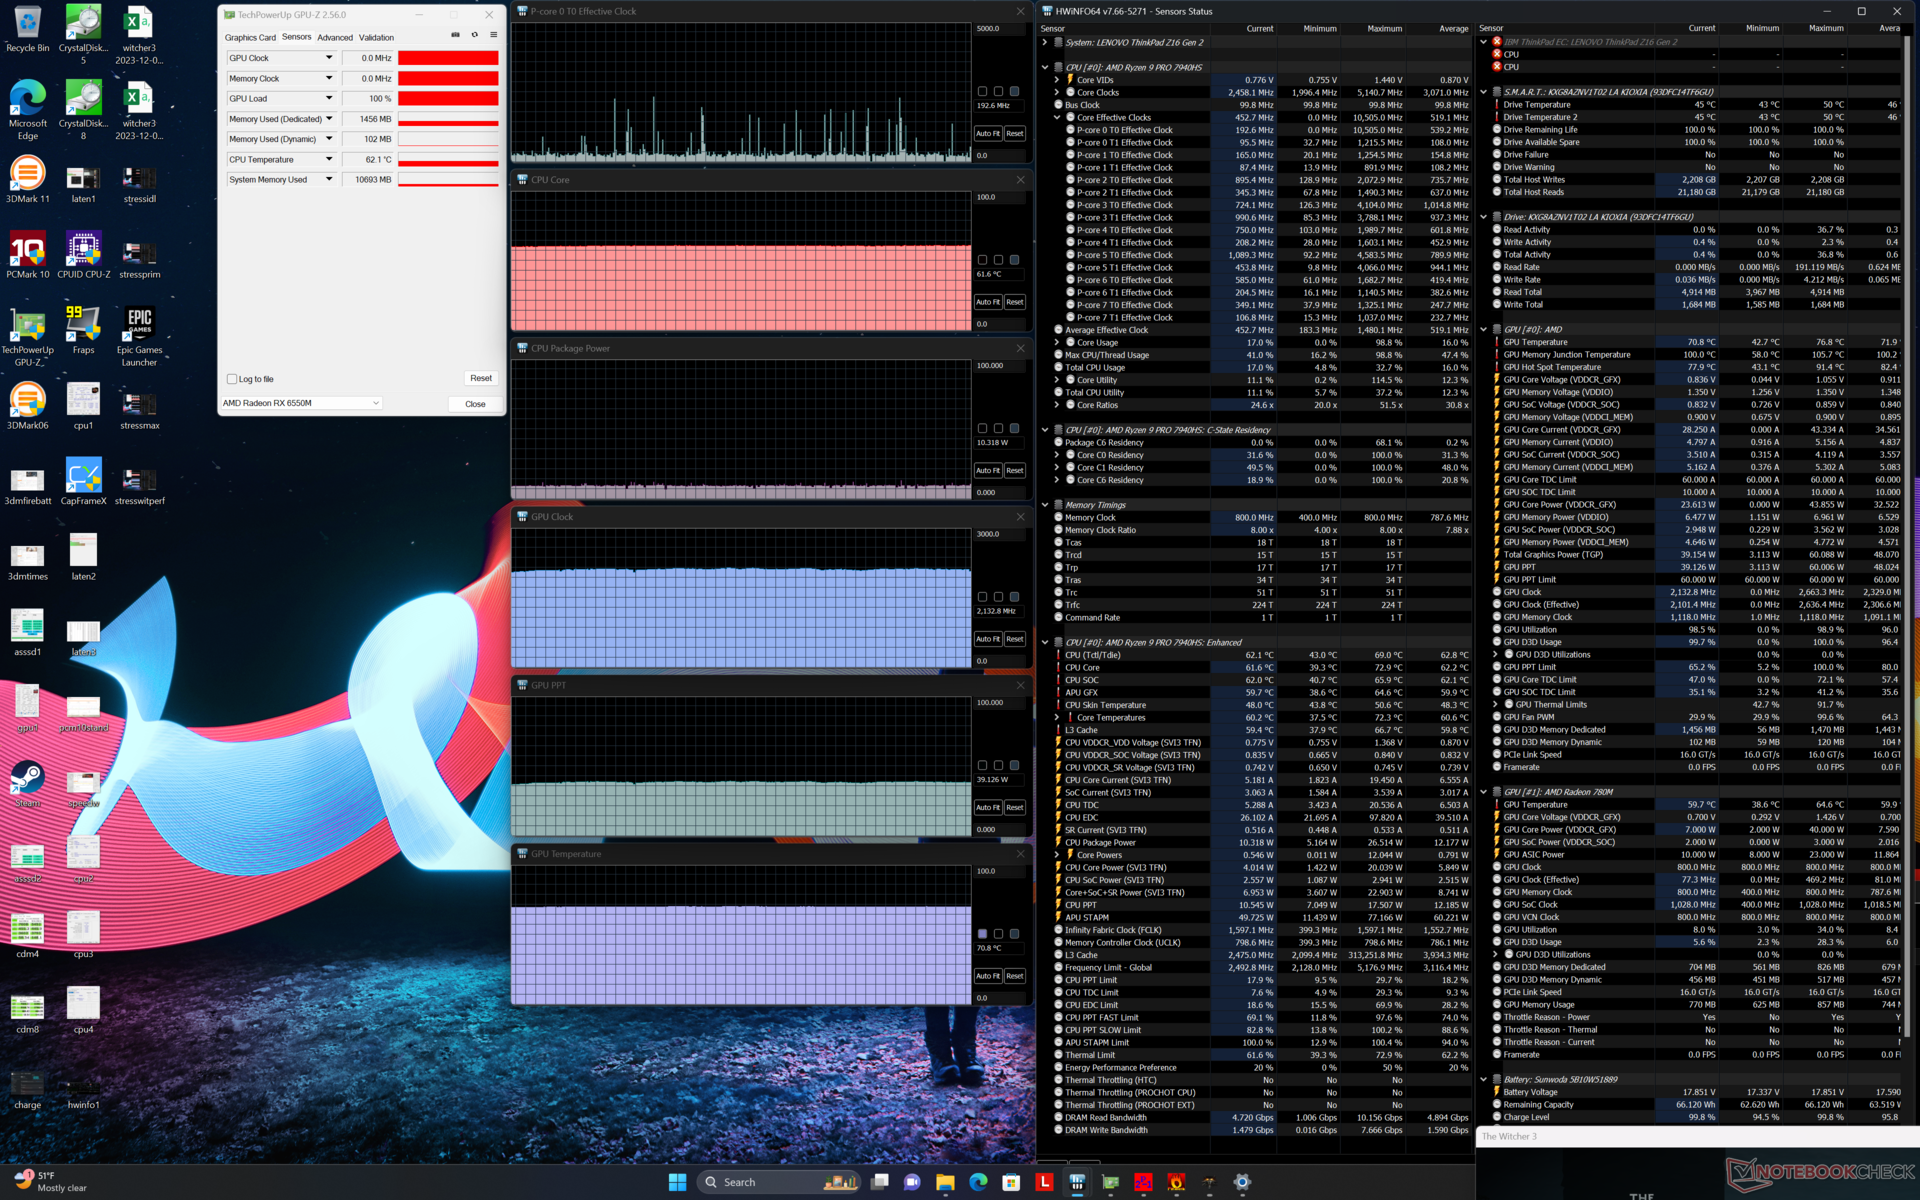
| Horloge du CPU (GHz) | Horloge du GPU (MHz) | Température moyenne du CPU (°C) | Température moyenne du GPU (°C) | |
| Système au repos | -- | -- | 32 | 33 |
| Prime95 Stress | 4.2 | -- | 100 | 64 |
| Prime95 + FurMark Stress | 2.5 - 4.0 | 750 - 1000 | 64 - 100 | 62 - 72 |
| Witcher 3 Stress(mode équilibré) | ~0.2 | 2133 | 62 | 71 |
| Witcher 3 Stress (mode Performance) | ~0,2 | 2630 | 64 | 76 |
Intervenants
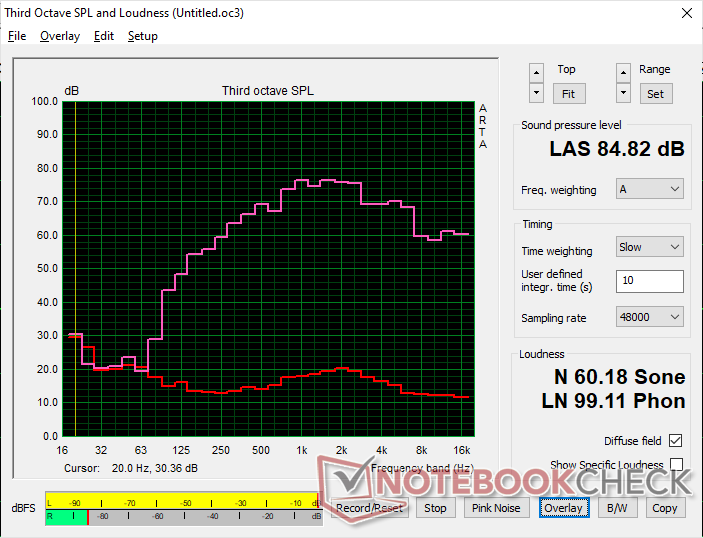
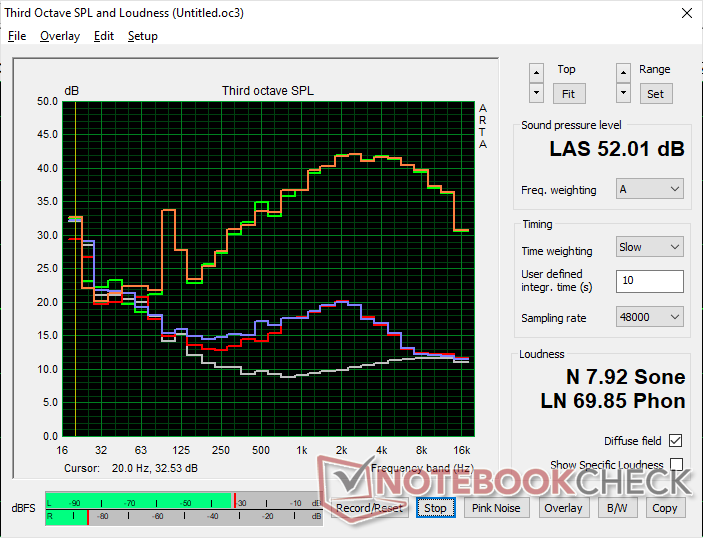
Lenovo ThinkPad Z16 Gen 2 analyse audio
(+) | les haut-parleurs peuvent jouer relativement fort (84.8# dB)
Basses 100 - 315 Hz
(±) | basse réduite - en moyenne 13% inférieure à la médiane
(±) | la linéarité des basses est moyenne (11.1% delta à la fréquence précédente)
Médiums 400 - 2000 Hz
(±) | médiane supérieure - en moyenne 5.5% supérieure à la médiane
(+) | les médiums sont linéaires (4.9% delta à la fréquence précédente)
Aiguës 2 - 16 kHz
(+) | des sommets équilibrés - à seulement 4.7% de la médiane
(+) | les aigus sont linéaires (5.2% delta à la fréquence précédente)
Globalement 100 - 16 000 Hz
(+) | le son global est linéaire (14.8% différence à la médiane)
Par rapport à la même classe
» 35% de tous les appareils testés de cette catégorie étaient meilleurs, 4% similaires, 61% pires
» Le meilleur avait un delta de 5%, la moyenne était de 17%, le pire était de 45%.
Par rapport à tous les appareils testés
» 20% de tous les appareils testés étaient meilleurs, 4% similaires, 76% pires
» Le meilleur avait un delta de 4%, la moyenne était de 24%, le pire était de 134%.
Apple MacBook Pro 16 2021 M1 Pro analyse audio
(+) | les haut-parleurs peuvent jouer relativement fort (84.7# dB)
Basses 100 - 315 Hz
(+) | bonne basse - seulement 3.8% loin de la médiane
(+) | les basses sont linéaires (5.2% delta à la fréquence précédente)
Médiums 400 - 2000 Hz
(+) | médiane équilibrée - seulement 1.3% de la médiane
(+) | les médiums sont linéaires (2.1% delta à la fréquence précédente)
Aiguës 2 - 16 kHz
(+) | des sommets équilibrés - à seulement 1.9% de la médiane
(+) | les aigus sont linéaires (2.7% delta à la fréquence précédente)
Globalement 100 - 16 000 Hz
(+) | le son global est linéaire (4.6% différence à la médiane)
Par rapport à la même classe
» 0% de tous les appareils testés de cette catégorie étaient meilleurs, 0% similaires, 100% pires
» Le meilleur avait un delta de 5%, la moyenne était de 17%, le pire était de 45%.
Par rapport à tous les appareils testés
» 0% de tous les appareils testés étaient meilleurs, 0% similaires, 100% pires
» Le meilleur avait un delta de 4%, la moyenne était de 24%, le pire était de 134%.
Gestion de l'énergie
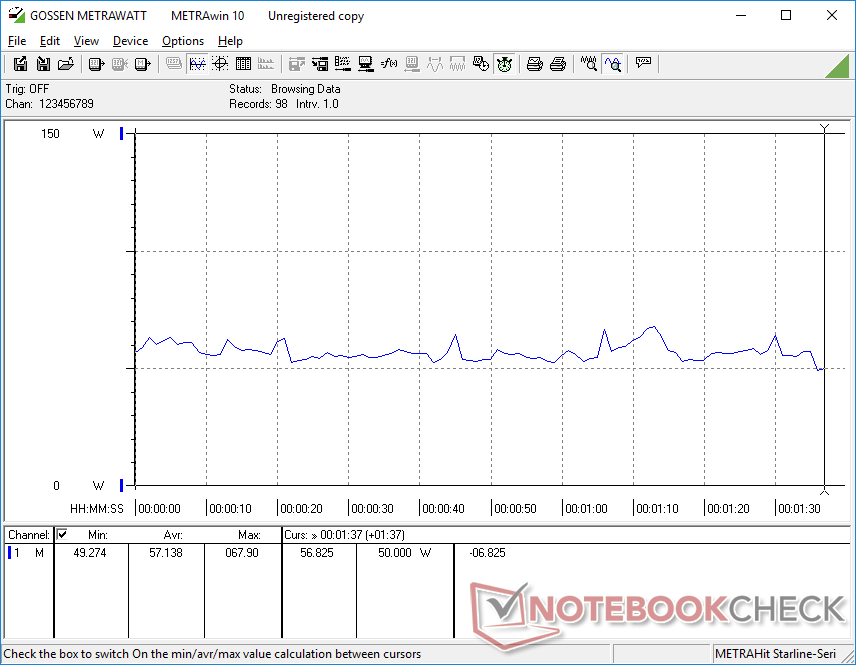
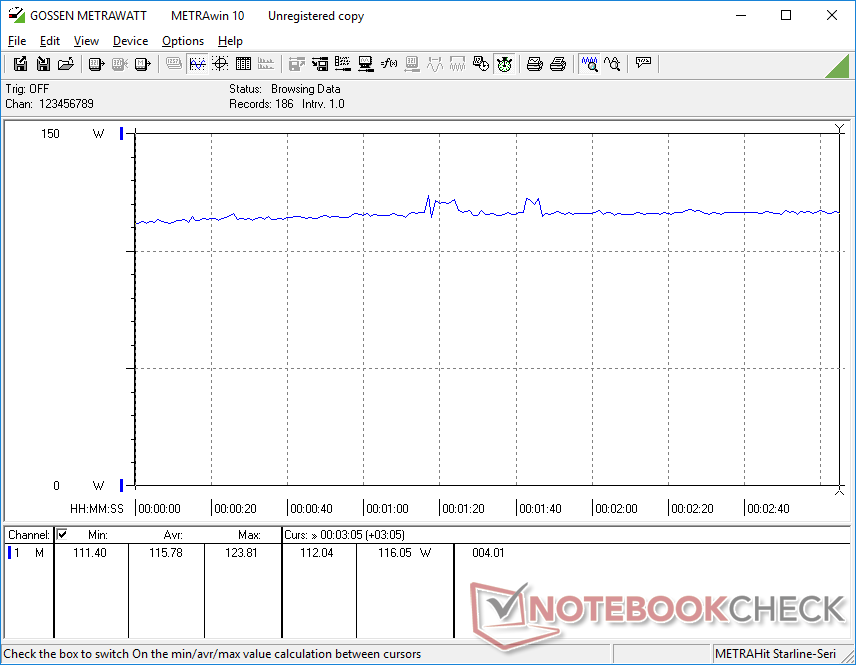
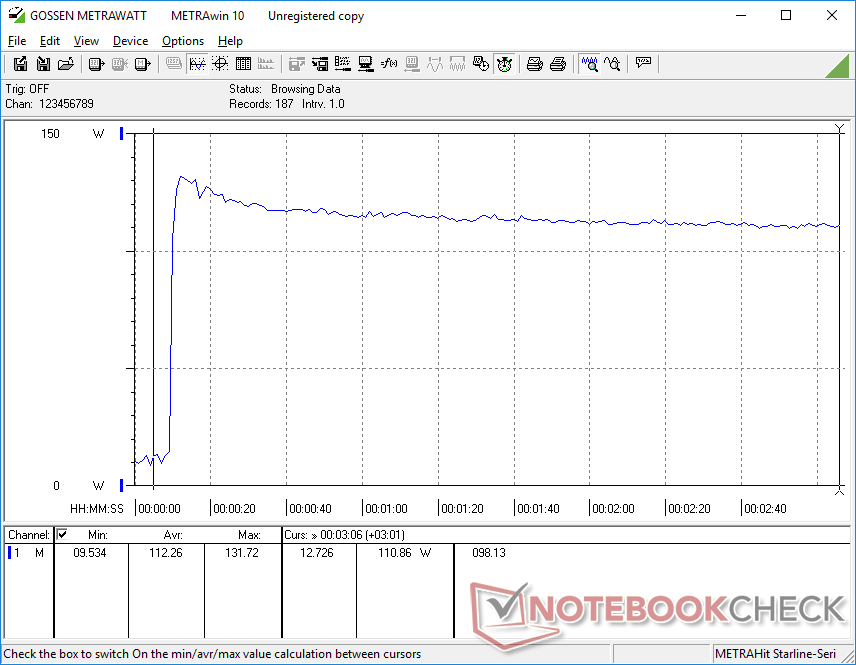
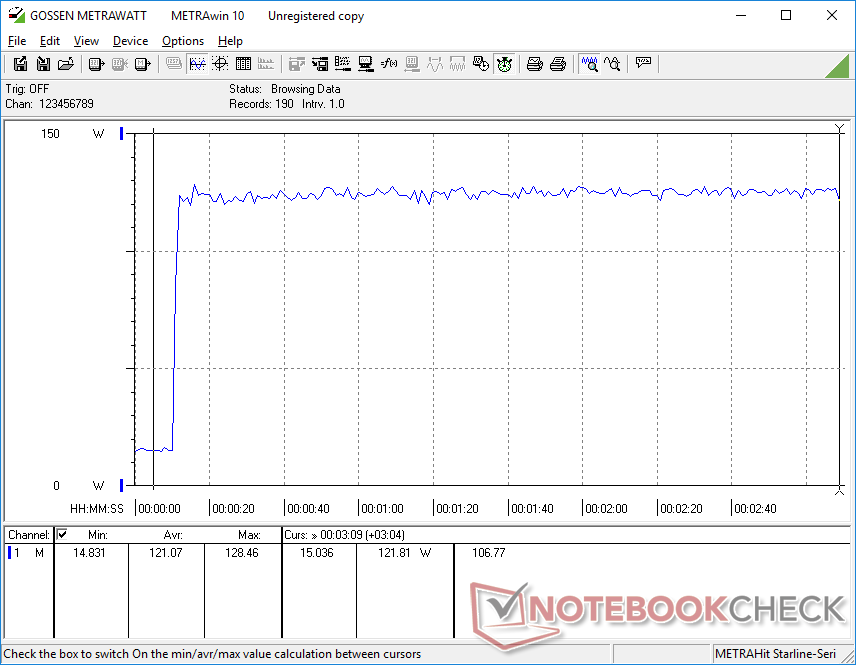
Consommation électrique
Le panneau OLED 4K a un impact considérable sur la consommation d'énergie. Par exemple, la consommation d'énergie n'est que de 7 W en mode veille sur un écran entièrement noir, alors qu'un écran entièrement blanc à la luminosité maximale peut nécessiter près de 19 W, contre seulement 10 W pour la configuration IPS. Les différences de consommation d'énergie entre l'IPS et l'OLED sont examinées plus en détail ici.
La consommation lors de l'exécution de tâches intensives du CPU ou du GPU est légèrement supérieure à celle du ThinkPad Z16 Gen 1Test du Lenovo ThinkPad Z16 G1 : l'ordinateur phare d'AMD, mais avec un petit problème , même en tenant compte du fait que l'écran OLED est plus exigeant. Cependant, les différences sont mineures par rapport à l'augmentation importante des performances offerte par le processeur Zen 4 Ryzen 9.
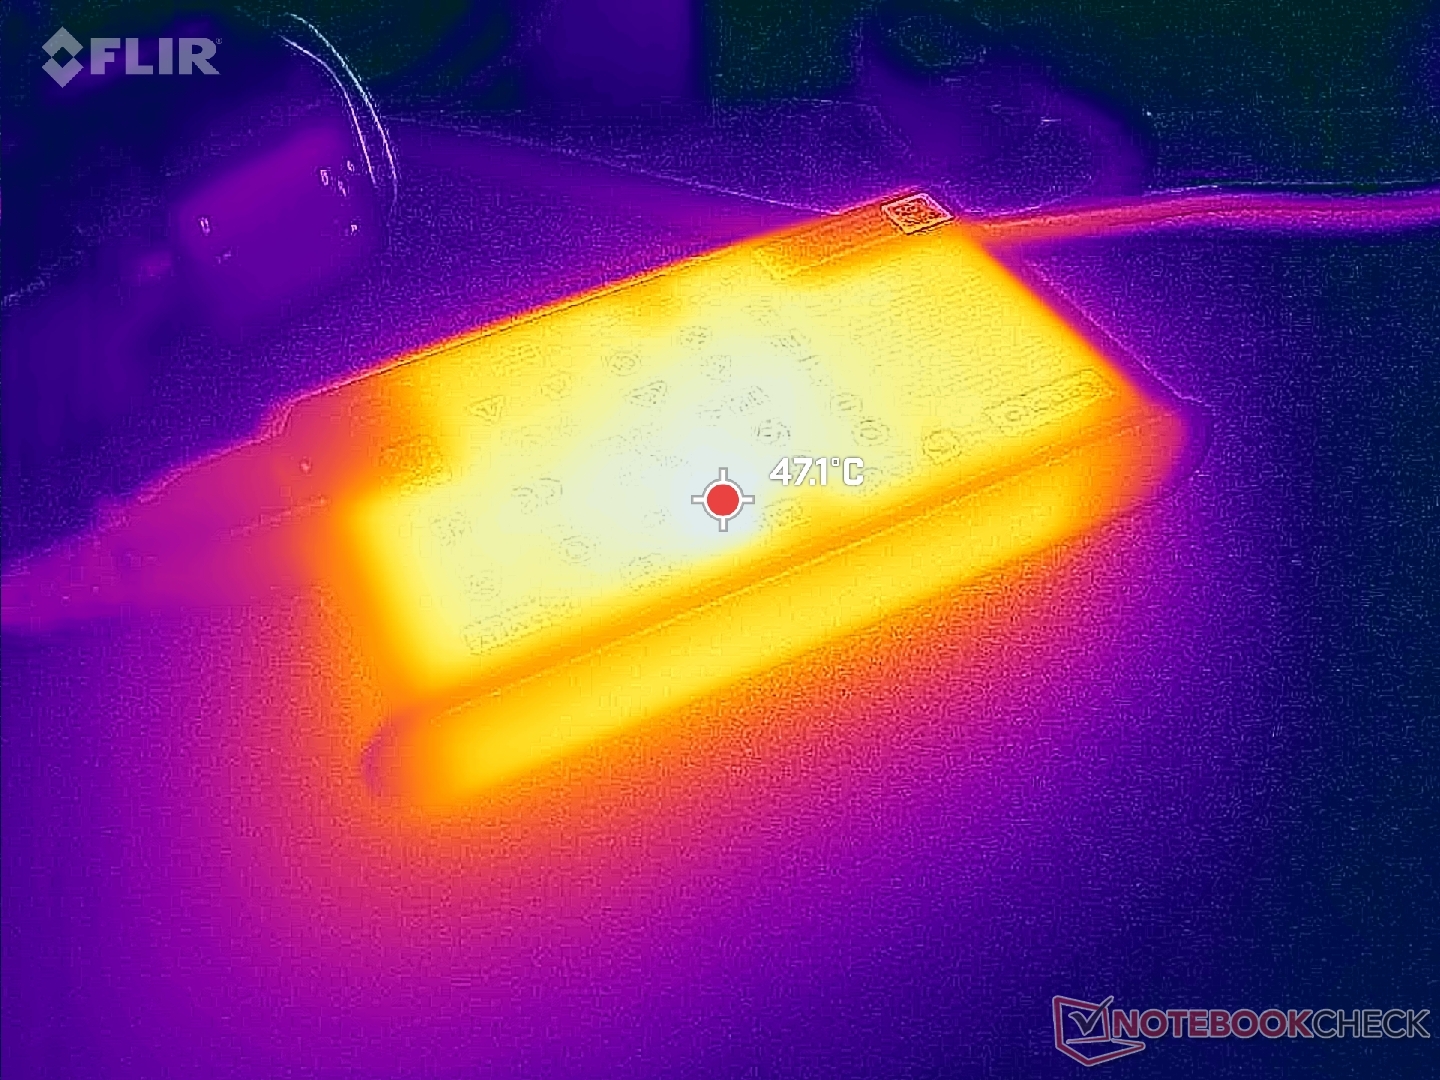
Nous sommes en mesure de mesurer une consommation maximale de 132 W à partir de l'adaptateur secteur USB-C 135 W de taille moyenne (~14,6 x 7,7 x 2,3 cm). Le jeu demande déjà près de 120 W, ce qui signifie que le taux de charge ralentira au maximum si vous exécutez des charges exigeantes simultanément.
| Éteint/en veille | |
| Au repos | |
| Fortement sollicité |
|
Légende:
min: | |
| Lenovo ThinkPad Z16 Gen 2 R9 PRO 7940HS, Radeon RX 6550M, Kioxia XG8 KXG8AZNV1T02, OLED, 3840x2400, 16" | Lenovo ThinkPad Z16 G1 21D5S00T00 R7 PRO 6850H, Radeon RX 6500M, Samsung PM9A1 MZVL21T0HCLR, IPS LED, 1920x1200, 16" | Lenovo ThinkBook 16 G6 ABP R5 7530U, Vega 7, SK hynix HFS512GEJ9X125N, IPS, 1920x1200, 16" | MSI Creator Z16P B12UHST i9-12900H, GeForce RTX 3080 Ti Laptop GPU, Samsung PM9A1 MZVL22T0HBLB, IPS True Pixel (~100% DCI-P3), 2560x1600, 16" | Asus Vivobook Pro 16X K6604JV-MX016W i9-13980HX, GeForce RTX 4060 Laptop GPU, Solidigm P41 Plus SSDPFKNU010TZ, OLED, 3200x2000, 16" | Apple MacBook Pro 16 2023 M3 Max Apple M3 Max 16-Core, M3 Max 40-Core GPU, Apple SSD AP8192Z, Mini-LED, 3456x2234, 16" | |
|---|---|---|---|---|---|---|
| Power Consumption | 15% | 45% | -60% | -71% | -17% | |
| Idle Minimum * (Watt) | 7.5 | 5.3 29% | 3.7 51% | 11 -47% | 13.8 -84% | 5.2 31% |
| Idle Average * (Watt) | 9.6 | 8.6 10% | 7.1 26% | 17 -77% | 16 -67% | 16.9 -76% |
| Idle Maximum * (Watt) | 18.5 | 9.5 49% | 7.7 58% | 26 -41% | 19 -3% | 17.2 7% |
| Load Average * (Watt) | 57.1 | 65.2 -14% | 43.9 23% | 124 -117% | 147 -157% | 90.5 -58% |
| Witcher 3 ultra * (Watt) | 115.8 | 93.6 19% | 40.8 65% | 133.5 -15% | 147.8 -28% | 109 6% |
| Load Maximum * (Watt) | 131.7 | 133.81 -2% | 66.6 49% | 212 -61% | 244 -85% | 145.2 -10% |
* ... Moindre est la valeur, meilleures sont les performances
Power Consumption Witcher 3 / Stresstest
Power Consumption external Monitor
Autonomie de la batterie
Les durées d'exécution sont généralement plus courtes que sur le modèle de l'année dernière, en grande partie à cause de notre panneau OLED plus exigeant. Comme la plupart des pages web sont essentiellement blanches, la consommation d'énergie peut être supérieure de 10 W, même si les applications actives sont peu exigeantes, comme indiqué dans la section Consommation d'énergie ci-dessus. Nous n'avons pu enregistrer qu'une autonomie de 6 heures pour le WLAN, contre 10 heures pour le ThinkPad Z16 IPS et plus de 16 heures pour le MacBook Pro 16.
La charge de la batterie vide à la batterie pleine est plus lente que d'habitude, environ 2,5 heures contre 1,5 à 2 heures sur la plupart des Ultrabooks. C'est l'un des rares ordinateurs portables équipés de Ryzen 9 et d'une carte graphique discrète à être alimenté par USB-C.
| Lenovo ThinkPad Z16 Gen 2 R9 PRO 7940HS, Radeon RX 6550M, 72 Wh | Lenovo ThinkPad Z16 G1 21D5S00T00 R7 PRO 6850H, Radeon RX 6500M, 72 Wh | Lenovo ThinkBook 16 G6 ABP R5 7530U, Vega 7, 45 Wh | MSI Creator Z16P B12UHST i9-12900H, GeForce RTX 3080 Ti Laptop GPU, 90 Wh | Asus Vivobook Pro 16X K6604JV-MX016W i9-13980HX, GeForce RTX 4060 Laptop GPU, 90 Wh | Apple MacBook Pro 16 2023 M3 Max Apple M3 Max 16-Core, M3 Max 40-Core GPU, 99.6 Wh | |
|---|---|---|---|---|---|---|
| Autonomie de la batterie | 45% | 68% | -27% | -2% | 75% | |
| Reader / Idle (h) | 10.2 | |||||
| WiFi v1.3 (h) | 6 | 9.9 65% | 10.1 68% | 5.2 -13% | 6.5 8% | 16.7 178% |
| Load (h) | 1.7 | 2.1 24% | 1 -41% | 1.5 -12% | 1.2 -29% | |
| H.264 (h) | 11.9 | 11.6 | 5.8 | 5.3 | 20.4 |
Points positifs
Points négatifs
Verdict - Un design remarquable freiné par un GPU médiocre
Dans notre revue du modèle original Gen 1, nous avons fait l'éloge du ThinkPad Z16 pour sa construction robuste et attrayante, ainsi que pour son clavier et son trackpad confortables. Le modèle Gen 2 conserve tous ces avantages tout en ajoutant un processeur Ryzen Pro beaucoup plus rapide et un écran tactile OLED de haute qualité pour des performances et des couleurs nettement meilleures, respectivement. Ces deux ajouts sont les principales raisons de choisir la version Gen 2 plutôt que la Gen 1.
Le ThinkPad Z16 Gen 2 est définitivement élégant et sexy et le nouveau processeur Zen 4 Pro n'est pas en reste. La Radeon RX 6550M, cependant, est trop peu et trop tard, surtout dans cette gamme de prix.
La nouvelle Radeon RX 6550M AMD Radeon RX 6550M permet également de distinguer les deux versions du modèle, mais ses performances ne sont pas impressionnantes, surtout si l'on tient compte du prix élevé de plus de 1600 $. Non seulement le GPU est d'une architecture AMD plus ancienne, mais les ordinateurs portables avec la GeForce RTX 3050 Ti peuvent être trouvés pour moins de mille dollars tout en offrant un niveau de performance similaire. Le GPU Radeon est certainement l'un des aspects les plus faibles de la série ThinkPad Z16 jusqu'à présent.
Si vous n'aimez pas les Ryzen Pro, vous pouvez opter pour l'Asus Vivobook Pro 16X
Asus Vivobook Pro 16X ou même le HP Spectre x360 16 peuvent constituer d'excellentes alternatives au ThinkPad Z16 Gen 2, car ils offrent tous deux des options OLED et graphiques discrètes similaires dans des châssis minces. Espérons que les futures révisions de Lenovo incluront soit GeForce RTX, soit des options RDNA3 plus récentes.Prix et disponibilité
Lenovo livre maintenant le ThinkPad Z16 Gen 2 à partir de $1600 USD pour la configuration Ryzen 5, GPU intégré, et 1200p IPS jusqu'à plus de $2600 pour la version revue.
Lenovo ThinkPad Z16 Gen 2
- 12/16/2023 v7 (old)
Allen Ngo
Transparency
La sélection des appareils à examiner est effectuée par notre équipe éditoriale. L'échantillon de test a été prêté à l'auteur par le fabricant ou le détaillant pour les besoins de cet examen. Le prêteur n'a pas eu d'influence sur cette évaluation et le fabricant n'a pas reçu de copie de cette évaluation avant sa publication. Il n'y avait aucune obligation de publier cet article. En tant que média indépendant, Notebookcheck n'est pas soumis à l'autorité des fabricants, des détaillants ou des éditeurs.
Voici comment Notebookcheck teste
Chaque année, Notebookcheck examine de manière indépendante des centaines d'ordinateurs portables et de smartphones en utilisant des procédures standardisées afin de garantir que tous les résultats sont comparables. Nous avons continuellement développé nos méthodes de test depuis environ 20 ans et avons établi des normes industrielles dans le processus. Dans nos laboratoires de test, des équipements de mesure de haute qualité sont utilisés par des techniciens et des rédacteurs expérimentés. Ces tests impliquent un processus de validation en plusieurs étapes. Notre système d'évaluation complexe repose sur des centaines de mesures et de points de référence bien fondés, ce qui garantit l'objectivité.Price comparison

