

Verdict - Le XMG Fusion 16 avec OLED vaut la peine d'être considéré
Avec le Fusion 16, XMG propose une version légèrement plus puissante du célèbre Core 16. La caractéristique principale est le nouveau panneau OLED, qui offre une qualité d'image exceptionnelle et des images nettement plus éclatantes que la version IPS. Seule la luminosité HDR pourrait être un peu plus élevée. Cela dit, la dalle IPS avec un taux de rafraîchissement de 300 Hz reste une alternative solide et ne souffre pas de problèmes de PWM.
Le processeur Intel HX, plus rapide, offre des performances brutes nettement supérieures, mais son impact sur les jeux est limité. Dans l'ensemble, les ventilateurs restent un peu plus silencieux que ceux de la concurrence, et XMG offre un plus grand contrôle sur les options de configuration, y compris jusqu'à 128 Go de RAM et 16 To de stockage SSD.
Dans l'ensemble, le nouveau XMG Fusion 16 est très solide, et l'écran OLED vaut la peine d'être choisi si vous souhaitez obtenir la meilleure qualité d'image possible. L'autonomie de la batterie reste pratiquement inchangée. Toutefois, si vous préférez un écran IPS, le Core 16, plus abordable, est également une bonne option, car les performances de jeu avec le processeur AMD ne sont que légèrement inférieures.
Points positifs
Points négatifs
Prix et disponibilité
Le Fusion 16 peut être commandé directement auprès de XMG à partir de 1 899 euros. Notre configuration de test, qui comprend de nombreuses améliorations, coûte actuellement environ 2 700 euros.
Note du traducteur : les ordinateurs portables XMG ne sont pas officiellement disponibles en Amérique du Nord.
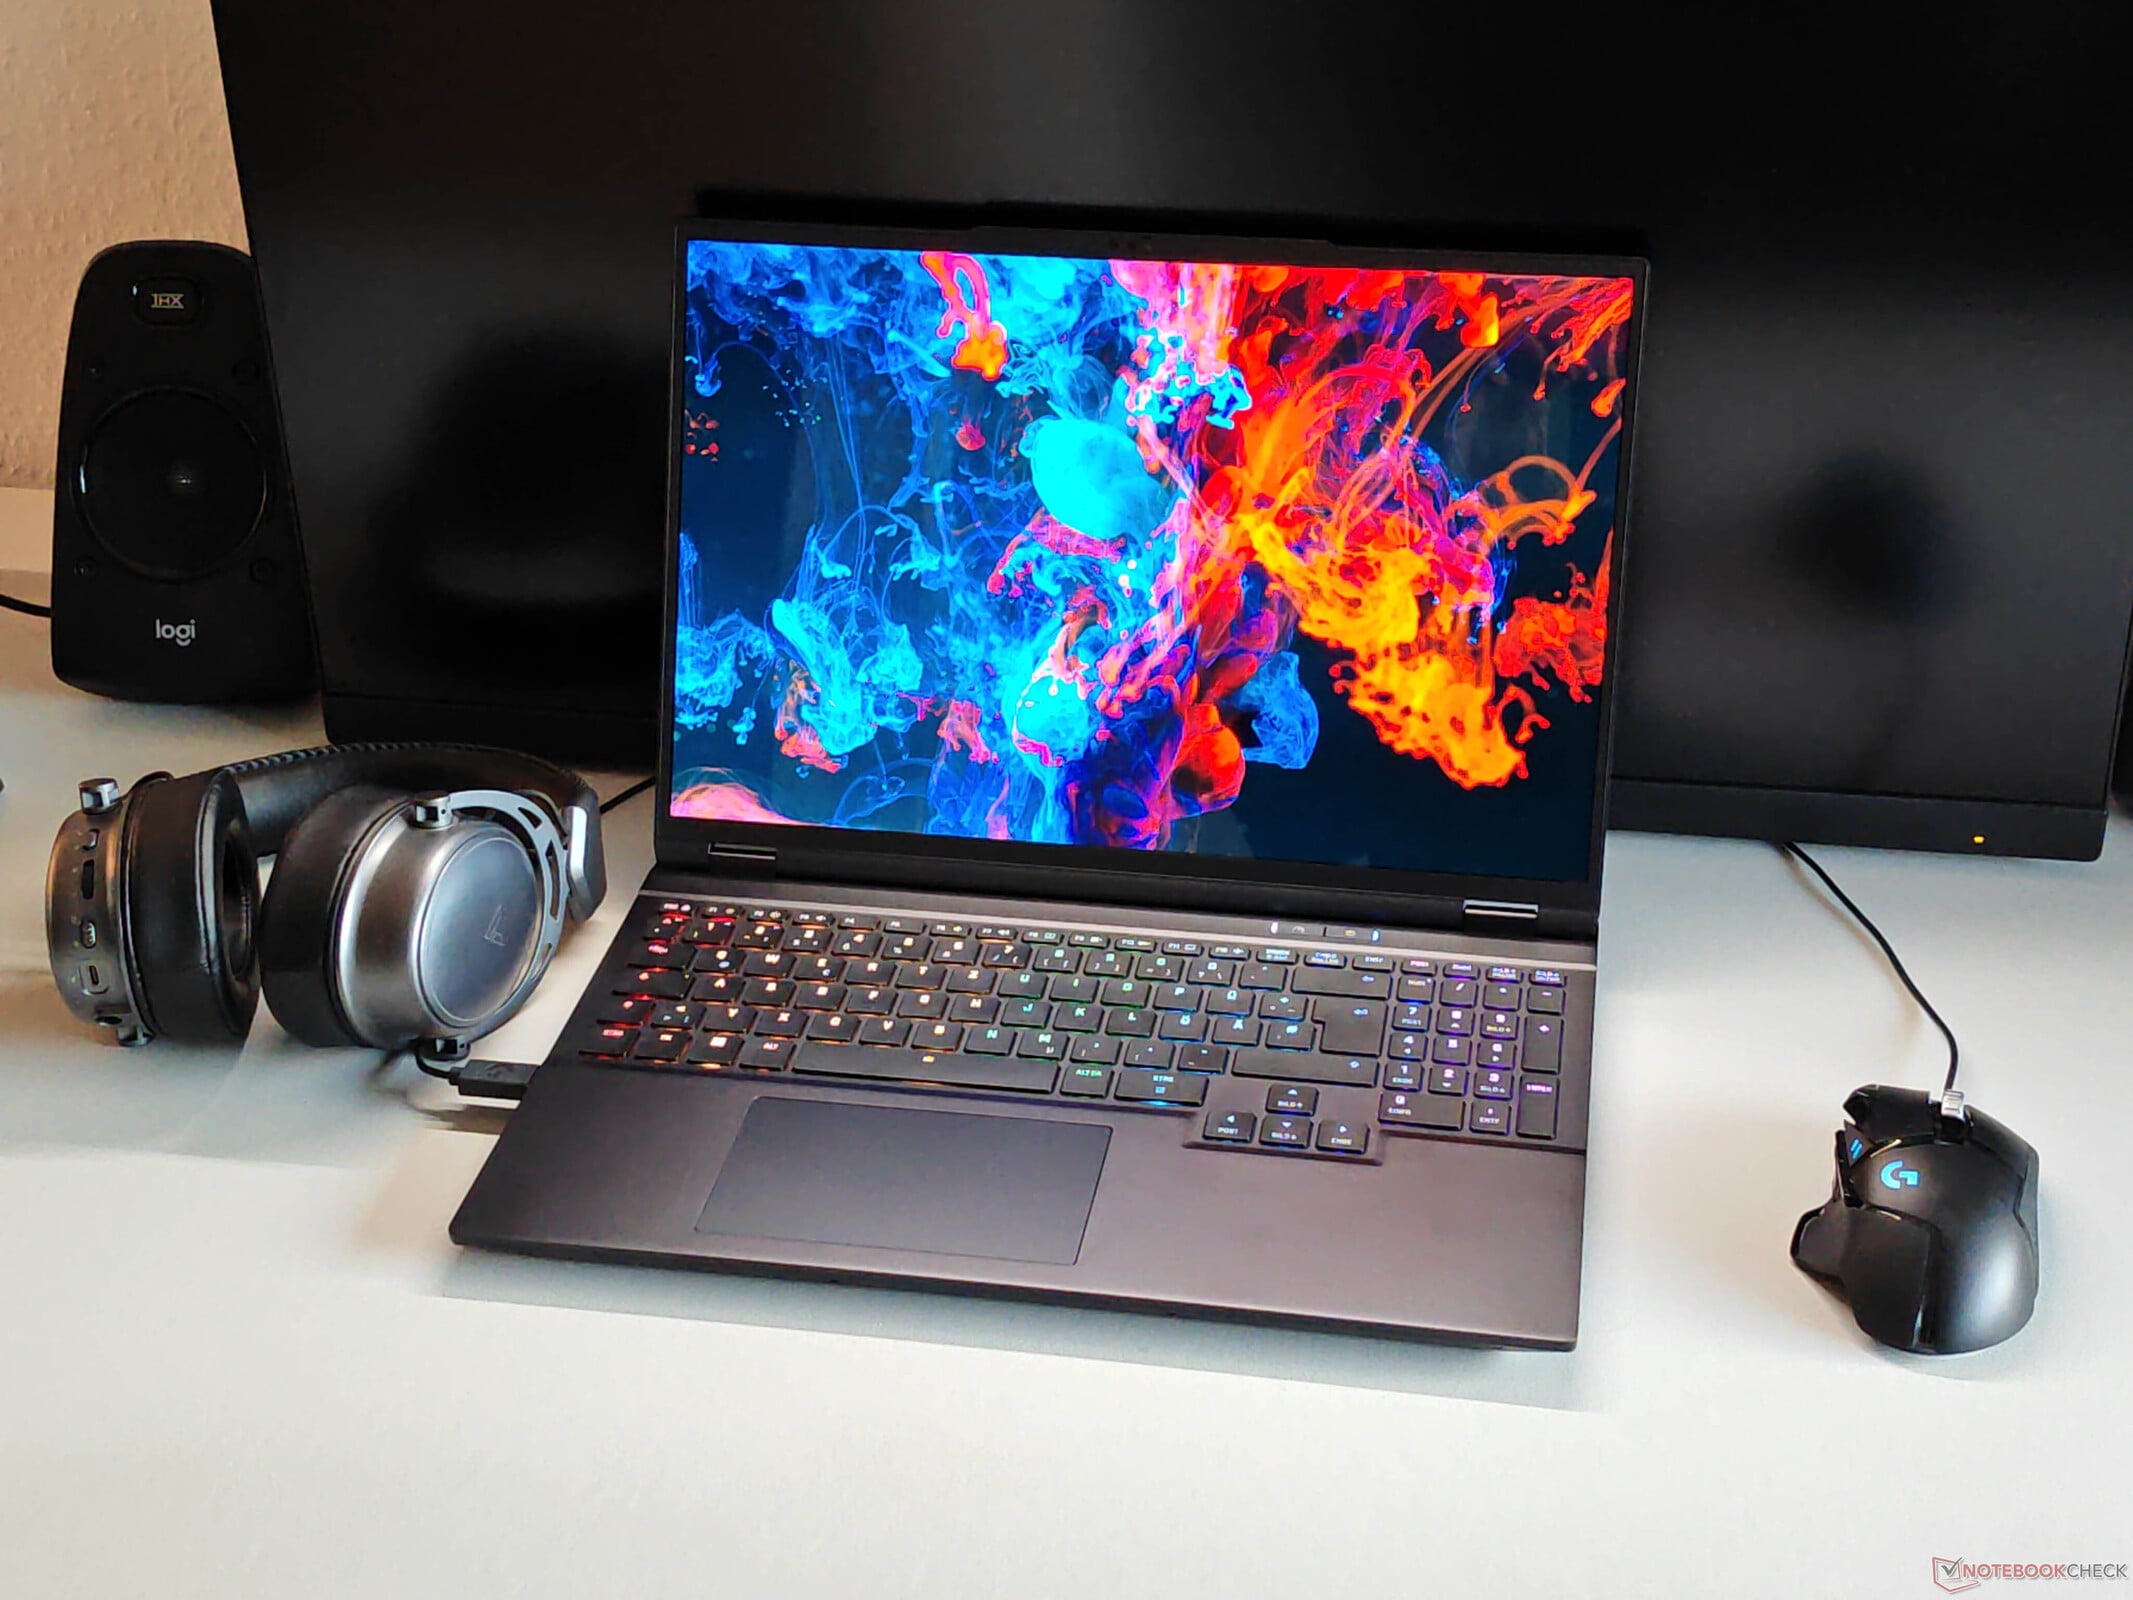
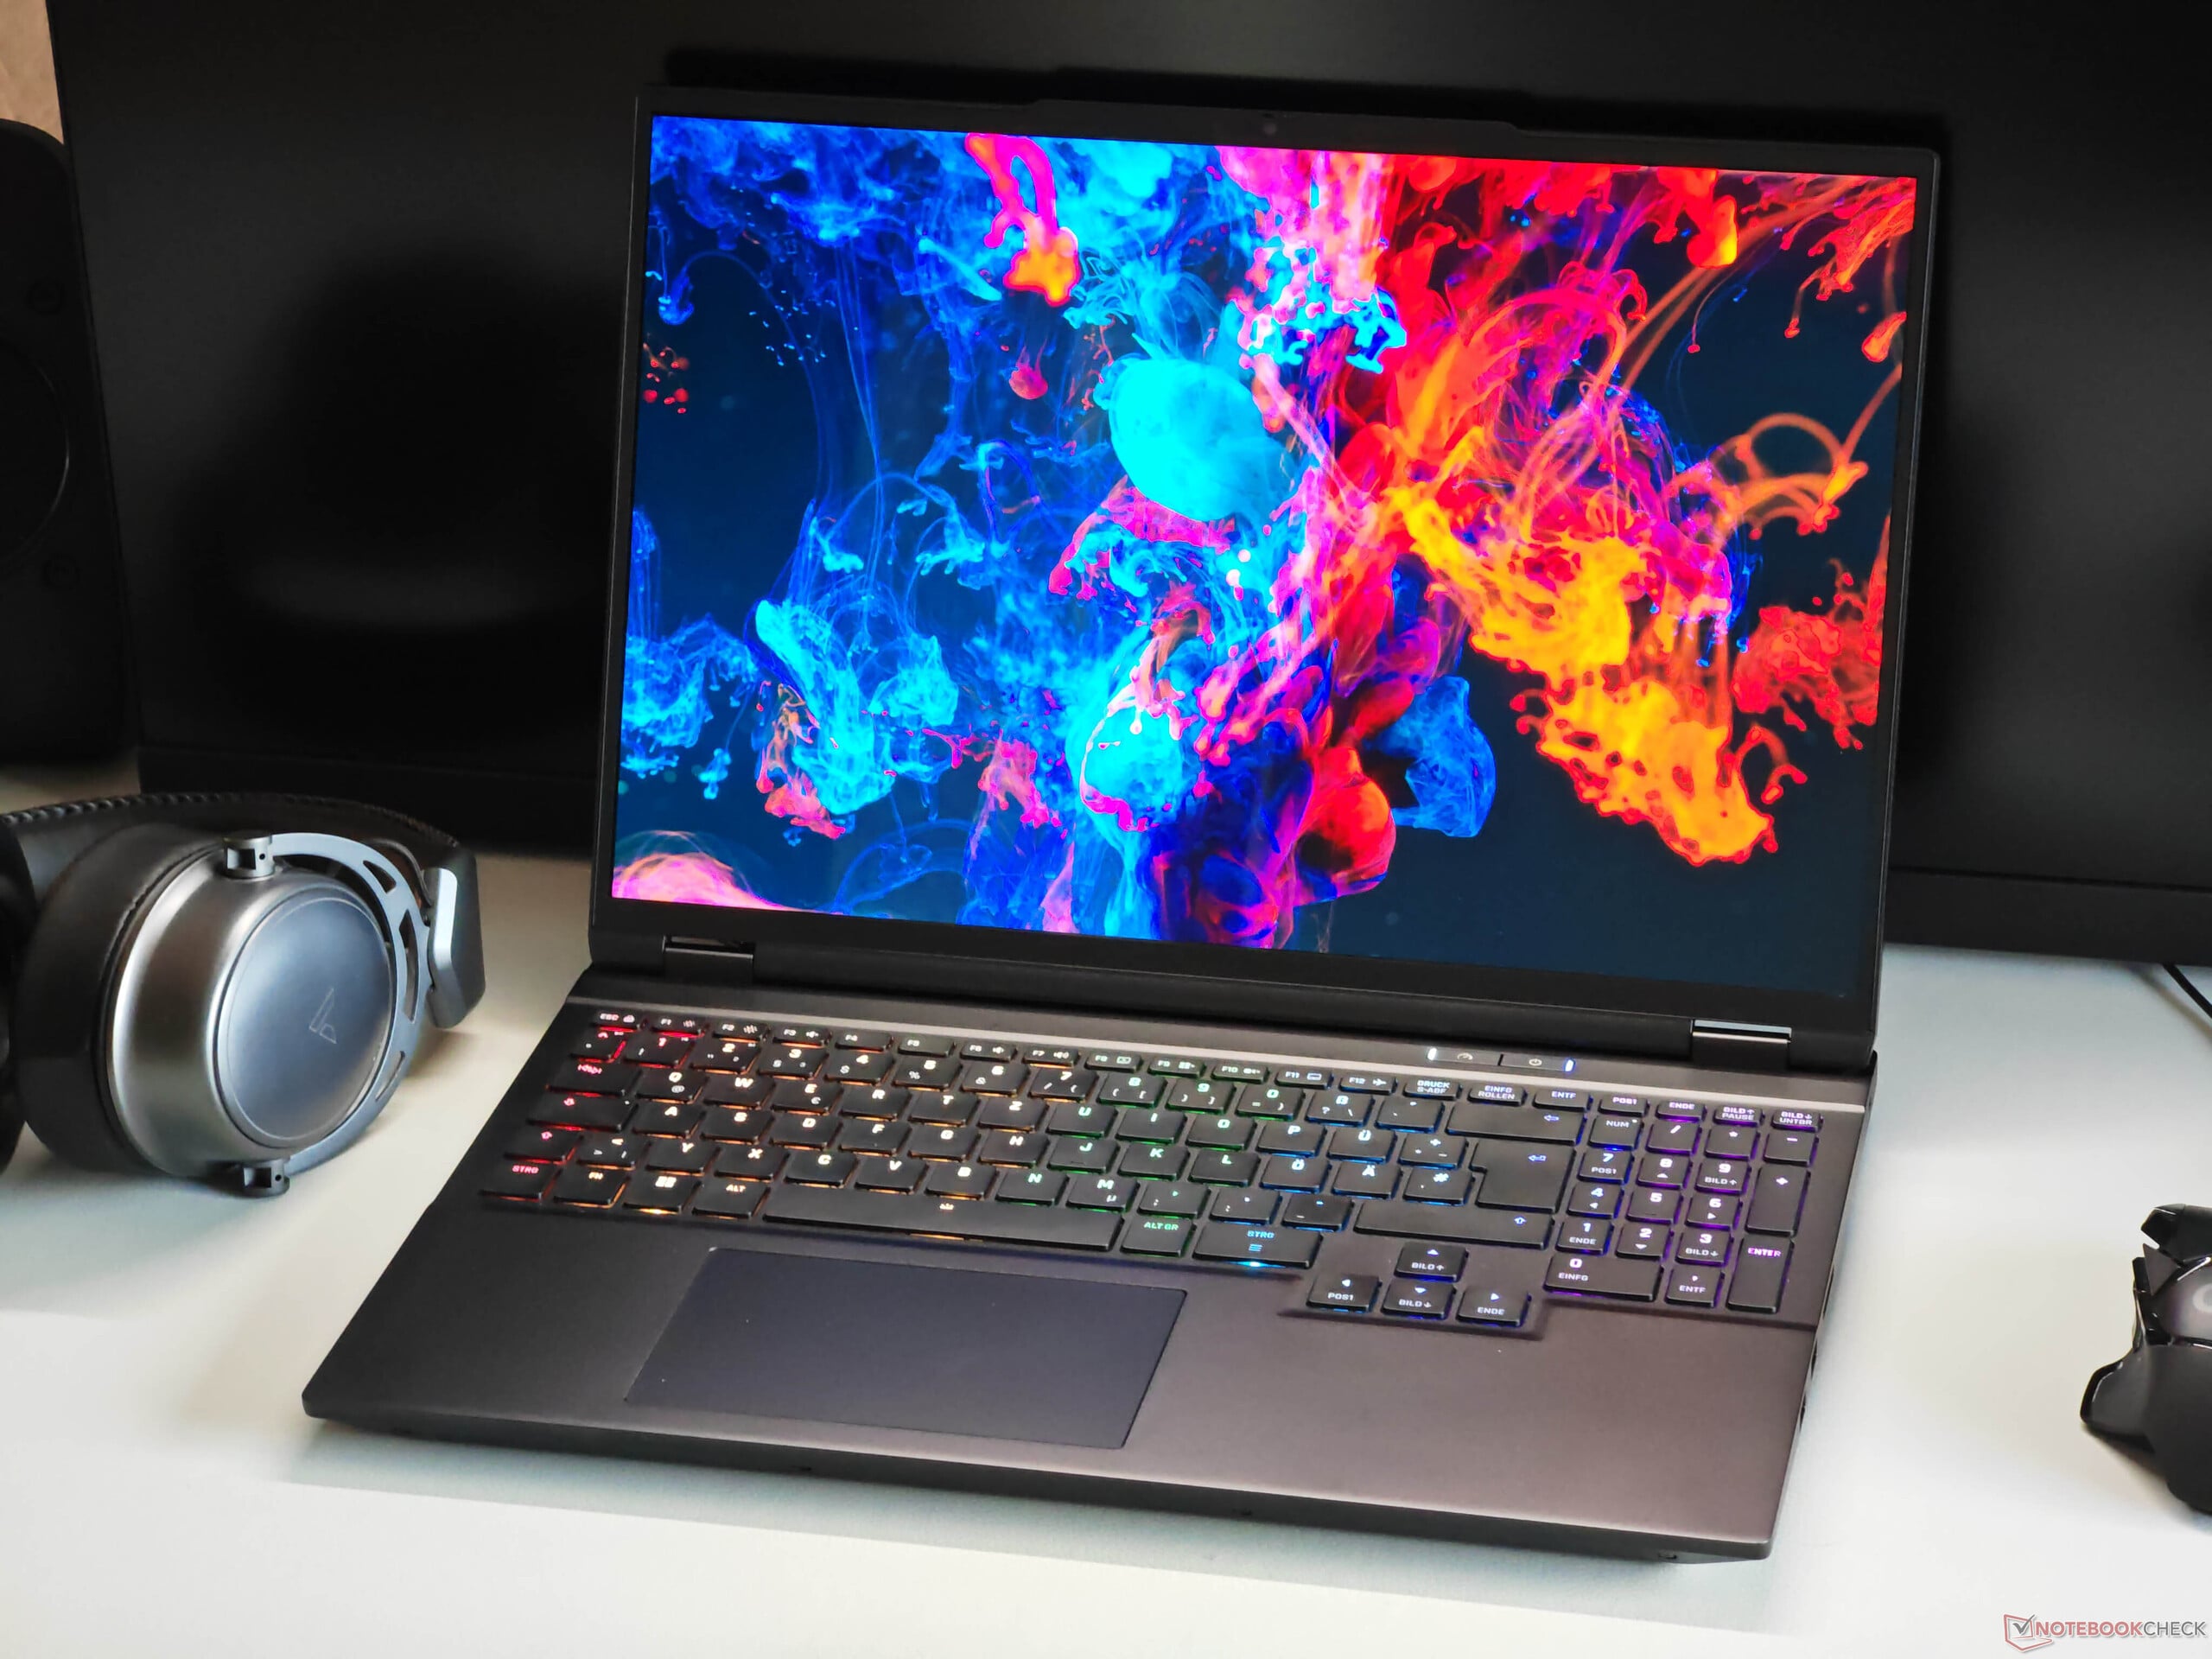
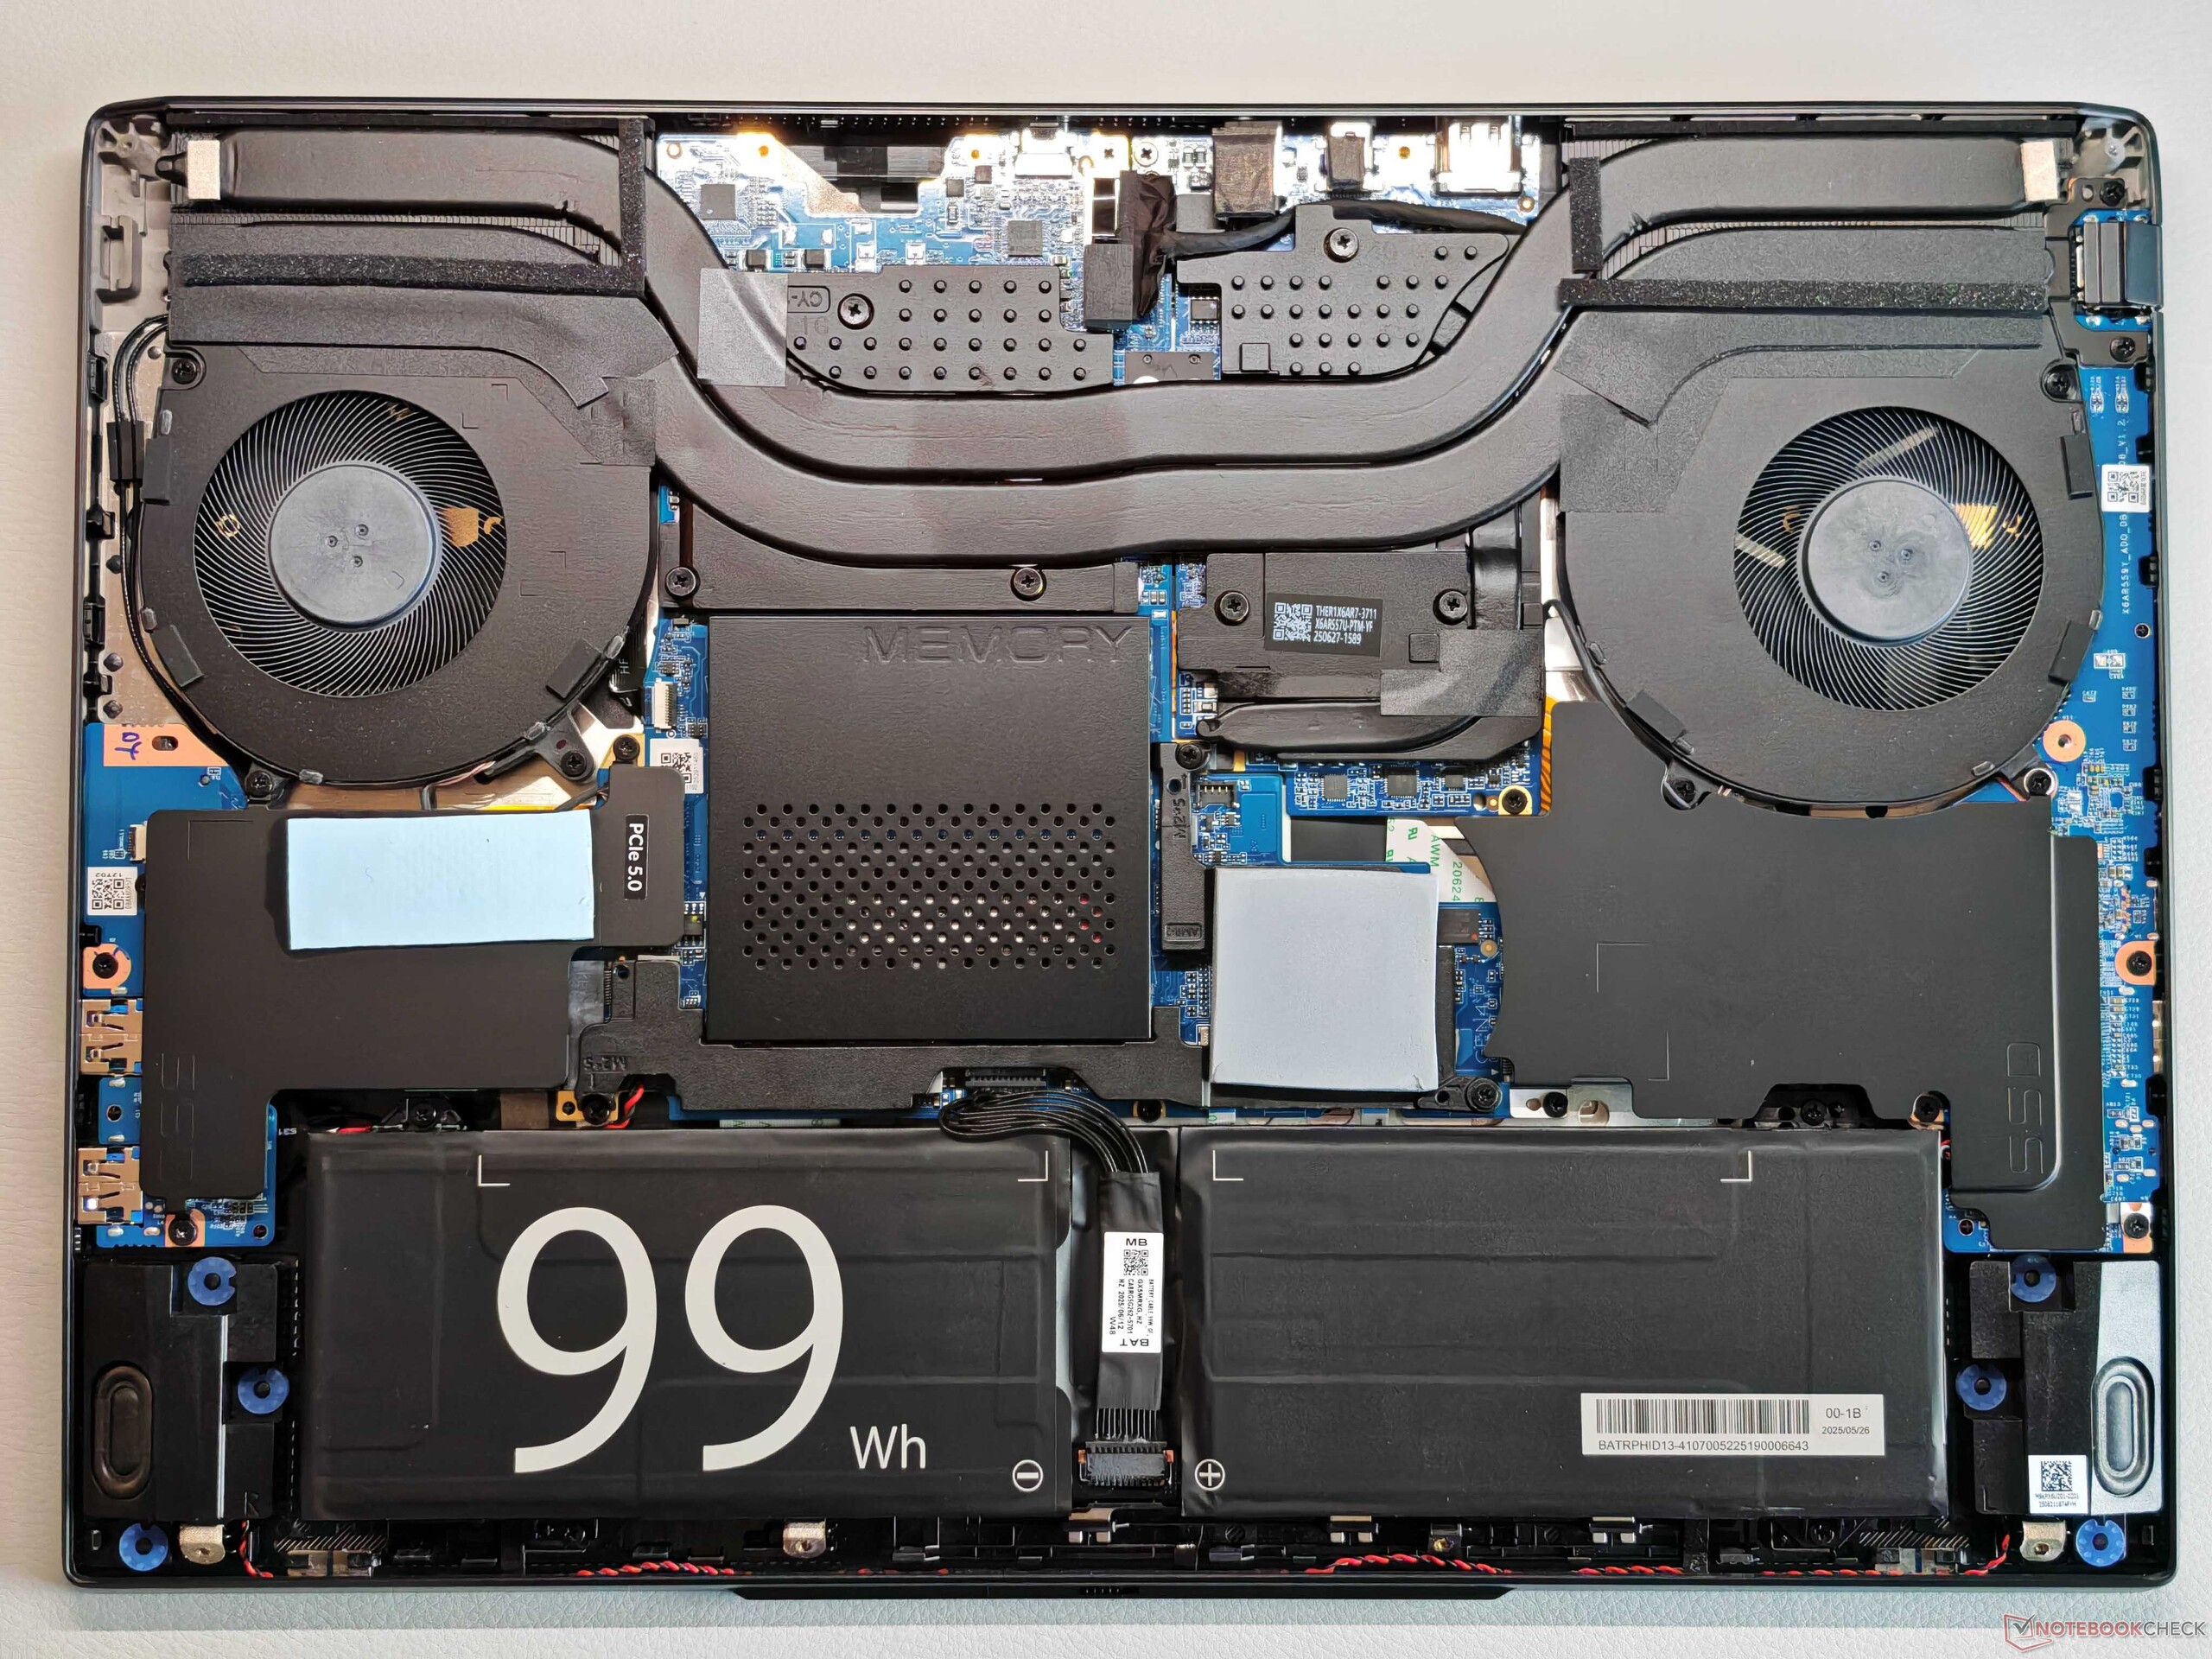
Le Fusion 16 est le premier ordinateur portable de jeu de XMG doté d'une dalle OLED. Le châssis est déjà familier de l'actuel XMG Core 16 (AMD Ryzen avec IPS), mais le Fusion 16 est propulsé par le très performant Intel Core Ultra 9 275HX, le familier GPU GeForce RTX 5070 Laptop, et un nouvel écran OLED 120 Hz.
Spécifications
Mallette et équipement
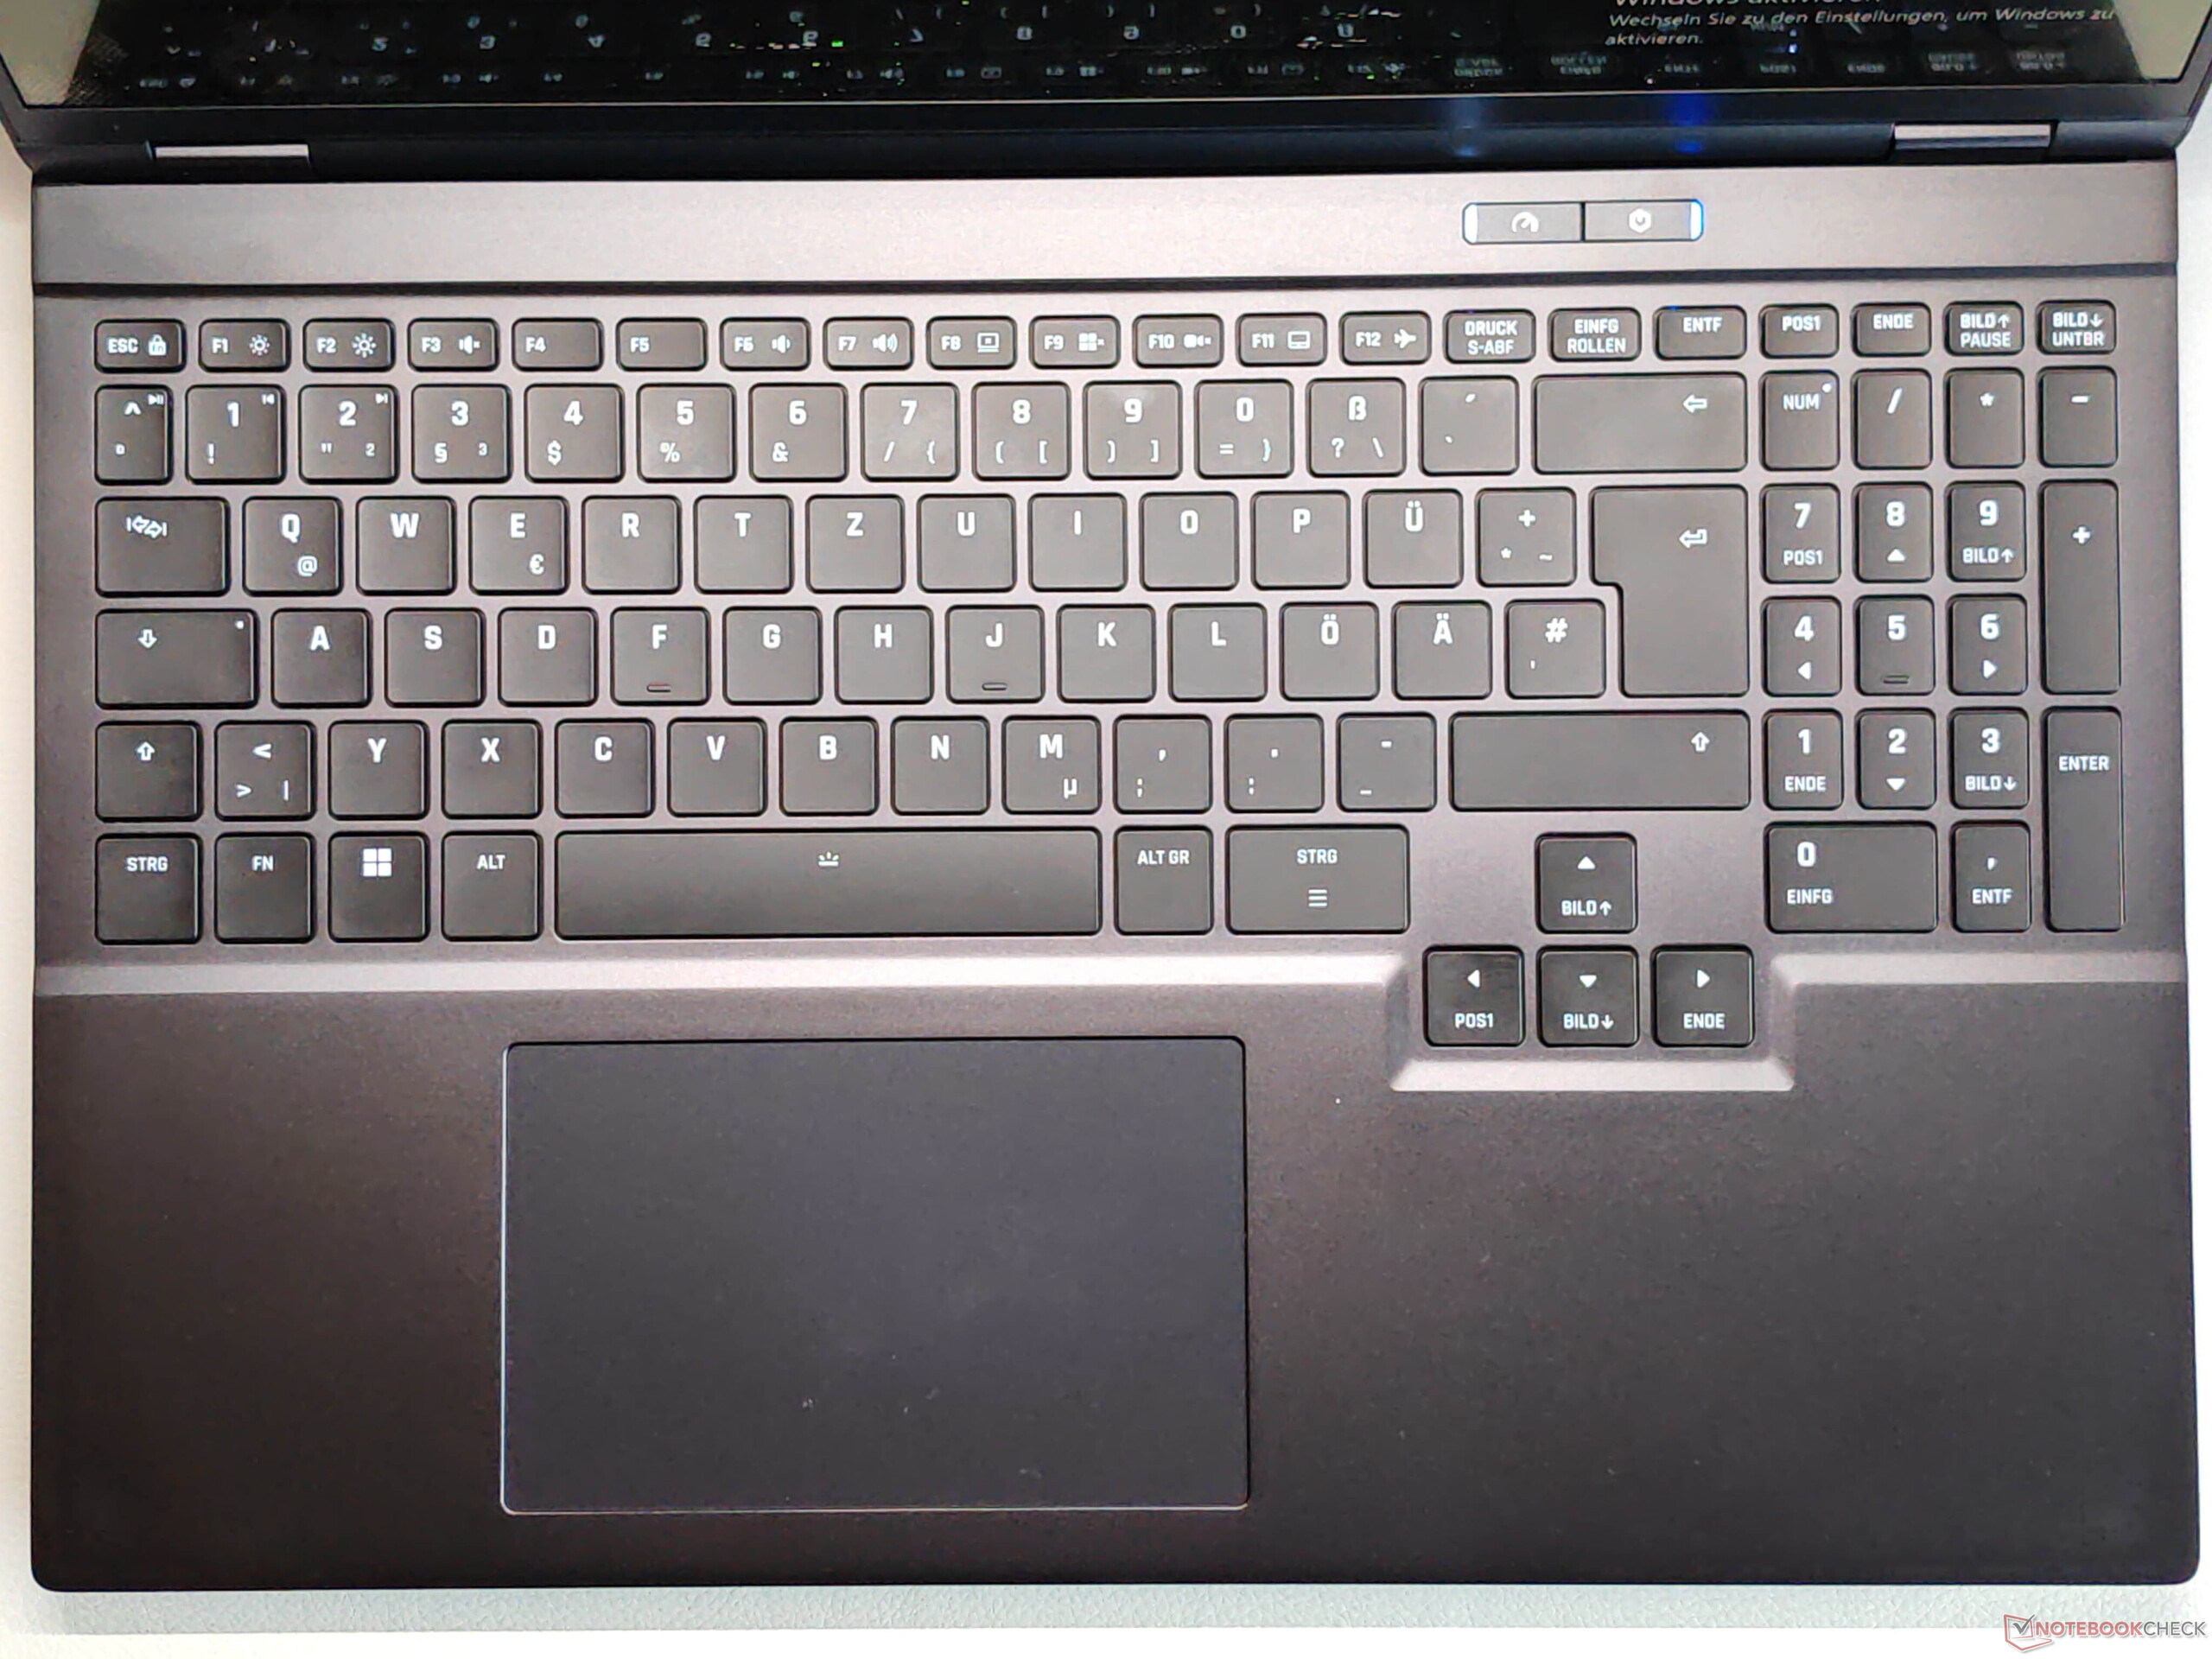
Il n'y a pas de différences dans le boîtier et les périphériques d'entrée par rapport à la version déjà testée du XMG Core 16la nouvelle version OLED est seulement quelques grammes plus légère que le modèle IPS. Cependant, les caractéristiques du nouveau Fusion 16 sont légèrement meilleures, puisqu'un port Thunderbolt 4 est également disponible en plus d'un module Wi-Fi 7.


| SD Card Reader | |
| average JPG Copy Test (av. of 3 runs) | |
| Aorus Elite 16 AE6H (AV PRO microSD 128 GB V60) | |
| Schenker XMG Core 16 M25 (Angelbird AV Pro V60) | |
| Moyenne de la classe Gaming (20 - 210, n=70, 2 dernières années) | |
| Schenker XMG Fusion 16 M25 (Angelbird AV Pro V60) | |
| maximum AS SSD Seq Read Test (1GB) | |
| Schenker XMG Core 16 M25 (Angelbird AV Pro V60) | |
| Aorus Elite 16 AE6H (AV PRO microSD 128 GB V60) | |
| Moyenne de la classe Gaming (25.5 - 261, n=66, 2 dernières années) | |
| Schenker XMG Fusion 16 M25 (Angelbird AV Pro V60) | |
| Networking | |
| Schenker XMG Fusion 16 M25 | |
| iperf3 transmit AXE11000 | |
| iperf3 receive AXE11000 | |
| Lenovo Legion Pro 5 16IAX10, RTX 5070 | |
| iperf3 transmit AXE11000 | |
| iperf3 receive AXE11000 | |
| iperf3 transmit AXE11000 6GHz | |
| Schenker XMG Core 16 M25 | |
| iperf3 transmit AXE11000 | |
| iperf3 receive AXE11000 | |
| Asus TUF Gaming A16 FA608UP | |
| iperf3 transmit AXE11000 | |
| iperf3 receive AXE11000 | |
| MSI Crosshair 16 HX AI D2XWGKG | |
| iperf3 transmit AXE11000 | |
| iperf3 receive AXE11000 | |
| iperf3 transmit AXE11000 6GHz | |
| iperf3 receive AXE11000 6GHz | |
| Aorus Elite 16 AE6H | |
| iperf3 transmit AXE11000 | |
| iperf3 receive AXE11000 | |
| Gigabyte Gaming A16 GA6H | |
| iperf3 transmit AXE11000 | |
| iperf3 receive AXE11000 | |


Affichage - OLED 120 Hz
Le Fusion 16 est disponible avec l'écran IPS (300 Hz) du modèle Core 16 soit avec le nouvel écran OLED de Samsung (2 880 × 1 800 pixels, 16:10, 120 Hz, supplément de 130 €). La qualité de l'image sur l'écran OLED brillant est excellente, avec des couleurs éclatantes, un contraste élevé et des temps de réponse extrêmement rapides. Cependant, un scintillement PWM est présent à 480 Hz, bien que l'amplitude soit relativement faible.
La luminosité moyenne en mode SDR est de 433 cd/m² (avec un niveau de noir de 0), tandis que la luminosité HDR atteint un peu moins de 500 cd/m². Une luminosité plus élevée aurait été souhaitable, en particulier en mode HDR. XMG fournit plusieurs profils calibrés en usine, mais aucun n'est totalement convaincant. Dans notre analyse à l'aide du logiciel professionnel CalMAN, le profil sRGB donne les meilleurs résultats. Avec notre propre étalonnage (le profil est disponible en téléchargement gratuit dans l'encadré ci-dessous), l'affichage peut être encore amélioré, ce qui rend l'écran adapté à l'édition d'images.
| |||||||||||||||||||||||||
Homogénéité de la luminosité: 99 %
Valeur mesurée au centre, sur batterie: 434 cd/m²
Contraste: ∞:1 (Valeurs des noirs: 0 cd/m²)
ΔE ColorChecker Calman: 3 | ∀{0.5-29.43 Ø4.78}
calibrated: 1.4
ΔE Greyscale Calman: 3.4 | ∀{0.09-98 Ø5}
93.3% AdobeRGB 1998 (Argyll 3D)
100% sRGB (Argyll 3D)
99.9% Display P3 (Argyll 3D)
Gamma: 2.47
CCT: 6452 K
| Schenker XMG Fusion 16 M25 ATNA60CL10_0, OLED, 2880x1800, 16", 120 Hz | Lenovo Legion Pro 5 16IAX10, RTX 5070 ATNA60HS01-0 (Samsung SDC420A), OLED, 2650x1600, 16", 165 Hz | Schenker XMG Core 16 M25 MNG007DA6-4, IPS, 2560x1600, 16", 300 Hz | Asus TUF Gaming A16 FA608UP MNG007DA5-3, IPS, 2560x1600, 16", 165 Hz | MSI Crosshair 16 HX AI D2XWGKG AUO B160QAN02.3, IPS, 2560x1600, 16", 240 Hz | Aorus Elite 16 AE6H NE160QDM-NYJ, IPS, 2560x1600, 16", 165 Hz | Gigabyte Gaming A16 GA6H NE160QDM-NYJ (BOE0C80), IPS, 2560x1600, 16", 165 Hz | |
|---|---|---|---|---|---|---|---|
| Display | 0% | -2% | -19% | -5% | -17% | -18% | |
| Display P3 Coverage (%) | 99.9 | 99.3 -1% | 98.8 -1% | 69.4 -31% | 95.5 -4% | 70.8 -29% | 69.4 -31% |
| sRGB Coverage (%) | 100 | 100 0% | 100 0% | 97.2 -3% | 99.7 0% | 99.8 0% | 99.5 0% |
| AdobeRGB 1998 Coverage (%) | 93.3 | 93.9 1% | 88.4 -5% | 71.9 -23% | 83.9 -10% | 72.6 -22% | 71.6 -23% |
| Response Times | -121% | -1278% | -877% | -832% | -2081% | -1781% | |
| Response Time Grey 50% / Grey 80% * (ms) | 0.56 ? | 2 ? -257% | 10.7 ? -1811% | 6.3 ? -1025% | 3.59 ? -541% | 16.8 ? -2900% | 14.3 ? -2454% |
| Response Time Black / White * (ms) | 0.58 ? | 1.4 ? -141% | 4.9 ? -745% | 4.8 ? -728% | 7.09 ? -1122% | 7.9 ? -1262% | 7 ? -1107% |
| PWM Frequency (Hz) | 480 ? | 1300 | |||||
| PWM Amplitude * (%) | 26 | 16.7 36% | |||||
| Screen | -2% | 16% | 26% | -49% | -20% | -29% | |
| Brightness middle (cd/m²) | 434 | 521 20% | 512 18% | 480 11% | 472 9% | 443 2% | 432 0% |
| Brightness (cd/m²) | 433 | 519 20% | 483 12% | 456 5% | 438 1% | 433 0% | 425 -2% |
| Brightness Distribution (%) | 99 | 98 -1% | 91 -8% | 91 -8% | 88 -11% | 90 -9% | 91 -8% |
| Black Level * (cd/m²) | 0.075 | 0.43 | 0.32 | 0.4 | 0.42 | 0.37 | |
| Colorchecker dE 2000 * | 3 | 2.5 17% | 2.4 20% | 1.4 53% | 6.07 -102% | 3.82 -27% | 4.76 -59% |
| Colorchecker dE 2000 max. * | 5.1 | 4.85 5% | 3.8 25% | 2.5 51% | 9.76 -91% | 7.61 -49% | 8.59 -68% |
| Colorchecker dE 2000 calibrated * | 1.4 | 2.5 -79% | 0.9 36% | 1.3 7% | 2.25 -61% | 1.33 5% | 1.18 16% |
| Greyscale dE 2000 * | 3.4 | 3.17 7% | 3.1 9% | 1.2 65% | 6.4 -88% | 5.5 -62% | 6.2 -82% |
| Gamma | 2.47 89% | 2.35 94% | 2.41 91% | 2.16 102% | 2.52 87% | 2.249 98% | 2.079 106% |
| CCT | 6452 101% | 6454 101% | 6534 99% | 6620 98% | 7987 81% | 6549 99% | 6690 97% |
| Contrast (:1) | 6947 | 1191 | 1500 | 1180 | 1055 | 1168 | |
| Moyenne finale (programmes/paramètres) | -41% /
-29% | -421% /
-204% | -290% /
-136% | -295% /
-168% | -706% /
-363% | -609% /
-318% |
* ... Moindre est la valeur, meilleures sont les performances


Temps de réponse de l'écran
| ↔ Temps de réponse noir à blanc | ||
|---|---|---|
| 0.58 ms ... hausse ↗ et chute ↘ combinées | ↗ 0.33 ms hausse | 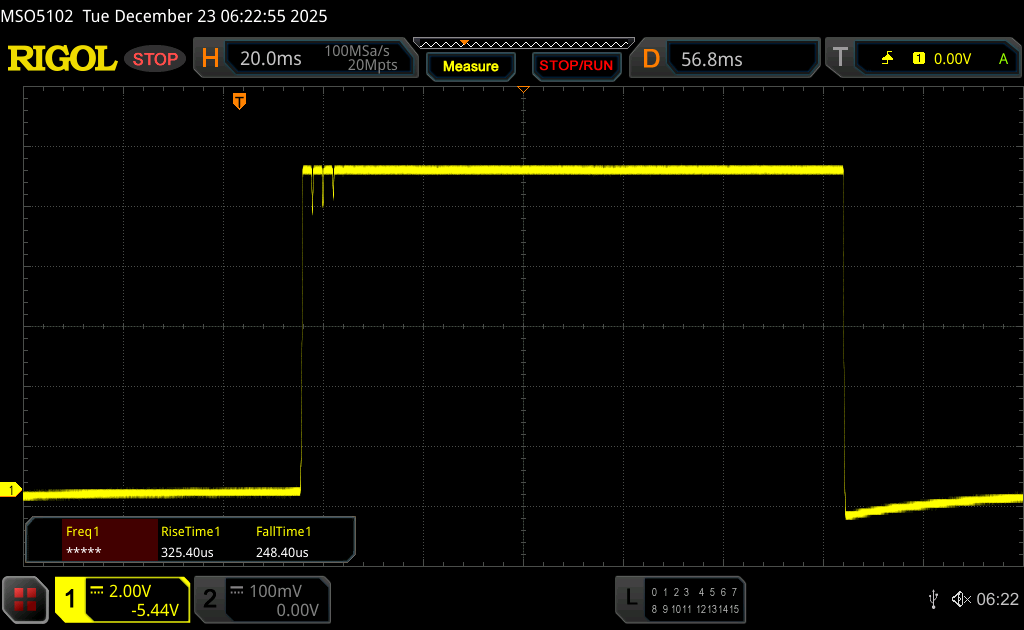 |
| ↘ 0.25 ms chute | ||
| L'écran montre de très faibles temps de réponse, parfait pour le jeu. En comparaison, tous les appareils testés affichent entre 0.1 (minimum) et 240 (maximum) ms. » 1 % des appareils testés affichent de meilleures performances. Cela signifie que les latences relevées sont meilleures que la moyenne (20.2 ms) de tous les appareils testés. | ||
| ↔ Temps de réponse gris 50% à gris 80% | ||
| 0.56 ms ... hausse ↗ et chute ↘ combinées | ↗ 0.3 ms hausse | 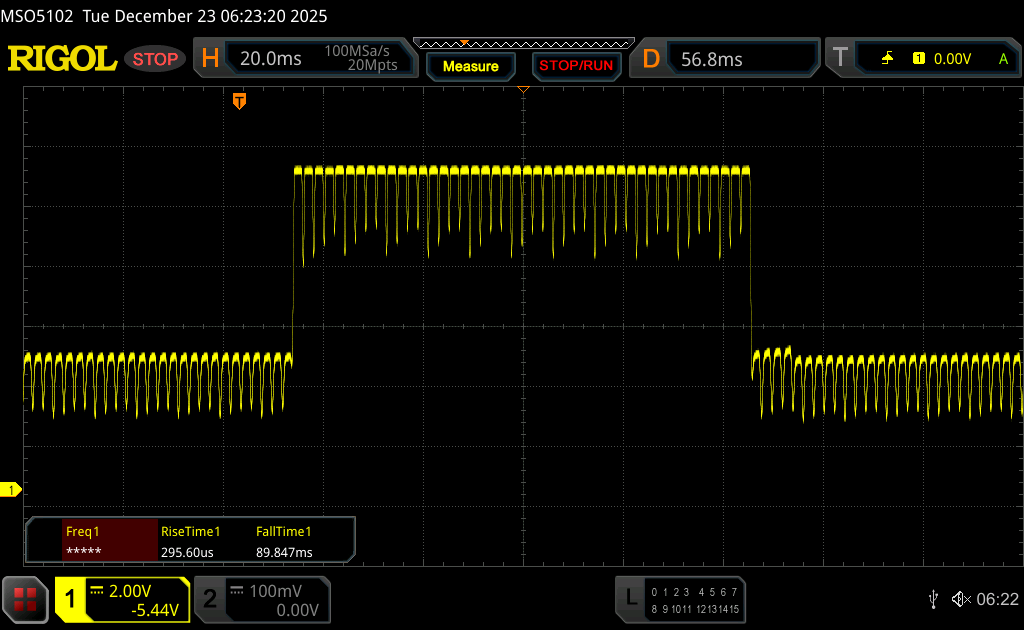 |
| ↘ 0.26 ms chute | ||
| L'écran montre de très faibles temps de réponse, parfait pour le jeu. En comparaison, tous les appareils testés affichent entre 0.165 (minimum) et 636 (maximum) ms. » 1 % des appareils testés affichent de meilleures performances. Cela signifie que les latences relevées sont meilleures que la moyenne (31.6 ms) de tous les appareils testés. | ||
Scintillement / MLI (Modulation de largeur d'impulsion)
| Scintillement / MLI (Modulation de largeur d'impulsion) décelé | 480 Hz Amplitude: 26 % | ≤ 92 Niveau de luminosité |  |
Le rétroéclairage de l'écran scintille à la fréquence de 480 Hz (certainement du fait de l'utilisation d'une MDI - Modulation de largeur d'impulsion) à un niveau de luminosité inférieur ou égal à 92 % . Aucun scintillement ne devrait être perceptible au-dessus de cette valeur. La fréquence de rafraîchissement de 480 Hz est relativement élevée, la grande majorité des utilisateurs ne devrait pas percevLa fréquence de rafraîchissement de 480 Hz est relativement élevée, la grande majorité des utilisateurs ne devrait pas percevoir de scintillements et être sujette à une fatigue oculaire accrue.oir de scintillements et être sujette à une fatigue oculaire accrue. Néanmoins certaines personnes pourront toujours percevoir un scintillement. En comparaison, 53 % des appareils testés n'emploient pas MDI pour assombrir leur écran. Nous avons relevé une moyenne à 8091 (minimum : 5 - maximum : 343500) Hz dans le cas où une MDI était active. | |||


Performance - Arrow Lake HX et Blackwell


Conditions d'essai
XMG propose plusieurs profils de puissance, et nous avons effectué les tests en mode Overboost - Normal. Un mode Overboost - Extrême est également disponible, mais il n'a pas apporté de gains de performances supplémentaires dans les jeux.
Processeur
L'Intel Core Ultra 9 275HX Intel Core Ultra 9 275HX peut consommer jusqu'à 150/140 watts dans le Fusion 16 et offre d'excellentes performances générales. Comparé au processeur AMD Ryzen AI 9 HX 370 du XMG Core 16, le 275HX est en moyenne 28% plus rapide dans tous nos benchmarks CPU. Lorsqu'il fonctionne sur batterie, le processeur est limité à 40 watts, ce qui entraîne une baisse de 35 % des performances multicœurs.
Test d'endurance multiple Cinebench R15
Cinebench 2024: CPU Multi Core | CPU Single Core
Cinebench R23: Multi Core | Single Core
Cinebench R20: CPU (Multi Core) | CPU (Single Core)
Cinebench R15: CPU Multi 64Bit | CPU Single 64Bit
Blender: v2.79 BMW27 CPU
7-Zip 18.03: 7z b 4 | 7z b 4 -mmt1
Geekbench 6.5: Multi-Core | Single-Core
Geekbench 5.5: Multi-Core | Single-Core
HWBOT x265 Benchmark v2.2: 4k Preset
LibreOffice : 20 Documents To PDF
R Benchmark 2.5: Overall mean
| CPU Performance rating | |
| Moyenne Intel Core Ultra 9 275HX | |
| Aorus Elite 16 AE6H -1! | |
| MSI Crosshair 16 HX AI D2XWGKG | |
| Schenker XMG Fusion 16 M25 | |
| Lenovo Legion Pro 5 16IAX10, RTX 5070 -2! | |
| Moyenne de la classe Gaming | |
| Schenker XMG Core 16 M25 | |
| Asus TUF Gaming A16 FA608UP | |
| Gigabyte Gaming A16 GA6H | |
| Cinebench 2024 / CPU Multi Core | |
| Moyenne Intel Core Ultra 9 275HX (1547 - 2288, n=25) | |
| Schenker XMG Fusion 16 M25 | |
| Aorus Elite 16 AE6H | |
| MSI Crosshair 16 HX AI D2XWGKG | |
| Moyenne de la classe Gaming (331 - 2298, n=106, 2 dernières années) | |
| Schenker XMG Core 16 M25 | |
| Asus TUF Gaming A16 FA608UP | |
| Gigabyte Gaming A16 GA6H | |
| Cinebench 2024 / CPU Single Core | |
| Schenker XMG Fusion 16 M25 | |
| MSI Crosshair 16 HX AI D2XWGKG | |
| Moyenne Intel Core Ultra 9 275HX (123.1 - 138.2, n=25) | |
| Aorus Elite 16 AE6H | |
| Moyenne de la classe Gaming (68.2 - 138.2, n=107, 2 dernières années) | |
| Schenker XMG Core 16 M25 | |
| Gigabyte Gaming A16 GA6H | |
| Asus TUF Gaming A16 FA608UP | |
| Cinebench R23 / Multi Core | |
| Moyenne Intel Core Ultra 9 275HX (30712 - 40970, n=30) | |
| MSI Crosshair 16 HX AI D2XWGKG | |
| Schenker XMG Fusion 16 M25 | |
| Aorus Elite 16 AE6H | |
| Lenovo Legion Pro 5 16IAX10, RTX 5070 | |
| Moyenne de la classe Gaming (5668 - 40970, n=148, 2 dernières années) | |
| Schenker XMG Core 16 M25 | |
| Asus TUF Gaming A16 FA608UP | |
| Gigabyte Gaming A16 GA6H | |
| Cinebench R23 / Single Core | |
| Schenker XMG Fusion 16 M25 | |
| MSI Crosshair 16 HX AI D2XWGKG | |
| Moyenne Intel Core Ultra 9 275HX (2009 - 2267, n=30) | |
| Lenovo Legion Pro 5 16IAX10, RTX 5070 | |
| Aorus Elite 16 AE6H | |
| Schenker XMG Core 16 M25 | |
| Moyenne de la classe Gaming (1136 - 2267, n=148, 2 dernières années) | |
| Gigabyte Gaming A16 GA6H | |
| Asus TUF Gaming A16 FA608UP | |
| Cinebench R20 / CPU (Multi Core) | |
| Moyenne Intel Core Ultra 9 275HX (12026 - 16108, n=29) | |
| MSI Crosshair 16 HX AI D2XWGKG | |
| Schenker XMG Fusion 16 M25 | |
| Aorus Elite 16 AE6H | |
| Lenovo Legion Pro 5 16IAX10, RTX 5070 | |
| Moyenne de la classe Gaming (2179 - 16108, n=147, 2 dernières années) | |
| Schenker XMG Core 16 M25 | |
| Asus TUF Gaming A16 FA608UP | |
| Gigabyte Gaming A16 GA6H | |
| Cinebench R20 / CPU (Single Core) | |
| Schenker XMG Fusion 16 M25 | |
| MSI Crosshair 16 HX AI D2XWGKG | |
| Moyenne Intel Core Ultra 9 275HX (774 - 870, n=29) | |
| Aorus Elite 16 AE6H | |
| Lenovo Legion Pro 5 16IAX10, RTX 5070 | |
| Schenker XMG Core 16 M25 | |
| Moyenne de la classe Gaming (439 - 870, n=147, 2 dernières années) | |
| Gigabyte Gaming A16 GA6H | |
| Asus TUF Gaming A16 FA608UP | |
| Cinebench R15 / CPU Multi 64Bit | |
| Moyenne Intel Core Ultra 9 275HX (4737 - 6271, n=29) | |
| MSI Crosshair 16 HX AI D2XWGKG | |
| Aorus Elite 16 AE6H | |
| Schenker XMG Fusion 16 M25 | |
| Lenovo Legion Pro 5 16IAX10, RTX 5070 | |
| Moyenne de la classe Gaming (1537 - 6271, n=147, 2 dernières années) | |
| Schenker XMG Core 16 M25 | |
| Asus TUF Gaming A16 FA608UP | |
| Gigabyte Gaming A16 GA6H | |
| Cinebench R15 / CPU Single 64Bit | |
| Schenker XMG Fusion 16 M25 | |
| Moyenne Intel Core Ultra 9 275HX (306 - 343, n=30) | |
| MSI Crosshair 16 HX AI D2XWGKG | |
| Lenovo Legion Pro 5 16IAX10, RTX 5070 | |
| Aorus Elite 16 AE6H | |
| Moyenne de la classe Gaming (188.8 - 343, n=146, 2 dernières années) | |
| Asus TUF Gaming A16 FA608UP | |
| Gigabyte Gaming A16 GA6H | |
| Schenker XMG Core 16 M25 | |
| Blender / v2.79 BMW27 CPU | |
| Gigabyte Gaming A16 GA6H | |
| Asus TUF Gaming A16 FA608UP | |
| Moyenne de la classe Gaming (80 - 517, n=143, 2 dernières années) | |
| Schenker XMG Core 16 M25 | |
| Lenovo Legion Pro 5 16IAX10, RTX 5070 | |
| Schenker XMG Fusion 16 M25 | |
| MSI Crosshair 16 HX AI D2XWGKG | |
| Moyenne Intel Core Ultra 9 275HX (82 - 116, n=28) | |
| 7-Zip 18.03 / 7z b 4 | |
| Moyenne Intel Core Ultra 9 275HX (98236 - 124155, n=29) | |
| Schenker XMG Fusion 16 M25 | |
| Aorus Elite 16 AE6H | |
| MSI Crosshair 16 HX AI D2XWGKG | |
| Lenovo Legion Pro 5 16IAX10, RTX 5070 | |
| Moyenne de la classe Gaming (23795 - 148086, n=145, 2 dernières années) | |
| Schenker XMG Core 16 M25 | |
| Asus TUF Gaming A16 FA608UP | |
| Gigabyte Gaming A16 GA6H | |
| 7-Zip 18.03 / 7z b 4 -mmt1 | |
| Schenker XMG Fusion 16 M25 | |
| MSI Crosshair 16 HX AI D2XWGKG | |
| Moyenne Intel Core Ultra 9 275HX (6026 - 7149, n=29) | |
| Lenovo Legion Pro 5 16IAX10, RTX 5070 | |
| Schenker XMG Core 16 M25 | |
| Moyenne de la classe Gaming (4199 - 7508, n=145, 2 dernières années) | |
| Aorus Elite 16 AE6H | |
| Asus TUF Gaming A16 FA608UP | |
| Gigabyte Gaming A16 GA6H | |
| Geekbench 6.5 / Multi-Core | |
| Lenovo Legion Pro 5 16IAX10, RTX 5070 | |
| Moyenne Intel Core Ultra 9 275HX (16033 - 21668, n=31) | |
| Schenker XMG Fusion 16 M25 | |
| Aorus Elite 16 AE6H | |
| MSI Crosshair 16 HX AI D2XWGKG | |
| Schenker XMG Core 16 M25 | |
| Moyenne de la classe Gaming (5340 - 22104, n=145, 2 dernières années) | |
| Asus TUF Gaming A16 FA608UP | |
| Gigabyte Gaming A16 GA6H | |
| Geekbench 6.5 / Single-Core | |
| Schenker XMG Fusion 16 M25 | |
| MSI Crosshair 16 HX AI D2XWGKG | |
| Moyenne Intel Core Ultra 9 275HX (2843 - 3160, n=31) | |
| Lenovo Legion Pro 5 16IAX10, RTX 5070 | |
| Aorus Elite 16 AE6H | |
| Schenker XMG Core 16 M25 | |
| Moyenne de la classe Gaming (1490 - 3253, n=145, 2 dernières années) | |
| Asus TUF Gaming A16 FA608UP | |
| Gigabyte Gaming A16 GA6H | |
| Geekbench 5.5 / Multi-Core | |
| Schenker XMG Fusion 16 M25 | |
| Moyenne Intel Core Ultra 9 275HX (19105 - 25855, n=30) | |
| Aorus Elite 16 AE6H | |
| MSI Crosshair 16 HX AI D2XWGKG | |
| Lenovo Legion Pro 5 16IAX10, RTX 5070 | |
| Moyenne de la classe Gaming (4557 - 27010, n=144, 2 dernières années) | |
| Schenker XMG Core 16 M25 | |
| Asus TUF Gaming A16 FA608UP | |
| Gigabyte Gaming A16 GA6H | |
| Geekbench 5.5 / Single-Core | |
| Schenker XMG Fusion 16 M25 | |
| MSI Crosshair 16 HX AI D2XWGKG | |
| Lenovo Legion Pro 5 16IAX10, RTX 5070 | |
| Moyenne Intel Core Ultra 9 275HX (2033 - 2292, n=30) | |
| Aorus Elite 16 AE6H | |
| Schenker XMG Core 16 M25 | |
| Moyenne de la classe Gaming (986 - 2423, n=144, 2 dernières années) | |
| Asus TUF Gaming A16 FA608UP | |
| Gigabyte Gaming A16 GA6H | |
| HWBOT x265 Benchmark v2.2 / 4k Preset | |
| Moyenne Intel Core Ultra 9 275HX (30.7 - 43.8, n=29) | |
| Lenovo Legion Pro 5 16IAX10, RTX 5070 | |
| MSI Crosshair 16 HX AI D2XWGKG | |
| Aorus Elite 16 AE6H | |
| Schenker XMG Fusion 16 M25 | |
| Schenker XMG Core 16 M25 | |
| Moyenne de la classe Gaming (7.7 - 44.3, n=145, 2 dernières années) | |
| Asus TUF Gaming A16 FA608UP | |
| Gigabyte Gaming A16 GA6H | |
| LibreOffice / 20 Documents To PDF | |
| Asus TUF Gaming A16 FA608UP | |
| Gigabyte Gaming A16 GA6H | |
| Schenker XMG Core 16 M25 | |
| Schenker XMG Fusion 16 M25 | |
| Moyenne de la classe Gaming (19 - 88.8, n=144, 2 dernières années) | |
| Lenovo Legion Pro 5 16IAX10, RTX 5070 | |
| Moyenne Intel Core Ultra 9 275HX (33.2 - 62.1, n=29) | |
| MSI Crosshair 16 HX AI D2XWGKG | |
| Aorus Elite 16 AE6H | |
| R Benchmark 2.5 / Overall mean | |
| Gigabyte Gaming A16 GA6H | |
| Asus TUF Gaming A16 FA608UP | |
| Aorus Elite 16 AE6H | |
| Moyenne de la classe Gaming (0.3551 - 0.759, n=146, 2 dernières années) | |
| Lenovo Legion Pro 5 16IAX10, RTX 5070 | |
| Moyenne Intel Core Ultra 9 275HX (0.3943 - 0.4568, n=29) | |
| Schenker XMG Fusion 16 M25 | |
| MSI Crosshair 16 HX AI D2XWGKG | |
| Schenker XMG Core 16 M25 | |
* ... Moindre est la valeur, meilleures sont les performances
AIDA64: FP32 Ray-Trace | FPU Julia | CPU SHA3 | CPU Queen | FPU SinJulia | FPU Mandel | CPU AES | CPU ZLib | FP64 Ray-Trace | CPU PhotoWorxx
| Performance rating | |
| Moyenne Intel Core Ultra 9 275HX | |
| MSI Crosshair 16 HX AI D2XWGKG | |
| Schenker XMG Fusion 16 M25 | |
| Lenovo Legion Pro 5 16IAX10, RTX 5070 | |
| Aorus Elite 16 AE6H | |
| Schenker XMG Core 16 M25 | |
| Moyenne de la classe Gaming | |
| Asus TUF Gaming A16 FA608UP | |
| Gigabyte Gaming A16 GA6H | |
| AIDA64 / FP32 Ray-Trace | |
| Schenker XMG Core 16 M25 | |
| MSI Crosshair 16 HX AI D2XWGKG | |
| Moyenne Intel Core Ultra 9 275HX (28039 - 39895, n=29) | |
| Schenker XMG Fusion 16 M25 | |
| Lenovo Legion Pro 5 16IAX10, RTX 5070 | |
| Aorus Elite 16 AE6H | |
| Asus TUF Gaming A16 FA608UP | |
| Moyenne de la classe Gaming (7192 - 85542, n=144, 2 dernières années) | |
| Gigabyte Gaming A16 GA6H | |
| AIDA64 / FPU Julia | |
| MSI Crosshair 16 HX AI D2XWGKG | |
| Moyenne Intel Core Ultra 9 275HX (140254 - 200744, n=29) | |
| Schenker XMG Fusion 16 M25 | |
| Lenovo Legion Pro 5 16IAX10, RTX 5070 | |
| Aorus Elite 16 AE6H | |
| Schenker XMG Core 16 M25 | |
| Moyenne de la classe Gaming (35040 - 238426, n=144, 2 dernières années) | |
| Asus TUF Gaming A16 FA608UP | |
| Gigabyte Gaming A16 GA6H | |
| AIDA64 / CPU SHA3 | |
| Moyenne Intel Core Ultra 9 275HX (6710 - 9817, n=29) | |
| MSI Crosshair 16 HX AI D2XWGKG | |
| Schenker XMG Fusion 16 M25 | |
| Aorus Elite 16 AE6H | |
| Lenovo Legion Pro 5 16IAX10, RTX 5070 | |
| Schenker XMG Core 16 M25 | |
| Moyenne de la classe Gaming (1728 - 9817, n=144, 2 dernières années) | |
| Asus TUF Gaming A16 FA608UP | |
| Gigabyte Gaming A16 GA6H | |
| AIDA64 / CPU Queen | |
| Lenovo Legion Pro 5 16IAX10, RTX 5070 | |
| Moyenne Intel Core Ultra 9 275HX (113887 - 140937, n=29) | |
| Aorus Elite 16 AE6H | |
| MSI Crosshair 16 HX AI D2XWGKG | |
| Schenker XMG Fusion 16 M25 | |
| Asus TUF Gaming A16 FA608UP | |
| Moyenne de la classe Gaming (49785 - 173351, n=144, 2 dernières années) | |
| Schenker XMG Core 16 M25 | |
| Gigabyte Gaming A16 GA6H | |
| AIDA64 / FPU SinJulia | |
| Schenker XMG Core 16 M25 | |
| Asus TUF Gaming A16 FA608UP | |
| Moyenne de la classe Gaming (4424 - 33636, n=144, 2 dernières années) | |
| Moyenne Intel Core Ultra 9 275HX (11172 - 14425, n=29) | |
| MSI Crosshair 16 HX AI D2XWGKG | |
| Aorus Elite 16 AE6H | |
| Schenker XMG Fusion 16 M25 | |
| Lenovo Legion Pro 5 16IAX10, RTX 5070 | |
| Gigabyte Gaming A16 GA6H | |
| AIDA64 / FPU Mandel | |
| MSI Crosshair 16 HX AI D2XWGKG | |
| Moyenne Intel Core Ultra 9 275HX (72596 - 104508, n=29) | |
| Schenker XMG Fusion 16 M25 | |
| Lenovo Legion Pro 5 16IAX10, RTX 5070 | |
| Aorus Elite 16 AE6H | |
| Schenker XMG Core 16 M25 | |
| Moyenne de la classe Gaming (17585 - 128721, n=144, 2 dernières années) | |
| Asus TUF Gaming A16 FA608UP | |
| Gigabyte Gaming A16 GA6H | |
| AIDA64 / CPU AES | |
| Moyenne Intel Core Ultra 9 275HX (105608 - 247074, n=29) | |
| MSI Crosshair 16 HX AI D2XWGKG | |
| Schenker XMG Fusion 16 M25 | |
| Schenker XMG Core 16 M25 | |
| Lenovo Legion Pro 5 16IAX10, RTX 5070 | |
| Aorus Elite 16 AE6H | |
| Moyenne de la classe Gaming (19065 - 247074, n=144, 2 dernières années) | |
| Asus TUF Gaming A16 FA608UP | |
| Gigabyte Gaming A16 GA6H | |
| AIDA64 / CPU ZLib | |
| Moyenne Intel Core Ultra 9 275HX (1582 - 2263, n=29) | |
| MSI Crosshair 16 HX AI D2XWGKG | |
| Schenker XMG Fusion 16 M25 | |
| Aorus Elite 16 AE6H | |
| Lenovo Legion Pro 5 16IAX10, RTX 5070 | |
| Moyenne de la classe Gaming (373 - 2531, n=144, 2 dernières années) | |
| Schenker XMG Core 16 M25 | |
| Asus TUF Gaming A16 FA608UP | |
| Gigabyte Gaming A16 GA6H | |
| AIDA64 / FP64 Ray-Trace | |
| Schenker XMG Core 16 M25 | |
| MSI Crosshair 16 HX AI D2XWGKG | |
| Moyenne Intel Core Ultra 9 275HX (14847 - 21854, n=29) | |
| Schenker XMG Fusion 16 M25 | |
| Lenovo Legion Pro 5 16IAX10, RTX 5070 | |
| Aorus Elite 16 AE6H | |
| Asus TUF Gaming A16 FA608UP | |
| Moyenne de la classe Gaming (3856 - 45446, n=144, 2 dernières années) | |
| Gigabyte Gaming A16 GA6H | |
| AIDA64 / CPU PhotoWorxx | |
| Lenovo Legion Pro 5 16IAX10, RTX 5070 | |
| Schenker XMG Core 16 M25 | |
| Schenker XMG Fusion 16 M25 | |
| Moyenne Intel Core Ultra 9 275HX (37482 - 62916, n=29) | |
| Aorus Elite 16 AE6H | |
| Moyenne de la classe Gaming (10805 - 62916, n=144, 2 dernières années) | |
| Asus TUF Gaming A16 FA608UP | |
| MSI Crosshair 16 HX AI D2XWGKG | |
| Gigabyte Gaming A16 GA6H | |
Performance du système
L'impression subjective de performance est excellente et les résultats des tests synthétiques sont également très bons.
PCMark 10: Score | Essentials | Productivity | Digital Content Creation
CrossMark: Overall | Productivity | Creativity | Responsiveness
WebXPRT 3: Overall
WebXPRT 4: Overall
Mozilla Kraken 1.1: Total
| Performance rating | |
| Schenker XMG Fusion 16 M25 | |
| Lenovo Legion Pro 5 16IAX10, RTX 5070 | |
| Moyenne Intel Core Ultra 9 275HX, NVIDIA GeForce RTX 5070 Laptop | |
| Schenker XMG Core 16 M25 -4! | |
| MSI Crosshair 16 HX AI D2XWGKG | |
| Aorus Elite 16 AE6H | |
| Moyenne de la classe Gaming | |
| Gigabyte Gaming A16 GA6H | |
| Asus TUF Gaming A16 FA608UP -4! | |
| PCMark 10 / Score | |
| Schenker XMG Fusion 16 M25 | |
| Lenovo Legion Pro 5 16IAX10, RTX 5070 | |
| Moyenne Intel Core Ultra 9 275HX, NVIDIA GeForce RTX 5070 Laptop (8018 - 9667, n=4) | |
| MSI Crosshair 16 HX AI D2XWGKG | |
| Aorus Elite 16 AE6H | |
| Moyenne de la classe Gaming (5776 - 9667, n=122, 2 dernières années) | |
| Gigabyte Gaming A16 GA6H | |
| PCMark 10 / Essentials | |
| Lenovo Legion Pro 5 16IAX10, RTX 5070 | |
| Aorus Elite 16 AE6H | |
| MSI Crosshair 16 HX AI D2XWGKG | |
| Moyenne de la classe Gaming (8810 - 12600, n=127, 2 dernières années) | |
| Moyenne Intel Core Ultra 9 275HX, NVIDIA GeForce RTX 5070 Laptop (10259 - 11025, n=4) | |
| Schenker XMG Fusion 16 M25 | |
| Gigabyte Gaming A16 GA6H | |
| PCMark 10 / Productivity | |
| Schenker XMG Fusion 16 M25 | |
| Moyenne Intel Core Ultra 9 275HX, NVIDIA GeForce RTX 5070 Laptop (8307 - 16716, n=4) | |
| Lenovo Legion Pro 5 16IAX10, RTX 5070 | |
| Moyenne de la classe Gaming (6662 - 16716, n=122, 2 dernières années) | |
| Aorus Elite 16 AE6H | |
| MSI Crosshair 16 HX AI D2XWGKG | |
| Gigabyte Gaming A16 GA6H | |
| PCMark 10 / Digital Content Creation | |
| Lenovo Legion Pro 5 16IAX10, RTX 5070 | |
| MSI Crosshair 16 HX AI D2XWGKG | |
| Moyenne Intel Core Ultra 9 275HX, NVIDIA GeForce RTX 5070 Laptop (13010 - 16417, n=4) | |
| Schenker XMG Fusion 16 M25 | |
| Aorus Elite 16 AE6H | |
| Moyenne de la classe Gaming (7440 - 19351, n=122, 2 dernières années) | |
| Gigabyte Gaming A16 GA6H | |
| CrossMark / Overall | |
| Moyenne Intel Core Ultra 9 275HX, NVIDIA GeForce RTX 5070 Laptop (2084 - 2269, n=5) | |
| Aorus Elite 16 AE6H | |
| MSI Crosshair 16 HX AI D2XWGKG | |
| Schenker XMG Fusion 16 M25 | |
| Lenovo Legion Pro 5 16IAX10, RTX 5070 | |
| Schenker XMG Core 16 M25 | |
| Moyenne de la classe Gaming (1247 - 2344, n=118, 2 dernières années) | |
| Gigabyte Gaming A16 GA6H | |
| Asus TUF Gaming A16 FA608UP | |
| CrossMark / Productivity | |
| Aorus Elite 16 AE6H | |
| Moyenne Intel Core Ultra 9 275HX, NVIDIA GeForce RTX 5070 Laptop (1931 - 2173, n=5) | |
| MSI Crosshair 16 HX AI D2XWGKG | |
| Schenker XMG Fusion 16 M25 | |
| Lenovo Legion Pro 5 16IAX10, RTX 5070 | |
| Moyenne de la classe Gaming (1299 - 2211, n=118, 2 dernières années) | |
| Schenker XMG Core 16 M25 | |
| Gigabyte Gaming A16 GA6H | |
| Asus TUF Gaming A16 FA608UP | |
| CrossMark / Creativity | |
| Schenker XMG Core 16 M25 | |
| Schenker XMG Fusion 16 M25 | |
| Moyenne Intel Core Ultra 9 275HX, NVIDIA GeForce RTX 5070 Laptop (2322 - 2430, n=5) | |
| MSI Crosshair 16 HX AI D2XWGKG | |
| Aorus Elite 16 AE6H | |
| Lenovo Legion Pro 5 16IAX10, RTX 5070 | |
| Moyenne de la classe Gaming (1275 - 2729, n=118, 2 dernières années) | |
| Asus TUF Gaming A16 FA608UP | |
| Gigabyte Gaming A16 GA6H | |
| CrossMark / Responsiveness | |
| Aorus Elite 16 AE6H | |
| Moyenne Intel Core Ultra 9 275HX, NVIDIA GeForce RTX 5070 Laptop (1754 - 2143, n=5) | |
| Gigabyte Gaming A16 GA6H | |
| MSI Crosshair 16 HX AI D2XWGKG | |
| Schenker XMG Fusion 16 M25 | |
| Lenovo Legion Pro 5 16IAX10, RTX 5070 | |
| Moyenne de la classe Gaming (1030 - 2330, n=118, 2 dernières années) | |
| Schenker XMG Core 16 M25 | |
| Asus TUF Gaming A16 FA608UP | |
| WebXPRT 3 / Overall | |
| Schenker XMG Core 16 M25 | |
| Schenker XMG Fusion 16 M25 | |
| Lenovo Legion Pro 5 16IAX10, RTX 5070 | |
| Moyenne Intel Core Ultra 9 275HX, NVIDIA GeForce RTX 5070 Laptop (309 - 364, n=5) | |
| MSI Crosshair 16 HX AI D2XWGKG | |
| Moyenne de la classe Gaming (237 - 532, n=123, 2 dernières années) | |
| Aorus Elite 16 AE6H | |
| Asus TUF Gaming A16 FA608UP | |
| Gigabyte Gaming A16 GA6H | |
| WebXPRT 4 / Overall | |
| Schenker XMG Core 16 M25 | |
| Aorus Elite 16 AE6H | |
| Lenovo Legion Pro 5 16IAX10, RTX 5070 | |
| Moyenne Intel Core Ultra 9 275HX, NVIDIA GeForce RTX 5070 Laptop (297 - 330, n=5) | |
| MSI Crosshair 16 HX AI D2XWGKG | |
| Schenker XMG Fusion 16 M25 | |
| Moyenne de la classe Gaming (176.4 - 345, n=118, 2 dernières années) | |
| Gigabyte Gaming A16 GA6H | |
| Asus TUF Gaming A16 FA608UP | |
| Mozilla Kraken 1.1 / Total | |
| Asus TUF Gaming A16 FA608UP | |
| Gigabyte Gaming A16 GA6H | |
| Moyenne de la classe Gaming (397 - 674, n=132, 2 dernières années) | |
| Lenovo Legion Pro 5 16IAX10, RTX 5070 | |
| Schenker XMG Fusion 16 M25 | |
| Aorus Elite 16 AE6H | |
| Moyenne Intel Core Ultra 9 275HX, NVIDIA GeForce RTX 5070 Laptop (407 - 431, n=5) | |
| Schenker XMG Core 16 M25 | |
| MSI Crosshair 16 HX AI D2XWGKG | |
* ... Moindre est la valeur, meilleures sont les performances
| PCMark 10 Score | 9667 points | |
Aide | ||
| AIDA64 / Memory Copy | |
| Lenovo Legion Pro 5 16IAX10, RTX 5070 | |
| Schenker XMG Fusion 16 M25 | |
| Moyenne Intel Core Ultra 9 275HX (56003 - 94460, n=29) | |
| Aorus Elite 16 AE6H | |
| Schenker XMG Core 16 M25 | |
| Moyenne de la classe Gaming (21750 - 108104, n=144, 2 dernières années) | |
| MSI Crosshair 16 HX AI D2XWGKG | |
| Asus TUF Gaming A16 FA608UP | |
| Gigabyte Gaming A16 GA6H | |
| AIDA64 / Memory Read | |
| Lenovo Legion Pro 5 16IAX10, RTX 5070 | |
| Schenker XMG Fusion 16 M25 | |
| Aorus Elite 16 AE6H | |
| Moyenne Intel Core Ultra 9 275HX (55795 - 97151, n=29) | |
| Schenker XMG Core 16 M25 | |
| MSI Crosshair 16 HX AI D2XWGKG | |
| Moyenne de la classe Gaming (22956 - 104349, n=144, 2 dernières années) | |
| Asus TUF Gaming A16 FA608UP | |
| Gigabyte Gaming A16 GA6H | |
| AIDA64 / Memory Write | |
| Aorus Elite 16 AE6H | |
| Asus TUF Gaming A16 FA608UP | |
| Lenovo Legion Pro 5 16IAX10, RTX 5070 | |
| Schenker XMG Fusion 16 M25 | |
| Schenker XMG Core 16 M25 | |
| Moyenne Intel Core Ultra 9 275HX (55663 - 116129, n=29) | |
| Moyenne de la classe Gaming (22297 - 133486, n=144, 2 dernières années) | |
| MSI Crosshair 16 HX AI D2XWGKG | |
| Gigabyte Gaming A16 GA6H | |
| AIDA64 / Memory Latency | |
| Moyenne Intel Core Ultra 9 275HX (105.8 - 161.6, n=29) | |
| Aorus Elite 16 AE6H | |
| MSI Crosshair 16 HX AI D2XWGKG | |
| Schenker XMG Fusion 16 M25 | |
| Lenovo Legion Pro 5 16IAX10, RTX 5070 | |
| Gigabyte Gaming A16 GA6H | |
| Moyenne de la classe Gaming (59.5 - 259, n=144, 2 dernières années) | |
| Asus TUF Gaming A16 FA608UP | |
| Schenker XMG Core 16 M25 | |
* ... Moindre est la valeur, meilleures sont les performances
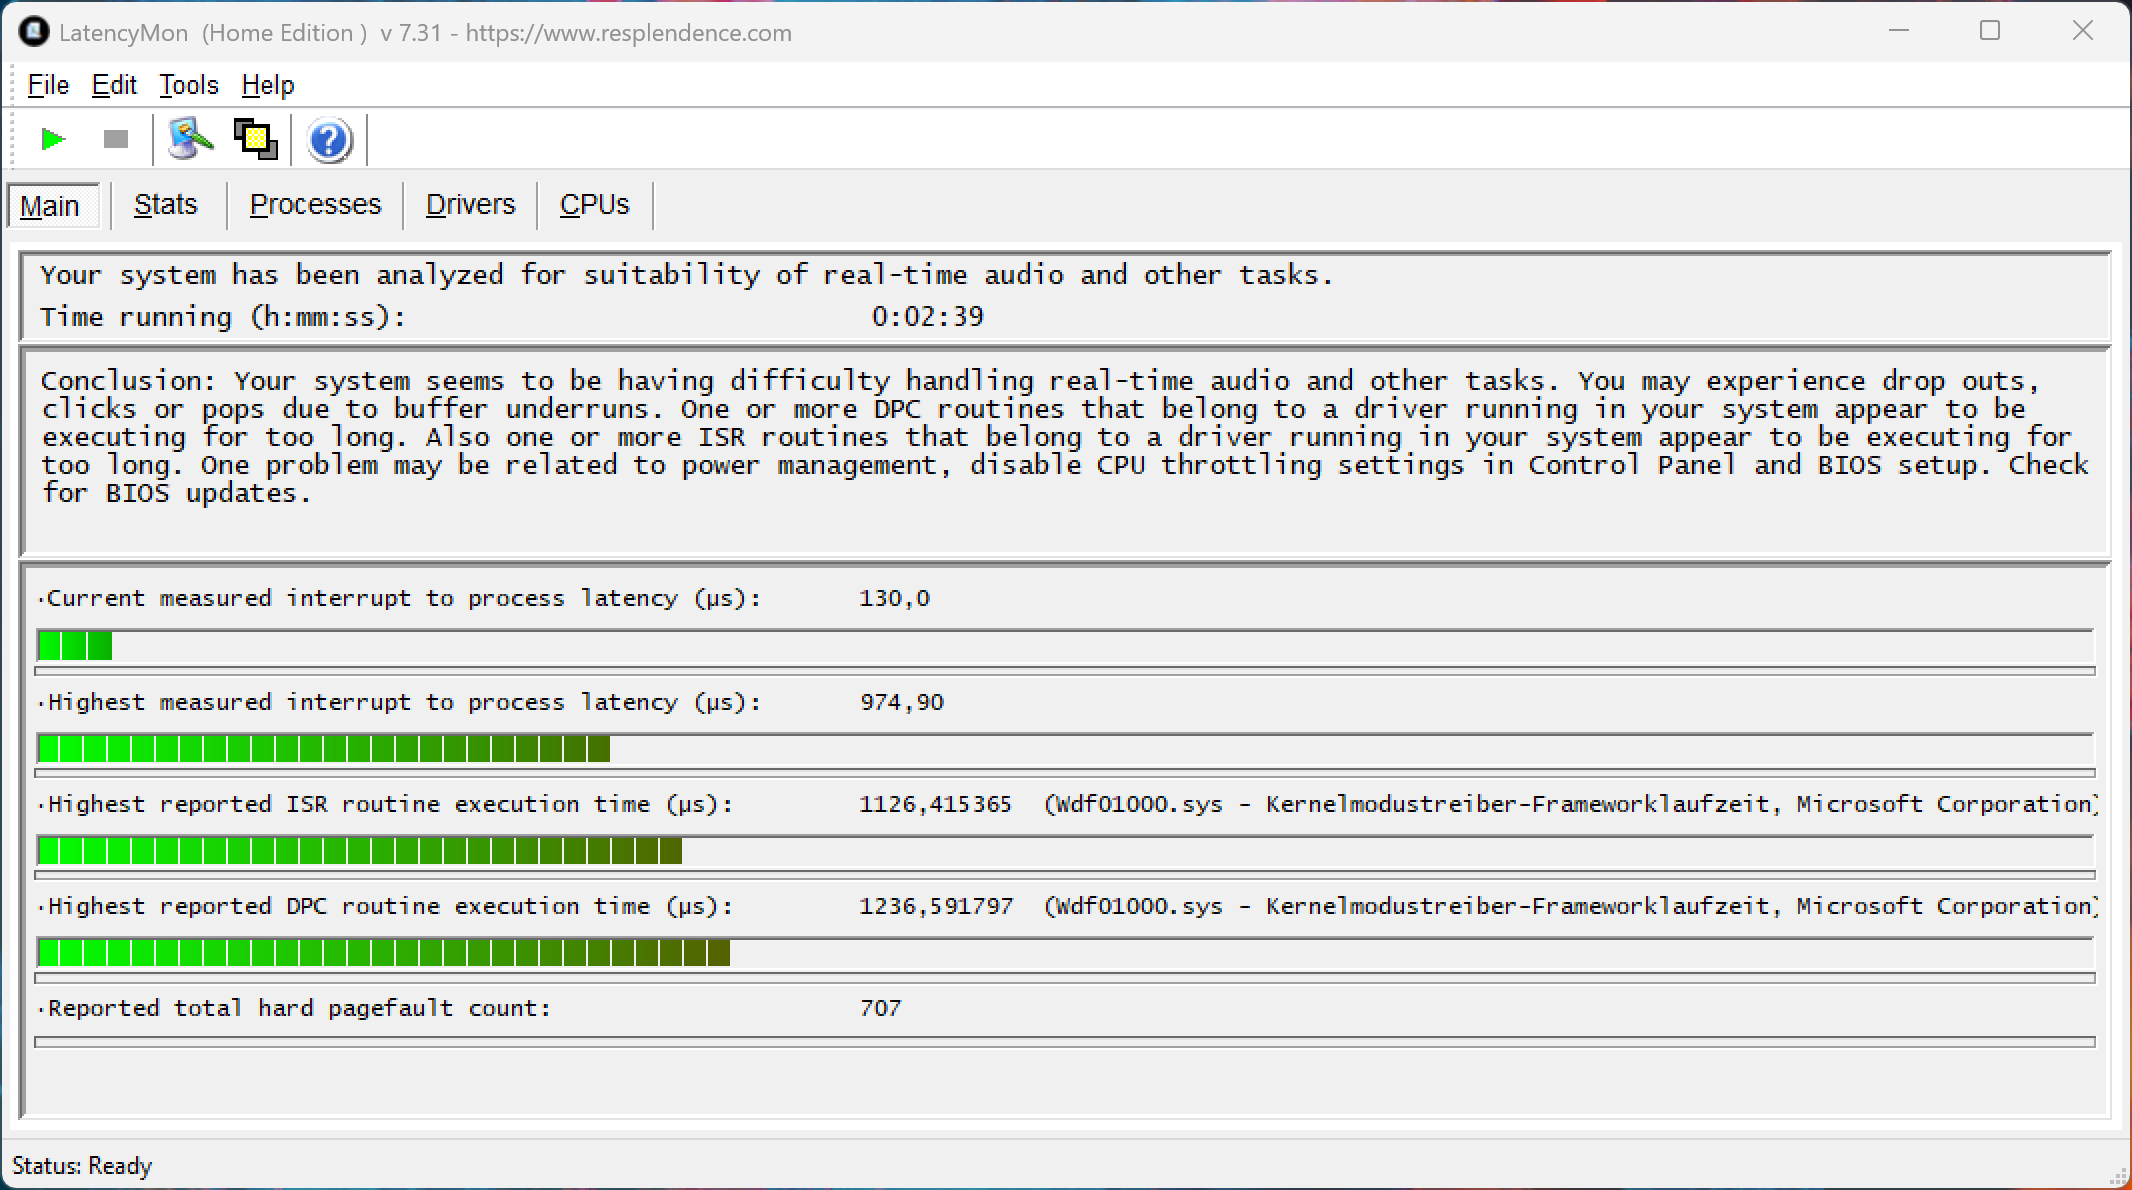
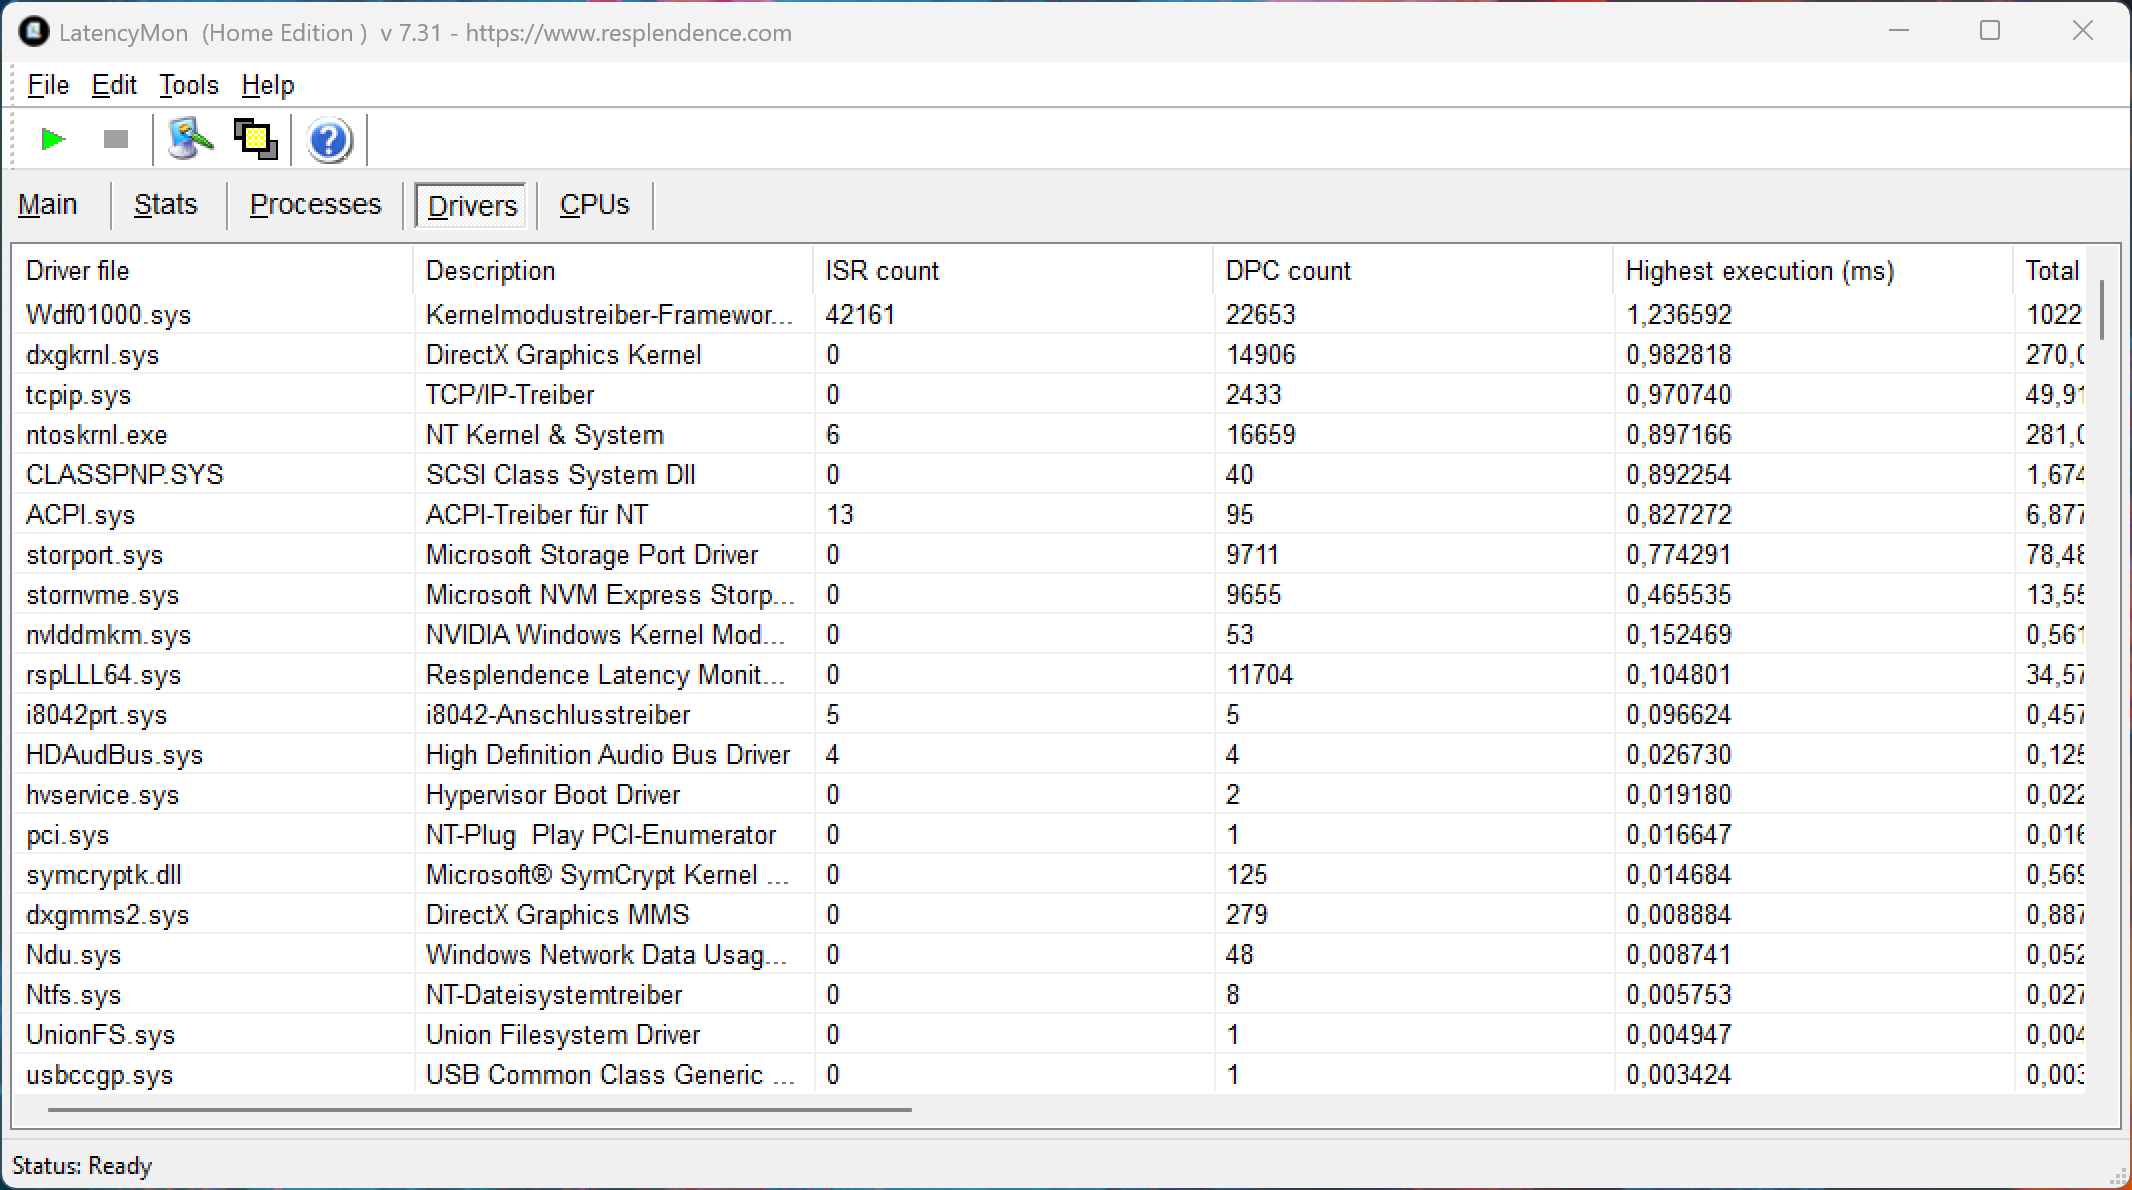
Latences DPC
Dans notre test de latence standardisé, l'unité de test avec la version actuelle du BIOS montre des limitations mineures lors de l'utilisation d'applications audio en temps réel.
| DPC Latencies / LatencyMon - interrupt to process latency (max), Web, Youtube, Prime95 | |
| Gigabyte Gaming A16 GA6H | |
| MSI Crosshair 16 HX AI D2XWGKG | |
| Schenker XMG Fusion 16 M25 | |
| Aorus Elite 16 AE6H | |
| Lenovo Legion Pro 5 16IAX10, RTX 5070 | |
| Schenker XMG Core 16 M25 | |
| Asus TUF Gaming A16 FA608UP | |
* ... Moindre est la valeur, meilleures sont les performances
Dispositifs de stockage
Le Fusion 16 supporte le PCIe 5.0, et notre unité de test est équipée d'un SSD Samsung 9100 Pro de 2 To (1,73 To libres). Les performances sont très bonnes et restent stables même sous une charge soutenue.

* ... Moindre est la valeur, meilleures sont les performances
Throttoir de disque : Boucle de lecture DiskSpd, profondeur de la file d'attente 8
Performance du GPU
Comme pour le Core 16, la version la plus rapide de l'ordinateur portable RTX 5070 pour ordinateur portable Est installée (115 watts), et les performances sont conformes aux attentes. Cependant, le Core Ultra 9 275HX plus rapide n'offre pas d'avantage majeur par rapport au processeur AMD du Core 16. Tous les jeux modernes tournent sans problème avec des paramètres raisonnables, bien que les 8 Go de VRAM puissent devenir une limitation à des résolutions plus élevées (plus de détails sont disponibles sur ici). Lorsqu'il fonctionne sur batterie, le GPU est limité à un maximum de 50 watts, soit environ 50 % de puissance en moins.
| 3DMark 11 Performance | 37410 points | |
| 3DMark Fire Strike Score | 28680 points | |
| 3DMark Time Spy Score | 13439 points | |
| 3DMark Steel Nomad Score | 3075 points | |
| 3DMark Steel Nomad Light Score | 13426 points | |
Aide | ||
| Blender / v3.3 Classroom OPTIX/RTX | |
| Schenker XMG Core 16 M25 | |
| Gigabyte Gaming A16 GA6H | |
| MSI Crosshair 16 HX AI D2XWGKG | |
| Asus TUF Gaming A16 FA608UP | |
| Schenker XMG Fusion 16 M25 | |
| Moyenne NVIDIA GeForce RTX 5070 Laptop (17 - 24, n=23) | |
| Moyenne de la classe Gaming (9 - 95, n=141, 2 dernières années) | |
| Aorus Elite 16 AE6H | |
| Lenovo Legion Pro 5 16IAX10, RTX 5070 | |
| Blender / v3.3 Classroom CUDA | |
| Moyenne NVIDIA GeForce RTX 5070 Laptop (29 - 228, n=24) | |
| Schenker XMG Core 16 M25 | |
| Schenker XMG Fusion 16 M25 | |
| Gigabyte Gaming A16 GA6H | |
| Asus TUF Gaming A16 FA608UP | |
| Moyenne de la classe Gaming (15 - 228, n=145, 2 dernières années) | |
| Aorus Elite 16 AE6H | |
| MSI Crosshair 16 HX AI D2XWGKG | |
| Lenovo Legion Pro 5 16IAX10, RTX 5070 | |
| Blender / v3.3 Classroom CPU | |
| Gigabyte Gaming A16 GA6H | |
| Asus TUF Gaming A16 FA608UP | |
| Moyenne de la classe Gaming (122 - 962, n=142, 2 dernières années) | |
| Moyenne NVIDIA GeForce RTX 5070 Laptop (137 - 507, n=21) | |
| Schenker XMG Core 16 M25 | |
| Lenovo Legion Pro 5 16IAX10, RTX 5070 | |
| MSI Crosshair 16 HX AI D2XWGKG | |
| Schenker XMG Fusion 16 M25 | |
* ... Moindre est la valeur, meilleures sont les performances

Cyberpunk 2077 ultra FPS chart
| Bas | Moyen | Élevé | Ultra | QHD | |
|---|---|---|---|---|---|
| GTA V (2015) | 143.7 | 124.5 | |||
| Dota 2 Reborn (2015) | 211 | 185.7 | 177 | 164.3 | |
| Final Fantasy XV Benchmark (2018) | 231 | 179.7 | 136.2 | 97.4 | |
| X-Plane 11.11 (2018) | 142.4 | 117.4 | 99.3 | ||
| Strange Brigade (2018) | 519 | 335 | 278 | 242 | 165.7 |
| Baldur's Gate 3 (2023) | 179.1 | 142.7 | 123.4 | 121 | 84.1 |
| Cyberpunk 2077 (2023) | 164.9 | 137.6 | 115.3 | 103.8 | 65.2 |
| F1 24 (2024) | 296 | 291 | 241 | 86.4 | 55.2 |
| F1 25 (2025) | 243 | 218 | 172.3 | 27.7 | 15.5 |
| Call of Duty Black Ops 7 (2025) | 224 | 152 | 117 | 44 | 28 |
Émissions
Bruit du système
Les ventilateurs restent très silencieux pendant l'utilisation quotidienne, et le Fusion 16 est également plus silencieux que la plupart des concurrents, atteignant un maximum de 49,7 dB(A) pendant les jeux. Aucun autre bruit électronique n'a été détecté.
Degré de la nuisance sonore
| Au repos |
| 25.7 / 25.7 / 28 dB(A) |
| Fortement sollicité |
| 38.9 / 49.7 dB(A) |
 | ||
30 dB silencieux 40 dB(A) audible 50 dB(A) bruyant |
||
min: | ||
| Schenker XMG Fusion 16 M25 Ultra 9 275HX, GeForce RTX 5070 Laptop | Lenovo Legion Pro 5 16IAX10, RTX 5070 Ultra 7 255HX, GeForce RTX 5070 Laptop | Schenker XMG Core 16 M25 Ryzen AI 9 HX 370, GeForce RTX 5070 Laptop | Asus TUF Gaming A16 FA608UP R7 260, GeForce RTX 5070 Laptop | MSI Crosshair 16 HX AI D2XWGKG Ultra 9 275HX, GeForce RTX 5070 Laptop | Aorus Elite 16 AE6H Ultra 9 275HX, GeForce RTX 5070 Laptop | Gigabyte Gaming A16 GA6H i7-13620H, GeForce RTX 5070 Laptop | |
|---|---|---|---|---|---|---|---|
| Noise | 4% | 2% | -12% | -12% | -16% | -7% | |
| arrêt / environnement * (dB) | 25.7 | 23 11% | 24.8 4% | 25.1 2% | 25.56 1% | 24 7% | 24 7% |
| Idle Minimum * (dB) | 25.7 | 23 11% | 24.8 4% | 32.2 -25% | 28.3 -10% | 25 3% | 25 3% |
| Idle Average * (dB) | 25.7 | 23 11% | 24.8 4% | 32.2 -25% | 28.3 -10% | 29 -13% | 26 -1% |
| Idle Maximum * (dB) | 28 | 23 18% | 27.1 3% | 32.2 -15% | 28.3 -1% | 32 -14% | 27 4% |
| Load Average * (dB) | 38.9 | 43.85 -13% | 40.2 -3% | 38.1 2% | 50.26 -29% | 60 -54% | 54 -39% |
| Cyberpunk 2077 ultra * (dB) | 49.7 | 50.27 -1% | 49.2 1% | 53.9 -8% | 57.8 -16% | 59 -19% | 54 -9% |
| Load Maximum * (dB) | 49.7 | 52.9 -6% | 49.2 1% | 57.1 -15% | 57.95 -17% | 61 -23% | 55 -11% |
* ... Moindre est la valeur, meilleures sont les performances
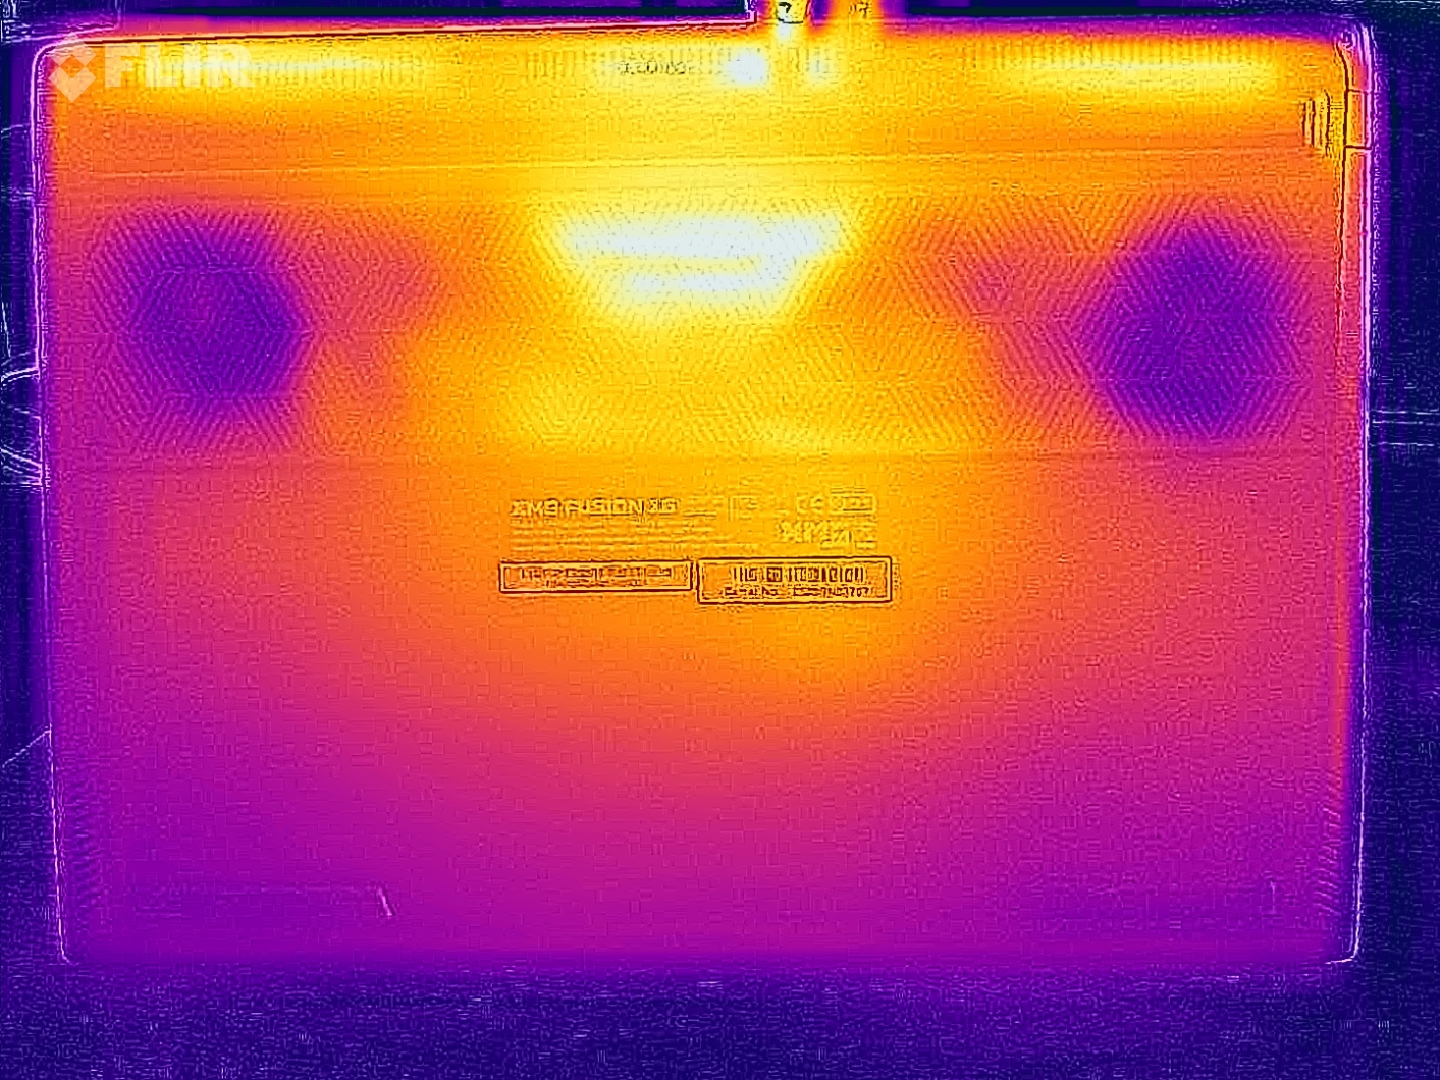
Température
La Fusion 16 reste discrète en termes de températures, et un maximum de 48 °C sur la face inférieure n'est pas critique pendant le jeu.

(±) La température maximale du côté supérieur est de 43.2 °C / 110 F, par rapport à la moyenne de 40.4 °C / 105 F, allant de 21.2 à 68.8 °C pour la classe Gaming.
(-) Le fond chauffe jusqu'à un maximum de 48 °C / 118 F, contre une moyenne de 43.3 °C / 110 F
(+) En utilisation inactive, la température moyenne du côté supérieur est de 25.8 °C / 78 F, par rapport à la moyenne du dispositif de 33.9 °C / 93 F.
(±) 3: The average temperature for the upper side is 36.6 °C / 98 F, compared to the average of 33.9 °C / 93 F for the class Gaming.
(+) Les repose-poignets et le pavé tactile sont plus froids que la température de la peau avec un maximum de 31.4 °C / 88.5 F et sont donc froids au toucher.
(-) La température moyenne de la zone de l'appui-paume de dispositifs similaires était de 28.8 °C / 83.8 F (-2.6 °C / #-4.7 F).

| Schenker XMG Fusion 16 M25 Ultra 9 275HX, GeForce RTX 5070 Laptop | Lenovo Legion Pro 5 16IAX10, RTX 5070 Ultra 7 255HX, GeForce RTX 5070 Laptop | Schenker XMG Core 16 M25 Ryzen AI 9 HX 370, GeForce RTX 5070 Laptop | Asus TUF Gaming A16 FA608UP R7 260, GeForce RTX 5070 Laptop | MSI Crosshair 16 HX AI D2XWGKG Ultra 9 275HX, GeForce RTX 5070 Laptop | Aorus Elite 16 AE6H Ultra 9 275HX, GeForce RTX 5070 Laptop | Gigabyte Gaming A16 GA6H i7-13620H, GeForce RTX 5070 Laptop | |
|---|---|---|---|---|---|---|---|
| Heat | -9% | -11% | 7% | -4% | -13% | -18% | |
| Maximum Upper Side * (°C) | 43.2 | 42 3% | 46.7 -8% | 39.5 9% | 44.8 -4% | 41 5% | 50 -16% |
| Maximum Bottom * (°C) | 48 | 44 8% | 58.5 -22% | 45.1 6% | 43.4 10% | 45 6% | 49 -2% |
| Idle Upper Side * (°C) | 26.6 | 33 -24% | 28.3 -6% | 25.7 3% | 31.2 -17% | 35 -32% | 35 -32% |
| Idle Bottom * (°C) | 27.6 | 34 -23% | 29.9 -8% | 25.5 8% | 28.8 -4% | 36 -30% | 34 -23% |
* ... Moindre est la valeur, meilleures sont les performances
Intervenants
Schenker XMG Fusion 16 M25 analyse audio
(+) | les haut-parleurs peuvent jouer relativement fort (85.1# dB)
Basses 100 - 315 Hz
(-) | presque aucune basse - en moyenne 17.9% plus bas que la médiane
(±) | la linéarité des basses est moyenne (10.5% delta à la fréquence précédente)
Médiums 400 - 2000 Hz
(±) | médiane supérieure - en moyenne 5.7% supérieure à la médiane
(+) | les médiums sont linéaires (4.6% delta à la fréquence précédente)
Aiguës 2 - 16 kHz
(+) | des sommets équilibrés - à seulement 3.1% de la médiane
(+) | les aigus sont linéaires (4.8% delta à la fréquence précédente)
Globalement 100 - 16 000 Hz
(+) | le son global est linéaire (14.8% différence à la médiane)
Par rapport à la même classe
» 29% de tous les appareils testés de cette catégorie étaient meilleurs, 7% similaires, 64% pires
» Le meilleur avait un delta de 6%, la moyenne était de 18%, le pire était de 132%.
Par rapport à tous les appareils testés
» 19% de tous les appareils testés étaient meilleurs, 4% similaires, 77% pires
» Le meilleur avait un delta de 4%, la moyenne était de 24%, le pire était de 134%.
Lenovo Legion Pro 5 16IAX10, RTX 5070 analyse audio
(±) | le niveau sonore du haut-parleur est moyen mais bon (75.73# dB)
Basses 100 - 315 Hz
(-) | presque aucune basse - en moyenne 20% plus bas que la médiane
(±) | la linéarité des basses est moyenne (9.3% delta à la fréquence précédente)
Médiums 400 - 2000 Hz
(±) | médiane supérieure - en moyenne 6.1% supérieure à la médiane
(±) | la linéarité des médiums est moyenne (7.9% delta à la fréquence précédente)
Aiguës 2 - 16 kHz
(+) | des sommets équilibrés - à seulement 2.2% de la médiane
(+) | les aigus sont linéaires (6.3% delta à la fréquence précédente)
Globalement 100 - 16 000 Hz
(±) | la linéarité du son global est moyenne (19.4% de différence avec la médiane)
Par rapport à la même classe
» 66% de tous les appareils testés de cette catégorie étaient meilleurs, 7% similaires, 26% pires
» Le meilleur avait un delta de 6%, la moyenne était de 18%, le pire était de 132%.
Par rapport à tous les appareils testés
» 47% de tous les appareils testés étaient meilleurs, 7% similaires, 46% pires
» Le meilleur avait un delta de 4%, la moyenne était de 24%, le pire était de 134%.
Asus TUF Gaming A16 FA608UP analyse audio
(±) | le niveau sonore du haut-parleur est moyen mais bon (80.2# dB)
Basses 100 - 315 Hz
(±) | basse réduite - en moyenne 11.8% inférieure à la médiane
(±) | la linéarité des basses est moyenne (8.7% delta à la fréquence précédente)
Médiums 400 - 2000 Hz
(+) | médiane équilibrée - seulement 3% de la médiane
(+) | les médiums sont linéaires (3% delta à la fréquence précédente)
Aiguës 2 - 16 kHz
(+) | des sommets équilibrés - à seulement 4.4% de la médiane
(±) | la linéarité des aigus est moyenne (7.4% delta à la fréquence précédente)
Globalement 100 - 16 000 Hz
(+) | le son global est linéaire (12.6% différence à la médiane)
Par rapport à la même classe
» 15% de tous les appareils testés de cette catégorie étaient meilleurs, 3% similaires, 81% pires
» Le meilleur avait un delta de 6%, la moyenne était de 18%, le pire était de 132%.
Par rapport à tous les appareils testés
» 11% de tous les appareils testés étaient meilleurs, 2% similaires, 87% pires
» Le meilleur avait un delta de 4%, la moyenne était de 24%, le pire était de 134%.
MSI Crosshair 16 HX AI D2XWGKG analyse audio
(±) | le niveau sonore du haut-parleur est moyen mais bon (81.5# dB)
Basses 100 - 315 Hz
(-) | presque aucune basse - en moyenne 15.6% plus bas que la médiane
(±) | la linéarité des basses est moyenne (10.5% delta à la fréquence précédente)
Médiums 400 - 2000 Hz
(±) | médiane supérieure - en moyenne 6.6% supérieure à la médiane
(±) | la linéarité des médiums est moyenne (7.1% delta à la fréquence précédente)
Aiguës 2 - 16 kHz
(+) | des sommets équilibrés - à seulement 1.6% de la médiane
(+) | les aigus sont linéaires (5.8% delta à la fréquence précédente)
Globalement 100 - 16 000 Hz
(+) | le son global est linéaire (14.7% différence à la médiane)
Par rapport à la même classe
» 28% de tous les appareils testés de cette catégorie étaient meilleurs, 7% similaires, 64% pires
» Le meilleur avait un delta de 6%, la moyenne était de 18%, le pire était de 132%.
Par rapport à tous les appareils testés
» 19% de tous les appareils testés étaient meilleurs, 4% similaires, 77% pires
» Le meilleur avait un delta de 4%, la moyenne était de 24%, le pire était de 134%.
Aorus Elite 16 AE6H analyse audio
(+) | les haut-parleurs peuvent jouer relativement fort (87# dB)
Basses 100 - 315 Hz
(±) | basse réduite - en moyenne 10.8% inférieure à la médiane
(±) | la linéarité des basses est moyenne (7.5% delta à la fréquence précédente)
Médiums 400 - 2000 Hz
(+) | médiane équilibrée - seulement 2.1% de la médiane
(+) | les médiums sont linéaires (4.8% delta à la fréquence précédente)
Aiguës 2 - 16 kHz
(+) | des sommets équilibrés - à seulement 2.5% de la médiane
(+) | les aigus sont linéaires (4.3% delta à la fréquence précédente)
Globalement 100 - 16 000 Hz
(+) | le son global est linéaire (8.1% différence à la médiane)
Par rapport à la même classe
» 1% de tous les appareils testés de cette catégorie étaient meilleurs, 1% similaires, 98% pires
» Le meilleur avait un delta de 6%, la moyenne était de 18%, le pire était de 132%.
Par rapport à tous les appareils testés
» 1% de tous les appareils testés étaient meilleurs, 1% similaires, 98% pires
» Le meilleur avait un delta de 4%, la moyenne était de 24%, le pire était de 134%.
Gestion de l'énergie
La consommation d'énergie est sans surprise. Nous avons mesuré un pic de 243 watts pendant le test de stress, mais il se stabilise rapidement autour de 170 watts. L'adaptateur compact de 250 watts est donc suffisant. La consommation en veille de 1,8 watts est relativement élevée.
| Éteint/en veille | |
| Au repos | |
| Fortement sollicité |
|
Légende:
min: | |
| Schenker XMG Fusion 16 M25 Ultra 9 275HX, GeForce RTX 5070 Laptop, Samsung 9100 Pro 2 TB, OLED, 2880x1800, 16" | Lenovo Legion Pro 5 16IAX10, RTX 5070 Ultra 7 255HX, GeForce RTX 5070 Laptop, SK Hynix HFS001TEJ9X115N, OLED, 2650x1600, 16" | Schenker XMG Core 16 M25 Ryzen AI 9 HX 370, GeForce RTX 5070 Laptop, Samsung 990 Pro 2 TB MZVL72T0HDLB, IPS, 2560x1600, 16" | Asus TUF Gaming A16 FA608UP R7 260, GeForce RTX 5070 Laptop, Western Digital PC SN5000S SDEQNSJ-1T00, IPS, 2560x1600, 16" | MSI Crosshair 16 HX AI D2XWGKG Ultra 9 275HX, GeForce RTX 5070 Laptop, Micron 2500 1TB MTFDKBA1T0QGN, IPS, 2560x1600, 16" | Aorus Elite 16 AE6H Ultra 9 275HX, GeForce RTX 5070 Laptop, Gigabyte AG470S1TB-SI B10, IPS, 2560x1600, 16" | Gigabyte Gaming A16 GA6H i7-13620H, GeForce RTX 5070 Laptop, Kingston OM8PGP41024Q-A0, IPS, 2560x1600, 16" | Moyenne NVIDIA GeForce RTX 5070 Laptop | Moyenne de la classe Gaming | |
|---|---|---|---|---|---|---|---|---|---|
| Power Consumption | -2% | 9% | 23% | -51% | -4% | 20% | 0% | -15% | |
| Idle Minimum * (Watt) | 15.3 | 10.6 31% | 7.4 52% | 4.6 70% | 26.2 -71% | 8.5 44% | 9 41% | 11.5 ? 25% | 13.5 ? 12% |
| Idle Average * (Watt) | 16.8 | 12.3 27% | 14.9 11% | 9.8 42% | 33.8 -101% | 13.6 19% | 11 35% | 16.3 ? 3% | 19.3 ? -15% |
| Idle Maximum * (Watt) | 17.3 | 18.6 -8% | 15.2 12% | 10.2 41% | 34 -97% | 22 -27% | 23 -33% | 21.6 ? -25% | 25.8 ? -49% |
| Load Average * (Watt) | 94.7 | 104 -10% | 100.8 -6% | 76.1 20% | 112 -18% | 113 -19% | 91 4% | 102 ? -8% | 110.9 ? -17% |
| Cyberpunk 2077 ultra external monitor * (Watt) | 180.9 | 227 -25% | 181.4 -0% | 198.1 -10% | 220 -22% | 219 -21% | 130 28% | ||
| Cyberpunk 2077 ultra * (Watt) | 185.3 | 231 -25% | 184.8 -0% | 198.9 -7% | 224 -21% | 223 -20% | 132.5 28% | ||
| Load Maximum * (Watt) | 242.7 | 248 -2% | 251.1 -3% | 235.2 3% | 315 -30% | 257 -6% | 155 36% | 227 ? 6% | 260 ? -7% |
* ... Moindre est la valeur, meilleures sont les performances
Consommation électrique Cyberpunk / Stress test
Consommation électrique du moniteur externe
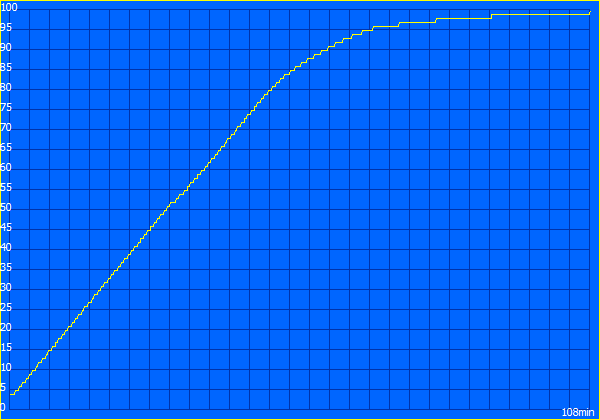
Durée de vie de la batterie
Malgré l'écran OLED, l'autonomie de la batterie est très similaire à celle du Core 16 avec écran IPS. Lors du test Wi-Fi avec 150 cd/m², nous avons mesuré 10:15 heures et 7:39 heures à pleine luminosité.

| Schenker XMG Fusion 16 M25 Ultra 9 275HX, GeForce RTX 5070 Laptop, 99.8 Wh | Lenovo Legion Pro 5 16IAX10, RTX 5070 Ultra 7 255HX, GeForce RTX 5070 Laptop, 80 Wh | Schenker XMG Core 16 M25 Ryzen AI 9 HX 370, GeForce RTX 5070 Laptop, 99.8 Wh | Asus TUF Gaming A16 FA608UP R7 260, GeForce RTX 5070 Laptop, 90 Wh | MSI Crosshair 16 HX AI D2XWGKG Ultra 9 275HX, GeForce RTX 5070 Laptop, 90 Wh | Aorus Elite 16 AE6H Ultra 9 275HX, GeForce RTX 5070 Laptop, 99 Wh | Gigabyte Gaming A16 GA6H i7-13620H, GeForce RTX 5070 Laptop, 76 Wh | Moyenne de la classe Gaming | |
|---|---|---|---|---|---|---|---|---|
| Battery Runtime | -40% | -2% | 21% | 8% | -17% | -25% | -33% | |
| WiFi Websurfing (h) | 10.3 | 6.2 -40% | 10.9 6% | 13 26% | 11.1 8% | 8.5 -17% | 7.7 -25% | 6.79 ? -34% |
| WiFi Websurfing max. Brightness (h) | 7.7 | 7 -9% | 8.9 16% | 5.3 ? -31% |
Notebookcheck note globale
Schenker XMG Fusion 16 M25
- 12/29/2025 v8
Andreas Osthoff
 Total Sustainability Score:
 Comparaison des alternatives possibles
Image | Modèle | Prix | Poids | Épaisseur | Écran |
|---|---|---|---|---|---|
1. 87.5%  | Schenker XMG Fusion 16 M25 Intel Core Ultra 9 275HX ⎘ NVIDIA GeForce RTX 5070 Laptop ⎘ 64 Go Mémoire, 2048 Go SSD | Prix de liste: 2700€ | 2.1 kg | 23 mm | 16.00" 2880x1800 212 PPI OLED |
2. 86.2%  | Lenovo Legion Pro 5 16IAX10, RTX 5070 Intel Core Ultra 7 255HX ⎘ NVIDIA GeForce RTX 5070 Laptop ⎘ 32 Go Mémoire, 1024 Go SSD | Amazon: 1. $1,784.00 Lenovo Legion Pro 5 16IAX10 ... 2. $1,929.00 Lenovo 2025 Gaming Laptop | ... 3. $1,919.00 Lenovo Legion Pro 5 16IAX10 ... Prix de liste: 1800 Euro | 2.3 kg | 25.95 mm | 16.00" 2650x1600 189 PPI OLED |
3. 86.2%  | Schenker XMG Core 16 M25 AMD Ryzen AI 9 HX 370 ⎘ NVIDIA GeForce RTX 5070 Laptop ⎘ 64 Go Mémoire, 2048 Go SSD | Prix de liste: 2100€ | 2.1 kg | 23 mm | 16.00" 2560x1600 189 PPI IPS |
4. 83.8%  | Asus TUF Gaming A16 FA608UP AMD Ryzen 7 260 ⎘ NVIDIA GeForce RTX 5070 Laptop ⎘ 32 Go Mémoire, 1024 Go SSD | Amazon: $1,427.00 Prix de liste: 2199€ | 2.2 kg | 25.7 mm | 16.00" 2560x1600 189 PPI IPS |
5. 81.9%  | MSI Crosshair 16 HX AI D2XWGKG Intel Core Ultra 9 275HX ⎘ NVIDIA GeForce RTX 5070 Laptop ⎘ 16 Go Mémoire, 1024 Go SSD | Amazon: 1. $1,710.99 msi Crosshair 18 HX AI 18" 2... 2. $54.99 Dongerdi 240W Charger Fit fo... 3. $1,699.00 msi Crosshair 16 HX AI 16" Q... Prix de liste: 2500 EUR | 2.5 kg | 27.9 mm | 16.00" 2560x1600 189 PPI IPS |
6. 84.4%  | Aorus Elite 16 AE6H Intel Core Ultra 9 275HX ⎘ NVIDIA GeForce RTX 5070 Laptop ⎘ 32 Go Mémoire, 1024 Go SSD | Amazon: 1. $46.99 Smatree Hard Laptop Sleeve C... 2. $45.99 Smatree Hard EVA Protective ... 3. $55.99 Smatree MS89 Hard Protective... Prix de liste: 2300 EUR | 2.4 kg | 26 mm | 16.00" 2560x1600 189 PPI IPS |
7. 80.1%  | Gigabyte Gaming A16 GA6H Intel Core i7-13620H ⎘ NVIDIA GeForce RTX 5070 Laptop ⎘ 16 Go Mémoire, 1024 Go SSD | Amazon: 1. $22.98 Puccy 3 Pack Screen Protecto... 2. $12.98 Puccy 2 Pack Touch Pad Film ... 3. $18.98 Puccy 2 Pack Film Protector,... Prix de liste: 1700 EUR | 2.3 kg | 23 mm | 16.00" 2560x1600 189 PPI IPS |
Transparency
La sélection des appareils à examiner est effectuée par notre équipe éditoriale. L'échantillon de test a été prêté à l'auteur par le fabricant ou le détaillant pour les besoins de cet examen. Le prêteur n'a pas eu d'influence sur cette évaluation et le fabricant n'a pas reçu de copie de cette évaluation avant sa publication. Il n'y avait aucune obligation de publier cet article. En tant que média indépendant, Notebookcheck n'est pas soumis à l'autorité des fabricants, des détaillants ou des éditeurs.
Voici comment Notebookcheck teste
Chaque année, Notebookcheck examine de manière indépendante des centaines d'ordinateurs portables et de smartphones en utilisant des procédures standardisées afin de garantir que tous les résultats sont comparables. Nous avons continuellement développé nos méthodes de test depuis environ 20 ans et avons établi des normes industrielles dans le processus. Dans nos laboratoires de test, des équipements de mesure de haute qualité sont utilisés par des techniciens et des rédacteurs expérimentés. Ces tests impliquent un processus de validation en plusieurs étapes. Notre système d'évaluation complexe repose sur des centaines de mesures et de points de référence bien fondés, ce qui garantit l'objectivité.