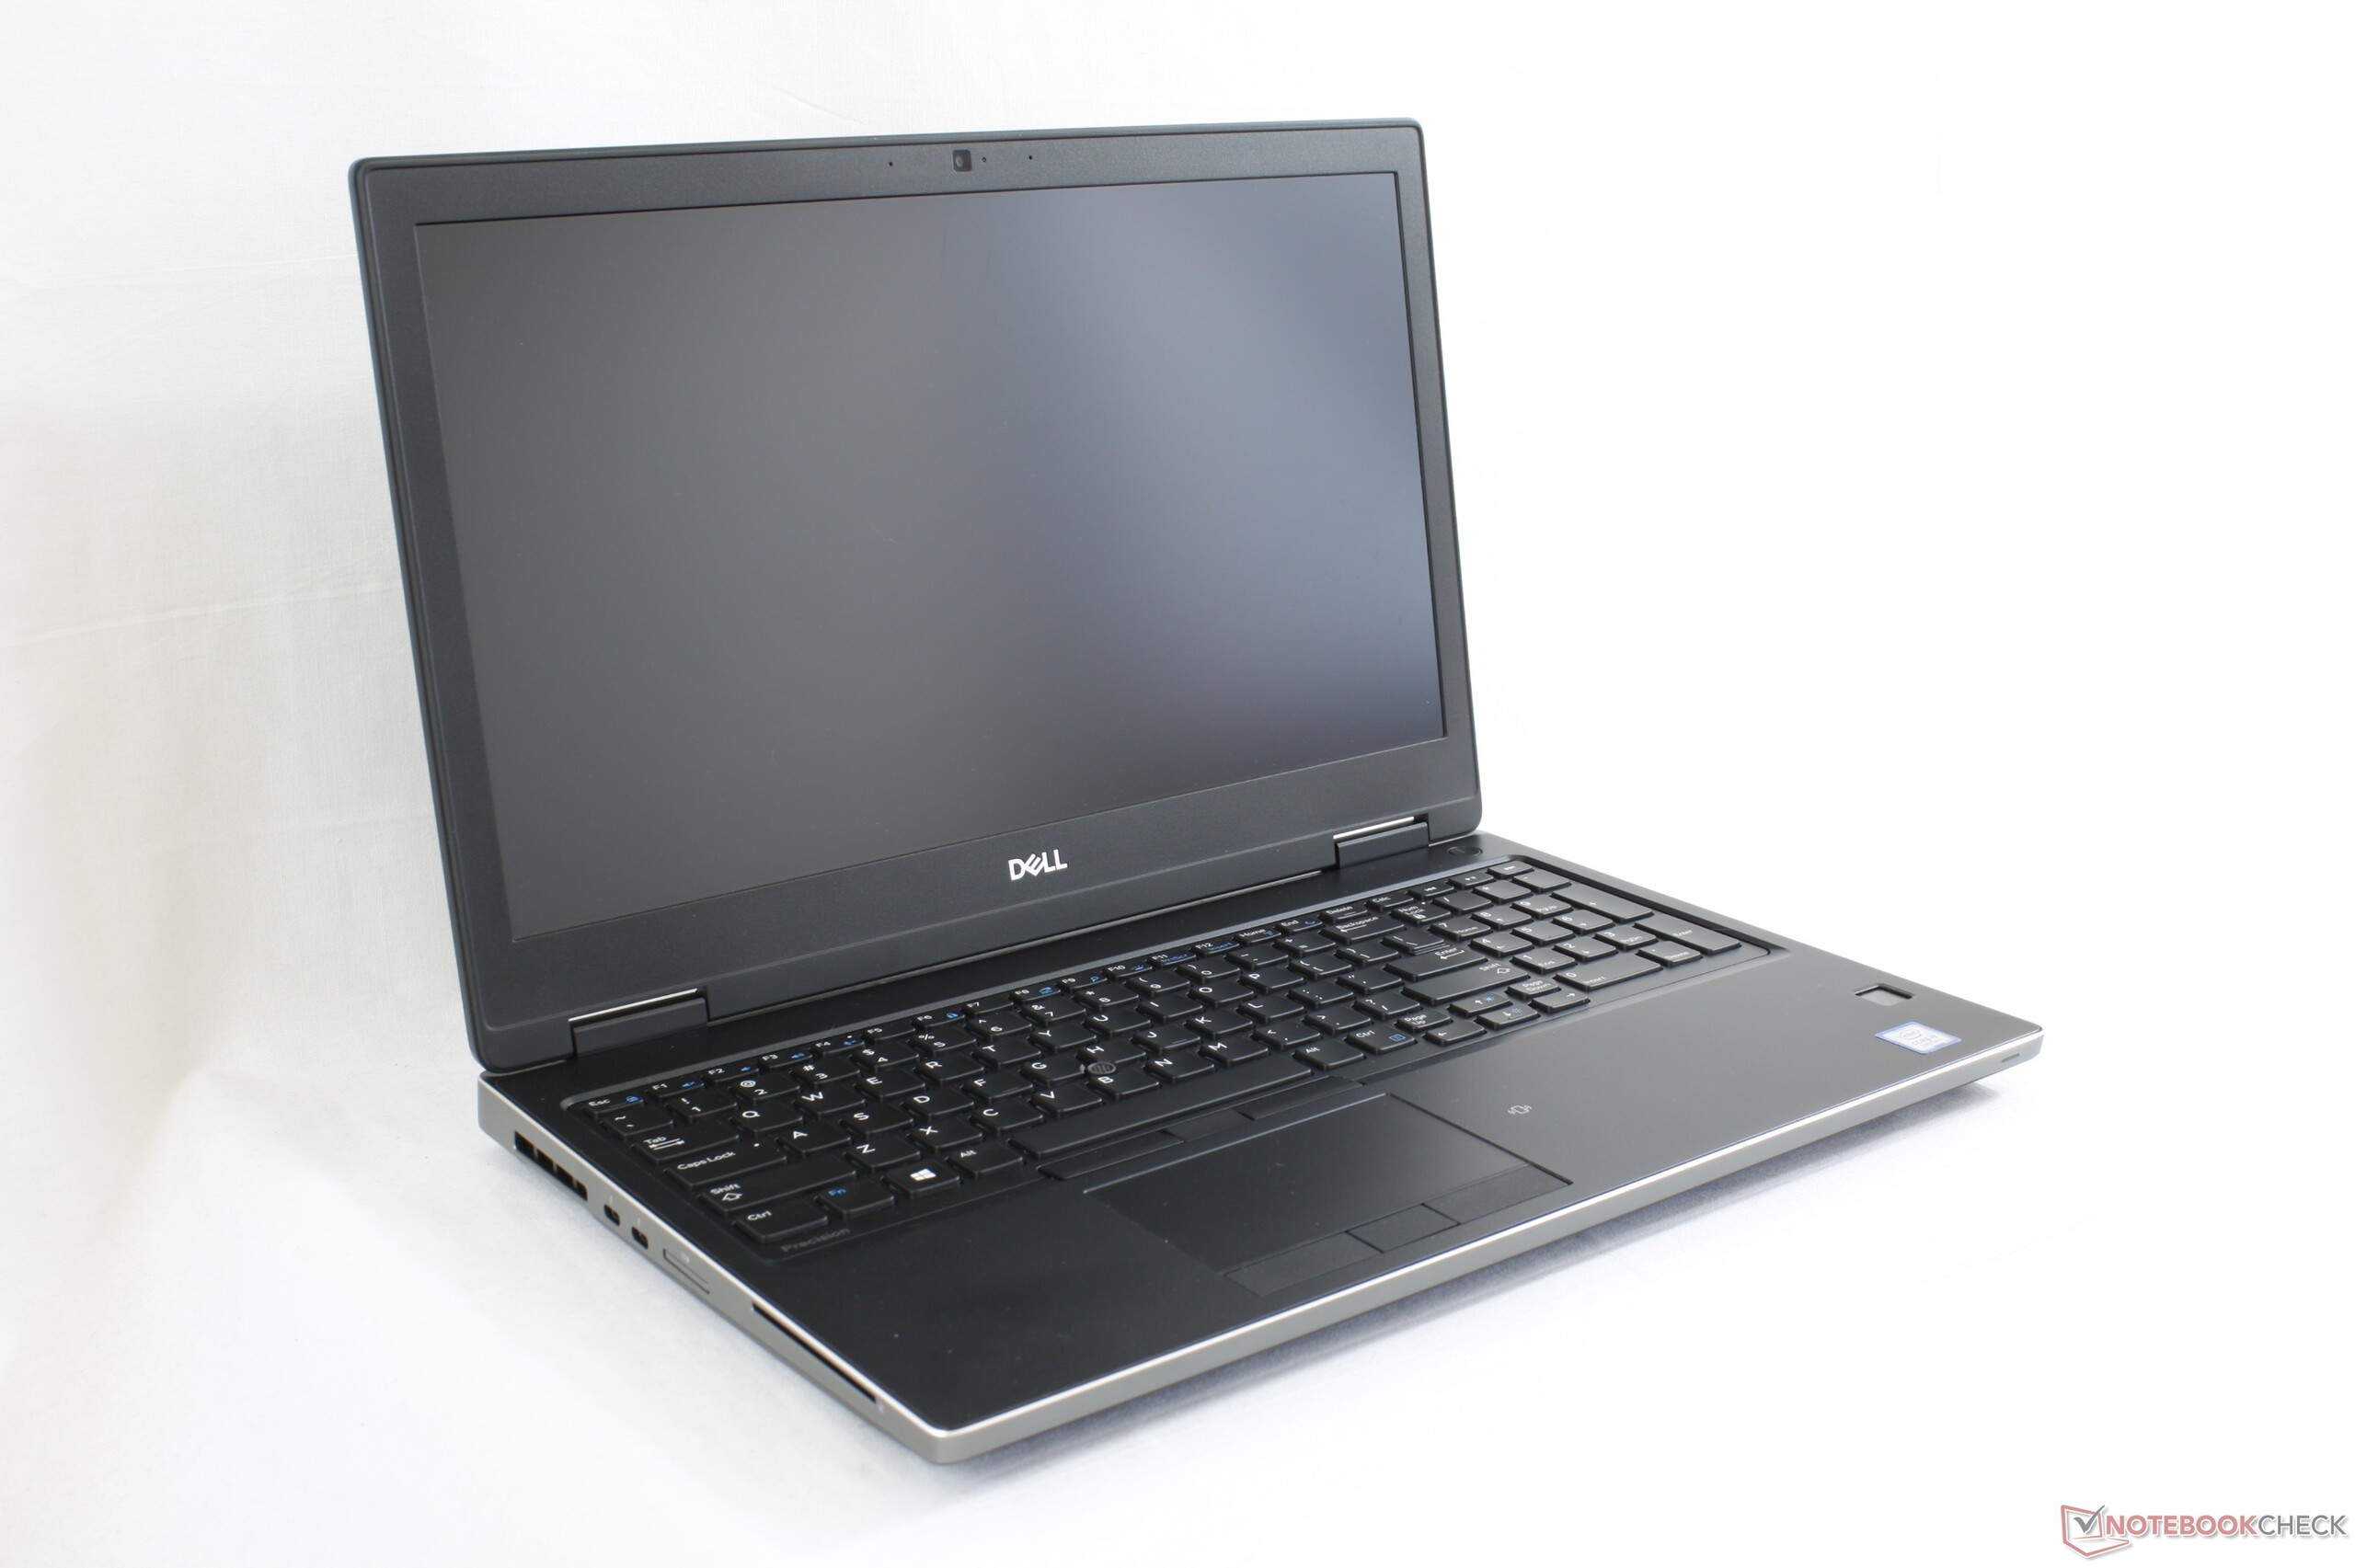
Courte critique de la station de travail Dell Precision 7530 (i9-8950HK, Quadro P3200, UHD)
| SD Card Reader | |
| average JPG Copy Test (av. of 3 runs) | |
| Dell Precision 7530 (Toshiba Exceria Pro SDXC 64 GB UHS-II) | |
| Gigabyte Aero 15X v8 (Toshiba Exceria Pro SDXC 64 GB UHS-II) | |
| Dell Precision 3530 (Toshiba Exceria Pro SDXC 64 GB UHS-II) | |
| Lenovo ThinkPad P1-20MD002LUS (Toshiba Exceria Pro SDXC 64 GB UHS-II) | |
| Dell Precision 5530 2-in-1 (Toshiba Exceria Pro M501 UHS-II) | |
| maximum AS SSD Seq Read Test (1GB) | |
| Gigabyte Aero 15X v8 (Toshiba Exceria Pro SDXC 64 GB UHS-II) | |
| Lenovo ThinkPad P1-20MD002LUS (Toshiba Exceria Pro SDXC 64 GB UHS-II) | |
| Dell Precision 5530 2-in-1 (Toshiba Exceria Pro M501 UHS-II) | |
| Dell Precision 3530 (Toshiba Exceria Pro SDXC 64 GB UHS-II) | |
| Dell Precision 7530 (Toshiba Exceria Pro SDXC 64 GB UHS-II) | |
| |||||||||||||||||||||||||
Homogénéité de la luminosité: 85 %
Valeur mesurée au centre, sur batterie: 292.8 cd/m²
Contraste: 813:1 (Valeurs des noirs: 0.36 cd/m²)
ΔE ColorChecker Calman: 3.48 | ∀{0.5-29.43 Ø4.72}
calibrated: 3.13
ΔE Greyscale Calman: 4.1 | ∀{0.09-98 Ø4.97}
99.6% sRGB (Argyll 1.6.3 3D)
84.4% AdobeRGB 1998 (Argyll 1.6.3 3D)
96.2% AdobeRGB 1998 (Argyll 3D)
99.4% sRGB (Argyll 3D)
82.5% Display P3 (Argyll 3D)
Gamma: 2.2
CCT: 6740 K
| Dell Precision 7530 Sharp LQ156D1, IPS, 15.6", 3840x2160 | Lenovo ThinkPad P1-20MD002LUS B156ZAN03.2, IPS, 15.6", 3840x2160 | Dell Precision 5530 2-in-1 Sharp SHP148D, IPS, 15.6", 3840x2160 | Dell Precision 3530 BOE BOE06F1, IPS, 15.6", 1920x1080 | HP ZBook 15u G5 2ZC05EA CMN15E7, IPS LED, 15.6", 1920x1080 | Eurocom Tornado F5W AUO52ED B156HTN05.2, TN, 15.6", 1920x1080 | |
|---|---|---|---|---|---|---|
| Display | 3% | 5% | -15% | -46% | -22% | |
| Display P3 Coverage (%) | 82.5 | 86.4 5% | 91.2 11% | 72.8 -12% | 43.05 -48% | 66.1 -20% |
| sRGB Coverage (%) | 99.4 | 99.9 1% | 99.9 1% | 94.6 -5% | 64.7 -35% | 87.7 -12% |
| AdobeRGB 1998 Coverage (%) | 96.2 | 99.1 3% | 99.4 3% | 69.3 -28% | 44.5 -54% | 64.2 -33% |
| Response Times | -38% | -42% | -24% | -14% | 51% | |
| Response Time Grey 50% / Grey 80% * (ms) | 35.2 ? | 55.6 ? -58% | 49.6 ? -41% | 40.4 ? -15% | 41.6 ? -18% | 23.2 ? 34% |
| Response Time Black / White * (ms) | 26.4 ? | 30.8 ? -17% | 37.6 ? -42% | 34.8 ? -32% | 28.8 ? -9% | 8.5 ? 68% |
| PWM Frequency (Hz) | 198.4 ? | 990 ? | 1053 ? | 25770 ? | ||
| Screen | 5% | 14% | -16% | -22% | -53% | |
| Brightness middle (cd/m²) | 292.8 | 397.6 36% | 430.9 47% | 285.7 -2% | 229 -22% | 405.7 39% |
| Brightness (cd/m²) | 295 | 396 34% | 398 35% | 275 -7% | 212 -28% | 397 35% |
| Brightness Distribution (%) | 85 | 85 0% | 79 -7% | 85 0% | 88 4% | 92 8% |
| Black Level * (cd/m²) | 0.36 | 0.25 31% | 0.35 3% | 0.31 14% | 0.23 36% | 0.65 -81% |
| Contrast (:1) | 813 | 1590 96% | 1231 51% | 922 13% | 996 23% | 624 -23% |
| Colorchecker dE 2000 * | 3.48 | 4.95 -42% | 3.29 5% | 5.84 -68% | 4.2 -21% | 8.5 -144% |
| Colorchecker dE 2000 max. * | 6.81 | 10.23 -50% | 7.46 -10% | 8.76 -29% | 18 -164% | 16.2 -138% |
| Colorchecker dE 2000 calibrated * | 3.13 | 4.22 -35% | 3.58 -14% | 3.14 -0% | 4.2 -34% | |
| Greyscale dE 2000 * | 4.1 | 5.1 -24% | 2.6 37% | 6.5 -59% | 2 51% | 11.6 -183% |
| Gamma | 2.2 100% | 2.234 98% | 2.19 100% | 2.383 92% | 2.23 99% | 2.37 93% |
| CCT | 6740 96% | 7543 86% | 6870 95% | 7176 91% | 6292 103% | 10468 62% |
| Color Space (Percent of AdobeRGB 1998) (%) | 84.4 | 87.6 4% | 87.2 3% | 62 -27% | 41 -51% | 57 -32% |
| Color Space (Percent of sRGB) (%) | 99.6 | 100 0% | 100 0% | 94 -6% | 64.5 -35% | 87 -13% |
| Moyenne finale (programmes/paramètres) | -10% /
-1% | -8% /
5% | -18% /
-16% | -27% /
-25% | -8% /
-33% |
* ... Moindre est la valeur, meilleures sont les performances
Temps de réponse de l'écran
| ↔ Temps de réponse noir à blanc | ||
|---|---|---|
| 26.4 ms ... hausse ↗ et chute ↘ combinées | ↗ 14 ms hausse | 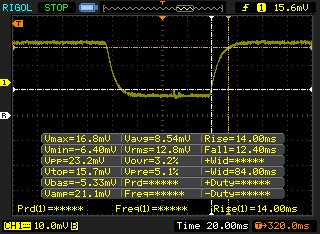 |
| ↘ 12.4 ms chute | ||
| L'écran souffre de latences relativement élevées, insuffisant pour le jeu. En comparaison, tous les appareils testés affichent entre 0.1 (minimum) et 240 (maximum) ms. » 66 % des appareils testés affichent de meilleures performances. Cela signifie que les latences relevées sont moins bonnes que la moyenne (19.8 ms) de tous les appareils testés. | ||
| ↔ Temps de réponse gris 50% à gris 80% | ||
| 35.2 ms ... hausse ↗ et chute ↘ combinées | ↗ 17.2 ms hausse | 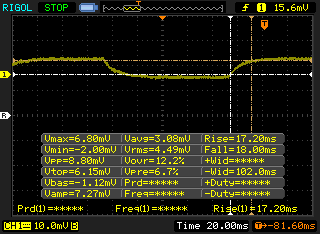 |
| ↘ 18 ms chute | ||
| L'écran souffre de latences très élevées, à éviter pour le jeu. En comparaison, tous les appareils testés affichent entre 0.165 (minimum) et 636 (maximum) ms. » 49 % des appareils testés affichent de meilleures performances. Cela signifie que les latences relevées sont moins bonnes que la moyenne (31 ms) de tous les appareils testés. | ||
Scintillement / MLI (Modulation de largeur d'impulsion)
| Scintillement / MLI (Modulation de largeur d'impulsion) décelé | 198.4 Hz | ≤ 25 Niveau de luminosité | 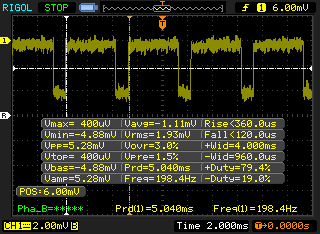 |
Le rétroéclairage de l'écran scintille à la fréquence de 198.4 Hz (certainement du fait de l'utilisation d'une MDI - Modulation de largeur d'impulsion) à un niveau de luminosité inférieur ou égal à 25 % . Aucun scintillement ne devrait être perceptible au-dessus de cette valeur. La fréquence de rafraîchissement de 198.4 Hz est relativement faible, les personnes les plus sensibles devraient percevoir un scintillement et être sujettes à une fatigue oculaire accrue (avec le niveau de luminosité indiqué) En comparaison, 52 % des appareils testés n'emploient pas MDI pour assombrir leur écran. Nous avons relevé une moyenne à 7769 (minimum : 5 - maximum : 343500) Hz dans le cas où une MDI était active. | |||
| wPrime 2.10 - 1024m | |
| Asus ROG Strix GL702ZC-GC204T | |
| Dell Precision 7510 (4K IGZO) | |
| Eurocom Tornado F5W | |
| Moyenne Intel Core i9-8950HK (n=1) | |
| Dell Precision 5530 2-in-1 | |
| Eurocom Sky X4C | |
* ... Moindre est la valeur, meilleures sont les performances
| PCMark 8 | |
| Home Score Accelerated v2 | |
| Eurocom Tornado F5W | |
| Dell Precision 3530 | |
| Dell Precision 7530 | |
| Lenovo ThinkPad P1-20MD002LUS | |
| Dell Precision 5530 2-in-1 | |
| Work Score Accelerated v2 | |
| Dell Precision 7530 | |
| Eurocom Tornado F5W | |
| Dell Precision 3530 | |
| Lenovo ThinkPad P1-20MD002LUS | |
| Dell Precision 5530 2-in-1 | |
| Creative Score Accelerated v2 | |
| Eurocom Tornado F5W | |
| Dell Precision 3530 | |
| Lenovo ThinkPad P1-20MD002LUS | |
| PCMark 8 Home Score Accelerated v2 | 4200 points | |
| PCMark 8 Work Score Accelerated v2 | 5568 points | |
| PCMark 10 Score | 5738 points | |
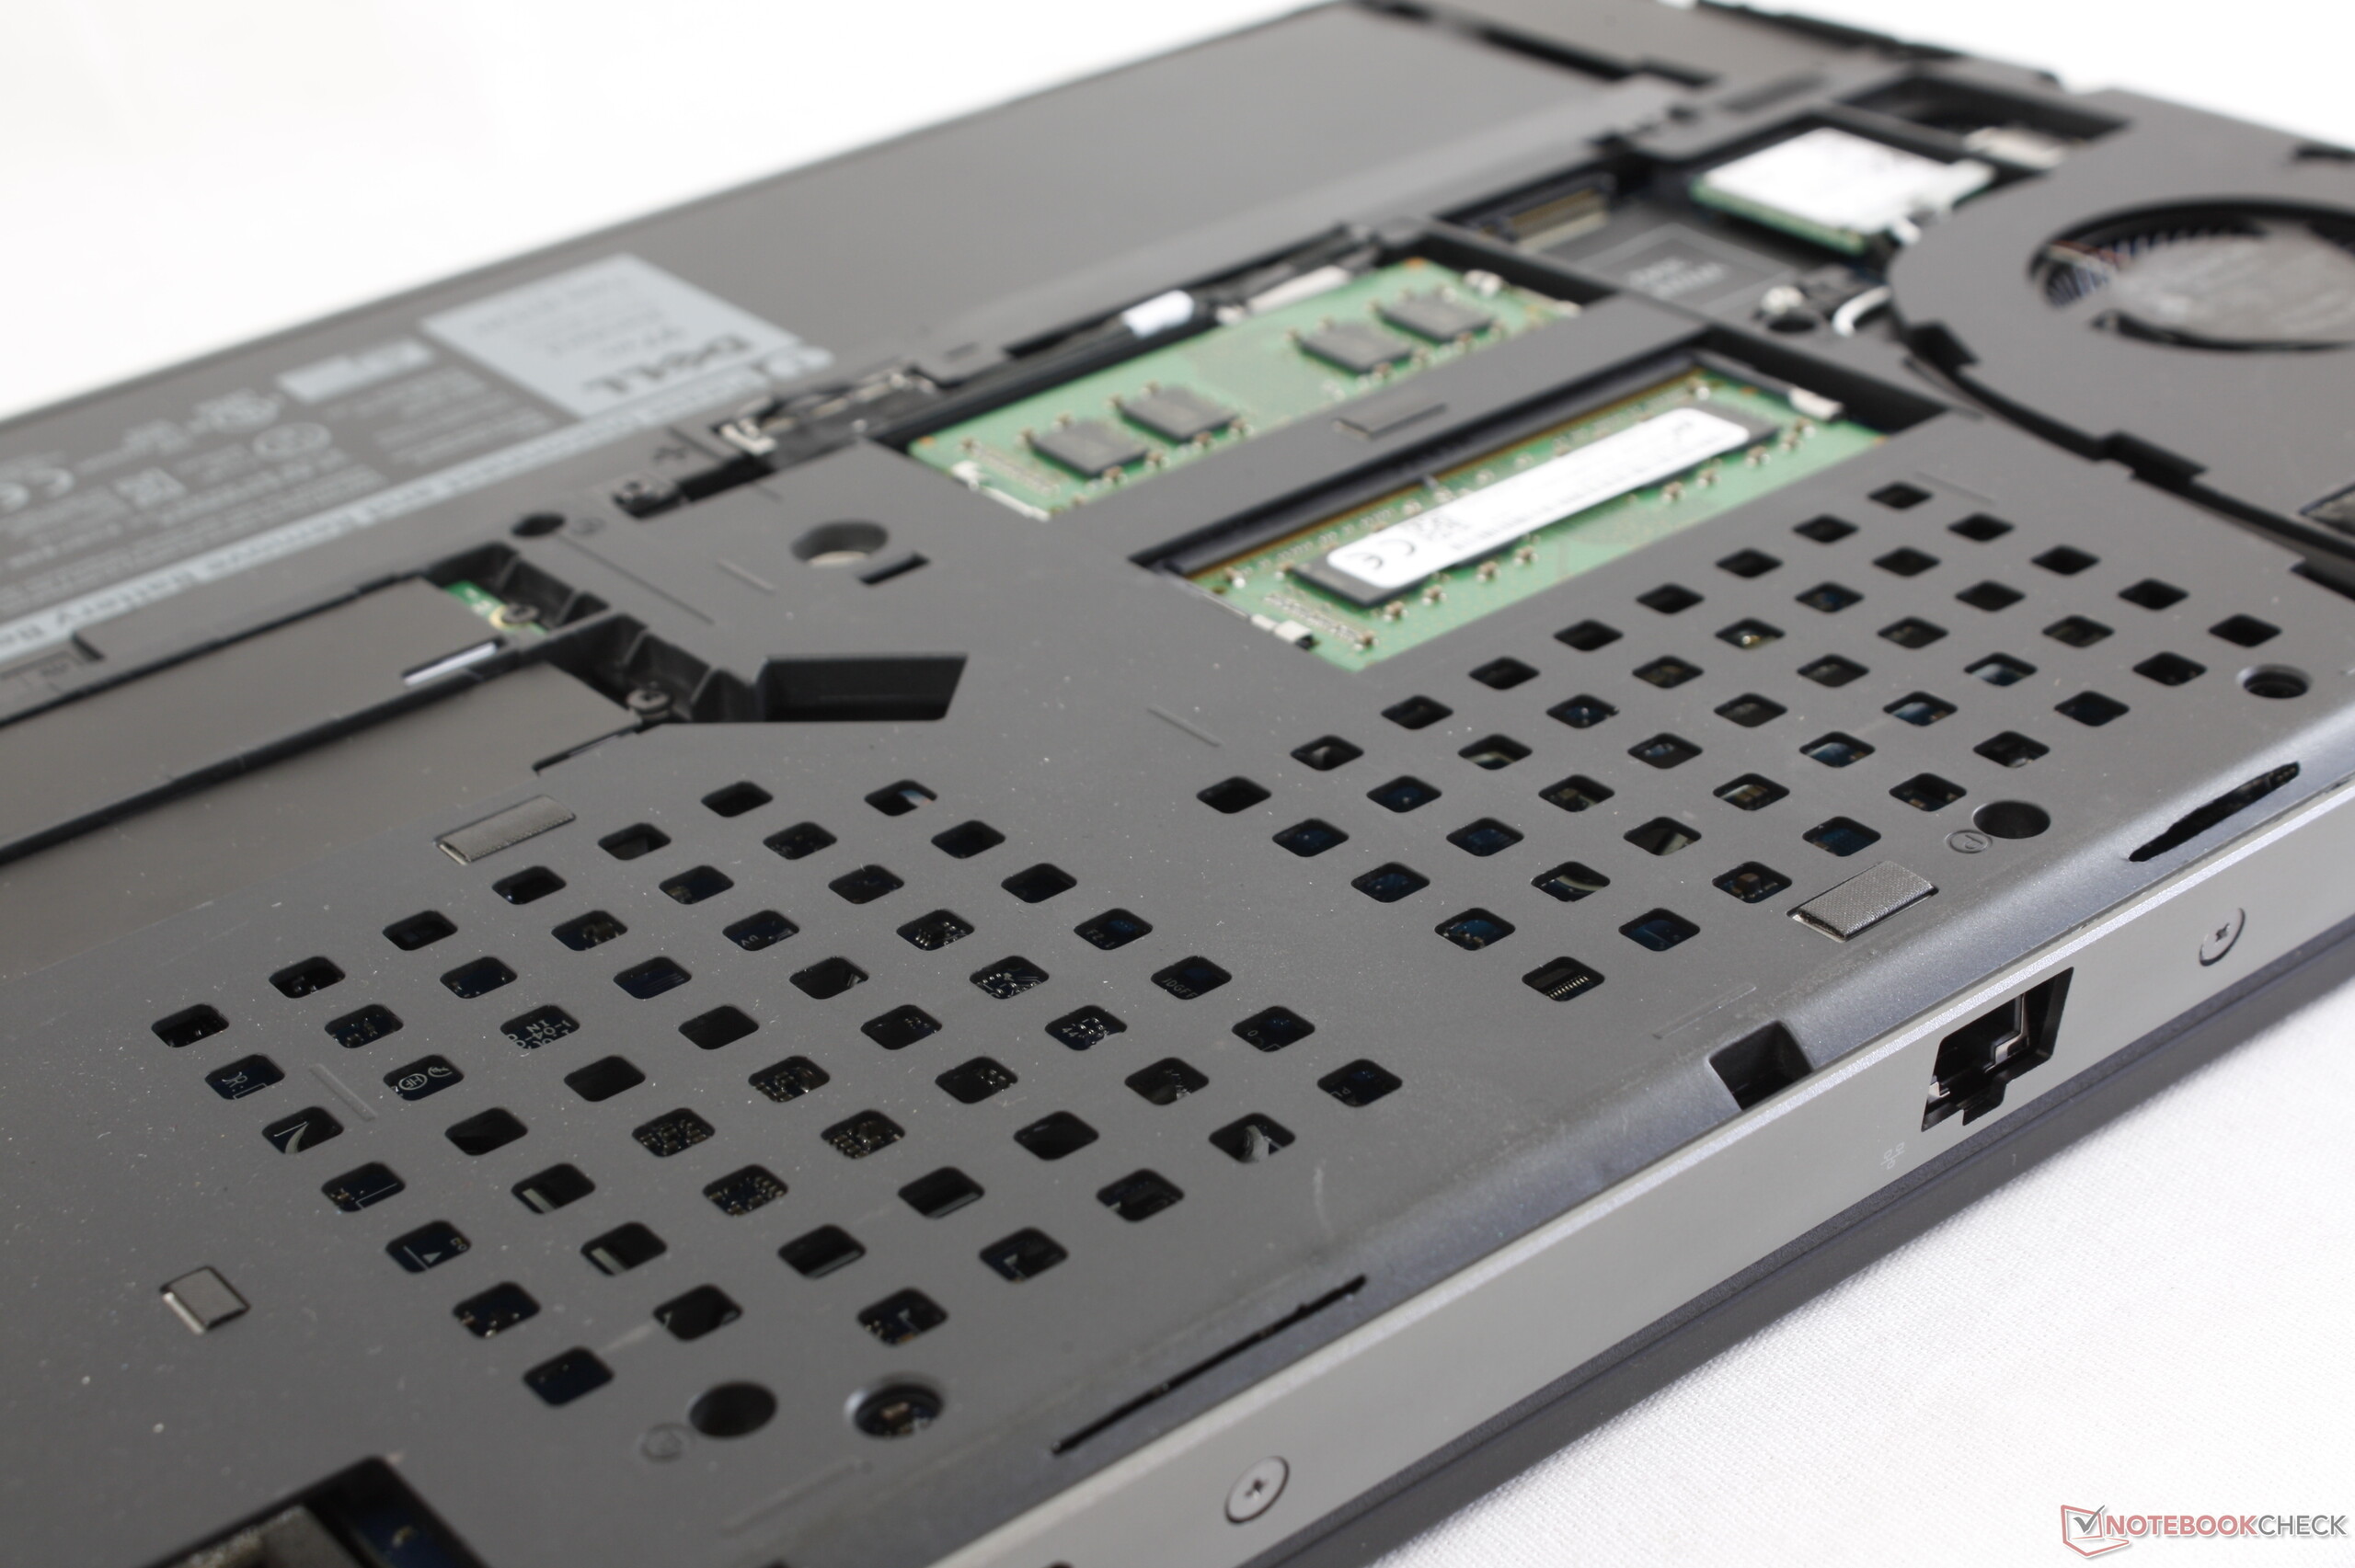
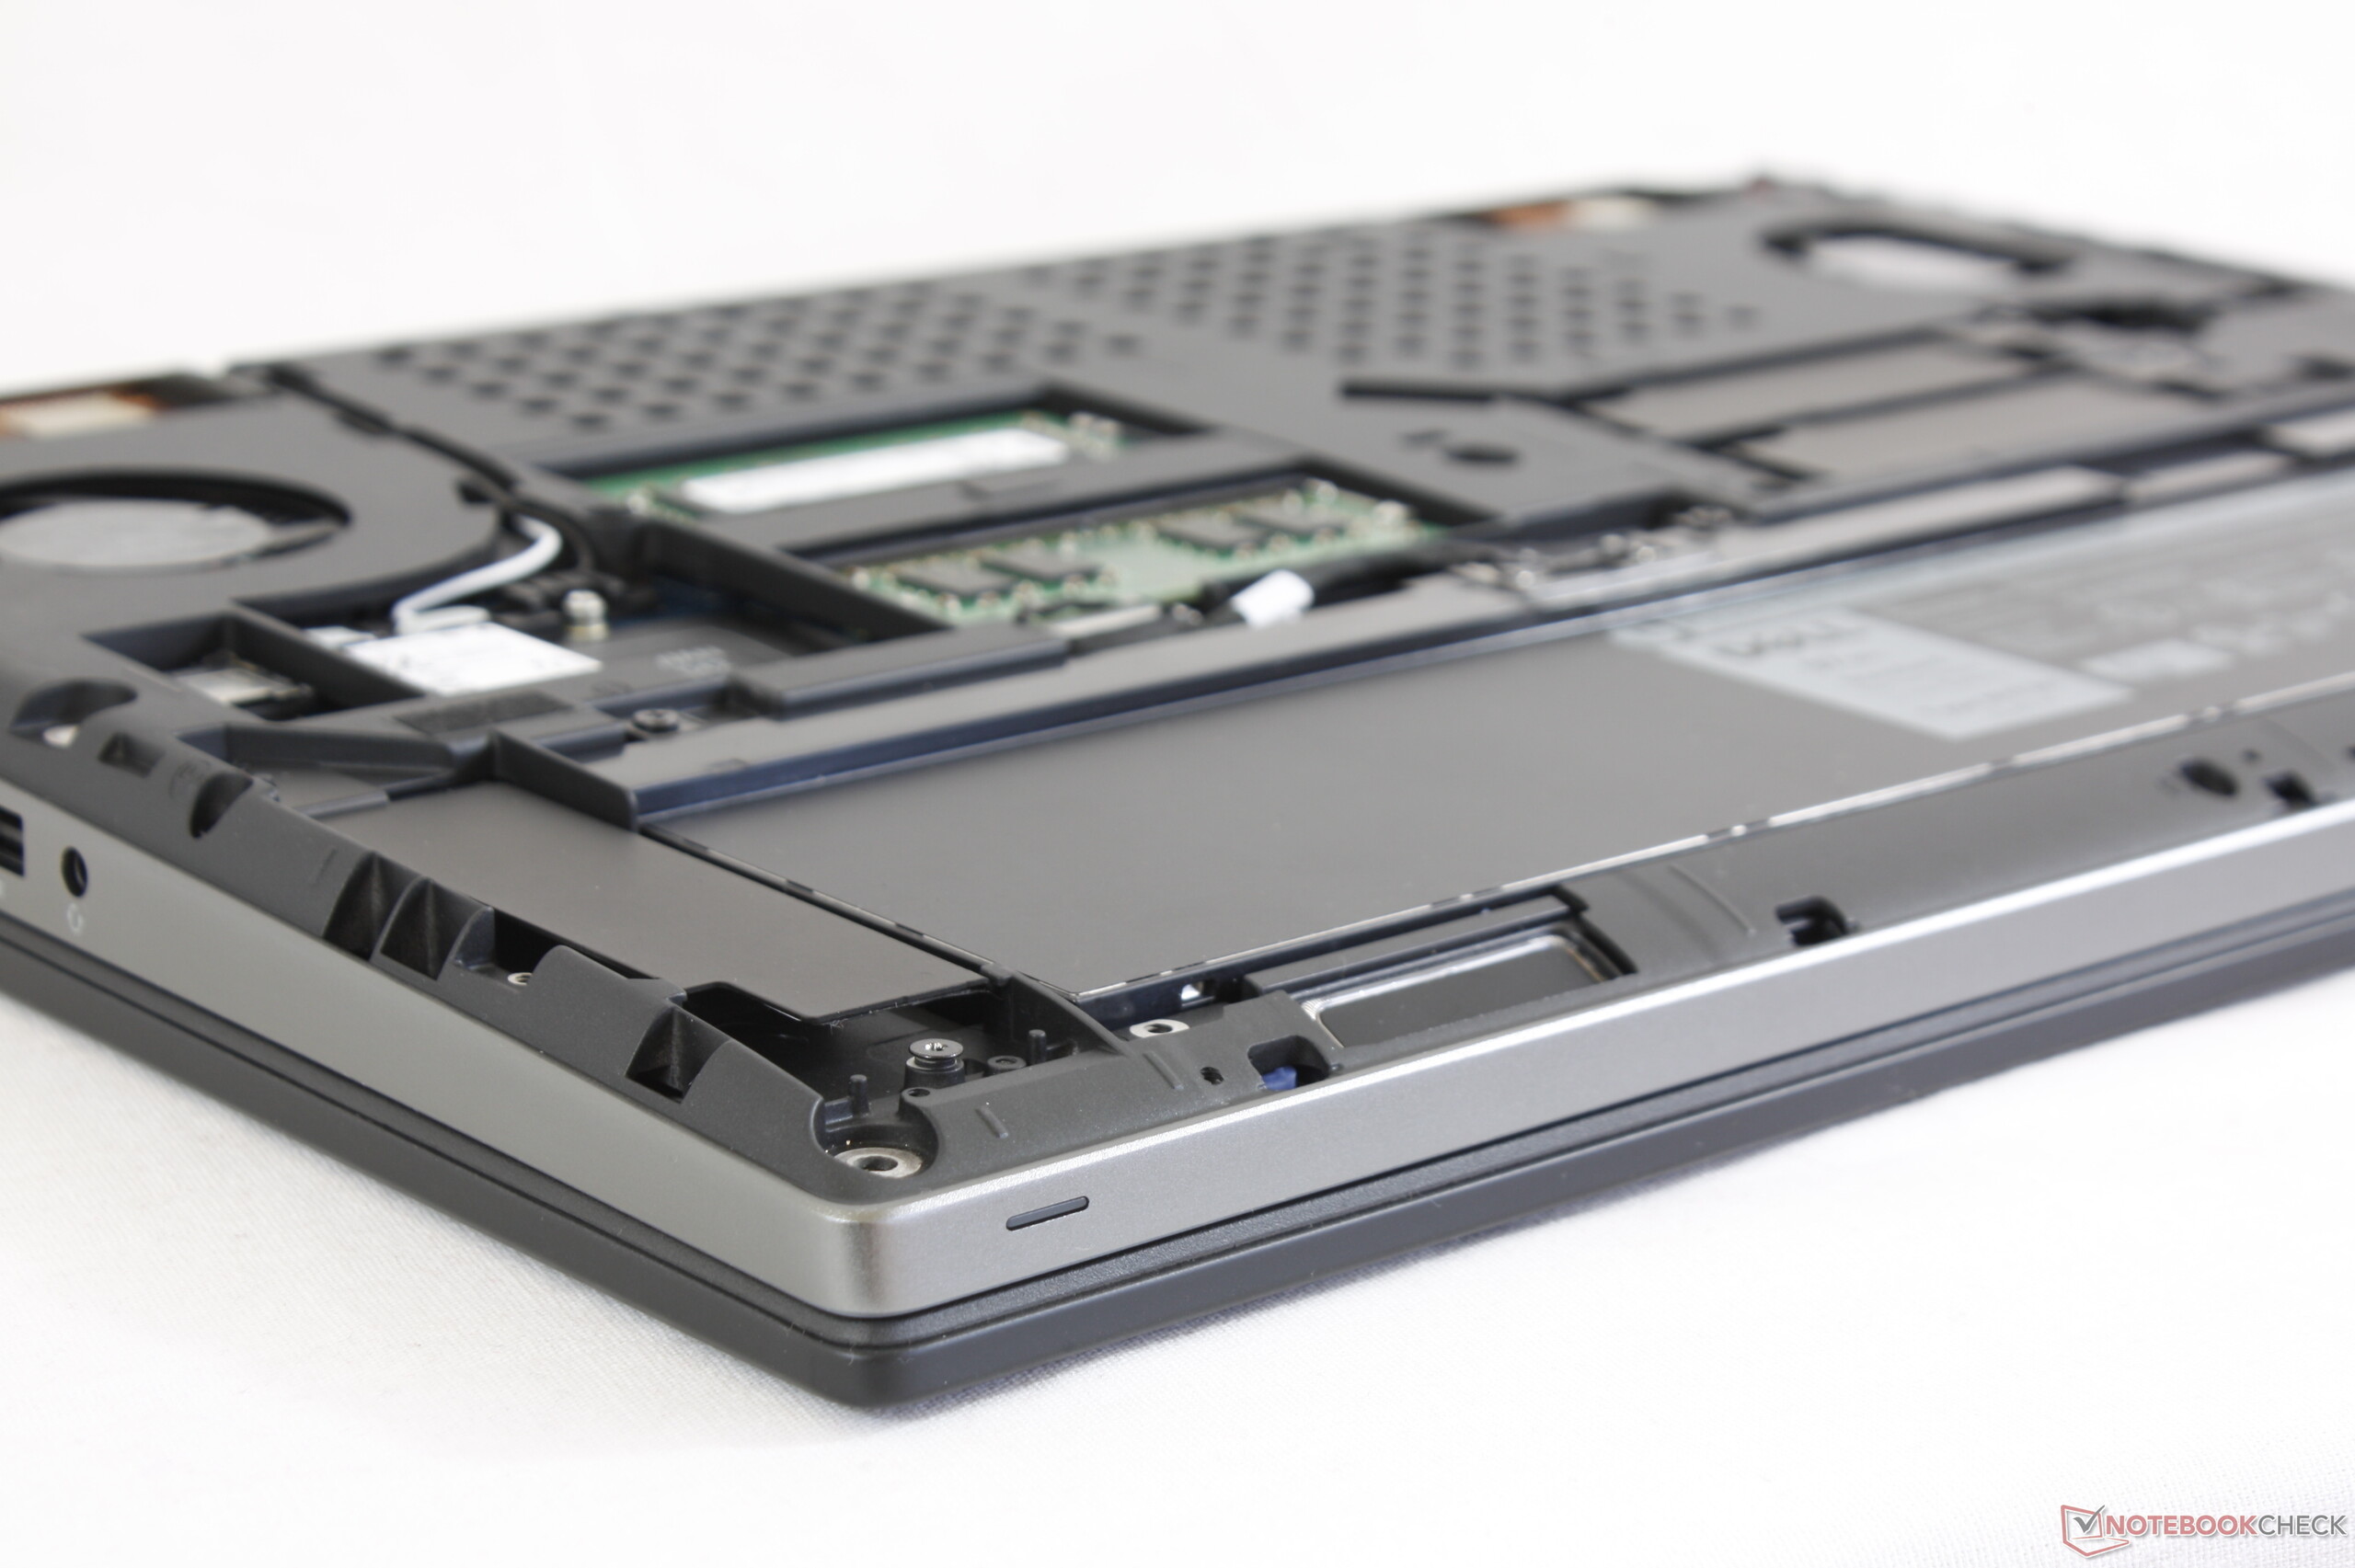
Aide | ||
| Dell Precision 7530 Samsung PM961 NVMe MZVLW512HMJP | Lenovo ThinkPad P1-20MD002LUS Samsung SSD PM981 MZVLB2T0HMLB | Dell Precision 5530 2-in-1 SK Hynix PC401 512GB M.2 (HFS512GD9TNG) | Dell Precision 3530 SK hynix PC400 512 GB | Eurocom Tornado F5W Samsung SSD 960 Pro 512 GB m.2 | HP ZBook 15u G5 2ZC05EA Toshiba XG5 KXG50ZNV256G | |
|---|---|---|---|---|---|---|
| CrystalDiskMark 5.2 / 6 | 12% | 1% | 11% | 64% | -15% | |
| Write 4K (MB/s) | 105.9 | 108 2% | 128.9 22% | 113.6 7% | 211.4 100% | 98.8 -7% |
| Read 4K (MB/s) | 23.87 | 37.24 56% | 45.7 91% | 41.18 73% | 56.7 138% | 33.98 42% |
| Write Seq (MB/s) | 1542 | 1476 -4% | 635 -59% | 1417 -8% | 1983 29% | 395.7 -74% |
| Read Seq (MB/s) | 1916 | 1367 -29% | 2065 8% | 1896 -1% | 2841 48% | 2063 8% |
| Write 4K Q32T1 (MB/s) | 305.4 | 302.4 -1% | 336.6 10% | 355 16% | 571 87% | 352.3 15% |
| Read 4K Q32T1 (MB/s) | 358.4 | 375 5% | 393.6 10% | 404.3 13% | 606 69% | 281.8 -21% |
| Write Seq Q32T1 (MB/s) | 1572 | 2433 55% | 662 -58% | 1411 -10% | 1986 26% | 355 -77% |
| Read Seq Q32T1 (MB/s) | 3061 | 3493 14% | 2664 -13% | 3095 1% | 3467 13% | 2775 -9% |
| Write 4K Q8T8 (MB/s) | 361 | |||||
| Read 4K Q8T8 (MB/s) | 447.3 |

| 3DMark 06 Standard Score | 24576 points | |
| 3DMark Vantage P Result | 45851 points | |
| 3DMark 11 Performance | 14244 points | |
| 3DMark Ice Storm Standard Score | 49190 points | |
| 3DMark Cloud Gate Standard Score | 30100 points | |
| 3DMark Fire Strike Score | 10128 points | |
| 3DMark Time Spy Score | 3979 points | |
Aide | ||
| The Witcher 3 - 1920x1080 Ultra Graphics & Postprocessing (HBAO+) | |
| Eurocom Tornado F5W | |
| Moyenne NVIDIA Quadro P3200 (41.6 - 46.4, n=4) | |
| Nvidia GeForce GTX 1060 Founders Edition 6 GB | |
| Dell Precision 7530 | |
| Dell Precision 5530 Xeon E-2176M | |
| Lenovo ThinkPad P1-20MD002LUS | |
| HP ZBook 15 G4-Y4E80AV | |
| Lenovo ThinkPad P52 20MAS03N00 | |
| Dell Precision 3530 | |
| Bas | Moyen | Élevé | Ultra | 4K | |
|---|---|---|---|---|---|
| The Witcher 3 (2015) | 208.9 | 141 | 80.6 | 41.6 | 28.2 |
| Batman: Arkham Knight (2015) | 140 | 127 | 89 | 59 | 29 |
| Rise of the Tomb Raider (2016) | 180.9 | 139.7 | 77.4 | 65.8 | 27.6 |
| Dell Precision 7530 i9-8950HK, Quadro P3200 | HP ZBook 15 G4-Y4E80AV E3-1535M v6, Quadro M2200 | Dell Precision 7510 (4K IGZO) E3-1535M v5, Quadro M2000M | Lenovo ThinkPad P52 20MAS03N00 i7-8750H, Quadro P1000 | Lenovo ThinkPad P1-20MD002LUS E-2176M, Quadro P2000 Max-Q | Eurocom Tornado F5W E3-1280 v5, Quadro P5000 | |
|---|---|---|---|---|---|---|
| Noise | 3% | -3% | 6% | 3% | 0% | |
| arrêt / environnement * (dB) | 28.3 | 29.5 -4% | 28.2 -0% | 29.5 -4% | 28.3 -0% | 29.6 -5% |
| Idle Minimum * (dB) | 28.3 | 29.5 -4% | 29.8 -5% | 29.5 -4% | 28.4 -0% | 31.2 -10% |
| Idle Average * (dB) | 28.3 | 29.5 -4% | 29.8 -5% | 29.5 -4% | 28.4 -0% | 31.2 -10% |
| Idle Maximum * (dB) | 30.5 | 30 2% | 31.2 -2% | 29.5 3% | 29.2 4% | 32.6 -7% |
| Load Average * (dB) | 34.5 | 39.5 -14% | 37.2 -8% | 34.7 -1% | 41.8 -21% | 32.6 6% |
| Witcher 3 ultra * (dB) | 49.5 | 39.5 20% | 33.1 33% | 39.1 21% | 43.1 13% | |
| Load Maximum * (dB) | 49.5 | 36 27% | 49.4 -0% | 39.4 20% | 41.8 16% | 43.3 13% |
* ... Moindre est la valeur, meilleures sont les performances
Degré de la nuisance sonore
| Au repos |
| 28.3 / 28.3 / 30.5 dB(A) |
| Fortement sollicité |
| 34.5 / 49.5 dB(A) |
 | ||
30 dB silencieux 40 dB(A) audible 50 dB(A) bruyant |
||
min: | ||
(-) La température maximale du côté supérieur est de 54.4 °C / 130 F, par rapport à la moyenne de 38.2 °C / 101 F, allant de 22.2 à 69.8 °C pour la classe Workstation.
(-) Le fond chauffe jusqu'à un maximum de 49 °C / 120 F, contre une moyenne de 41.1 °C / 106 F
(±) En utilisation inactive, la température moyenne du côté supérieur est de 33 °C / 91 F, par rapport à la moyenne du dispositif de 32 °C / 90 F.
(±) En jouant à The Witcher 3, la température moyenne du côté supérieur est de 34.9 °C / 95 F, alors que la moyenne de l'appareil est de 32 °C / 90 F.
(+) Les repose-poignets et le pavé tactile sont plus froids que la température de la peau avec un maximum de 28.8 °C / 83.8 F et sont donc froids au toucher.
(±) La température moyenne de la zone de l'appui-paume de dispositifs similaires était de 27.8 °C / 82 F (-1 °C / #-1.8 F).
Dell Precision 7530 analyse audio
(±) | le niveau sonore du haut-parleur est moyen mais bon (74.4# dB)
Basses 100 - 315 Hz
(±) | basse réduite - en moyenne 8% inférieure à la médiane
(±) | la linéarité des basses est moyenne (12.3% delta à la fréquence précédente)
Médiums 400 - 2000 Hz
(+) | médiane équilibrée - seulement 3.3% de la médiane
(±) | la linéarité des médiums est moyenne (7.8% delta à la fréquence précédente)
Aiguës 2 - 16 kHz
(+) | des sommets équilibrés - à seulement 2.3% de la médiane
(+) | les aigus sont linéaires (5% delta à la fréquence précédente)
Globalement 100 - 16 000 Hz
(+) | le son global est linéaire (11.4% différence à la médiane)
Par rapport à la même classe
» 13% de tous les appareils testés de cette catégorie étaient meilleurs, 4% similaires, 83% pires
» Le meilleur avait un delta de 7%, la moyenne était de 17%, le pire était de 35%.
Par rapport à tous les appareils testés
» 7% de tous les appareils testés étaient meilleurs, 2% similaires, 91% pires
» Le meilleur avait un delta de 4%, la moyenne était de 24%, le pire était de 134%.
Apple MacBook 12 (Early 2016) 1.1 GHz analyse audio
(+) | les haut-parleurs peuvent jouer relativement fort (83.6# dB)
Basses 100 - 315 Hz
(±) | basse réduite - en moyenne 11.3% inférieure à la médiane
(±) | la linéarité des basses est moyenne (14.2% delta à la fréquence précédente)
Médiums 400 - 2000 Hz
(+) | médiane équilibrée - seulement 2.4% de la médiane
(+) | les médiums sont linéaires (5.5% delta à la fréquence précédente)
Aiguës 2 - 16 kHz
(+) | des sommets équilibrés - à seulement 2% de la médiane
(+) | les aigus sont linéaires (4.5% delta à la fréquence précédente)
Globalement 100 - 16 000 Hz
(+) | le son global est linéaire (10.2% différence à la médiane)
Par rapport à la même classe
» 7% de tous les appareils testés de cette catégorie étaient meilleurs, 2% similaires, 91% pires
» Le meilleur avait un delta de 5%, la moyenne était de 18%, le pire était de 53%.
Par rapport à tous les appareils testés
» 5% de tous les appareils testés étaient meilleurs, 1% similaires, 94% pires
» Le meilleur avait un delta de 4%, la moyenne était de 24%, le pire était de 134%.
| Éteint/en veille | |
| Au repos | |
| Fortement sollicité |
|
Légende:
min: | |
| Dell Precision 7530 i9-8950HK, Quadro P3200, Samsung PM961 NVMe MZVLW512HMJP, IPS, 3840x2160, 15.6" | Lenovo ThinkPad P1-20MD002LUS E-2176M, Quadro P2000 Max-Q, Samsung SSD PM981 MZVLB2T0HMLB, IPS, 3840x2160, 15.6" | Dell Precision 5530 2-in-1 i7-8706G, WX Vega M GL, SK Hynix PC401 512GB M.2 (HFS512GD9TNG), IPS, 3840x2160, 15.6" | Dell Precision 7510 (4K IGZO) E3-1535M v5, Quadro M2000M, Samsung SSD SM951a 512GB M.2 PCIe 3.0 x4 NVMe (MZVKV512), IGZO IPS, 3840x2160, 15.6" | HP ZBook 15u G5 2ZC05EA i5-8550U, Radeon Pro WX 3100, Toshiba XG5 KXG50ZNV256G, IPS LED, 1920x1080, 15.6" | Asus Strix GL504GM i7-8750H, GeForce GTX 1060 Mobile, Toshiba NVMe THNSN5256GPU7, IPS, 1920x1080, 15.6" | |
|---|---|---|---|---|---|---|
| Power Consumption | 40% | 43% | -16% | 64% | 14% | |
| Idle Minimum * (Watt) | 15.7 | 7.1 55% | 7.4 53% | 23.9 -52% | 3.2 80% | 10 36% |
| Idle Average * (Watt) | 20.3 | 14.4 29% | 12.4 39% | 28.9 -42% | 6.1 70% | 16.9 17% |
| Idle Maximum * (Watt) | 25.7 | 14.6 43% | 13.3 48% | 30 -17% | 9.7 62% | 21.1 18% |
| Load Average * (Watt) | 118.9 | 93.9 21% | 79.2 33% | 95.2 20% | 62 48% | 112.4 5% |
| Witcher 3 ultra * (Watt) | 131.2 | 77.9 41% | 82.2 37% | 48 63% | 135.5 -3% | |
| Load Maximum * (Watt) | 174 | 88.3 49% | 96.5 45% | 157.1 10% | 71 59% | 157.3 10% |
* ... Moindre est la valeur, meilleures sont les performances
| Dell Precision 7530 i9-8950HK, Quadro P3200, 97 Wh | Lenovo ThinkPad P1-20MD002LUS E-2176M, Quadro P2000 Max-Q, 80 Wh | Dell Precision 7510 (4K IGZO) E3-1535M v5, Quadro M2000M, 91 Wh | Dell Precision 5530 2-in-1 i7-8706G, WX Vega M GL, 75 Wh | HP ZBook 15u G5 2ZC05EA i5-8550U, Radeon Pro WX 3100, 56 Wh | Eurocom Tornado F5W E3-1280 v5, Quadro P5000, 75.24 Wh | |
|---|---|---|---|---|---|---|
| Autonomie de la batterie | 15% | -23% | 42% | 144% | -22% | |
| Reader / Idle (h) | 6.4 | 4.5 -30% | 12.3 92% | 21.7 239% | 4.7 -27% | |
| WiFi v1.3 (h) | 4.6 | 5.3 15% | 4 -13% | 7.3 59% | 8.6 87% | 4 -13% |
| Load (h) | 1.6 | 1.2 -25% | 1.2 -25% | 3.3 106% | 1.2 -25% |
Points positifs
Points négatifs
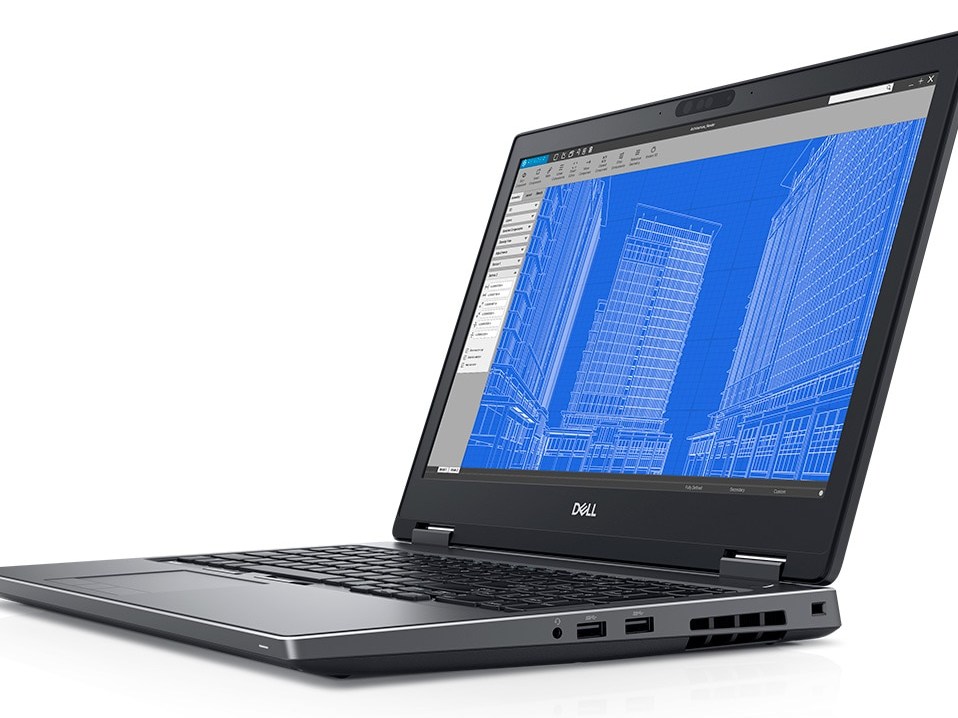
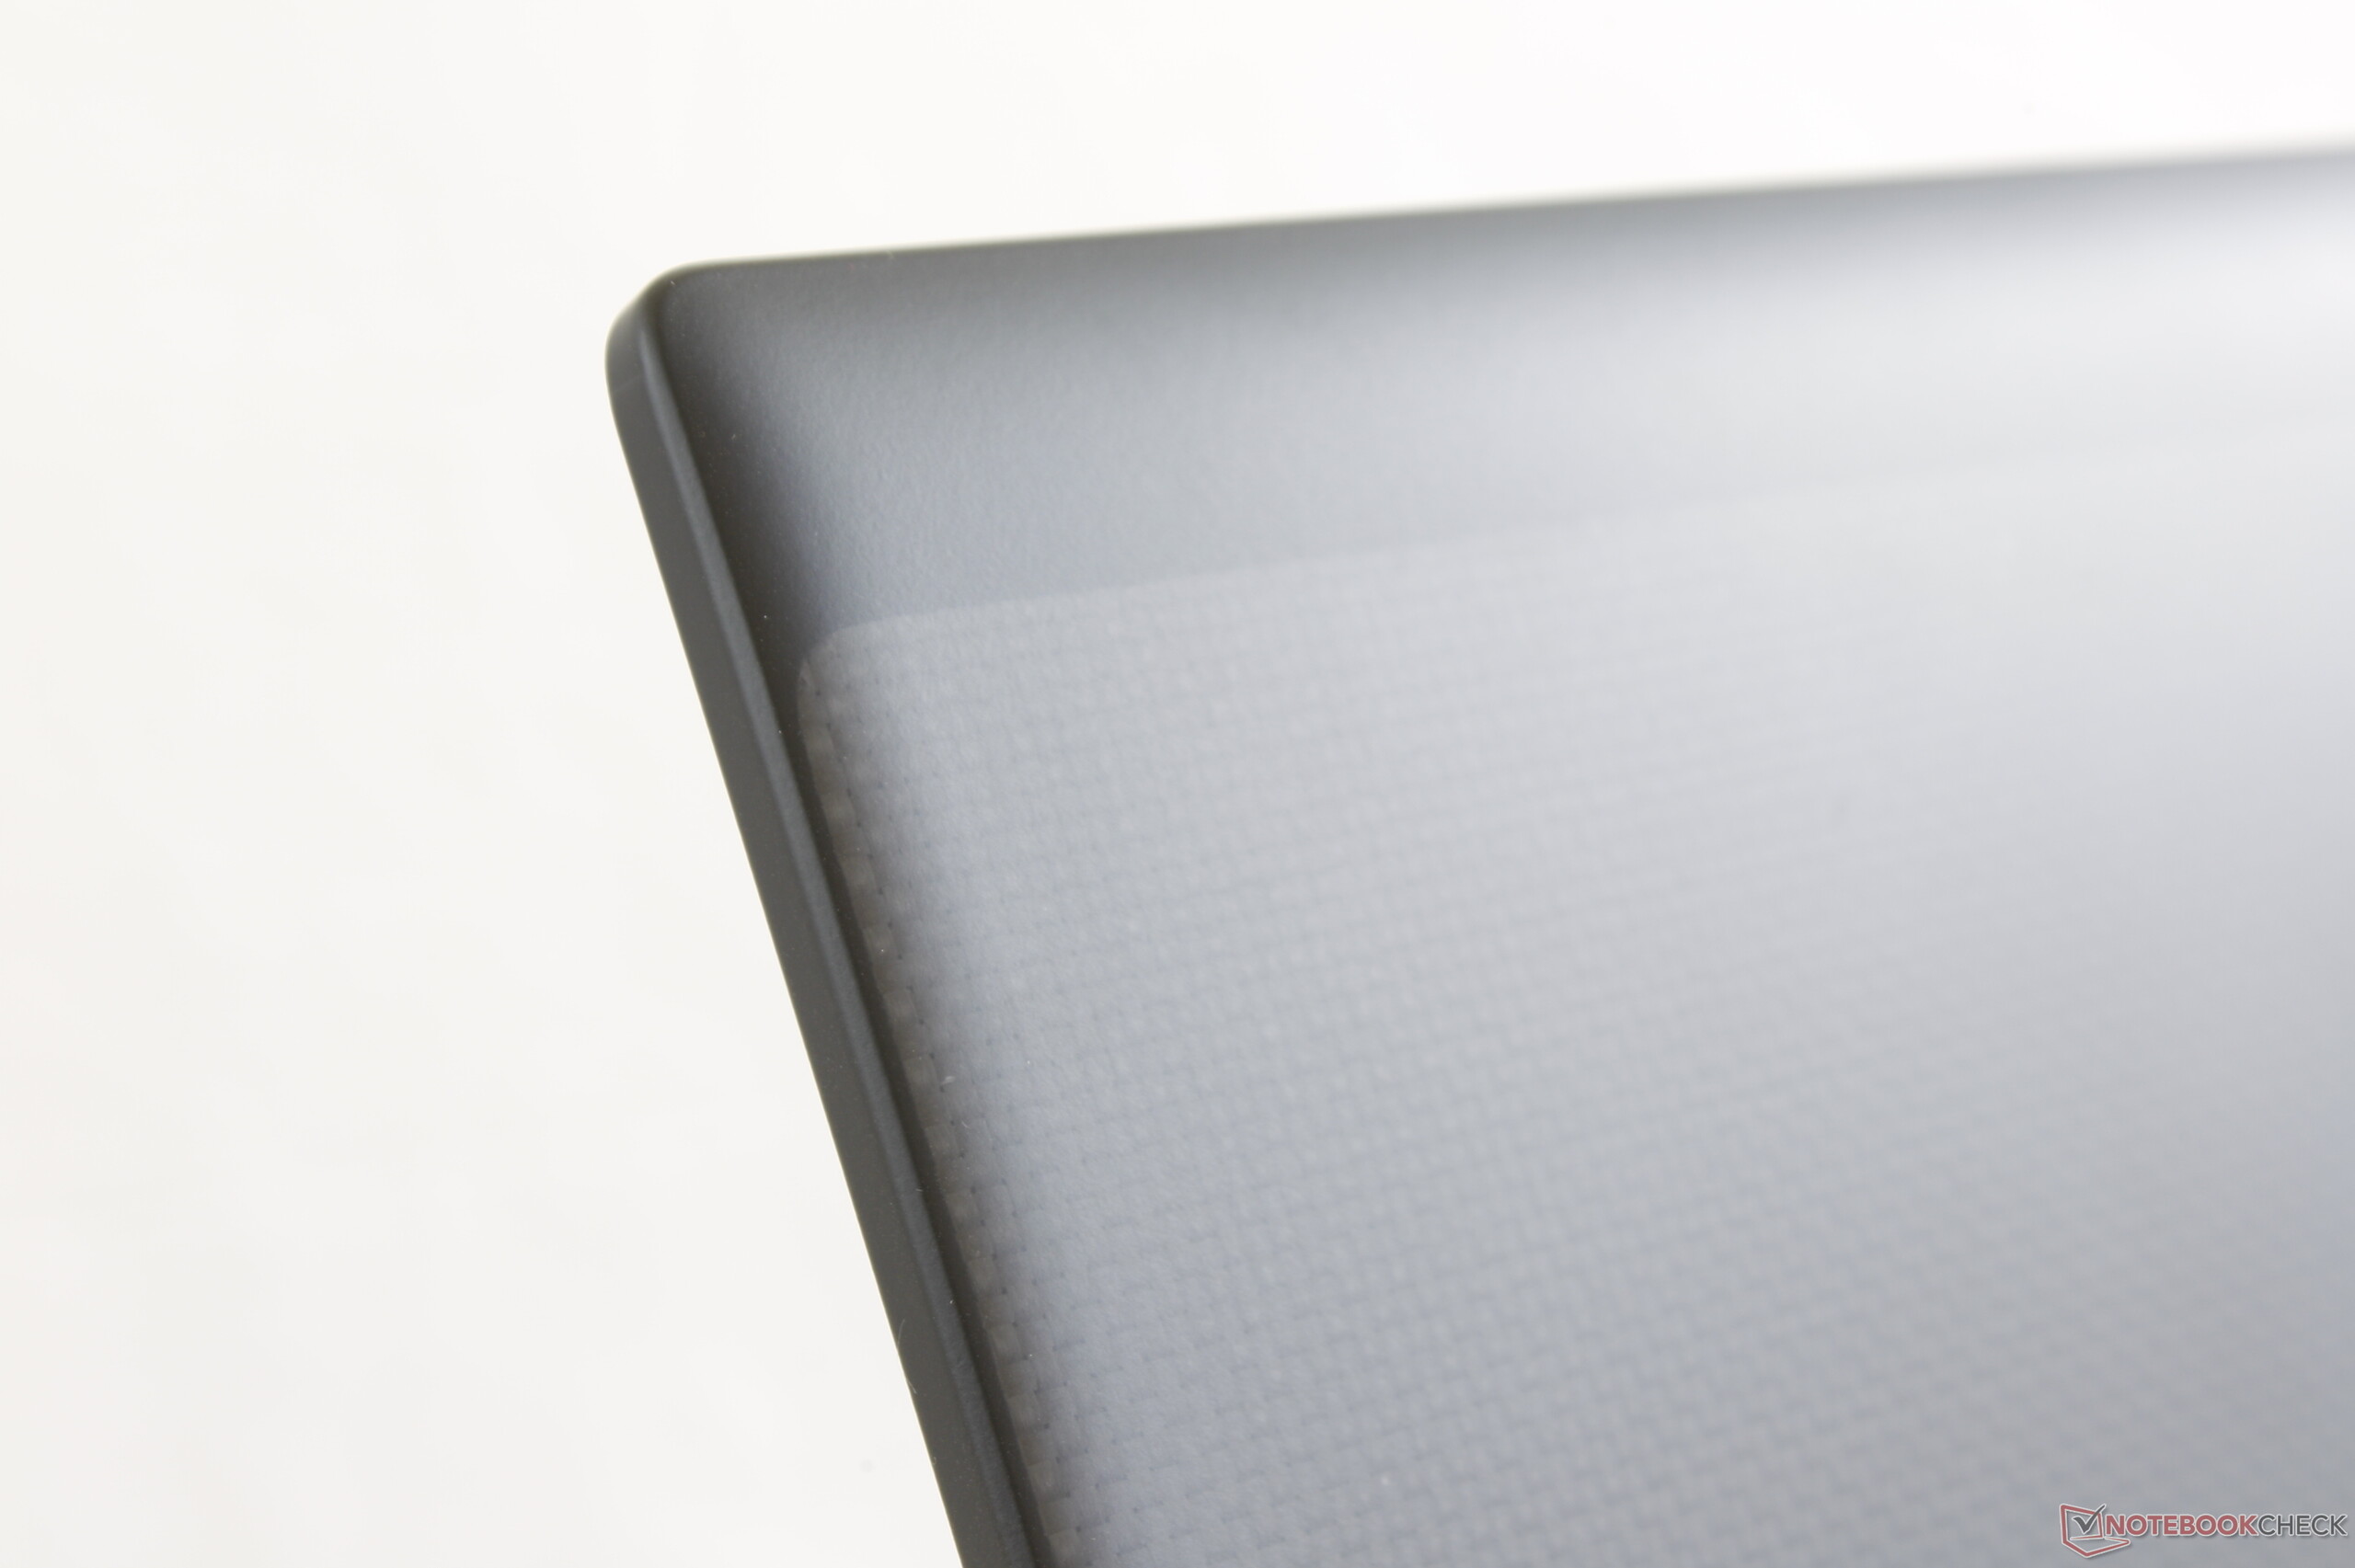
Le Precision 7530 est une mise à jour réussie du 7510. Il est plus petit sans sacrifier la rigidité, et embarque assez de puissance processeur et graphique pour contenter les utilisateurs de stations de travail. Son WAN optionnel lui donne également un avantage sur ses concurrents.
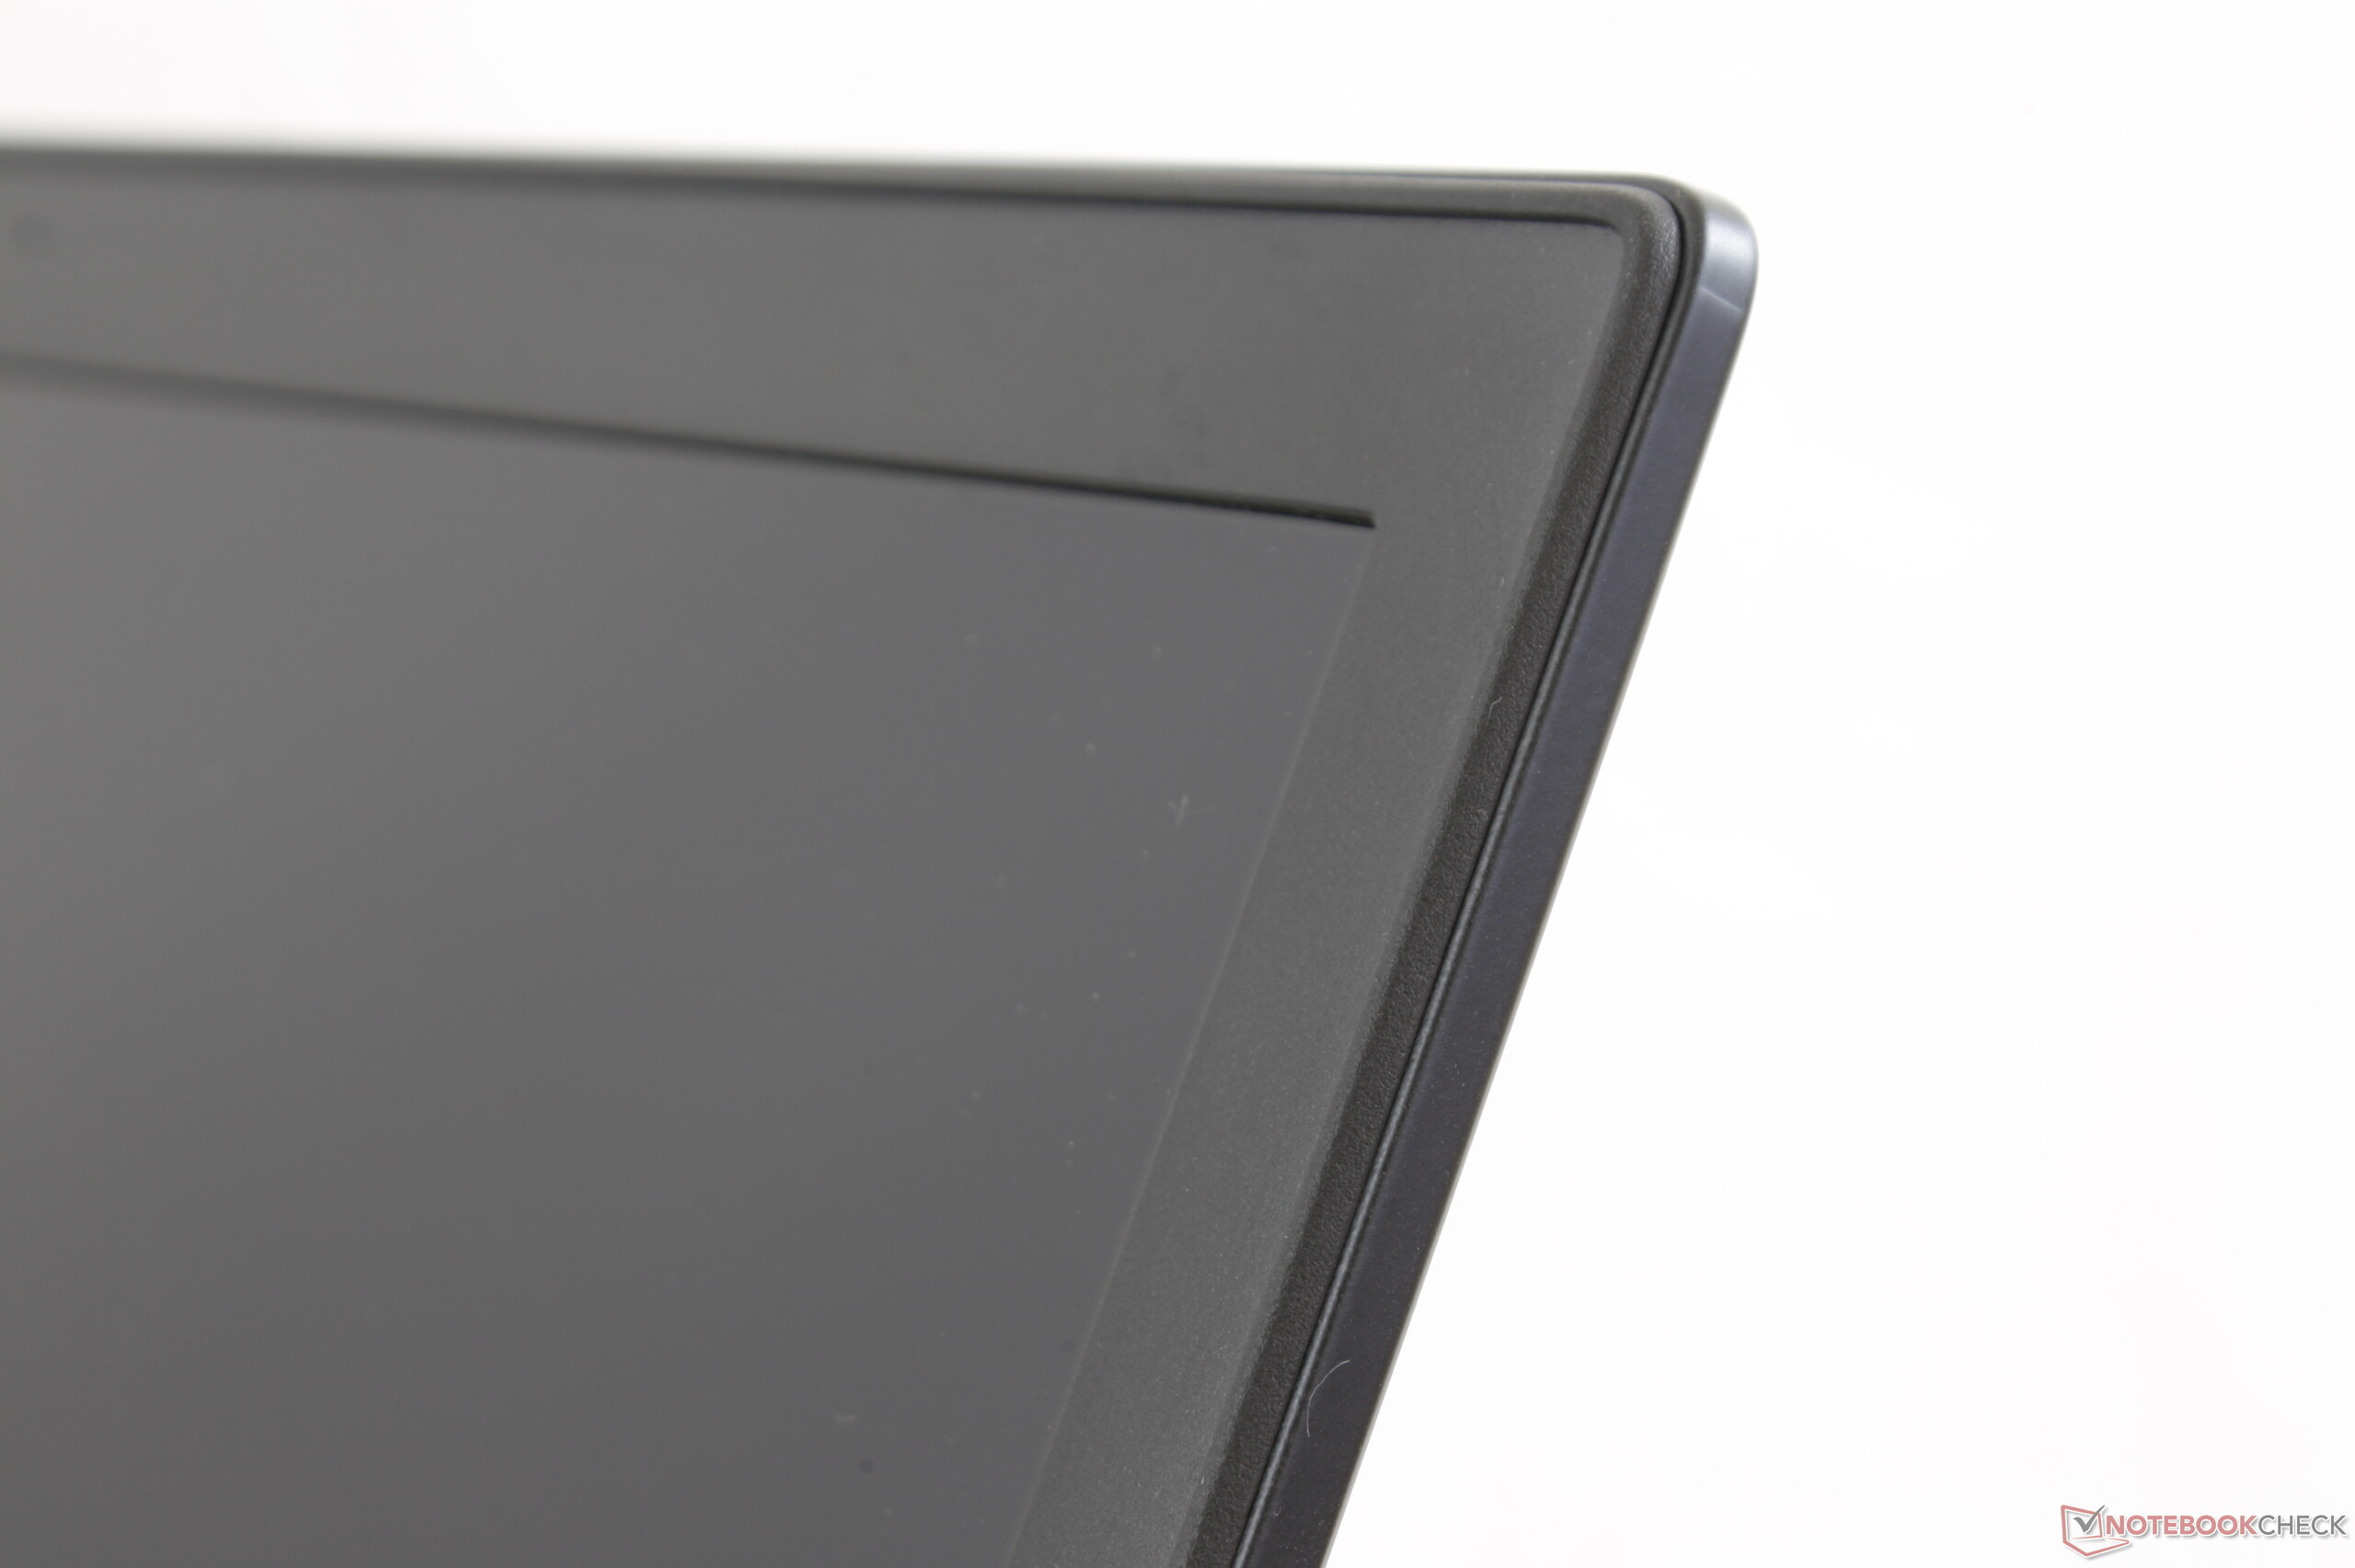
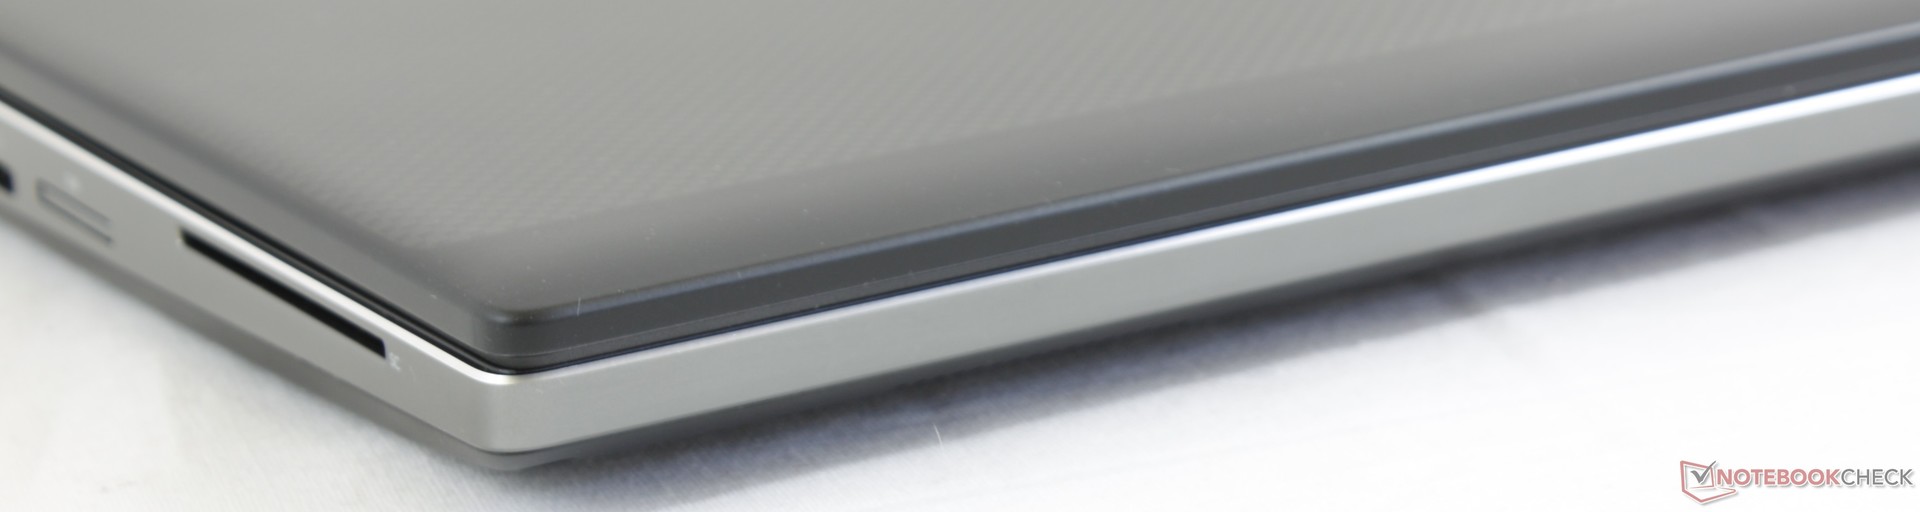
Il y a un certain nombre de défauts liés au processeur et à la connectique. D’abord, le processeur Core i9 chauffe ici bien trop pour pouvoir vraiment profiter de sa fréquence de Turbo Boost élevée. Les performances sont de ce fait juste un peu supérieures à celles de la version Core i7-8750H moins chère, que nous recommandons donc. Nous sommes ensuite déçus de voir la réduction de performances sur batterie, et l’absence de version avec Quadro P4000 ou mieux, vu qu’il s’agit normalement de la station de travail mobile "la plus puissante au monde et la première prête pour la réalité virtuelle". Enfin, l’écran mat quelque peu granuleux et les ventilateurs bruyants freinent encore un peu plus un appareil autrement réussi.
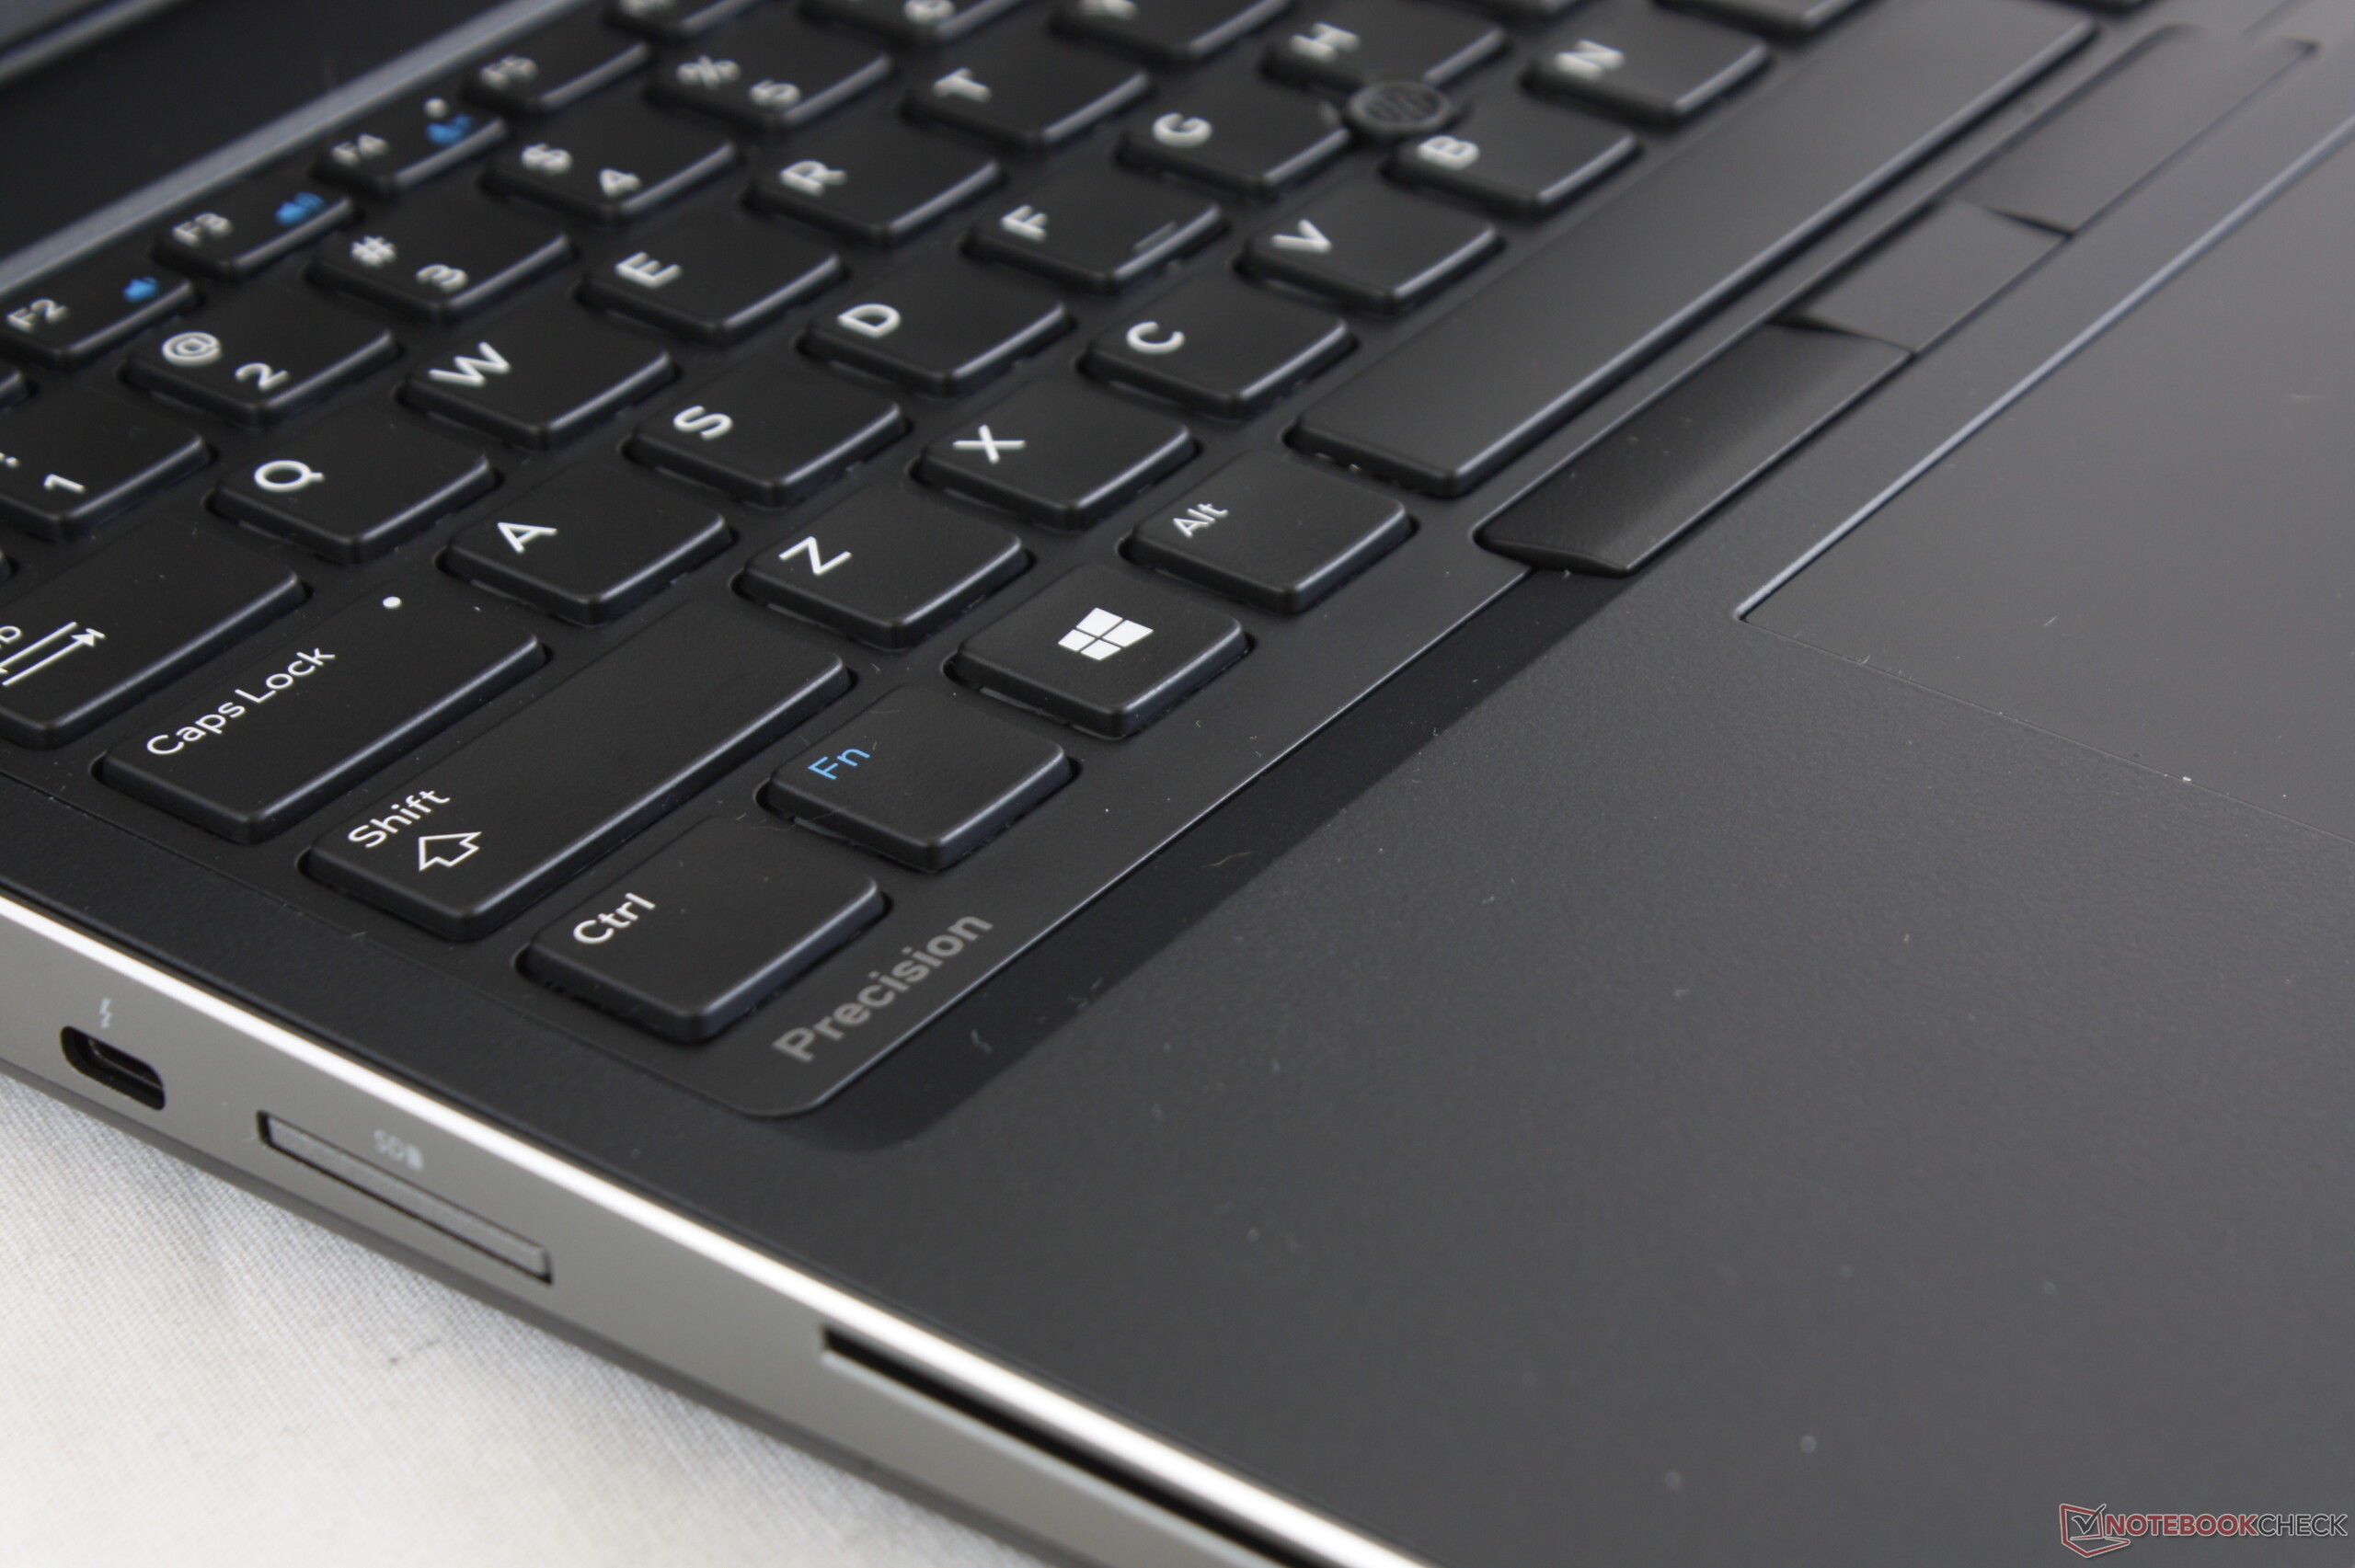
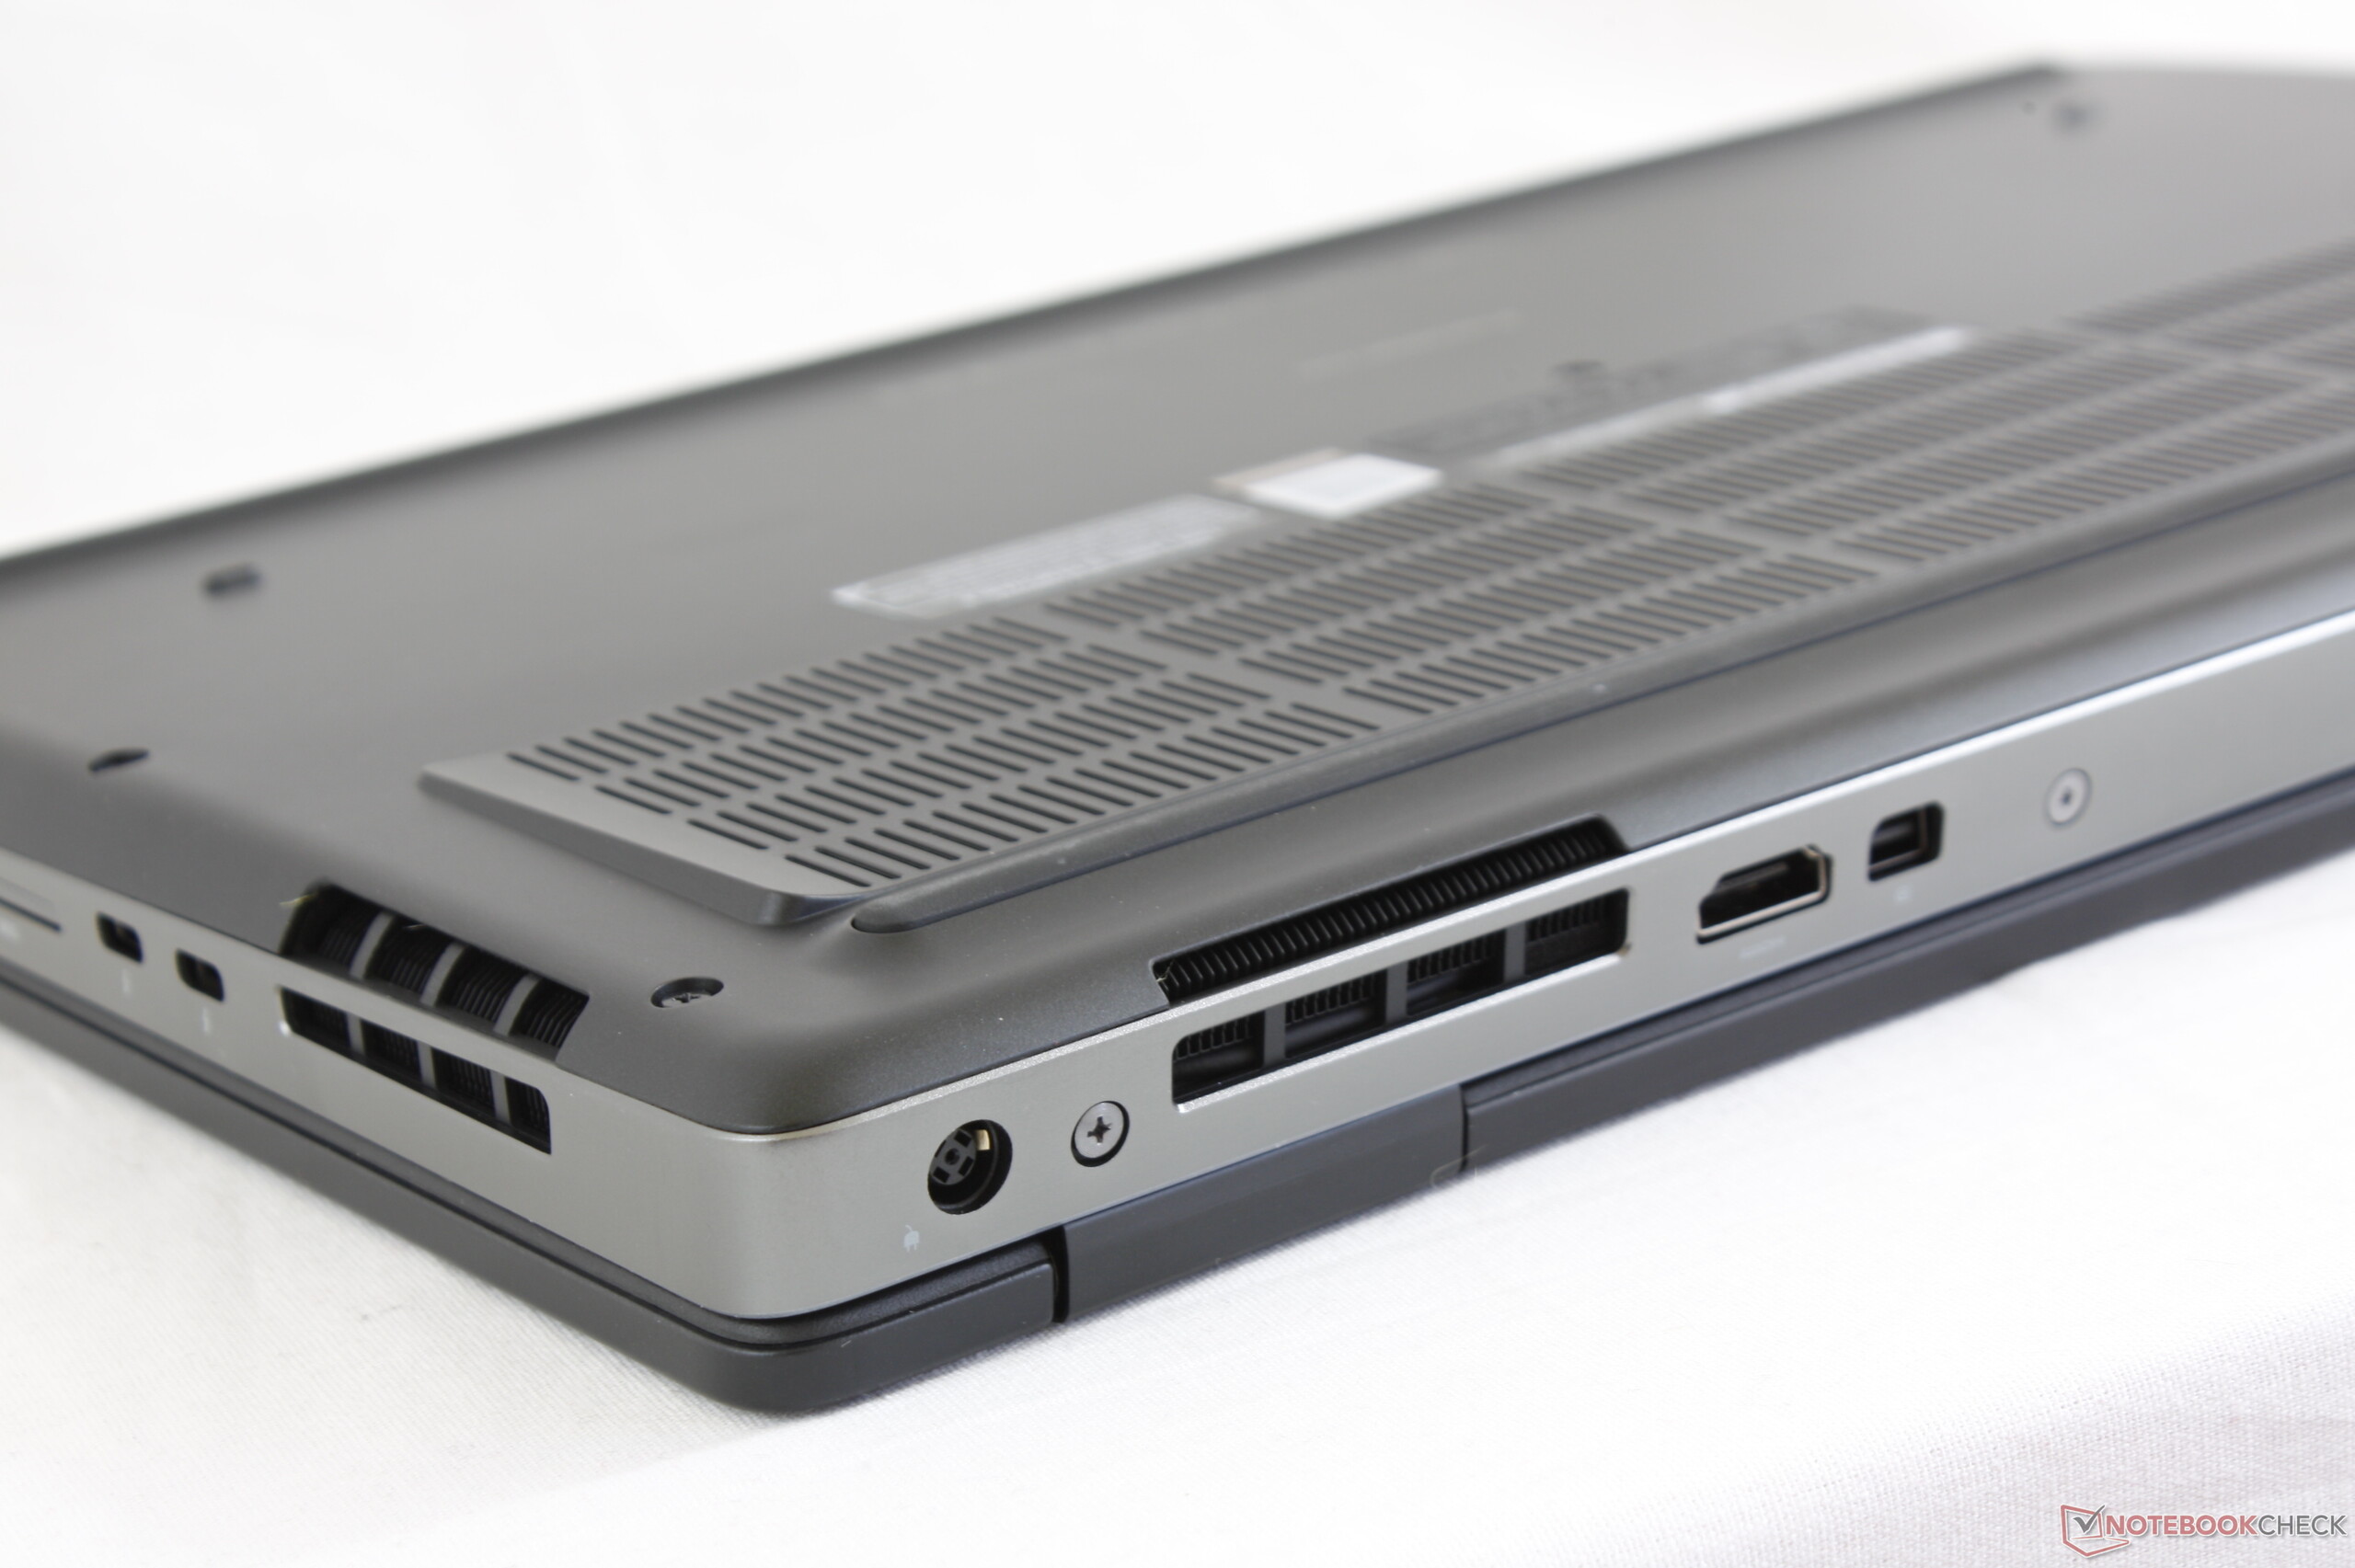
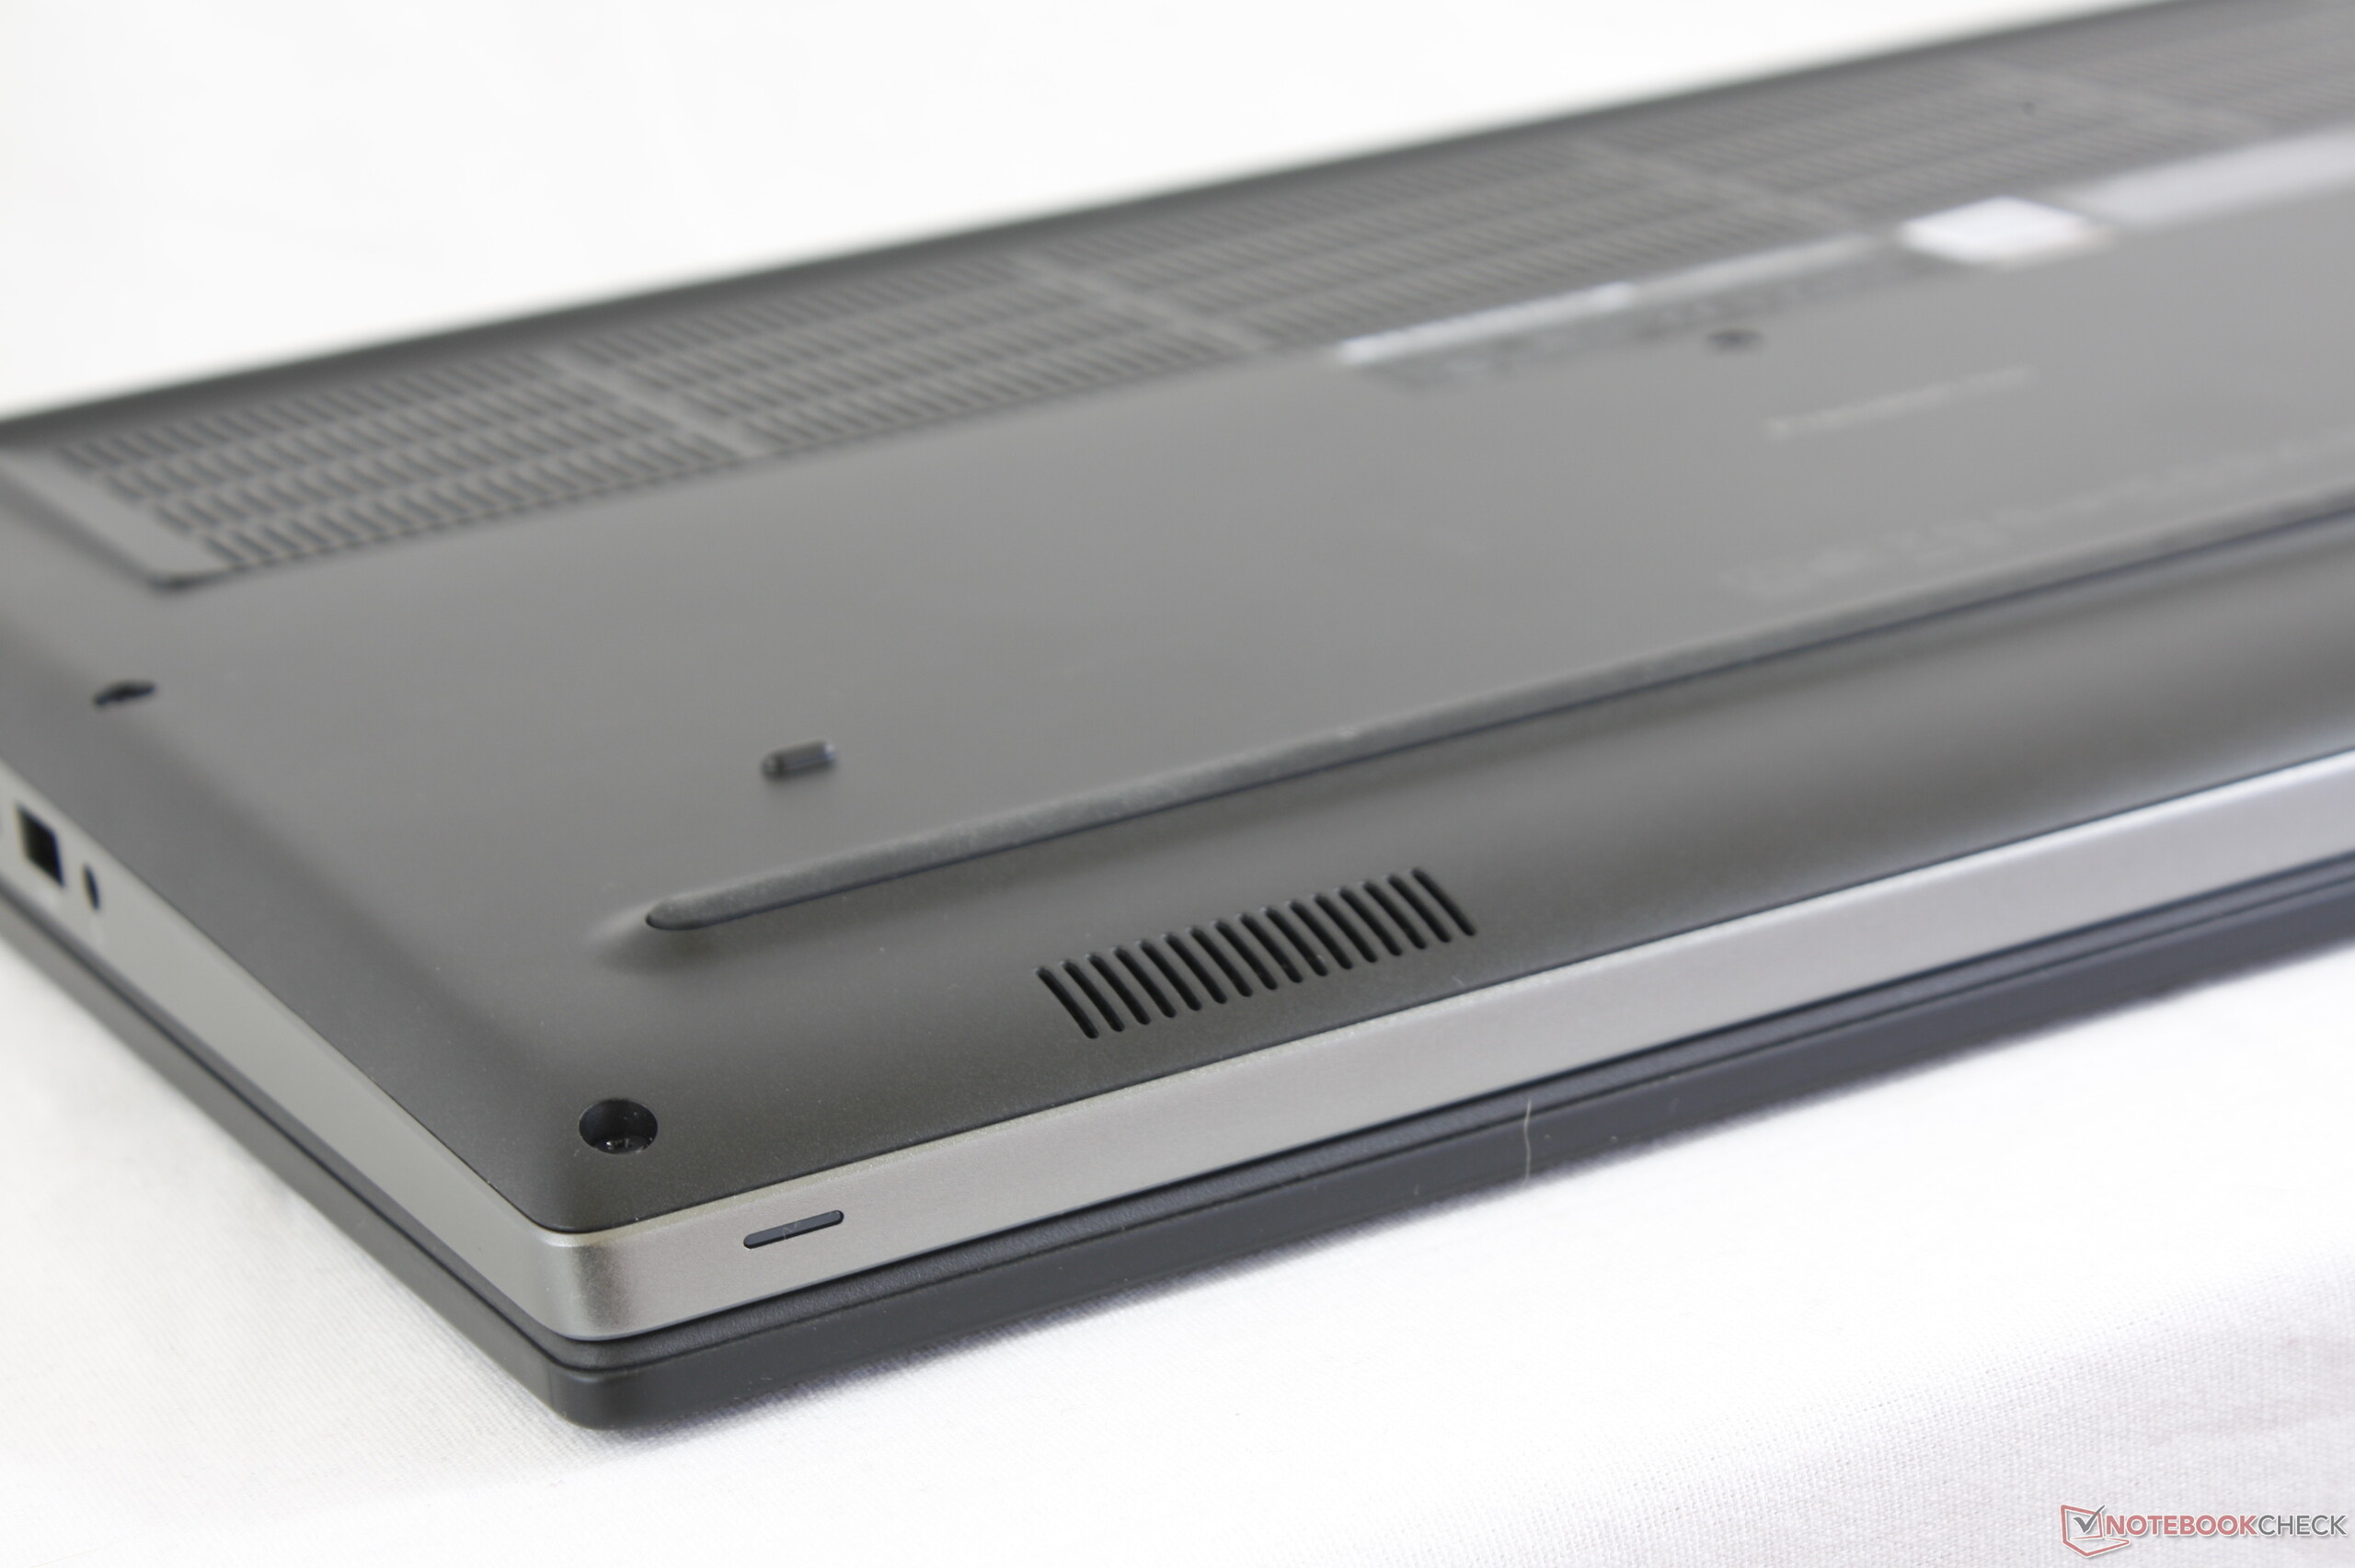
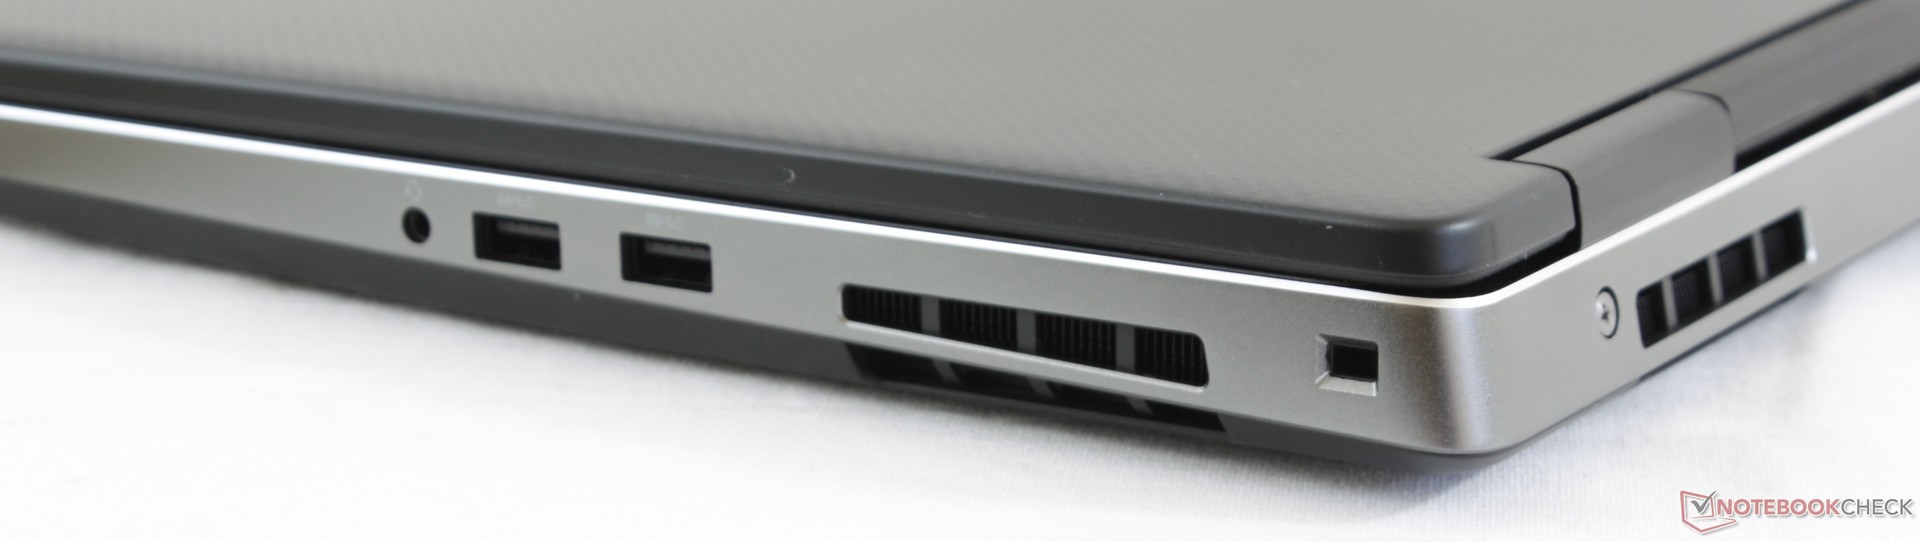
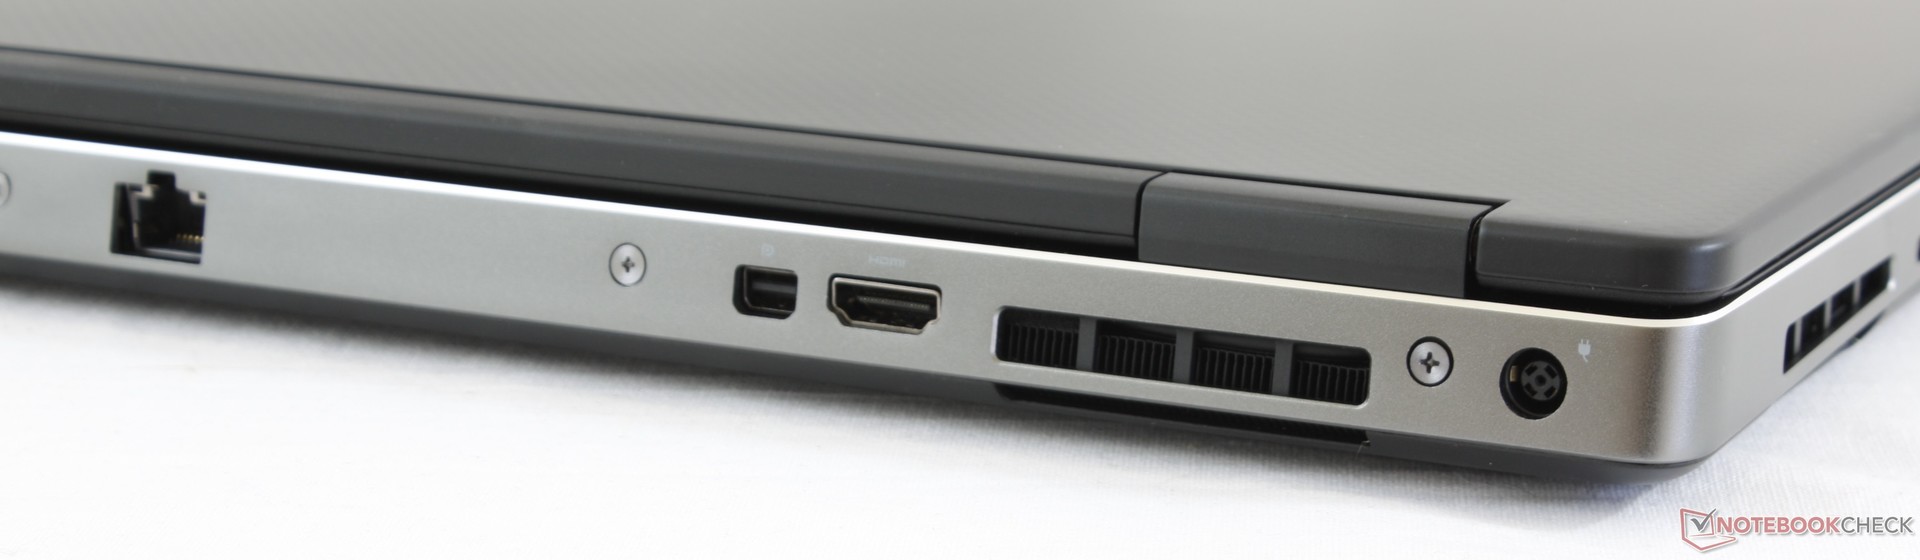
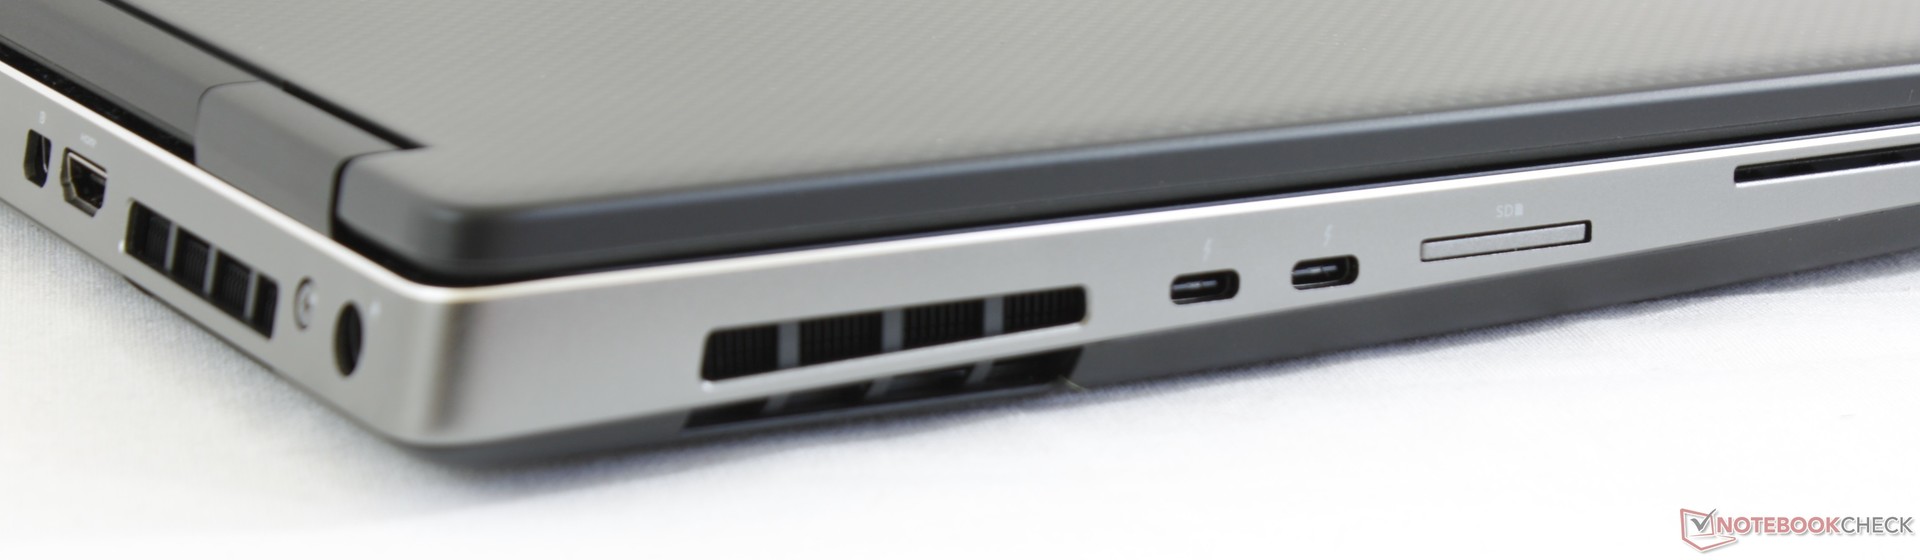
Concernant la connectivité, nous pensons que Dell aurait pu faire mieux que les deux ports USB A, alors que l’ancien Precision 7510 en avait le double. Passez à côté de ces défauts, et le Precision 7530 reste une machine réussie, que ce soit pour les performances comme pour l’esthétique.
Le Core i9 est un peu exagéré pour le Precision 7530. Pour avoir une machine plus équilibrée, les utilisateurs devraient choisir une configuration avec le Core i7-8750H ou le Xeon E-2176M. C’est de toutes façons une station de travail des plus puissantes, avec jusqu’à 128 Go de RAM en option !
L’intégralité de cette critique est disponible en anglais en suivant ce lien.
Dell Precision 7530
- 10/25/2019 v7 (old)
Allen Ngo
Price comparison
