Critiques du Intel Core i9-8950HK processeur
Critique complète du portable Apple MacBook Pro 15 2018 (i9-8950HK 2,9 GHz, Vega 20, 1800p)
En plus des puces classiques Radeon Pro, Apple propose aussi son MacBook Pro 15 avec une puce graphique AMD Pro Vega. Nous testons le modèle le plus haut de gamme, équipé d’un Intel Core i9 et d’une Radeon Vega 20 Pro.
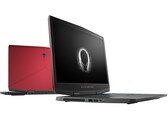
Intel Core i9-8950HK, AMD Radeon Pro Vega 20, 15.6", 1.8 kgCritique complète du PC portable de jeu Alienware m17 (i9-8950HK, RTX 2080 Max-Q, 4K UHD)
23 % plus fin, 37 % plus compact et 40 % plus léger. L’Alienware m17 corrige tout ce dont on pouvait se plaindre à propos de la taille et du poids de l’Alienware 17. Mais cela se fait au prix de fonctionnalités secondaires tels le trackpad éclairé, le rétroéclairage par touche, ou les ports additionnels.
Intel Core i9-8950HK, NVIDIA GeForce RTX 2080 Max-Q, 17.3", 2.6 kgCourte critique du PC portable de jeu Gigabyte Aero 15-Y9 (i9-8950HK, RTX 2080 Max-Q, 4K UHD)
L’Aero 15-Y9 bien équipé peut faire tourner (presque) tous les jeux fluidement sur son écran mat 4K. Cependant Gigabyte a choisi de l’équiper de la GeForce RTX 2080 version Max-Q. De ce fait, il n’est pas capable d’offrir beaucoup plus de performances que les Aero 15 avec des cartes graphiques RTX 2070 Max-Q.
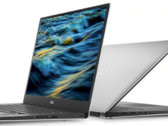
Intel Core i9-8950HK, NVIDIA GeForce RTX 2080 Max-Q, 15.6", 2.1 kgCourte critique du PC portable Dell XPS 15 9570 (i9-8950HK, GTX 1050 Ti Max-Q, 4K UHD)
Après avoir testé les versions Core i5 et Core i7 du Dell XPS 15 9570, nous voici avec la version Core i9. En bref, les utilisateurs feront mieux d’investir dans plus de stockage, de RAM, ou dans une meilleure carte graphique plutôt que de dépenser 250 € de plus pour la version Core i9-8950HK.
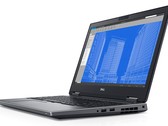
Intel Core i9-8950HK, NVIDIA GeForce GTX 1050 Ti Max-Q, 15.6", 2 kgCourte critique de la station de travail Dell Precision 7530 (i9-8950HK, Quadro P3200, UHD)
Dell intègre l’un des processeurs mobiles Intel les plus puissants dans un châssis qui est même plus fin que celui du Precision 7510 de la génération précédente. Les utilisateurs peuvent-ils vraiment bénéficier des performances du processeur, ou le throttling règne-t-il en maître ?
Intel Core i9-8950HK, NVIDIA Quadro P3200, 15.6", 2.6 kgAsus ZenBook Pro 15 UX580GE: NVIDIA GeForce GTX 1050 Ti Mobile, 15.60", 1.9 kg
Critique » Critique complète du PC portable Asus ZenBook Pro 15 UX580GE (i9-8950HK, GTX 1050 Ti, 4K UHD)
Asus Chimera G703GI: NVIDIA GeForce GTX 1080 Mobile, 17.30", 4.7 kg
Critique » Critique complète du PC portable de jeu Asus ROG Chimera G703GI (i9-8950HK, GTX 1080, Full HD)
Acer Predator Helios 500 PH517-51-93LS: NVIDIA GeForce GTX 1070 Mobile, 17.30", 4 kg
Critique » Courte critique du PC portable Acer Predator Helios 500 (GTX 1070, i9-8950HK)
Aorus X9 DT: NVIDIA GeForce GTX 1080 Mobile, 17.30", 3.7 kg
Critique » Critique complète du PC portable Aorus X9 DT (i9-8950HK, GTX 1080, FHD)
Alienware 15 R4: NVIDIA GeForce GTX 1070 Mobile, 15.60", 3.5 kg
Critique » Courte critique du PC portable de jeu Alienware 15 R4 (i9-8950HK, GTX 1070, FHD)
Eurocom Q8: NVIDIA GeForce GTX 1070 Mobile, 17.30", 3 kg
Critique » Courte critique du PC portable Eurocom Q8 (i9-8950HK, GTX 1070, QHD)
MSI GT75 8RG-090 Titan: NVIDIA GeForce GTX 1080 Mobile, 17.30", 4.6 kg
Critique » Courte critique du PC Portable MSI GT75 8RG Titan (i9-8950HK, GTX 1080, Full-HD)
MSI GT75 Titan 8SG-051: NVIDIA GeForce RTX 2080 Mobile, 17.30", 4.6 kg
Autres tests » MSI GT75 Titan 8SG-051
HP ZBook Studio x360 G5 5UC06EA: NVIDIA Quadro P2000, 15.60", 2.3 kg
Autres tests » HP ZBook Studio x360 G5 5UC06EA
Medion Erazer X15805: NVIDIA GeForce RTX 2070 Max-Q, 15.60", 2.1 kg
Autres tests » Medion Erazer X15805
Asus ROG GRIFFIN GZ755GX-E5028T: NVIDIA GeForce RTX 2080 Mobile, 17.30", 4.7 kg
Autres tests » Asus ROG GRIFFIN GZ755GX-E5028T
Alienware m15-565K7: NVIDIA GeForce RTX 2080 Max-Q, 15.60", 2.2 kg
Autres tests » Alienware m15-565K7
Alienware m17 P37E: NVIDIA GeForce RTX 2080 Max-Q, 17.30", 2.6 kg
Autres tests » Alienware m17 P37E
Asus ROG Chimera G703GX-E5006T: NVIDIA GeForce RTX 2080 Mobile, 17.30", 4.7 kg
Autres tests » Asus ROG Chimera G703GX-E5006T
Gigabyte Aero 15-Y9: NVIDIA GeForce RTX 2080 Max-Q, 15.60", 2.1 kg
Autres tests » Gigabyte Aero 15-Y9
Acer Predator Helios 500 PH517-51-960K: NVIDIA GeForce GTX 1070 Mobile, 17.30", 4 kg
Autres tests » Acer Predator Helios 500 PH517-51-960K
MSI GT75 8SG-035: NVIDIA GeForce RTX 2080 Mobile, 17.30", 4.6 kg
Autres tests » MSI GT75 8SG-035
Gigabyte Aero 15 Y9-9UK4720P: NVIDIA GeForce RTX 2080 Max-Q, 15.60", 2 kg
Autres tests » Gigabyte Aero 15 Y9-9UK4720P
Origin PC EVO-17S, GTX 1070, i9-8950HK: NVIDIA GeForce GTX 1070 Mobile, 17.30", 3 kg
Autres tests » Origin PC EVO-17S, GTX 1070, i9-8950HK
Dell XPS 15 9570 Core i9 UHD: NVIDIA GeForce GTX 1050 Ti Max-Q, 15.60", 2 kg
Autres tests » Dell XPS 15 9570 Core i9 UHD
Acer Predator Helios 500 PH517-51-98Y7: NVIDIA GeForce GTX 1070 Mobile, 17.30", 4 kg
Autres tests » Acer Predator Helios 500 PH517-51-98Y7
MSI GT75 Titan 8RG-092TR: NVIDIA GeForce GTX 1080 Mobile, 17.30", 4.6 kg
Autres tests » MSI GT75 Titan 8RG-092TR
Acer Predator Helios 500 PH517-51-90BK: NVIDIA GeForce GTX 1070 Mobile, 17.30", 3.8 kg
Autres tests » Acer Predator Helios 500 PH517-51-90BK
Asus ZenBook Pro 15 UX580GE-E2036T: NVIDIA GeForce GTX 1050 Ti Mobile, 15.60", 1.9 kg
Autres tests » Asus ZenBook Pro 15 UX580GE-E2036T
Dell Precision 7730, i9-8950HK, Nvidia Quadro P5200: NVIDIA Quadro P5200, 17.30", 3.2 kg
Autres tests » Dell Precision 7730, i9-8950HK, Nvidia Quadro P5200
Asus Chimera G703GI-E5042T: NVIDIA GeForce GTX 1080 Mobile, 17.30", 4.7 kg
Autres tests » Asus Chimera G703GI-E5042T
Alienware 15 R4: NVIDIA GeForce GTX 1070 Mobile, 15.60", 3.5 kg
Autres tests » Alienware 15 R4
Asus Zenbook Pro 15 UX580GE E2048T: NVIDIA GeForce GTX 1050 Ti Mobile, 15.60", 1.9 kg
Autres tests » Asus Zenbook Pro 15 UX580GE E2048T
Apple MacBook Pro 15 2018 (2.9 GHz, 560X): AMD Radeon RX 560X (Laptop), 15.40", 1.8 kg
Autres tests » Apple MacBook Pro 15 2018 (2.9 GHz, 560X)
Acer Predator Helios 500 PH517-51-99UR: NVIDIA GeForce GTX 1070 Mobile, 17.30", 3.8 kg
Autres tests » Acer Predator Helios 500 PH517-51-99UR
MSI GT75 8RG-086NL: NVIDIA GeForce GTX 1080 Mobile, 17.30", 4.6 kg
Autres tests » MSI GT75 8RG-086NL
Acer Predator Helios 500 PH517-51-93LS: NVIDIA GeForce GTX 1070 Mobile, 17.30", 4 kg
Autres tests » Acer Predator Helios 500 PH517-51-93LS
Alienware 17 R5, Core i9, GTX 1080: NVIDIA GeForce GTX 1080 Mobile, 17.30", 4.4 kg
Autres tests » Alienware 17 R5, Core i9, GTX 1080
MSI GT75 8RG-090 Titan: NVIDIA GeForce GTX 1080 Mobile, 17.30", 4.6 kg
Autres tests » MSI GT75 8RG-090 Titan
Dell Precision 5530: unknown, 15.60", 1.8 kg
Autres tests » Dell Precision 5530
Asus Chimera G703GI: NVIDIA GeForce GTX 1080 Mobile, 17.30", 4.7 kg
Autres tests » Asus Chimera G703GI
MSI GT75 Titan 8RG-201UK: NVIDIA GeForce GTX 1080 SLI (Laptop), 17.30", 4.6 kg
Autres tests » MSI GT75 Titan 8RG-201UK
Asus ZenBook Pro 15 UX580GE: NVIDIA GeForce GTX 1050 Ti Mobile, 15.60", 1.9 kg
Autres tests » Asus ZenBook Pro 15 UX580GE
MSI GT75 Titan 8RG-089: NVIDIA GeForce GTX 1080 Mobile, 17.30", 4.6 kg
Autres tests » MSI GT75 Titan 8RG-089
Alienware 15 R4 GTX 1080: NVIDIA GeForce GTX 1080 Mobile, 15.60", 3.5 kg
Autres tests » Alienware 15 R4
Aorus X9 DT: NVIDIA GeForce GTX 1080 Mobile, 17.30", 3.7 kg
Autres tests » Aorus X9 DT