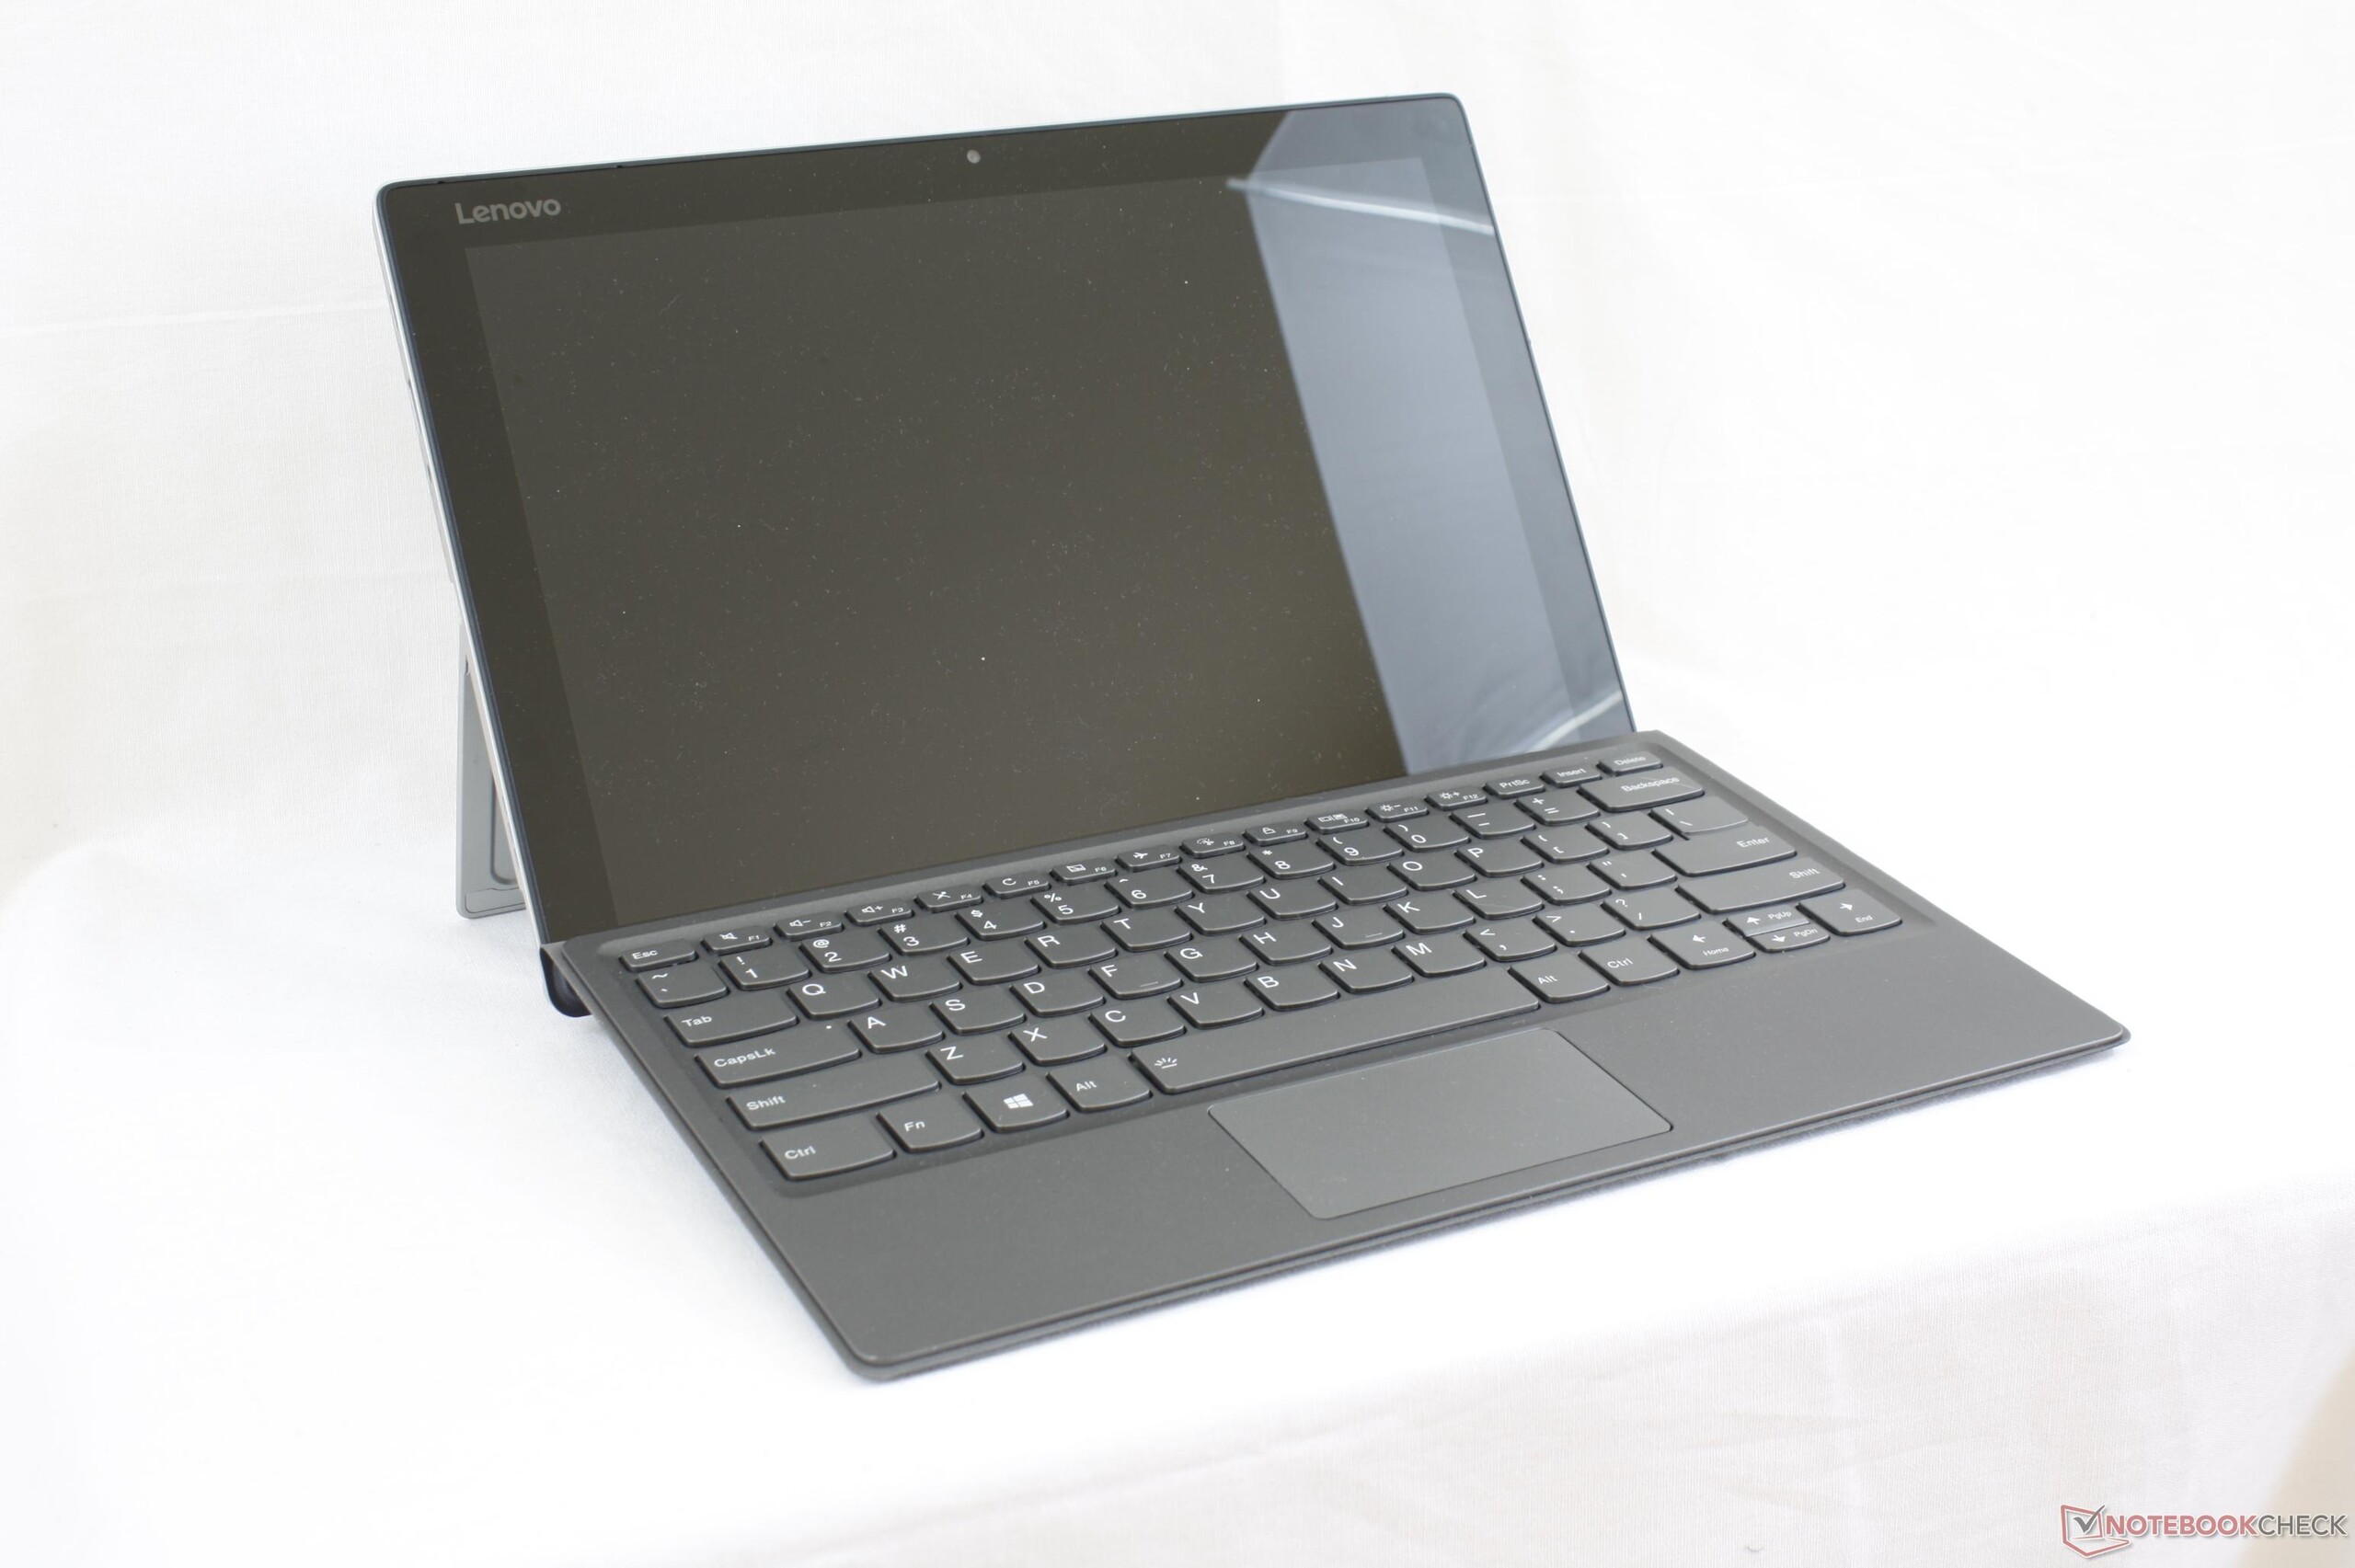
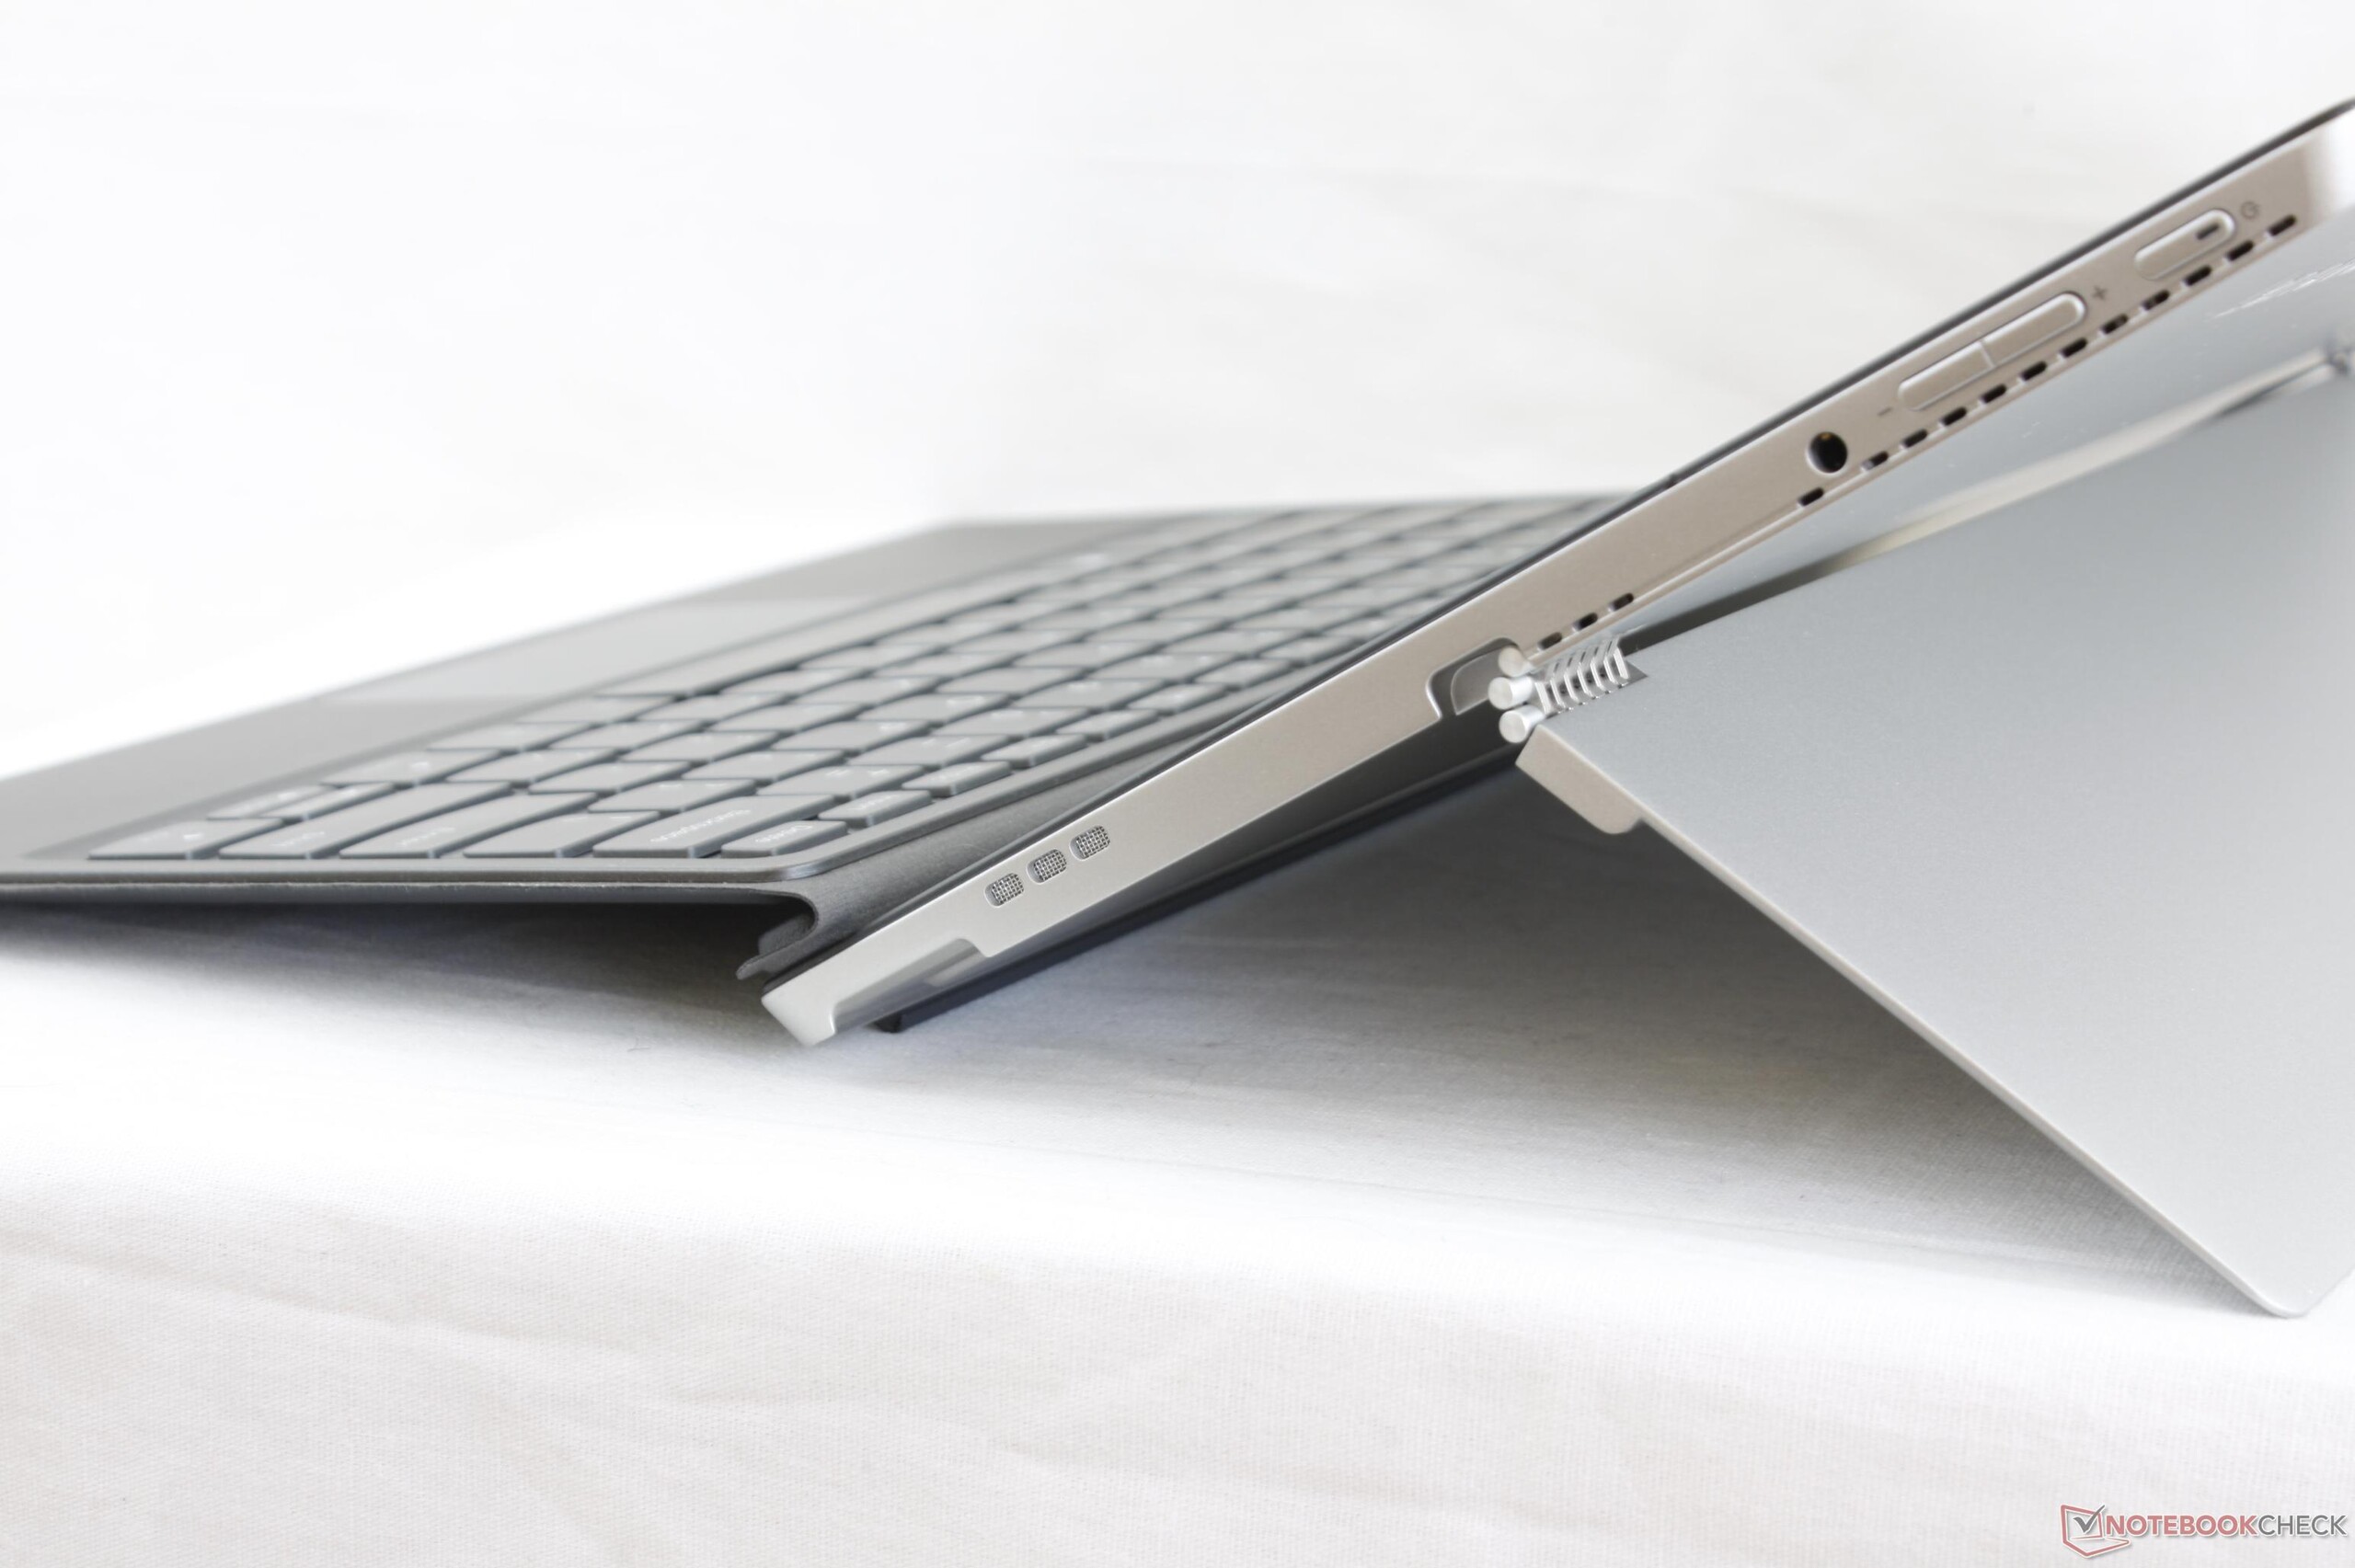
Courte critique du convertible Lenovo Miix 520 (i5-8250U, FHD)
| SD Card Reader | |
| average JPG Copy Test (av. of 3 runs) | |
| HP Elite x2 1012 G2-1LV76EA | |
| Lenovo Miix 520-12IKB 81CG | |
| Lenovo ThinkPad X1 Tablet Gen 2 | |
| maximum AS SSD Seq Read Test (1GB) | |
| Lenovo ThinkPad X1 Tablet Gen 2 | |
| HP Elite x2 1012 G2-1LV76EA | |
| Lenovo Miix 520-12IKB 81CG | |
| Networking | |
| iperf3 transmit AX12 | |
| Lenovo Miix 520-12IKB 81CG | |
| Lenovo Miix 510 Pro 80U10006GE (jseb) | |
| Dell XPS 13-9365 2-in-1 | |
| HP Elite x2 1012 G2-1LV76EA | |
| iperf3 receive AX12 | |
| Lenovo Miix 510 Pro 80U10006GE (jseb) | |
| HP Elite x2 1012 G2-1LV76EA | |
| Lenovo Miix 520-12IKB 81CG | |
| Dell XPS 13-9365 2-in-1 | |
| |||||||||||||||||||||||||
Homogénéité de la luminosité: 87 %
Valeur mesurée au centre, sur batterie: 348.8 cd/m²
Contraste: 872:1 (Valeurs des noirs: 0.4 cd/m²)
ΔE ColorChecker Calman: 7 | ∀{0.5-29.43 Ø4.73}
ΔE Greyscale Calman: 10.1 | ∀{0.09-98 Ø4.97}
90.9% sRGB (Argyll 1.6.3 3D)
58.7% AdobeRGB 1998 (Argyll 1.6.3 3D)
65.4% AdobeRGB 1998 (Argyll 3D)
90.8% sRGB (Argyll 3D)
64.4% Display P3 (Argyll 3D)
Gamma: 2.22
CCT: 9065 K
| Lenovo Miix 520-12IKB 81CG Unknown, IPS, 12.2", 1920x1200 | Microsoft Surface Pro (2017) m3 LG Display LP123WQ112604, IPS, 12.3", 2736x1826 | Lenovo Miix 510 Pro 80U10006GE Unknown, IPS, 12.2", 1920x1200 | HP Elite x2 1012 G2-1LV76EA Samsung SDC4A49, IPS, 12.3", 2716x1824 | Dell XPS 13 9365-4537 2-in-1 Sharp LQ133Z1, IPS, 13.3", 3200x1800 | Lenovo ThinkPad X1 Tablet Gen 2 LSN120QL01L01, IPS, 12", 2160x1440 | |
|---|---|---|---|---|---|---|
| Display | 7% | 0% | 6% | 1% | ||
| Display P3 Coverage (%) | 64.4 | 68.5 6% | 64.5 0% | 66.7 4% | 64.4 0% | |
| sRGB Coverage (%) | 90.8 | 99.2 9% | 92 1% | 98 8% | 92.9 2% | |
| AdobeRGB 1998 Coverage (%) | 65.4 | 70.1 7% | 65.5 0% | 68.7 5% | 66.1 1% | |
| Response Times | -9% | 13% | -3% | -18% | 20% | |
| Response Time Grey 50% / Grey 80% * (ms) | 35.6 ? | 42 ? -18% | 33 ? 7% | 45.6 ? -28% | 48 ? -35% | 28.4 ? 20% |
| Response Time Black / White * (ms) | 28 ? | 28 ? -0% | 23 ? 18% | 21.6 ? 23% | 28 ? -0% | 22.8 ? 19% |
| PWM Frequency (Hz) | 198.4 ? | 125 ? | 2119 ? | 221.2 ? | ||
| Screen | 35% | 3% | 31% | 33% | 14% | |
| Brightness middle (cd/m²) | 348.8 | 461 32% | 327 -6% | 443 27% | 348 0% | 388.1 11% |
| Brightness (cd/m²) | 339 | 444 31% | 324 -4% | 446 32% | 306 -10% | 344 1% |
| Brightness Distribution (%) | 87 | 93 7% | 88 1% | 88 1% | 78 -10% | 78 -10% |
| Black Level * (cd/m²) | 0.4 | 0.34 15% | 0.35 13% | 0.41 -2% | 0.2 50% | 0.39 2% |
| Contrast (:1) | 872 | 1356 56% | 934 7% | 1080 24% | 1740 100% | 995 14% |
| Colorchecker dE 2000 * | 7 | 3.43 51% | 6.54 7% | 2.6 63% | 2.79 60% | 4.6 34% |
| Colorchecker dE 2000 max. * | 16.2 | 5.55 66% | 15.59 4% | 4 75% | 5.53 66% | 9.1 44% |
| Greyscale dE 2000 * | 10.1 | 3.08 70% | 9.52 6% | 3 70% | 3.47 66% | 6.1 40% |
| Gamma | 2.22 99% | 3.03 73% | 2.35 94% | 2.38 92% | 2.54 87% | 2.07 106% |
| CCT | 9065 72% | 7014 93% | 8802 74% | 6780 96% | 6564 99% | 7104 91% |
| Color Space (Percent of AdobeRGB 1998) (%) | 58.7 | 64 9% | 59 1% | 62.6 7% | 60 2% | 59 1% |
| Color Space (Percent of sRGB) (%) | 90.9 | 99 9% | 92 1% | 98 8% | 93 2% | 91 0% |
| Moyenne finale (programmes/paramètres) | 11% /
23% | 5% /
4% | 11% /
21% | 5% /
20% | 17% /
15% |
* ... Moindre est la valeur, meilleures sont les performances
Temps de réponse de l'écran
| ↔ Temps de réponse noir à blanc | ||
|---|---|---|
| 28 ms ... hausse ↗ et chute ↘ combinées | ↗ 14.8 ms hausse | 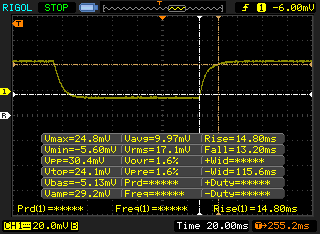 |
| ↘ 13.2 ms chute | ||
| L'écran souffre de latences relativement élevées, insuffisant pour le jeu. En comparaison, tous les appareils testés affichent entre 0.1 (minimum) et 240 (maximum) ms. » 71 % des appareils testés affichent de meilleures performances. Cela signifie que les latences relevées sont moins bonnes que la moyenne (19.9 ms) de tous les appareils testés. | ||
| ↔ Temps de réponse gris 50% à gris 80% | ||
| 35.6 ms ... hausse ↗ et chute ↘ combinées | ↗ 17.2 ms hausse | 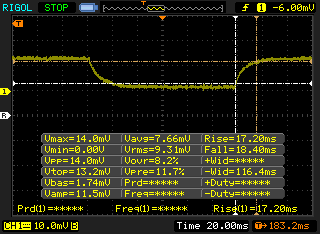 |
| ↘ 18.4 ms chute | ||
| L'écran souffre de latences très élevées, à éviter pour le jeu. En comparaison, tous les appareils testés affichent entre 0.165 (minimum) et 636 (maximum) ms. » 50 % des appareils testés affichent de meilleures performances. Cela signifie que les latences relevées sont moins bonnes que la moyenne (31.1 ms) de tous les appareils testés. | ||
Scintillement / MLI (Modulation de largeur d'impulsion)
| Scintillement / MLI (Modulation de largeur d'impulsion) décelé | 198.4 Hz | ≤ 99 Niveau de luminosité | 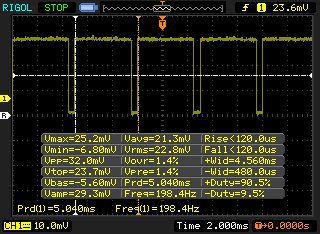 |
Le rétroéclairage de l'écran scintille à la fréquence de 198.4 Hz (certainement du fait de l'utilisation d'une MDI - Modulation de largeur d'impulsion) à un niveau de luminosité inférieur ou égal à 99 % . Aucun scintillement ne devrait être perceptible au-dessus de cette valeur. La fréquence de rafraîchissement de 198.4 Hz est relativement faible, les personnes les plus sensibles devraient percevoir un scintillement et être sujettes à une fatigue oculaire accrue (avec le niveau de luminosité indiqué) En comparaison, 52 % des appareils testés n'emploient pas MDI pour assombrir leur écran. Nous avons relevé une moyenne à 7798 (minimum : 5 - maximum : 343500) Hz dans le cas où une MDI était active. | |||
| Cinebench R11.5 | |
| CPU Single 64Bit | |
| Microsoft Surface Pro (2017) i7 | |
| Lenovo ThinkPad P51s 20HB000SGE | |
| HP Spectre x360 15t-bl100 | |
| MSI GF62VR 7RF-877 | |
| Lenovo Miix 520-12IKB 81CG | |
| Lenovo ThinkPad T460s-20FA003GGE | |
| HP Envy x360 15m-bq121dx | |
| Dell Latitude 7285 | |
| Dell Inspiron 15 7000 7577 | |
| HP 350 G2 L8B05ES | |
| CPU Multi 64Bit | |
| MSI GF62VR 7RF-877 | |
| HP Envy x360 15m-bq121dx | |
| Lenovo Miix 520-12IKB 81CG | |
| Dell Inspiron 15 7000 7577 | |
| HP Spectre x360 15t-bl100 | |
| Microsoft Surface Pro (2017) i7 | |
| Lenovo ThinkPad P51s 20HB000SGE | |
| Lenovo ThinkPad T460s-20FA003GGE | |
| Dell Latitude 7285 | |
| HP 350 G2 L8B05ES | |
| Cinebench R10 | |
| Rendering Multiple CPUs 32Bit | |
| MSI GF62VR 7RF-877 | |
| Dell Inspiron 15 7000 7577 | |
| Lenovo Miix 520-12IKB 81CG | |
| Acer Swift 3 SF315-51G-57E5 | |
| HP Spectre x360 15t-bl100 | |
| HP Envy x360 15m-bq121dx | |
| Microsoft Surface Pro (2017) i7 | |
| Lenovo ThinkPad P51s 20HB000SGE | |
| Lenovo ThinkPad T460s-20FA003GGE | |
| Dell Latitude 7285 | |
| HP 350 G2 L8B05ES | |
| Rendering Single 32Bit | |
| HP Spectre x360 15t-bl100 | |
| Lenovo ThinkPad P51s 20HB000SGE | |
| Microsoft Surface Pro (2017) i7 | |
| Acer Swift 3 SF315-51G-57E5 | |
| Lenovo Miix 520-12IKB 81CG | |
| MSI GF62VR 7RF-877 | |
| Dell Inspiron 15 7000 7577 | |
| Lenovo ThinkPad T460s-20FA003GGE | |
| Dell Latitude 7285 | |
| HP 350 G2 L8B05ES | |
| HP Envy x360 15m-bq121dx | |
| wPrime 2.10 - 1024m | |
| Microsoft Surface Pro (2017) i7 | |
| HP Spectre x360 15t-bl100 | |
| Dell Inspiron 15 7000 7577 | |
| Lenovo Miix 520-12IKB 81CG | |
| HP Envy x360 15m-bq121dx | |
| MSI GF62VR 7RF-877 | |
* ... Moindre est la valeur, meilleures sont les performances
| PCMark 8 | |
| Home Score Accelerated v2 | |
| Lenovo Miix 520-12IKB 81CG | |
| HP Elite x2 1012 G2-1LV76EA | |
| Lenovo Miix 510 Pro 80U10006GE | |
| Microsoft Surface Pro (2017) m3 | |
| Work Score Accelerated v2 | |
| Lenovo Miix 510 Pro 80U10006GE | |
| HP Elite x2 1012 G2-1LV76EA | |
| Microsoft Surface Pro (2017) m3 | |
| Lenovo Miix 520-12IKB 81CG | |
| Creative Score Accelerated v2 | |
| Lenovo Miix 520-12IKB 81CG | |
| HP Elite x2 1012 G2-1LV76EA | |
| Microsoft Surface Pro (2017) m3 | |
| PCMark 10 - Score | |
| Lenovo Miix 520-12IKB 81CG | |
| HP Elite x2 1012 G2-1LV76EA | |
| Microsoft Surface Pro (2017) m3 | |
| PCMark 8 Home Score Accelerated v2 | 3733 points | |
| PCMark 8 Creative Score Accelerated v2 | 4869 points | |
| PCMark 8 Work Score Accelerated v2 | 2699 points | |
| PCMark 10 Score | 3295 points | |
Aide | ||
| Lenovo Miix 520-12IKB 81CG Samsung PM961 MZVLW256HEHP | Microsoft Surface Pro (2017) m3 Samsung PM971 KUS020203M | Lenovo Miix 510 Pro 80U10006GE Samsung PM951 NVMe MZVLV256 | HP Elite x2 1012 G2-1LV76EA Samsung PM961 MZVLW256HEHP | Dell XPS 13 9365-4537 2-in-1 Toshiba NVMe THNSN5256GPUK | |
|---|---|---|---|---|---|
| AS SSD | -22% | -146% | 48% | -11% | |
| Copy Game MB/s (MB/s) | 410.8 | 140.7 -66% | 379.9 -8% | 457.8 11% | |
| Copy Program MB/s (MB/s) | 310.4 | 83.8 -73% | 198.2 -36% | 264.7 -15% | |
| Copy ISO MB/s (MB/s) | 659 | 173.2 -74% | 791 20% | 714 8% | |
| Score Total (Points) | 2378 | 1847 -22% | 1190 -50% | 4653 96% | 1388 -42% |
| Score Write (Points) | 572 | 284 -50% | 60 -90% | 879 54% | 389 -32% |
| Score Read (Points) | 1200 | 1053 -12% | 777 -35% | 2545 112% | 681 -43% |
| Access Time Write * (ms) | 0.33 | 0.04 88% | 4.206 -1175% | 0.027 92% | 0.041 88% |
| Access Time Read * (ms) | 0.49 | 0.074 85% | 0.053 89% | 0.041 92% | 0.169 66% |
| 4K-64 Write (MB/s) | 345.5 | 144.3 -58% | 43.14 -88% | 657 90% | 249.4 -28% |
| 4K-64 Read (MB/s) | 999 | 891 -11% | 611 -39% | 2280 128% | 512 -49% |
| 4K Write (MB/s) | 107.9 | 88.6 -18% | 0.96 -99% | 132.2 23% | 85.8 -20% |
| 4K Read (MB/s) | 48.69 | 38.82 -20% | 39.6 -19% | 45.24 -7% | 34.77 -29% |
| Seq Write (MB/s) | 1182 | 514 -57% | 158.3 -87% | 897 -24% | 543 -54% |
| Seq Read (MB/s) | 1523 | 1226 -20% | 1260 -17% | 2197 44% | 1342 -12% |
* ... Moindre est la valeur, meilleures sont les performances

| 3DMark 11 | |
| 1280x720 Performance GPU | |
| Intel Skull Canyon NUC6i7KYK | |
| Lenovo IdeaPad 320S-13IKB | |
| Microsoft Surface Laptop i7 | |
| Microsoft Surface Laptop i7 | |
| Razer Blade Stealth QHD i7-8550U | |
| Dell XPS 13 i5-8250U | |
| Toshiba Tecra X40-D | |
| Lenovo Miix 520-12IKB 81CG | |
| Acer TravelMate P249-M-5452 | |
| Lenovo Miix 510 Pro 80U10006GE | |
| 1280x720 Performance Combined | |
| Lenovo IdeaPad 320S-13IKB | |
| Intel Skull Canyon NUC6i7KYK | |
| Microsoft Surface Laptop i7 | |
| Microsoft Surface Laptop i7 | |
| Razer Blade Stealth QHD i7-8550U | |
| Dell XPS 13 i5-8250U | |
| Toshiba Tecra X40-D | |
| Lenovo Miix 520-12IKB 81CG | |
| Acer TravelMate P249-M-5452 | |
| Lenovo Miix 510 Pro 80U10006GE | |
| 3DMark | |
| 1280x720 Cloud Gate Standard Graphics | |
| Lenovo IdeaPad 320S-13IKB | |
| Intel Skull Canyon NUC6i7KYK | |
| Microsoft Surface Laptop i7 | |
| Razer Blade Stealth QHD i7-8550U | |
| Dell XPS 13 i5-8250U | |
| Toshiba Tecra X40-D | |
| Lenovo Miix 520-12IKB 81CG | |
| Acer TravelMate P249-M-5452 | |
| Lenovo Miix 510 Pro 80U10006GE | |
| 1920x1080 Fire Strike Graphics | |
| Lenovo IdeaPad 320S-13IKB | |
| Intel Skull Canyon NUC6i7KYK | |
| Microsoft Surface Laptop i7 | |
| Toshiba Tecra X40-D | |
| Lenovo Miix 520-12IKB 81CG | |
| Acer TravelMate P249-M-5452 | |
| 1920x1080 Ice Storm Extreme Graphics | |
| Intel Skull Canyon NUC6i7KYK | |
| Lenovo Miix 520-12IKB 81CG | |
| Acer TravelMate P249-M-5452 | |
| 3DMark 11 Performance | 1800 points | |
| 3DMark Ice Storm Standard Score | 65197 points | |
| 3DMark Cloud Gate Standard Score | 7775 points | |
| 3DMark Fire Strike Score | 952 points | |
| 3DMark Fire Strike Extreme Score | 437 points | |
Aide | ||
| Bas | Moyen | Élevé | Ultra | |
|---|---|---|---|---|
| BioShock Infinite (2013) | 54.3 | 29.3 | 24.1 | 7.4 |
| Rise of the Tomb Raider (2016) | 21.3 | 11 |
Degré de la nuisance sonore
| Au repos |
| 28.2 / 28.2 / 29.6 dB(A) |
| Fortement sollicité |
| 34 / 36 dB(A) |
 | ||
30 dB silencieux 40 dB(A) audible 50 dB(A) bruyant |
||
min: | ||
| Lenovo Miix 520-12IKB 81CG UHD Graphics 620, i5-8250U, Samsung PM961 MZVLW256HEHP | Microsoft Surface Pro (2017) i7 Iris Plus Graphics 640, i7-7660U, Samsung PM971 KUS040202M | Lenovo Miix 510 Pro 80U10006GE HD Graphics 520, 6200U, Samsung PM951 NVMe MZVLV256 | HP Elite x2 1012 G2-1LV76EA HD Graphics 620, i5-7200U, Samsung PM961 MZVLW256HEHP | Dell XPS 13 9365-4537 2-in-1 HD Graphics 615, i5-7Y54, Toshiba NVMe THNSN5256GPUK | Lenovo ThinkPad X1 Tablet Gen 2 HD Graphics 615, i5-7Y54, Samsung PM961 MZVLW256HEHP | |
|---|---|---|---|---|---|---|
| Noise | -1% | -5% | 1% | |||
| arrêt / environnement * (dB) | 28.2 | 29.6 -5% | 30.15 -7% | 29.5 -5% | ||
| Idle Minimum * (dB) | 28.2 | 29.6 -5% | 30.15 -7% | 29.5 -5% | ||
| Idle Average * (dB) | 28.2 | 29.6 -5% | 30.8 -9% | 29.5 -5% | ||
| Idle Maximum * (dB) | 29.6 | 29.6 -0% | 31 -5% | 29.5 -0% | ||
| Load Average * (dB) | 34 | 33.4 2% | 36.8 -8% | 30.6 10% | ||
| Load Maximum * (dB) | 36 | 34.1 5% | 33.8 6% | 32.5 10% | ||
| Witcher 3 ultra * (dB) | 33.4 |
* ... Moindre est la valeur, meilleures sont les performances
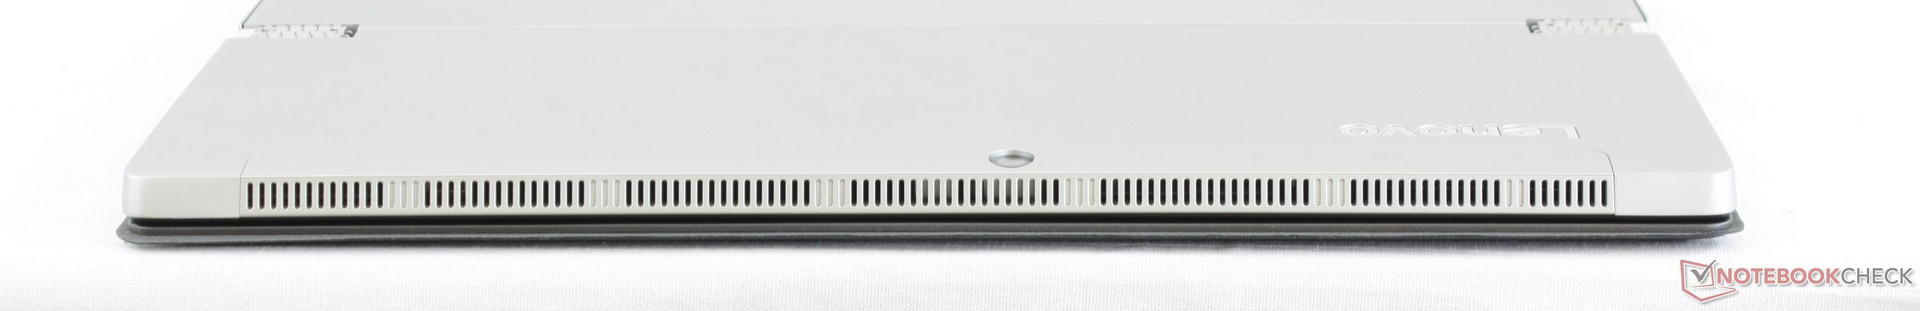
(±) La température maximale du côté supérieur est de 44.8 °C / 113 F, par rapport à la moyenne de 35.4 °C / 96 F, allant de 19.6 à 60 °C pour la classe Convertible.
(±) Le fond chauffe jusqu'à un maximum de 44.2 °C / 112 F, contre une moyenne de 36.9 °C / 98 F
(+) En utilisation inactive, la température moyenne du côté supérieur est de 28 °C / 82 F, par rapport à la moyenne du dispositif de 30.3 °C / 87 F.
(+) Les repose-poignets et le pavé tactile atteignent la température maximale de la peau (35 °C / 95 F) et ne sont donc pas chauds.
(-) La température moyenne de la zone de l'appui-paume de dispositifs similaires était de 28 °C / 82.4 F (-7 °C / #-12.6 F).
Lenovo Miix 520-12IKB 81CG analyse audio
(-) | haut-parleurs pas très forts (61.3 dB)
Basses 100 - 315 Hz
(-) | presque aucune basse - en moyenne 18.1% plus bas que la médiane
(±) | la linéarité des basses est moyenne (12.5% delta à la fréquence précédente)
Médiums 400 - 2000 Hz
(+) | médiane équilibrée - seulement 4% de la médiane
(±) | la linéarité des médiums est moyenne (9.9% delta à la fréquence précédente)
Aiguës 2 - 16 kHz
(±) | sommets plus élevés - en moyenne 5.1% plus élevés que la médiane
(±) | la linéarité des aigus est moyenne (10.9% delta à la fréquence précédente)
Globalement 100 - 16 000 Hz
(-) | le son global n'est pas linéaire (31% de différence à la médiane)
Par rapport à la même classe
» 90% de tous les appareils testés de cette catégorie étaient meilleurs, 2% similaires, 8% pires
» Le meilleur avait un delta de 6%, la moyenne était de 20%, le pire était de 57%.
Par rapport à tous les appareils testés
» 90% de tous les appareils testés étaient meilleurs, 2% similaires, 8% pires
» Le meilleur avait un delta de 4%, la moyenne était de 24%, le pire était de 134%.
Apple MacBook 12 (Early 2016) 1.1 GHz analyse audio
(+) | les haut-parleurs peuvent jouer relativement fort (83.6# dB)
Basses 100 - 315 Hz
(±) | basse réduite - en moyenne 11.3% inférieure à la médiane
(±) | la linéarité des basses est moyenne (14.2% delta à la fréquence précédente)
Médiums 400 - 2000 Hz
(+) | médiane équilibrée - seulement 2.4% de la médiane
(+) | les médiums sont linéaires (5.5% delta à la fréquence précédente)
Aiguës 2 - 16 kHz
(+) | des sommets équilibrés - à seulement 2% de la médiane
(+) | les aigus sont linéaires (4.5% delta à la fréquence précédente)
Globalement 100 - 16 000 Hz
(+) | le son global est linéaire (10.2% différence à la médiane)
Par rapport à la même classe
» 7% de tous les appareils testés de cette catégorie étaient meilleurs, 2% similaires, 91% pires
» Le meilleur avait un delta de 5%, la moyenne était de 18%, le pire était de 53%.
Par rapport à tous les appareils testés
» 5% de tous les appareils testés étaient meilleurs, 1% similaires, 94% pires
» Le meilleur avait un delta de 4%, la moyenne était de 24%, le pire était de 134%.
| Éteint/en veille | |
| Au repos | |
| Fortement sollicité |
|
Légende:
min: | |
| Lenovo Miix 520-12IKB 81CG i5-8250U, UHD Graphics 620, Samsung PM961 MZVLW256HEHP, IPS, 1920x1200, 12.2" | Microsoft Surface Pro (2017) i7 i7-7660U, Iris Plus Graphics 640, Samsung PM971 KUS040202M, IPS, 2736x1824, 12.3" | Microsoft Surface Pro (2017) i5 i5-7300U, HD Graphics 620, Samsung PM971 KUS030202M, IPS, 2736x1824, 12.3" | Lenovo Miix 510 Pro 80U10006GE 6200U, HD Graphics 520, Samsung PM951 NVMe MZVLV256, IPS, 1920x1200, 12.2" | HP Elite x2 1012 G2-1LV76EA i5-7200U, HD Graphics 620, Samsung PM961 MZVLW256HEHP, IPS, 2716x1824, 12.3" | Dell XPS 13 9365-4537 2-in-1 i5-7Y54, HD Graphics 615, Toshiba NVMe THNSN5256GPUK, IPS, 3200x1800, 13.3" | |
|---|---|---|---|---|---|---|
| Power Consumption | -2% | 26% | 6% | -0% | -3% | |
| Idle Minimum * (Watt) | 5.5 | 4.2 24% | 3.6 35% | 4.2 24% | 4.1 25% | 8.2 -49% |
| Idle Average * (Watt) | 8.3 | 10.1 -22% | 8.1 2% | 11.5 -39% | 9.2 -11% | 10.8 -30% |
| Idle Maximum * (Watt) | 11.5 | 14 -22% | 8.7 24% | 11.7 -2% | 11.1 3% | 12.7 -10% |
| Load Average * (Watt) | 38.3 | 37.4 2% | 25.5 33% | 31 19% | 33.8 12% | 22.6 41% |
| Load Maximum * (Watt) | 37.7 | 34 10% | 23.5 38% | 27.4 27% | 49.2 -31% | 24.6 35% |
| Witcher 3 ultra * (Watt) | 38.1 |
* ... Moindre est la valeur, meilleures sont les performances
| Lenovo Miix 520-12IKB 81CG i5-8250U, UHD Graphics 620, 38 Wh | Microsoft Surface Pro (2017) i5 i5-7300U, HD Graphics 620, 45 Wh | Lenovo Miix 510 Pro 80U10006GE 6200U, HD Graphics 520, 50 Wh | HP Elite x2 1012 G2-1LV76EA i5-7200U, HD Graphics 620, 47 Wh | Dell XPS 13 9365-4537 2-in-1 i5-7Y54, HD Graphics 615, 46 Wh | Lenovo ThinkPad X1 Tablet Gen 2 i5-7Y54, HD Graphics 615, 37 Wh | |
|---|---|---|---|---|---|---|
| Autonomie de la batterie | 106% | 21% | 45% | 21% | 40% | |
| Reader / Idle (h) | 12.3 | 17.6 43% | 11.6 -6% | 13.9 13% | 11 -11% | |
| WiFi v1.3 (h) | 5.6 | 12.4 121% | 5.4 -4% | 6.3 13% | 6.8 21% | 7.4 32% |
| Load (h) | 1.1 | 2.8 155% | 1.9 73% | 2.3 109% | 2.2 100% |
Points positifs
Points négatifs
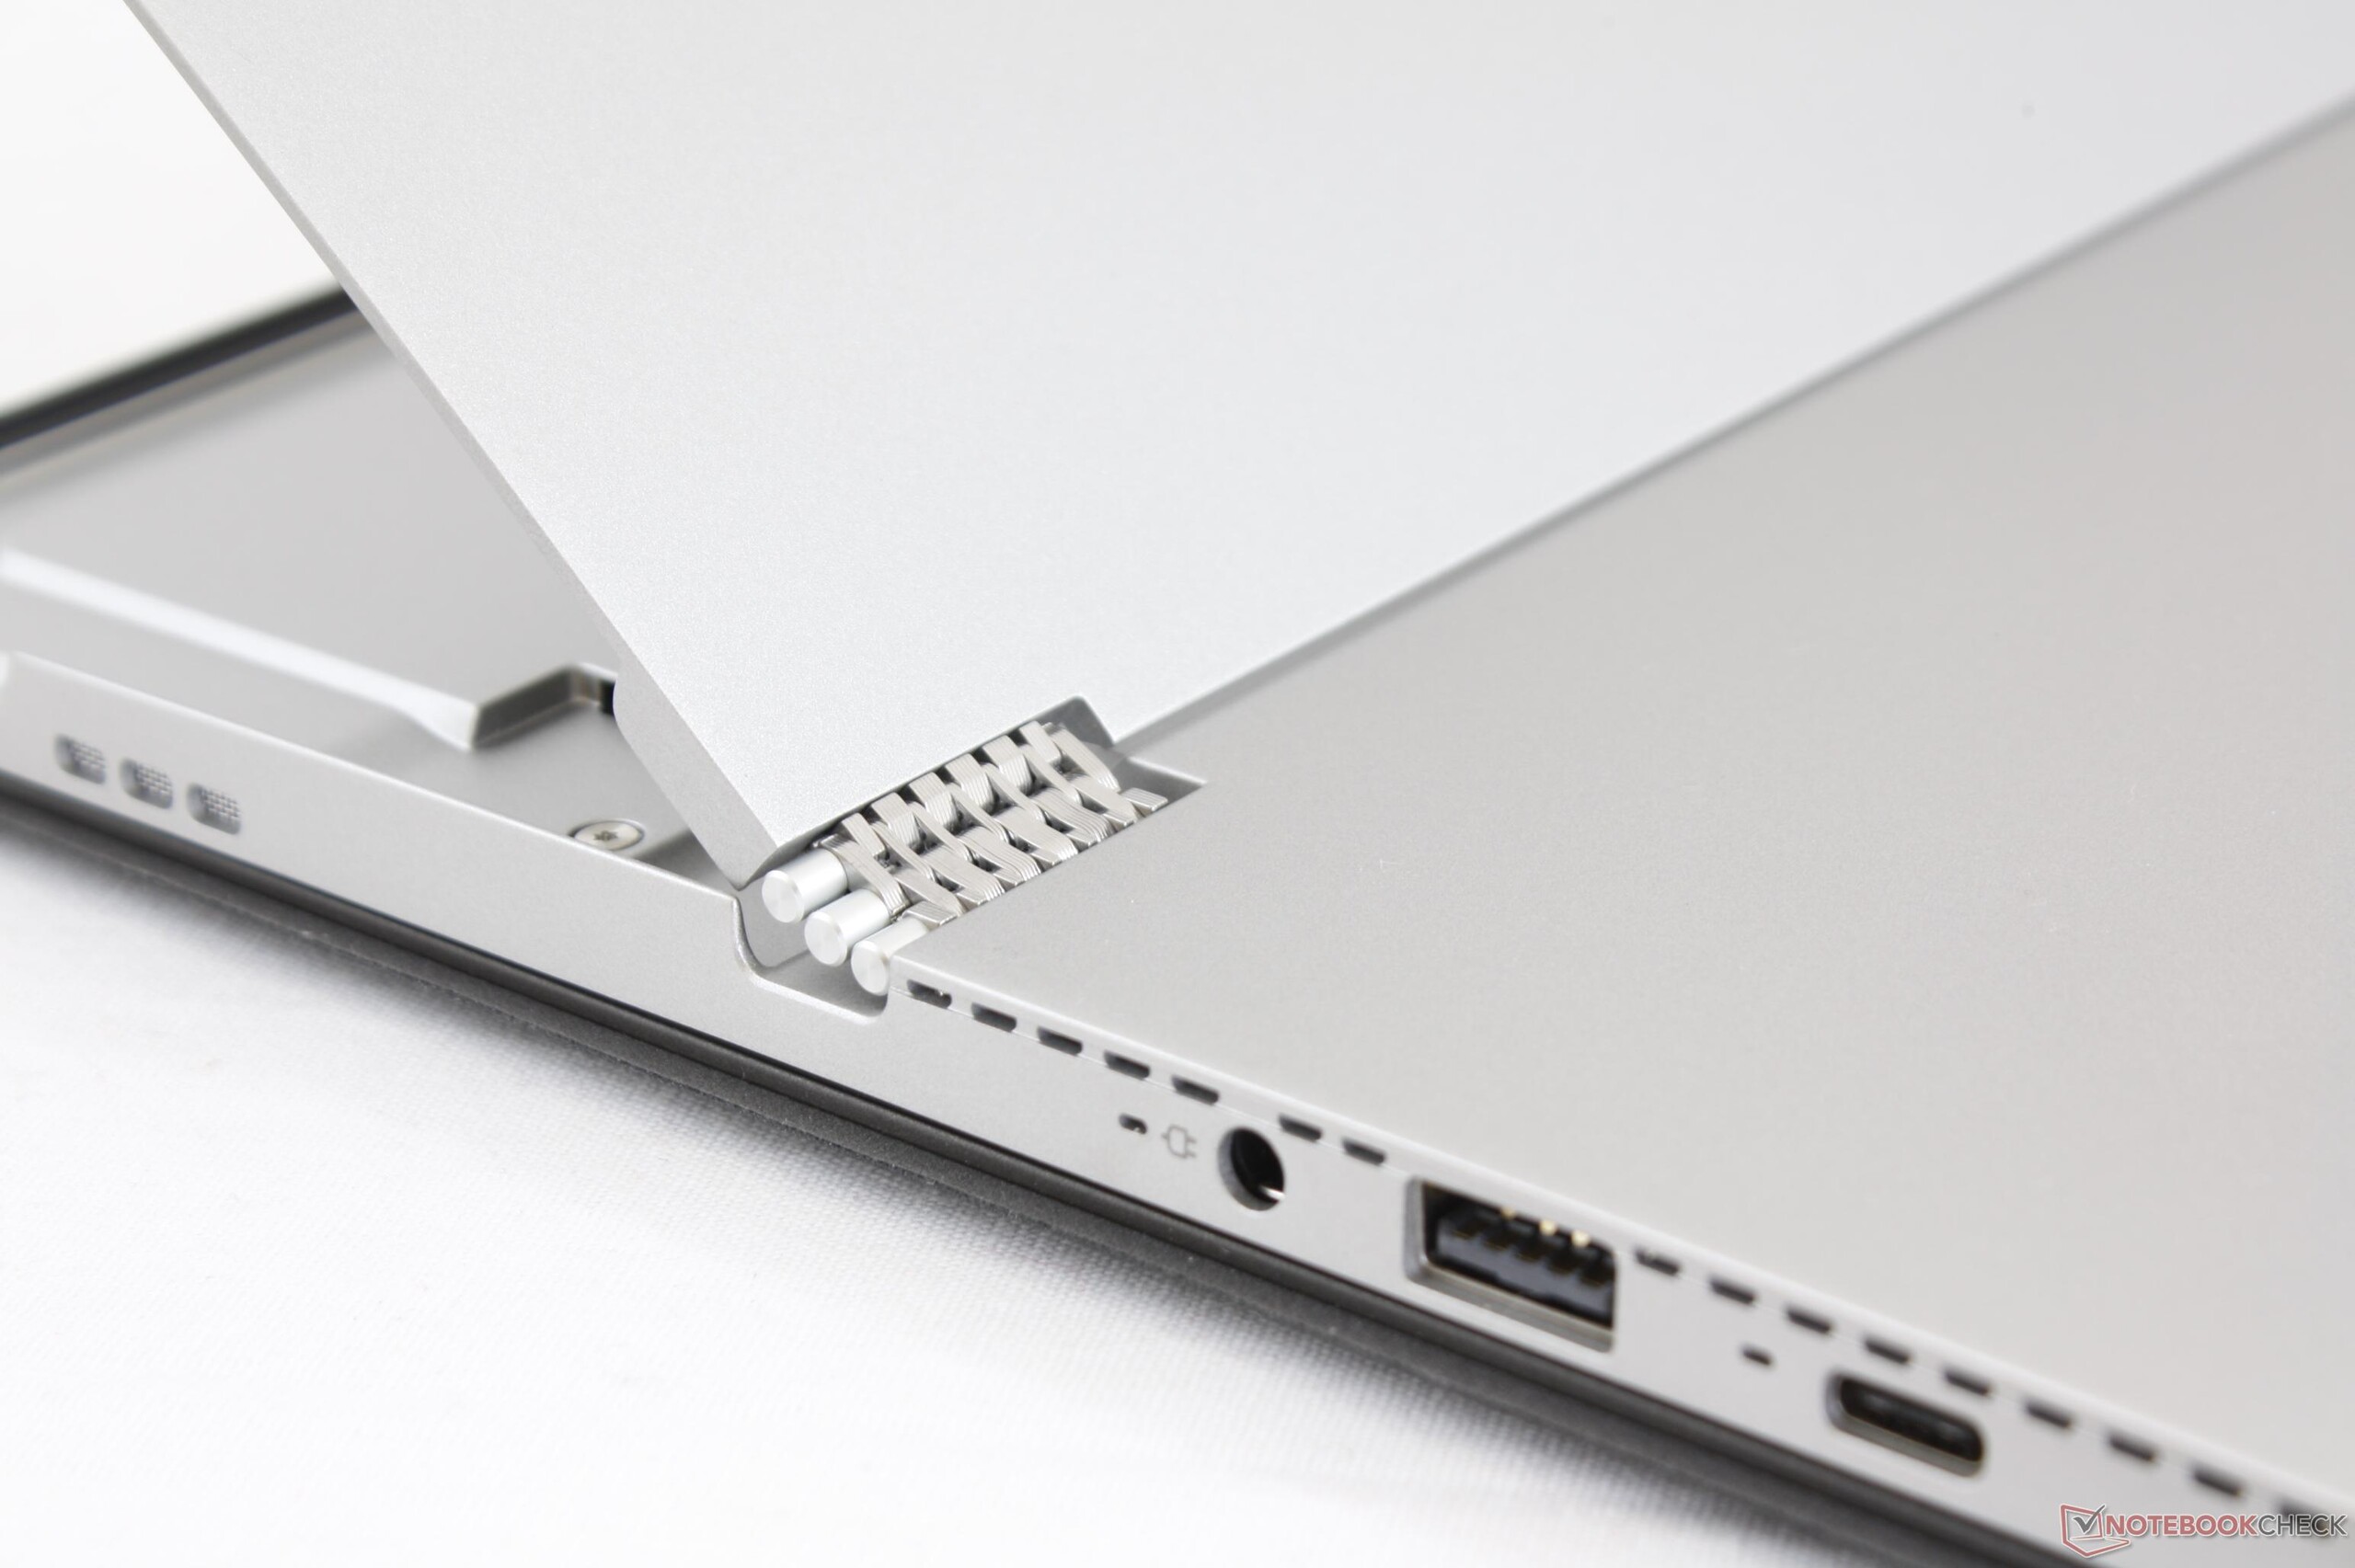
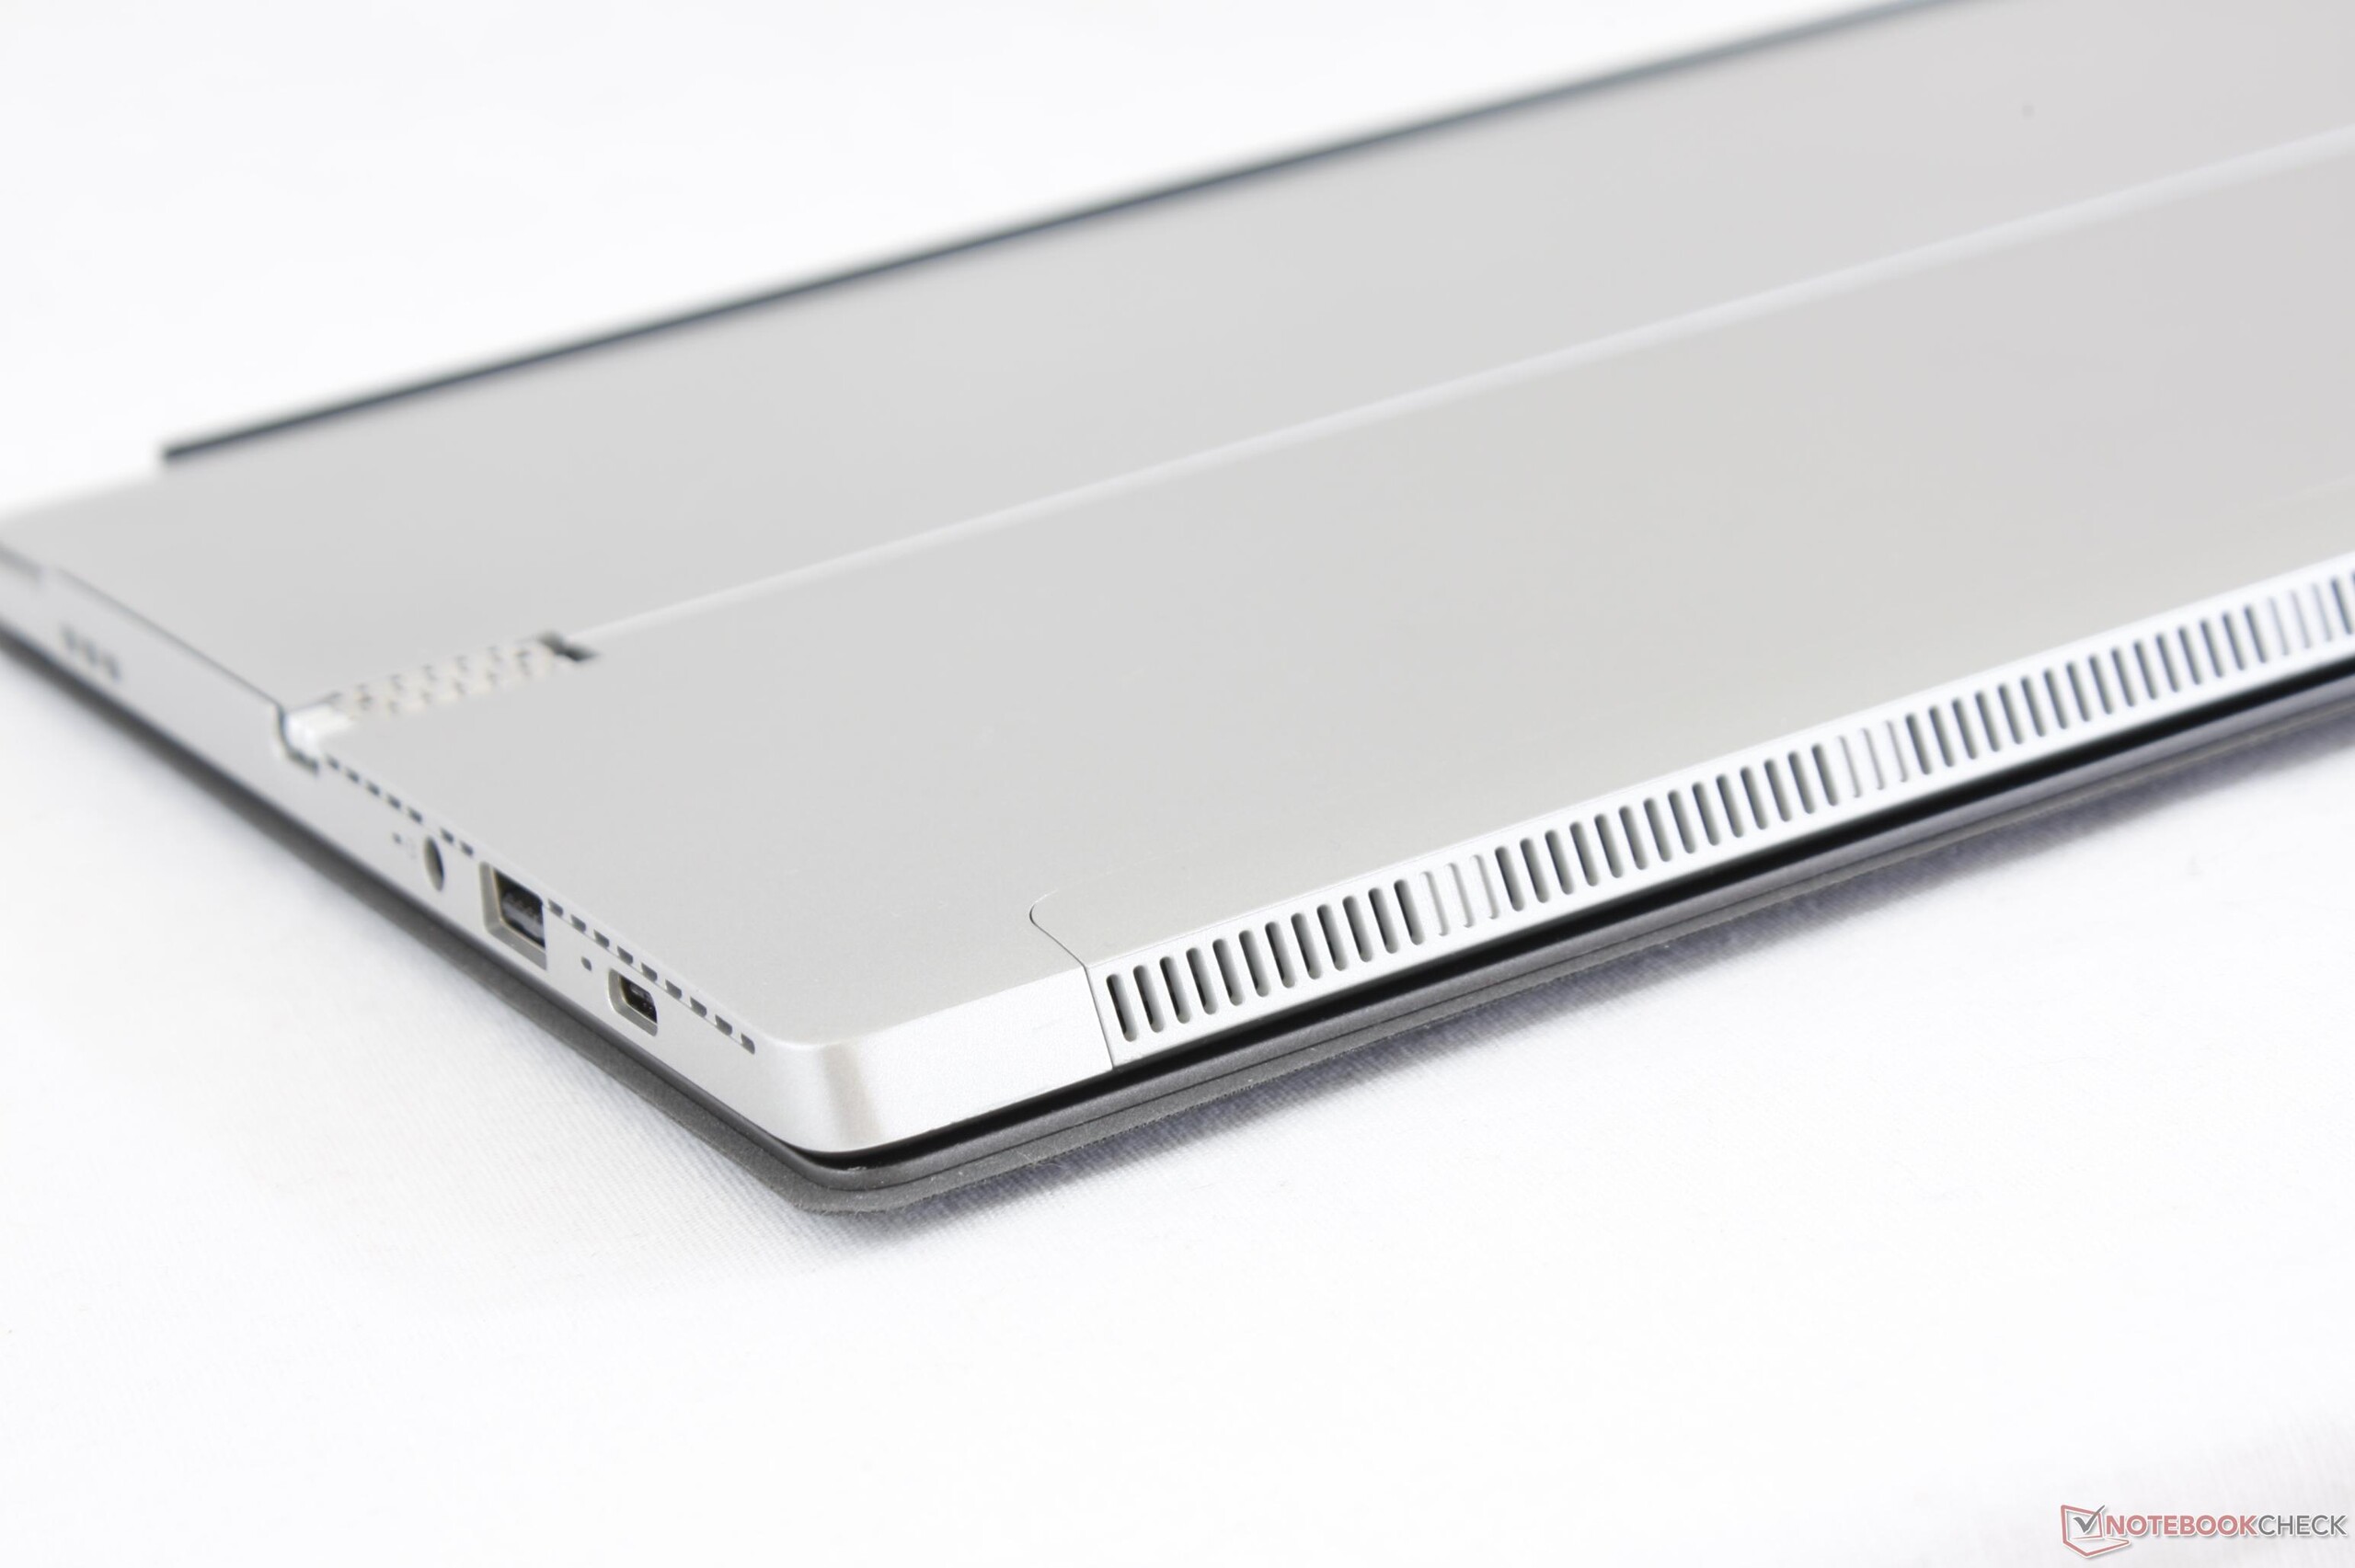
Les meilleurs aspects de la Miix 520 sont les performances de son processeur et de son SSD, la polyvalence de ses ports, et son prix. Son rapport prix / performances est en effet l’un des meilleurs du marché, la plupart des autres tablettes Windows étant toujours bloquées avec des processeurs Core Y ou de 7e génération. Ceux qui veulent un peu plus de puissance, trouveront que la Miix 520 est un faux ultrabook efficace.
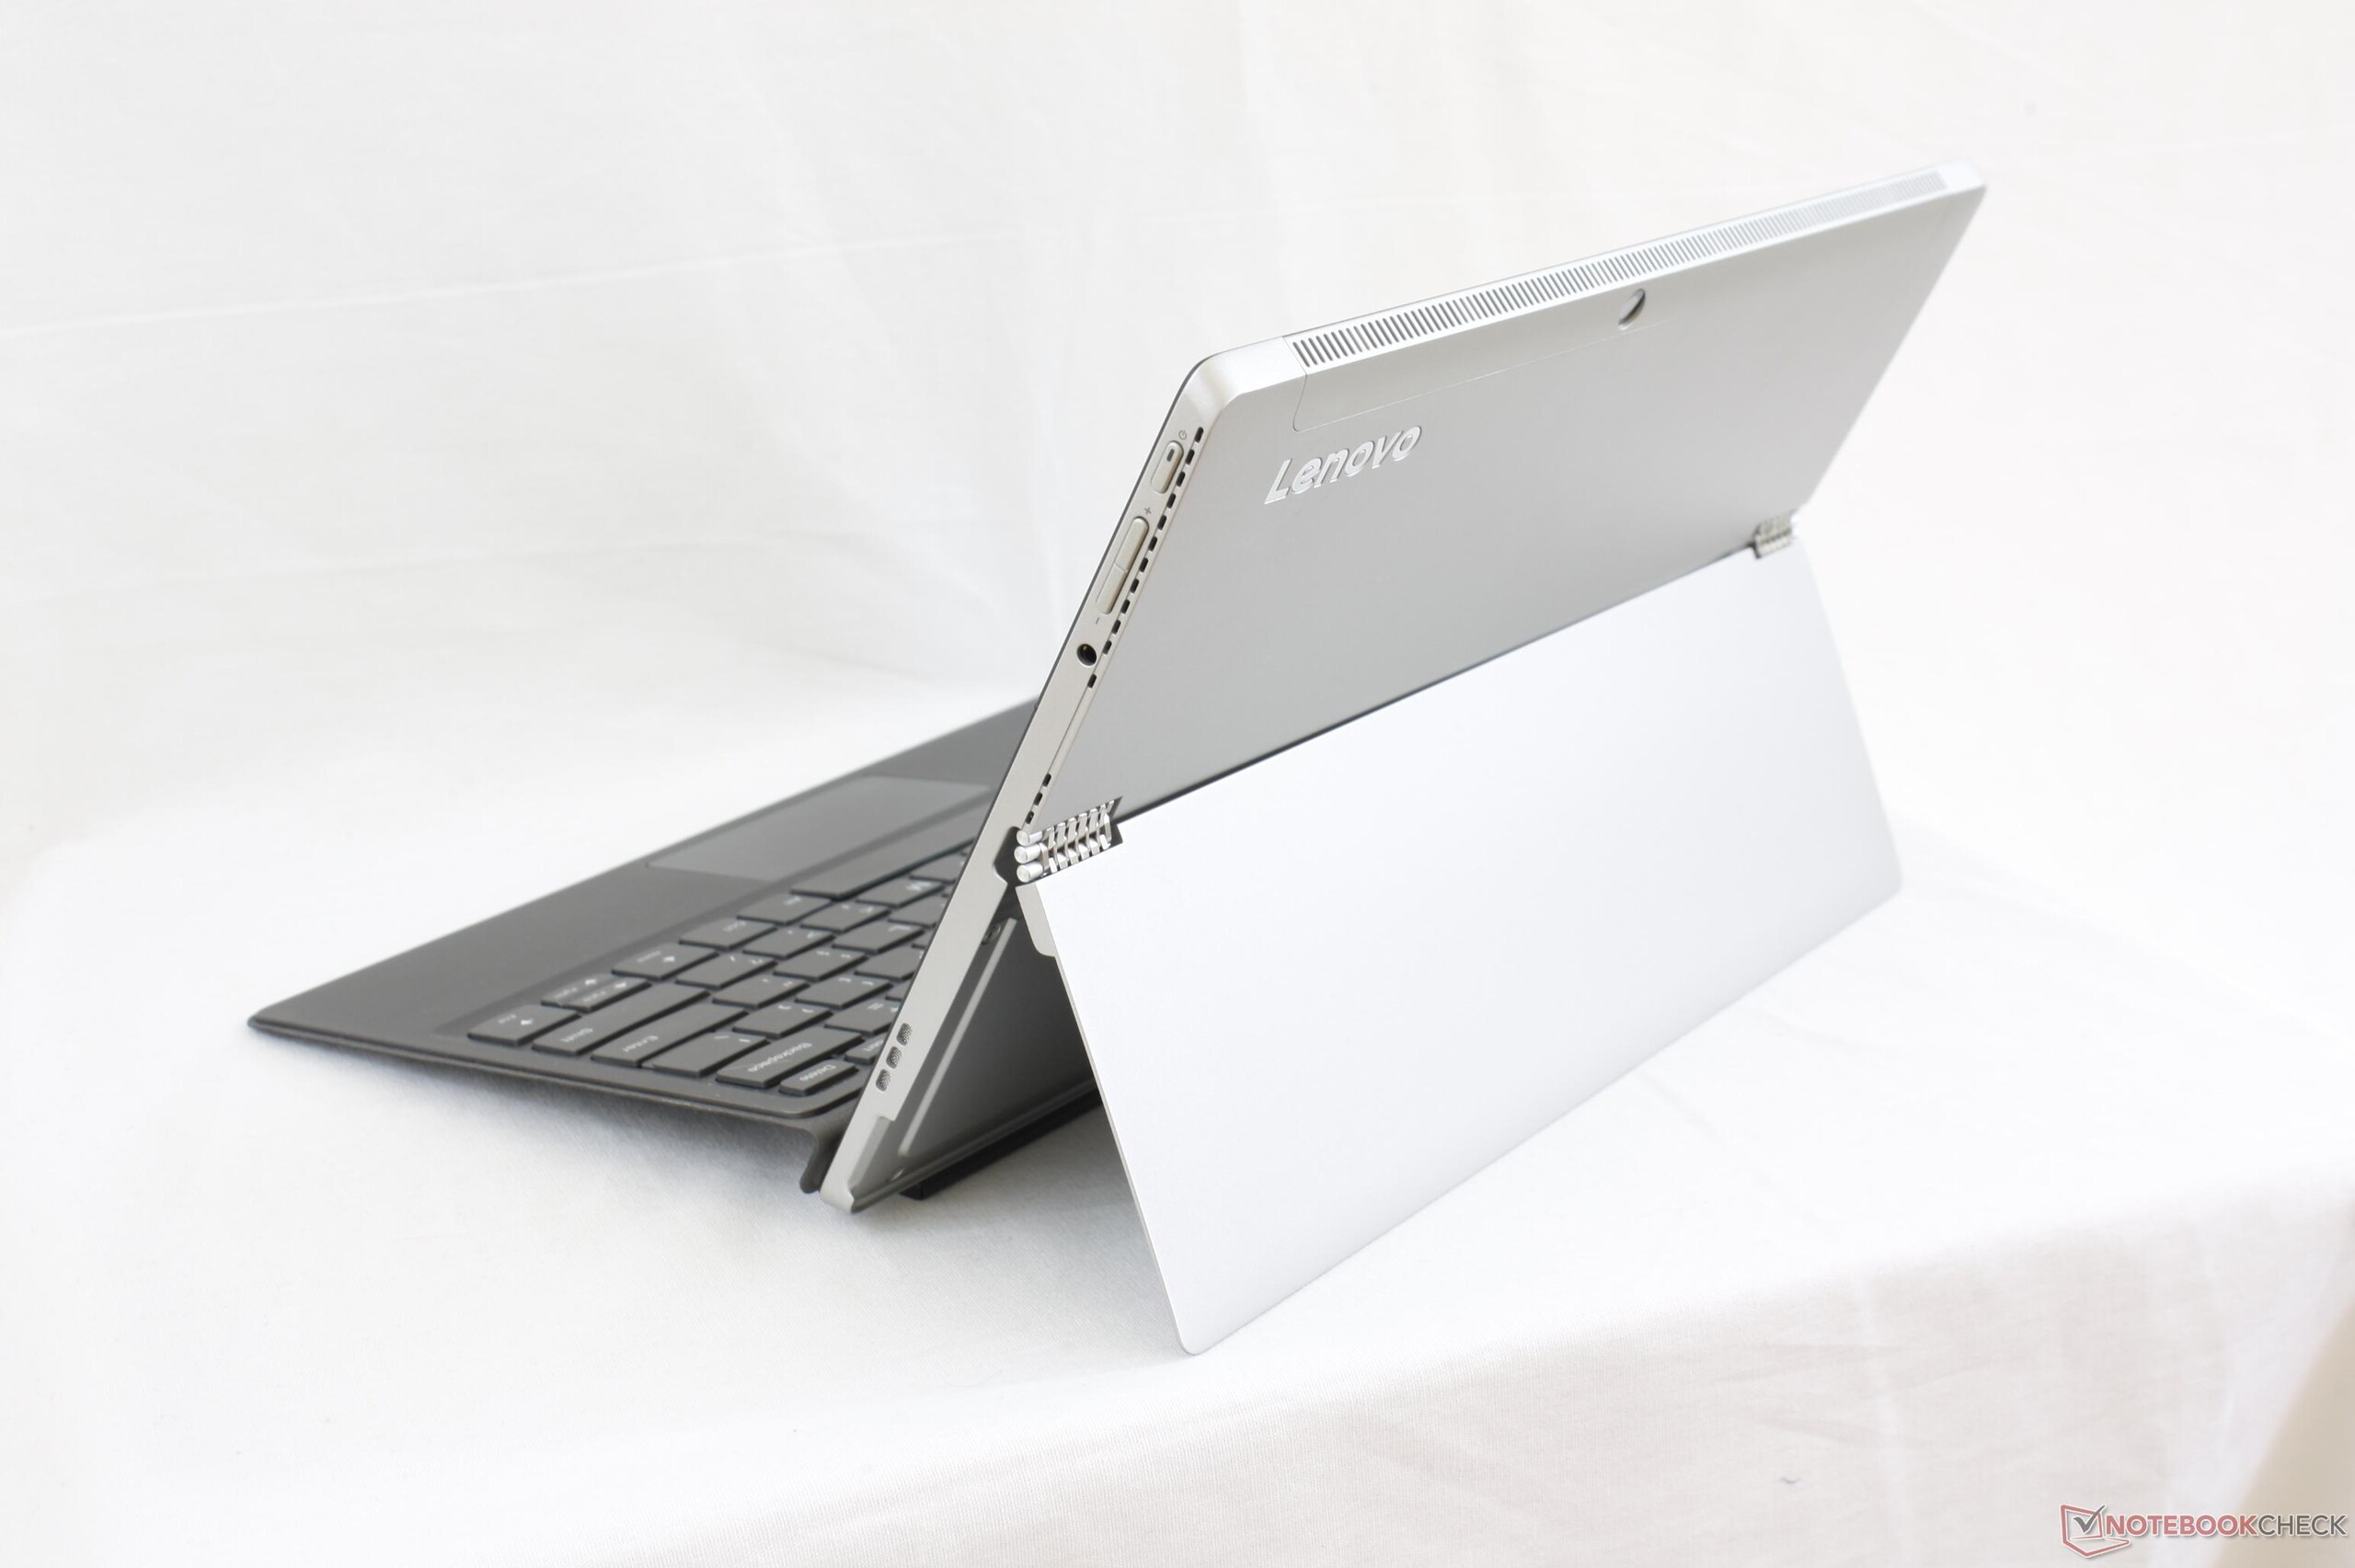
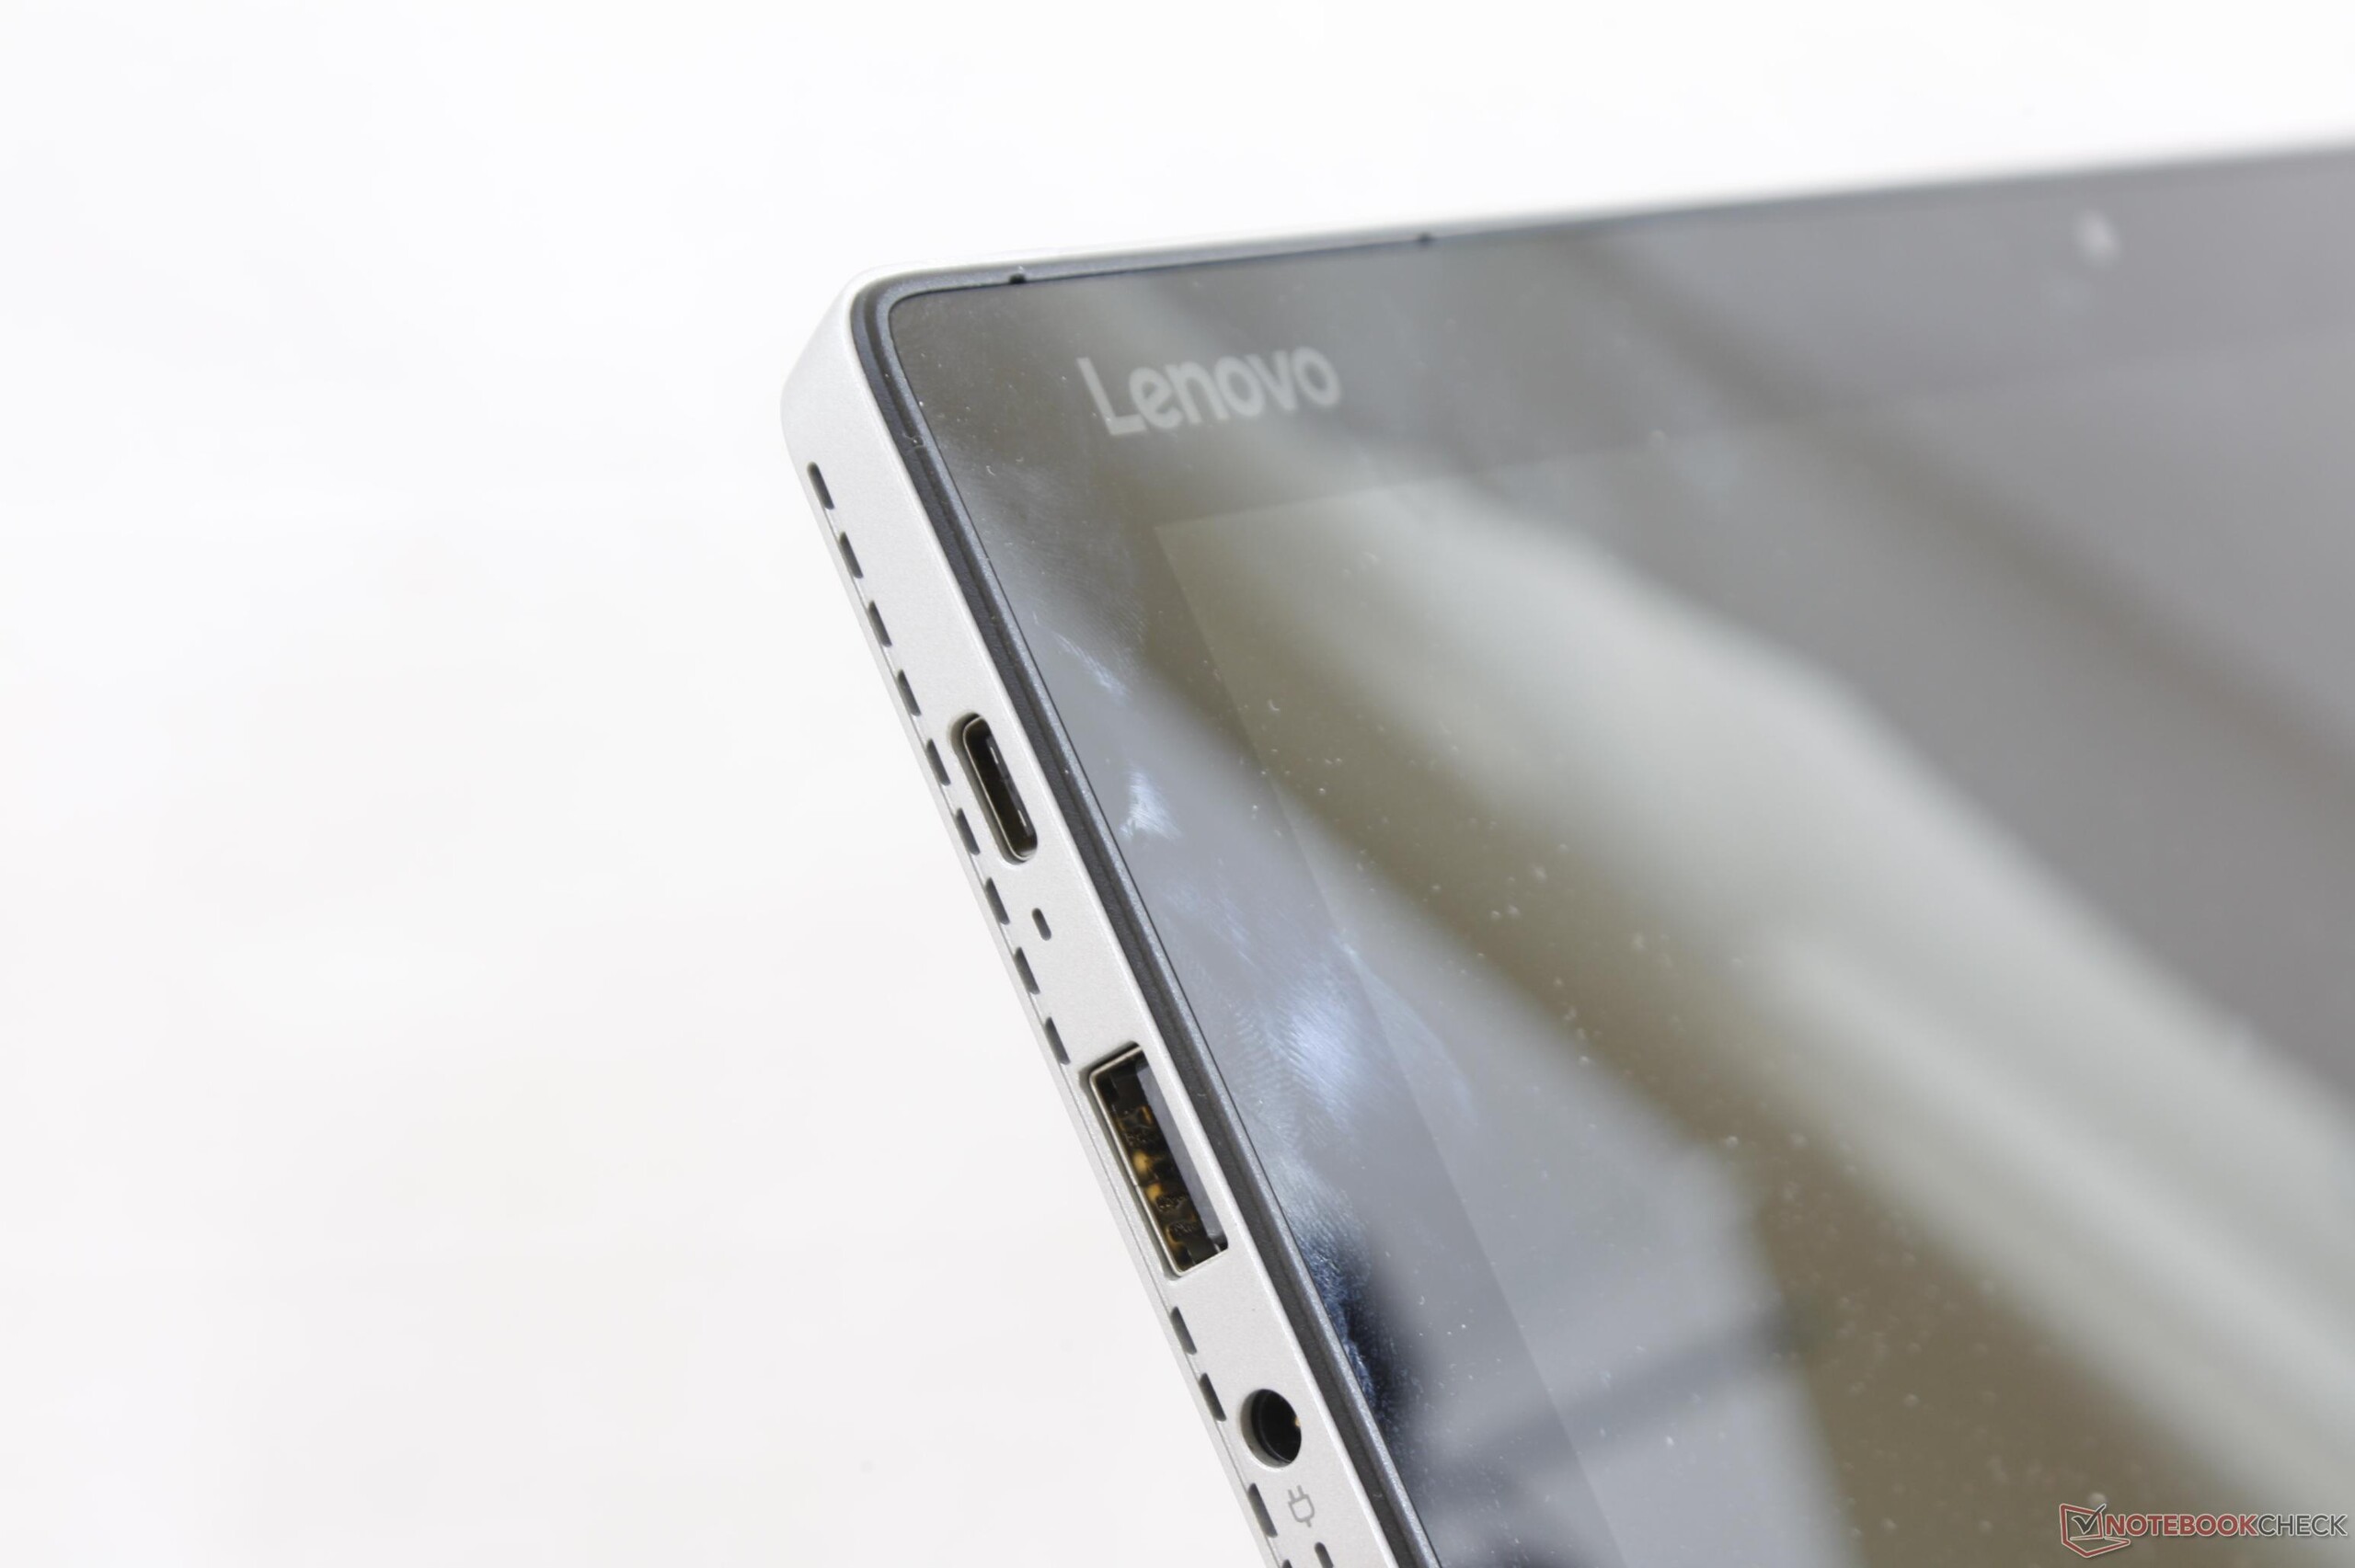
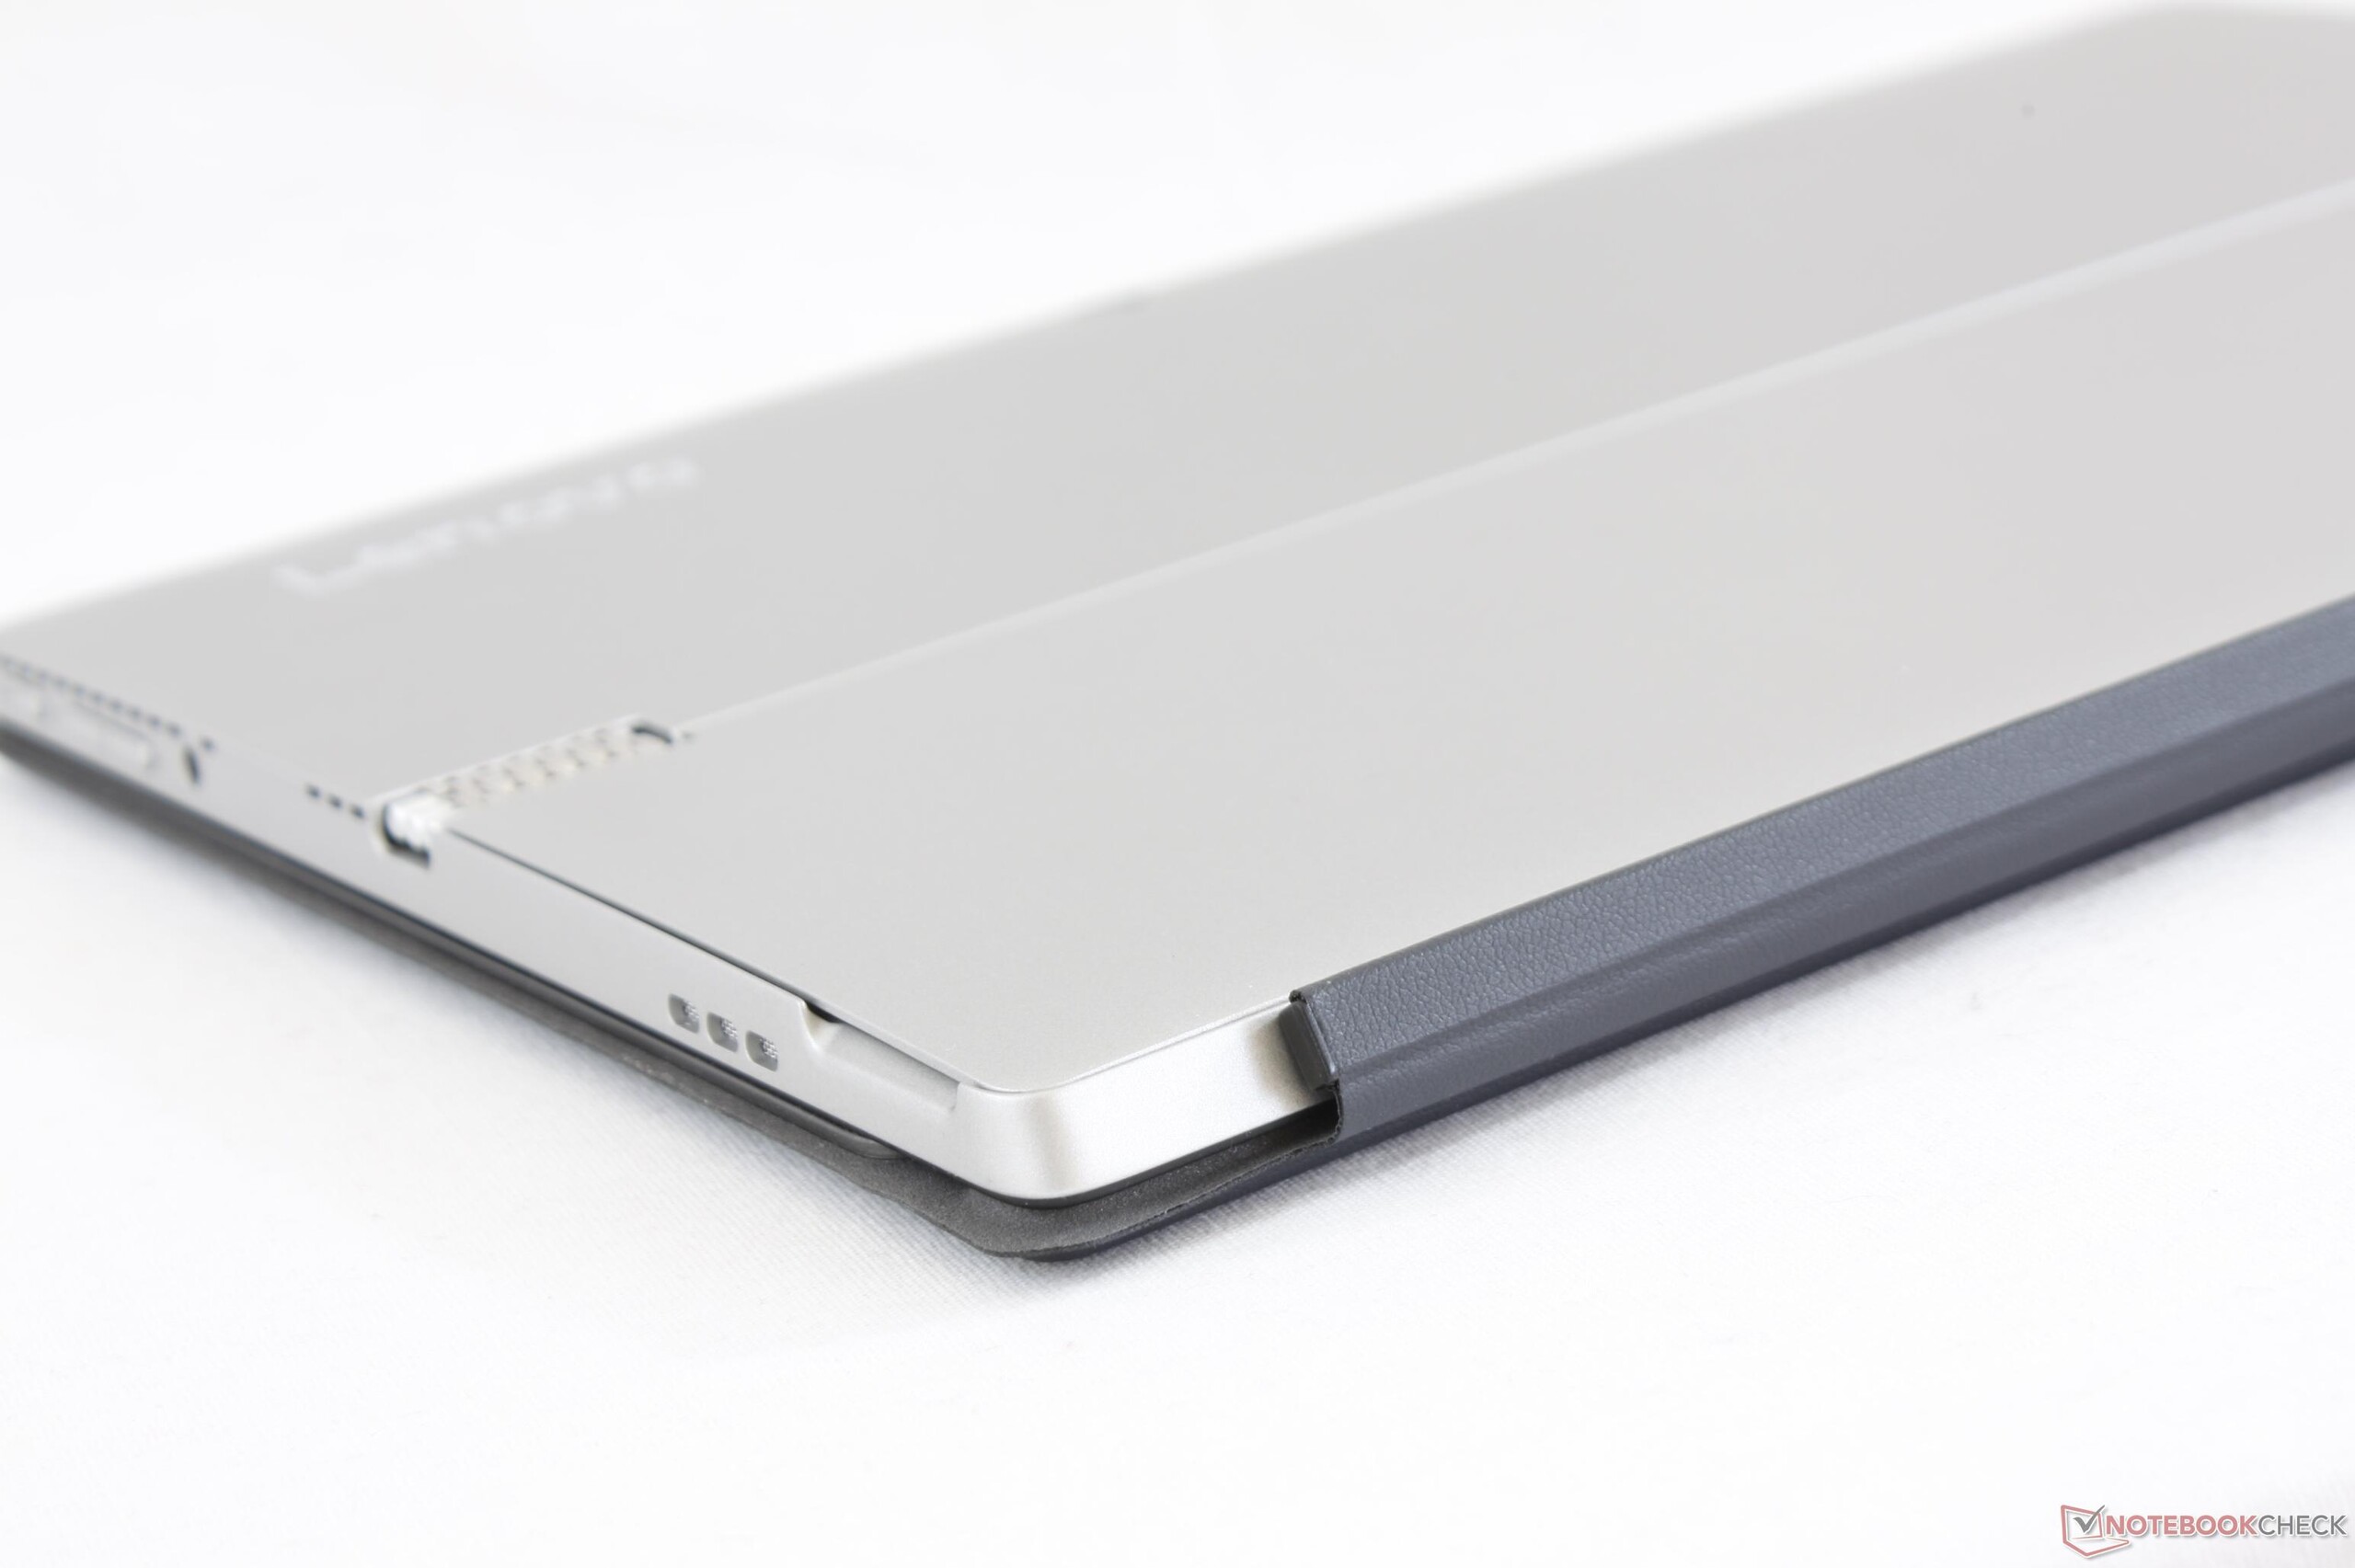
Le reste n’est pas nécessairement mauvais, ni même moyen, mais c’est sûr que des progrès peuvent être faits, quand on compare cette tablette aux concurrentes. Le Surface Pro et l’Elite x2 sont plus robustes, ont des écrans avec une meilleure résolution et de meilleurs couleurs, et une meilleure autonomie. La tablette HP en particulier possède également un port Thunderbolt 3, et possède encore plus de ports. Un clavier plus ferme aurait amélioré l’expérience de frappe molle, par rapport à la plupart des claviers d’ultrabooks.
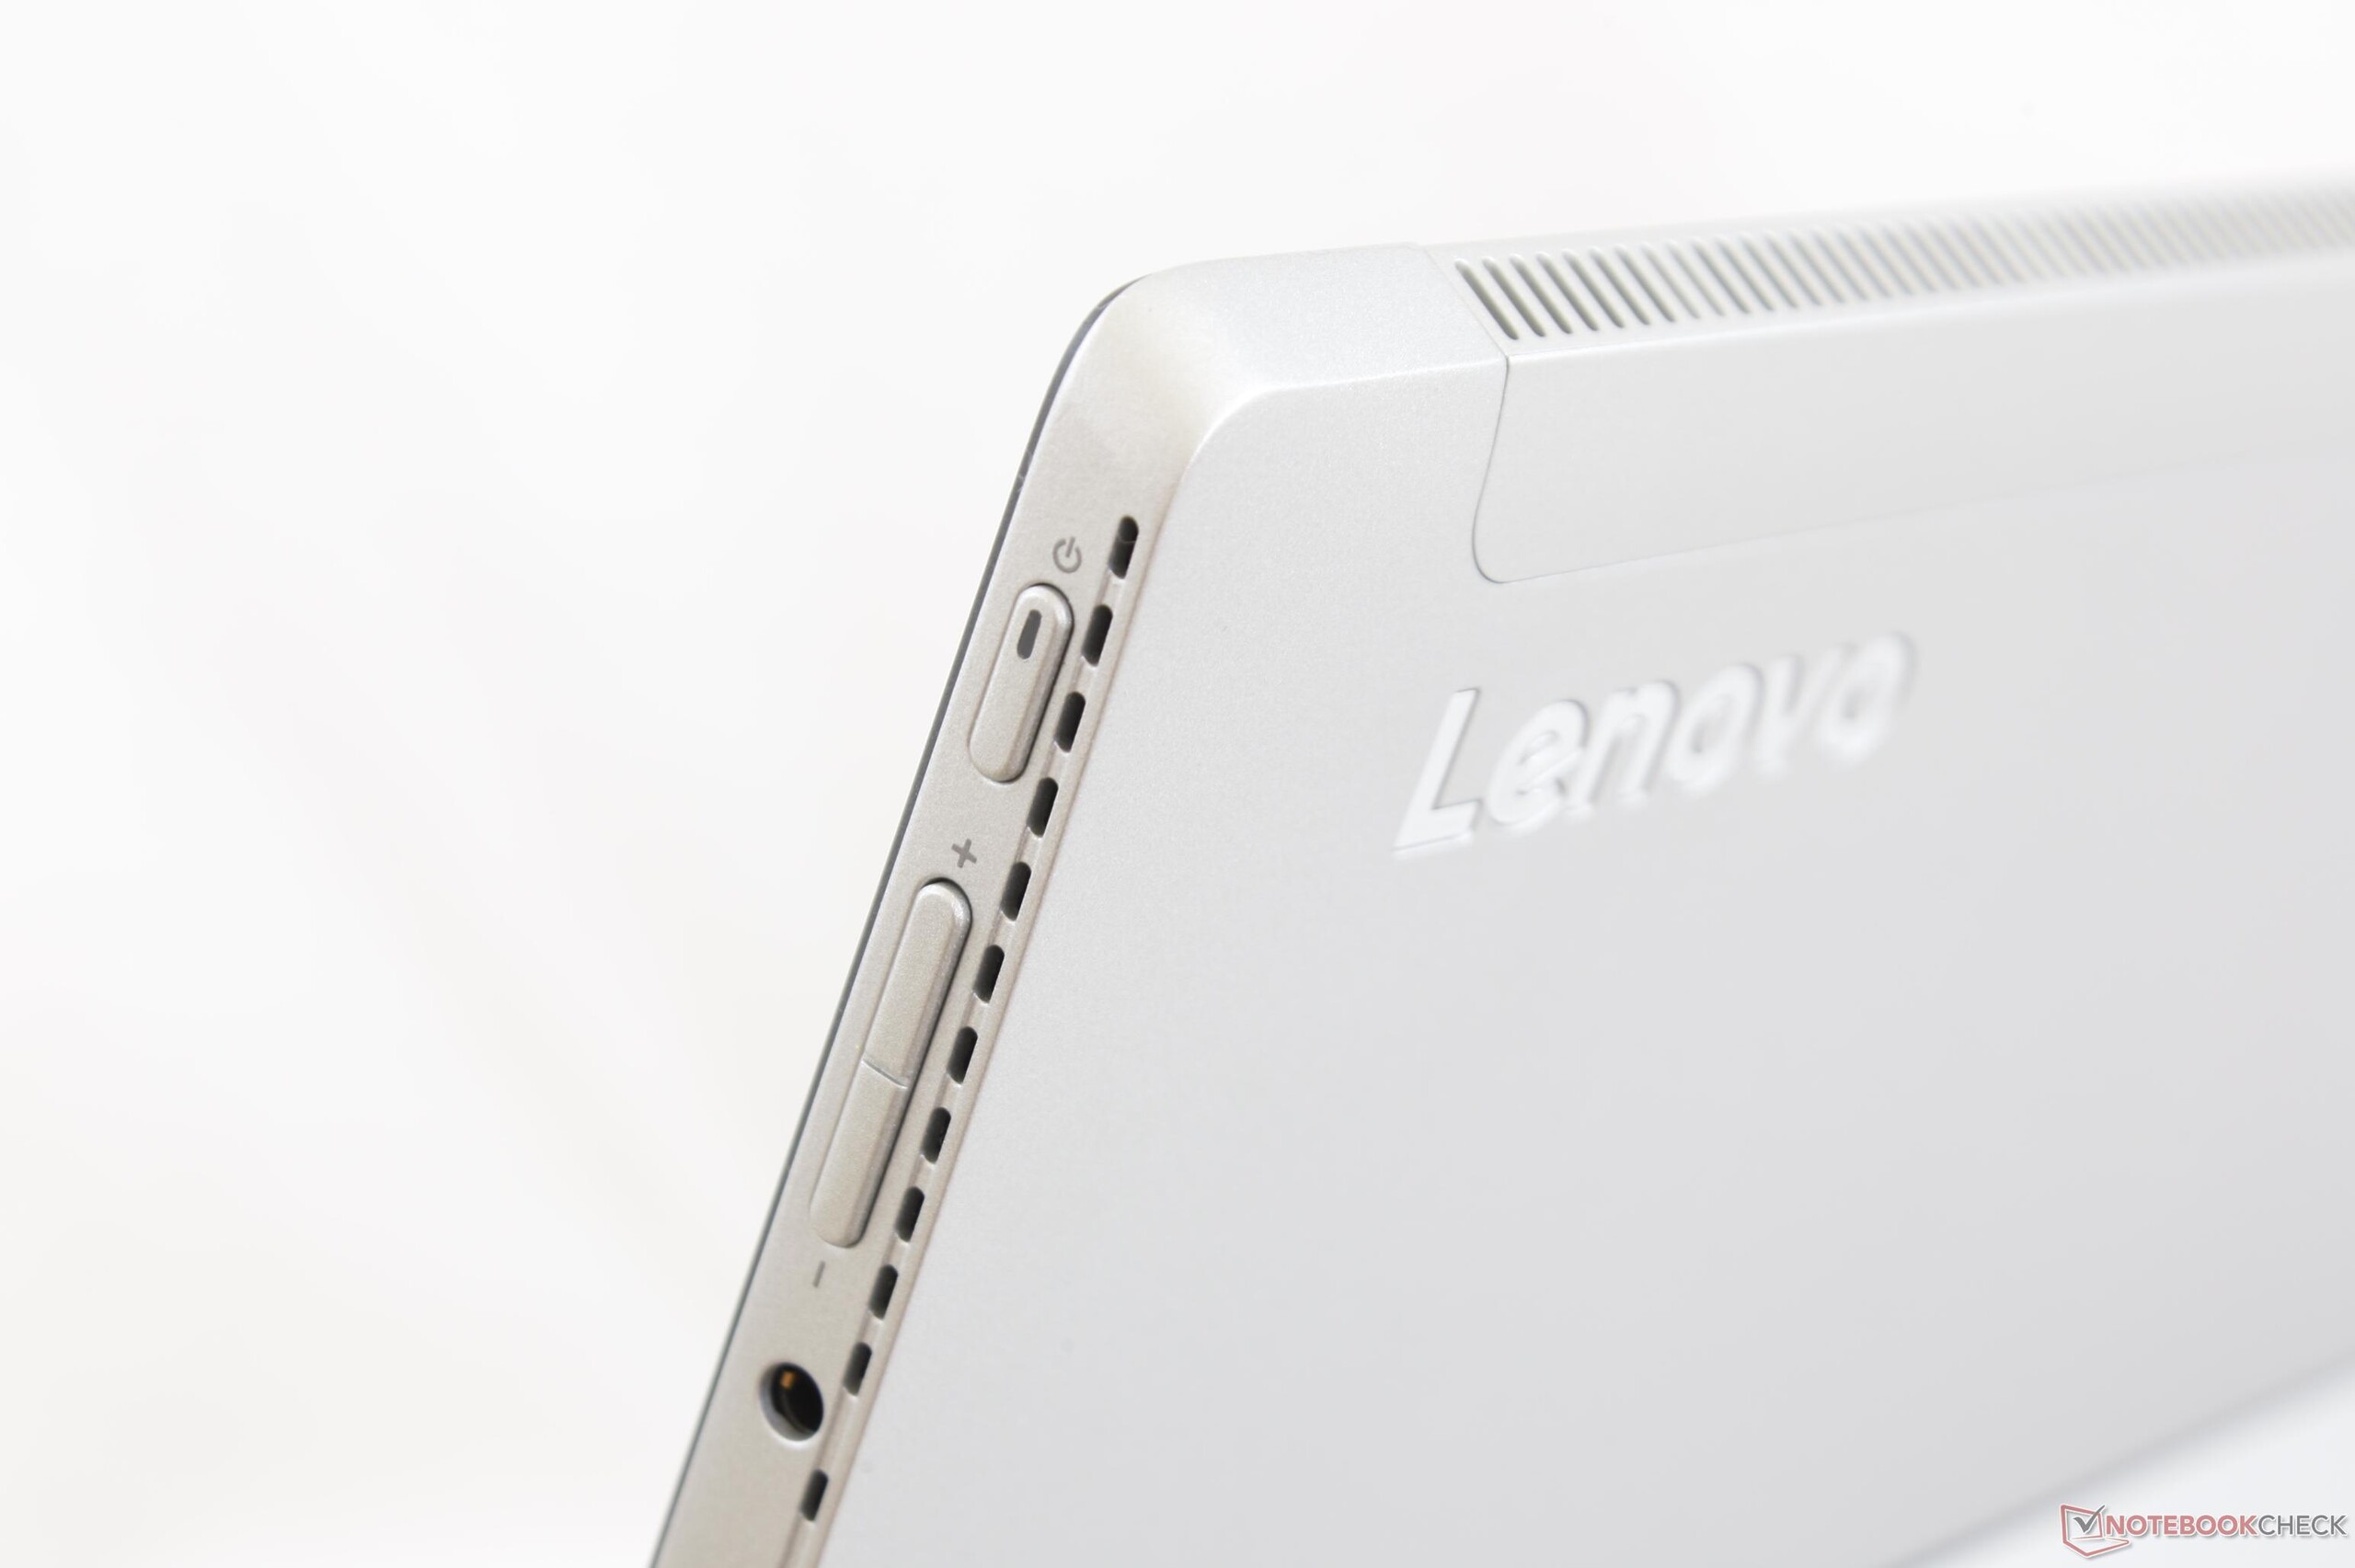
L’inconvénient principal de la machine avec le processeur le plus puissant est le niveau sonore de son ventilateur. Il est légèrement plus élevé que sur le Surface Pro, et se met en route beaucoup plus fréquemment, dans un usage au quotidien. Il n’est pas aussi bruyant que sur la série de convertibles HP Spectre, mais il se remarque, surtout pour une tablette.
La Miix 520 est une excellente machine, tant que l’on est prévenu de ses défauts. Les performances du processeur se font au prix de nuisances sonores plus élevées. Nous espérons que les versions futures amélioreront l’écran et incorporeront le Thunderbolt 3, afin de rendre la série Miix encore plus compétitive face à Microsoft.
L’intégralité de cette critique est disponible en anglais en suivant ce lien.
Lenovo Miix 520-12IKB 81CG
- 12/10/2017 v6 (old)
Allen Ngo
Price comparison
