Verdict
Bien que le XMG Core 16 VE soit commercialisé en tant qu'édition économique, cet ordinateur portable de jeu de 16 pouces ne fait pas partie des modèles RTX 5060 les moins chers. Avec un prix de départ de 1 479 € (environ 1 711 $) et un prix configuré de plus de 1 900 € (environ 2 198 $ avec 64 Go de RAM, 2 TB SSD, Windows 11), il se situe plutôt dans la gamme de prix de nombreux appareils RTX 5070 Ti. D'après nos mesures et nos tests, ce prix est au moins partiellement justifié.
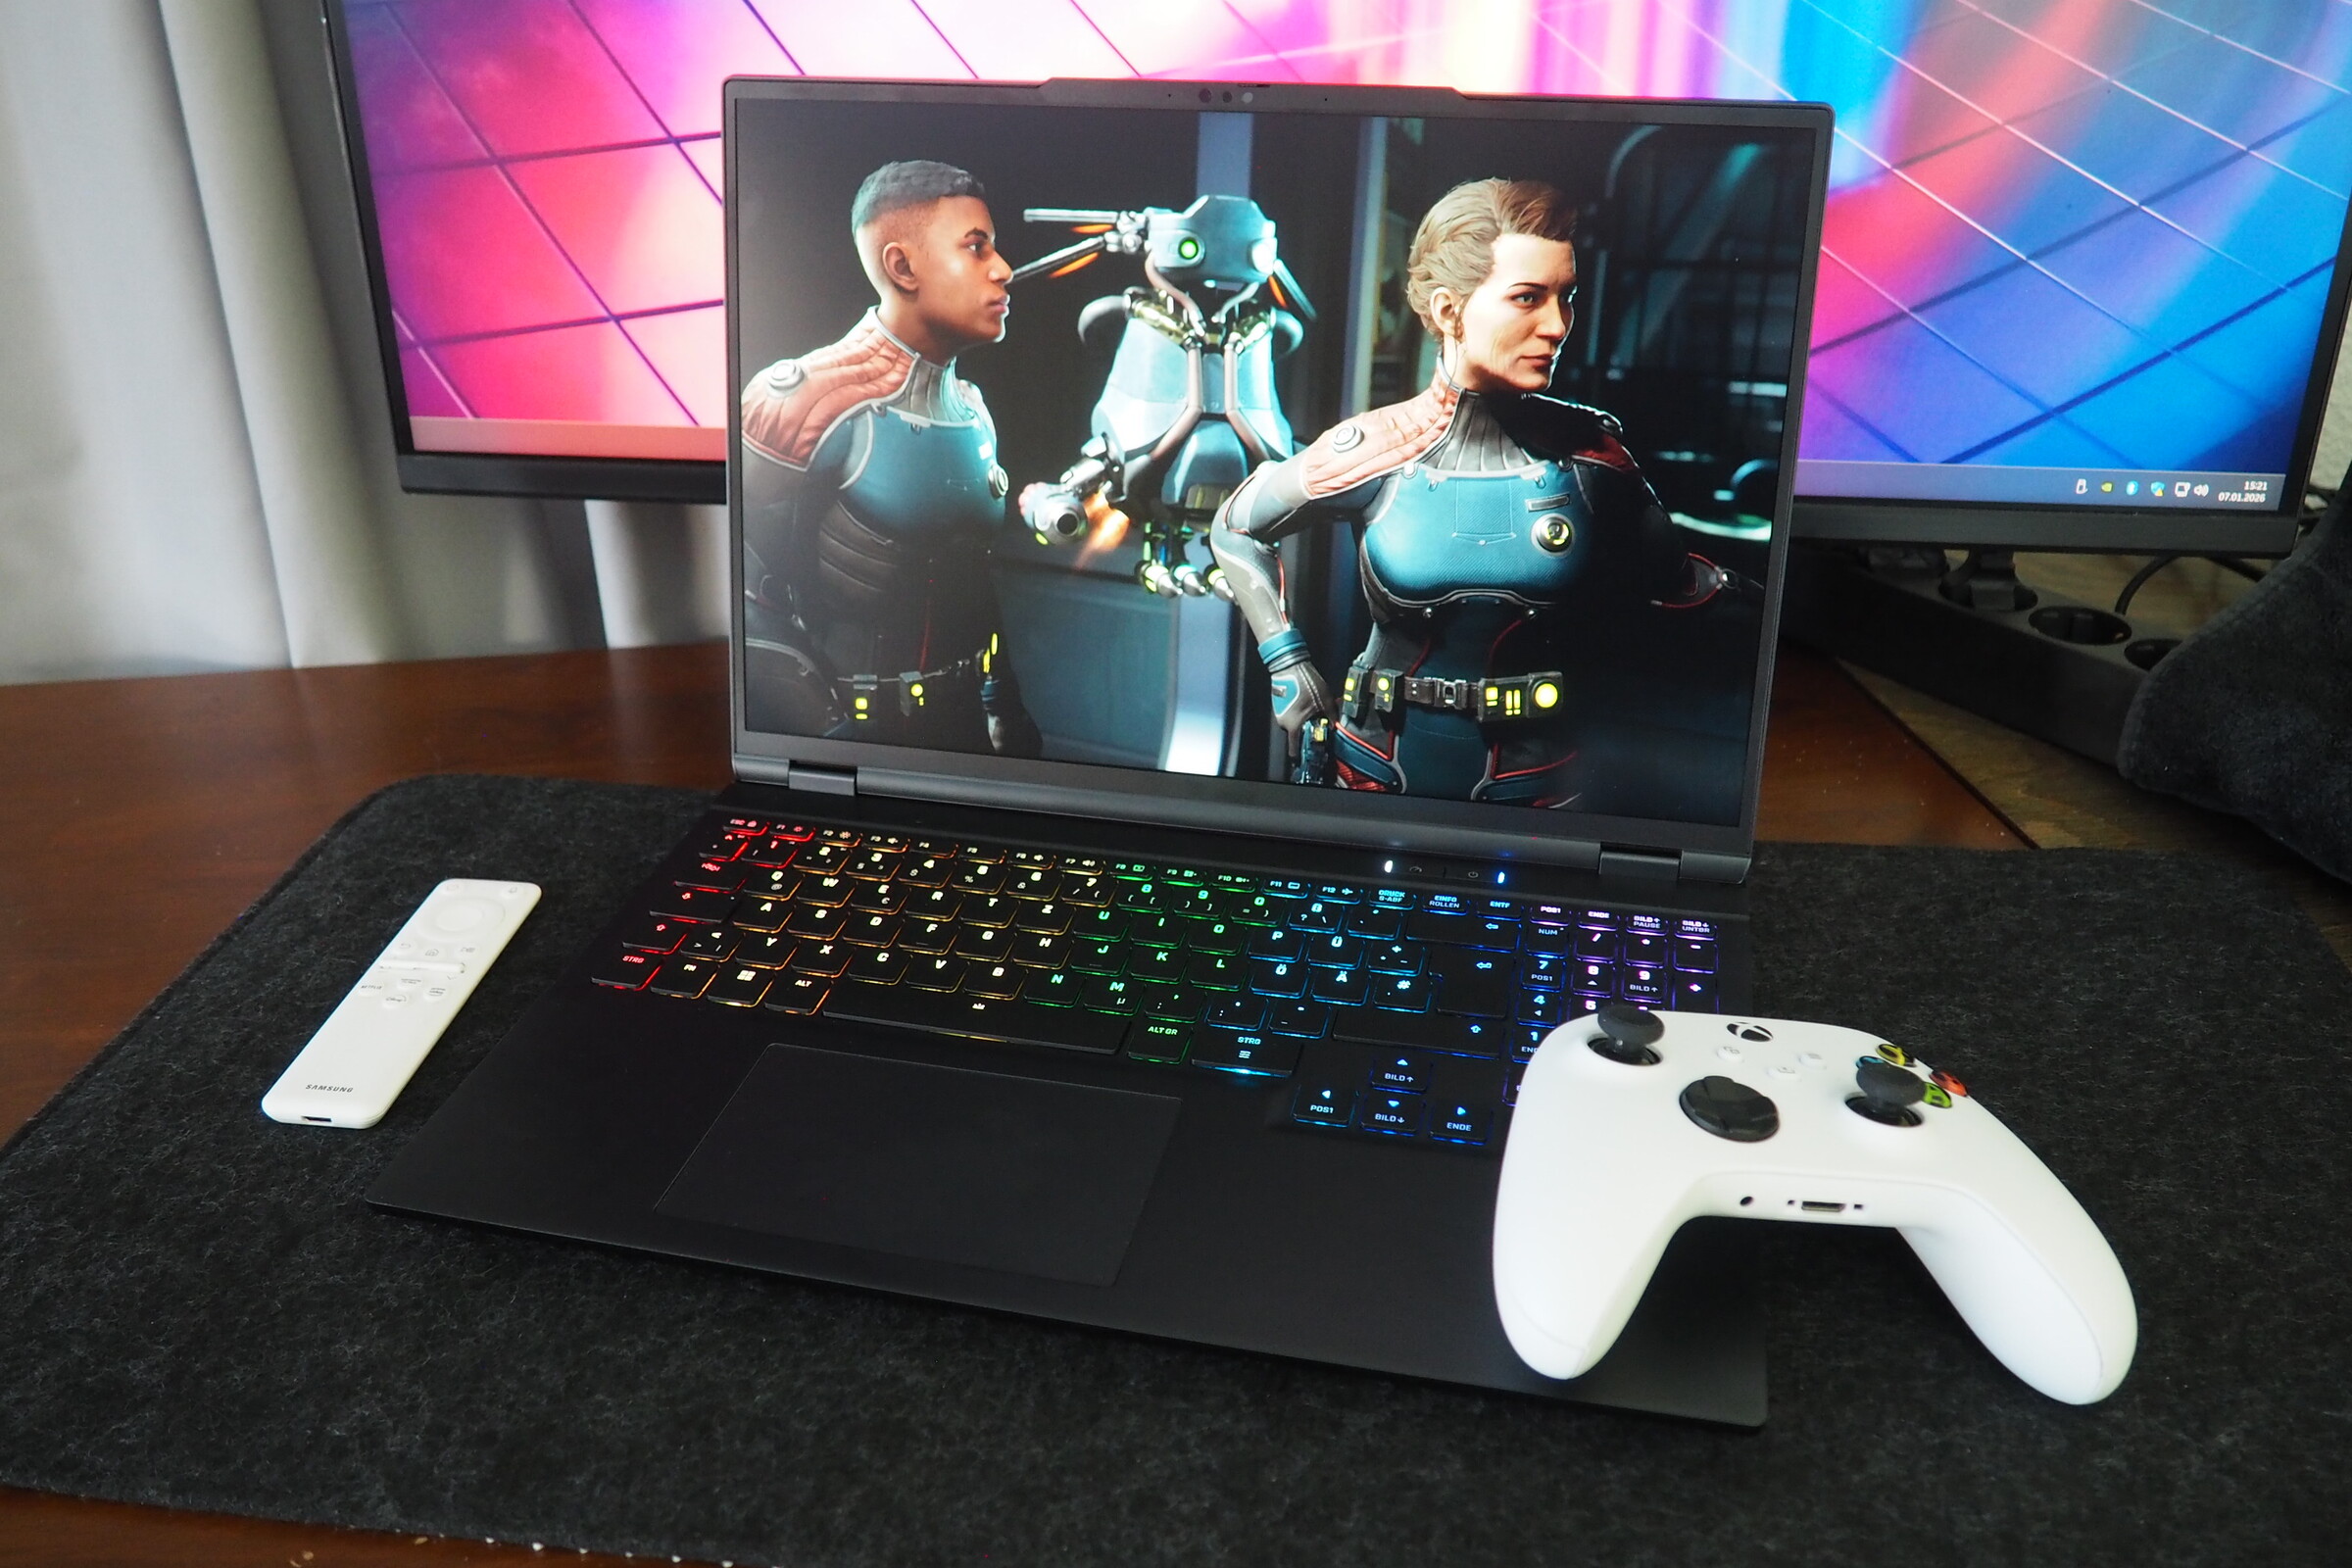
L'un de ses principaux atouts est son châssis métallique élégant et robuste, qui combine de bons dispositifs d'entrée avec une large sélection de ports et un écran IPS assez lumineux. Les options de maintenance et de mise à jour sont également solides. Les performances du CPU et du GPU sont également convaincantes. Si le Ryzen 7 255 n'est pas très puissant comparé à d'autres processeurs de jeu, la puce Zen 4 offre des performances constantes. La qualité du son, cependant, pourrait être améliorée. Les haut-parleurs intégrés offrent un son plutôt modeste.
Dans l'ensemble, le score n'atteint pas celui de son principal rival, le Lenovo Legion 7 16, mais le XMG Core 16 VE surpasse de nombreux autres ordinateurs portables RTX 5060, tels que le Tulpar T6 V3.5 et le HP Omen 16. Nos tableaux comparatifs incluent également un ordinateur portable RTX 5070 ou RTX 5070 Ti plus puissant.
Points positifs
Points négatifs
Prix et disponibilité
Comme indiqué précédemment, le XMG Core 16 VE (M25) est disponible directement auprès du fabricant à partir de 1 479 € (environ 1 711 $).
Note du traducteur : les ordinateurs portables XMG ne sont pas officiellement disponibles en Amérique du Nord.
Spécifications
Cas
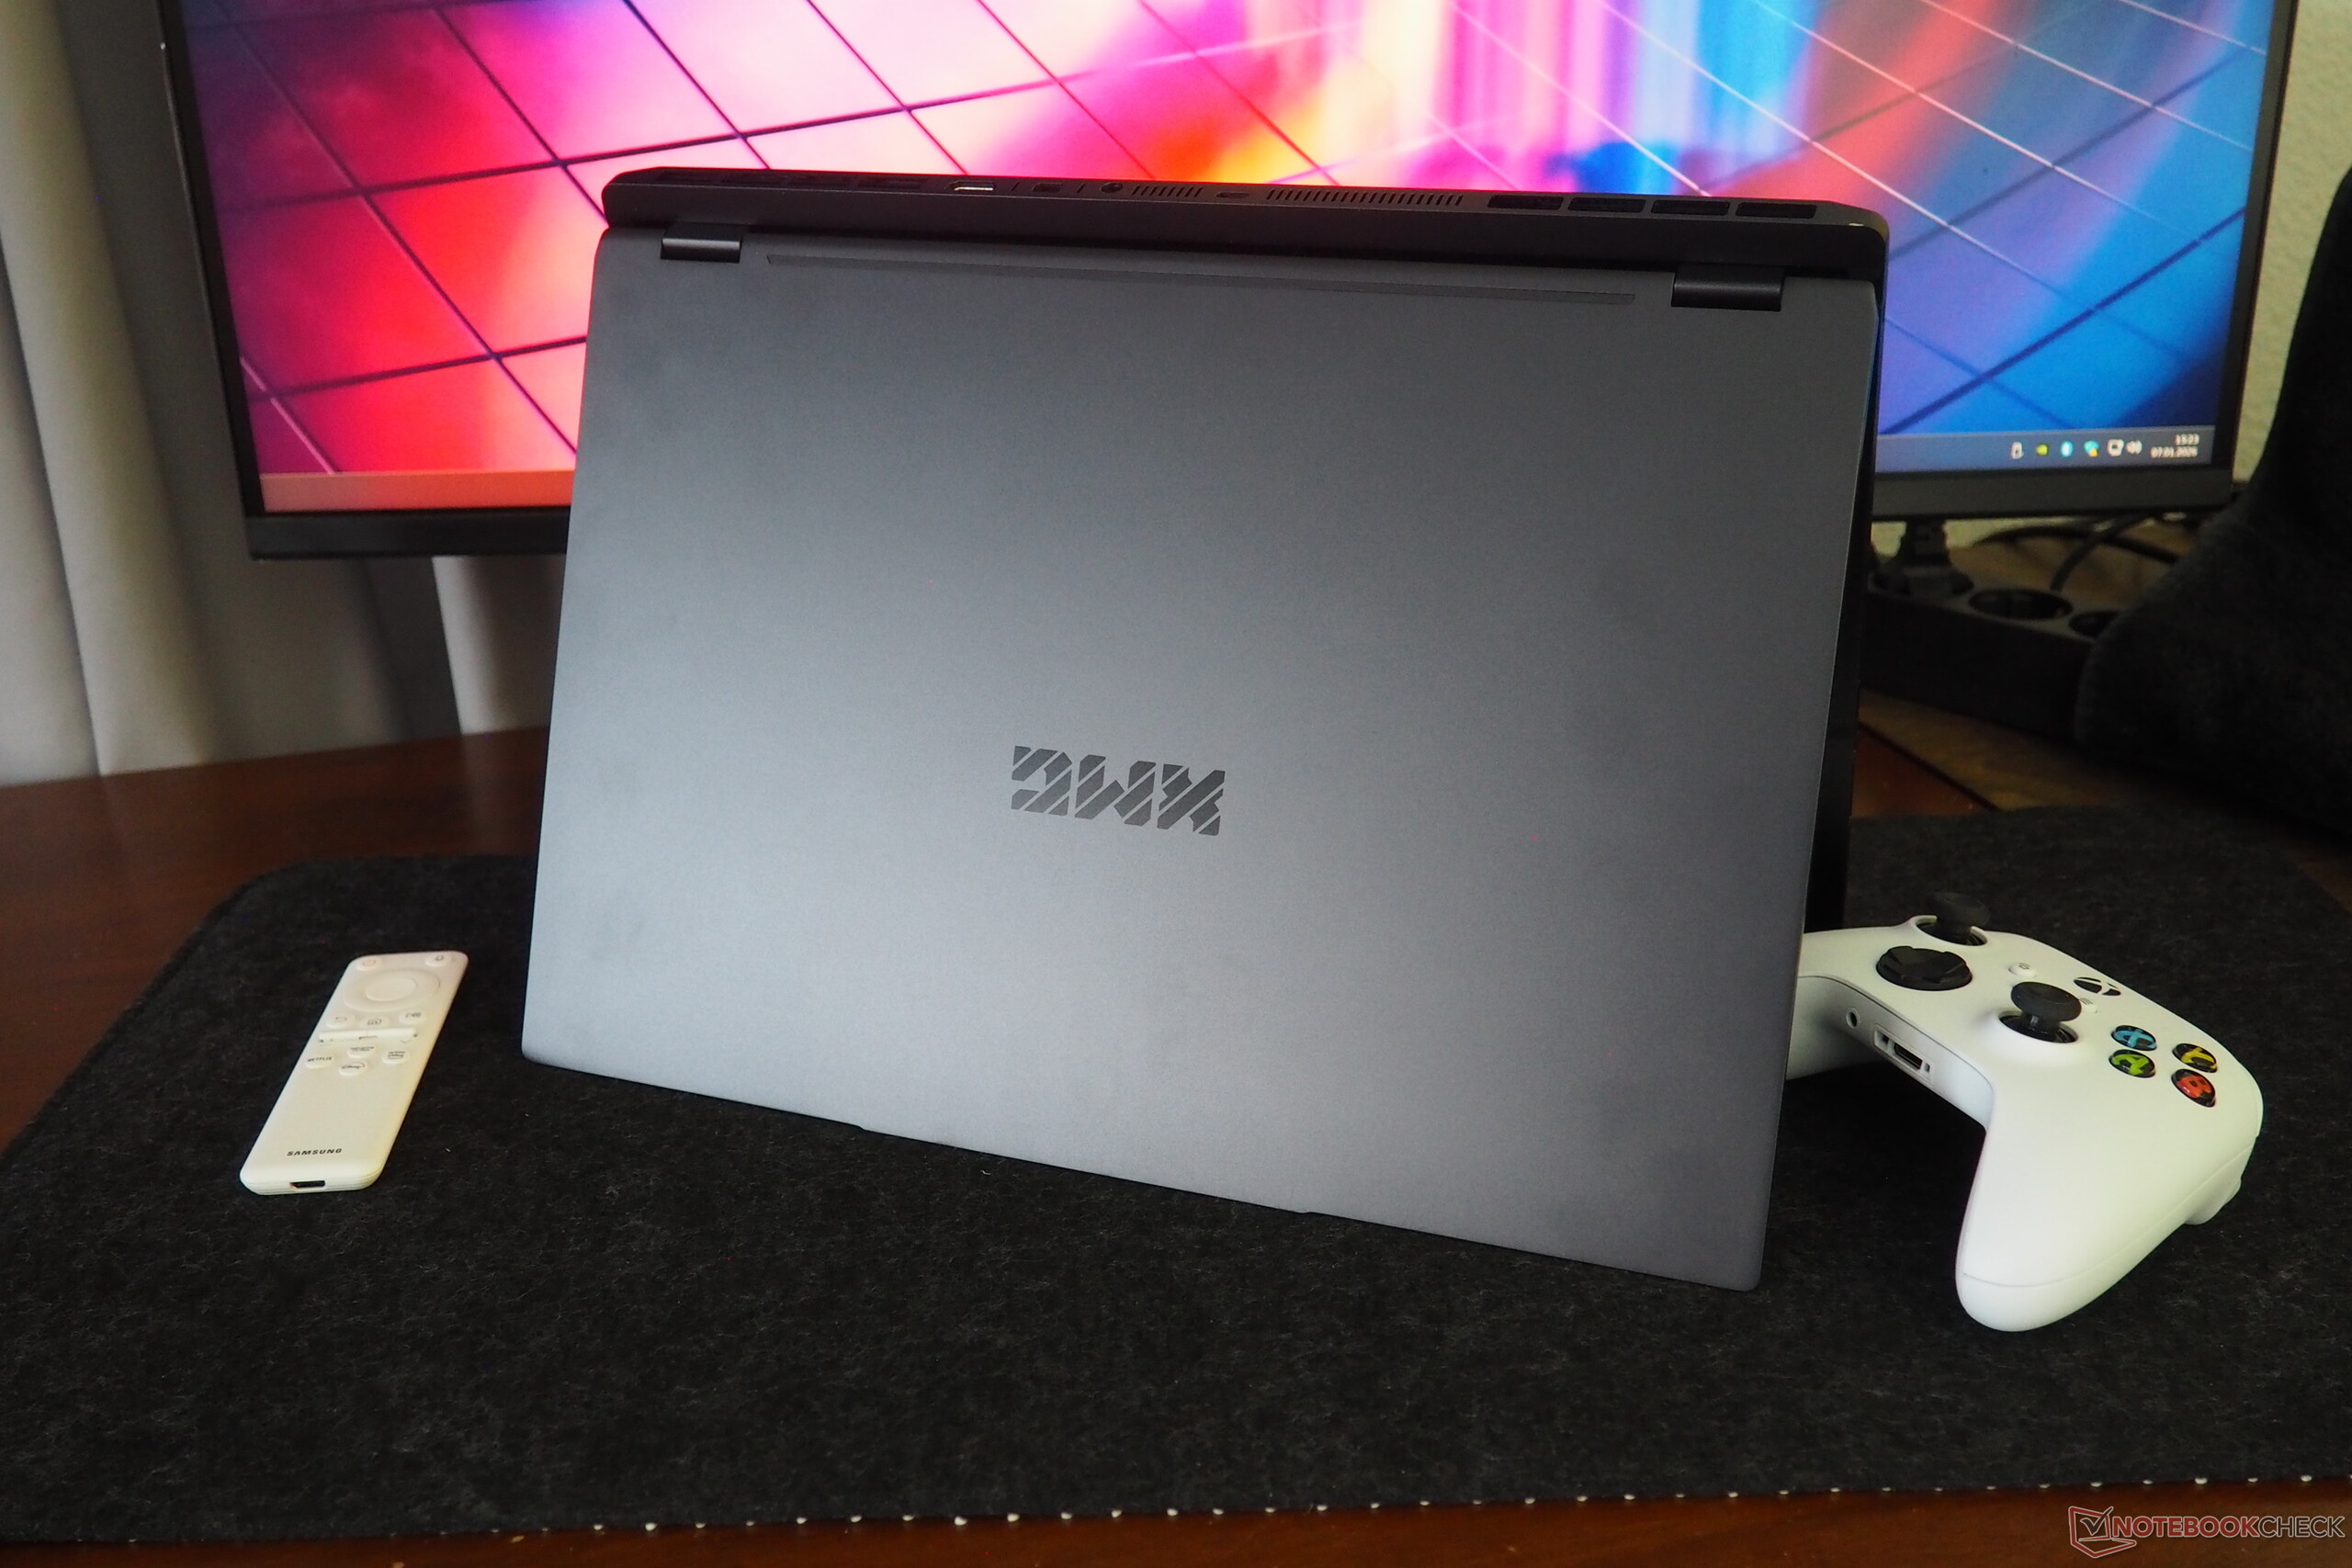
Le châssis donne une impression de qualité supérieure grâce à l'utilisation de composants métalliques. Si les surfaces sombres sont sujettes aux traces de doigts, la rigidité est impressionnante dans la plupart des zones. L'angle d'ouverture généreux de 180° mérite également des éloges. Avec ses 2,1 kg, le XMG Core 16 VE se situe dans la partie inférieure du groupe de comparaison et n'est donc pas trop lourd. Avec une épaisseur de 2,3 cm, il reste également dans des limites raisonnables.
Equipement
Schenker n'a pas grand-chose à redire en matière de connectivité. En plus de trois ports USB-A et de deux ports USB-C, il y a également deux sorties d'affichage (HDMI et Mini DisplayPort). L'ordinateur portable comprend également une prise audio, un port LAN, un lecteur de cartes très rapide et un emplacement pour verrou Kensington.
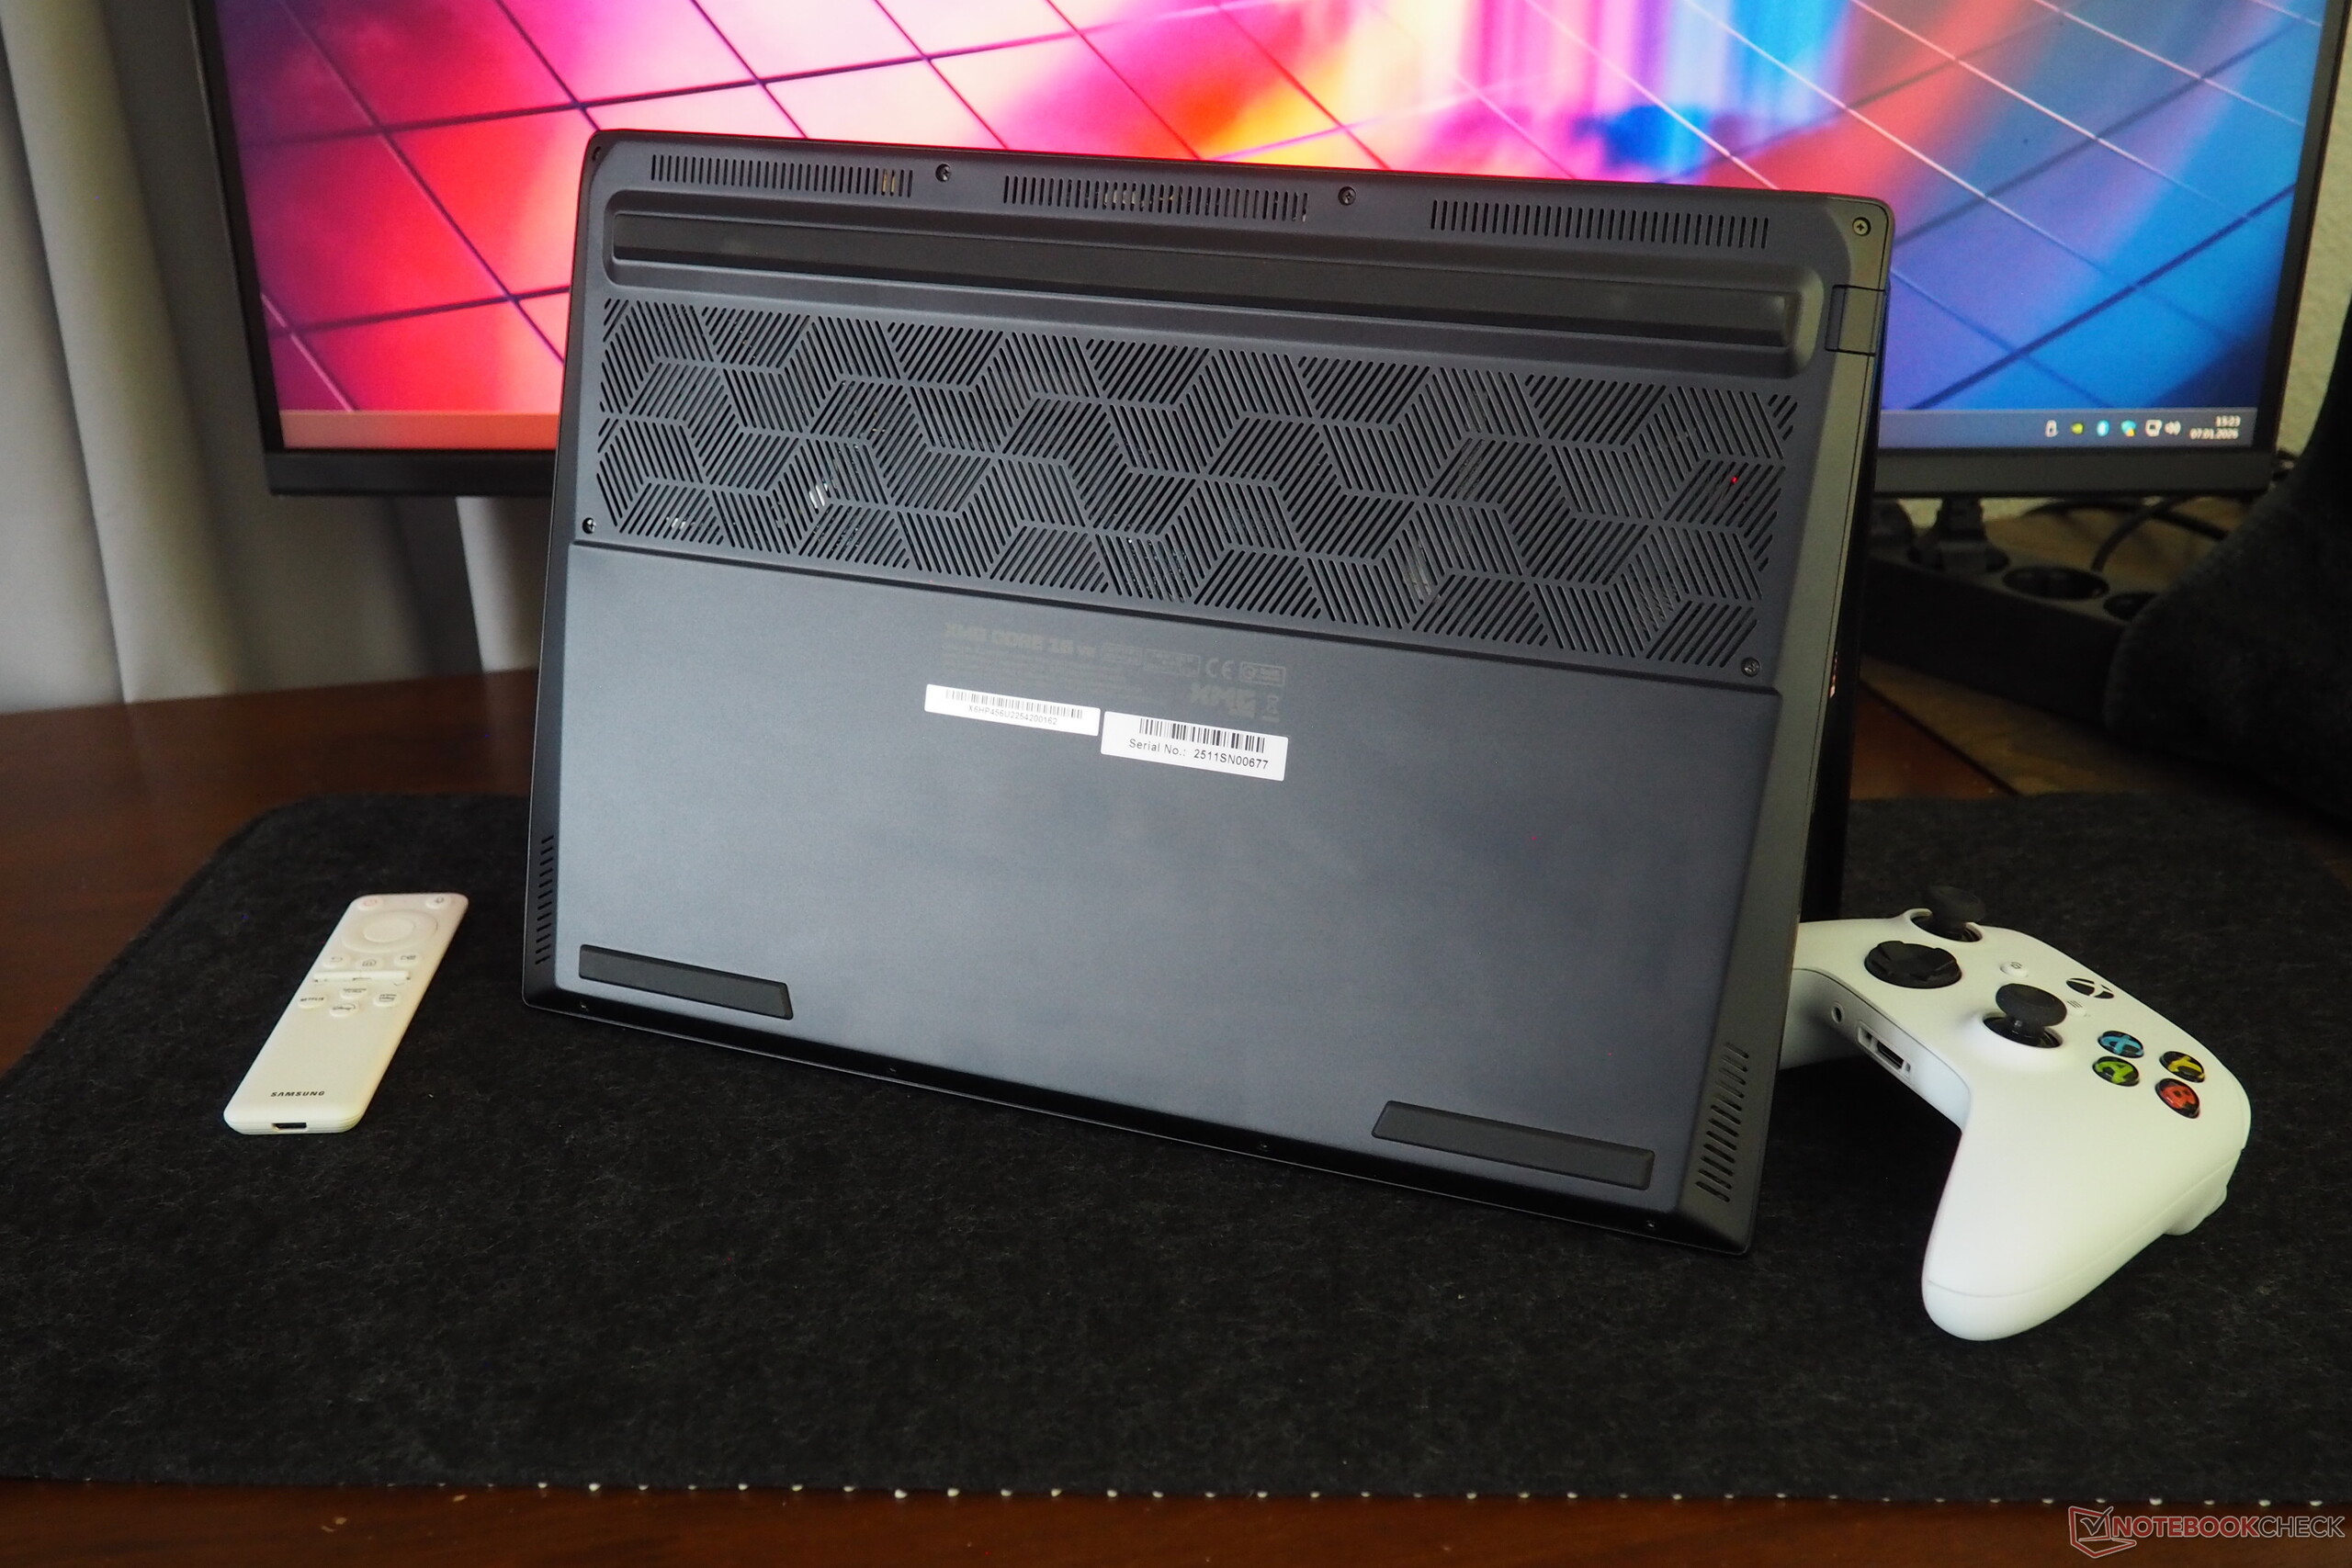
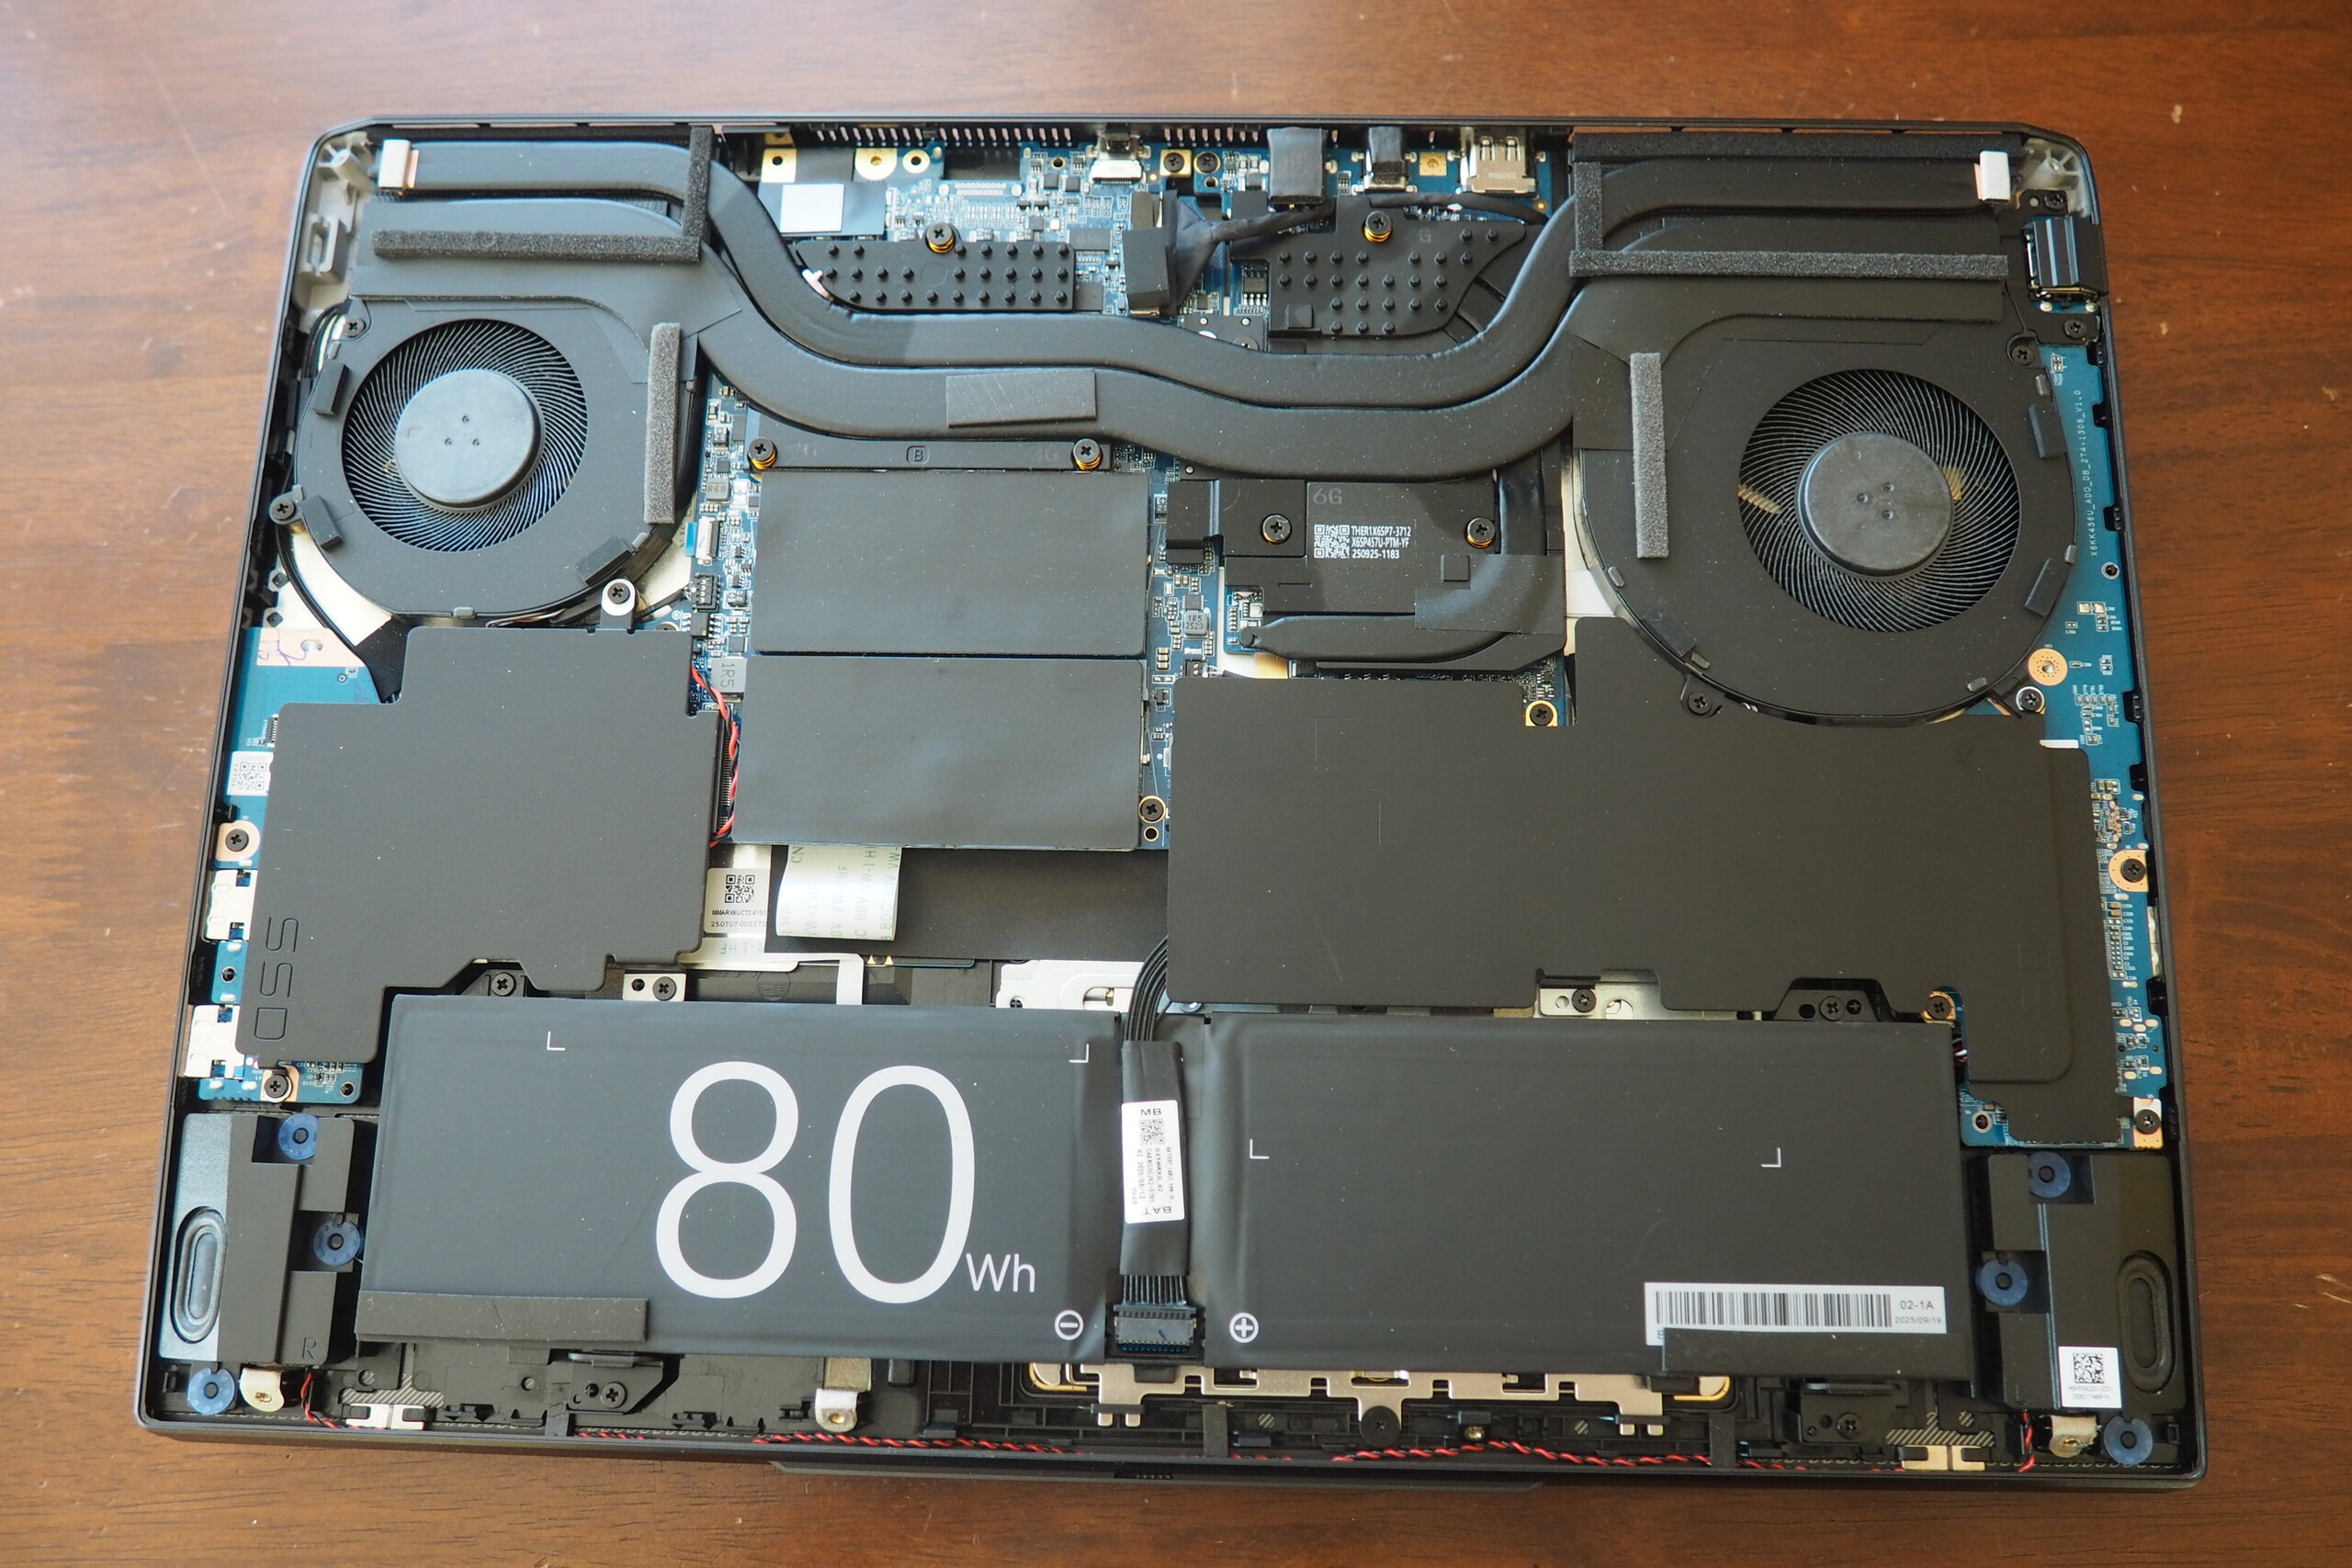
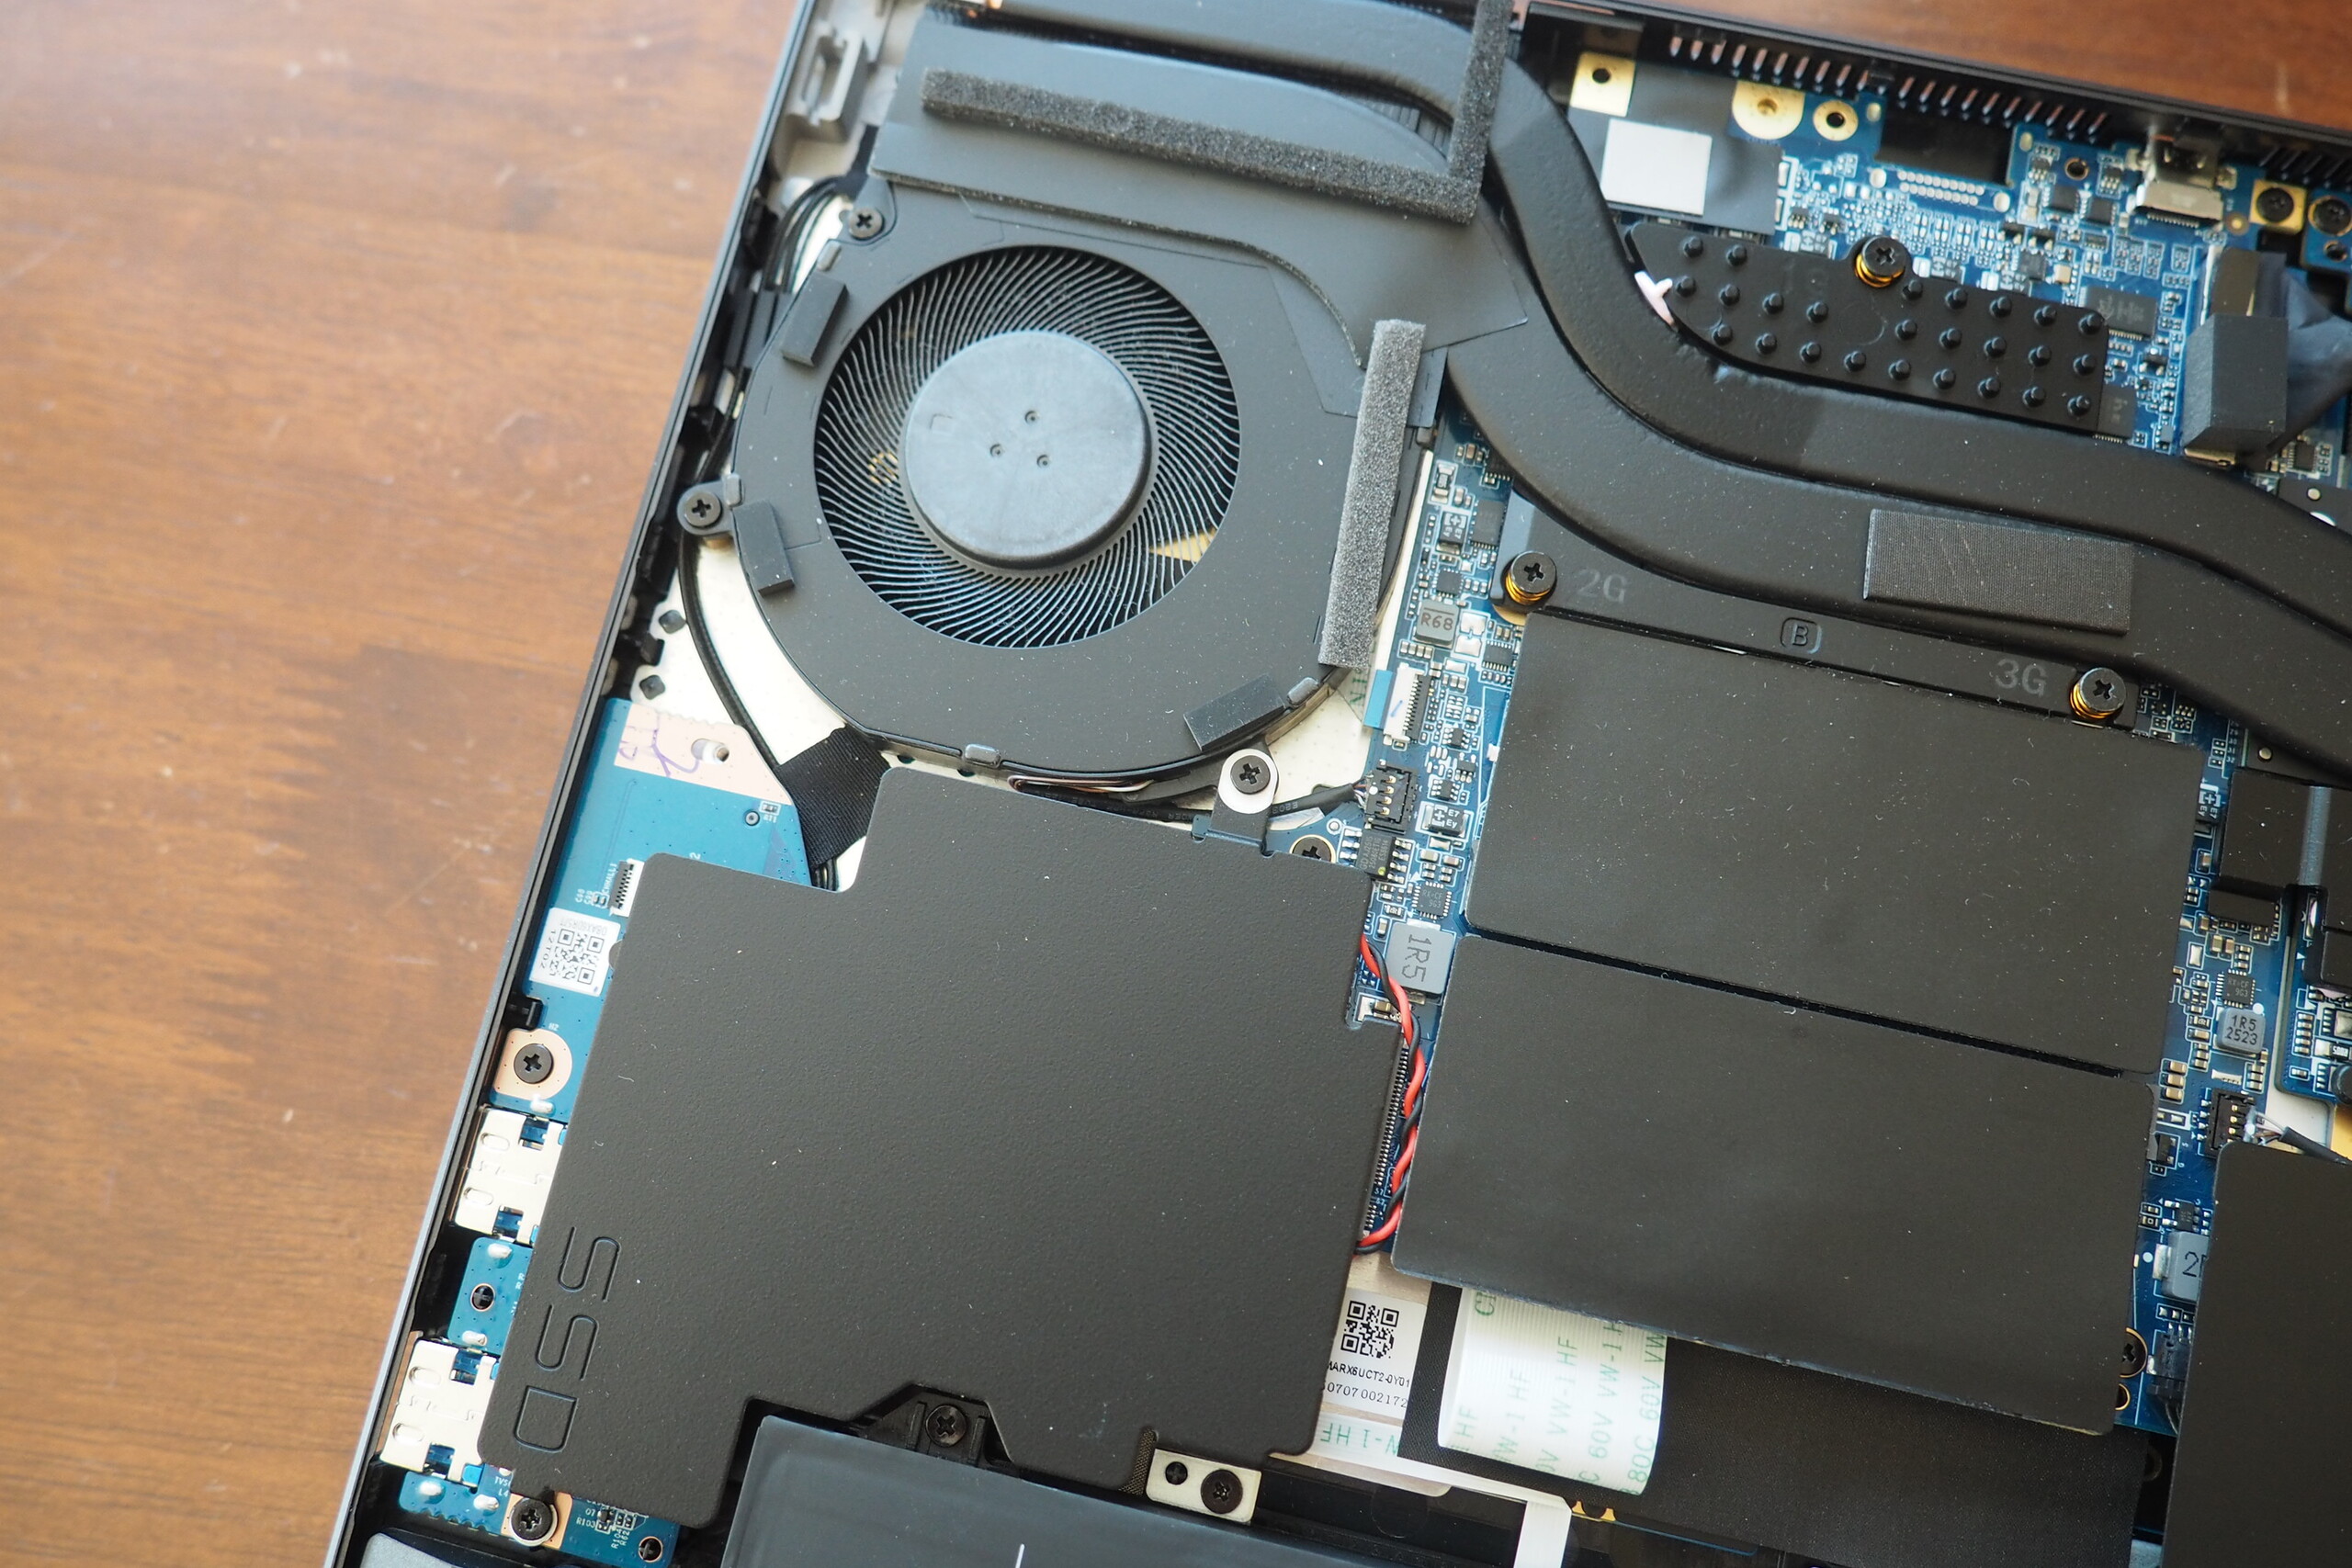
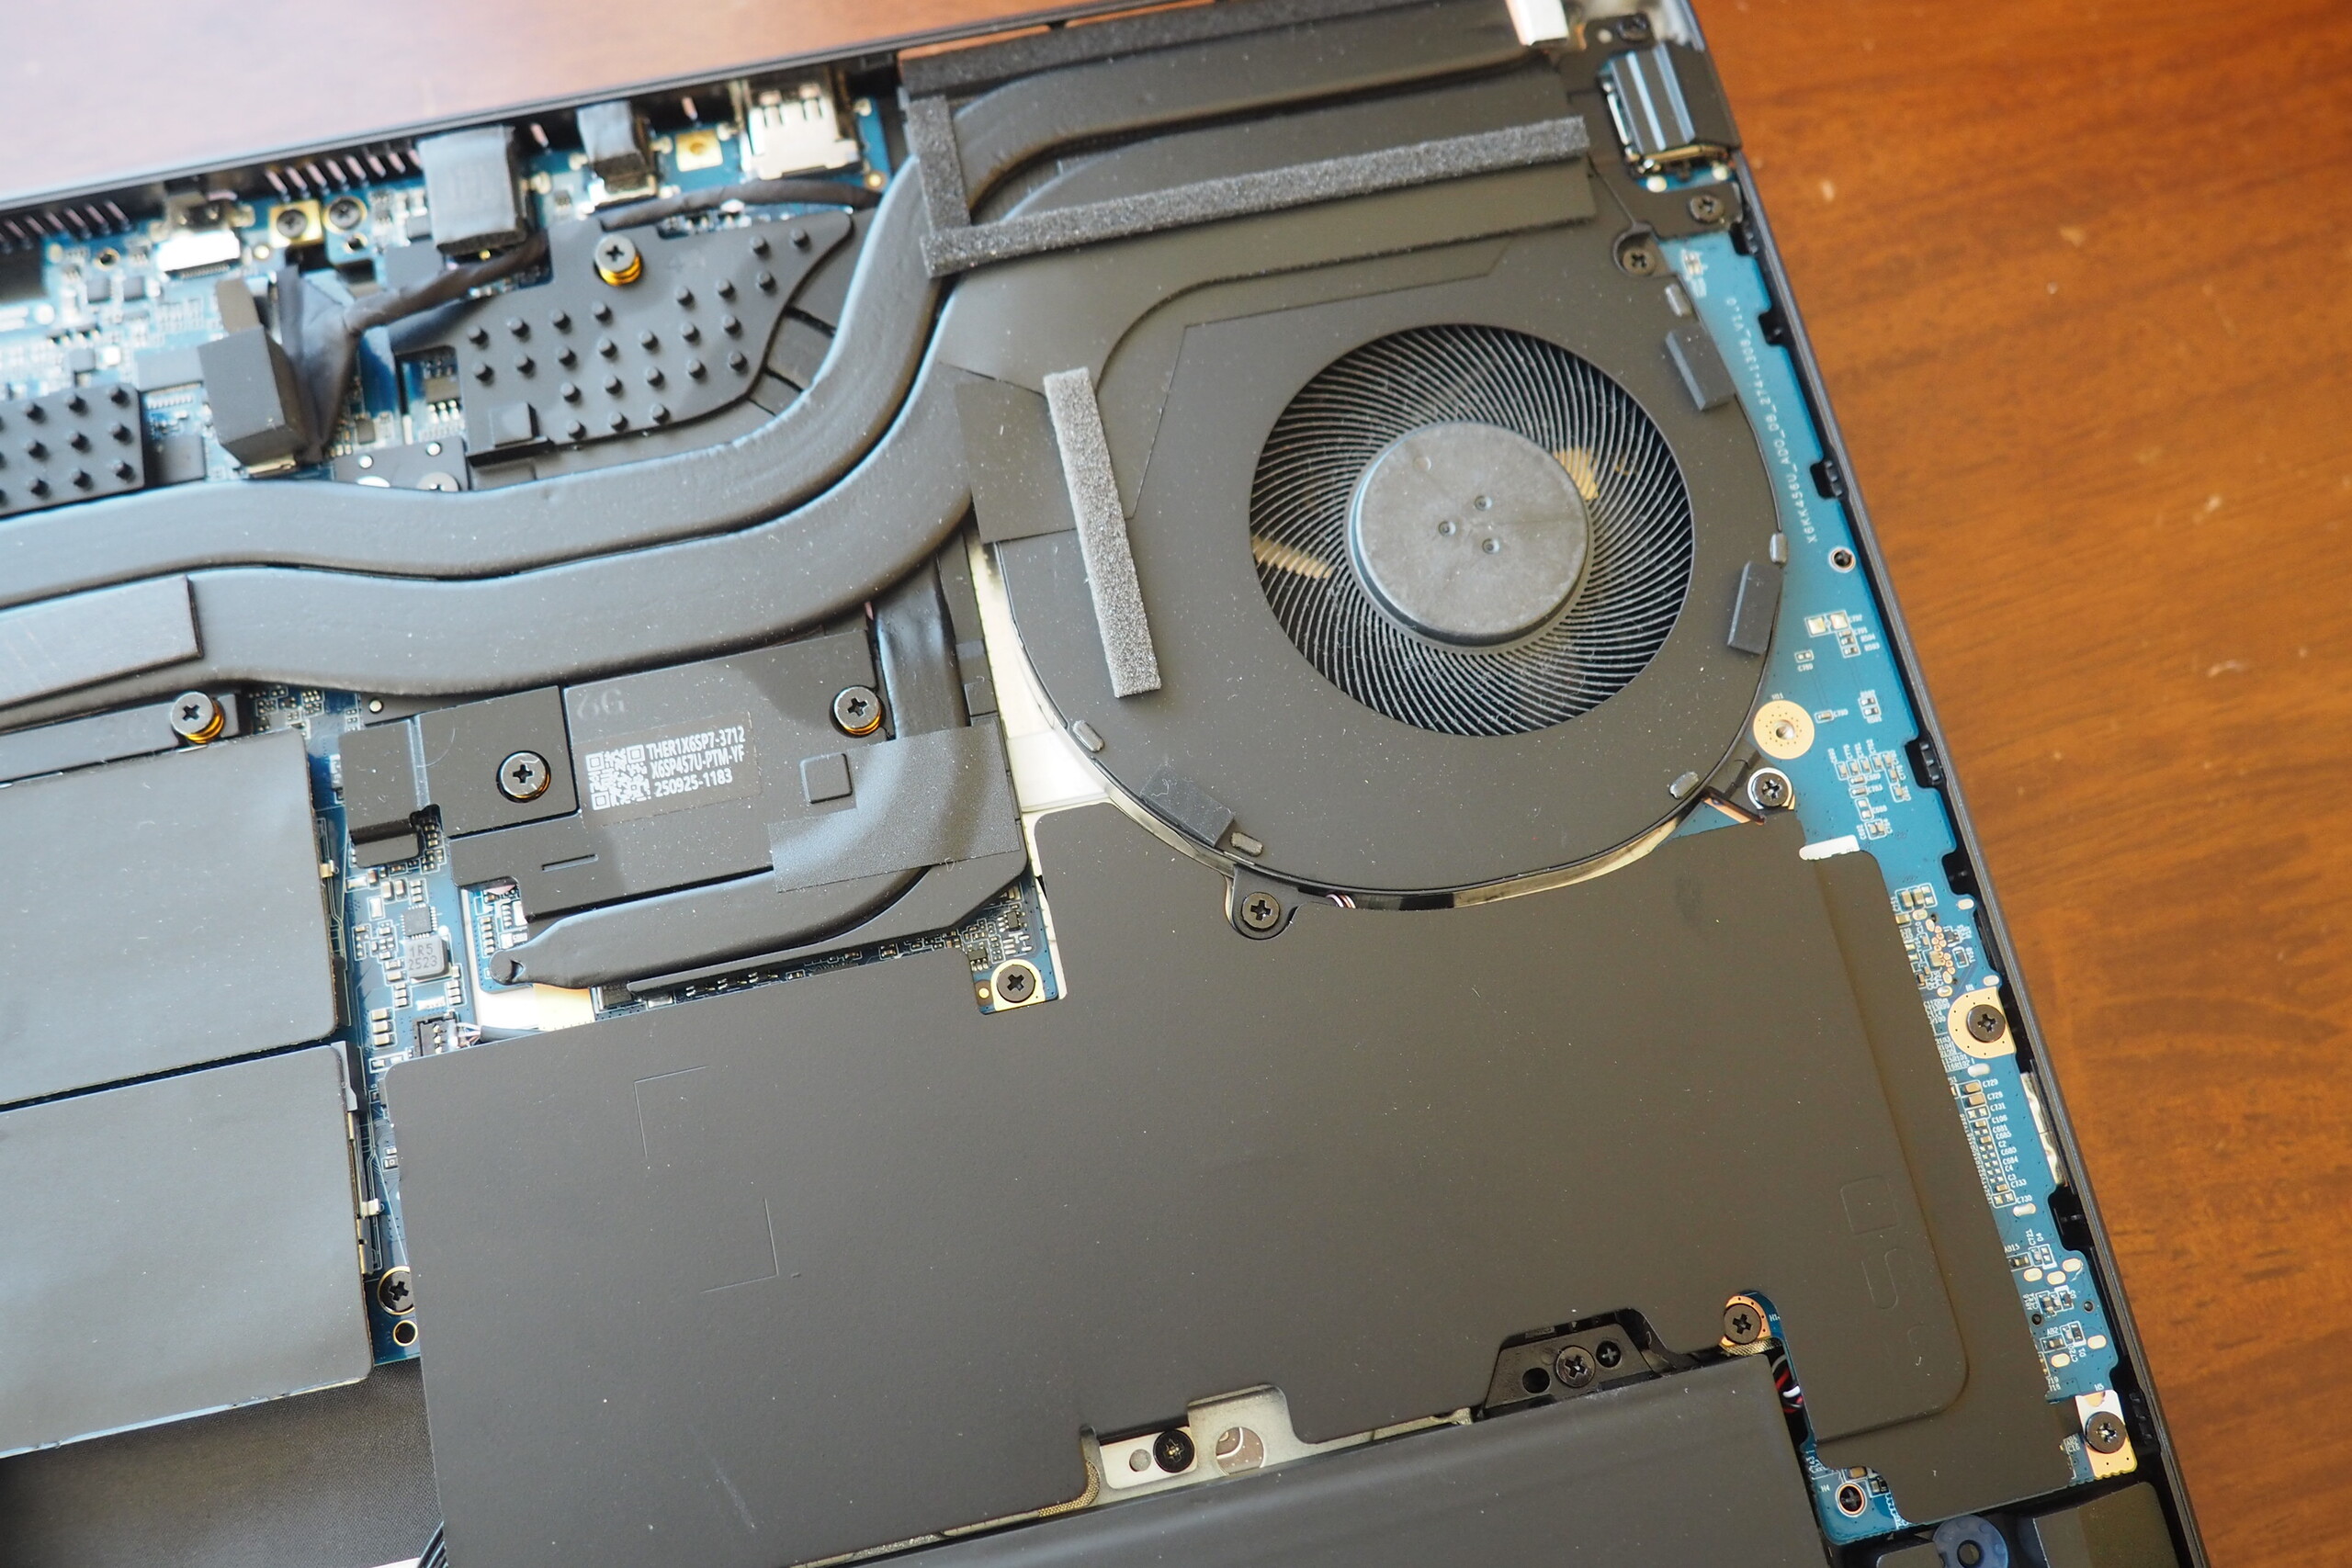
Le module Wi-Fi MediaTek offre des vitesses de chargement décentes et de très bonnes vitesses de téléchargement. La webcam FHD, qui offre des images assez nettes pour un ordinateur portable, est dotée d'un obturateur physique. L'accès aux composants internes est facile après avoir retiré 10 vis à tête cruciforme ; vous trouverez des photos des composants internes ci-dessous.


Lecteur de carte SD
| SD Card Reader - average JPG Copy Test (av. of 3 runs) | |
| Schenker XMG Core 16 VE M25 (AV PRO microSD 128 GB V60) | |
| Schenker XMG Core 16 M25 (Angelbird AV Pro V60) | |
| Lenovo Legion 7 16IAX10 (Toshiba Exceria Pro SDXC 64 GB UHS-II) | |
| Moyenne de la classe Gaming (20.9 - 210, n=60, 2 dernières années) | |
| Acer Predator Helios Neo 16S AI PHN16S-71-94L9 (AV PRO microSD 128 GB V60) | |
Communication
Webcam


Maintenance
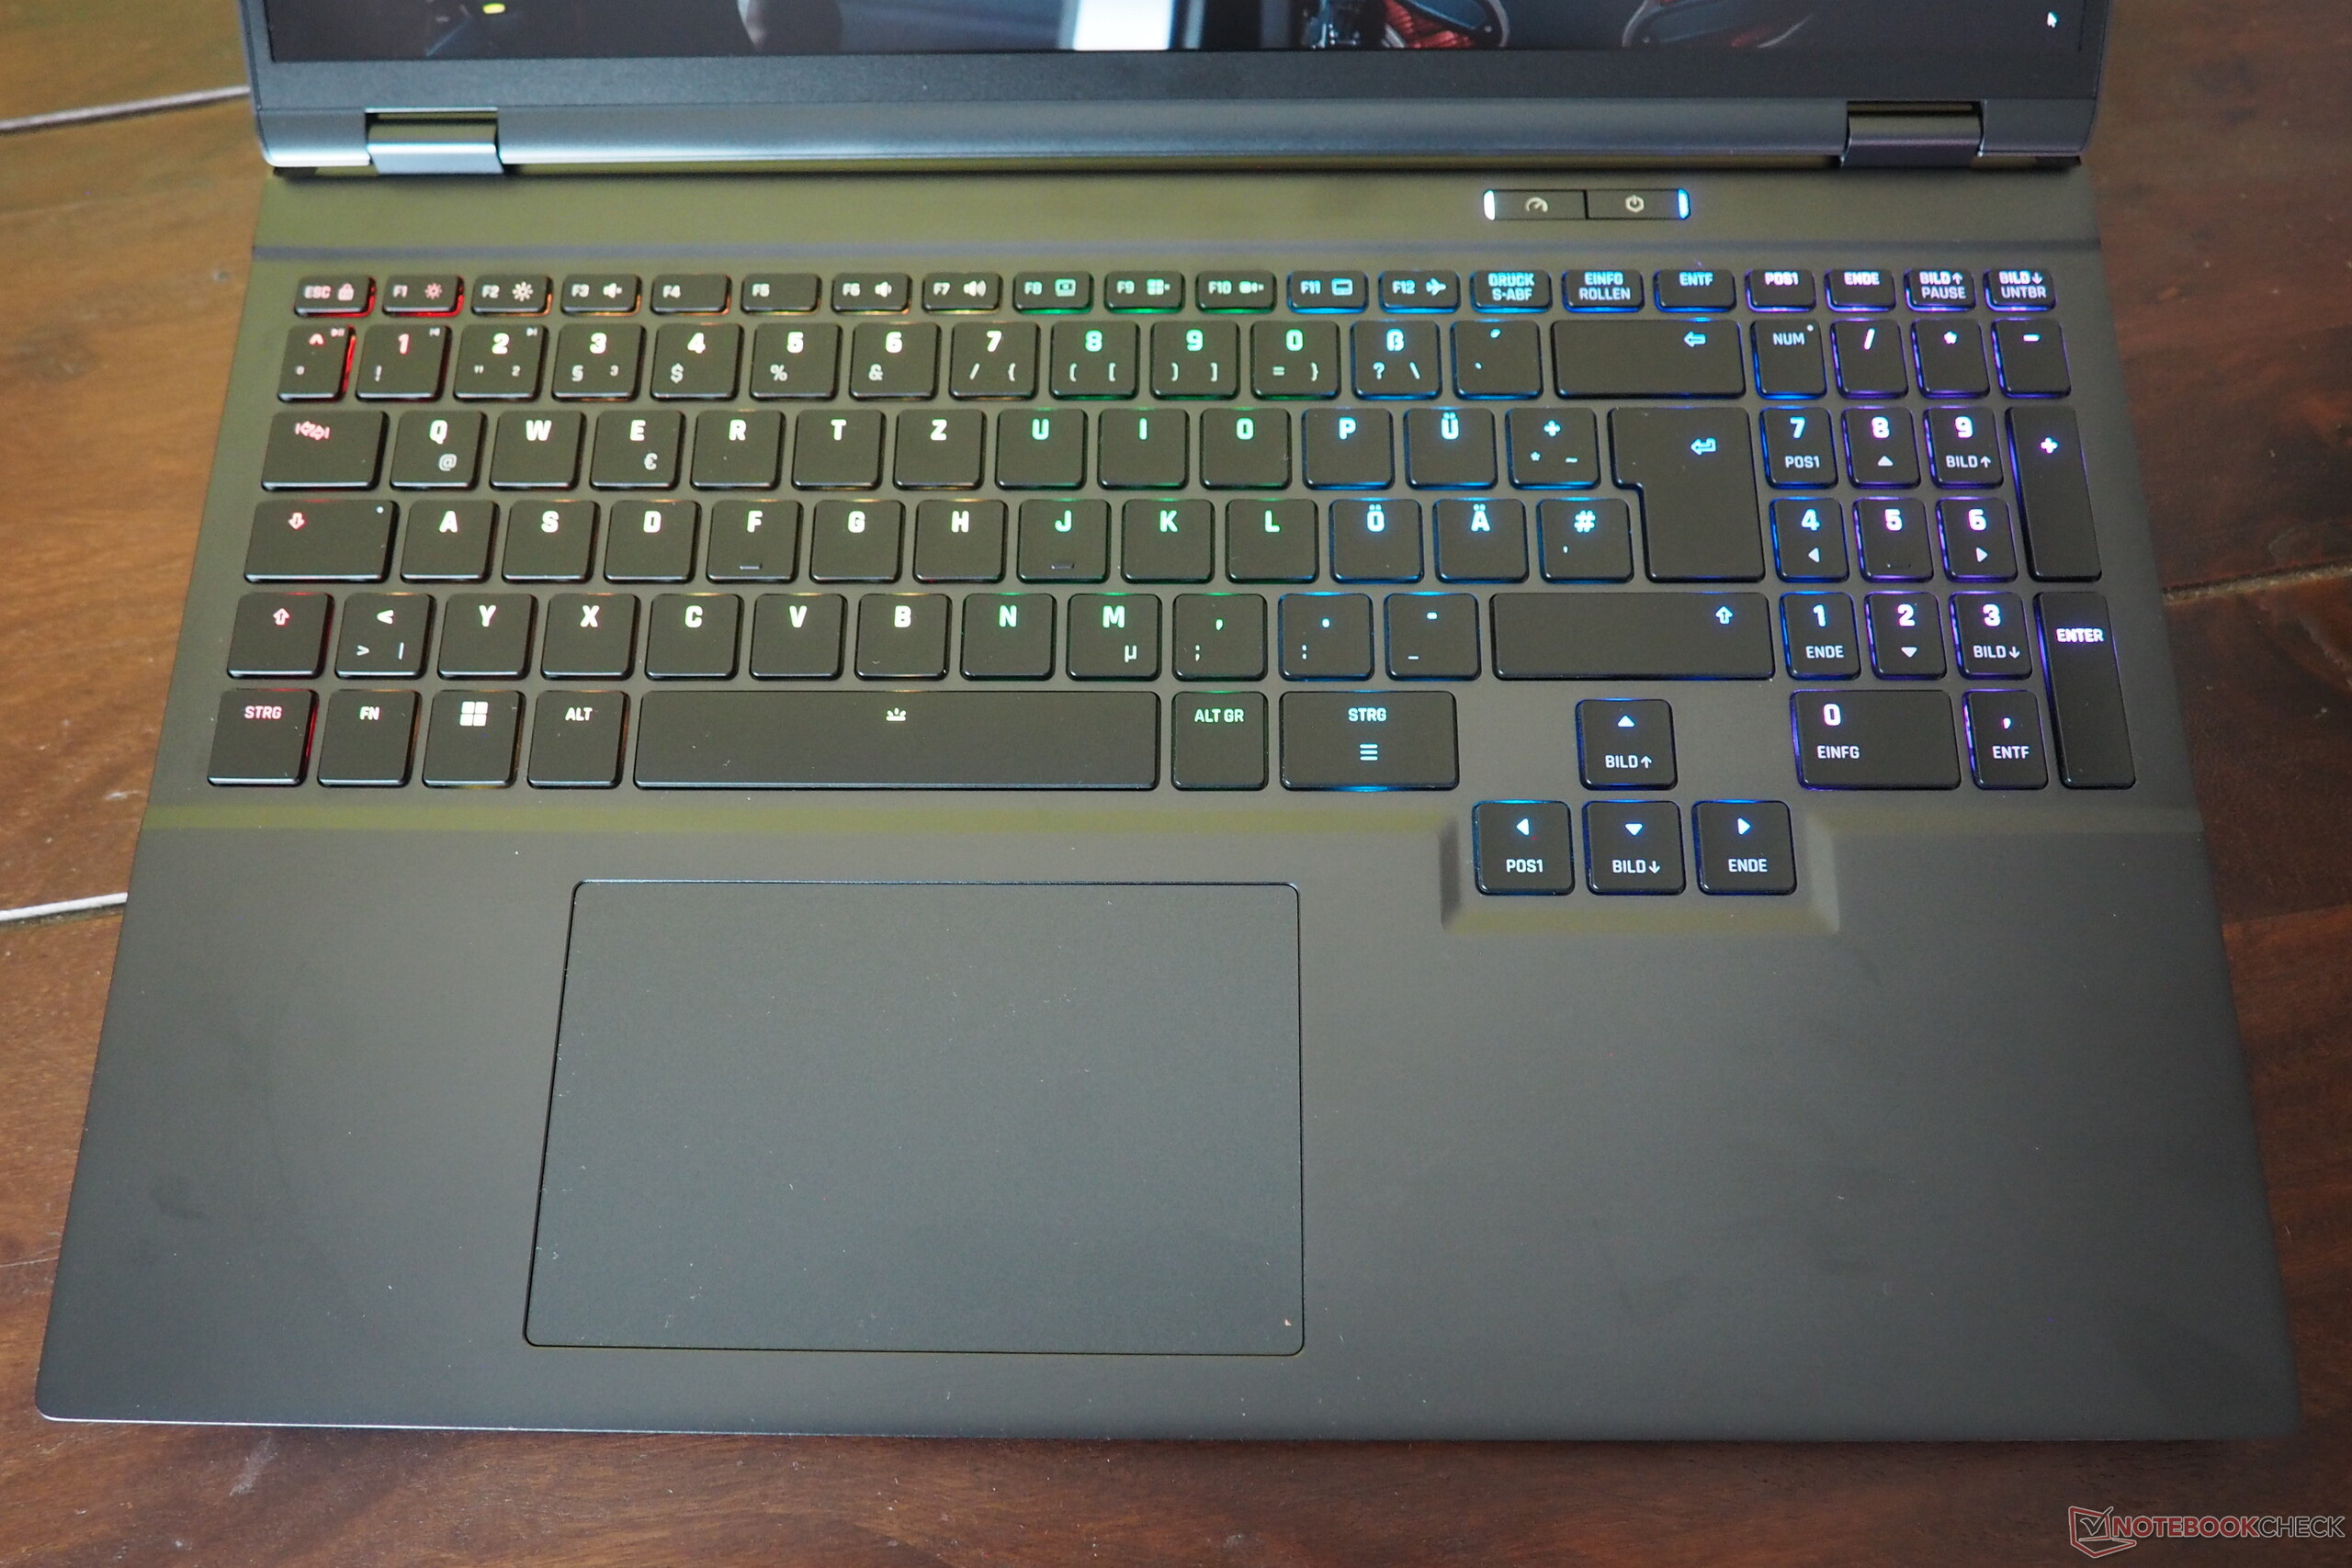
Dispositifs d'entrée
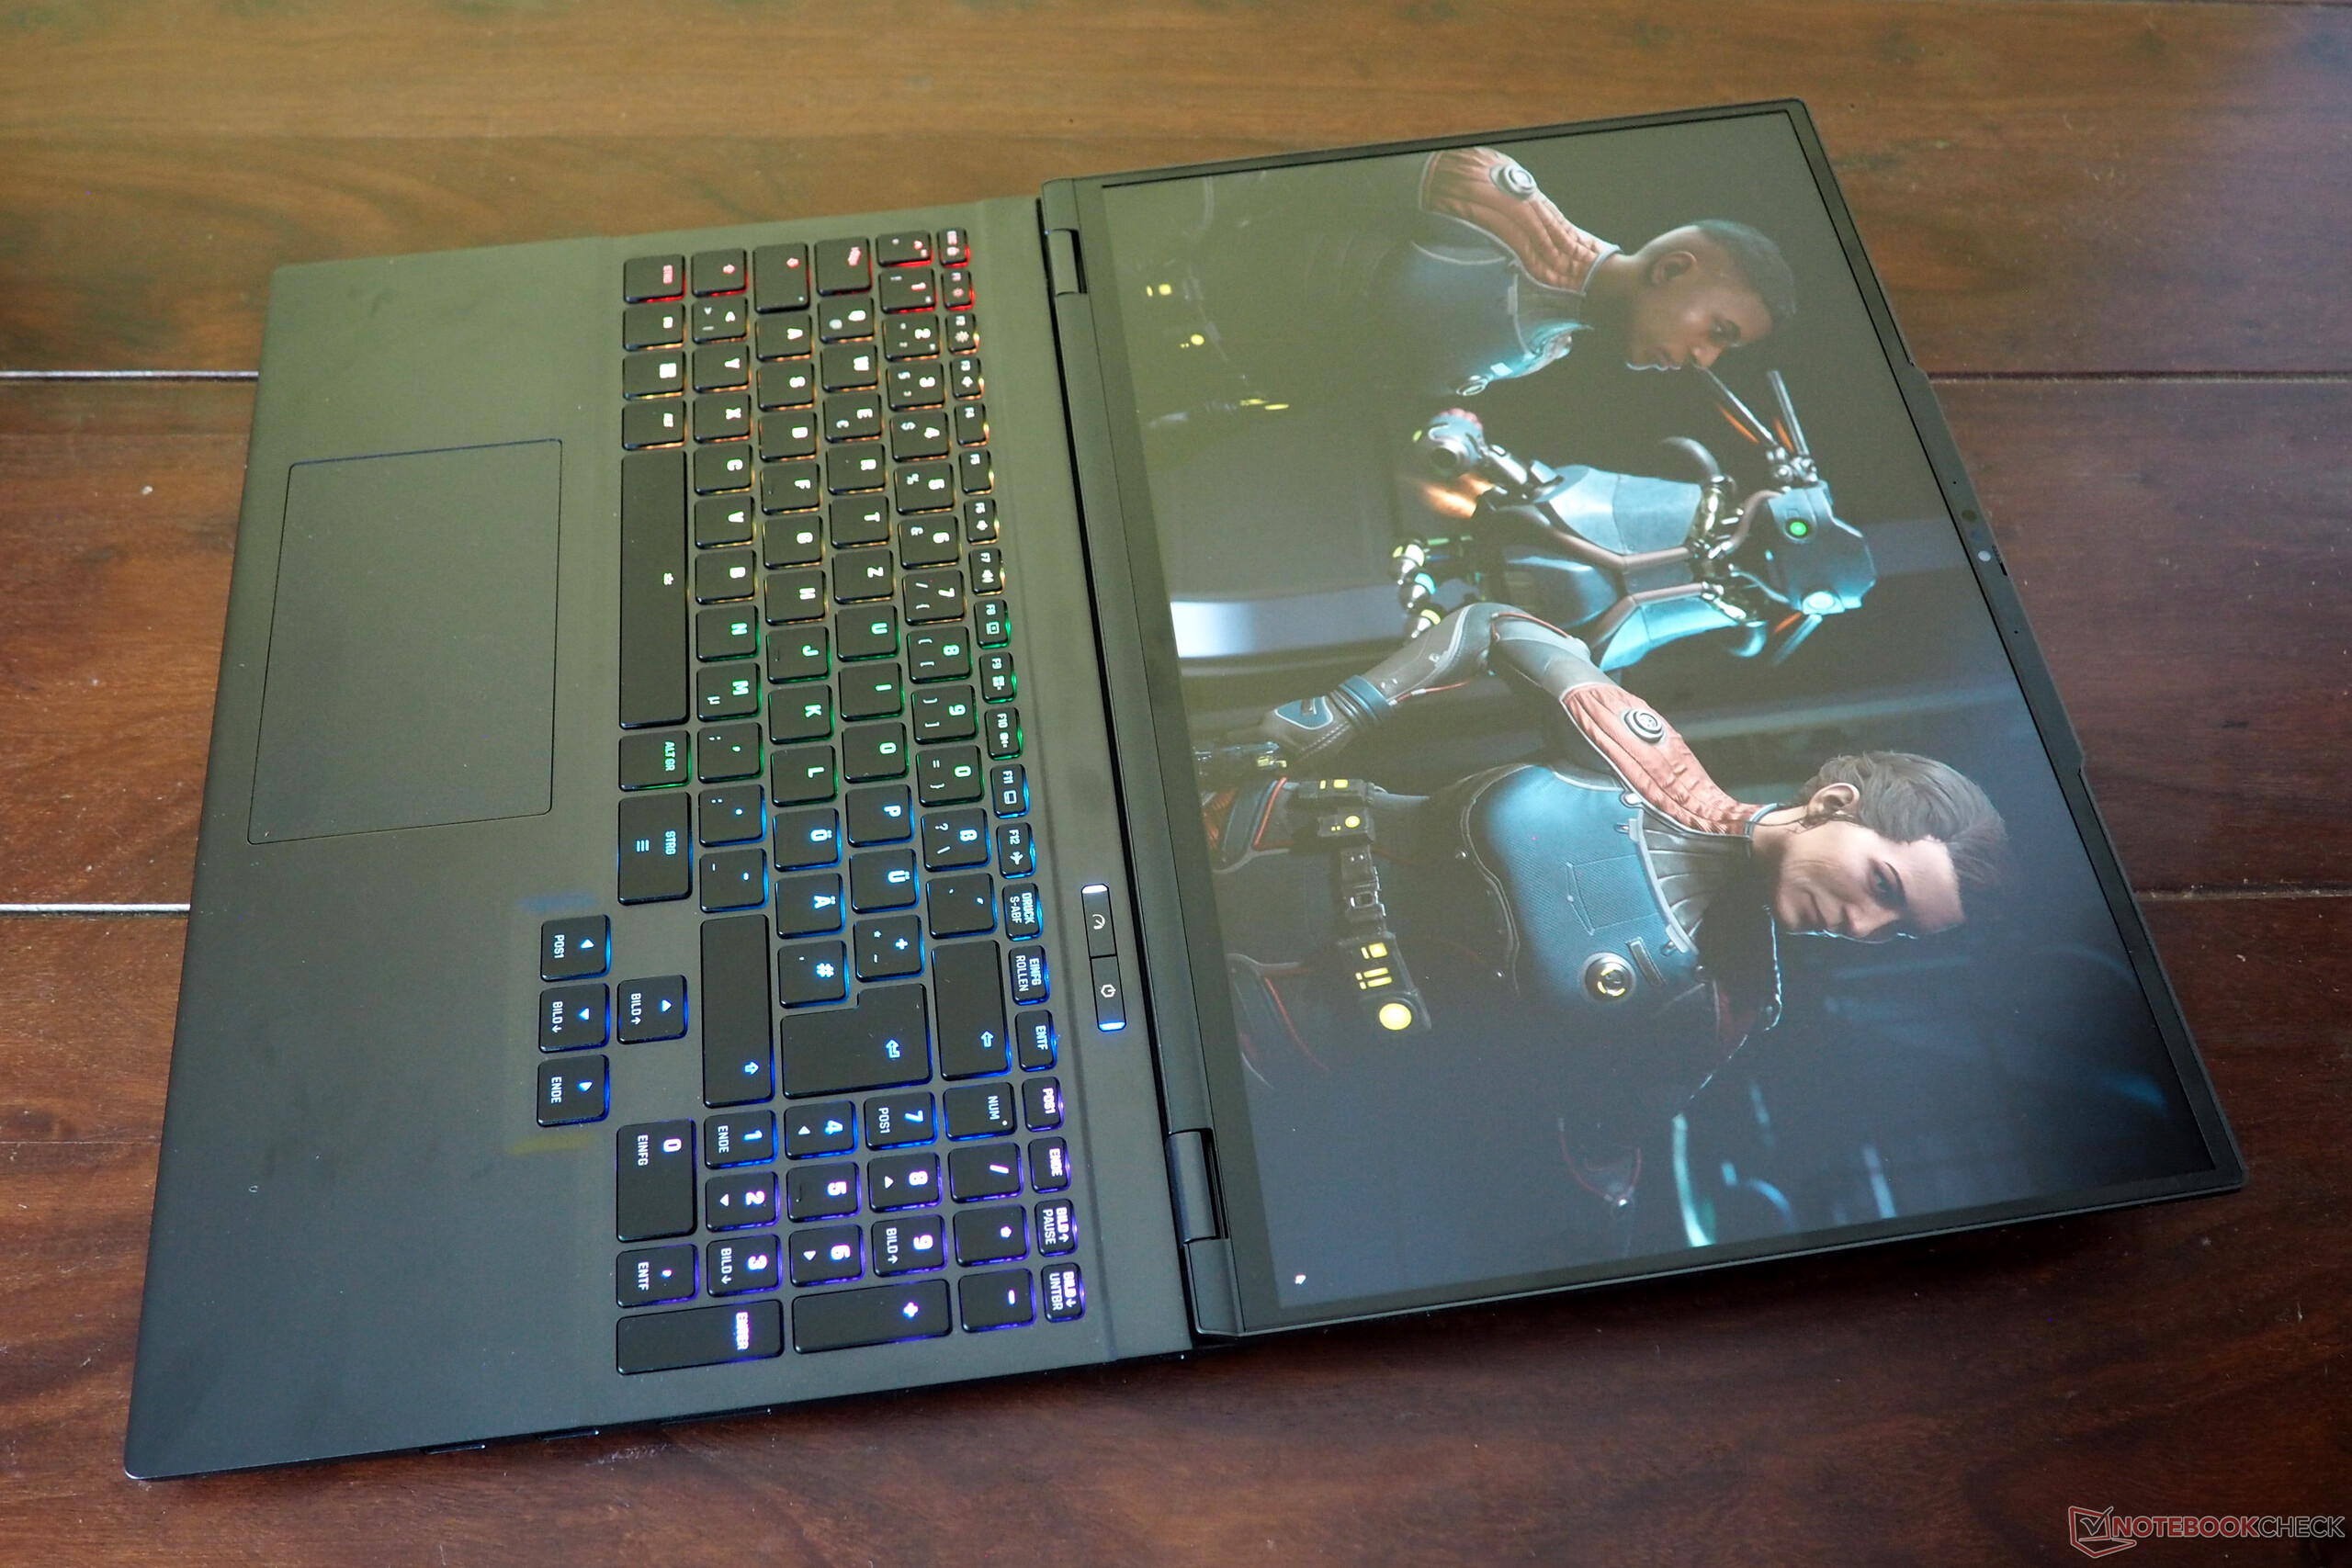
Pour un clavier à dôme en caoutchouc, la sensation de frappe est relativement bonne. Nous avons été particulièrement impressionnés par la disposition des touches, qui comprennent des flèches de taille normale et une disposition des touches bien conçue qui suit largement les conventions standard. Bien entendu, le rétroéclairage RGB est également inclus.
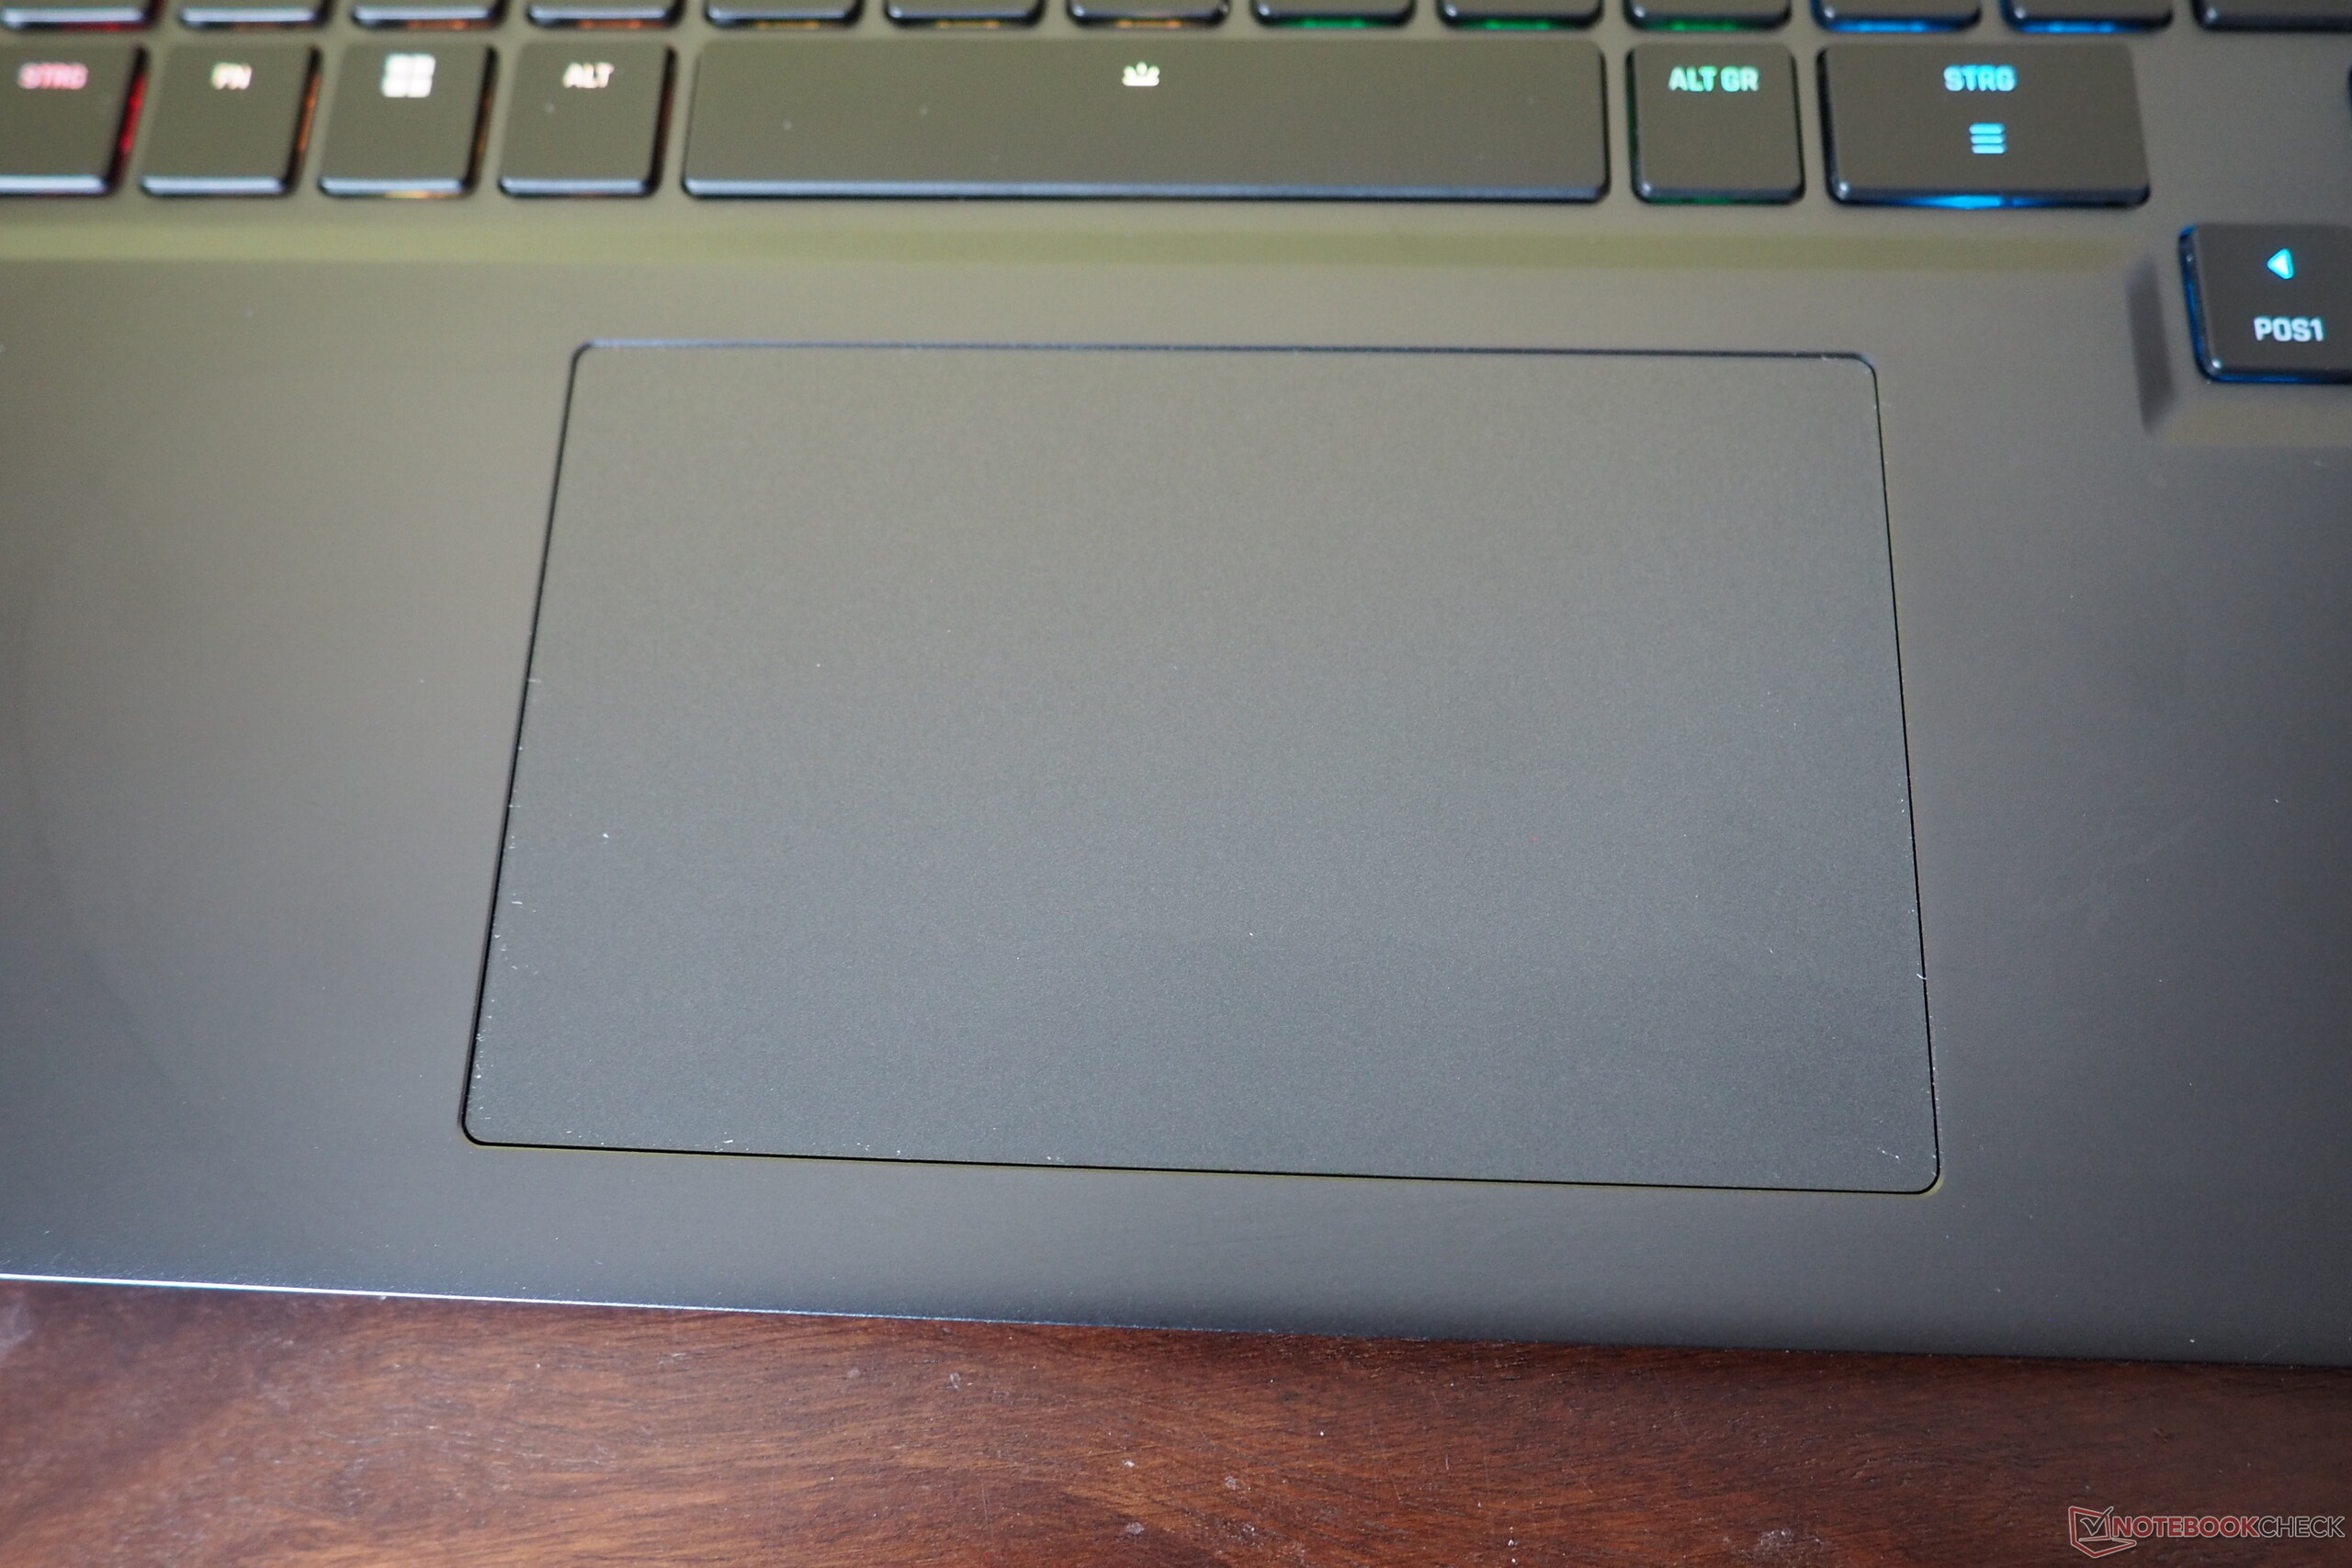
Le pavé tactile mesure environ 12,3 × 7,6 cm, ce qui est convenable pour un ordinateur portable de cette taille. Petit bémol : les zones de clic sont assez bruyantes et donnent l'impression d'être un peu secouées.

Affichage
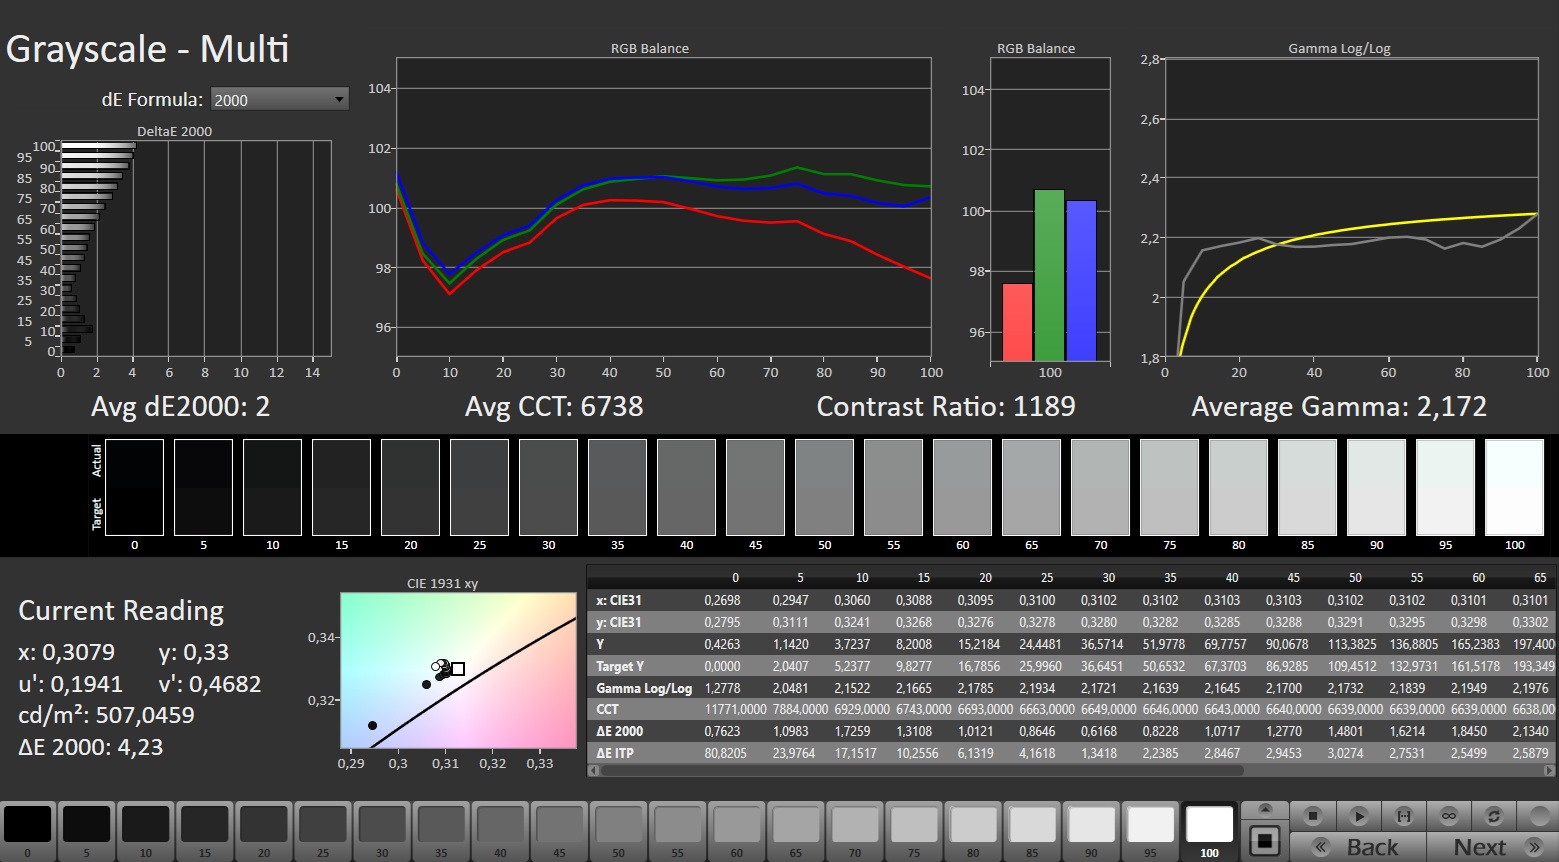
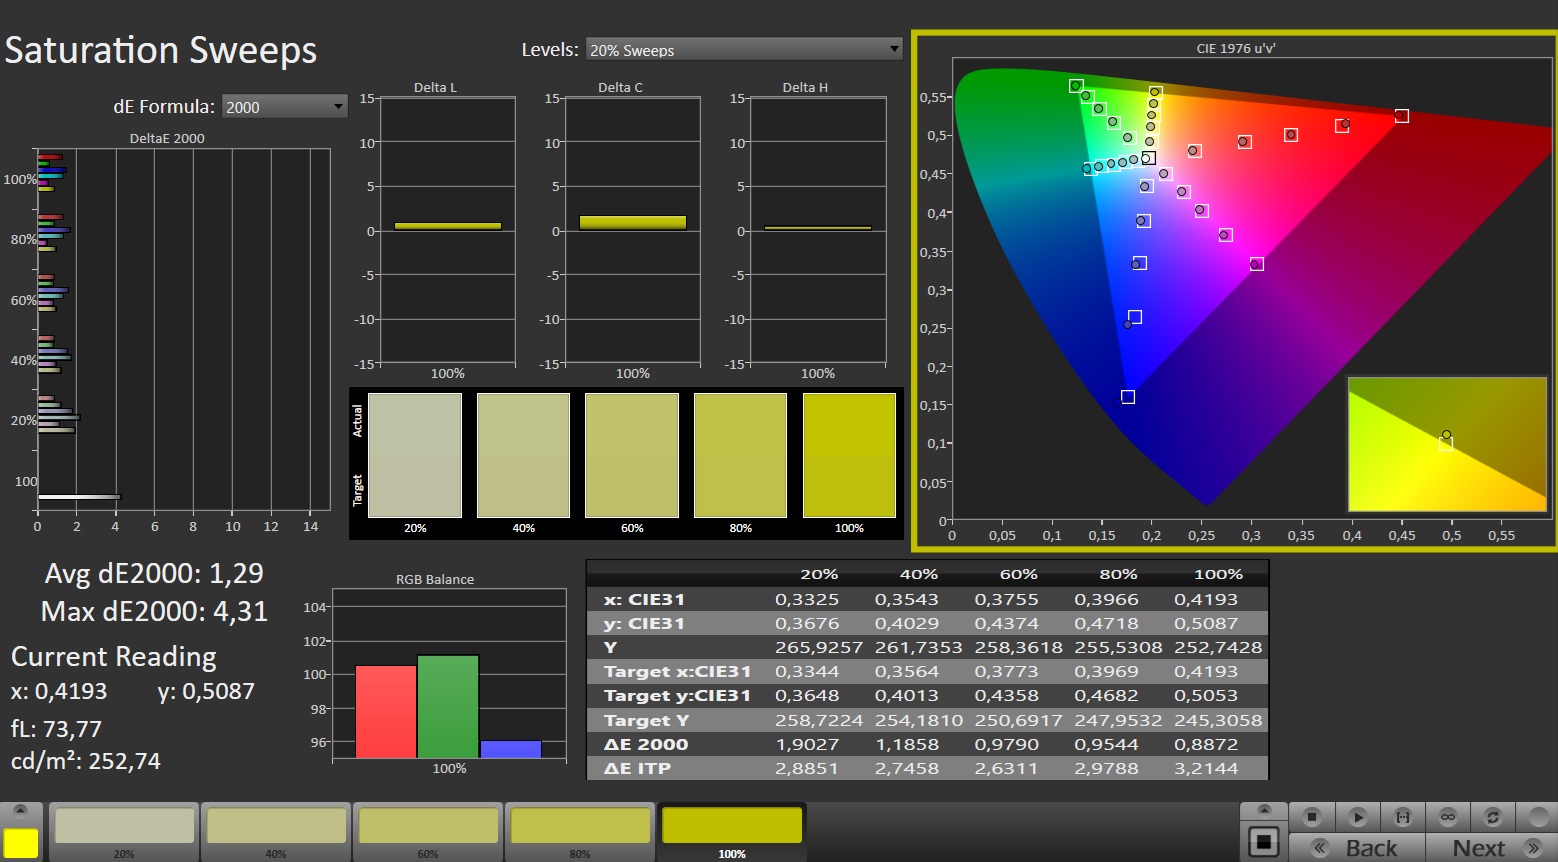
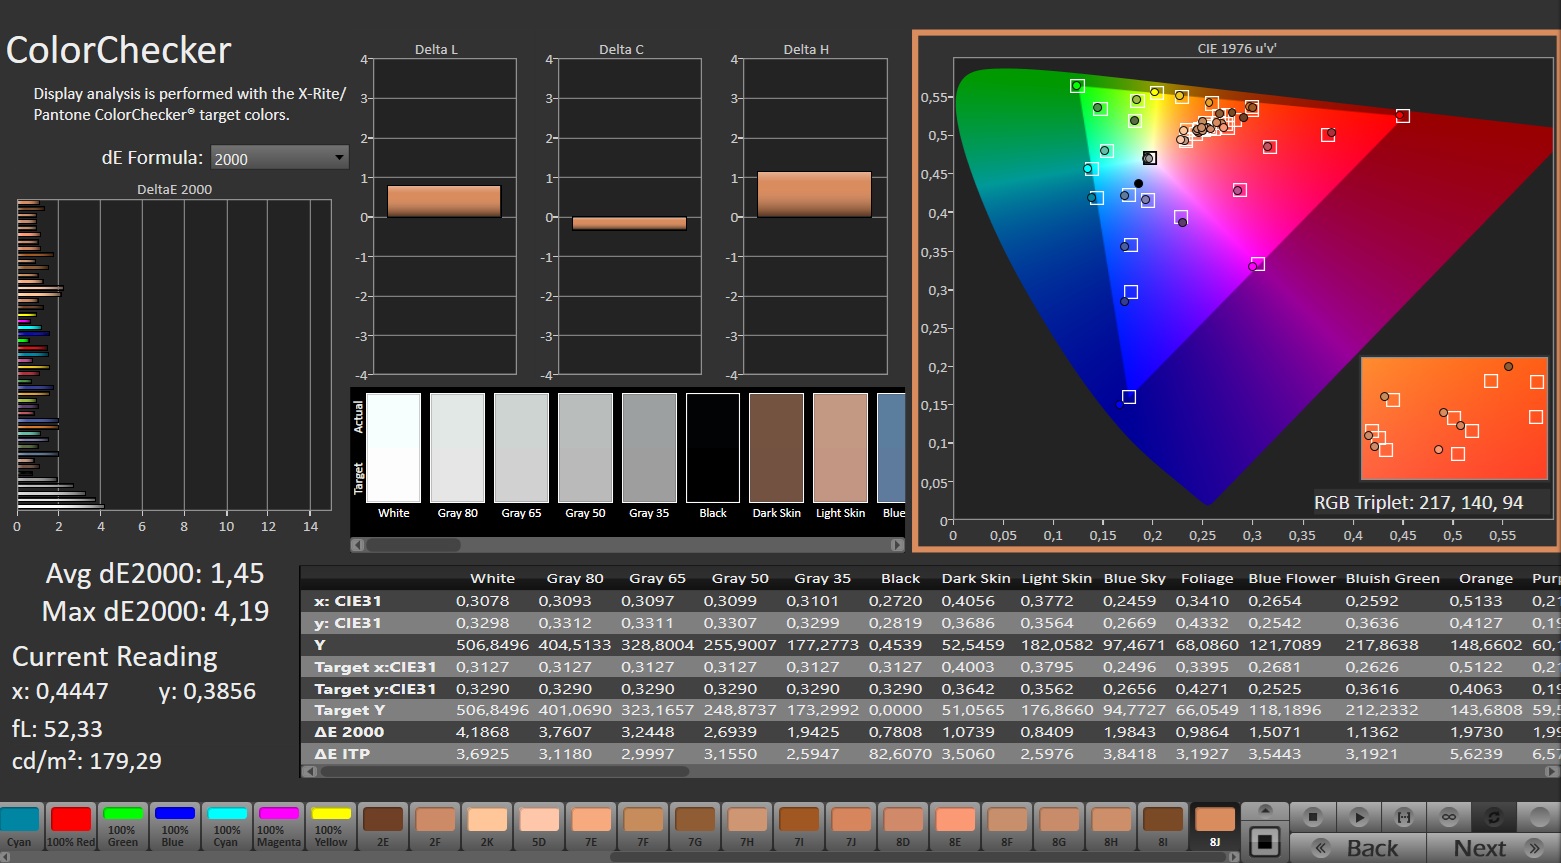
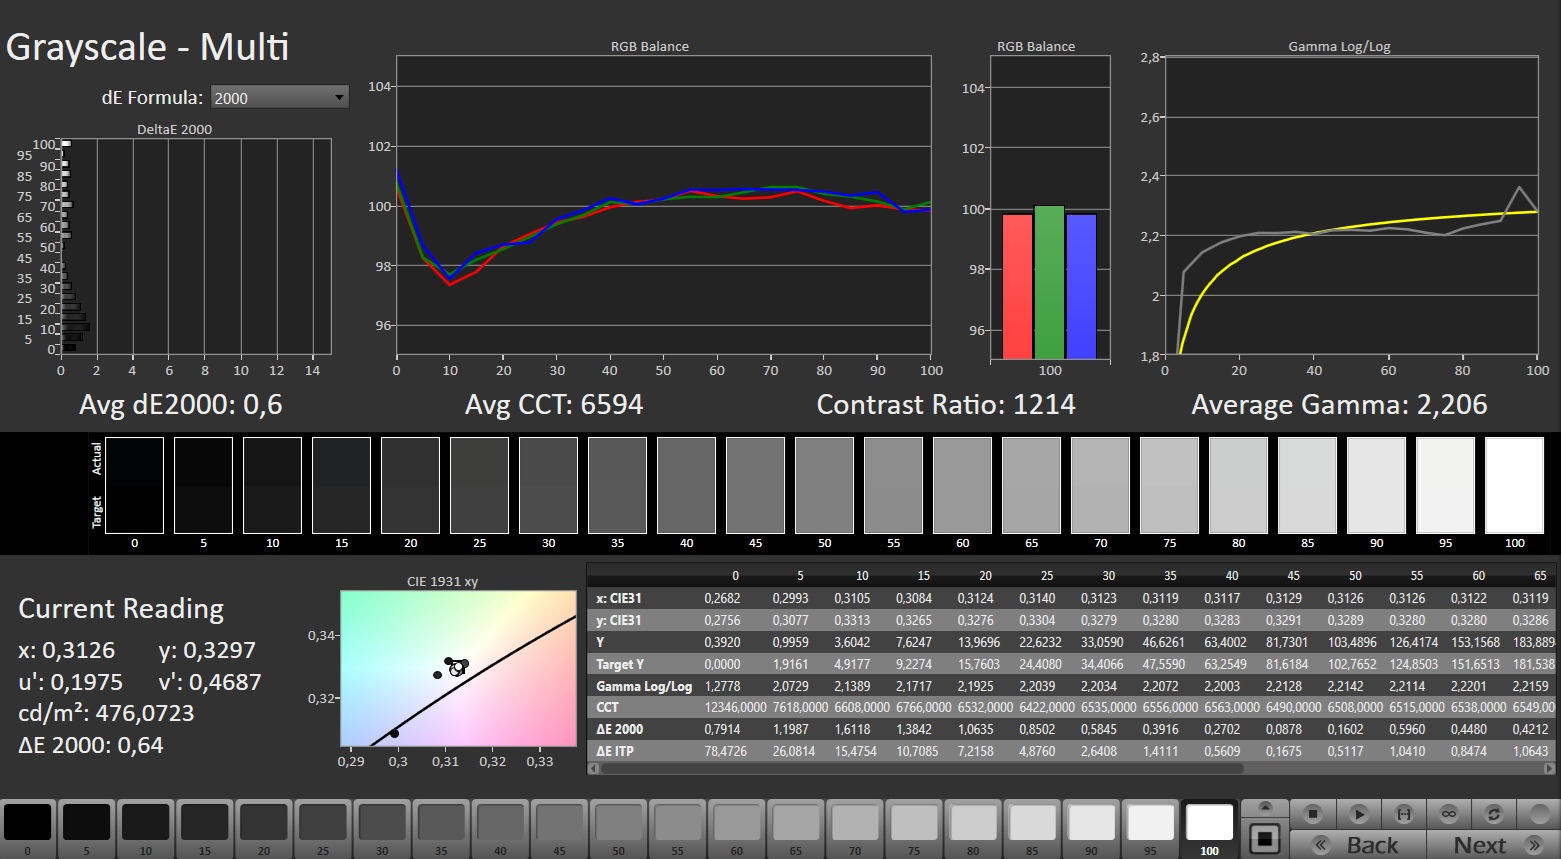
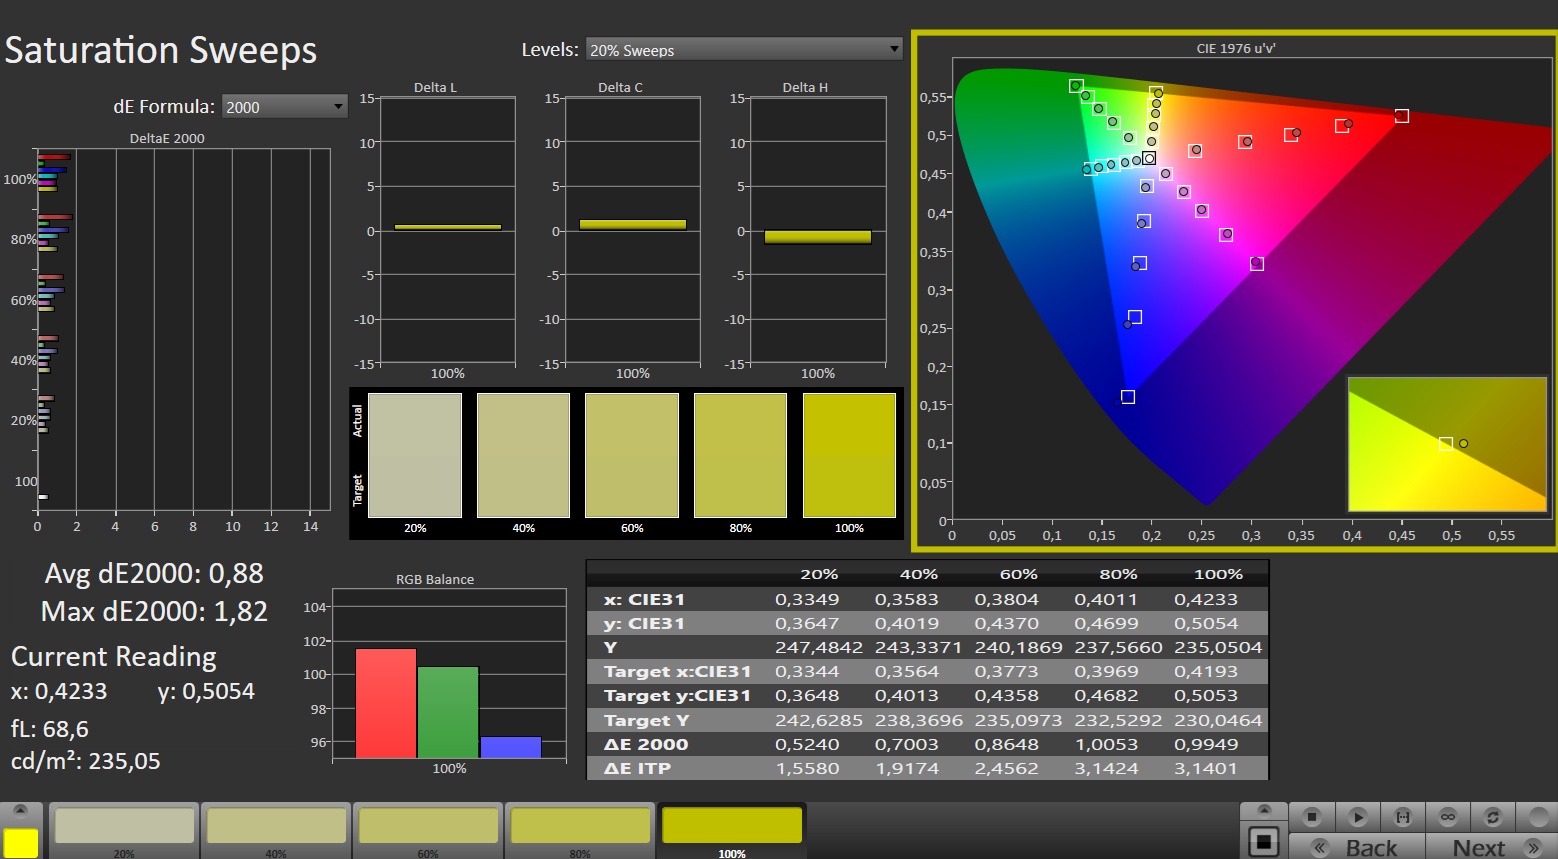
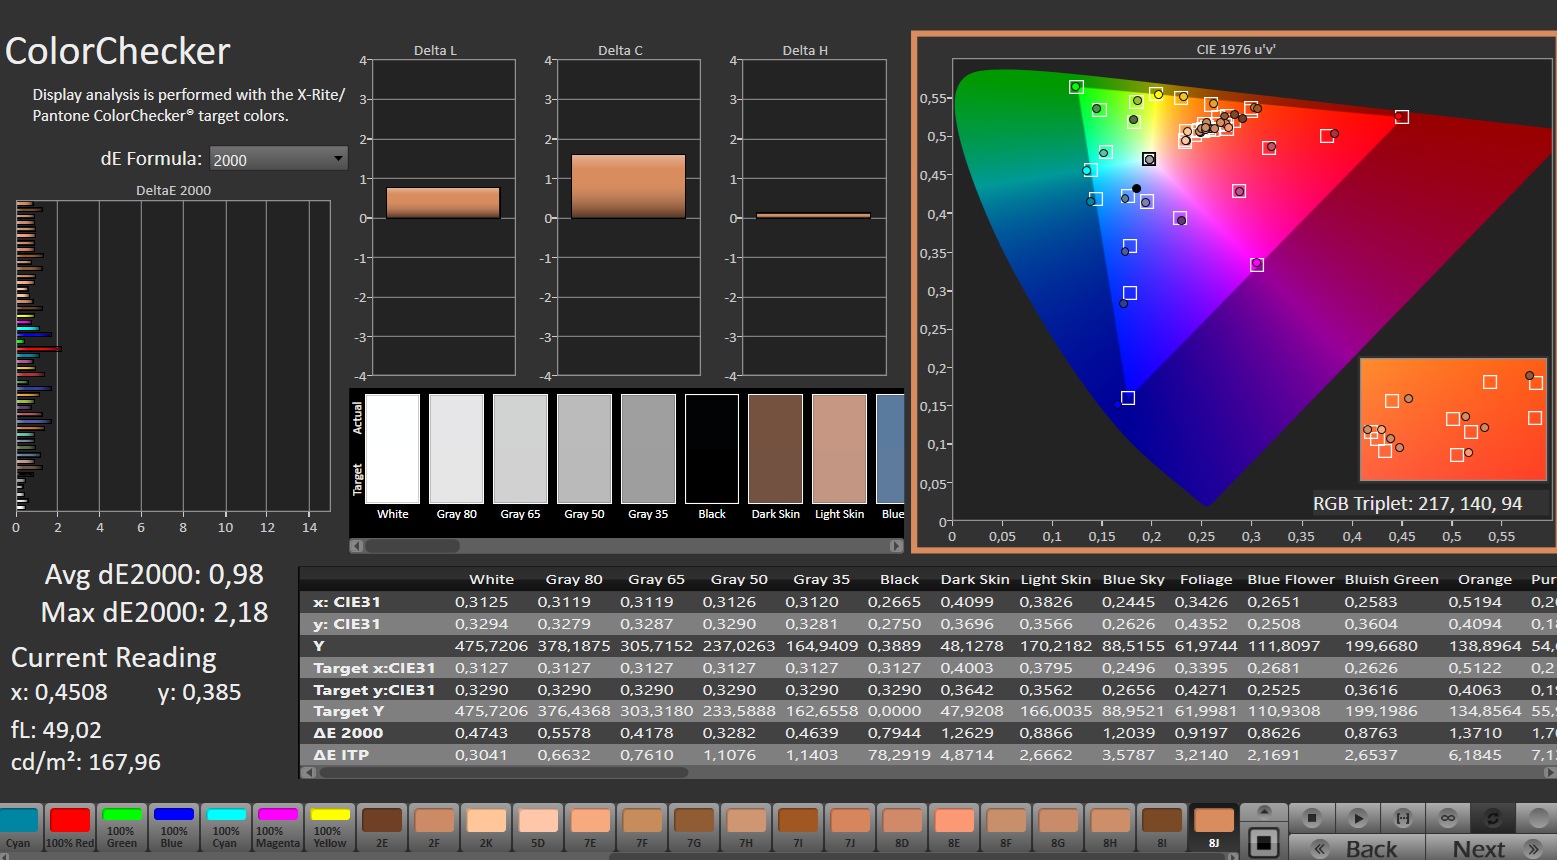
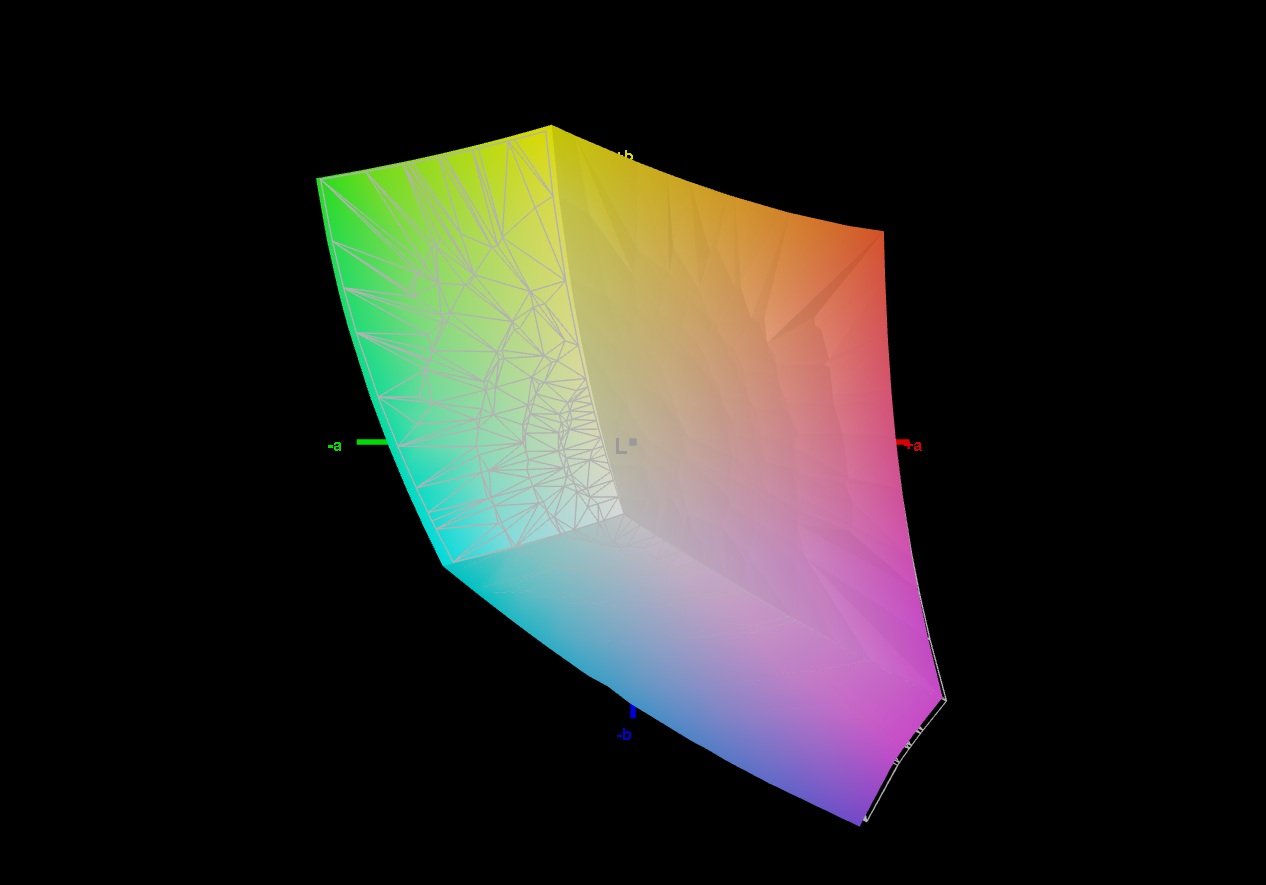
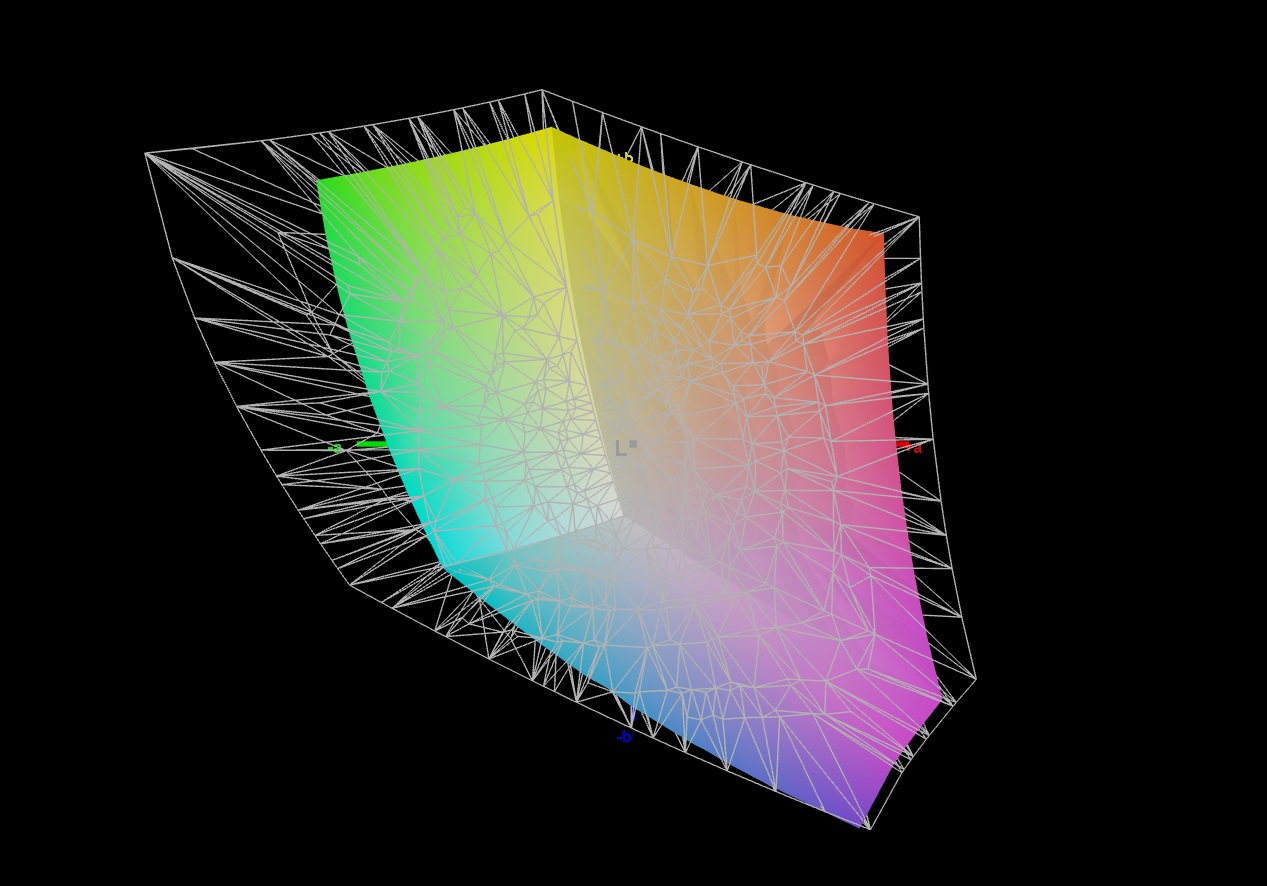
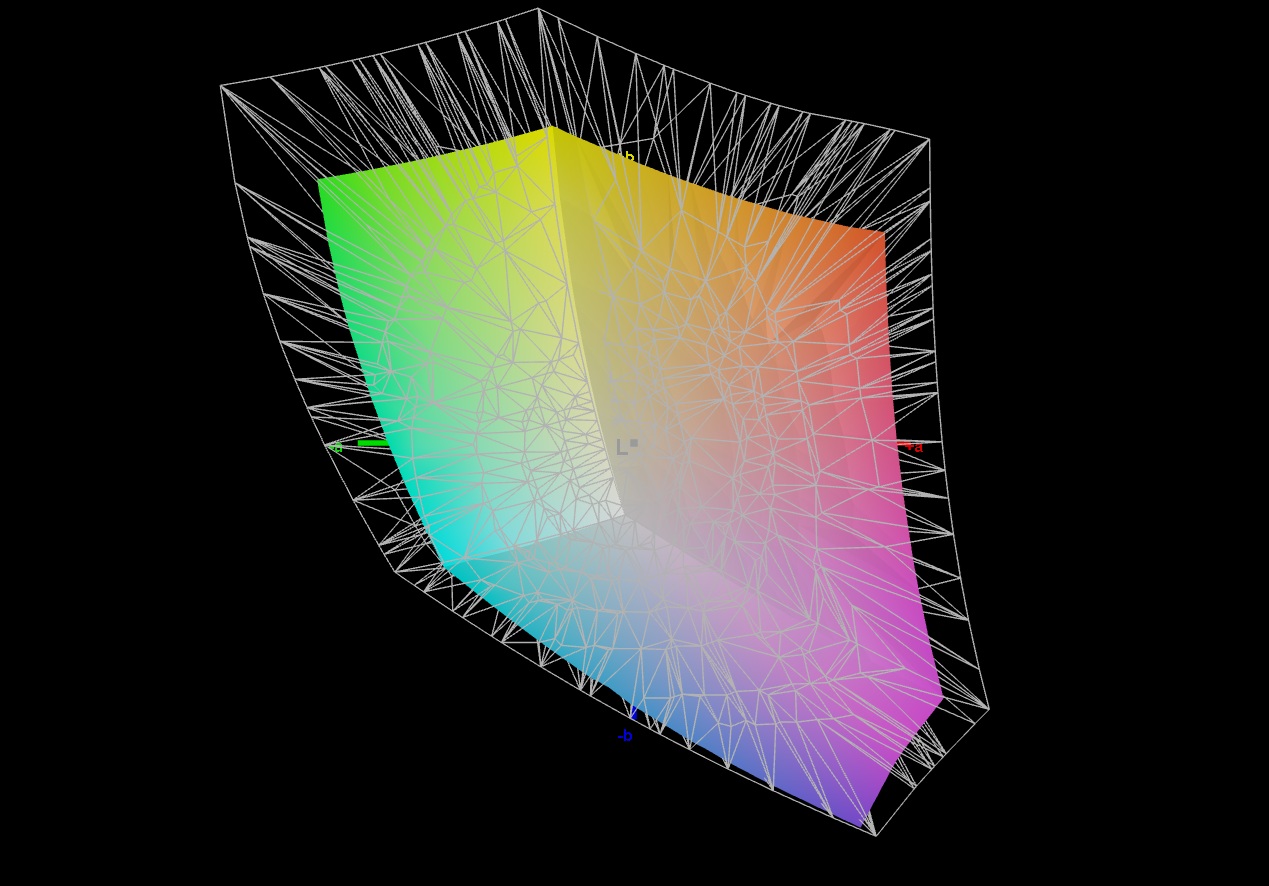
Schenker renonce à l'OLED et s'appuie sur une dalle IPS classique, particulièrement agréable en termes de luminosité. Une moyenne de 488 cd/m² est plutôt bonne et permet une utilisation en extérieur si nécessaire. la résolution de 2б560 x 1 600 pixels et la fréquence de 180 Hz devraient également satisfaire la plupart des acheteurs. Le niveau de noir et le contraste sont basés sur le niveau IPS typique. L'espace colorimétrique (couverture complète sRGB) et les angles de vision sont similaires. Il n'y a pas grand-chose à redire sur le temps de réponse.
| |||||||||||||||||||||||||
Homogénéité de la luminosité: 95 %
Valeur mesurée au centre, sur batterie: 490 cd/m²
Contraste: 1167:1 (Valeurs des noirs: 0.42 cd/m²)
ΔE ColorChecker Calman: 1.45 | ∀{0.5-29.43 Ø4.75}
calibrated: 0.98
ΔE Greyscale Calman: 2 | ∀{0.09-98 Ø5}
71.4% AdobeRGB 1998 (Argyll 3D)
98.7% sRGB (Argyll 3D)
69% Display P3 (Argyll 3D)
Gamma: 2.172
CCT: 6738 K
| Schenker XMG Core 16 VE M25 MNG007DA5-4, IPS, 2560x1600, 16", 180 Hz | Tulpar T6 V3.5 B160UANAC.J (AUO33B7), IPS, 1920x1200, 16", 165 Hz | HP Omen 16-ap0091ng AUODBB2, IPS, 1920x1200, 16", 144 Hz | Lenovo Legion 7 16IAX10 Samsung ATNA60HS01-0, OLED, 2560x1600, 16", 165 Hz | Schenker XMG Core 16 M25 MNG007DA6-4, IPS, 2560x1600, 16", 300 Hz | Acer Predator Helios Neo 16S AI PHN16S-71-94L9 Samsung ATNA60DL03-0, OLED, 2560x1600, 16", 240 Hz | |
|---|---|---|---|---|---|---|
| Display | -1% | -43% | 25% | 23% | 27% | |
| Display P3 Coverage (%) | 69 | 68.6 -1% | 40 -42% | 99.6 44% | 98.8 43% | 99.9 45% |
| sRGB Coverage (%) | 98.7 | 98.7 0% | 58.1 -41% | 100 1% | 100 1% | 100 1% |
| AdobeRGB 1998 Coverage (%) | 71.4 | 70.6 -1% | 38.7 -46% | 93.5 31% | 88.4 24% | 96.5 35% |
| Response Times | -32% | -208% | 90% | 7% | 97% | |
| Response Time Grey 50% / Grey 80% * (ms) | 12.1 ? | 12.4 ? -2% | 27.6 ? -128% | 0.6 ? 95% | 10.7 ? 12% | 0.2 ? 98% |
| Response Time Black / White * (ms) | 5 ? | 8.1 ? -62% | 19.4 ? -288% | 0.8 ? 84% | 4.9 ? 2% | 0.25 ? 95% |
| PWM Frequency (Hz) | 1317 ? | 960 | ||||
| PWM Amplitude * (%) | 23 | 50 | ||||
| Screen | -33% | -100% | -12% | -12% | 86% | |
| Brightness middle (cd/m²) | 490 | 456 -7% | 328 -33% | 477.6 -3% | 512 4% | 390 -20% |
| Brightness (cd/m²) | 488 | 403 -17% | 313 -36% | 483 -1% | 483 -1% | 394 -19% |
| Brightness Distribution (%) | 95 | 79 -17% | 91 -4% | 95 0% | 91 -4% | 98 3% |
| Black Level * (cd/m²) | 0.42 | 0.39 7% | 0.26 38% | 0.43 -2% | 0.04 90% | |
| Contrast (:1) | 1167 | 1169 0% | 1262 8% | 1191 2% | 9750 735% | |
| Colorchecker dE 2000 * | 1.45 | 3.05 -110% | 4.73 -226% | 3.11 -114% | 2.4 -66% | 1.61 -11% |
| Colorchecker dE 2000 max. * | 4.19 | 6.56 -57% | 17.47 -317% | 5.99 -43% | 3.8 9% | 3.49 17% |
| Colorchecker dE 2000 calibrated * | 0.98 | 1.03 -5% | 4.22 -331% | 0.79 19% | 0.9 8% | 1.59 -62% |
| Greyscale dE 2000 * | 2 | 3.9 -95% | 2.05 -2% | 0.9 55% | 3.1 -55% | 1.2 40% |
| Gamma | 2.172 101% | 2.279 97% | 2.63 84% | 2.18 101% | 2.41 91% | 2.235 98% |
| CCT | 6738 96% | 7198 90% | 6718 97% | 6405 101% | 6534 99% | 6580 99% |
| Moyenne finale (programmes/paramètres) | -22% /
-26% | -117% /
-103% | 34% /
14% | 6% /
-2% | 70% /
75% |
* ... Moindre est la valeur, meilleures sont les performances


Scintillement / MLI (Modulation de largeur d'impulsion)
| Scintillement / MLI (Modulation de largeur d'impulsion) non décelé | 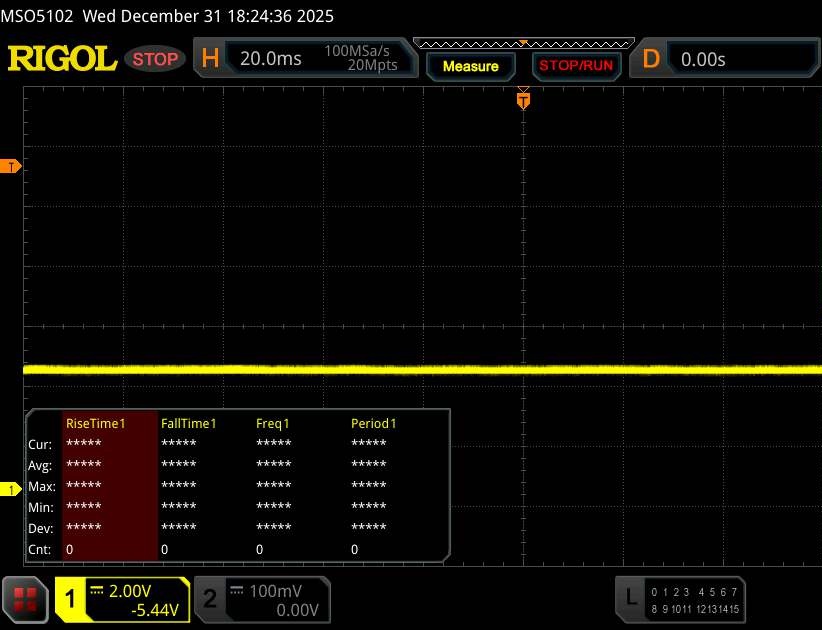 | ||
En comparaison, 53 % des appareils testés n'emploient pas MDI pour assombrir leur écran. Nous avons relevé une moyenne à 7962 (minimum : 5 - maximum : 343500) Hz dans le cas où une MDI était active. | |||
Temps de réponse de l'écran
| ↔ Temps de réponse noir à blanc | ||
|---|---|---|
| 5 ms ... hausse ↗ et chute ↘ combinées | ↗ 1.8 ms hausse | 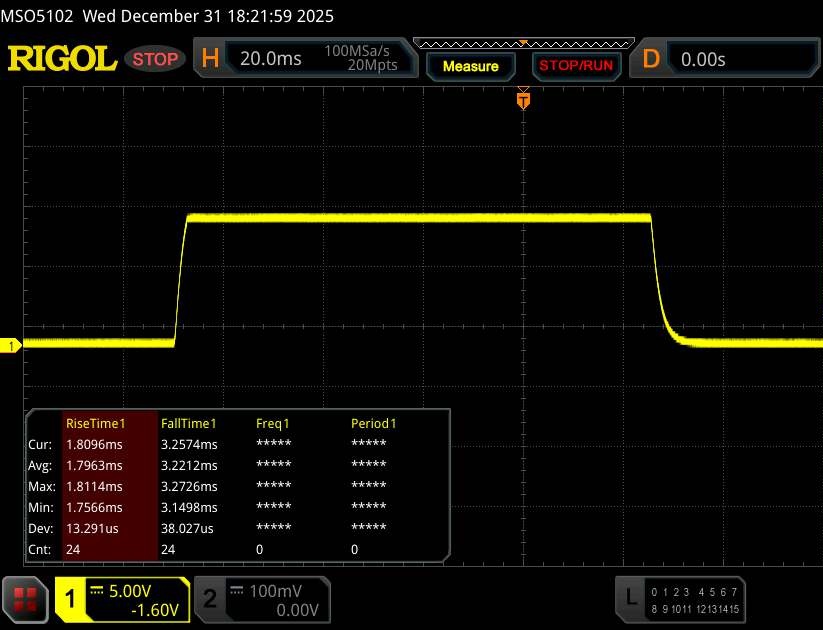 |
| ↘ 3.2 ms chute | ||
| L'écran montre de très faibles temps de réponse, parfait pour le jeu. En comparaison, tous les appareils testés affichent entre 0.1 (minimum) et 240 (maximum) ms. » 17 % des appareils testés affichent de meilleures performances. Cela signifie que les latences relevées sont meilleures que la moyenne (20 ms) de tous les appareils testés. | ||
| ↔ Temps de réponse gris 50% à gris 80% | ||
| 12.1 ms ... hausse ↗ et chute ↘ combinées | ↗ 5.9 ms hausse | 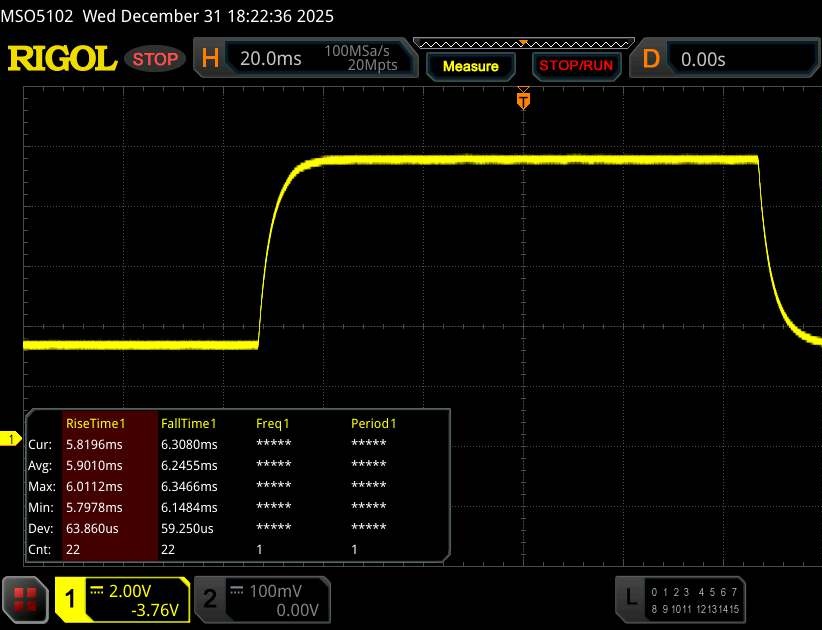 |
| ↘ 6.2 ms chute | ||
| L'écran montre de bons temps de réponse, mais insuffisant pour du jeu compétitif. En comparaison, tous les appareils testés affichent entre 0.165 (minimum) et 636 (maximum) ms. » 25 % des appareils testés affichent de meilleures performances. Cela signifie que les latences relevées sont meilleures que la moyenne (31.3 ms) de tous les appareils testés. | ||
Performance
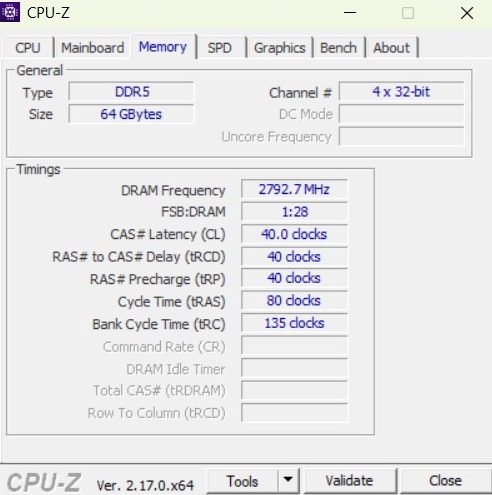
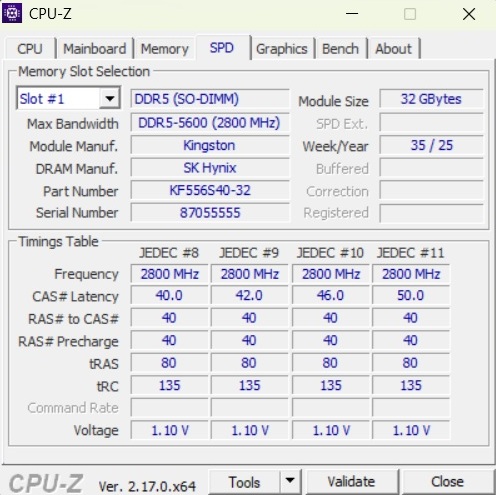
En termes de performances CPU et GPU, le XMG Core 16 VE se situe dans la moyenne. Deux emplacements SO-DIMM et deux emplacements M.2 facilitent les mises à jour futures.
Conditions d'essai
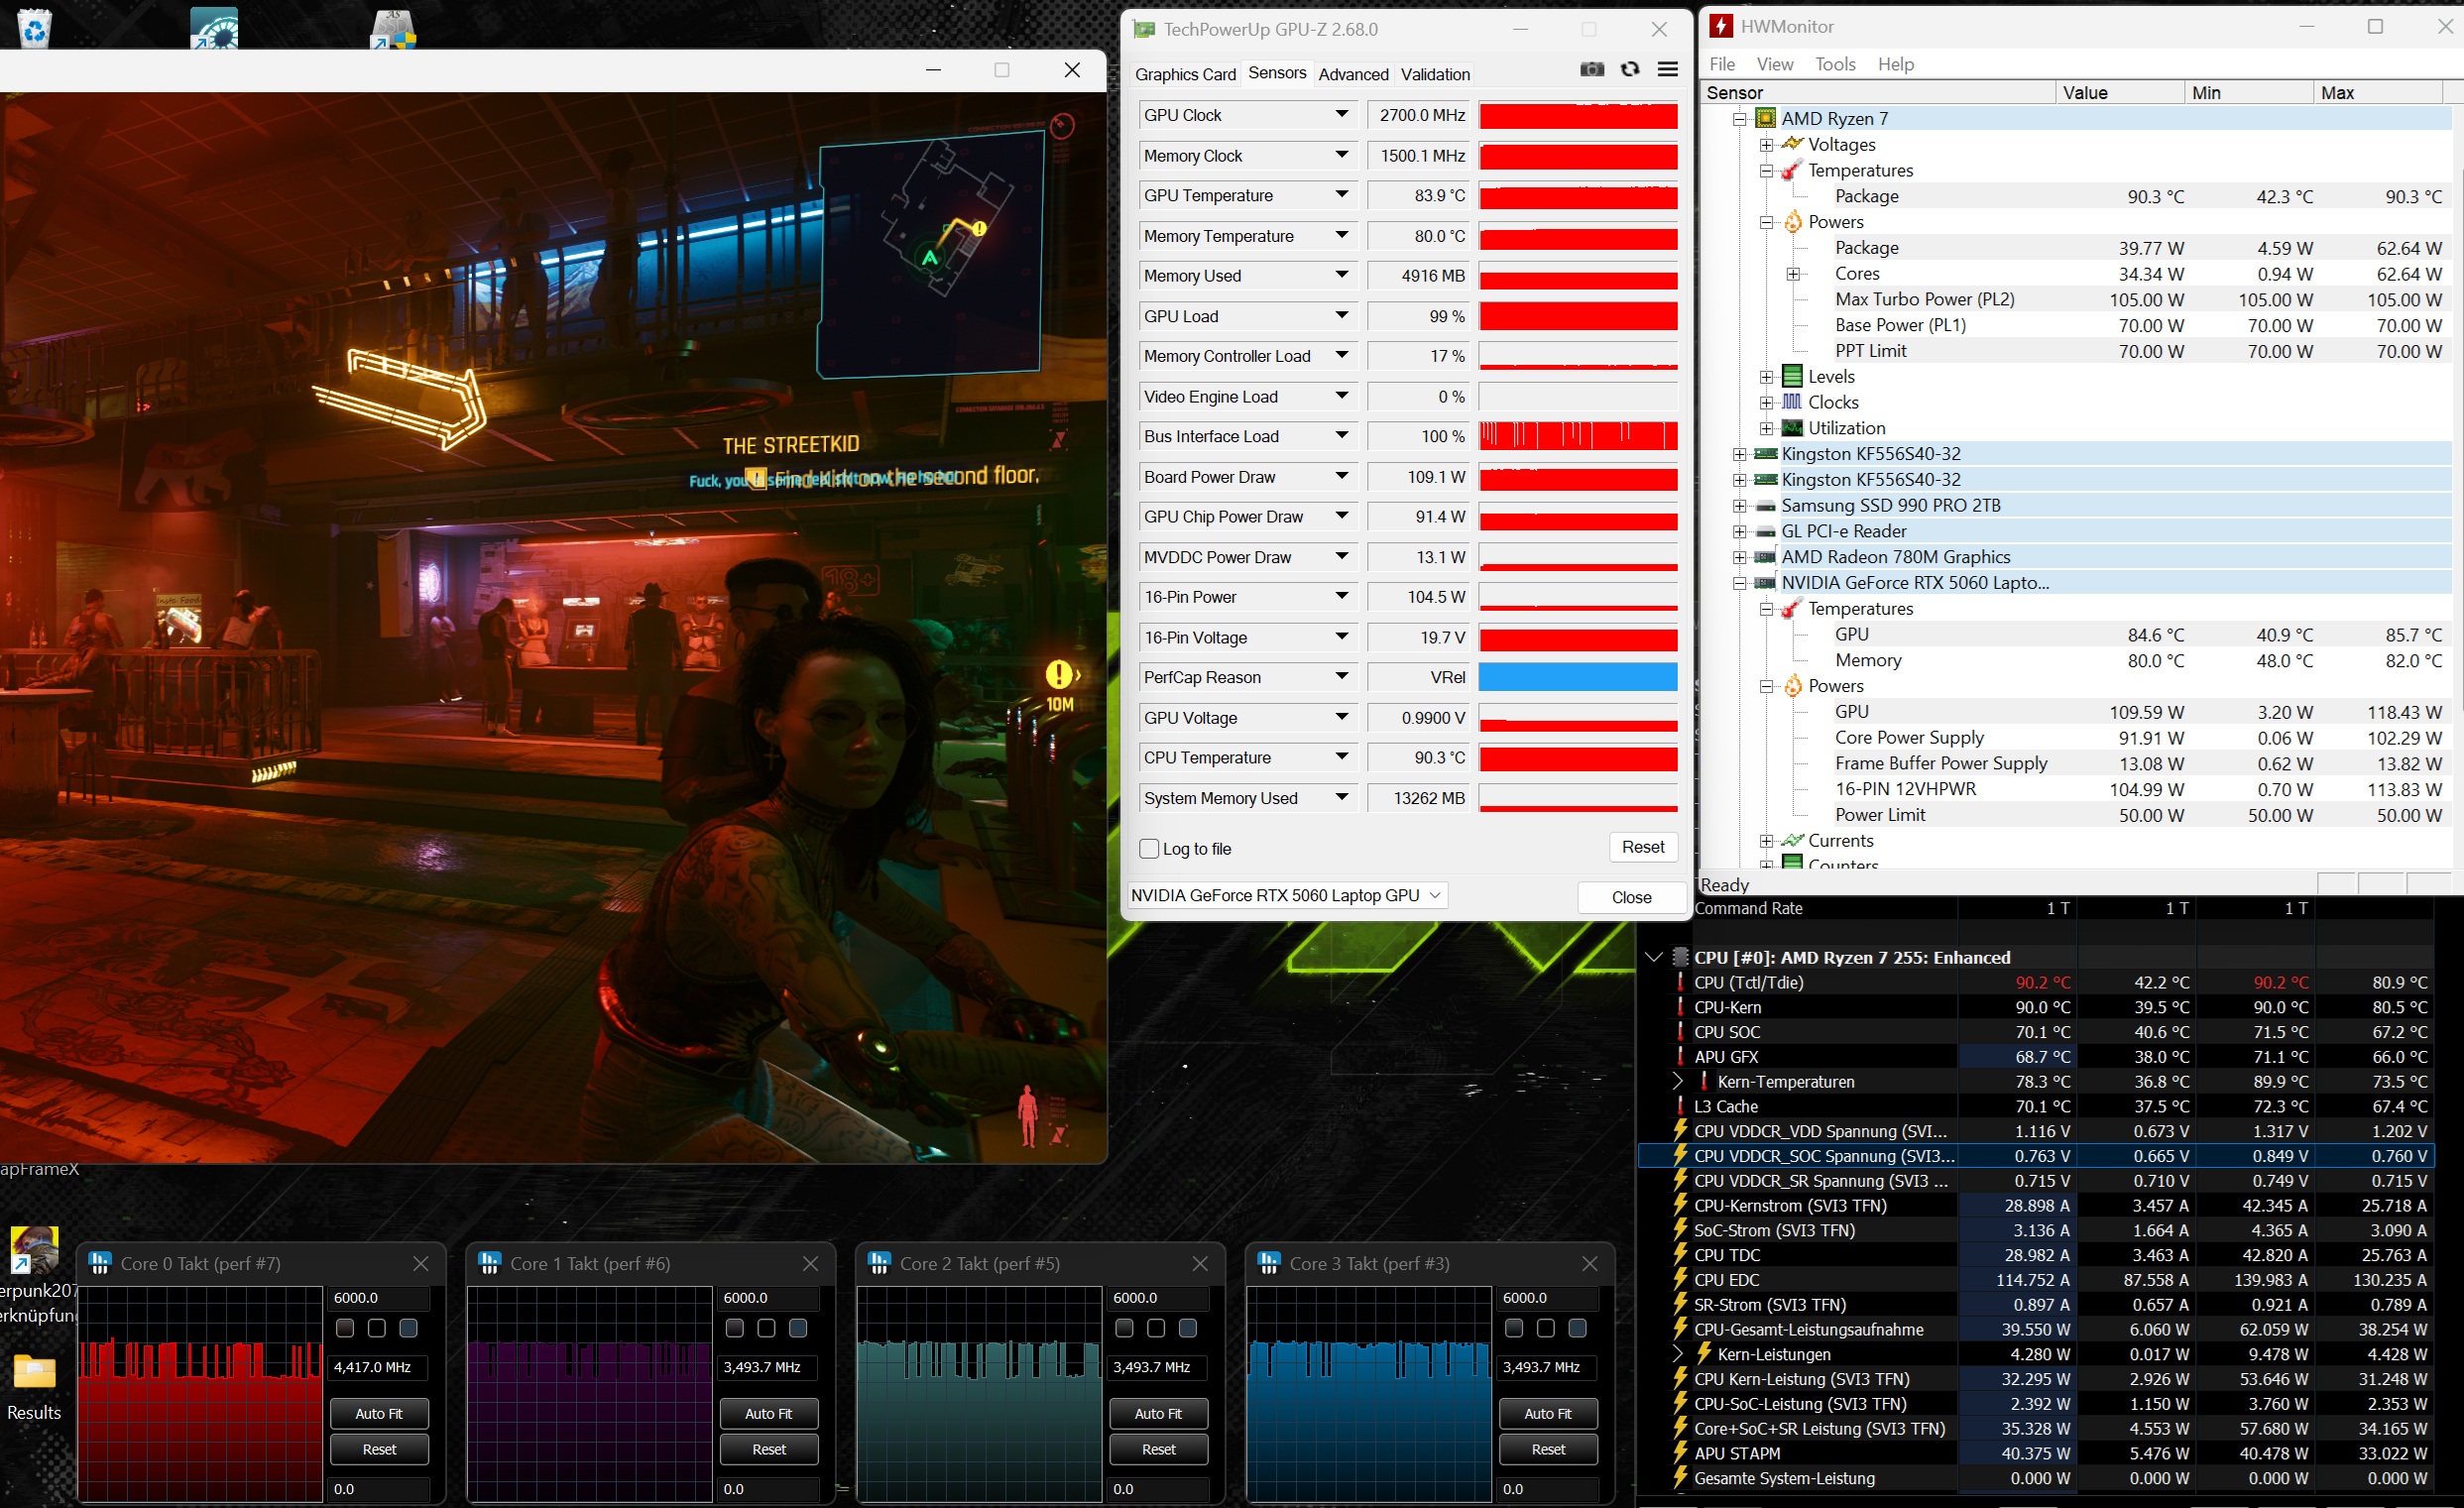
Dans le centre de contrôle, les utilisateurs peuvent choisir entre trois modes différents (voir le tableau pour plus de détails). À l'exception du test de la batterie, toutes les mesures ont été prises en mode Overboost "Normal" sans overclocking du GPU.
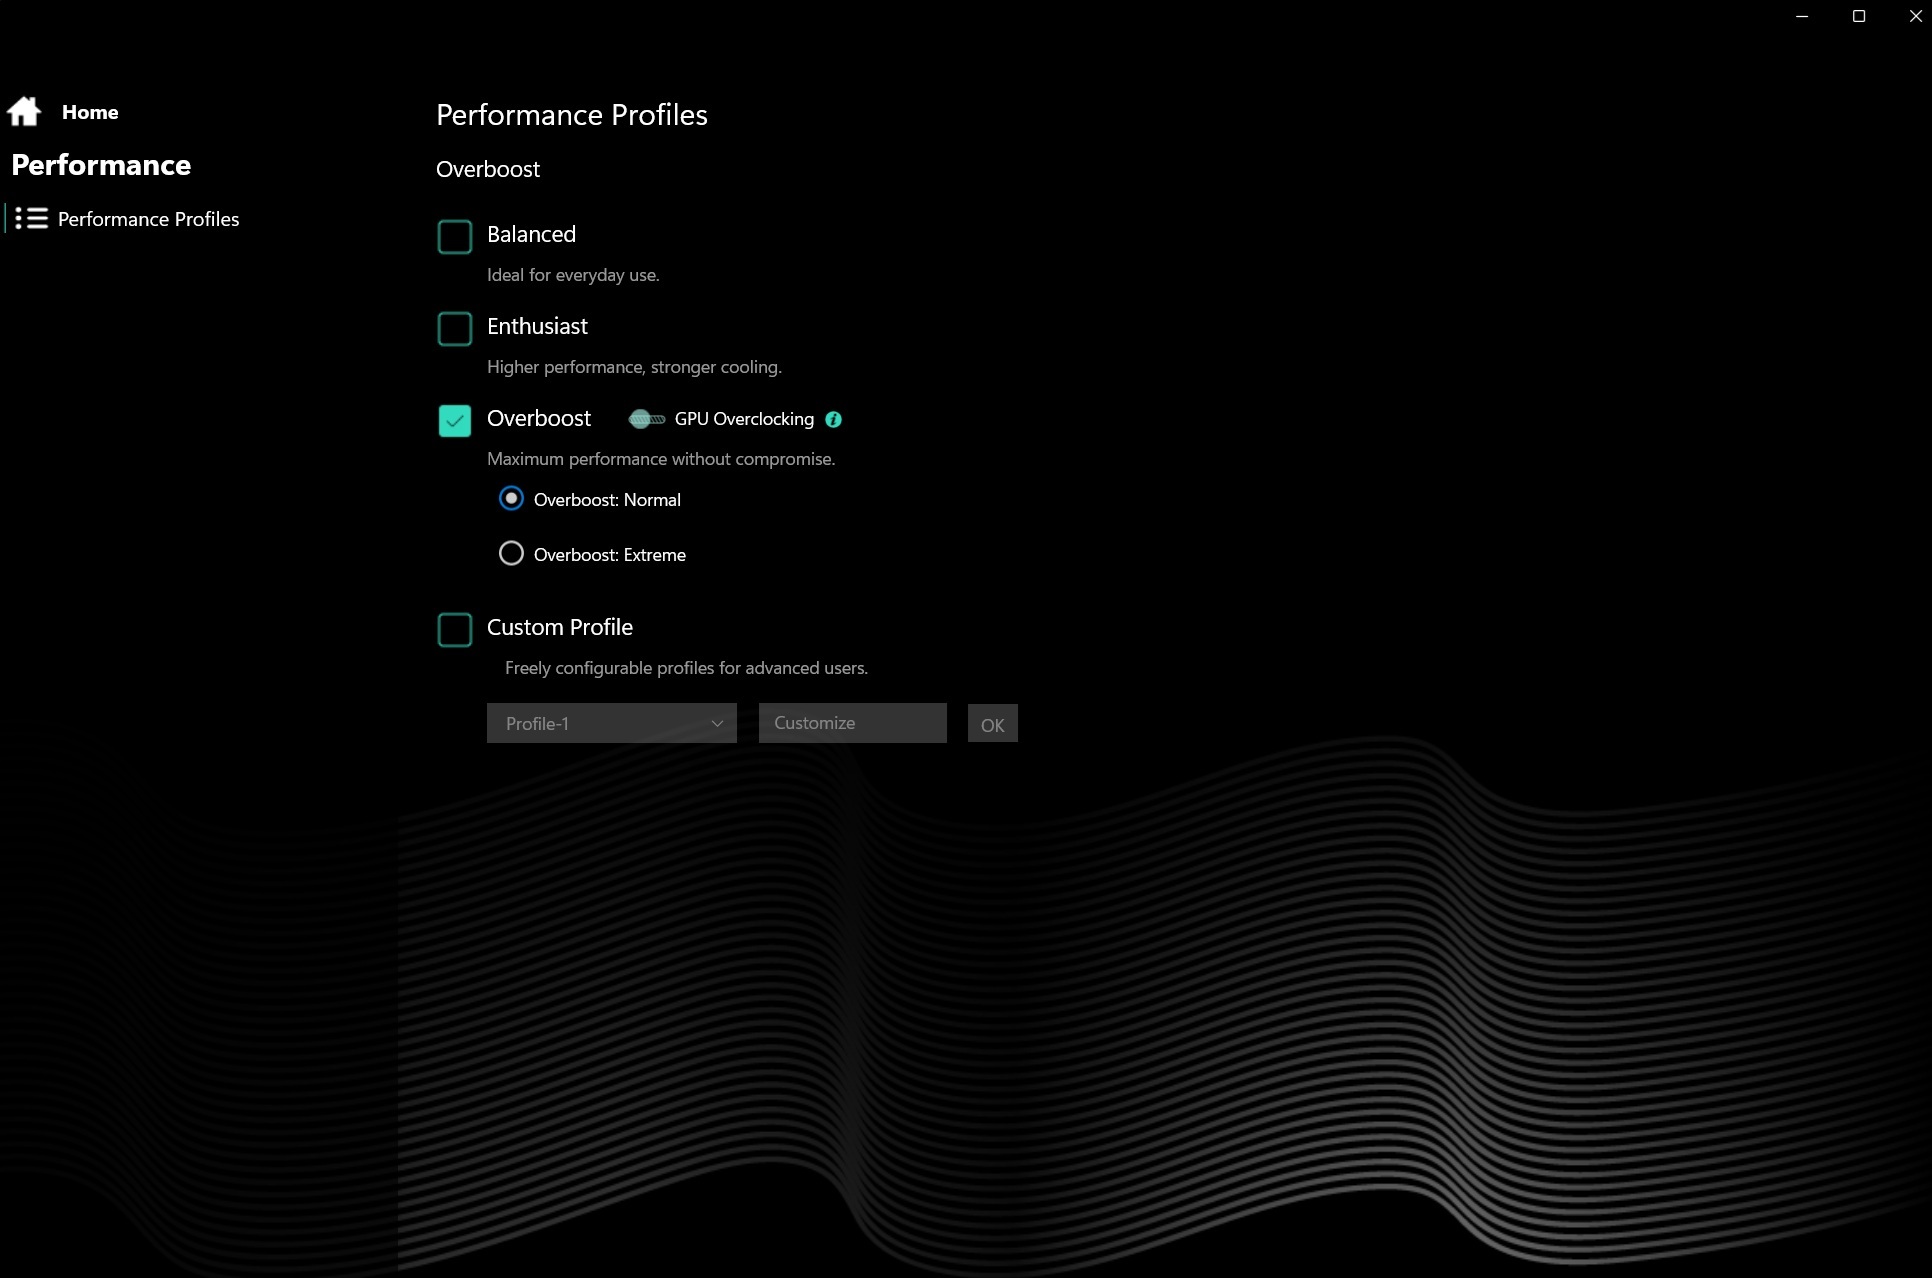
| Mode | Balanced | Enthusiast | Overboost |
| Cyberpunk 2077 Bruit | 33 dB(A) | 46 dB(A) | 49 dB(A) |
| Cyberpunk 2077 Fréquence (FHD/Ultra) | 35.4 fps | 78.6 fps | 85 fps |
| Consommation du GPU | ~30 W | ~80 W | ~110 W |
| CPU PL1 | 45 W | 54 W | 70 W |
| CPU PL2 | 65 W | 65 W | 105 W |
| Cinebench R15 Multi Score | 2075 Points | 2670 Points | 2815 Points |
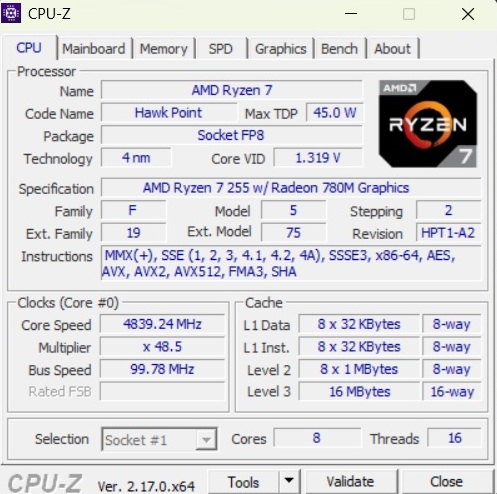
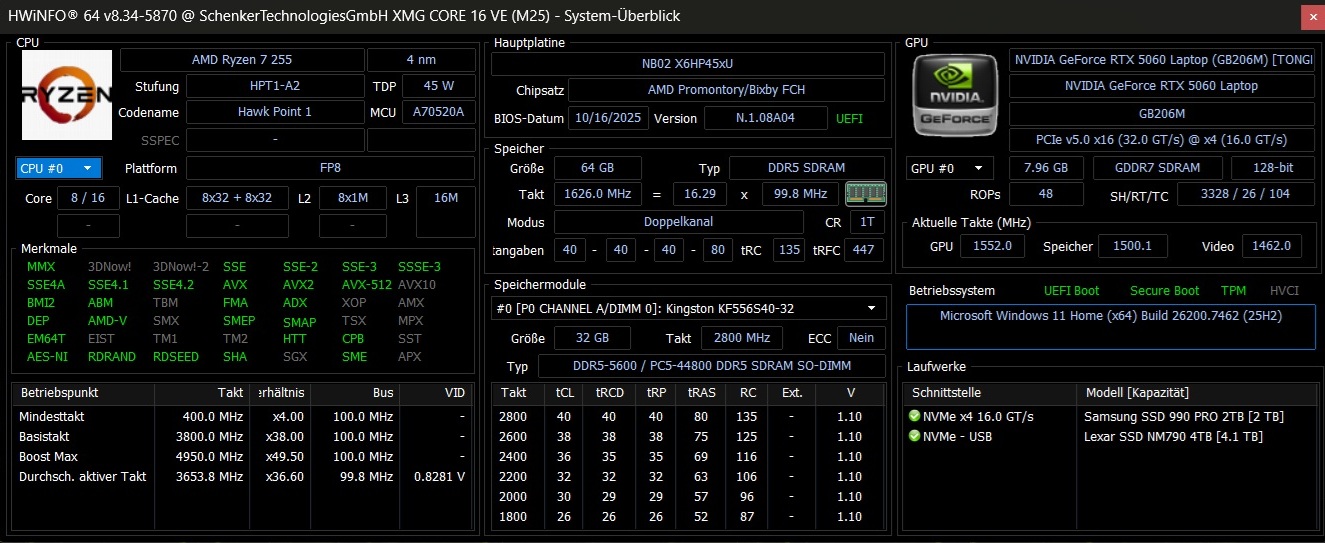
Processeur
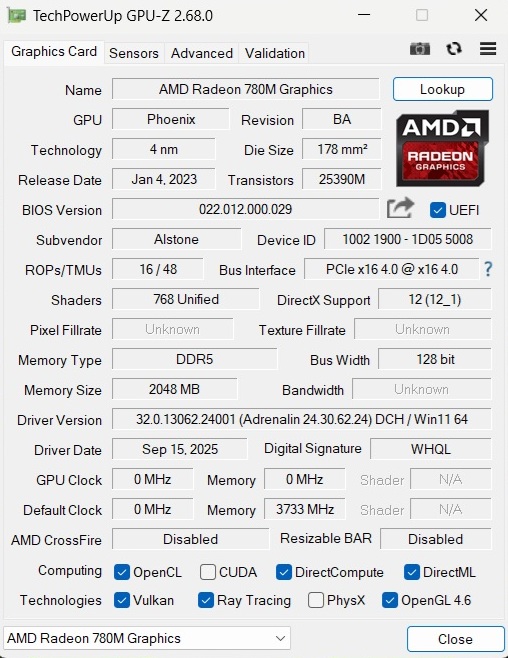
Les Ryzen 7 255 est encore rare dans les ordinateurs portables. Construite selon un procédé 4 nm, la puce offre huit cœurs et peut gérer jusqu'à 16 threads. Contrairement au Core i7-14700HX du Tulpar T6 V3.5, les performances restent constantes même en cas de charge prolongée, bien qu'elles restent inférieures à celles de processeurs tels que le Core Ultra 7 255HX, Core Ultra 9 275HX, Ryzen 9 8940HX et Ryzen AI 9 HX 370.
Test d'endurance multiple Cinebench R15
* ... Moindre est la valeur, meilleures sont les performances
AIDA64: FP32 Ray-Trace | FPU Julia | CPU SHA3 | CPU Queen | FPU SinJulia | FPU Mandel | CPU AES | CPU ZLib | FP64 Ray-Trace | CPU PhotoWorxx
| Performance rating | |
| HP Omen 16-ap0091ng | |
| Schenker XMG Core 16 M25 | |
| Lenovo Legion 7 16IAX10 | |
| Acer Predator Helios Neo 16S AI PHN16S-71-94L9 | |
| Moyenne de la classe Gaming | |
| Schenker XMG Core 16 VE M25 | |
| Moyenne AMD Ryzen 7 255 | |
| Tulpar T6 V3.5 | |
| AIDA64 / FP32 Ray-Trace | |
| HP Omen 16-ap0091ng | |
| Schenker XMG Core 16 M25 | |
| Moyenne de la classe Gaming (10227 - 85542, n=123, 2 dernières années) | |
| Lenovo Legion 7 16IAX10 | |
| Schenker XMG Core 16 VE M25 | |
| Acer Predator Helios Neo 16S AI PHN16S-71-94L9 | |
| Moyenne AMD Ryzen 7 255 (27202 - 28101, n=2) | |
| Tulpar T6 V3.5 | |
| AIDA64 / FPU Julia | |
| HP Omen 16-ap0091ng | |
| Lenovo Legion 7 16IAX10 | |
| Schenker XMG Core 16 M25 | |
| Acer Predator Helios Neo 16S AI PHN16S-71-94L9 | |
| Moyenne de la classe Gaming (51376 - 238426, n=123, 2 dernières années) | |
| Schenker XMG Core 16 VE M25 | |
| Moyenne AMD Ryzen 7 255 (110760 - 114847, n=2) | |
| Tulpar T6 V3.5 | |
| AIDA64 / CPU SHA3 | |
| HP Omen 16-ap0091ng | |
| Lenovo Legion 7 16IAX10 | |
| Acer Predator Helios Neo 16S AI PHN16S-71-94L9 | |
| Moyenne de la classe Gaming (2180 - 9817, n=123, 2 dernières années) | |
| Schenker XMG Core 16 M25 | |
| Schenker XMG Core 16 VE M25 | |
| Moyenne AMD Ryzen 7 255 (4831 - 5045, n=2) | |
| Tulpar T6 V3.5 | |
| AIDA64 / CPU Queen | |
| HP Omen 16-ap0091ng | |
| Lenovo Legion 7 16IAX10 | |
| Tulpar T6 V3.5 | |
| Schenker XMG Core 16 VE M25 | |
| Acer Predator Helios Neo 16S AI PHN16S-71-94L9 | |
| Moyenne AMD Ryzen 7 255 (118448 - 124528, n=2) | |
| Moyenne de la classe Gaming (49785 - 173351, n=121, 2 dernières années) | |
| Schenker XMG Core 16 M25 | |
| AIDA64 / FPU SinJulia | |
| HP Omen 16-ap0091ng | |
| Schenker XMG Core 16 M25 | |
| Schenker XMG Core 16 VE M25 | |
| Moyenne AMD Ryzen 7 255 (15213 - 15342, n=2) | |
| Moyenne de la classe Gaming (4424 - 33636, n=123, 2 dernières années) | |
| Lenovo Legion 7 16IAX10 | |
| Acer Predator Helios Neo 16S AI PHN16S-71-94L9 | |
| Tulpar T6 V3.5 | |
| AIDA64 / FPU Mandel | |
| HP Omen 16-ap0091ng | |
| Schenker XMG Core 16 M25 | |
| Lenovo Legion 7 16IAX10 | |
| Acer Predator Helios Neo 16S AI PHN16S-71-94L9 | |
| Moyenne de la classe Gaming (25115 - 128721, n=123, 2 dernières années) | |
| Schenker XMG Core 16 VE M25 | |
| Moyenne AMD Ryzen 7 255 (59408 - 61675, n=2) | |
| Tulpar T6 V3.5 | |
| AIDA64 / CPU AES | |
| HP Omen 16-ap0091ng | |
| Schenker XMG Core 16 M25 | |
| Lenovo Legion 7 16IAX10 | |
| Moyenne de la classe Gaming (39258 - 247074, n=123, 2 dernières années) | |
| Acer Predator Helios Neo 16S AI PHN16S-71-94L9 | |
| Schenker XMG Core 16 VE M25 | |
| Moyenne AMD Ryzen 7 255 (88405 - 90655, n=2) | |
| Tulpar T6 V3.5 | |
| AIDA64 / CPU ZLib | |
| Lenovo Legion 7 16IAX10 | |
| HP Omen 16-ap0091ng | |
| Acer Predator Helios Neo 16S AI PHN16S-71-94L9 | |
| Schenker XMG Core 16 M25 | |
| Moyenne de la classe Gaming (574 - 2531, n=123, 2 dernières années) | |
| Schenker XMG Core 16 VE M25 | |
| Moyenne AMD Ryzen 7 255 (1088 - 1134, n=2) | |
| Tulpar T6 V3.5 | |
| AIDA64 / FP64 Ray-Trace | |
| HP Omen 16-ap0091ng | |
| Schenker XMG Core 16 M25 | |
| Lenovo Legion 7 16IAX10 | |
| Moyenne de la classe Gaming (5509 - 45446, n=123, 2 dernières années) | |
| Acer Predator Helios Neo 16S AI PHN16S-71-94L9 | |
| Schenker XMG Core 16 VE M25 | |
| Moyenne AMD Ryzen 7 255 (13661 - 14945, n=2) | |
| Tulpar T6 V3.5 | |
| AIDA64 / CPU PhotoWorxx | |
| Acer Predator Helios Neo 16S AI PHN16S-71-94L9 | |
| Schenker XMG Core 16 M25 | |
| Lenovo Legion 7 16IAX10 | |
| Tulpar T6 V3.5 | |
| Schenker XMG Core 16 VE M25 | |
| Moyenne AMD Ryzen 7 255 (39932 - 45359, n=2) | |
| Moyenne de la classe Gaming (10805 - 62916, n=123, 2 dernières années) | |
| HP Omen 16-ap0091ng | |
Performance du système
Les performances globales du système ne sont pas remarquables - dans le sens positif du terme. Il n'y a pas eu de valeurs aberrantes pendant les tests.
PCMark 10: Score | Essentials | Productivity | Digital Content Creation
CrossMark: Overall | Productivity | Creativity | Responsiveness
WebXPRT 3: Overall
WebXPRT 4: Overall
Mozilla Kraken 1.1: Total
| Performance rating | |
| Acer Predator Helios Neo 16S AI PHN16S-71-94L9 | |
| Schenker XMG Core 16 M25 -4! | |
| Lenovo Legion 7 16IAX10 | |
| Moyenne de la classe Gaming | |
| Schenker XMG Core 16 VE M25 | |
| Moyenne AMD Ryzen 7 255, NVIDIA GeForce RTX 5060 Laptop | |
| HP Omen 16-ap0091ng | |
| Tulpar T6 V3.5 | |
| PCMark 10 / Score | |
| Acer Predator Helios Neo 16S AI PHN16S-71-94L9 | |
| Schenker XMG Core 16 VE M25 | |
| Moyenne AMD Ryzen 7 255, NVIDIA GeForce RTX 5060 Laptop (n=1) | |
| Moyenne de la classe Gaming (5828 - 10060, n=106, 2 dernières années) | |
| HP Omen 16-ap0091ng | |
| Lenovo Legion 7 16IAX10 | |
| Tulpar T6 V3.5 | |
| PCMark 10 / Essentials | |
| Lenovo Legion 7 16IAX10 | |
| Acer Predator Helios Neo 16S AI PHN16S-71-94L9 | |
| HP Omen 16-ap0091ng | |
| Moyenne de la classe Gaming (8810 - 12600, n=110, 2 dernières années) | |
| Tulpar T6 V3.5 | |
| Schenker XMG Core 16 VE M25 | |
| Moyenne AMD Ryzen 7 255, NVIDIA GeForce RTX 5060 Laptop (n=1) | |
| PCMark 10 / Productivity | |
| Schenker XMG Core 16 VE M25 | |
| Moyenne AMD Ryzen 7 255, NVIDIA GeForce RTX 5060 Laptop (n=1) | |
| Lenovo Legion 7 16IAX10 | |
| Moyenne de la classe Gaming (6662 - 16716, n=108, 2 dernières années) | |
| HP Omen 16-ap0091ng | |
| Acer Predator Helios Neo 16S AI PHN16S-71-94L9 | |
| Tulpar T6 V3.5 | |
| PCMark 10 / Digital Content Creation | |
| Acer Predator Helios Neo 16S AI PHN16S-71-94L9 | |
| Moyenne de la classe Gaming (7505 - 19351, n=108, 2 dernières années) | |
| HP Omen 16-ap0091ng | |
| Tulpar T6 V3.5 | |
| Schenker XMG Core 16 VE M25 | |
| Moyenne AMD Ryzen 7 255, NVIDIA GeForce RTX 5060 Laptop (n=1) | |
| Lenovo Legion 7 16IAX10 | |
| CrossMark / Overall | |
| Acer Predator Helios Neo 16S AI PHN16S-71-94L9 | |
| Lenovo Legion 7 16IAX10 | |
| Schenker XMG Core 16 M25 | |
| Moyenne de la classe Gaming (1247 - 2344, n=107, 2 dernières années) | |
| Schenker XMG Core 16 VE M25 | |
| Moyenne AMD Ryzen 7 255, NVIDIA GeForce RTX 5060 Laptop (n=1) | |
| HP Omen 16-ap0091ng | |
| Tulpar T6 V3.5 | |
| CrossMark / Productivity | |
| Acer Predator Helios Neo 16S AI PHN16S-71-94L9 | |
| Lenovo Legion 7 16IAX10 | |
| Moyenne de la classe Gaming (1299 - 2211, n=107, 2 dernières années) | |
| HP Omen 16-ap0091ng | |
| Schenker XMG Core 16 M25 | |
| Schenker XMG Core 16 VE M25 | |
| Moyenne AMD Ryzen 7 255, NVIDIA GeForce RTX 5060 Laptop (n=1) | |
| Tulpar T6 V3.5 | |
| CrossMark / Creativity | |
| Schenker XMG Core 16 M25 | |
| Acer Predator Helios Neo 16S AI PHN16S-71-94L9 | |
| Lenovo Legion 7 16IAX10 | |
| Tulpar T6 V3.5 | |
| Moyenne de la classe Gaming (1275 - 2729, n=107, 2 dernières années) | |
| HP Omen 16-ap0091ng | |
| Schenker XMG Core 16 VE M25 | |
| Moyenne AMD Ryzen 7 255, NVIDIA GeForce RTX 5060 Laptop (n=1) | |
| CrossMark / Responsiveness | |
| Lenovo Legion 7 16IAX10 | |
| Acer Predator Helios Neo 16S AI PHN16S-71-94L9 | |
| Moyenne de la classe Gaming (1030 - 2330, n=107, 2 dernières années) | |
| Schenker XMG Core 16 VE M25 | |
| Moyenne AMD Ryzen 7 255, NVIDIA GeForce RTX 5060 Laptop (n=1) | |
| Schenker XMG Core 16 M25 | |
| HP Omen 16-ap0091ng | |
| Tulpar T6 V3.5 | |
| WebXPRT 3 / Overall | |
| Schenker XMG Core 16 M25 | |
| Lenovo Legion 7 16IAX10 | |
| Acer Predator Helios Neo 16S AI PHN16S-71-94L9 | |
| HP Omen 16-ap0091ng | |
| Moyenne de la classe Gaming (237 - 532, n=110, 2 dernières années) | |
| Tulpar T6 V3.5 | |
| Schenker XMG Core 16 VE M25 | |
| Moyenne AMD Ryzen 7 255, NVIDIA GeForce RTX 5060 Laptop (n=1) | |
| WebXPRT 4 / Overall | |
| Schenker XMG Core 16 M25 | |
| Lenovo Legion 7 16IAX10 | |
| Acer Predator Helios Neo 16S AI PHN16S-71-94L9 | |
| Tulpar T6 V3.5 | |
| Moyenne de la classe Gaming (176.4 - 345, n=109, 2 dernières années) | |
| Schenker XMG Core 16 VE M25 | |
| Moyenne AMD Ryzen 7 255, NVIDIA GeForce RTX 5060 Laptop (n=1) | |
| HP Omen 16-ap0091ng | |
| Mozilla Kraken 1.1 / Total | |
| HP Omen 16-ap0091ng | |
| Schenker XMG Core 16 VE M25 | |
| Moyenne AMD Ryzen 7 255, NVIDIA GeForce RTX 5060 Laptop (n=1) | |
| Moyenne de la classe Gaming (397 - 674, n=116, 2 dernières années) | |
| Tulpar T6 V3.5 | |
| Lenovo Legion 7 16IAX10 | |
| Schenker XMG Core 16 M25 | |
| Acer Predator Helios Neo 16S AI PHN16S-71-94L9 | |
* ... Moindre est la valeur, meilleures sont les performances
| PCMark 10 Score | 8166 points | |
Aide | ||
| AIDA64 / Memory Copy | |
| Lenovo Legion 7 16IAX10 | |
| Acer Predator Helios Neo 16S AI PHN16S-71-94L9 | |
| Tulpar T6 V3.5 | |
| Schenker XMG Core 16 M25 | |
| Moyenne de la classe Gaming (21750 - 108104, n=123, 2 dernières années) | |
| Schenker XMG Core 16 VE M25 | |
| Moyenne AMD Ryzen 7 255 (67909 - 69008, n=2) | |
| HP Omen 16-ap0091ng | |
| AIDA64 / Memory Read | |
| Acer Predator Helios Neo 16S AI PHN16S-71-94L9 | |
| Tulpar T6 V3.5 | |
| Lenovo Legion 7 16IAX10 | |
| Schenker XMG Core 16 M25 | |
| Moyenne de la classe Gaming (22956 - 104349, n=123, 2 dernières années) | |
| Moyenne AMD Ryzen 7 255 (60500 - 61434, n=2) | |
| Schenker XMG Core 16 VE M25 | |
| HP Omen 16-ap0091ng | |
| AIDA64 / Memory Write | |
| Acer Predator Helios Neo 16S AI PHN16S-71-94L9 | |
| Schenker XMG Core 16 VE M25 | |
| Moyenne AMD Ryzen 7 255 (82539 - 83452, n=2) | |
| Schenker XMG Core 16 M25 | |
| Lenovo Legion 7 16IAX10 | |
| Tulpar T6 V3.5 | |
| Moyenne de la classe Gaming (22297 - 133486, n=123, 2 dernières années) | |
| HP Omen 16-ap0091ng | |
| AIDA64 / Memory Latency | |
| Acer Predator Helios Neo 16S AI PHN16S-71-94L9 | |
| Lenovo Legion 7 16IAX10 | |
| Moyenne de la classe Gaming (75.3 - 259, n=123, 2 dernières années) | |
| Moyenne AMD Ryzen 7 255 (87 - 91.2, n=2) | |
| Schenker XMG Core 16 VE M25 | |
| Schenker XMG Core 16 M25 | |
| Tulpar T6 V3.5 | |
| HP Omen 16-ap0091ng | |
* ... Moindre est la valeur, meilleures sont les performances
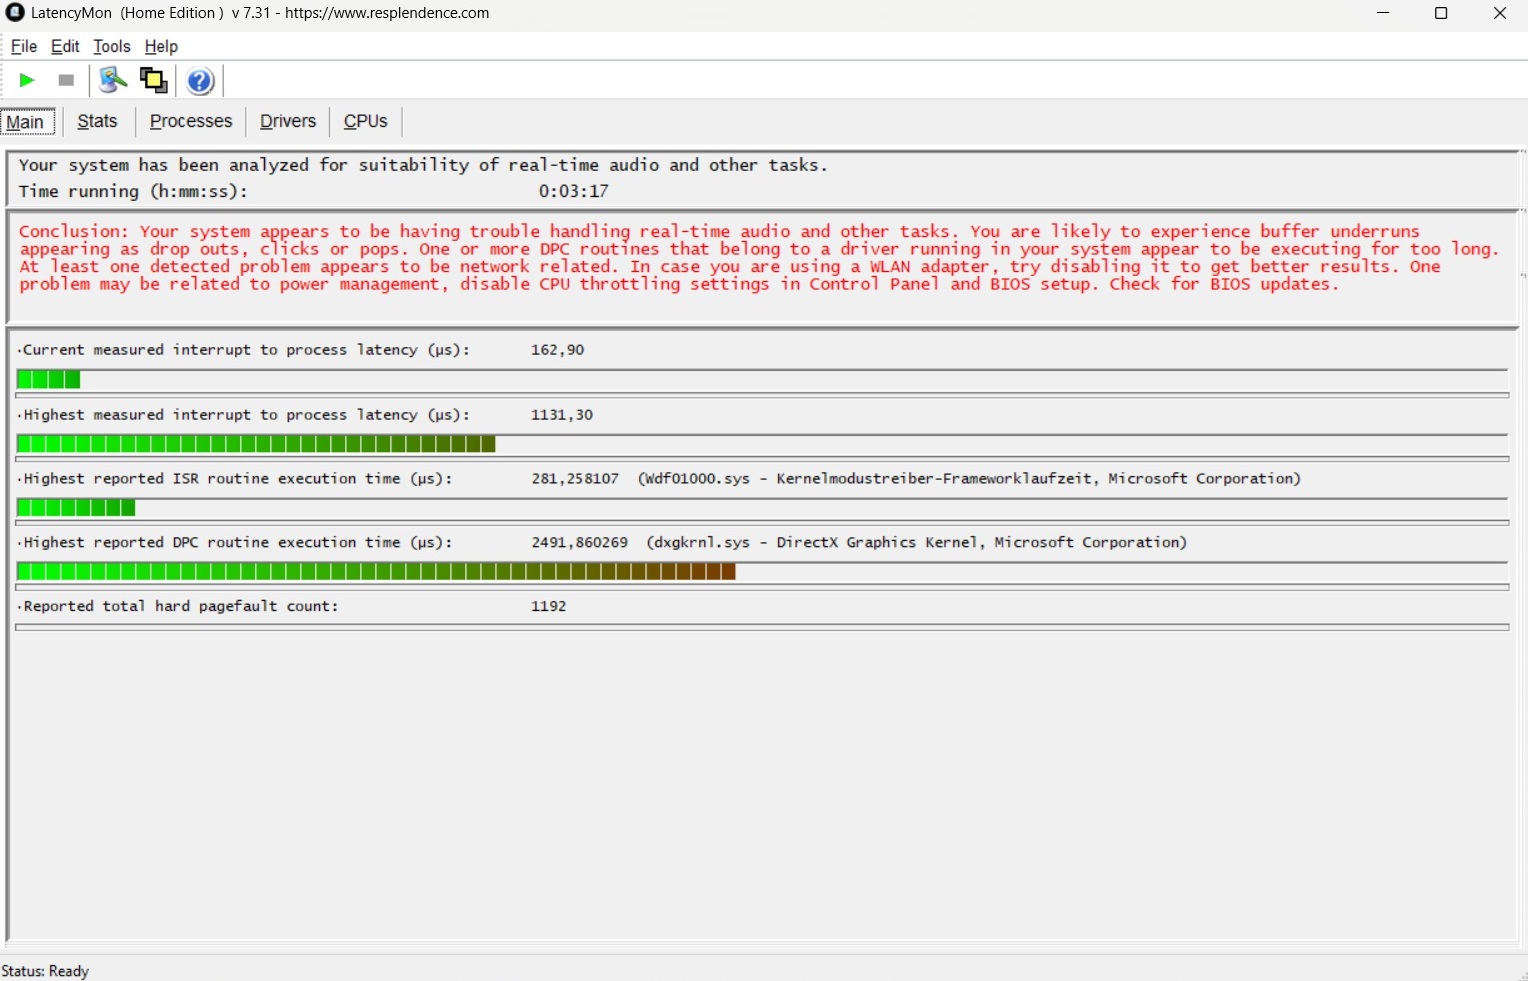
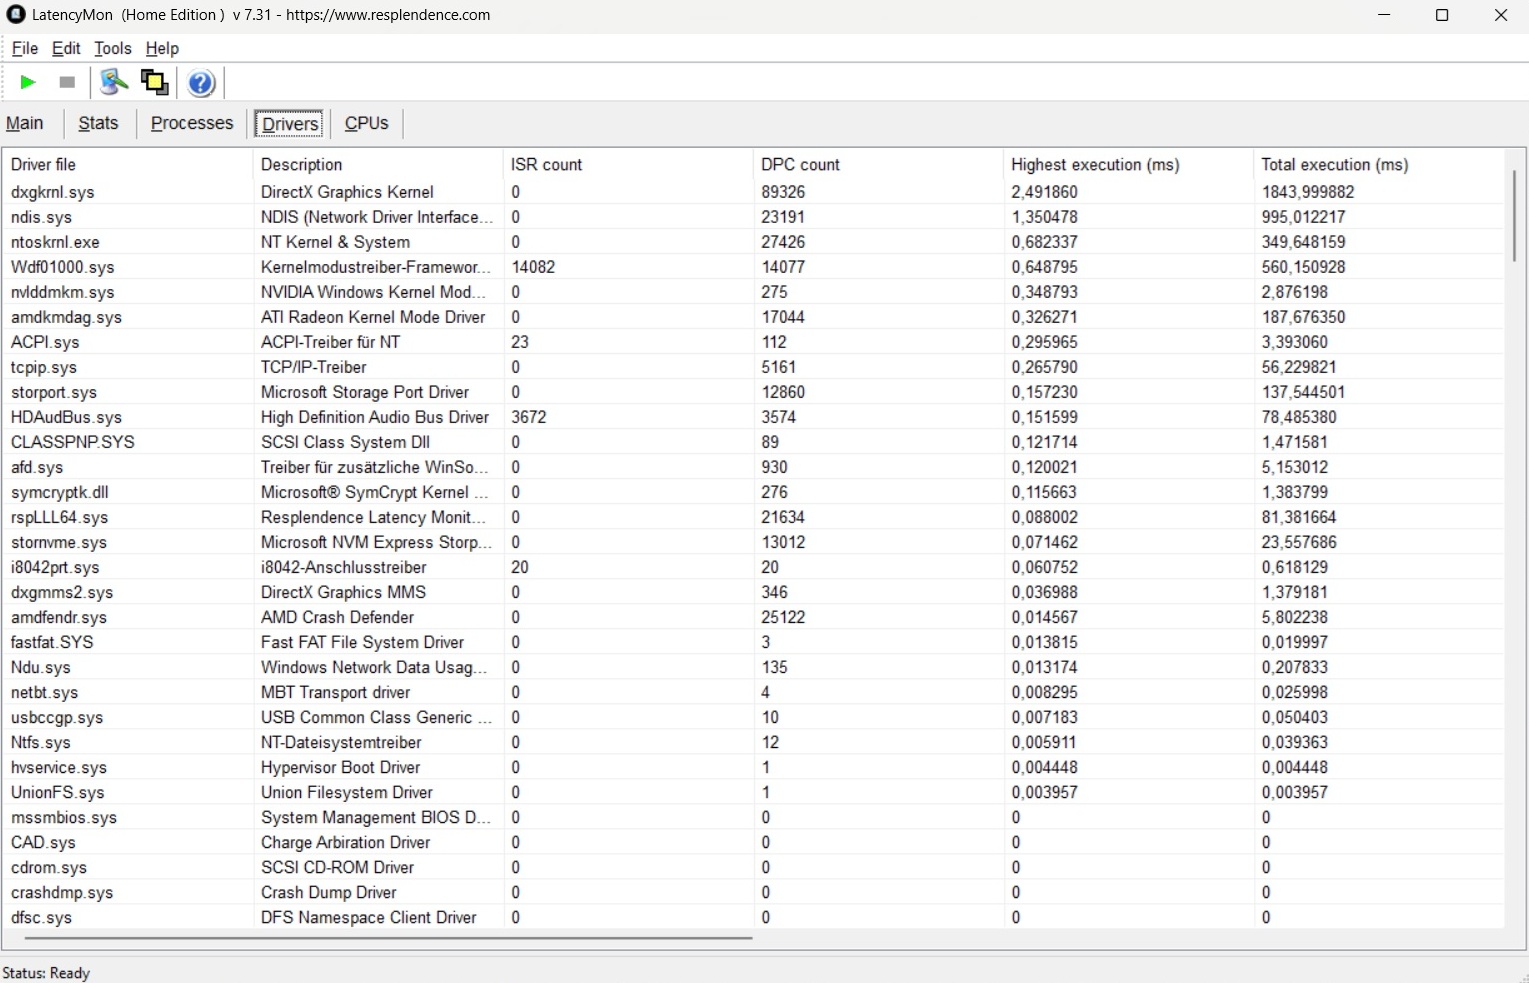
Latences DPC
En termes de latence, le XMG Core 16 VE se situe carrément en milieu de peloton parmi ses concurrents.
| DPC Latencies / LatencyMon - interrupt to process latency (max), Web, Youtube, Prime95 | |
| Tulpar T6 V3.5 | |
| Acer Predator Helios Neo 16S AI PHN16S-71-94L9 | |
| HP Omen 16-ap0091ng | |
| Schenker XMG Core 16 VE M25 | |
| Lenovo Legion 7 16IAX10 | |
| Schenker XMG Core 16 M25 | |
* ... Moindre est la valeur, meilleures sont les performances
Dispositifs de stockage
L'un des points forts de notre appareil de test était le SSD relativement rapide. Le 990 Pro de Samsung a obtenu un excellent score global dans le benchmark AS SSD.

* ... Moindre est la valeur, meilleures sont les performances
Performances en lecture continue : Boucle de lecture DiskSpd, profondeur de la file d'attente 8
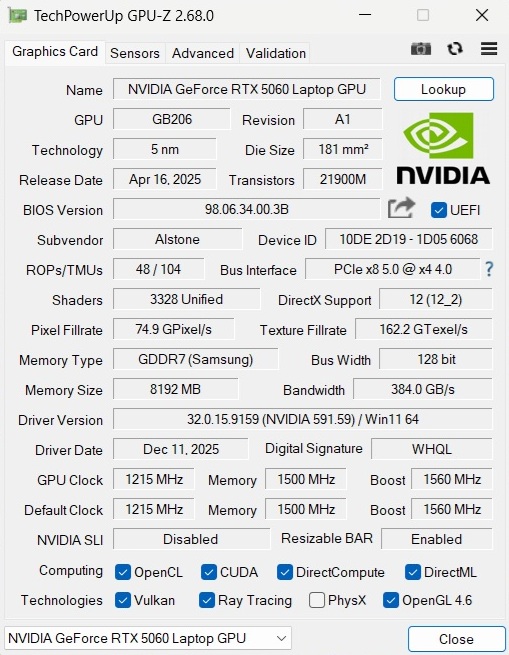
Performance du GPU
| 3DMark 11 Performance | 33268 points | |
| 3DMark Cloud Gate Standard Score | 50474 points | |
| 3DMark Fire Strike Score | 25692 points | |
| 3DMark Time Spy Score | 11440 points | |
Aide | ||
* ... Moindre est la valeur, meilleures sont les performances
Performances des jeux
Sans DLSS et autres technologies similaires, l'exécution à la résolution native (2 560 × 1 440) peut parfois s'avérer un peu exigeante. Les titres très gourmands en ressources CPU, tels que The Outer Worlds 2, Anno 117 et Black Ops 7 ne fonctionnent sans problème qu'avec l'upscaling activé ou avec des paramètres réduits.
La situation est meilleure dans ARC Raiderspar exemple : avec les paramètres maximums, le jeu offre un solide 48 FPS. À titre de comparaison, la qualité DLSS augmente les performances jusqu'à 76 FPS, tandis que la génération d'images 4× permet d'atteindre 174 FPS sur le papier (la fluidité perçue dans le monde réel peut varier).
| Final Fantasy XV Benchmark - 1920x1080 High Quality | |
| Schenker XMG Core 16 M25 | |
| Moyenne de la classe Gaming (37.9 - 215, n=117, 2 dernières années) | |
| Lenovo Legion 7 16IAX10 | |
| Moyenne NVIDIA GeForce RTX 5060 Laptop (107 - 133.6, n=10) | |
| HP Omen 16-ap0091ng | |
| Tulpar T6 V3.5 | |
| Schenker XMG Core 16 VE M25 | |
| Bas | Moyen | Élevé | Ultra | QHD | |
|---|---|---|---|---|---|
| Dota 2 Reborn (2015) | 145.2 | 140.7 | 133.2 | ||
| Final Fantasy XV Benchmark (2018) | 143.9 | 107 | |||
| X-Plane 11.11 (2018) | 97.7 | 79.6 | |||
| Baldur's Gate 3 (2023) | 114.2 | 95.4 | 90.7 | ||
| Cyberpunk 2077 (2023) | 107.6 | 93.4 | 85 | ||
| The Outer Worlds 2 (2025) | 91.7 | 72.7 | 40.9 | 26.7 | |
| ARC Raiders (2025) | 136.7 | 104.9 | 70.2 | 47.8 | |
| Anno 117: Pax Romana (2025) | 91.3 | 67 | 33.9 | 23.4 | |
| Call of Duty Black Ops 7 (2025) | 138 | 103 | 38 | 18 |
| ARC Raiders | |
| 1920x1080 Epic Preset + Epic Raytracing AA:TSR | |
| Acer Predator Helios Neo 16S AI PHN16S-71-94L9 | |
| Schenker XMG Core 16 VE M25 | |
| Moyenne de la classe Gaming (43.5 - 89.5, n=10, 2 dernières années) | |
| Moyenne NVIDIA GeForce RTX 5060 Laptop (55 - 70.2, n=4) | |
| Tulpar T6 V3.5 | |
| 2560x1440 Epic Preset + Epic Raytracing AA:TSR | |
| Acer Predator Helios Neo 16S AI PHN16S-71-94L9 | |
| Moyenne de la classe Gaming (47.8 - 64, n=4, 2 dernières années) | |
| Schenker XMG Core 16 VE M25 | |
| Moyenne NVIDIA GeForce RTX 5060 Laptop (n=1) | |
| Call of Duty Black Ops 7 | |
| 1920x1080 Extreme Preset + Raytracing | |
| Acer Predator Helios Neo 16S AI PHN16S-71-94L9 | |
| Moyenne de la classe Gaming (24 - 60, n=10, 2 dernières années) | |
| Schenker XMG Core 16 VE M25 | |
| Moyenne NVIDIA GeForce RTX 5060 Laptop (32 - 38, n=4) | |
| Tulpar T6 V3.5 | |
| 2560x1440 Extreme Preset + Raytracing | |
| Acer Predator Helios Neo 16S AI PHN16S-71-94L9 | |
| Moyenne de la classe Gaming (18 - 39, n=6, 2 dernières années) | |
| Moyenne NVIDIA GeForce RTX 5060 Laptop (18 - 23, n=2) | |
| Schenker XMG Core 16 VE M25 | |
Cyberpunk 2077 ultra FPS chart
Émissions et énergie
Émissions sonores
En charge, les niveaux de bruit sont similaires à ceux du HP Omen 16 et du Core 16 "normal". À 49 dB(A) dans Cyberpunk 2077les ventilateurs sont clairement audibles, mais pas excessivement bruyants. Au ralenti, l'ordinateur portable de 16 pouces reste agréablement silencieux. Les ventilateurs s'arrêtent complètement ou fonctionnent à un niveau assez discret.
Degré de la nuisance sonore
| Au repos |
| 24 / 27 / 32 dB(A) |
| Fortement sollicité |
| 41 / 50 dB(A) |
 | ||
30 dB silencieux 40 dB(A) audible 50 dB(A) bruyant |
||
min: | ||
| Schenker XMG Core 16 VE M25 Ryzen 7 255, GeForce RTX 5060 Laptop | Tulpar T6 V3.5 i7-14700HX, GeForce RTX 5060 Laptop | HP Omen 16-ap0091ng R9 8940HX, GeForce RTX 5060 Laptop | Lenovo Legion 7 16IAX10 Ultra 7 255HX, GeForce RTX 5060 Laptop | Schenker XMG Core 16 M25 Ryzen AI 9 HX 370, GeForce RTX 5070 Laptop | Acer Predator Helios Neo 16S AI PHN16S-71-94L9 Ultra 9 275HX, GeForce RTX 5070 Ti Laptop | |
|---|---|---|---|---|---|---|
| Noise | -7% | 1% | 1% | 3% | -9% | |
| arrêt / environnement * (dB) | 24 | 24 -0% | 23 4% | 23.9 -0% | 24.8 -3% | 24 -0% |
| Idle Minimum * (dB) | 24 | 26 -8% | 23 4% | 24 -0% | 24.8 -3% | 24 -0% |
| Idle Average * (dB) | 27 | 29 -7% | 23 15% | 26 4% | 24.8 8% | 30 -11% |
| Idle Maximum * (dB) | 32 | 31 3% | 27.64 14% | 29.4 8% | 27.1 15% | 35 -9% |
| Load Average * (dB) | 41 | 52 -27% | 49.5 -21% | 35.4 14% | 40.2 2% | 53 -29% |
| Cyberpunk 2077 ultra * (dB) | 49 | 52 -6% | 49.5 -1% | 54.6 -11% | 49.2 -0% | 52 -6% |
| Load Maximum * (dB) | 50 | 53 -6% | 52.73 -5% | 54.7 -9% | 49.2 2% | 54 -8% |
* ... Moindre est la valeur, meilleures sont les performances
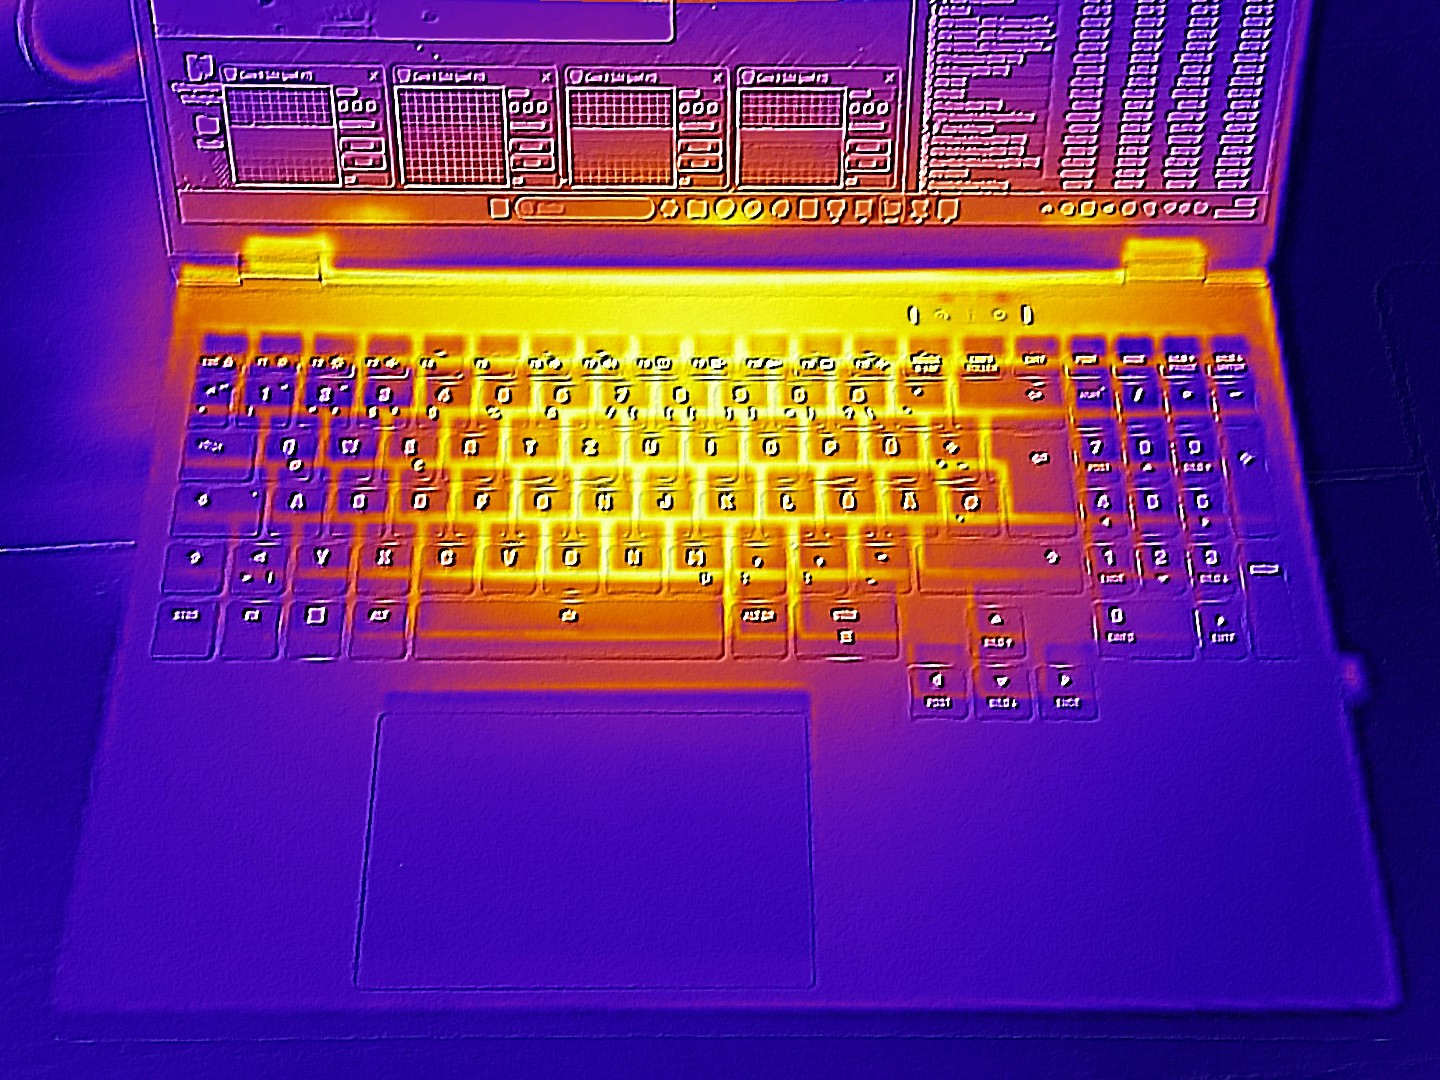
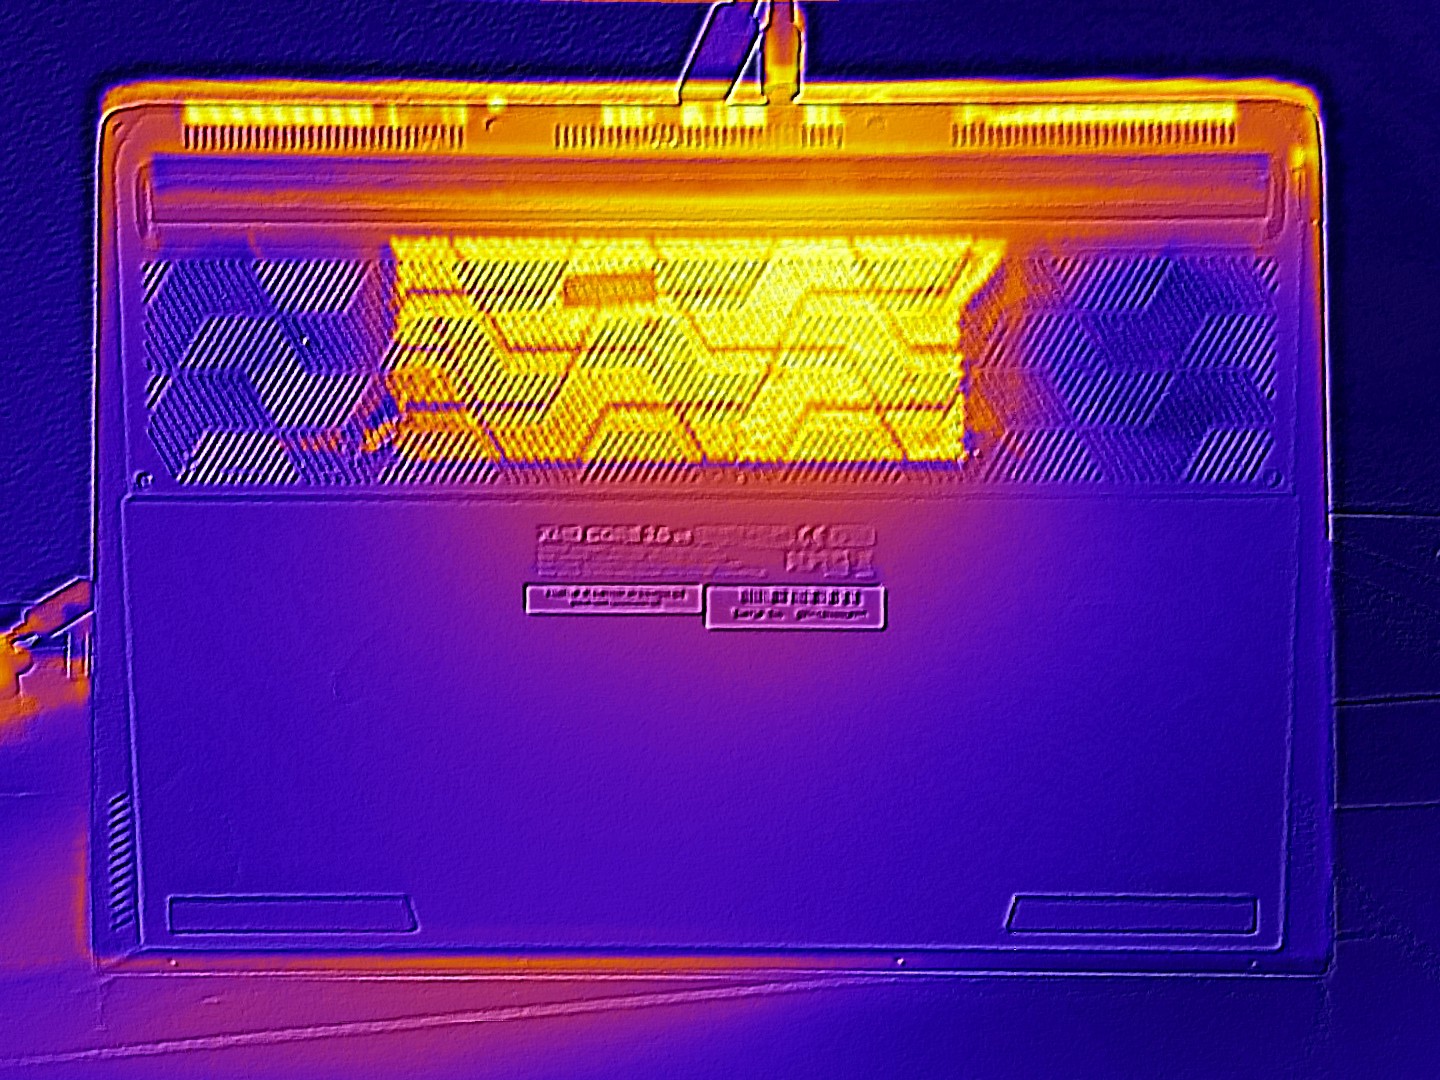
Température
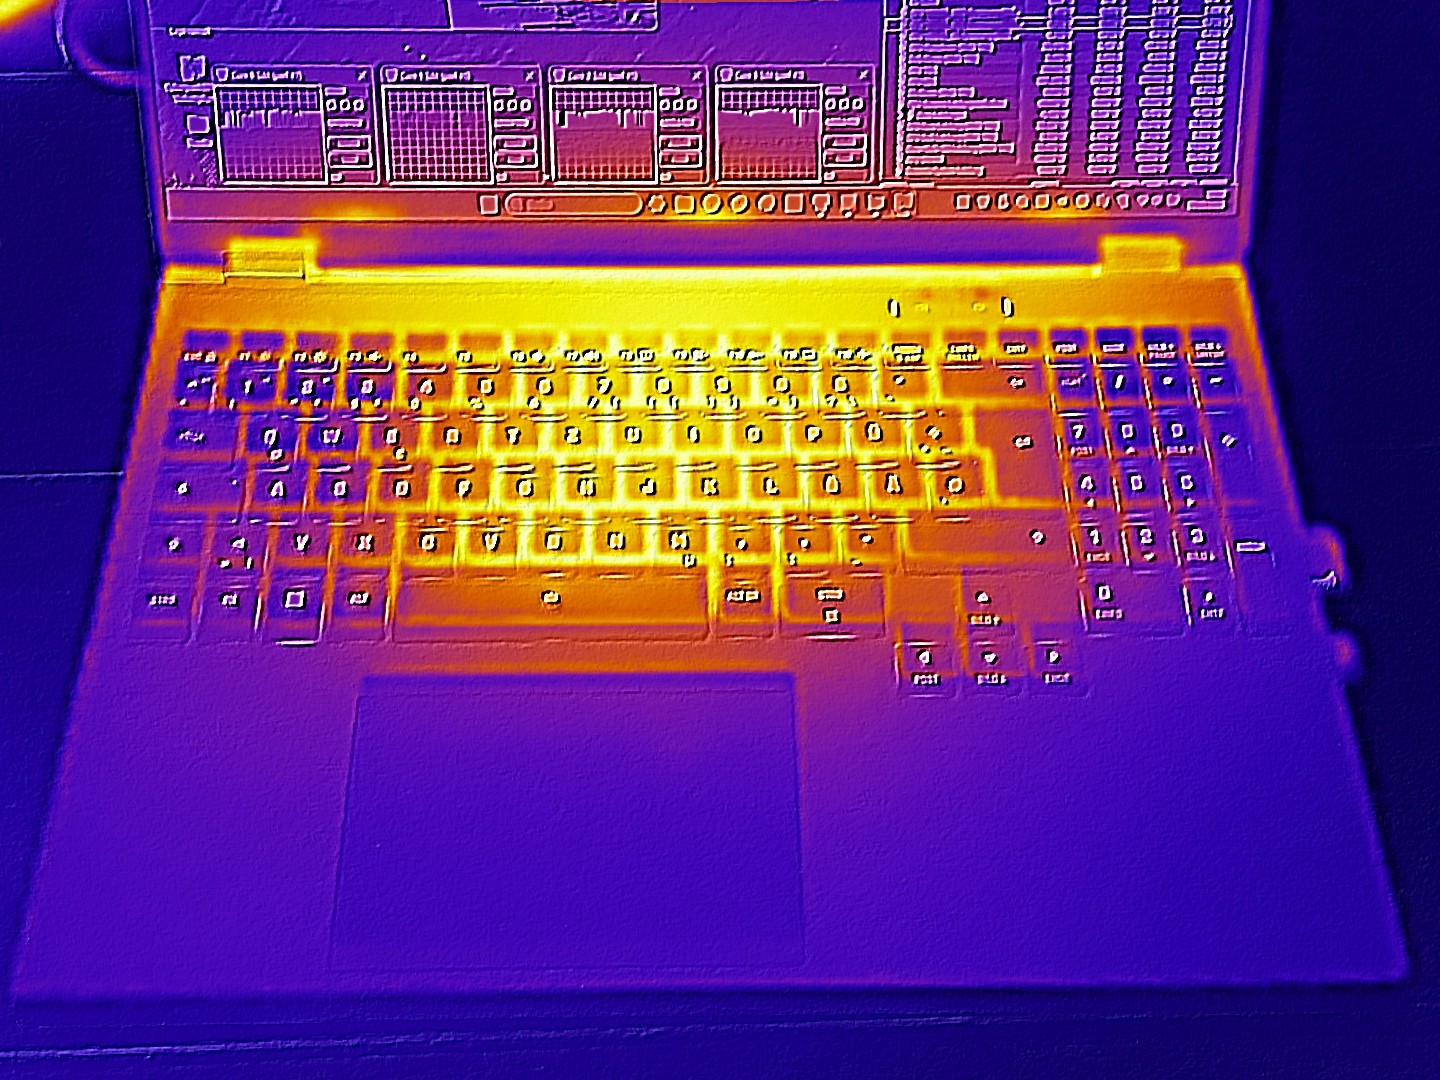
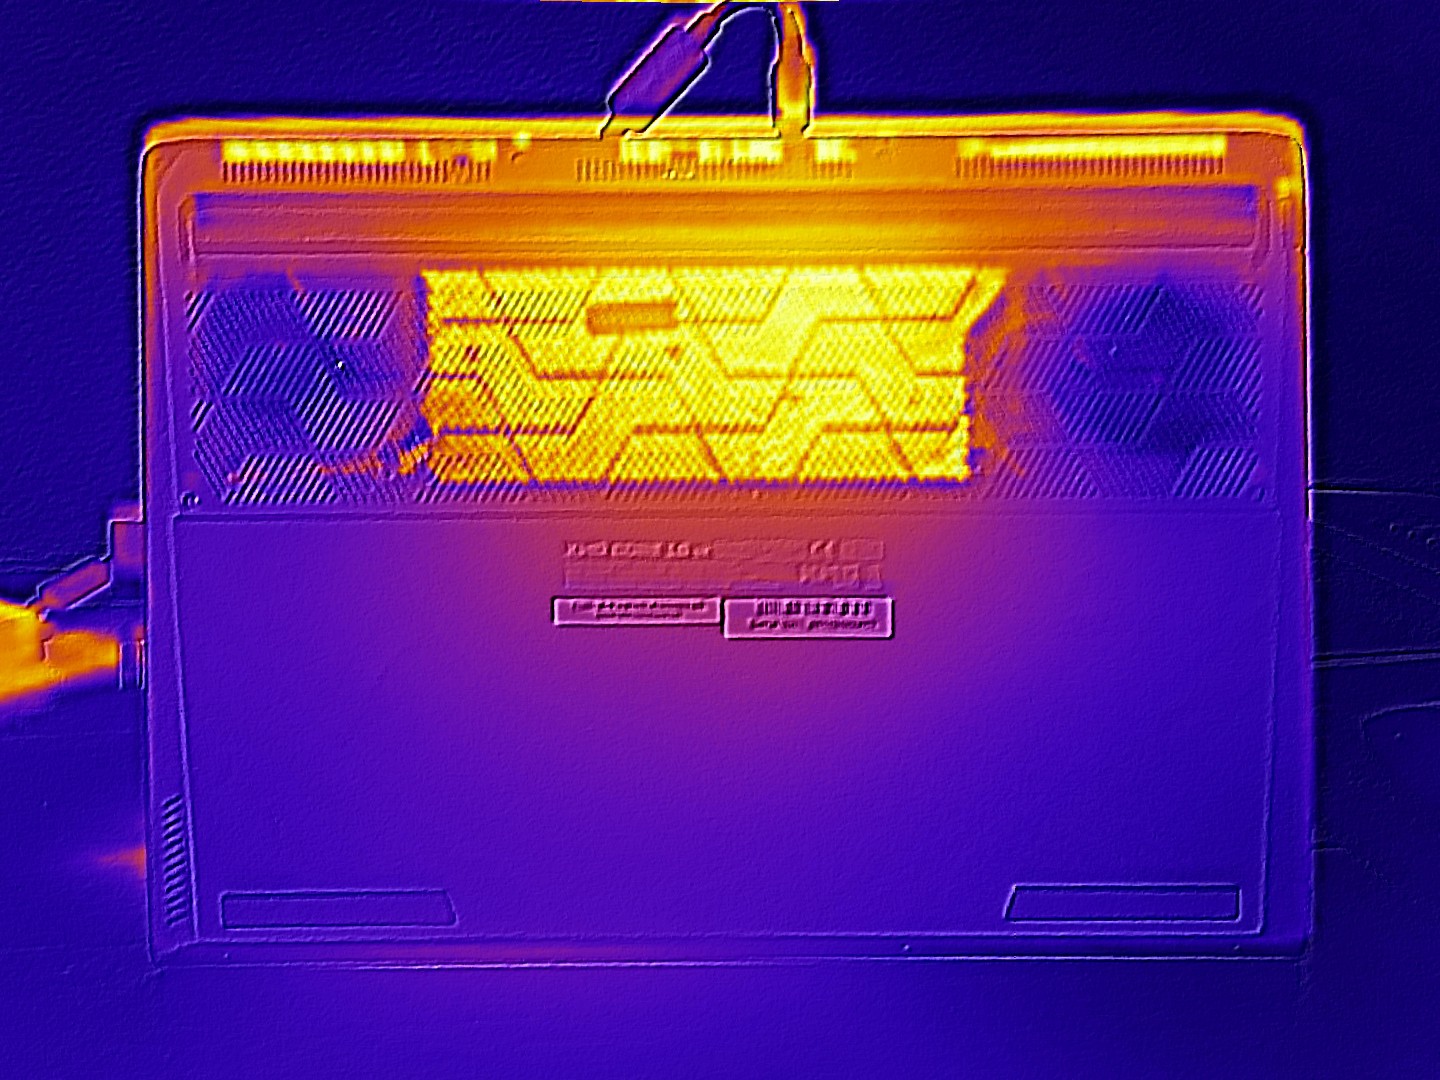
Sous charge, le dessous du châssis chauffe davantage, atteignant un maximum de 57 °C, tandis que le dessus culmine à 46 °C. Au repos, le châssis se maintient à une température modérée de 25 à 31 °C.
(-) La température maximale du côté supérieur est de 46 °C / 115 F, par rapport à la moyenne de 40.4 °C / 105 F, allant de 21.2 à 68.8 °C pour la classe Gaming.
(-) Le fond chauffe jusqu'à un maximum de 57 °C / 135 F, contre une moyenne de 43.3 °C / 110 F
(+) En utilisation inactive, la température moyenne du côté supérieur est de 27.3 °C / 81 F, par rapport à la moyenne du dispositif de 33.9 °C / 93 F.
(-) 3: The average temperature for the upper side is 39.7 °C / 103 F, compared to the average of 33.9 °C / 93 F for the class Gaming.
(+) Les repose-poignets et le pavé tactile sont plus froids que la température de la peau avec un maximum de 31 °C / 87.8 F et sont donc froids au toucher.
(-) La température moyenne de la zone de l'appui-paume de dispositifs similaires était de 28.8 °C / 83.8 F (-2.2 °C / #-4 F).
| Schenker XMG Core 16 VE M25 Ryzen 7 255, GeForce RTX 5060 Laptop | Tulpar T6 V3.5 i7-14700HX, GeForce RTX 5060 Laptop | HP Omen 16-ap0091ng R9 8940HX, GeForce RTX 5060 Laptop | Lenovo Legion 7 16IAX10 Ultra 7 255HX, GeForce RTX 5060 Laptop | Schenker XMG Core 16 M25 Ryzen AI 9 HX 370, GeForce RTX 5070 Laptop | Acer Predator Helios Neo 16S AI PHN16S-71-94L9 Ultra 9 275HX, GeForce RTX 5070 Ti Laptop | |
|---|---|---|---|---|---|---|
| Heat | 4% | 13% | -4% | 0% | 3% | |
| Maximum Upper Side * (°C) | 46 | 40 13% | 36 22% | 47 -2% | 46.7 -2% | 47 -2% |
| Maximum Bottom * (°C) | 57 | 47 18% | 37 35% | 44 23% | 58.5 -3% | 55 4% |
| Idle Upper Side * (°C) | 29 | 30 -3% | 30 -3% | 35.6 -23% | 28.3 2% | 28 3% |
| Idle Bottom * (°C) | 31 | 35 -13% | 32 -3% | 35.2 -14% | 29.9 4% | 29 6% |
* ... Moindre est la valeur, meilleures sont les performances
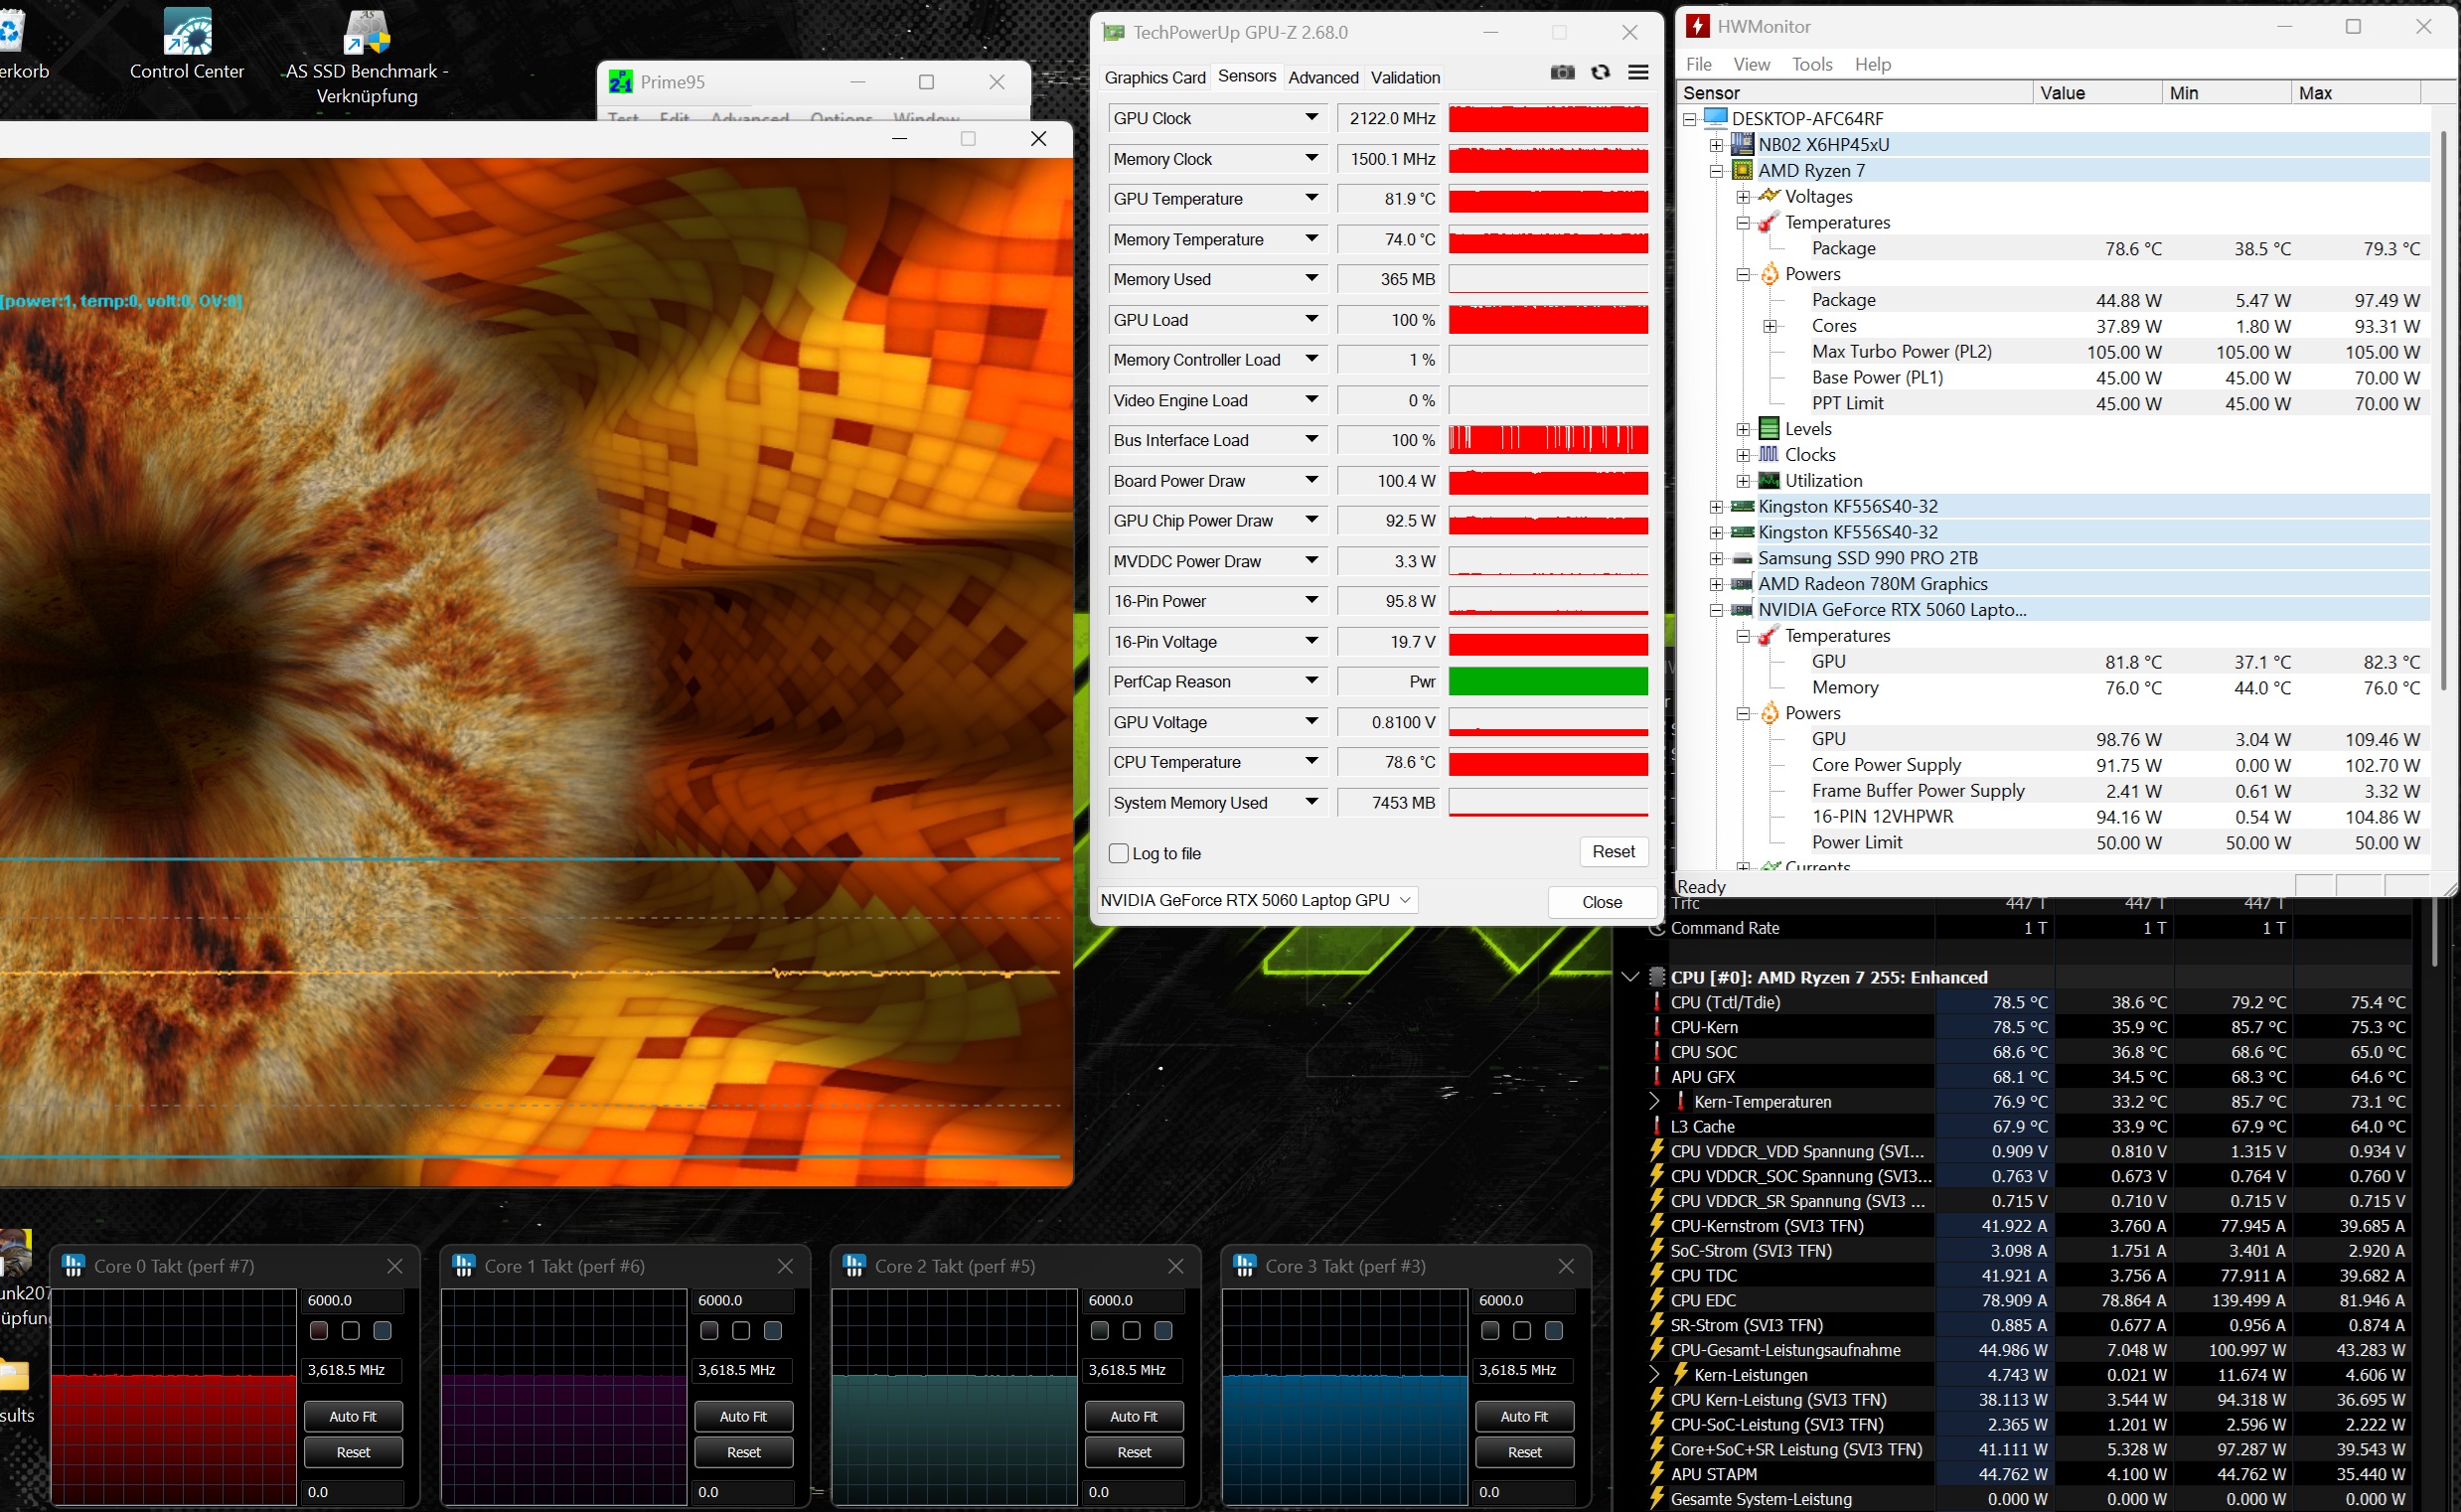
Épreuve d'effort
Les composants ne meurent pas non plus de chaleur. Notre test de stress avec les outils Furmark et Prime a amené le CPU et le GPU à un peu moins de 80 °C.
Intervenants
La qualité du son est plutôt faible. Le Lenovo Legion 7 est nettement plus performant dans ce domaine.
Schenker XMG Core 16 VE M25 analyse audio
(±) | le niveau sonore du haut-parleur est moyen mais bon (76# dB)
Basses 100 - 315 Hz
(-) | presque aucune basse - en moyenne 19.1% plus bas que la médiane
(±) | la linéarité des basses est moyenne (10.5% delta à la fréquence précédente)
Médiums 400 - 2000 Hz
(±) | médiane supérieure - en moyenne 6.3% supérieure à la médiane
(±) | la linéarité des médiums est moyenne (7.2% delta à la fréquence précédente)
Aiguës 2 - 16 kHz
(+) | des sommets équilibrés - à seulement 1.8% de la médiane
(+) | les aigus sont linéaires (6% delta à la fréquence précédente)
Globalement 100 - 16 000 Hz
(±) | la linéarité du son global est moyenne (18.7% de différence avec la médiane)
Par rapport à la même classe
» 61% de tous les appareils testés de cette catégorie étaient meilleurs, 8% similaires, 31% pires
» Le meilleur avait un delta de 6%, la moyenne était de 18%, le pire était de 132%.
Par rapport à tous les appareils testés
» 42% de tous les appareils testés étaient meilleurs, 8% similaires, 50% pires
» Le meilleur avait un delta de 4%, la moyenne était de 24%, le pire était de 134%.
Lenovo Legion 7 16IAX10 analyse audio
(±) | le niveau sonore du haut-parleur est moyen mais bon (77.6# dB)
Basses 100 - 315 Hz
(±) | basse réduite - en moyenne 9.5% inférieure à la médiane
(±) | la linéarité des basses est moyenne (9.8% delta à la fréquence précédente)
Médiums 400 - 2000 Hz
(+) | médiane équilibrée - seulement 1.5% de la médiane
(+) | les médiums sont linéaires (4% delta à la fréquence précédente)
Aiguës 2 - 16 kHz
(+) | des sommets équilibrés - à seulement 3% de la médiane
(+) | les aigus sont linéaires (4.9% delta à la fréquence précédente)
Globalement 100 - 16 000 Hz
(+) | le son global est linéaire (11.5% différence à la médiane)
Par rapport à la même classe
» 9% de tous les appareils testés de cette catégorie étaient meilleurs, 3% similaires, 88% pires
» Le meilleur avait un delta de 6%, la moyenne était de 18%, le pire était de 132%.
Par rapport à tous les appareils testés
» 7% de tous les appareils testés étaient meilleurs, 2% similaires, 90% pires
» Le meilleur avait un delta de 4%, la moyenne était de 24%, le pire était de 134%.
Consommation d'énergie
Consommation d'énergie
Avec 10 à 19 watts au repos et 181 à 246 watts en charge, la consommation d'énergie est conforme aux attentes.
| Éteint/en veille | |
| Au repos | |
| Fortement sollicité |
|
Légende:
min: | |
| Schenker XMG Core 16 VE M25 Ryzen 7 255, GeForce RTX 5060 Laptop | Tulpar T6 V3.5 i7-14700HX, GeForce RTX 5060 Laptop | HP Omen 16-ap0091ng R9 8940HX, GeForce RTX 5060 Laptop | Lenovo Legion 7 16IAX10 Ultra 7 255HX, GeForce RTX 5060 Laptop | Schenker XMG Core 16 M25 Ryzen AI 9 HX 370, GeForce RTX 5070 Laptop | Acer Predator Helios Neo 16S AI PHN16S-71-94L9 Ultra 9 275HX, GeForce RTX 5070 Ti Laptop | Moyenne de la classe Gaming | |
|---|---|---|---|---|---|---|---|
| Power Consumption | 8% | 11% | -12% | 5% | 22% | -28% | |
| Idle Minimum * (Watt) | 10.5 | 6.7 36% | 7.8 26% | 9.4 10% | 7.4 30% | 3.9 63% | 13.5 ? -29% |
| Idle Average * (Watt) | 13 | 13.7 -5% | 8.8 32% | 10.6 18% | 14.9 -15% | 11 15% | 19.3 ? -48% |
| Idle Maximum * (Watt) | 18.8 | 21.8 -16% | 21.5 -14% | 36.4 -94% | 15.2 19% | 16.9 10% | 24.7 ? -31% |
| Cyberpunk 2077 ultra * (Watt) | 182.5 | 156.7 14% | 192 -5% | 188 -3% | 184.8 -1% | 152.7 16% | |
| Cyberpunk 2077 ultra external monitor * (Watt) | 181.1 | 151.9 16% | 164.5 9% | 187.5 -4% | 181.4 -0% | 144.9 20% | |
| Load Maximum * (Watt) | 246 | 242 2% | 208 15% | 247 -0% | 251.1 -2% | 229 7% | 254 ? -3% |
| Load Average * (Watt) | 127 | 119 | 107.7 | 100.8 | 123 | 108.6 ? |
* ... Moindre est la valeur, meilleures sont les performances
consommation d'énergie Cyberpunk / Stress test
consommation d'énergie avec moniteur externe
Durée de vie de la batterie
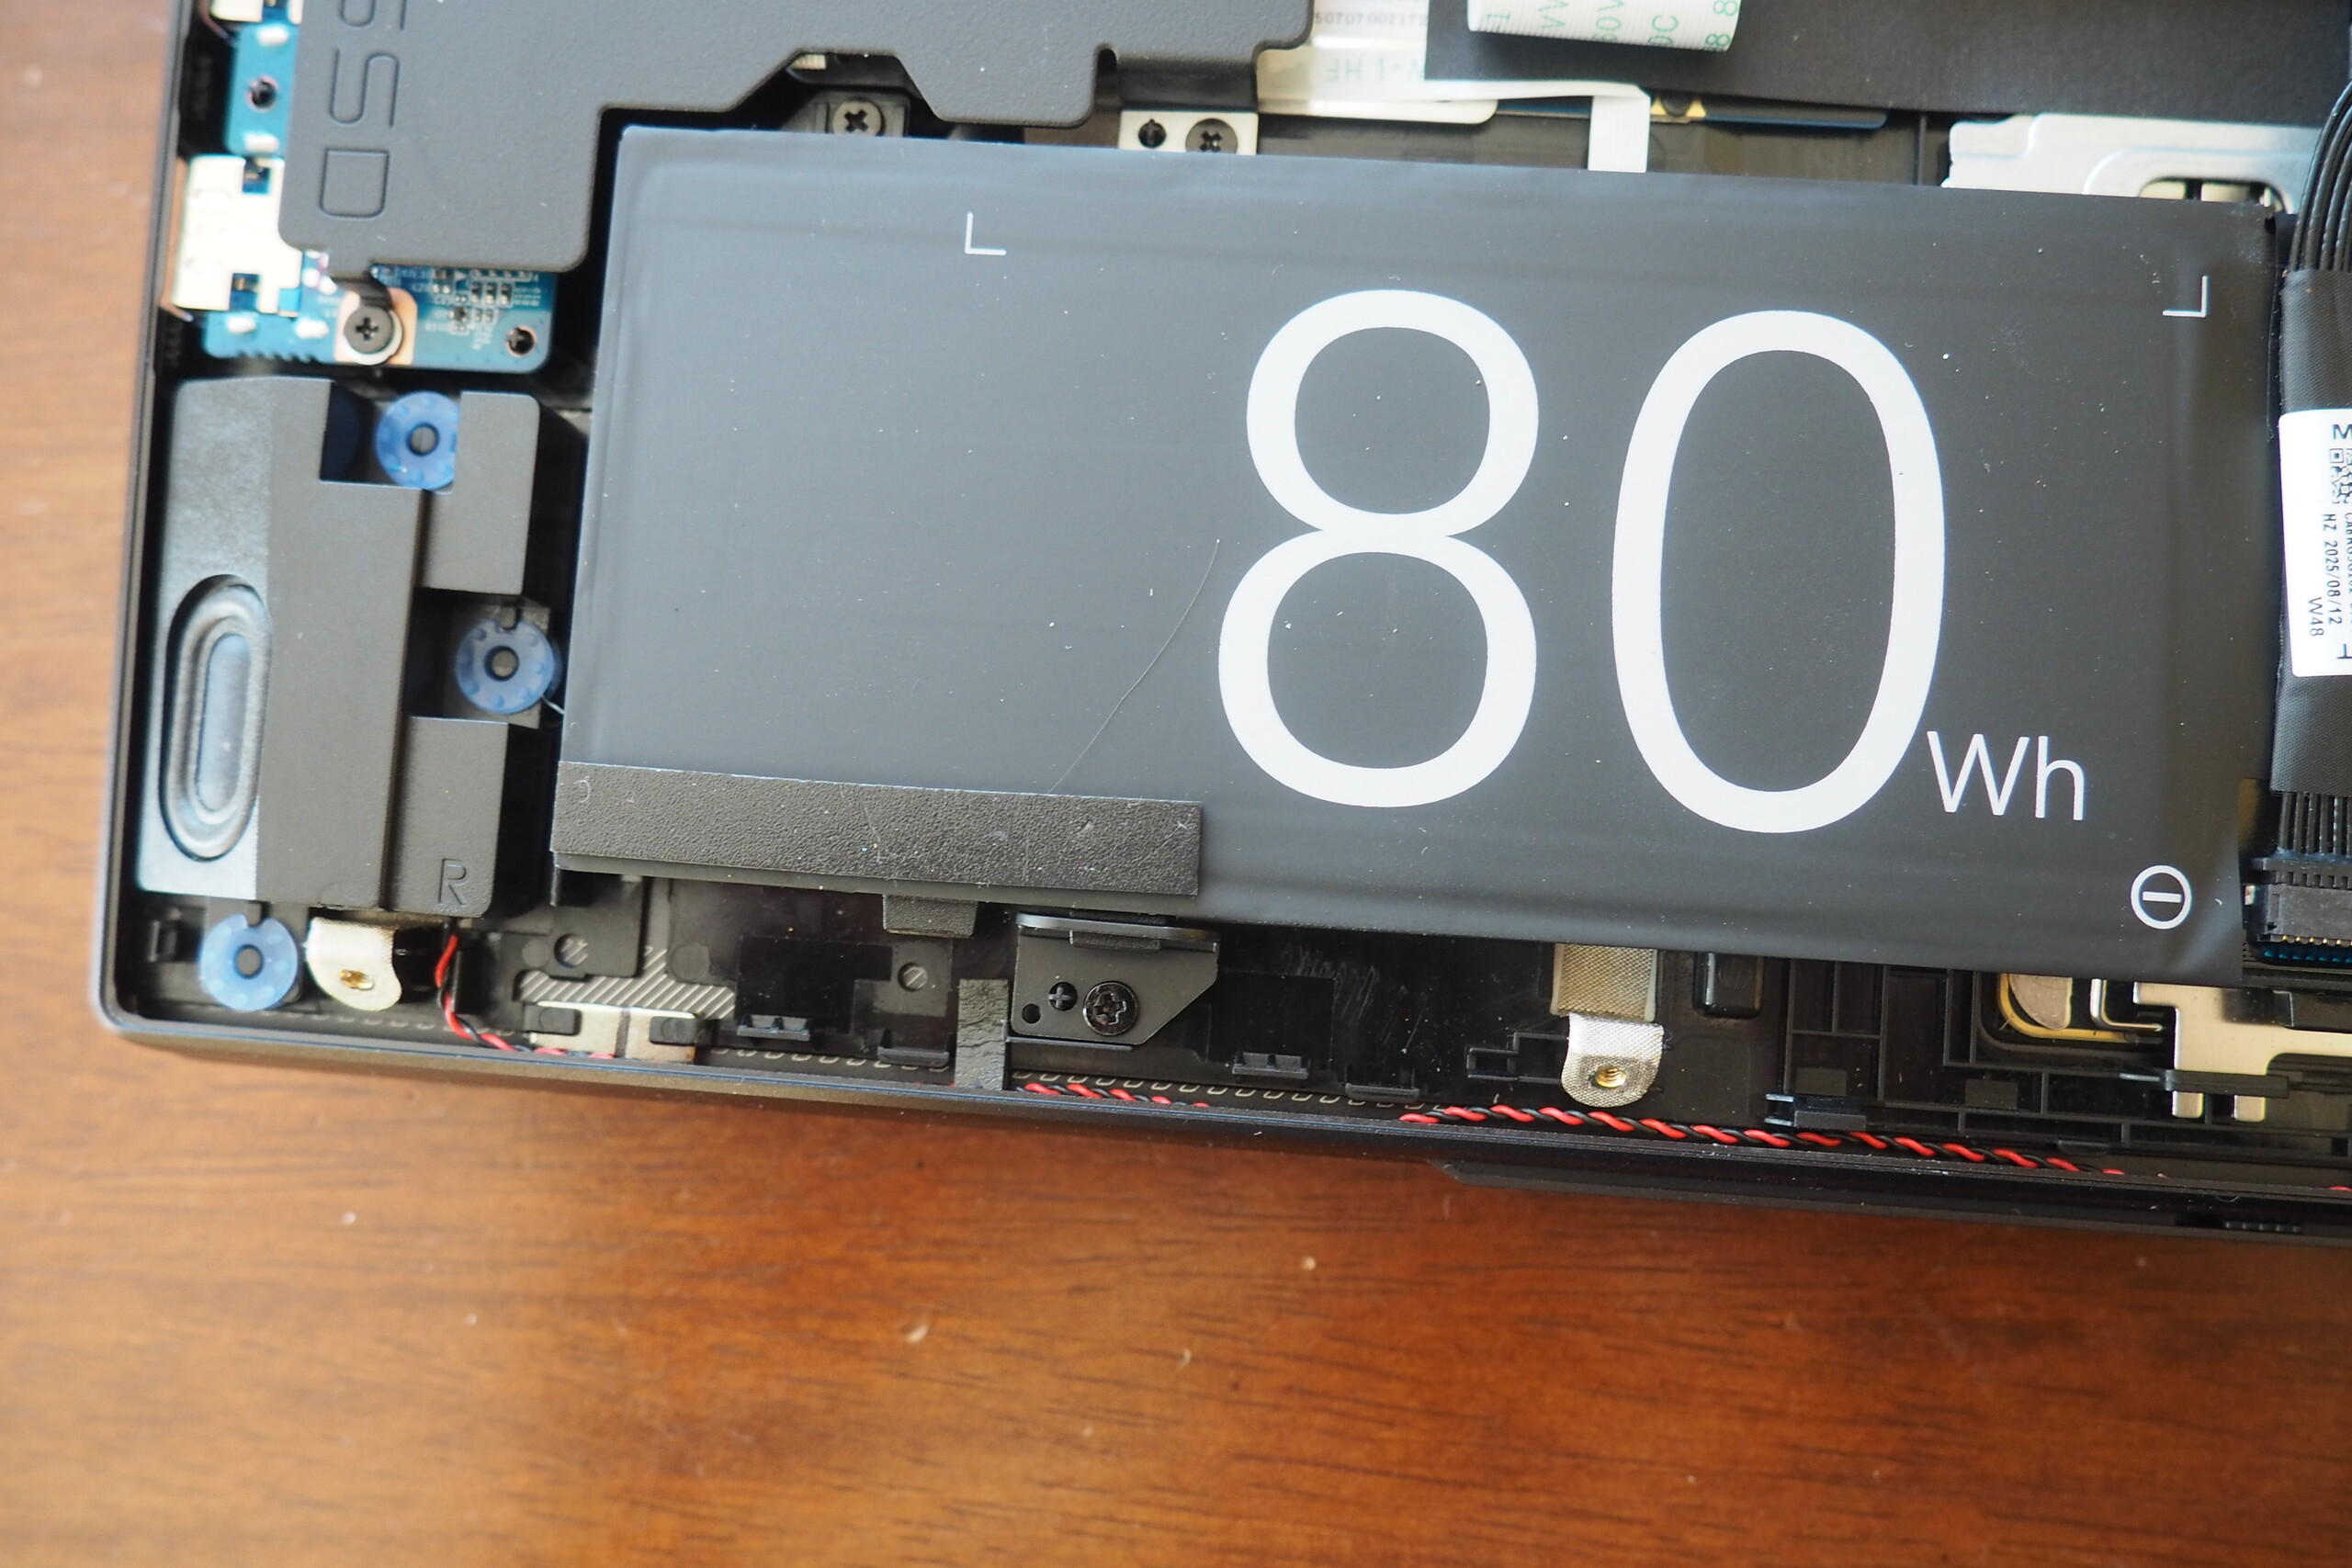
L'autonomie de la batterie est relativement bonne. Pratiquement aucun appareil comparable n'a réussi à dépasser les 7 heures lors de notre test Wi-Fi (luminosité réduite à 150 cd/m²). Le Core 16 normal, qui est équipé d'une batterie de 99 Wh au lieu de 80 Wh, atteint même environ 11 heures.
| Schenker XMG Core 16 VE M25 Ryzen 7 255, GeForce RTX 5060 Laptop, 80 Wh | Tulpar T6 V3.5 i7-14700HX, GeForce RTX 5060 Laptop, 53.35 Wh | HP Omen 16-ap0091ng R9 8940HX, GeForce RTX 5060 Laptop, 70 Wh | Lenovo Legion 7 16IAX10 Ultra 7 255HX, GeForce RTX 5060 Laptop, 84 Wh | Schenker XMG Core 16 M25 Ryzen AI 9 HX 370, GeForce RTX 5070 Laptop, 99.8 Wh | Acer Predator Helios Neo 16S AI PHN16S-71-94L9 Ultra 9 275HX, GeForce RTX 5070 Ti Laptop, 76 Wh | Moyenne de la classe Gaming | |
|---|---|---|---|---|---|---|---|
| Autonomie de la batterie | -40% | -32% | -36% | 49% | -32% | -7% | |
| WiFi v1.3 (h) | 7.3 | 4.4 -40% | 5 -32% | 4.7 -36% | 10.9 49% | 5 -32% | 6.8 ? -7% |
| H.264 (h) | 5.1 | 8.02 ? | |||||
| Load (h) | 1.3 | 1.512 ? |
Notebookcheck note globale
Même si le XMG Core 16 VE n'arrive pas à la cheville du Lenovo Legion 7 16il s'agit d'un ordinateur portable de jeu bien équilibré et de haute qualité qui présente très peu de faiblesses.
Schenker XMG Core 16 VE M25
- 01/09/2026 v8
Florian Glaser
 Total Sustainability Score:
 Comparaison des alternatives possibles
Image | Modèle | Prix | Poids | Épaisseur | Écran |
|---|---|---|---|---|---|
1. 83.9%  | Schenker XMG Core 16 VE M25 AMD Ryzen 7 255 ⎘ NVIDIA GeForce RTX 5060 Laptop ⎘ 64 Go Mémoire, 2048 Go SSD | Prix de liste: 1935 EUR | 2.1 kg | 23 mm | 16.00" 2560x1600 189 PPI IPS |
2. 77.8%  | Tulpar T6 V3.5 Intel Core i7-14700HX ⎘ NVIDIA GeForce RTX 5060 Laptop ⎘ 32 Go Mémoire, 1000 Go SSD | Prix de liste: 1160 EUR | 2.4 kg | 25 mm | 16.00" 1920x1200 142 PPI IPS |
3. 82.5%  | HP Omen 16-ap0091ng AMD Ryzen 9 8940HX ⎘ NVIDIA GeForce RTX 5060 Laptop ⎘ 16 Go Mémoire, 1000 Go SSD | Amazon: Prix de liste: 1500 Euro | 2.4 kg | 23.7 mm | 16.00" 1920x1200 162 PPI IPS |
4. 86.6%  | Lenovo Legion 7 16IAX10 Intel Core Ultra 7 255HX ⎘ NVIDIA GeForce RTX 5060 Laptop ⎘ 32 Go Mémoire, 1024 Go SSD | Amazon: Prix de liste: 1650 USD | 2 kg | 17.9 mm | 16.00" 2560x1600 189 PPI OLED |
5. 86.2%  | Schenker XMG Core 16 M25 AMD Ryzen AI 9 HX 370 ⎘ NVIDIA GeForce RTX 5070 Laptop ⎘ 64 Go Mémoire, 2048 Go SSD | Amazon: Prix de liste: 2100€ | 2.1 kg | 23 mm | 16.00" 2560x1600 189 PPI IPS |
6. 82%  | Acer Predator Helios Neo 16S AI PHN16S-71-94L9 Intel Core Ultra 9 275HX ⎘ NVIDIA GeForce RTX 5070 Ti Laptop ⎘ 32 Go Mémoire, 1024 Go SSD | Prix de liste: 2400 EUR | 2.2 kg | 19.9 mm | 16.00" 2560x1600 189 PPI OLED |
Transparency
La sélection des appareils à examiner est effectuée par notre équipe éditoriale. L'échantillon de test a été prêté à l'auteur par le fabricant ou le détaillant pour les besoins de cet examen. Le prêteur n'a pas eu d'influence sur cette évaluation et le fabricant n'a pas reçu de copie de cette évaluation avant sa publication. Il n'y avait aucune obligation de publier cet article. En tant que média indépendant, Notebookcheck n'est pas soumis à l'autorité des fabricants, des détaillants ou des éditeurs.
Voici comment Notebookcheck teste
Chaque année, Notebookcheck examine de manière indépendante des centaines d'ordinateurs portables et de smartphones en utilisant des procédures standardisées afin de garantir que tous les résultats sont comparables. Nous avons continuellement développé nos méthodes de test depuis environ 20 ans et avons établi des normes industrielles dans le processus. Dans nos laboratoires de test, des équipements de mesure de haute qualité sont utilisés par des techniciens et des rédacteurs expérimentés. Ces tests impliquent un processus de validation en plusieurs étapes. Notre système d'évaluation complexe repose sur des centaines de mesures et de points de référence bien fondés, ce qui garantit l'objectivité.