

Verdict : il couvre tous les besoins de base
En tant qu'ordinateur portable de milieu de gamme abordable, le Dell 14 Plus n'offre pas grand-chose en termes de cloches et de sifflets fantaisistes ou de designs brillants et accrocheurs. Au lieu de cela, il se concentre sur les caractéristiques essentielles qui intéressent les utilisateurs soucieux de leur budget, notamment un processeur moderne, un écran IPS haute résolution avec des couleurs sRGB complètes et une structure relativement fine et légère pour faciliter le transport. Le processeur est à lui seul responsable de la longue durée de vie de la batterie et de l'efficacité accrue par rapport aux modèles de la génération précédente.
Parmi les inconvénients, citons le GPU intégré peu performant, les temps de réponse noir-blanc moyens et la dalle mate quelque peu granuleuse. Le système est donc loin d'être idéal pour les jeux, mais il est tout de même bien meilleur que ses prédécesseurs équipés de cartes graphiques Iris Xe. L'absence d'écran tactile peut également décevoir certains utilisateurs.
Points positifs
Points négatifs
Prix et disponibilité
Dell livre dès à présent le Dell 14 Plus tel qu'il a été testé au prix de 1100 USD. Amazon dispose également de certains modèles en stock.
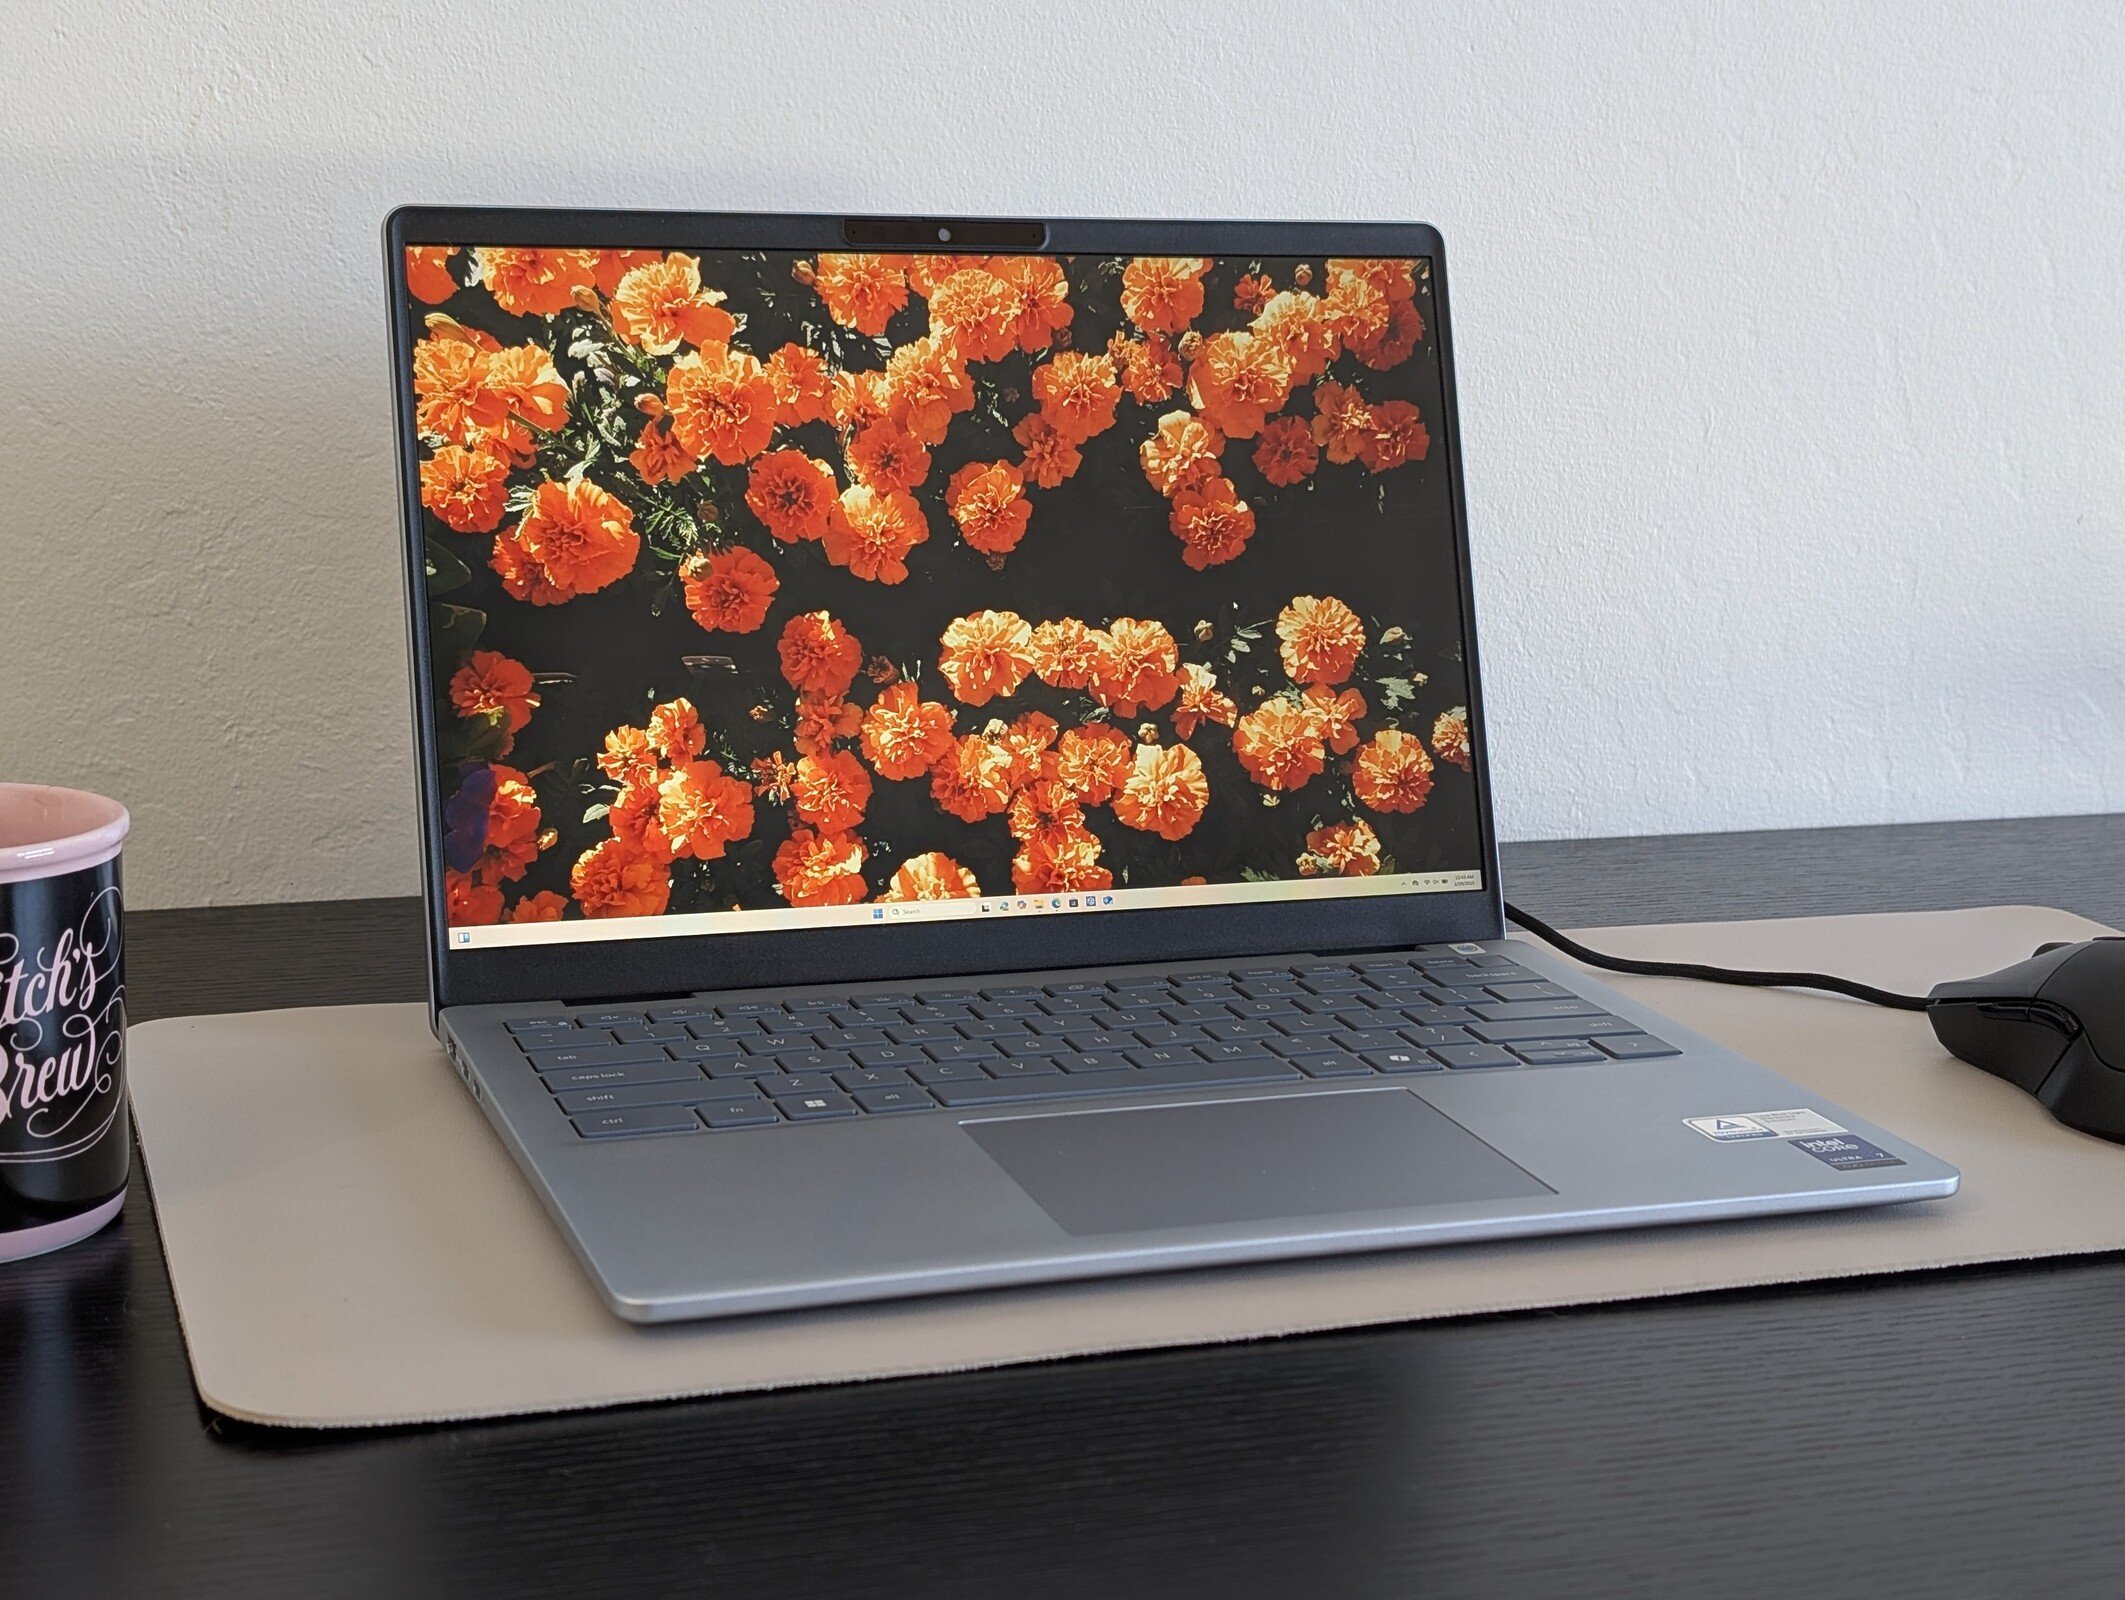
Le Dell 14 Plus succède à l'Inspiron 14 Plus 7440 de l'année dernière Inspiron 14 Plus 7440 de l'année dernière, pour être une option de milieu de gamme économique conçue pour le multimédia domestique ou les étudiants. Il partage les principales caractéristiques de conception avec l'Inspiron, comme le montre notre examen ci-dessous.
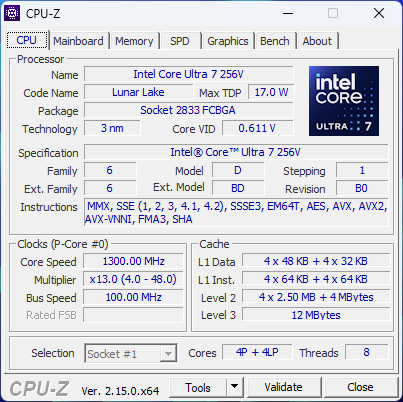
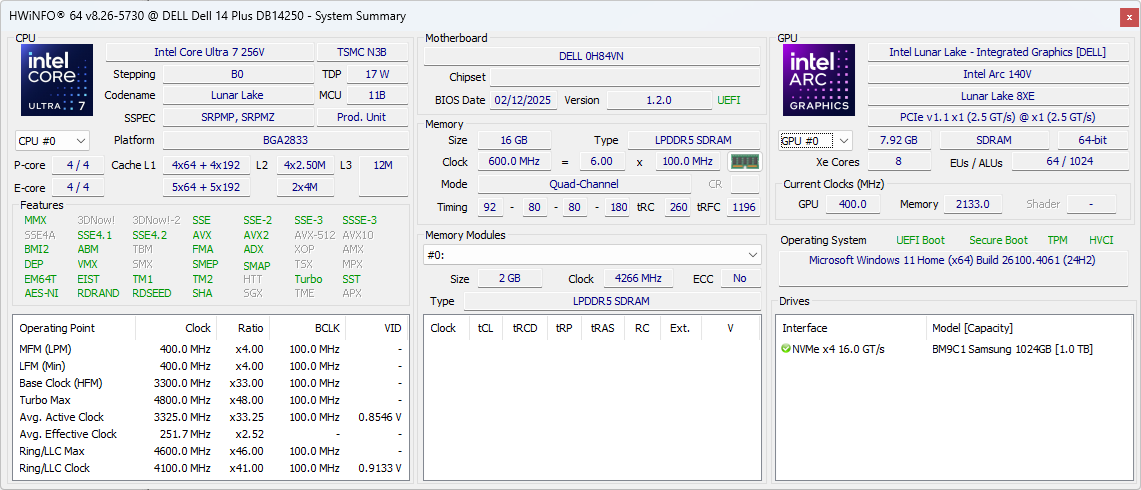
Notre unité de test est une configuration bas de gamme avec un processeur Core Ultra 7 256V et 16 Go de RAM pour un prix d'environ 1100 $. Les SKUs plus haut de gamme sont équipés du Core Ultra 7 258V ou du Core Ultra 9 288V avec le double de RAM, mais l'écran 2.5K 90 Hz reste constant dans toutes les configurations actuelles.
Parmi les alternatives au Dell 14 Plus, on trouve d'autres ordinateurs portables grand public de 14 pouces, comme le Lenovo IdeaPad Pro 5 14 ou le HP Pavilion Plus 14.
Plus d'avis sur Dell :
Spécifications
Cas
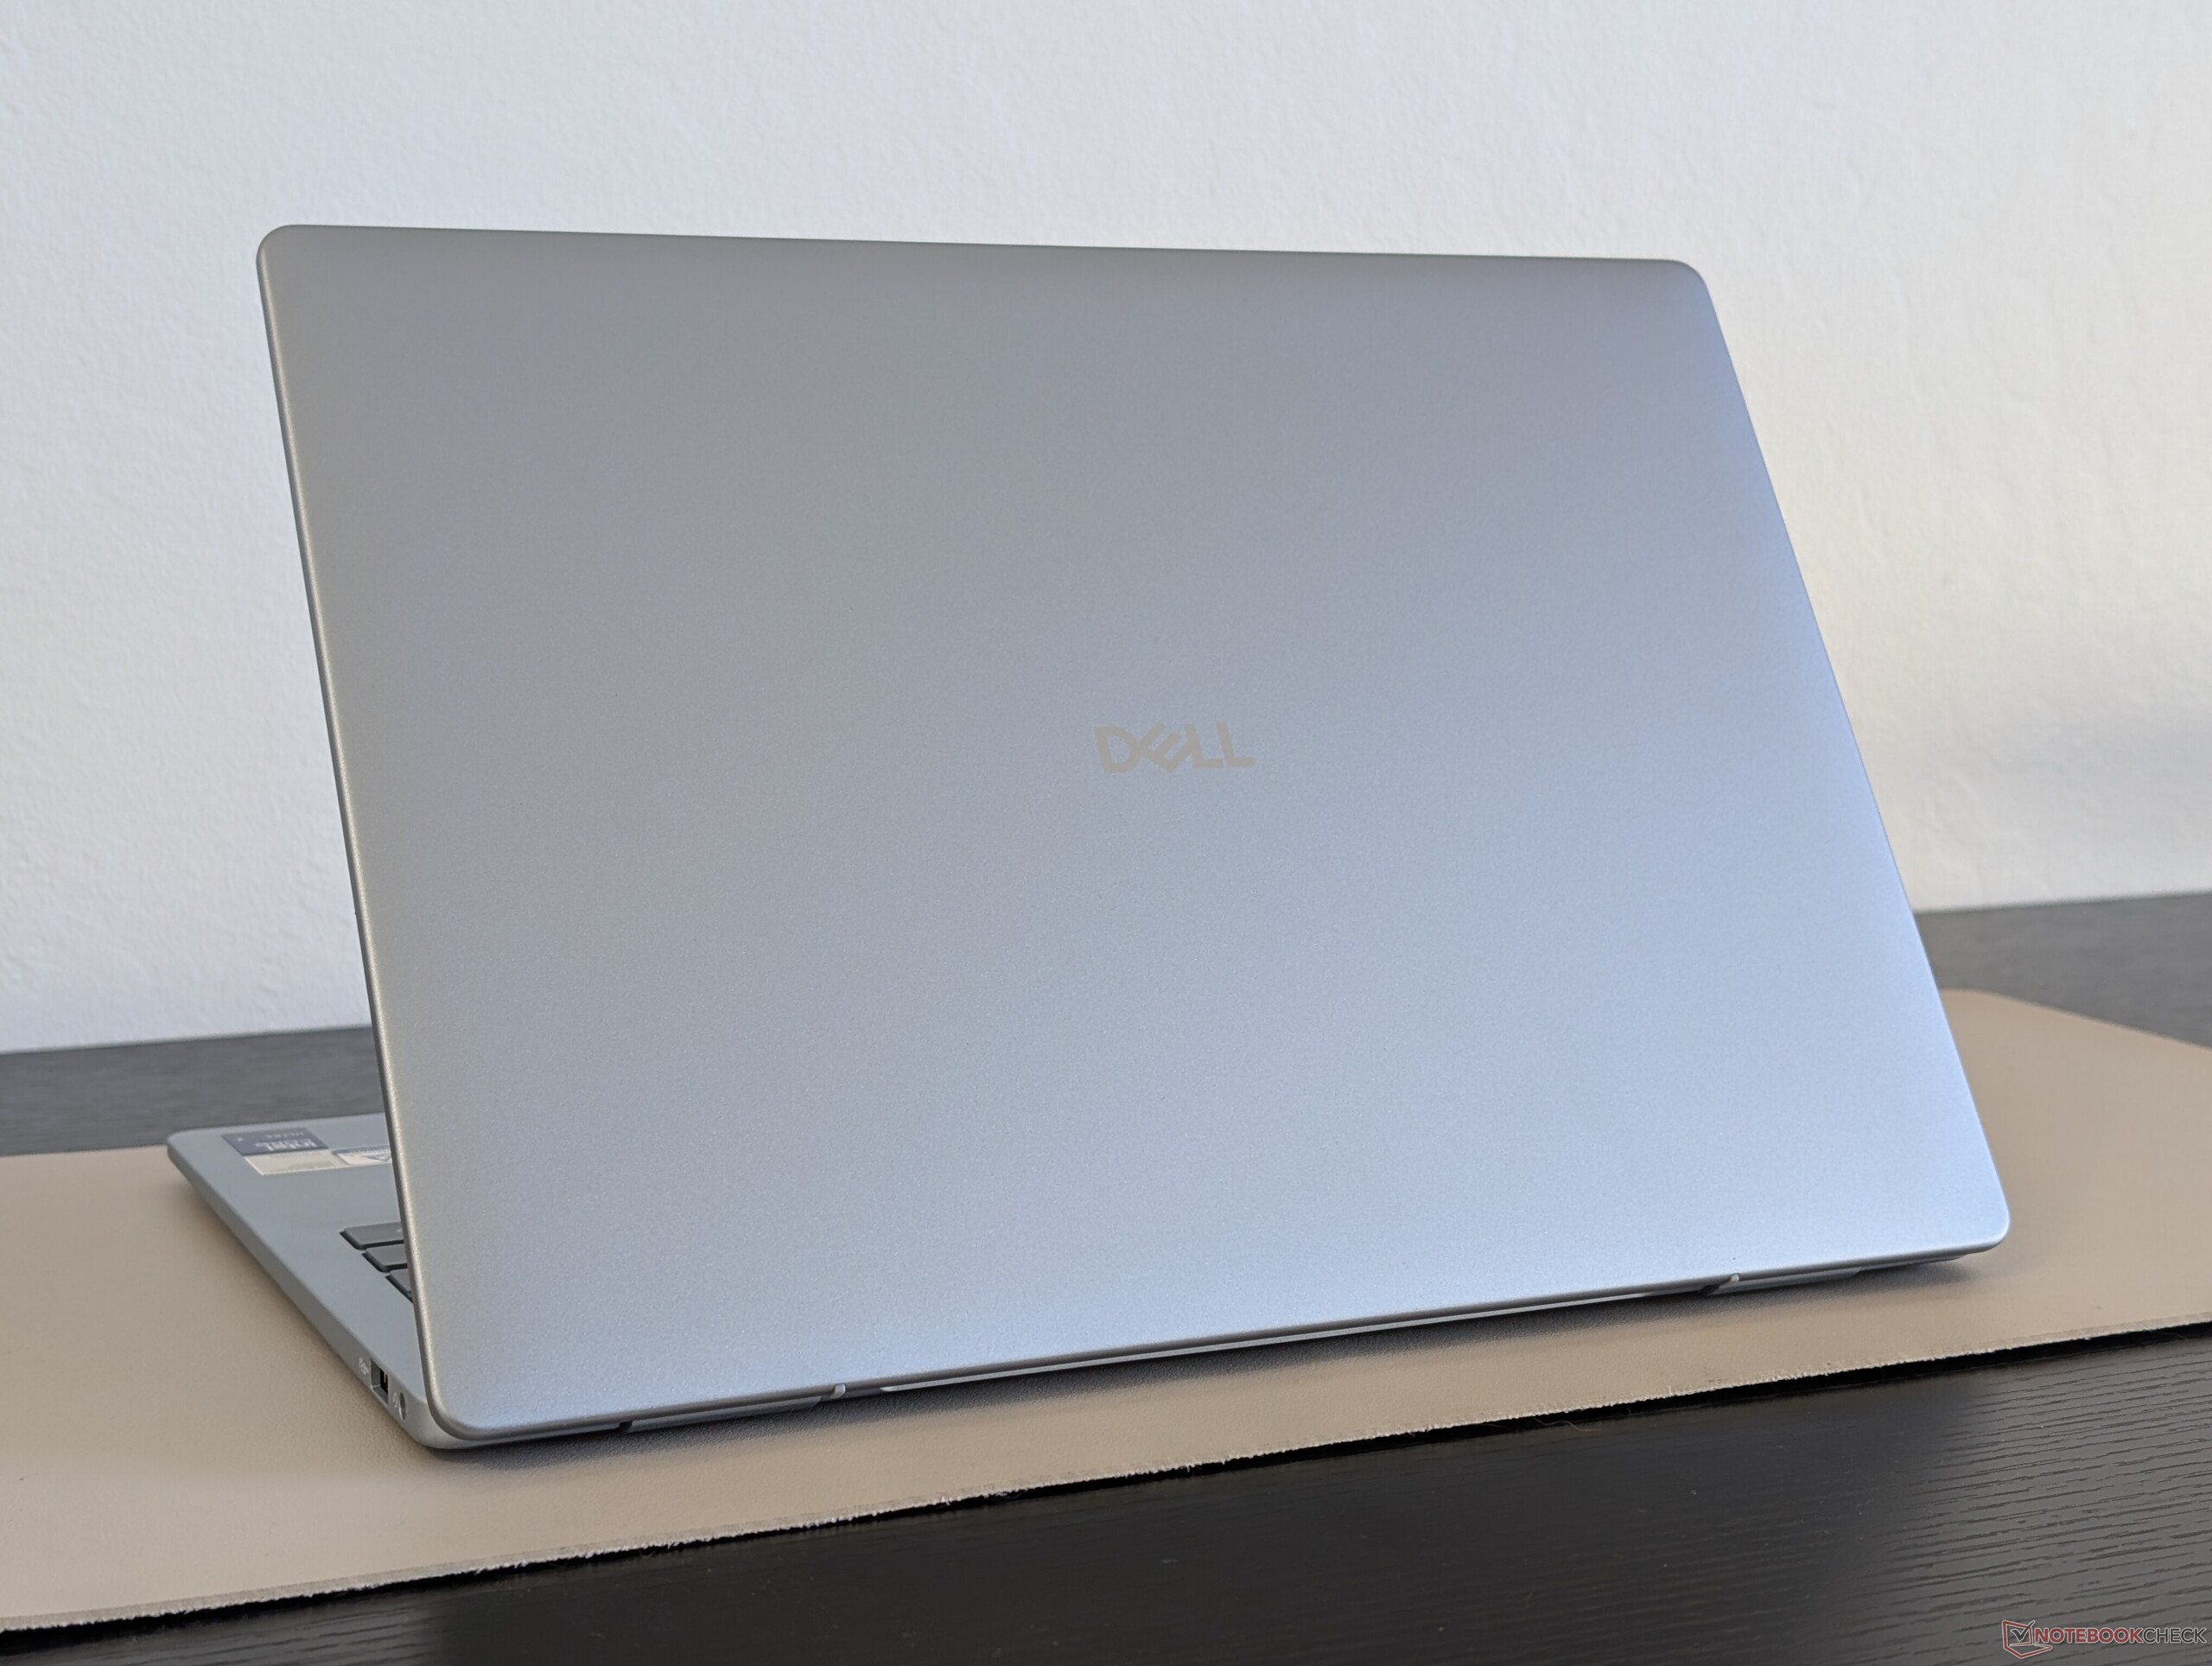
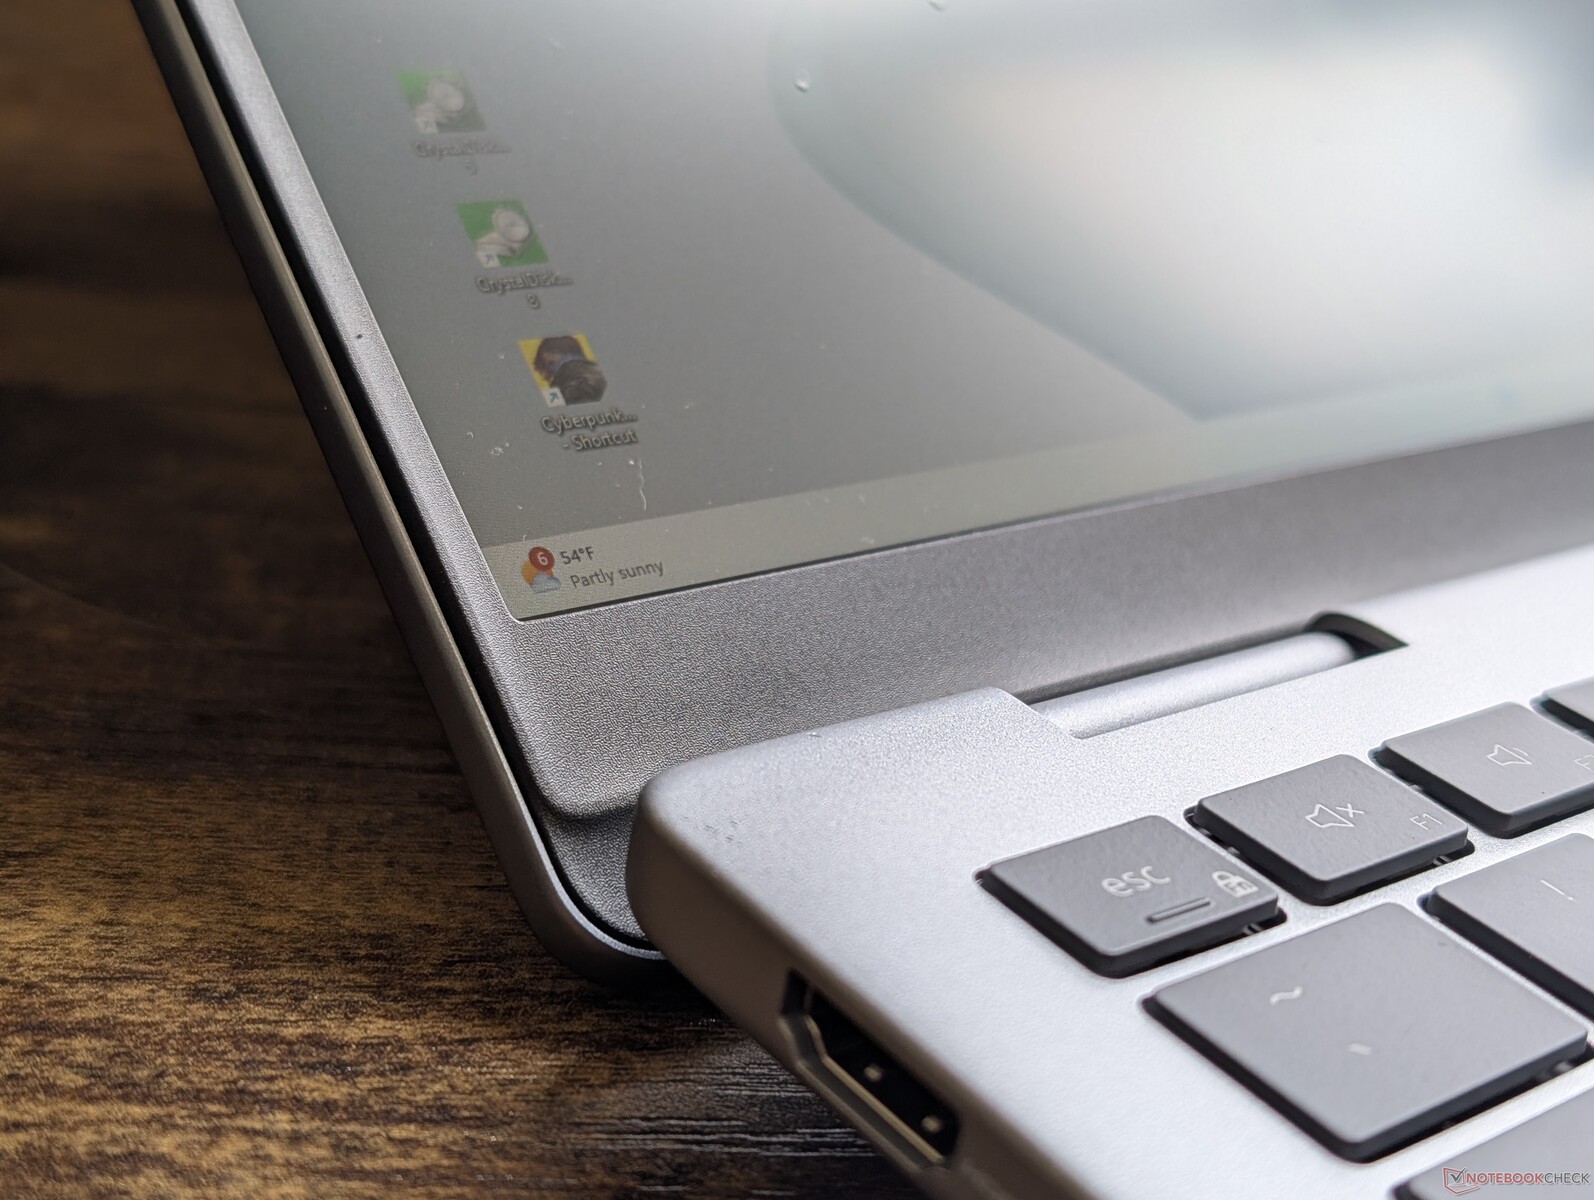
Le châssis a beaucoup de points communs avec l'Inspiron 14 Plus 7440, que ce soit au niveau des matériaux, des couleurs ou même des dimensions. La différence la plus notable réside peut-être dans les charnières puisque le couvercle du nouveau modèle peut s'ouvrir à 180 degrés alors que le modèle de l'année dernière était limité à un maximum d'environ 150 degrés. Les grilles d'aération arrière et le logo sur le couvercle extérieur présentent également des différences mineures. Pour le reste, on a toujours l'impression d'être en présence d'un Inspiron malgré l'abandon du nom.
Connectivité
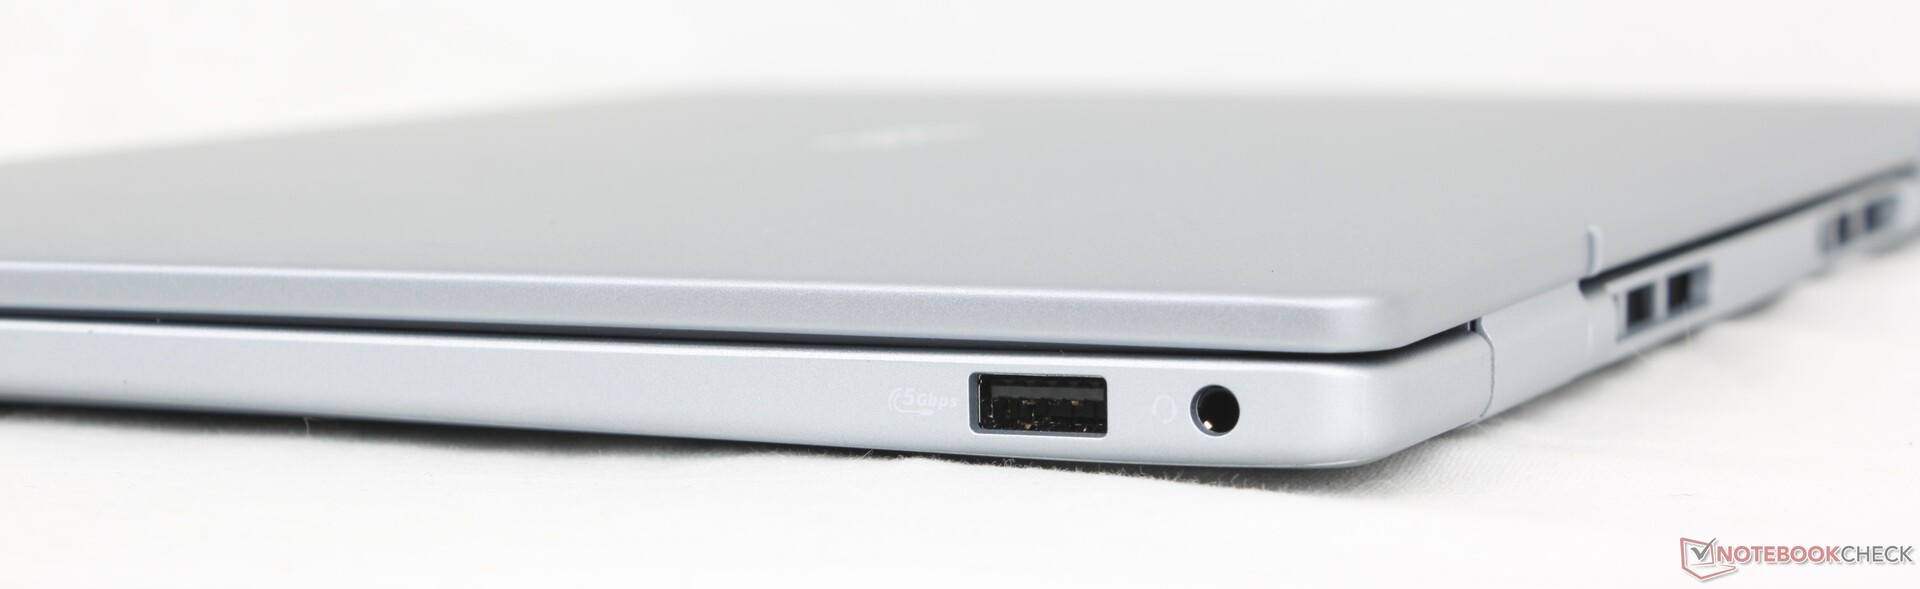
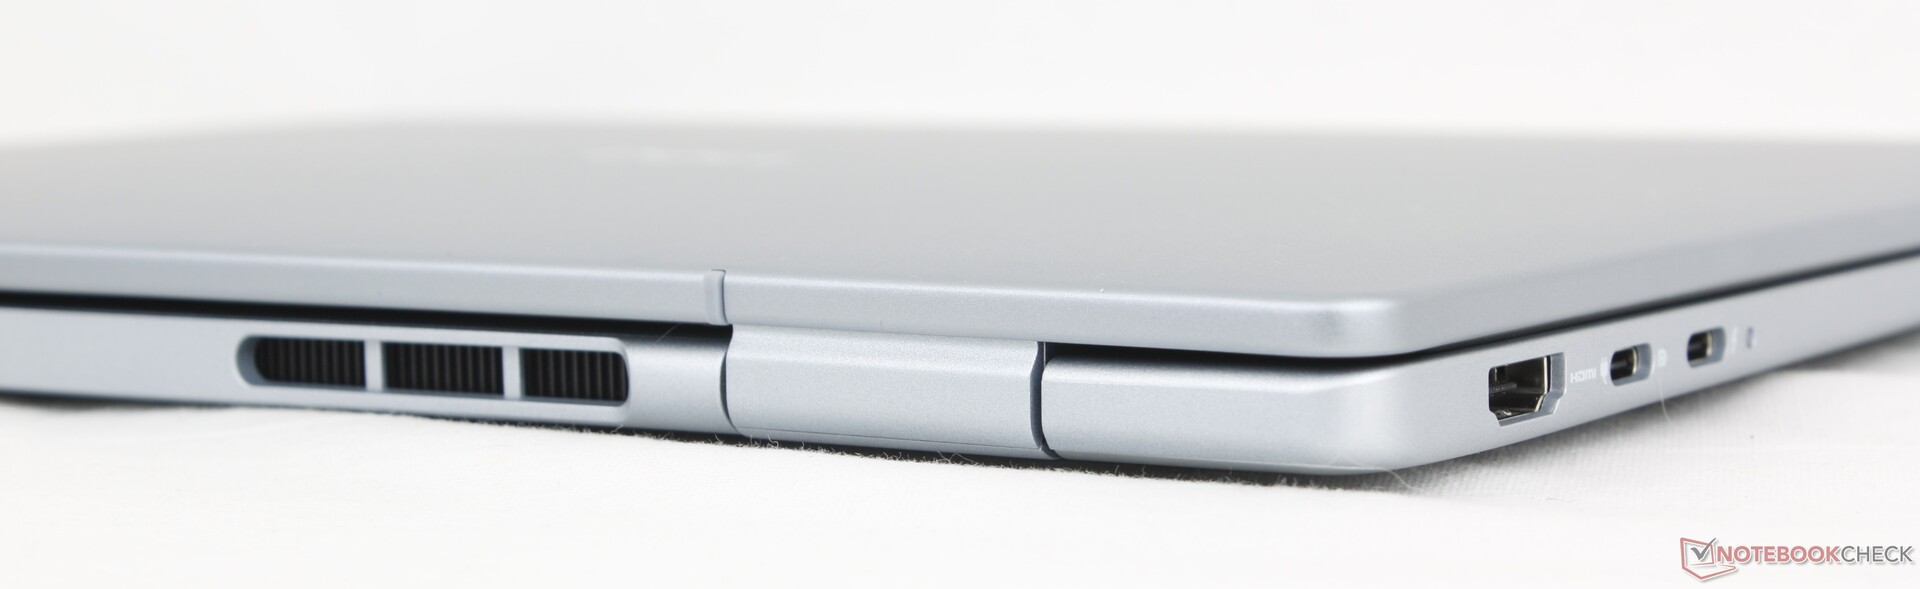
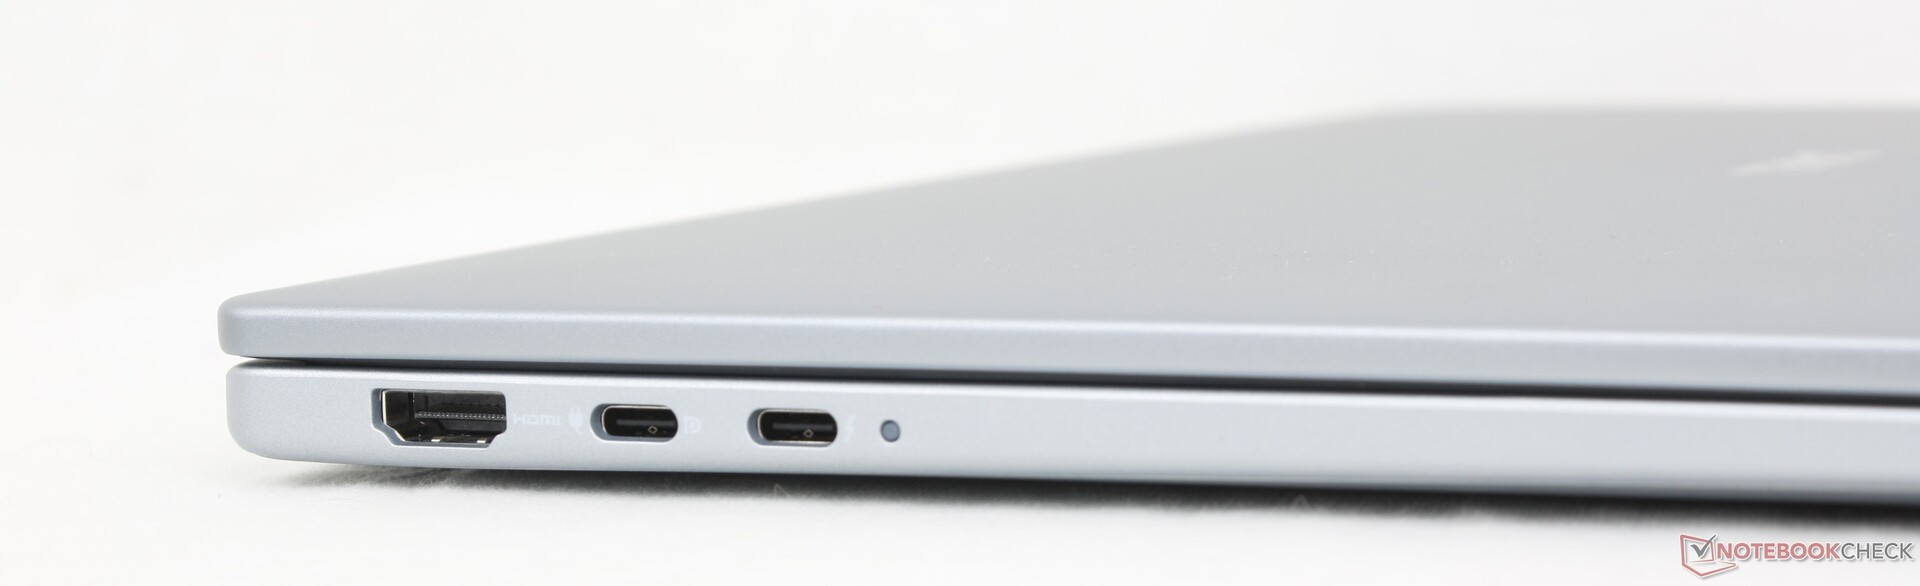
Les options de port sont décentes avec deux ports USB-C et un seul port USB-A. Le port d'adaptateur secteur en baril qui était présent sur les anciens modèles Inspiron a été abandonné pour adopter pleinement la charge USB-C.
Notez qu'un seul des deux ports USB-C prend en charge Thunderbolt 4 et DisplayPort 2.1.
Communication
| Networking | |
| iperf3 transmit AX12 | |
| Dell Inspiron 14 5425 6VPKR | |
| iperf3 receive AX12 | |
| Dell Inspiron 14 5425 6VPKR | |
| iperf3 transmit AXE11000 | |
| Lenovo IdeaPad Pro 5 14AKP G10 | |
| HP Pavilion Plus 14-ew0153TU | |
| Dell 14 Plus | |
| Dell Latitude 3440 | |
| Lenovo ThinkPad E14 G6 | |
| iperf3 receive AXE11000 | |
| Lenovo IdeaPad Pro 5 14AKP G10 | |
| HP Pavilion Plus 14-ew0153TU | |
| Dell 14 Plus | |
| Dell Latitude 3440 | |
| Lenovo ThinkPad E14 G6 | |
| iperf3 transmit AXE11000 6GHz | |
| HP Pavilion Plus 14-ew0153TU | |
| Dell 14 Plus | |
| Dell Latitude 3440 | |
| iperf3 receive AXE11000 6GHz | |
| HP Pavilion Plus 14-ew0153TU | |
| Dell 14 Plus | |
| Dell Latitude 3440 | |
Webcam
Une webcam de 2 mégapixels est fournie en standard, ainsi qu'une interface infrarouge et un obturateur physique.


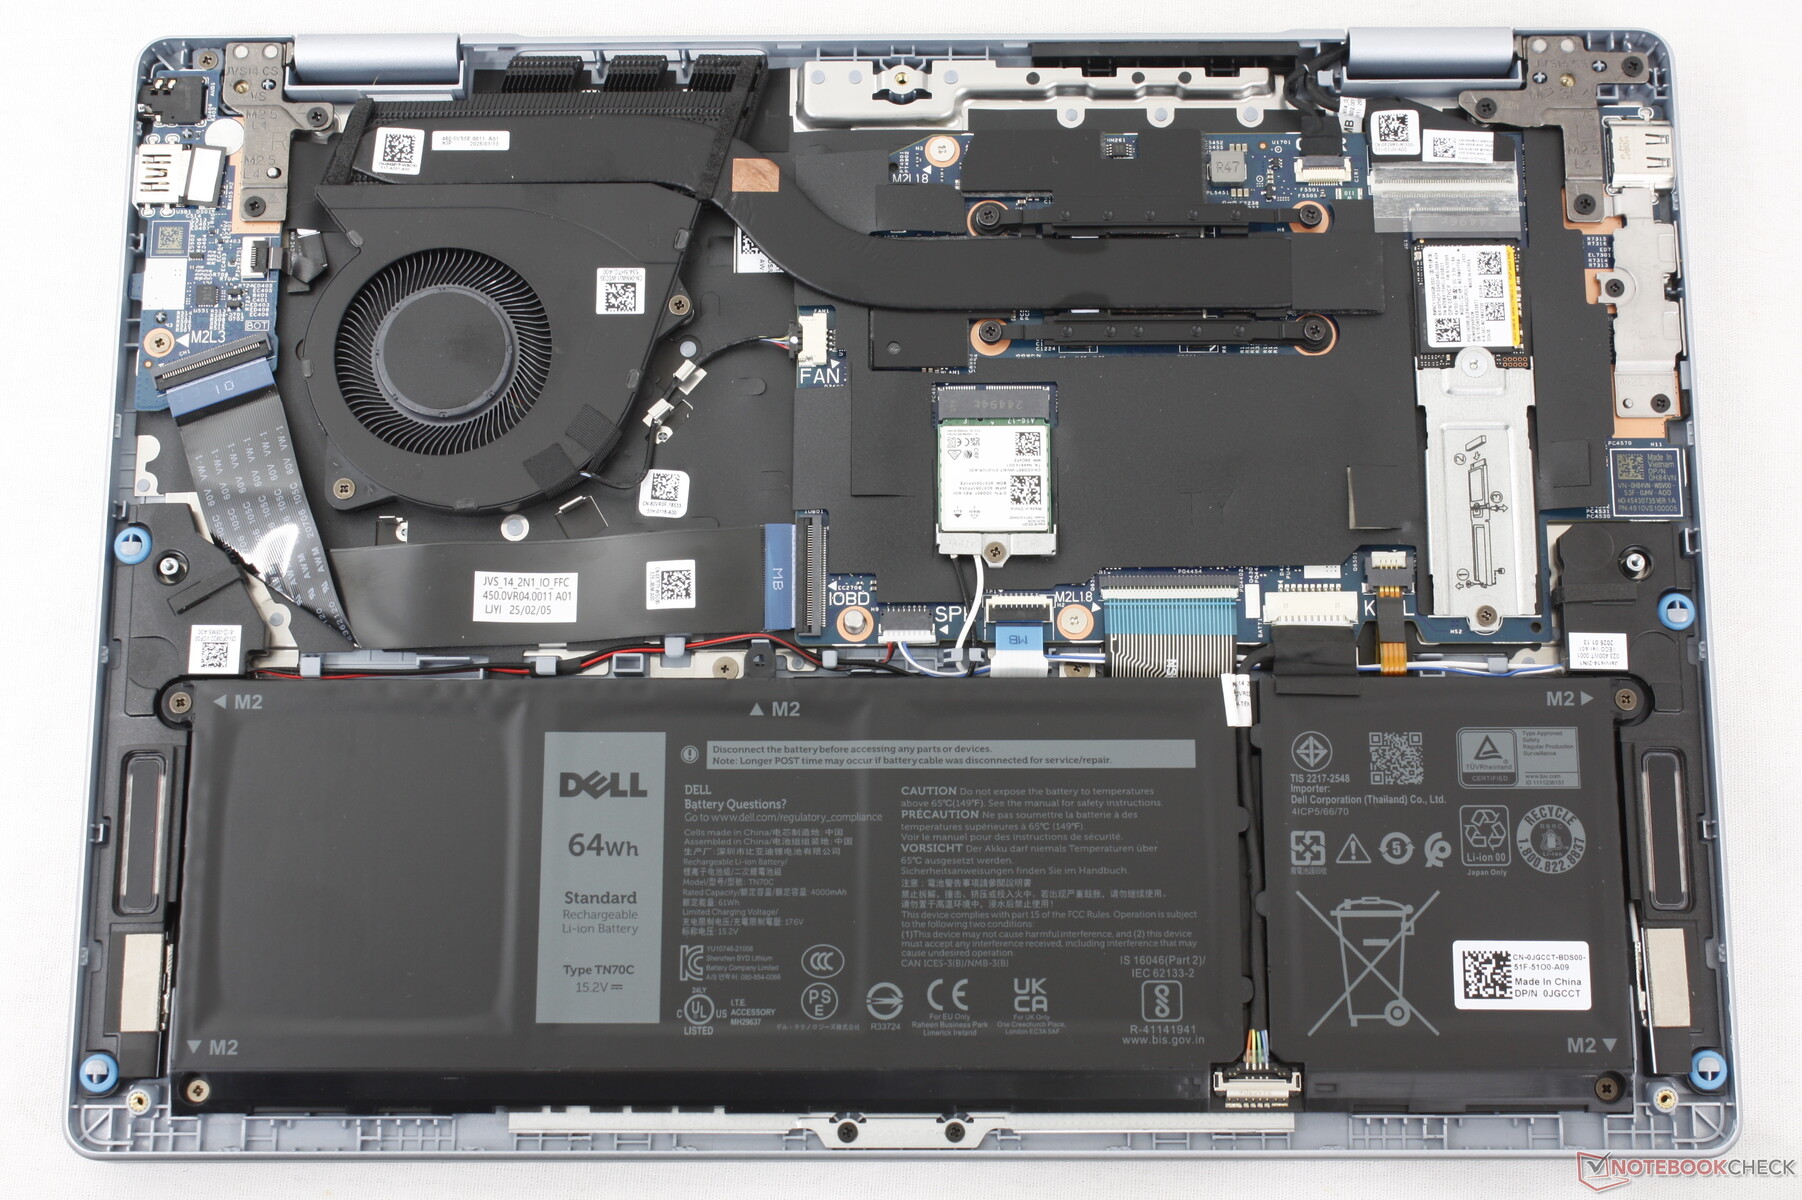
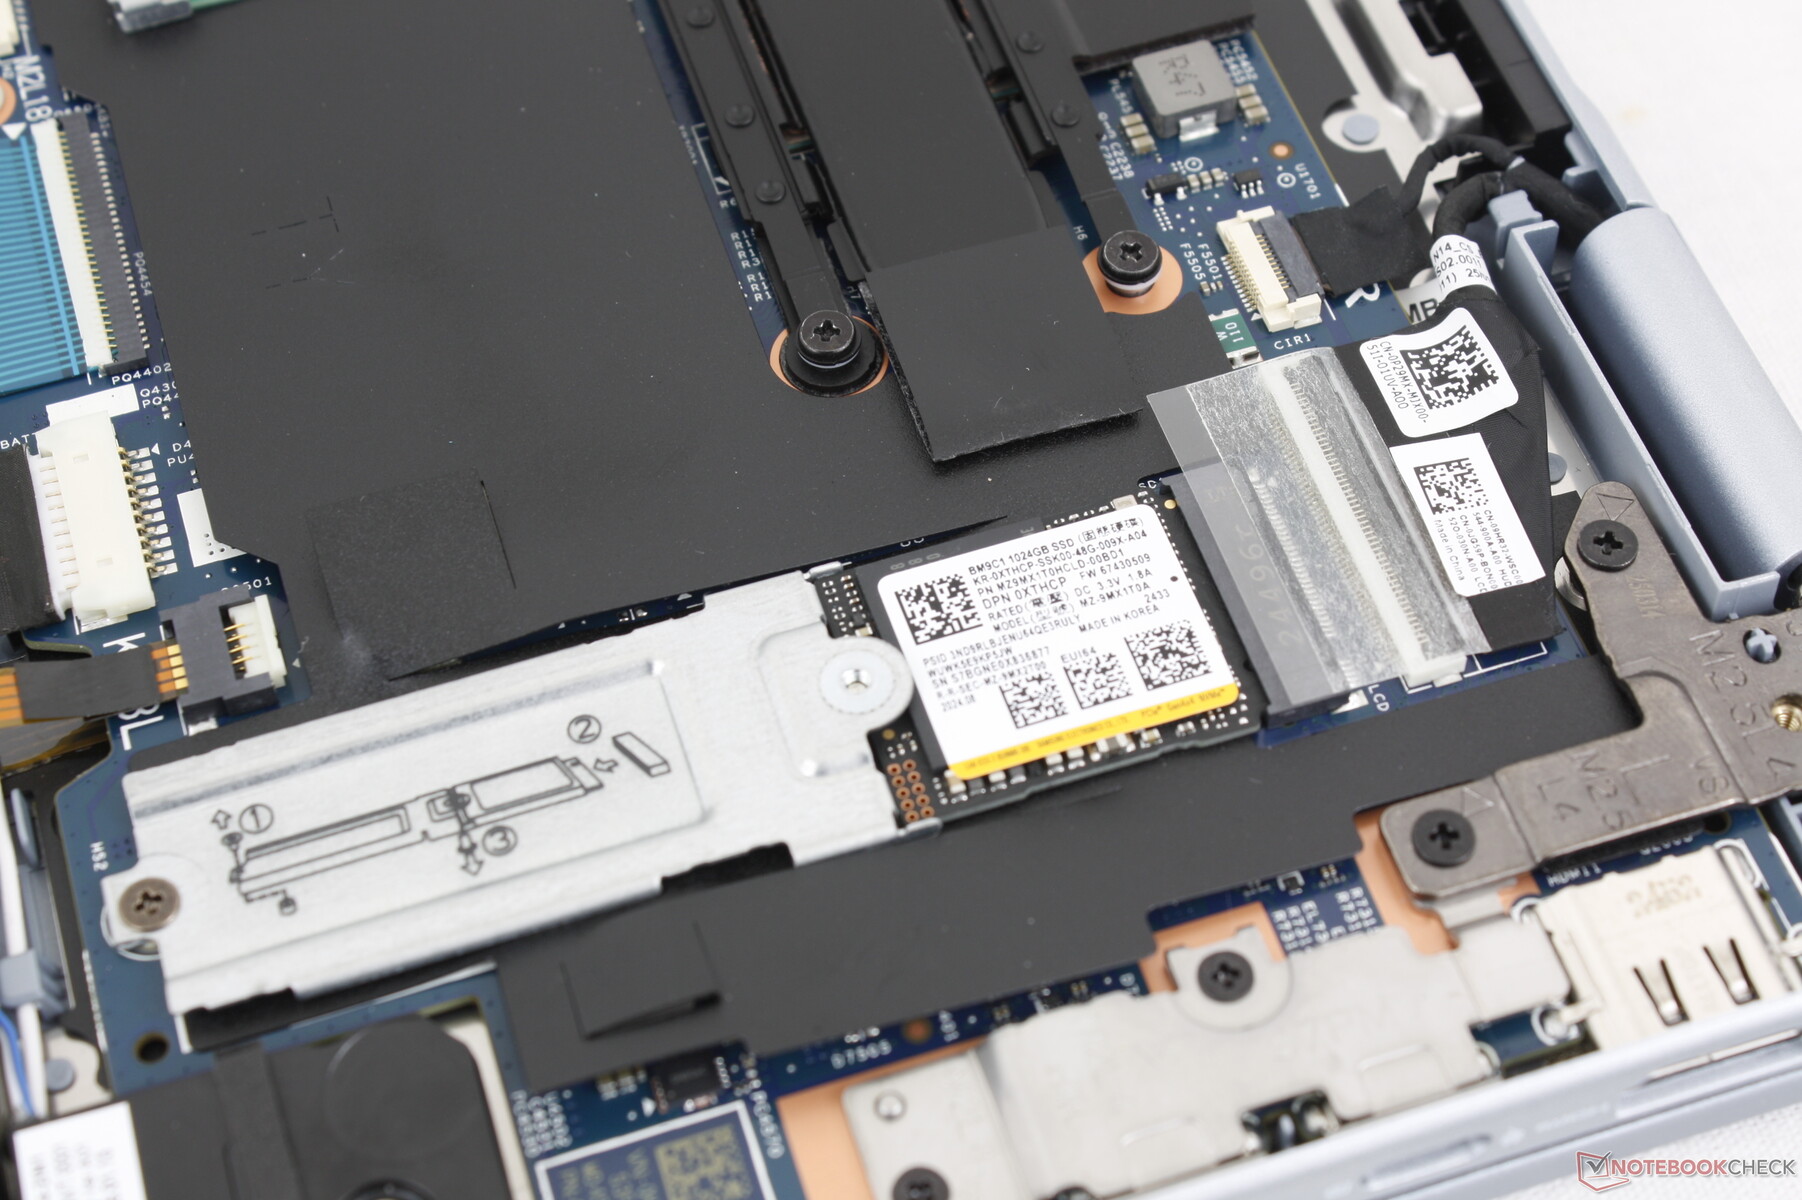
Maintenance
La carte mère est presque identique à celle de l'Inspiron 14 Plus 7440, avec seulement des changements mineurs au niveau de la solution de refroidissement.
Durabilité
Le couvercle supérieur est composé à 50 % d'aluminium recyclé, tandis que le boîtier du ventilateur est composé à 25 % de plastique recyclé provenant des océans. Le support du repose-paume est composé de 15 % d'acier recyclé.
L'emballage n'utilise pas de plastique pour faciliter le recyclage.
Accessoires et garantie
La boîte de vente au détail comprend un petit (~11,1 x 5 x 2,8 cm) adaptateur secteur USB-C de 65 W et les documents habituels. Une garantie fabricant limitée d'un an s'applique si vous l'achetez aux États-Unis.
Périphériques d'entrée
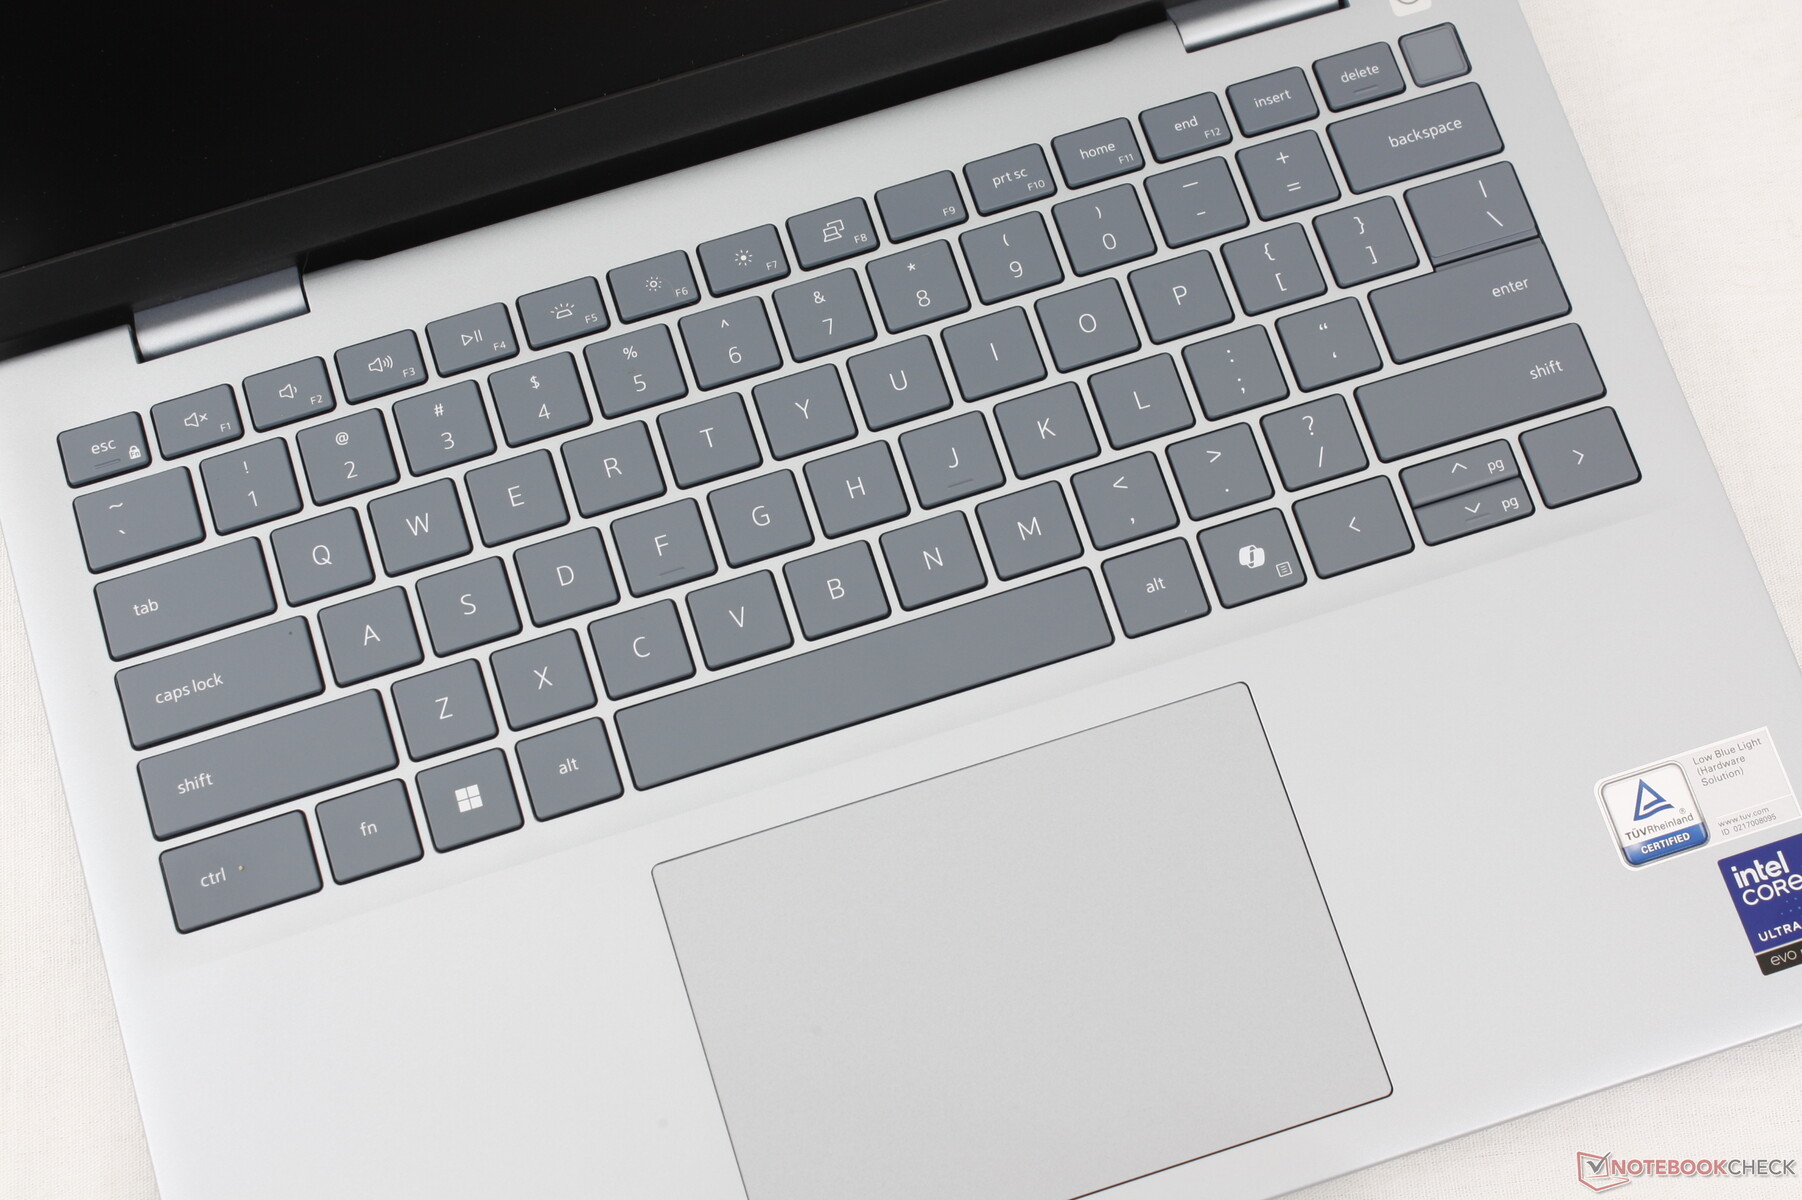
Clavier
Le clavier est essentiellement identique à celui de l'Inspiron 14 Plus 7440 de l'année dernière, au niveau du feedback, de la police et même des fonctions secondaires. La seule différence visuelle est la touche Co-Pilot dédiée qui remplace la touche Ctrl droite.
Pavé tactile
Le clavier est exactement de la même taille que celui de l'Inspiron 14 Plus 7440 de l'année dernière (12,5 x 8 cm). Le contrôle du curseur est spacieux et fiable, mais le retour d'information lorsque vous appuyez sur la surface est beaucoup trop faible et superficiel.
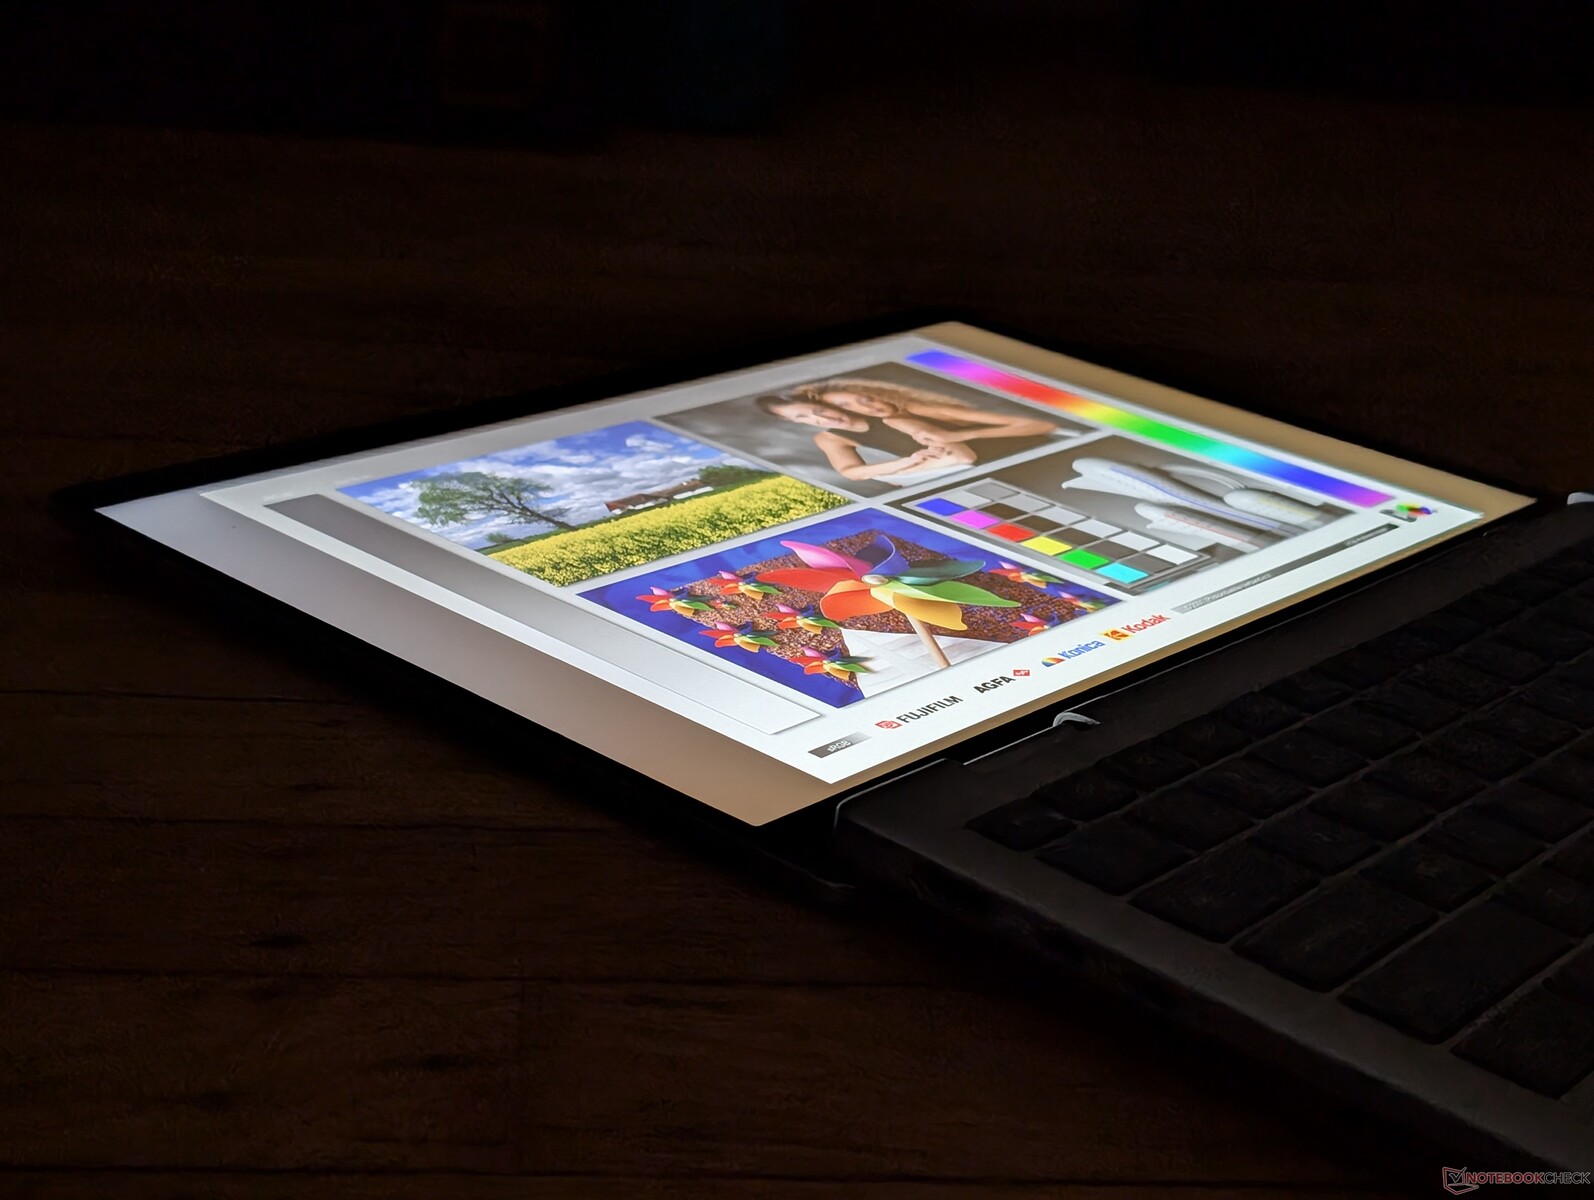
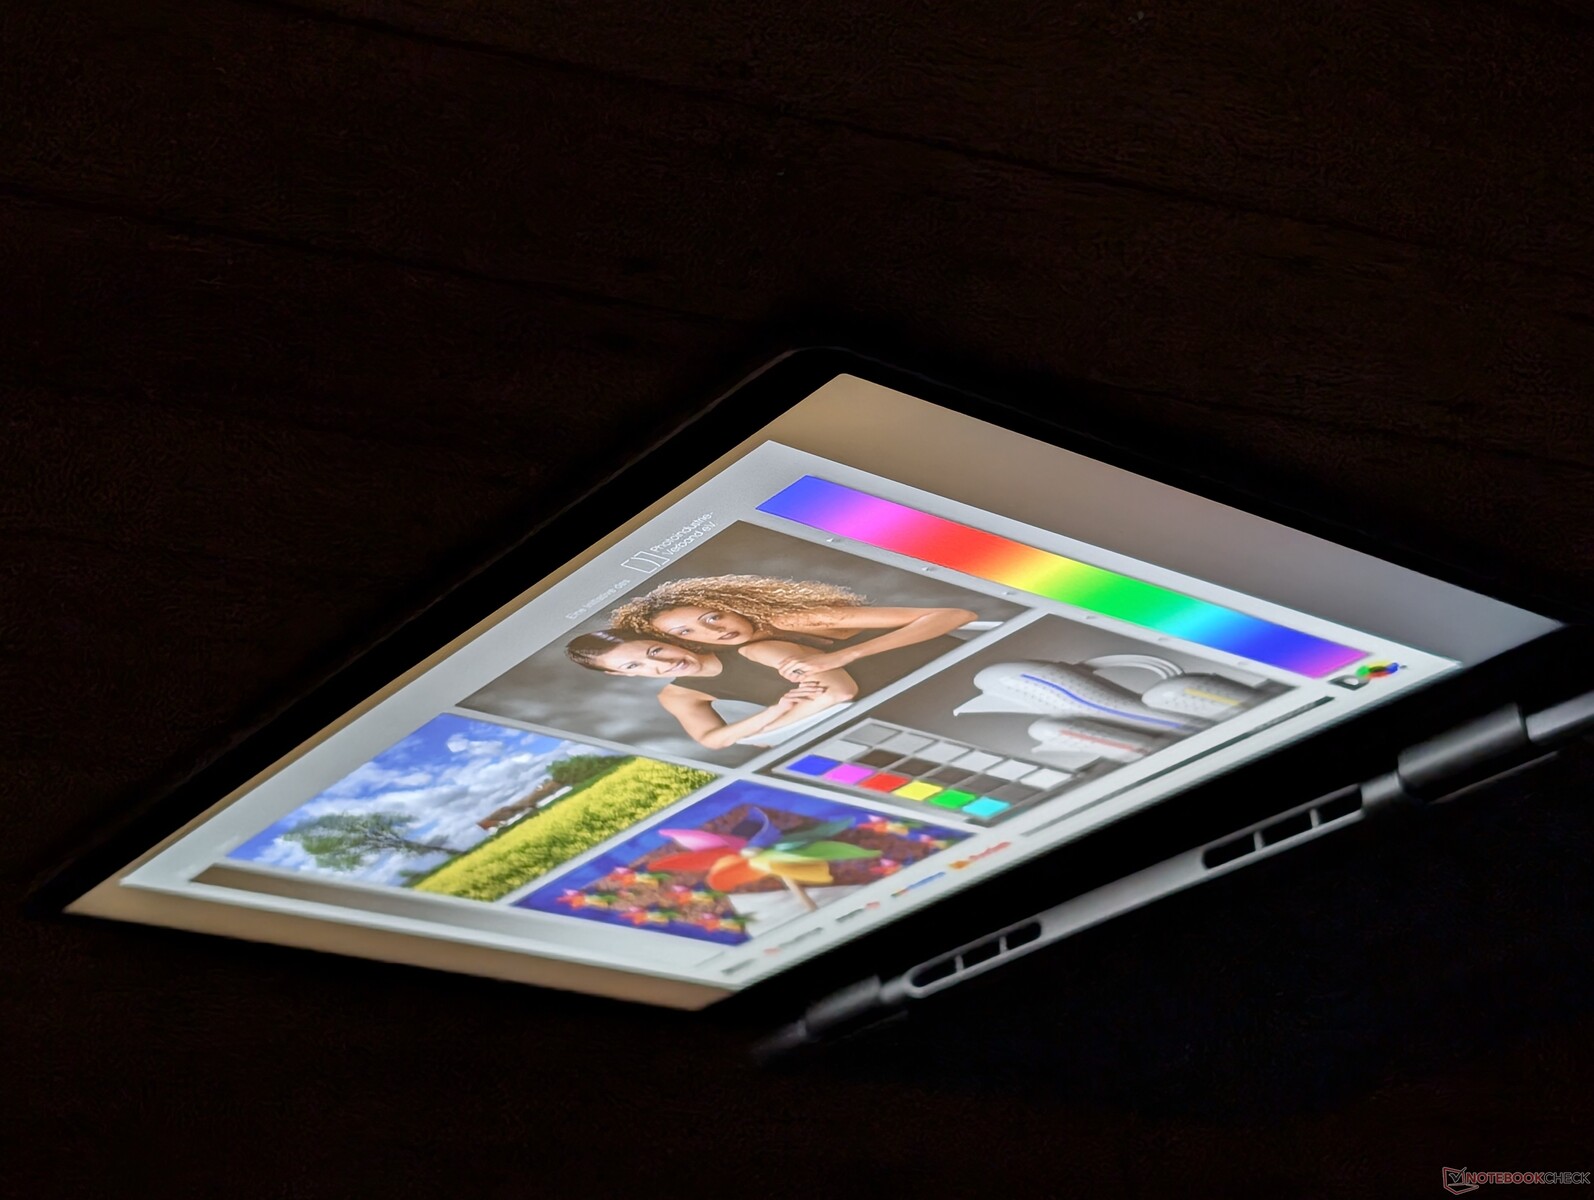
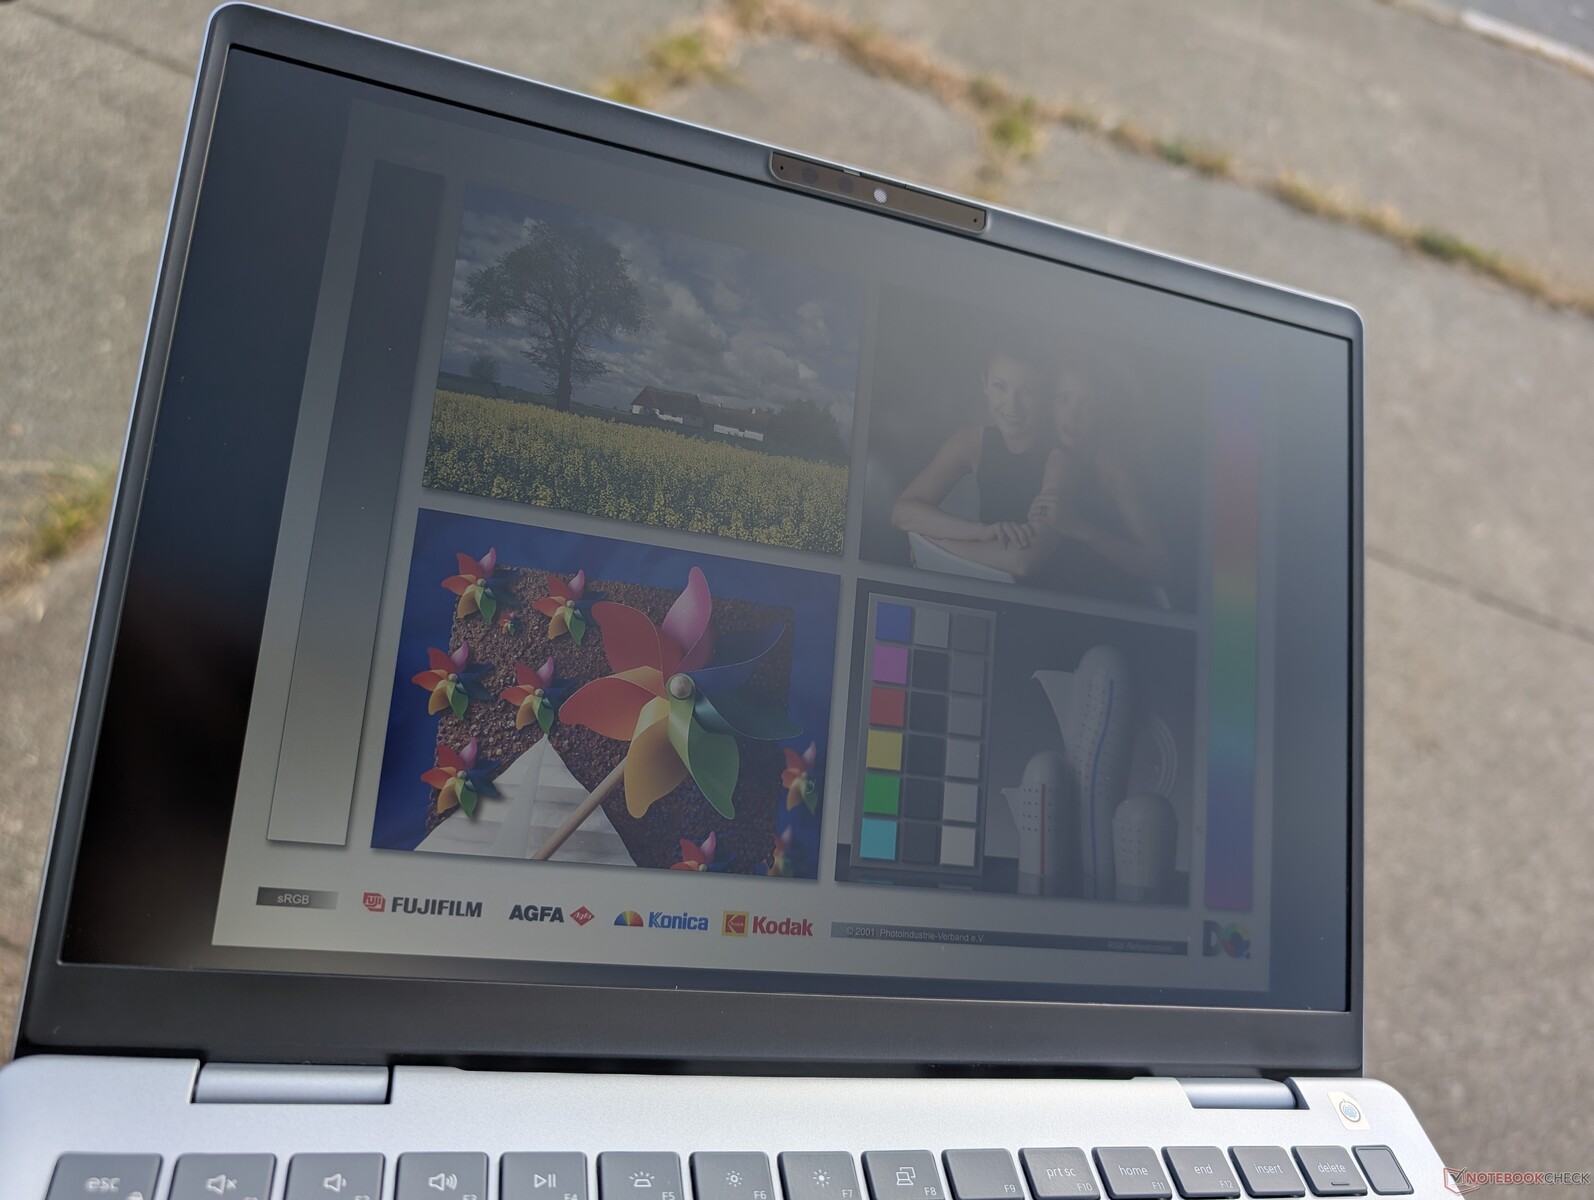
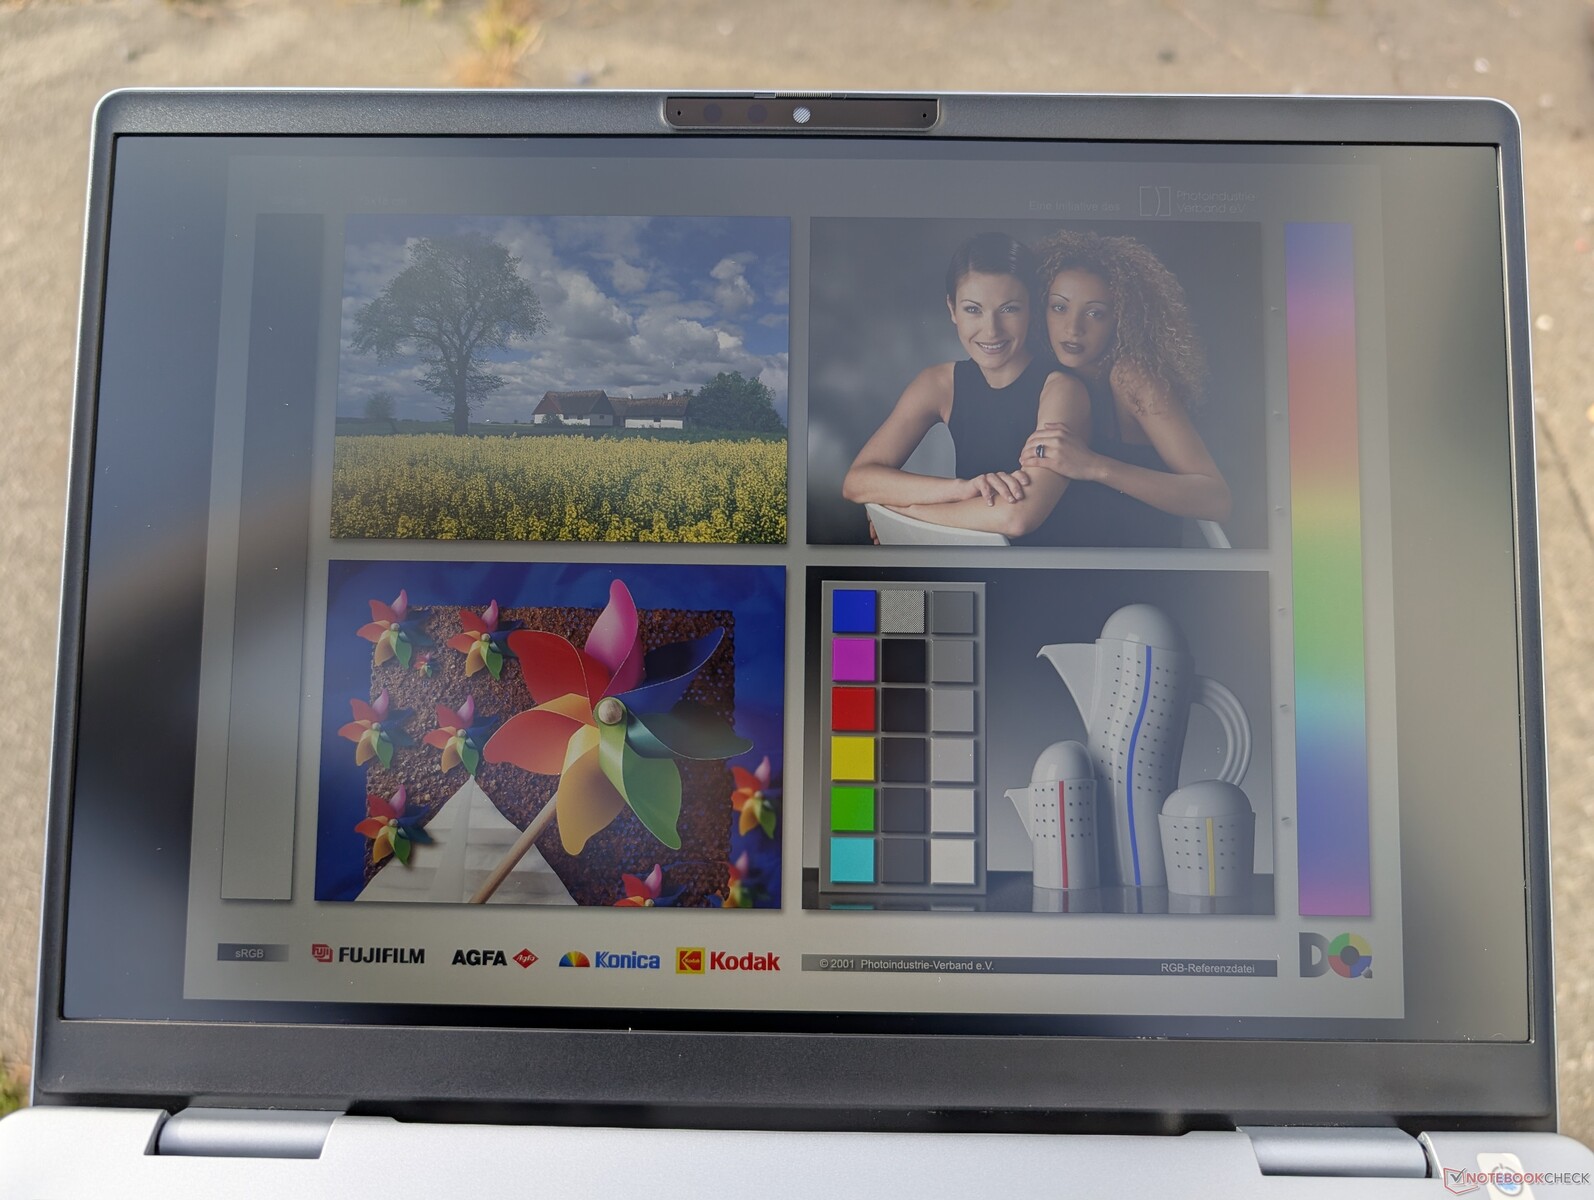
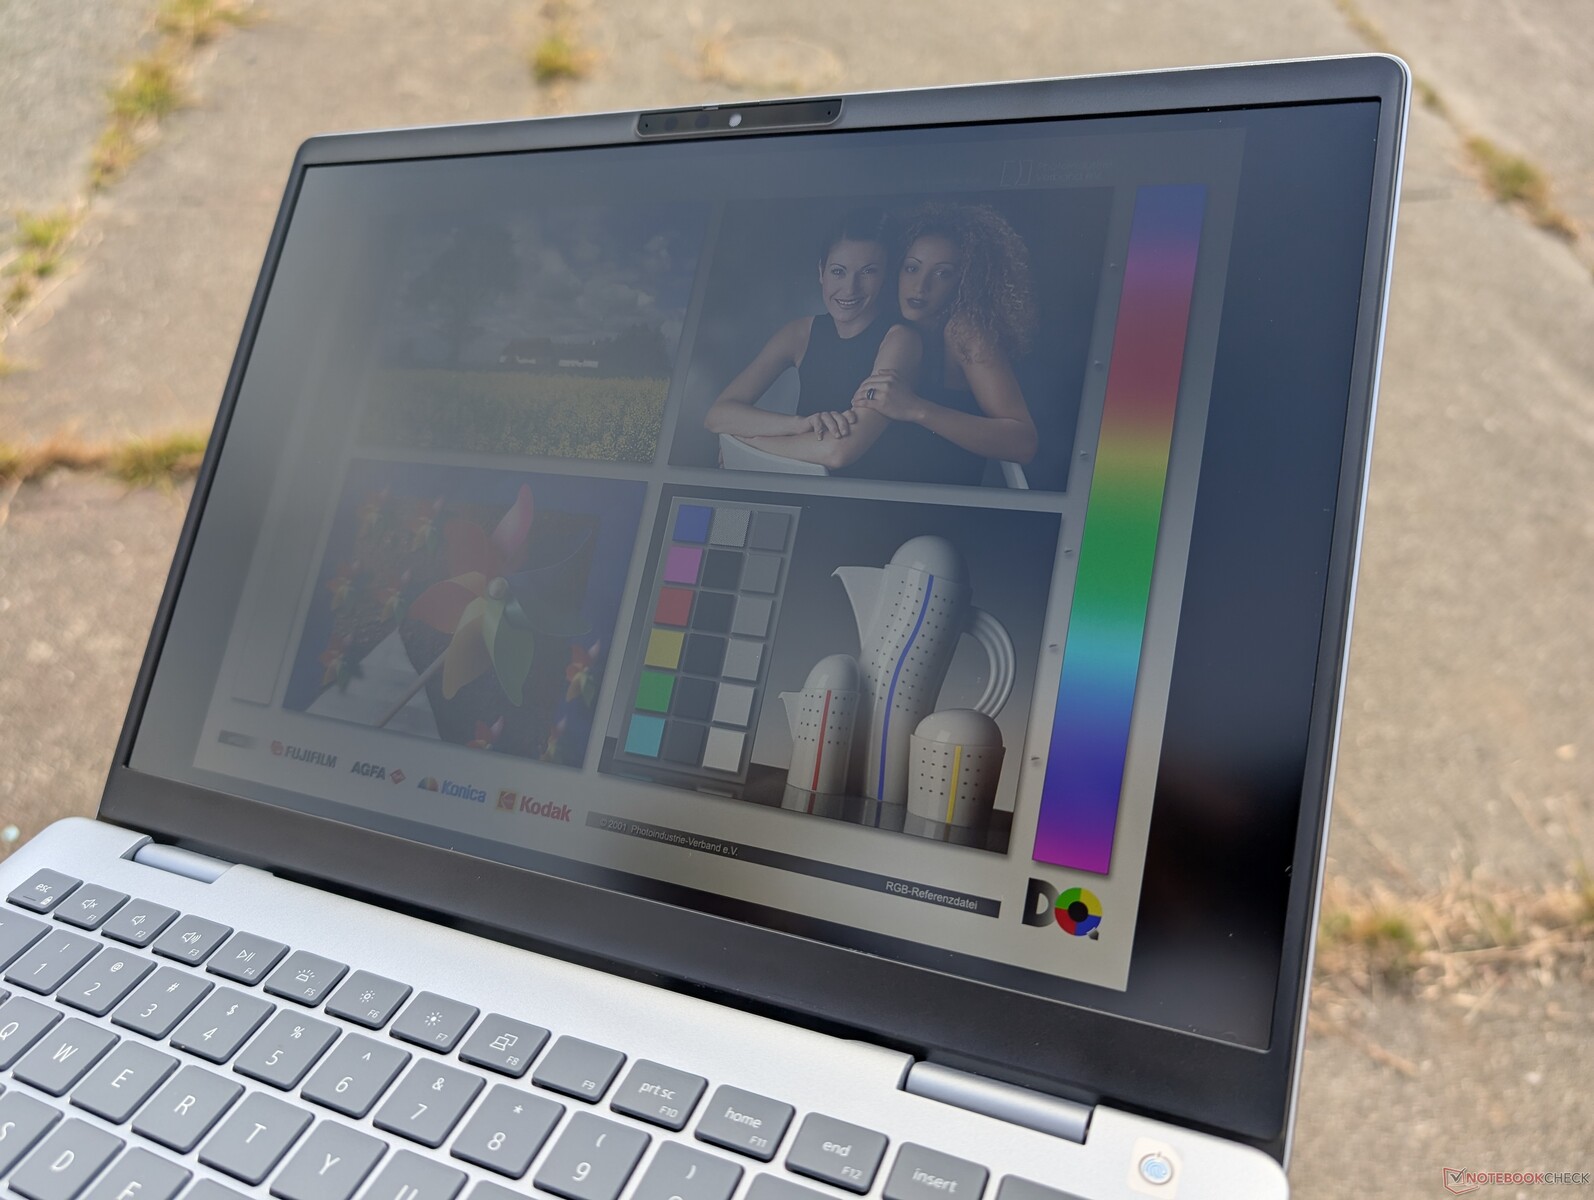
Affichage
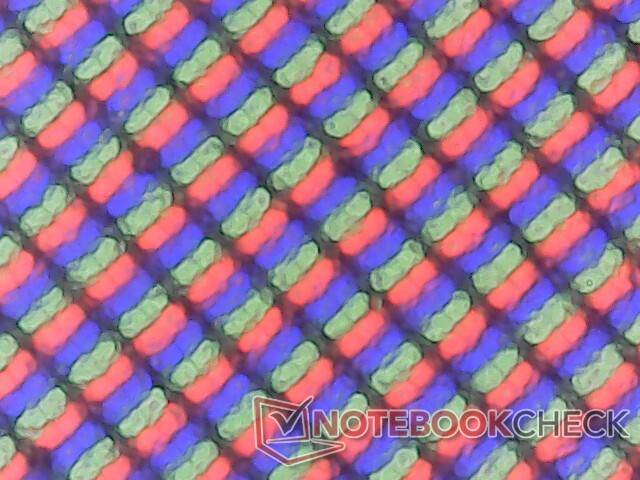
L'écran 1600p offre des couleurs sRGB complètes, un taux de contraste élevé pour une dalle IPS et un taux de rafraîchissement de 90 Hz, ce qui est supérieur à la plupart des écrans des ordinateurs portables bon marché. Les principaux inconvénients sont les temps de réponse noir-blanc relativement lents et la surcouche mate légèrement granuleuse. Toutefois, pour la navigation et la lecture de vidéos, ces inconvénients ne devraient avoir qu'un impact minime sur l'expérience visuelle.

| |||||||||||||||||||||||||
Homogénéité de la luminosité: 92 %
Valeur mesurée au centre, sur batterie: 354 cd/m²
Contraste: 1686:1 (Valeurs des noirs: 0.21 cd/m²)
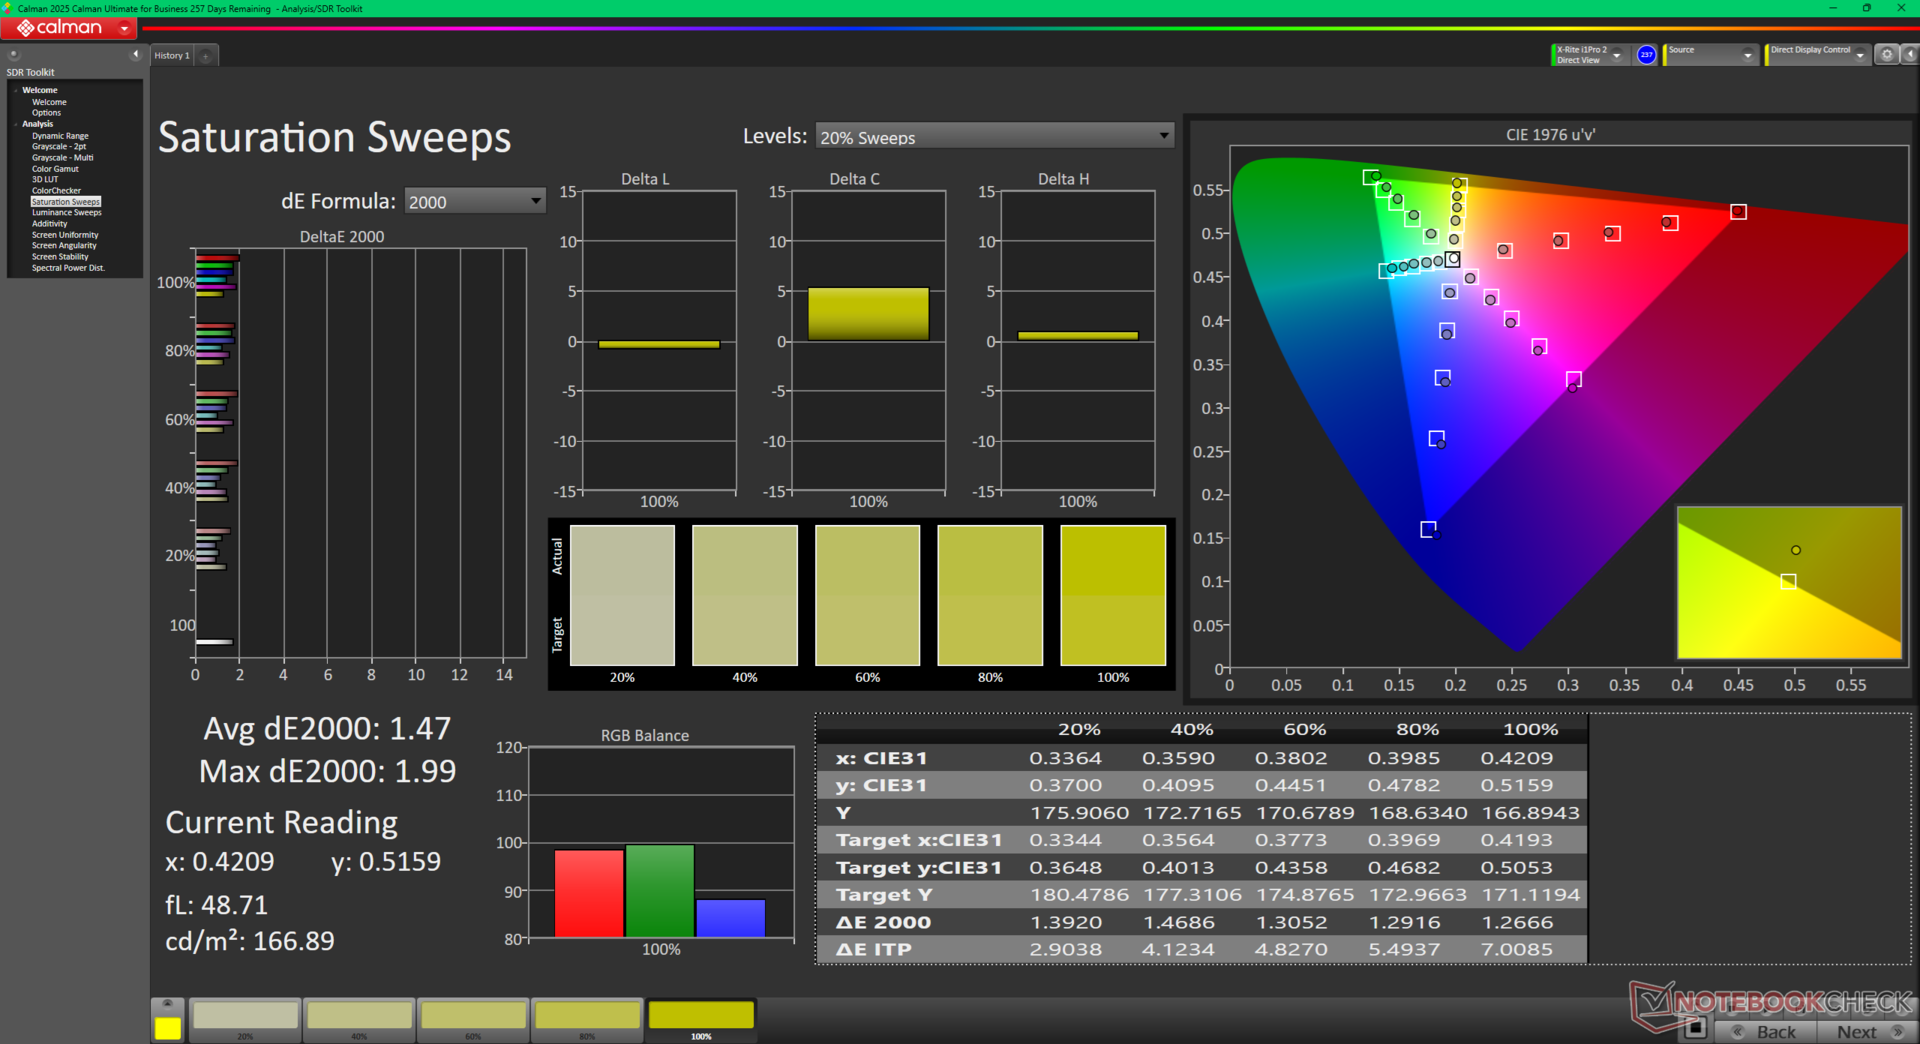
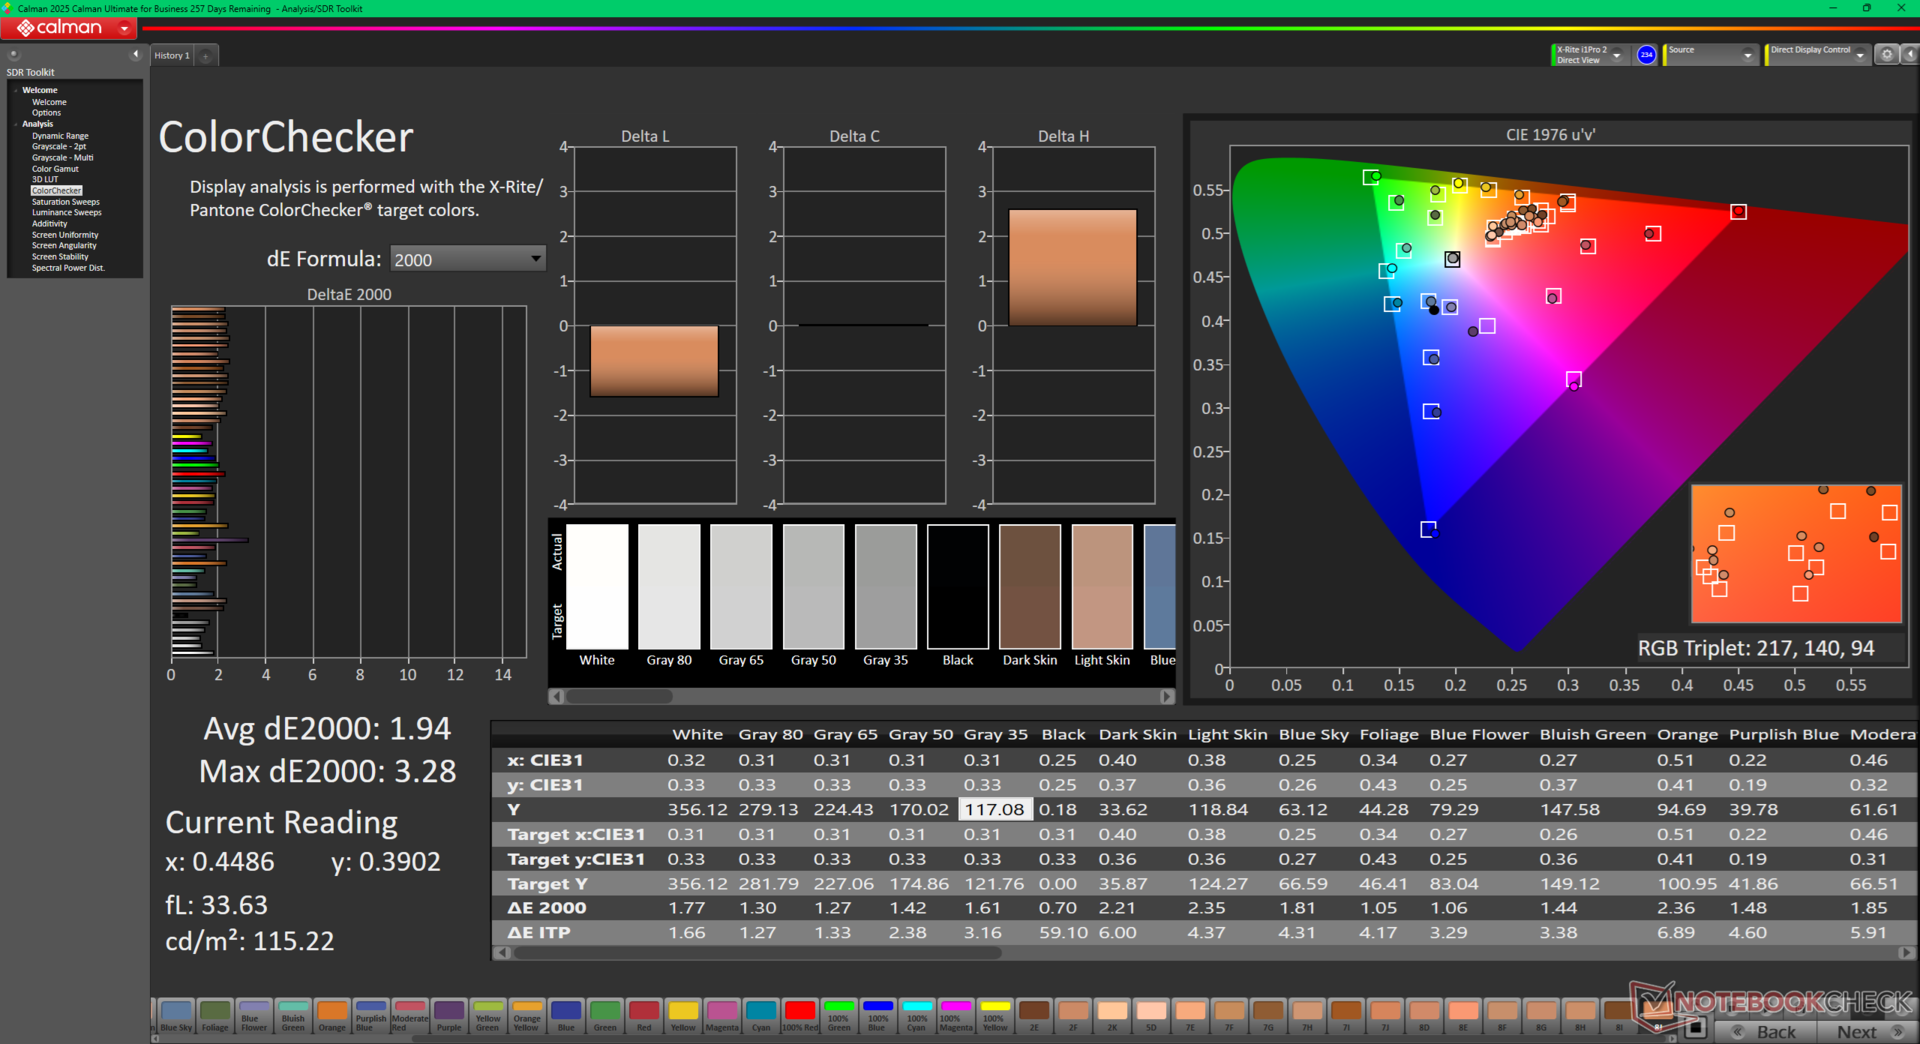
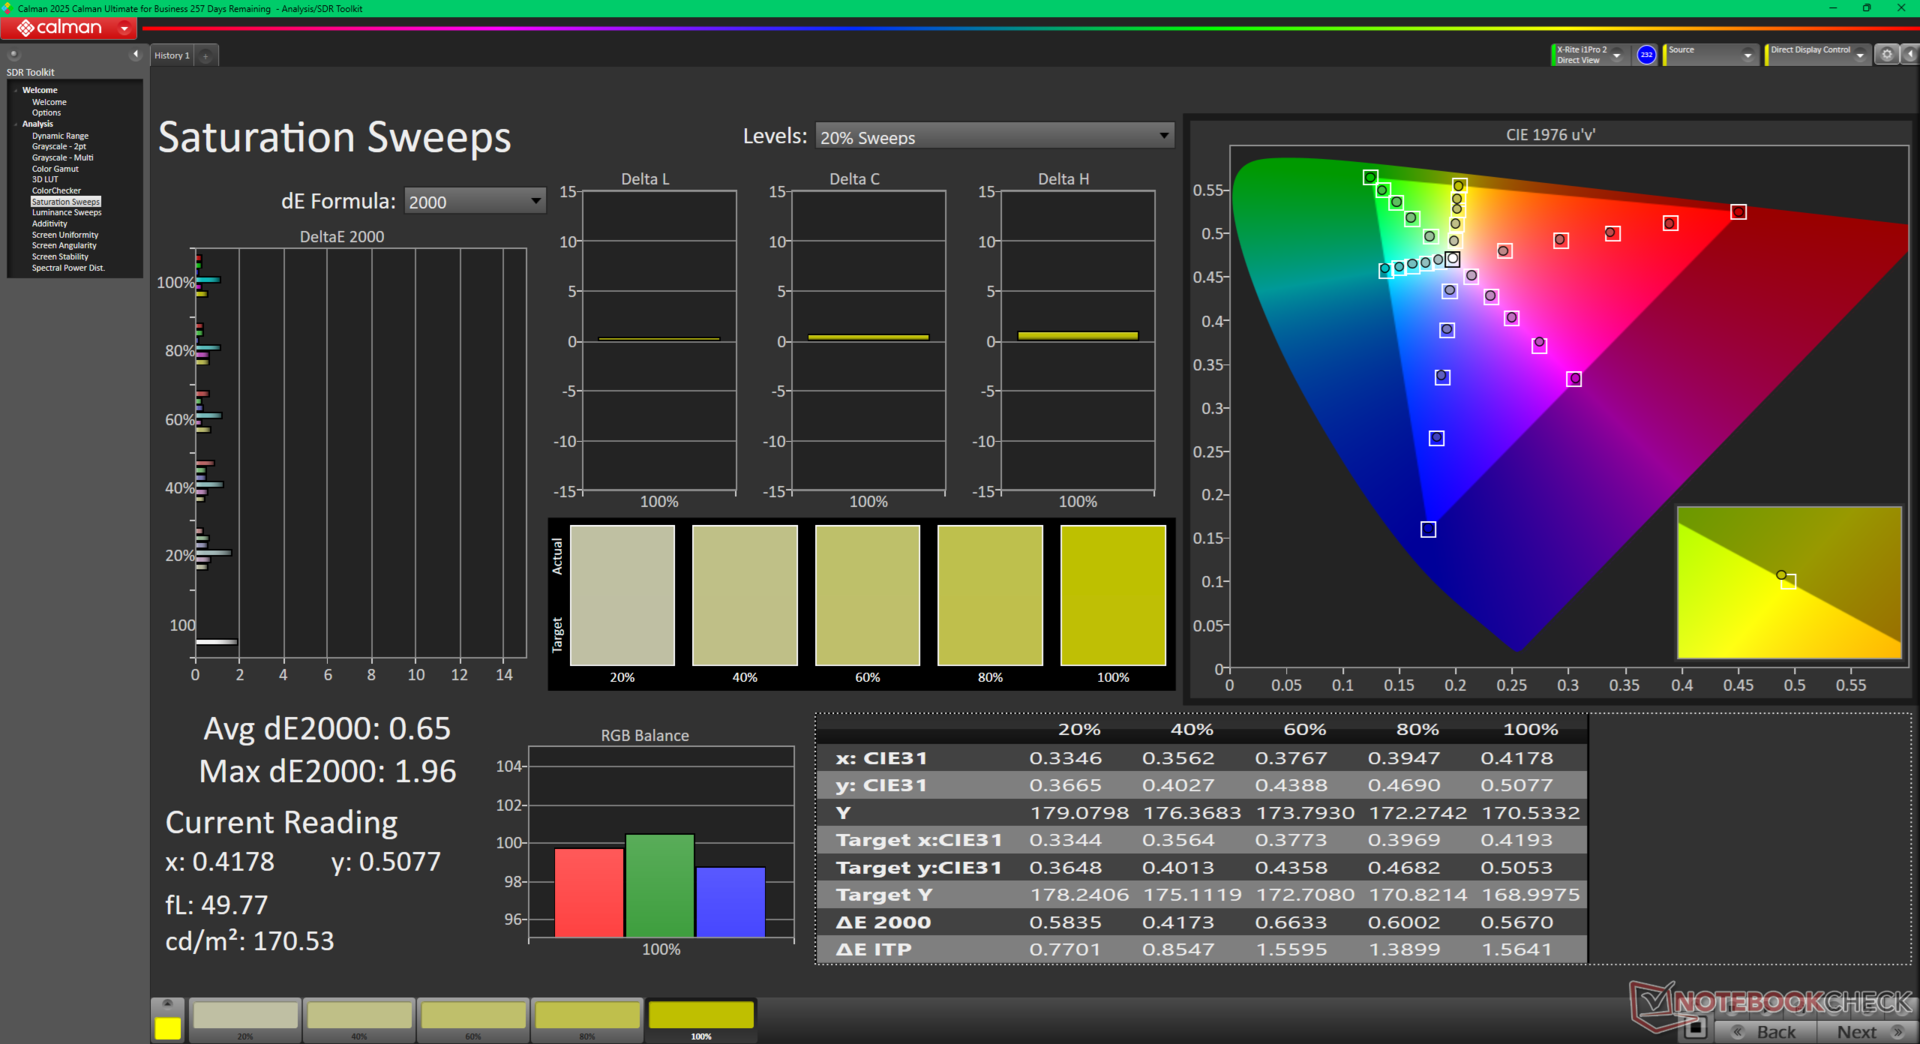
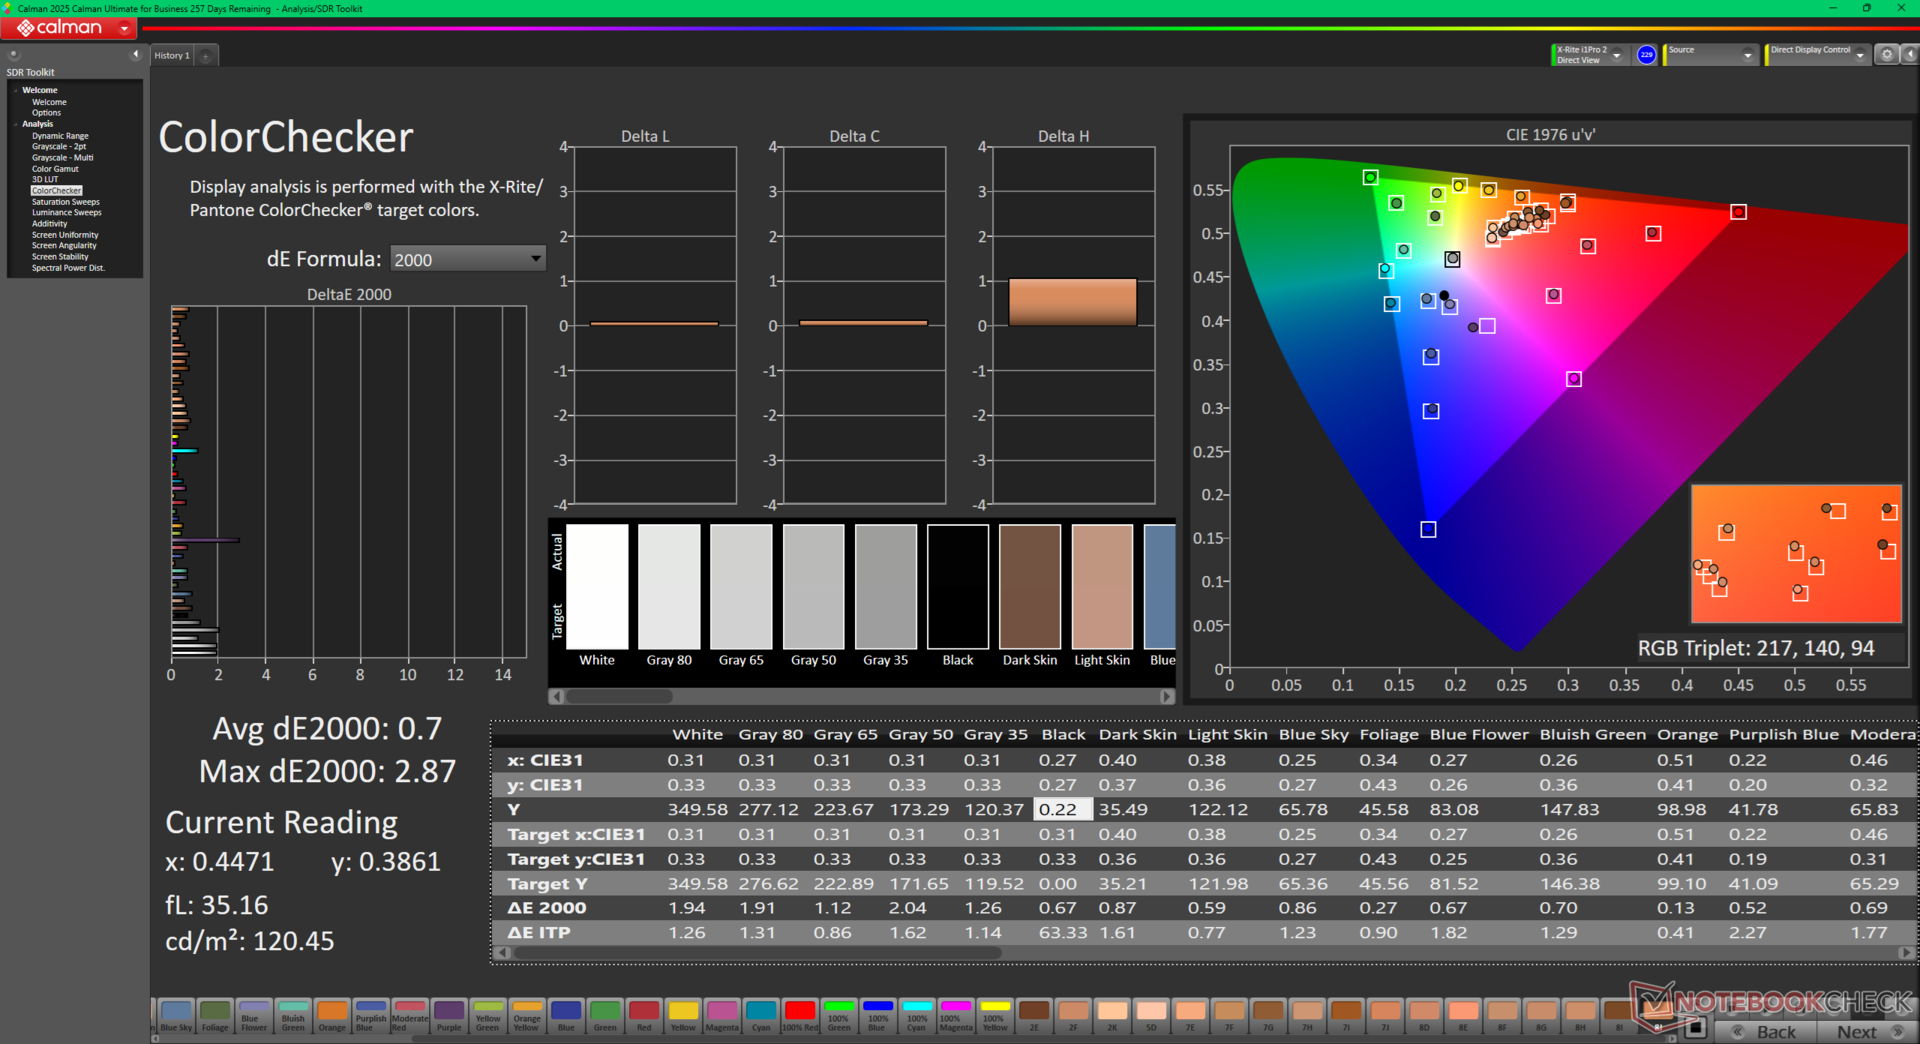
ΔE ColorChecker Calman: 1.94 | ∀{0.5-29.43 Ø4.8}
calibrated: 0.7
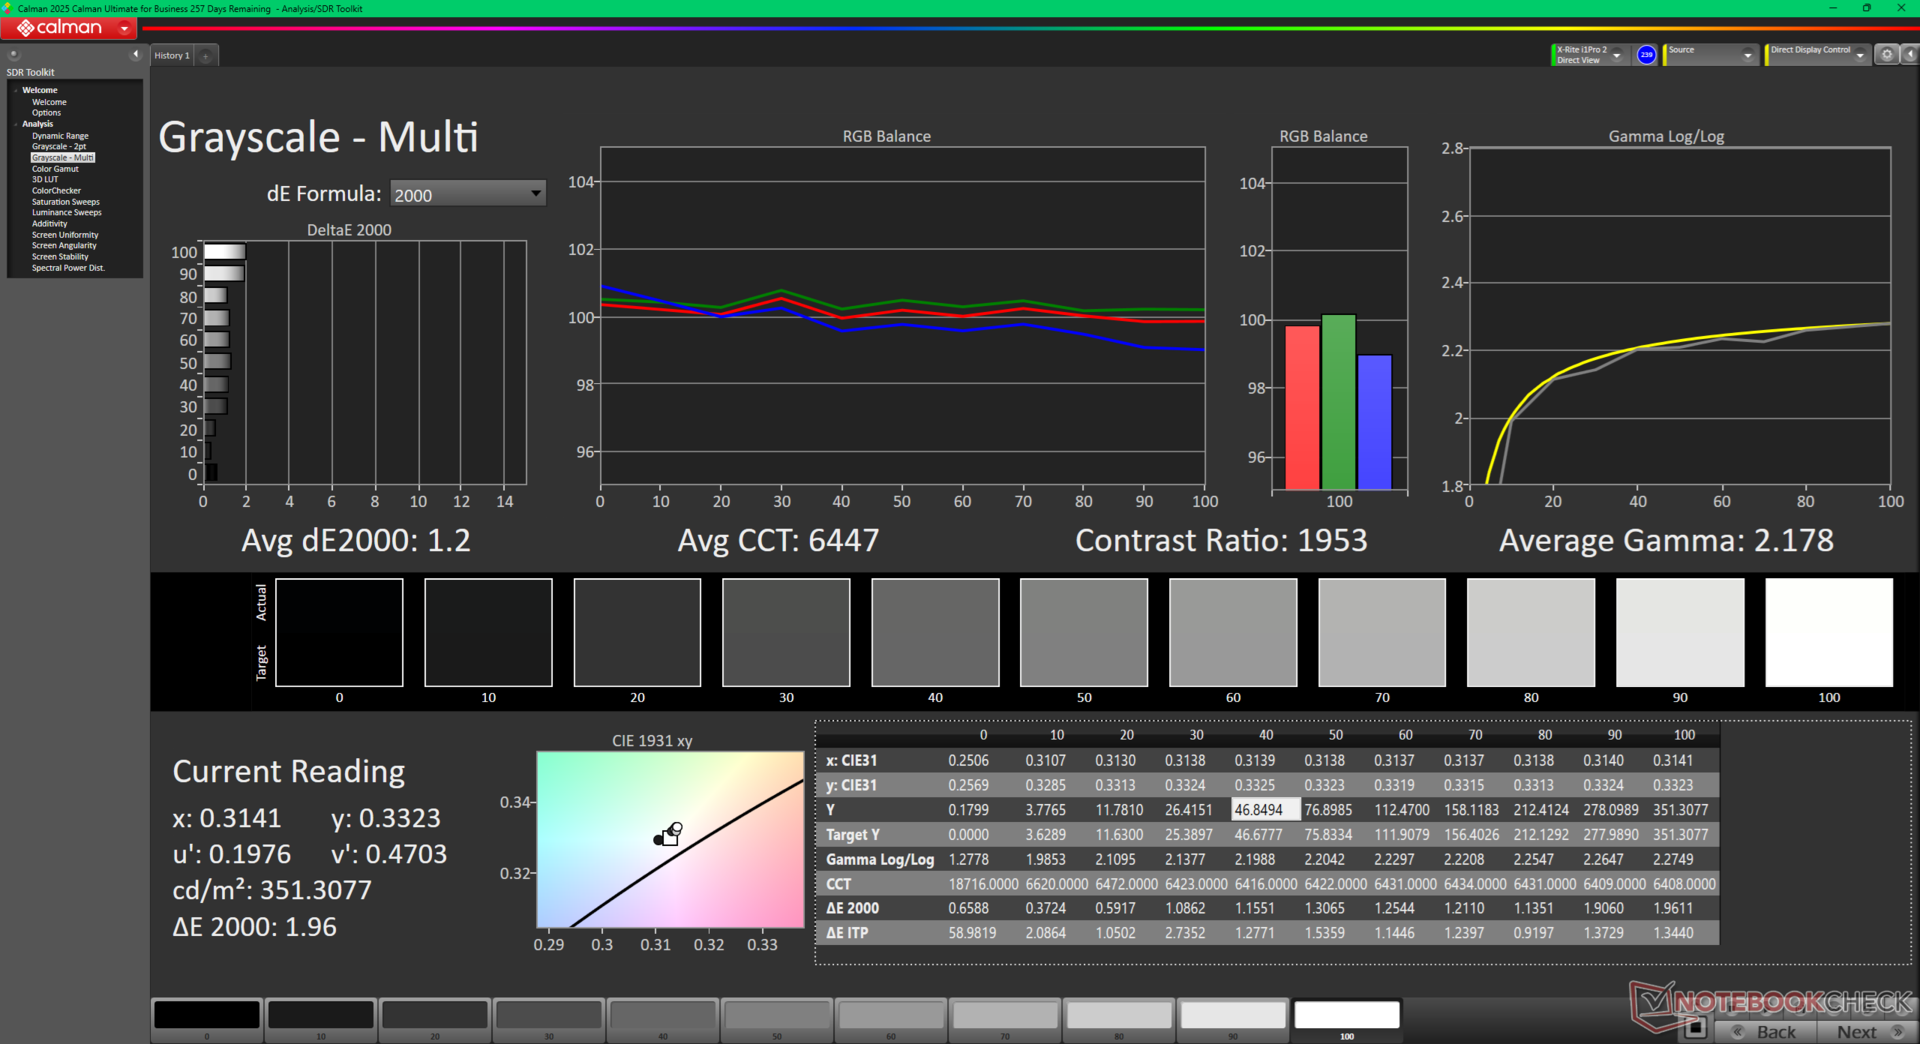
ΔE Greyscale Calman: 1.4 | ∀{0.09-98 Ø5.1}
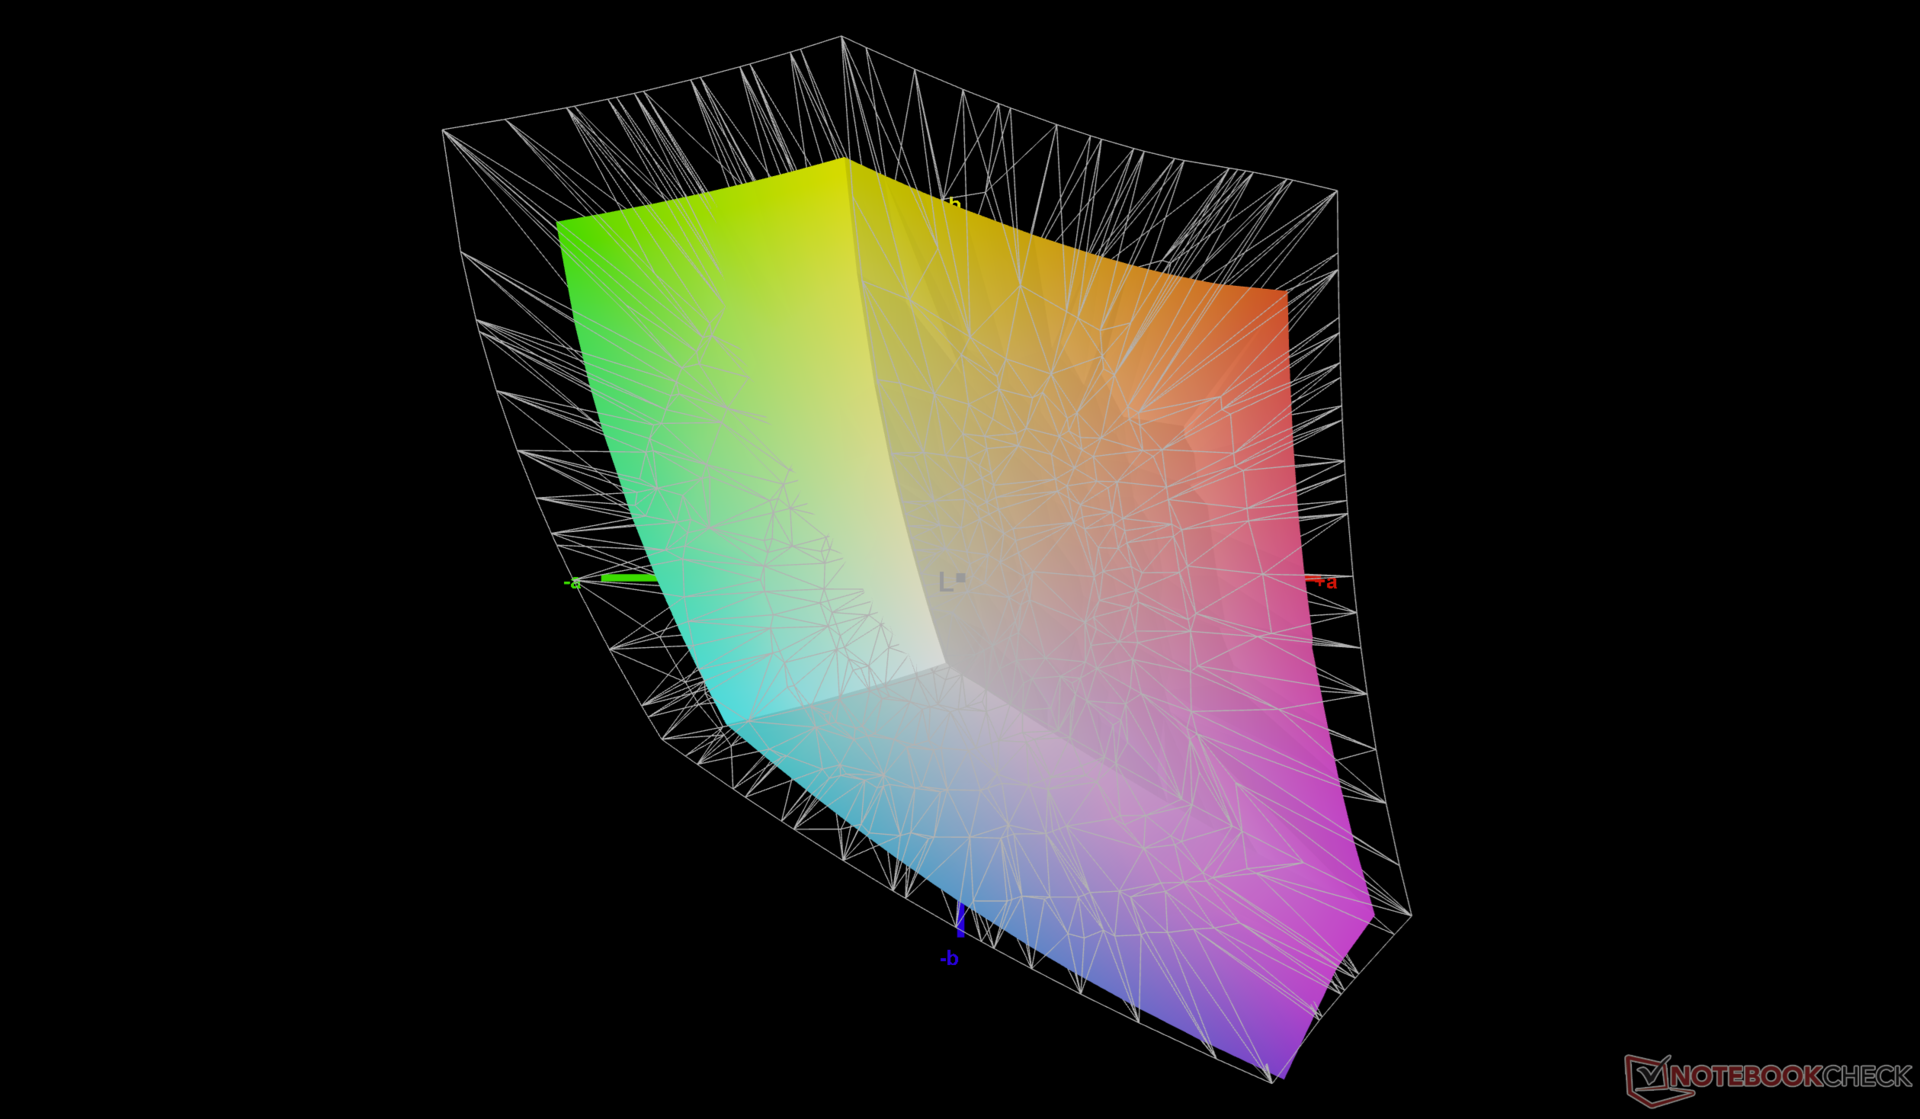
71.9% AdobeRGB 1998 (Argyll 3D)
99.9% sRGB (Argyll 3D)
71.7% Display P3 (Argyll 3D)
Gamma: 2.25
CCT: 6453 K
| Dell 14 Plus BOE NE14N42, IPS, 2560x1600, 14", 90 Hz | Dell Inspiron 14 5425 6VPKR BOE NV14N42, IPS, 1920x1200, 14", 60 Hz | Dell Latitude 3440 BOE NE140FH, IPS, 1920x1080, 14", 60 Hz | Lenovo IdeaPad Pro 5 14AKP G10 LEN140WQ+, OLED, 2880x1800, 14", 120 Hz | Lenovo ThinkPad E14 G6 AU Optronics B140UAN03.2, IPS, 1920x1200, 14", 60 Hz | HP Pavilion Plus 14-ew0153TU Samsung SDC4197, OLED, 2880x1800, 14", 120 Hz | |
|---|---|---|---|---|---|---|
| Display | -44% | -42% | 23% | -40% | 22% | |
| Display P3 Coverage (%) | 71.7 | 39.2 -45% | 40.4 -44% | 99.9 39% | 41.3 -42% | 97.9 37% |
| sRGB Coverage (%) | 99.9 | 57.4 -43% | 60.7 -39% | 100 0% | 61.8 -38% | 99.6 0% |
| AdobeRGB 1998 Coverage (%) | 71.9 | 40.5 -44% | 41.8 -42% | 94.5 31% | 42.7 -41% | 92.1 28% |
| Response Times | 43% | -1% | 99% | 29% | 69% | |
| Response Time Grey 50% / Grey 80% * (ms) | 42.7 ? | 23 ? 46% | 35.3 ? 17% | 0.39 ? 99% | 28.8 ? 33% | 10.8 ? 75% |
| Response Time Black / White * (ms) | 25.2 ? | 15 ? 40% | 29.8 ? -18% | 0.49 ? 98% | 19.1 ? 24% | 9.29 ? 63% |
| PWM Frequency (Hz) | 1200 ? | 120 ? | ||||
| PWM Amplitude * (%) | 22 | |||||
| Screen | -133% | -104% | 17% | -109% | 234% | |
| Brightness middle (cd/m²) | 354 | 292 -18% | 292.6 -17% | 473 34% | 369.9 4% | 387 9% |
| Brightness (cd/m²) | 333 | 279 -16% | 270 -19% | 474 42% | 361 8% | 387 16% |
| Brightness Distribution (%) | 92 | 90 -2% | 88 -4% | 99 8% | 93 1% | 97 5% |
| Black Level * (cd/m²) | 0.21 | 0.34 -62% | 0.19 10% | 0.24 -14% | 0.01 95% | |
| Contrast (:1) | 1686 | 859 -49% | 1540 -9% | 1541 -9% | 38700 2195% | |
| Colorchecker dE 2000 * | 1.94 | 6.26 -223% | 4.63 -139% | 1.2 38% | 5.2 -168% | 2.03 -5% |
| Colorchecker dE 2000 max. * | 3.28 | 19.14 -484% | 17.1 -421% | 3.8 -16% | 18.41 -461% | 3.86 -18% |
| Colorchecker dE 2000 calibrated * | 0.7 | 2.13 -204% | 2.04 -191% | 1.6 -129% | ||
| Greyscale dE 2000 * | 1.4 | 4.31 -208% | 3.2 -129% | 1.5 -7% | 3.5 -150% | 2.3 -64% |
| Gamma | 2.25 98% | 2.27 97% | 2.34 94% | 2.27 97% | 2.06 107% | 2.23 99% |
| CCT | 6453 101% | 6102 107% | 7184 90% | 6214 105% | 6204 105% | 6523 100% |
| Moyenne finale (programmes/paramètres) | -45% /
-85% | -49% /
-76% | 46% /
33% | -40% /
-75% | 108% /
165% |
* ... Moindre est la valeur, meilleures sont les performances
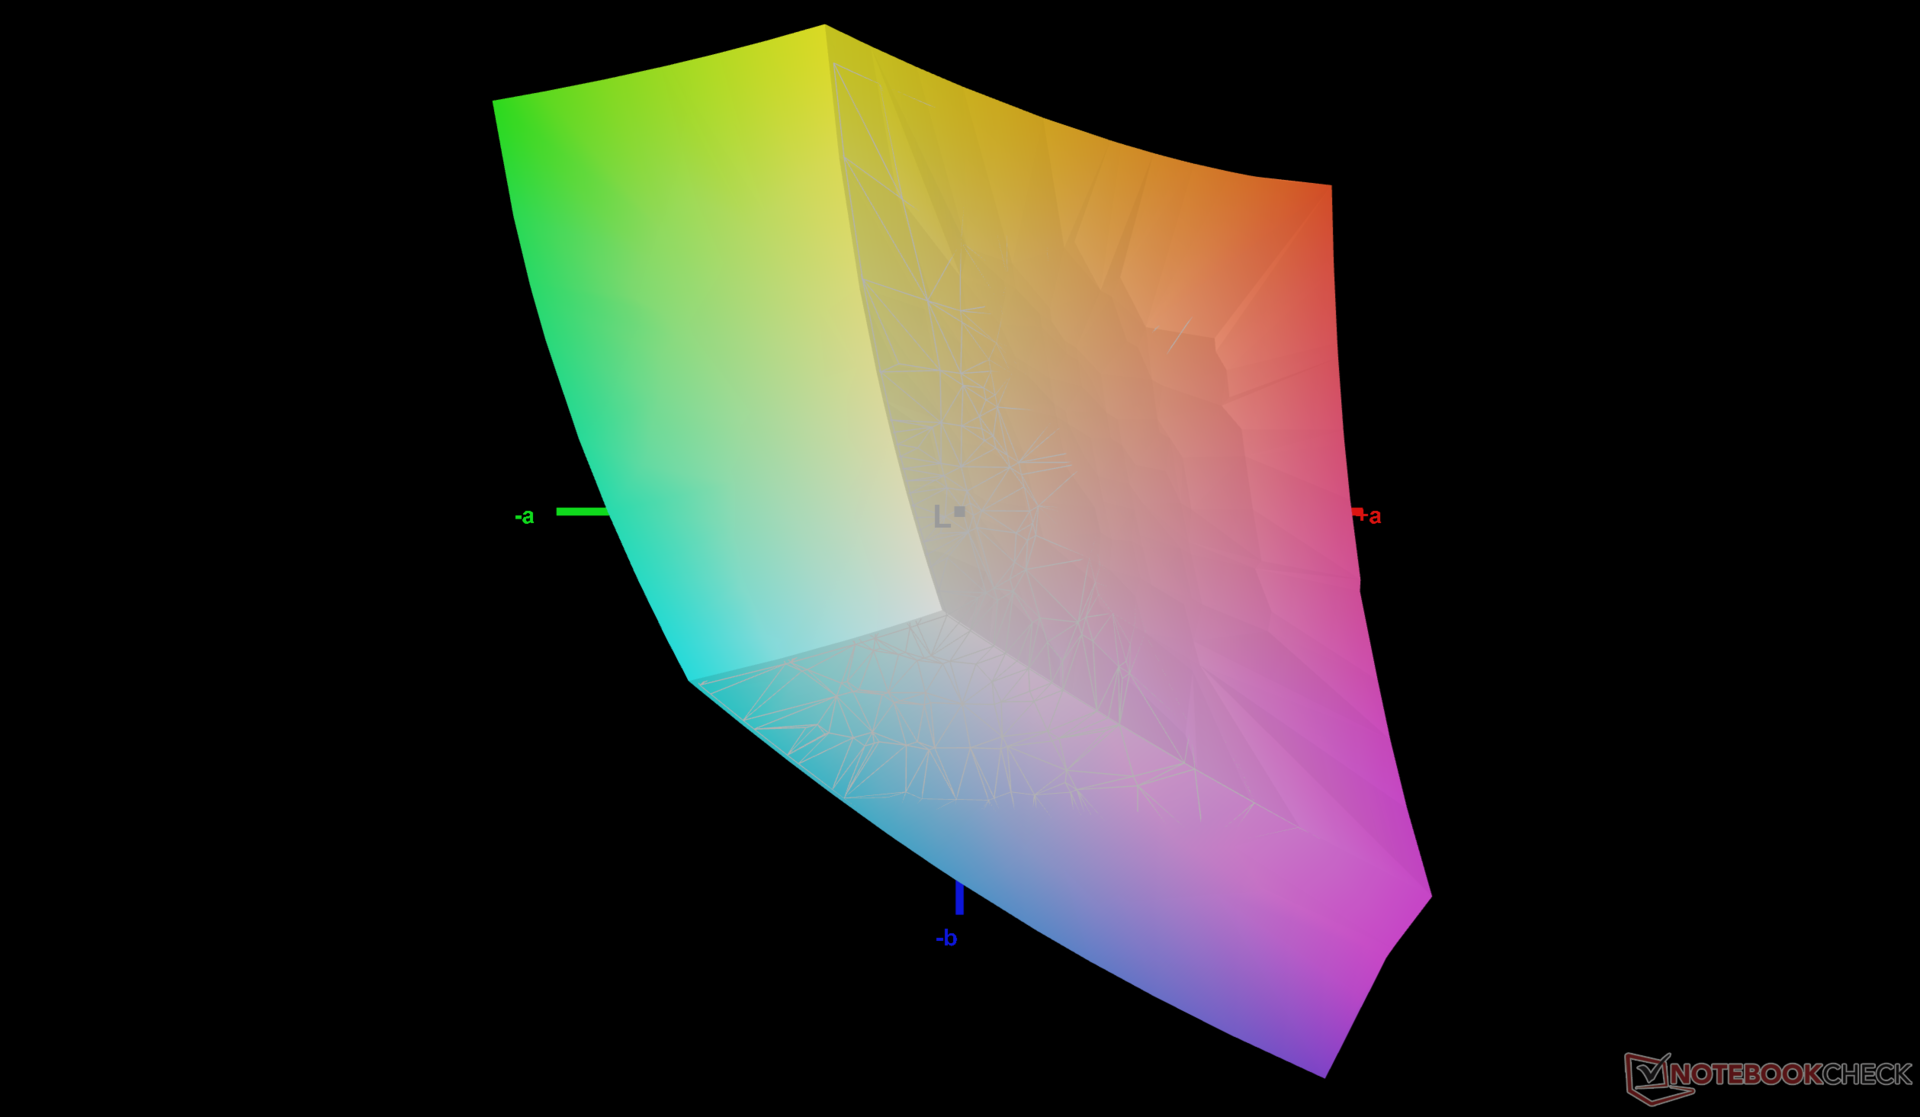
Le Dell 14 Plus est l'un des rares ordinateurs portables bon marché à être livré bien calibré avec la certification TUV. Les valeurs DeltaE moyennes en niveaux de gris et en couleurs ne sont que de 1,4 et 1,89, respectivement, même avant toute tentative d'étalonnage par l'utilisateur final.

Temps de réponse de l'écran
| ↔ Temps de réponse noir à blanc | ||
|---|---|---|
| 25.2 ms ... hausse ↗ et chute ↘ combinées | ↗ 12.7 ms hausse |  |
| ↘ 12.5 ms chute | ||
| L'écran souffre de latences relativement élevées, insuffisant pour le jeu. En comparaison, tous les appareils testés affichent entre 0.1 (minimum) et 240 (maximum) ms. » 59 % des appareils testés affichent de meilleures performances. Cela signifie que les latences relevées sont moins bonnes que la moyenne (20.3 ms) de tous les appareils testés. | ||
| ↔ Temps de réponse gris 50% à gris 80% | ||
| 42.7 ms ... hausse ↗ et chute ↘ combinées | ↗ 20.2 ms hausse | 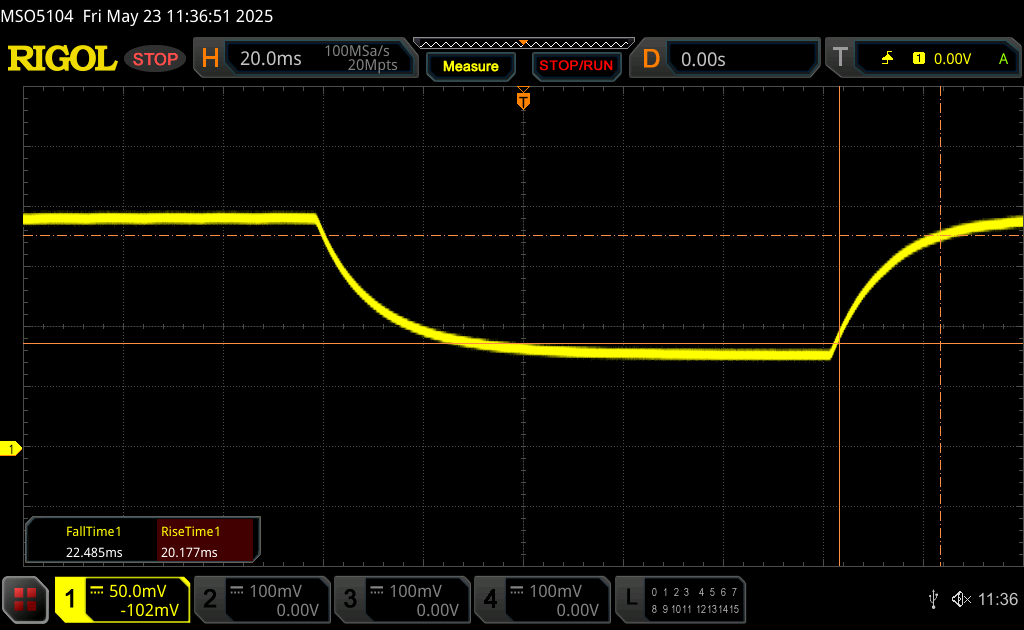 |
| ↘ 22.5 ms chute | ||
| L'écran souffre de latences très élevées, à éviter pour le jeu. En comparaison, tous les appareils testés affichent entre 0.165 (minimum) et 636 (maximum) ms. » 69 % des appareils testés affichent de meilleures performances. Cela signifie que les latences relevées sont moins bonnes que la moyenne (31.8 ms) de tous les appareils testés. | ||
Scintillement / MLI (Modulation de largeur d'impulsion)
| Scintillement / MLI (Modulation de largeur d'impulsion) non décelé | 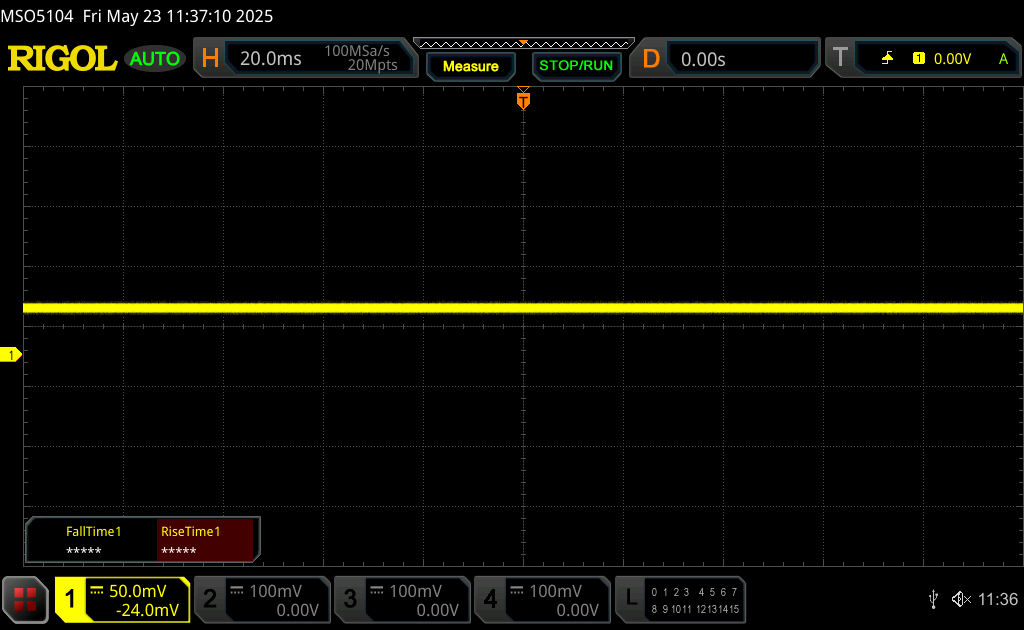 | ||
En comparaison, 53 % des appareils testés n'emploient pas MDI pour assombrir leur écran. Nous avons relevé une moyenne à 8215 (minimum : 5 - maximum : 343500) Hz dans le cas où une MDI était active. | |||

Performance
Conditions d'essai
Nous avons réglé Windows sur le mode Performance avant d'effectuer les tests ci-dessous.
Processeur
Les performances brutes de l'unité centrale sont comparables à celles de l'ancienne Core Ultra 7 155U. Les principaux avantages du nouveau Core Ultra 7 256V résident dans la performance par watt, le NPU intégré, la RAM plus rapide et le GPU intégré amélioré.
La durabilité du Turbo Boost pourrait être meilleure ; les performances chutent d'environ 17% au fil du temps lorsque l'on exécute CineBench R15 xT en boucle, comme le montre notre graphique de comparaison ci-dessous.
Cinebench R15 Multi Loop
Cinebench R23: Multi Core | Single Core
Cinebench R20: CPU (Multi Core) | CPU (Single Core)
Cinebench R15: CPU Multi 64Bit | CPU Single 64Bit
Blender: v2.79 BMW27 CPU
7-Zip 18.03: 7z b 4 | 7z b 4 -mmt1
Geekbench 6.5: Multi-Core | Single-Core
Geekbench 5.5: Multi-Core | Single-Core
HWBOT x265 Benchmark v2.2: 4k Preset
LibreOffice : 20 Documents To PDF
R Benchmark 2.5: Overall mean
* ... Moindre est la valeur, meilleures sont les performances
AIDA64: FP32 Ray-Trace | FPU Julia | CPU SHA3 | CPU Queen | FPU SinJulia | FPU Mandel | CPU AES | CPU ZLib | FP64 Ray-Trace | CPU PhotoWorxx
| Performance rating | |
| Lenovo IdeaPad Pro 5 14AKP G10 | |
| Moyenne Intel Core Ultra 7 256V | |
| Dell 14 Plus | |
| Lenovo ThinkPad E14 G6 | |
| Dell Inspiron 14 5425 6VPKR | |
| Dell Latitude 3440 | |
| HP Pavilion Plus 14-ew0153TU | |
| AIDA64 / FP32 Ray-Trace | |
| Lenovo IdeaPad Pro 5 14AKP G10 | |
| Dell 14 Plus | |
| Moyenne Intel Core Ultra 7 256V (10524 - 12812, n=6) | |
| Dell Inspiron 14 5425 6VPKR | |
| Lenovo ThinkPad E14 G6 | |
| Dell Latitude 3440 | |
| HP Pavilion Plus 14-ew0153TU | |
| AIDA64 / FPU Julia | |
| Lenovo IdeaPad Pro 5 14AKP G10 | |
| Dell Inspiron 14 5425 6VPKR | |
| Moyenne Intel Core Ultra 7 256V (52443 - 61614, n=6) | |
| Dell 14 Plus | |
| Lenovo ThinkPad E14 G6 | |
| Dell Latitude 3440 | |
| HP Pavilion Plus 14-ew0153TU | |
| AIDA64 / CPU SHA3 | |
| Lenovo IdeaPad Pro 5 14AKP G10 | |
| Moyenne Intel Core Ultra 7 256V (2364 - 2814, n=6) | |
| Lenovo ThinkPad E14 G6 | |
| Dell 14 Plus | |
| Dell Inspiron 14 5425 6VPKR | |
| Dell Latitude 3440 | |
| HP Pavilion Plus 14-ew0153TU | |
| AIDA64 / CPU Queen | |
| Lenovo IdeaPad Pro 5 14AKP G10 | |
| Dell Inspiron 14 5425 6VPKR | |
| Dell Latitude 3440 | |
| HP Pavilion Plus 14-ew0153TU | |
| Dell 14 Plus | |
| Moyenne Intel Core Ultra 7 256V (49622 - 49794, n=6) | |
| Lenovo ThinkPad E14 G6 | |
| AIDA64 / FPU SinJulia | |
| Lenovo IdeaPad Pro 5 14AKP G10 | |
| Dell Inspiron 14 5425 6VPKR | |
| Lenovo ThinkPad E14 G6 | |
| Dell Latitude 3440 | |
| Dell 14 Plus | |
| Moyenne Intel Core Ultra 7 256V (4401 - 4431, n=6) | |
| HP Pavilion Plus 14-ew0153TU | |
| AIDA64 / FPU Mandel | |
| Lenovo IdeaPad Pro 5 14AKP G10 | |
| Dell Inspiron 14 5425 6VPKR | |
| Moyenne Intel Core Ultra 7 256V (27382 - 32644, n=6) | |
| Dell 14 Plus | |
| Lenovo ThinkPad E14 G6 | |
| Dell Latitude 3440 | |
| HP Pavilion Plus 14-ew0153TU | |
| AIDA64 / CPU AES | |
| Lenovo IdeaPad Pro 5 14AKP G10 | |
| Lenovo ThinkPad E14 G6 | |
| Dell 14 Plus | |
| Moyenne Intel Core Ultra 7 256V (38495 - 40828, n=6) | |
| Dell Latitude 3440 | |
| Dell Inspiron 14 5425 6VPKR | |
| HP Pavilion Plus 14-ew0153TU | |
| AIDA64 / CPU ZLib | |
| Lenovo IdeaPad Pro 5 14AKP G10 | |
| Lenovo ThinkPad E14 G6 | |
| Dell 14 Plus | |
| Moyenne Intel Core Ultra 7 256V (536 - 632, n=6) | |
| Dell Latitude 3440 | |
| Dell Inspiron 14 5425 6VPKR | |
| HP Pavilion Plus 14-ew0153TU | |
| AIDA64 / FP64 Ray-Trace | |
| Lenovo IdeaPad Pro 5 14AKP G10 | |
| Moyenne Intel Core Ultra 7 256V (5655 - 6878, n=6) | |
| Dell 14 Plus | |
| Dell Inspiron 14 5425 6VPKR | |
| Lenovo ThinkPad E14 G6 | |
| Dell Latitude 3440 | |
| HP Pavilion Plus 14-ew0153TU | |
| AIDA64 / CPU PhotoWorxx | |
| Dell 14 Plus | |
| Moyenne Intel Core Ultra 7 256V (49906 - 52282, n=6) | |
| Lenovo IdeaPad Pro 5 14AKP G10 | |
| Lenovo ThinkPad E14 G6 | |
| HP Pavilion Plus 14-ew0153TU | |
| Dell Latitude 3440 | |
| Dell Inspiron 14 5425 6VPKR | |
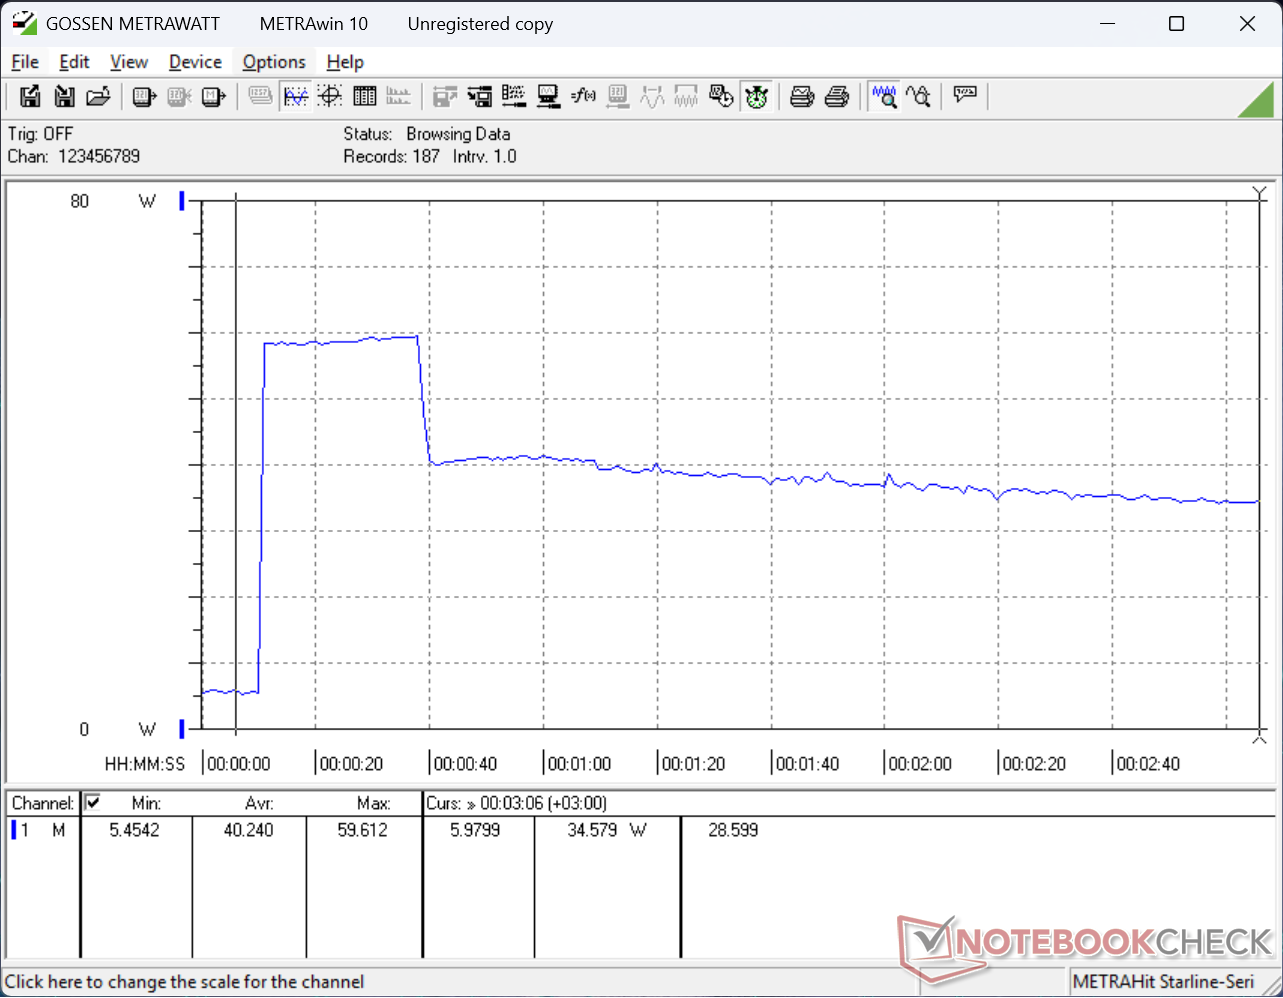
Test de stress
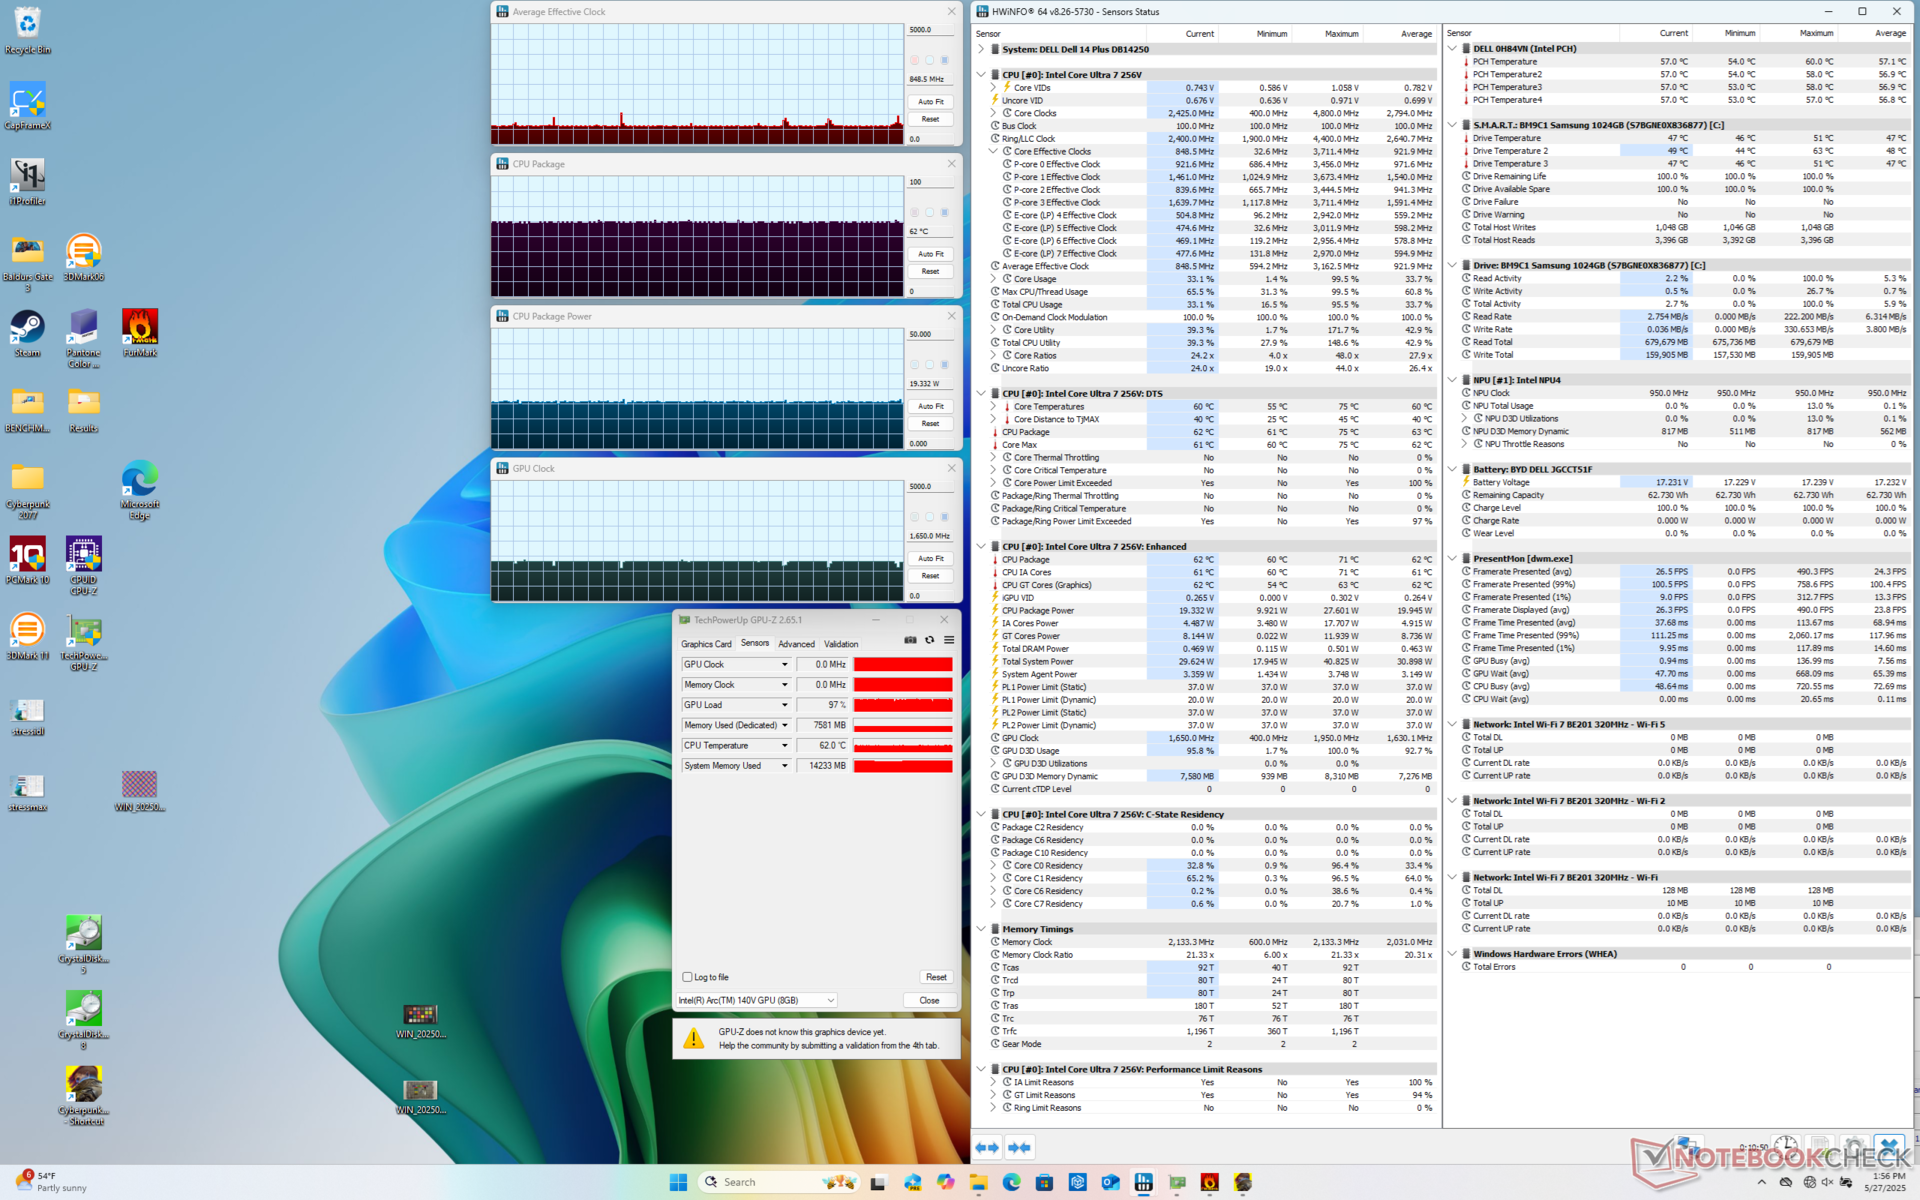
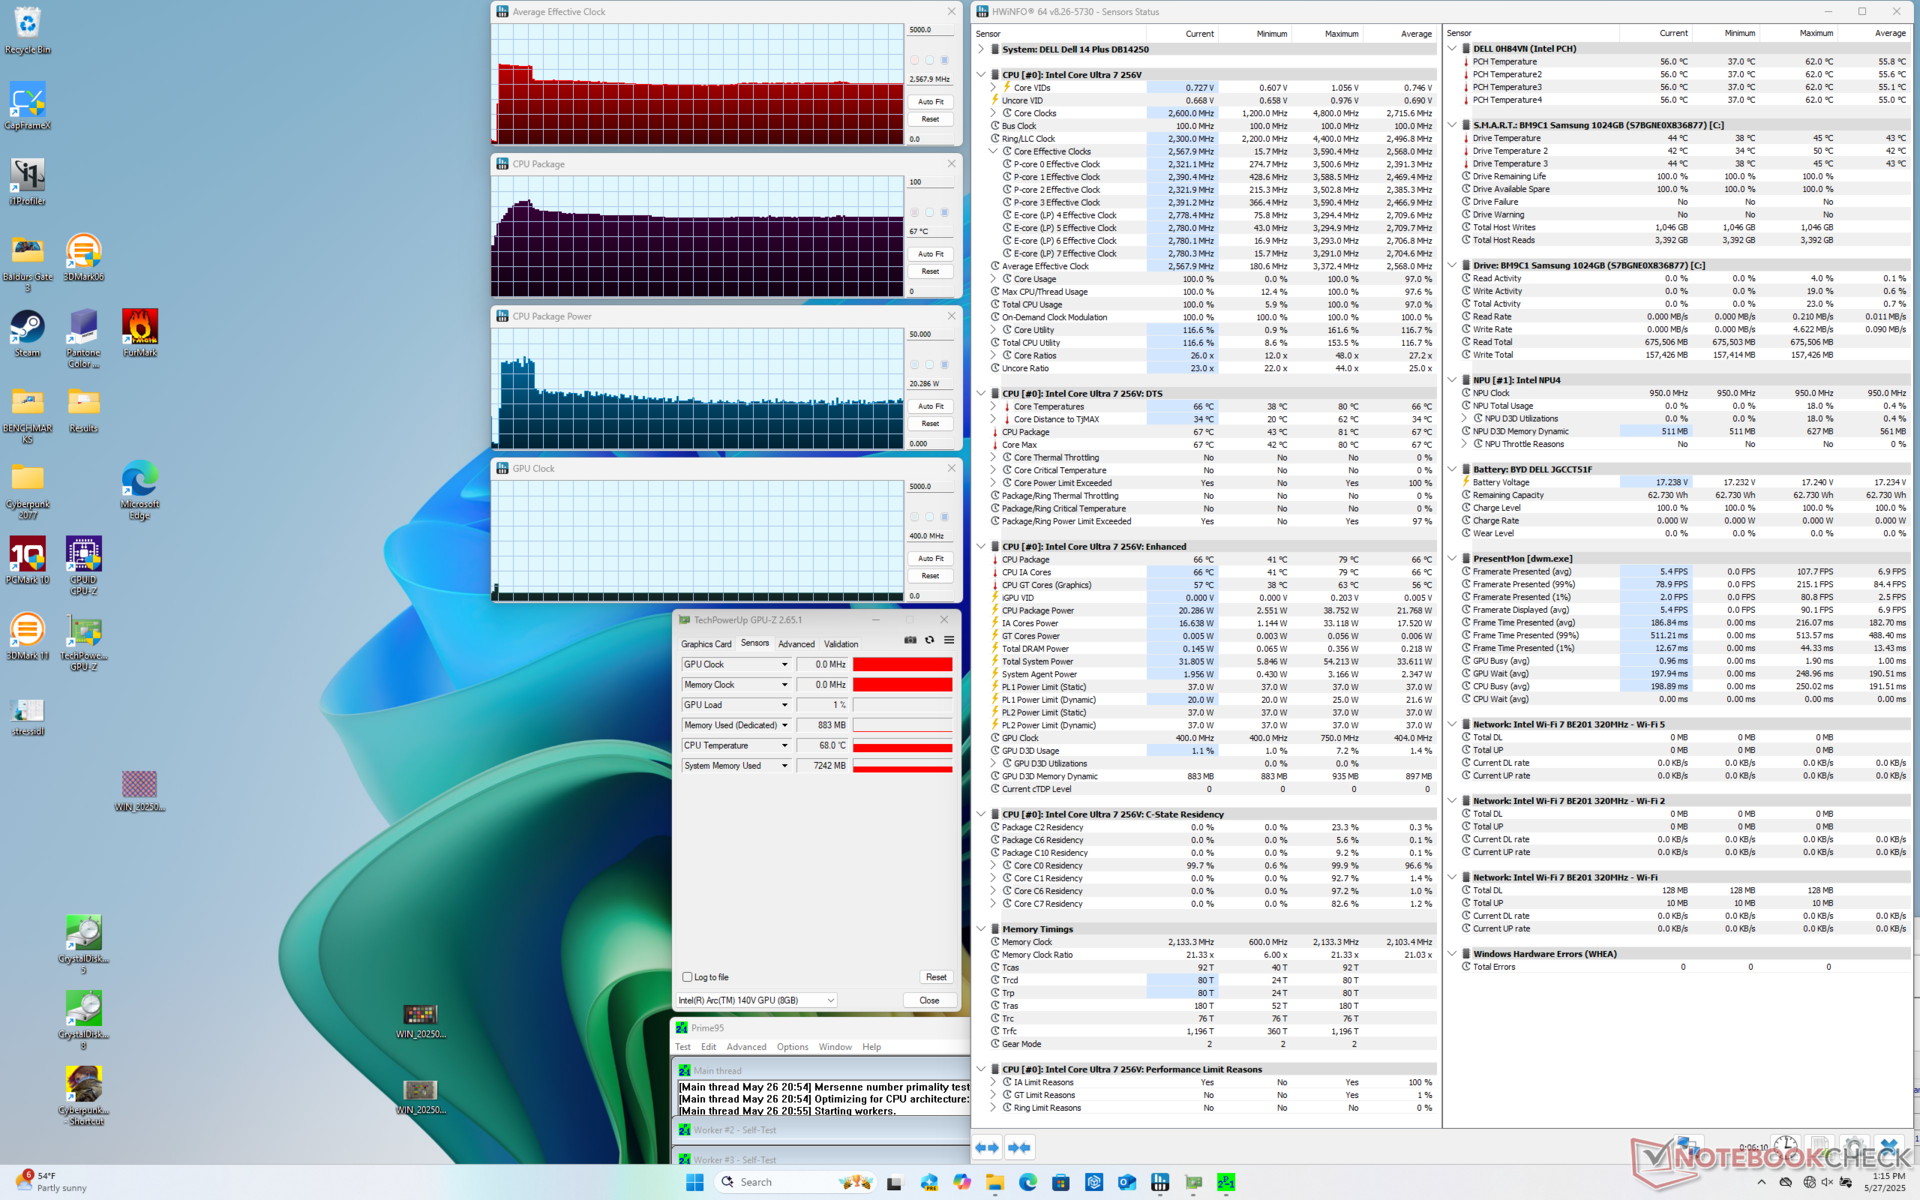
Lors de l'exécution de Prime95, le processeur atteignait 3,4 GHz et 39 W avant d'atteindre une température de 80 C environ 30 secondes plus tard. Ensuite, le processeur se stabilise à 2,6 GHz, 20 W et 67 C.
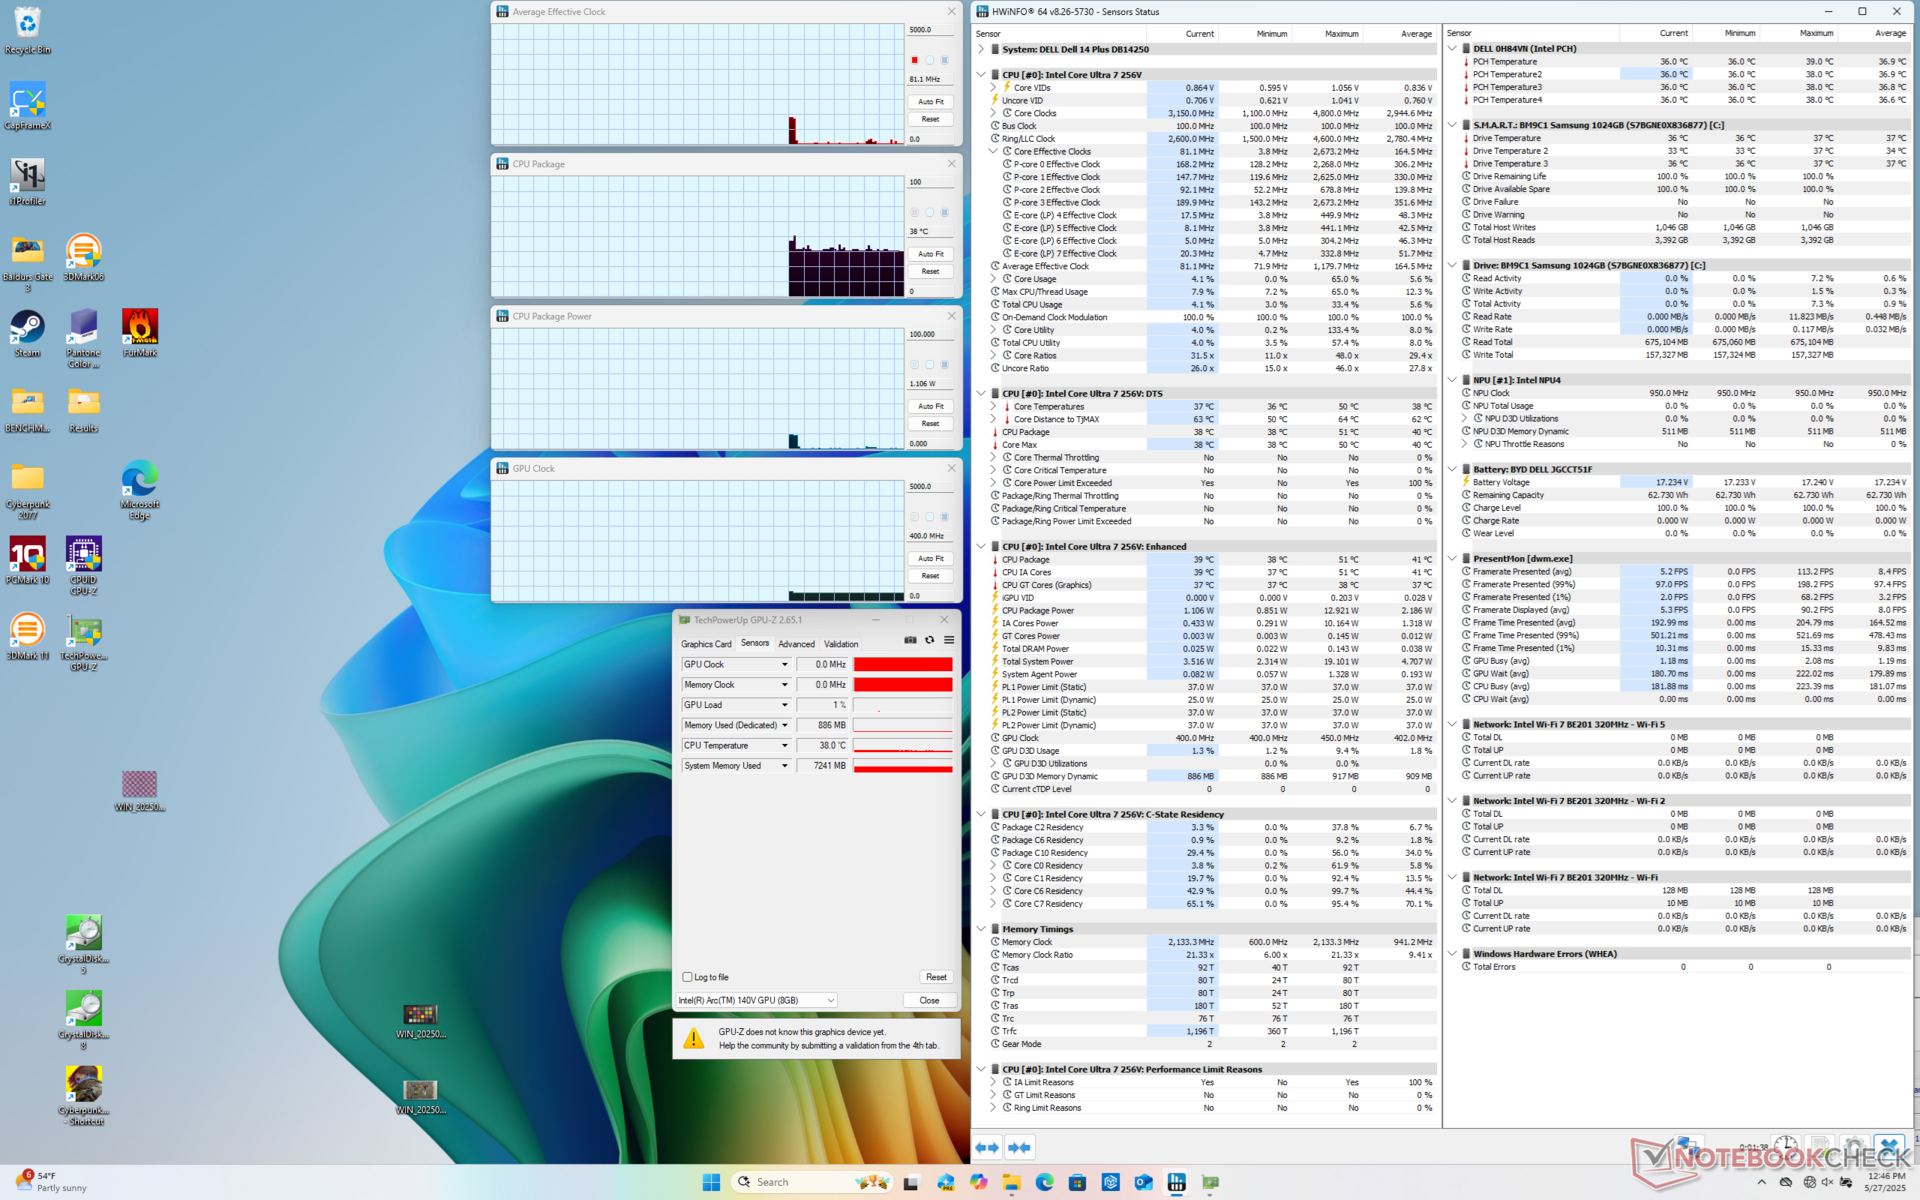
| Horloge moyenne du CPU (GHz) | Horloge du GPU (MHz) | Température moyenne du CPU (°C) | |
| Système au repos | -- | -- | 38 |
| Prime95 Stress | 2.6 | -- | 67 |
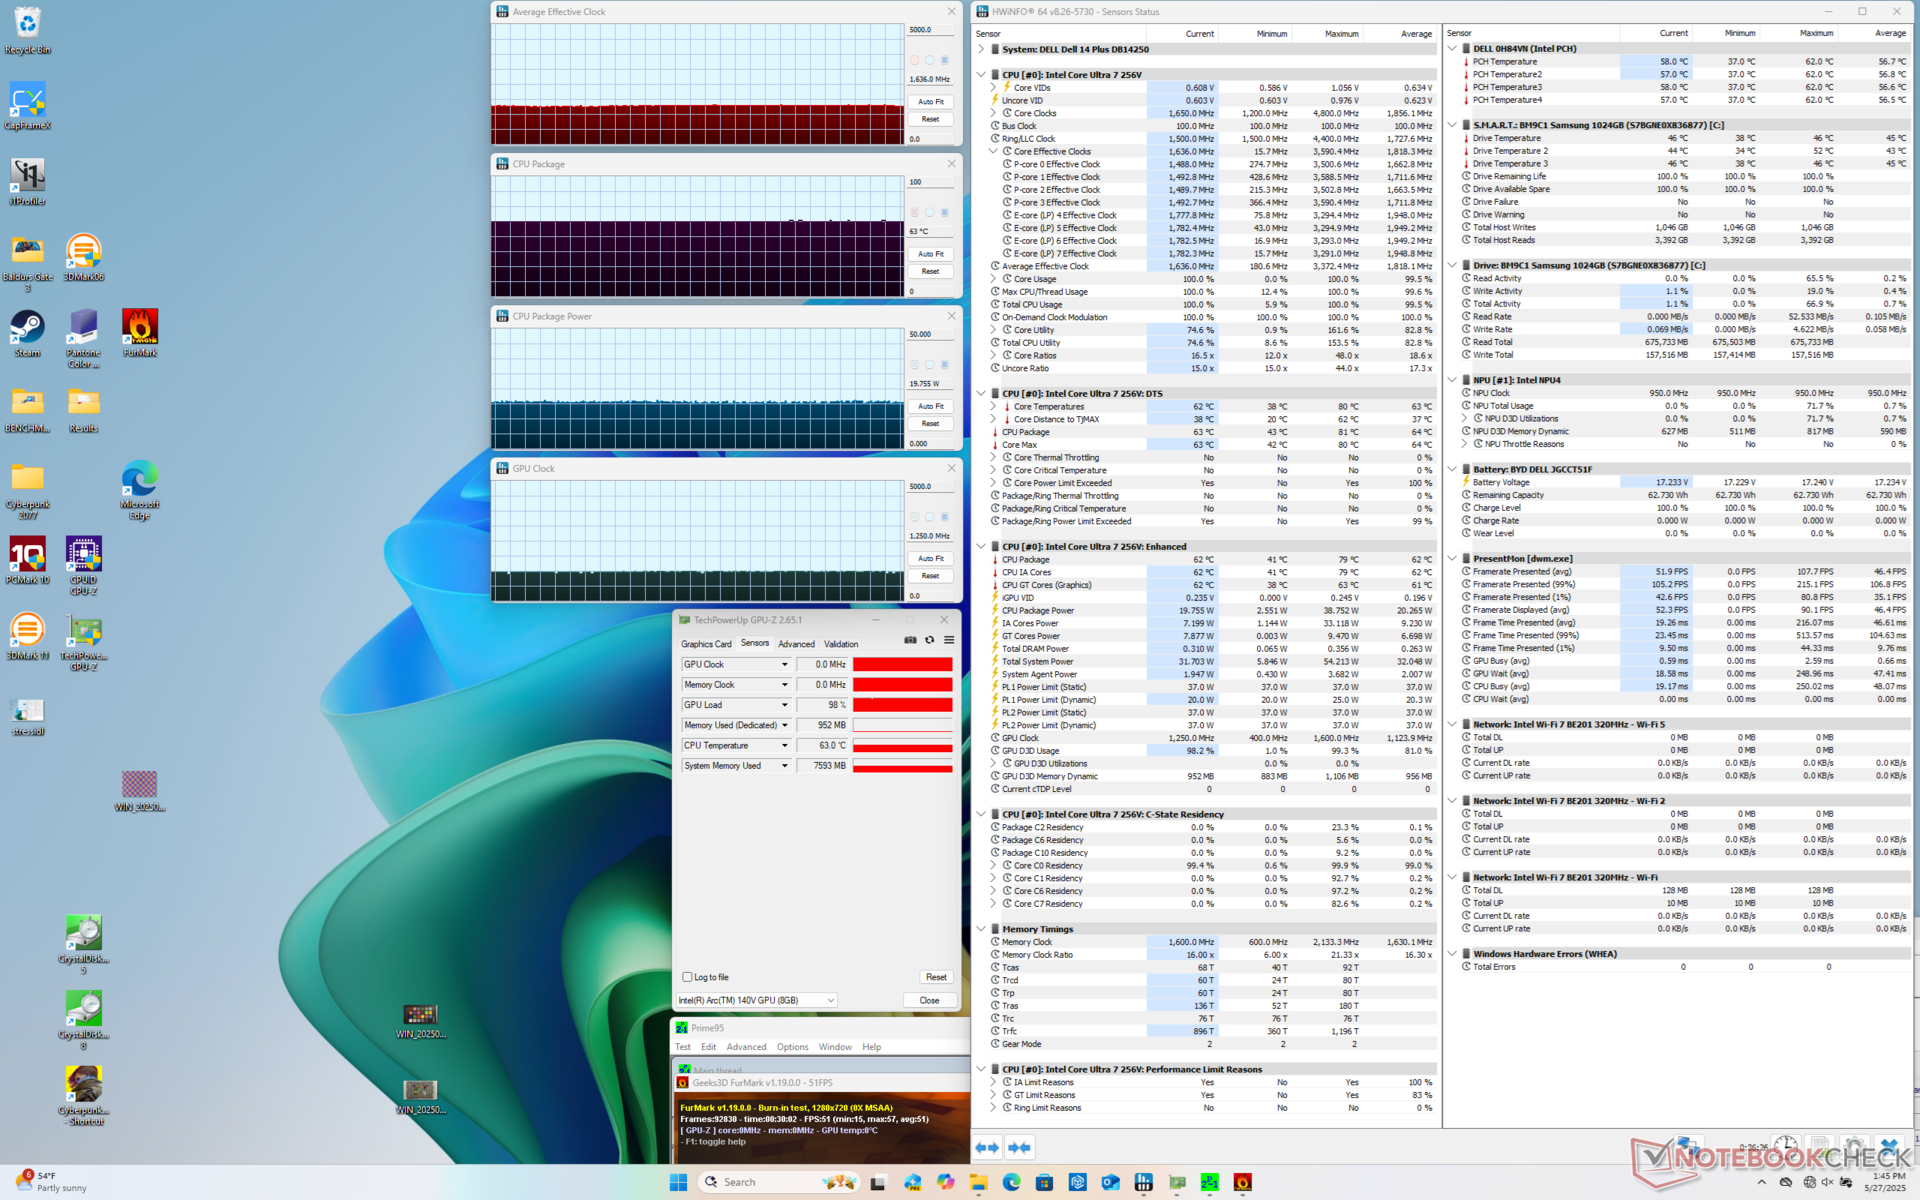
| Prime95 + FurMark Stress | 1.6 | 1250 | 63 |
| Cyberpunk 2077 Stress | 0.8 | 1650 | 62 |
Performance du système
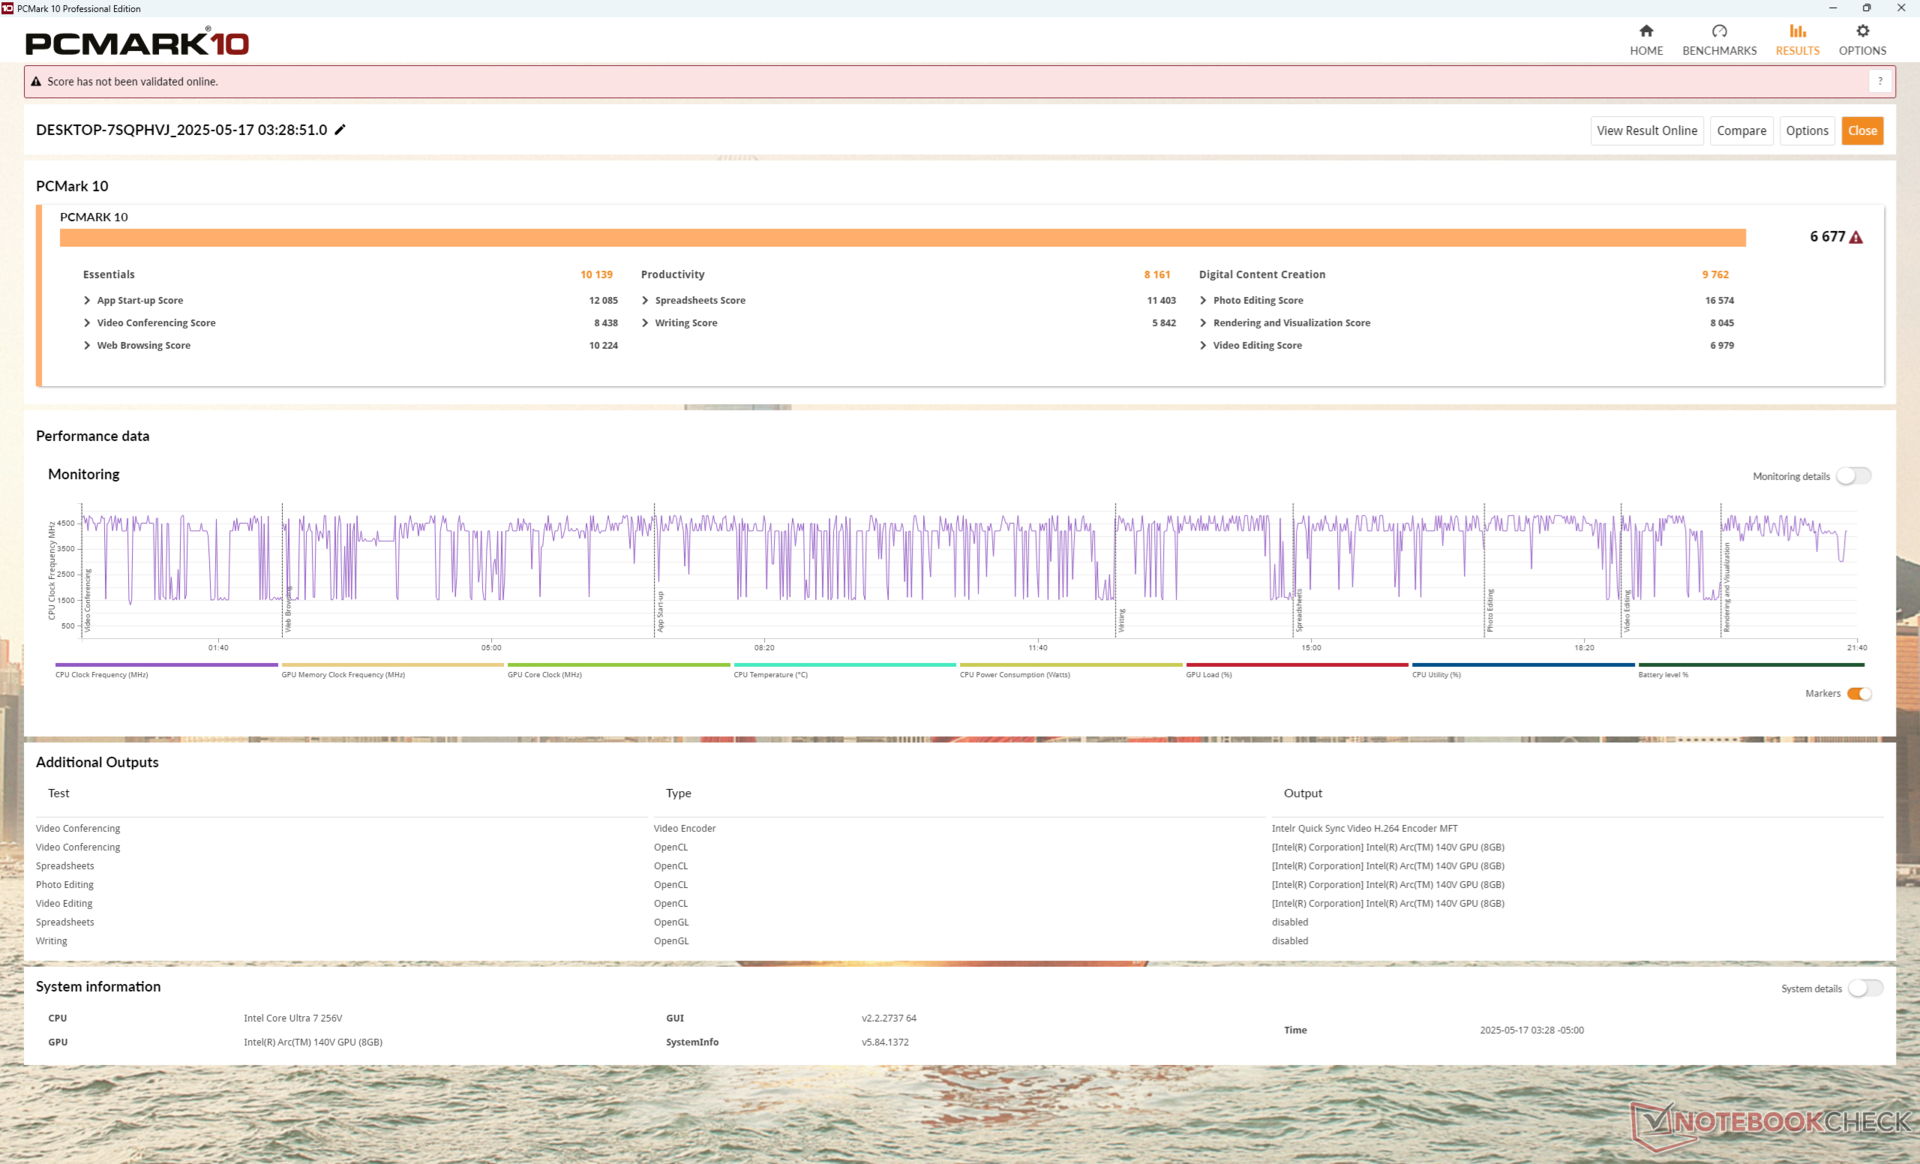
PCMark 10: Score | Essentials | Productivity | Digital Content Creation
CrossMark: Overall | Productivity | Creativity | Responsiveness
WebXPRT 3: Overall
WebXPRT 4: Overall
Mozilla Kraken 1.1: Total
| Performance rating | |
| Lenovo IdeaPad Pro 5 14AKP G10 | |
| Moyenne Intel Core Ultra 7 256V, Intel Arc Graphics 140V | |
| Dell 14 Plus | |
| Lenovo ThinkPad E14 G6 | |
| HP Pavilion Plus 14-ew0153TU | |
| Dell Latitude 3440 | |
| Dell Inspiron 14 5425 6VPKR | |
| PCMark 10 / Score | |
| Lenovo IdeaPad Pro 5 14AKP G10 | |
| Moyenne Intel Core Ultra 7 256V, Intel Arc Graphics 140V (6677 - 7367, n=6) | |
| Dell 14 Plus | |
| Lenovo ThinkPad E14 G6 | |
| Dell Inspiron 14 5425 6VPKR | |
| HP Pavilion Plus 14-ew0153TU | |
| Dell Latitude 3440 | |
| PCMark 10 / Essentials | |
| Lenovo IdeaPad Pro 5 14AKP G10 | |
| Dell Latitude 3440 | |
| Lenovo ThinkPad E14 G6 | |
| Moyenne Intel Core Ultra 7 256V, Intel Arc Graphics 140V (9627 - 11365, n=6) | |
| HP Pavilion Plus 14-ew0153TU | |
| Dell 14 Plus | |
| Dell Inspiron 14 5425 6VPKR | |
| PCMark 10 / Productivity | |
| Lenovo IdeaPad Pro 5 14AKP G10 | |
| Moyenne Intel Core Ultra 7 256V, Intel Arc Graphics 140V (8161 - 9544, n=6) | |
| Dell Inspiron 14 5425 6VPKR | |
| Lenovo ThinkPad E14 G6 | |
| Dell 14 Plus | |
| Dell Latitude 3440 | |
| HP Pavilion Plus 14-ew0153TU | |
| PCMark 10 / Digital Content Creation | |
| Moyenne Intel Core Ultra 7 256V, Intel Arc Graphics 140V (9481 - 10126, n=6) | |
| Dell 14 Plus | |
| Lenovo IdeaPad Pro 5 14AKP G10 | |
| Lenovo ThinkPad E14 G6 | |
| HP Pavilion Plus 14-ew0153TU | |
| Dell Inspiron 14 5425 6VPKR | |
| Dell Latitude 3440 | |
| CrossMark / Overall | |
| Lenovo IdeaPad Pro 5 14AKP G10 | |
| Dell 14 Plus | |
| Moyenne Intel Core Ultra 7 256V, Intel Arc Graphics 140V (1636 - 1736, n=6) | |
| Lenovo ThinkPad E14 G6 | |
| HP Pavilion Plus 14-ew0153TU | |
| Dell Latitude 3440 | |
| Dell Inspiron 14 5425 6VPKR | |
| CrossMark / Productivity | |
| Lenovo IdeaPad Pro 5 14AKP G10 | |
| Dell 14 Plus | |
| Moyenne Intel Core Ultra 7 256V, Intel Arc Graphics 140V (1563 - 1682, n=6) | |
| HP Pavilion Plus 14-ew0153TU | |
| Lenovo ThinkPad E14 G6 | |
| Dell Latitude 3440 | |
| Dell Inspiron 14 5425 6VPKR | |
| CrossMark / Creativity | |
| Lenovo IdeaPad Pro 5 14AKP G10 | |
| Dell 14 Plus | |
| Moyenne Intel Core Ultra 7 256V, Intel Arc Graphics 140V (1862 - 1962, n=6) | |
| Lenovo ThinkPad E14 G6 | |
| HP Pavilion Plus 14-ew0153TU | |
| Dell Latitude 3440 | |
| Dell Inspiron 14 5425 6VPKR | |
| CrossMark / Responsiveness | |
| Lenovo IdeaPad Pro 5 14AKP G10 | |
| Lenovo ThinkPad E14 G6 | |
| HP Pavilion Plus 14-ew0153TU | |
| Moyenne Intel Core Ultra 7 256V, Intel Arc Graphics 140V (1215 - 1343, n=6) | |
| Dell 14 Plus | |
| Dell Latitude 3440 | |
| Dell Inspiron 14 5425 6VPKR | |
| WebXPRT 3 / Overall | |
| Lenovo IdeaPad Pro 5 14AKP G10 | |
| Dell 14 Plus | |
| Moyenne Intel Core Ultra 7 256V, Intel Arc Graphics 140V (243 - 310, n=6) | |
| Lenovo ThinkPad E14 G6 | |
| Dell Latitude 3440 | |
| HP Pavilion Plus 14-ew0153TU | |
| Dell Inspiron 14 5425 6VPKR | |
| WebXPRT 4 / Overall | |
| Dell 14 Plus | |
| Moyenne Intel Core Ultra 7 256V, Intel Arc Graphics 140V (282 - 286, n=6) | |
| Lenovo IdeaPad Pro 5 14AKP G10 | |
| HP Pavilion Plus 14-ew0153TU | |
| Lenovo ThinkPad E14 G6 | |
| Dell Latitude 3440 | |
| Dell Inspiron 14 5425 6VPKR | |
| Mozilla Kraken 1.1 / Total | |
| Dell Inspiron 14 5425 6VPKR | |
| Dell Latitude 3440 | |
| Lenovo ThinkPad E14 G6 | |
| HP Pavilion Plus 14-ew0153TU | |
| Dell 14 Plus | |
| Moyenne Intel Core Ultra 7 256V, Intel Arc Graphics 140V (470 - 480, n=6) | |
| Lenovo IdeaPad Pro 5 14AKP G10 | |
* ... Moindre est la valeur, meilleures sont les performances
| PCMark 10 Score | 6677 points | |
Aide | ||
| AIDA64 / Memory Copy | |
| Moyenne Intel Core Ultra 7 256V (99227 - 104459, n=6) | |
| Dell 14 Plus | |
| Lenovo IdeaPad Pro 5 14AKP G10 | |
| Lenovo ThinkPad E14 G6 | |
| HP Pavilion Plus 14-ew0153TU | |
| Dell Latitude 3440 | |
| Dell Inspiron 14 5425 6VPKR | |
| AIDA64 / Memory Read | |
| Moyenne Intel Core Ultra 7 256V (86352 - 89144, n=6) | |
| Dell 14 Plus | |
| Lenovo ThinkPad E14 G6 | |
| Lenovo IdeaPad Pro 5 14AKP G10 | |
| HP Pavilion Plus 14-ew0153TU | |
| Dell Latitude 3440 | |
| Dell Inspiron 14 5425 6VPKR | |
| AIDA64 / Memory Write | |
| Dell 14 Plus | |
| Moyenne Intel Core Ultra 7 256V (108692 - 117933, n=6) | |
| Lenovo IdeaPad Pro 5 14AKP G10 | |
| HP Pavilion Plus 14-ew0153TU | |
| Lenovo ThinkPad E14 G6 | |
| Dell Latitude 3440 | |
| Dell Inspiron 14 5425 6VPKR | |
| AIDA64 / Memory Latency | |
| Lenovo ThinkPad E14 G6 | |
| HP Pavilion Plus 14-ew0153TU | |
| Lenovo IdeaPad Pro 5 14AKP G10 | |
| Dell Inspiron 14 5425 6VPKR | |
| Dell 14 Plus | |
| Moyenne Intel Core Ultra 7 256V (96.1 - 99.6, n=6) | |
| Dell Latitude 3440 | |
* ... Moindre est la valeur, meilleures sont les performances
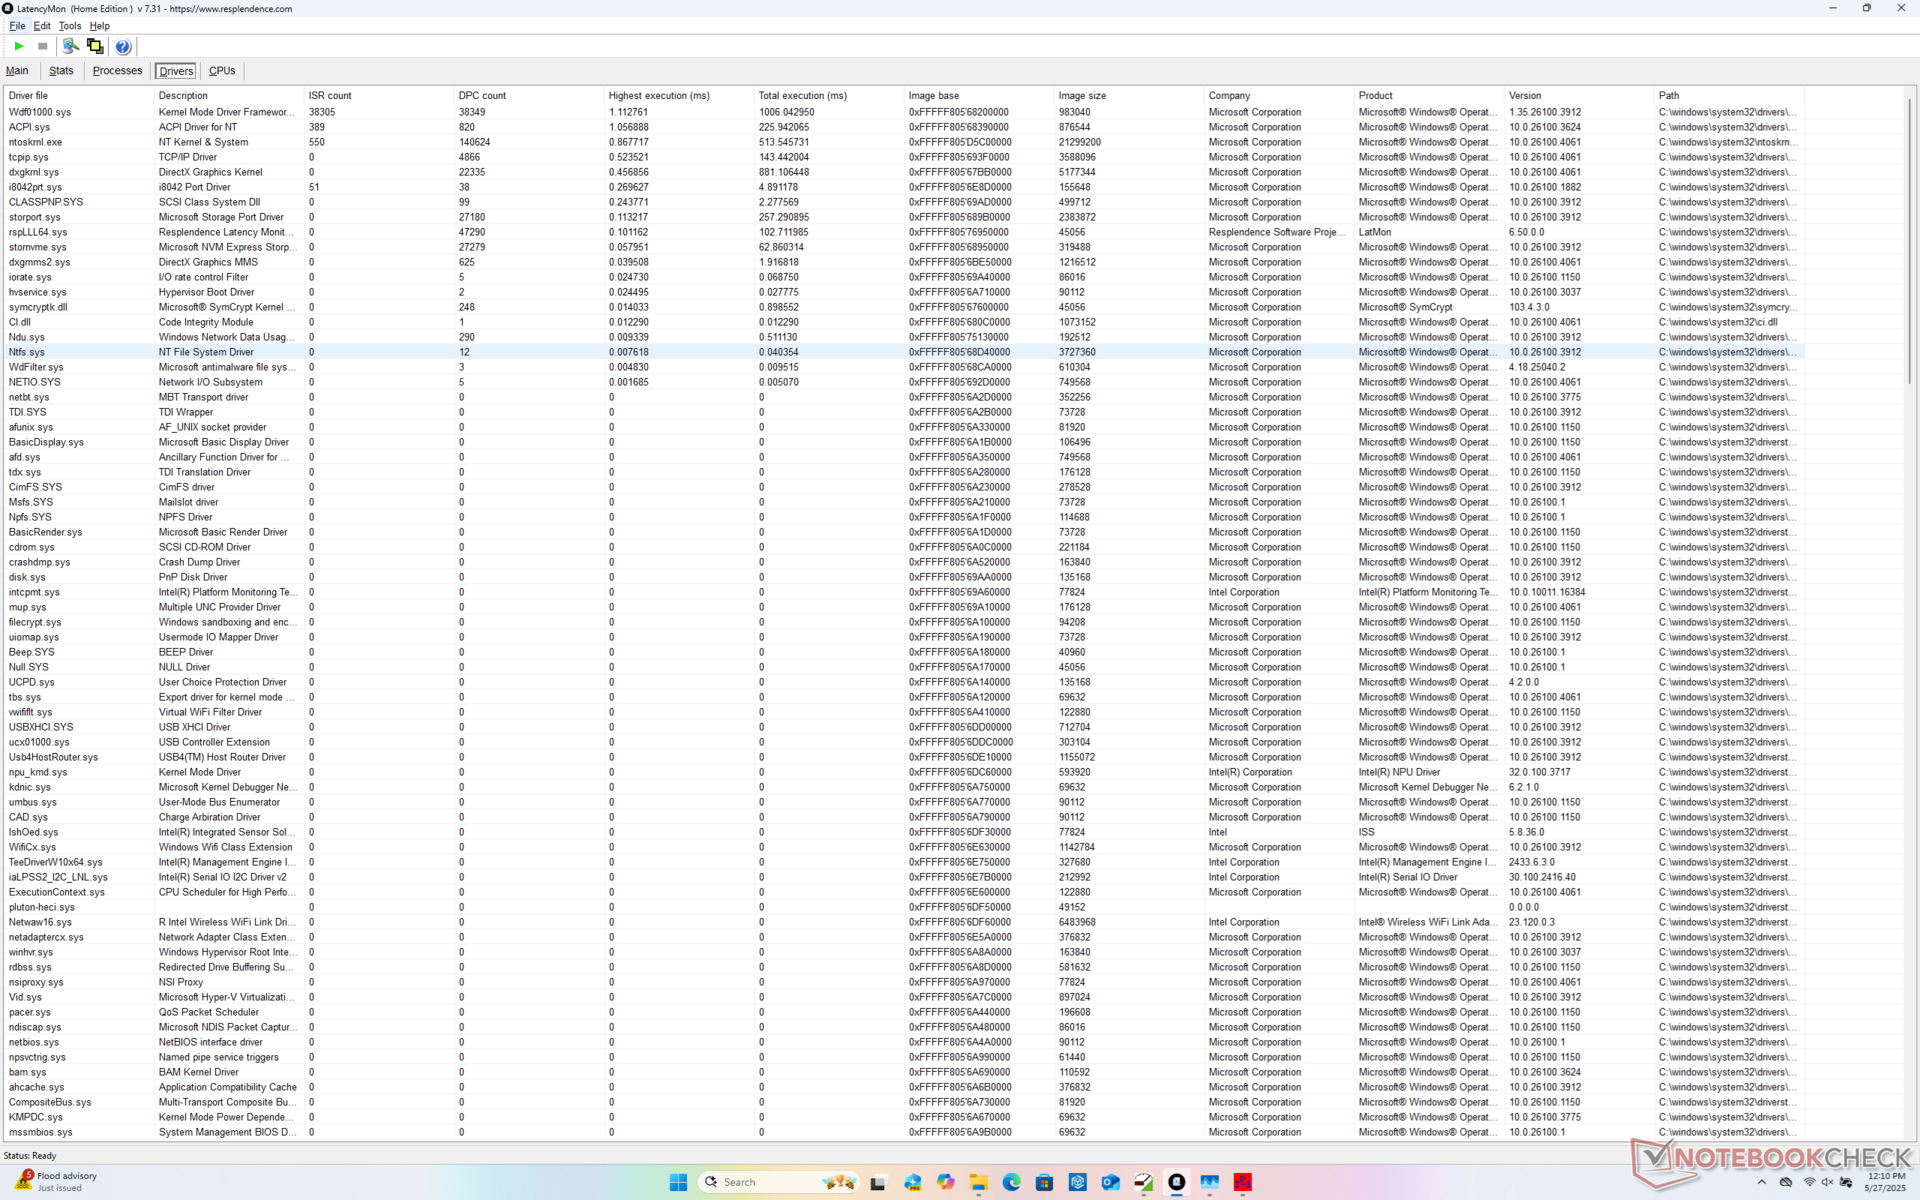
Latence DPC

| DPC Latencies / LatencyMon - interrupt to process latency (max), Web, Youtube, Prime95 | |
| Lenovo ThinkPad E14 G6 | |
| Dell Latitude 3440 | |
| HP Pavilion Plus 14-ew0153TU | |
| Dell 14 Plus | |
| Dell Inspiron 14 5425 6VPKR | |
| Lenovo IdeaPad Pro 5 14AKP G10 | |
* ... Moindre est la valeur, meilleures sont les performances
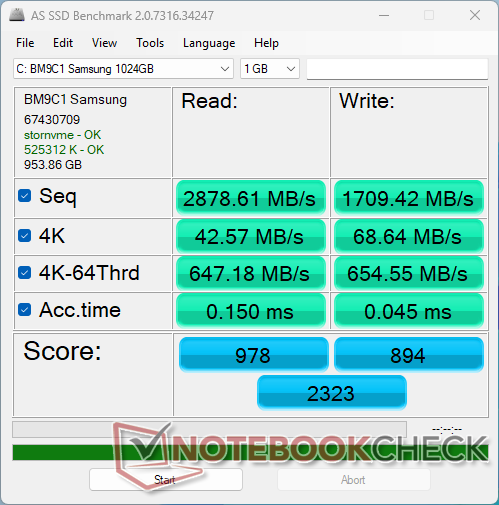
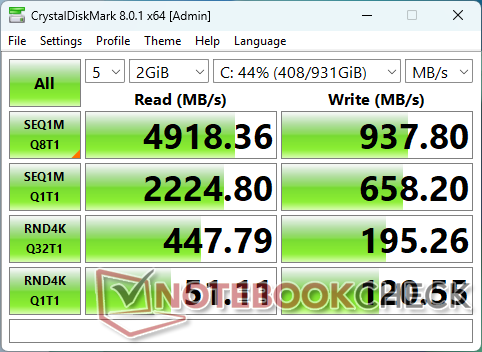
Dispositifs de stockage
Notre appareil est livré avec le modèle de milieu de gamme Samsung BM9C1 PCIe4 NVMe SSD avec des taux de lecture décents allant jusqu'à 4900 MB/s. Les taux d'écriture peuvent cependant être beaucoup plus lents, avec moins de la moitié de la vitesse. Les taux d'écriture, cependant, peuvent être beaucoup plus lents à moins de la moitié de la vitesse.

| Drive Performance rating - Percent | |
| Lenovo IdeaPad Pro 5 14AKP G10 | |
| HP Pavilion Plus 14-ew0153TU | |
| Lenovo ThinkPad E14 G6 | |
| Dell Latitude 3440 | |
| Dell Inspiron 14 5425 6VPKR | |
| Dell 14 Plus | |
* ... Moindre est la valeur, meilleures sont les performances
Disk Throttling: DiskSpd Read Loop, Queue Depth 8
Performance du GPU
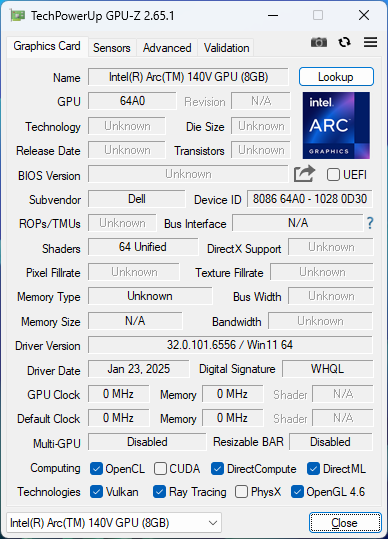
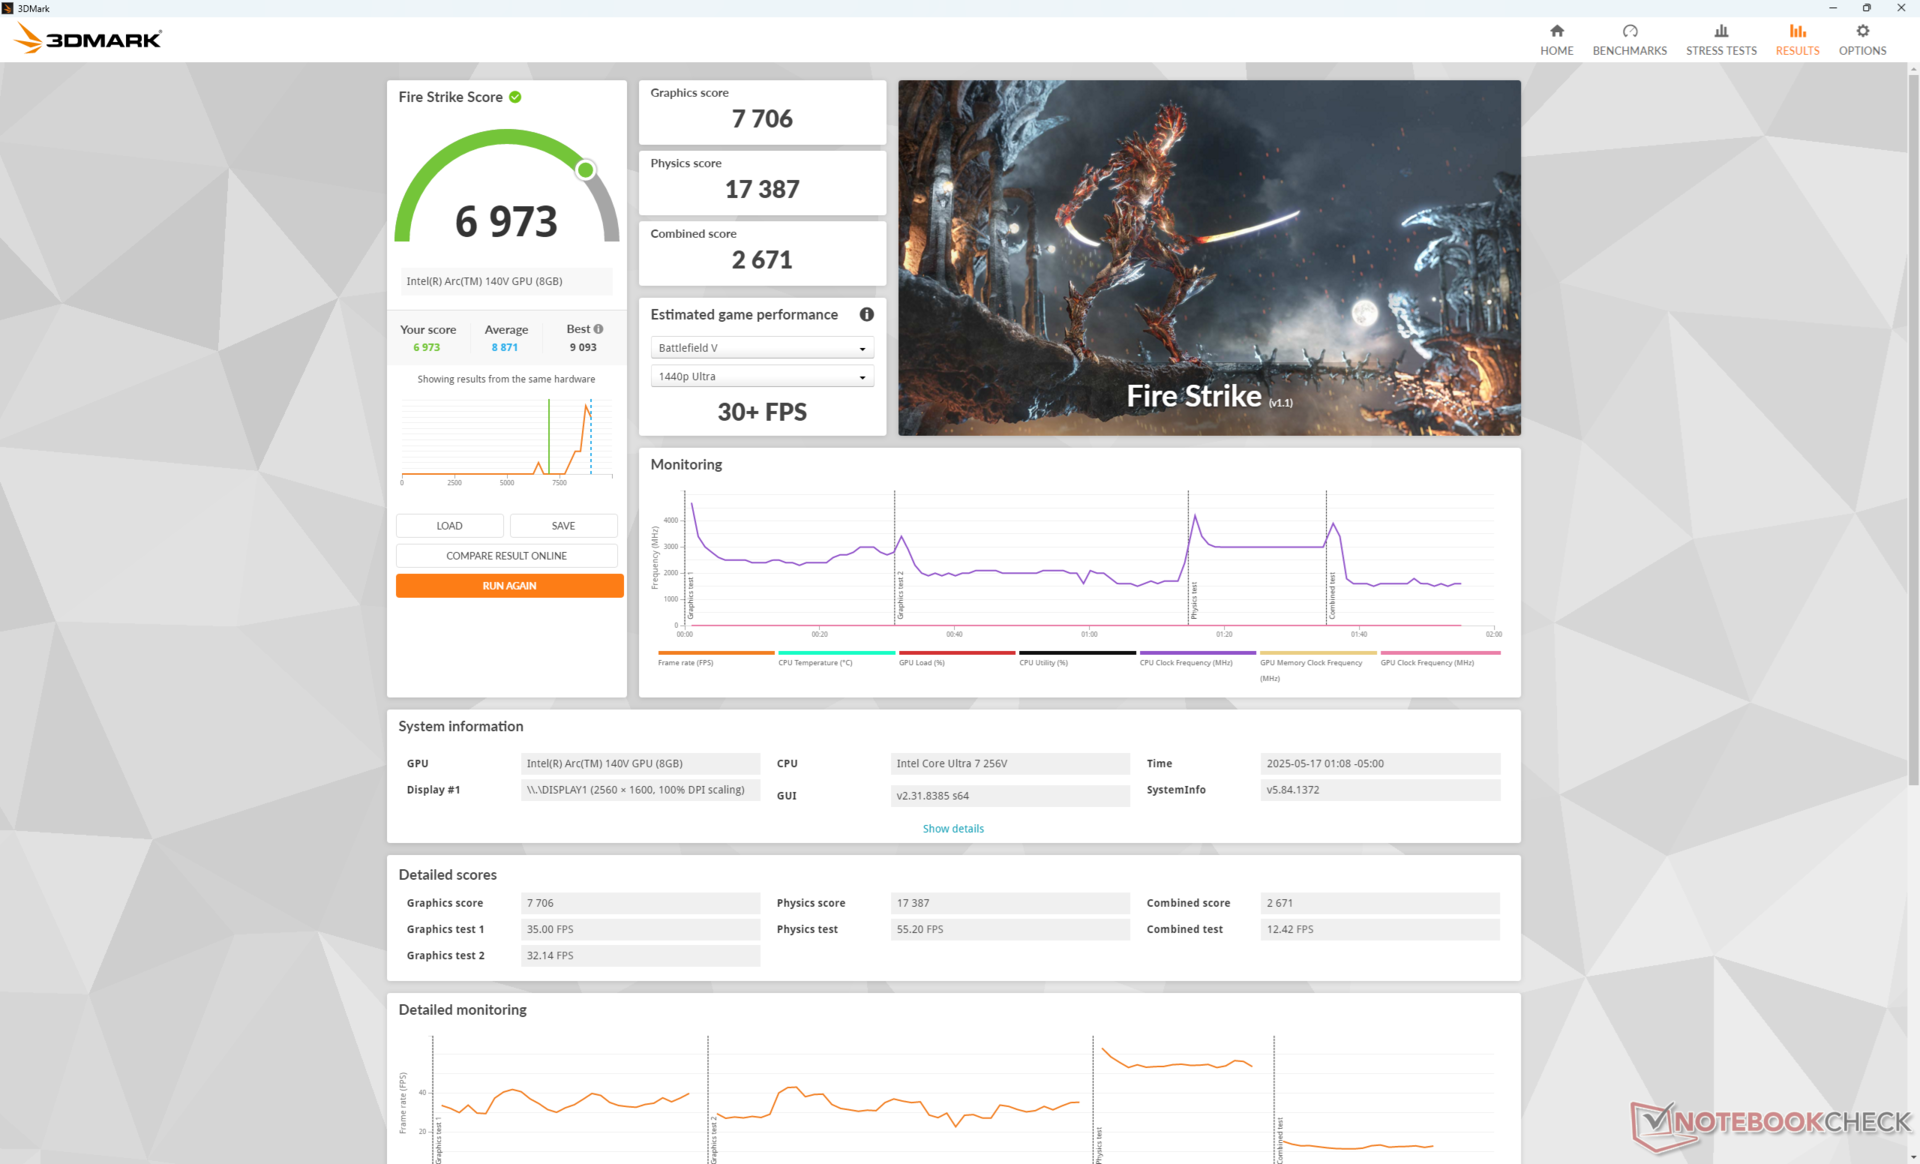
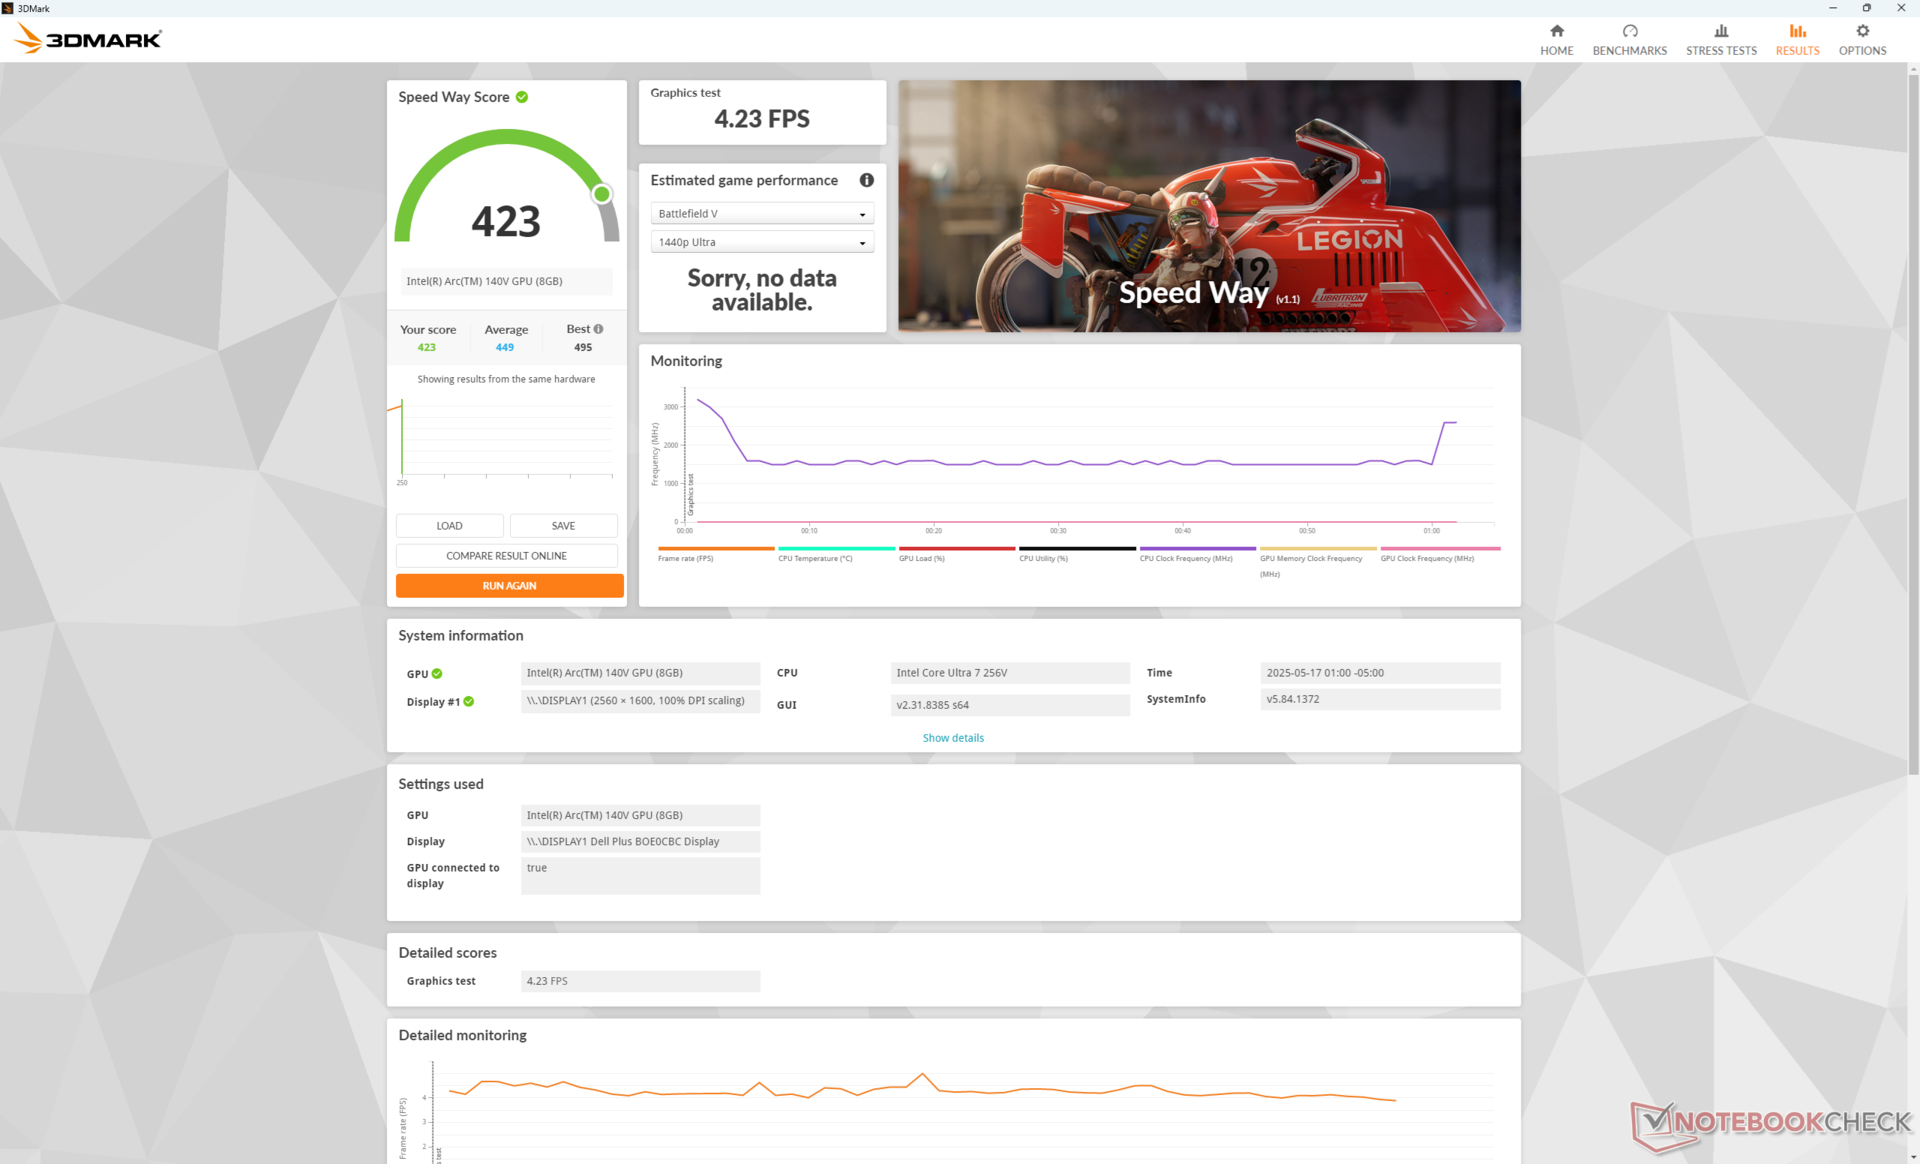
L'Arc Arc 140V dans notre unité est plus lent que la moyenne des ordinateurs portables de notre base de données avec le même iGPU, et ce jusqu'à 20 %. Malgré cela, le système constitue une amélioration significative par rapport à l'ancien modèle de l'Iris Xe 96 EU Iris Xe 96 EU que beaucoup d'acheteurs vont remplacer.
| Profil de puissance | Score graphique | Score physique | Score combiné |
| Mode performance | 7706 | 17387 | 2671 |
| Mode équilibré | 7182 (-7%) | 16601 (-5%) | 2426 (-9%) |
| Alimentation par batterie | 7374(-4%) | 16277 (-6%) | 2373 (-11%) |
L'exécution en mode équilibré ou sur batterie ne réduit les performances que de quelques points de pourcentage, comme le montre notre tableau de résultats Fire Strike ci-dessus.
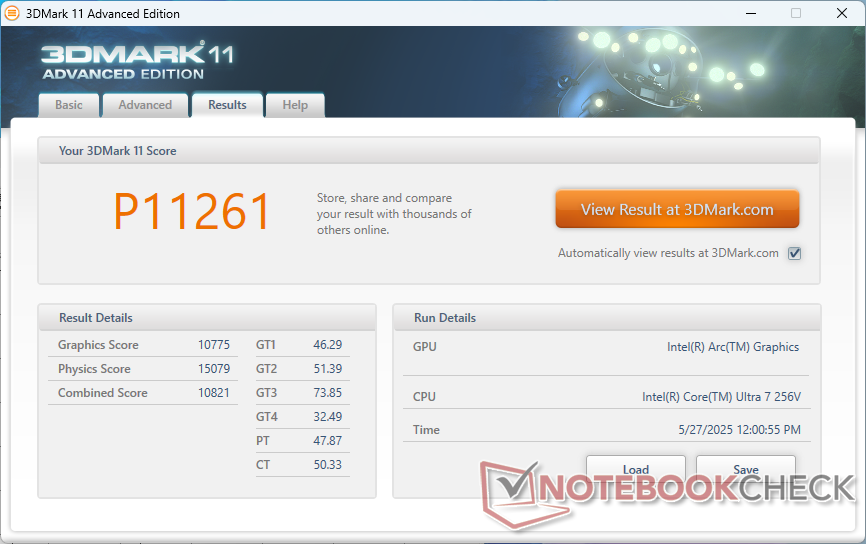
| 3DMark 11 Performance | 11261 points | |
| 3DMark Fire Strike Score | 6973 points | |
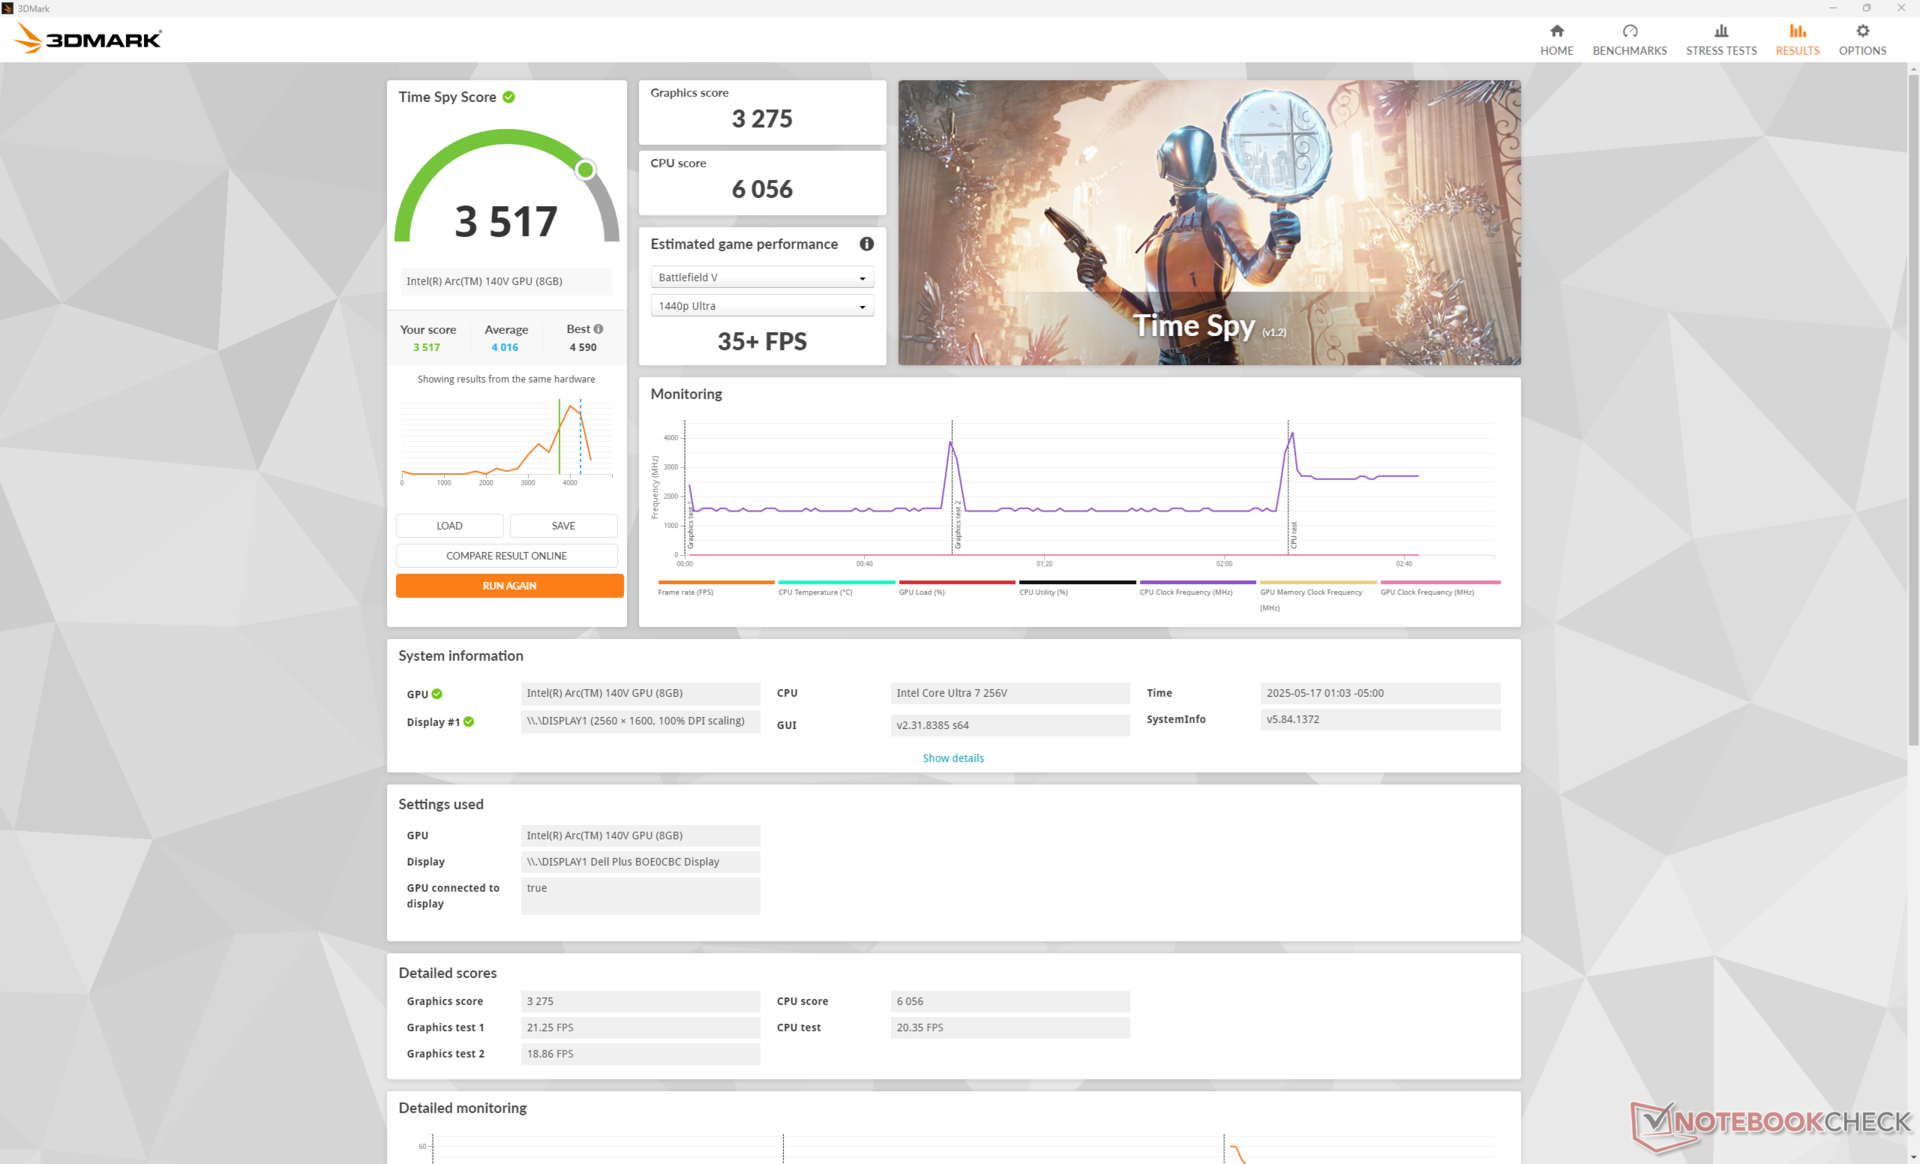
| 3DMark Time Spy Score | 3517 points | |
Aide | ||
* ... Moindre est la valeur, meilleures sont les performances
| F1 24 | |
| 1920x1080 High Preset AA:T AF:16x | |
| Moyenne Intel Arc Graphics 140V (34.4 - 66.4, n=25) | |
| Lenovo ThinkPad X1 2-in-1 Gen 10 | |
| Lenovo IdeaPad Pro 5 14AKP G10 | |
| Dell 14 Plus | |
| Lenovo Yoga 7 2-in-1 14AKP10 | |
| 1920x1080 Ultra High Preset AA:T AF:16x | |
| Moyenne Intel Arc Graphics 140V (15.3 - 22, n=23) | |
| Lenovo ThinkPad X1 2-in-1 Gen 10 | |
| Dell 14 Plus | |
| Lenovo IdeaPad Pro 5 14AKP G10 | |
Cyberpunk 2077 ultra FPS Chart
| Bas | Moyen | Élevé | Ultra | |
|---|---|---|---|---|
| Dota 2 Reborn (2015) | 98.6 | 59.7 | 74.5 | 69.1 |
| Final Fantasy XV Benchmark (2018) | 76.9 | 42.8 | 32.3 | |
| X-Plane 11.11 (2018) | 43.8 | 35.3 | 36 | |
| Strange Brigade (2018) | 193.4 | 56.2 | 52.6 | 48.8 |
| Baldur's Gate 3 (2023) | 38.1 | 32.1 | 27.9 | 27.4 |
| Cyberpunk 2077 2.2 Phantom Liberty (2023) | 43.5 | 35.1 | 26 | 24.2 |
| F1 24 (2024) | 64.3 | 62.2 | 45.9 | 16.5 |
Émissions
Bruit du système
Le ventilateur interne est généralement léthargique et silencieux en cas de charge faible à moyenne, comme c'est le cas avec la plupart des ordinateurs portables équipés d'un processeur Lunar Lake. Le ventilateur met un peu de temps à se mettre en route lorsque les charges sont plus élevées, mais il atteint un niveau de plafond similaire à celui de la plupart des autres concurrents de 14 pouces.
Degré de la nuisance sonore
| Au repos |
| 23.8 / 23.8 / 23.8 dB(A) |
| Fortement sollicité |
| 31.4 / 45.2 dB(A) |
 | ||
30 dB silencieux 40 dB(A) audible 50 dB(A) bruyant |
||
min: | ||
| Dell 14 Plus Arc 140V, Core Ultra 7 256V | Dell Inspiron 14 5425 6VPKR Vega 7, R5 5625U, SK Hynix BC711 512GB HFM512GD3GX013N | Dell Latitude 3440 Iris Xe G7 80EUs, i5-1345U, Samsung PM9A1 MZVL2512HCJQ | Lenovo IdeaPad Pro 5 14AKP G10 Radeon 860M, Ryzen AI 7 350, SK hynix PVC10 HFS001TEM4X182N | Lenovo ThinkPad E14 G6 Graphics 4-Core, Ultra 7 155U, Samsung PM9C1a MZAL8512HDLU | HP Pavilion Plus 14-ew0153TU Iris Xe G7 96EUs, i7-1355U, SK hynix PC801 HFS001TEJ9X101N | |
|---|---|---|---|---|---|---|
| Noise | -7% | -3% | -10% | 2% | 15% | |
| arrêt / environnement * (dB) | 23.8 | 25.5 -7% | 23.9 -0% | 23.6 1% | 24.6 -3% | 19.35 19% |
| Idle Minimum * (dB) | 23.8 | 25.5 -7% | 24.4 -3% | 23.6 1% | 24.6 -3% | 20.57 14% |
| Idle Average * (dB) | 23.8 | 25.5 -7% | 24.4 -3% | 23.6 1% | 24.6 -3% | 20.57 14% |
| Idle Maximum * (dB) | 23.8 | 25.5 -7% | 24.4 -3% | 23.6 1% | 24.6 -3% | 20.57 14% |
| Load Average * (dB) | 31.4 | 37.7 -20% | 37.1 -18% | 46.5 -48% | 27.5 12% | 32.18 -2% |
| Cyberpunk 2077 ultra * (dB) | 42 | 48.9 -16% | 39.4 6% | |||
| Load Maximum * (dB) | 45.2 | 43.3 4% | 40.2 11% | 48.9 -8% | 42.5 6% | 32.26 29% |
| Witcher 3 ultra * (dB) | 38.2 | 29.44 |
* ... Moindre est la valeur, meilleures sont les performances
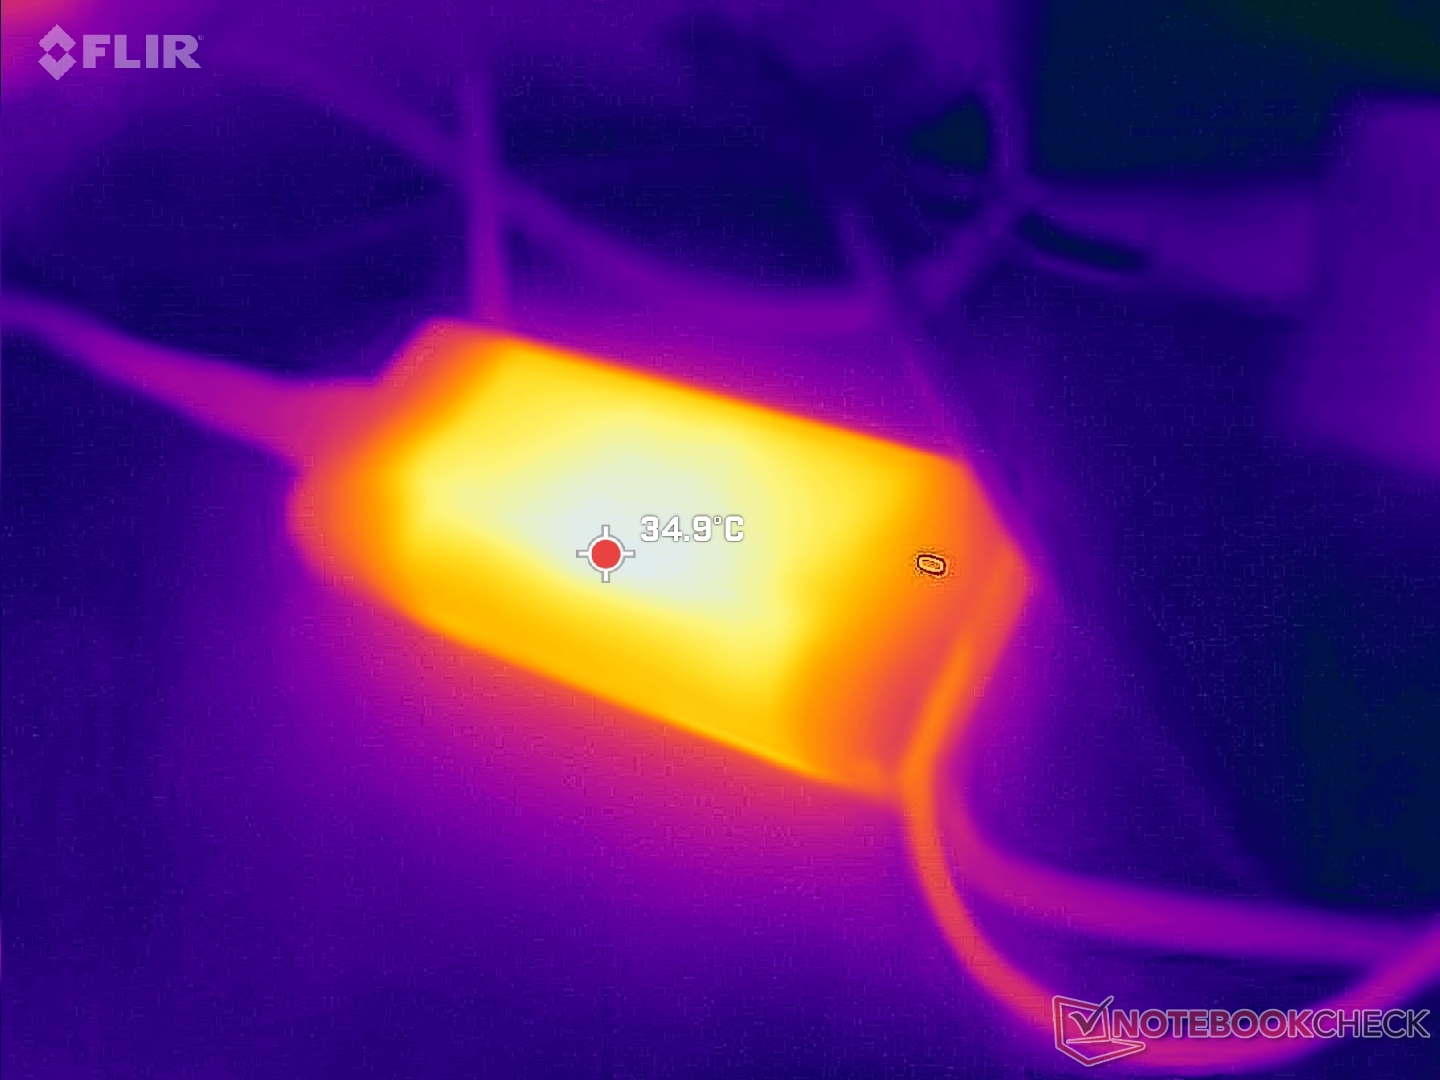
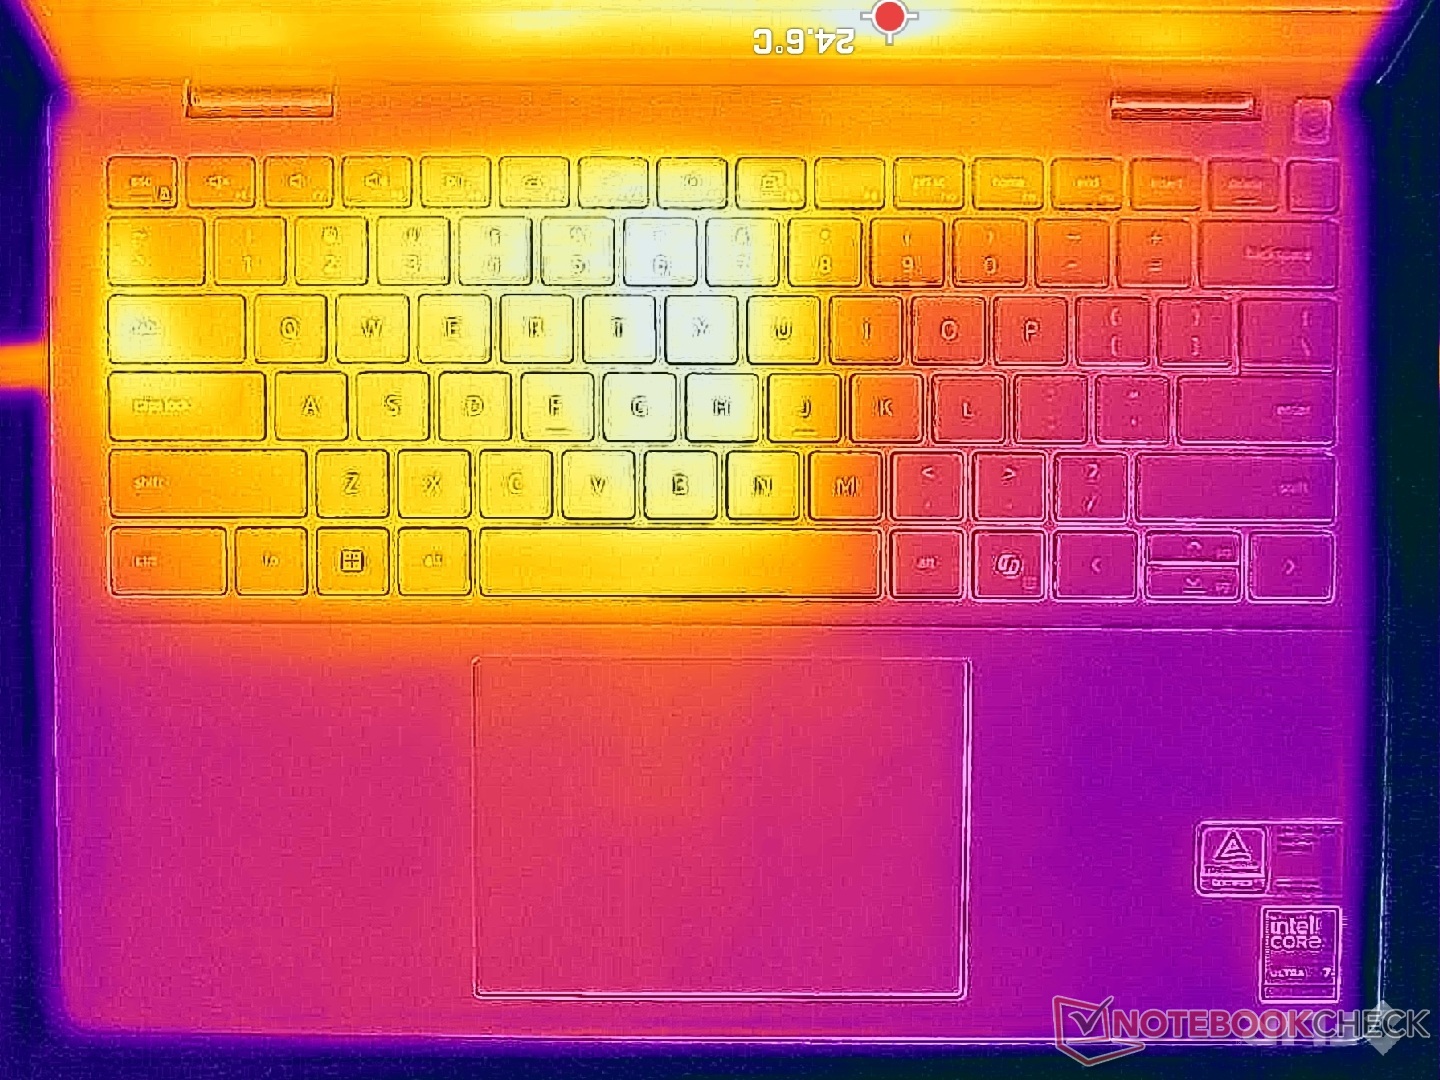
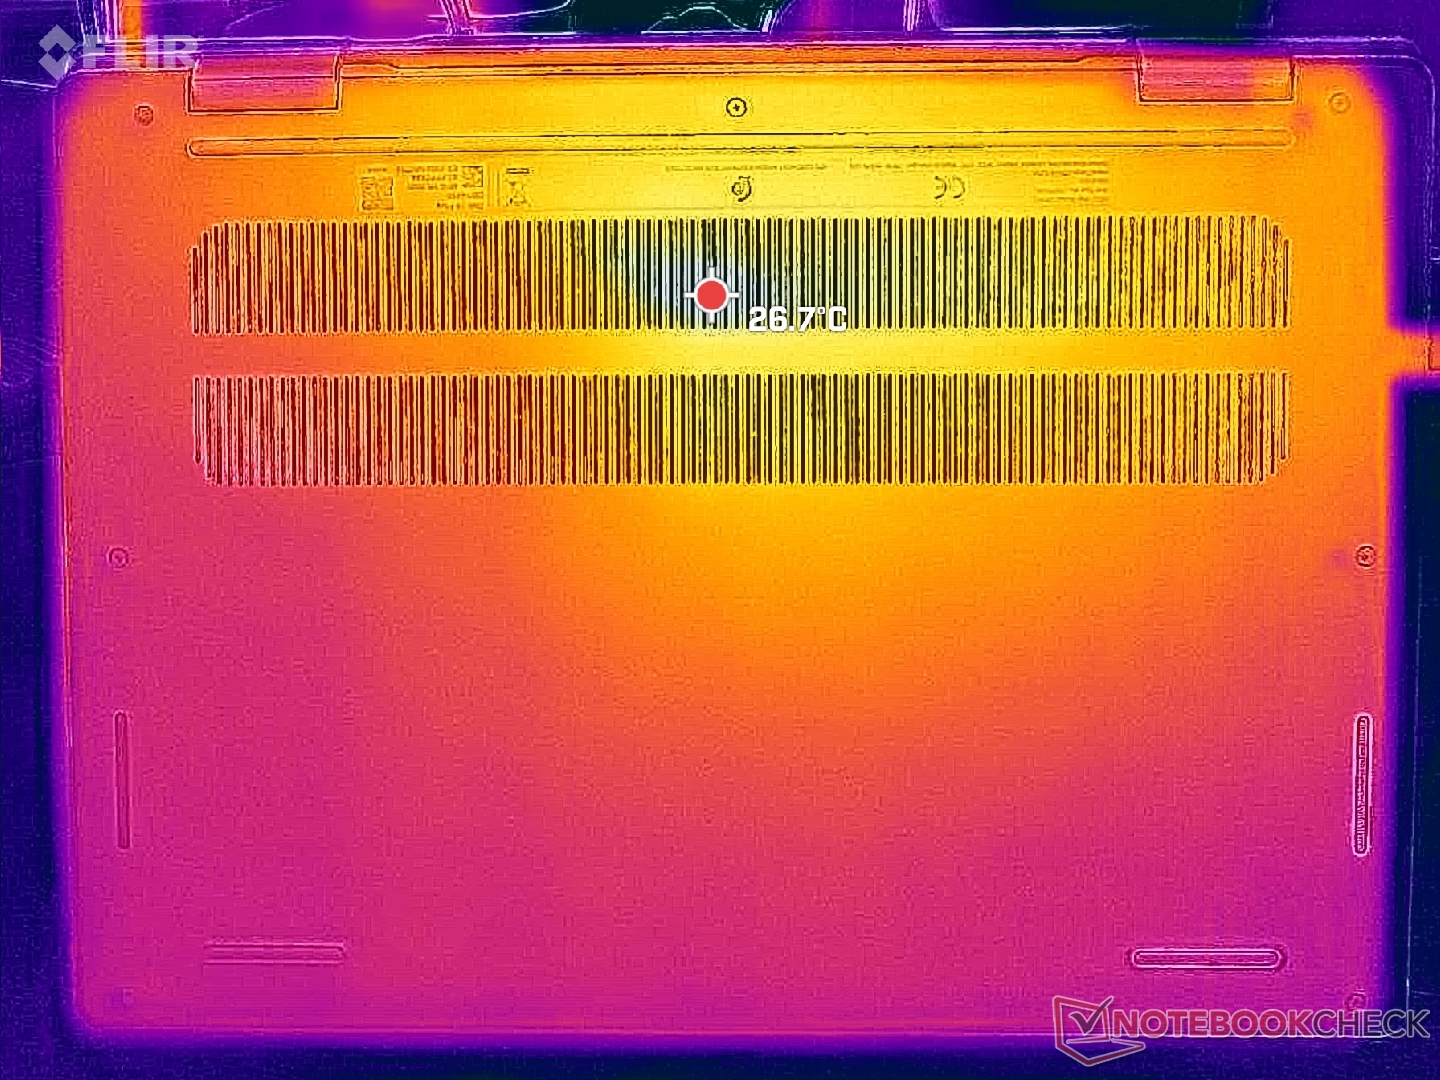
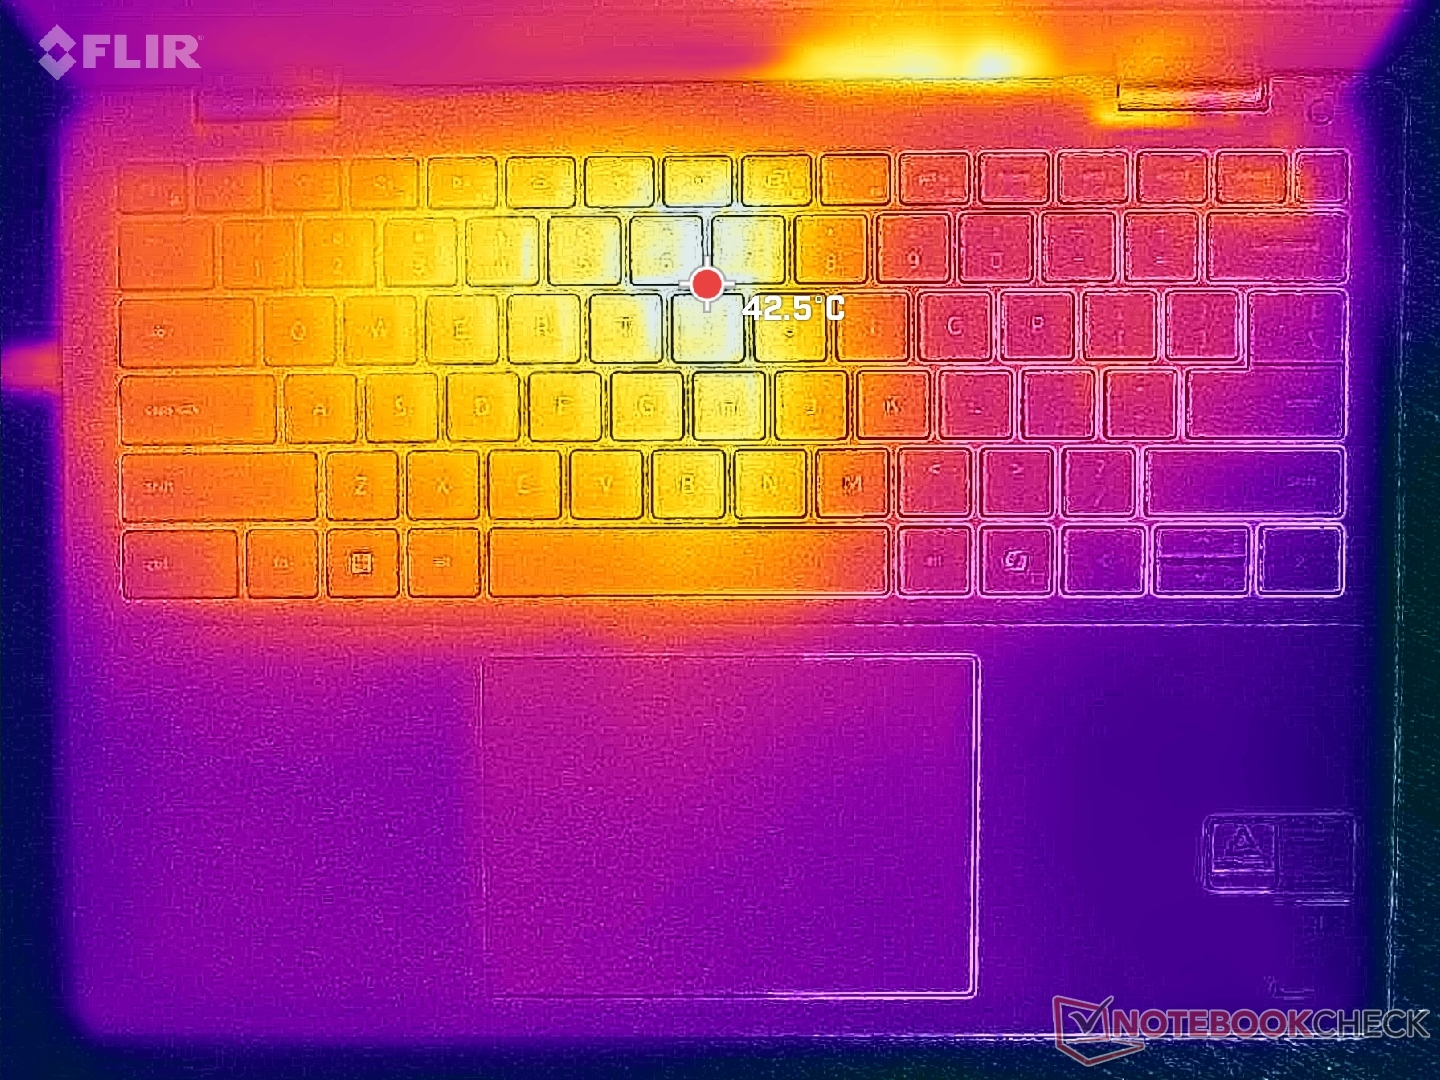
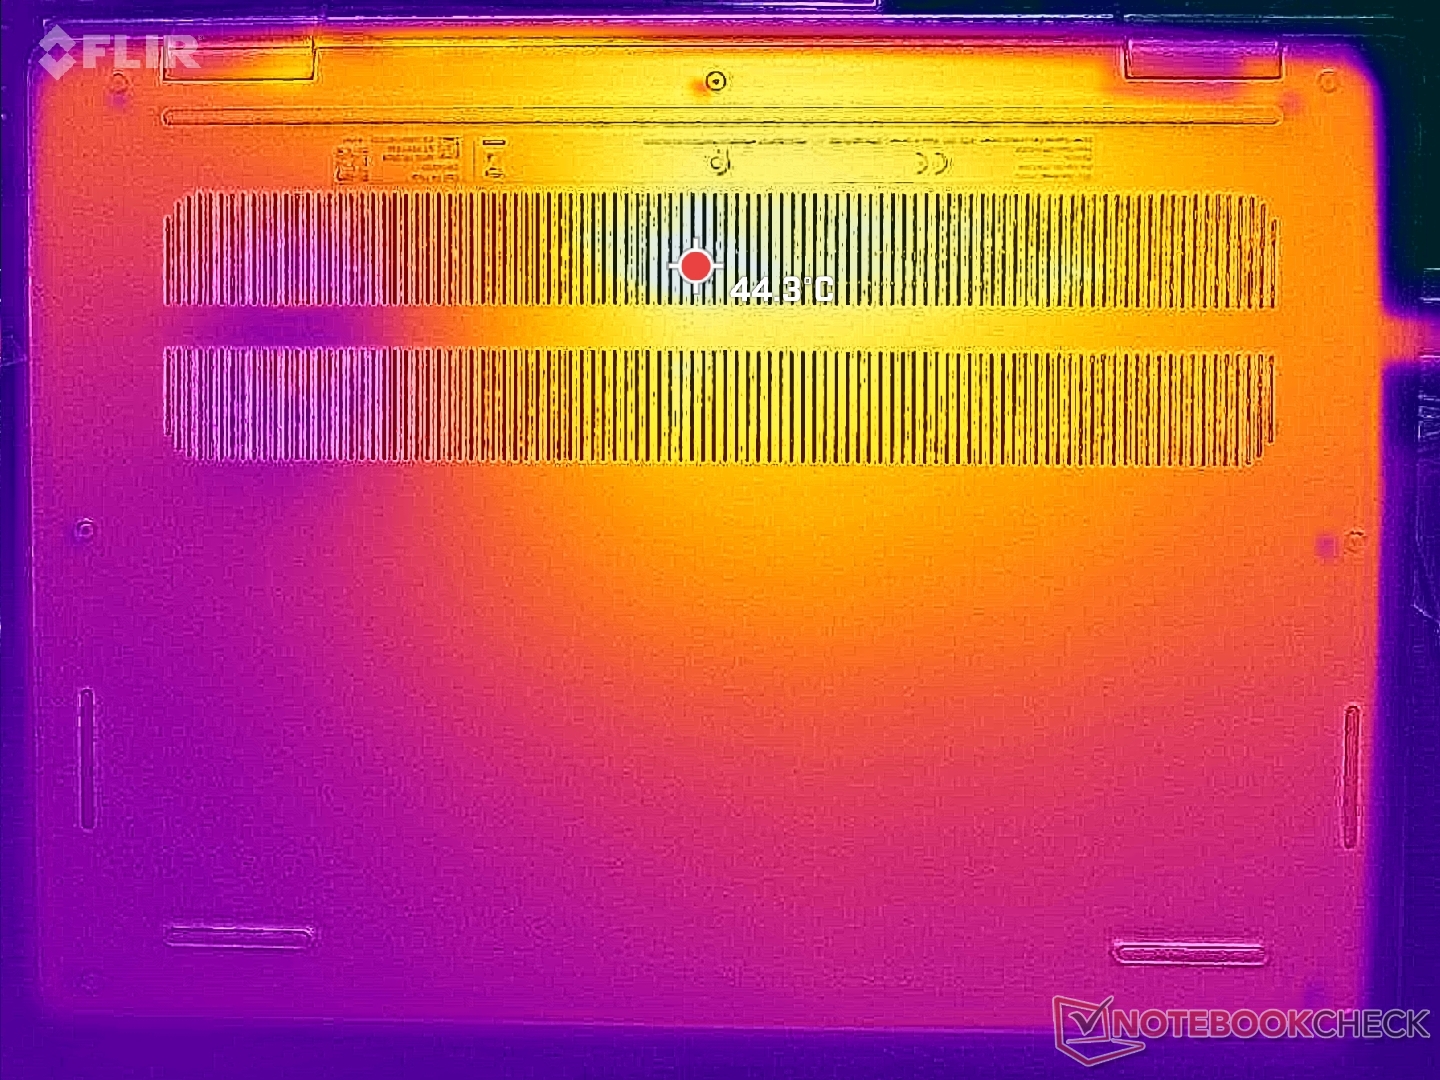
Température
Les points chauds de la température de surface sous charge peuvent atteindre jusqu'à 43°C sur le clavier et le dessous, ce qui est nettement plus chaud que ce que nous avons enregistré sur l'ordinateur de bureau HP Pavilion Plus 14 de quelques degrés.
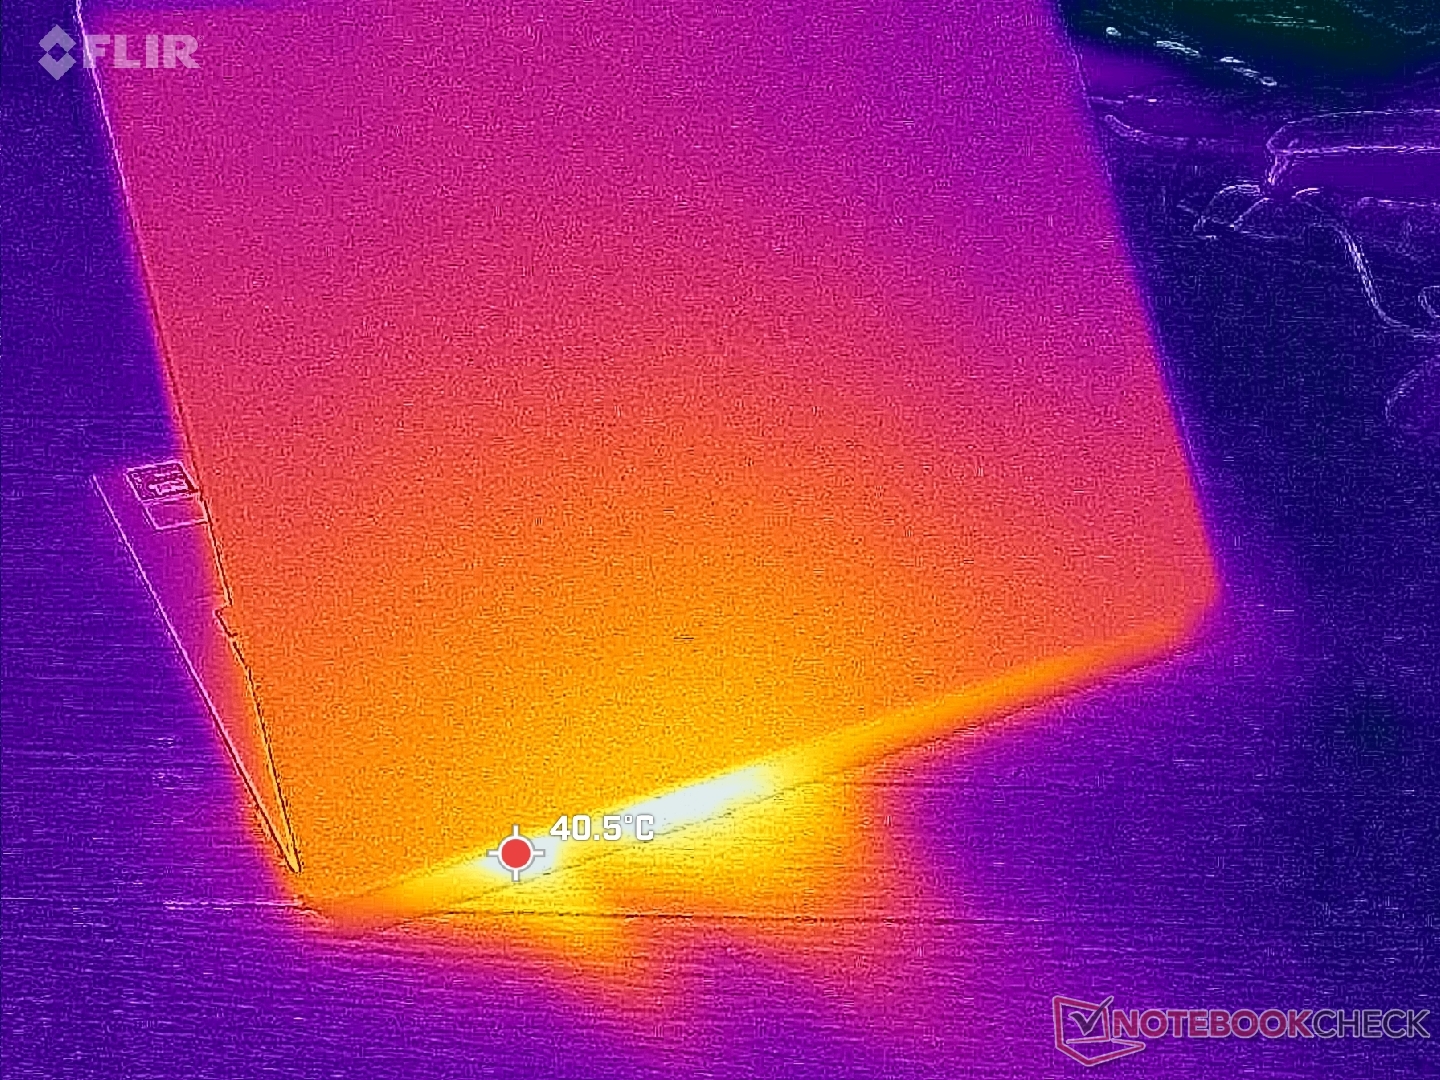
(±) La température maximale du côté supérieur est de 43 °C / 109 F, par rapport à la moyenne de 35.9 °C / 97 F, allant de 21.4 à 59 °C pour la classe Subnotebook.
(±) Le fond chauffe jusqu'à un maximum de 42.6 °C / 109 F, contre une moyenne de 39.3 °C / 103 F
(+) En utilisation inactive, la température moyenne du côté supérieur est de 28.8 °C / 84 F, par rapport à la moyenne du dispositif de 30.8 °C / 87 F.
(+) Les repose-poignets et le pavé tactile sont plus froids que la température de la peau avec un maximum de 28.4 °C / 83.1 F et sont donc froids au toucher.
(±) La température moyenne de la zone de l'appui-paume de dispositifs similaires était de 28.2 °C / 82.8 F (-0.2 °C / #-0.3 F).
| Dell 14 Plus Intel Core Ultra 7 256V, Intel Arc Graphics 140V | Dell Inspiron 14 5425 6VPKR AMD Ryzen 5 5625U, AMD Radeon RX Vega 7 | Dell Latitude 3440 Intel Core i5-1345U, Intel Iris Xe Graphics G7 80EUs | Lenovo IdeaPad Pro 5 14AKP G10 AMD Ryzen AI 7 350, AMD Radeon 860M | Lenovo ThinkPad E14 G6 Intel Core Ultra 7 155U, Intel Graphics 4-Core iGPU (Arc) | HP Pavilion Plus 14-ew0153TU Intel Core i7-1355U, Intel Iris Xe Graphics G7 96EUs | |
|---|---|---|---|---|---|---|
| Heat | 3% | 6% | 10% | 20% | 8% | |
| Maximum Upper Side * (°C) | 43 | 39.1 9% | 35.2 18% | 42.2 2% | 35 19% | 36.6 15% |
| Maximum Bottom * (°C) | 42.6 | 41.9 2% | 41 4% | 42.4 -0% | 35.6 16% | 37.2 13% |
| Idle Upper Side * (°C) | 31.6 | 31.2 1% | 29.8 6% | 25.4 20% | 23.8 25% | 31.6 -0% |
| Idle Bottom * (°C) | 30.6 | 30.9 -1% | 32 -5% | 25.7 16% | 24.8 19% | 30 2% |
* ... Moindre est la valeur, meilleures sont les performances
Intervenants
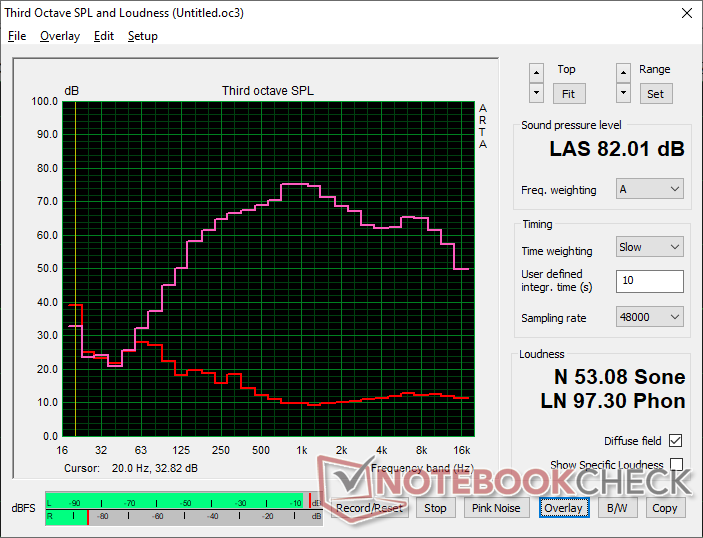
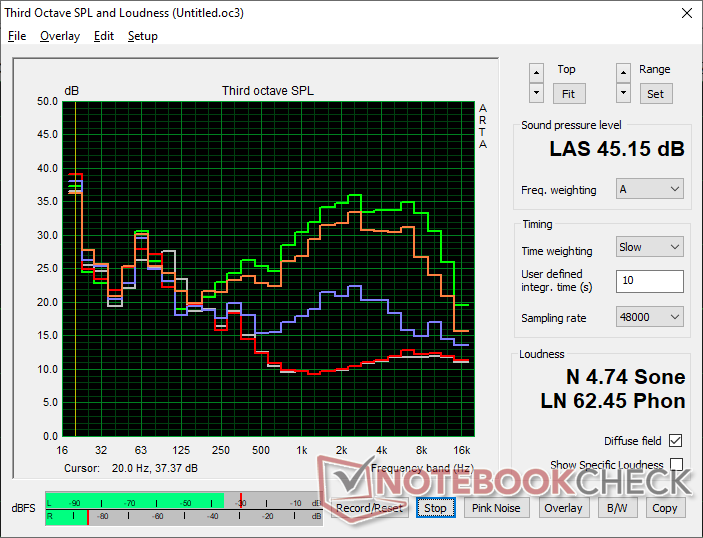
Dell 14 Plus analyse audio
(+) | les haut-parleurs peuvent jouer relativement fort (82# dB)
Basses 100 - 315 Hz
(±) | basse réduite - en moyenne 7.8% inférieure à la médiane
(±) | la linéarité des basses est moyenne (9.2% delta à la fréquence précédente)
Médiums 400 - 2000 Hz
(±) | médiane supérieure - en moyenne 6.5% supérieure à la médiane
(+) | les médiums sont linéaires (3.6% delta à la fréquence précédente)
Aiguës 2 - 16 kHz
(+) | des sommets équilibrés - à seulement 1.9% de la médiane
(+) | les aigus sont linéaires (3.7% delta à la fréquence précédente)
Globalement 100 - 16 000 Hz
(+) | le son global est linéaire (12.4% différence à la médiane)
Par rapport à la même classe
» 16% de tous les appareils testés de cette catégorie étaient meilleurs, 4% similaires, 80% pires
» Le meilleur avait un delta de 5%, la moyenne était de 18%, le pire était de 53%.
Par rapport à tous les appareils testés
» 10% de tous les appareils testés étaient meilleurs, 2% similaires, 88% pires
» Le meilleur avait un delta de 4%, la moyenne était de 24%, le pire était de 134%.
Apple MacBook Pro 16 2021 M1 Pro analyse audio
(+) | les haut-parleurs peuvent jouer relativement fort (84.7# dB)
Basses 100 - 315 Hz
(+) | bonne basse - seulement 3.8% loin de la médiane
(+) | les basses sont linéaires (5.2% delta à la fréquence précédente)
Médiums 400 - 2000 Hz
(+) | médiane équilibrée - seulement 1.3% de la médiane
(+) | les médiums sont linéaires (2.1% delta à la fréquence précédente)
Aiguës 2 - 16 kHz
(+) | des sommets équilibrés - à seulement 1.9% de la médiane
(+) | les aigus sont linéaires (2.7% delta à la fréquence précédente)
Globalement 100 - 16 000 Hz
(+) | le son global est linéaire (4.6% différence à la médiane)
Par rapport à la même classe
» 0% de tous les appareils testés de cette catégorie étaient meilleurs, 0% similaires, 100% pires
» Le meilleur avait un delta de 5%, la moyenne était de 18%, le pire était de 45%.
Par rapport à tous les appareils testés
» 0% de tous les appareils testés étaient meilleurs, 0% similaires, 100% pires
» Le meilleur avait un delta de 4%, la moyenne était de 24%, le pire était de 134%.
Gestion de l'énergie
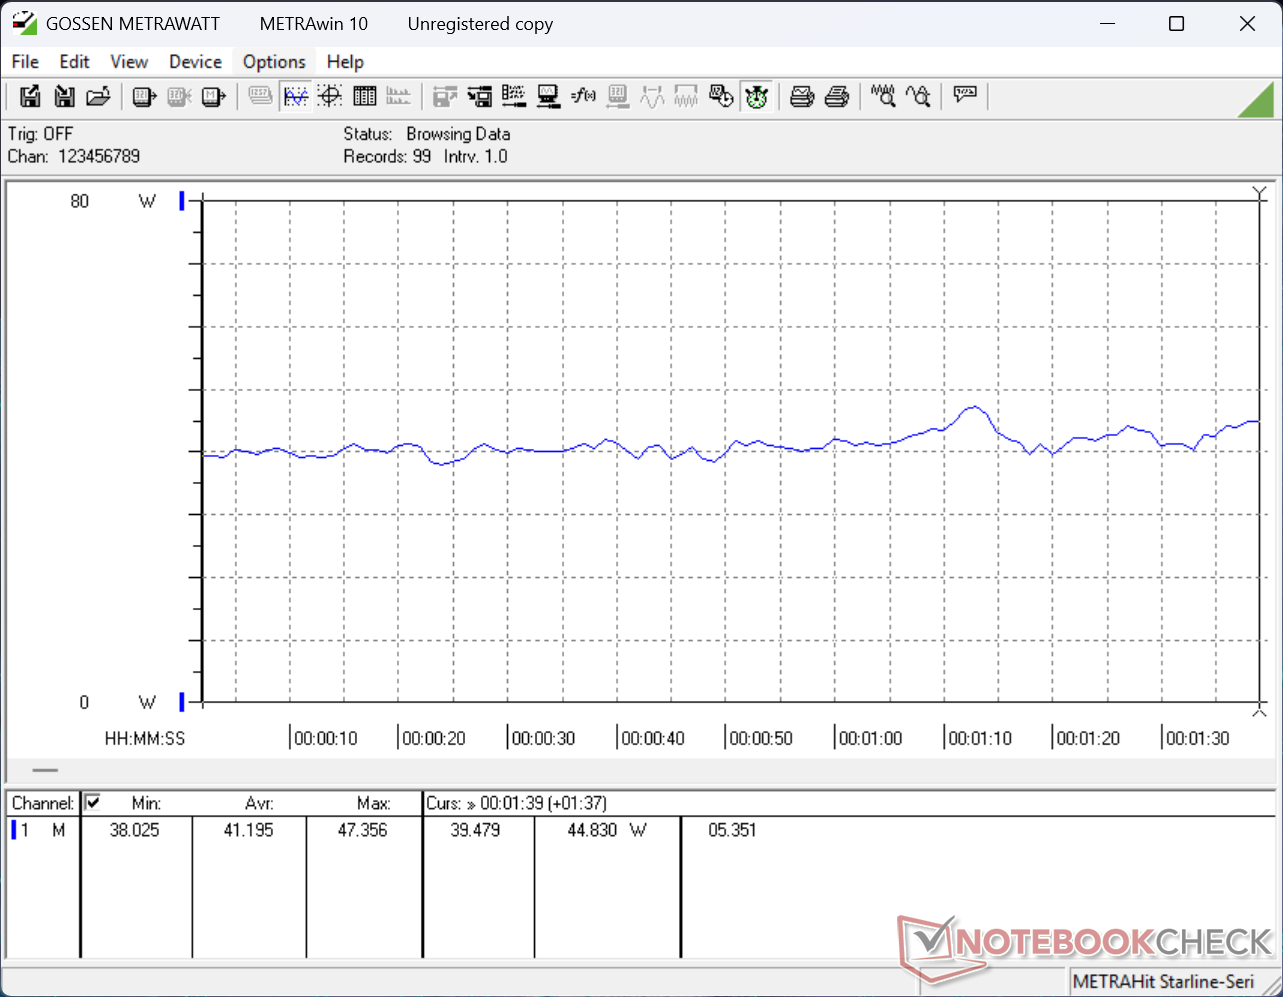
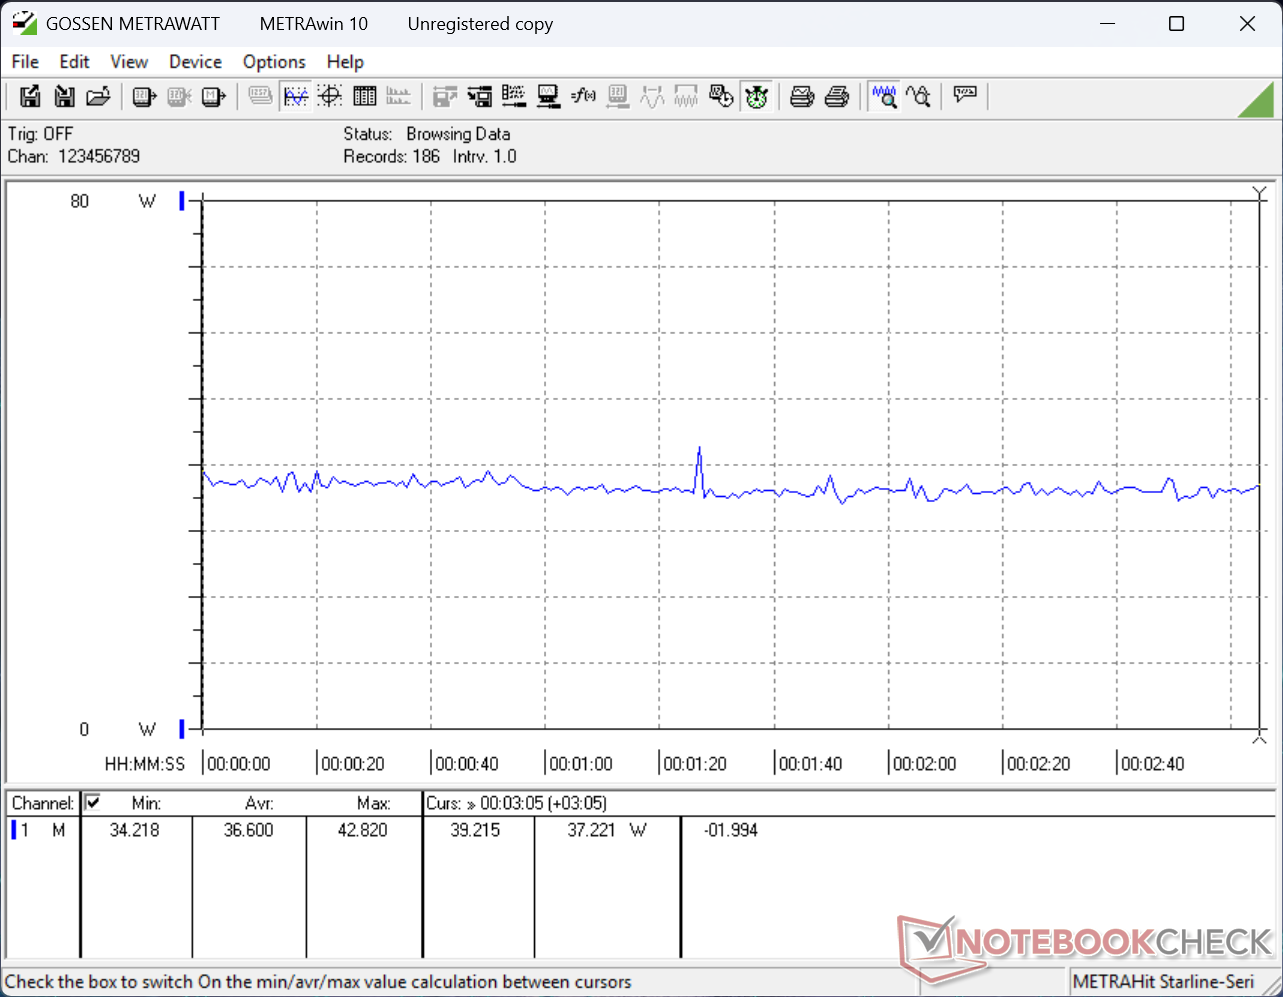
Consommation électrique
La consommation globale est assez proche de celle du Dell Latitude 7450 2-en-1 équipé d'un Core Ultra 7 165U, même si notre Dell 14 Plus offre une accélération de l'IA, des performances de la RAM et de l'iGPU nettement plus rapides, ce qui permet d'augmenter les performances par watt.
| Éteint/en veille | |
| Au repos | |
| Fortement sollicité |
|
Légende:
min: | |
| Dell 14 Plus Core Ultra 7 256V, Arc 140V, , IPS, 2560x1600, 14" | Dell Inspiron 14 5425 6VPKR R5 5625U, Vega 7, SK Hynix BC711 512GB HFM512GD3GX013N, IPS, 1920x1200, 14" | Dell Latitude 3440 i5-1345U, Iris Xe G7 80EUs, Samsung PM9A1 MZVL2512HCJQ, IPS, 1920x1080, 14" | Lenovo IdeaPad Pro 5 14AKP G10 Ryzen AI 7 350, Radeon 860M, SK hynix PVC10 HFS001TEM4X182N, OLED, 2880x1800, 14" | Lenovo ThinkPad E14 G6 Ultra 7 155U, Graphics 4-Core, Samsung PM9C1a MZAL8512HDLU, IPS, 1920x1200, 14" | HP Pavilion Plus 14-ew0153TU i7-1355U, Iris Xe G7 96EUs, SK hynix PC801 HFS001TEJ9X101N, OLED, 2880x1800, 14" | |
|---|---|---|---|---|---|---|
| Power Consumption | -4% | -12% | -66% | -36% | -34% | |
| Idle Minimum * (Watt) | 3.6 | 4 -11% | 3.7 -3% | 5.1 -42% | 5.4 -50% | 6.7 -86% |
| Idle Average * (Watt) | 6.7 | 6.6 1% | 6.5 3% | 6.8 -1% | 9.7 -45% | 7.16 -7% |
| Idle Maximum * (Watt) | 6.9 | 9.4 -36% | 9.5 -38% | 6.9 -0% | 10.4 -51% | 11.17 -62% |
| Load Average * (Watt) | 41.2 | 37 10% | 46.9 -14% | 71.7 -74% | 49.2 -19% | 46.5 -13% |
| Cyberpunk 2077 ultra external monitor * (Watt) | 34.2 | 83.5 -144% | 47.1 -38% | |||
| Cyberpunk 2077 ultra * (Watt) | 36.6 | 84.8 -132% | 50.1 -37% | |||
| Load Maximum * (Watt) | 62.6 | 53.7 14% | 67 -7% | 104.8 -67% | 68.9 -10% | 64.36 -3% |
| Witcher 3 ultra * (Watt) | 37.1 | 42.1 | 37.2 |
* ... Moindre est la valeur, meilleures sont les performances
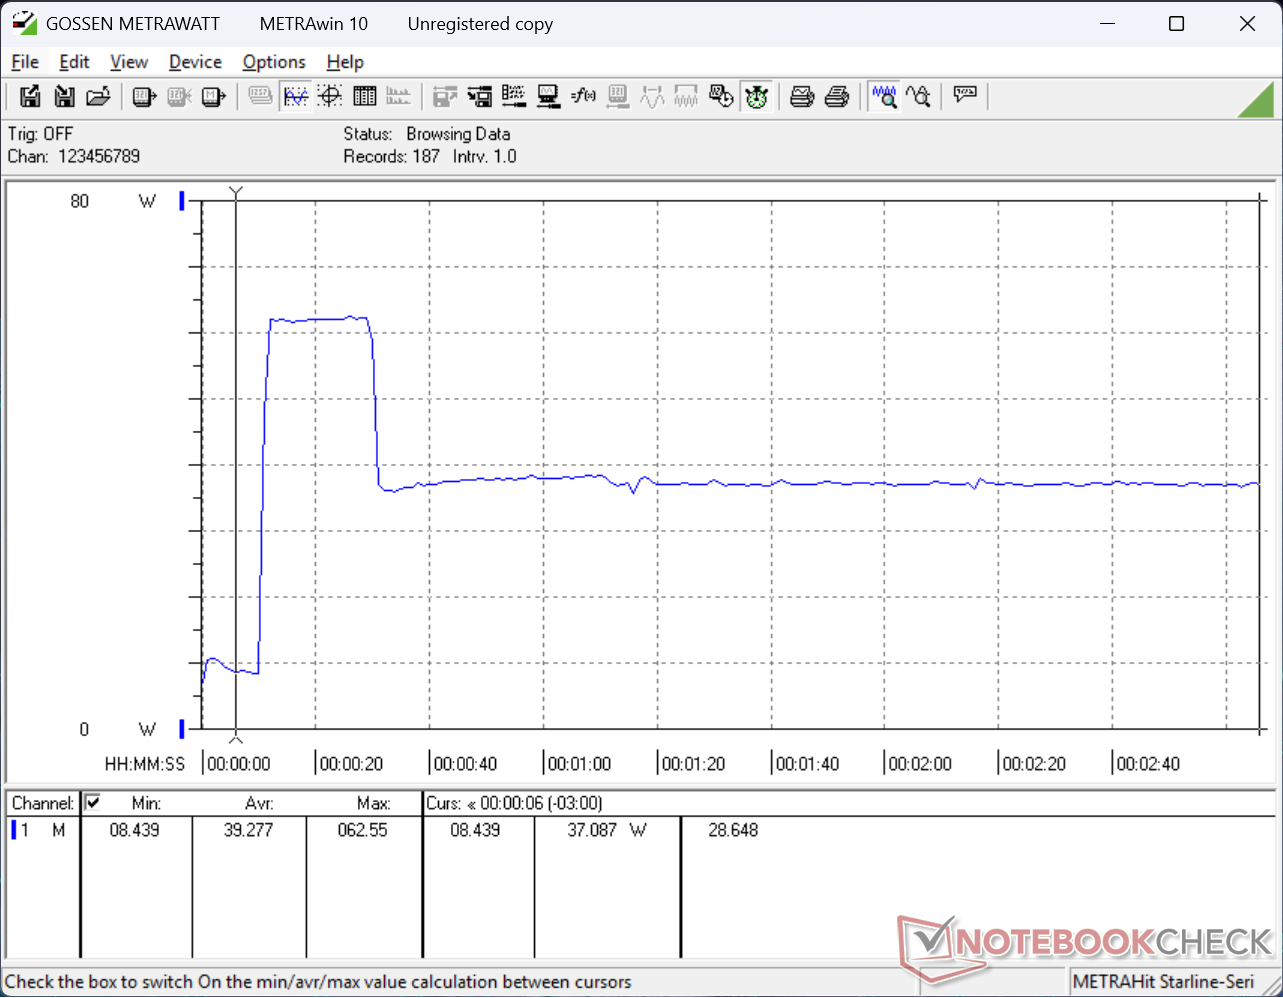
Power Consumption Cyberpunk / Stress Test
Power Consumption external Monitor
Autonomie de la batterie
L'autonomie du réseau local sans fil est très longue (plus de 14 heures) grâce à la batterie de 64 Wh.
| Dell 14 Plus Core Ultra 7 256V, Arc 140V, 64 Wh | Dell Inspiron 14 5425 6VPKR R5 5625U, Vega 7, 54 Wh | Dell Latitude 3440 i5-1345U, Iris Xe G7 80EUs, 54 Wh | Lenovo IdeaPad Pro 5 14AKP G10 Ryzen AI 7 350, Radeon 860M, 84 Wh | Lenovo ThinkPad E14 G6 Ultra 7 155U, Graphics 4-Core, 47 Wh | HP Pavilion Plus 14-ew0153TU i7-1355U, Iris Xe G7 96EUs, 68 Wh | |
|---|---|---|---|---|---|---|
| Autonomie de la batterie | -10% | -38% | -3% | -34% | -33% | |
| WiFi v1.3 (h) | 14.3 | 12.8 -10% | 8.8 -38% | 13.9 -3% | 9.4 -34% | 9.6 -33% |
| H.264 (h) | 19.6 | 12 | ||||
| Load (h) | 0.9 | 1.5 | ||||
| Reader / Idle (h) | 22.8 |
Notebookcheck Rating
Dell 14 Plus
- 06/01/2025 v8
Allen Ngo
 Total Sustainability Score:
 Potential Competitors in Comparison
Image | Modèle | Prix | Poids | Épaisseur | Écran |
|---|---|---|---|---|---|
1. 83.4%  | Dell 14 Plus Intel Core Ultra 7 256V ⎘ Intel Arc Graphics 140V ⎘ 16 Go Mémoire | Amazon: $977.00 Prix de liste: 1100 USD | 1.5 kg | 16.95 mm | 14.00" 2560x1600 216 PPI IPS |
2. 84.6% v7 (old) 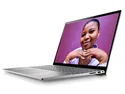 | Dell Inspiron 14 5425 6VPKR AMD Ryzen 5 5625U ⎘ AMD Radeon RX Vega 7 ⎘ 16 Go Mémoire, 512 Go SSD | Amazon: 1. $39.74 54Wh V6W33 Battery for Dell ... 2. $638.95 Dell Inspiron 14 5425 14" La... 3. $499.99 Dell Inspiron 14 5425 Notebo... Prix de liste: 849 Euro | 1.6 kg | 18.37 mm | 14.00" 1920x1200 162 PPI IPS |
3. 85.3% v7 (old) 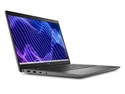 | Dell Latitude 3440 Intel Core i5-1345U ⎘ Intel Iris Xe Graphics G7 80EUs ⎘ 16 Go Mémoire, 512 Go SSD | Amazon: 1. $19.77 Dell Laptop Charger 65W Watt... 2. $21.99 GVKRLXZ 65W 4.5mm AC Adapter... 3. $1,055.33 Dell Latitude 3440 14" Touch... Prix de liste: 1100 USD | 1.5 kg | 19.4 mm | 14.00" 1920x1080 157 PPI IPS |
4. 87.4% 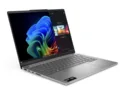 | Lenovo IdeaPad Pro 5 14AKP G10 AMD Ryzen AI 7 350 ⎘ AMD Radeon 860M ⎘ 32 Go Mémoire, 1024 Go SSD | Amazon: 1. $719.99 Lenovo Ideapad 5 14" 2-in-1 ... 2. $478.00 Lenovo Ideapad 5 14" 1080p T... 3. $899.98 Lenovo ThinkPad T14 Business... Prix de liste: 989€ | 1.4 kg | 15.5 mm | 14.00" 2880x1800 243 PPI OLED |
5. 84.8% 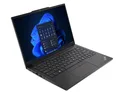 | Lenovo ThinkPad E14 G6 Intel Core Ultra 7 155U ⎘ Intel Graphics 4-Core iGPU (Arc) ⎘ 16 Go Mémoire, 512 Go SSD | Amazon: $1,165.38 Prix de liste: 990 USD | 1.5 kg | 17.99 mm | 14.00" 1920x1200 162 PPI IPS |
6. 87.5% v7 (old)  | HP Pavilion Plus 14-ew0153TU Intel Core i7-1355U ⎘ Intel Iris Xe Graphics G7 96EUs ⎘ 16 Go Mémoire, 1024 Go SSD | Amazon: 1. $54.99 WE04XL N39857-005 Battery Re... 2. $59.99 WE04XL Laptop Battery for HP... 3. $59.99 BOWEIRUI WE04XL N39857-005 B... Prix de liste: 1020 USD | 1.4 kg | 17.5 mm | 14.00" 2880x1800 243 PPI OLED |
Transparency
La sélection des appareils à examiner est effectuée par notre équipe éditoriale. L'échantillon de test a été prêté à l'auteur par le fabricant ou le détaillant pour les besoins de cet examen. Le prêteur n'a pas eu d'influence sur cette évaluation et le fabricant n'a pas reçu de copie de cette évaluation avant sa publication. Il n'y avait aucune obligation de publier cet article. En tant que média indépendant, Notebookcheck n'est pas soumis à l'autorité des fabricants, des détaillants ou des éditeurs.
Voici comment Notebookcheck teste
Chaque année, Notebookcheck examine de manière indépendante des centaines d'ordinateurs portables et de smartphones en utilisant des procédures standardisées afin de garantir que tous les résultats sont comparables. Nous avons continuellement développé nos méthodes de test depuis environ 20 ans et avons établi des normes industrielles dans le processus. Dans nos laboratoires de test, des équipements de mesure de haute qualité sont utilisés par des techniciens et des rédacteurs expérimentés. Ces tests impliquent un processus de validation en plusieurs étapes. Notre système d'évaluation complexe repose sur des centaines de mesures et de points de référence bien fondés, ce qui garantit l'objectivité.
