Dell Latitude 15 9520 2-en-1 face au 9510 2-en-1 : le plus récent n'est pas toujours le meilleur
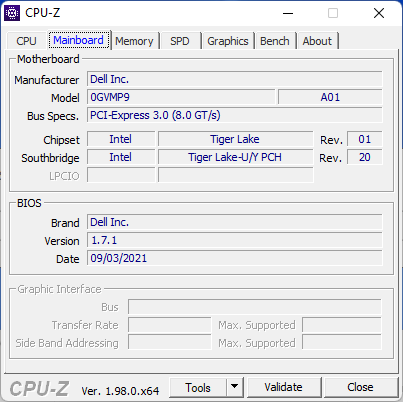
Le Latitude 9520 2-in-1 remplace le CPU Intel de 10e génération du Latitude 9510 2-in-1 par des options plus récentes de 11e génération tout en gardant le même châssis. Ainsi, nous vous recommandons de consulter notre revue existante sur le Latitude 9510 2-in-1 pour en savoir plus sur le châssis, le clavier et les autres caractéristiques physiques du système. Cet article se concentre sur les différences entre les deux modèles, y compris sur ce que les utilisateurs peuvent attendre en termes de performances.
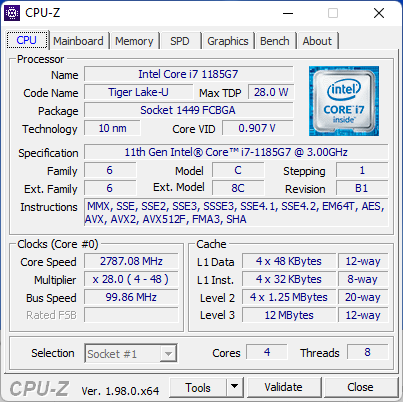
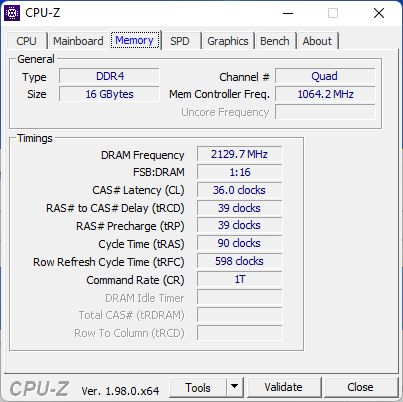
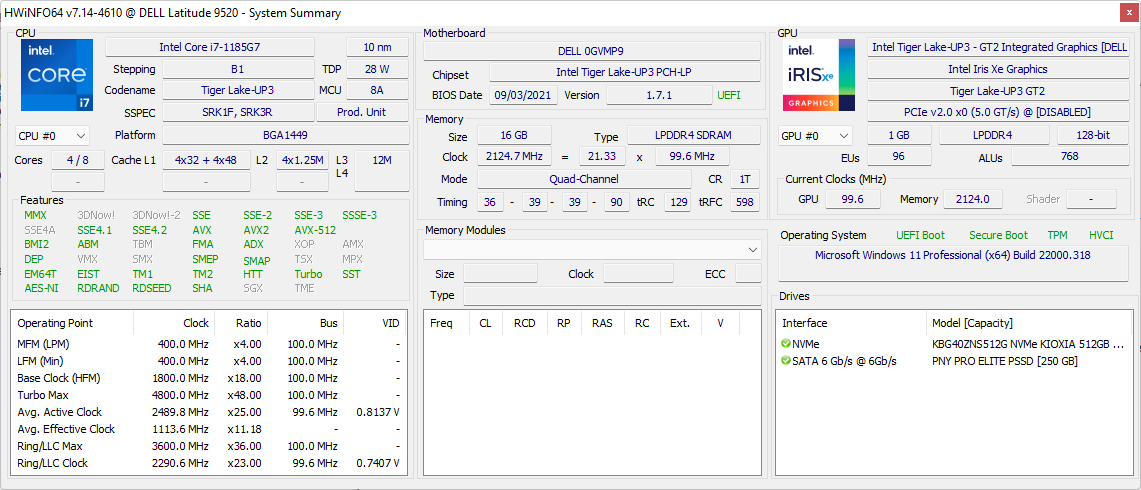
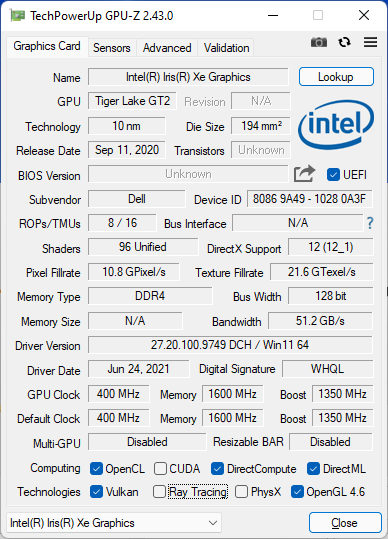
Notre unité de test est une configuration haut de gamme équipée d'un processeur Core i7-1185G7 compatible vPro, d'un GPU Iris Xe 96 EUs, de 16 Go de RAM et d'un SSD NVMe de 512 Go pour environ 2800 USD. Des SKU plus petits avec le CPU Core i5-1145G7 et la moitié de la capacité de stockage sont disponibles pour environ 2300 $. Notez que toutes les UGS 2-en-1 sont équipées de la même dalle FHD de 15 pouces avec capteur de proximité et obturateur électronique. Les utilisateurs peuvent également acheter le clamshell Latitude 9520 si le facteur de forme 2-en-1 n'est pas souhaitable.
Le 2-en-1 Latitude 9520 est en concurrence avec d'autres convertibles professionnels haut de gamme comme le MSI Summit E13 Flip, Microsoft Surface Book, HP EliteBook x360 1040 G7, ou le Lenovo ThinkPad x13 Yoga.
Plus de commentaires sur Dell :
Potential Competitors in Comparison
Note | Date | Modèle | Poids | Épaisseur | Taille | Résolution | Prix |
|---|---|---|---|---|---|---|---|
| 89.2 % v7 (old) | 11/21 | Dell Latitude 15 9520 2-in-1 i7-1185G7, Iris Xe G7 96EUs | 1.7 kg | 13.99 mm | 15.00" | 1920x1080 | |
| 88.6 % v7 (old) | 08/20 | Dell Latitude 9510 2-in-1 i7-10810U, UHD Graphics 620 | 1.7 kg | 13.99 mm | 15.00" | 1920x1080 | |
| 86.1 % v7 (old) | 08/21 | HP EliteBook 850 G8 3C7Z8EA i7-1165G7, Iris Xe G7 96EUs | 1.8 kg | 19 mm | 15.60" | 1920x1080 | |
| 85.1 % v7 (old) | 07/21 | Lenovo ThinkPad L15 G2 AMD R5 5600U, Vega 7 | 1.9 kg | 21 mm | 15.60" | 1920x1080 | |
| 81.2 % v7 (old) | 05/21 | MSI Summit B15 A11M i7-1165G7, Iris Xe G7 96EUs | 1.5 kg | 16.9 mm | 15.60" | 1920x1080 | |
| 84.9 % v7 (old) | 04/21 | Microsoft Surface Laptop 4 15 AMD TFF_00028 R7 4980U, Vega 8 | 1.6 kg | 14.7 mm | 15.00" | 2496x1664 |
Cas
Bien que le châssis soit identique au modèle de l'année dernière, les charnières de notre unité de test Latitude 9520 2-en-1 semblent plus faibles à des angles compris entre 60 et 90 degrés. Idéalement, la rigidité des charnières devrait être uniforme sous tous les angles. Nous vous recommandons de vérifier les charnières après l'achat pour détecter toute anomalie.
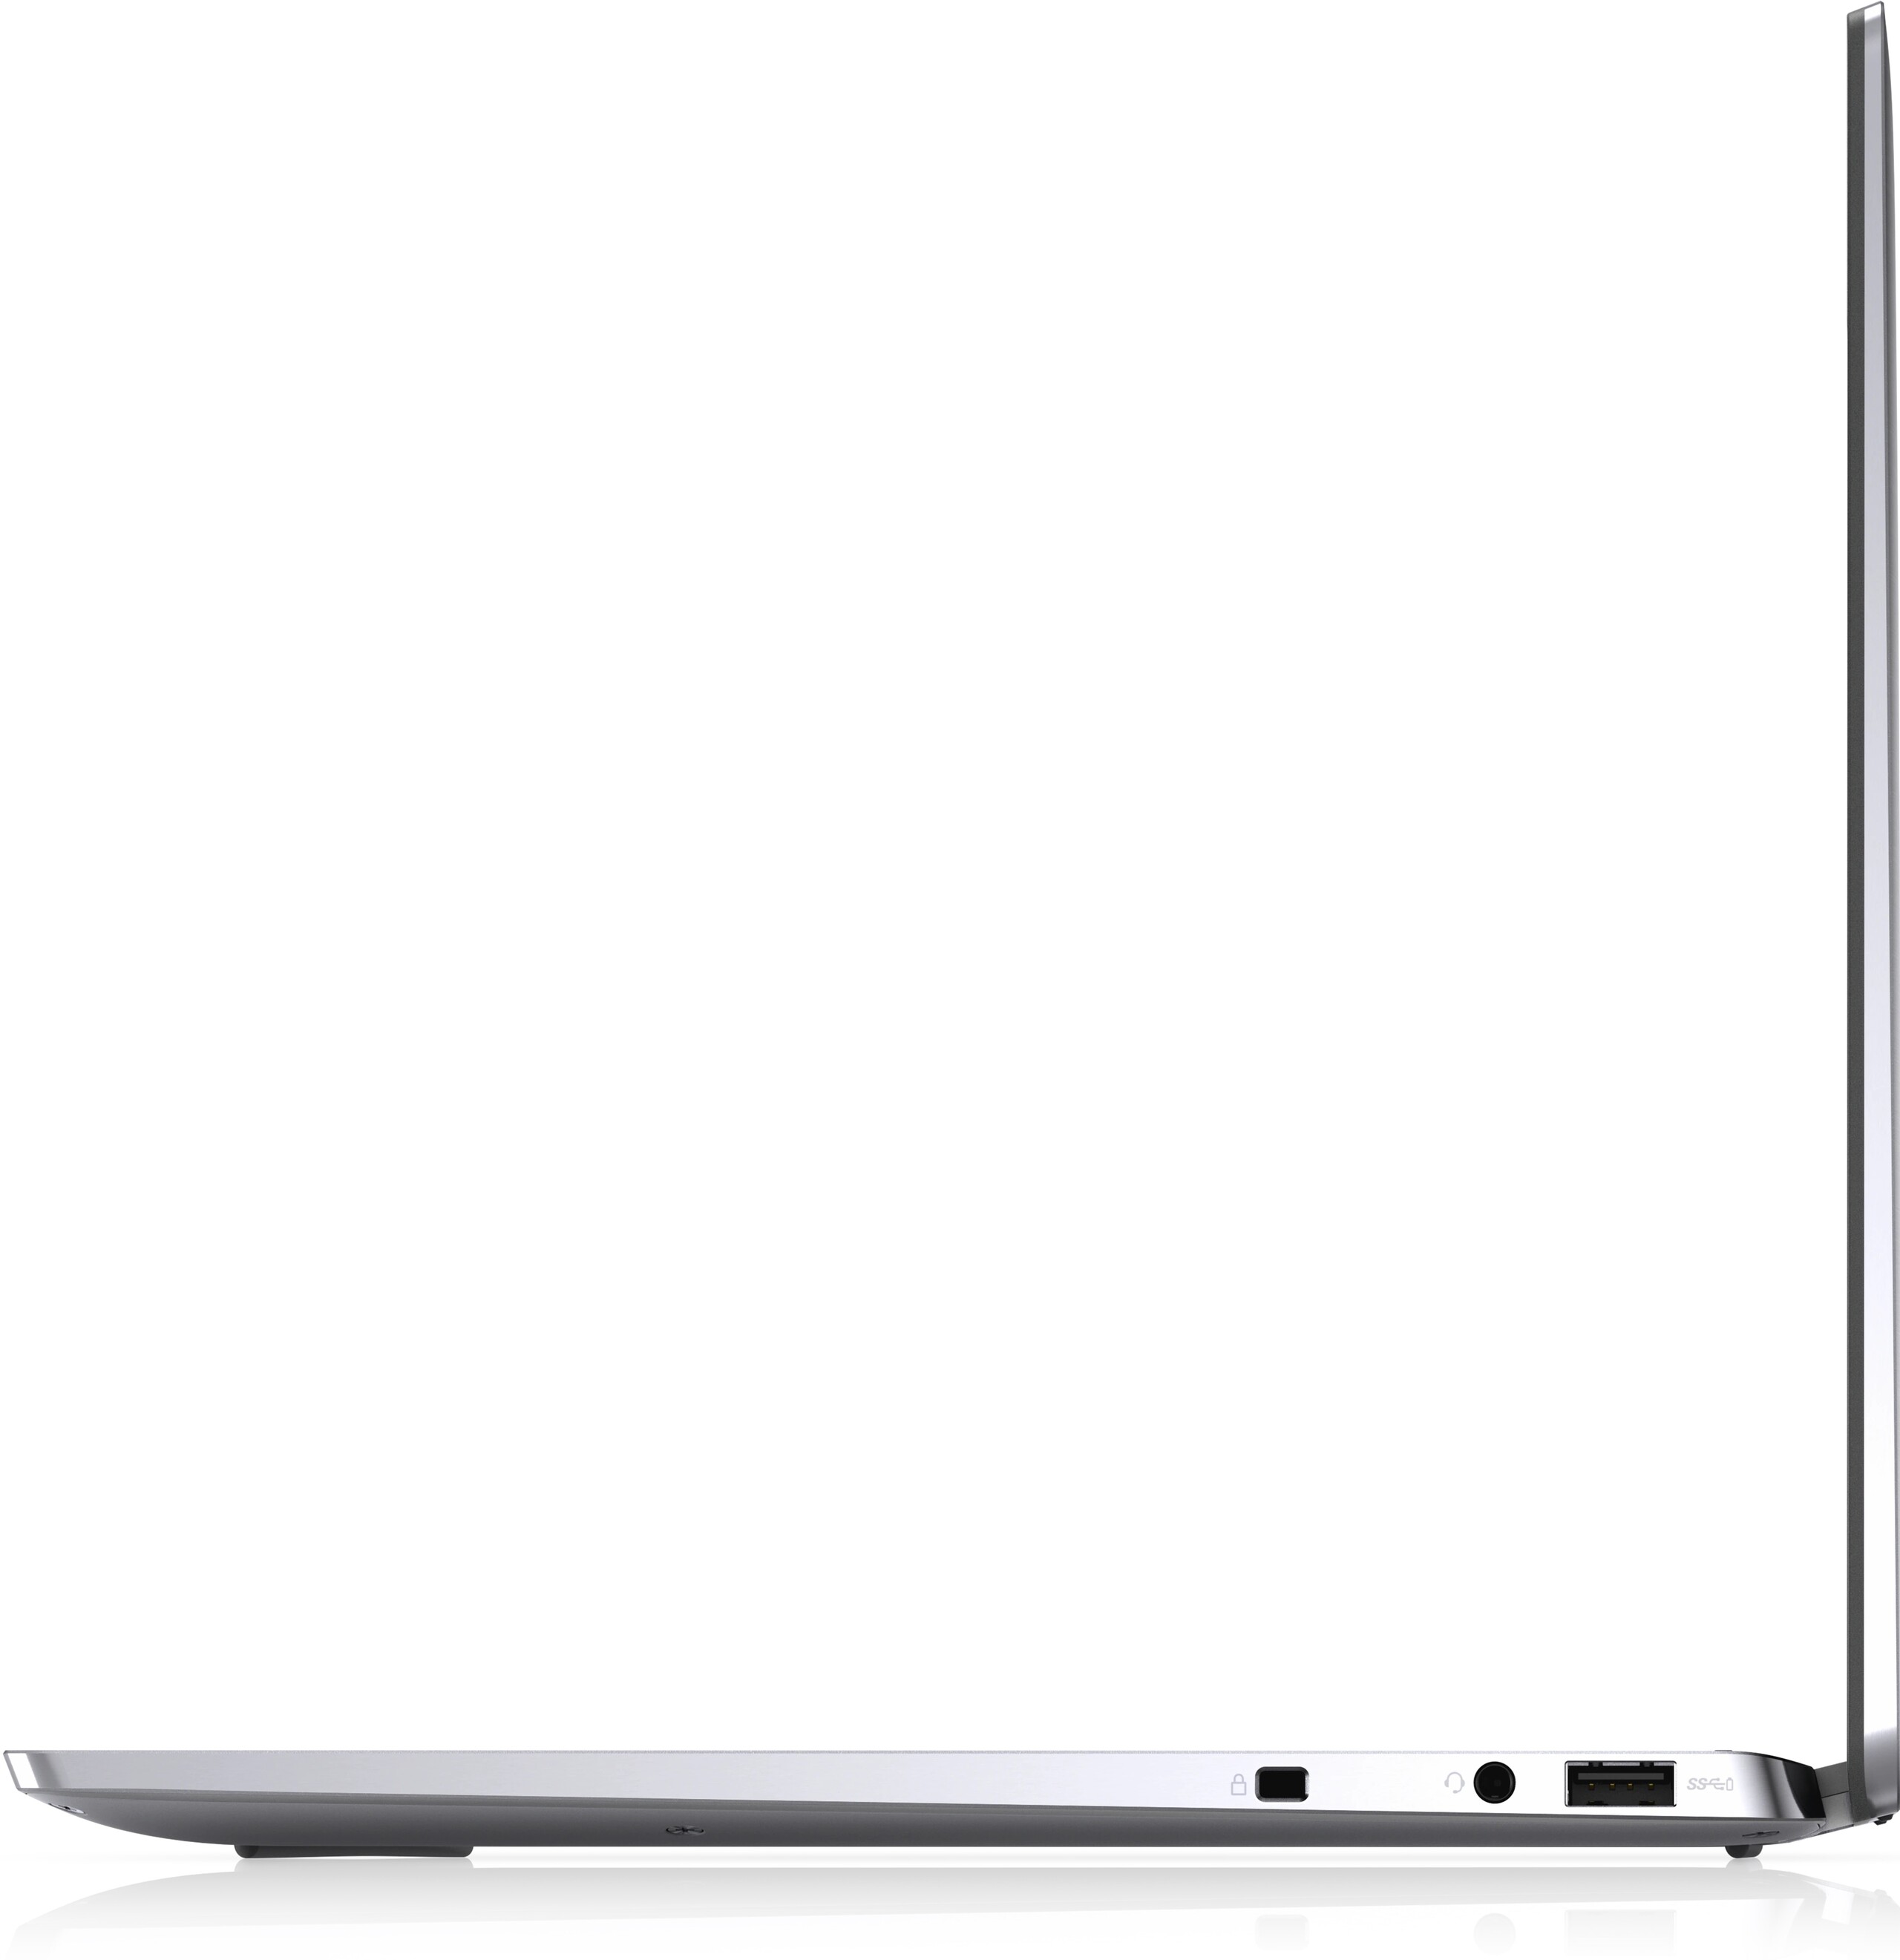
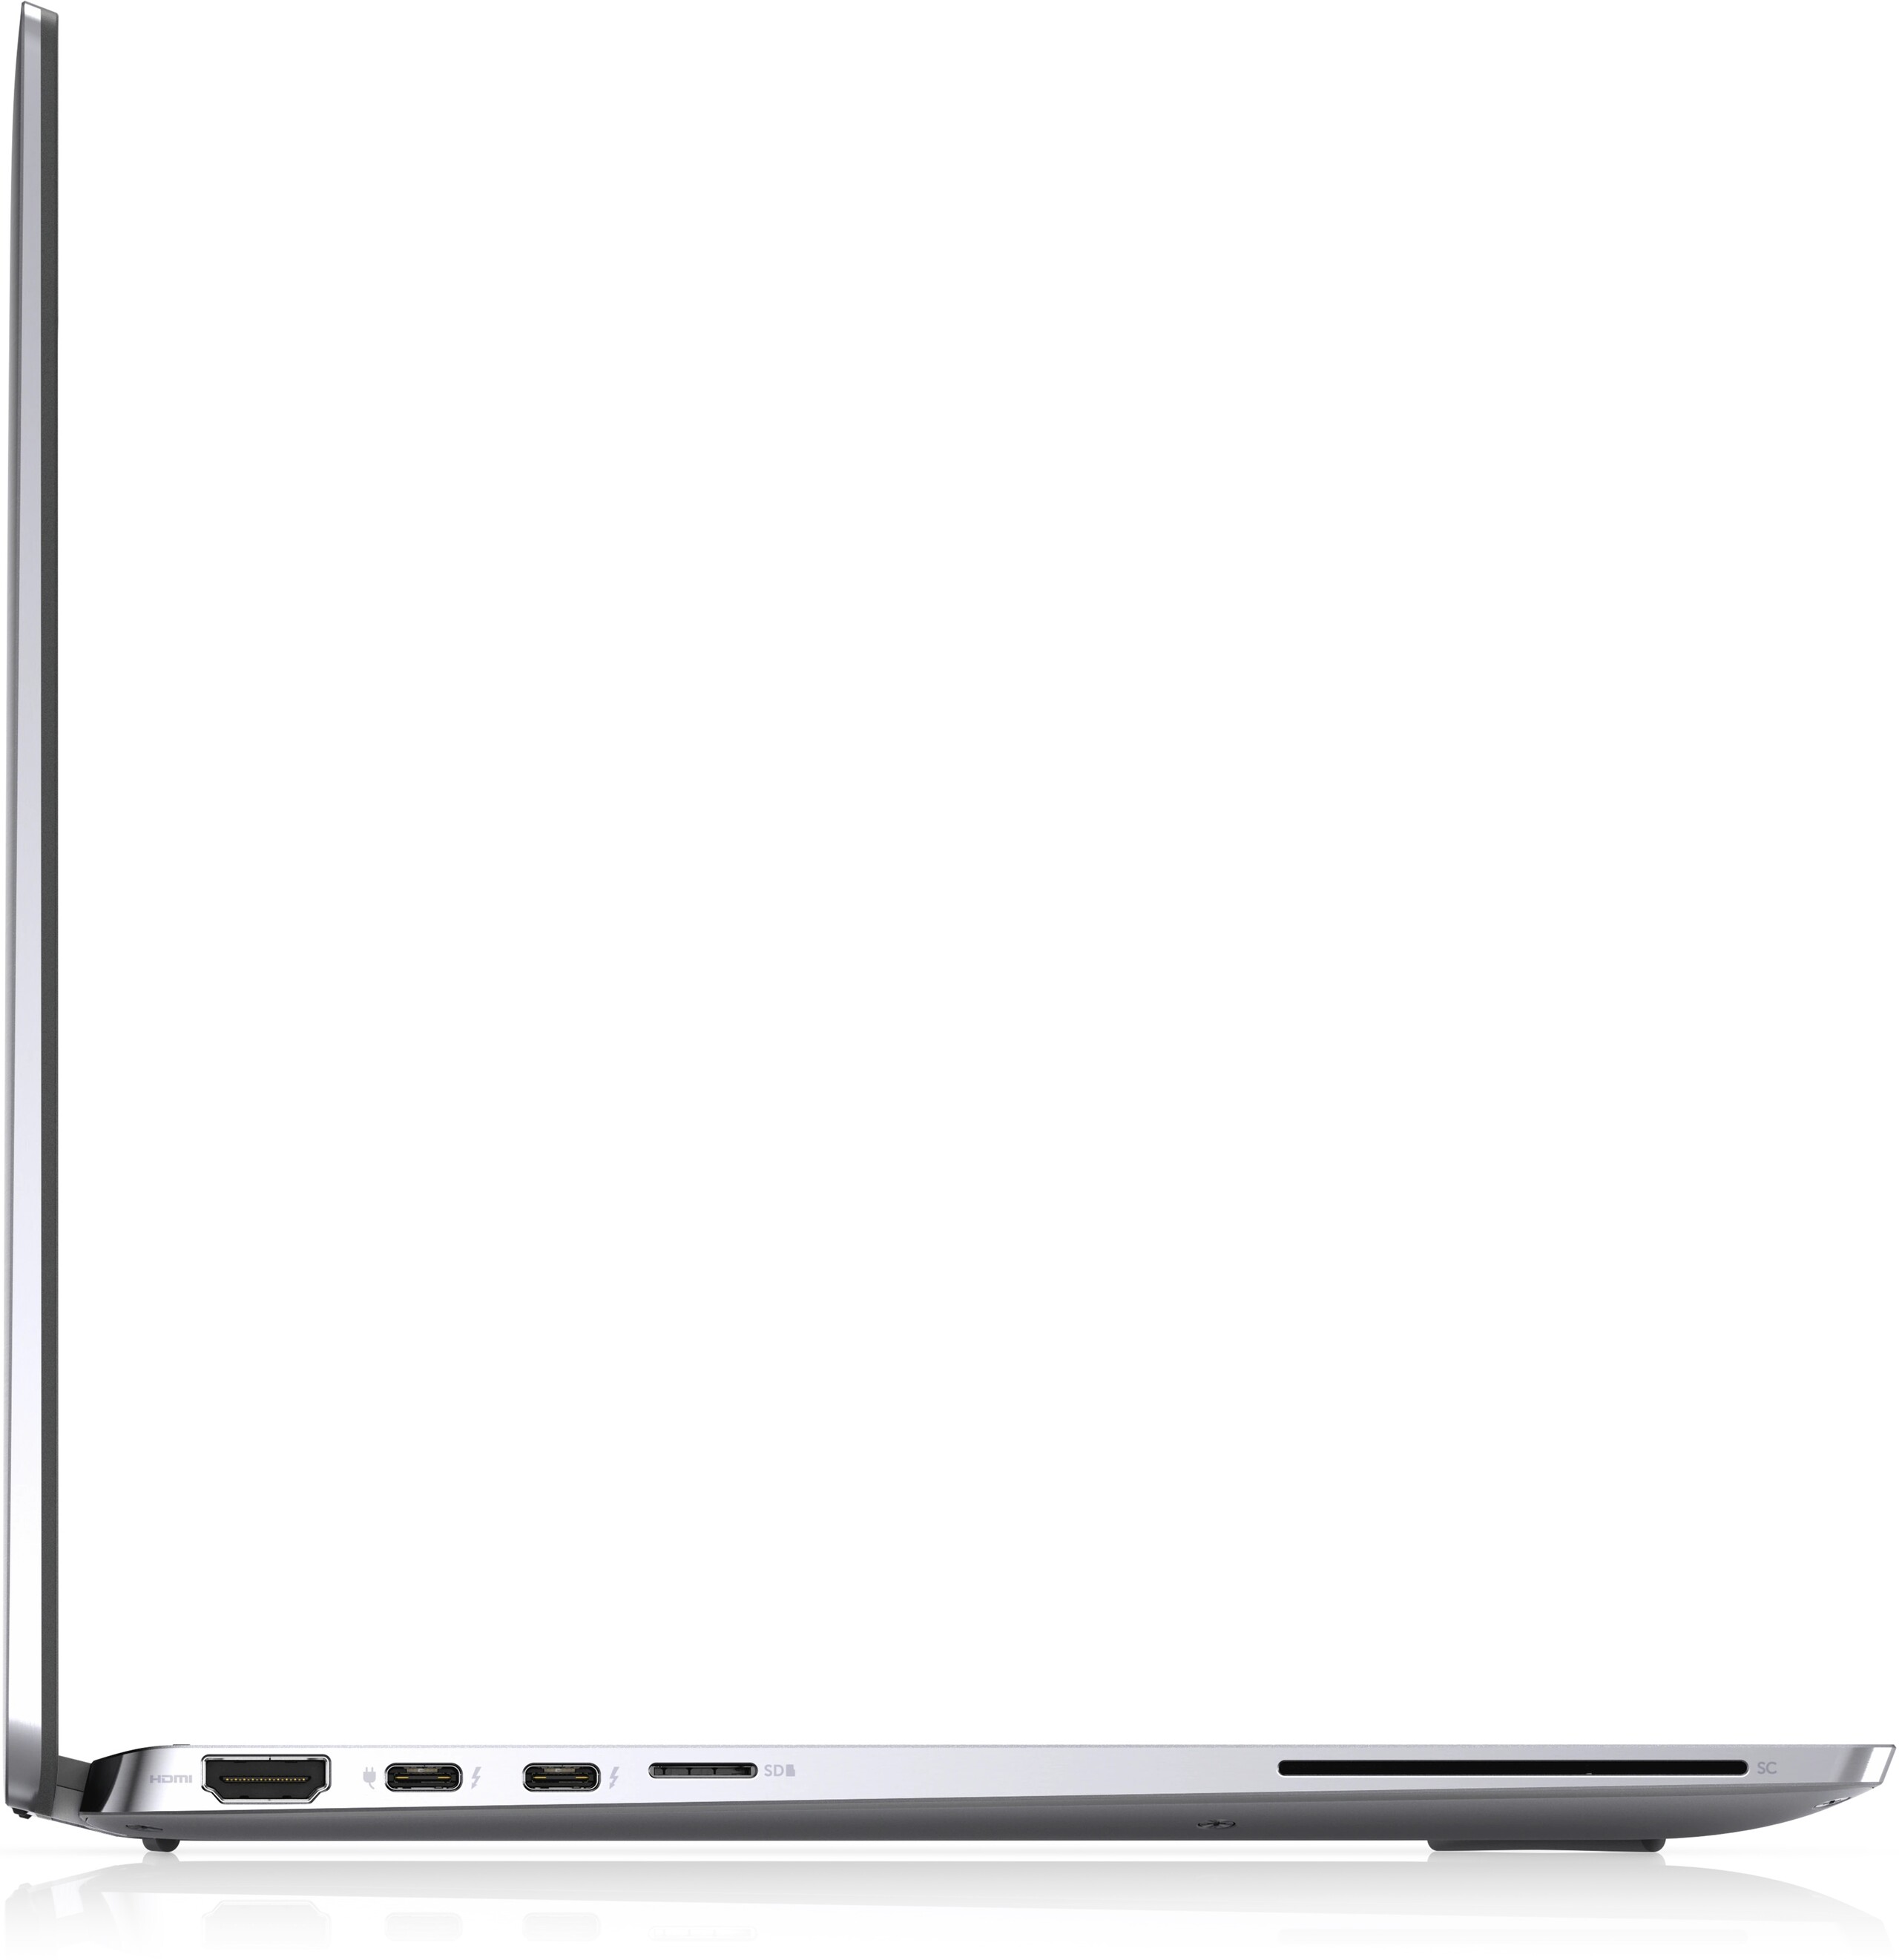
Connectivité
Les ports Thunderbolt 3 du Latitude 9510 ont été mis à niveau vers Thunderbolt 4 sur notre Latitude 9520. Pour la plupart des utilisateurs, cependant, la mise à niveau n'aura pratiquement aucune importance, sauf si vous prévoyez d'utiliser des GPU externes. Tous les autres ports sont par ailleurs identiques entre les deux modèles.
Lecteur de carte SD
| SD Card Reader | |
| average JPG Copy Test (av. of 3 runs) | |
| Dell Latitude 9510 2-in-1 (Toshiba Exceria Pro M501 64 GB UHS-II) | |
| Dell Latitude 15 9520 2-in-1 (AV Pro V60) | |
| MSI Summit B15 A11M (AV PRO microSD 128 GB V60) | |
| Lenovo ThinkPad L15 G2 AMD (AV Pro V60) | |
| maximum AS SSD Seq Read Test (1GB) | |
| MSI Summit B15 A11M (AV PRO microSD 128 GB V60) | |
| Dell Latitude 9510 2-in-1 (Toshiba Exceria Pro M501 64 GB UHS-II) | |
| Dell Latitude 15 9520 2-in-1 (AV Pro V60) | |
| Lenovo ThinkPad L15 G2 AMD (AV Pro V60) | |
Communication
Webcam


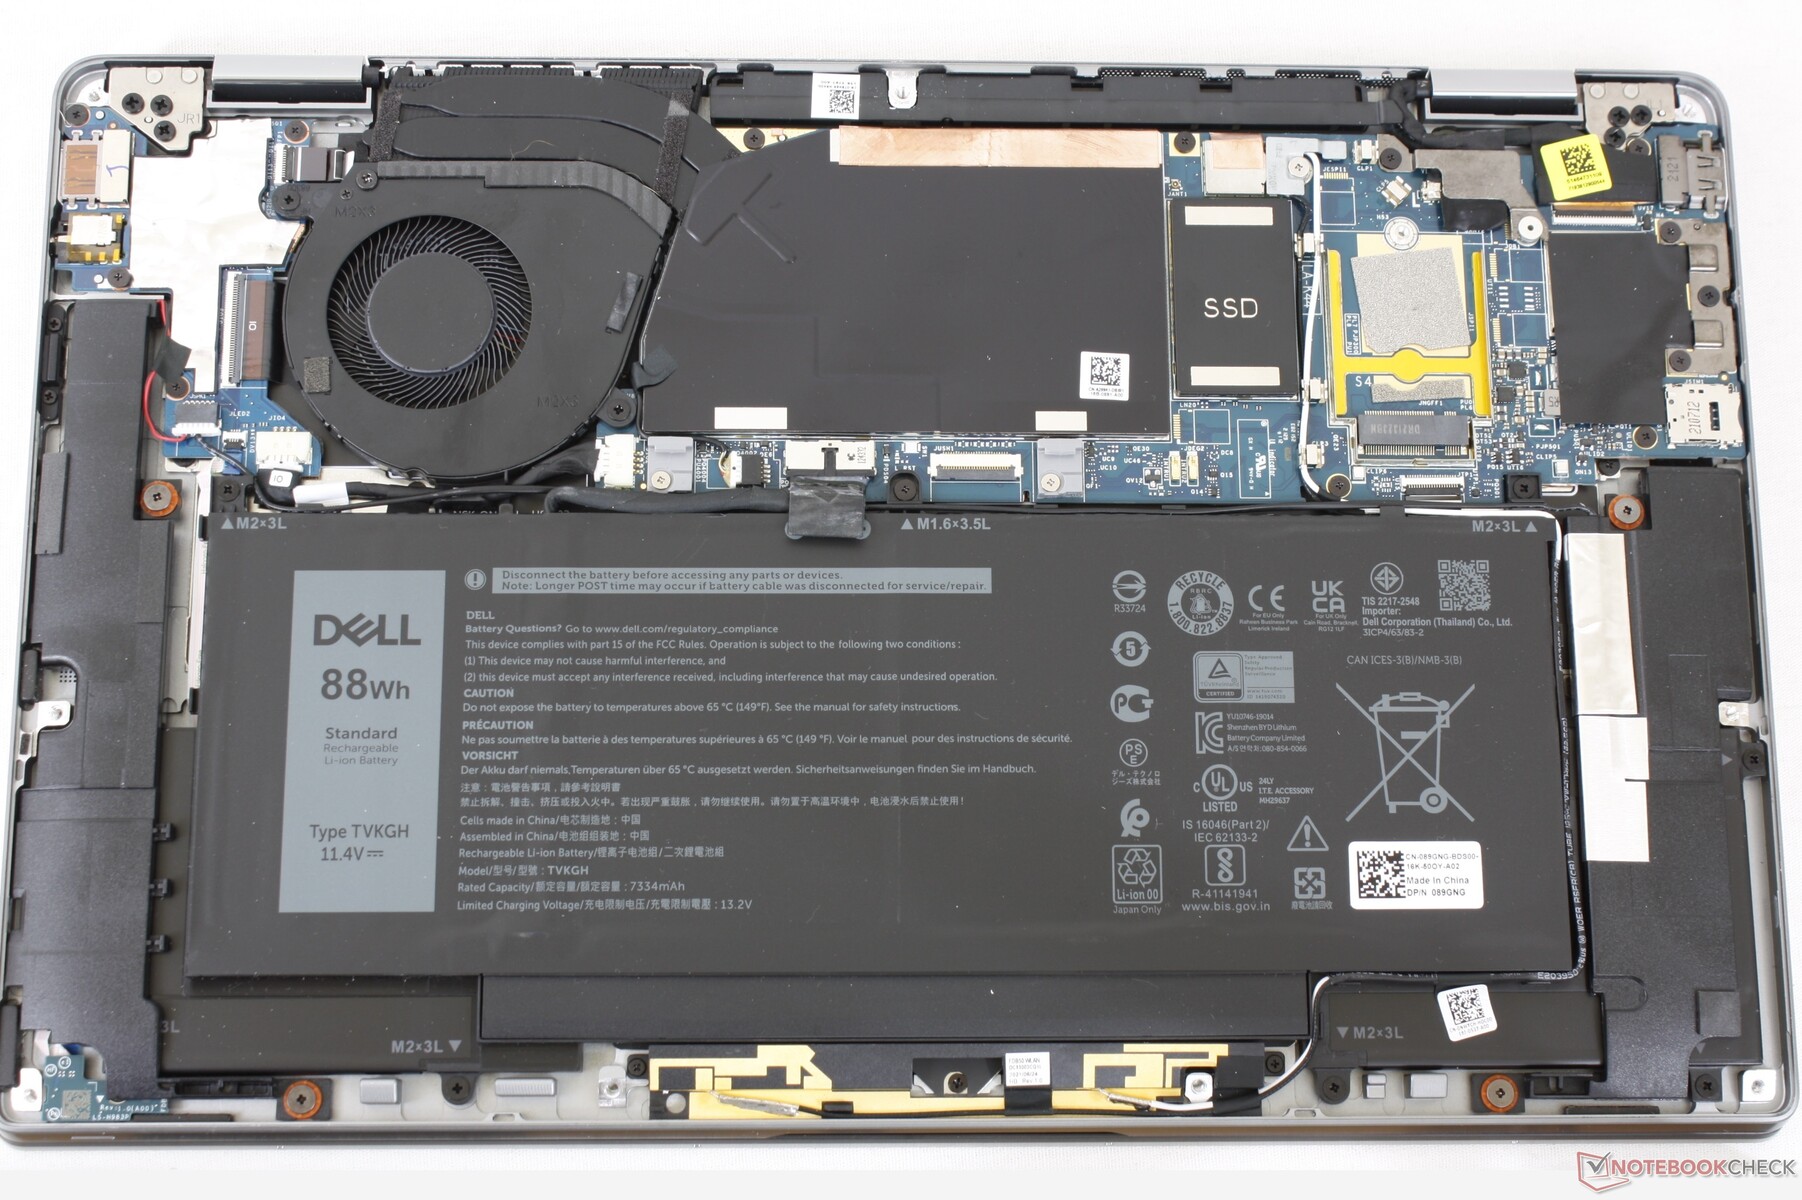
Maintenance
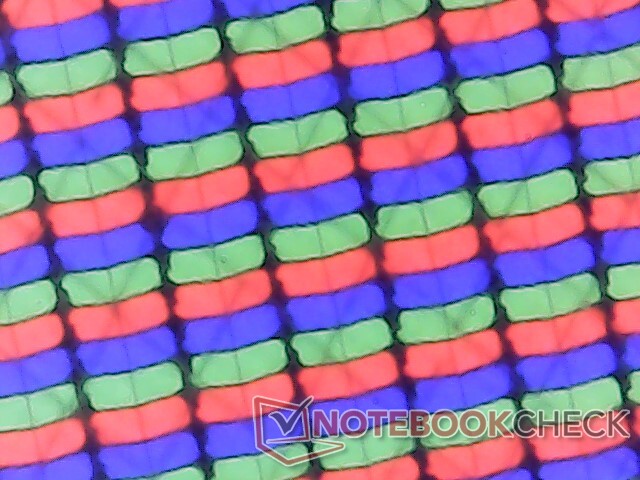
Afficher
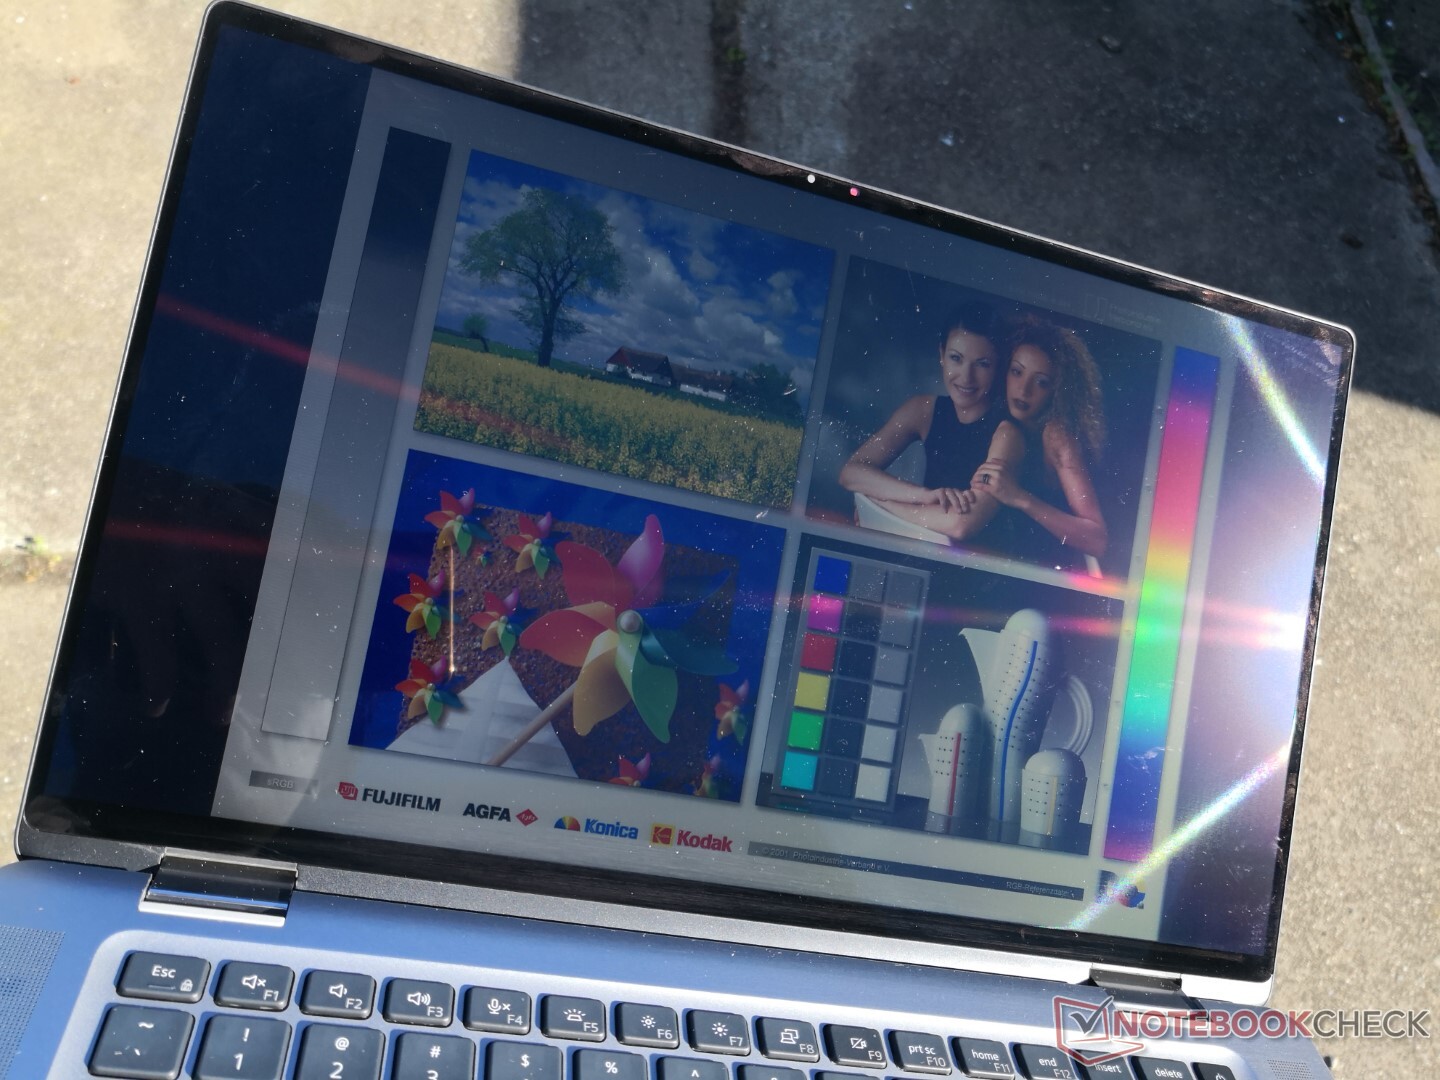
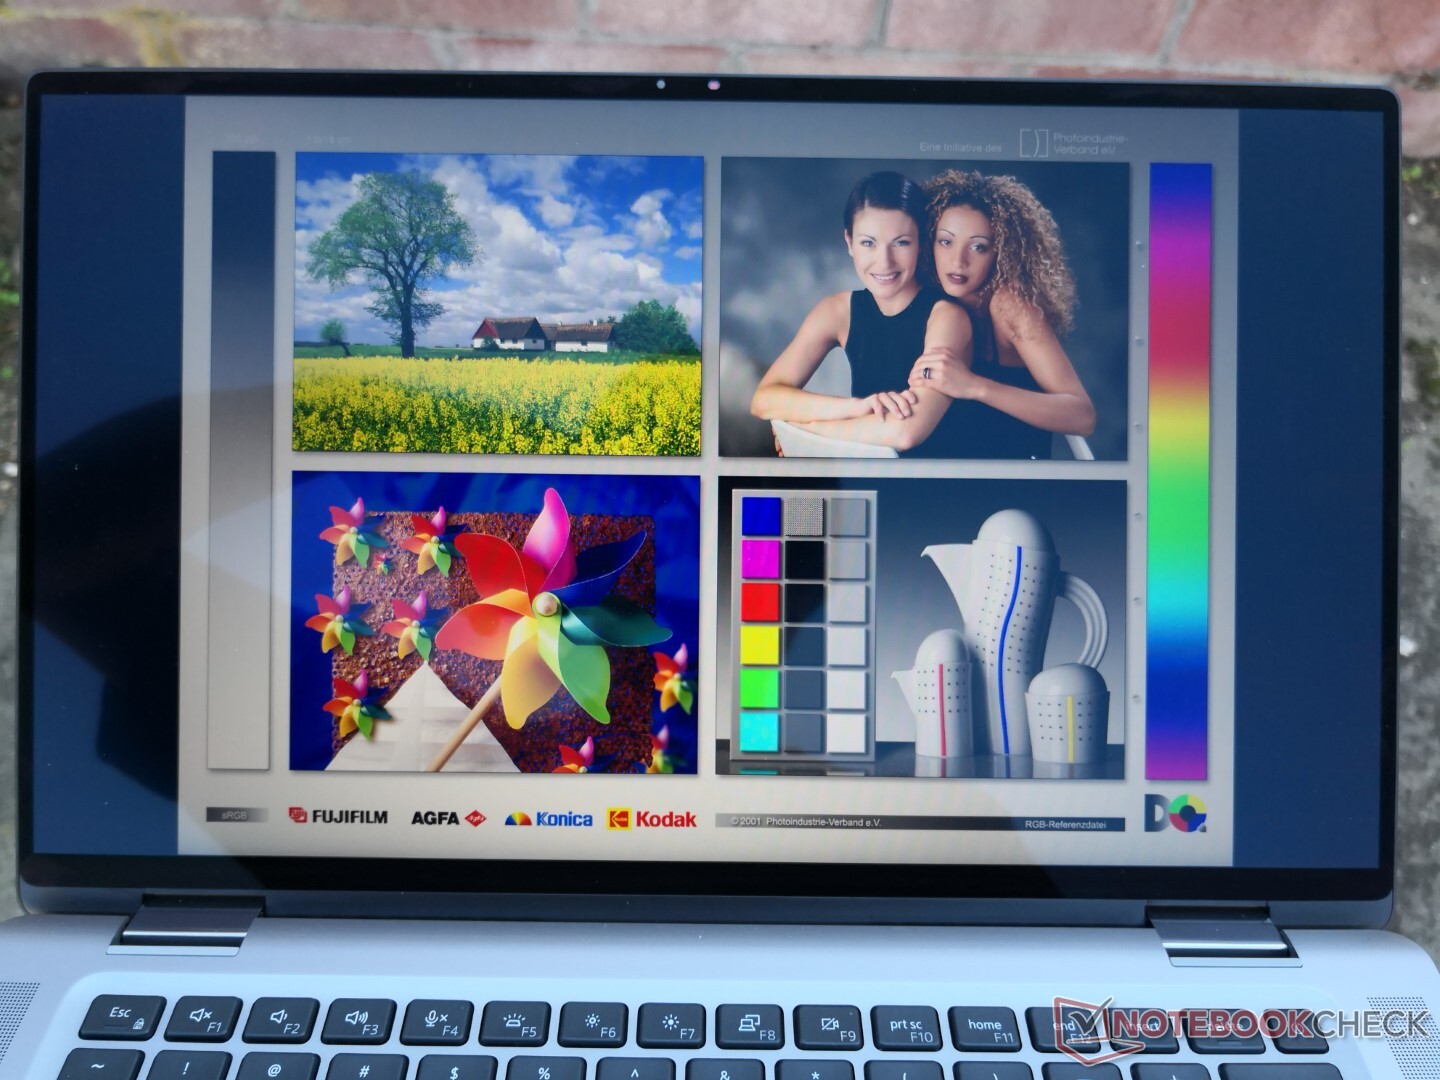
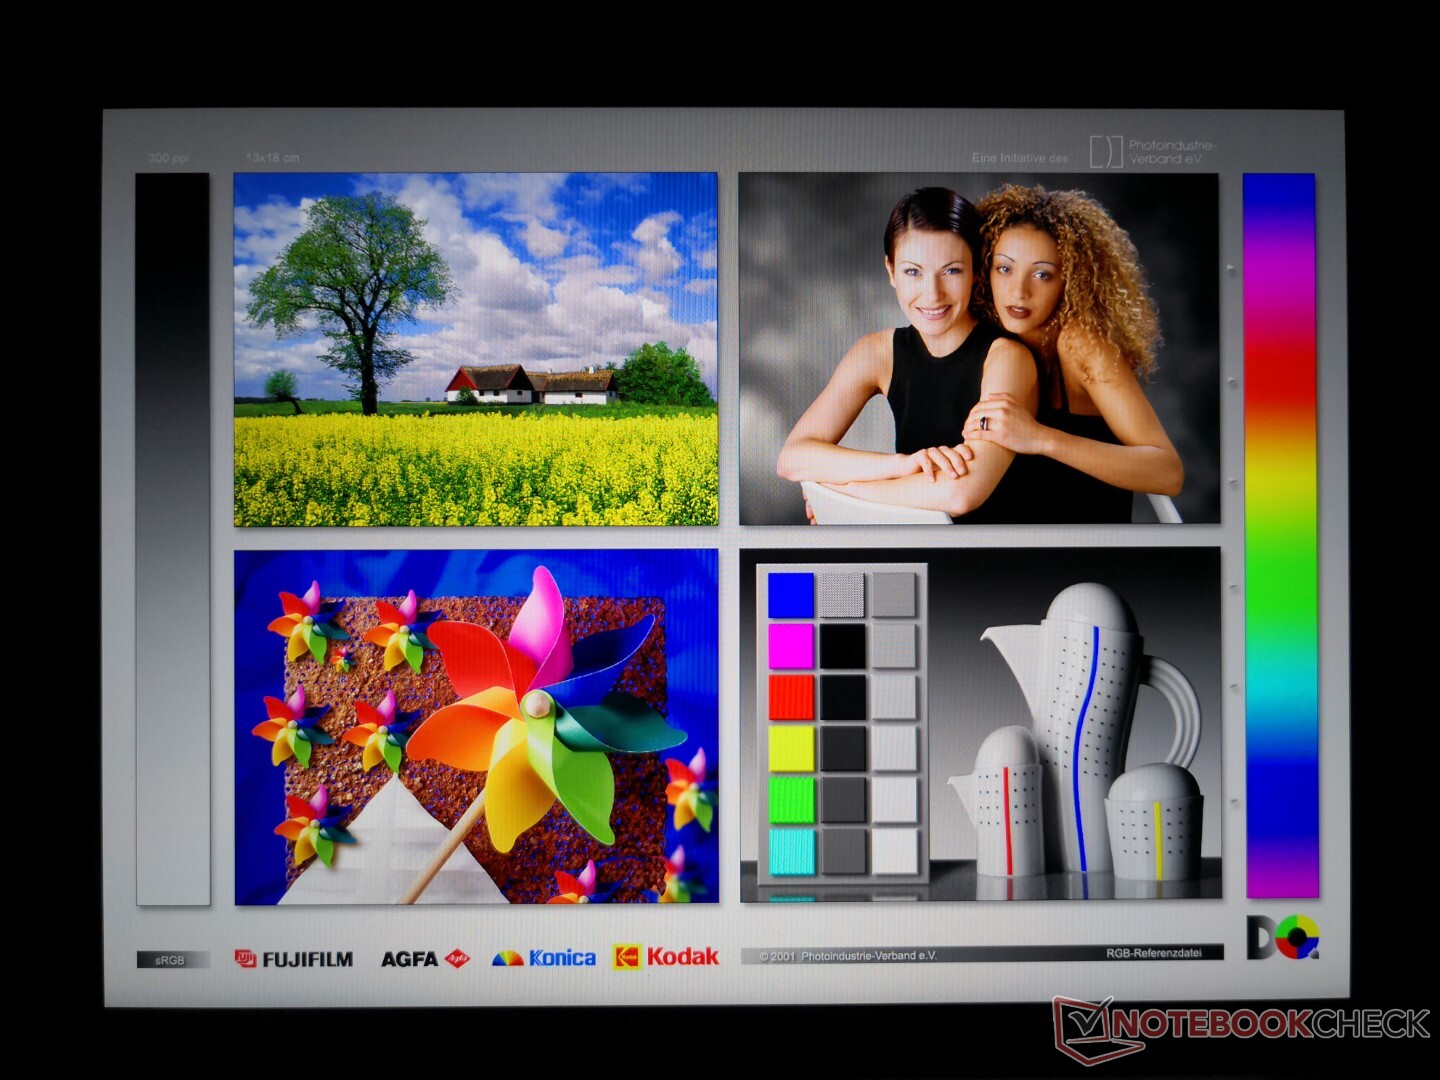
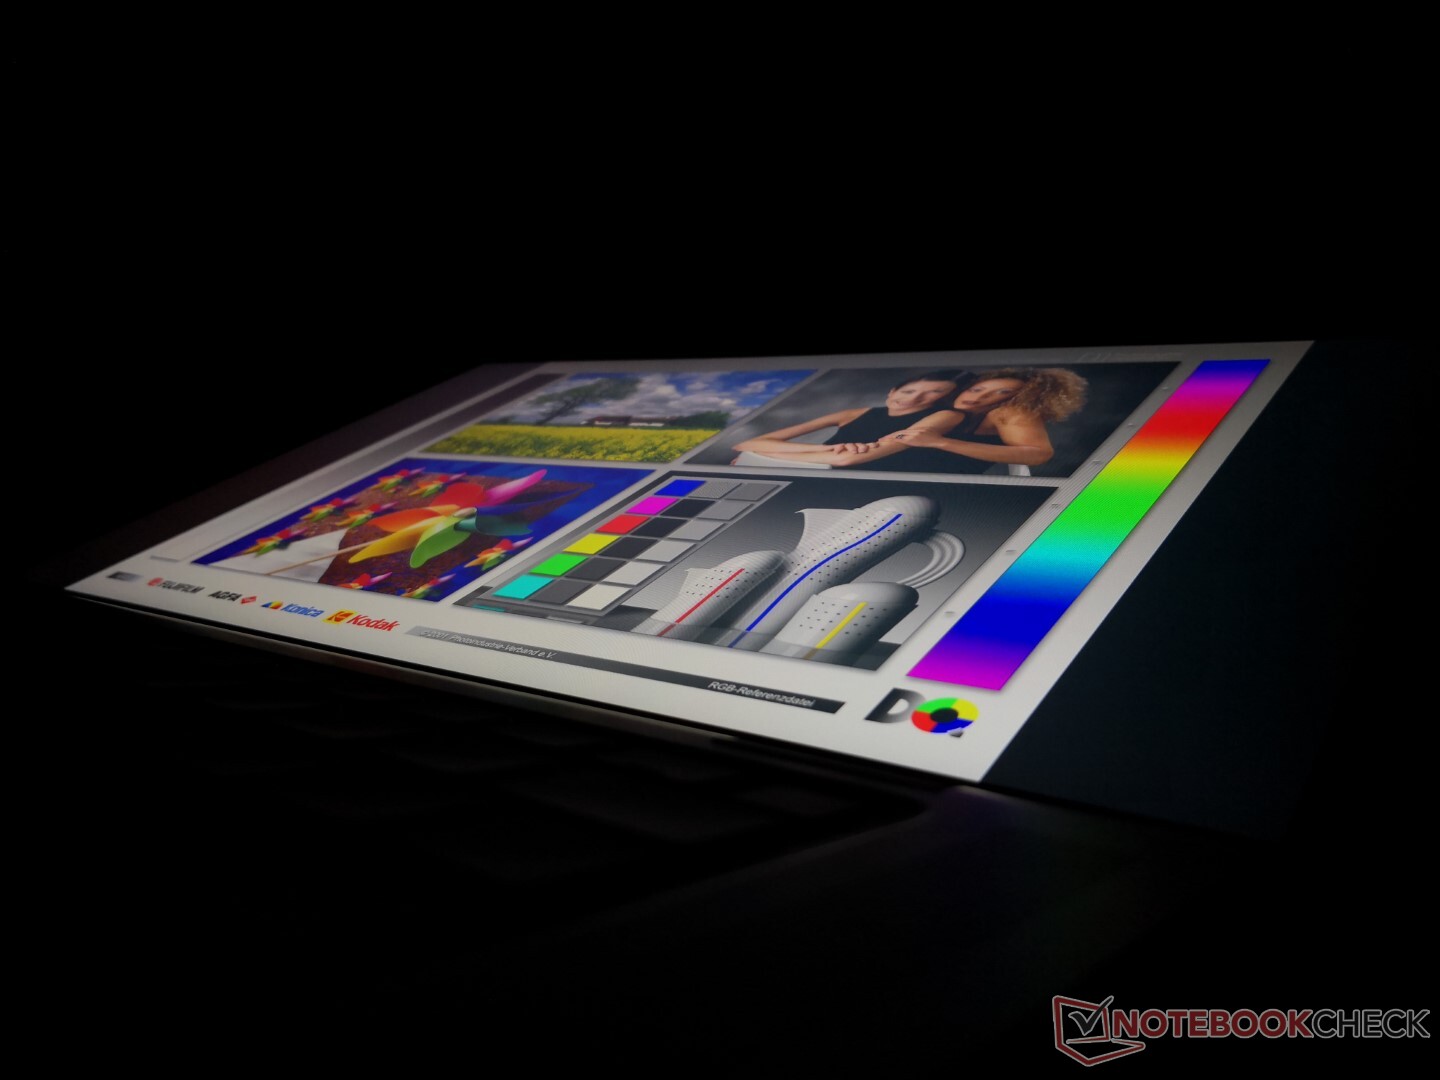
Dell utilise la même dalle IPS AU Optronics B150HAN sur les modèles Latitude 9510 2-in-1 et 9520 2-in-1 pour une expérience visuelle similaire. Il n'y a malheureusement pas de nouvelles options de panneau pour le 9520 2-en-1. Des options 4K ou OLED seraient très intéressantes pour les futures révisions de Latitude 2-in-1.
| |||||||||||||||||||||||||
Homogénéité de la luminosité: 84 %
Valeur mesurée au centre, sur batterie: 403.6 cd/m²
Contraste: 1835:1 (Valeurs des noirs: 0.22 cd/m²)
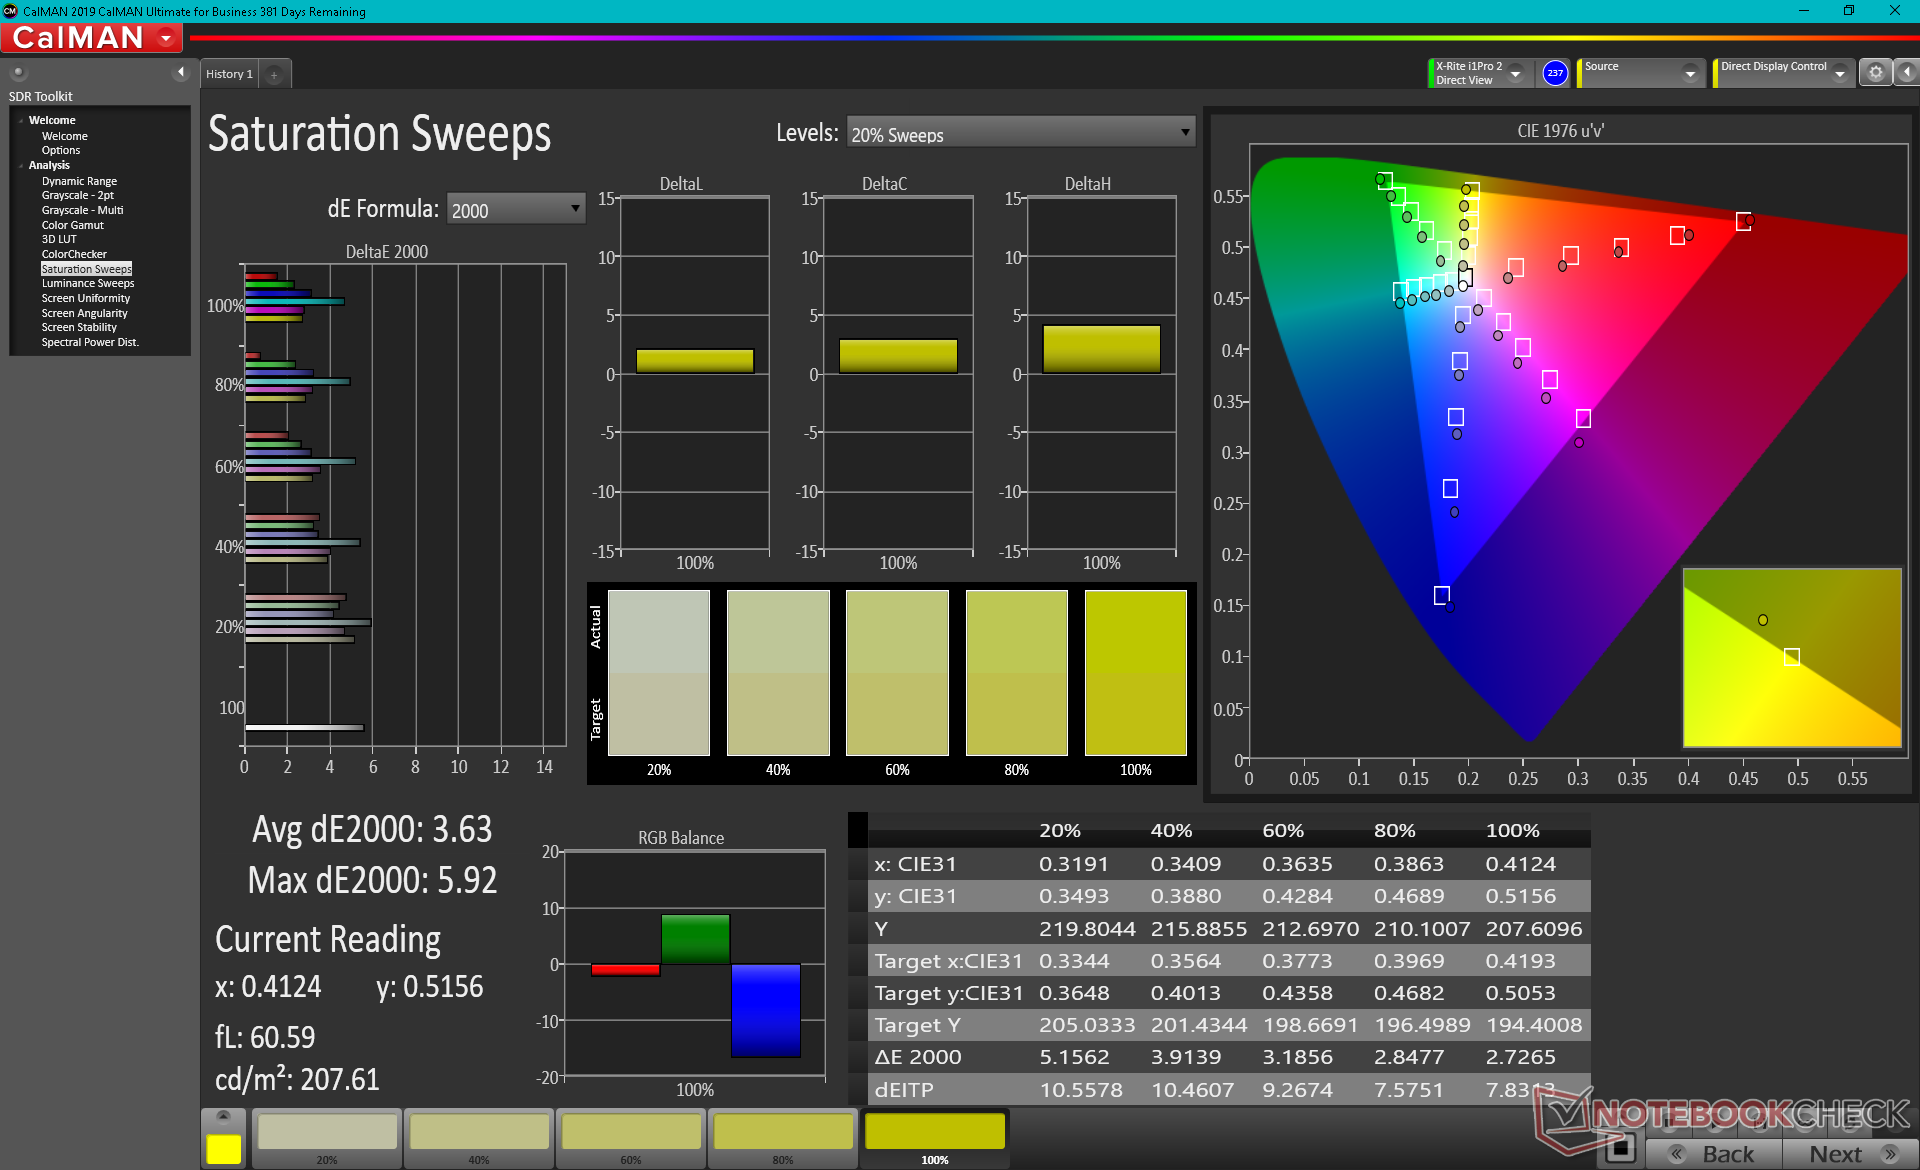
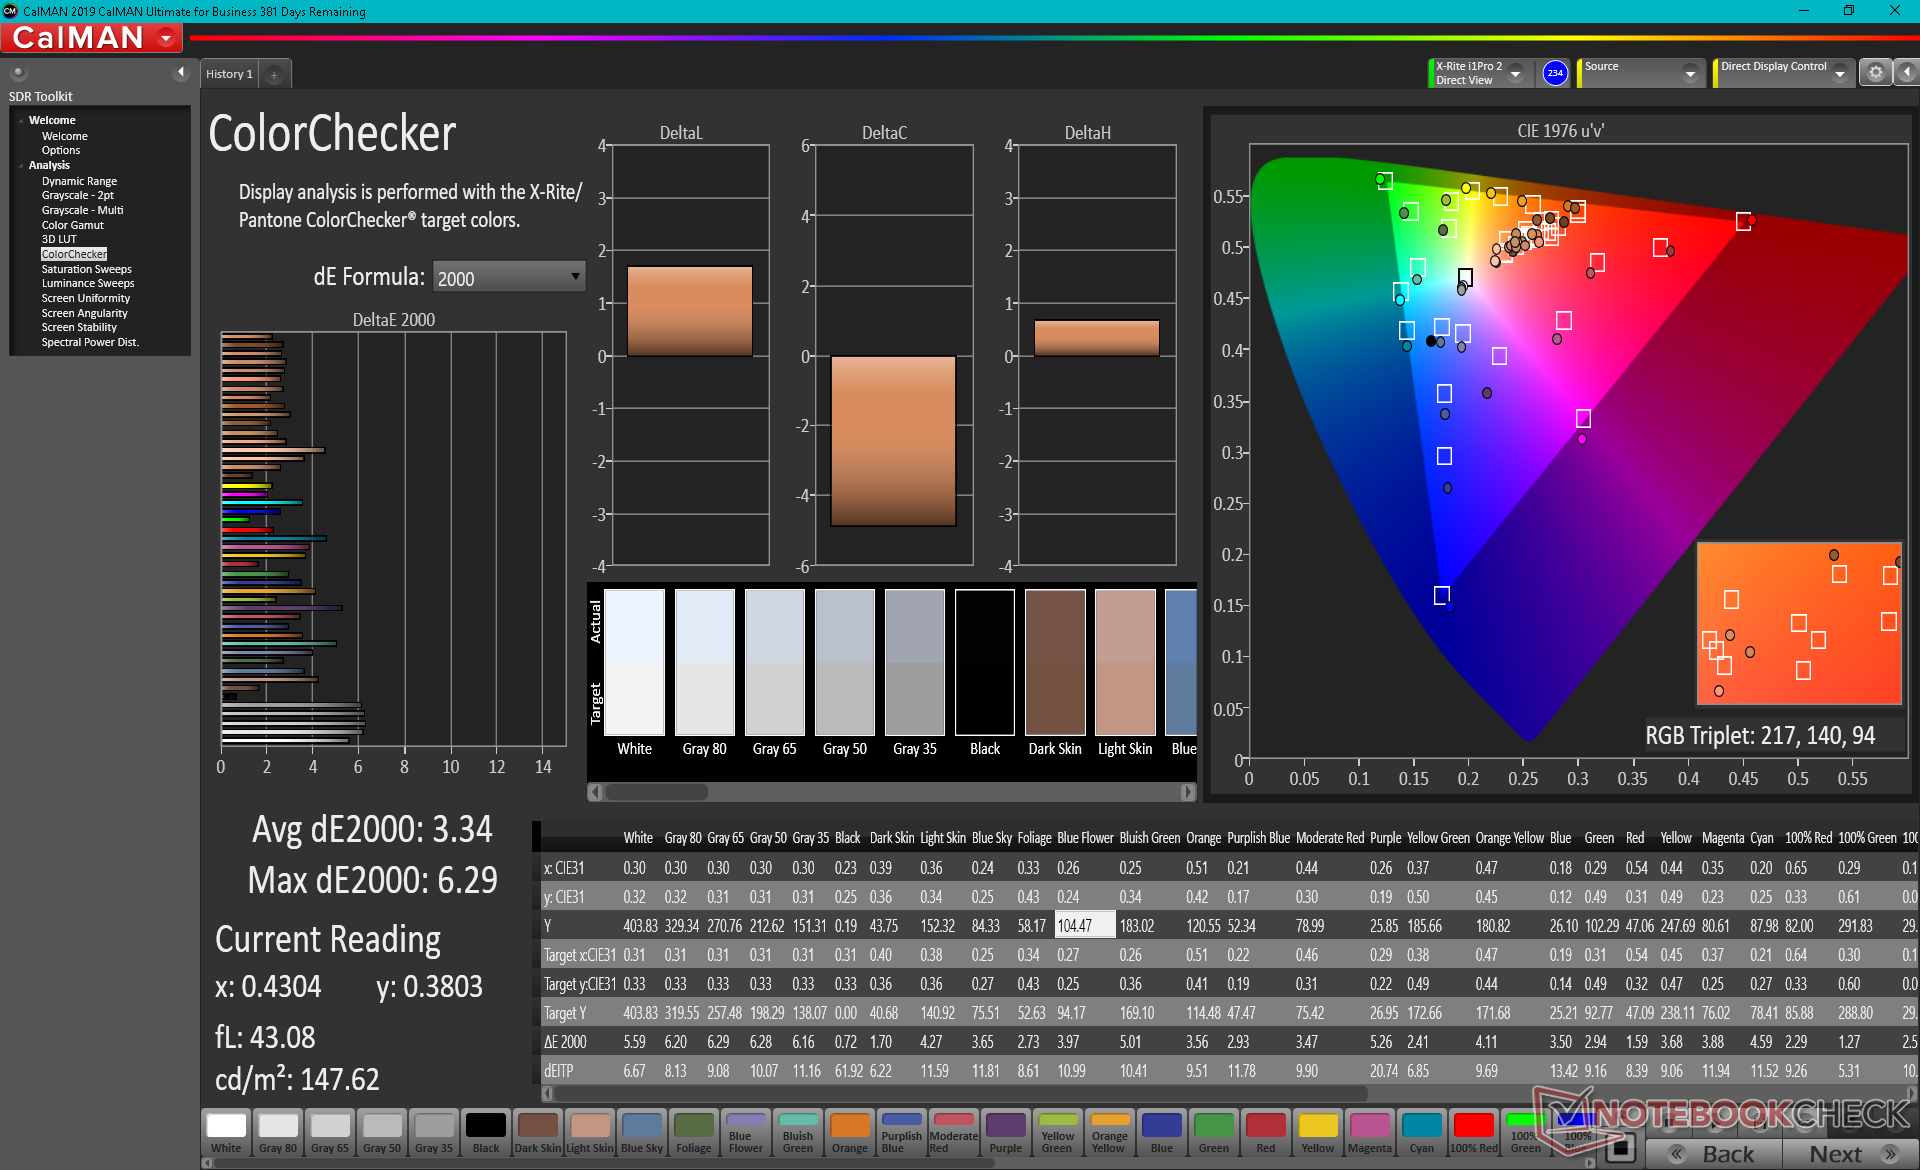
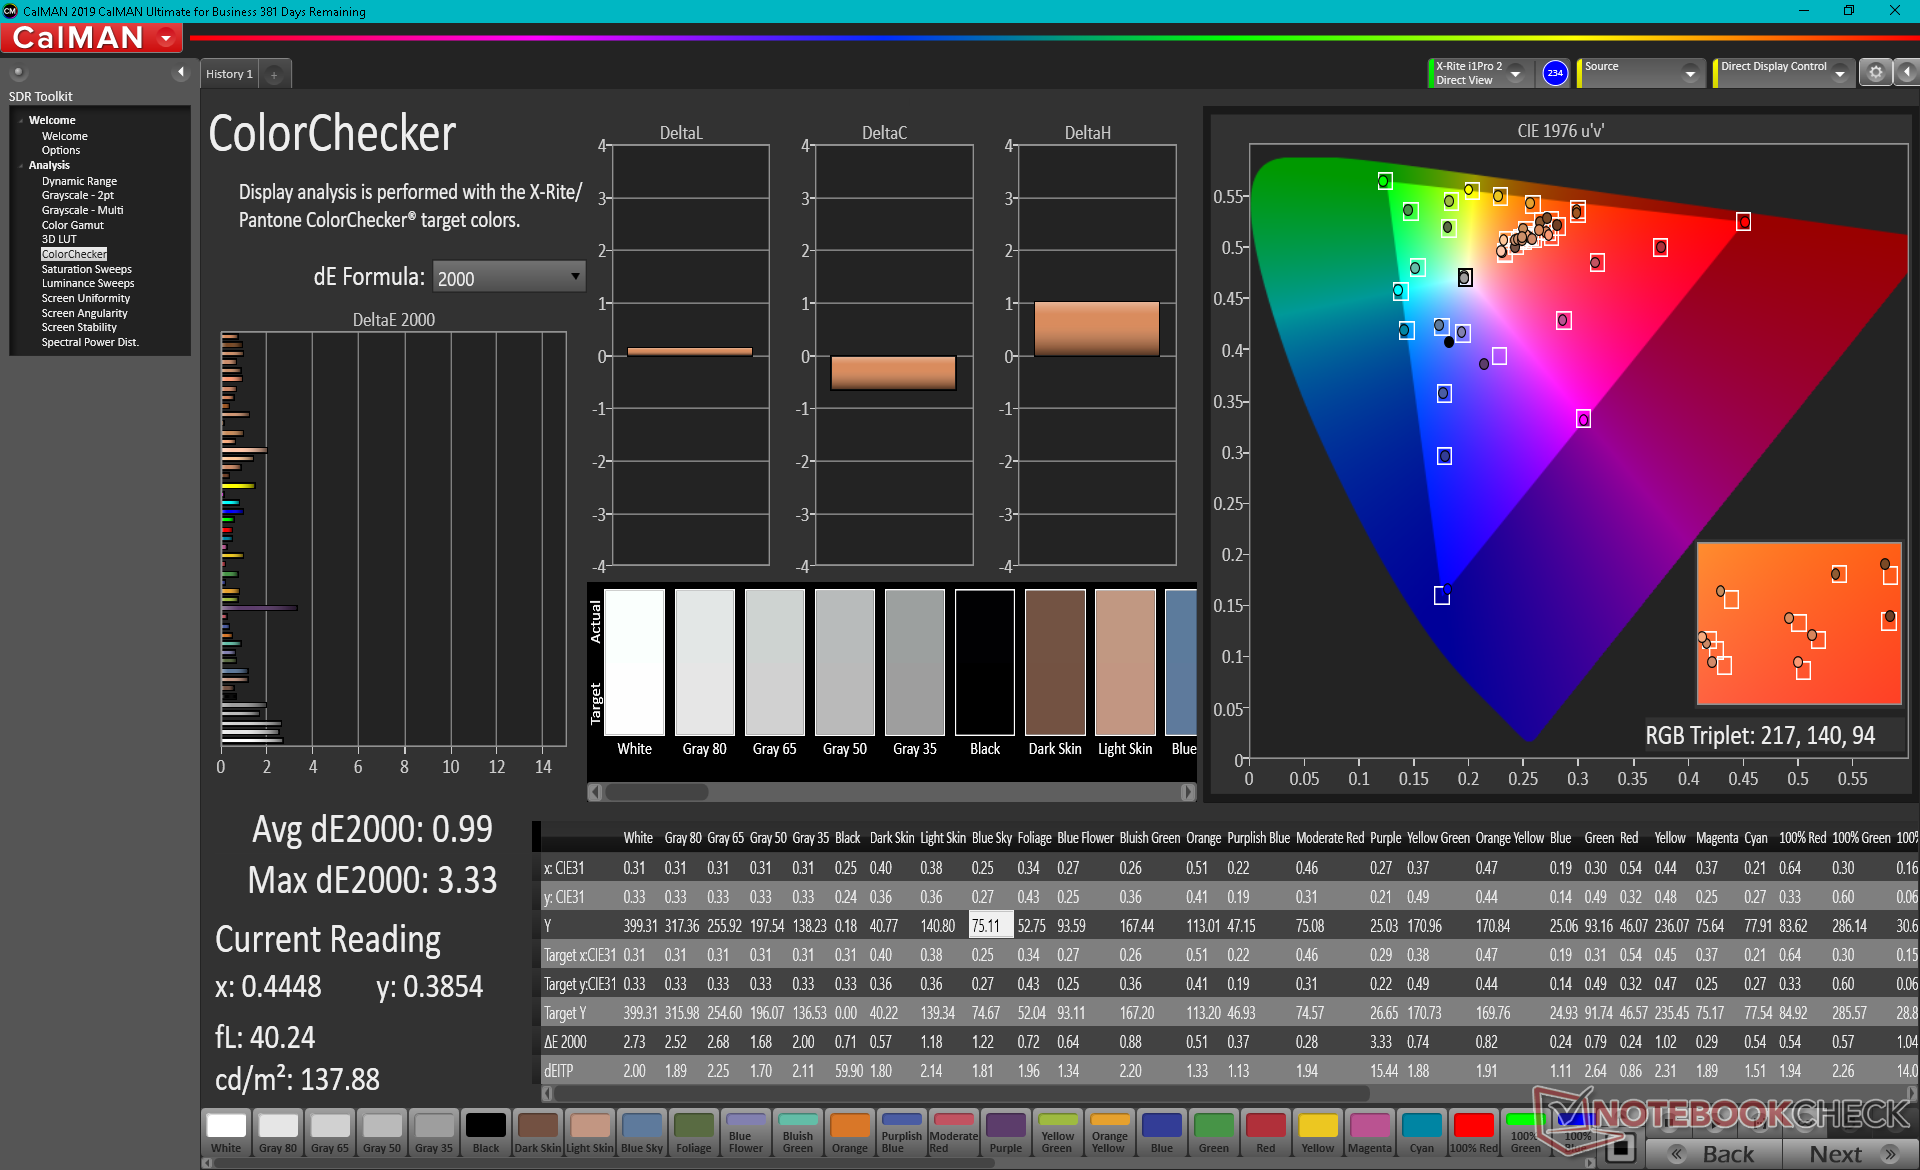
ΔE ColorChecker Calman: 3.34 | ∀{0.5-29.43 Ø4.71}
calibrated: 0.99
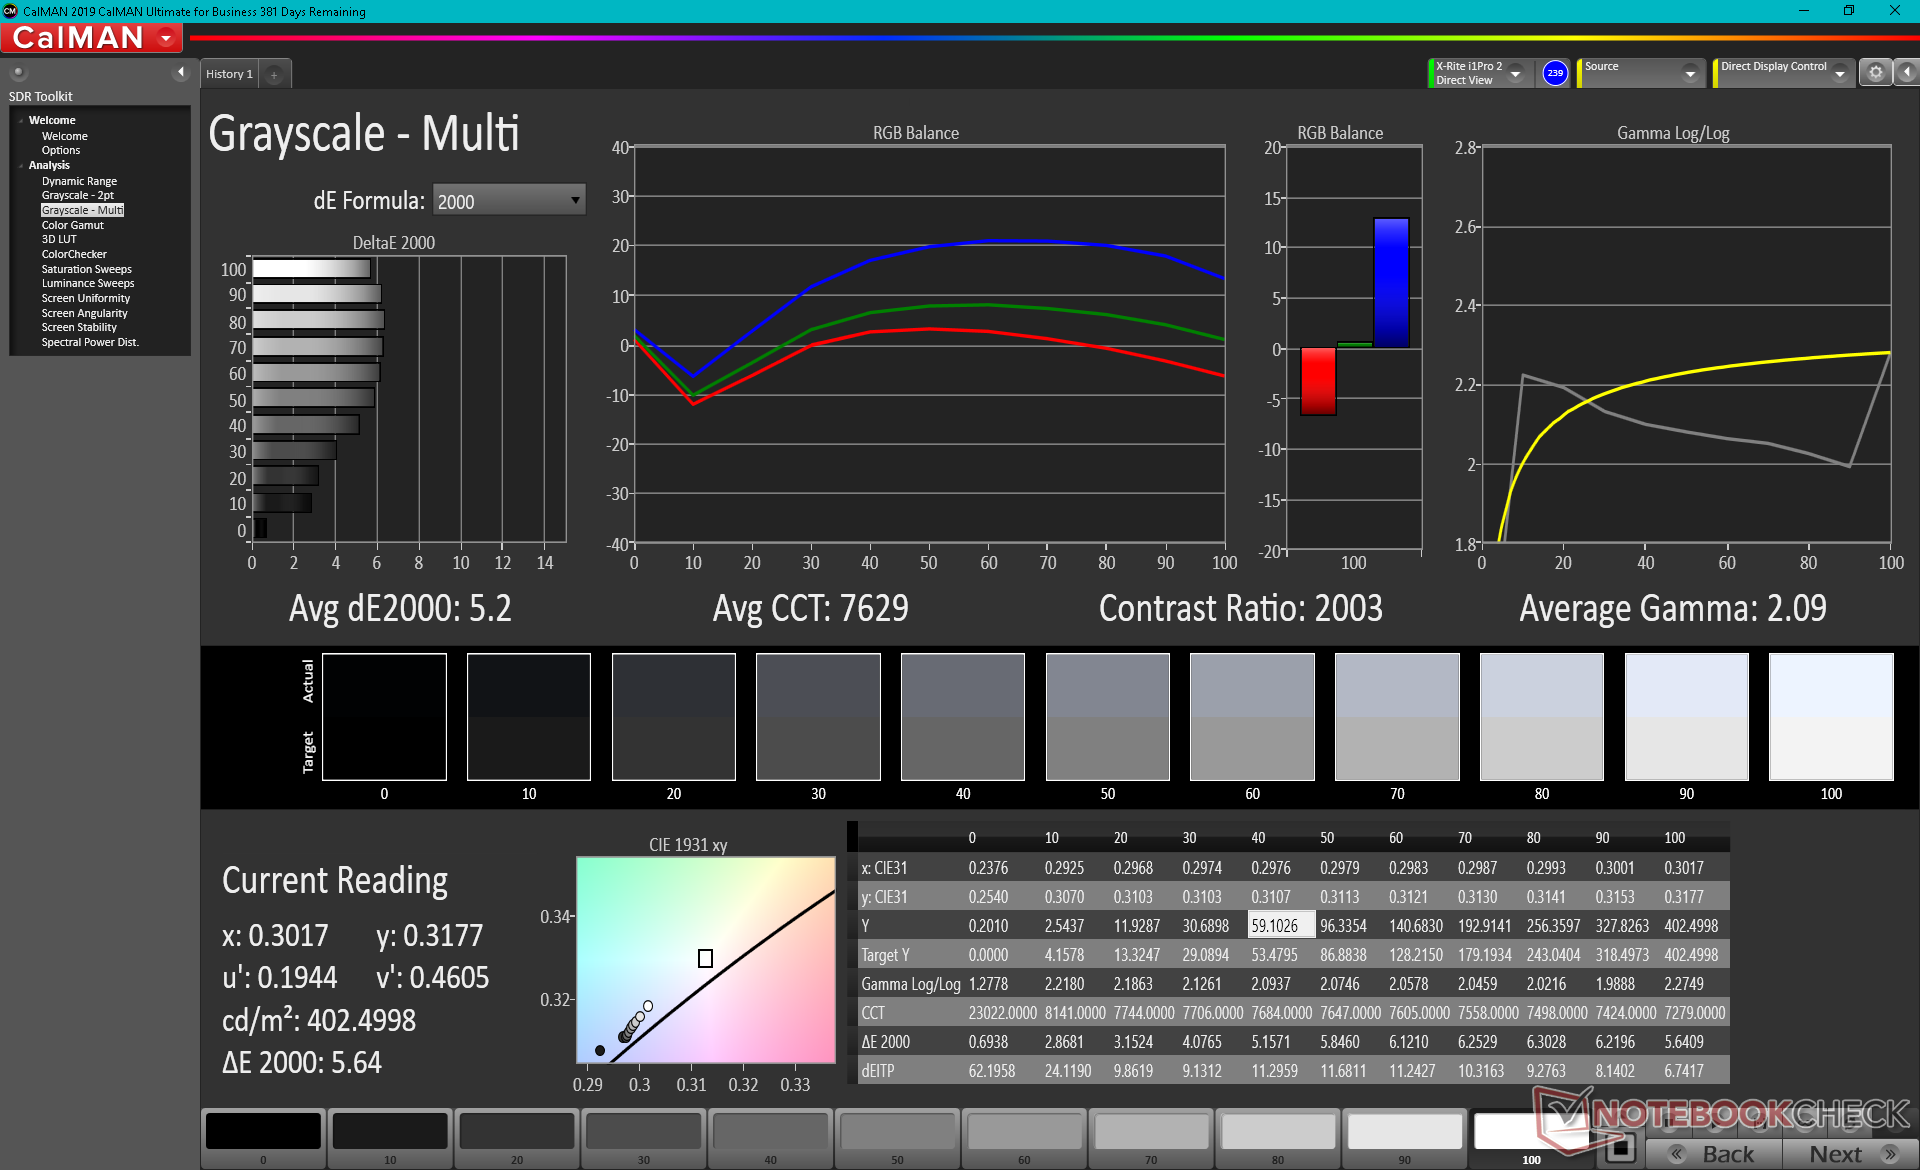
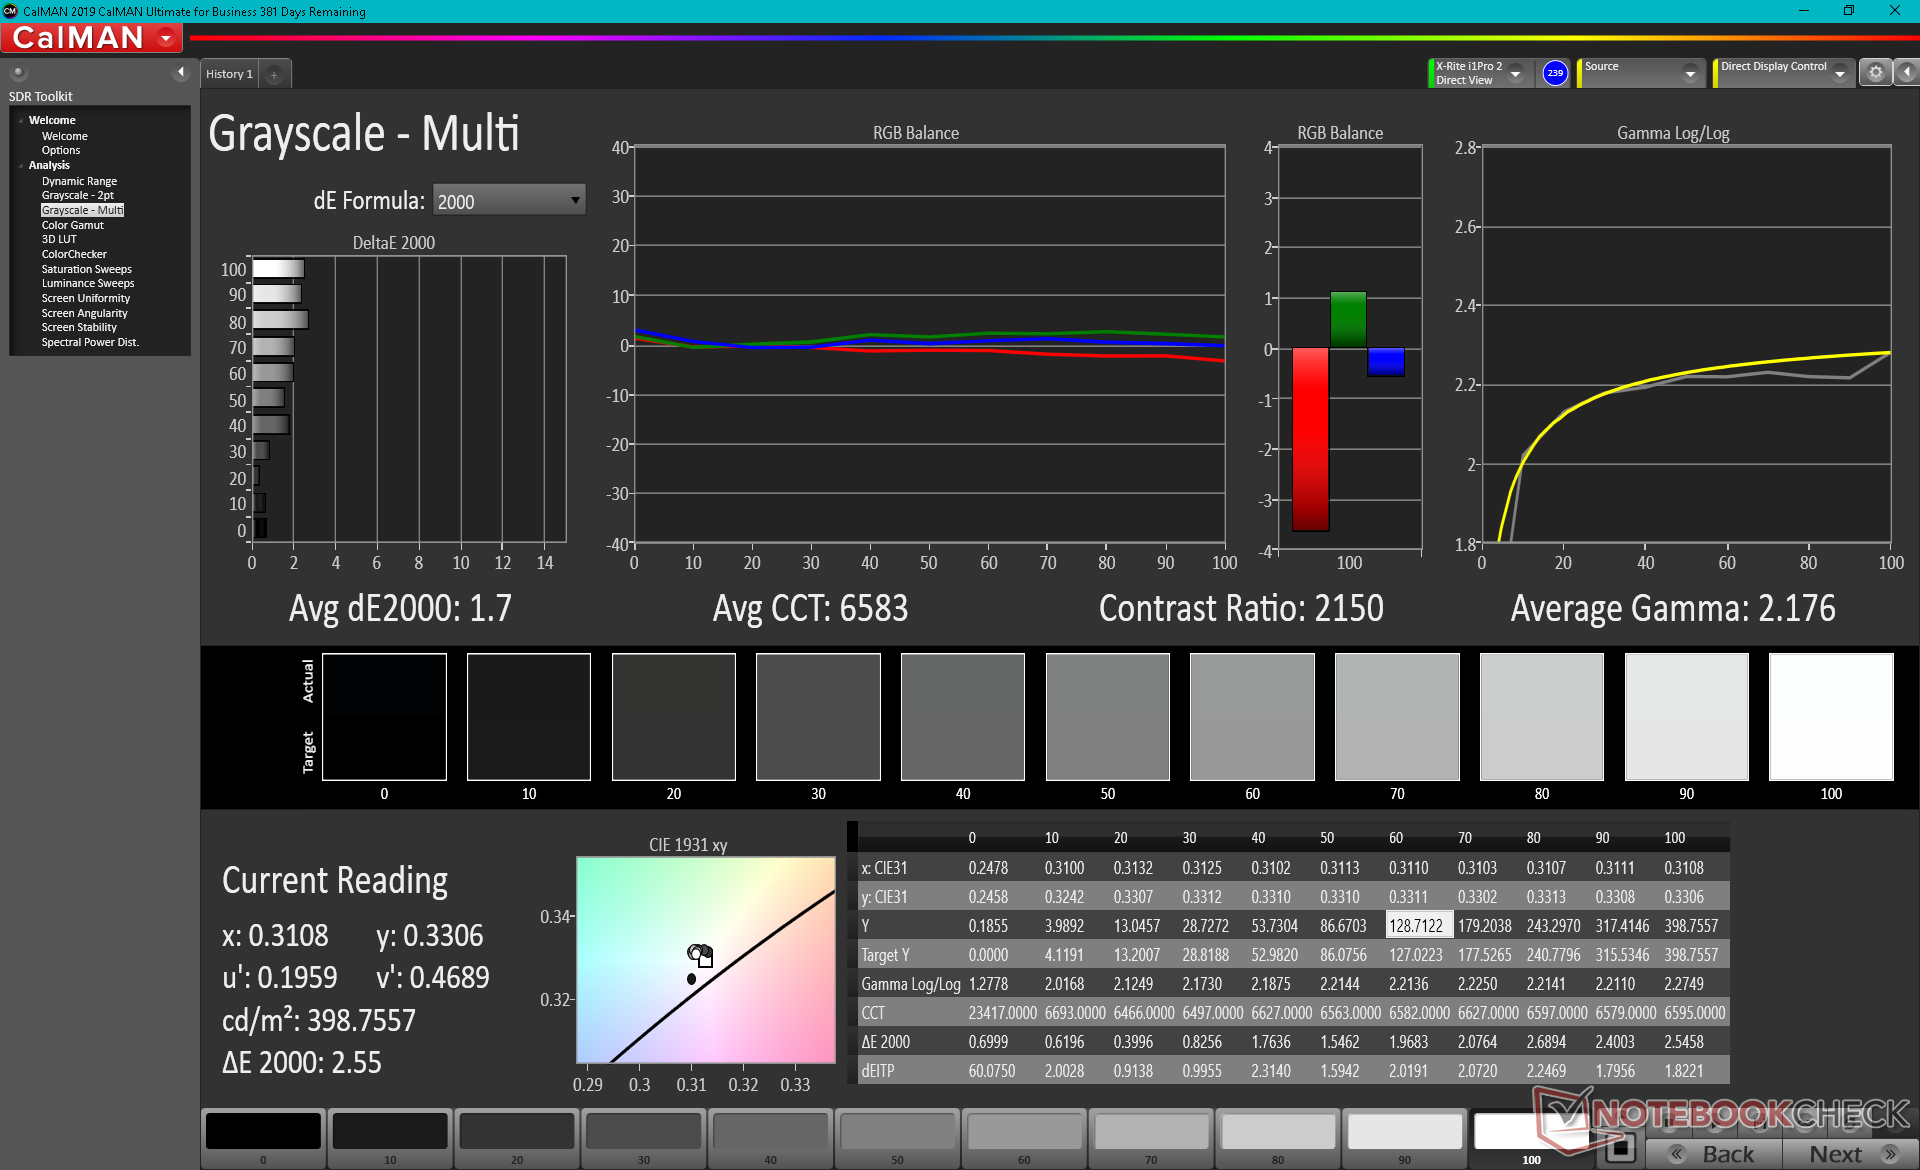
ΔE Greyscale Calman: 5.2 | ∀{0.09-98 Ø4.96}
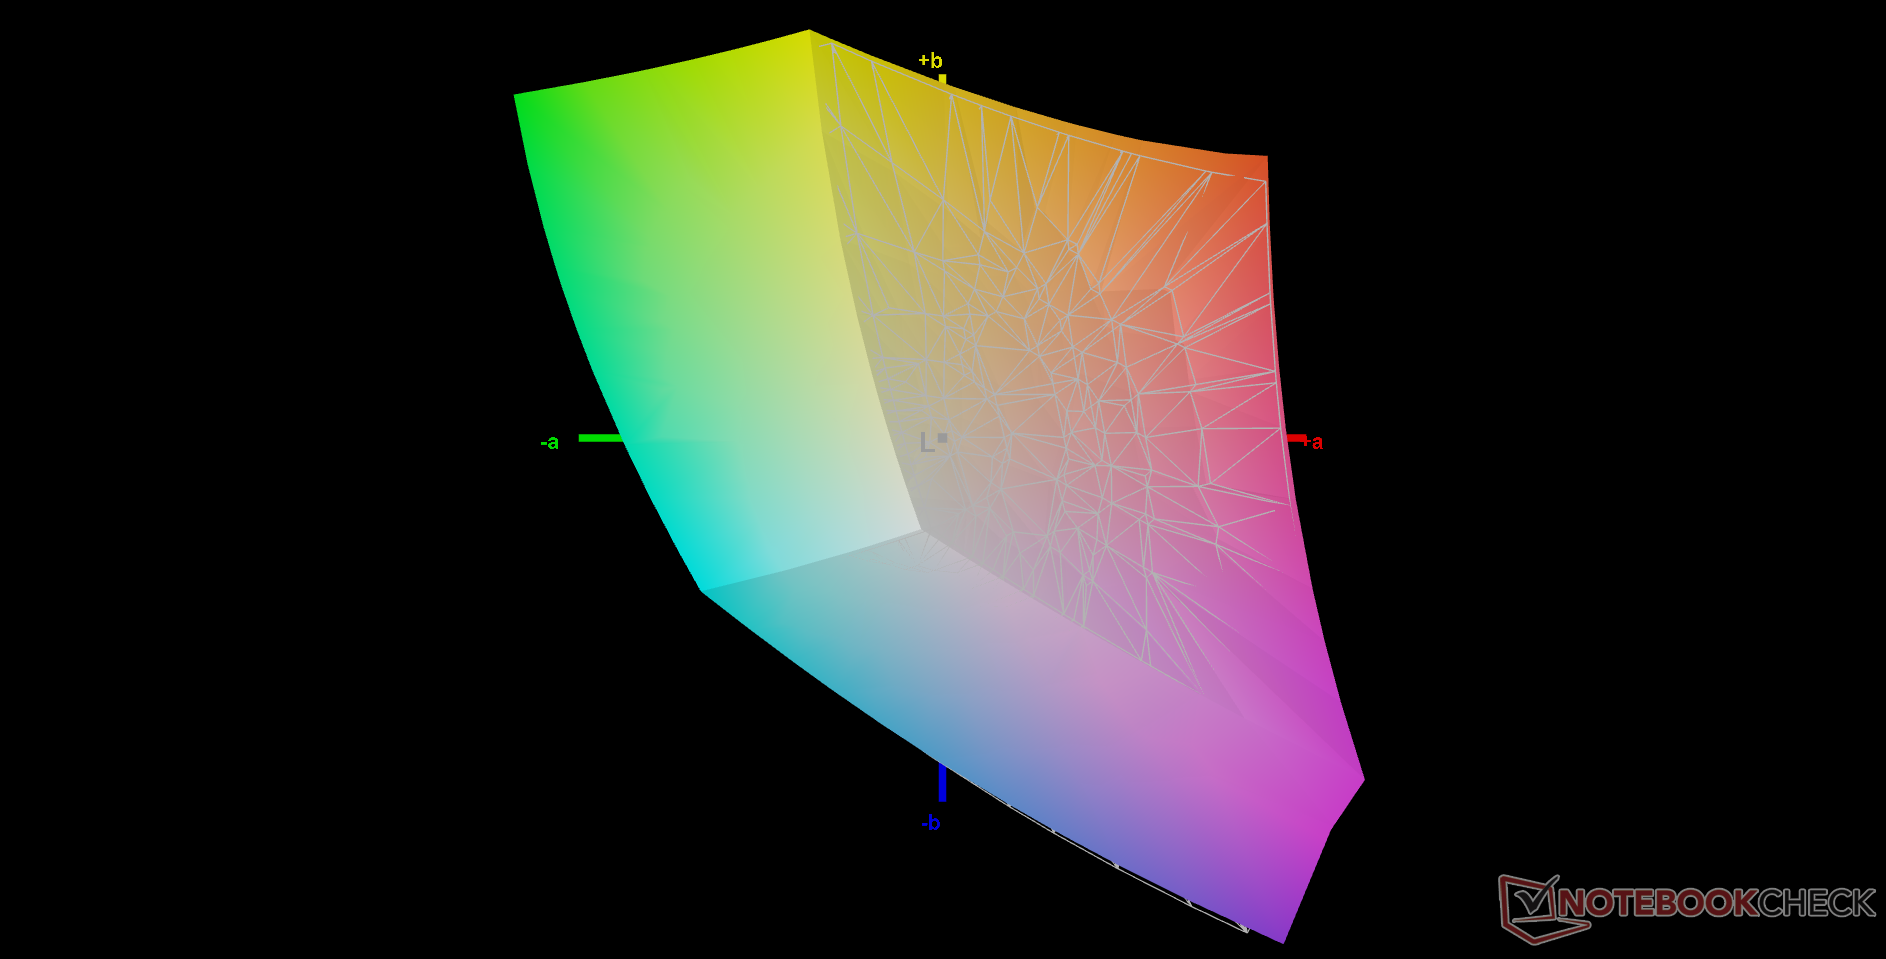
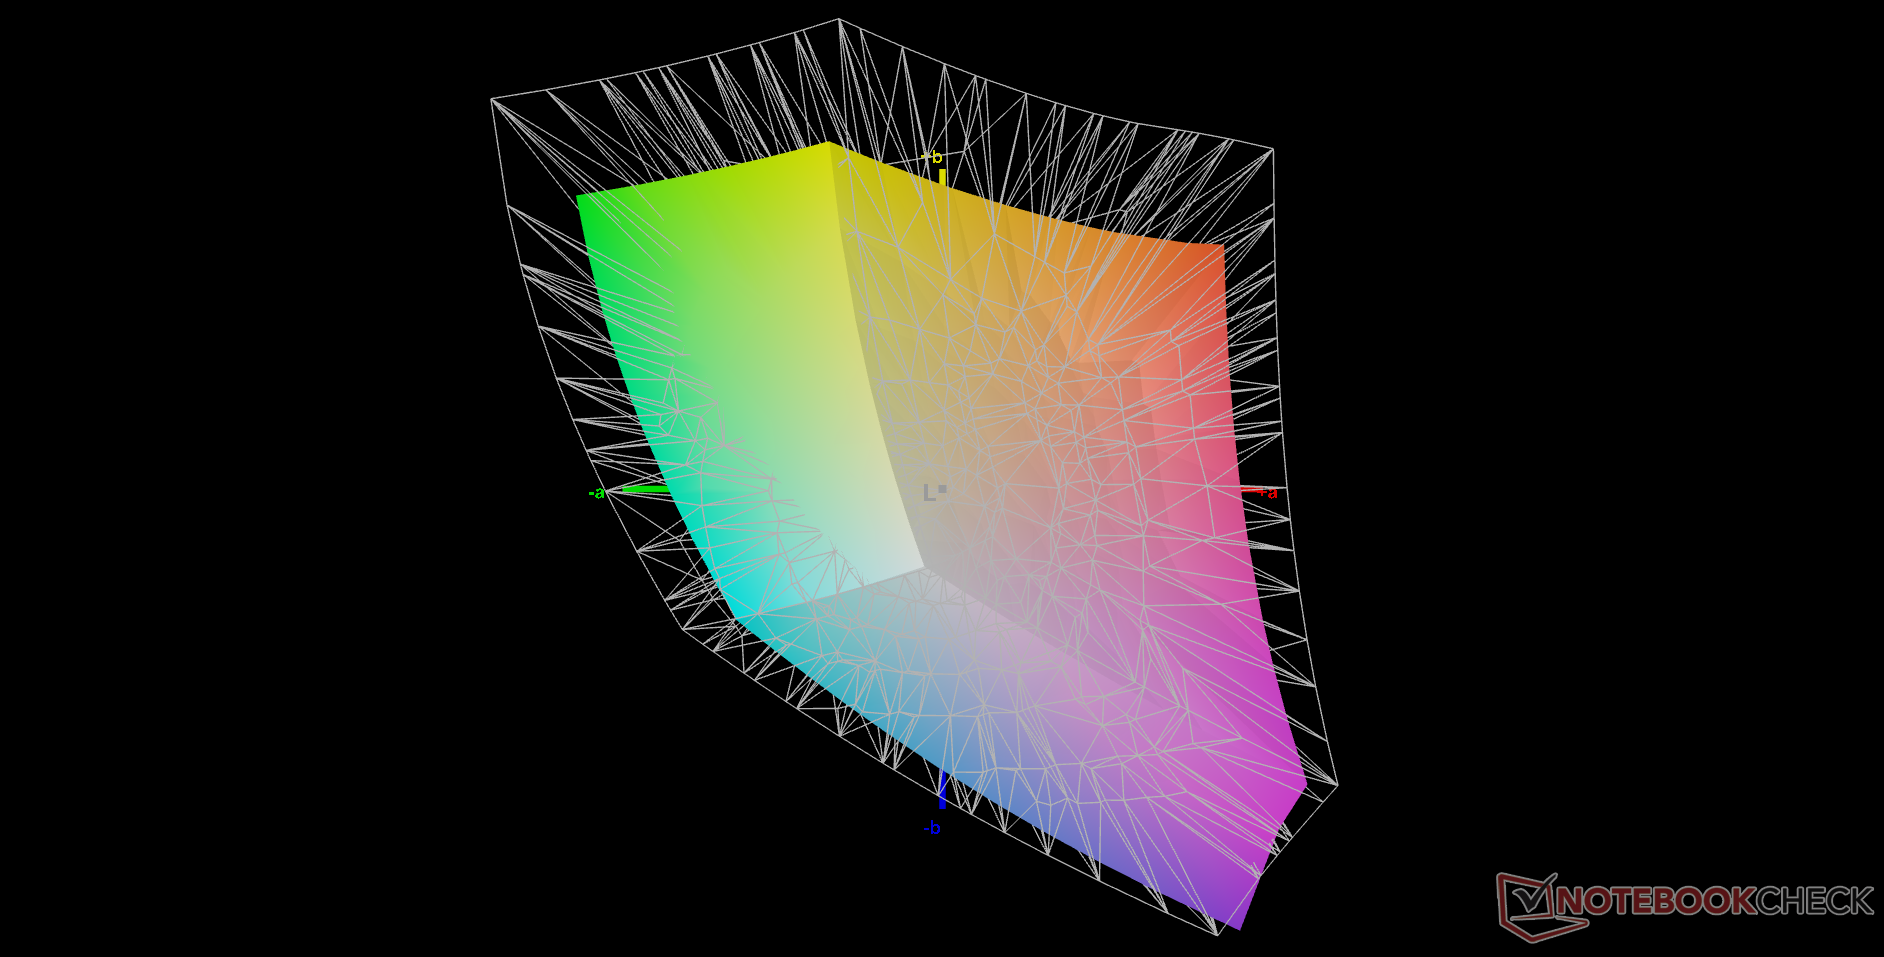
70.4% AdobeRGB 1998 (Argyll 3D)
98.7% sRGB (Argyll 3D)
69.9% Display P3 (Argyll 3D)
Gamma: 2.09
CCT: 7629 K
| Dell Latitude 15 9520 2-in-1 AU Optronics B150HAN, IPS, 1920x1080, 15" | Dell Latitude 9510 2-in-1 AU Optronics B150HAN, IPS, 1920x1080, 15" | HP EliteBook 850 G8 3C7Z8EA InfoVision X156NVF8 R1, I, 1920x1080, 15.6" | Lenovo ThinkPad L15 G2 AMD N156HCA-EAB, IPS LED, 1920x1080, 15.6" | MSI Summit B15 A11M Chi Mei N156HCE-EN1, IPS, 1920x1080, 15.6" | Microsoft Surface Laptop 4 15 AMD TFF_00028 SHP14B4, IPS, 2496x1664, 15" | |
|---|---|---|---|---|---|---|
| Display | 1% | -6% | -35% | -7% | -4% | |
| Display P3 Coverage (%) | 69.9 | 71.2 2% | 43.8 -37% | 65.7 -6% | 65.2 -7% | |
| sRGB Coverage (%) | 98.7 | 99.3 1% | 95 -4% | 65.7 -33% | 90.6 -8% | 97.7 -1% |
| AdobeRGB 1998 Coverage (%) | 70.4 | 71.3 1% | 65 -8% | 45.3 -36% | 66 -6% | 67.3 -4% |
| Response Times | -27% | -19% | -6% | -11% | -32% | |
| Response Time Grey 50% / Grey 80% * (ms) | 39.2 ? | 52.8 ? -35% | 47 ? -20% | 40 -2% | 40.4 ? -3% | 58.4 ? -49% |
| Response Time Black / White * (ms) | 27.2 ? | 32 ? -18% | 32 ? -18% | 30 -10% | 32.4 ? -19% | 31.2 ? -15% |
| PWM Frequency (Hz) | 312 ? | 25510 ? | 21550 ? | |||
| Screen | -27% | 7% | -49% | -71% | 6% | |
| Brightness middle (cd/m²) | 403.6 | 426.7 6% | 802 99% | 298 -26% | 341.3 -15% | 405 0% |
| Brightness (cd/m²) | 368 | 394 7% | 702 91% | 276 -25% | 310 -16% | 379 3% |
| Brightness Distribution (%) | 84 | 87 4% | 77 -8% | 86 2% | 81 -4% | 79 -6% |
| Black Level * (cd/m²) | 0.22 | 0.3 -36% | 0.245 -11% | 0.26 -18% | 0.45 -105% | 0.26 -18% |
| Contrast (:1) | 1835 | 1422 -23% | 3273 78% | 1146 -38% | 758 -59% | 1558 -15% |
| Colorchecker dE 2000 * | 3.34 | 4.28 -28% | 6.22 -86% | 3.7 -11% | 6.17 -85% | 2.6 22% |
| Colorchecker dE 2000 max. * | 6.29 | 10.43 -66% | 9.92 -58% | 15 -138% | 11.75 -87% | 6.6 -5% |
| Colorchecker dE 2000 calibrated * | 0.99 | 1.46 -47% | 3.5 -254% | 3.3 -233% | 0.9 9% | |
| Greyscale dE 2000 * | 5.2 | 8.1 -56% | 7.69 -48% | 1.7 67% | 7.1 -37% | 1.9 63% |
| Gamma | 2.09 105% | 2.26 97% | 2.75 80% | 2.21 100% | 2.2 100% | 2.11 104% |
| CCT | 7629 85% | 7993 81% | 6135 106% | 6588 99% | 6842 95% | 6825 95% |
| Color Space (Percent of AdobeRGB 1998) (%) | 65.2 | 65 | 58.7 | 62 | ||
| Color Space (Percent of sRGB) (%) | 99.2 | 95 | 90.1 | 97.7 | ||
| Moyenne finale (programmes/paramètres) | -18% /
-21% | -6% /
1% | -30% /
-40% | -30% /
-49% | -10% /
-2% |
* ... Moindre est la valeur, meilleures sont les performances
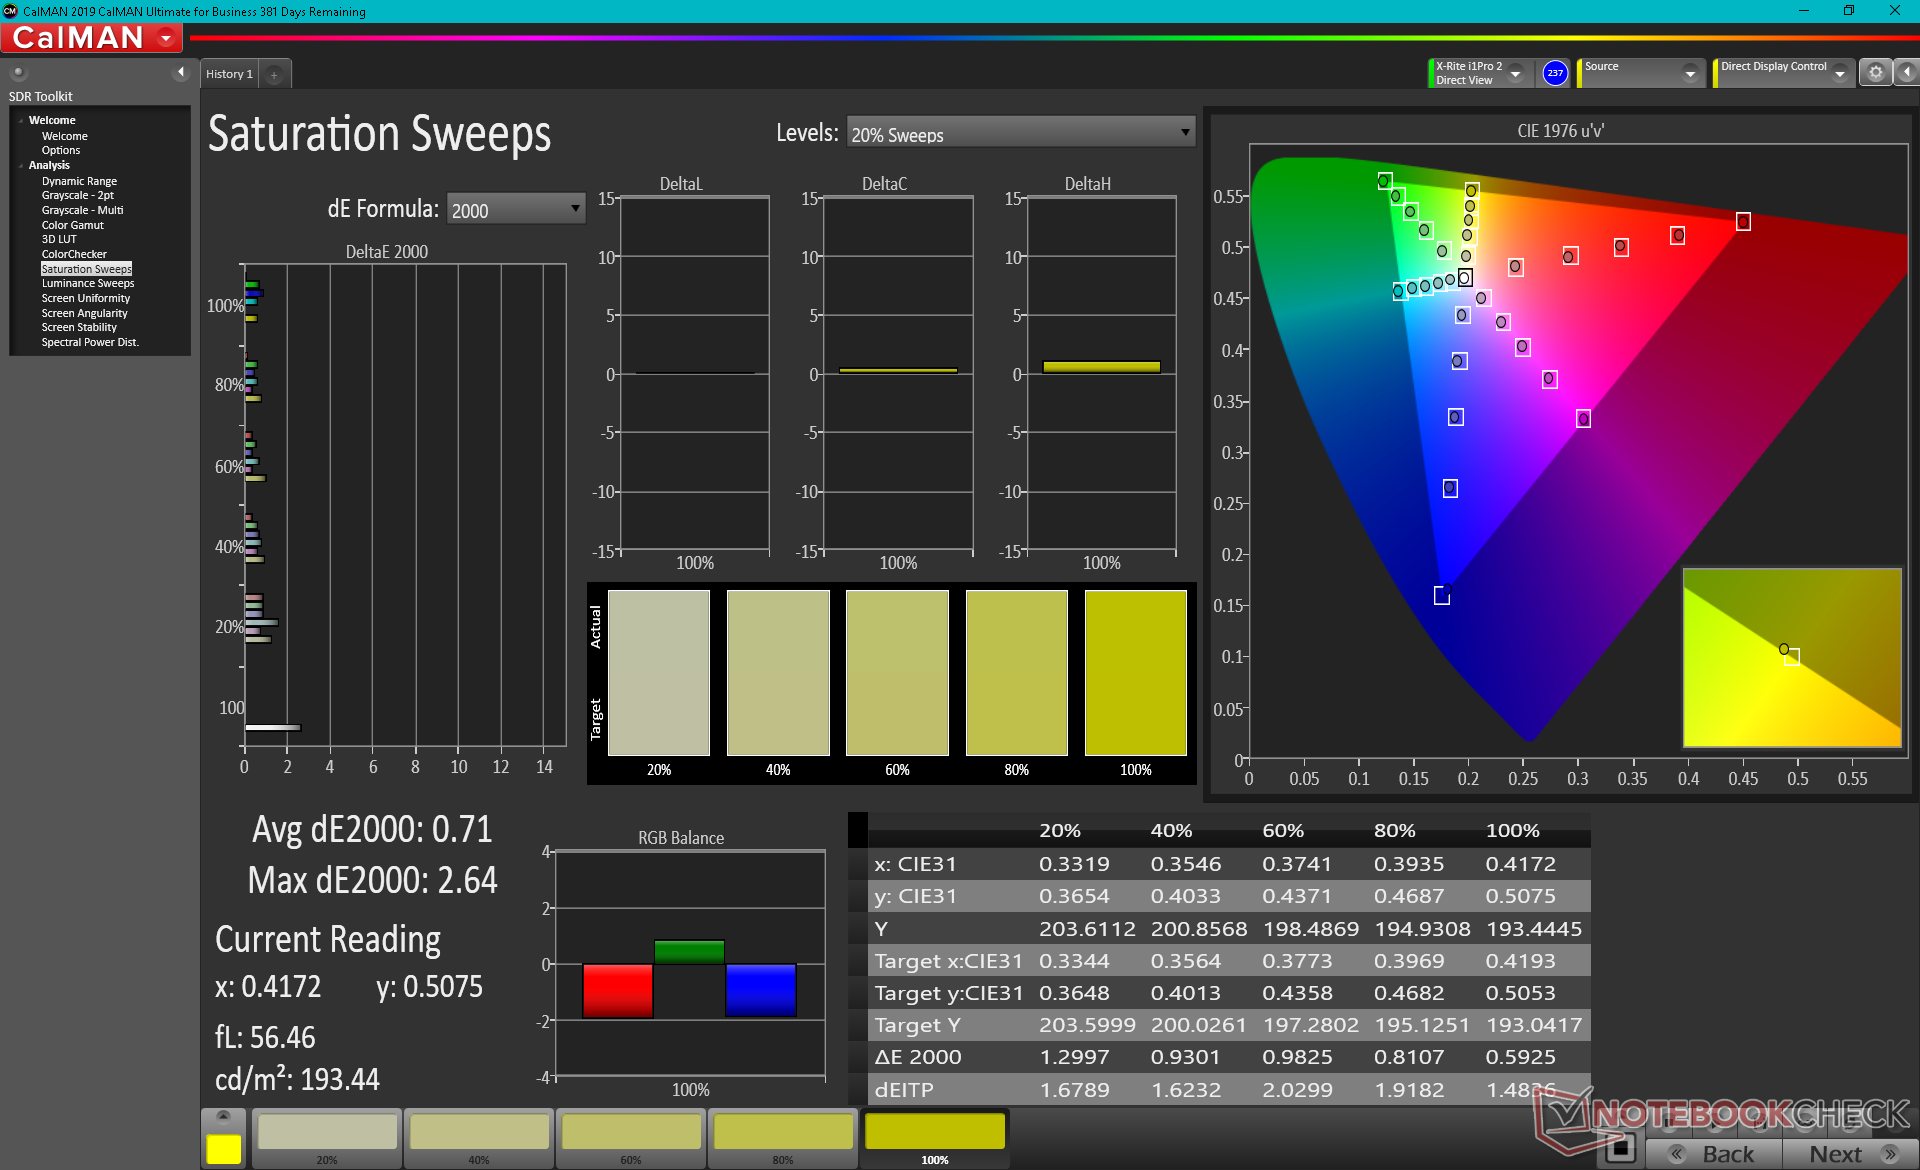
L'écran est correctement calibré, avec des valeurs moyennes de deltaE pour les niveaux de gris et les couleurs de seulement 5,2 et 3,34, respectivement. Une calibration correcte de l'utilisateur final peut réduire ces valeurs à moins de 2 chacune, comme le montrent nos captures d'écran CalMAN ci-dessous.
Temps de réponse de l'écran
| ↔ Temps de réponse noir à blanc | ||
|---|---|---|
| 27.2 ms ... hausse ↗ et chute ↘ combinées | ↗ 14 ms hausse | 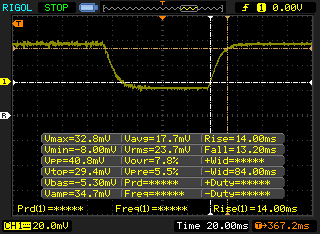 |
| ↘ 13.2 ms chute | ||
| L'écran souffre de latences relativement élevées, insuffisant pour le jeu. En comparaison, tous les appareils testés affichent entre 0.1 (minimum) et 240 (maximum) ms. » 69 % des appareils testés affichent de meilleures performances. Cela signifie que les latences relevées sont moins bonnes que la moyenne (19.8 ms) de tous les appareils testés. | ||
| ↔ Temps de réponse gris 50% à gris 80% | ||
| 39.2 ms ... hausse ↗ et chute ↘ combinées | ↗ 19.2 ms hausse | 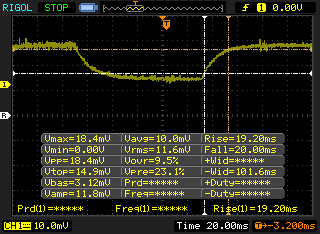 |
| ↘ 20 ms chute | ||
| L'écran souffre de latences très élevées, à éviter pour le jeu. En comparaison, tous les appareils testés affichent entre 0.165 (minimum) et 636 (maximum) ms. » 60 % des appareils testés affichent de meilleures performances. Cela signifie que les latences relevées sont moins bonnes que la moyenne (30.9 ms) de tous les appareils testés. | ||
Scintillement / MLI (Modulation de largeur d'impulsion)
| Scintillement / MLI (Modulation de largeur d'impulsion) non décelé | 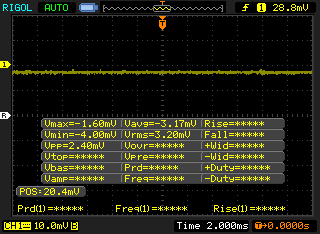 | ||
En comparaison, 52 % des appareils testés n'emploient pas MDI pour assombrir leur écran. Nous avons relevé une moyenne à 7744 (minimum : 5 - maximum : 343500) Hz dans le cas où une MDI était active. | |||
Performance
Conditions d'essai
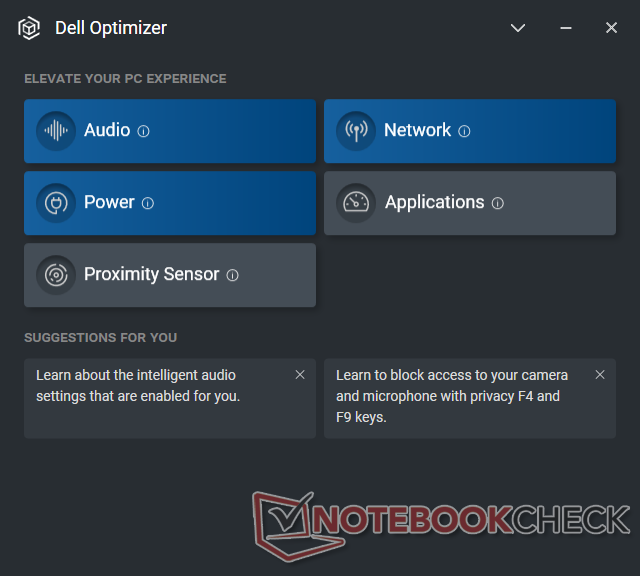
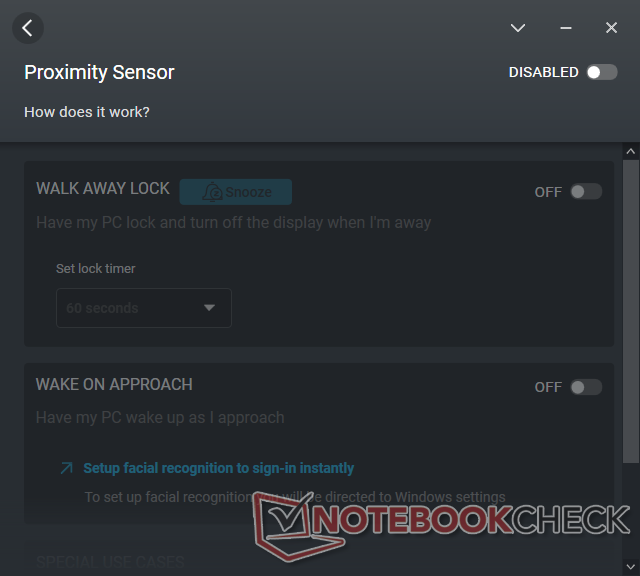
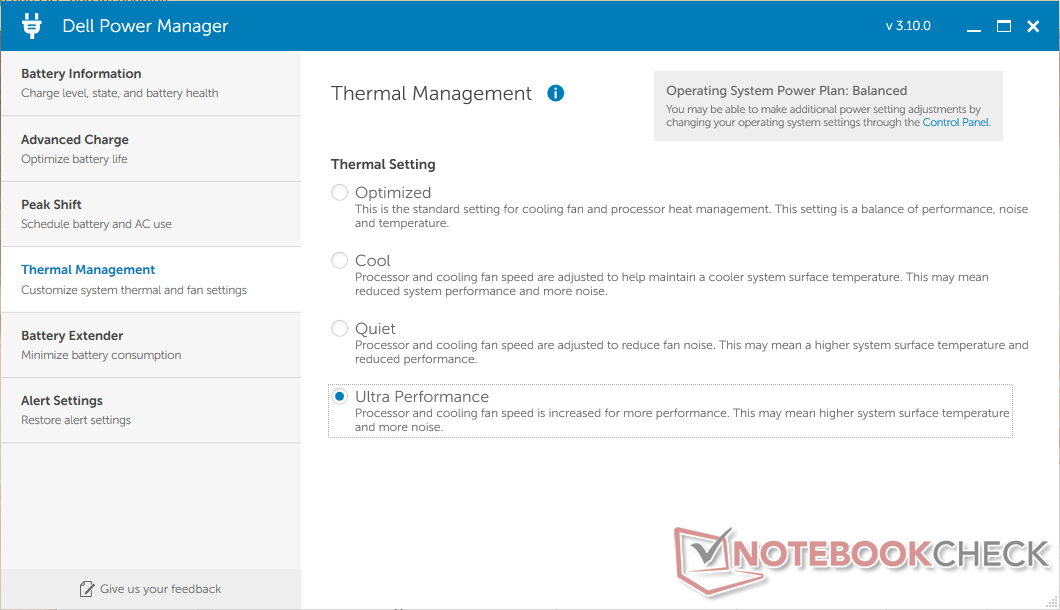
Notre système a été configuré en mode " Meilleures performances " de Windows et le gestionnaire d'énergie Dell a été réglé sur " Ultra performances " avant d'exécuter les tests de référence ci-dessous pour obtenir les meilleurs résultats possibles. Les utilisateurs doivent également se familiariser avec le logiciel Dell Optimizer préinstallé qui comprend des paramètres supplémentaires pour l'audio, le réseau et le capteur de proximité pour une connexion mains libres.
Processeur
Les performances du CPU multithread sont mitigées puisque le Core i7-1185G7 possède deux cœurs de moins que sur le Core i7-10810U soit une baisse d'environ 25 à 35 %. L'écart est plus important que prévu puisque le i7-1185G7 de notre Latitude 9520 2-in-1 fonctionne au moins 15 à 20 % plus lentement que la plupart des autres ordinateurs portables utilisant exactement le même CPU. Le processeur Core i7-1185G7 du MSI Stealth 15Mpar exemple, peut offrir des performances multithread jusqu'à 50 % supérieures à celles de notre Dell
Les performances mono-fil sont heureusement là où elles devraient être par rapport au Core i7-1185G7 moyen. Les utilisateurs peuvent s'attendre à des performances environ 30 % plus rapides que celles du Core i7-10810U à cet égard.
Cinebench R15 Multi Loop
Cinebench R23: Multi Core | Single Core
Cinebench R20: CPU (Multi Core) | CPU (Single Core)
Cinebench R15: CPU Multi 64Bit | CPU Single 64Bit
Blender: v2.79 BMW27 CPU
7-Zip 18.03: 7z b 4 | 7z b 4 -mmt1
Geekbench 5.5: Multi-Core | Single-Core
HWBOT x265 Benchmark v2.2: 4k Preset
LibreOffice : 20 Documents To PDF
R Benchmark 2.5: Overall mean
| CPU Performance rating | |
| HP Pavilion Aero 13 be0097nr -2! | |
| Lenovo ThinkPad E15 G3-20YG003UGE | |
| Microsoft Surface Laptop 4 15 AMD TFF_00028 | |
| Lenovo ThinkPad L15 G2 AMD | |
| MSI Prestige 15 A10SC -10! | |
| Moyenne Intel Core i7-1185G7 | |
| HP EliteBook 850 G8 3C7Z8EA | |
| Asus ZenBook 15 UX534FT-DB77 -10! | |
| Dell Latitude 15 9520 2-in-1 -2! | |
| Asus ExpertBook B1 B1500CEAE, i5-1135G7 | |
| Samsung Galaxy Book Flex 15-NP950 -2! | |
| Dell Latitude 9510 2-in-1 -2! | |
| LG Gram 15Z90N -3! | |
| Geekbench 5.5 / Multi-Core | |
| Microsoft Surface Laptop 4 15 AMD TFF_00028 | |
| Lenovo ThinkPad E15 G3-20YG003UGE | |
| HP EliteBook 850 G8 3C7Z8EA | |
| Moyenne Intel Core i7-1185G7 (4620 - 5944, n=21) | |
| Lenovo ThinkPad L15 G2 AMD | |
| Samsung Galaxy Book Flex 15-NP950 | |
| Asus ExpertBook B1 B1500CEAE, i5-1135G7 | |
| Dell Latitude 9510 2-in-1 | |
| LG Gram 15Z90N | |
| Geekbench 5.5 / Single-Core | |
| HP EliteBook 850 G8 3C7Z8EA | |
| Moyenne Intel Core i7-1185G7 (1398 - 1626, n=21) | |
| Lenovo ThinkPad L15 G2 AMD | |
| Asus ExpertBook B1 B1500CEAE, i5-1135G7 | |
| Samsung Galaxy Book Flex 15-NP950 | |
| Dell Latitude 9510 2-in-1 | |
| Lenovo ThinkPad E15 G3-20YG003UGE | |
| LG Gram 15Z90N | |
| Microsoft Surface Laptop 4 15 AMD TFF_00028 | |
| LibreOffice / 20 Documents To PDF | |
| Microsoft Surface Laptop 4 15 AMD TFF_00028 | |
| Dell Latitude 9510 2-in-1 | |
| Lenovo ThinkPad E15 G3-20YG003UGE | |
| Samsung Galaxy Book Flex 15-NP950 | |
| HP EliteBook 850 G8 3C7Z8EA | |
| HP Pavilion Aero 13 be0097nr | |
| Dell Latitude 15 9520 2-in-1 | |
| Asus ExpertBook B1 B1500CEAE, i5-1135G7 | |
| Moyenne Intel Core i7-1185G7 (41.3 - 61.7, n=26) | |
| Lenovo ThinkPad L15 G2 AMD | |
| LG Gram 15Z90N | |
| R Benchmark 2.5 / Overall mean | |
| LG Gram 15Z90N | |
| Dell Latitude 9510 2-in-1 | |
| Samsung Galaxy Book Flex 15-NP950 | |
| Asus ExpertBook B1 B1500CEAE, i5-1135G7 | |
| Microsoft Surface Laptop 4 15 AMD TFF_00028 | |
| Dell Latitude 15 9520 2-in-1 | |
| Lenovo ThinkPad E15 G3-20YG003UGE | |
| Moyenne Intel Core i7-1185G7 (0.55 - 0.615, n=27) | |
| HP EliteBook 850 G8 3C7Z8EA | |
| Lenovo ThinkPad L15 G2 AMD | |
| HP Pavilion Aero 13 be0097nr | |
Cinebench R23: Multi Core | Single Core
Cinebench R20: CPU (Multi Core) | CPU (Single Core)
Cinebench R15: CPU Multi 64Bit | CPU Single 64Bit
Blender: v2.79 BMW27 CPU
7-Zip 18.03: 7z b 4 | 7z b 4 -mmt1
Geekbench 5.5: Multi-Core | Single-Core
HWBOT x265 Benchmark v2.2: 4k Preset
LibreOffice : 20 Documents To PDF
R Benchmark 2.5: Overall mean
* ... Moindre est la valeur, meilleures sont les performances
AIDA64: FP32 Ray-Trace | FPU Julia | CPU SHA3 | CPU Queen | FPU SinJulia | FPU Mandel | CPU AES | CPU ZLib | FP64 Ray-Trace | CPU PhotoWorxx
| Performance rating | |
| Microsoft Surface Laptop 4 15 AMD TFF_00028 | |
| Lenovo ThinkPad L15 G2 AMD | |
| MSI Summit B15 A11M | |
| Moyenne Intel Core i7-1185G7 | |
| HP EliteBook 850 G8 3C7Z8EA | |
| Dell Latitude 15 9520 2-in-1 | |
| Dell Latitude 9510 2-in-1 | |
| AIDA64 / FP32 Ray-Trace | |
| Microsoft Surface Laptop 4 15 AMD TFF_00028 | |
| Lenovo ThinkPad L15 G2 AMD | |
| MSI Summit B15 A11M | |
| Moyenne Intel Core i7-1185G7 (5621 - 7453, n=20) | |
| HP EliteBook 850 G8 3C7Z8EA | |
| Dell Latitude 15 9520 2-in-1 | |
| Dell Latitude 9510 2-in-1 | |
| AIDA64 / FPU Julia | |
| Microsoft Surface Laptop 4 15 AMD TFF_00028 | |
| Lenovo ThinkPad L15 G2 AMD | |
| Dell Latitude 9510 2-in-1 | |
| MSI Summit B15 A11M | |
| Moyenne Intel Core i7-1185G7 (23248 - 32614, n=20) | |
| HP EliteBook 850 G8 3C7Z8EA | |
| Dell Latitude 15 9520 2-in-1 | |
| AIDA64 / CPU SHA3 | |
| Microsoft Surface Laptop 4 15 AMD TFF_00028 | |
| MSI Summit B15 A11M | |
| Lenovo ThinkPad L15 G2 AMD | |
| Moyenne Intel Core i7-1185G7 (1530 - 2209, n=20) | |
| HP EliteBook 850 G8 3C7Z8EA | |
| Dell Latitude 15 9520 2-in-1 | |
| Dell Latitude 9510 2-in-1 | |
| AIDA64 / CPU Queen | |
| Microsoft Surface Laptop 4 15 AMD TFF_00028 | |
| Lenovo ThinkPad L15 G2 AMD | |
| Dell Latitude 9510 2-in-1 | |
| HP EliteBook 850 G8 3C7Z8EA | |
| Moyenne Intel Core i7-1185G7 (44677 - 52815, n=20) | |
| Dell Latitude 15 9520 2-in-1 | |
| MSI Summit B15 A11M | |
| AIDA64 / FPU SinJulia | |
| Microsoft Surface Laptop 4 15 AMD TFF_00028 | |
| Lenovo ThinkPad L15 G2 AMD | |
| Dell Latitude 9510 2-in-1 | |
| MSI Summit B15 A11M | |
| Moyenne Intel Core i7-1185G7 (3870 - 5027, n=20) | |
| HP EliteBook 850 G8 3C7Z8EA | |
| Dell Latitude 15 9520 2-in-1 | |
| AIDA64 / FPU Mandel | |
| Microsoft Surface Laptop 4 15 AMD TFF_00028 | |
| Lenovo ThinkPad L15 G2 AMD | |
| MSI Summit B15 A11M | |
| Moyenne Intel Core i7-1185G7 (14584 - 19594, n=20) | |
| HP EliteBook 850 G8 3C7Z8EA | |
| Dell Latitude 15 9520 2-in-1 | |
| Dell Latitude 9510 2-in-1 | |
| AIDA64 / CPU AES | |
| Lenovo ThinkPad L15 G2 AMD | |
| HP EliteBook 850 G8 3C7Z8EA | |
| Moyenne Intel Core i7-1185G7 (33002 - 76826, n=20) | |
| MSI Summit B15 A11M | |
| Microsoft Surface Laptop 4 15 AMD TFF_00028 | |
| Dell Latitude 15 9520 2-in-1 | |
| Dell Latitude 9510 2-in-1 | |
| AIDA64 / CPU ZLib | |
| Microsoft Surface Laptop 4 15 AMD TFF_00028 | |
| Lenovo ThinkPad L15 G2 AMD | |
| Dell Latitude 9510 2-in-1 | |
| MSI Summit B15 A11M | |
| HP EliteBook 850 G8 3C7Z8EA | |
| Moyenne Intel Core i7-1185G7 (258 - 412, n=22) | |
| Dell Latitude 15 9520 2-in-1 | |
| AIDA64 / FP64 Ray-Trace | |
| Microsoft Surface Laptop 4 15 AMD TFF_00028 | |
| Lenovo ThinkPad L15 G2 AMD | |
| MSI Summit B15 A11M | |
| Moyenne Intel Core i7-1185G7 (2821 - 4094, n=20) | |
| HP EliteBook 850 G8 3C7Z8EA | |
| Dell Latitude 15 9520 2-in-1 | |
| Dell Latitude 9510 2-in-1 | |
| AIDA64 / CPU PhotoWorxx | |
| Dell Latitude 15 9520 2-in-1 | |
| Moyenne Intel Core i7-1185G7 (22349 - 43701, n=20) | |
| MSI Summit B15 A11M | |
| HP EliteBook 850 G8 3C7Z8EA | |
| Microsoft Surface Laptop 4 15 AMD TFF_00028 | |
| Dell Latitude 9510 2-in-1 | |
| Lenovo ThinkPad L15 G2 AMD | |
Performance du système
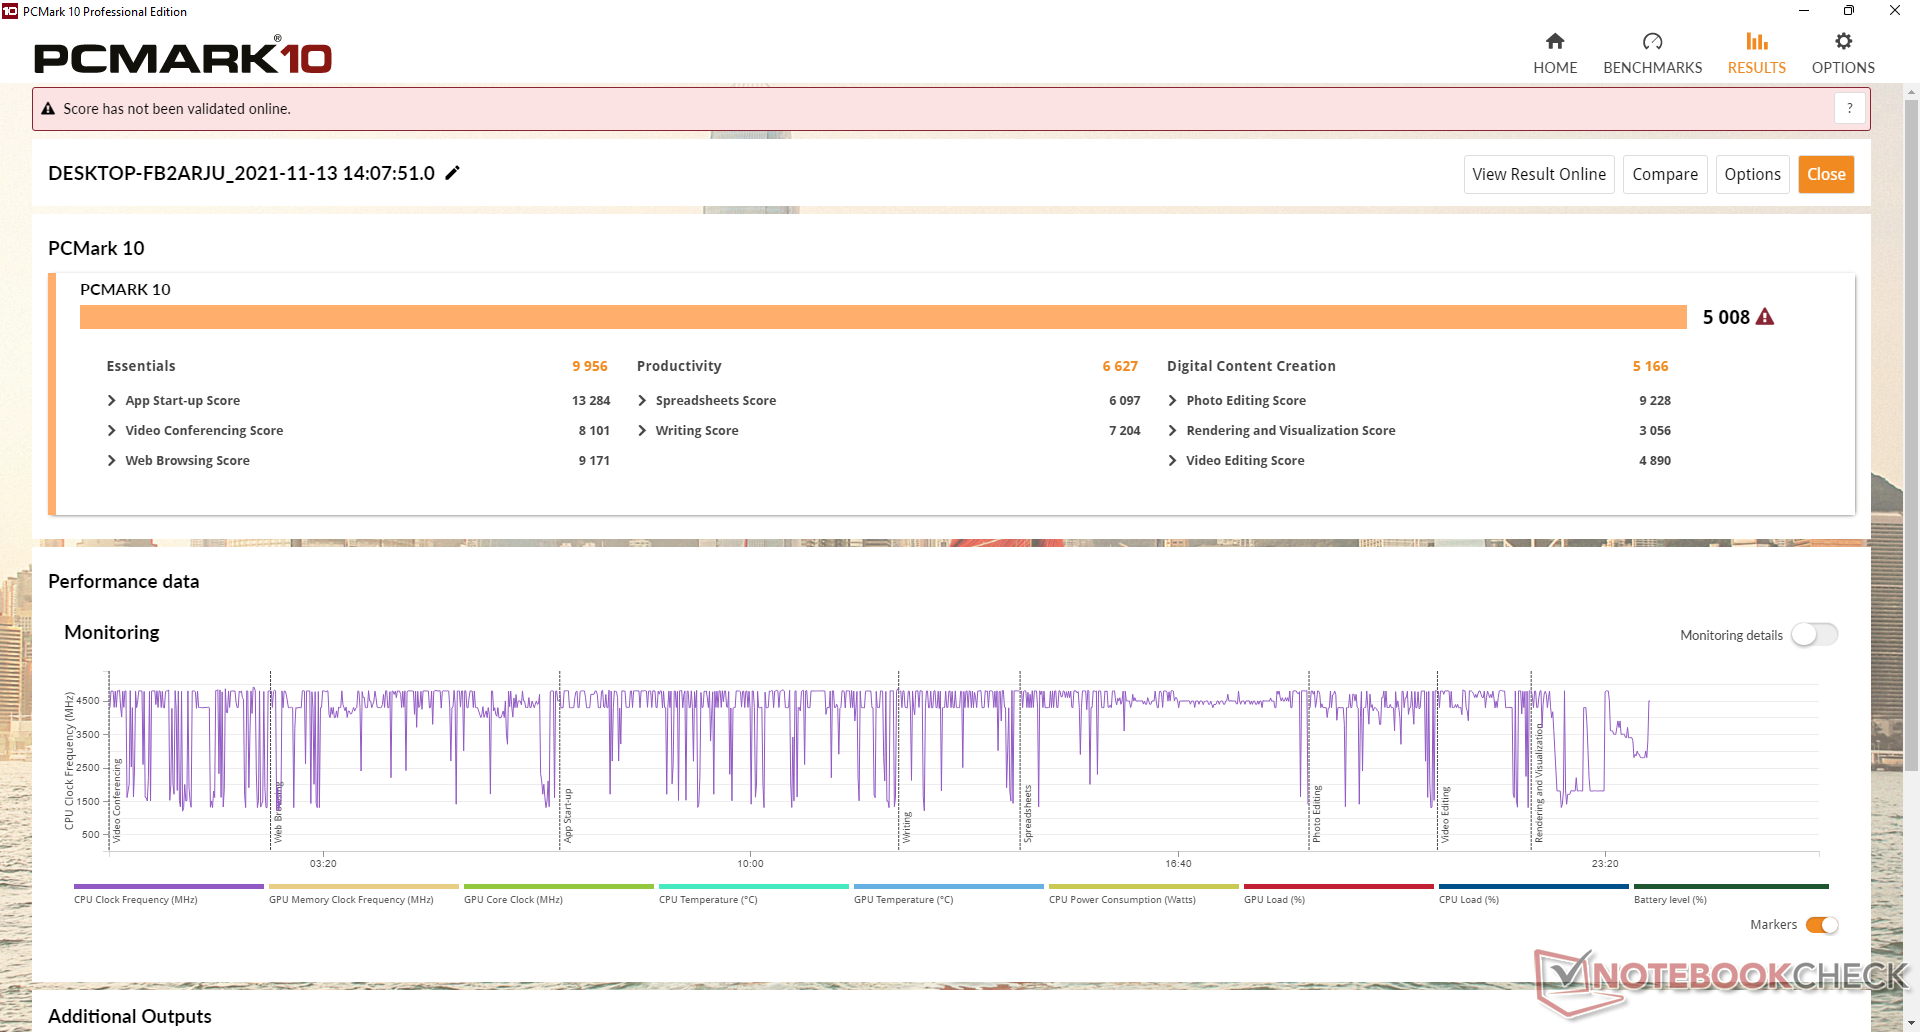
Les scores PCMark 10 sont généralement plus élevés que ceux que nous avons enregistrés sur le Latitude 9510 2-in-1, en particulier dans le domaine de la création de contenu numérique, où les graphiques ont le plus d'importance. L'ancien modèle a un score de productivité plus élevé, probablement en raison de ses performances multithread supérieures.
| PCMark 10 / Score | |
| Lenovo ThinkPad L15 G2 AMD | |
| Microsoft Surface Laptop 4 15 AMD TFF_00028 | |
| Dell Latitude 15 9520 2-in-1 | |
| Moyenne Intel Core i7-1185G7, Intel Iris Xe Graphics G7 96EUs (4746 - 5561, n=20) | |
| HP EliteBook 850 G8 3C7Z8EA | |
| MSI Summit B15 A11M | |
| Dell Latitude 9510 2-in-1 | |
| PCMark 10 / Essentials | |
| Lenovo ThinkPad L15 G2 AMD | |
| Dell Latitude 15 9520 2-in-1 | |
| Moyenne Intel Core i7-1185G7, Intel Iris Xe Graphics G7 96EUs (8279 - 10664, n=20) | |
| Dell Latitude 9510 2-in-1 | |
| MSI Summit B15 A11M | |
| HP EliteBook 850 G8 3C7Z8EA | |
| Microsoft Surface Laptop 4 15 AMD TFF_00028 | |
| PCMark 10 / Productivity | |
| Lenovo ThinkPad L15 G2 AMD | |
| Microsoft Surface Laptop 4 15 AMD TFF_00028 | |
| Dell Latitude 9510 2-in-1 | |
| HP EliteBook 850 G8 3C7Z8EA | |
| Moyenne Intel Core i7-1185G7, Intel Iris Xe Graphics G7 96EUs (5799 - 8770, n=20) | |
| Dell Latitude 15 9520 2-in-1 | |
| MSI Summit B15 A11M | |
| PCMark 10 / Digital Content Creation | |
| Microsoft Surface Laptop 4 15 AMD TFF_00028 | |
| Dell Latitude 15 9520 2-in-1 | |
| Moyenne Intel Core i7-1185G7, Intel Iris Xe Graphics G7 96EUs (4424 - 5684, n=20) | |
| HP EliteBook 850 G8 3C7Z8EA | |
| Lenovo ThinkPad L15 G2 AMD | |
| MSI Summit B15 A11M | |
| Dell Latitude 9510 2-in-1 | |
| PCMark 10 Score | 5008 points | |
Aide | ||
| AIDA64 / Memory Copy | |
| Dell Latitude 15 9520 2-in-1 | |
| Moyenne Intel Core i7-1185G7 (36515 - 68450, n=20) | |
| HP EliteBook 850 G8 3C7Z8EA | |
| Microsoft Surface Laptop 4 15 AMD TFF_00028 | |
| MSI Summit B15 A11M | |
| Dell Latitude 9510 2-in-1 | |
| Lenovo ThinkPad L15 G2 AMD | |
| AIDA64 / Memory Read | |
| Dell Latitude 15 9520 2-in-1 | |
| Moyenne Intel Core i7-1185G7 (38394 - 64291, n=20) | |
| HP EliteBook 850 G8 3C7Z8EA | |
| Microsoft Surface Laptop 4 15 AMD TFF_00028 | |
| MSI Summit B15 A11M | |
| Dell Latitude 9510 2-in-1 | |
| Lenovo ThinkPad L15 G2 AMD | |
| AIDA64 / Memory Write | |
| Dell Latitude 15 9520 2-in-1 | |
| Moyenne Intel Core i7-1185G7 (37684 - 66873, n=20) | |
| HP EliteBook 850 G8 3C7Z8EA | |
| MSI Summit B15 A11M | |
| Microsoft Surface Laptop 4 15 AMD TFF_00028 | |
| Dell Latitude 9510 2-in-1 | |
| Lenovo ThinkPad L15 G2 AMD | |
| AIDA64 / Memory Latency | |
| Microsoft Surface Laptop 4 15 AMD TFF_00028 | |
| Dell Latitude 15 9520 2-in-1 | |
| Dell Latitude 9510 2-in-1 | |
| Lenovo ThinkPad L15 G2 AMD | |
| Moyenne Intel Core i7-1185G7 (78.3 - 117, n=22) | |
| MSI Summit B15 A11M | |
| HP EliteBook 850 G8 3C7Z8EA | |
* ... Moindre est la valeur, meilleures sont les performances
Latence DPC
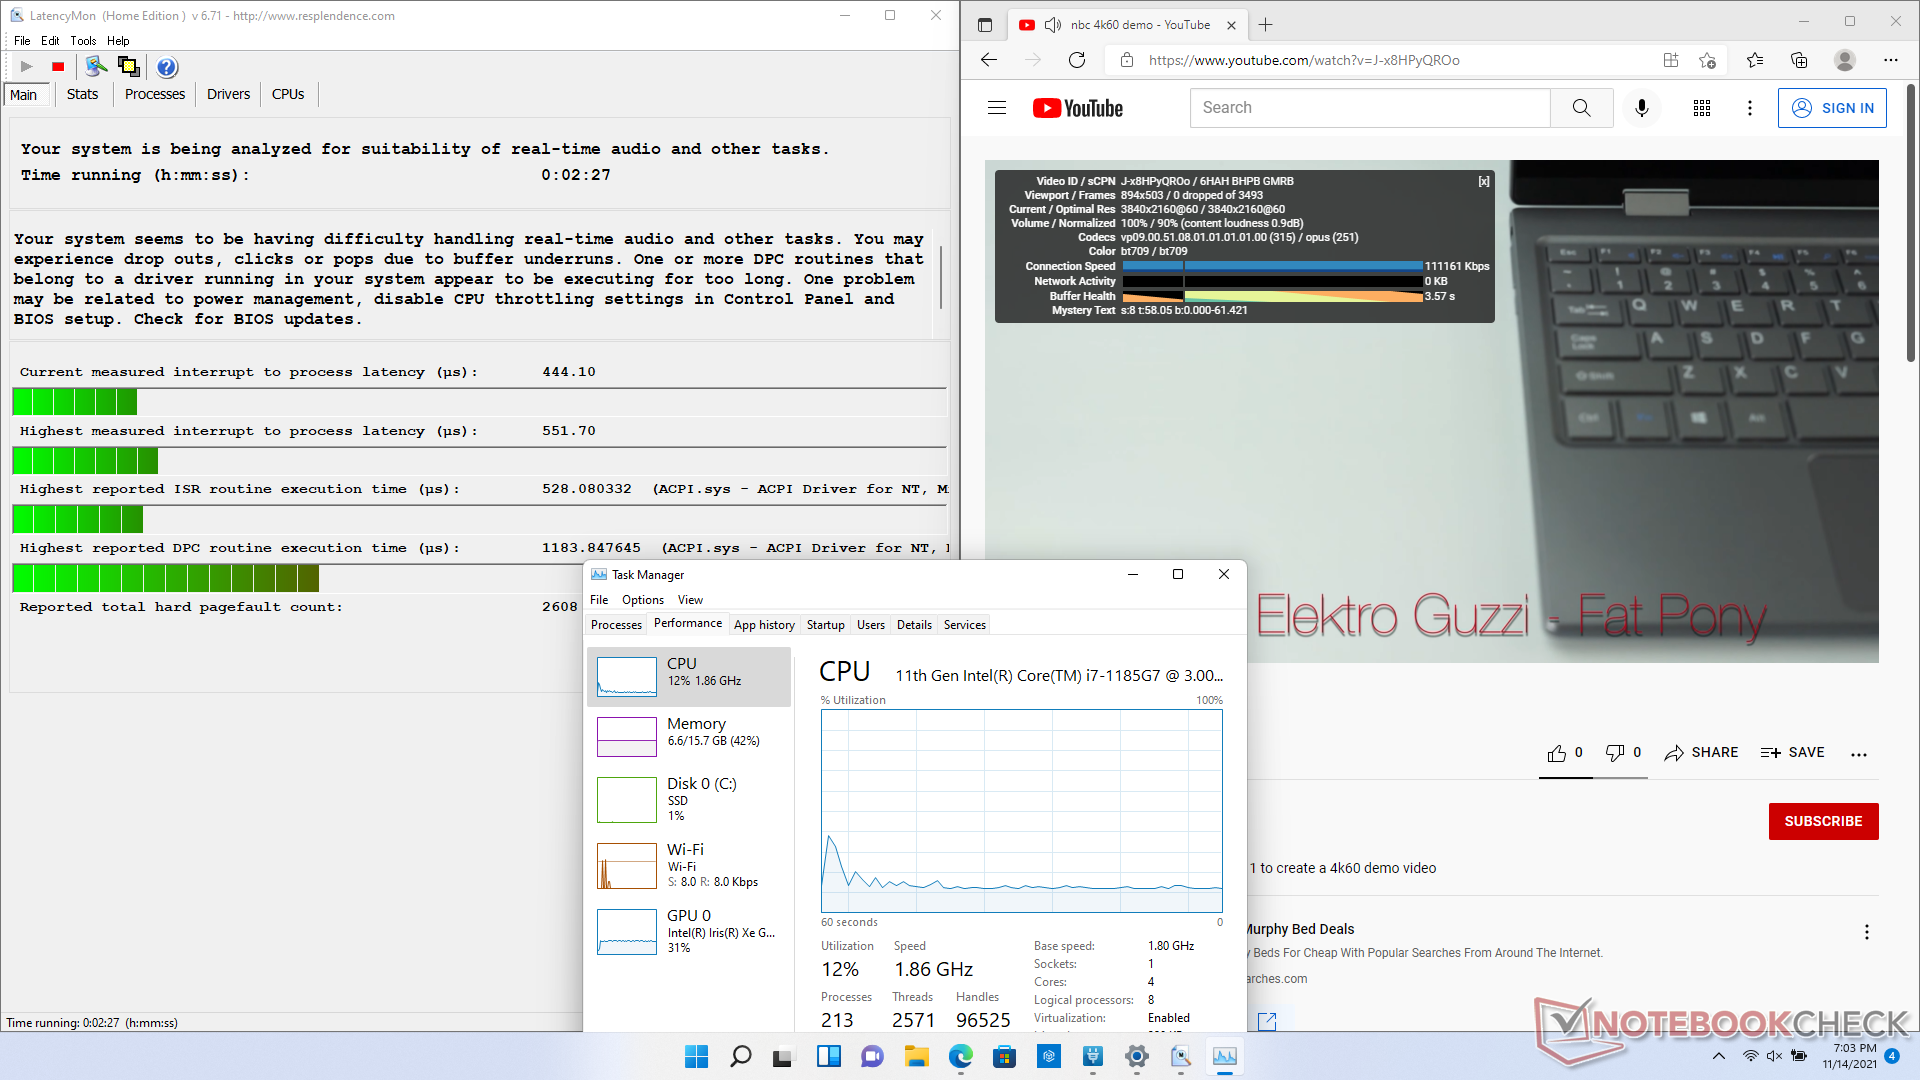
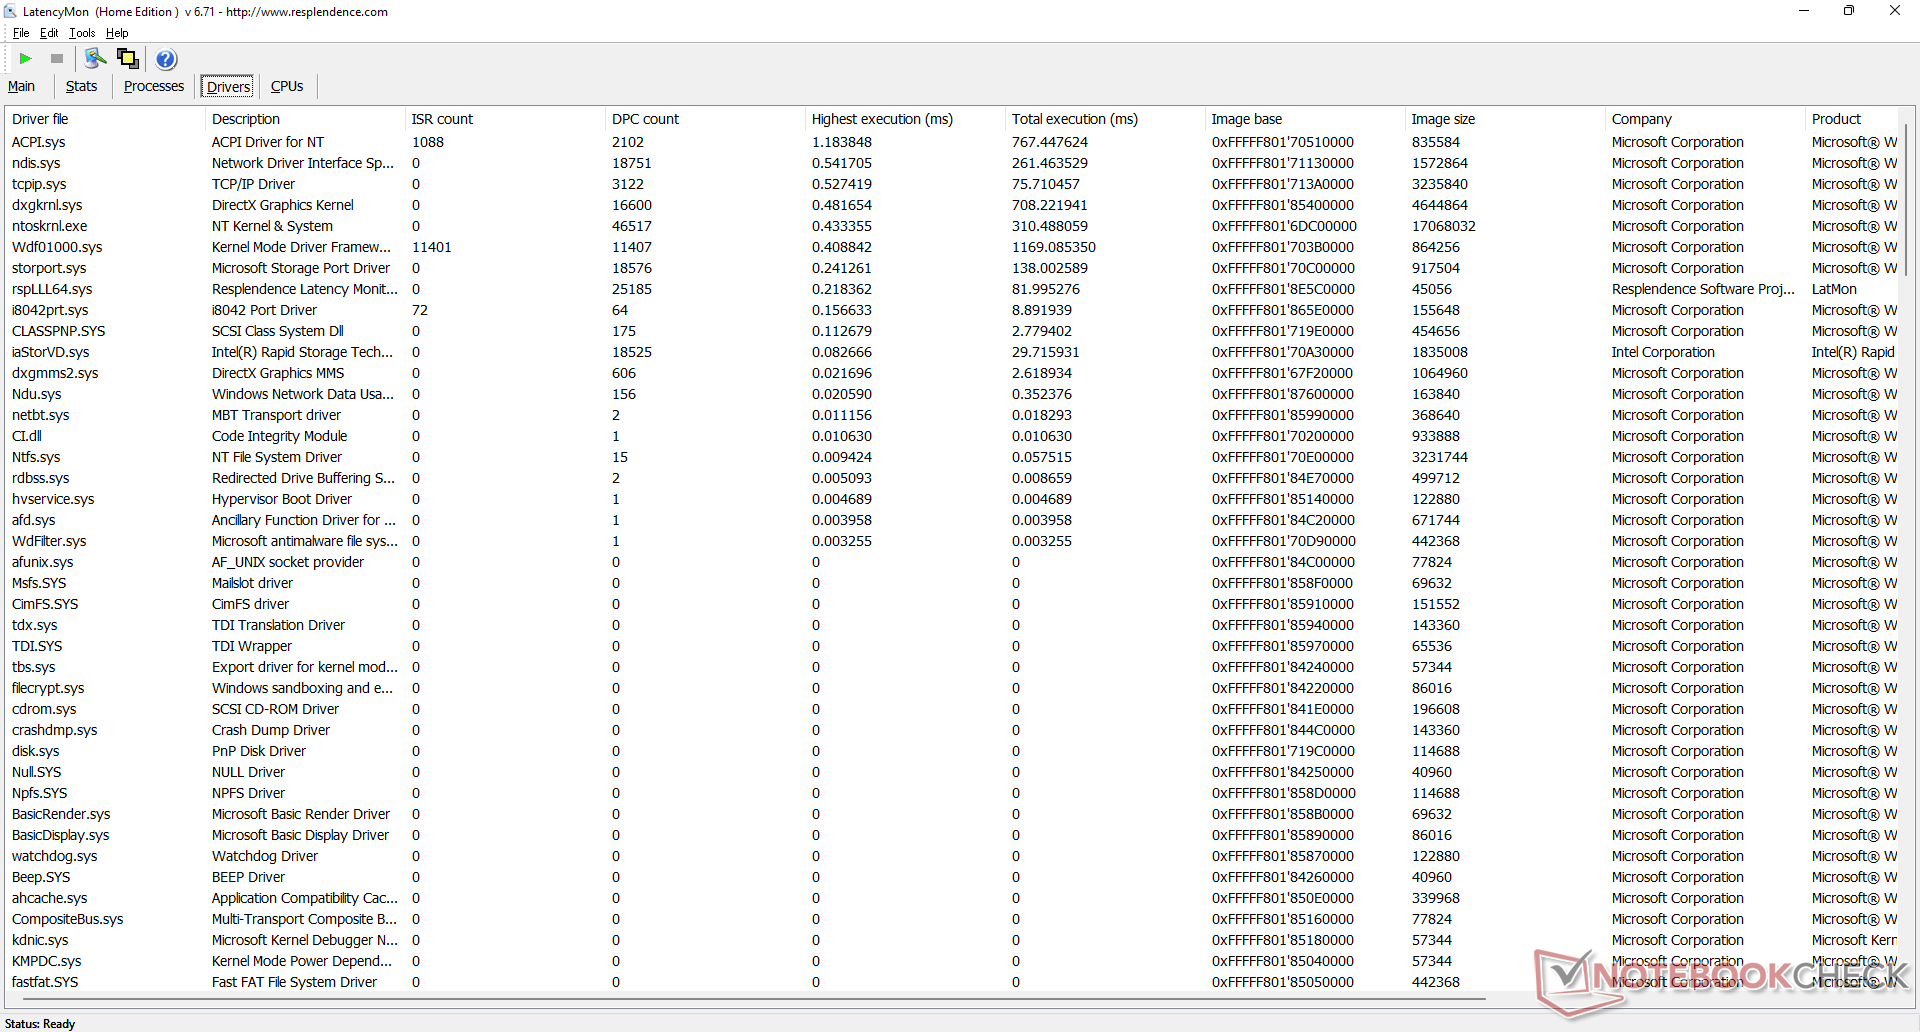
LatencyMon montre des problèmes mineurs de latence DPC liés à ACPI.sys lors de l'ouverture de plusieurs onglets de navigateur de notre page d'accueil. Il s'agit néanmoins d'une amélioration par rapport à ce que nous avons observé sur le modèle de l'année dernière
La lecture de vidéos 4K à 60 FPS reste parfaite, sans aucune image perdue et avec une utilisation du GPU plus efficace qu'avec le UHD Graphics 620.
| DPC Latencies / LatencyMon - interrupt to process latency (max), Web, Youtube, Prime95 | |
| Dell Latitude 9510 2-in-1 | |
| Lenovo ThinkPad L15 G2 AMD | |
| HP EliteBook 850 G8 3C7Z8EA | |
| MSI Summit B15 A11M | |
| Microsoft Surface Laptop 4 15 AMD TFF_00028 | |
| Dell Latitude 15 9520 2-in-1 | |
* ... Moindre est la valeur, meilleures sont les performances
Périphériques de stockage
Notre unité de test utilise la même carte PCIe3 x4 Toshiba KBG40ZNS512G NVMe M.2 2230 SSD que l'on trouve sur le Latitude 9510 2-in-1. Dell ne propose actuellement aucune option PCIe4, même si le chipset Intel devrait théoriquement être capable de prendre en charge de tels SSD. Cependant, l'absence de dissipateur thermique signifie que les SSD PCIe4 ne pourront être utilisés qu'après une courte période.

* ... Moindre est la valeur, meilleures sont les performances
Disk Throttling: DiskSpd Read Loop, Queue Depth 8
Performances du GPU
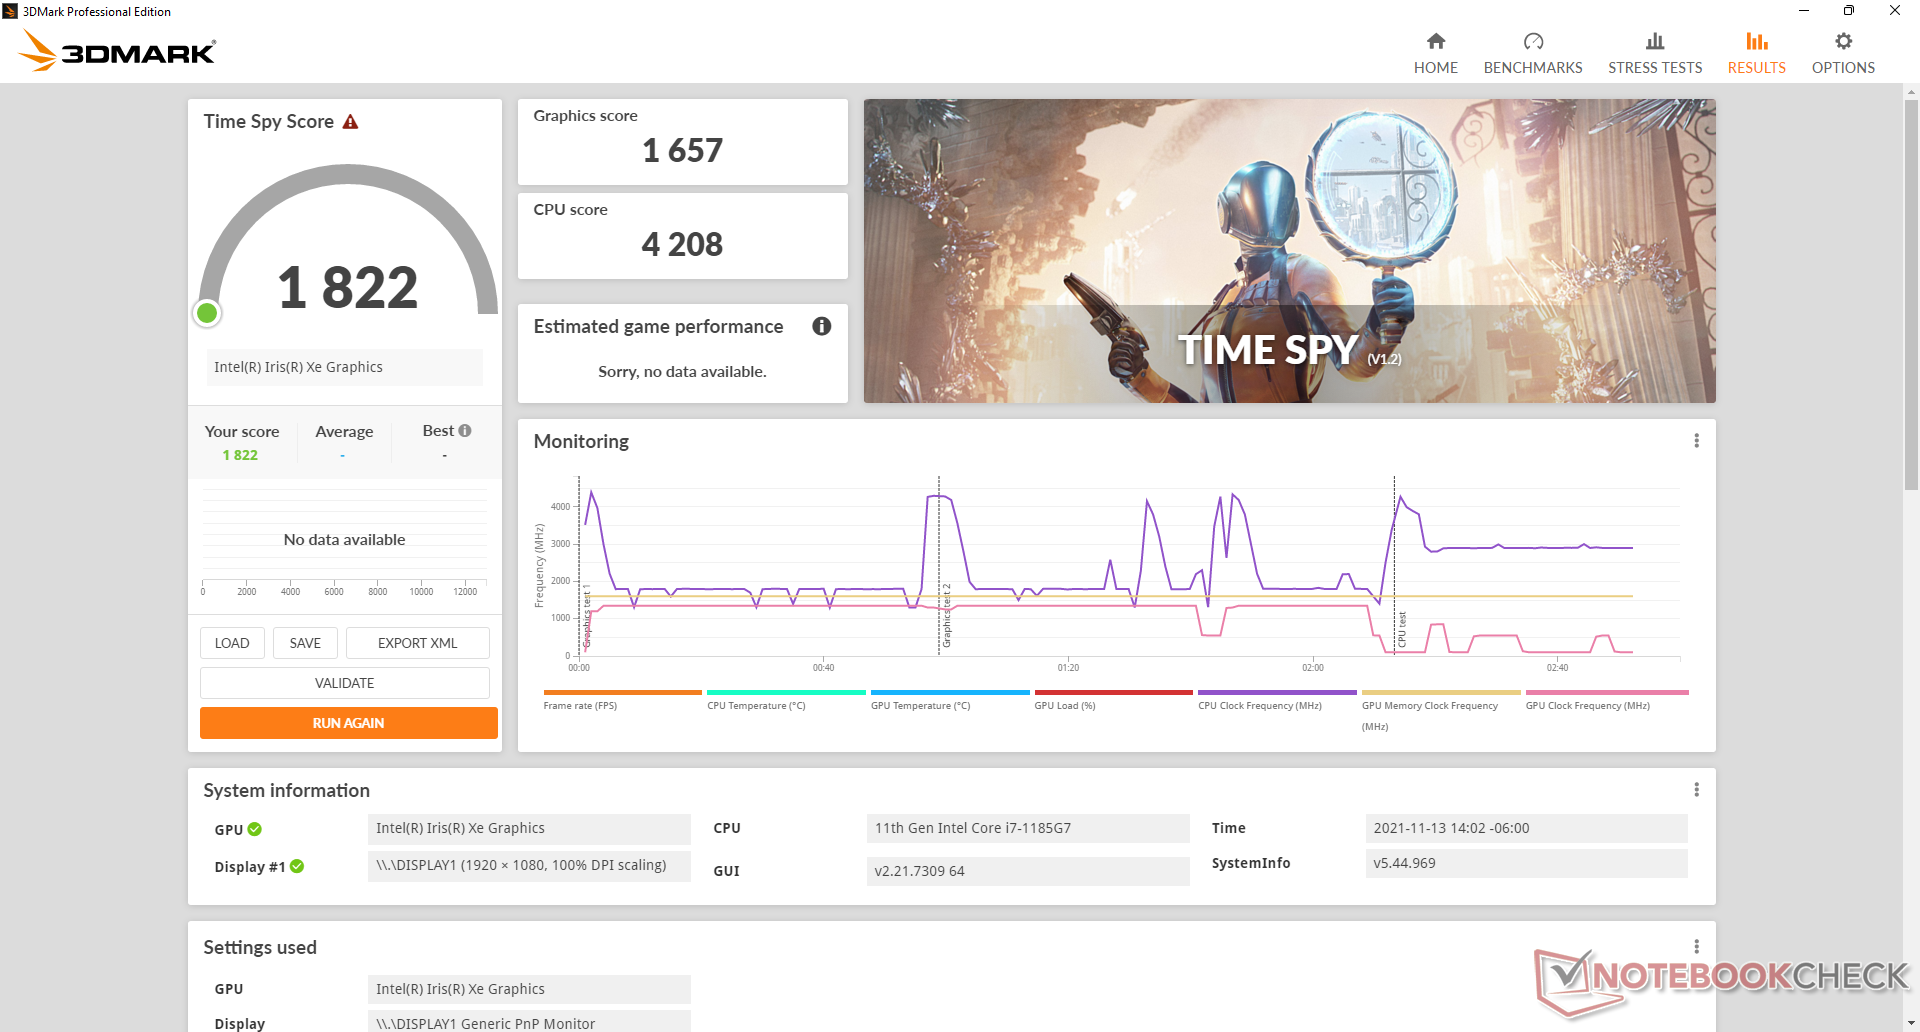
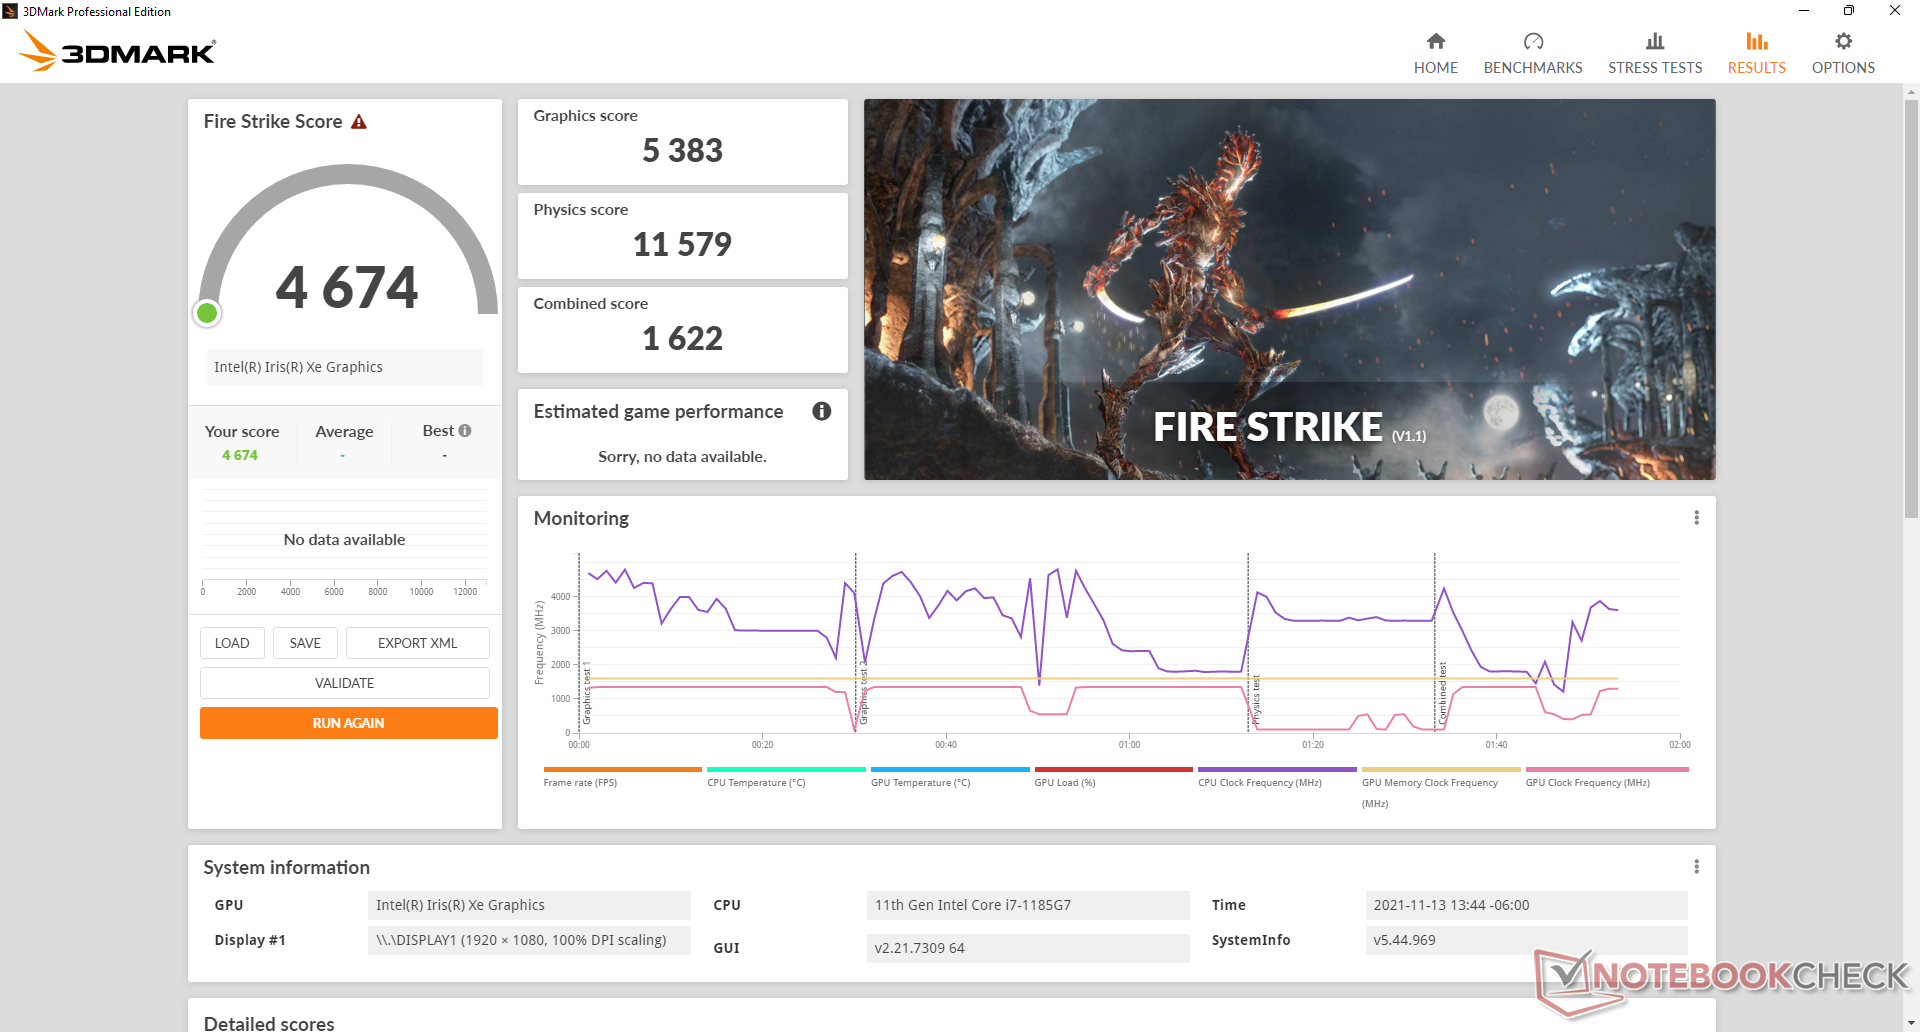
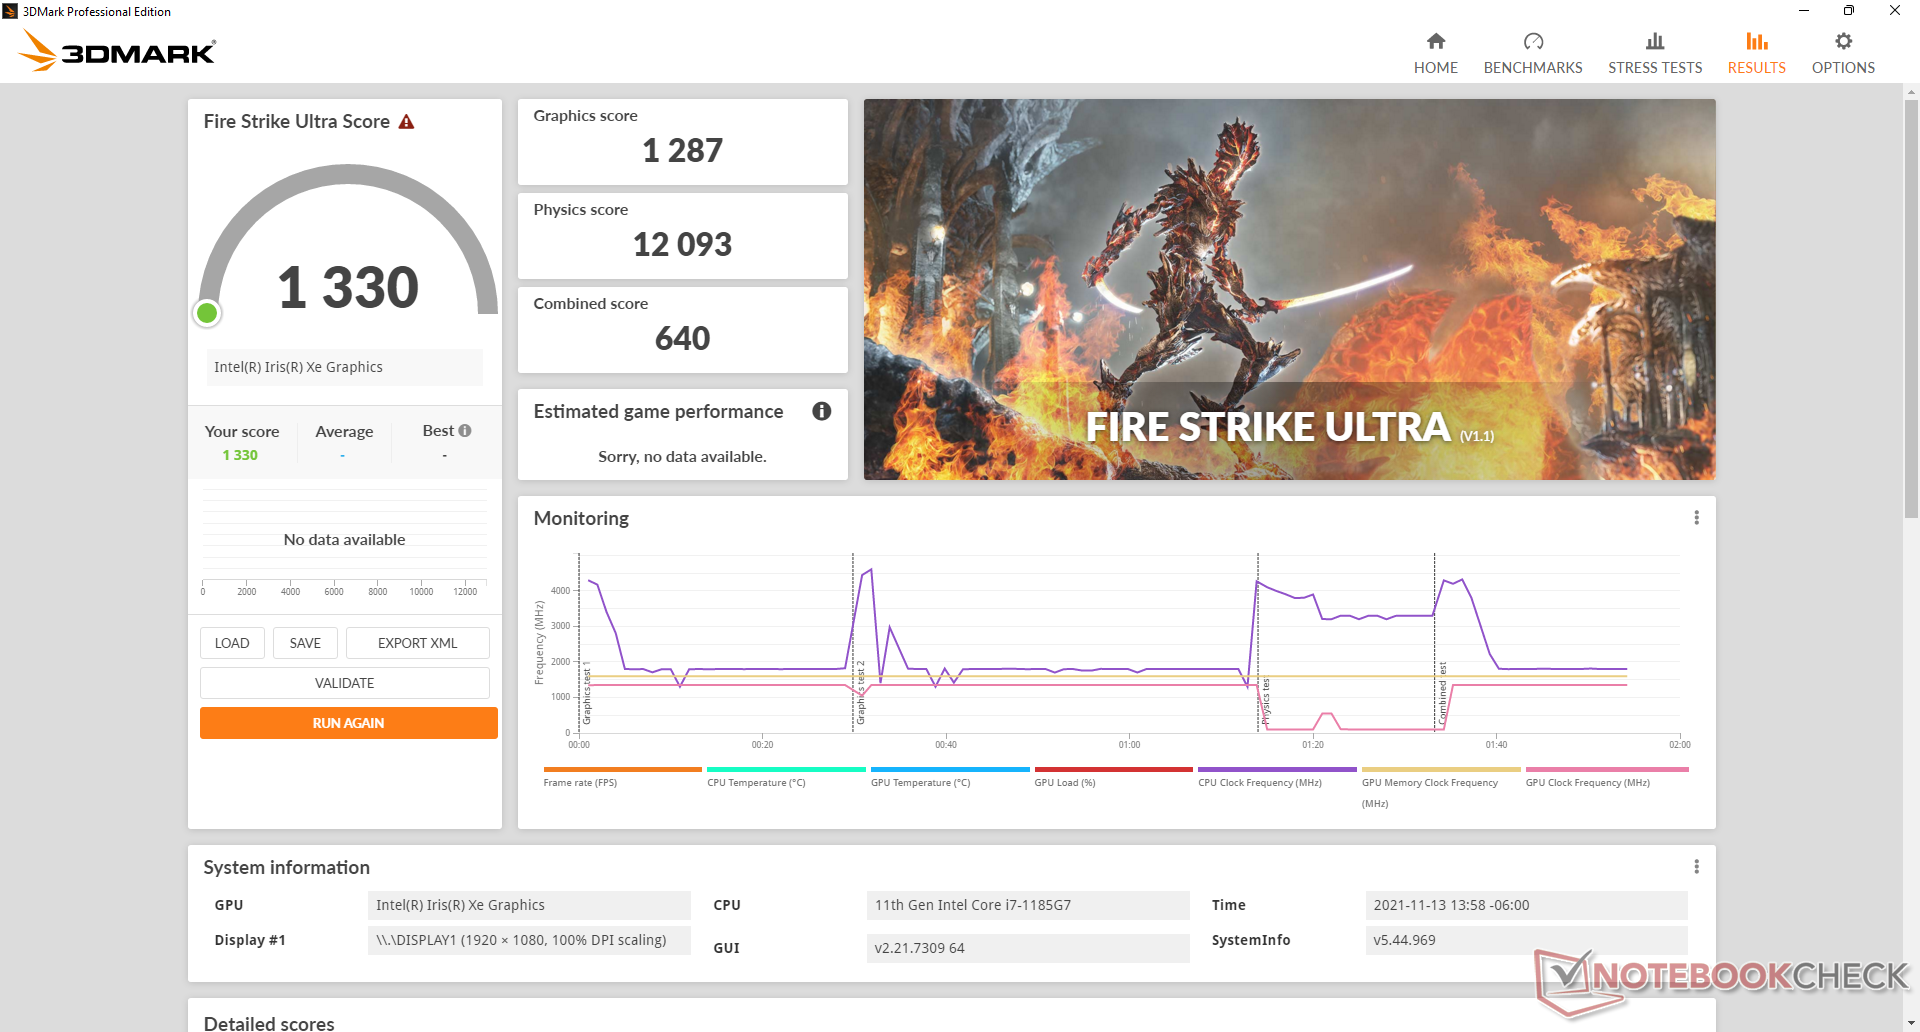
Les scores 3DMark montrent que l Iris Xe 96 EU de notre Latitude 9520 2-en-1 se comporte bien par rapport aux autres ordinateurs portables Iris Xe de notre base de données. Le diable est dans les détails, cependant, car les performances de jeu dans le monde réel sont médiocres en raison de la fluctuation inhabituelle des taux de trame. Par exemple, les taux de trame sautent constamment entre 40 FPS et 90 FPS lorsque l'ordinateur tourne au ralenti avec les paramètres les plus bas Witcher 3 à ses paramètres les plus bas, alors que le MSI Summit B15, équipé de l'Iris Xe, est plus performant MSI Summit B15 fonctionnait de manière beaucoup plus stable, sans aucune chute brutale du nombre d'images par seconde. Ainsi, alors que notre Latitude 9520 2-in-1 Iris Xe est indubitablement plus rapide que le UHD Graphics 620 sur le Latitude 9510 2-in-1 de l'année dernière, il aurait certainement pu être plus stable en termes de performances dans le temps.
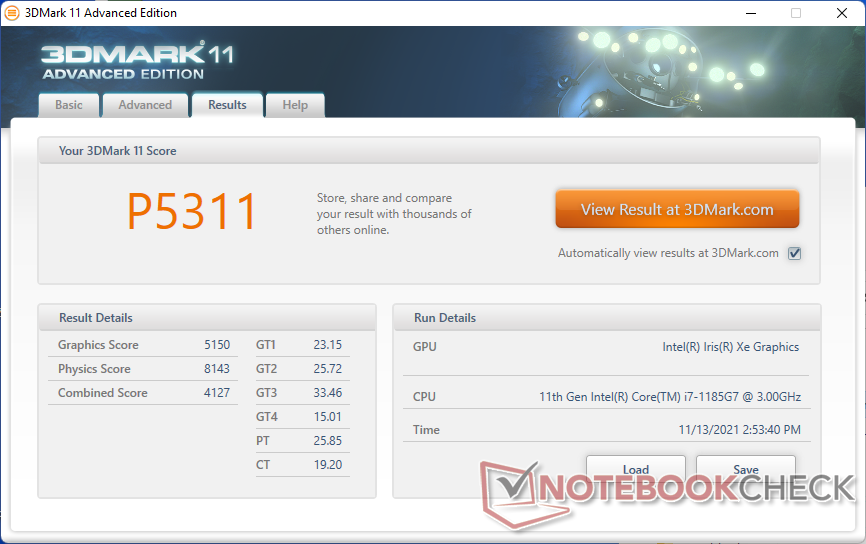
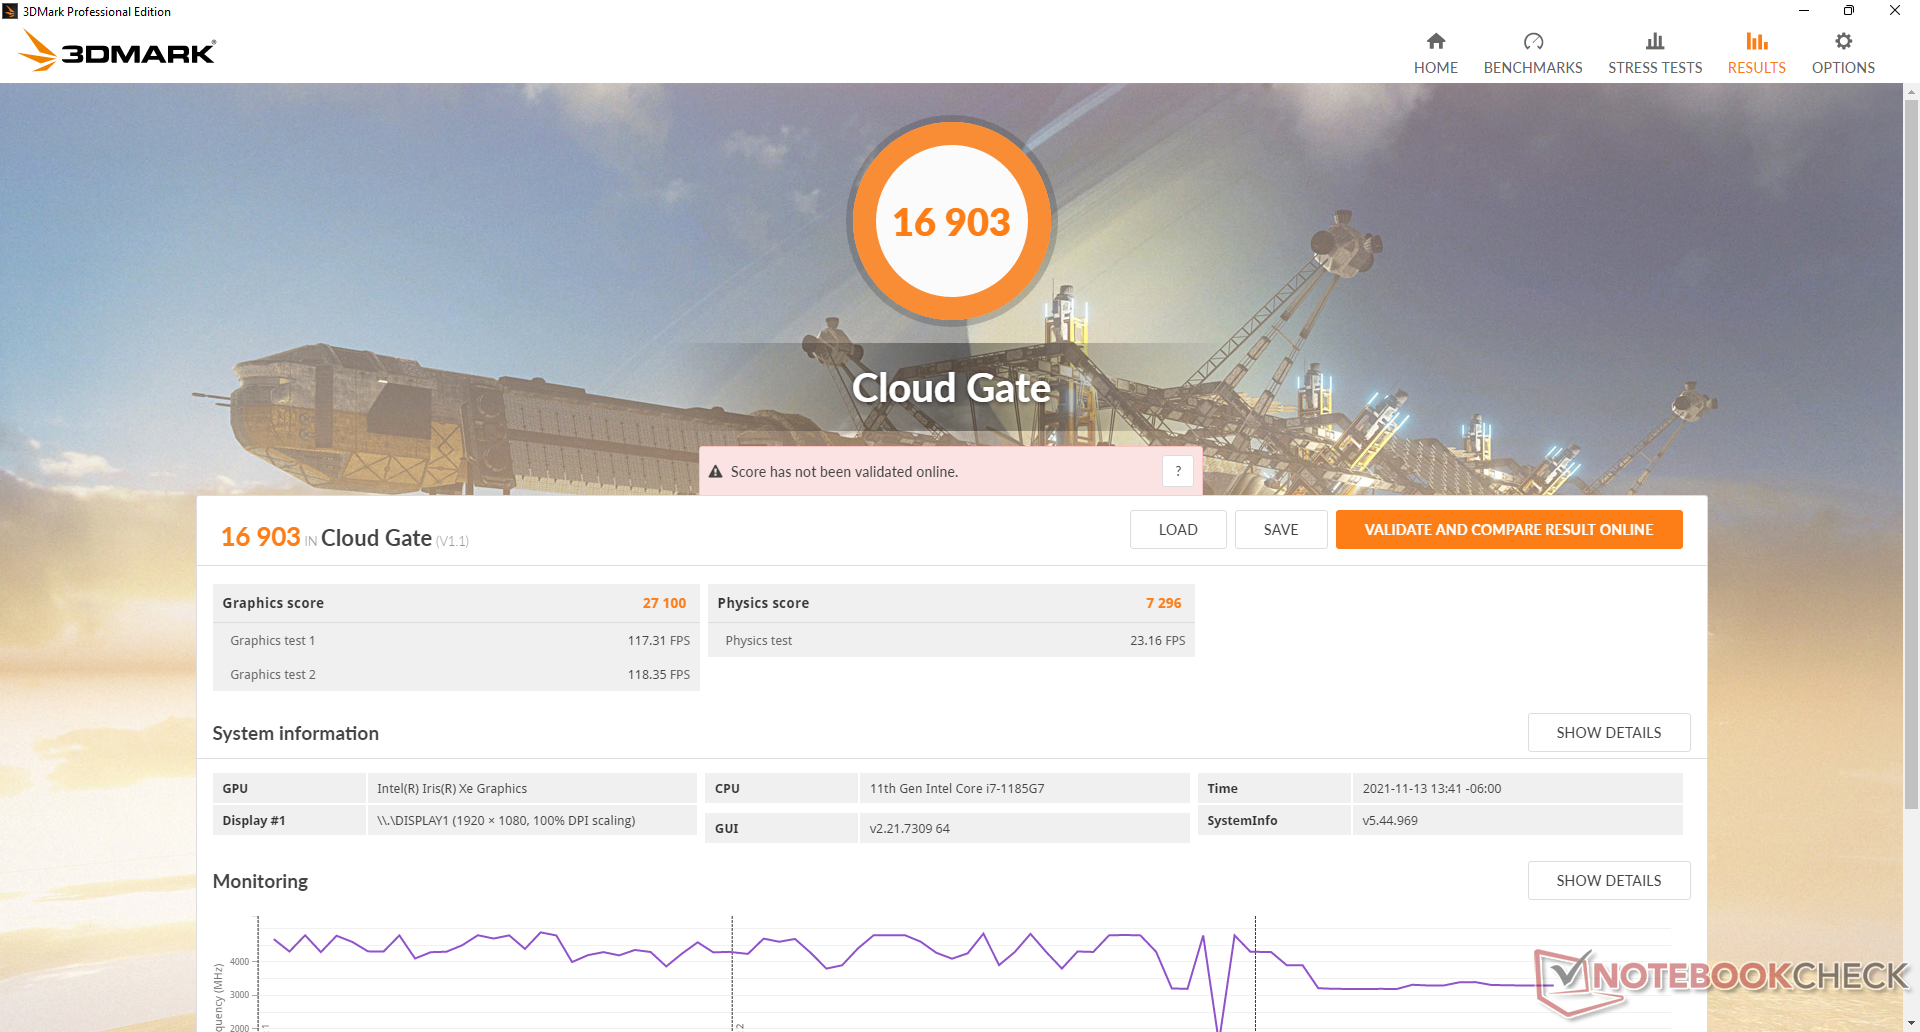
| 3DMark 11 Performance | 5311 points | |
| 3DMark Cloud Gate Standard Score | 16903 points | |
| 3DMark Fire Strike Score | 4674 points | |
| 3DMark Time Spy Score | 1822 points | |
Aide | ||
Witcher 3 FPS Chart
| Bas | Moyen | Élevé | Ultra | |
|---|---|---|---|---|
| GTA V (2015) | 81 | 70.5 | 27.2 | 10.6 |
| The Witcher 3 (2015) | 86.8 | 59.4 | 33.5 | 14.3 |
| Dota 2 Reborn (2015) | 103 | 61.7 | 39.8 | 39.8 |
| Final Fantasy XV Benchmark (2018) | 35 | 20 | 14.6 | |
| X-Plane 11.11 (2018) | 36 | 34.4 | 27.5 | |
| Strange Brigade (2018) | 82.8 | 32.7 | 26.3 | 23.2 |
Émissions
Bruit du système
Le ventilateur interne est silencieux à 24,1 dN(A) lorsque le moteur tourne au ralenti ou que vous naviguez sur le Web en mode équilibré ou optimisé ou plus bas. Il peut occasionnellement atteindre 25,8 dB(A), mais cela ne sera pas perceptible dans la plupart des environnements. Les utilisateurs peuvent atteindre le bruit maximal du ventilateur, soit un peu moins de 40 dB(A), lorsqu'ils utilisent des charges plus élevées, comme des jeux.
Le bruit du ventilateur pulsera plus fréquemment s'il est réglé sur le mode Haute performance lors de la navigation ou du streaming vidéo. Veillez donc à régler le profil de puissance de manière appropriée si le bruit du ventilateur vous préoccupe.
Degré de la nuisance sonore
| Au repos |
| 24.1 / 24.1 / 25.8 dB(A) |
| Fortement sollicité |
| 34.2 / 39.6 dB(A) |
 | ||
30 dB silencieux 40 dB(A) audible 50 dB(A) bruyant |
||
min: | ||
| Dell Latitude 15 9520 2-in-1 Iris Xe G7 96EUs, i7-1185G7, Toshiba KBG40ZNS512G NVMe | Dell Latitude 9510 2-in-1 UHD Graphics 620, i7-10810U, Toshiba KBG40ZNS512G NVMe | HP EliteBook 850 G8 3C7Z8EA Iris Xe G7 96EUs, i7-1165G7, Samsung PM981a MZVLB1T0HBLR | Lenovo ThinkPad L15 G2 AMD Vega 7, R5 5600U, SK Hynix HFS512 GDE9X081N | MSI Summit B15 A11M Iris Xe G7 96EUs, i7-1165G7, Kingston OM8PCP31024F | Microsoft Surface Laptop 4 15 AMD TFF_00028 Vega 8, R7 4980U, SK Hynix BC511 HFM512GDJTNI | |
|---|---|---|---|---|---|---|
| Noise | -7% | 0% | 6% | -1% | -2% | |
| arrêt / environnement * (dB) | 24 | 27.2 -13% | 26 -8% | 24.22 -1% | 25.2 -5% | 24.2 -1% |
| Idle Minimum * (dB) | 24.1 | 27.2 -13% | 26 -8% | 24.22 -0% | 26.4 -10% | 24.2 -0% |
| Idle Average * (dB) | 24.1 | 27.2 -13% | 26 -8% | 24.22 -0% | 26.4 -10% | 24.2 -0% |
| Idle Maximum * (dB) | 25.8 | 27.2 -5% | 26.2 -2% | 24.22 6% | 26.4 -2% | 24.2 6% |
| Load Average * (dB) | 34.2 | 33.4 2% | 29.5 14% | 25.84 24% | 26.8 22% | 39.9 -17% |
| Witcher 3 ultra * (dB) | 39.6 | 28 29% | 39.9 -1% | |||
| Load Maximum * (dB) | 39.6 | 39.5 -0% | 34 14% | 36.02 9% | 52.6 -33% | 39.9 -1% |
* ... Moindre est la valeur, meilleures sont les performances
Température
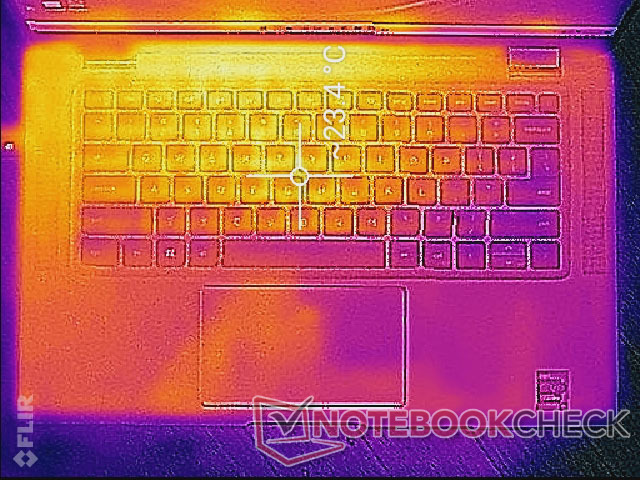
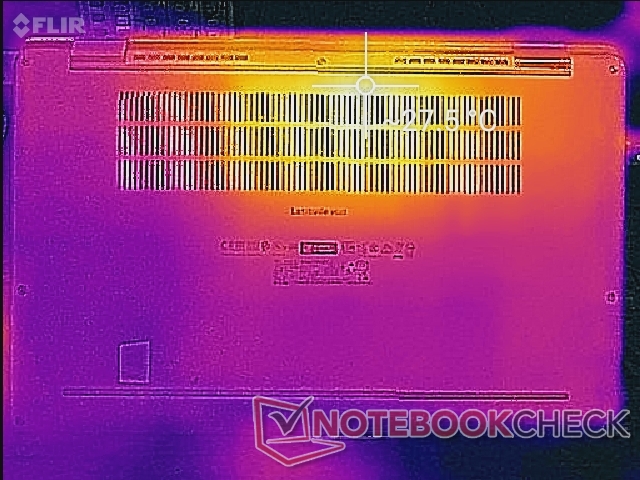
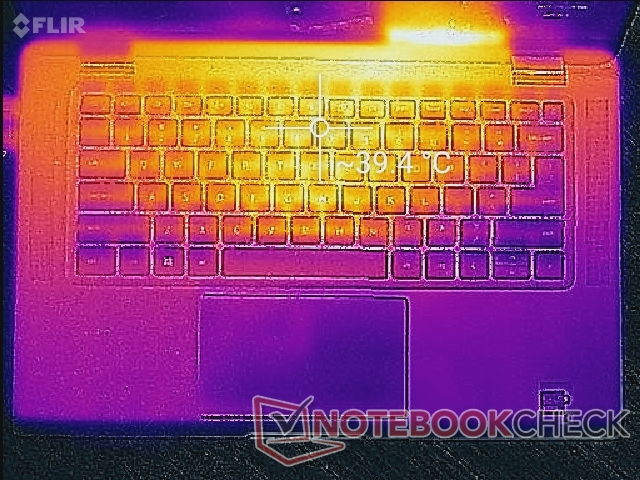
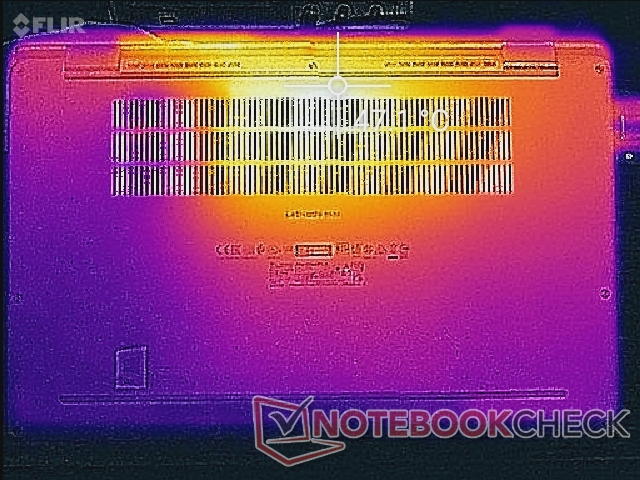
Les températures de surface sont similaires à celles de l'ordinateur Latitude 9510 2-in-1 en cas de charges faibles à moyennes. Cependant, si vous utilisez des charges plus élevées, comme des jeux, le point chaud inférieur du Latitude 9520 2-in-1 peut être plus chaud de quelques degrés que sur l'ancien modèle.
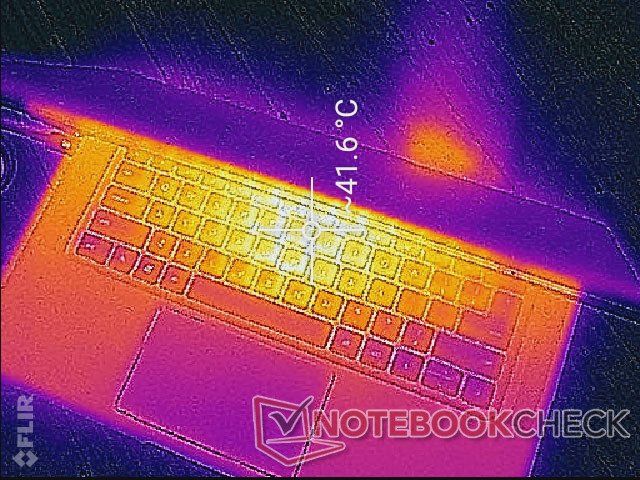
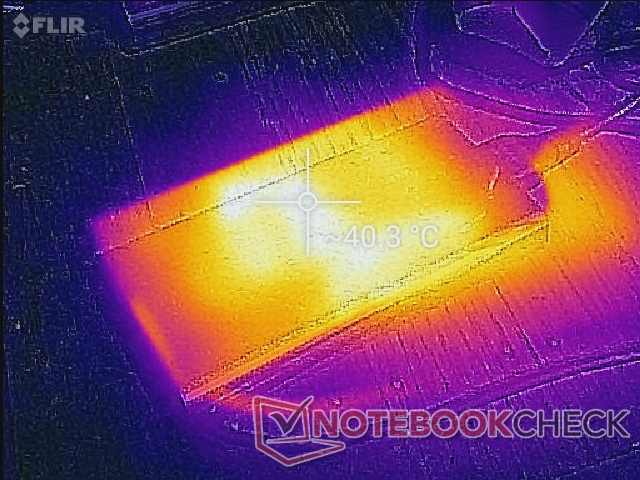
(±) La température maximale du côté supérieur est de 40 °C / 104 F, par rapport à la moyenne de 34.3 °C / 94 F, allant de 21.2 à 62.5 °C pour la classe Office.
(-) Le fond chauffe jusqu'à un maximum de 47.2 °C / 117 F, contre une moyenne de 36.8 °C / 98 F
(+) En utilisation inactive, la température moyenne du côté supérieur est de 22.5 °C / 73 F, par rapport à la moyenne du dispositif de 29.5 °C / 85 F.
(+) Les repose-poignets et le pavé tactile sont plus froids que la température de la peau avec un maximum de 28.6 °C / 83.5 F et sont donc froids au toucher.
(±) La température moyenne de la zone de l'appui-paume de dispositifs similaires était de 27.6 °C / 81.7 F (-1 °C / #-1.8 F).
| Dell Latitude 15 9520 2-in-1 Intel Core i7-1185G7, Intel Iris Xe Graphics G7 96EUs | Dell Latitude 9510 2-in-1 Intel Core i7-10810U, Intel UHD Graphics 620 | HP EliteBook 850 G8 3C7Z8EA Intel Core i7-1165G7, Intel Iris Xe Graphics G7 96EUs | Lenovo ThinkPad L15 G2 AMD AMD Ryzen 5 5600U, AMD Radeon RX Vega 7 | MSI Summit B15 A11M Intel Core i7-1165G7, Intel Iris Xe Graphics G7 96EUs | Microsoft Surface Laptop 4 15 AMD TFF_00028 AMD Ryzen 7 4980U, AMD Radeon RX Vega 8 (Ryzen 4000/5000) | |
|---|---|---|---|---|---|---|
| Heat | -9% | -3% | -8% | -8% | 4% | |
| Maximum Upper Side * (°C) | 40 | 42.8 -7% | 37.9 5% | 42.8 -7% | 42.8 -7% | 41.8 -5% |
| Maximum Bottom * (°C) | 47.2 | 41.8 11% | 39 17% | 46 3% | 52.2 -11% | 44.8 5% |
| Idle Upper Side * (°C) | 23.4 | 29.2 -25% | 31 -32% | 26.9 -15% | 26 -11% | 23 2% |
| Idle Bottom * (°C) | 27.4 | 31 -13% | 27.8 -1% | 31.1 -14% | 28.2 -3% | 23.6 14% |
* ... Moindre est la valeur, meilleures sont les performances
Test de stress
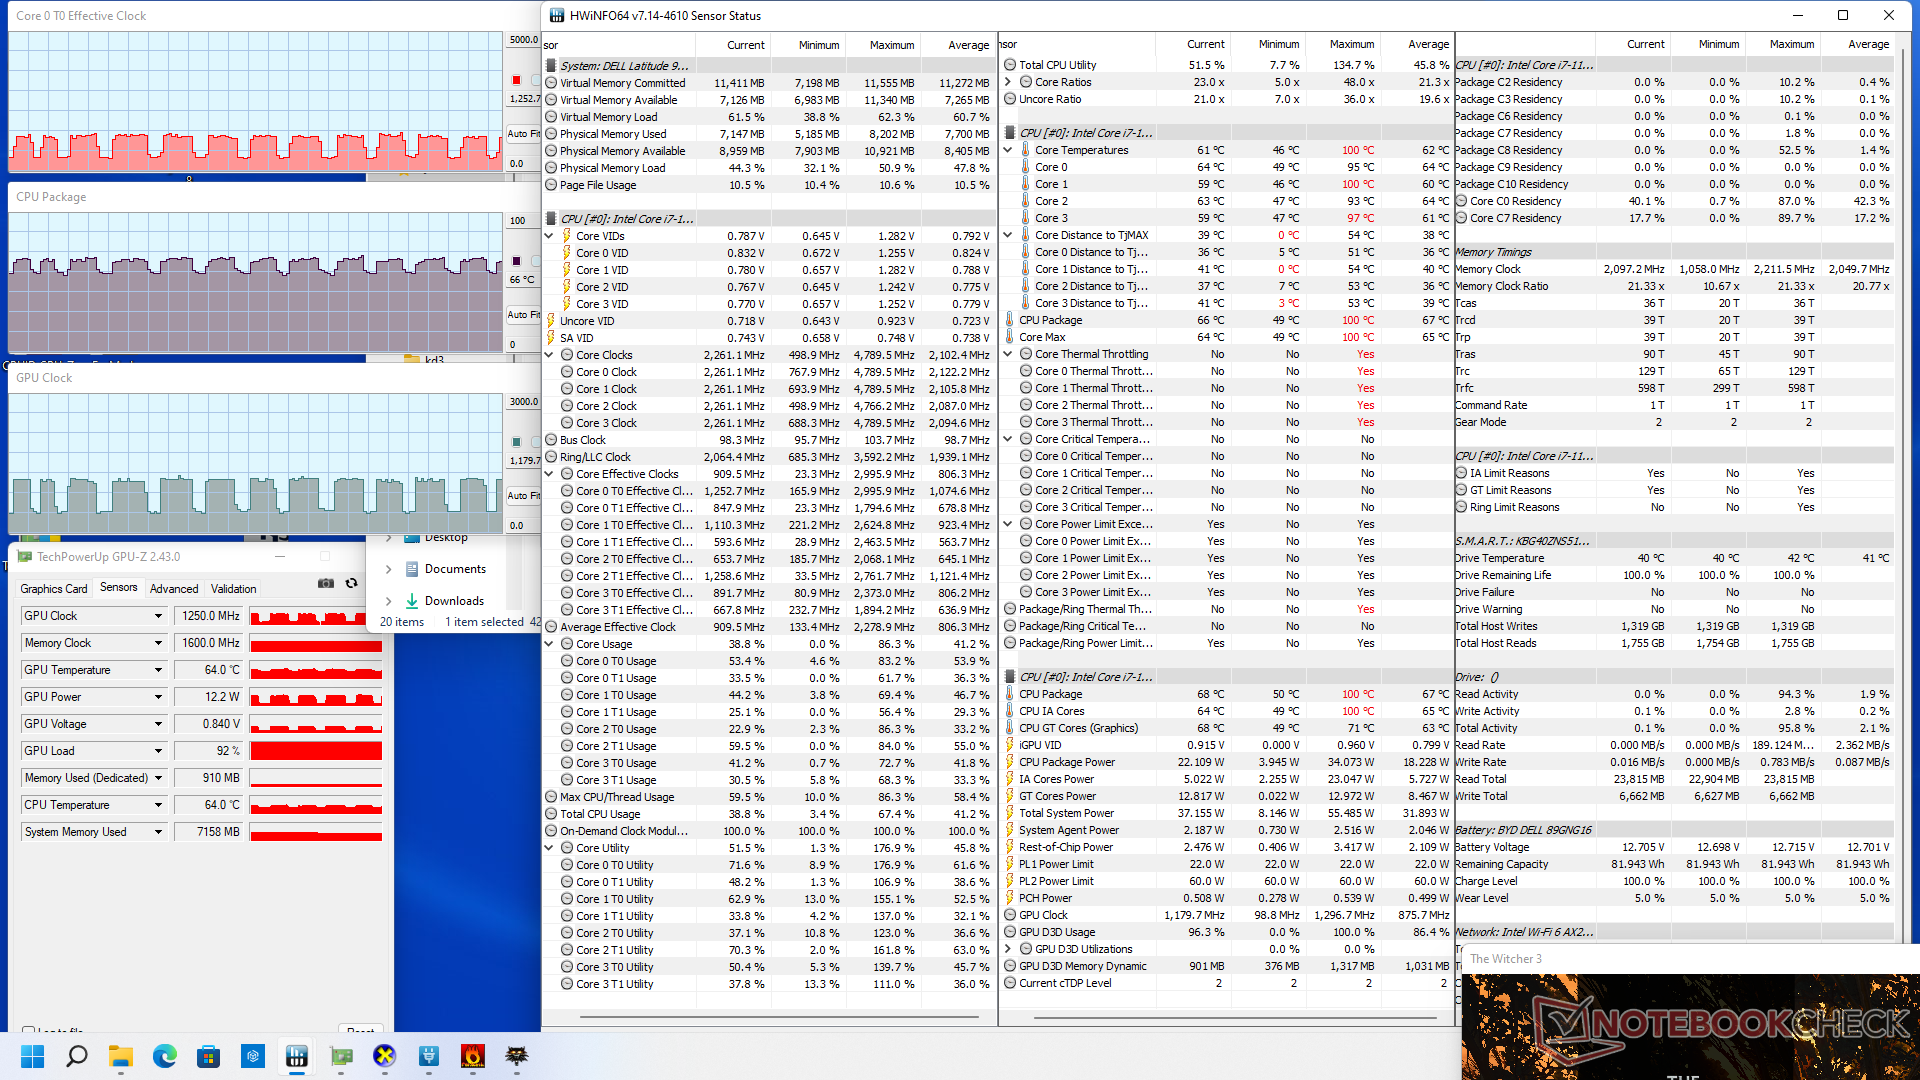
La performance instable lors du fonctionnement Witcher 3 comme mentionné ci-dessus peut être attribuée aux fréquences d'horloge instables lorsque le CPU et le GPU sont soumis à une charge simultanée. Les fréquences d'horloge du GPU oscillent entre 500 MHz et 1200 MHz lors de l'exécution du jeu, alors que la plupart des autres ordinateurs portables Iris Xe restent stables à des fréquences d'horloge fixes pour des performances plus régulières. Le site MSI Summit B15par exemple, avait une fréquence d'horloge du GPU stable de 1300 MHz dans les mêmes conditions de jeu que notre Dell. Ce comportement indésirable du GPU fait du Latitude 9520 2-en-1 un choix comparativement moins bon pour les tâches graphiques intensives.
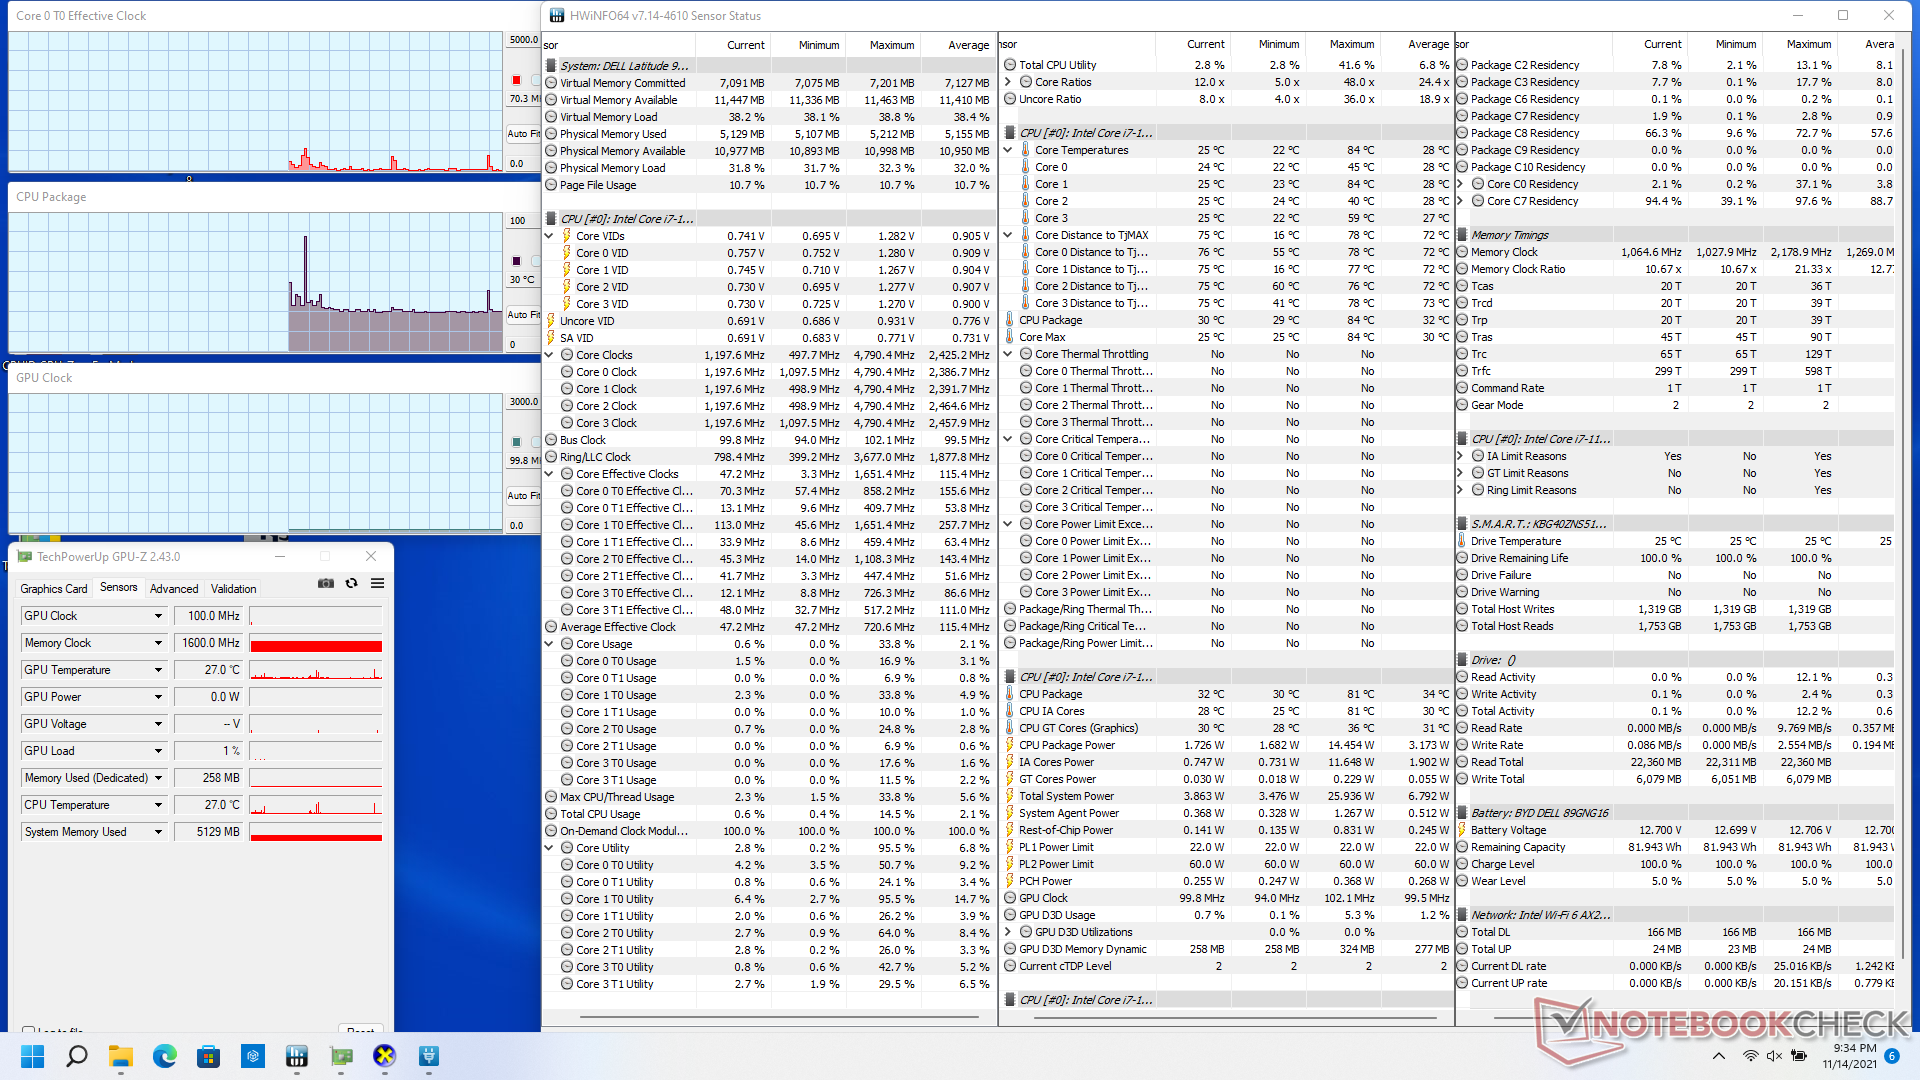
Si l'on sollicite uniquement le CPU via Prime95, les fréquences d'horloge montent à 3,2 GHz pendant les premières secondes à une température de 98 C. Ensuite, les fréquences d'horloge descendent à 2 GHz afin de maintenir une température plus froide d'environ 75 C. Les limites de puissance PL1 à long terme et PL2 à court terme du multithread sont respectivement de 22 W et 45 W lorsque le système est en mode Haute performance.
L'utilisation de la batterie ne limite pas les performances car les scores 3DMark 11 sont presque identiques entre le secteur et la batterie.
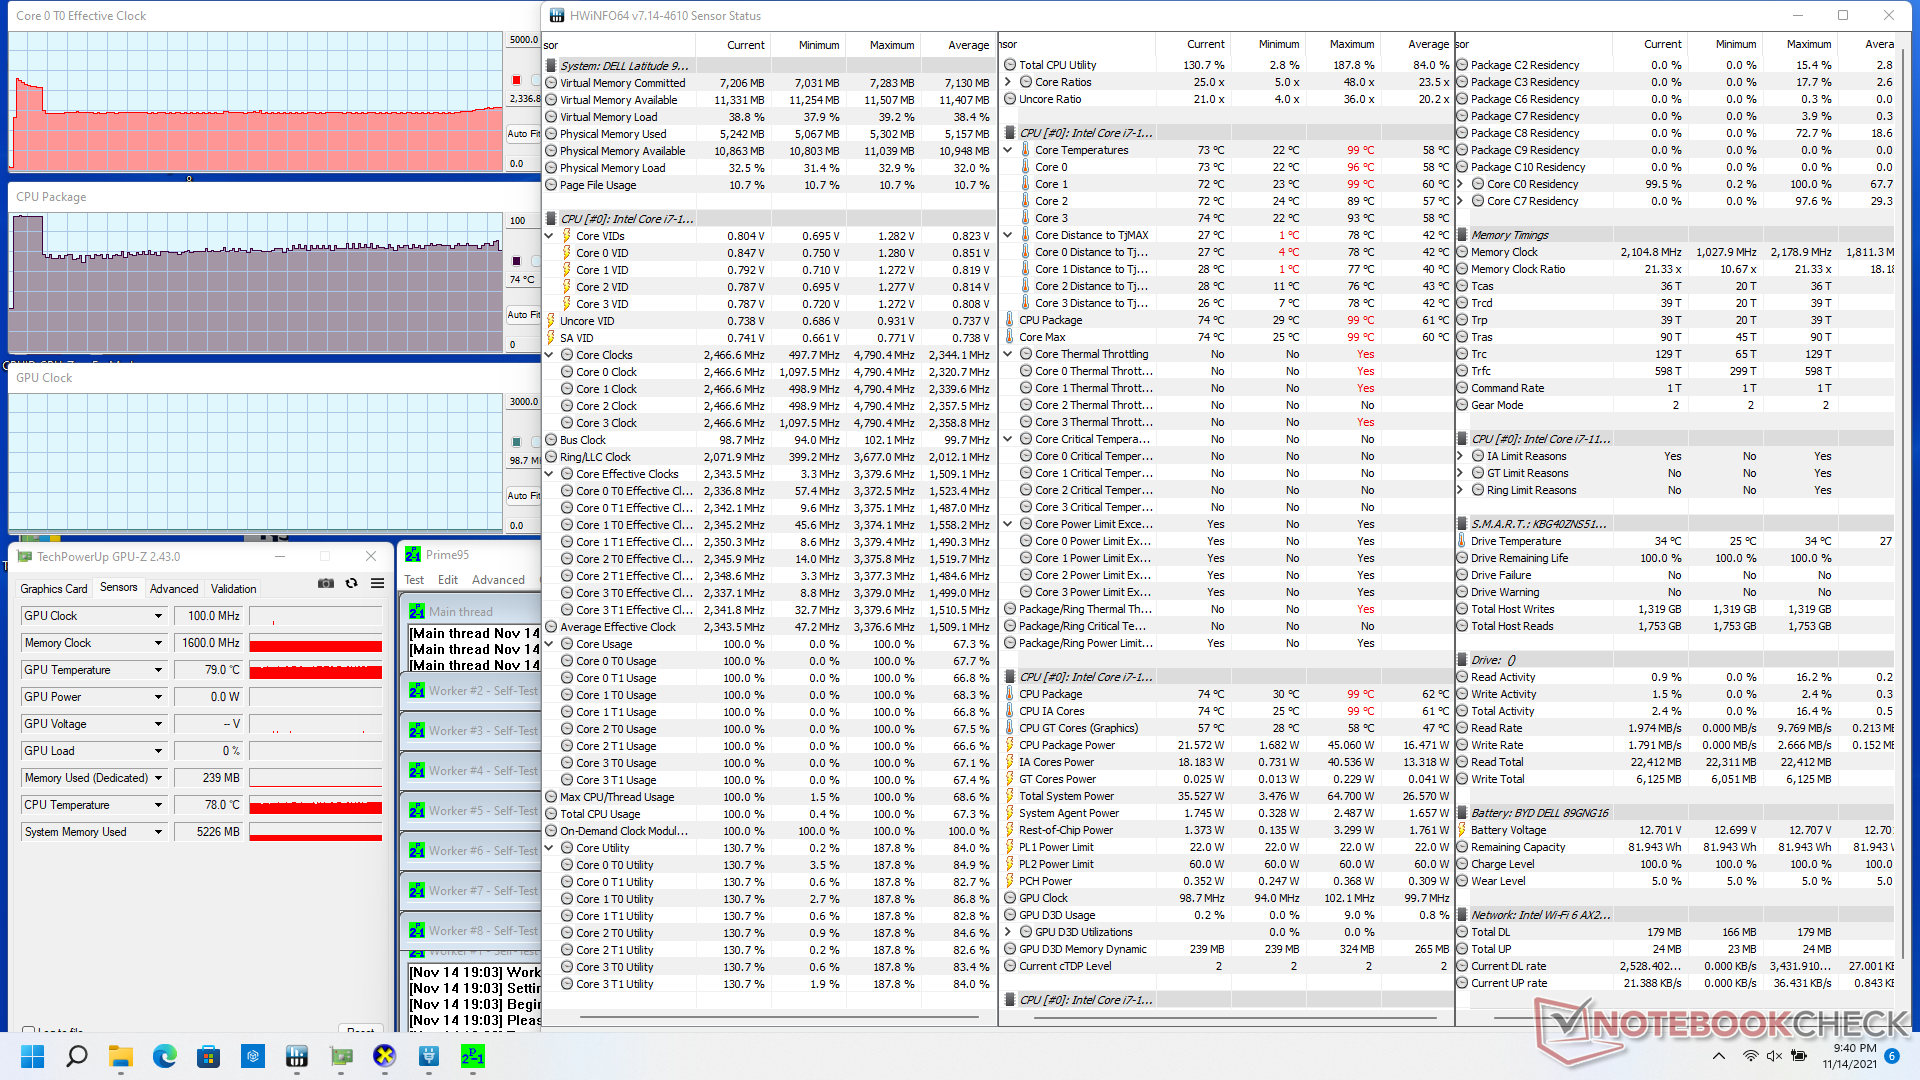
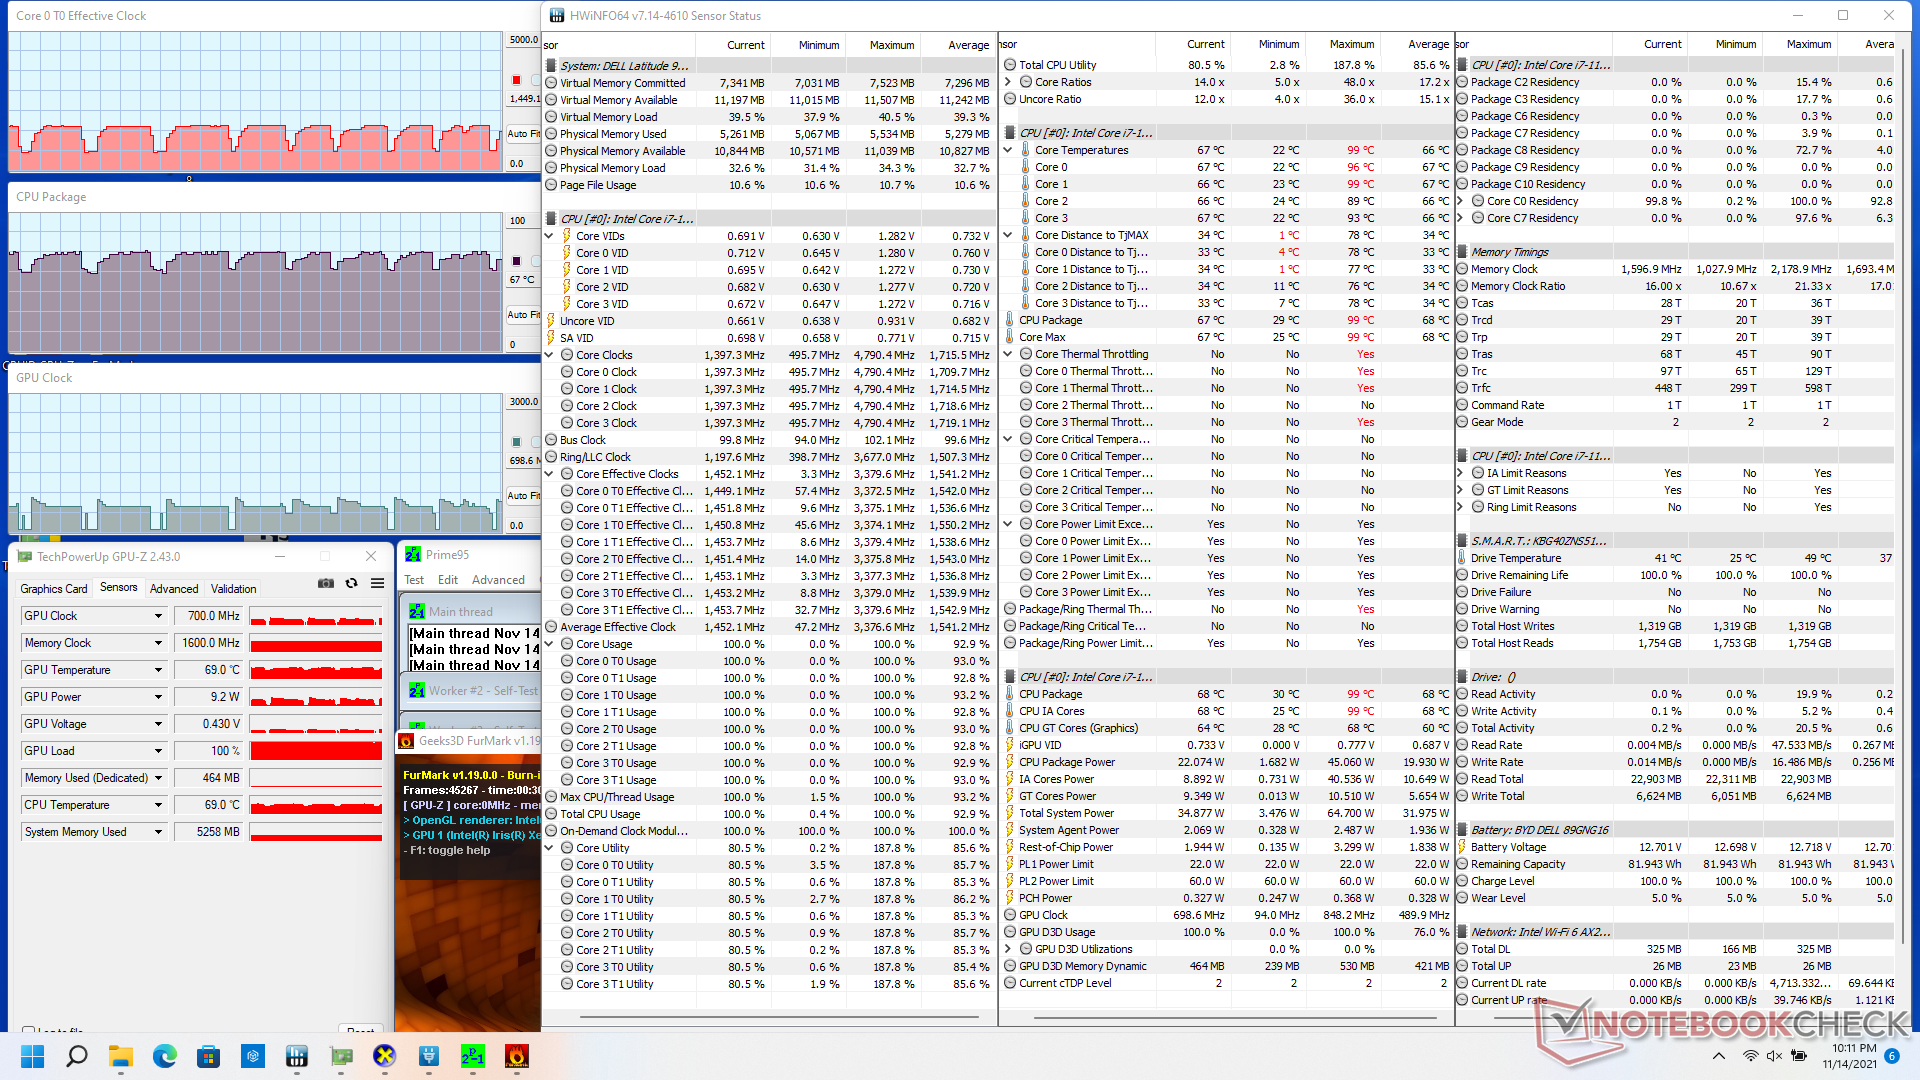
| Fréquence CPU(GHz) | Fréquence GPU(MHz) | Température CPUmoyenne(°C) |
| Système au repos | - | - |
| Prime95 Stress | 2.2 | -- |
| Prime95+ FurMark Stress | 0.6 - 1.7 | 100 - 800 |
| Witcher 3 Stress | 0.5 - 1.3 | 500 - 1200 |
Haut-parleurs
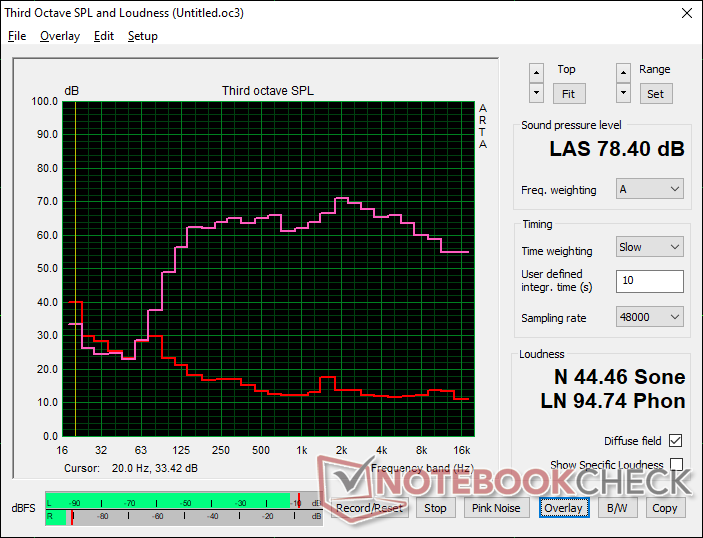
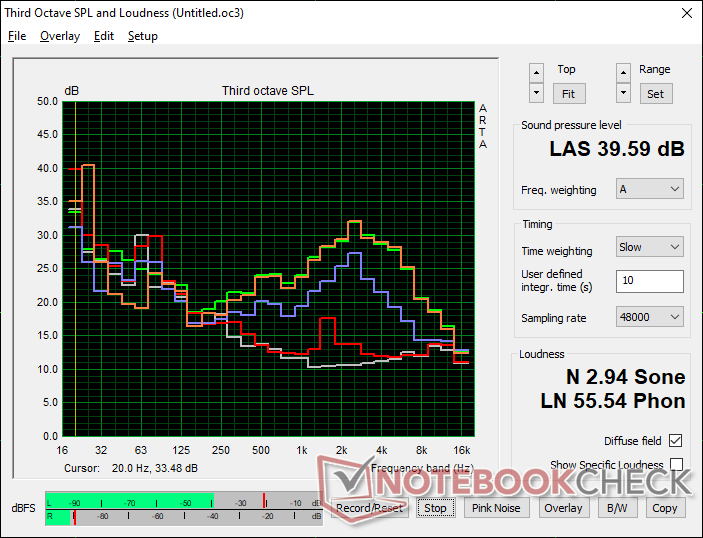
Dell Latitude 15 9520 2-in-1 analyse audio
(±) | le niveau sonore du haut-parleur est moyen mais bon (78.4# dB)
Basses 100 - 315 Hz
(+) | bonne basse - seulement 4.4% loin de la médiane
(±) | la linéarité des basses est moyenne (9.4% delta à la fréquence précédente)
Médiums 400 - 2000 Hz
(+) | médiane équilibrée - seulement 2.3% de la médiane
(+) | les médiums sont linéaires (4.5% delta à la fréquence précédente)
Aiguës 2 - 16 kHz
(+) | des sommets équilibrés - à seulement 3.3% de la médiane
(+) | les aigus sont linéaires (3.9% delta à la fréquence précédente)
Globalement 100 - 16 000 Hz
(+) | le son global est linéaire (9.5% différence à la médiane)
Par rapport à la même classe
» 1% de tous les appareils testés de cette catégorie étaient meilleurs, 0% similaires, 99% pires
» Le meilleur avait un delta de 7%, la moyenne était de 21%, le pire était de 53%.
Par rapport à tous les appareils testés
» 4% de tous les appareils testés étaient meilleurs, 1% similaires, 95% pires
» Le meilleur avait un delta de 4%, la moyenne était de 23%, le pire était de 134%.
Apple MacBook 12 (Early 2016) 1.1 GHz analyse audio
(+) | les haut-parleurs peuvent jouer relativement fort (83.6# dB)
Basses 100 - 315 Hz
(±) | basse réduite - en moyenne 11.3% inférieure à la médiane
(±) | la linéarité des basses est moyenne (14.2% delta à la fréquence précédente)
Médiums 400 - 2000 Hz
(+) | médiane équilibrée - seulement 2.4% de la médiane
(+) | les médiums sont linéaires (5.5% delta à la fréquence précédente)
Aiguës 2 - 16 kHz
(+) | des sommets équilibrés - à seulement 2% de la médiane
(+) | les aigus sont linéaires (4.5% delta à la fréquence précédente)
Globalement 100 - 16 000 Hz
(+) | le son global est linéaire (10.2% différence à la médiane)
Par rapport à la même classe
» 7% de tous les appareils testés de cette catégorie étaient meilleurs, 2% similaires, 90% pires
» Le meilleur avait un delta de 5%, la moyenne était de 18%, le pire était de 53%.
Par rapport à tous les appareils testés
» 5% de tous les appareils testés étaient meilleurs, 1% similaires, 94% pires
» Le meilleur avait un delta de 4%, la moyenne était de 23%, le pire était de 134%.
Gestion de l'énergie
Consommation d'énergie
L'exécution de 3DMark 06 ne consommerait que 44 W sur notre Latitude 9520 2-in-1, contre 46 W sur le Latitude 9510 2-in-1, malgré l'augmentation massive des performances graphiques sur le nouveau modèle. Ainsi, les propriétaires bénéficient d'une augmentation moyenne de 3x des performances du GPU dans la même enveloppe énergétique. L'augmentation des performances par watt d'une année sur l'autre ne peut être sous-estimée.
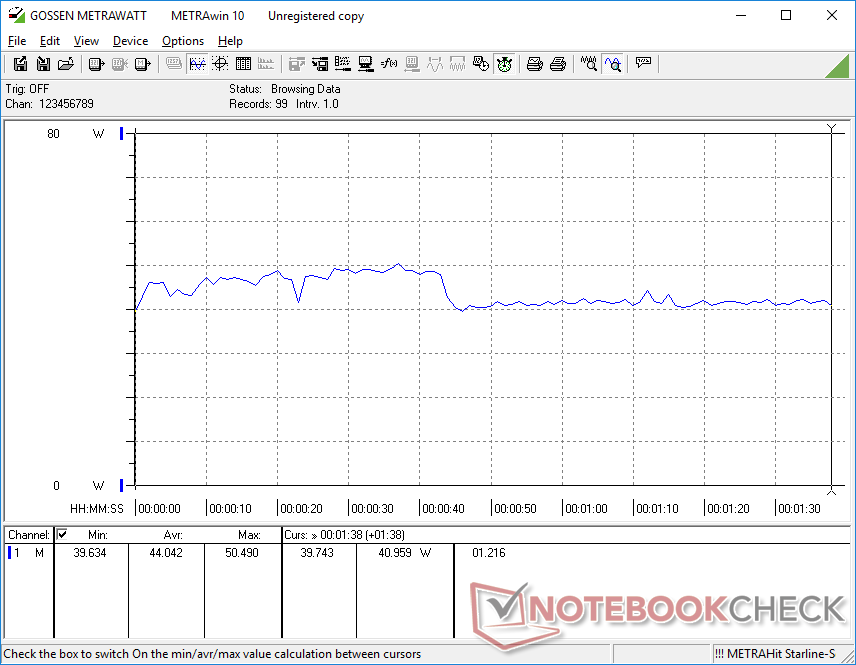
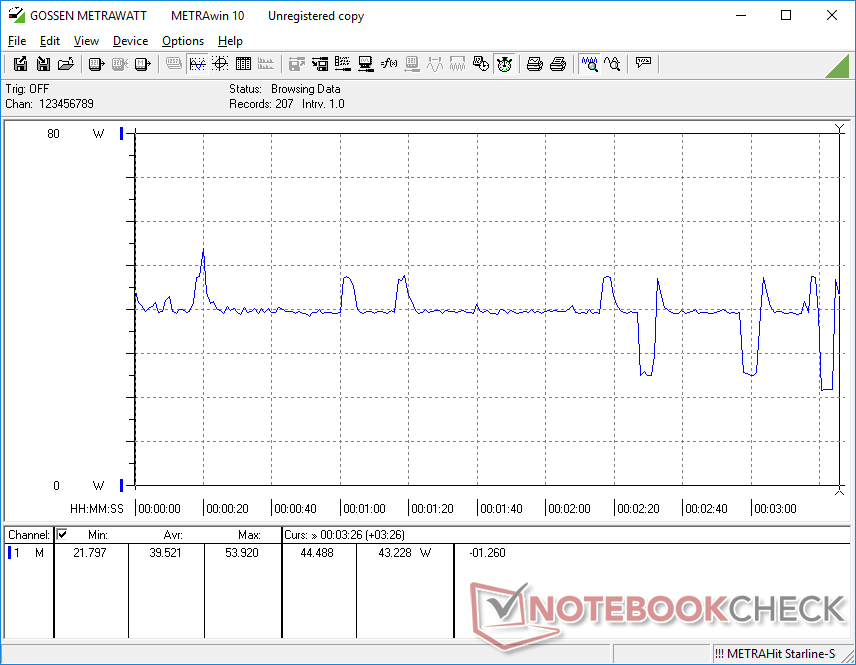
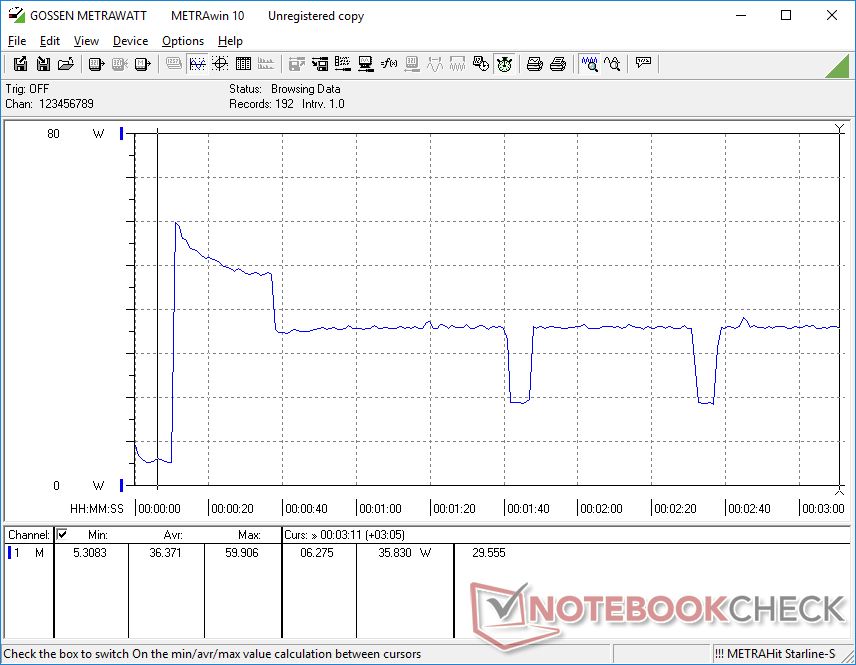
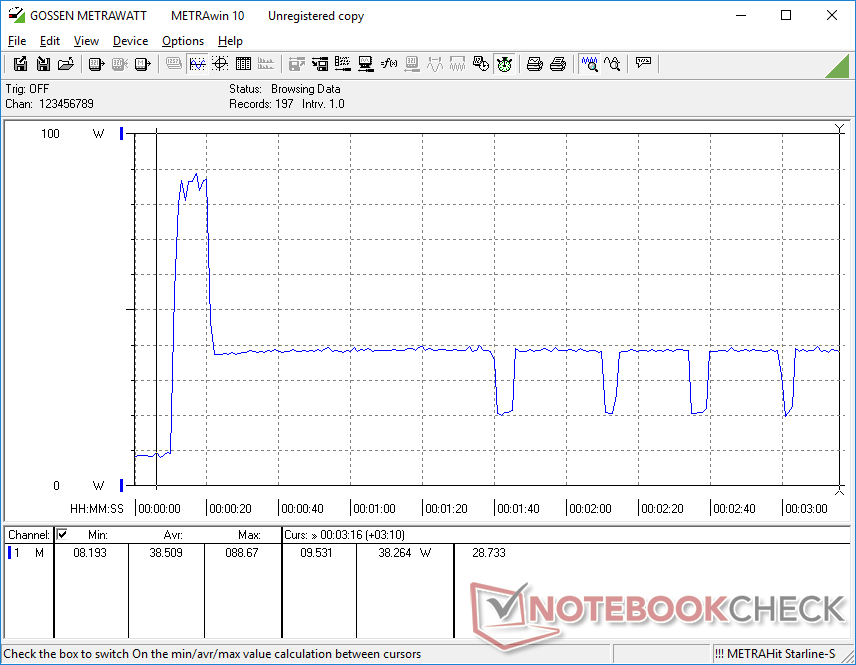
Malheureusement, les performances instables du GPU mentionnées ci-dessus sont reflétées par des taux de consommation d'énergie instables, comme le montrent les graphiques ci-dessous. Lors de l'exécution Witcher 3 pour représenter les charges de jeu, la consommation varie entre 21 W et 40 W alors qu'elle reste stable à seulement 34 W sur le HP EliteBook 850 G8 équipé du même processeur Core i7-1165G7.
Nous avons pu enregistrer une consommation maximale de 88,7 W sur le petit adaptateur secteur de 90 W (~13 x 6,6 x 2,3 cm). Le système est incapable de maintenir ce taux pendant plus de quelques secondes en raison de limitations thermiques.
| Éteint/en veille | |
| Au repos | |
| Fortement sollicité |
|
Légende:
min: | |
| Dell Latitude 15 9520 2-in-1 i7-1185G7, Iris Xe G7 96EUs, Toshiba KBG40ZNS512G NVMe, IPS, 1920x1080, 15" | Dell Latitude 9510 2-in-1 i7-10810U, UHD Graphics 620, Toshiba KBG40ZNS512G NVMe, IPS, 1920x1080, 15" | HP EliteBook 850 G8 3C7Z8EA i7-1165G7, Iris Xe G7 96EUs, Samsung PM981a MZVLB1T0HBLR, I, 1920x1080, 15.6" | Lenovo ThinkPad L15 G2 AMD R5 5600U, Vega 7, SK Hynix HFS512 GDE9X081N, IPS LED, 1920x1080, 15.6" | MSI Summit B15 A11M i7-1165G7, Iris Xe G7 96EUs, Kingston OM8PCP31024F, IPS, 1920x1080, 15.6" | Microsoft Surface Laptop 4 15 AMD TFF_00028 R7 4980U, Vega 8, SK Hynix BC511 HFM512GDJTNI, IPS, 2496x1664, 15" | |
|---|---|---|---|---|---|---|
| Power Consumption | 8% | -27% | -14% | -15% | -14% | |
| Idle Minimum * (Watt) | 2.6 | 2.1 19% | 5.8 -123% | 4.57 -76% | 4.2 -62% | 3.6 -38% |
| Idle Average * (Watt) | 5 | 4.6 8% | 8.4 -68% | 8.2 -64% | 7.7 -54% | 6.5 -30% |
| Idle Maximum * (Watt) | 7.1 | 5.3 25% | 9.9 -39% | 9.3 -31% | 8.4 -18% | 8.9 -25% |
| Load Average * (Watt) | 44 | 45.8 -4% | 33 25% | 31.9 27% | 37.8 14% | 46.5 -6% |
| Witcher 3 ultra * (Watt) | 39.5 | 34.3 13% | 34.5 13% | 36.6 7% | 43.4 -10% | |
| Load Maximum * (Watt) | 88.7 | 96.3 -9% | 60 32% | 47.4 47% | 67.5 24% | 64.9 27% |
* ... Moindre est la valeur, meilleures sont les performances
Power Consumption Witcher 3 / Stresstest
Autonomie de la batterie
Les durées d'exécution sont inférieures de quelques heures à celles que nous avons enregistrées sur le modèle de l'année dernière, malgré des batteries identiques de 88 Wh. Malgré tout, plus de 14 heures d'utilisation du WLAN dans le monde réel, ce n'est pas négligeable et c'est bien au-dessus de la moyenne pour cette catégorie de taille
Dell propose des modèles avec des batteries plus petites de 46 Wh pour les utilisateurs qui n'ont pas peur de sacrifier l'autonomie pour une unité plus légère
| Dell Latitude 15 9520 2-in-1 i7-1185G7, Iris Xe G7 96EUs, 88 Wh | Dell Latitude 9510 2-in-1 i7-10810U, UHD Graphics 620, 88 Wh | HP EliteBook 850 G8 3C7Z8EA i7-1165G7, Iris Xe G7 96EUs, 56 Wh | Lenovo ThinkPad L15 G2 AMD R5 5600U, Vega 7, 45 Wh | MSI Summit B15 A11M i7-1165G7, Iris Xe G7 96EUs, 52 Wh | Microsoft Surface Laptop 4 15 AMD TFF_00028 R7 4980U, Vega 8, 47.4 Wh | |
|---|---|---|---|---|---|---|
| Autonomie de la batterie | 26% | -43% | -47% | -55% | -30% | |
| WiFi v1.3 (h) | 14.8 | 18.7 26% | 8.5 -43% | 7.8 -47% | 6.6 -55% | 10.4 -30% |
| Reader / Idle (h) | 59 | 18.4 | ||||
| Load (h) | 4 | 2.3 | 1 | 2.5 | ||
| H.264 (h) | 6.6 | 14.8 |
Points positifs
Points négatifs
Verdict

La Latitude 9520 2-en-1 offre des avantages significatifs en termes de performances par rapport à la Latitude 9510 2-en-1 sur papier. L'ancienne UHD Graphics 620 est devenue obsolète maintenant que l'Iris Xe se répand. Dans la pratique, cependant, il y a des mises en garde que les acheteurs potentiels ne devraient pas ignorer.
Tout d'abord, le GPU Iris Xe du nouveau Latitude fonctionne à des fréquences d'horloge cycliques, ce qui entraîne des fréquences d'images cycliques dans les jeux ou des performances instables lors de l'exécution de tâches gourmandes en GPU. Les fréquences d'images sont tellement élevées que certaines applications pour lesquelles des fréquences d'images régulières sont essentielles deviennent presque injouables. Nous vous recommandons de vous tourner vers d'autres ordinateurs portables Tiger Lake-U comme le MSI Summit E13 Flip ouHP EliteBook 840 Aero G8 si vous souhaitez des performances GPU plus stables et plus fiables.
Le principal argument de vente du Latitude 9520 2-en-1 par rapport au 9510 2-en-1 est sa performance graphique intégrée nettement plus rapide. Cependant, les performances graphiques inhabituellement instables du nouveau modèle peuvent rebuter de nombreux acheteurs intéressés.
Deuxièmement, les performances du processeur multithread de notre Core i7-1185G7 sont plus lentes que celles de l'ancien Core i7-10810U du Latitude 9510 2-in-1. Bien que cet inconvénient ne soit pas propre aux PC Dell, le i7-1185G7 du Latitude 9520 2-in-1 fonctionne plus lentement que sur de nombreux autres ordinateurs portables équipés du même processeur. Ainsi, le déficit de performances multithread est amplifié sur le Dell.
Les raisons de choisir le Latitude 9520 2-in-1 plutôt que le 9510 2-in-1 sont moins nombreuses que nous le souhaiterions, d'autant plus que le nouveau modèle n'offre rien de nouveau en termes de qualité d'affichage, de qualité de la webcam ou d'autonomie de la batterie. Espérons que les performances inégales du GPU pourront être corrigées lors d'une prochaine mise à jour.
Prix et disponibilité
La plupart des grands détaillants comme Amazon, Walmartet Newegg ont le Latitude 9520 2-en-1 en stock dans différentes configurations. Les utilisateurs peuvent également acheter directement auprès de Dell à partir de 2 800 dollars américains pour la version Core i5.
Dell Latitude 15 9520 2-in-1
- 11/22/2021 v7 (old)
Allen Ngo
Price comparison

