Test du MSI Summit B15 A11M : le choix de l'Iris Xe plutôt que de la GeForce MX
MSI a dévoilé sa série Summit au CES 2021, qui englobe une gamme d'ordinateurs portables conçus pour les lieux de travail, les bureaux, la création de contenu et d'autres environnements semi-professionnels à professionnels. Les modèles haut de gamme comprennent le 13,4 pouces Summit E13 et le 15,6 pouces Summit E15 qui se vendent chacun aux alentours de 2 000 dollars américains.
Le modèle que nous allons examiner ici est un modèle d'entrée de gamme de la série, le Summit B15. Contrairement aux modèles Summit E susmentionnés, le B15 n'a pas les garnitures dorées et les options de GPU discret pour un poids plus léger et un prix plus abordable. Il est par ailleurs équipé des mêmes options de processeurs de 11e génération Tiger Lake-U. Parmi ses concurrents directs, on trouve d'autres ordinateurs portables de milieu de gamme à milieu de gamme supérieur destinés aux professionnels, comme le HP Envy 15, XPG Xenia Xe, Lenovo ThinkBook 15, Microsoft Surface Laptop 4ou le LG Gram série.
Plus de commentaires sur MSI :
potential competitors in comparison
Note | Date | Modèle | Poids | Épaisseur | Taille | Résolution | Prix |
|---|---|---|---|---|---|---|---|
| 81.2 % v7 (old) | 05/21 | MSI Summit B15 A11M i7-1165G7, Iris Xe G7 96EUs | 1.5 kg | 16.9 mm | 15.60" | 1920x1080 | |
| 83.7 % v7 (old) | 02/21 | MSI Summit E15 A11SCST i7-1185G7, GeForce GTX 1650 Ti Max-Q | 1.8 kg | 16.9 mm | 15.60" | 1920x1080 | |
| 86.8 % v7 (old) | 07/20 | Dell XPS 15 9500 Core i5 i5-10300H, UHD Graphics 630 | 1.8 kg | 18 mm | 15.60" | 1920x1200 | |
| 85 % v7 (old) | 01/20 | HP Spectre X360 15-5ZV31AV i7-10510U, GeForce MX250 | 2.1 kg | 19.3 mm | 15.60" | 3840x2160 | |
| 87.5 % v7 (old) | 05/21 | ADATA XPG Xenia Xe i7-1165G7, Iris Xe G7 96EUs | 1.7 kg | 14.9 mm | 15.60" | 1920x1080 | |
| 85.2 % v7 (old) | 04/20 | Asus ZenBook 15 UX534FTC-A8190T i7-10510U, GeForce GTX 1650 Max-Q | 1.6 kg | 18.9 mm | 15.60" | 1920x1080 |
Cas
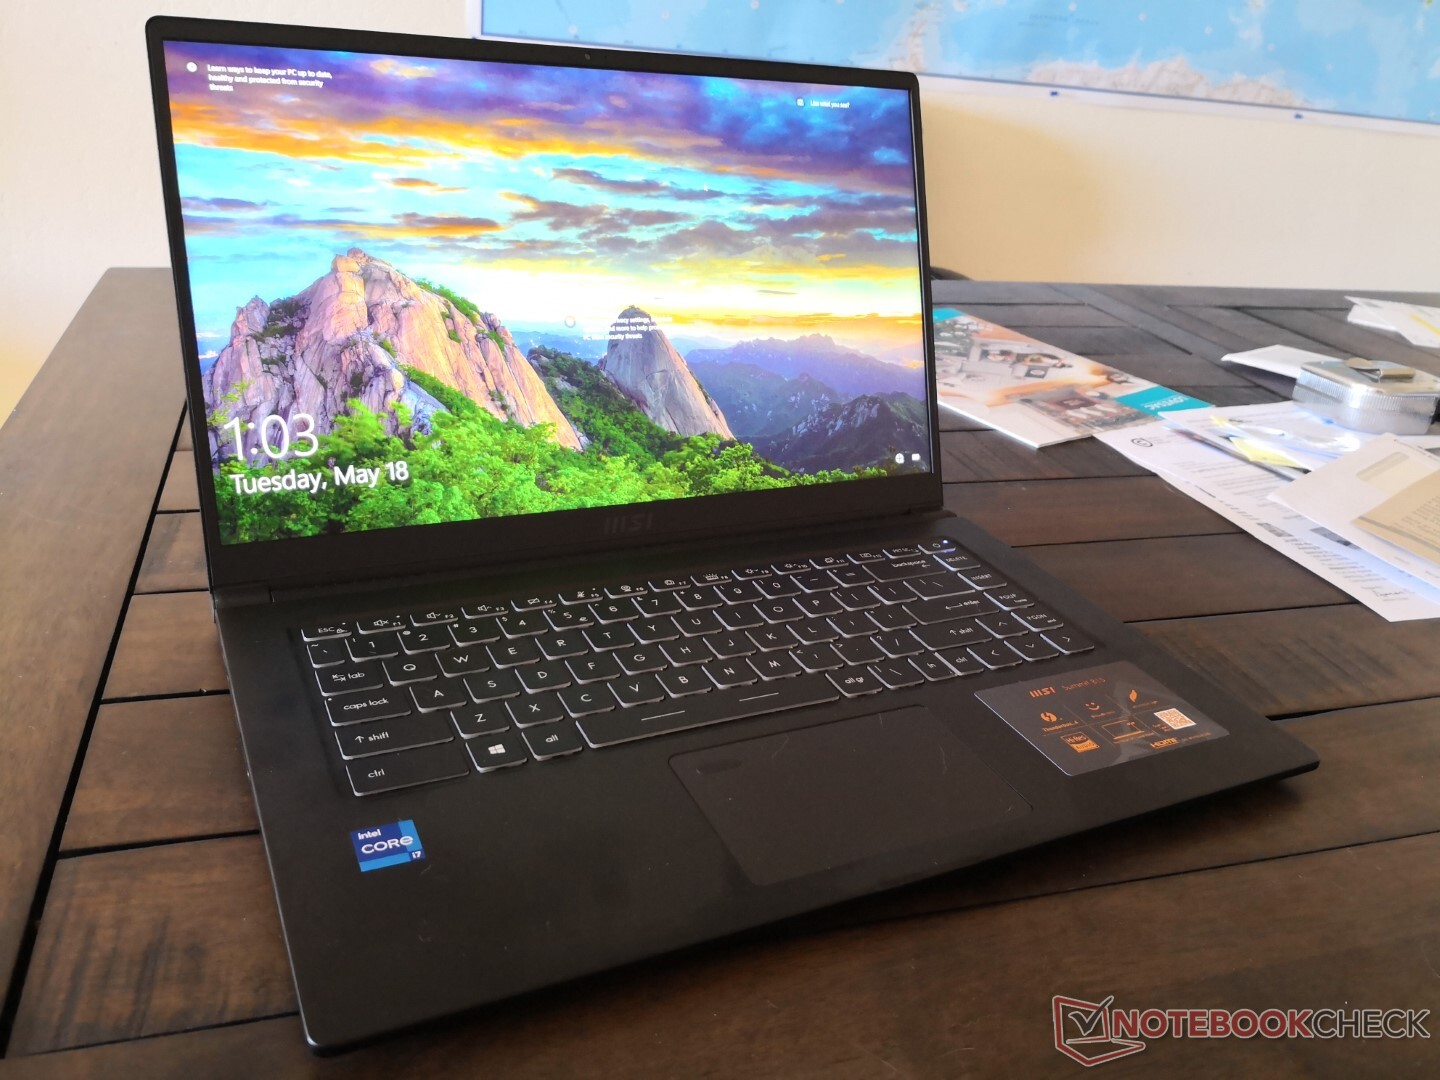
Si le Summit B15 vous semble familier, c'est parce qu'il s'agit essentiellement d'une nouvelle marque 2020 Modern 15 avec un nouveau logo doré "MSI" sur le couvercle extérieur. Son châssis et ses caractéristiques sont presque identiques à ceux du Modern 15, y compris la carte mère à l'intérieur. MSI est actuellement en train de remanier son portefeuille d'ordinateurs portables et donc les séries Modern et Prestige vieillissantes seront finalement regroupées sous la nouvelle série Summit dans un avenir proche. Ce changement devrait permettre aux clients de distinguer plus facilement les différents ordinateurs portables MSI, car la société a déjà trop de noms de modèles à gérer
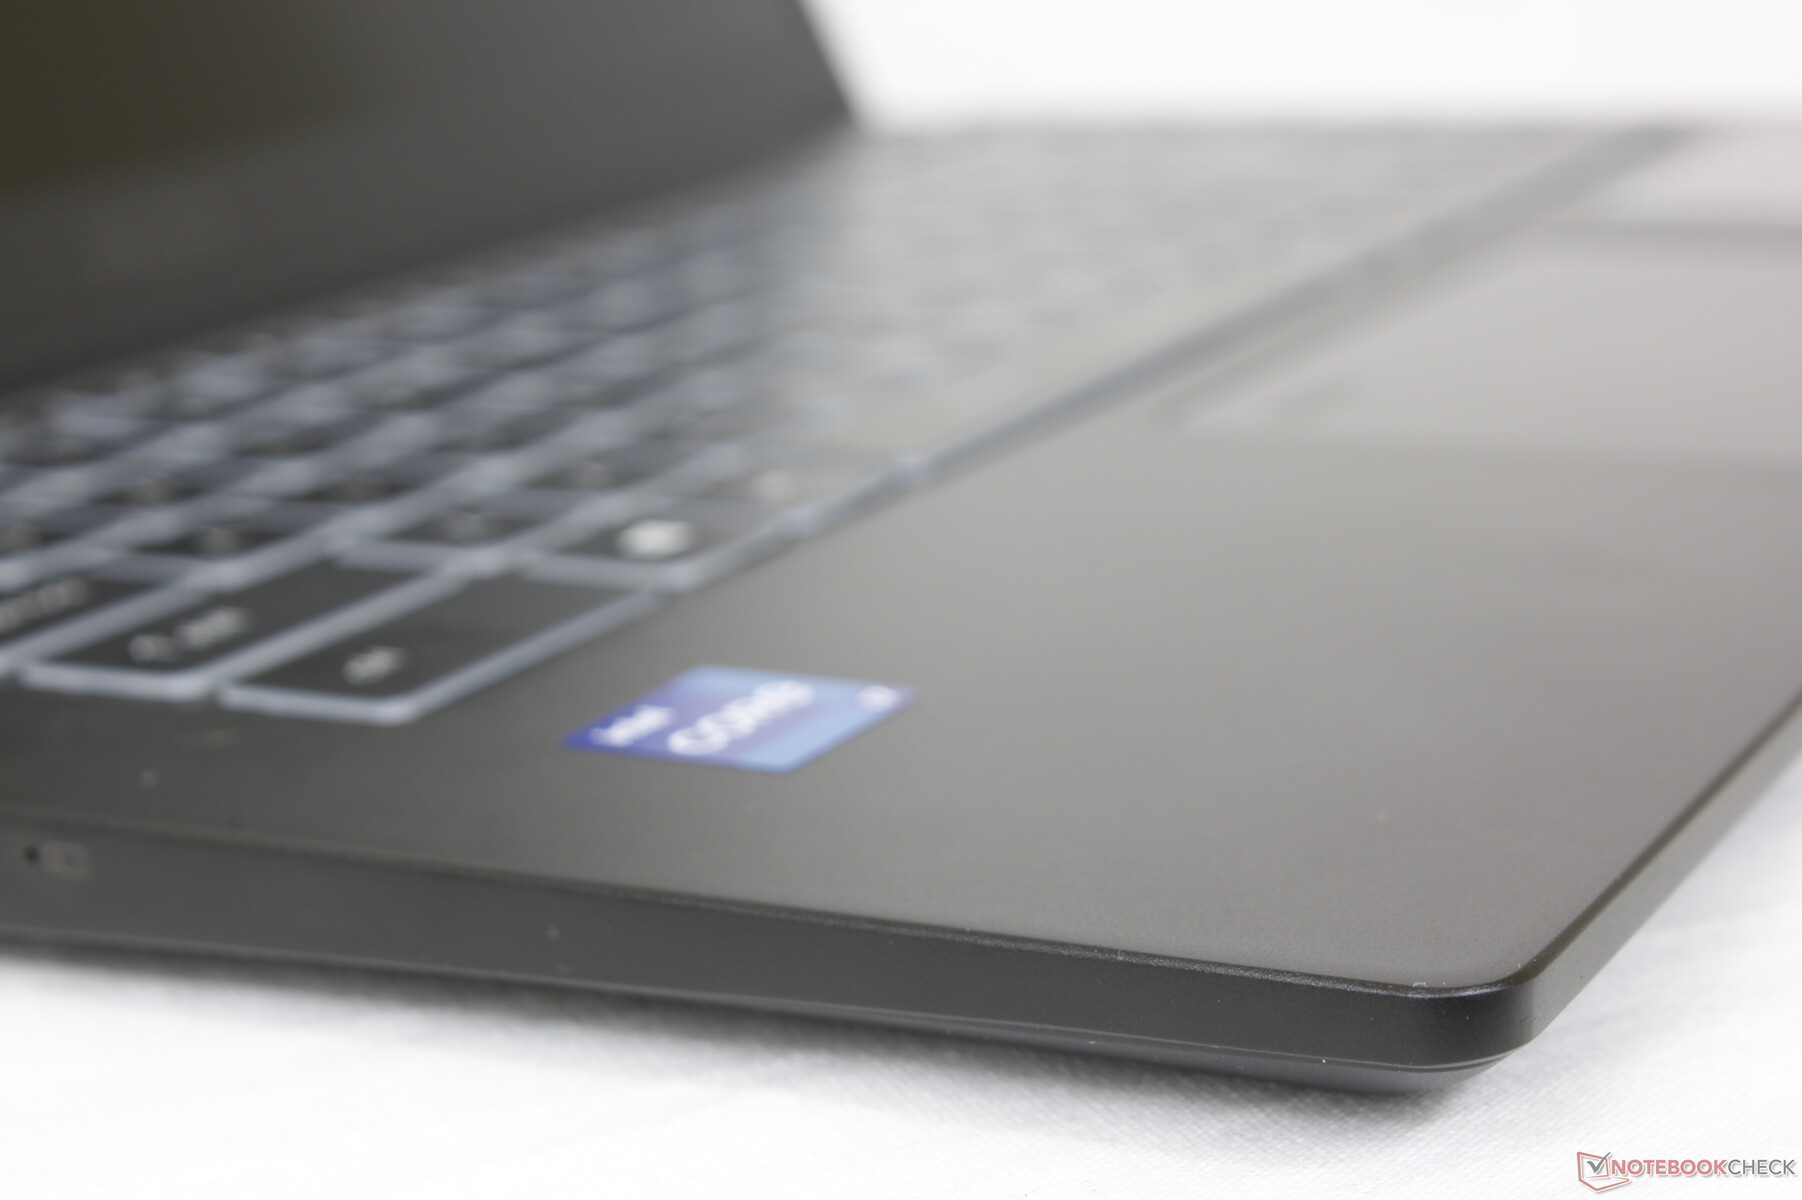
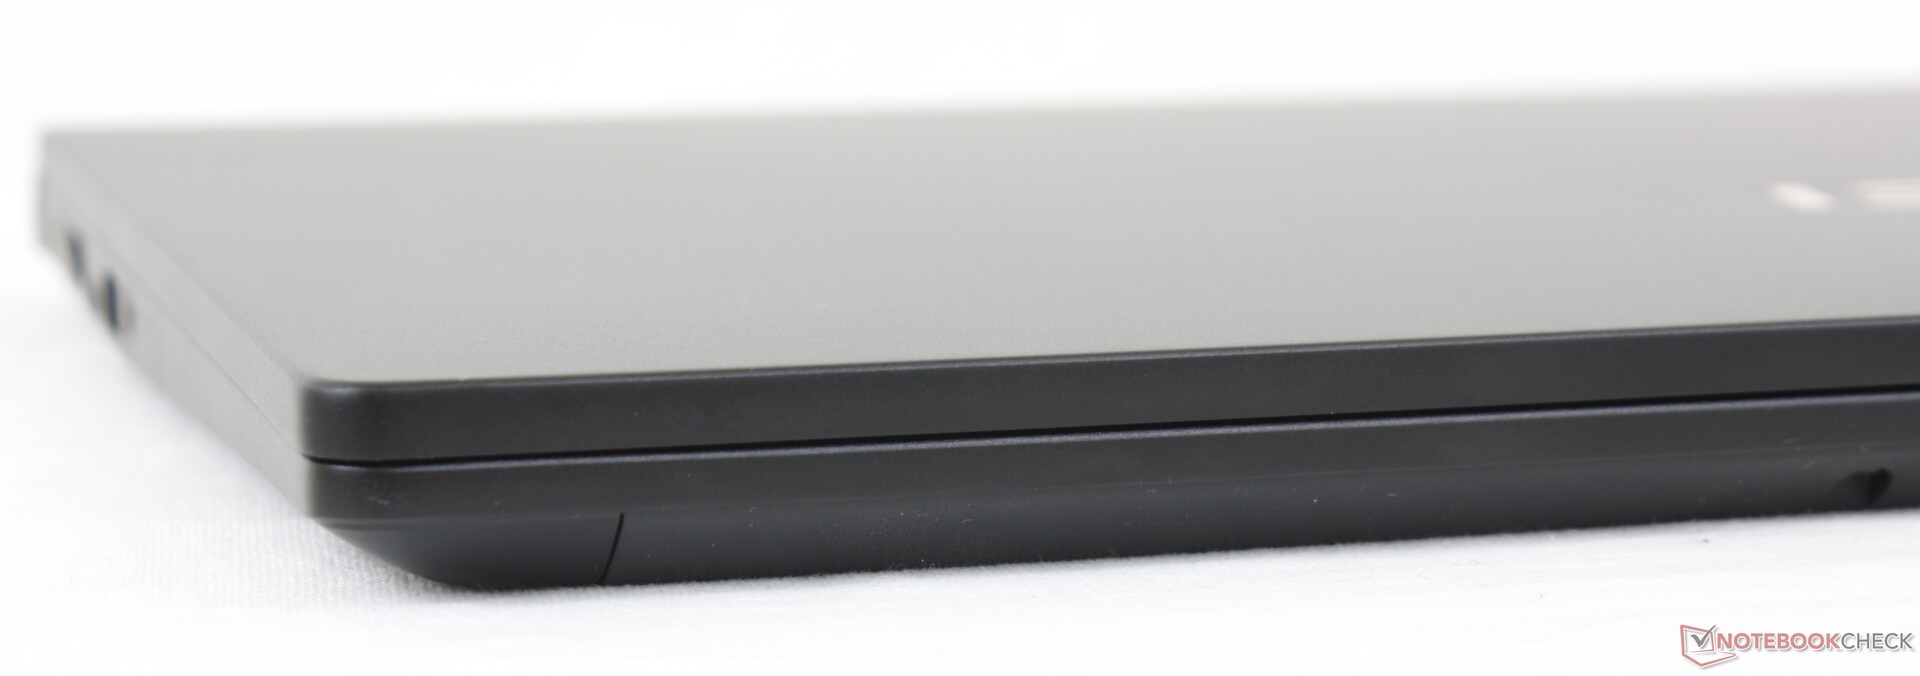
Nos impressions initiales sur le Modern 15 de l'année dernière s'appliquent ici au Summit B15. La rigidité de la base est toujours assez bonne, tandis que le couvercle fléchit un peu plus que nous ne le souhaiterions. Les ordinateurs portables professionnels complets comme le Dell Latitude, le HP EliteBook, ou le Lenovo ThinkPad sont certainement plus chers mais sont de meilleure qualité.
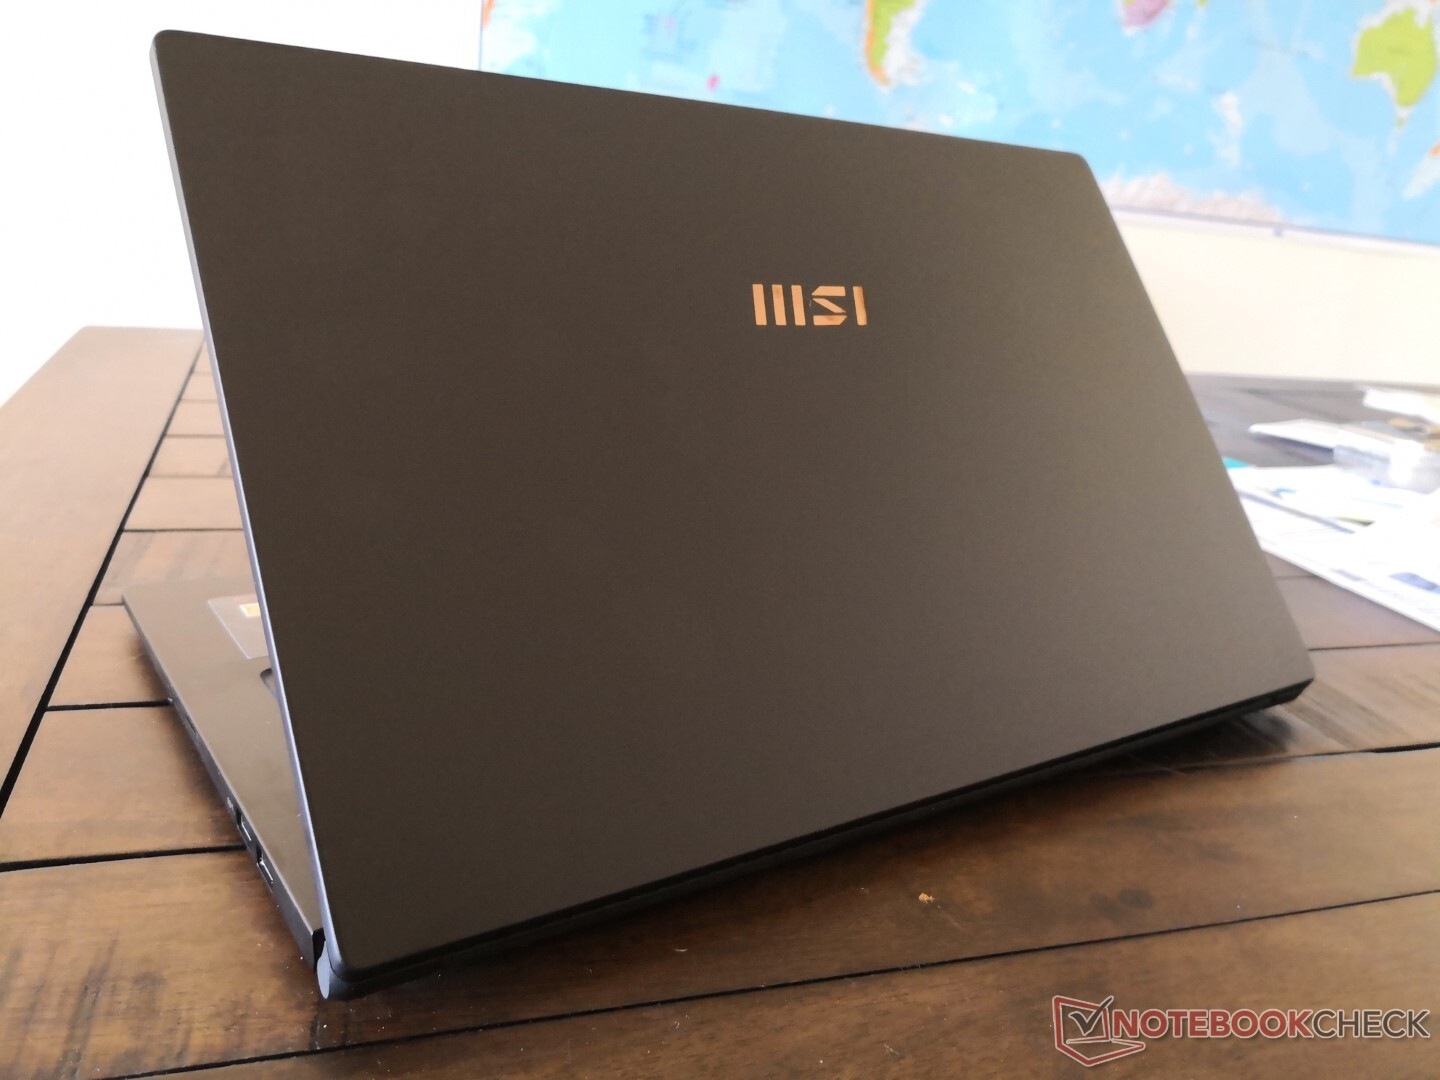
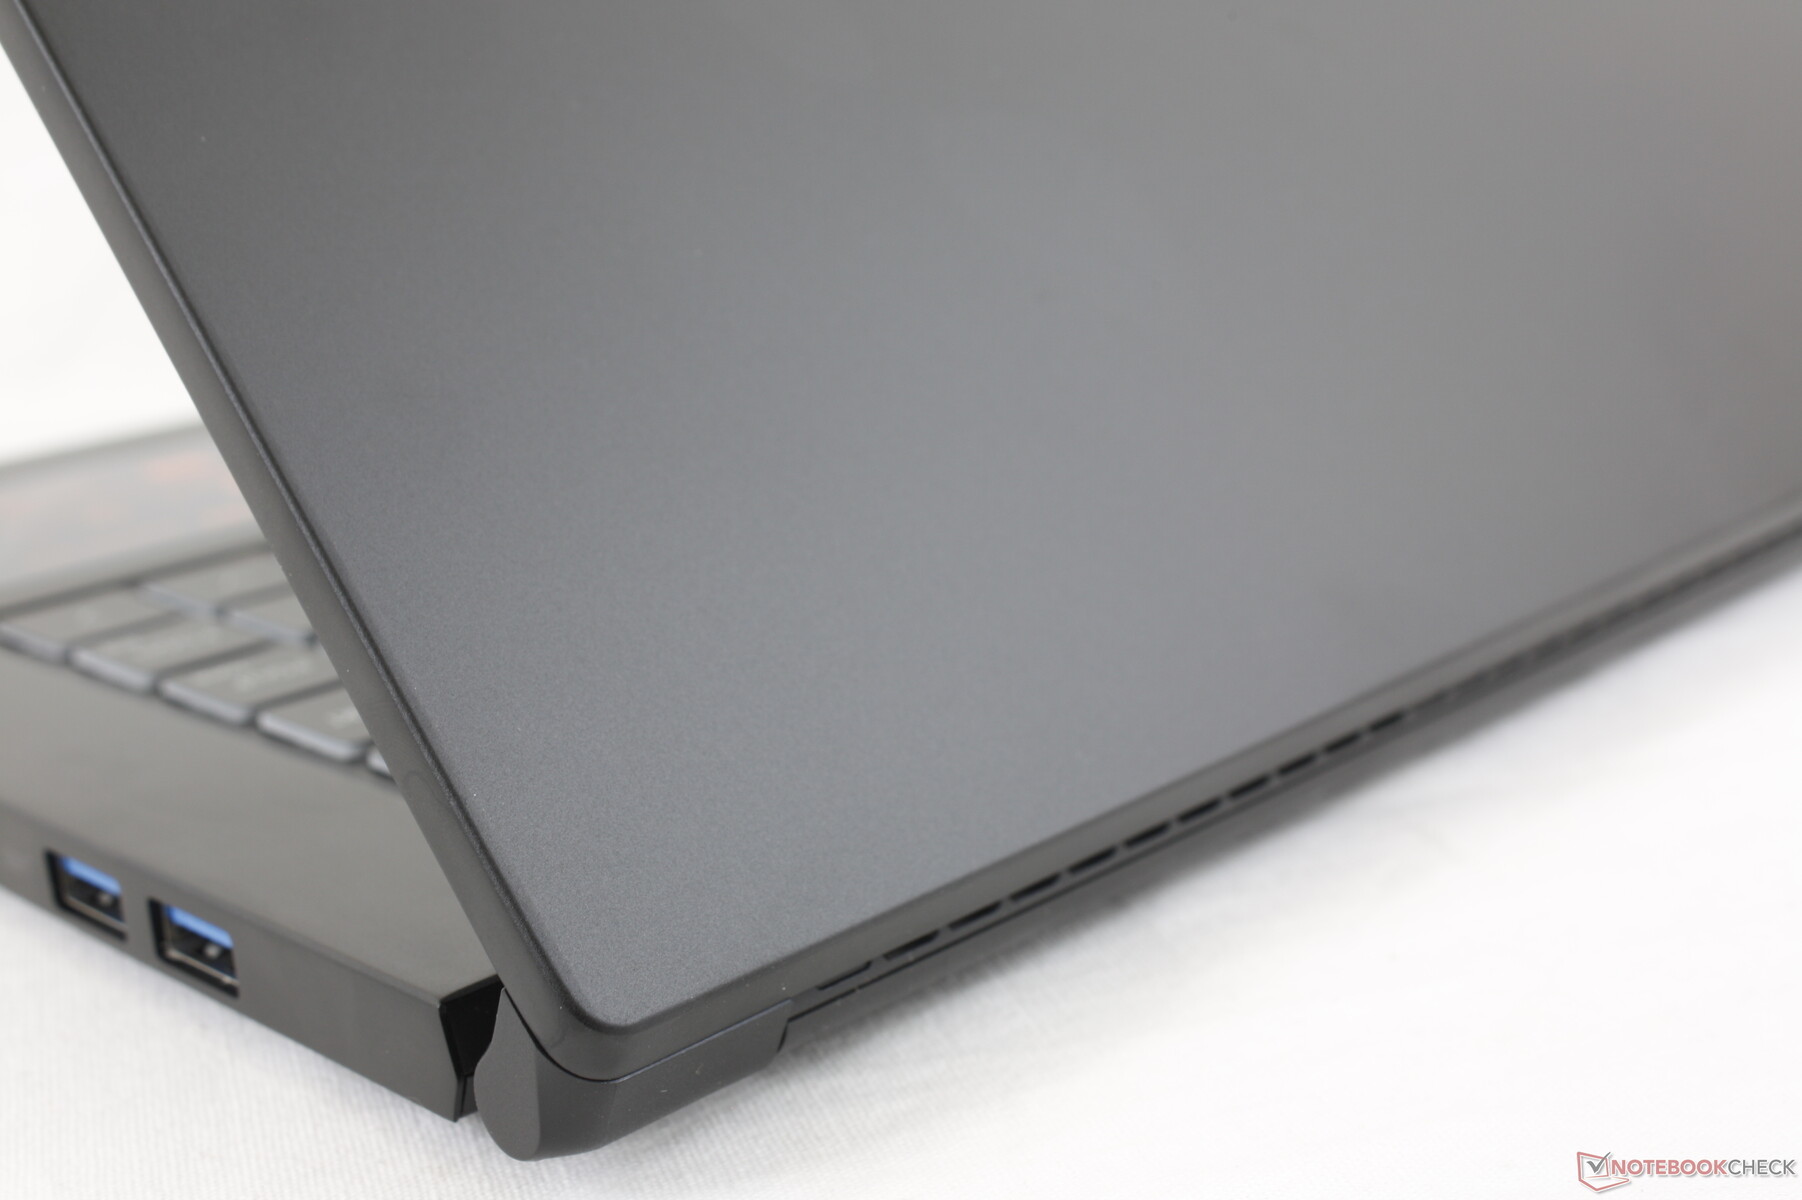
L'une des principales raisons de choisir le Summit B15 (ou Modern 15) plutôt que les alternatives de Dell, HP ou autres est son poids très léger de seulement 1,5 kg. Les concurrents Lenovo ThinkBook 15 G2 ou ADATA XPG Xenia Xe concurrents, pèsent chacun environ 200 grammes de plus, alors que leurs dimensions sont pratiquement identiques.
Connectivité
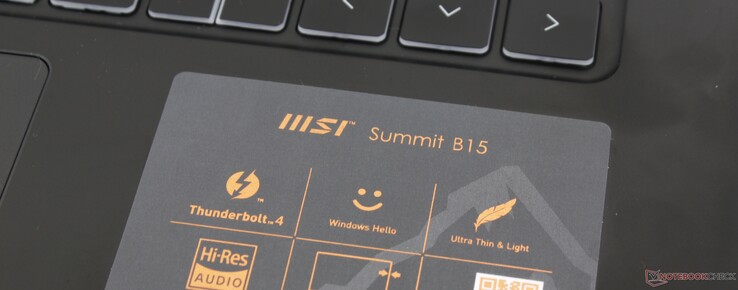
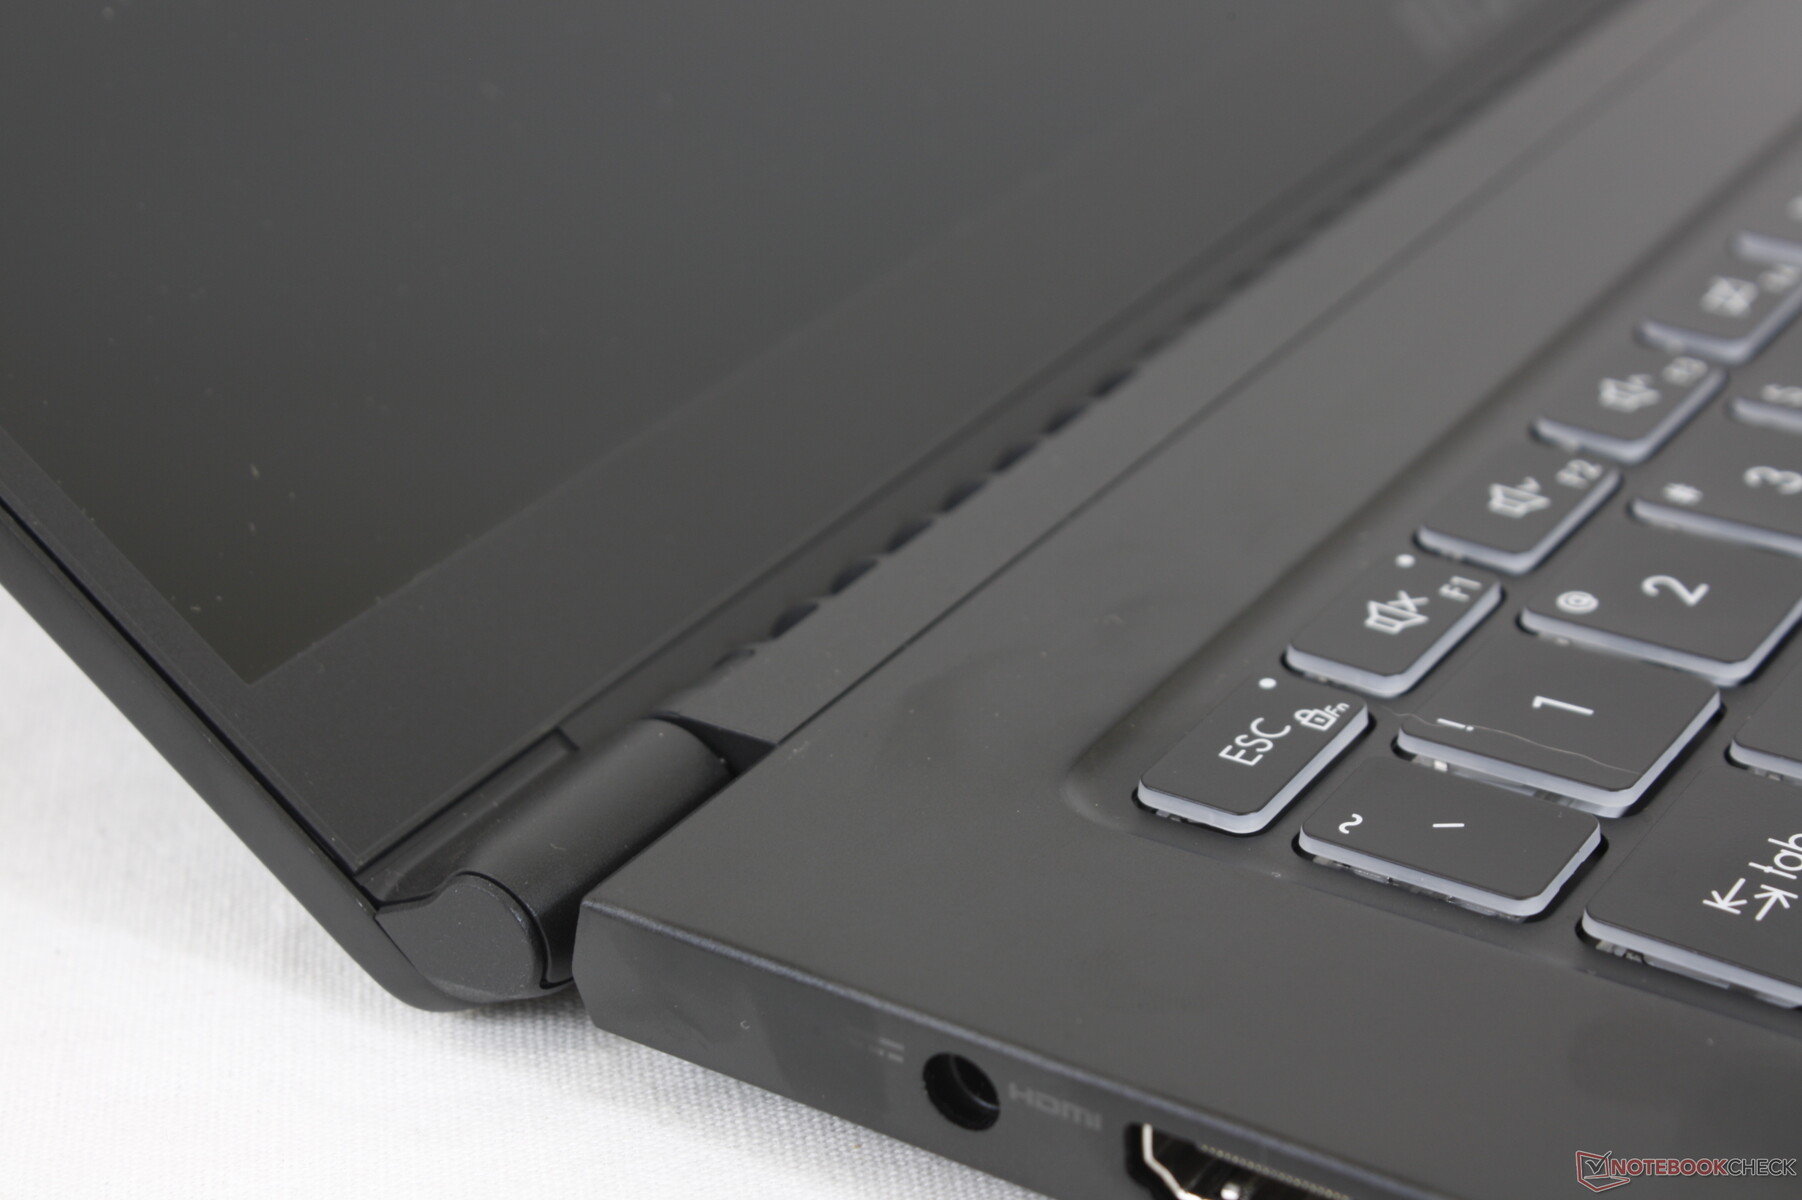
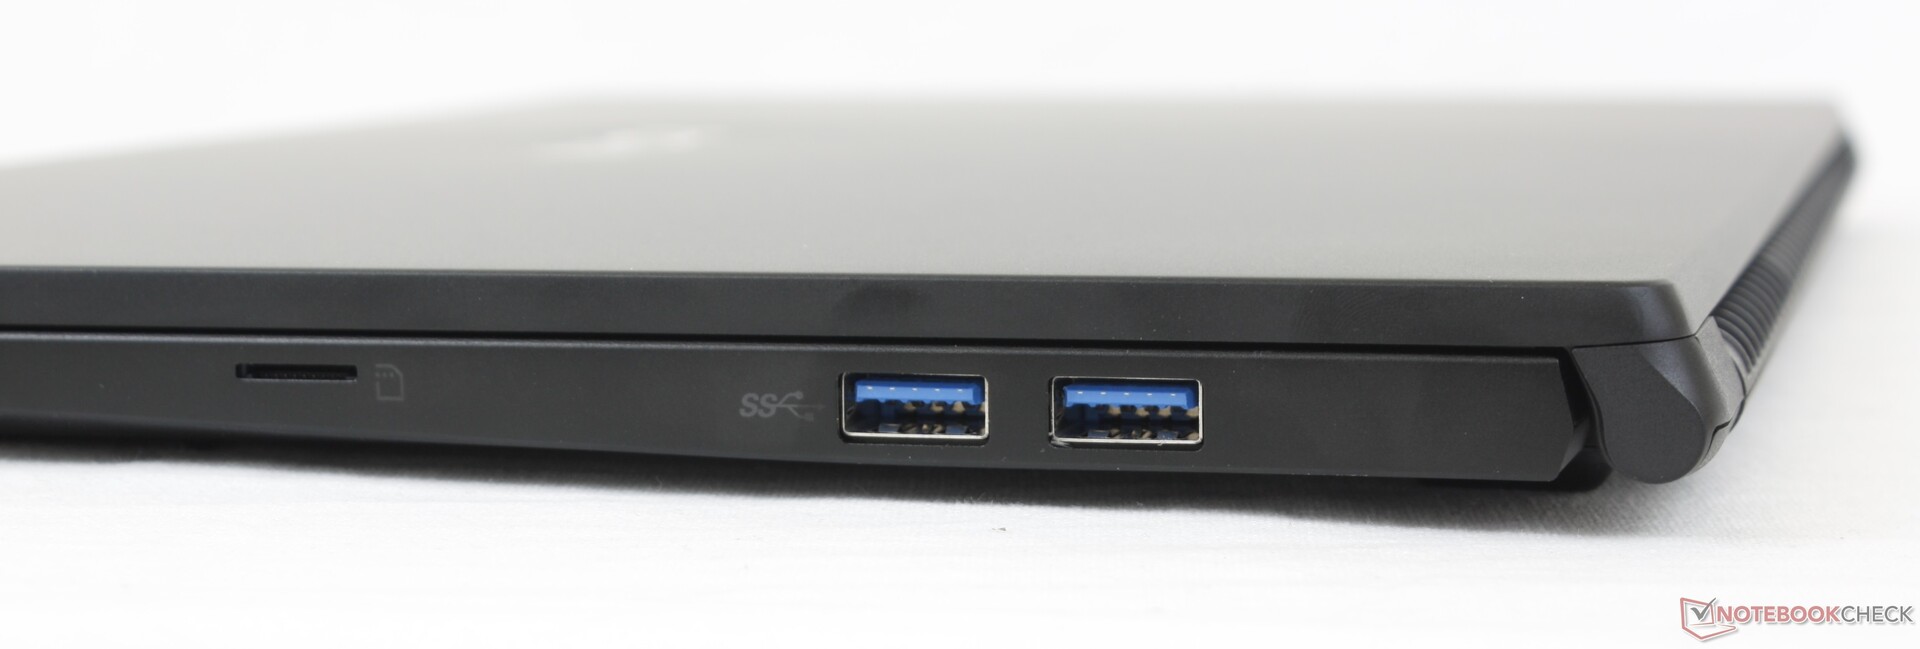
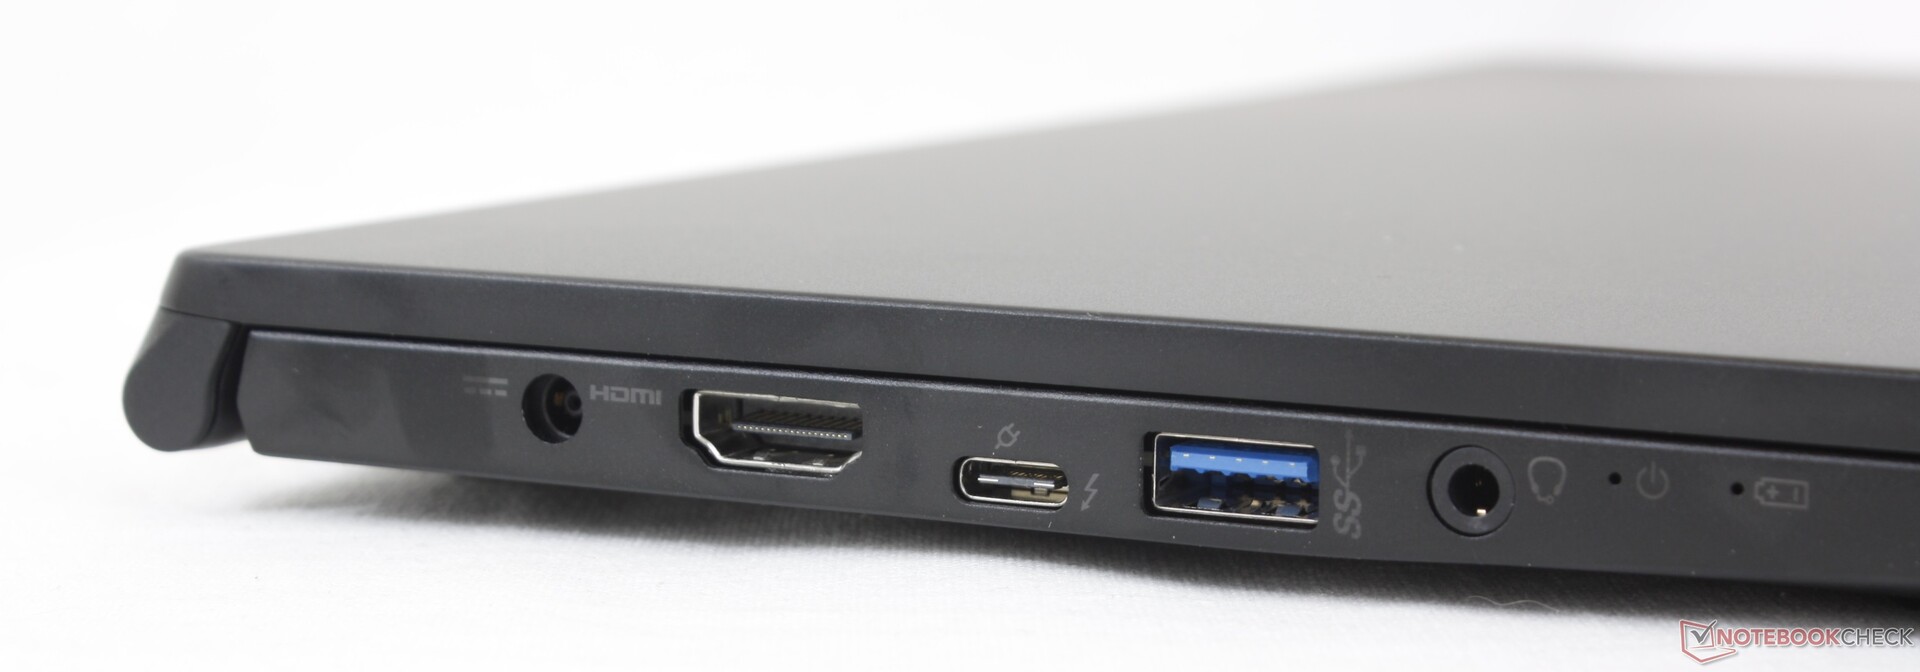
Les options de port restent inchangées par rapport au Modern 15, à l'exception de deux mises à niveau majeures : le port HDMI prend désormais en charge la sortie 4K60 tandis que le port USB-C est désormais compatible avec Thunderbolt 4. Les utilisateurs peuvent connecter des docks graphiques externes au Summit B15 alors que cela était impossible sur le Modern 15
Lecteur de carte SD
MSI a amélioré le slot MicroSD pour qu'il soit environ 6 fois plus rapide que le même slot MicroSD sur l'ancien Modern 15. Le transfert de 1 Go de photos de notre carte de test UHS-II vers le bureau prend environ 7 secondes, contre 40 secondes sur le modèle de l'année dernière.
| SD Card Reader | |
| average JPG Copy Test (av. of 3 runs) | |
| Dell XPS 15 9500 Core i5 (Toshiba Exceria Pro SDXC 64 GB UHS-II) | |
| HP Spectre X360 15-5ZV31AV (Toshiba Exceria Pro M501 UHS-II) | |
| MSI Summit B15 A11M (AV PRO microSD 128 GB V60) | |
| MSI Summit E13 Flip Evo A11MT (AV PRO microSD 128 GB V60) | |
| MSI Modern 15 A10RB (Toshiba Exceria Pro M501 UHS-II) | |
| maximum AS SSD Seq Read Test (1GB) | |
| Dell XPS 15 9500 Core i5 (Toshiba Exceria Pro SDXC 64 GB UHS-II) | |
| MSI Summit B15 A11M (AV PRO microSD 128 GB V60) | |
| HP Spectre X360 15-5ZV31AV (Toshiba Exceria Pro M501 UHS-II) | |
| MSI Summit E13 Flip Evo A11MT (AV PRO microSD 128 GB V60) | |
| MSI Modern 15 A10RB (Toshiba Exceria Pro M501 UHS-II) | |
Communication
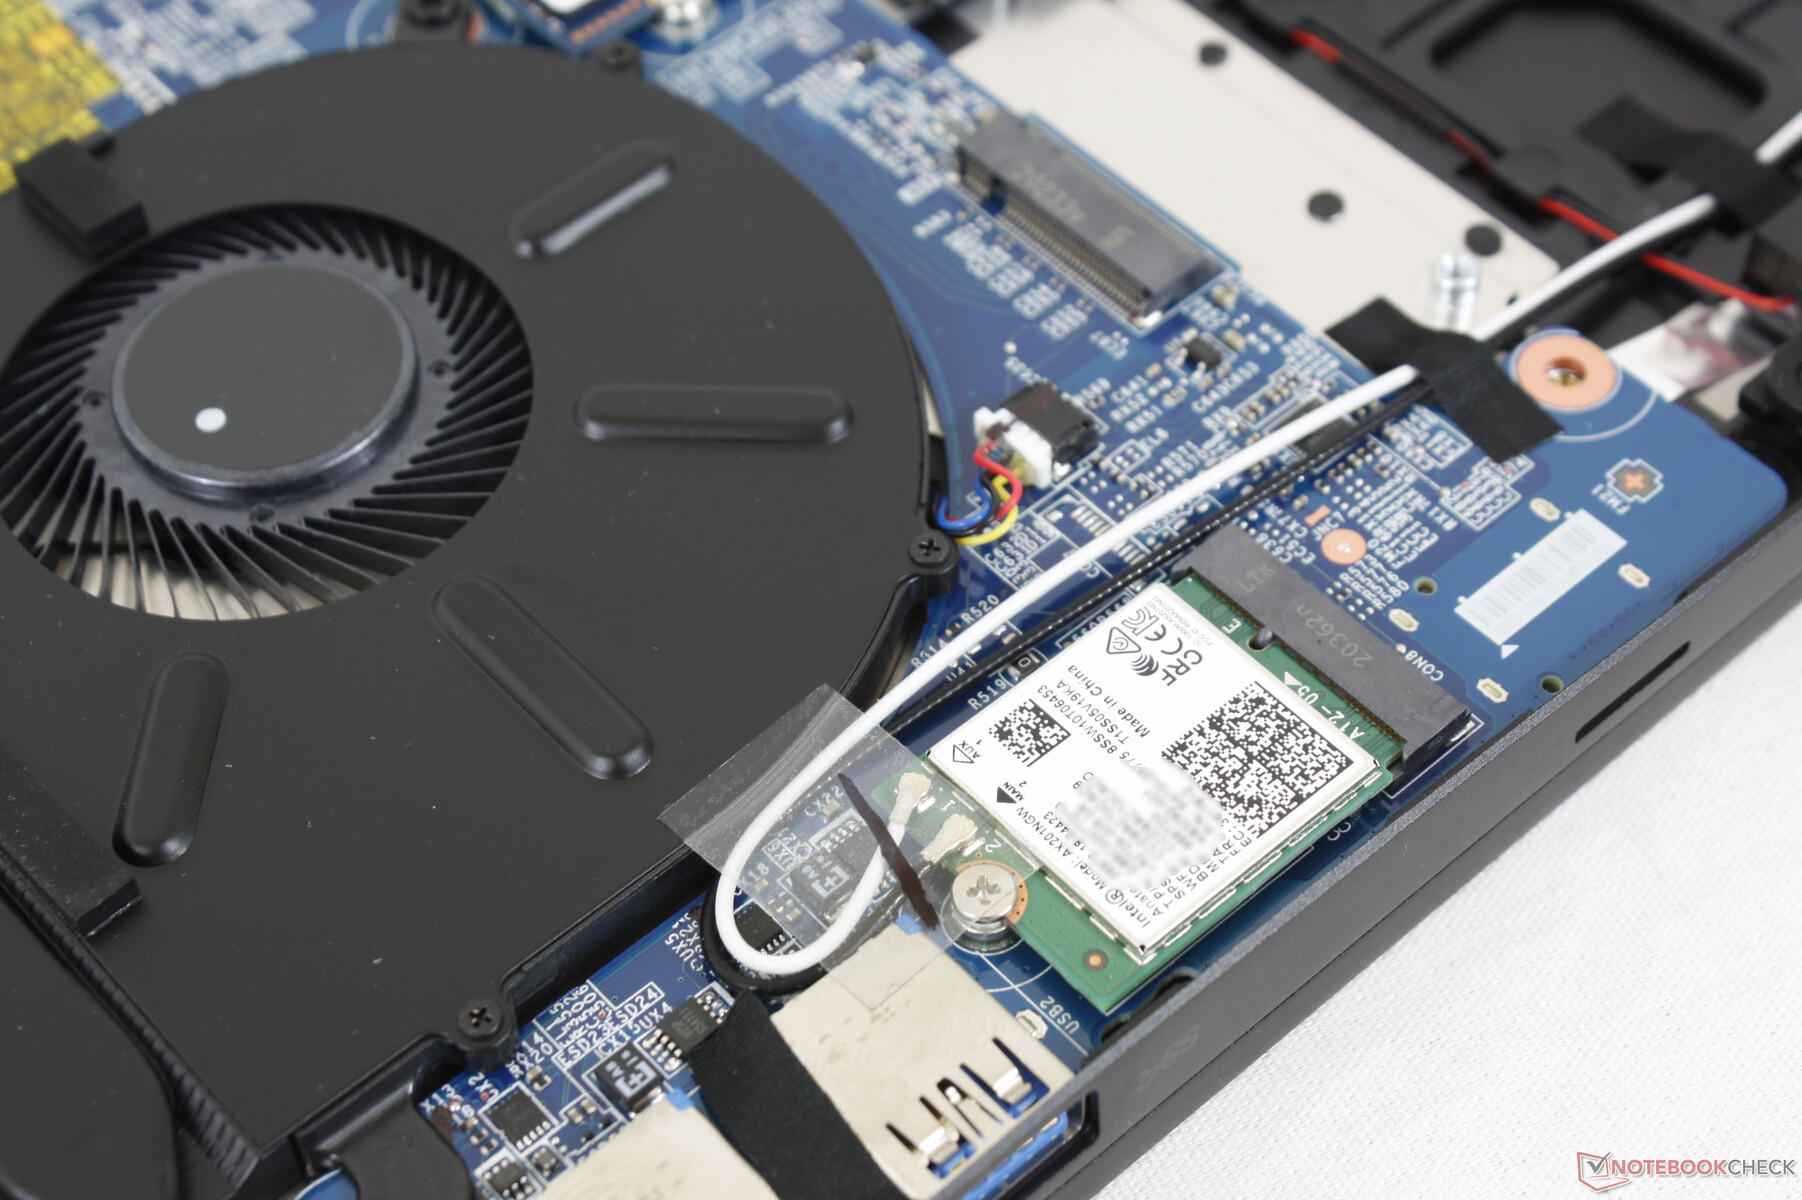
L'Intel AX201 est équipé en standard de la connectivité Wi-Fi 6 et Bluetooth 5.1. Nous n'avons rencontré aucun problème lorsque nous l'avons couplé à notre routeur Netgear RAX200.
Webcam


Maintenance
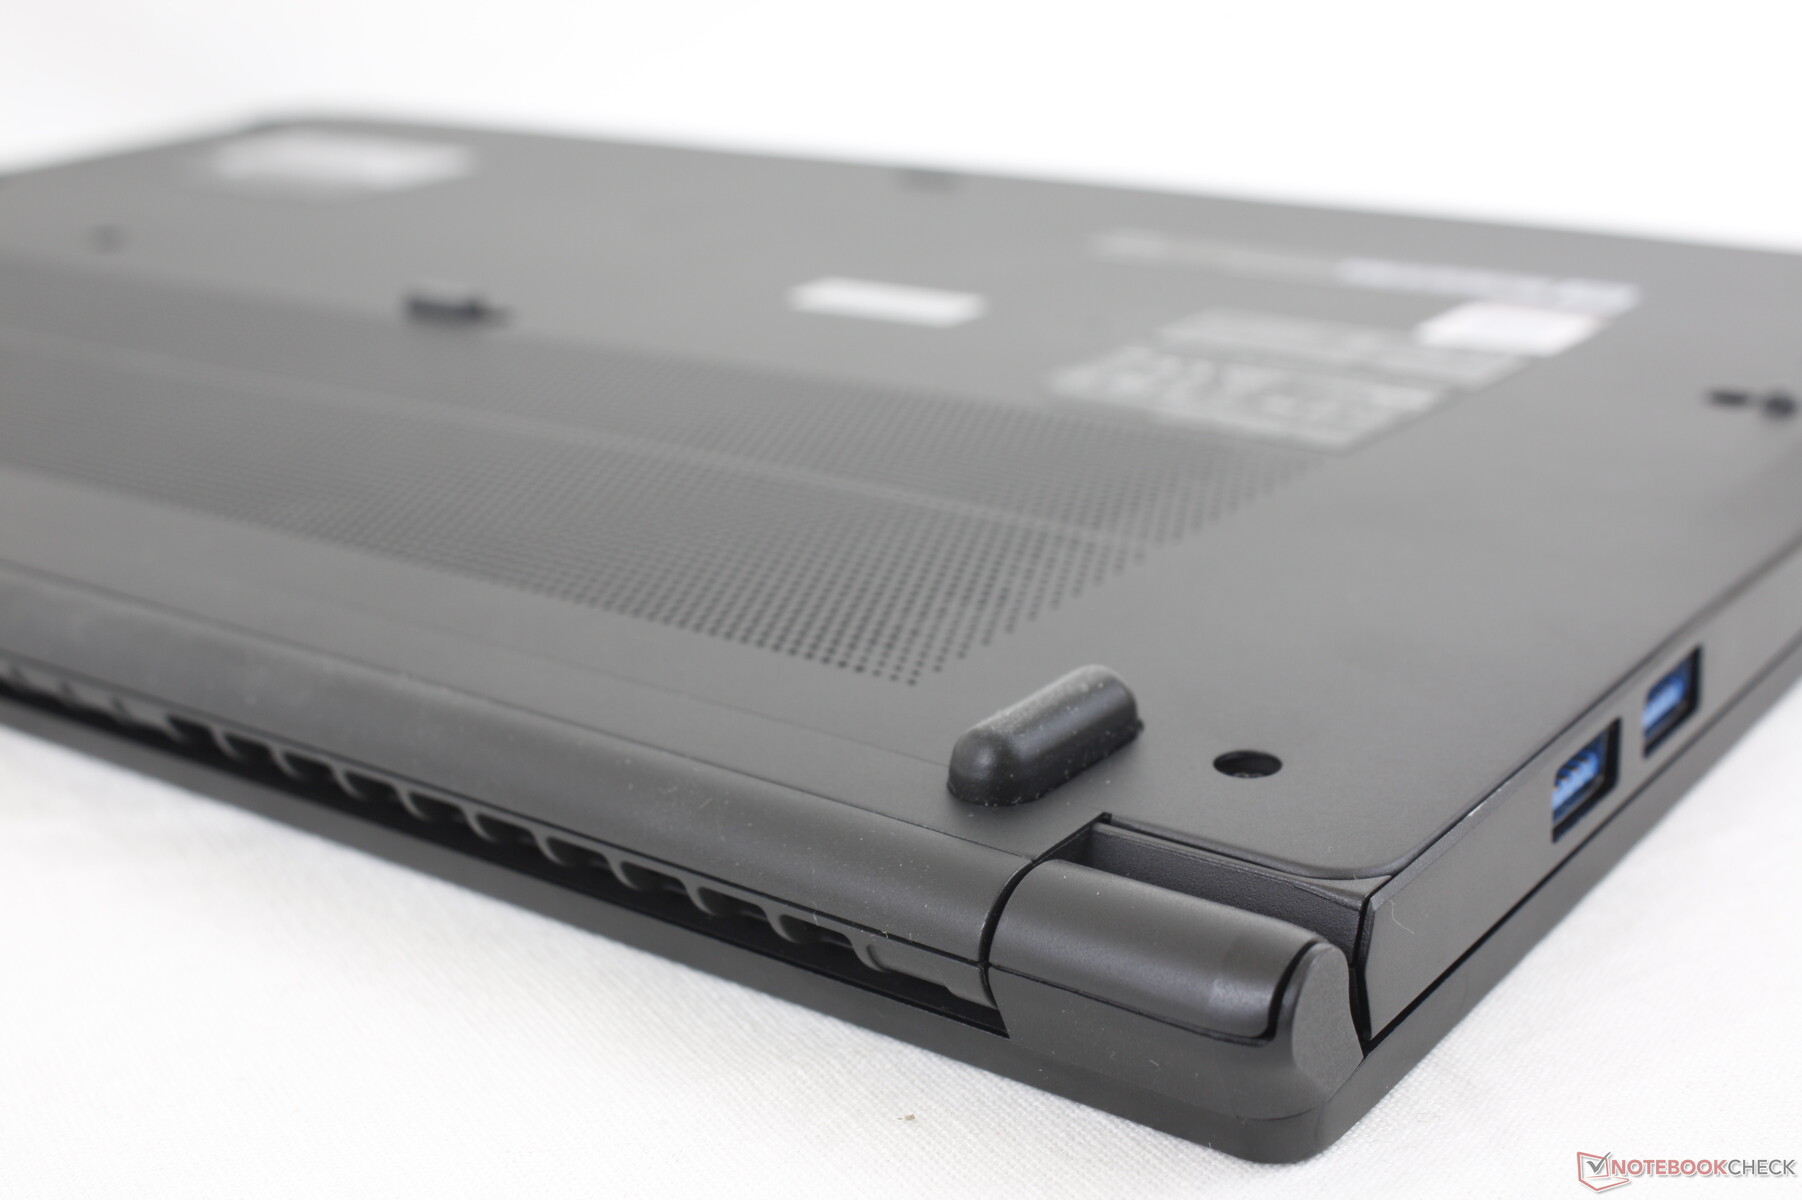
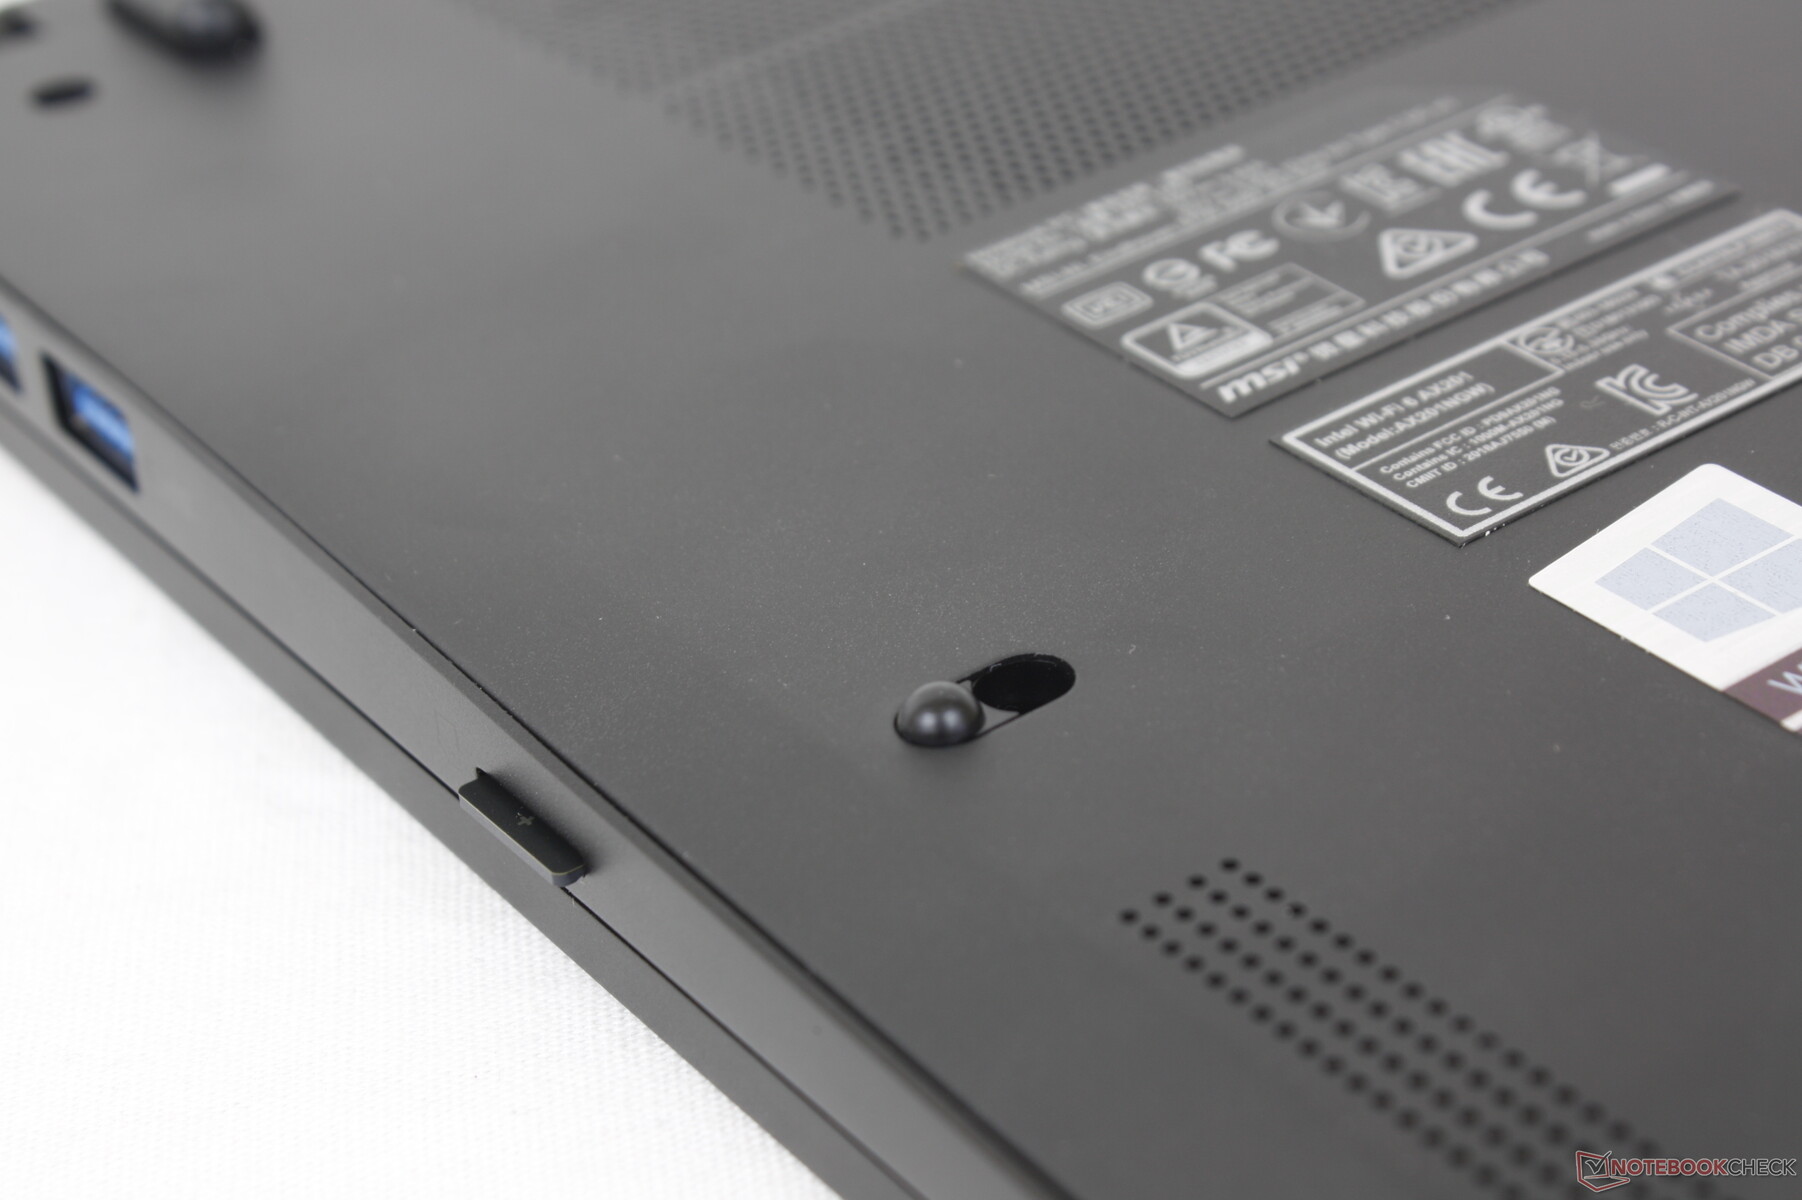
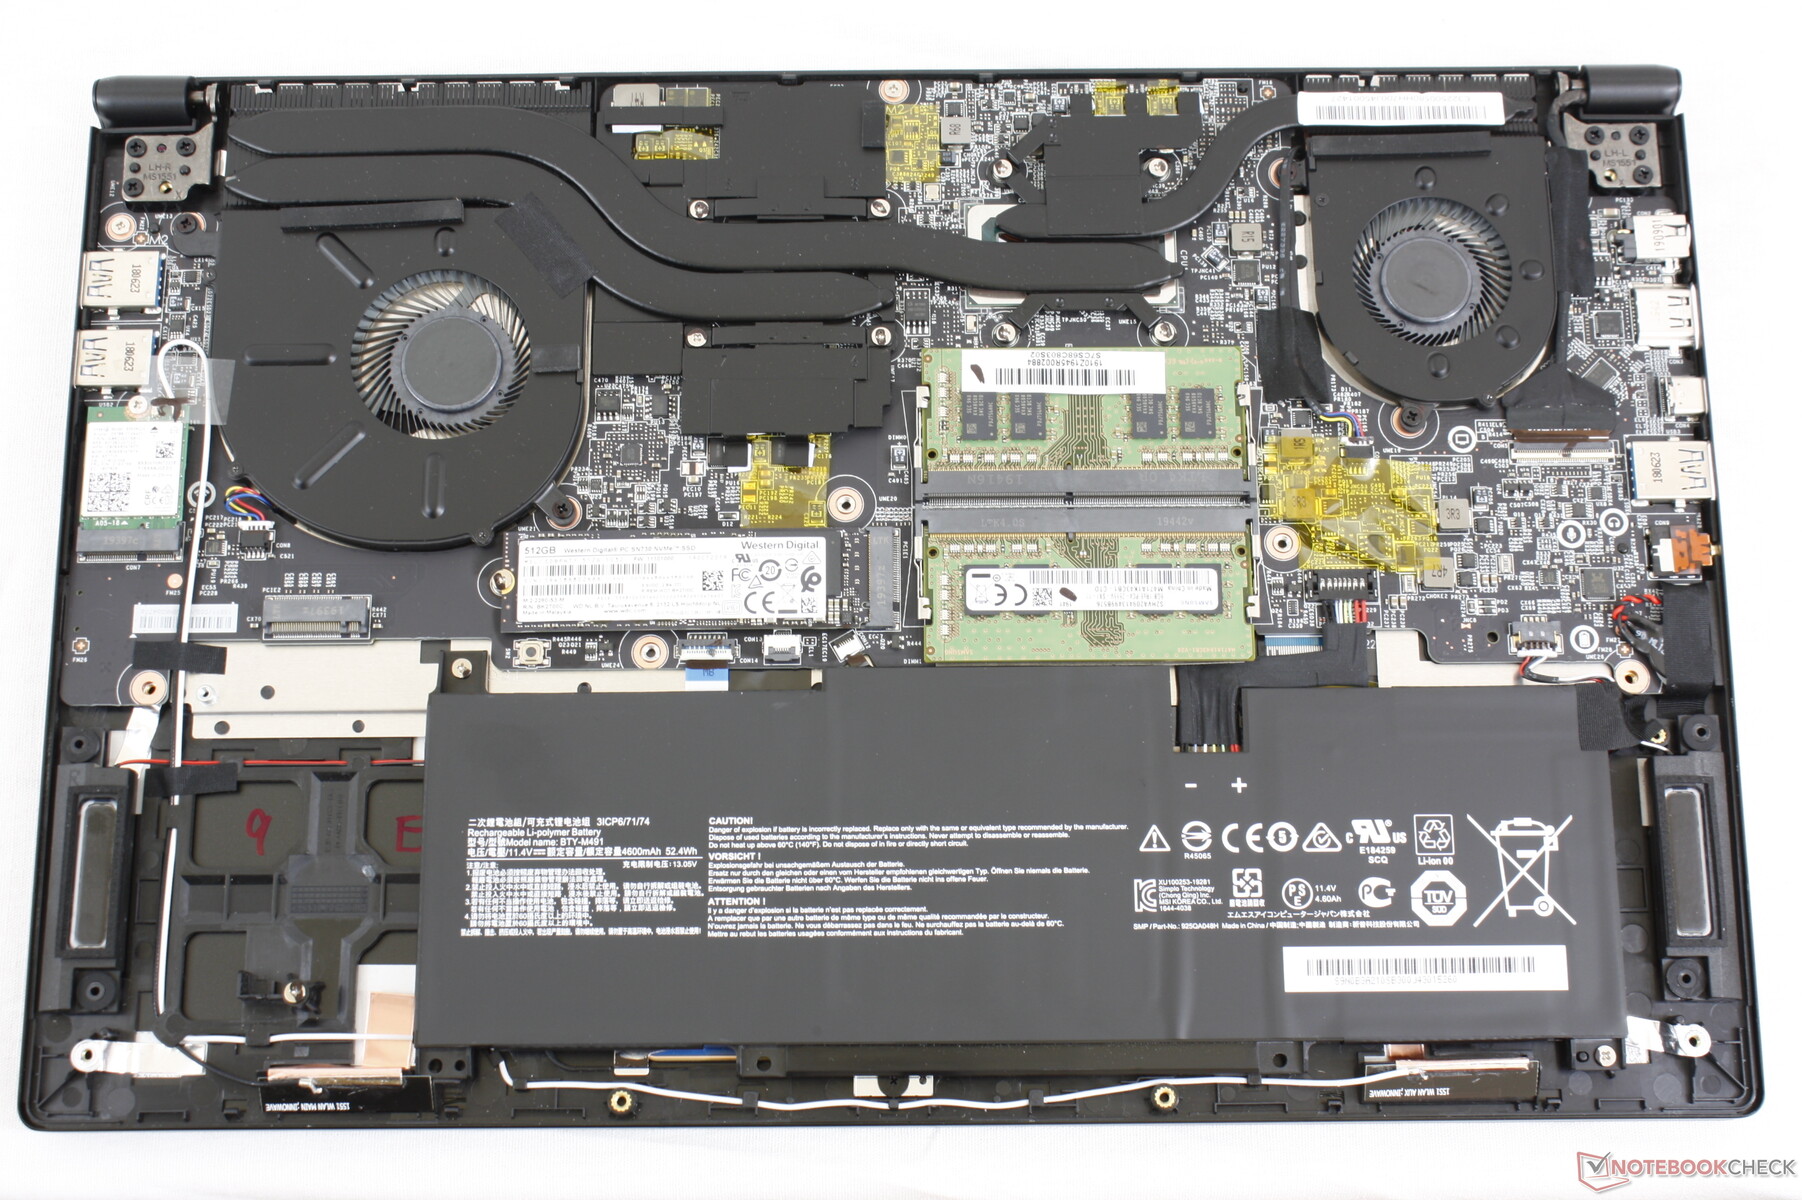
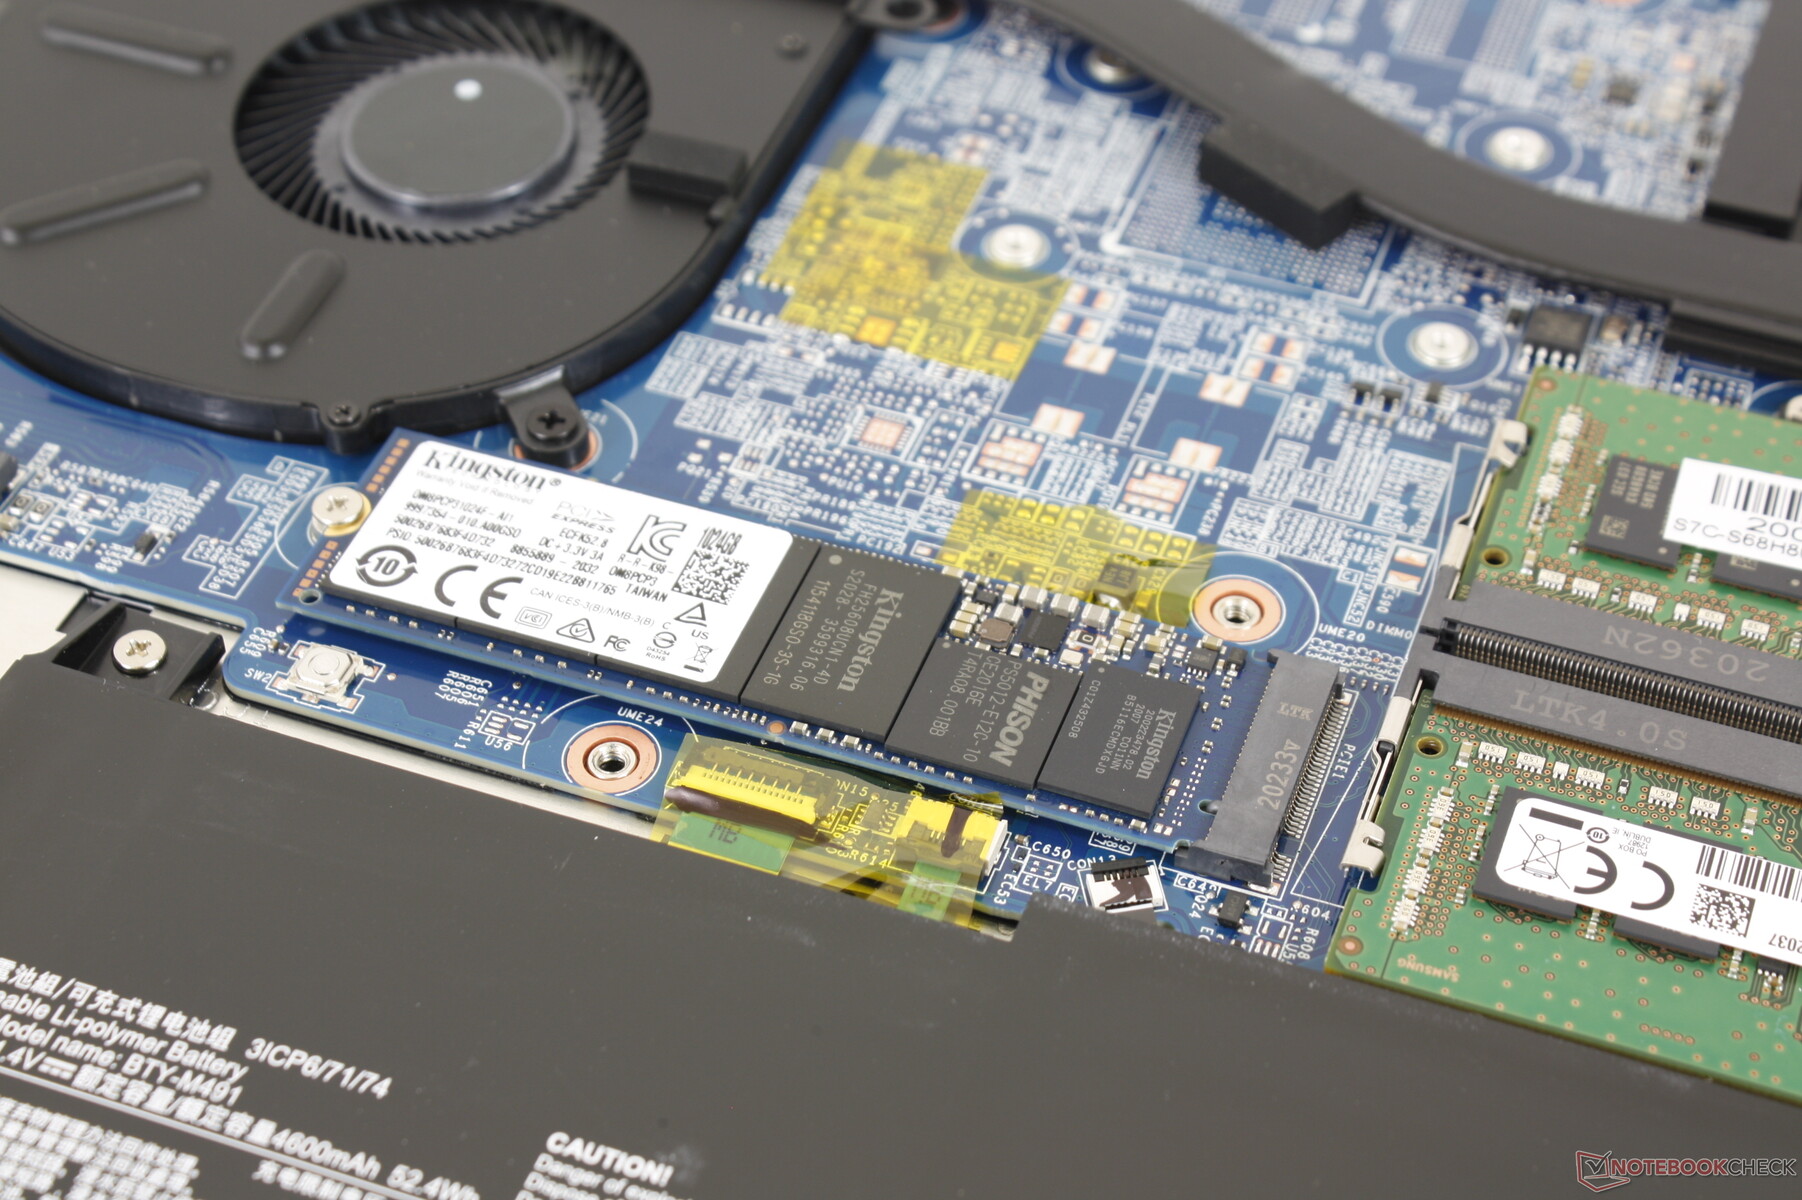
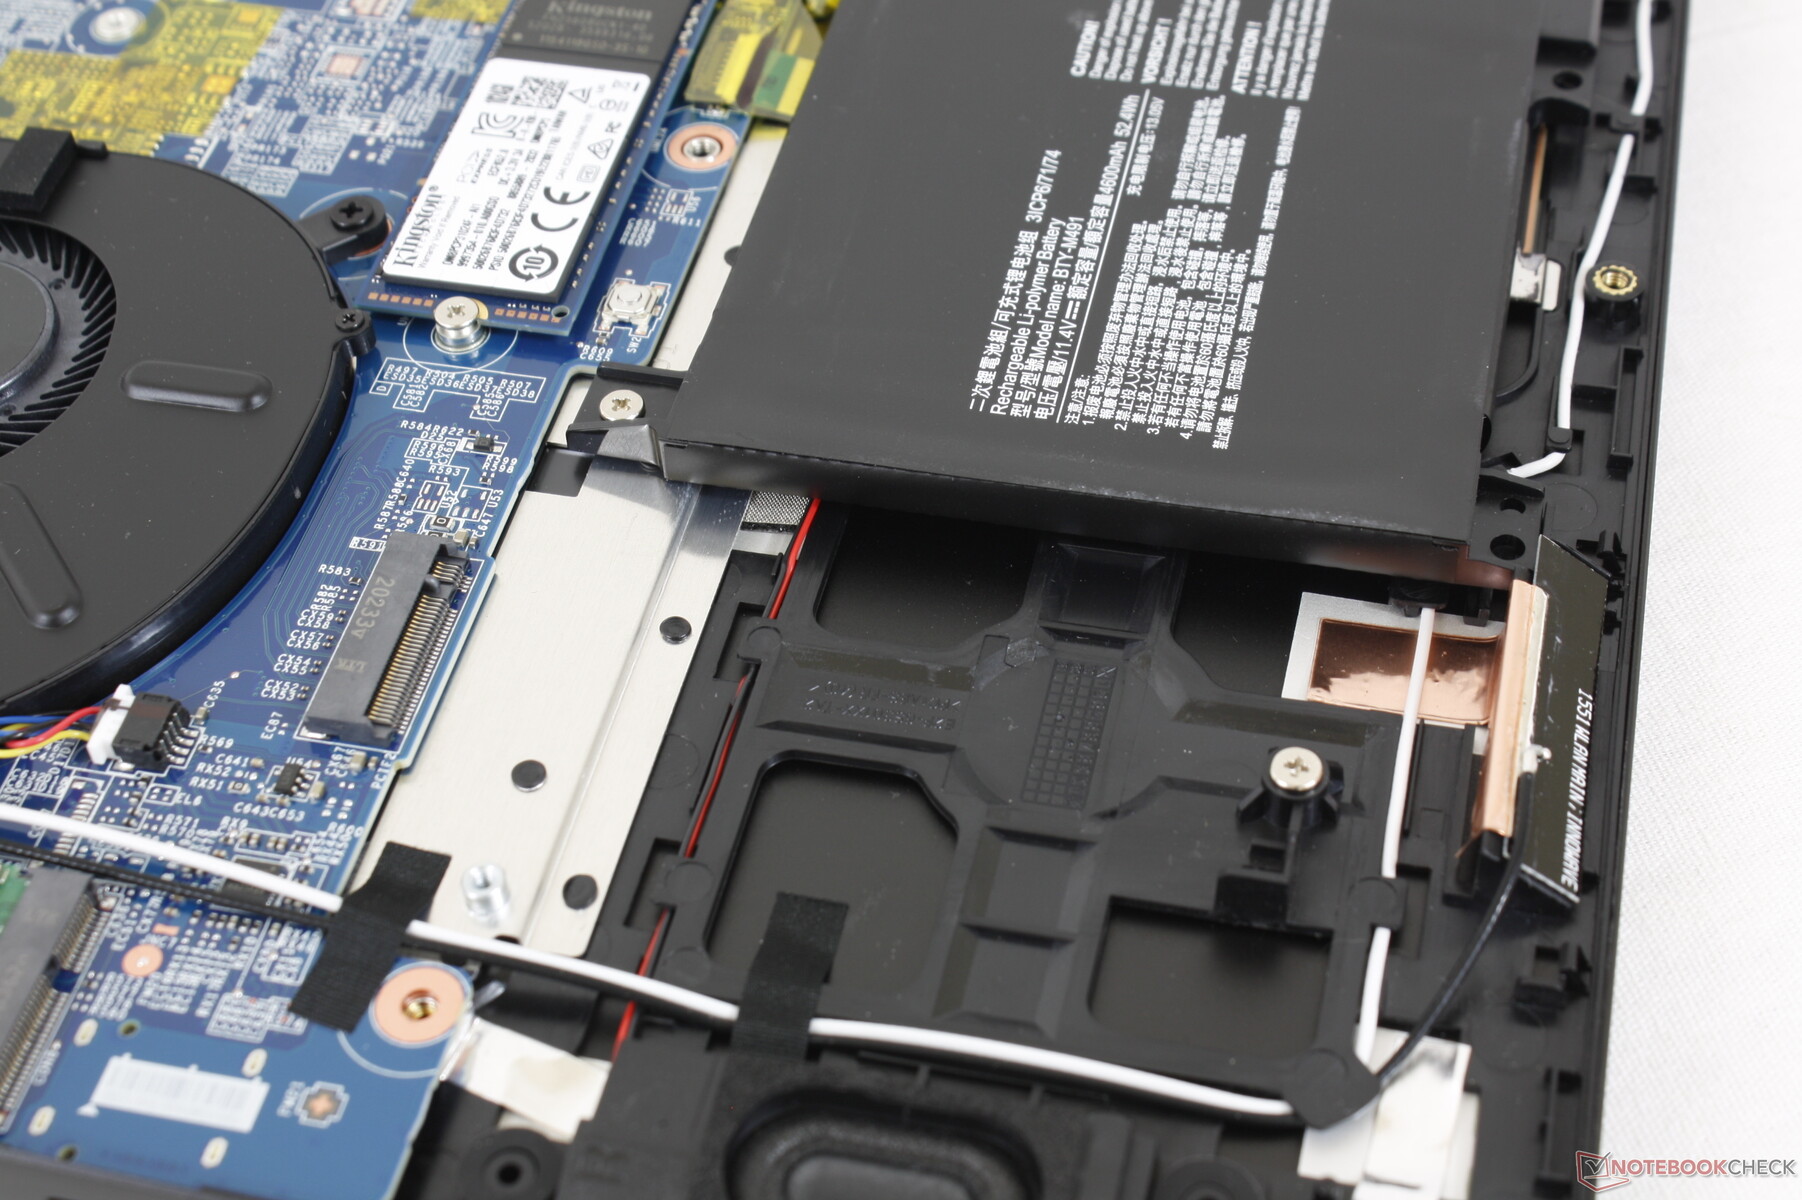
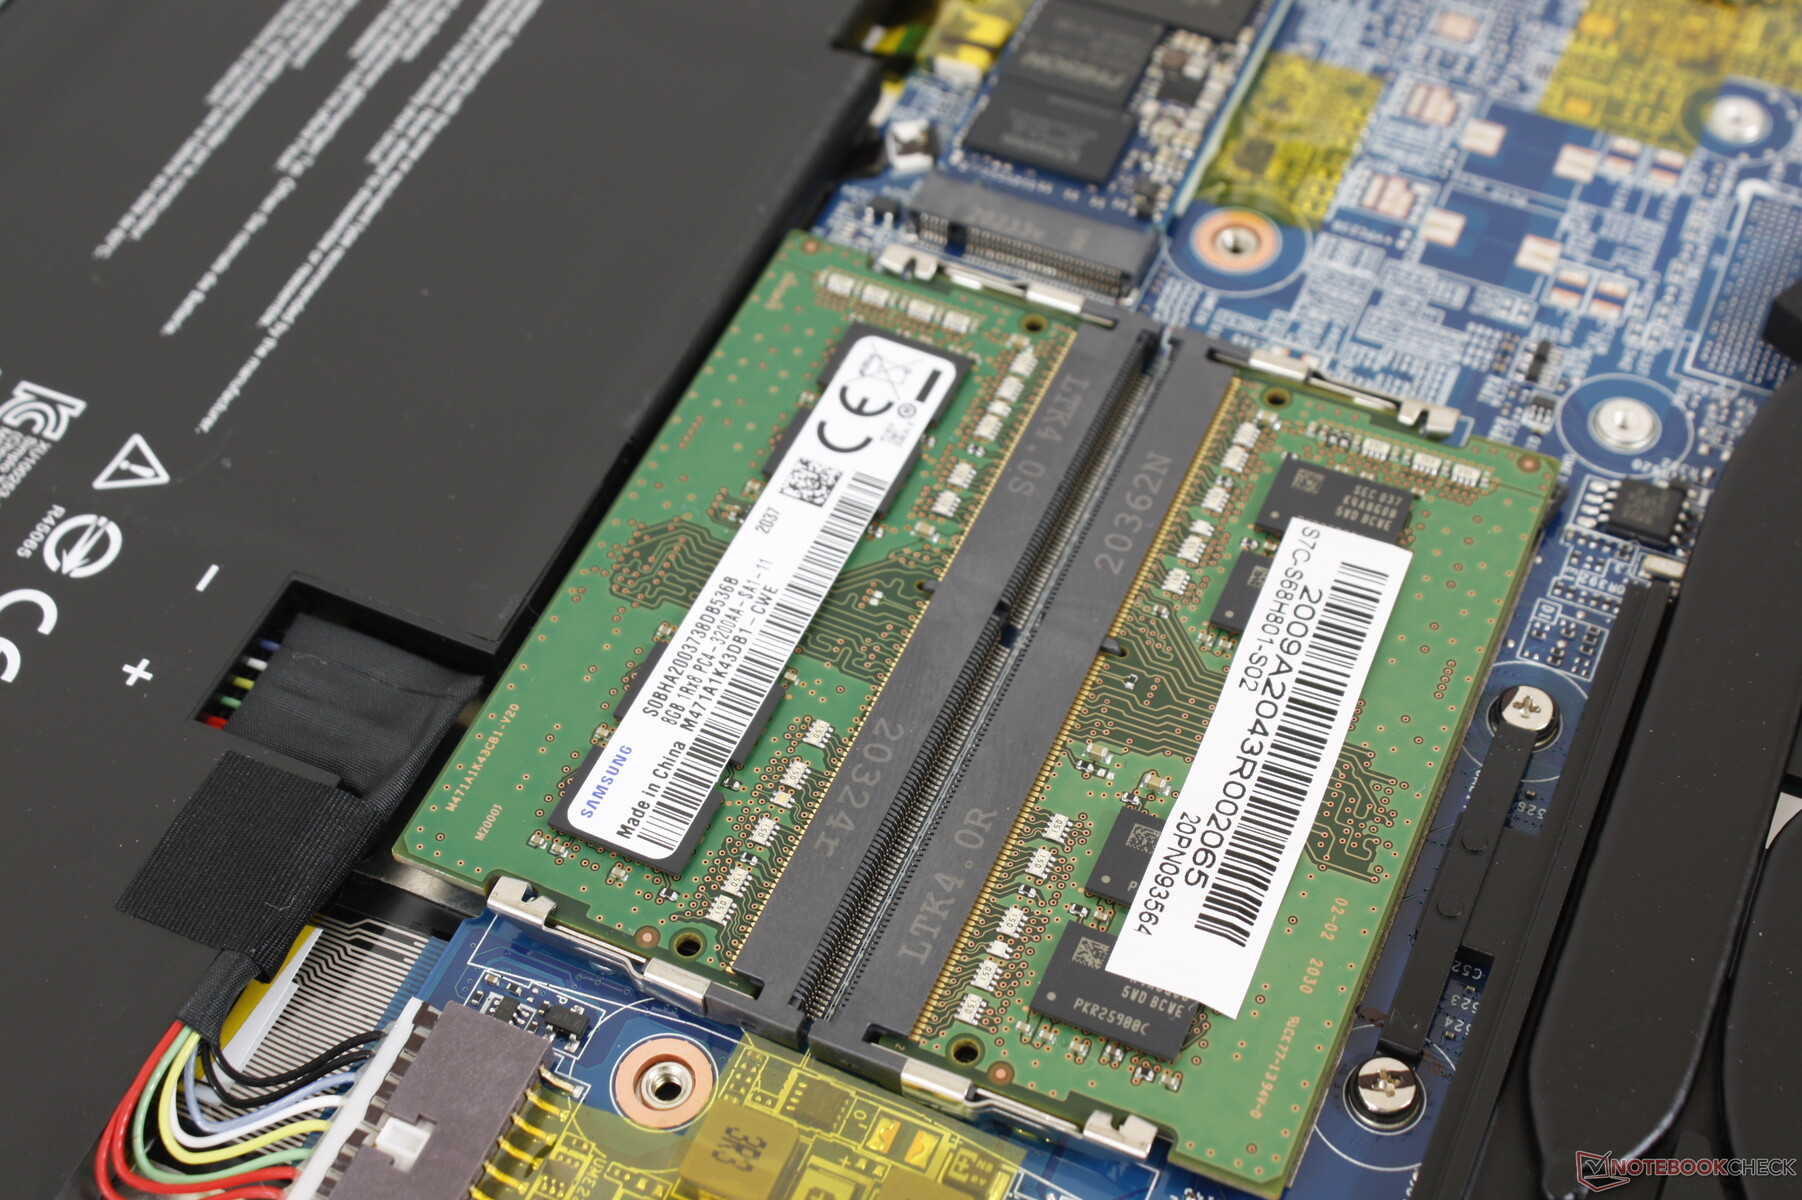
Le panneau inférieur se détache assez facilement avec un simple tournevis Philips. Cependant, gardez à l'esprit qu'il faut d'abord casser l'autocollant d'étanchéité de l'usine. Une fois à l'intérieur, les similitudes entre le Summit B15 et le Modern 15 de l'année dernière deviennent encore plus évidentes comme le montrent les images de comparaison ci-dessous.
Accessoires et garantie
La boîte de détail comprend un adaptateur USB-A vers RJ-45 ainsi que les documents et l'adaptateur secteur. La garantie limitée standard d'un an s'applique avec des options d'extension si elle est achetée chez Xotic PC.
Périphériques d'entrée
Clavier
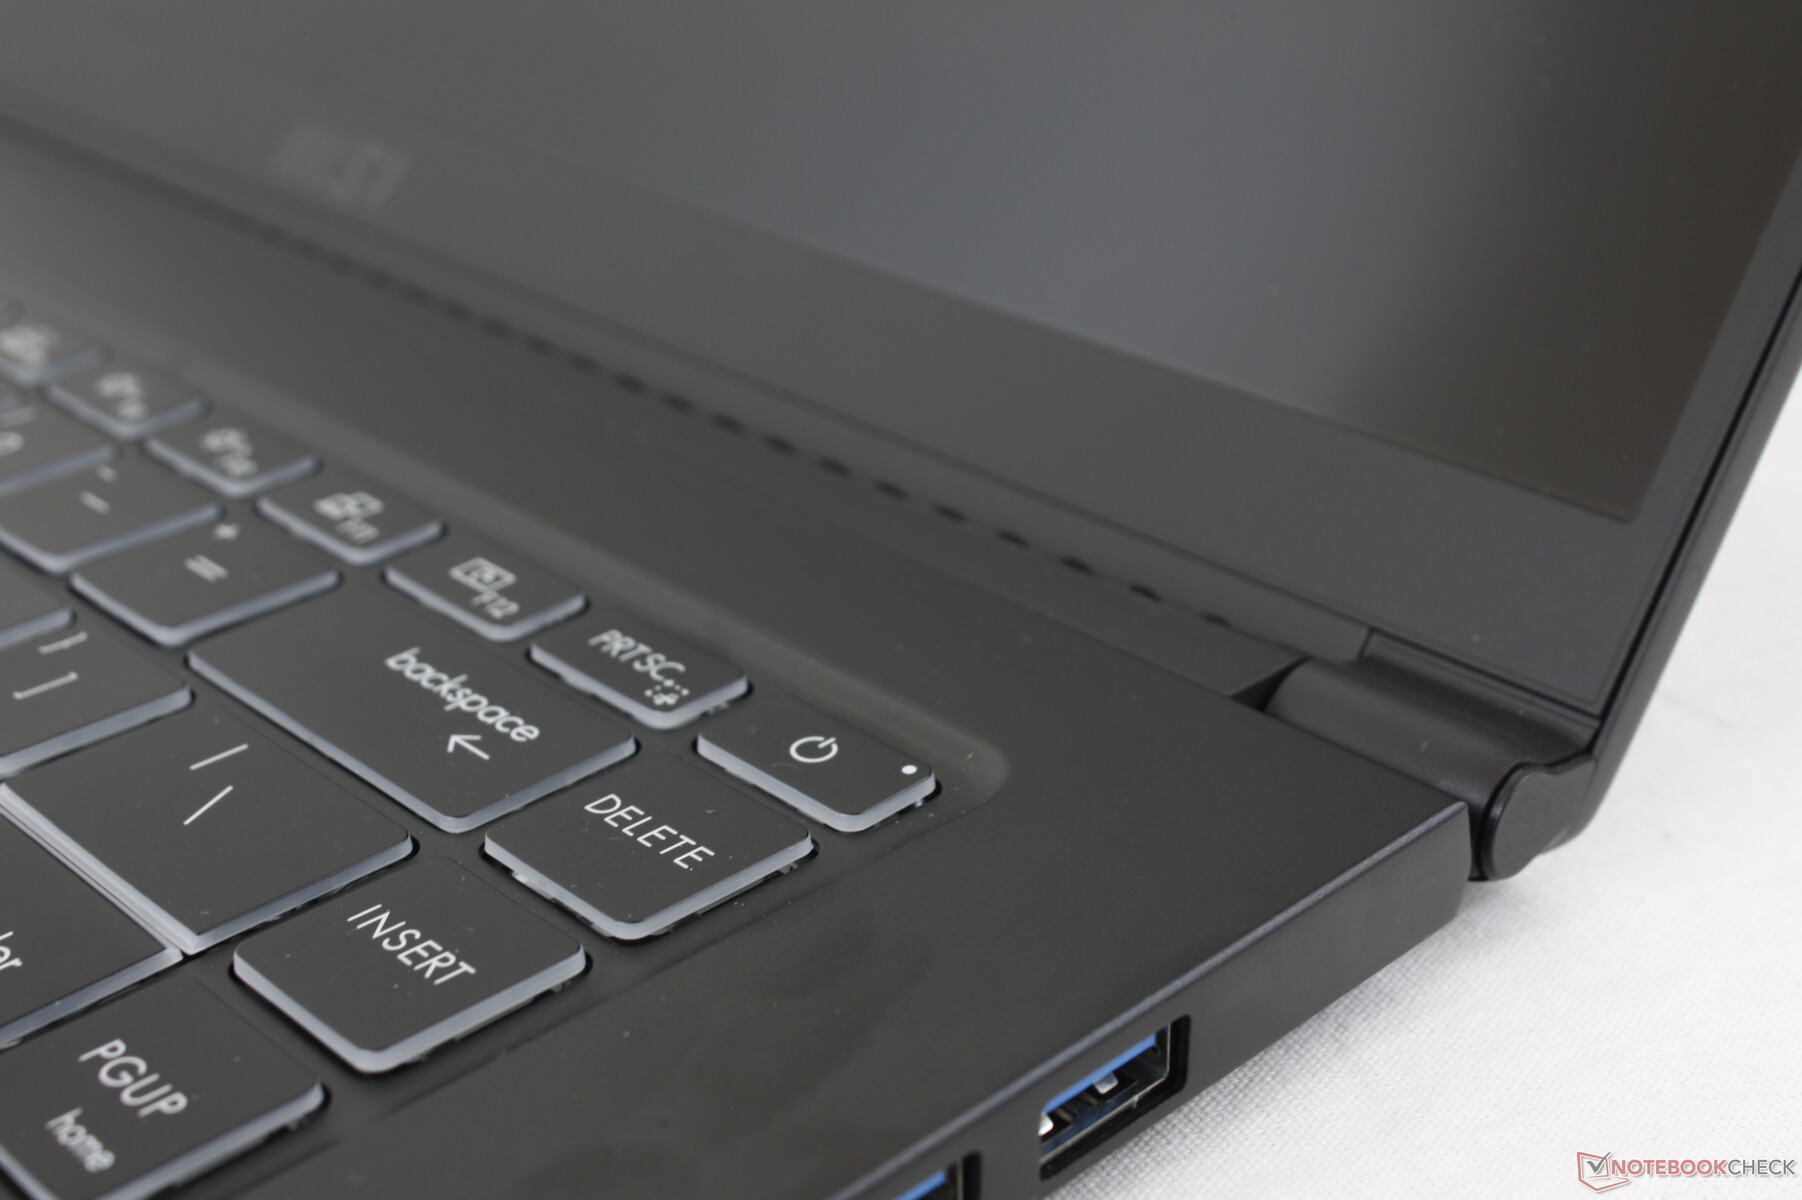
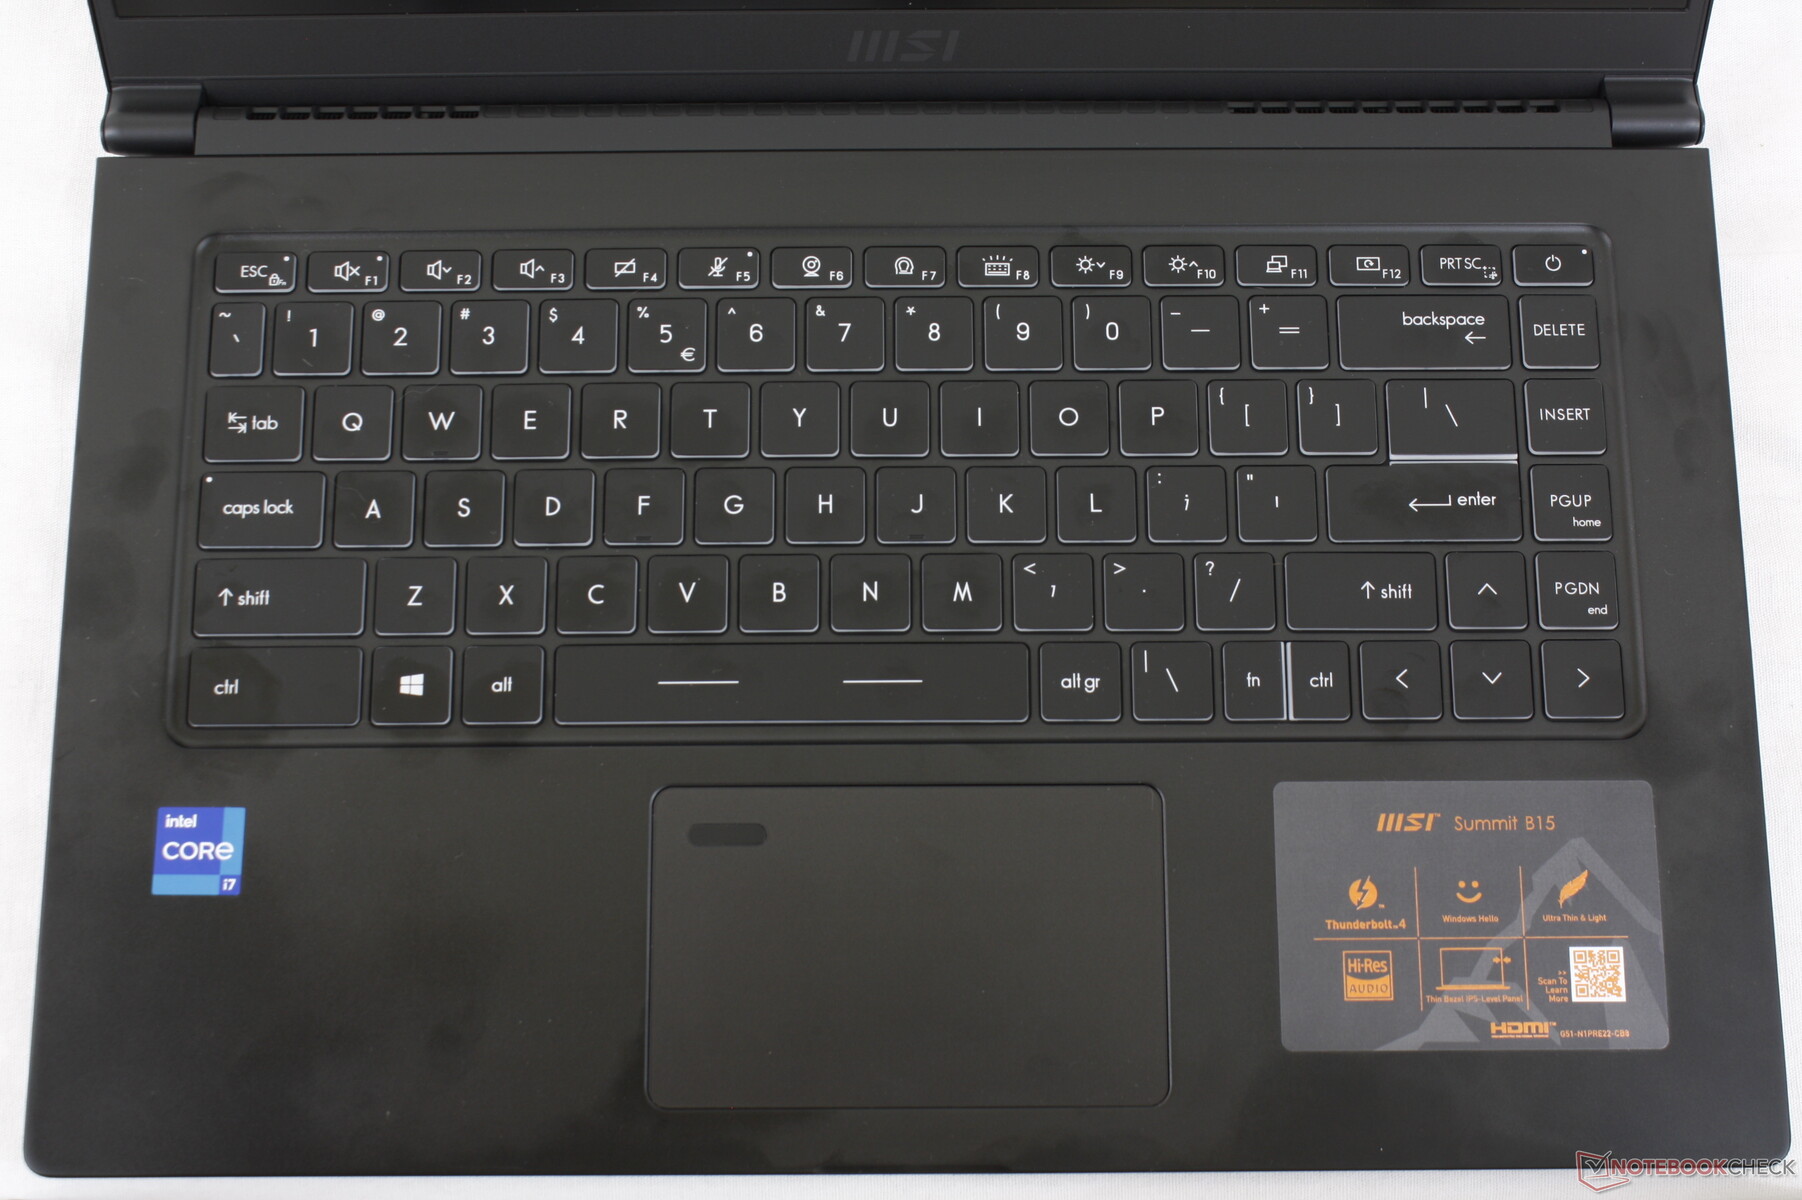
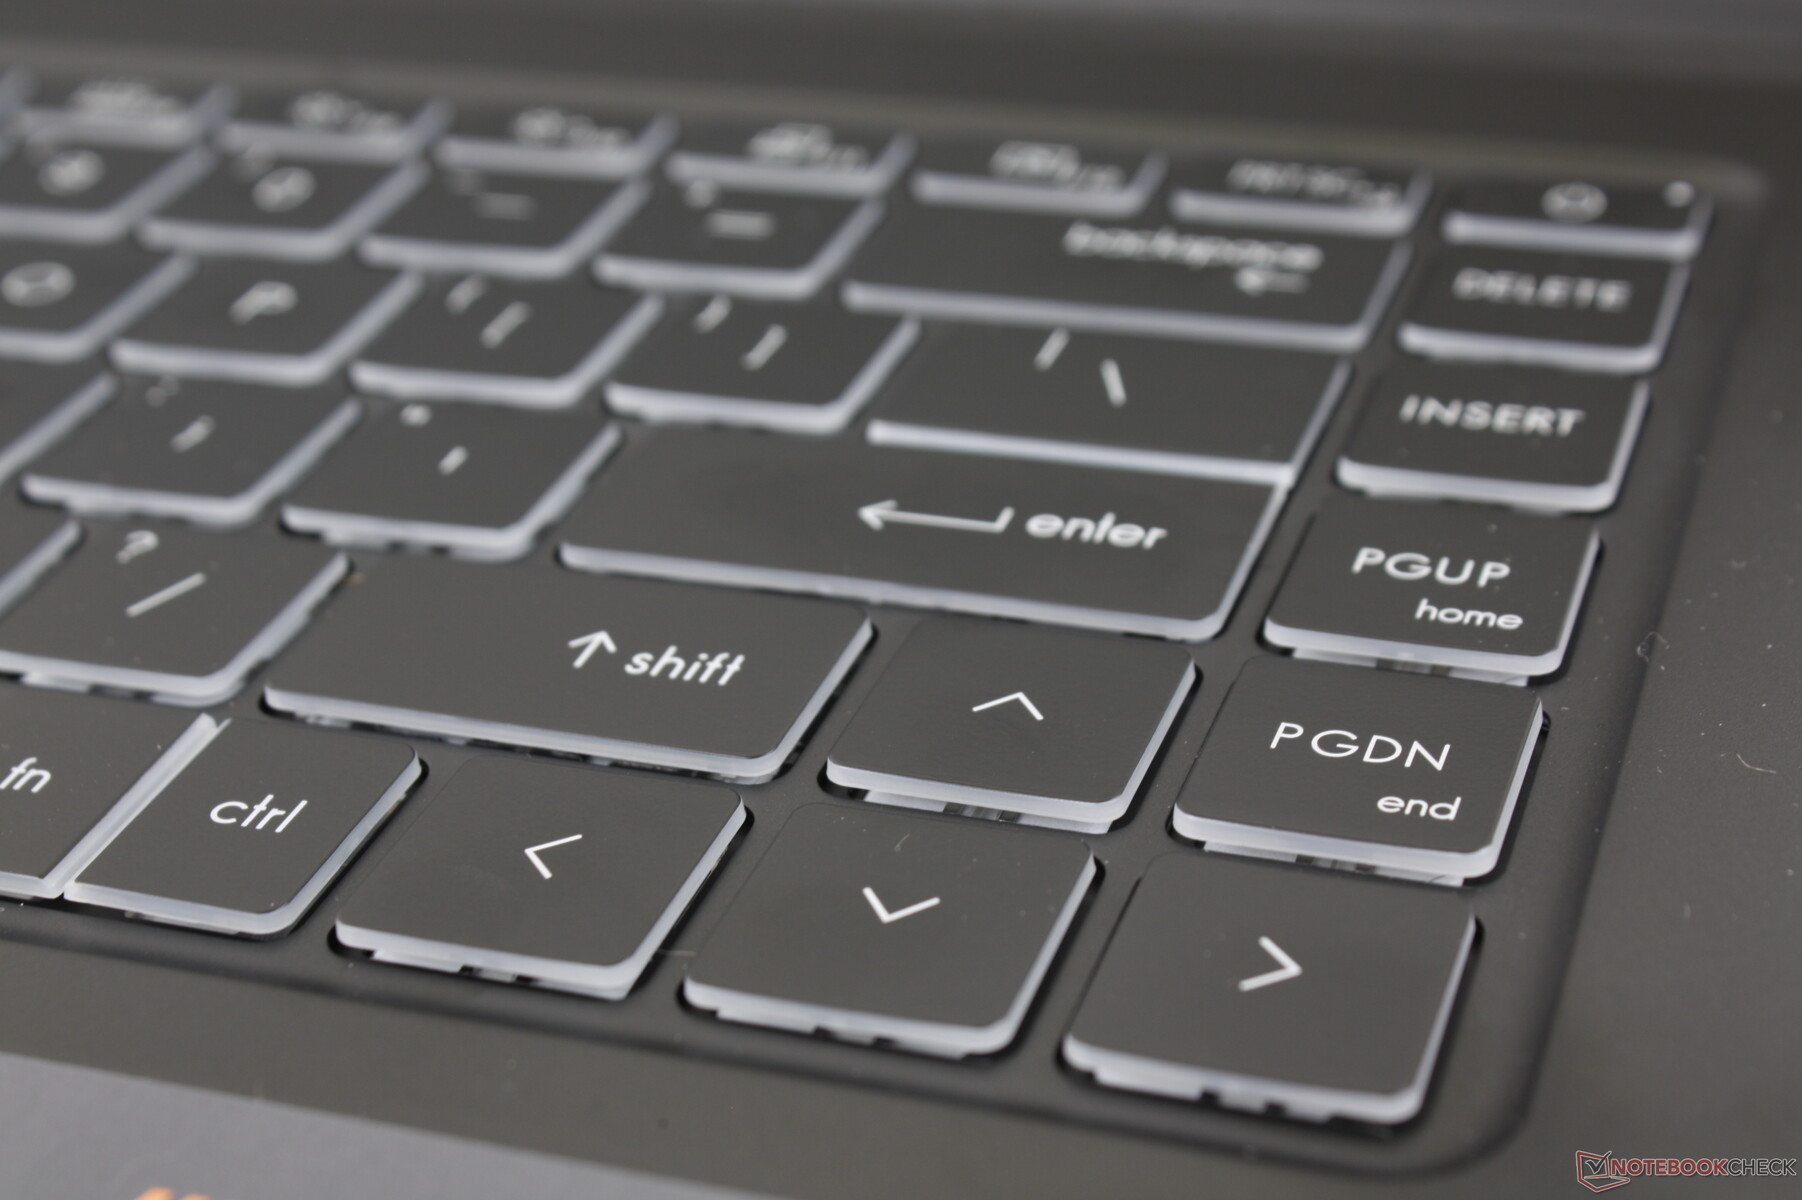
La police de caractères des touches a été modifiée par rapport au Modern 15 pour être plus nette et moins en gras ou en italique. Sinon, le feedback et la disposition des touches restent exactement les mêmes. Les touches sont plus fermes et plus profondes que sur le XPG Xenia Xe et leDell XPS 15respectivement, mais le bruit des touches est légèrement plus fort. Nous apprécions les touches PgUp, PgDn, Suppr et les flèches de taille normale, car elles sont souvent réduites sur la plupart des autres ordinateurs portables.
Pavé tactile
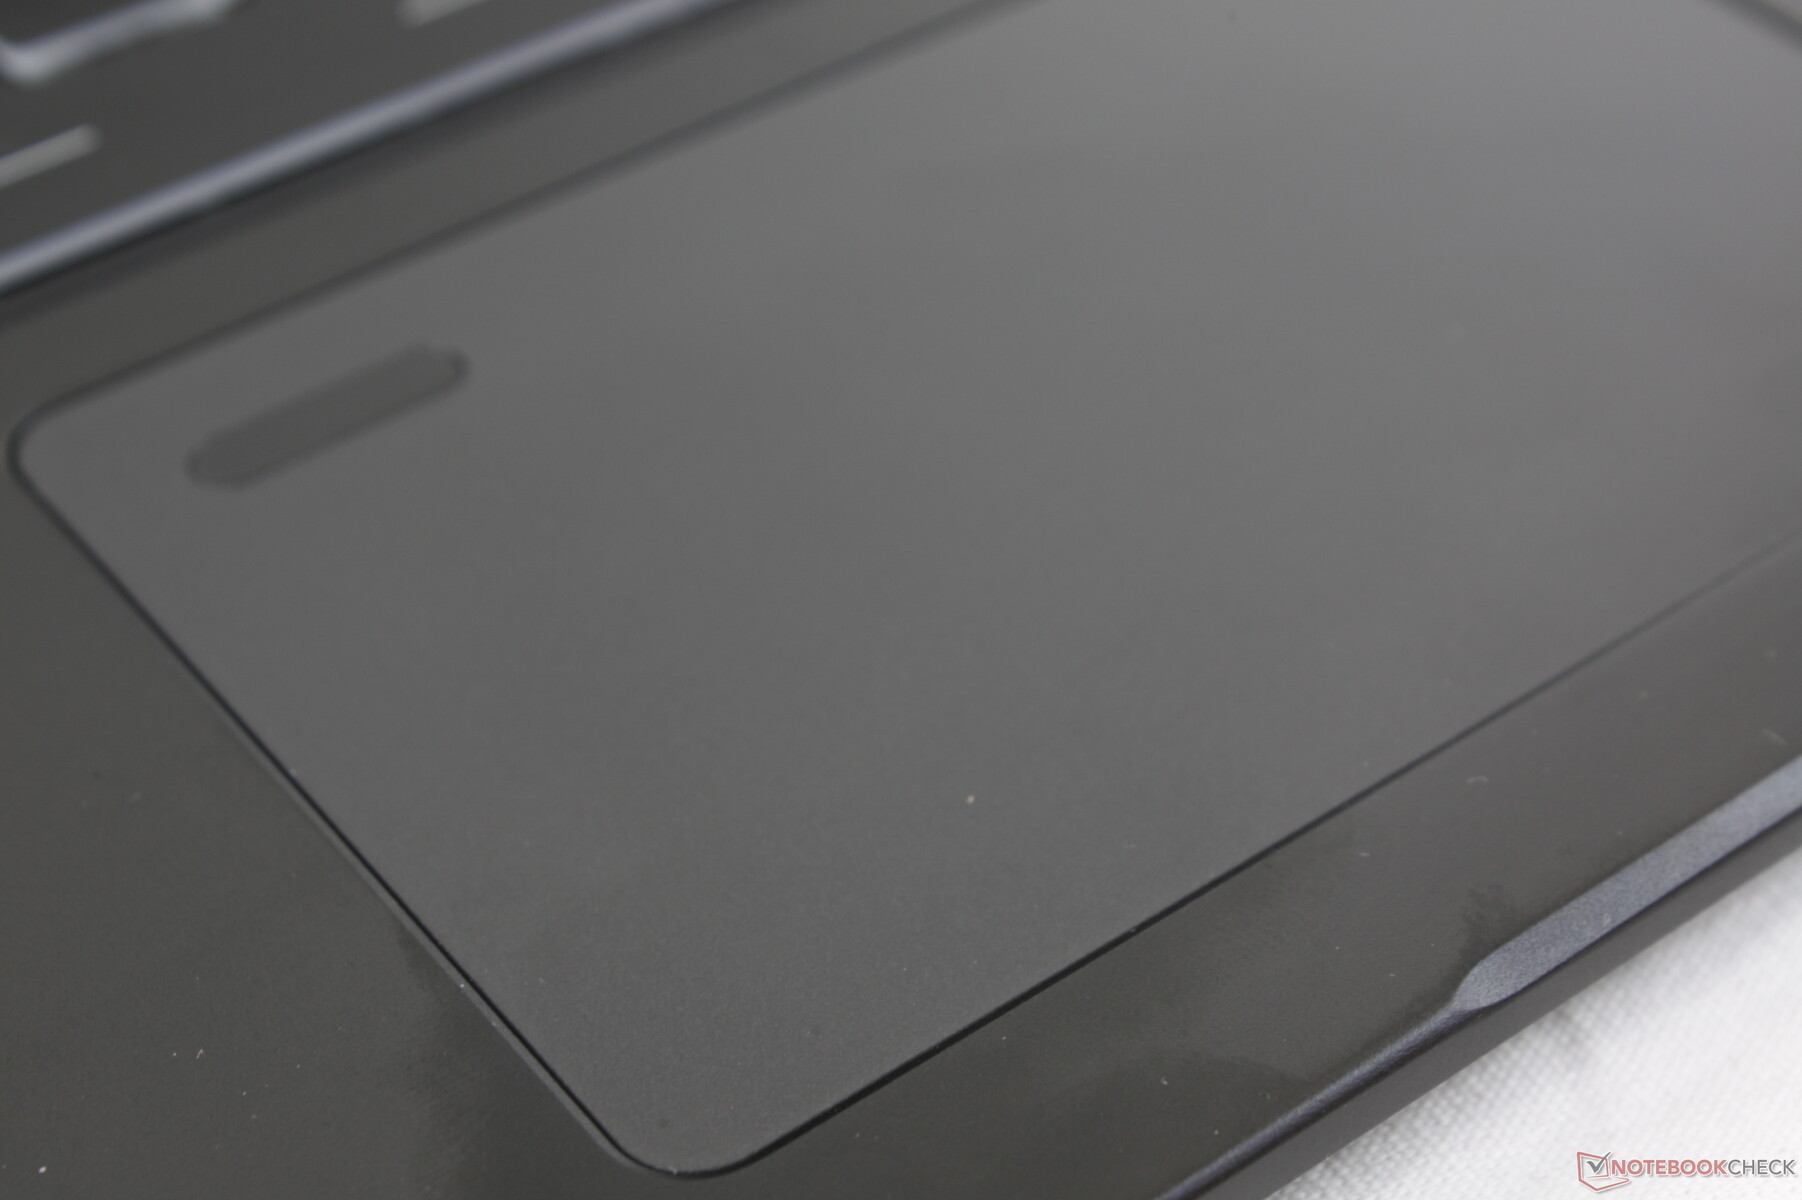
Le pavé tactile est de la même taille que celui du Modern 15 (10,5 x 6,5 cm), avec la même texture lisse et un retour spongieux. Il n'est pas aussi doux que le pavé tactile du Xenia Xe, mais il aurait pu être plus ferme pour un clic plus satisfaisant.
Nous pensons que MSI finira par éloigner le lecteur d'empreintes digitales du pavé numérique, à l'instar de ce que nous voyons déjà chez Dell, HP et d'autres.

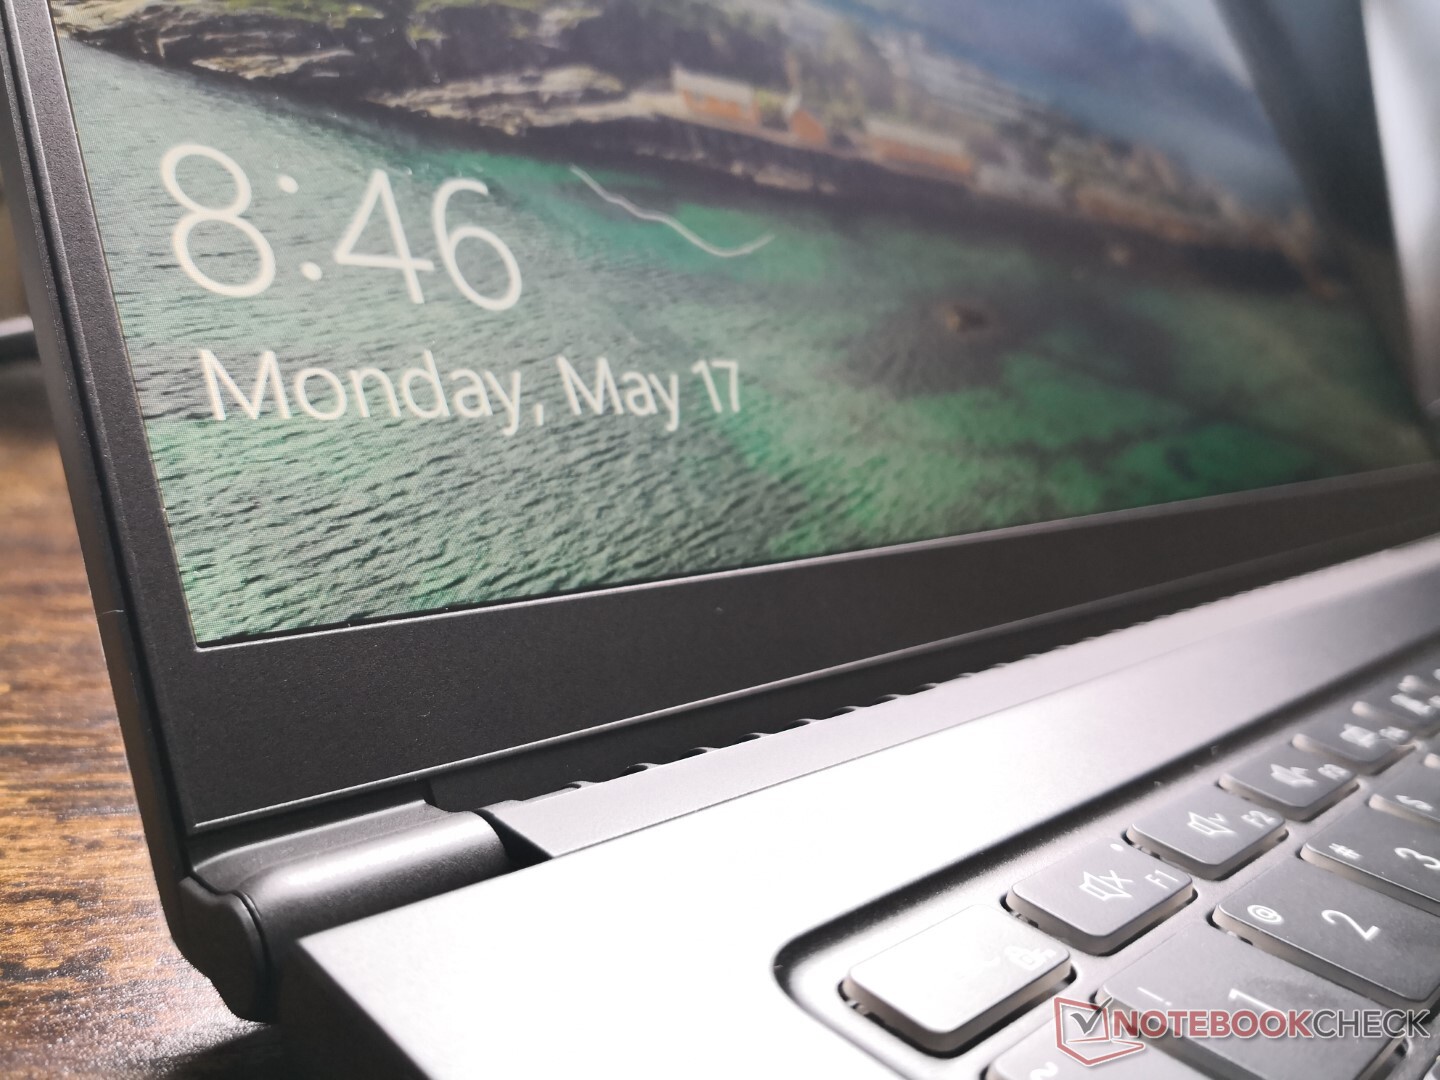
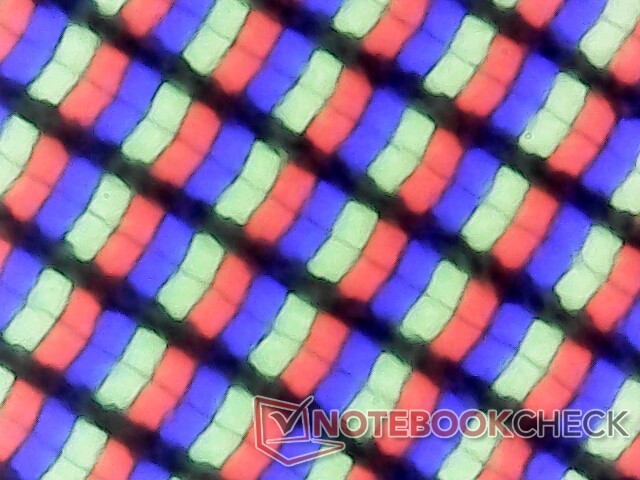
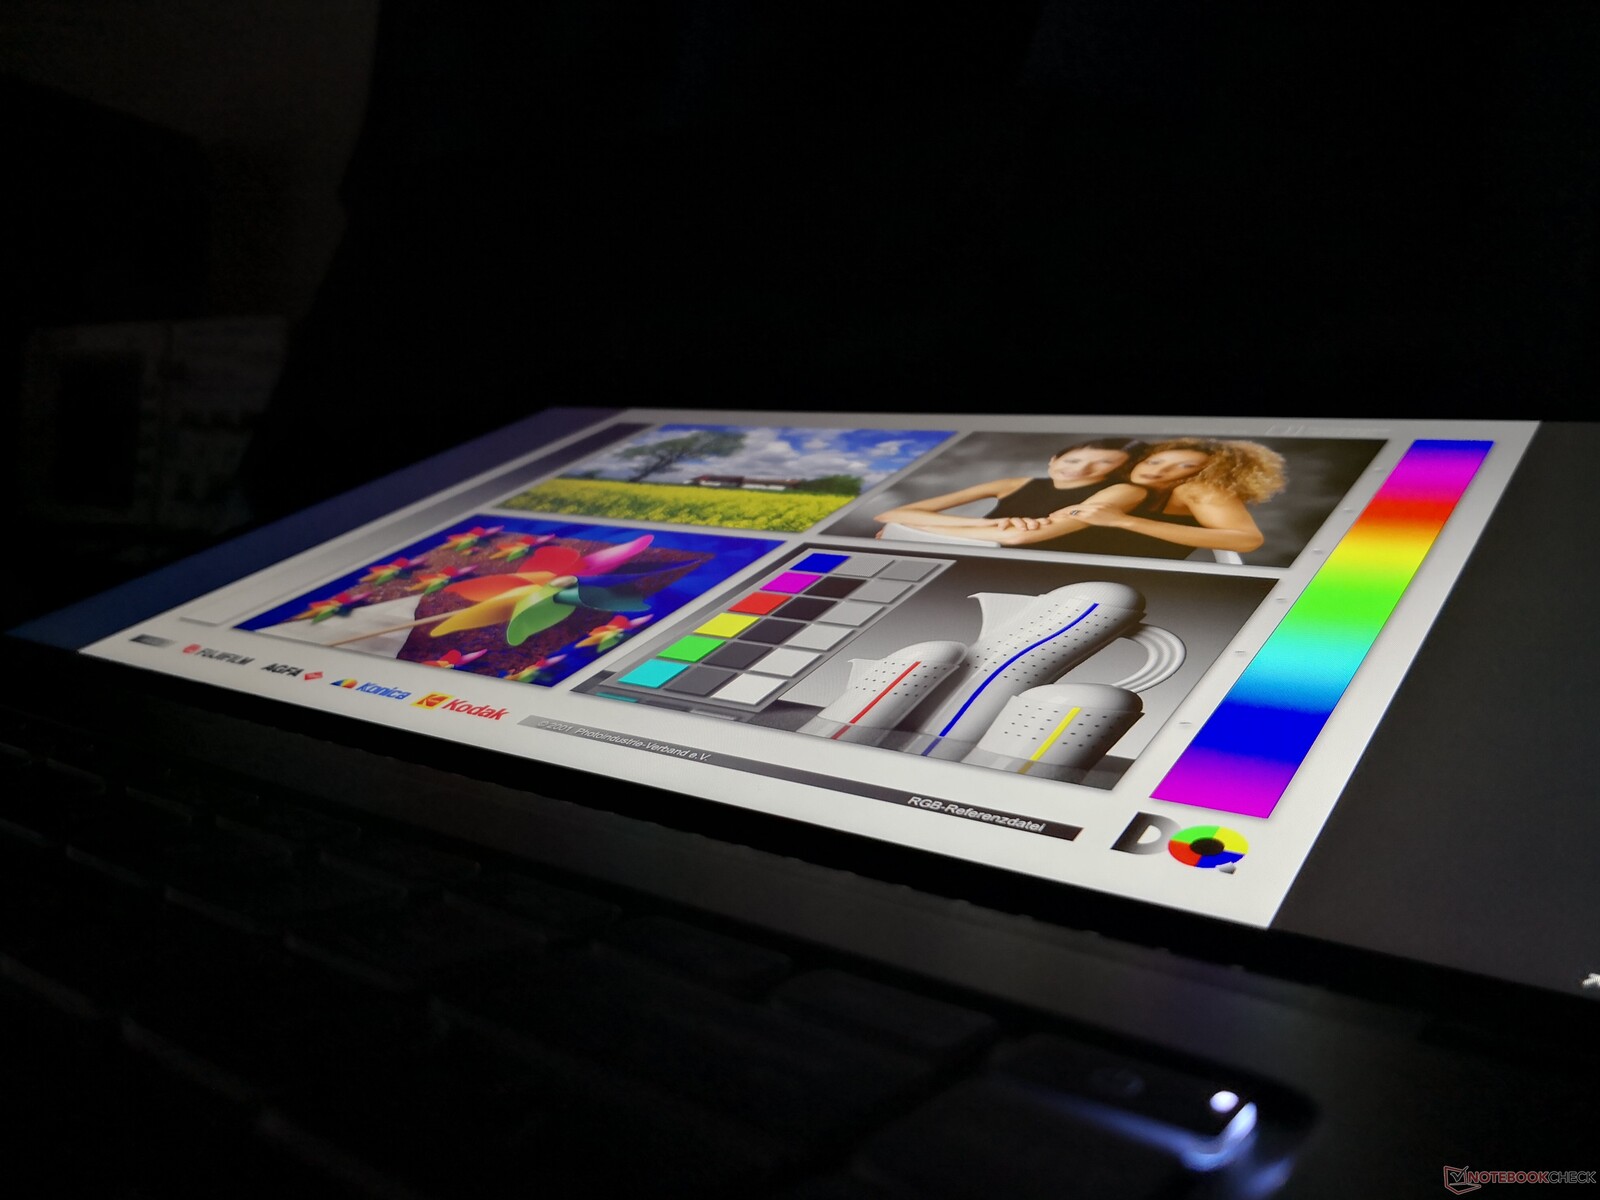
Afficher
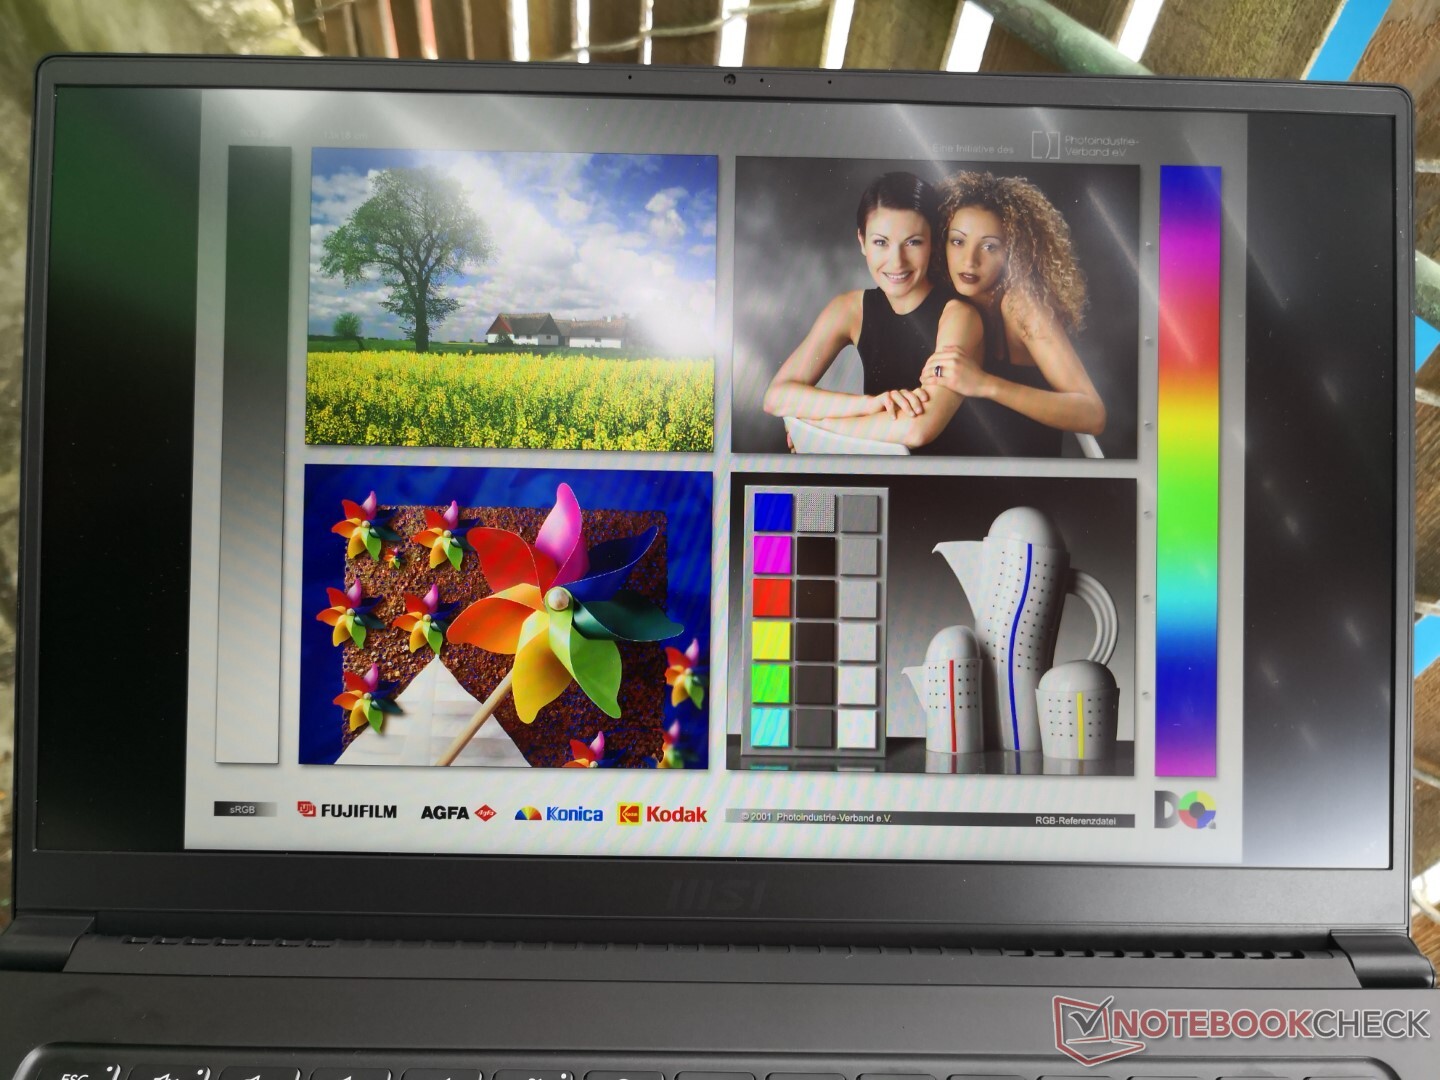
Le Summit B15 utilise la même dalle IPS matte Chi Mei N156HCE-EN1 que celle que l'on trouve sur le MSI PS63 Modern 2019. En fait, ce panneau exact est assez courant sur les ordinateurs portables de 15,6 pouces de milieu de gamme supérieure, notamment le ThinkPad P52et le ThinkPad X1 Extreme, Asus ZenBook Pro UX550et même le Modern 15 de MSI. La qualité d'image est donc similaire entre tous ces ordinateurs portables, y compris les temps de réponse noir-blanc moyens et le taux de contraste décent. La modulation de largeur d'impulsion à des niveaux de luminosité inférieurs est également de retour.
| |||||||||||||||||||||||||
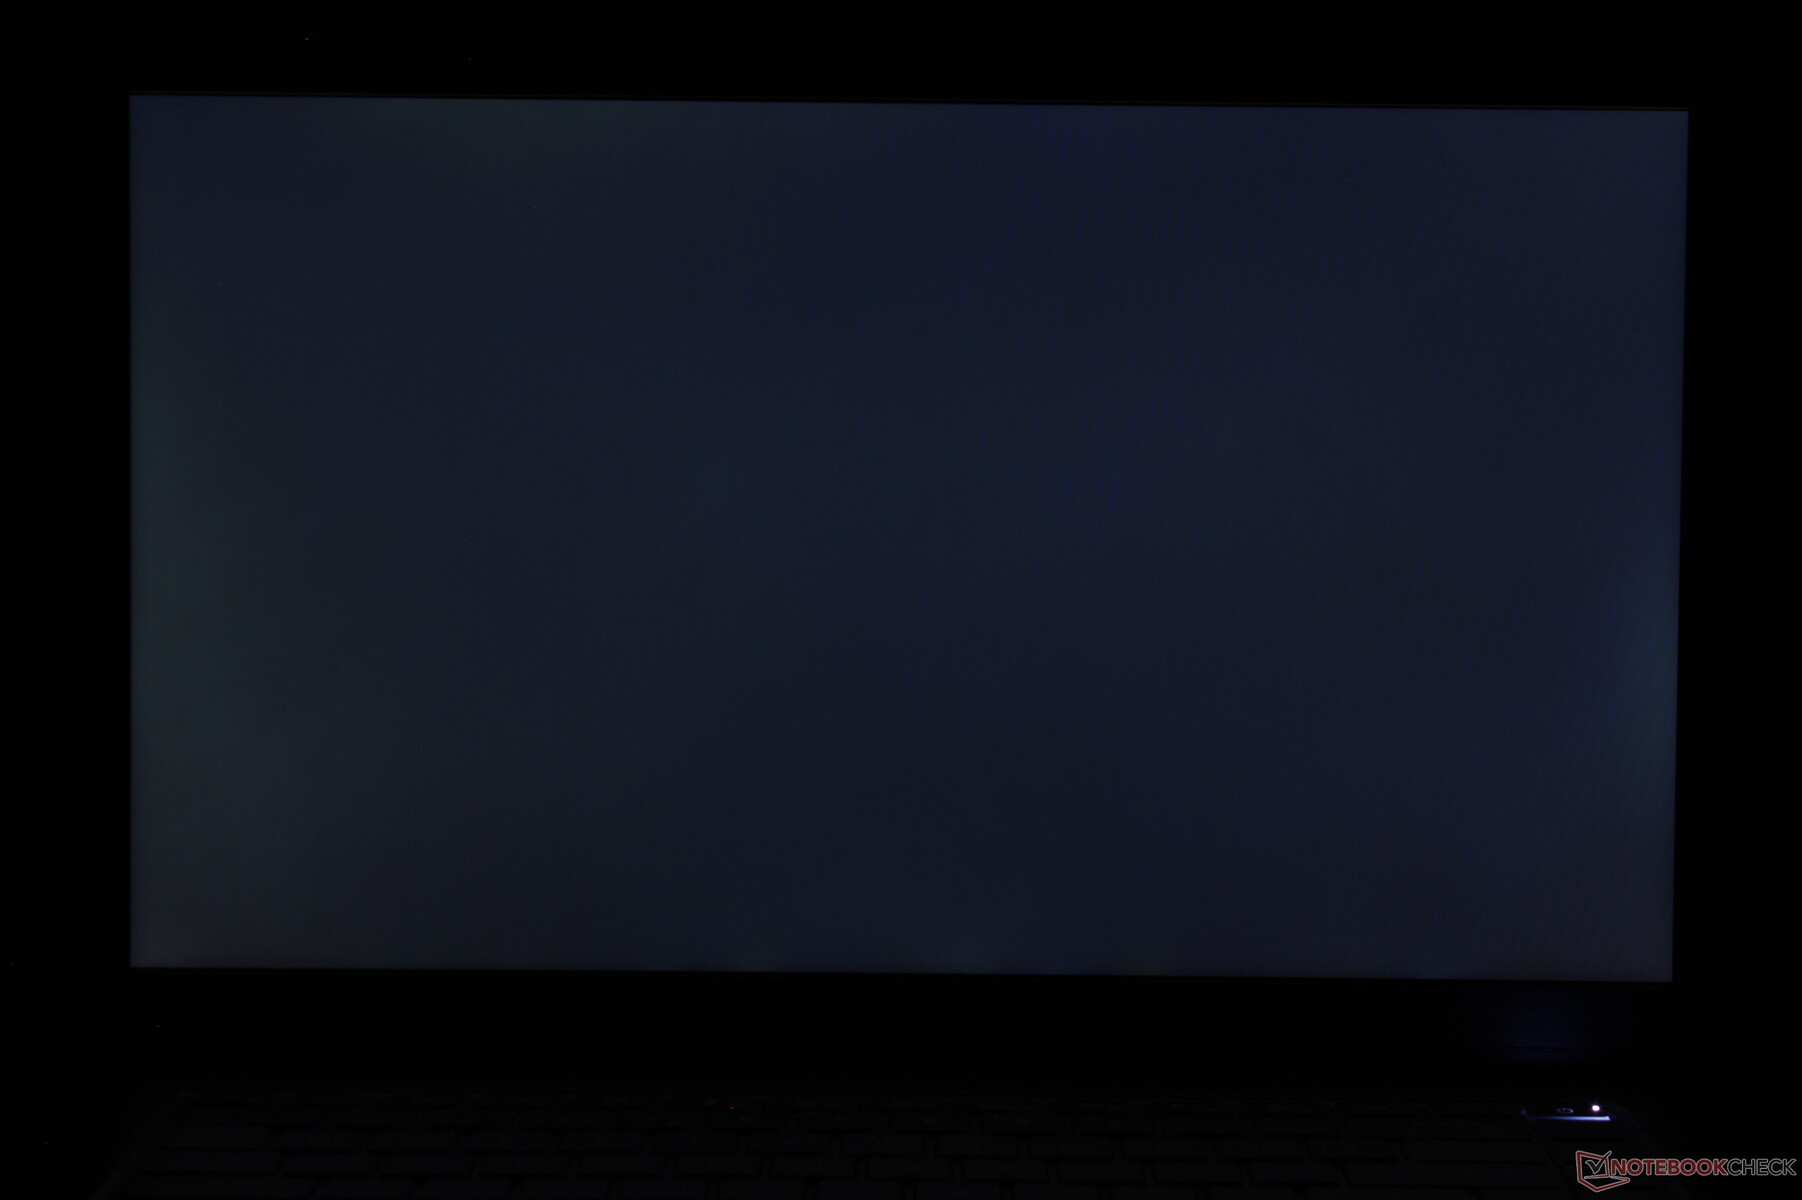
Homogénéité de la luminosité: 81 %
Valeur mesurée au centre, sur batterie: 341.3 cd/m²
Contraste: 758:1 (Valeurs des noirs: 0.45 cd/m²)
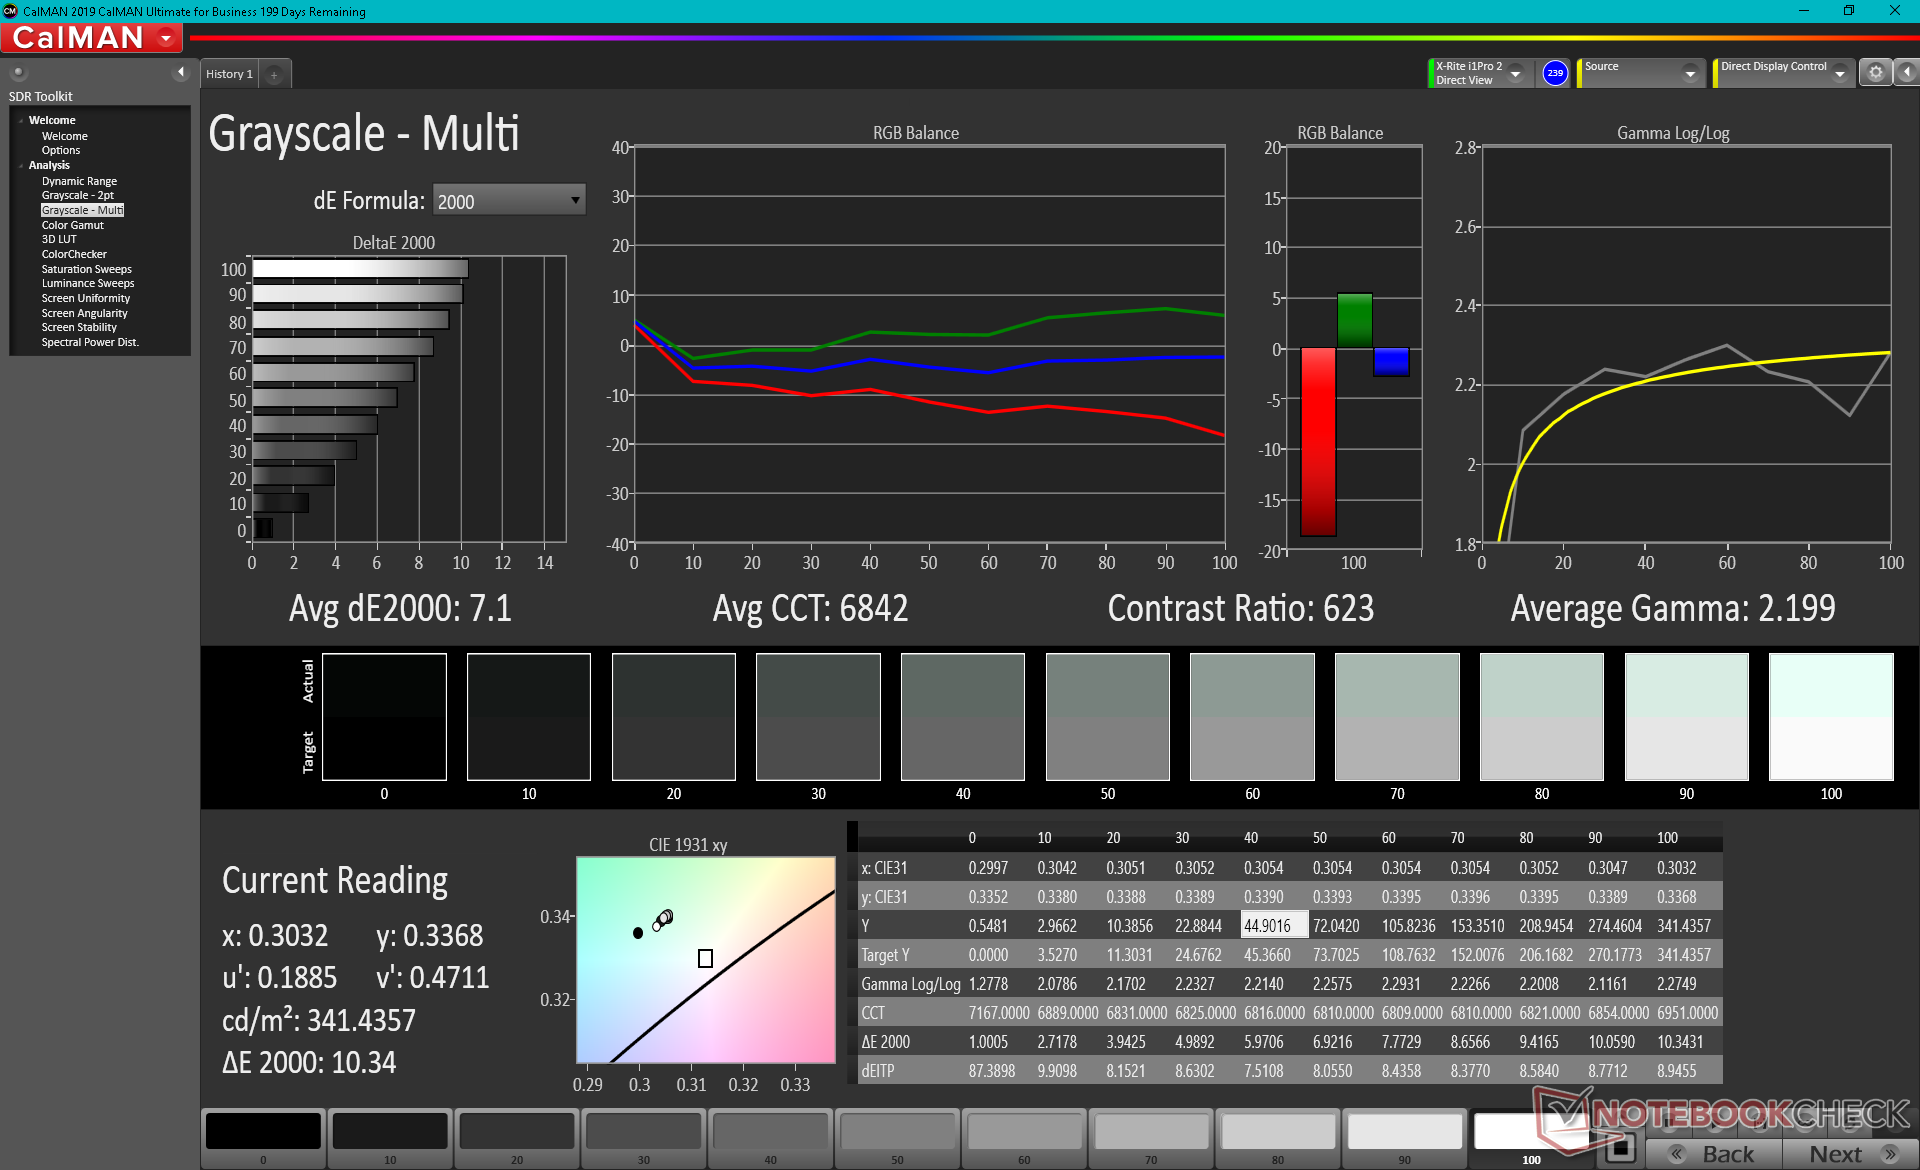
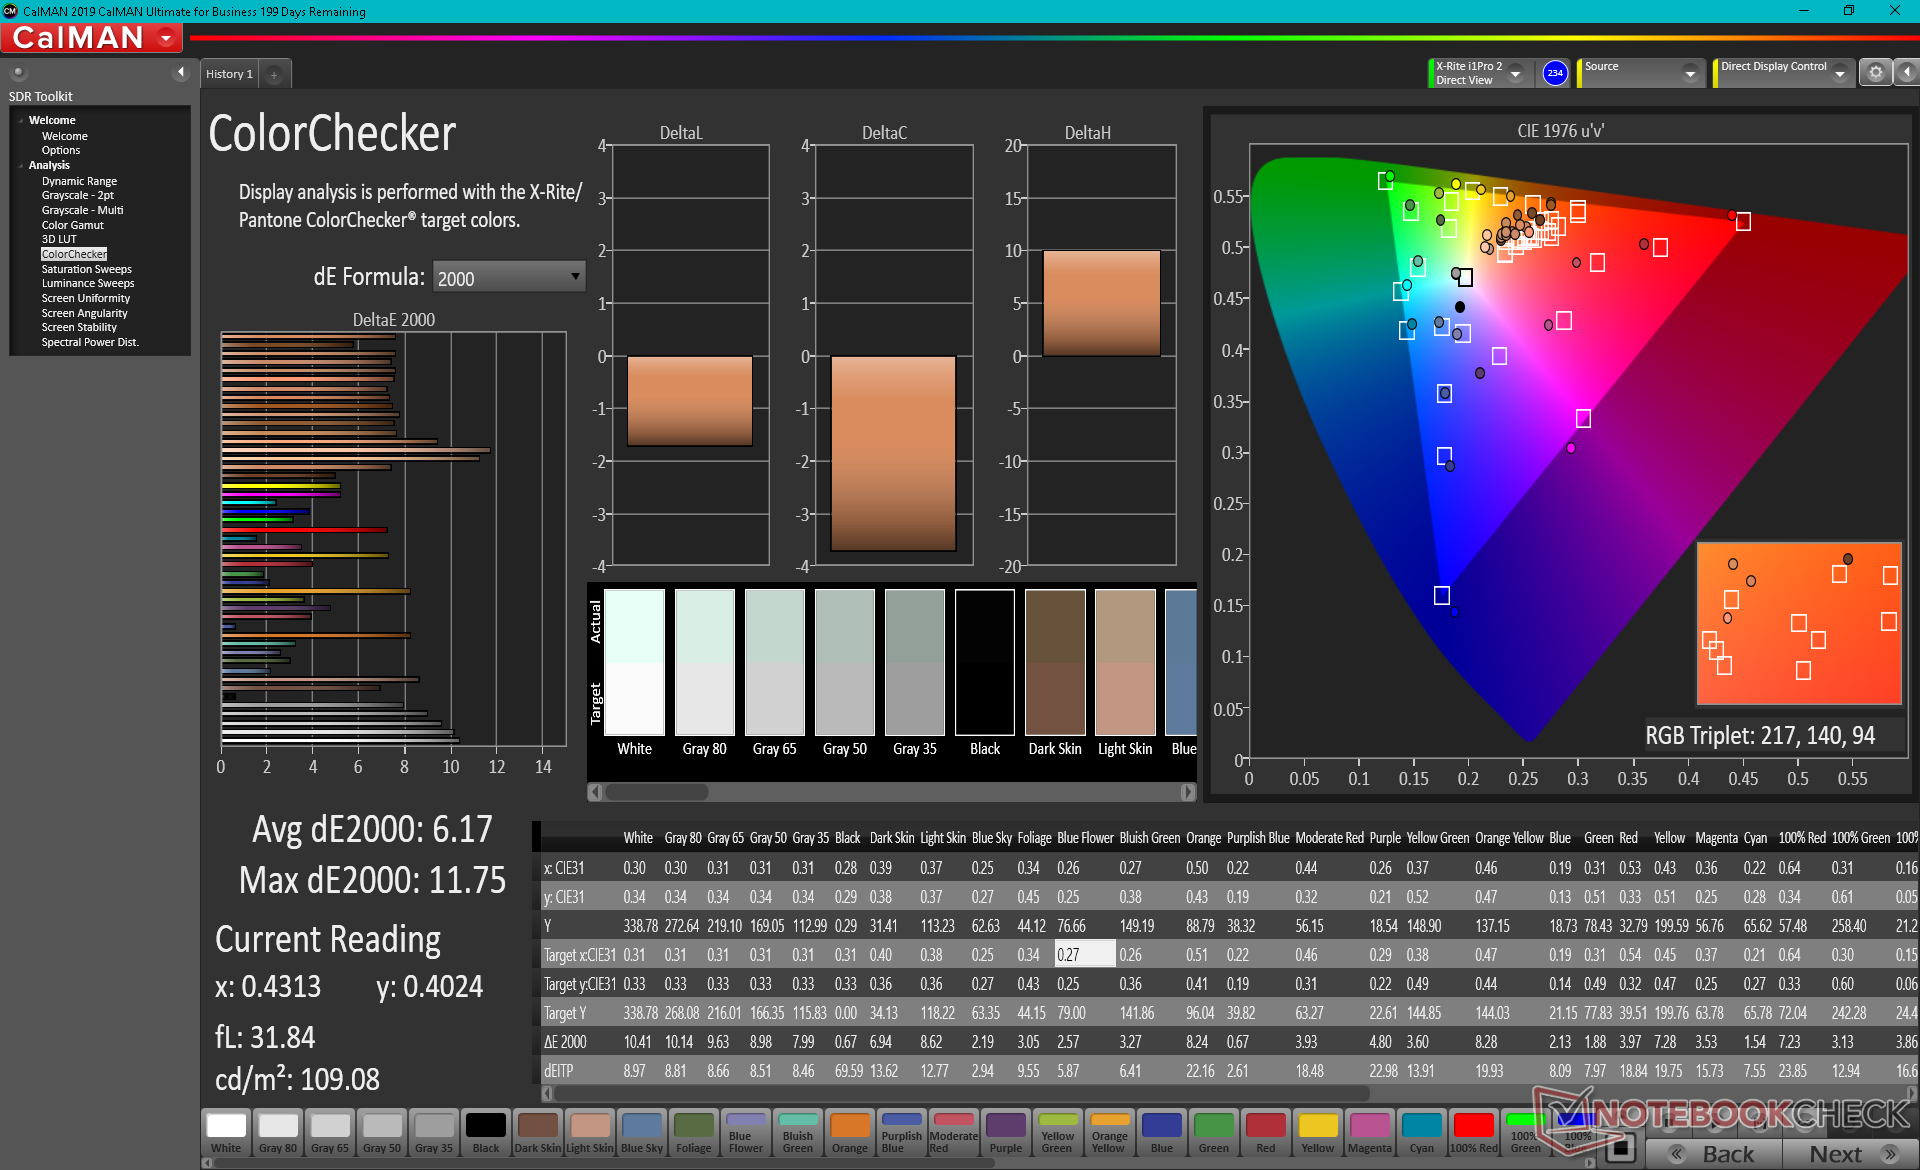
ΔE ColorChecker Calman: 6.17 | ∀{0.5-29.43 Ø4.72}
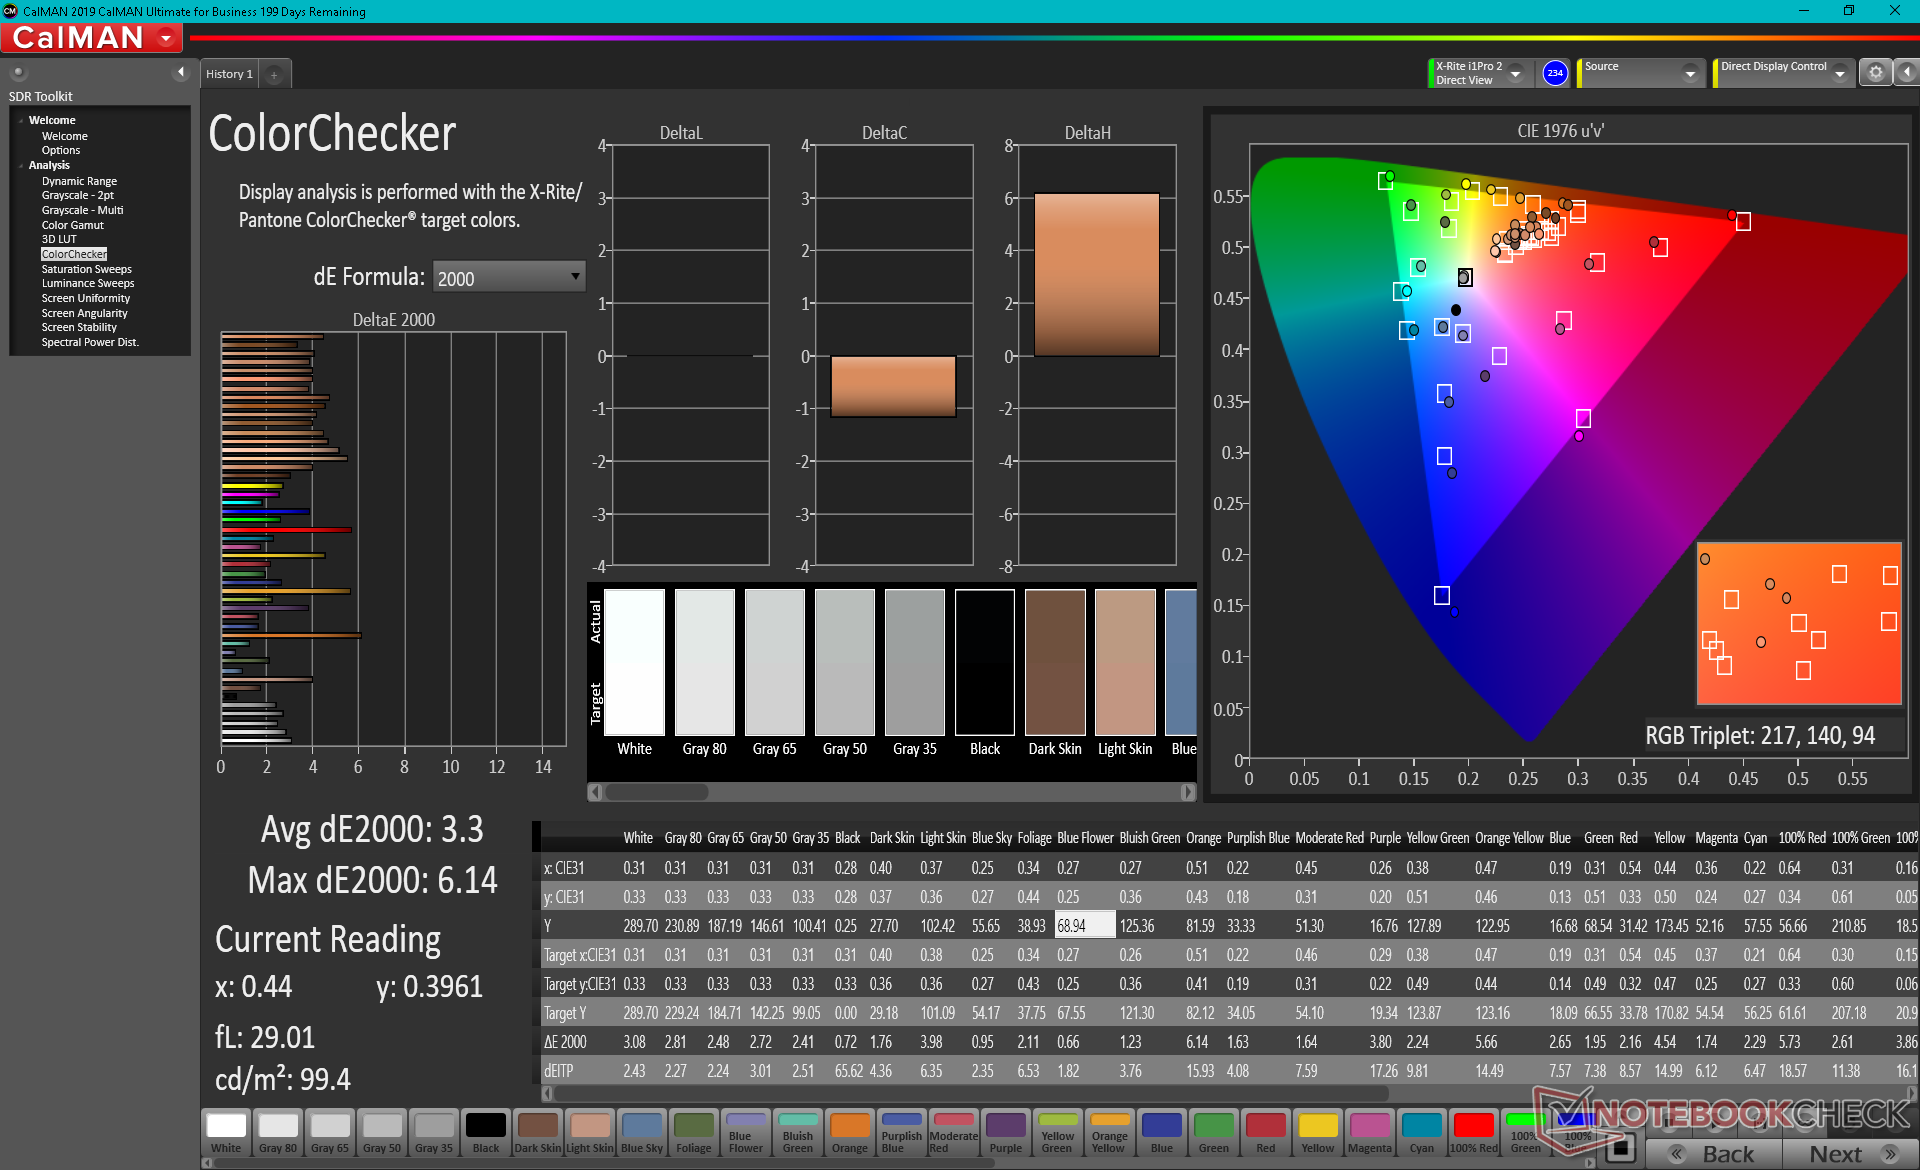
calibrated: 3.3
ΔE Greyscale Calman: 7.1 | ∀{0.09-98 Ø4.97}
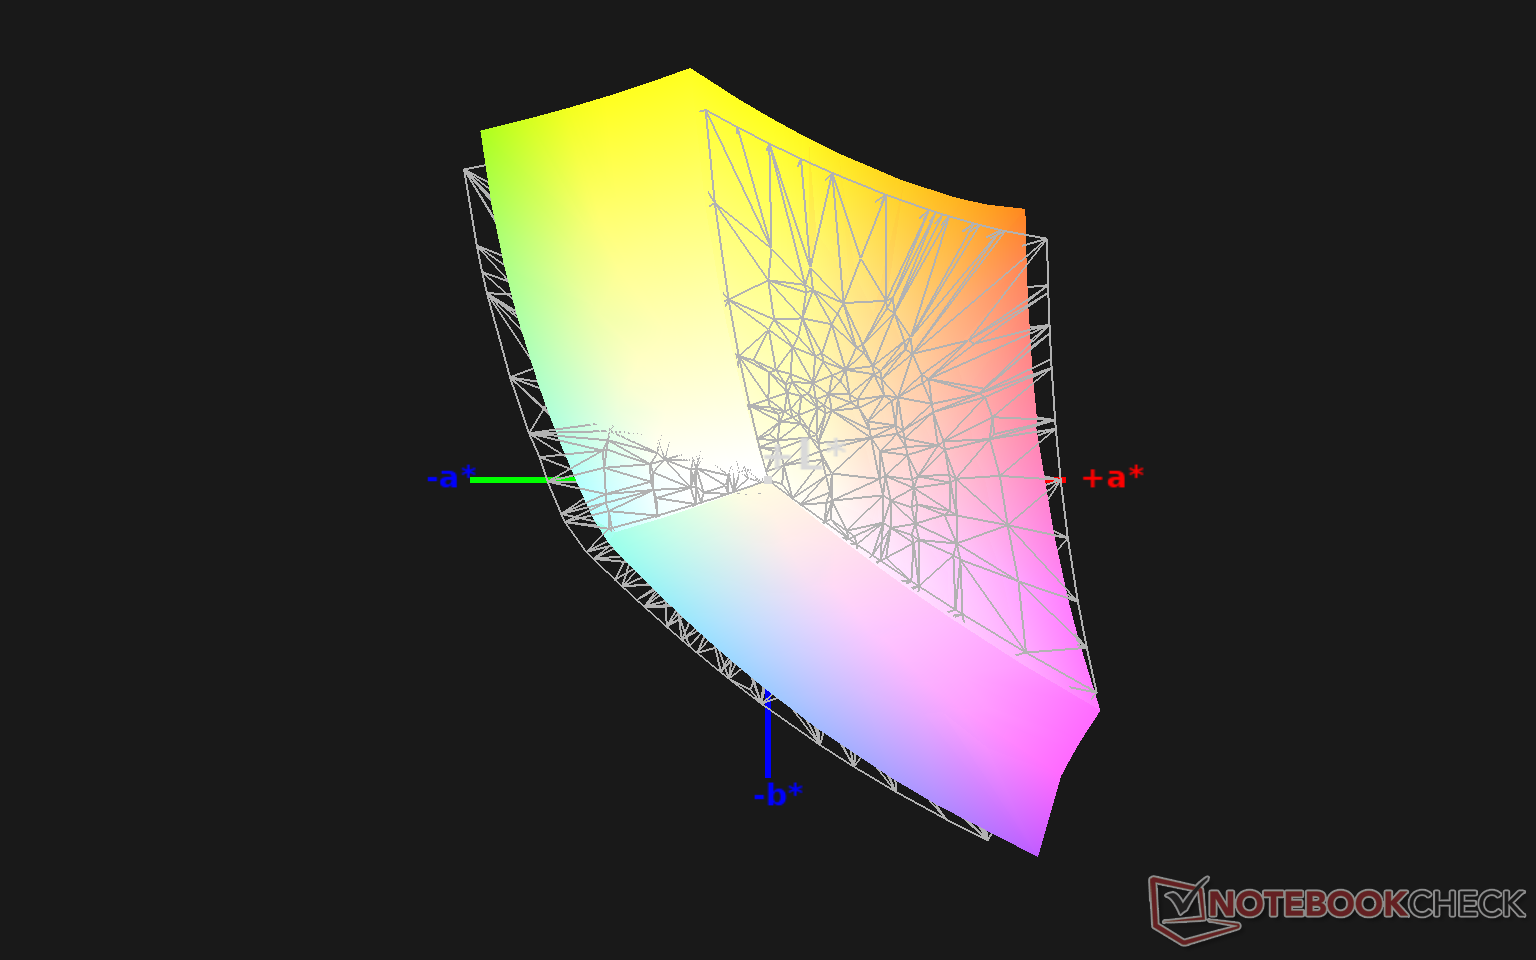
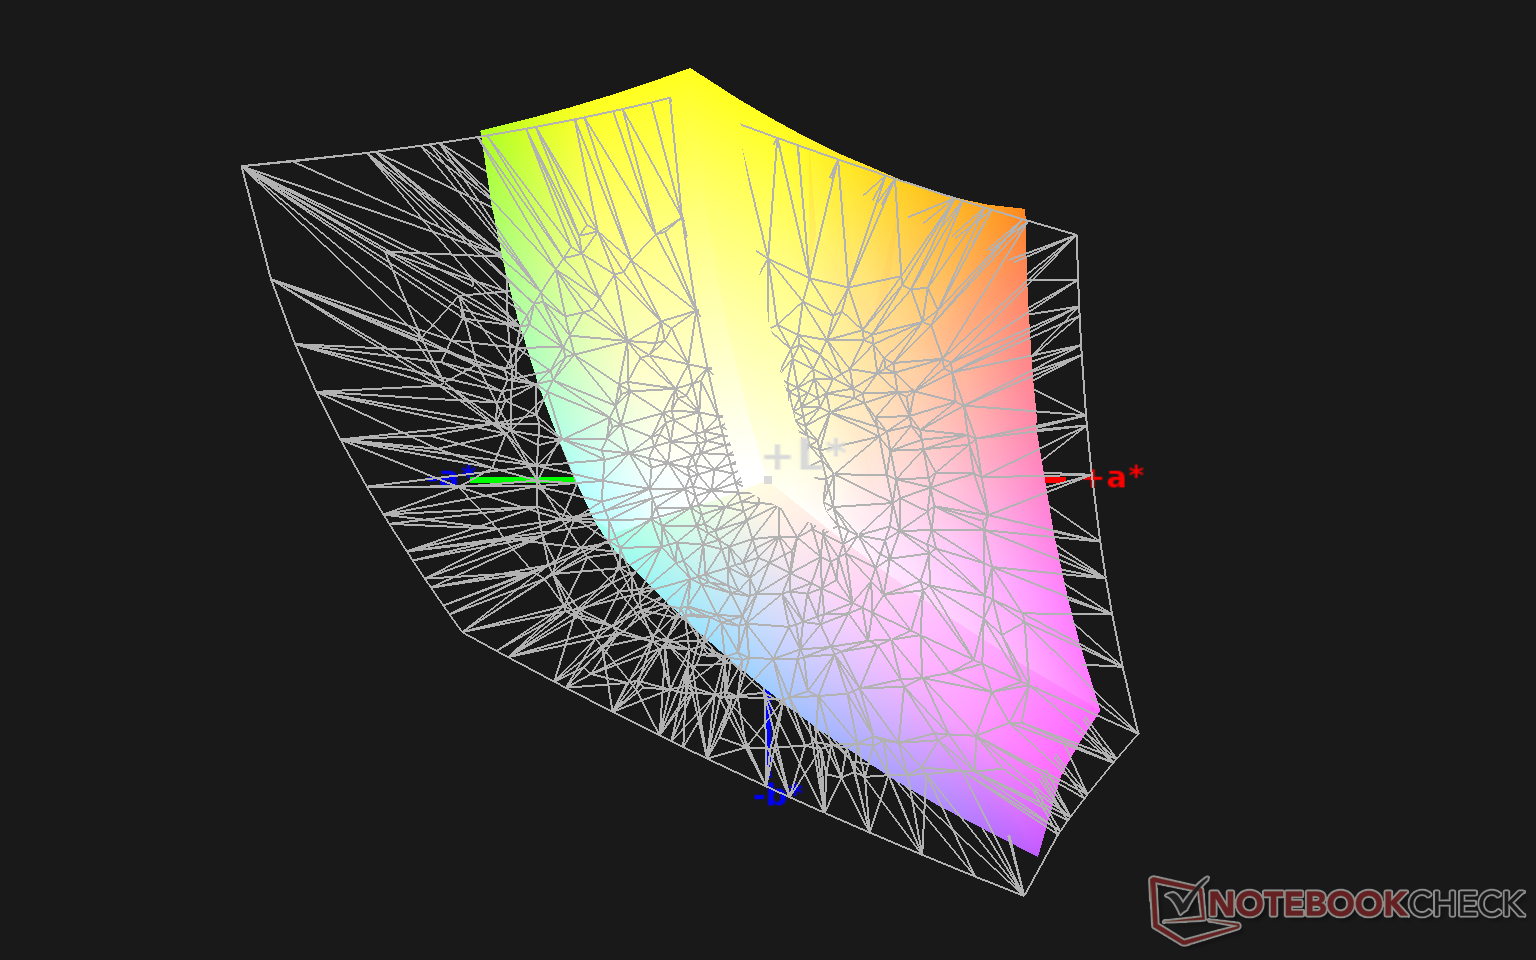
90.1% sRGB (Argyll 1.6.3 3D)
58.7% AdobeRGB 1998 (Argyll 1.6.3 3D)
66% AdobeRGB 1998 (Argyll 3D)
90.6% sRGB (Argyll 3D)
65.7% Display P3 (Argyll 3D)
Gamma: 2.2
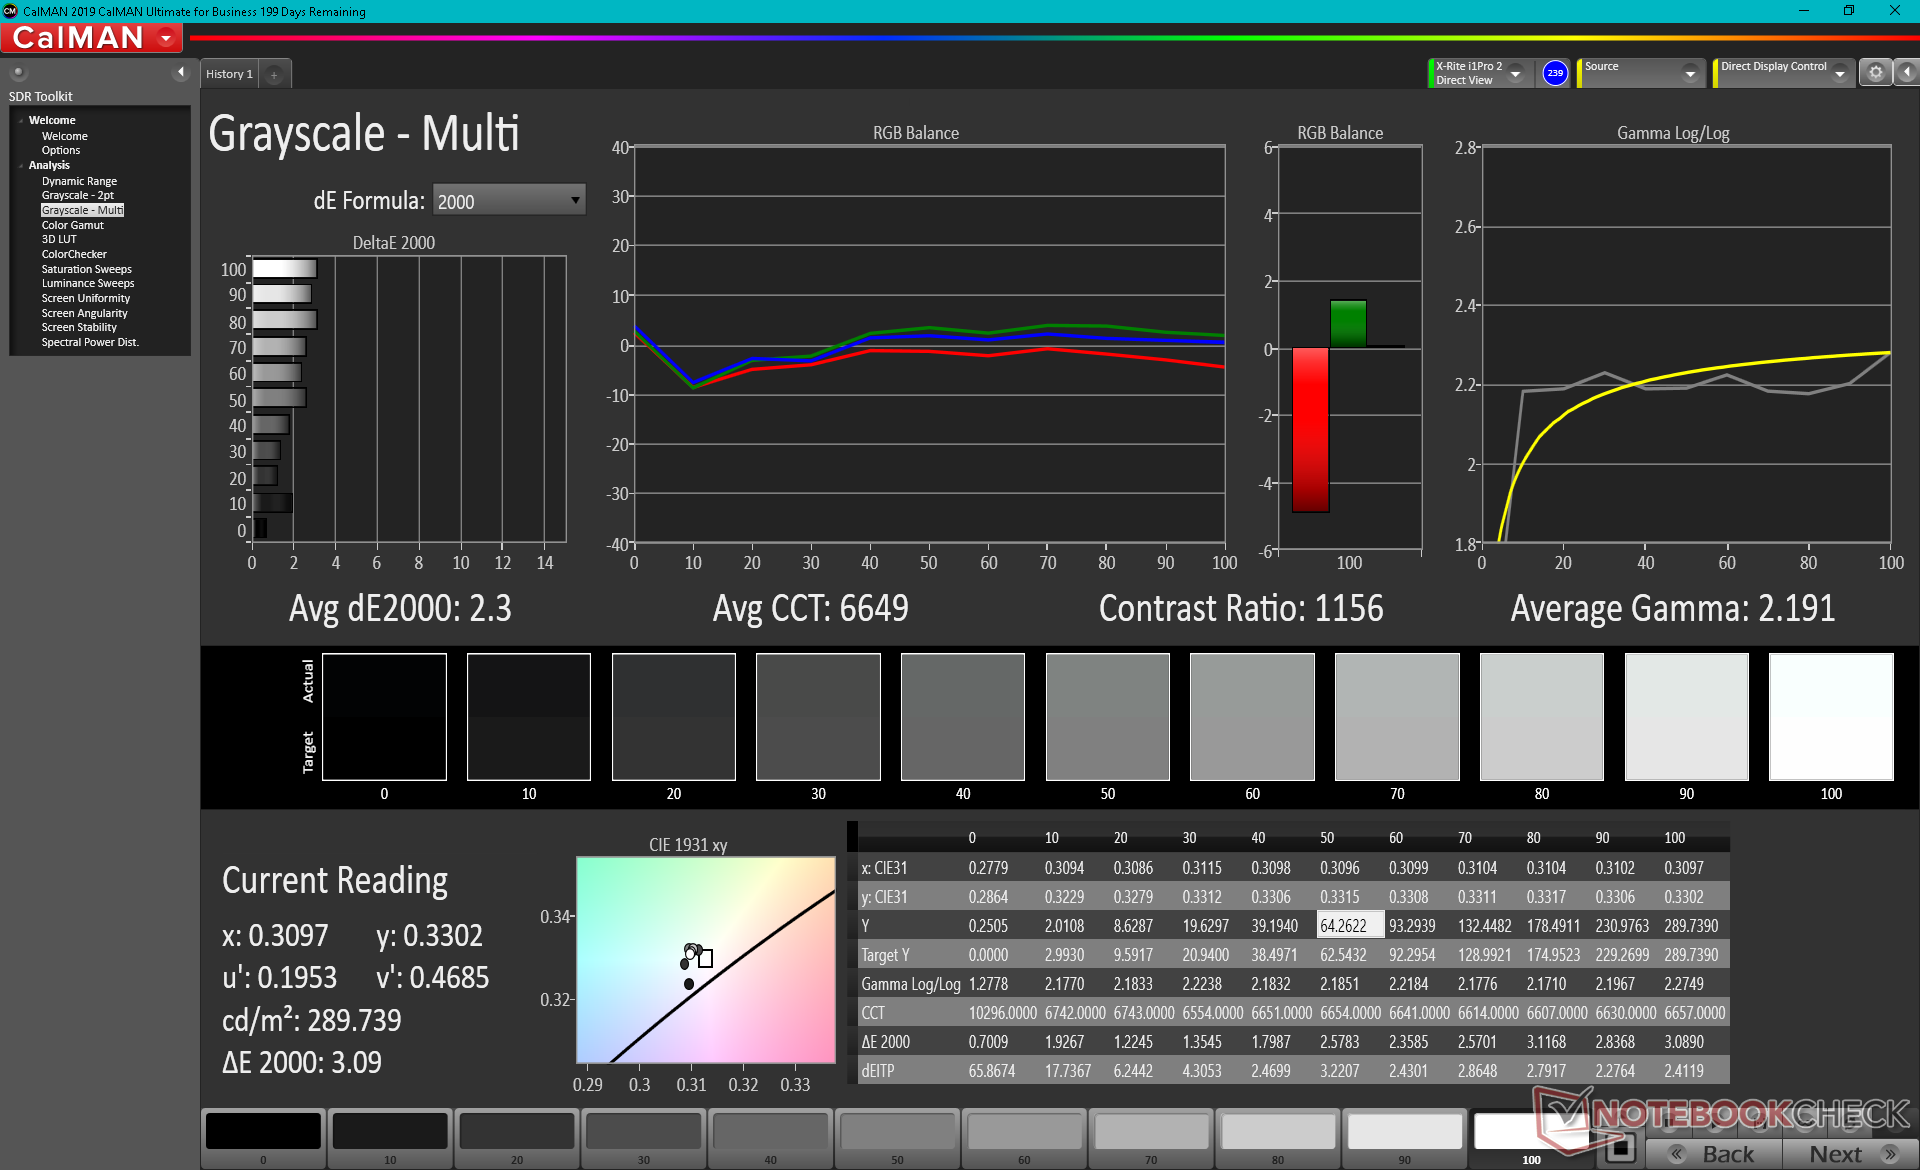
CCT: 6842 K
| MSI Summit B15 A11M Chi Mei N156HCE-EN1, IPS, 15.6", 1920x1080 | MSI Summit E15 A11SCST AU Optronics B156HAB03.1, IPS, 15.6", 1920x1080 | Dell XPS 15 9500 Core i5 Sharp LQ156N1, IPS, 15.6", 1920x1200 | HP Spectre X360 15-5ZV31AV AU Optronics AUO30EB, IPS, 15.6", 3840x2160 | ADATA XPG Xenia Xe BOE08F5, IPS, 15.6", 1920x1080 | Asus ZenBook 15 UX534FTC-A8190T BOE CQ NV156FHM-N63, IPS, 15.6", 1920x1080 | |
|---|---|---|---|---|---|---|
| Display | -1% | 18% | 4% | 7% | -4% | |
| Display P3 Coverage (%) | 65.7 | 64.5 -2% | 81.5 24% | 68.3 4% | 70 7% | 65 -1% |
| sRGB Coverage (%) | 90.6 | 89.3 -1% | 100 10% | 94.3 4% | 95.2 5% | 86.2 -5% |
| AdobeRGB 1998 Coverage (%) | 66 | 65.3 -1% | 79.6 21% | 68.4 4% | 71.2 8% | 62.9 -5% |
| Response Times | -1% | 4% | -34% | -31% | -5% | |
| Response Time Grey 50% / Grey 80% * (ms) | 40.4 ? | 43.2 ? -7% | 42 ? -4% | 56.8 ? -41% | 56.8 ? -41% | 45 ? -11% |
| Response Time Black / White * (ms) | 32.4 ? | 30.8 ? 5% | 28.8 ? 11% | 40.8 ? -26% | 38.8 ? -20% | 32 ? 1% |
| PWM Frequency (Hz) | 25510 ? | |||||
| Screen | 20% | 41% | 22% | 39% | 22% | |
| Brightness middle (cd/m²) | 341.3 | 298 -13% | 592 73% | 284.6 -17% | 480.4 41% | 299 -12% |
| Brightness (cd/m²) | 310 | 280 -10% | 565 82% | 285 -8% | 451 45% | 280 -10% |
| Brightness Distribution (%) | 81 | 90 11% | 85 5% | 85 5% | 88 9% | 89 10% |
| Black Level * (cd/m²) | 0.45 | 0.22 51% | 0.46 -2% | 0.25 44% | 0.31 31% | 0.21 53% |
| Contrast (:1) | 758 | 1355 79% | 1287 70% | 1138 50% | 1550 104% | 1424 88% |
| Colorchecker dE 2000 * | 6.17 | 5.41 12% | 3.19 48% | 3.52 43% | 2.53 59% | 4.76 23% |
| Colorchecker dE 2000 max. * | 11.75 | 8.59 27% | 5.45 54% | 5.56 53% | 7.28 38% | 9 23% |
| Colorchecker dE 2000 calibrated * | 3.3 | 2.97 10% | 2.03 38% | 3 9% | 1.69 49% | |
| Greyscale dE 2000 * | 7.1 | 4.1 42% | 3.9 45% | 3.2 55% | 3.8 46% | 3.53 50% |
| Gamma | 2.2 100% | 2.334 94% | 2.25 98% | 2.28 96% | 2.15 102% | 2.3 96% |
| CCT | 6842 95% | 7025 93% | 6522 100% | 7070 92% | 6760 96% | 7228 90% |
| Color Space (Percent of AdobeRGB 1998) (%) | 58.7 | 65 11% | 71.6 22% | 61.1 4% | 63 7% | 56 -5% |
| Color Space (Percent of sRGB) (%) | 90.1 | 90 0% | 100 11% | 93.8 4% | 94.9 5% | 86 -5% |
| Moyenne finale (programmes/paramètres) | 6% /
13% | 21% /
32% | -3% /
12% | 5% /
25% | 4% /
13% |
* ... Moindre est la valeur, meilleures sont les performances
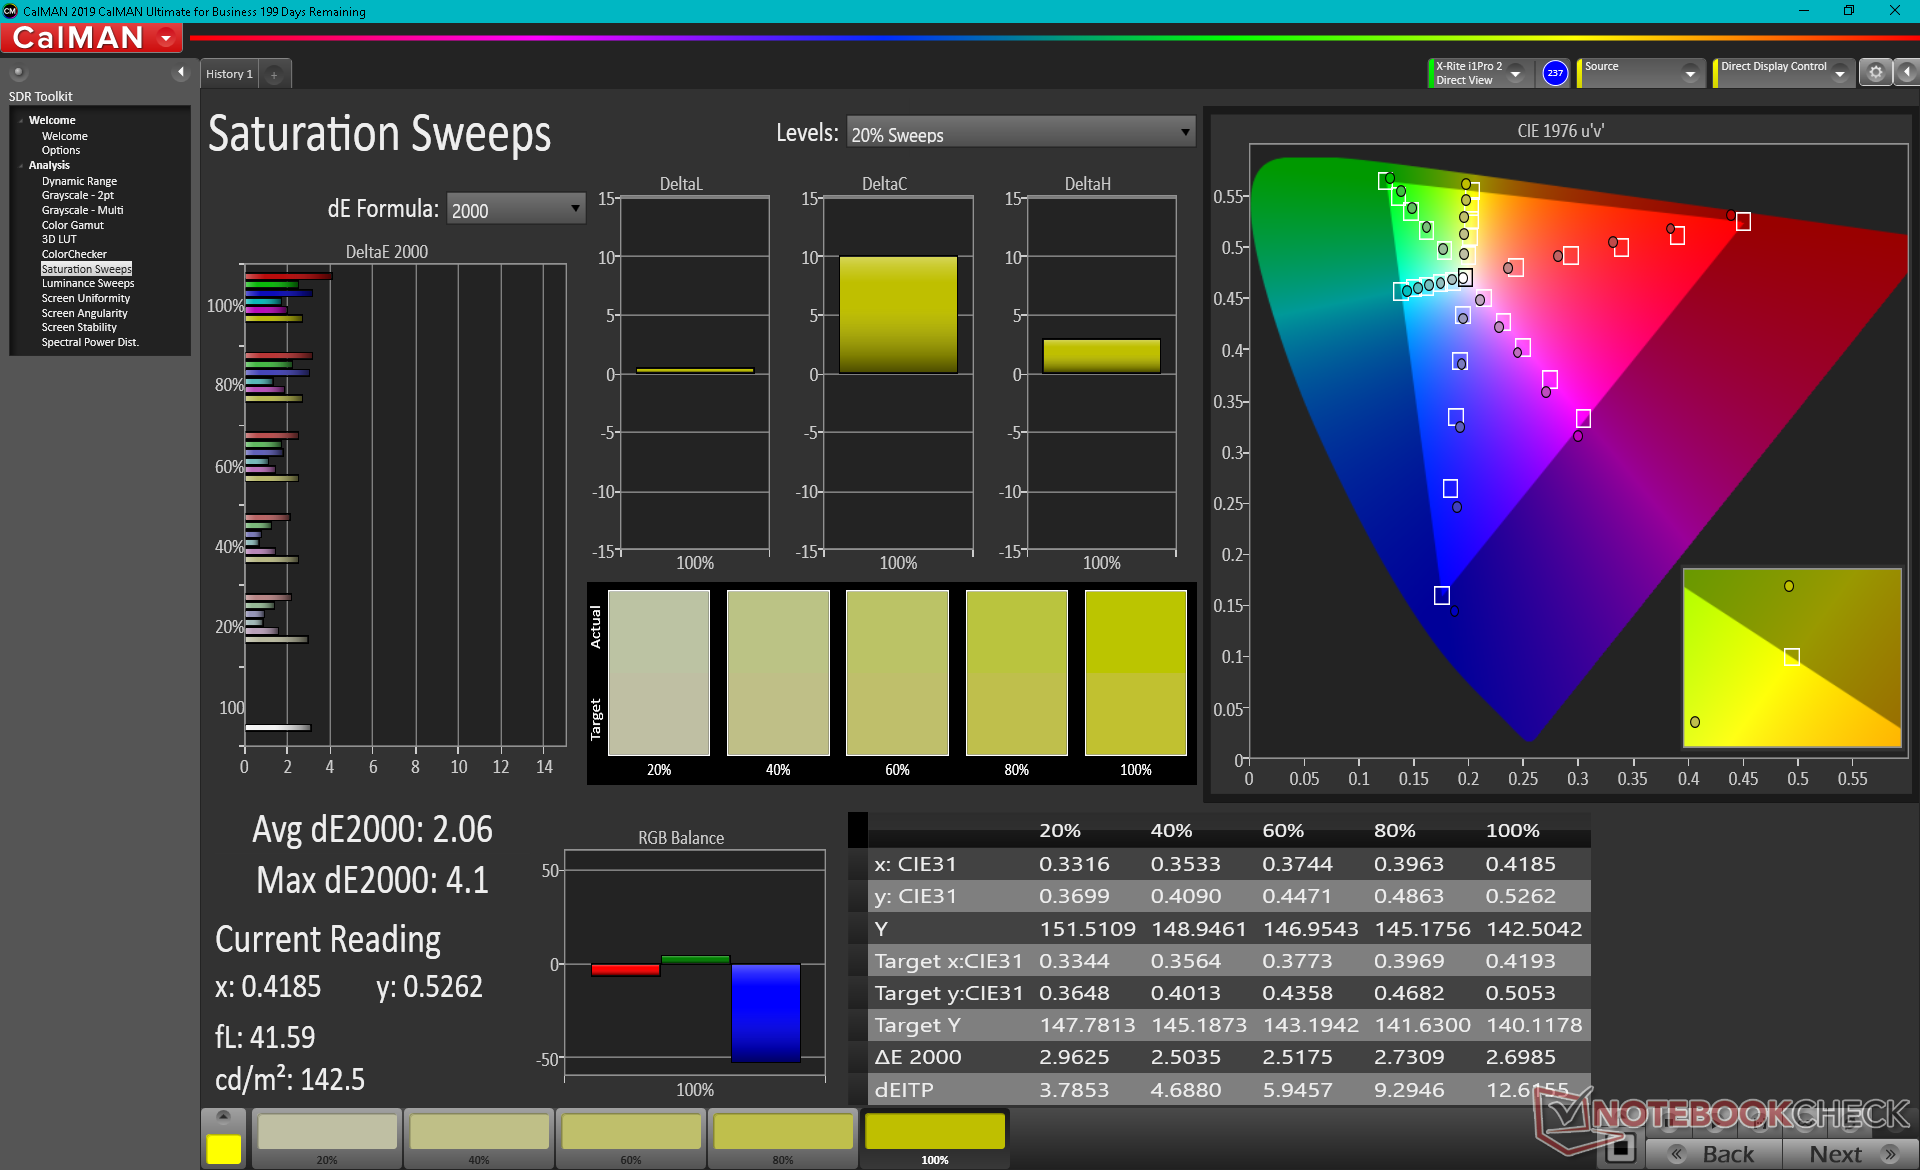
L'espace couleur couvre environ 90 % de sRGB, ce qui est suffisant pour l'éditeur graphique occasionnel visé. Vous devrez dépenser plus pour les modèles 4K ou OLED de Dell, HP ou autres si vous souhaitez couvrir AdobeRGB.
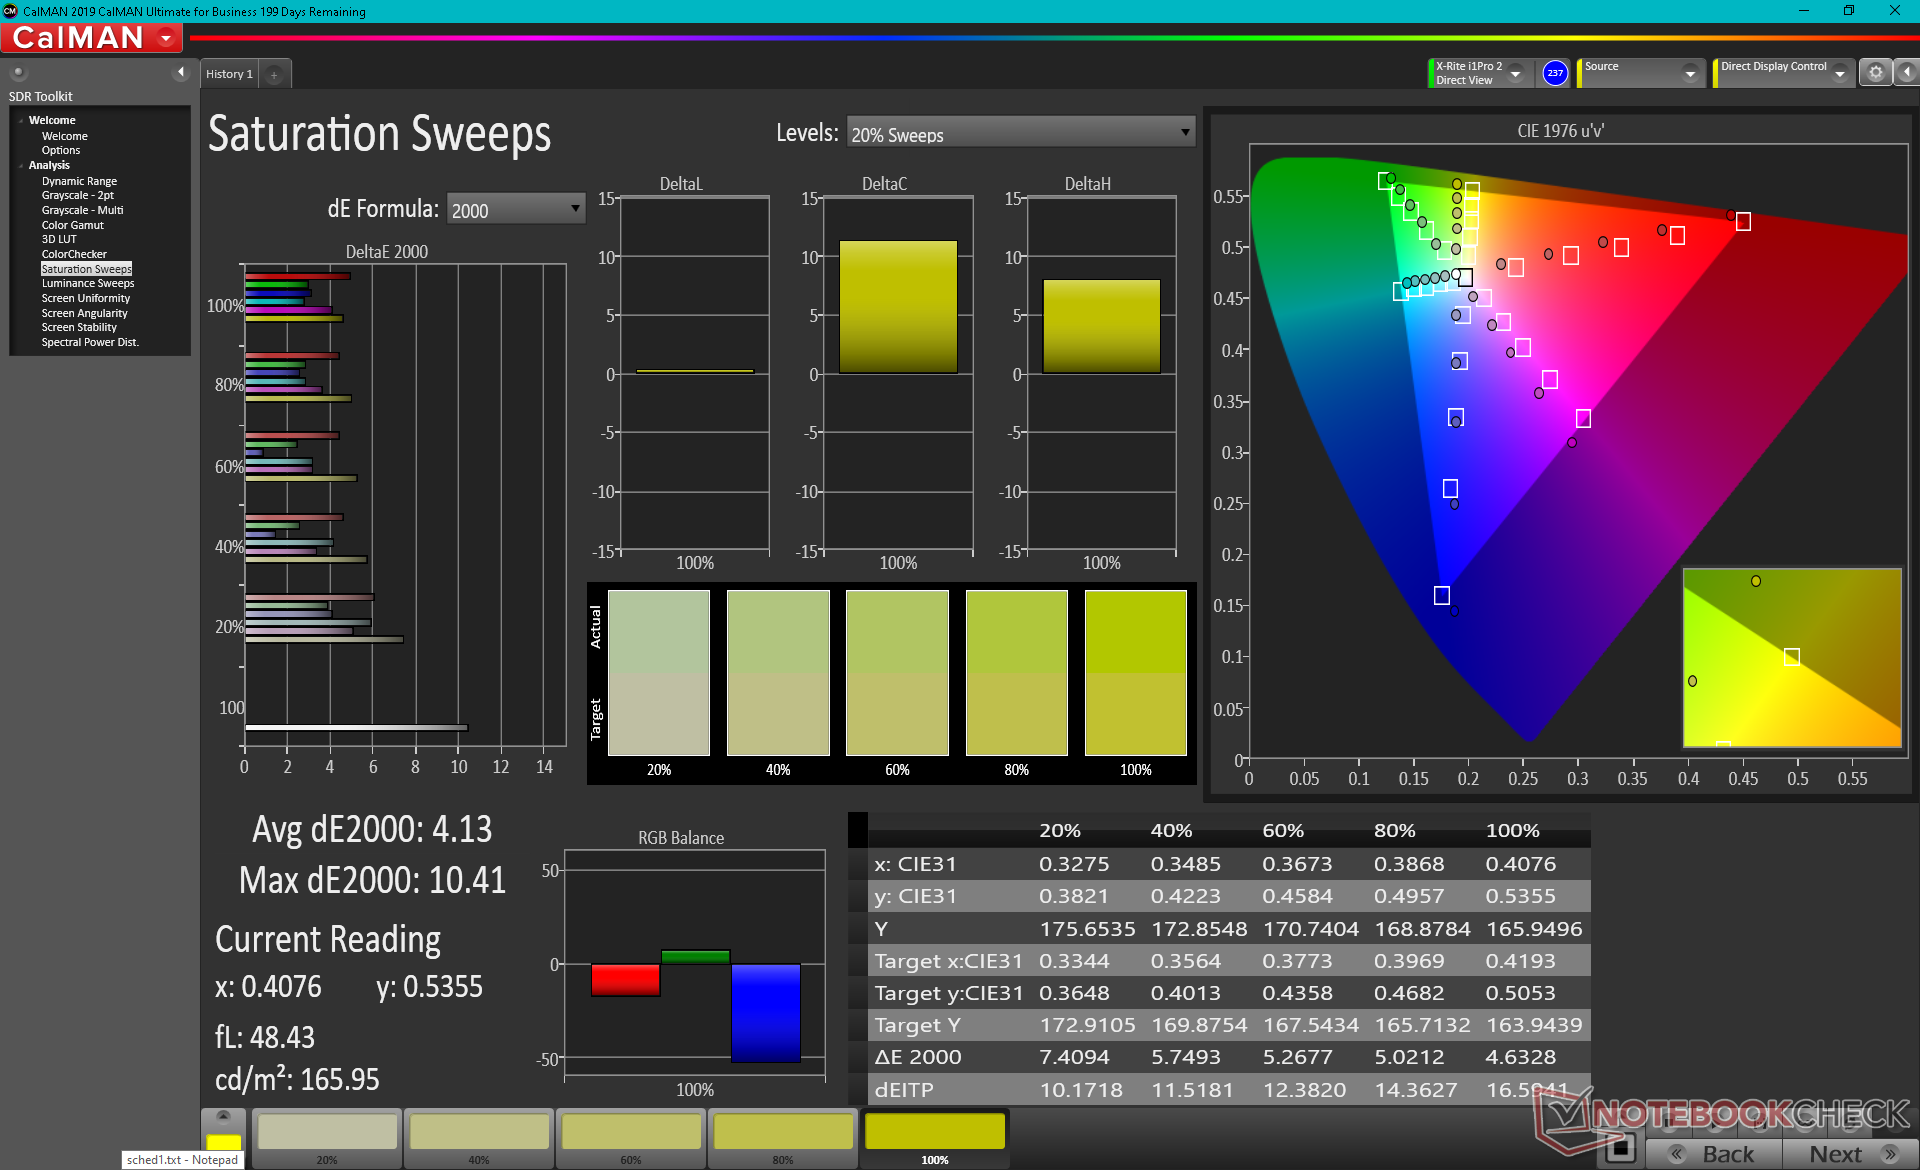
Les mesures du colorimètre X-Rite révèlent une température de couleur trop froide dès la sortie de la boîte, ce qui entraîne une mauvaise reproduction des niveaux de gris et des couleurs, malgré une couverture sRGB relativement élevée de 90 %. Ces données sont logiques car MSI ne pré-calibre pas la série Summit B15 en usine. Les couleurs et les niveaux de gris s'améliorent considérablement après le calibrage avec des valeurs DeltaE moyennes beaucoup plus faibles. Nous recommandons d'appliquer notre profil ICM calibré pour un affichage plus précis des couleurs.
Temps de réponse de l'écran
| ↔ Temps de réponse noir à blanc | ||
|---|---|---|
| 32.4 ms ... hausse ↗ et chute ↘ combinées | ↗ 18.4 ms hausse | 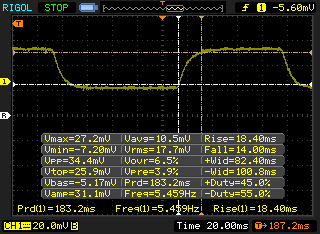 |
| ↘ 14 ms chute | ||
| L'écran souffre de latences très élevées, à éviter pour le jeu. En comparaison, tous les appareils testés affichent entre 0.1 (minimum) et 240 (maximum) ms. » 88 % des appareils testés affichent de meilleures performances. Cela signifie que les latences relevées sont moins bonnes que la moyenne (19.8 ms) de tous les appareils testés. | ||
| ↔ Temps de réponse gris 50% à gris 80% | ||
| 40.4 ms ... hausse ↗ et chute ↘ combinées | ↗ 20.4 ms hausse | 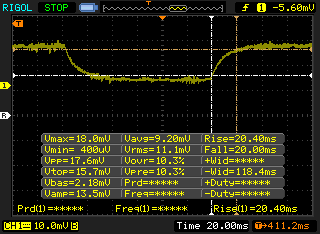 |
| ↘ 20 ms chute | ||
| L'écran souffre de latences très élevées, à éviter pour le jeu. En comparaison, tous les appareils testés affichent entre 0.165 (minimum) et 636 (maximum) ms. » 64 % des appareils testés affichent de meilleures performances. Cela signifie que les latences relevées sont moins bonnes que la moyenne (31 ms) de tous les appareils testés. | ||
Scintillement / MLI (Modulation de largeur d'impulsion)
| Scintillement / MLI (Modulation de largeur d'impulsion) décelé | 25510 Hz | ≤ 25 Niveau de luminosité | 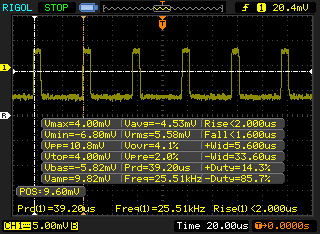 |
Le rétroéclairage de l'écran scintille à la fréquence de 25510 Hz (certainement du fait de l'utilisation d'une MDI - Modulation de largeur d'impulsion) à un niveau de luminosité inférieur ou égal à 25 % . Aucun scintillement ne devrait être perceptible au-dessus de cette valeur. La fréquence de rafraîchissement de 25510 Hz est élevée, la grande majorité des utilisateurs ne devrait pas percevoir de scintillements et être sujette à une fatigue oculaire accrue. En comparaison, 52 % des appareils testés n'emploient pas MDI pour assombrir leur écran. Nous avons relevé une moyenne à 7763 (minimum : 5 - maximum : 343500) Hz dans le cas où une MDI était active. | |||
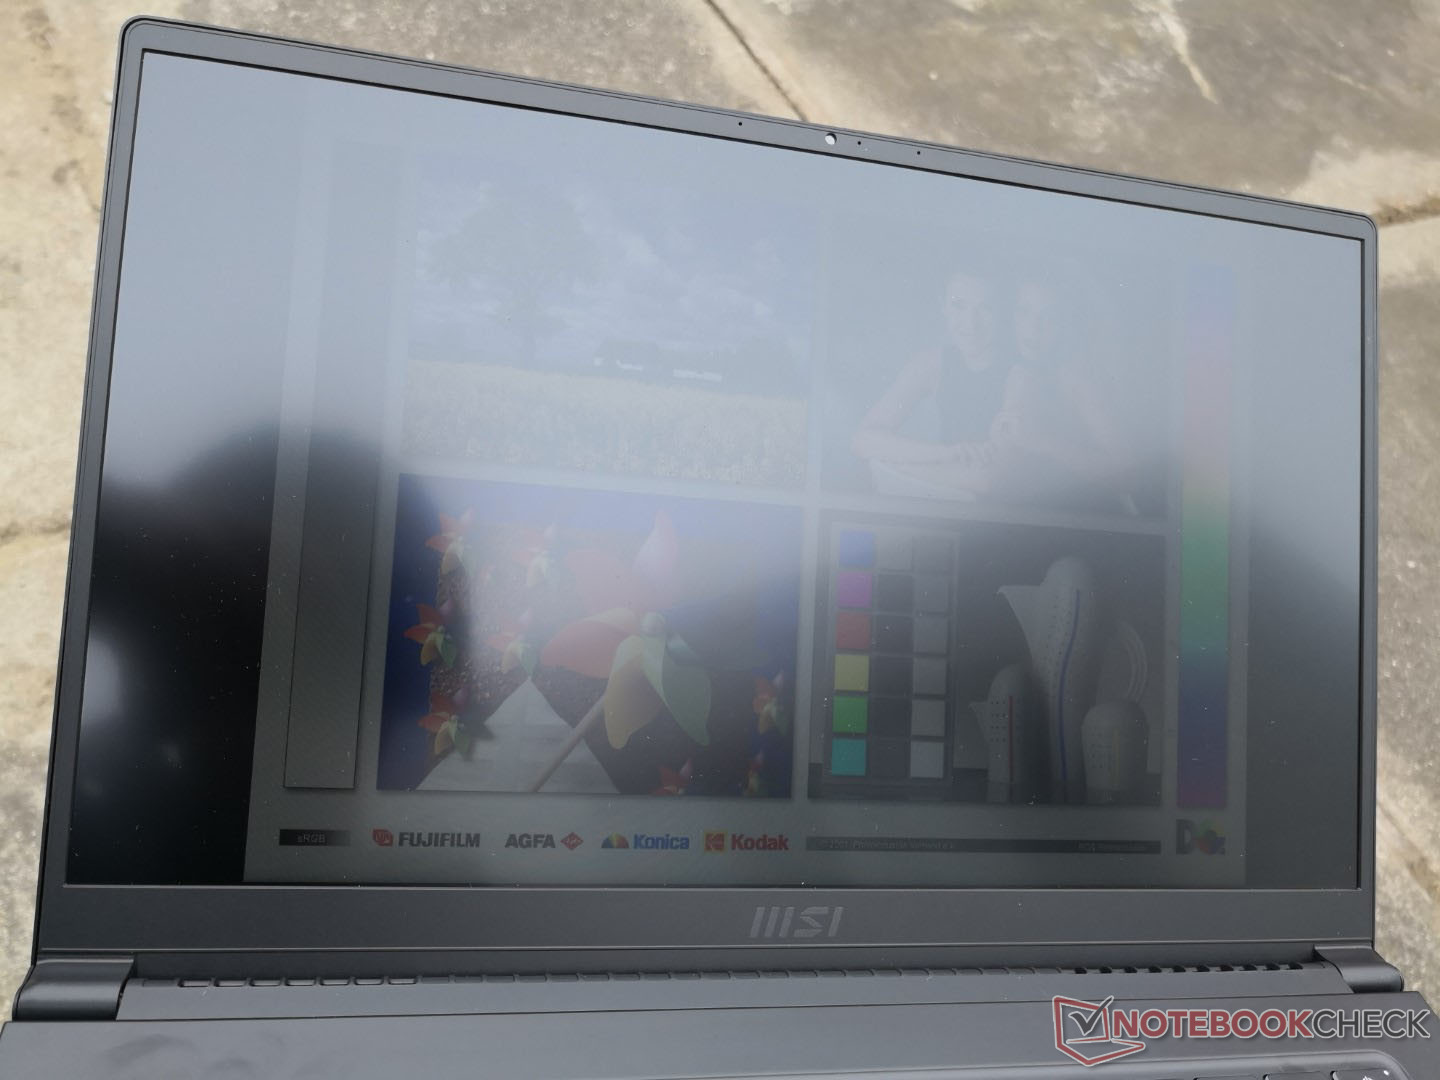
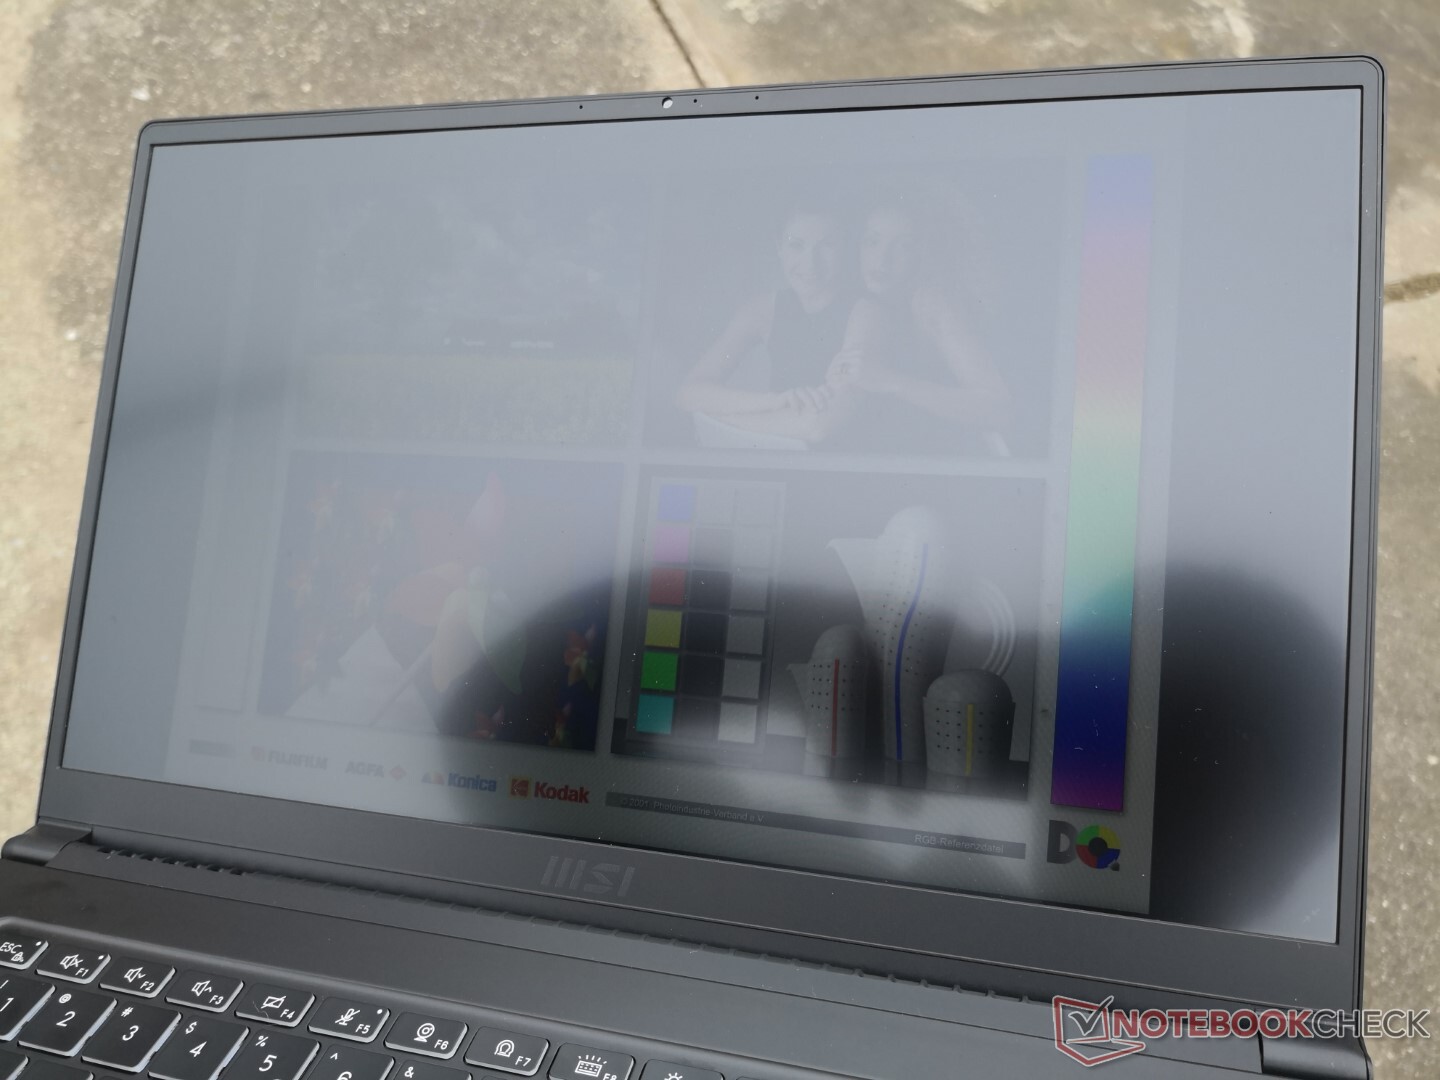
La visibilité extérieure n'est pas aussi bonne que celle du Dell XPS 15 ou du MacBook Pro 15 qui ont tous deux des écrans nettement plus lumineux. L'éblouissement n'est pas aussi important sur le MSI en raison de son panneau mat, mais l'écran est toujours difficile à voir confortablement dans la plupart des scénarios.
Performance
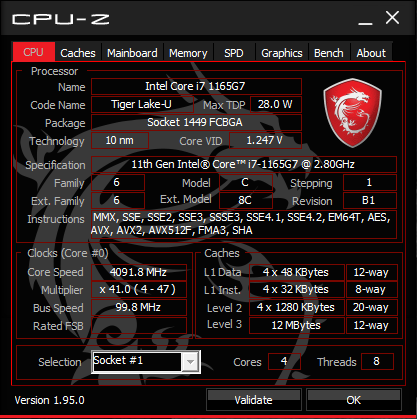
Seuls deux SKU sont disponibles à ce jour avec le Core i5-1135G7 ou le Core i7-1165G7 ULV. Pour des options Core H plus rapides, MSI propose plutôt la série Creator Z16.
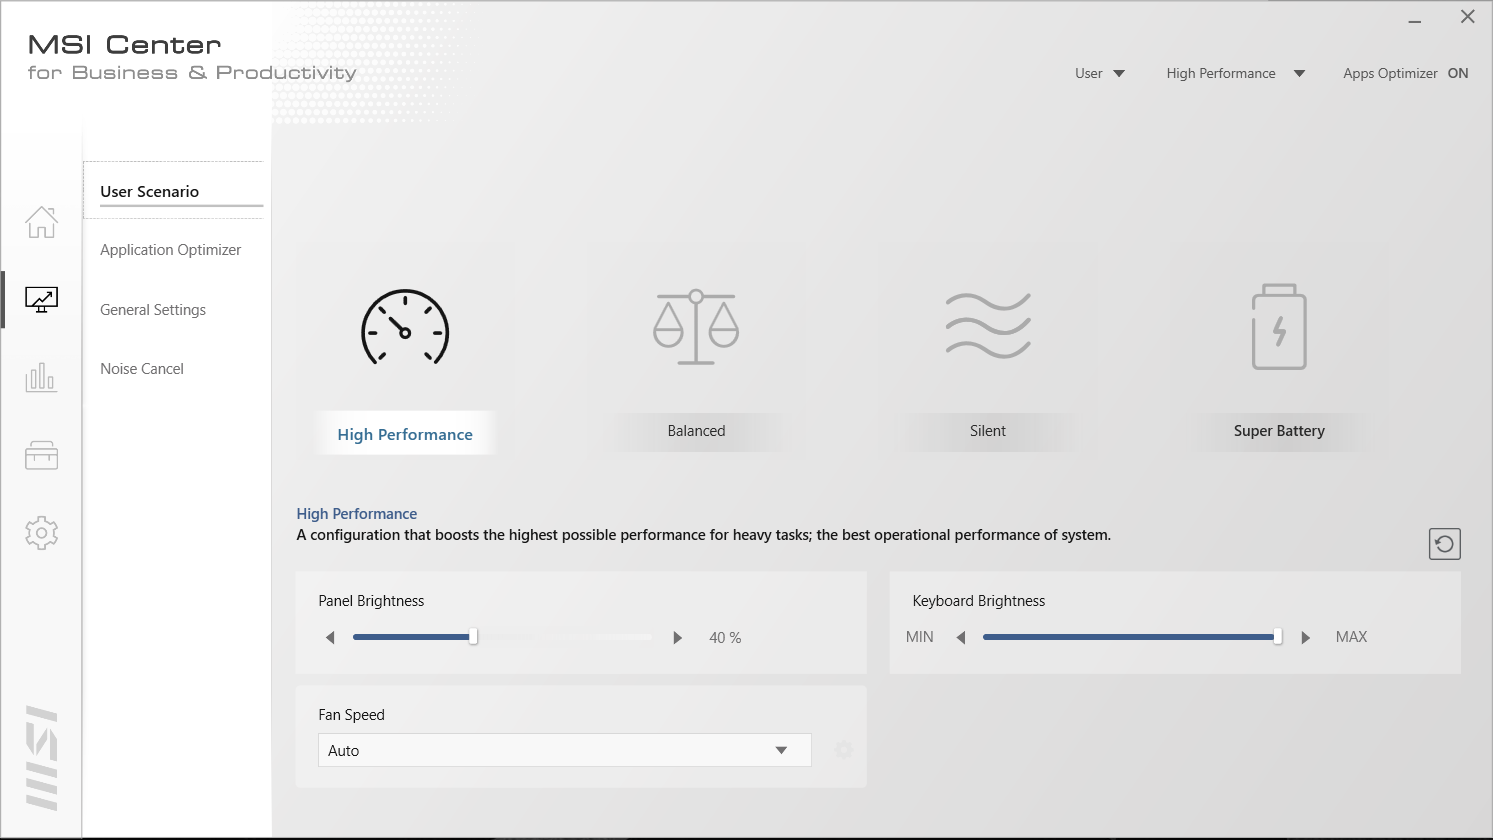
Notre appareil a été réglé en mode hautes performances via le MSI Center avant d'exécuter les tests de performances ci-dessous pour obtenir les meilleurs résultats possibles. Nous recommandons aux propriétaires de se familiariser avec ce logiciel car les mises à jour et les fonctionnalités spécifiques à MSI s'y trouvent.
Processeur
Les performances du CPU sont excellentes avec des scores CineBench R15 xT qui sont 12 pour cent plus rapides que la moyenne des ordinateurs portables de notre base de données équipés du même CPU. Les résultats de CineBench R20 et R23 sont encore meilleurs, avec 23 % de plus que la moyenne, ce qui implique une durabilité Turbo Boost supérieure à celle de la plupart des autres ordinateurs portables, puisque les tests de référence R20 et R23 sont nettement plus longs que R15. Le processeur est capable de surpasser de façon constante les performances du 10e génération du Core i7-10510U et Core i5-10300H dans le HP Spectre x360 15 et Dell XPS 15, respectivement.
En optant pour le moins cher Core i5-1135G7 au lieu de notre Core i7-1165G7 n'entraînera qu'une légère baisse de 7 à 10 % des performances du processeur, d'après notre expérience avec d'autres ordinateurs portables Core i5-1135G7.
Cinebench R23: Multi Core | Single Core
Cinebench R15: CPU Multi 64Bit | CPU Single 64Bit
Blender: v2.79 BMW27 CPU
7-Zip 18.03: 7z b 4 -mmt1 | 7z b 4
Geekbench 5.5: Single-Core | Multi-Core
HWBOT x265 Benchmark v2.2: 4k Preset
LibreOffice : 20 Documents To PDF
R Benchmark 2.5: Overall mean
| Cinebench R23 / Multi Core | |
| Lenovo IdeaPad Flex 5 14ALC05 82HU002YUS | |
| Lenovo Yoga Slim 7-14ARE | |
| MSI Summit B15 A11M | |
| MSI Summit E15 A11SCST | |
| Moyenne Intel Core i7-1165G7 (2525 - 6862, n=64) | |
| Cinebench R23 / Single Core | |
| MSI Summit B15 A11M | |
| MSI Summit E15 A11SCST | |
| Moyenne Intel Core i7-1165G7 (1110 - 1539, n=59) | |
| Lenovo IdeaPad Flex 5 14ALC05 82HU002YUS | |
| Lenovo Yoga Slim 7-14ARE | |
| HWBOT x265 Benchmark v2.2 / 4k Preset | |
| Lenovo Yoga Slim 7-14ARE | |
| Lenovo IdeaPad Flex 5 14ALC05 82HU002YUS | |
| Dell XPS 15 9500 Core i7 4K UHD | |
| Lenovo ThinkPad E15 Gen2-20T9S00K00 | |
| MSI Summit B15 A11M | |
| Dell XPS 15 9500 Core i5 | |
| Lenovo ThinkBook 15 Gen2 ITL | |
| MSI Summit E15 A11SCST | |
| Lenovo IdeaPad 5 15IIL05 | |
| Moyenne Intel Core i7-1165G7 (1.39 - 8.47, n=80) | |
Cinebench R23: Multi Core | Single Core
Cinebench R15: CPU Multi 64Bit | CPU Single 64Bit
Blender: v2.79 BMW27 CPU
7-Zip 18.03: 7z b 4 -mmt1 | 7z b 4
Geekbench 5.5: Single-Core | Multi-Core
HWBOT x265 Benchmark v2.2: 4k Preset
LibreOffice : 20 Documents To PDF
R Benchmark 2.5: Overall mean
* ... Moindre est la valeur, meilleures sont les performances
Performance du système
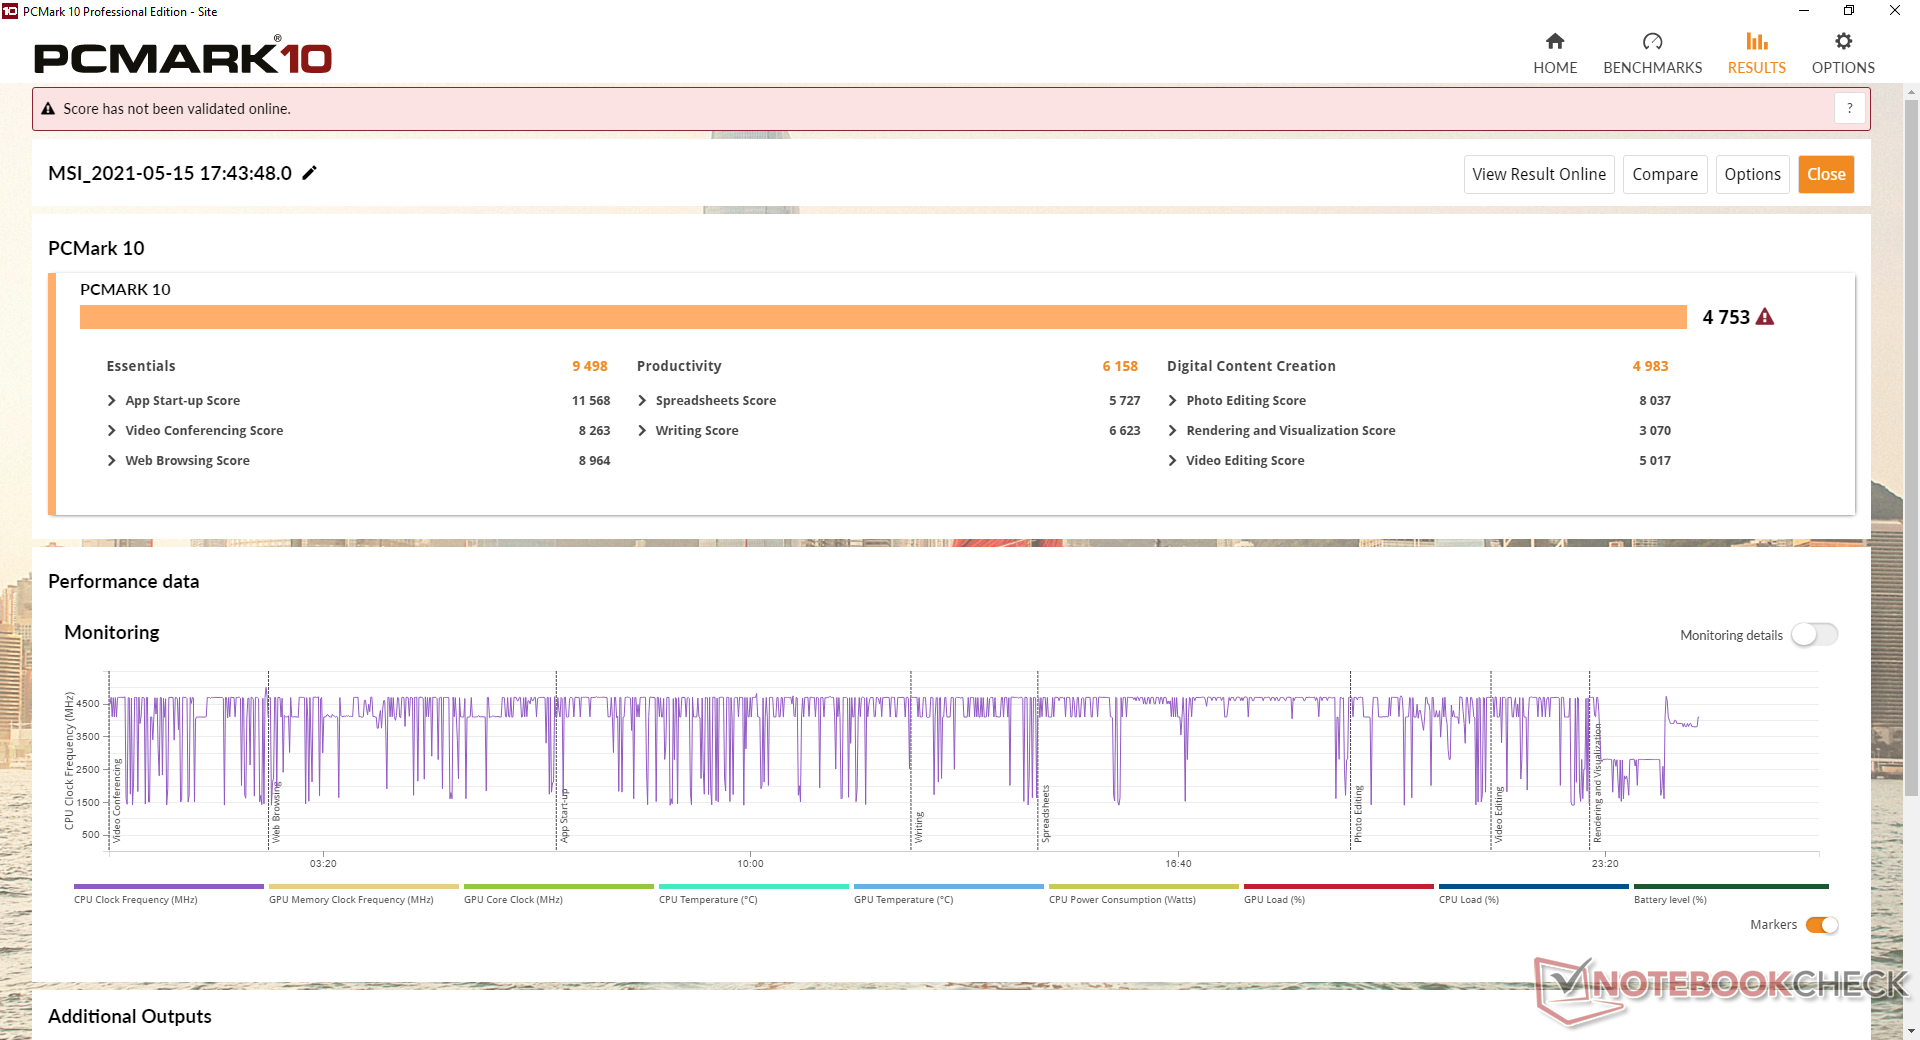
| PCMark 10 Score | 4753 points | |
Aide | ||
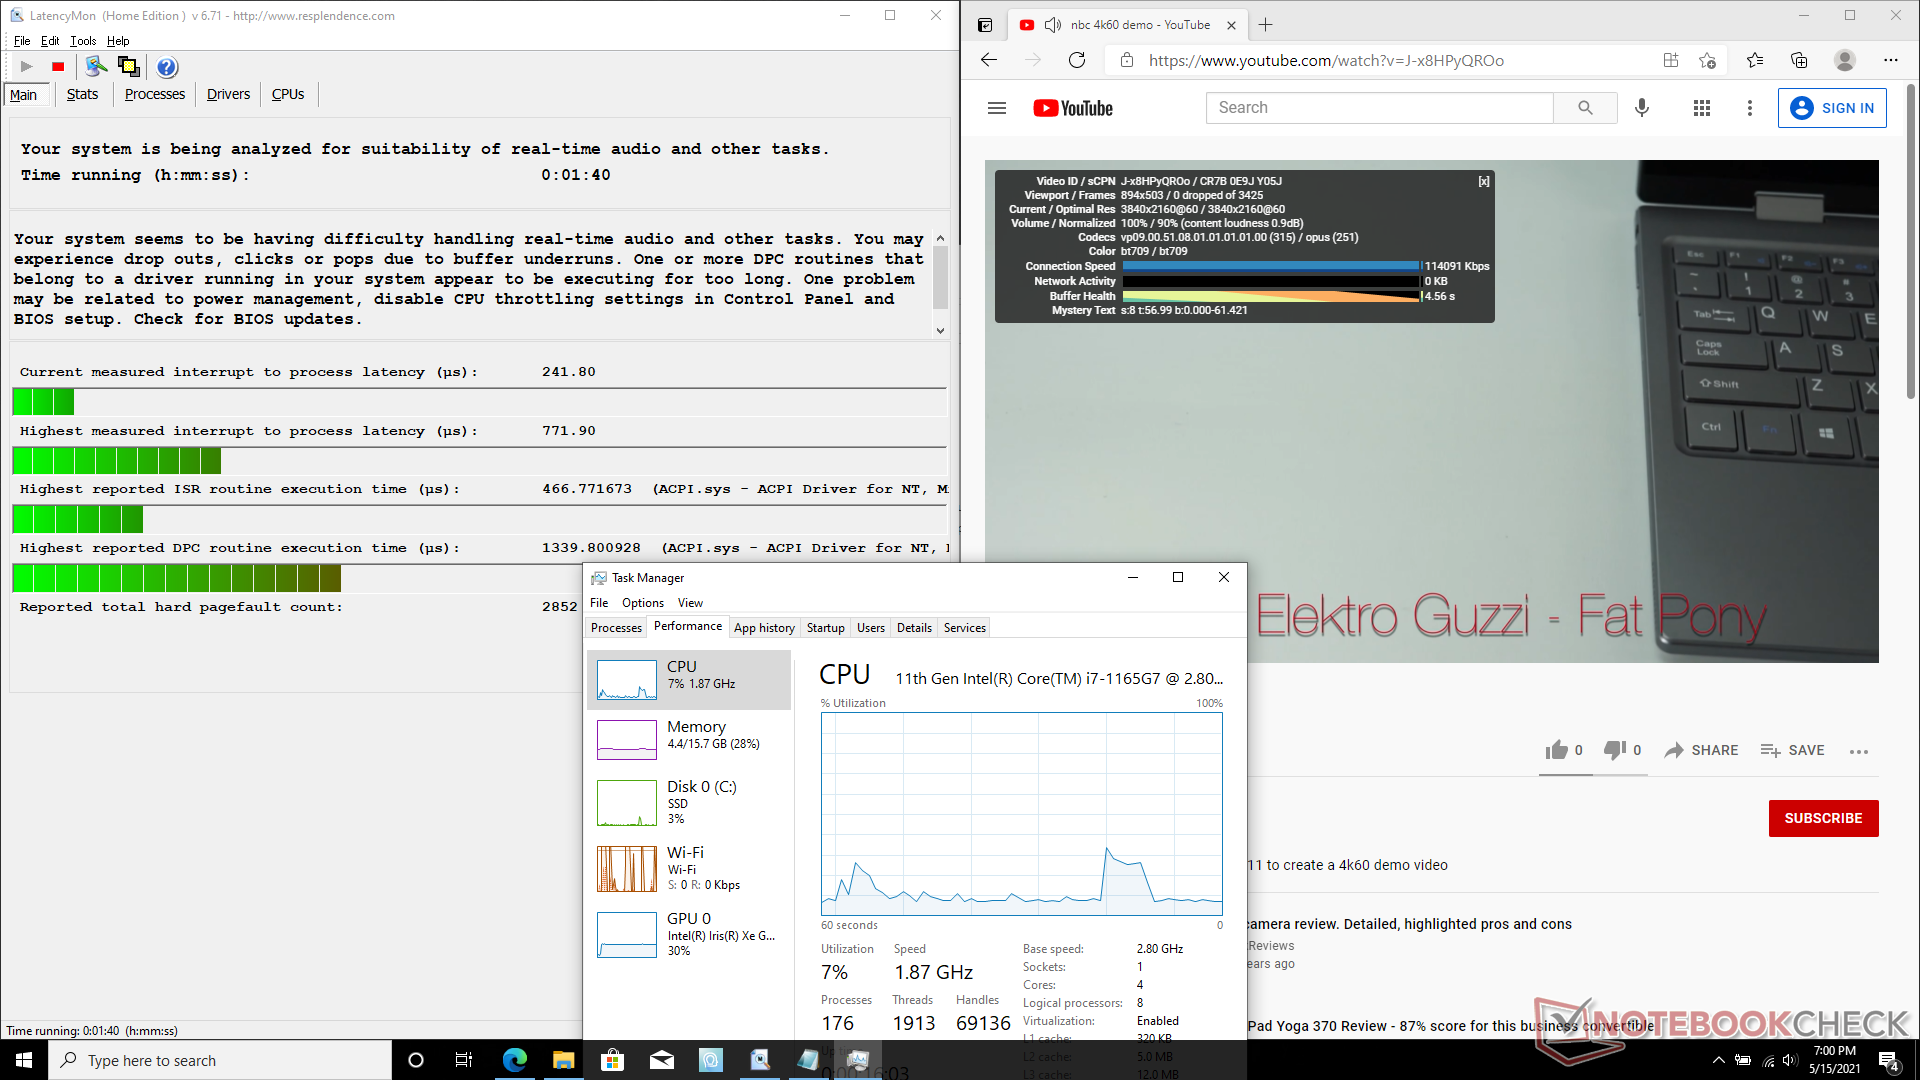
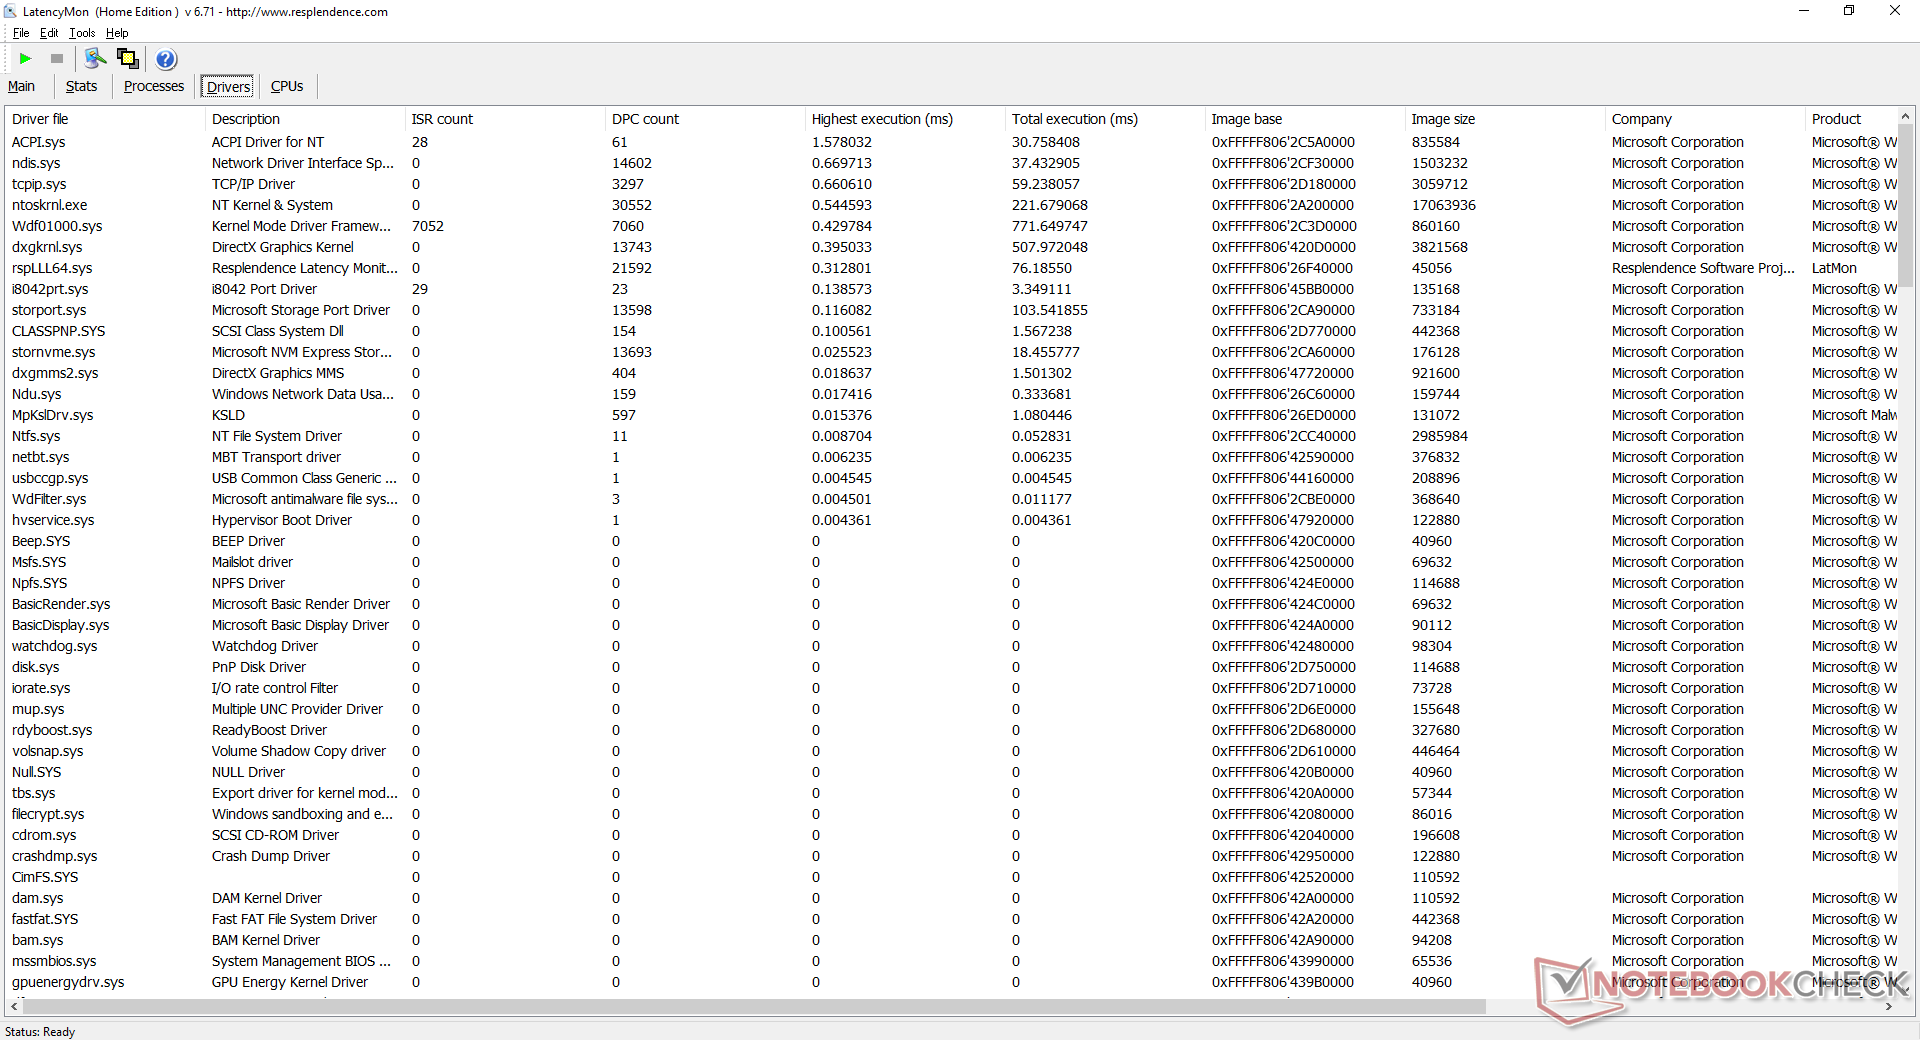
Latence DPC
LatencyMon montre des problèmes mineurs de latence DPC lors de l'ouverture de plusieurs onglets de navigateur sur notre page d'accueil. La lecture de vidéos 4K à 60 FPS est autrement fluide et sans perte d'images.
| DPC Latencies / LatencyMon - interrupt to process latency (max), Web, Youtube, Prime95 | |
| ADATA XPG Xenia Xe | |
| Dell XPS 15 9500 Core i5 | |
| MSI Summit E15 A11SCST | |
| MSI Summit B15 A11M | |
* ... Moindre est la valeur, meilleures sont les performances
Périphériques de stockage
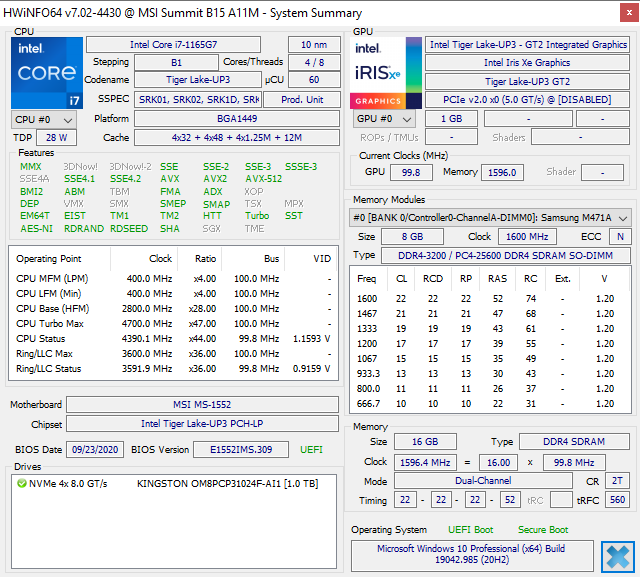
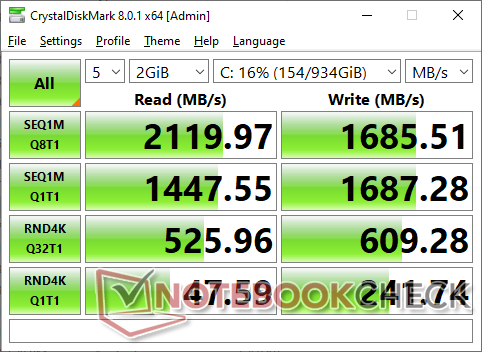
Jusqu'à deux SSD internes M.2 2280 sont pris en charge, l'un de ces emplacements étant compatible avec les vitesses PCIe 4.0. Notre unité de test est livrée avec le Kingston OM8PCP31024F de 1 To, un SSD NVMe PCIe 3.0 relativement bon marché dont les taux de transfert moyens culminent à environ 2100 Mo/s. Bien sûr, les utilisateurs peuvent configurer des SSD plus rapides avant de les acheter ou en installer un eux-mêmes.
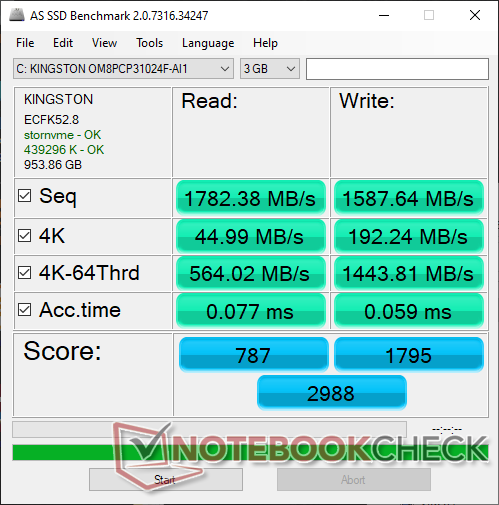
| MSI Summit B15 A11M Kingston OM8PCP31024F | MSI Summit E15 A11SCST Phison 1TB SM2801T24GKBB4S-E162 | HP Spectre X360 15-5ZV31AV Intel SSD 660p 2TB SSDPEKNW020T8 | ADATA XPG Xenia Xe ADATA XPG Gammix S50 1TB | |
|---|---|---|---|---|
| AS SSD | 42% | -12% | 25% | |
| Seq Read (MB/s) | 1782 | 3597 102% | 1220 -32% | 3842 116% |
| Seq Write (MB/s) | 1588 | 2101 32% | 1152 -27% | 1601 1% |
| 4K Read (MB/s) | 44.99 | 62.5 39% | 52.3 16% | 51.2 14% |
| 4K Write (MB/s) | 192.2 | 208.9 9% | 146.6 -24% | 260.8 36% |
| 4K-64 Read (MB/s) | 564 | 1145 103% | 652 16% | 1222 117% |
| 4K-64 Write (MB/s) | 1444 | 1482 3% | 847 -41% | 1508 4% |
| Access Time Read * (ms) | 0.077 | 0.05 35% | 0.077 -0% | 0.065 16% |
| Access Time Write * (ms) | 0.059 | 0.019 68% | 0.106 -80% | 0.249 -322% |
| Score Read (Points) | 787 | 1567 99% | 826 5% | 1657 111% |
| Score Write (Points) | 1795 | 1901 6% | 1109 -38% | 1929 7% |
| Score Total (Points) | 2988 | 4207 41% | 2371 -21% | 4329 45% |
| Copy ISO MB/s (MB/s) | 1541 | 2209 43% | 2070 34% | 2166 41% |
| Copy Program MB/s (MB/s) | 641 | 455.2 -29% | 571 -11% | 995 55% |
| Copy Game MB/s (MB/s) | 908 | 1225 35% | 1219 34% | 1844 103% |
| CrystalDiskMark 5.2 / 6 | 42% | -6% | 47% | |
| Write 4K (MB/s) | 235.9 | 242.9 3% | 151.5 -36% | 159.6 -32% |
| Read 4K (MB/s) | 47.06 | 54.6 16% | 59.3 26% | 45.45 -3% |
| Write Seq (MB/s) | 1684 | 2420 44% | 1424 -15% | 2498 48% |
| Read Seq (MB/s) | 1333 | 2300 73% | 1609 21% | 2340 76% |
| Write 4K Q32T1 (MB/s) | 606 | 392.7 -35% | 393.6 -35% | 645 6% |
| Read 4K Q32T1 (MB/s) | 422.8 | 667 58% | 369.4 -13% | 439.4 4% |
| Write Seq Q32T1 (MB/s) | 1688 | 2424 44% | 1946 15% | 4057 140% |
| Read Seq Q32T1 (MB/s) | 2116 | 4944 134% | 1934 -9% | 4960 134% |
| Moyenne finale (programmes/paramètres) | 42% /
42% | -9% /
-10% | 36% /
33% |
* ... Moindre est la valeur, meilleures sont les performances

Disk Throttling: DiskSpd Read Loop, Queue Depth 8
Performances du GPU
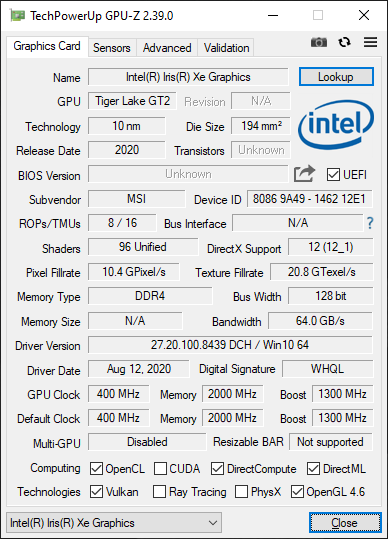
Les performances graphiques se situent à quelques points de pourcentage près par rapport à celles de l'ordinateur portable moyen de notre base de données équipé du même Iris Xe 96 EUs GPU. Bien que 3DMark montre qu'il surpasse la performance du GeForce MX250/350/450, ces GPU Nvidia sont toujours les plus performants dans des conditions de jeu réelles, principalement en raison des pilotes plus matures de Nvidia et de l'enveloppe de puissance plus élevée disponible pour le CPU lorsqu'un GPU discret est présent. Cependant, en ce qui concerne les GPU intégrés, l'Iris Xe est celui à battre.
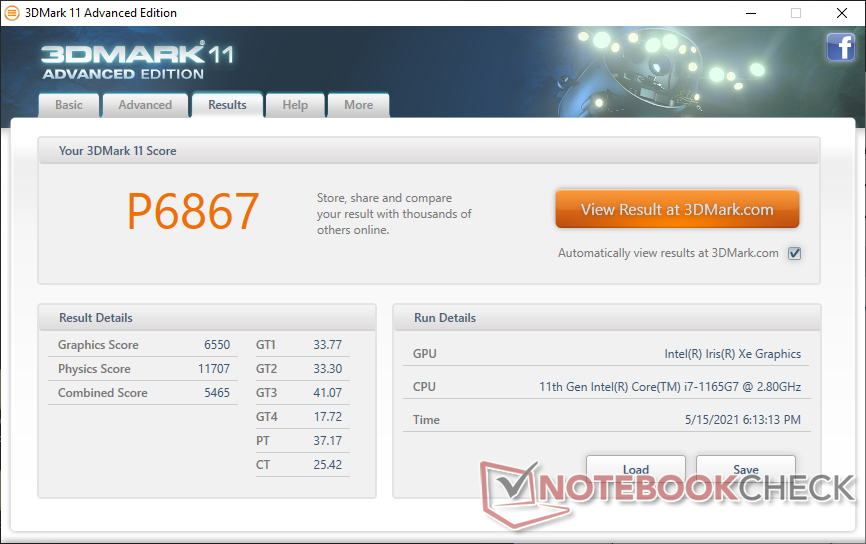
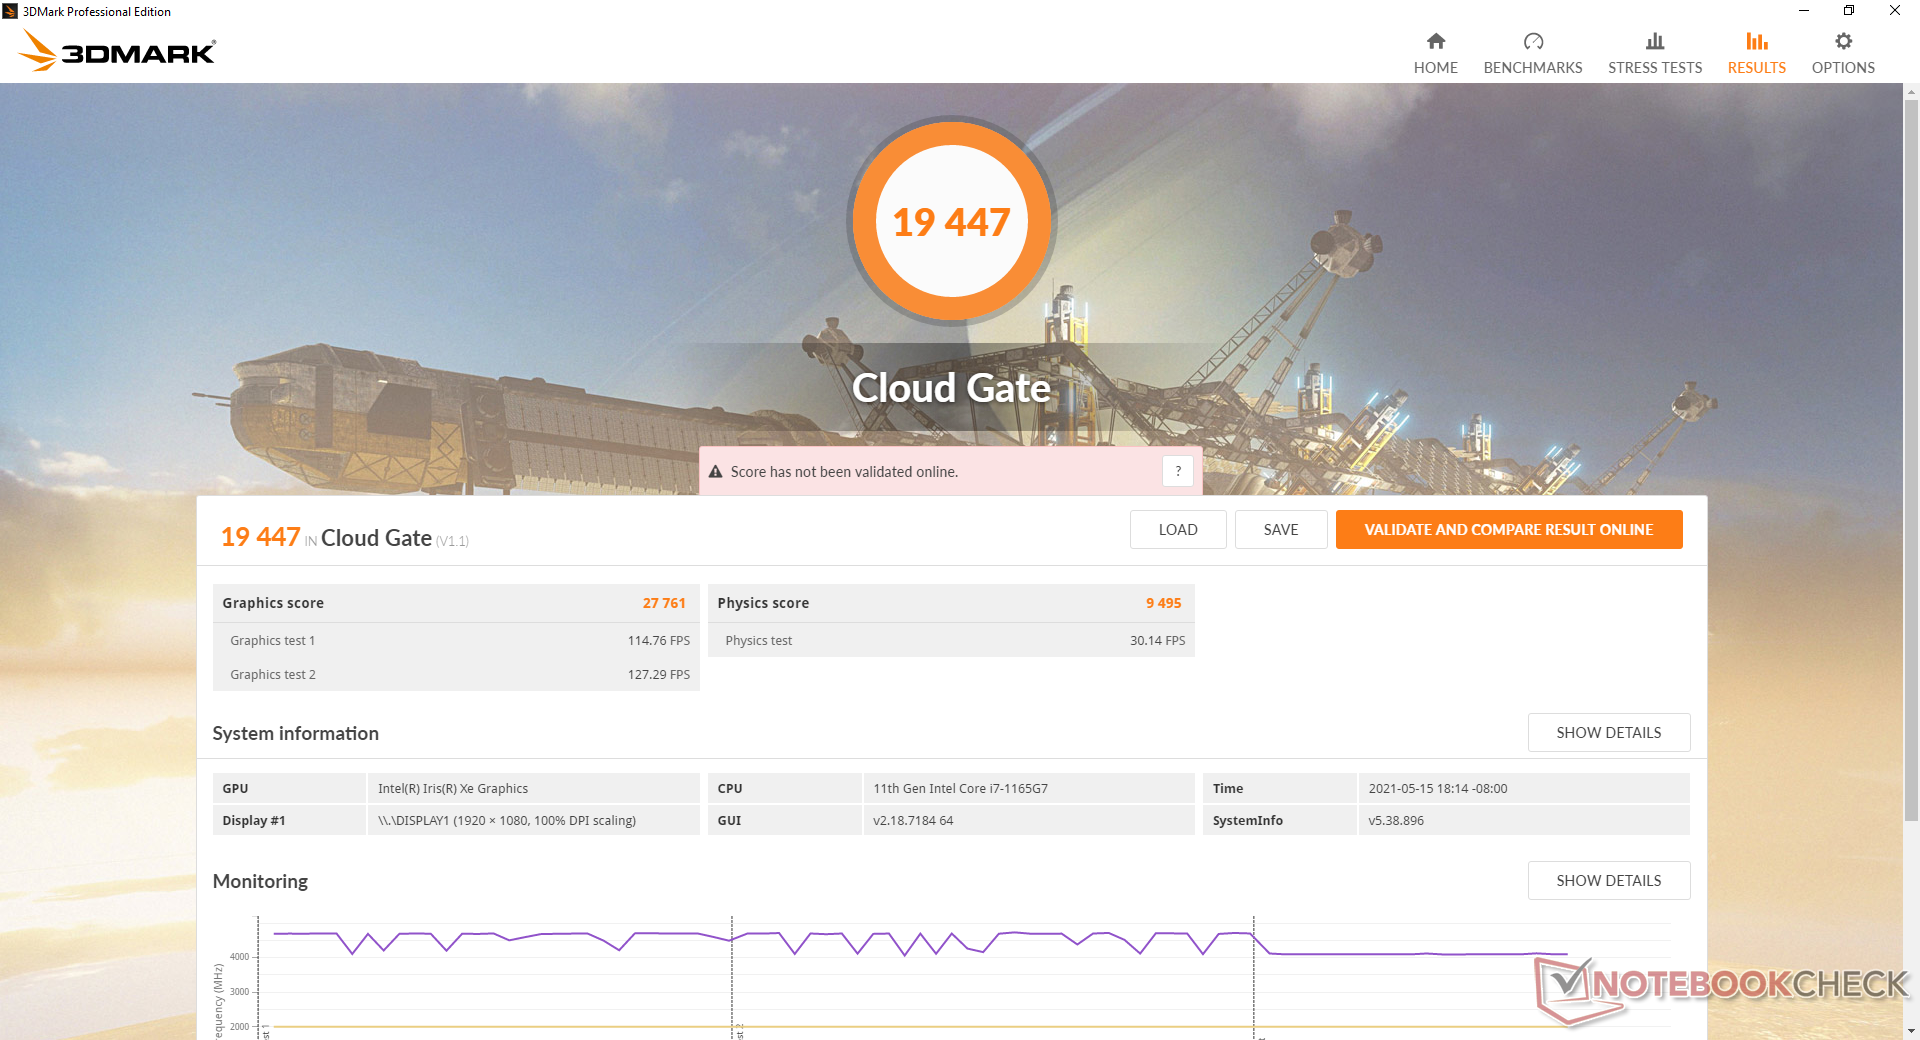
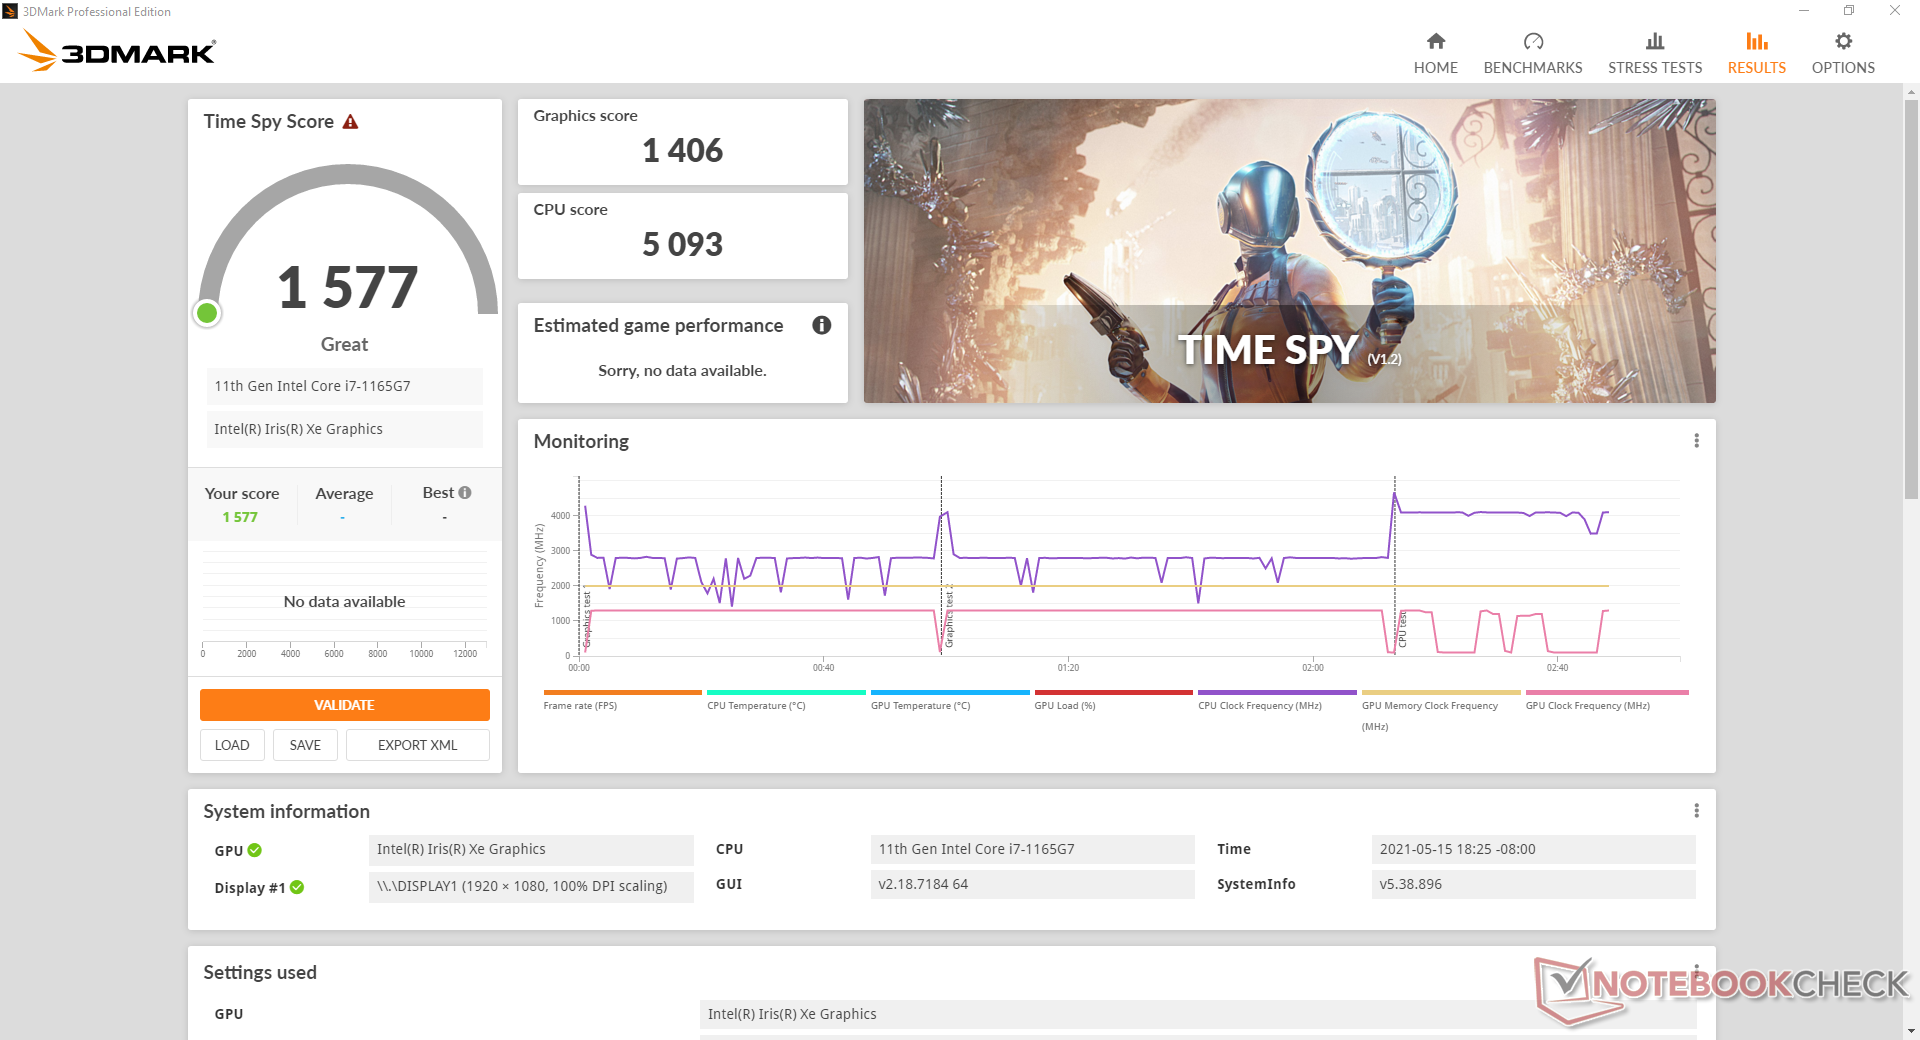
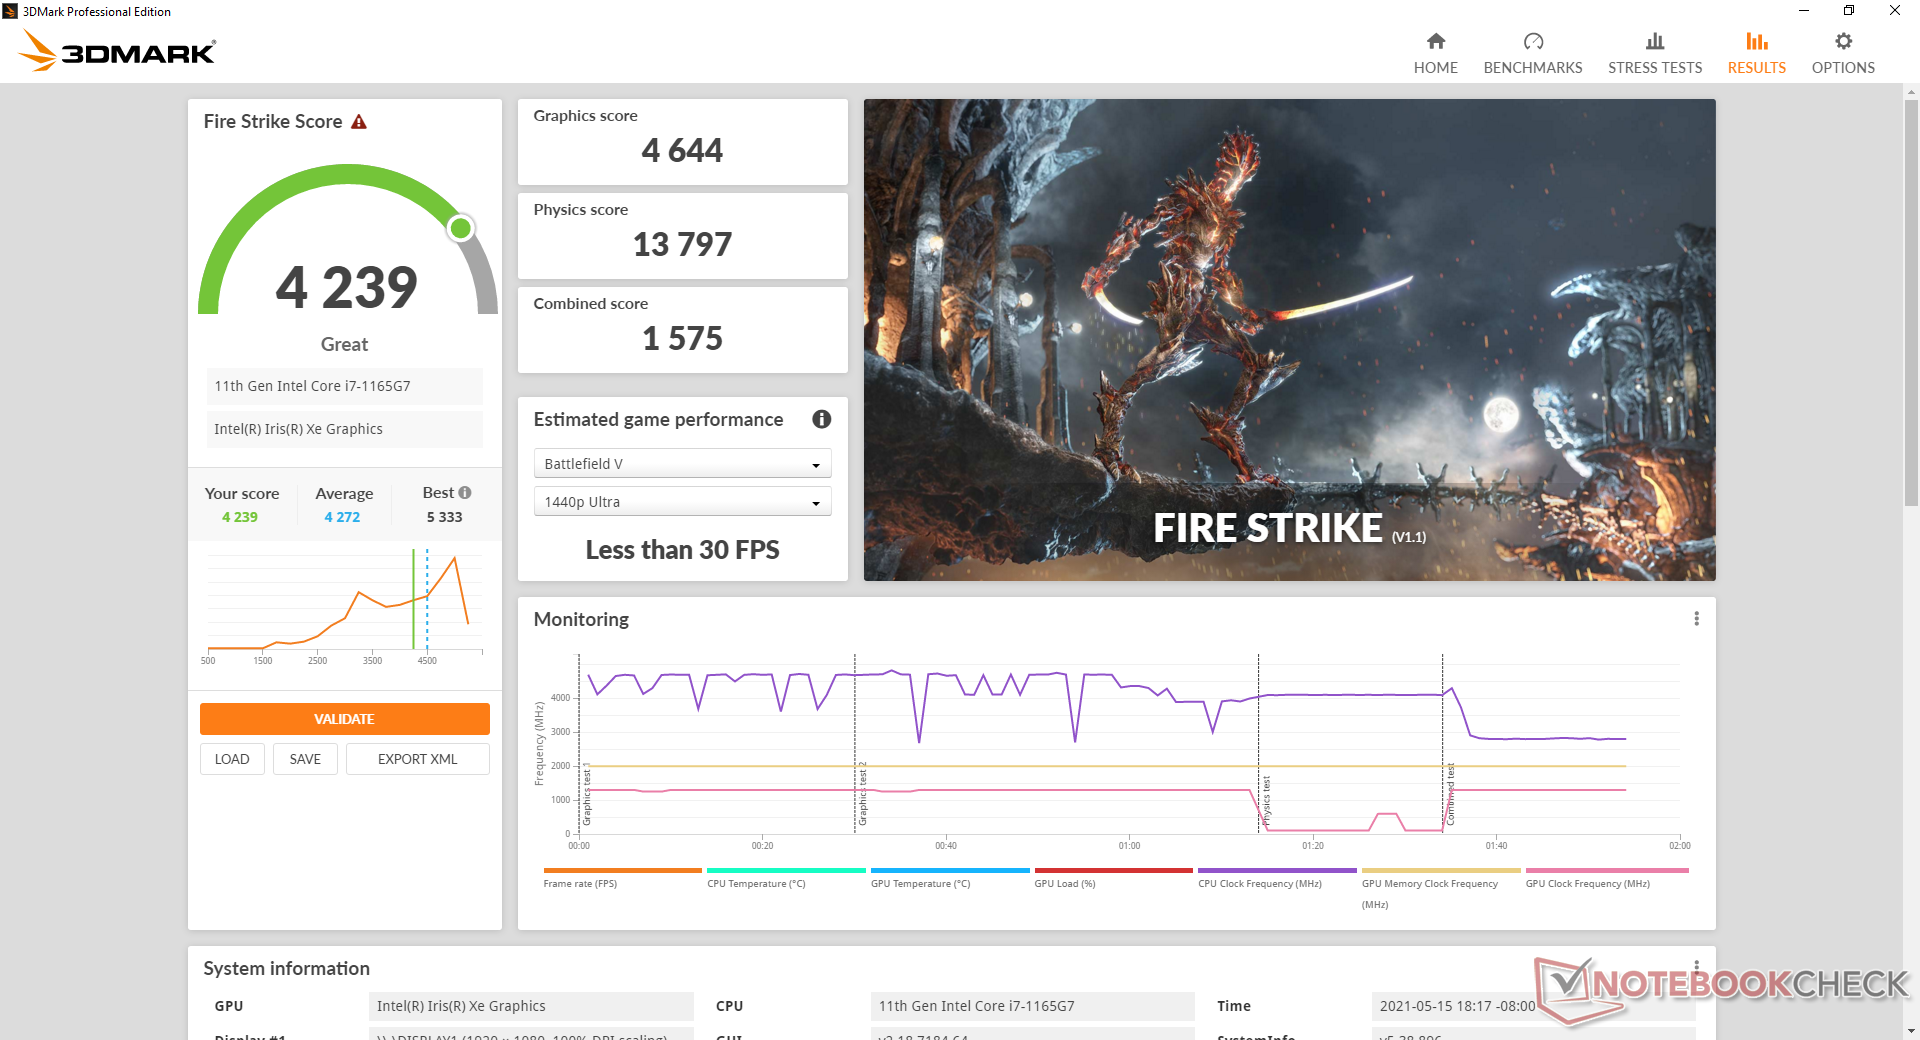
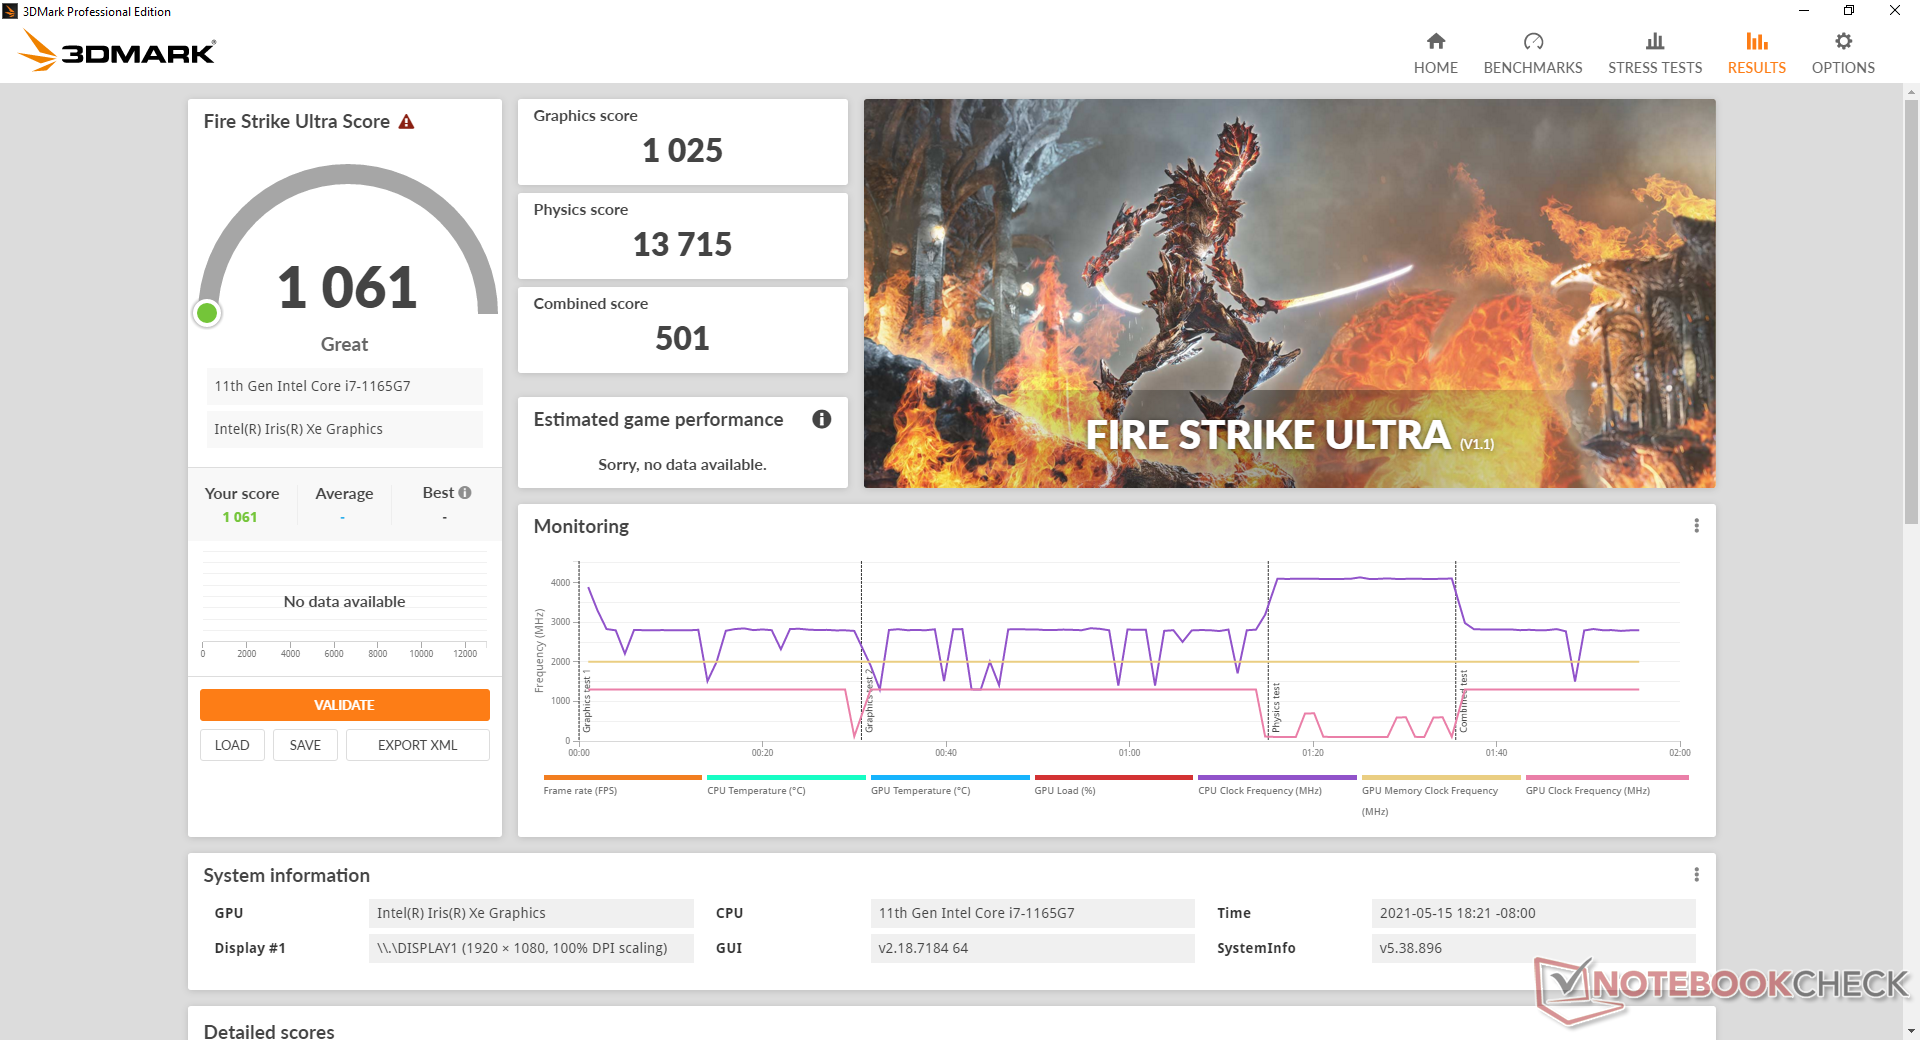
| 3DMark 11 Performance | 6867 points | |
| 3DMark Cloud Gate Standard Score | 19447 points | |
| 3DMark Fire Strike Score | 4239 points | |
| 3DMark Time Spy Score | 1577 points | |
Aide | ||
| Bas | Moyen | Élevé | Ultra | |
|---|---|---|---|---|
| The Witcher 3 (2015) | 95.3 | 56.3 | 30.8 | 14.5 |
| Dota 2 Reborn (2015) | 81.5 | 67.3 | 45.4 | 42.3 |
| Final Fantasy XV Benchmark (2018) | 39.1 | 20.4 | 15.8 | |
| X-Plane 11.11 (2018) | 59.3 | 42.3 | 38.5 |
Emissions
Bruit du système
Le bruit du ventilateur n'est jamais vraiment silencieux, même lorsqu'il est réglé sur le mode "Silencieux" du MSI Center. Nous sommes en mesure d'enregistrer un très léger bruit de ventilateur de 26,4 dB(A) sur un fond de 25,2 dB(A), quel que soit le réglage de l'ordinateur portable.
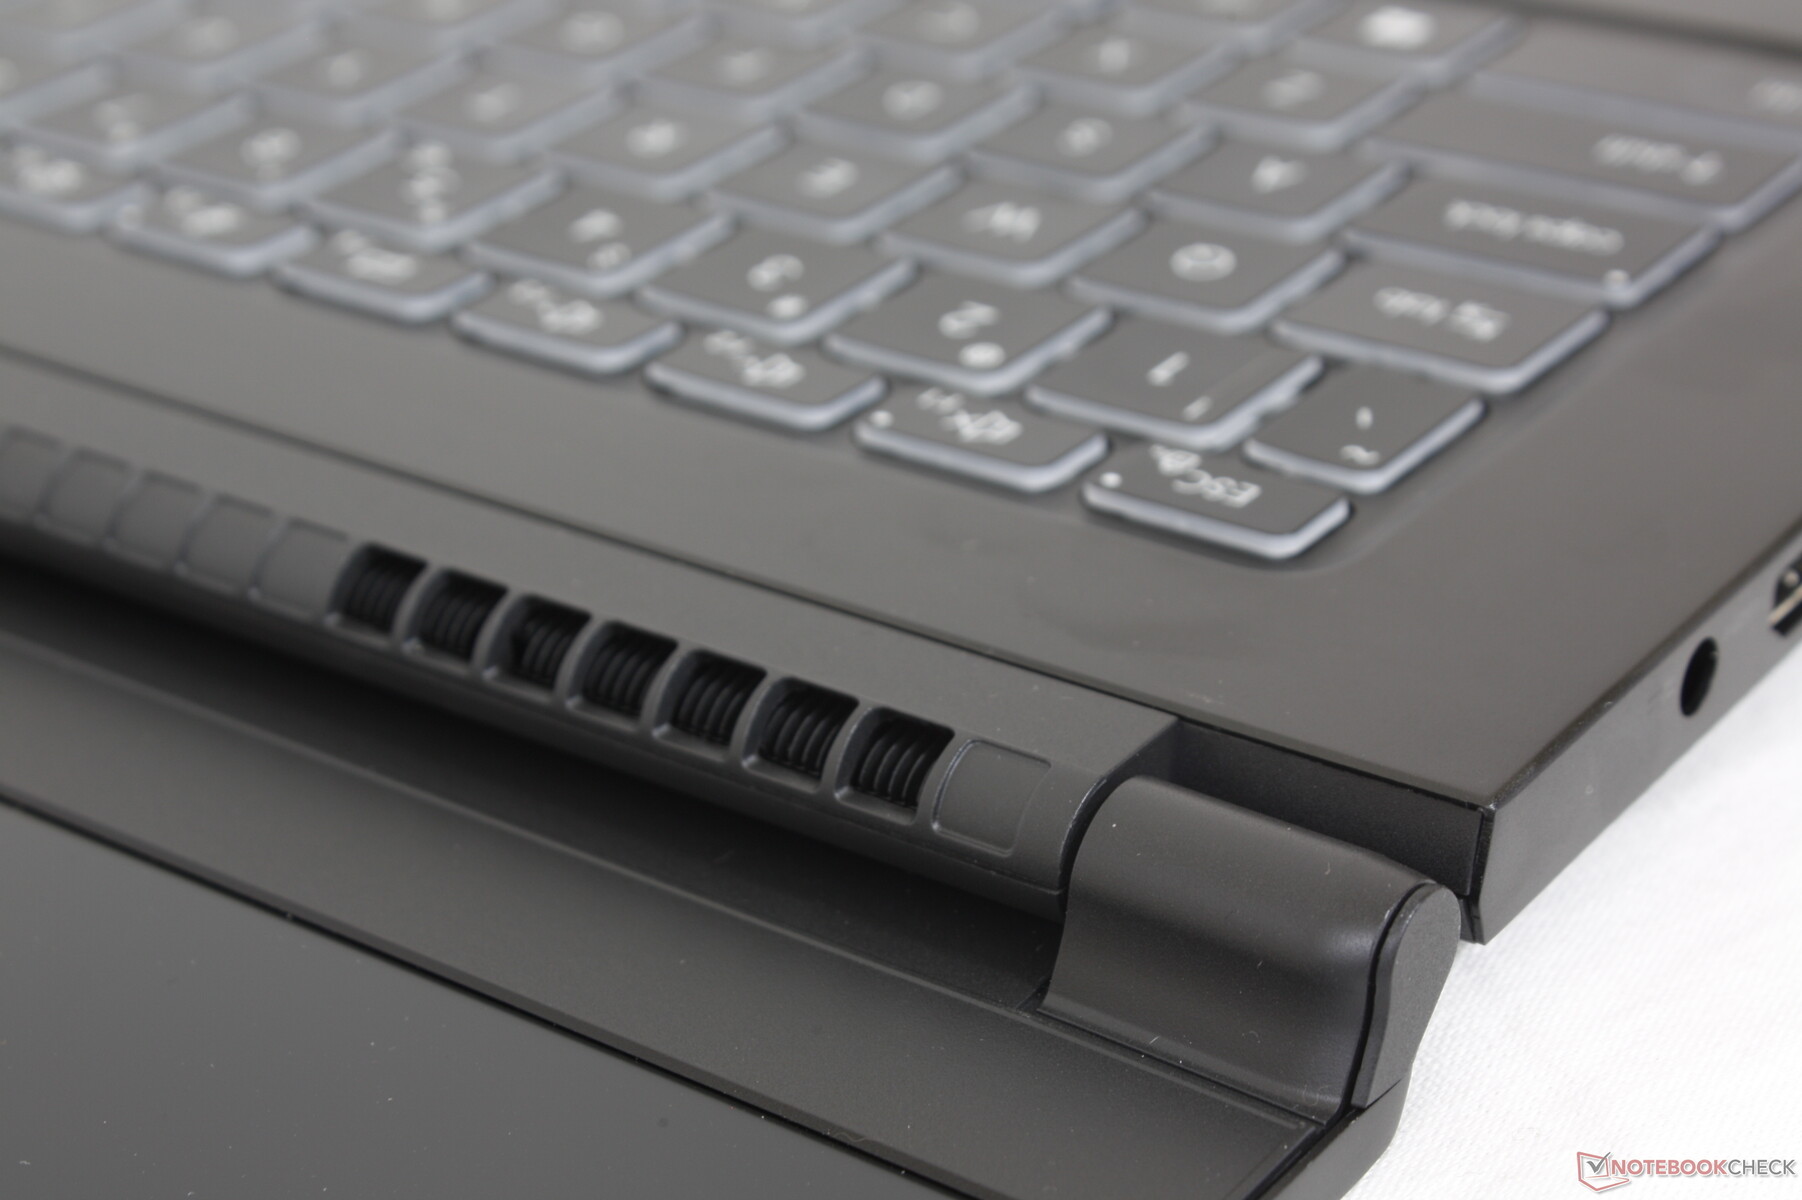
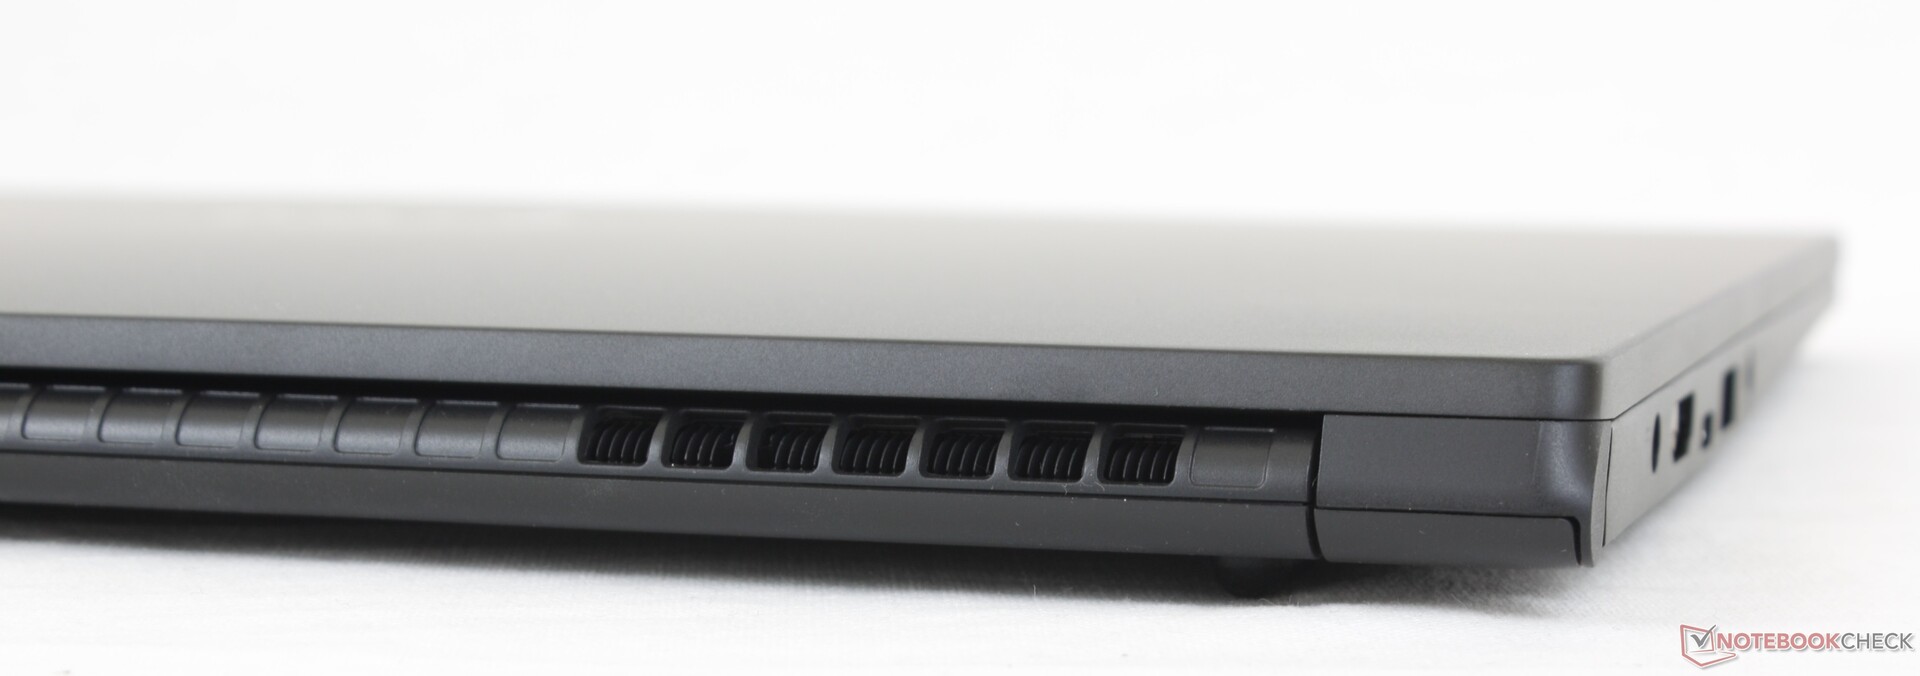
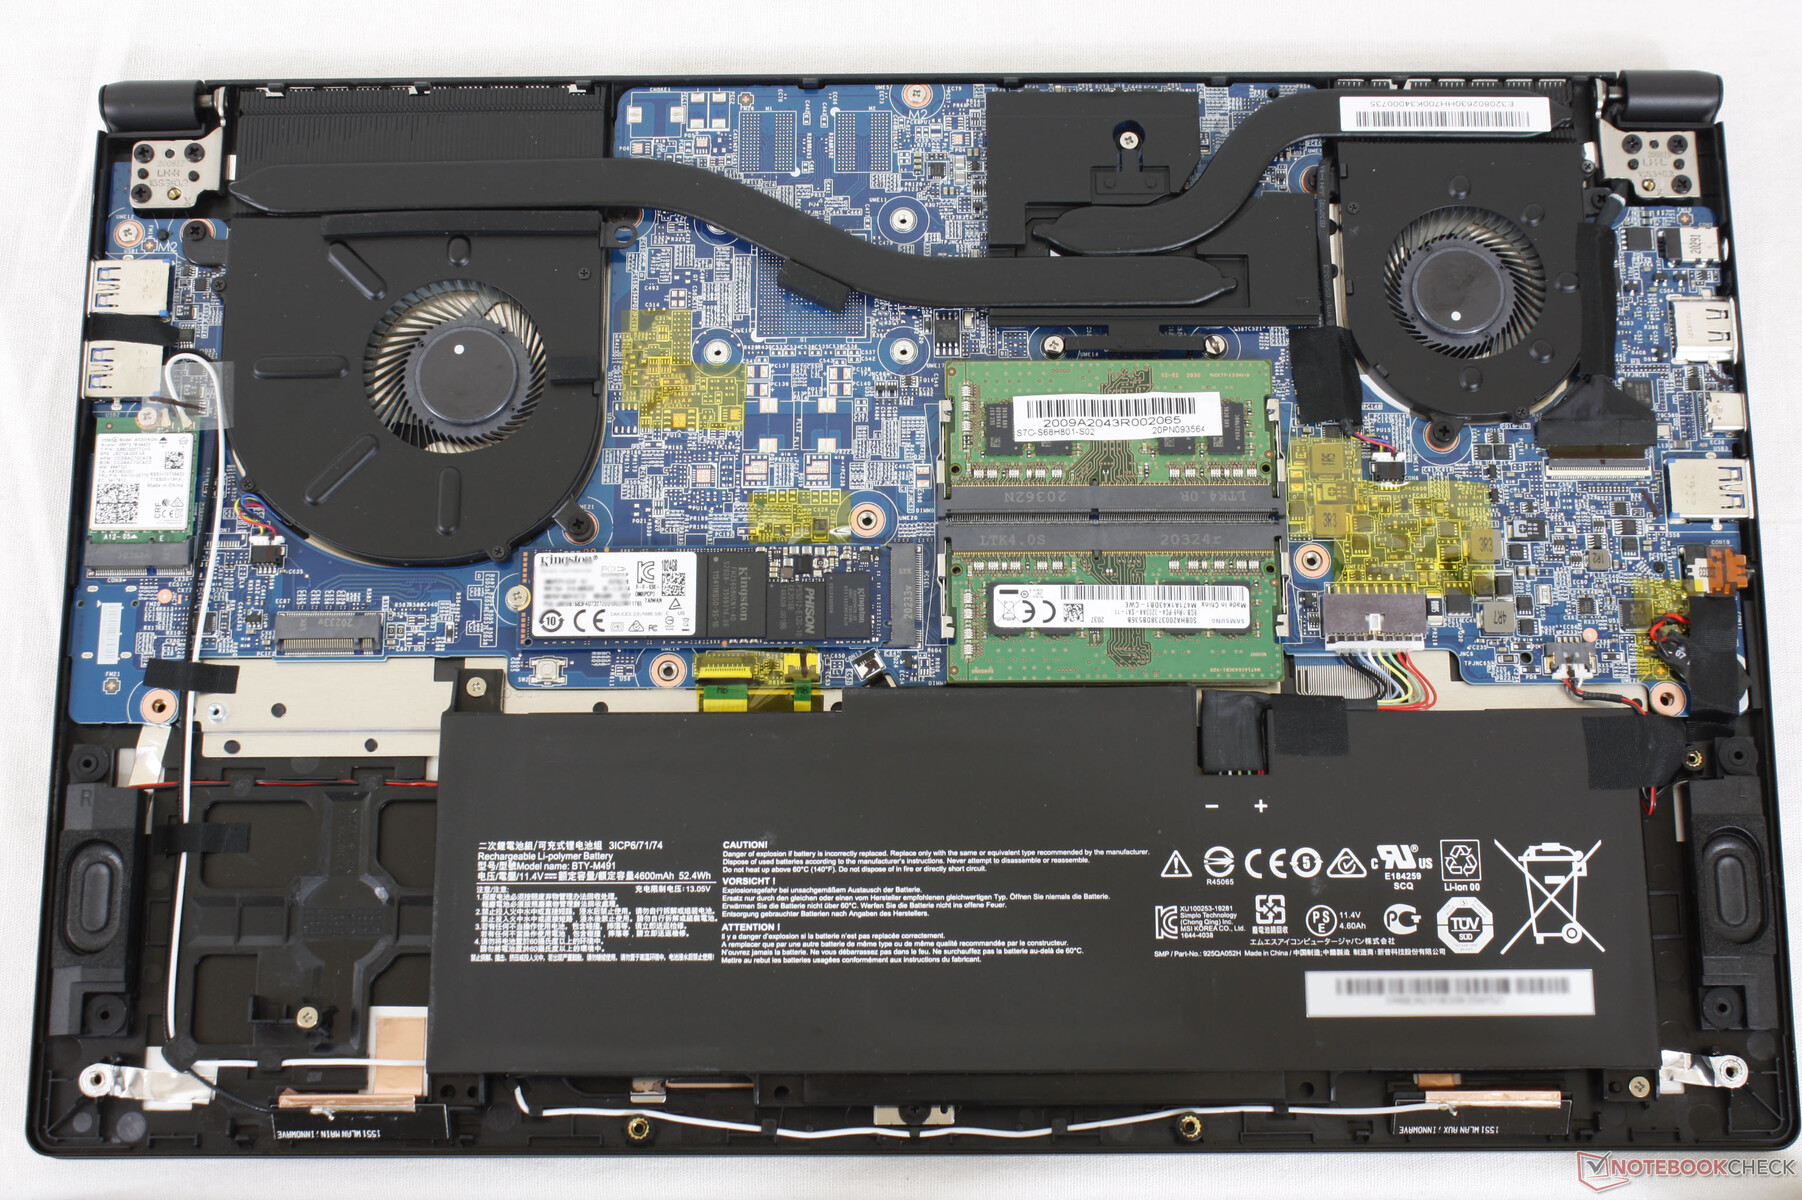
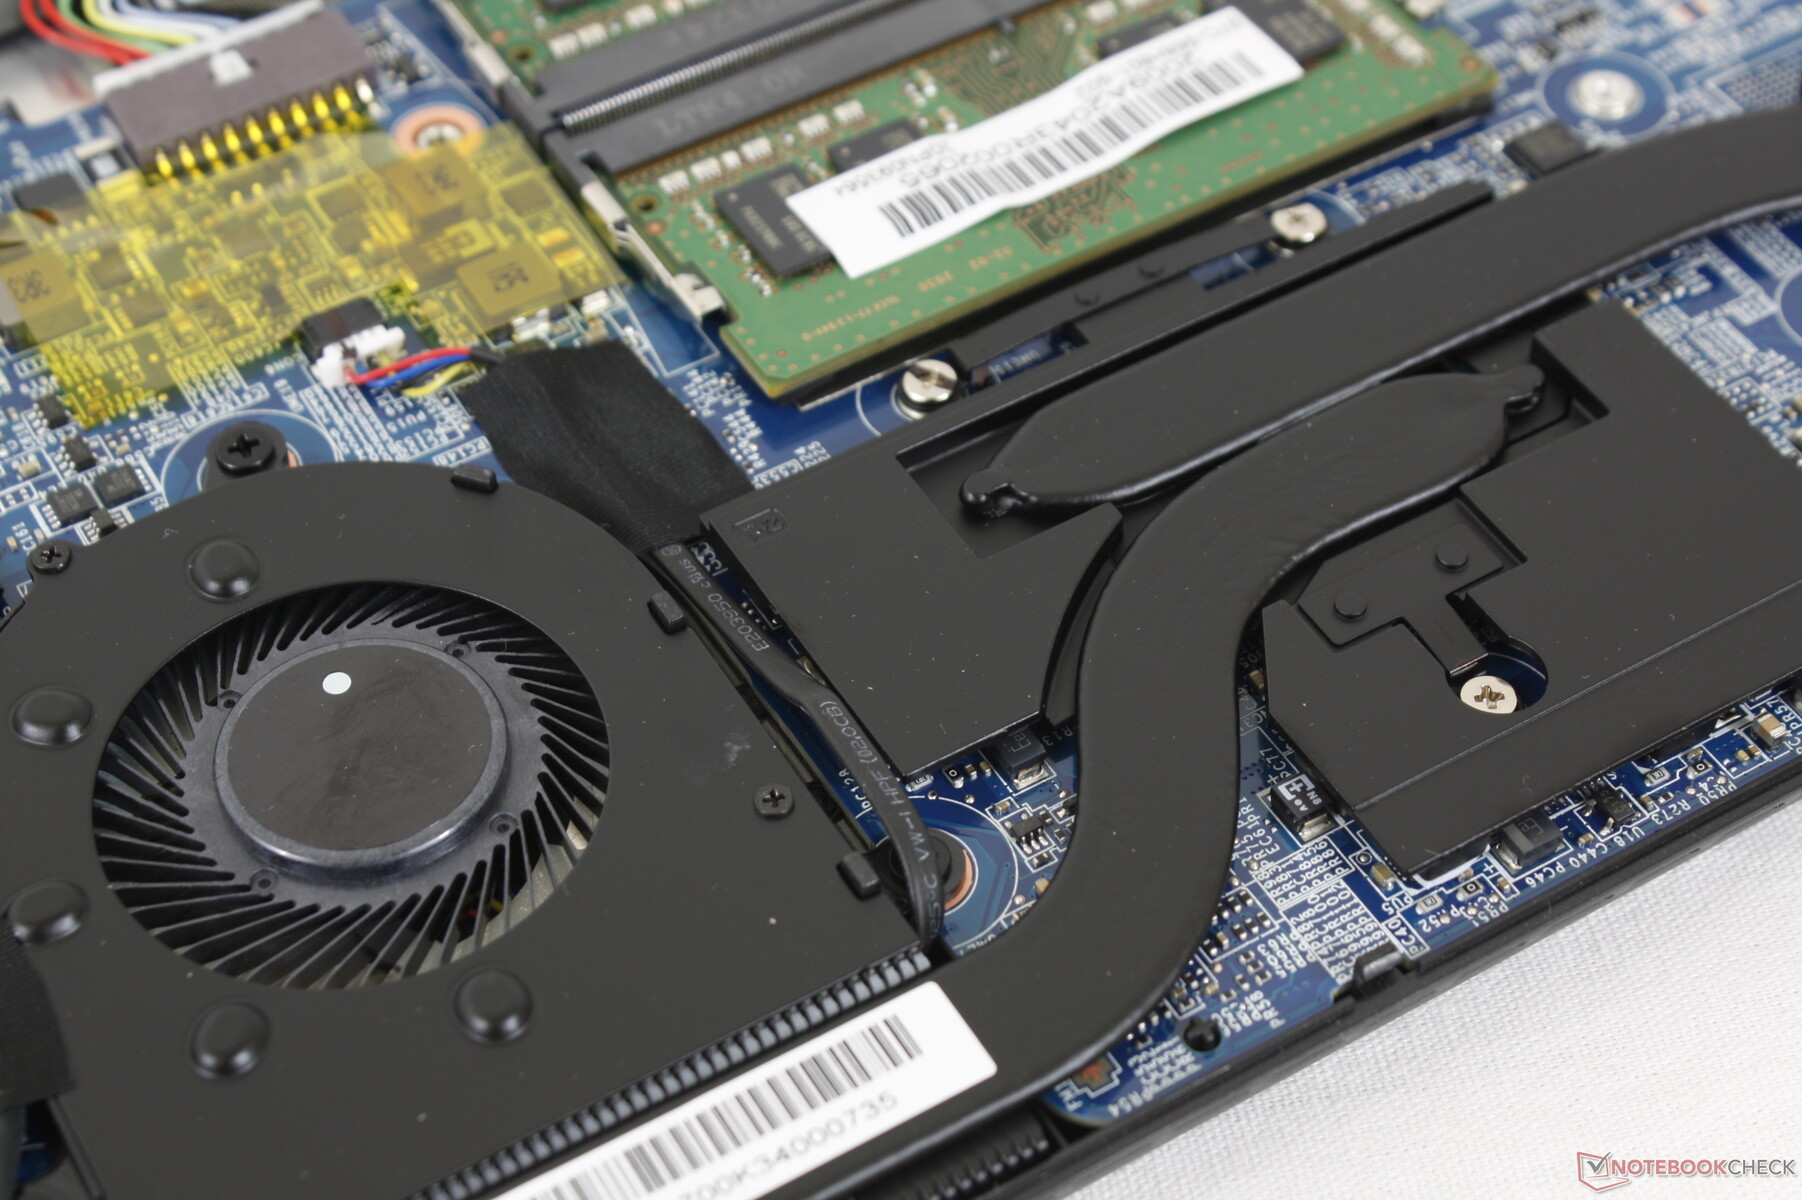
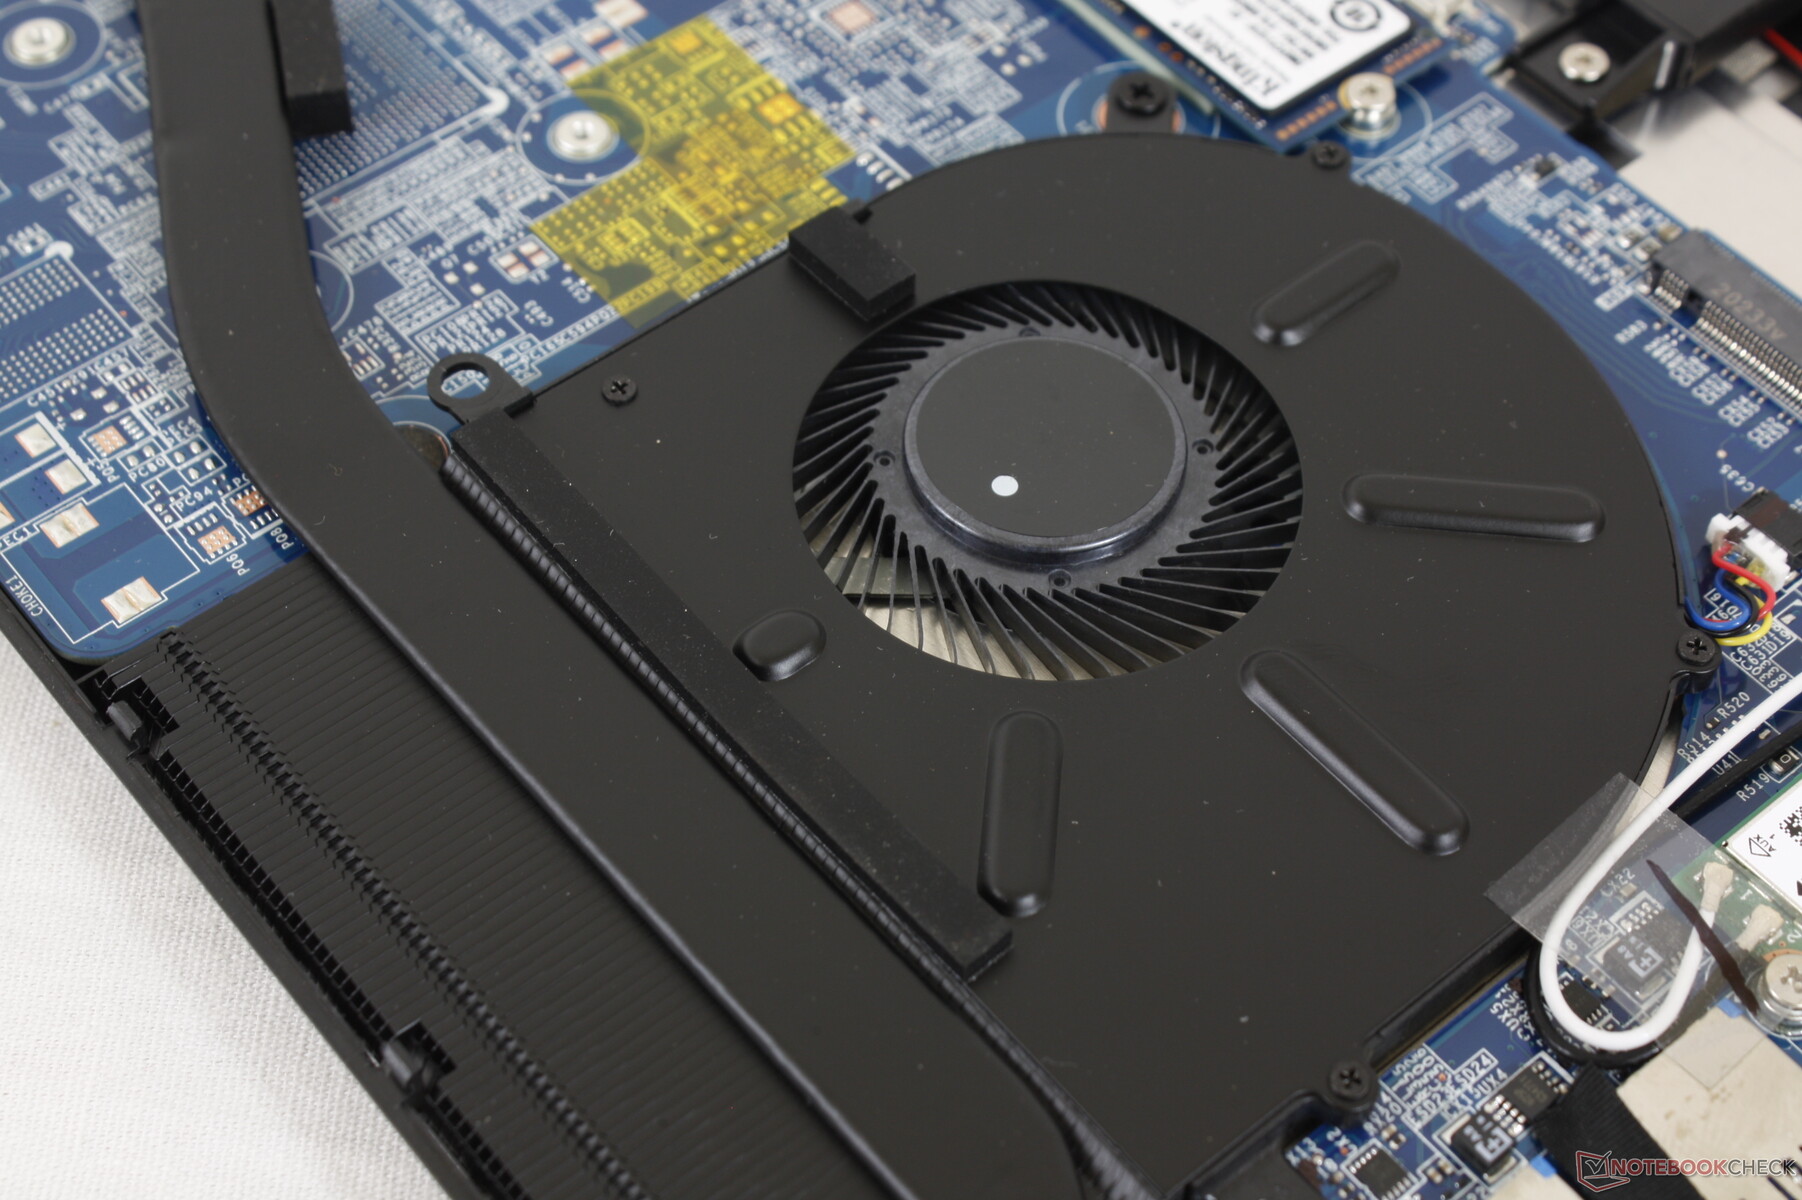
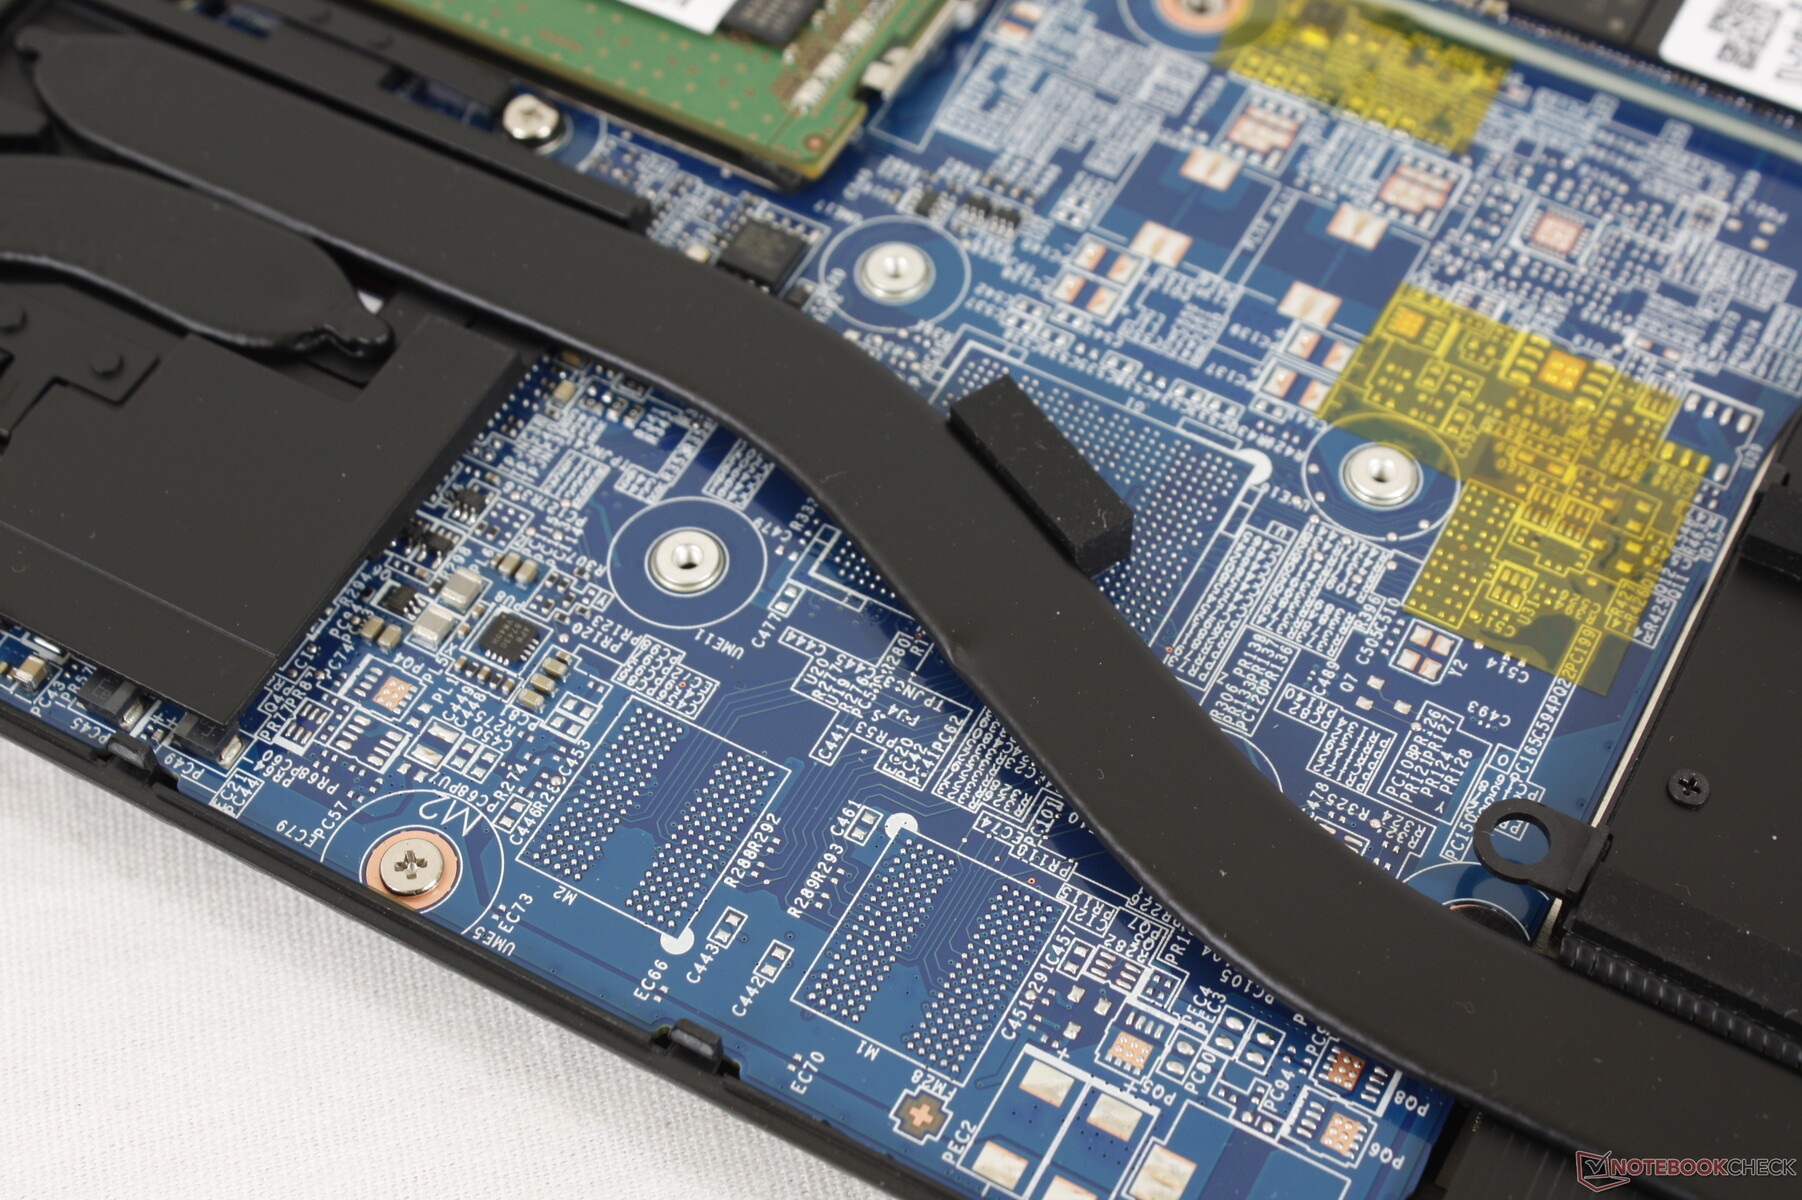
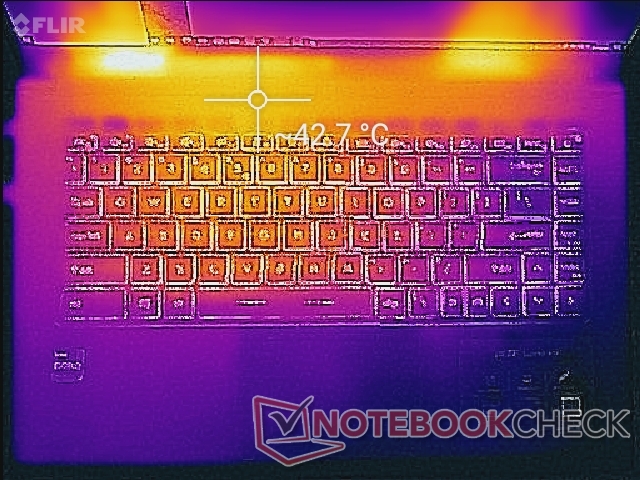
Heureusement, les ventilateurs restent silencieux à 26,4 dB(A) même après avoir exécuté la première scène de benchmark de 3DMark 06. Cela est dû au fait que la solution de refroidissement a été conçue pour refroidir à la fois un CPU et un GPU discret comme le montrent les images ci-dessous, malgré le fait que notre Summit B15 n'a pas de GPU discret. Ainsi, les deux ventilateurs internes n'ont pas besoin d'être toujours actifs pour maintenir le système aussi frais.
Bien sûr, le système peut toujours être très bruyant lors de l'exécution de jeux à des taux d'images élevés où le CPU sera sollicité. Dans ce cas, le bruit du ventilateur peut atteindre 40 dB(A) ou 52,6 dB(A) lorsque Cooler Boost est désactivé ou activé, respectivement. Notez que Cooler Boost n'est pas nécessaire pour cet ordinateur portable ULV, comme le montre notre test de stress ci-dessous.
Le bruit du ventilateur est très faible lorsqu'il fonctionne Witcher 3 sur les paramètres Ultra puisque les taux de trame sont dans les chiffres simples. Lorsque les paramètres graphiques sont bas, le bruit du ventilateur passe presque immédiatement à 40 dB(A) en raison de l'augmentation des performances du CPU.
| MSI Summit B15 A11M Iris Xe G7 96EUs, i7-1165G7, Kingston OM8PCP31024F | MSI Summit E15 A11SCST GeForce GTX 1650 Ti Max-Q, i7-1185G7, Phison 1TB SM2801T24GKBB4S-E162 | Dell XPS 15 9500 Core i5 UHD Graphics 630, i5-10300H, Toshiba KBG40ZNS256G NVMe | HP Spectre X360 15-5ZV31AV GeForce MX250, i7-10510U, Intel SSD 660p 2TB SSDPEKNW020T8 | ADATA XPG Xenia Xe Iris Xe G7 96EUs, i7-1165G7, ADATA XPG Gammix S50 1TB | |
|---|---|---|---|---|---|
| Noise | -17% | -2% | -14% | -7% | |
| arrêt / environnement * (dB) | 25.2 | 24 5% | 28 -11% | 30.1 -19% | 25.2 -0% |
| Idle Minimum * (dB) | 26.4 | 28 -6% | 28 -6% | 30.1 -14% | 25.2 5% |
| Idle Average * (dB) | 26.4 | 29 -10% | 28 -6% | 30.1 -14% | 25.2 5% |
| Idle Maximum * (dB) | 26.4 | 32 -21% | 28 -6% | 30.1 -14% | 25.2 5% |
| Load Average * (dB) | 26.8 | 43 -60% | 28 -4% | 30.1 -12% | 35.7 -33% |
| Witcher 3 ultra * (dB) | 28 | 41 -46% | 39.7 -42% | 39.7 -42% | |
| Load Maximum * (dB) | 52.6 | 44 16% | 41.9 20% | 42 20% | 45.3 14% |
* ... Moindre est la valeur, meilleures sont les performances
Degré de la nuisance sonore
| Au repos |
| 26.4 / 26.4 / 26.4 dB(A) |
| Fortement sollicité |
| 26.8 / 52.6 dB(A) |
 | ||
30 dB silencieux 40 dB(A) audible 50 dB(A) bruyant |
||
min: | ||
Température
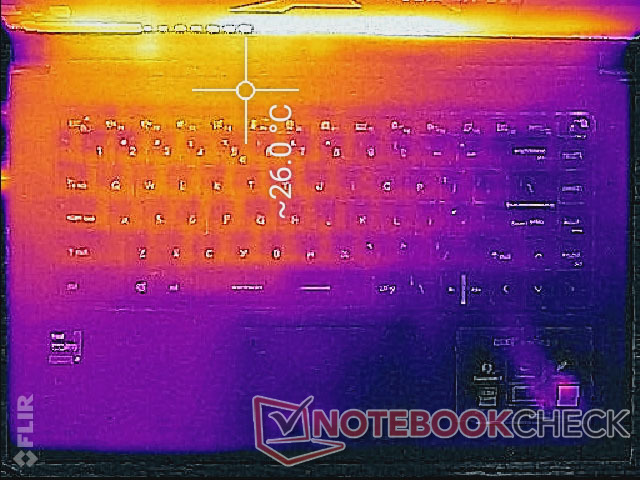
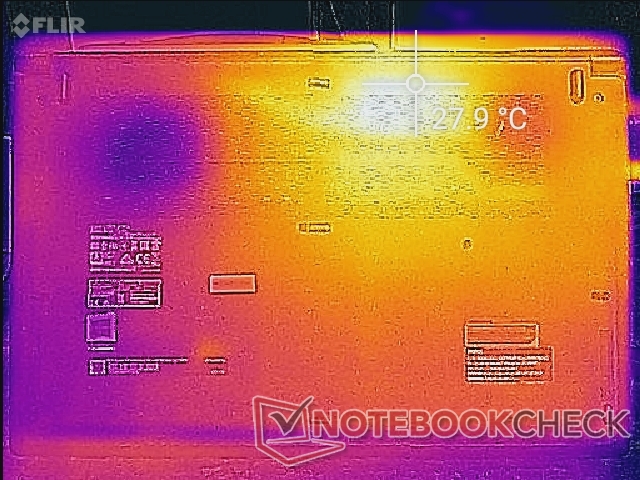
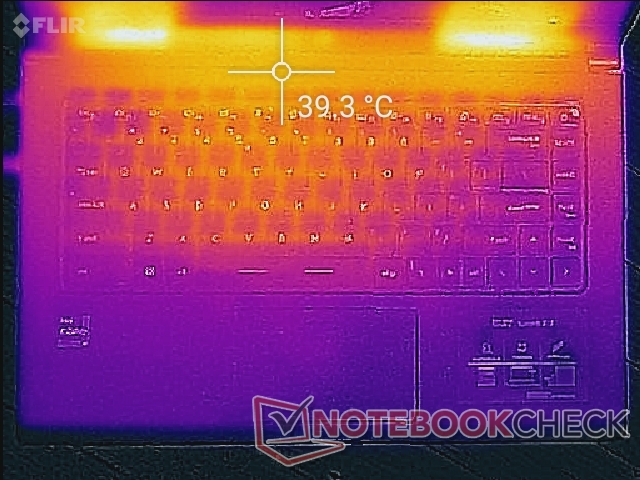
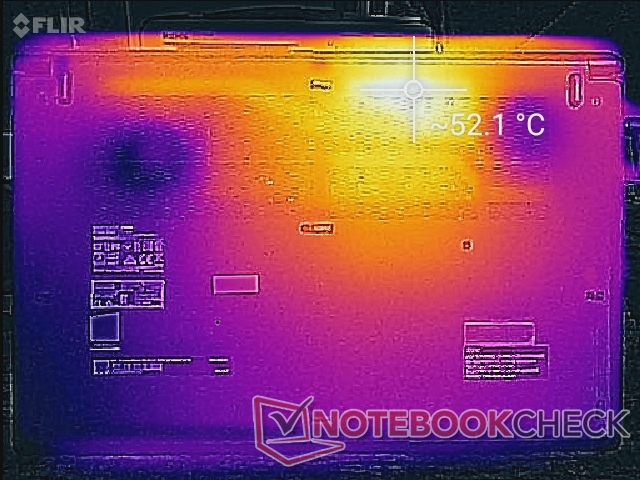
Les températures de surface sont sensiblement plus basses que celles que nous avons observées sur le Modern 15, probablement parce que notre Summit B15 n'est pas équipé d'un GPU discret. Par exemple, le centre du clavier se stabilise à environ 38 C lors de l'exécution de charges de traitement lourdes contre 45 C sur le Modern 15. Les points chauds sur le fond sont également plus frais de quelques degrés cette fois-ci. Une plus grande partie de la surface du fond est consacrée à la ventilation, contrairement aux minuscules grilles de l'écran du Razer Blade Stealth ou Blade 15 série.
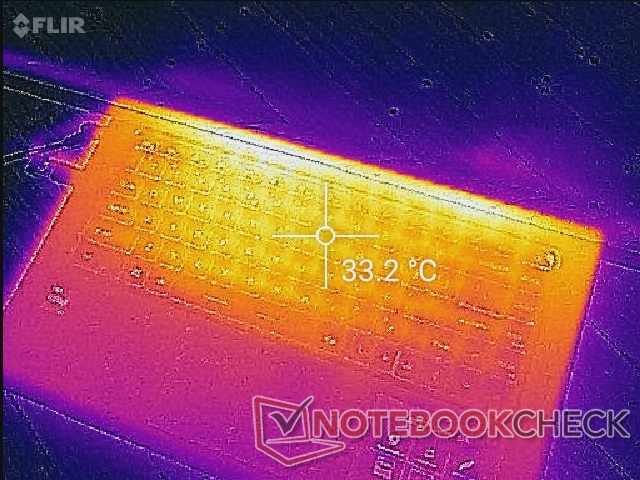
(±) La température maximale du côté supérieur est de 42.8 °C / 109 F, par rapport à la moyenne de 34.3 °C / 94 F, allant de 21.2 à 62.5 °C pour la classe Office.
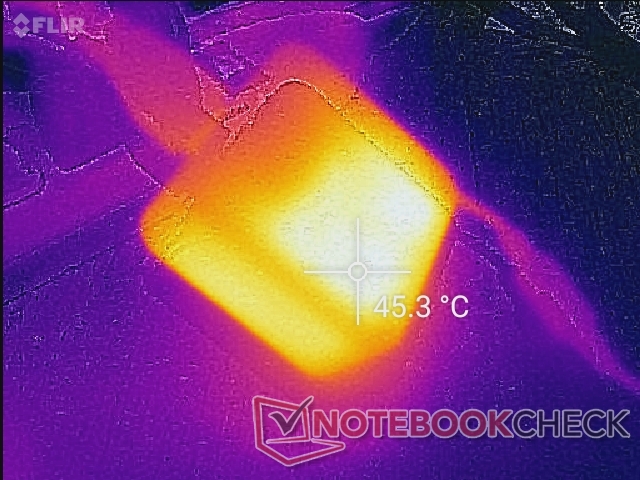
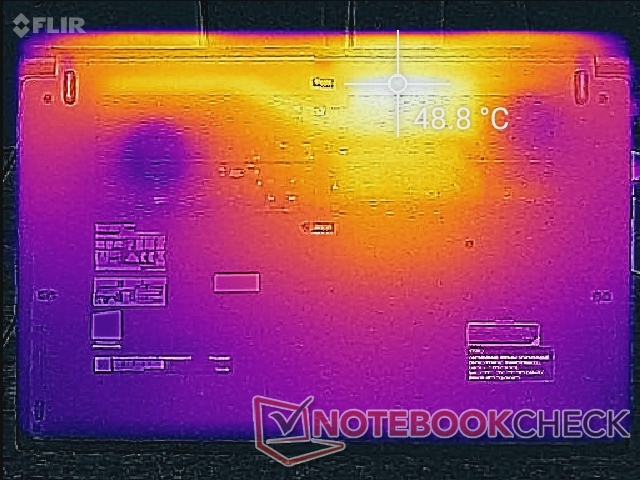
(-) Le fond chauffe jusqu'à un maximum de 52.2 °C / 126 F, contre une moyenne de 36.8 °C / 98 F
(+) En utilisation inactive, la température moyenne du côté supérieur est de 24.2 °C / 76 F, par rapport à la moyenne du dispositif de 29.5 °C / 85 F.
(+) En jouant à The Witcher 3, la température moyenne du côté supérieur est de 31.9 °C / 89 F, alors que la moyenne de l'appareil est de 29.5 °C / 85 F.
(+) Les repose-poignets et le pavé tactile sont plus froids que la température de la peau avec un maximum de 29.2 °C / 84.6 F et sont donc froids au toucher.
(±) La température moyenne de la zone de l'appui-paume de dispositifs similaires était de 27.5 °C / 81.5 F (-1.7 °C / #-3.1 F).
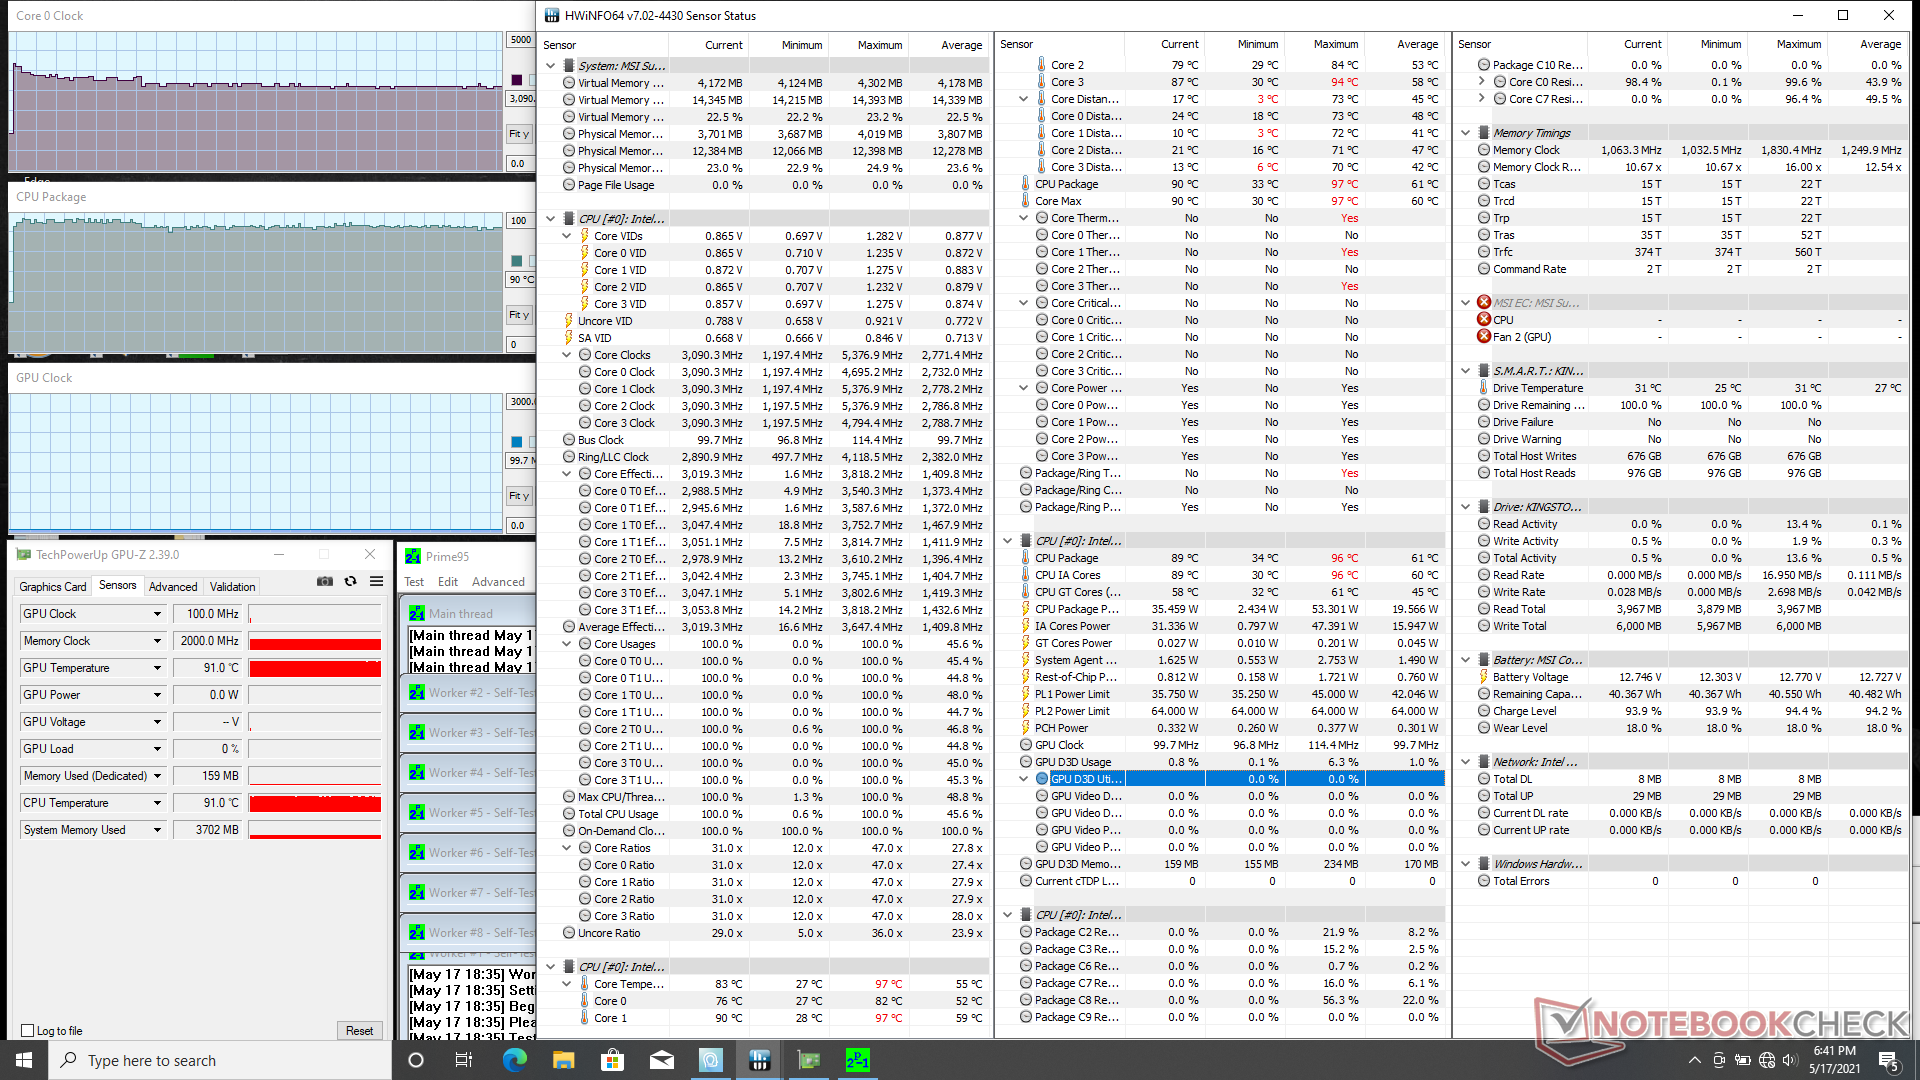
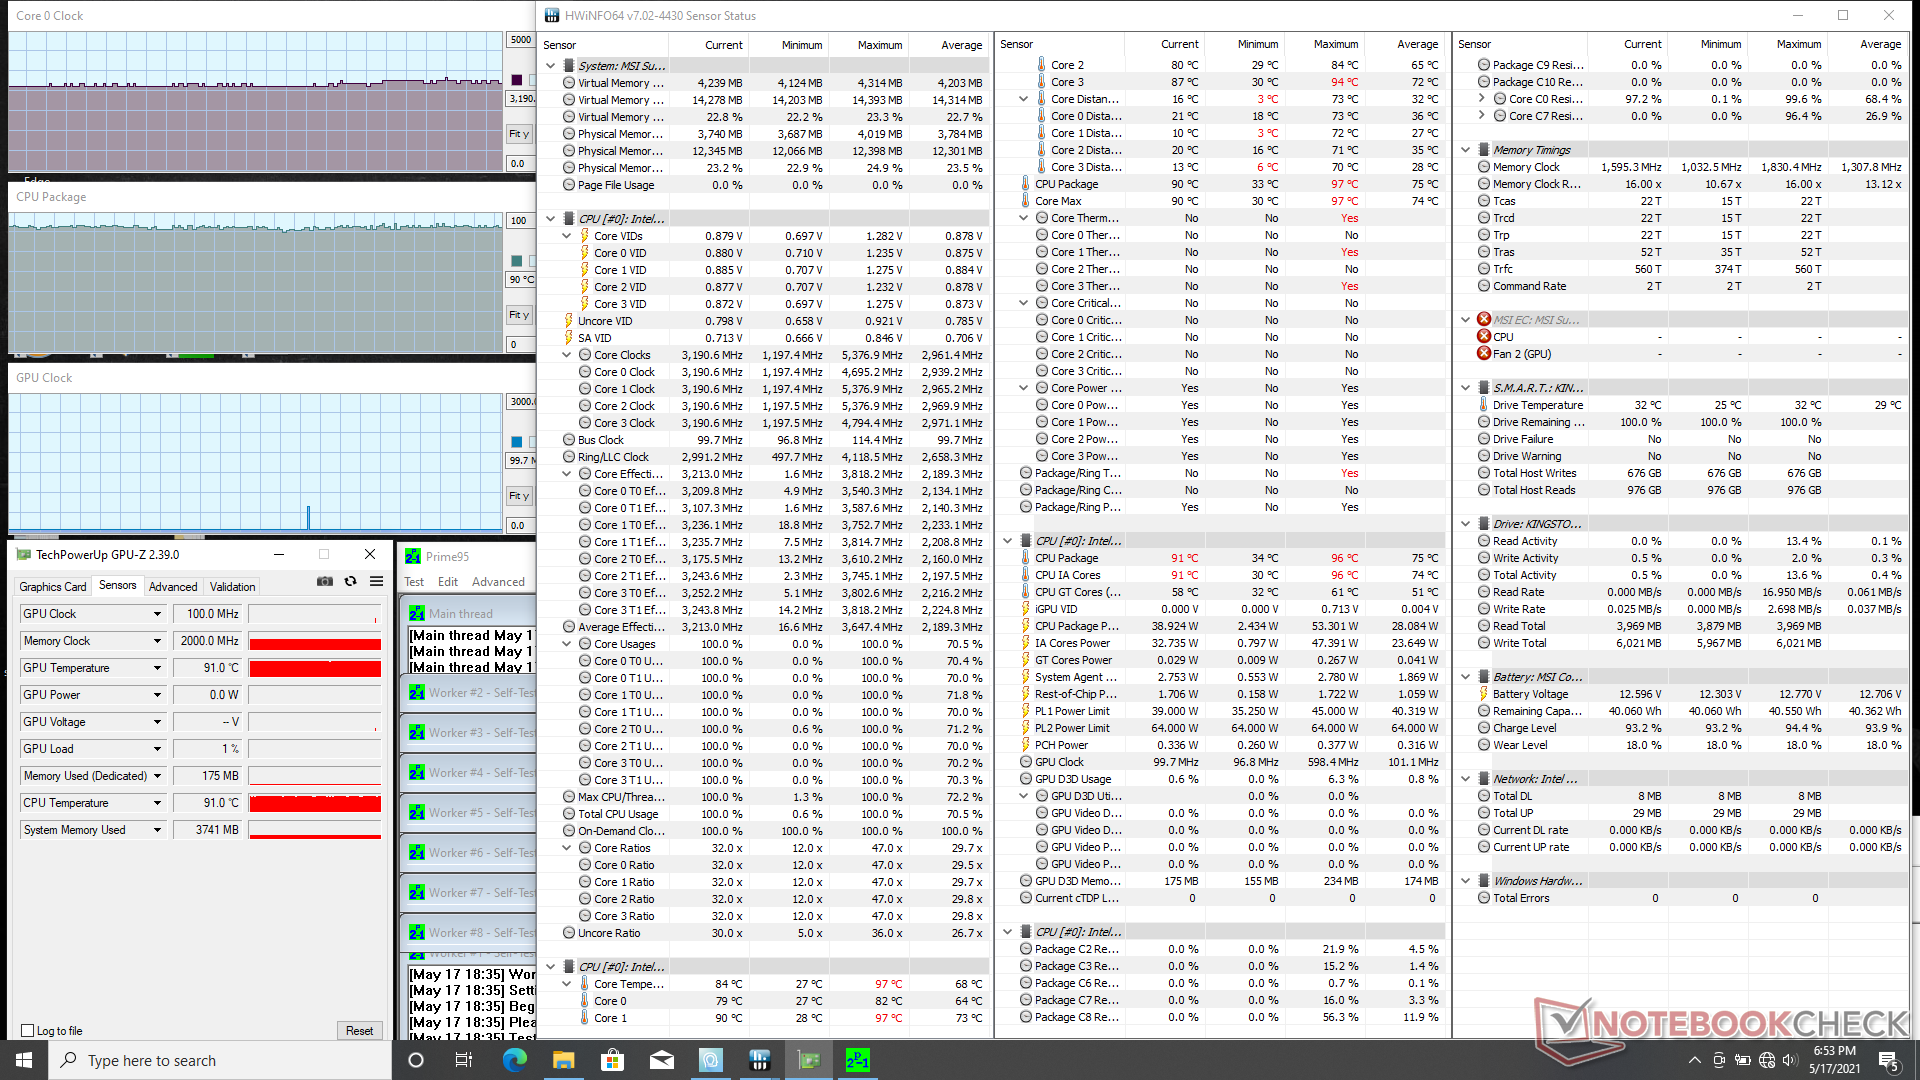
Test de stress
Lorsqu'il est sollicité avec Prime95, le CPU monte à 3,8 GHz pendant les premières secondes avant de baisser régulièrement et de se stabiliser dans la fourchette de 3,0 à 3,1 GHz. En activant le mode Cooler Boost (c'est-à-dire le mode ventilateur maximum), le CPU fonctionnera légèrement plus vite à 3,2 ou 3,3 GHz alors que la température centrale reste la même à 90 C. La température du CPU sur le Modern 15 serait beaucoup plus froide à 73 C sous des charges similaires
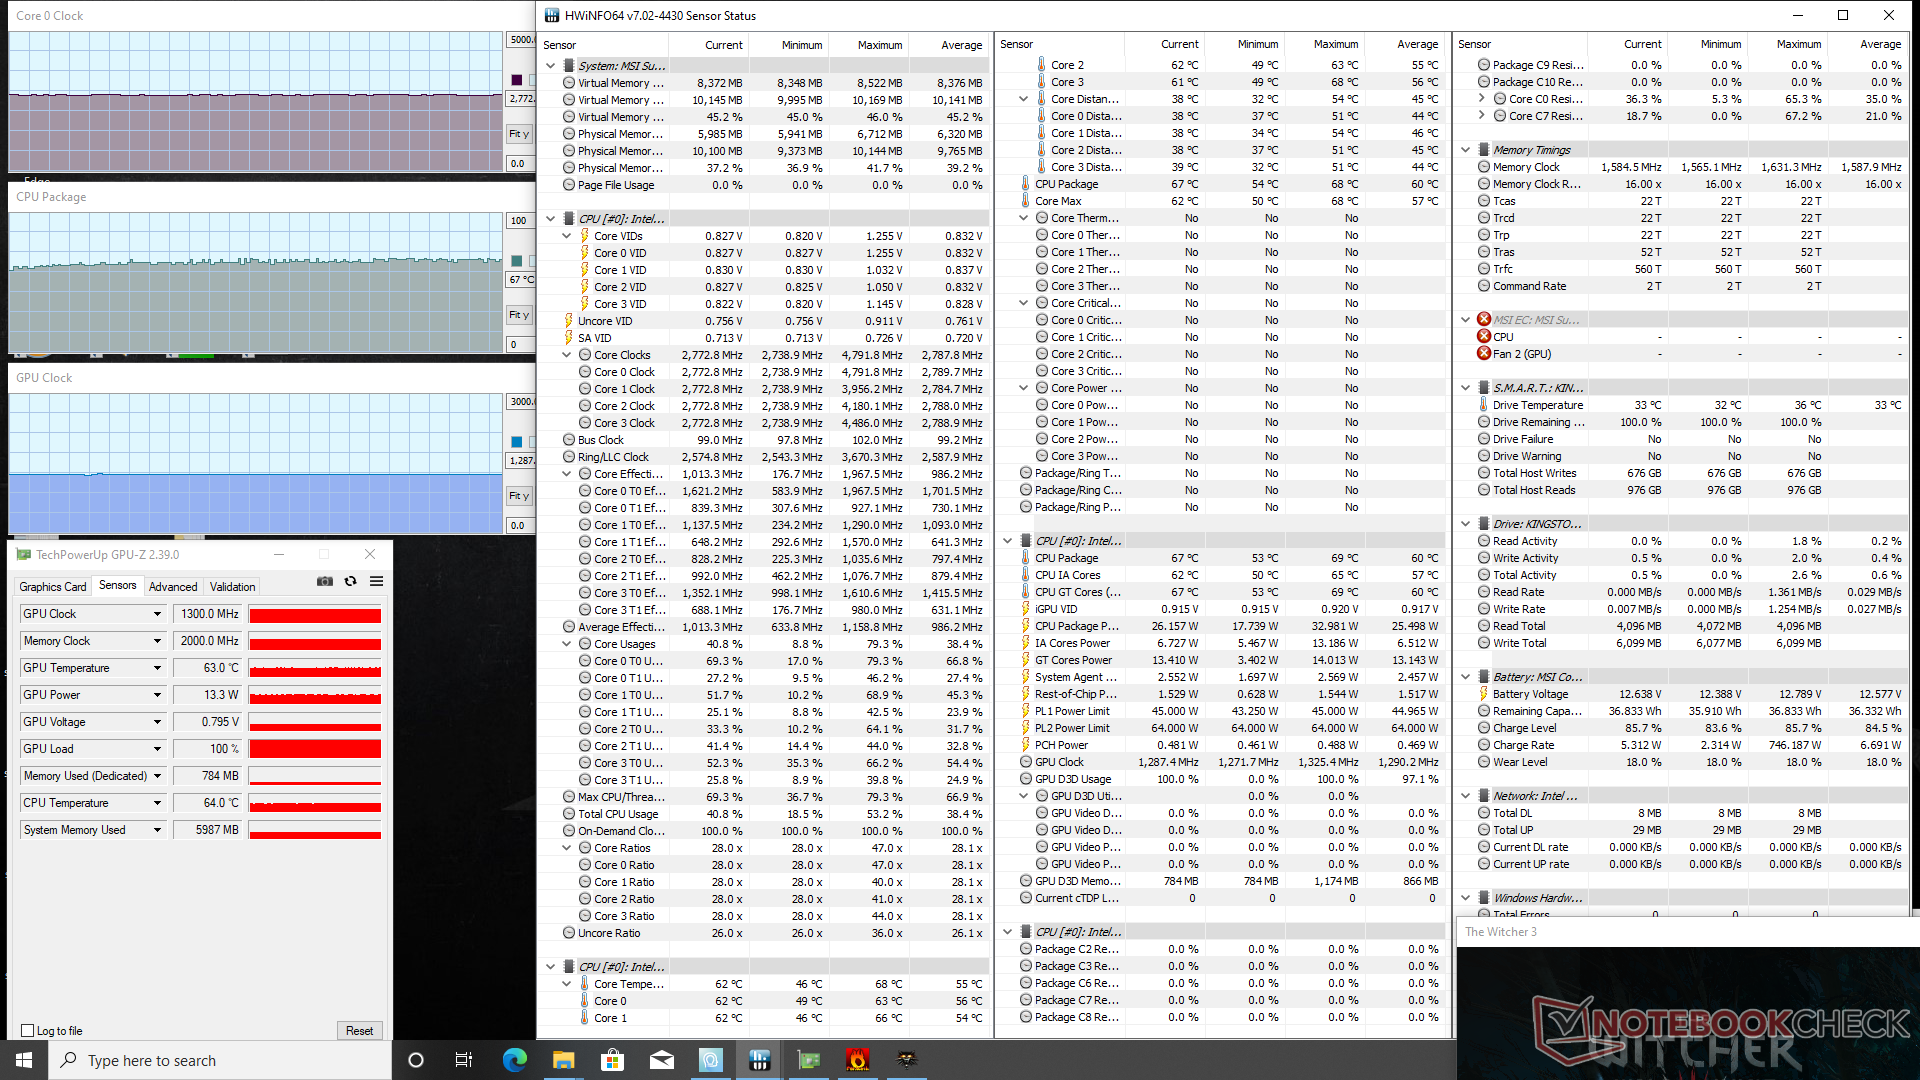
Lors de l'exécution Witcher 3 pour représenter les charges stressantes du monde réel, le CPU se stabiliserait à seulement 67 C ou même 56 C si Cooler Boost est activé. Les performances restent les mêmes, quel que soit le réglage de Cooler Boost, ce qui signifie que cette fonction est principalement destinée à la température
Le fonctionnement sur batterie peut avoir un impact sur les performances graphiques. Un test 3DMark 11 sur batterie donne le même score physique que sur adaptateur secteur, mais avec un score graphique légèrement inférieur (6550 contre 6232 points).
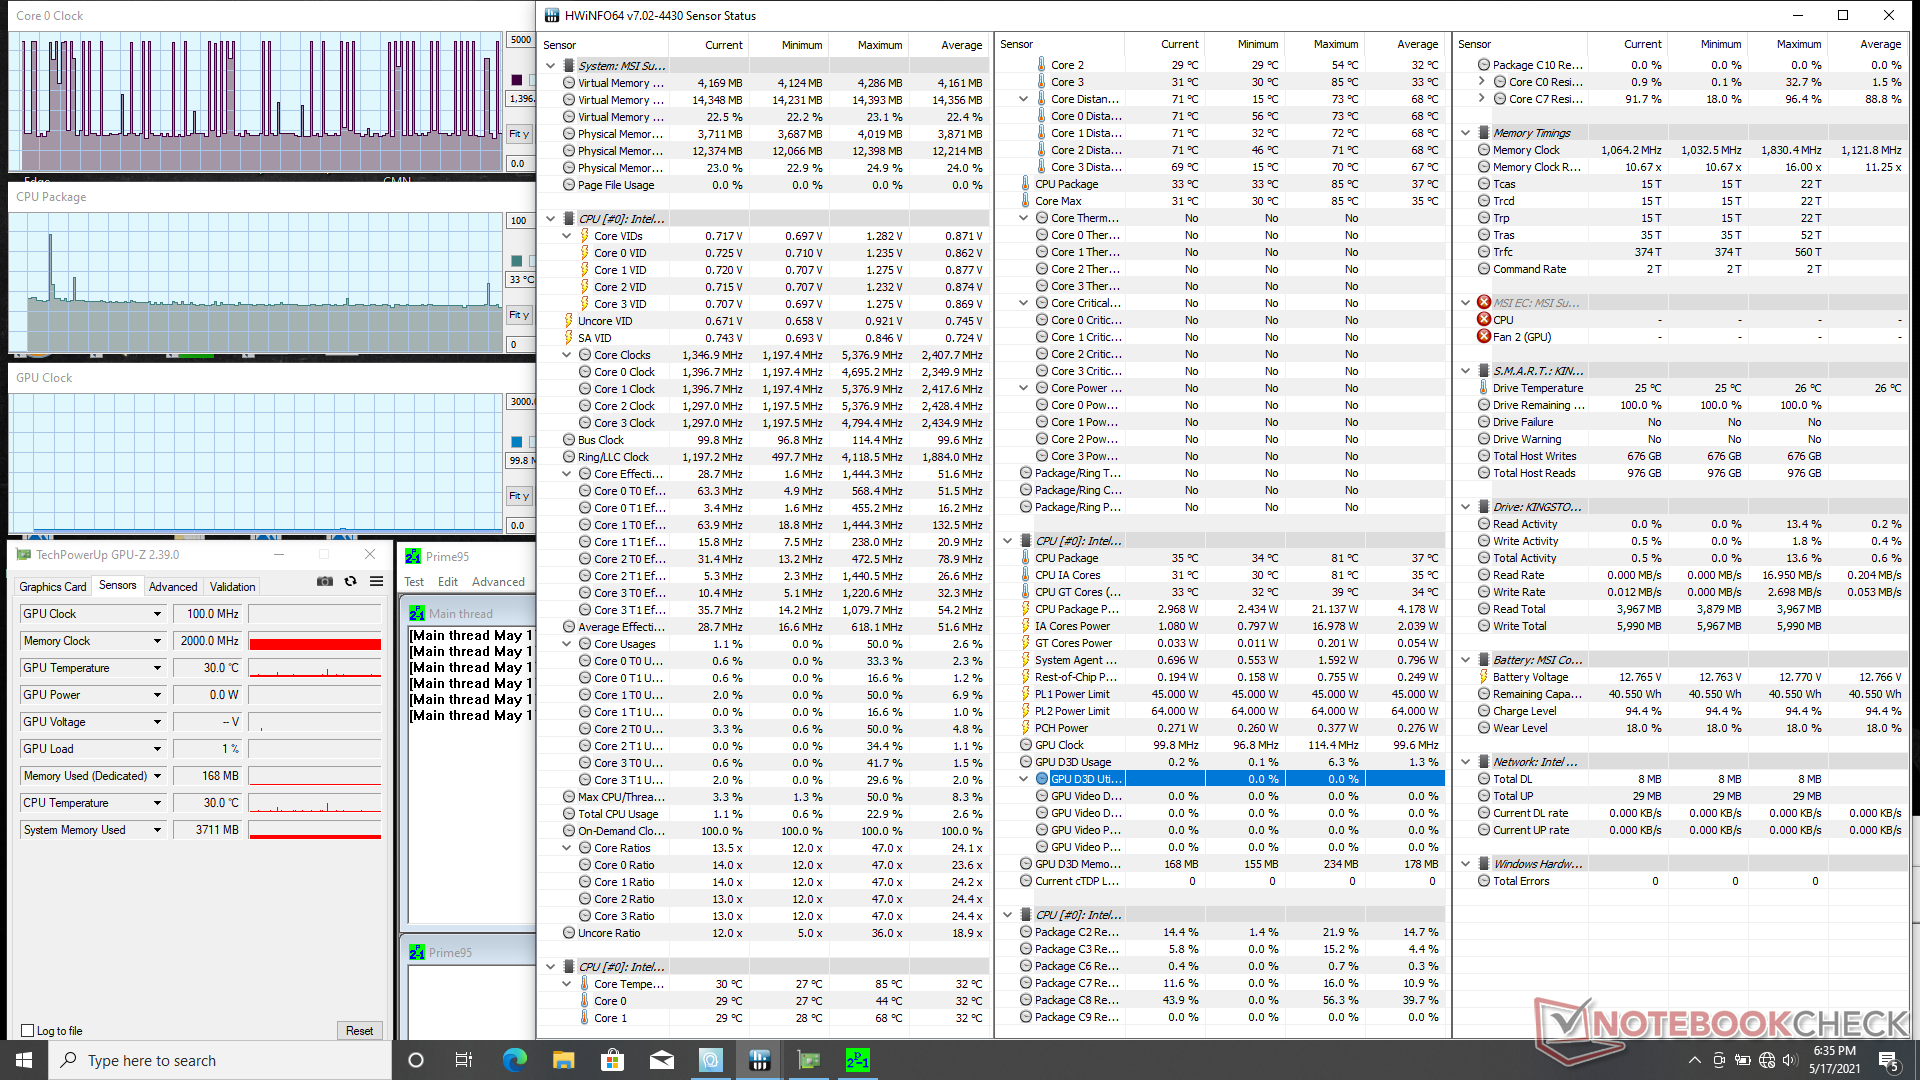
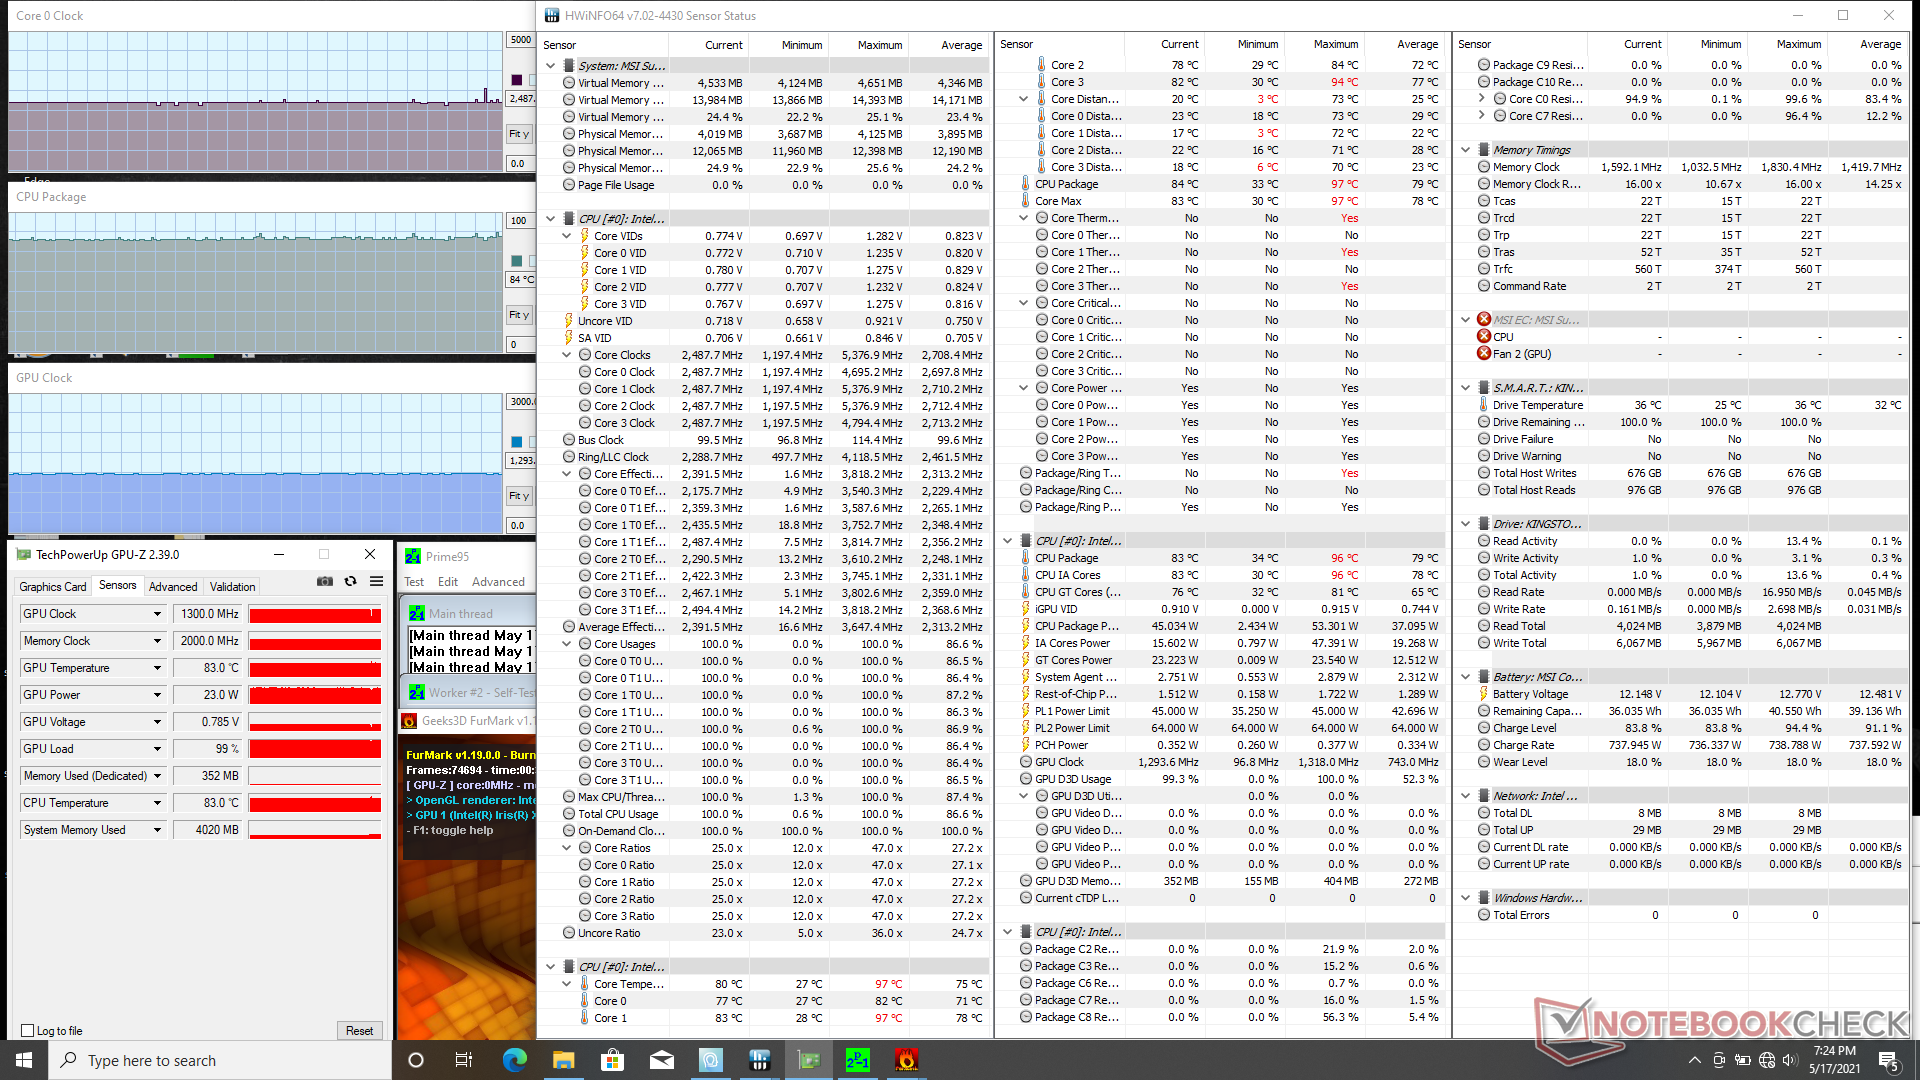

| Fréquence CPU(GHz) | Fréquence GPU(MHz) | Température CPUmoyenne(°C) |
| Système au repos | - | - |
| Prime95 + FurMark Stress (Cooler Boost on) | 2.5 | 1300 |
| Prime95 Stress (Cooler Boost off) | 3.0 - 3.1 | -- |
| Prime95 Stress (Cooler Boost on) | 3.2 - 3.3 | -- |
| Witcher 3 Stress (Cooler Boost off) | 2.8 | 1300 |
| Witcher 3 Stress (Cooler Boost on) | 2.8 | 1300 |
Haut-parleurs


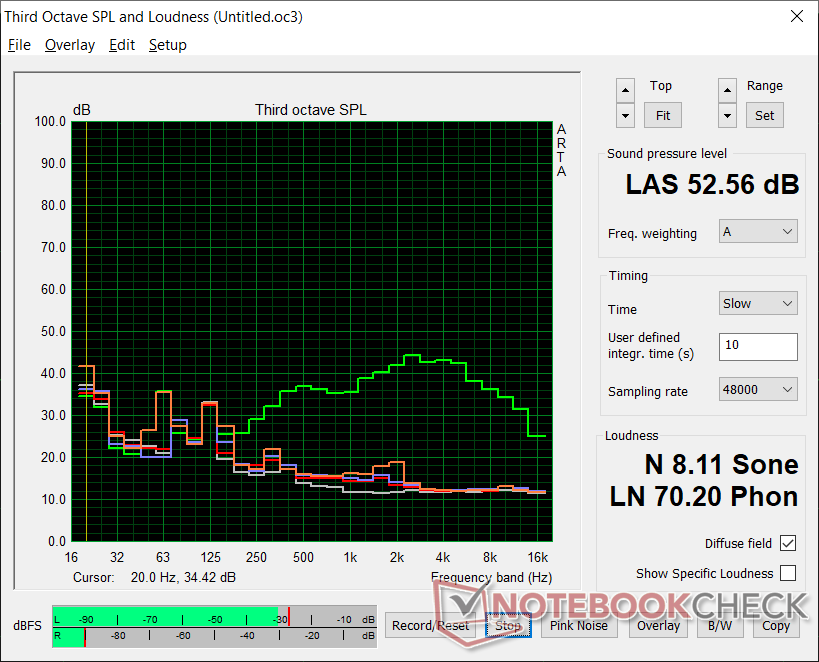
MSI Summit B15 A11M analyse audio
(+) | les haut-parleurs peuvent jouer relativement fort (83.9# dB)
Basses 100 - 315 Hz
(-) | presque aucune basse - en moyenne 18.2% plus bas que la médiane
(±) | la linéarité des basses est moyenne (12.2% delta à la fréquence précédente)
Médiums 400 - 2000 Hz
(±) | médiane supérieure - en moyenne 9.5% supérieure à la médiane
(±) | la linéarité des médiums est moyenne (9.3% delta à la fréquence précédente)
Aiguës 2 - 16 kHz
(±) | sommets plus élevés - en moyenne 7.5% plus élevés que la médiane
(±) | la linéarité des aigus est moyenne (7.1% delta à la fréquence précédente)
Globalement 100 - 16 000 Hz
(±) | la linéarité du son global est moyenne (25.6% de différence avec la médiane)
Par rapport à la même classe
» 78% de tous les appareils testés de cette catégorie étaient meilleurs, 6% similaires, 16% pires
» Le meilleur avait un delta de 7%, la moyenne était de 21%, le pire était de 53%.
Par rapport à tous les appareils testés
» 79% de tous les appareils testés étaient meilleurs, 4% similaires, 17% pires
» Le meilleur avait un delta de 4%, la moyenne était de 23%, le pire était de 134%.
Apple MacBook 12 (Early 2016) 1.1 GHz analyse audio
(+) | les haut-parleurs peuvent jouer relativement fort (83.6# dB)
Basses 100 - 315 Hz
(±) | basse réduite - en moyenne 11.3% inférieure à la médiane
(±) | la linéarité des basses est moyenne (14.2% delta à la fréquence précédente)
Médiums 400 - 2000 Hz
(+) | médiane équilibrée - seulement 2.4% de la médiane
(+) | les médiums sont linéaires (5.5% delta à la fréquence précédente)
Aiguës 2 - 16 kHz
(+) | des sommets équilibrés - à seulement 2% de la médiane
(+) | les aigus sont linéaires (4.5% delta à la fréquence précédente)
Globalement 100 - 16 000 Hz
(+) | le son global est linéaire (10.2% différence à la médiane)
Par rapport à la même classe
» 7% de tous les appareils testés de cette catégorie étaient meilleurs, 2% similaires, 91% pires
» Le meilleur avait un delta de 5%, la moyenne était de 18%, le pire était de 53%.
Par rapport à tous les appareils testés
» 5% de tous les appareils testés étaient meilleurs, 1% similaires, 94% pires
» Le meilleur avait un delta de 4%, la moyenne était de 23%, le pire était de 134%.
Energy Management
Consommation d'énergie
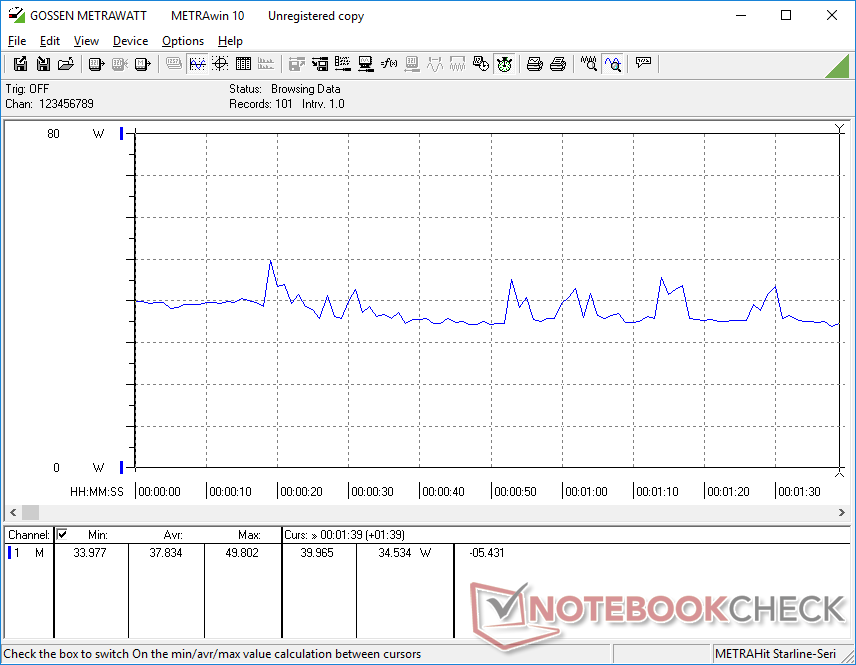
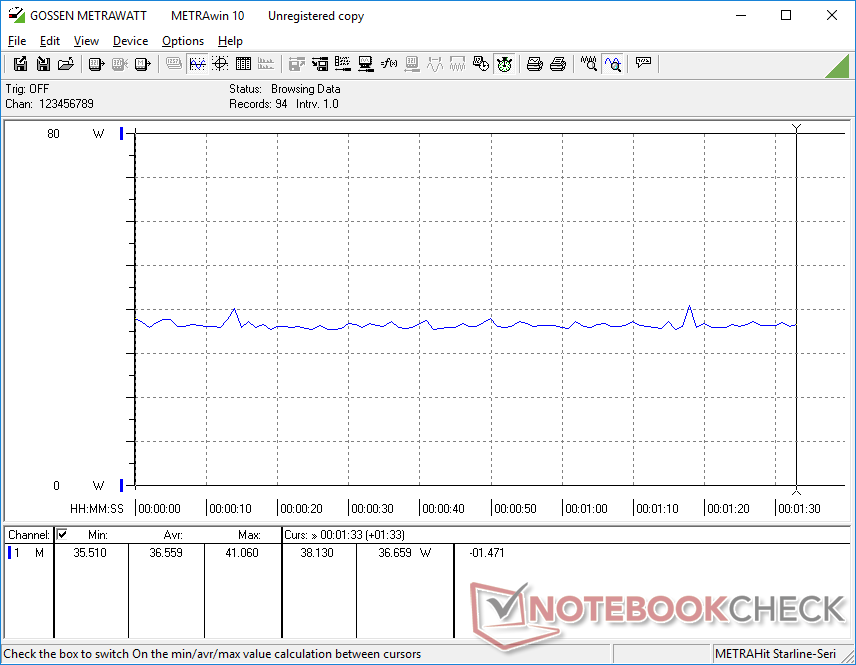
La consommation d'énergie est faible, surtout si on la compare à celle du Modern 15 de l'année dernière. Le ralenti sur le bureau consomme entre 4 W et 9 W selon le niveau de luminosité et le profil d'alimentation alors que le Modern 15 consommerait entre 6 W et 15 W. L'exécution de jeux consommerait également seulement 38 W sur notre Summit B15 contre 59 W à 83 W sur le Modern 15 même si notre système Summit peut surpasser le CPU de 10ème génération du Modern 15 tout en étant à peu près à égalité avec le GeForce MX250
Il est intéressant de noter que le XPG Xenia Xe avec le même CPU Core i7-1165G7 et le même GPU Iris Xe consomme légèrement plus d'énergie que notre Summit B15 en jeu (44 W contre 38 W). Le système XPG, cependant, surpasse constamment notre Summit dans les benchmarks GPU et les jeux
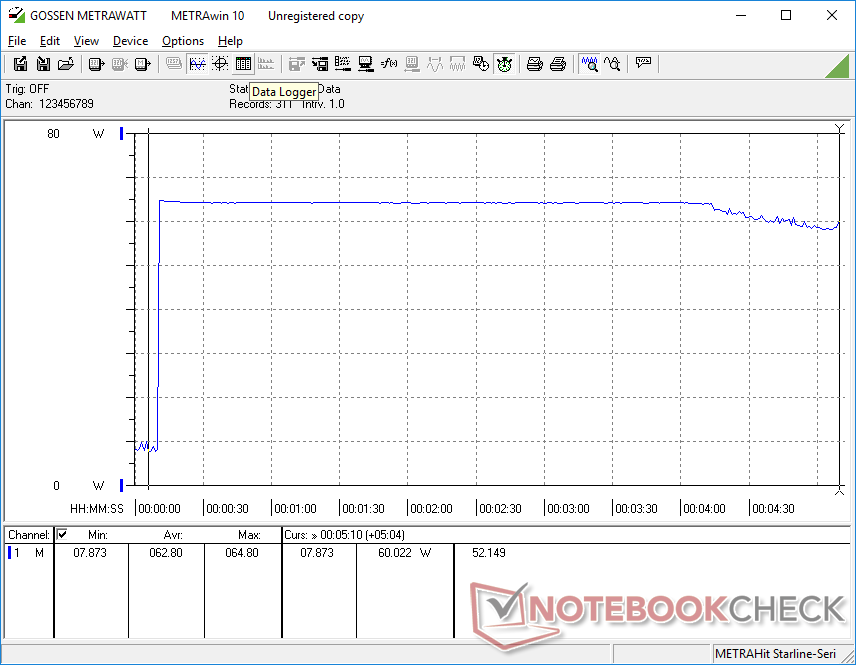
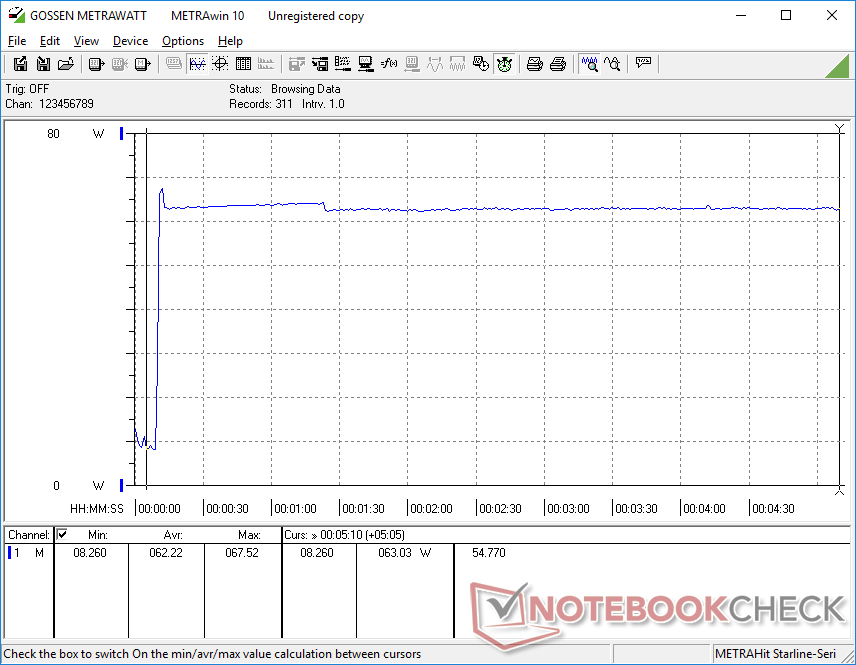
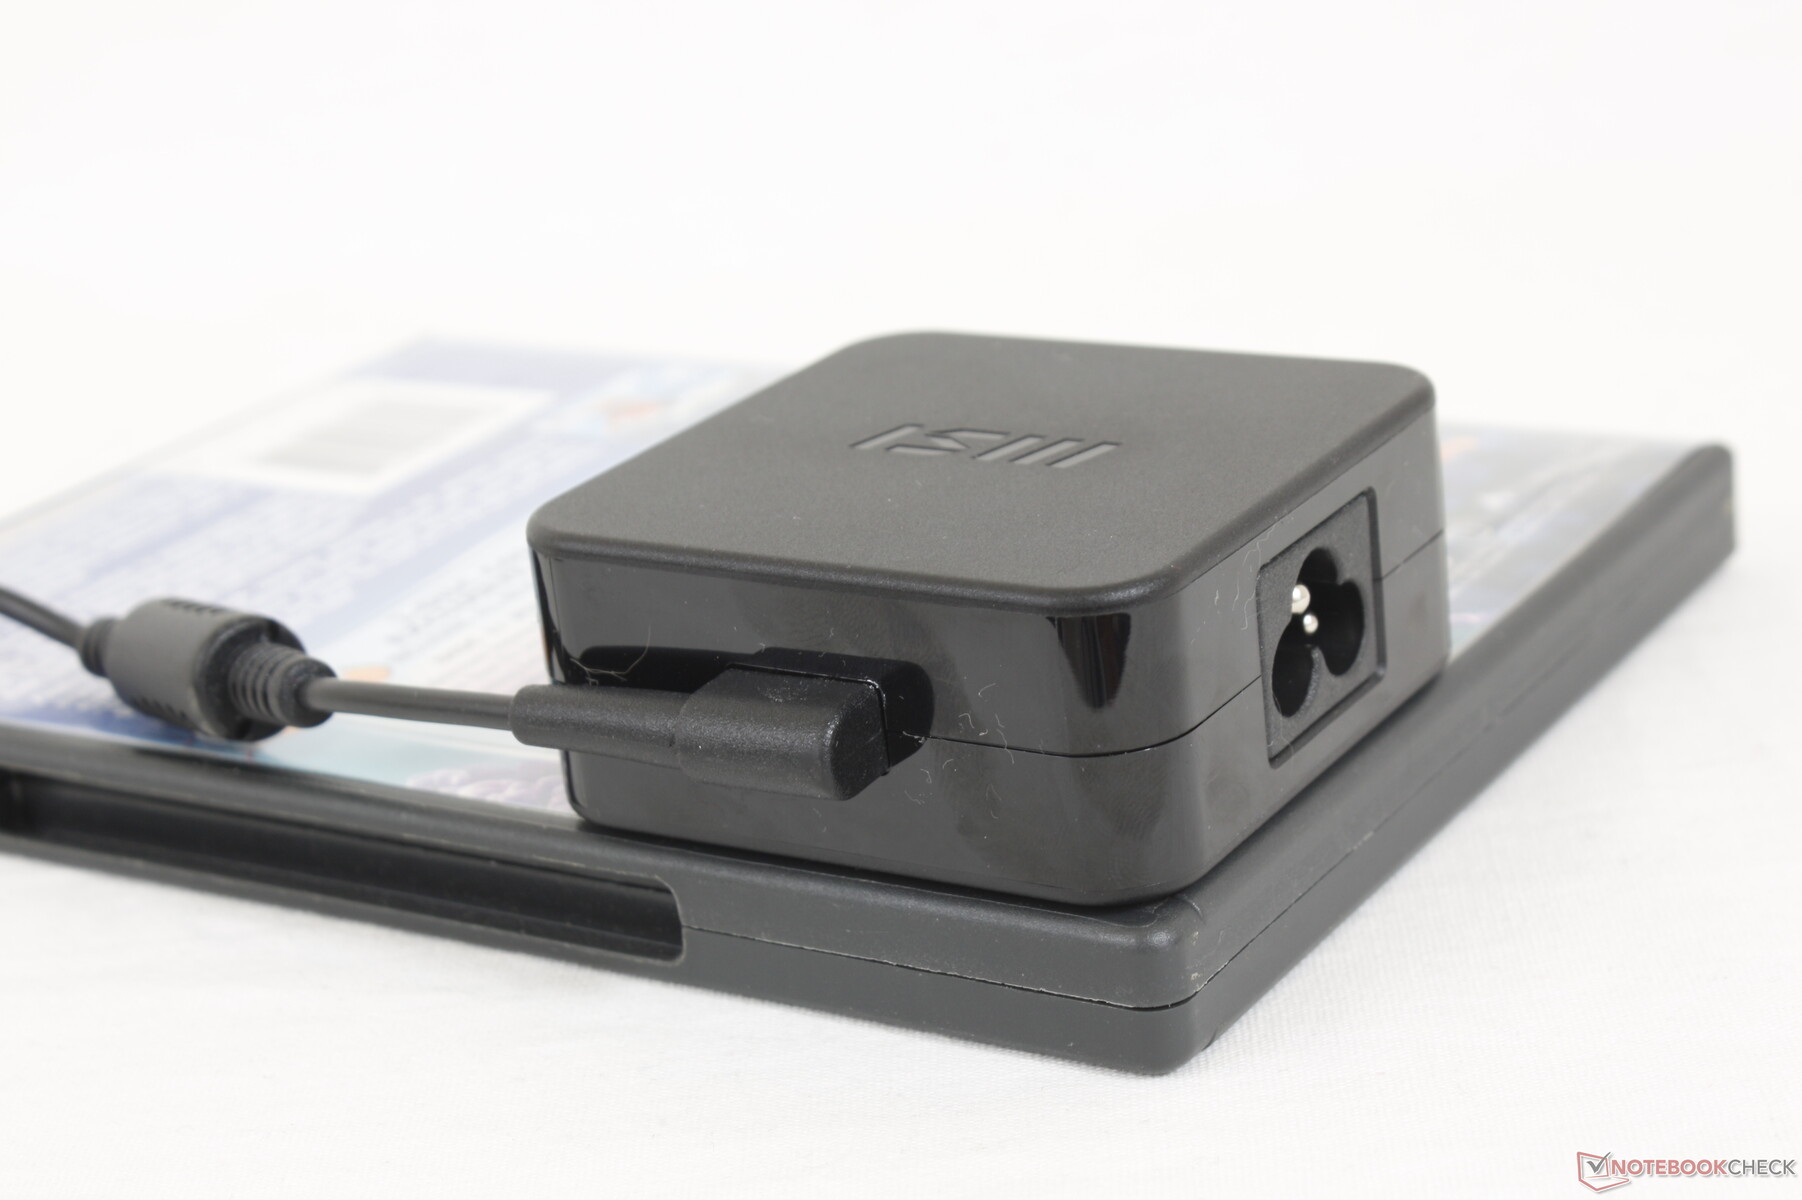
Nous sommes en mesure d'enregistrer une consommation maximale temporaire de 67,5 W à partir du petit adaptateur secteur de 65 W (~6,5 x 6,5 x 2,8 cm). Le système peut même maintenir une consommation approximative de 60 à 63 W pendant des périodes prolongées lorsqu'il est soumis à un stress de traitement extrême, ce qui montre qu'un adaptateur secteur plus performant aurait pu être bénéfique.
| Éteint/en veille | |
| Au repos | |
| Fortement sollicité |
|
Légende:
min: | |
| MSI Summit B15 A11M i7-1165G7, Iris Xe G7 96EUs, Kingston OM8PCP31024F, IPS, 1920x1080, 15.6" | MSI Summit E15 A11SCST i7-1185G7, GeForce GTX 1650 Ti Max-Q, Phison 1TB SM2801T24GKBB4S-E162, IPS, 1920x1080, 15.6" | Dell XPS 15 9500 Core i5 i5-10300H, UHD Graphics 630, Toshiba KBG40ZNS256G NVMe, IPS, 1920x1200, 15.6" | HP Spectre X360 15-5ZV31AV i7-10510U, GeForce MX250, Intel SSD 660p 2TB SSDPEKNW020T8, IPS, 3840x2160, 15.6" | ADATA XPG Xenia Xe i7-1165G7, Iris Xe G7 96EUs, ADATA XPG Gammix S50 1TB, IPS, 1920x1080, 15.6" | Asus ZenBook 15 UX534FTC-A8190T i7-10510U, GeForce GTX 1650 Max-Q, Samsung SSD PM981 MZVLB1T0HALR, IPS, 1920x1080, 15.6" | |
|---|---|---|---|---|---|---|
| Power Consumption | -68% | -3% | -34% | 8% | -29% | |
| Idle Minimum * (Watt) | 4.2 | 6 -43% | 2.9 31% | 5.2 -24% | 2.7 36% | 2.8 33% |
| Idle Average * (Watt) | 7.7 | 10 -30% | 7.6 1% | 8.5 -10% | 5.3 31% | 7.7 -0% |
| Idle Maximum * (Watt) | 8.4 | 16 -90% | 8 5% | 8.7 -4% | 7.3 13% | 9.4 -12% |
| Load Average * (Watt) | 37.8 | 84 -122% | 41.7 -10% | 65.6 -74% | 43.6 -15% | 57 -51% |
| Witcher 3 ultra * (Watt) | 36.6 | 69 -89% | 56.5 -54% | 43.5 -19% | 62 -69% | |
| Load Maximum * (Watt) | 67.5 | 90 -33% | 94.8 -40% | 92.4 -37% | 66.8 1% | 116 -72% |
* ... Moindre est la valeur, meilleures sont les performances
Autonomie de la batterie
Les durées d'exécution sont correctes, avec environ 6,5 heures d'utilisation réelle du WLAN, soit plusieurs heures de moins que le Summit E15, plus onéreux. La différence peut être attribuée à la plus petite capacité de la batterie de seulement 52 W, contre 80 W sur le modèle susmentionné.
Il faut environ 2 heures pour recharger le système de son état vide à sa pleine capacité avec l'adaptateur secteur. Le système peut également se recharger via des adaptateurs secteur USB-C tiers. Nous soupçonnons que les futurs modèles abandonneront complètement le port propriétaire AC barrel et passeront à la recharge USB-C uniquement.
| MSI Summit B15 A11M i7-1165G7, Iris Xe G7 96EUs, 52 Wh | MSI Summit E15 A11SCST i7-1185G7, GeForce GTX 1650 Ti Max-Q, 80.25 Wh | Dell XPS 15 9500 Core i5 i5-10300H, UHD Graphics 630, 56 Wh | HP Spectre X360 15-5ZV31AV i7-10510U, GeForce MX250, 84 Wh | ADATA XPG Xenia Xe i7-1165G7, Iris Xe G7 96EUs, 73.41 Wh | Asus ZenBook 15 UX534FTC-A8190T i7-10510U, GeForce GTX 1650 Max-Q, 71 Wh | |
|---|---|---|---|---|---|---|
| Autonomie de la batterie | 41% | 48% | 92% | 77% | 92% | |
| Reader / Idle (h) | 18.4 | 19.5 6% | 26.4 43% | 22.6 23% | 27.2 48% | |
| WiFi v1.3 (h) | 6.6 | 9.1 38% | 9.3 41% | 10.8 64% | 11.7 77% | 12.4 88% |
| Load (h) | 1 | 1.8 80% | 1.6 60% | 2.9 190% | 2.4 140% |
Points positifs
Points négatifs
Verdict

Le Summit B15 de MSI vaut-il la peine d'être acheté par rapport à l'ancien modèle Modern 15 même s'il s'agit de deux ordinateurs portables très similaires ? Si vous appréciez Thunderbolt 4, un processeur plus rapide et un ventilateur généralement plus silencieux, alors le nouveau Summit B15 mérite d'être considéré. Ses performances brutes sont impressionnantes pour un facteur de forme aussi léger de 15,6 pouces et les utilisateurs peuvent toujours connecter des GPU et des écrans externes pour obtenir des graphiques plus rapides et de meilleures couleurs, respectivement.
Les voyageurs apprécieront le poids ultra léger, les ventilateurs silencieux et les performances élevées par rapport aux Ultrabooks 15,6 pouces populaires comme le XPS 15, le Spectre x360 15 ou le Lenovo IdeaPad 15. Cependant, pour un ordinateur portable de plus de 1000 dollars américains, la rigidité du châssis n'est pas aussi forte que nous le souhaiterions.
Si vos charges de travail consistent principalement en une navigation web de base, du streaming vidéo, des jeux légers ou un montage minimal, alors le Modern 15 avec les graphiques GeForce MX sera plus que suffisant tout en coûtant des centaines de dollars de moins. N'oubliez pas que les deux ordinateurs portables offrent la même expérience en ce qui concerne l'écran, le clavier, le pavé tactile et la qualité du châssis. Vous perdrez toutefois les lucratives capacités d'accueil de Thunderbolt.
Prix et disponibilité
MSI Summit B15 A11M
- 05/20/2021 v7 (old)
Allen Ngo
Price comparison

