

Verdict - un excellent écran pour les créateurs
Notre HP ZBook 8 G1i avec RTX 500 se positionne en termes de performances juste entre le ZBook 8 avec carte graphique intégrée et le ZBook Ultra avec Radeon 8050S. Ses performances sont constantes, la qualité de construction est élevée et l'écran impressionne avec une couverture de l'espace couleur presque inégalée.
Le fait que le SSD ne puisse pas maintenir ses performances thermiques et que les latences soient actuellement assez élevées est sous-optimal pour une station de travail. HP pourrait également terminer le développement de son application HP : Les temps de démarrage parfois longs, les traductions incomplètes et les choix de conception discutables ne sont pas idéaux pour le public cible.
Points positifs
Points négatifs
Prix et disponibilité
Notre configuration d'essai est listée sur le site HP comme "bientôt disponible", avec des prix qui devraient se situer entre 2 500 et 2 900 euros. Sur le site de HP HP, la station de travail mobile personnalisable HP ZBook 8 G1i 14 pouces a un prix de vente conseillé de 2 942,00 USD. Le prix final et les détails de la configuration peuvent varier en fonction de la région et des options sélectionnées.
Table des matières
- Verdict - un excellent écran pour les créateurs
- Spécifications
- Boîtier et connectivité - métal argenté robuste
- Périphériques d'entrée - HP ZBook avec clavier silencieux
- Affichage - ZBook 8 G1i 14 avec 14 options
- Performances - performances élevées et constantes du ZBook
- Émissions et énergie - les bons orateurs
- Les alternatives en un coup d'œil
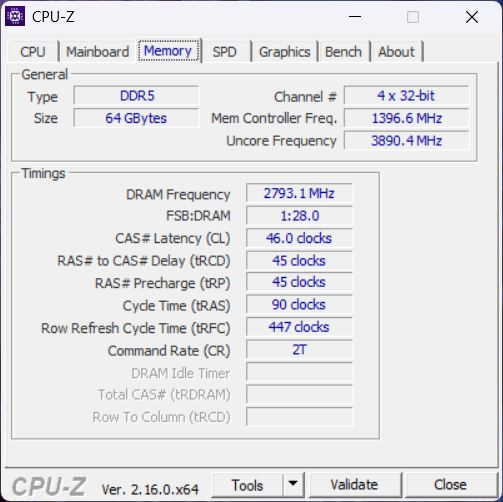
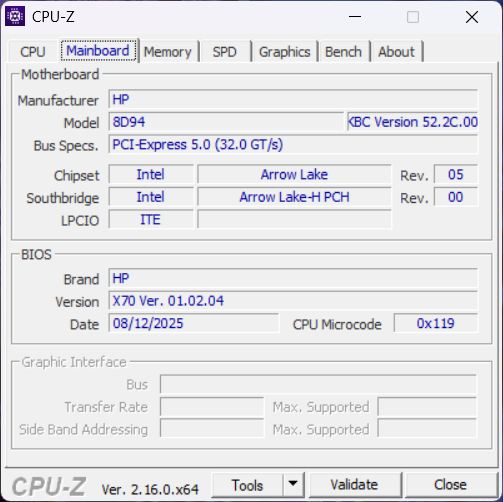
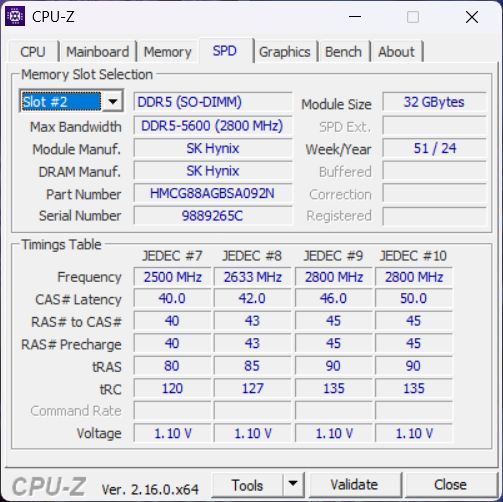
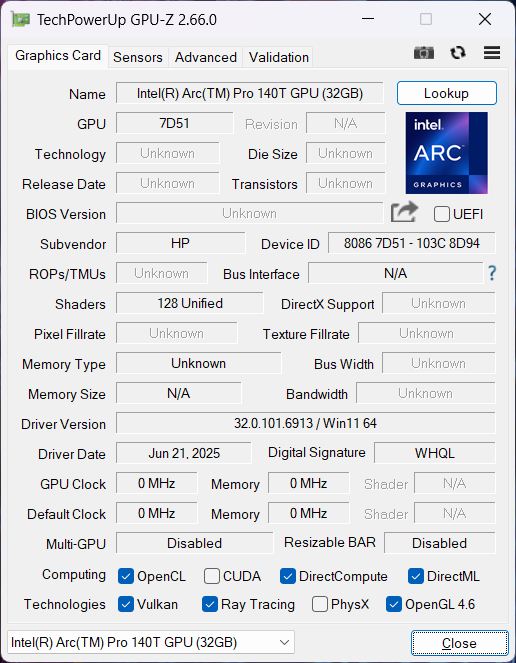
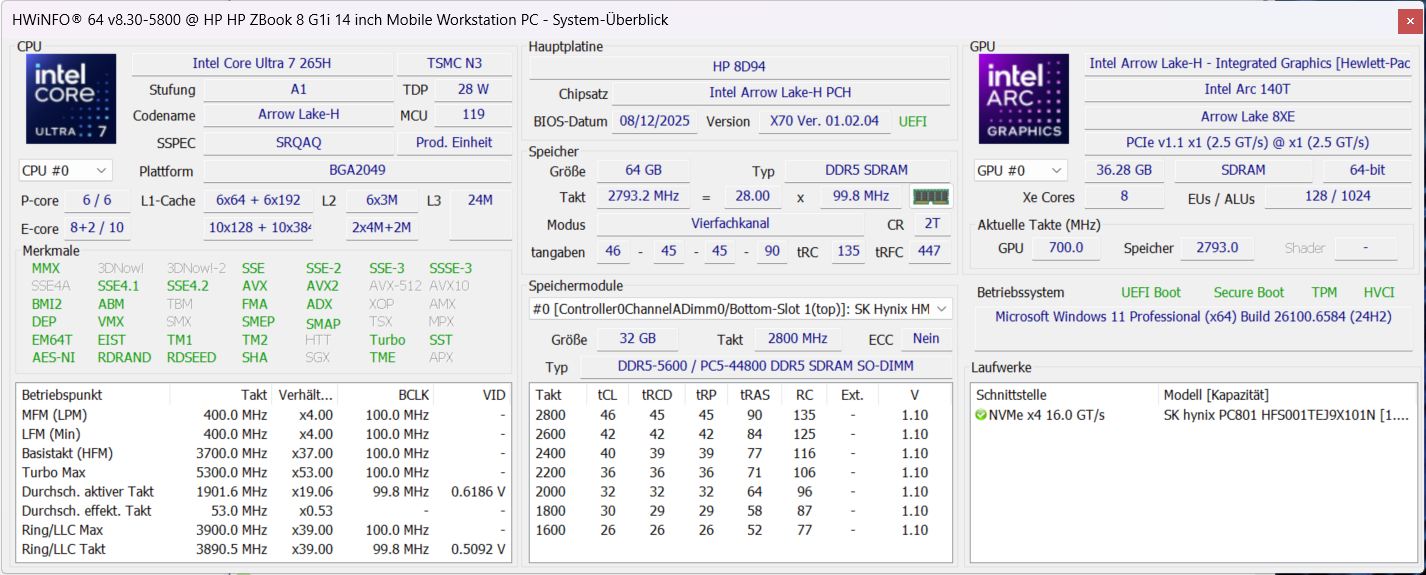
Dans un récent article, nous avons examiné le ZBook 8 équipé d'un Core Ultra 255H et d'une carte graphique intégrée. Étant donné qu'une station de travail professionnelle est censée inclure un GPU dédié, cet article porte sur la version équipée d'une carte graphique Nvidia RTX 500 Nvidia RTX 500de 64 Go de RAM et d'un Core Ultra 7 265H.
Spécifications
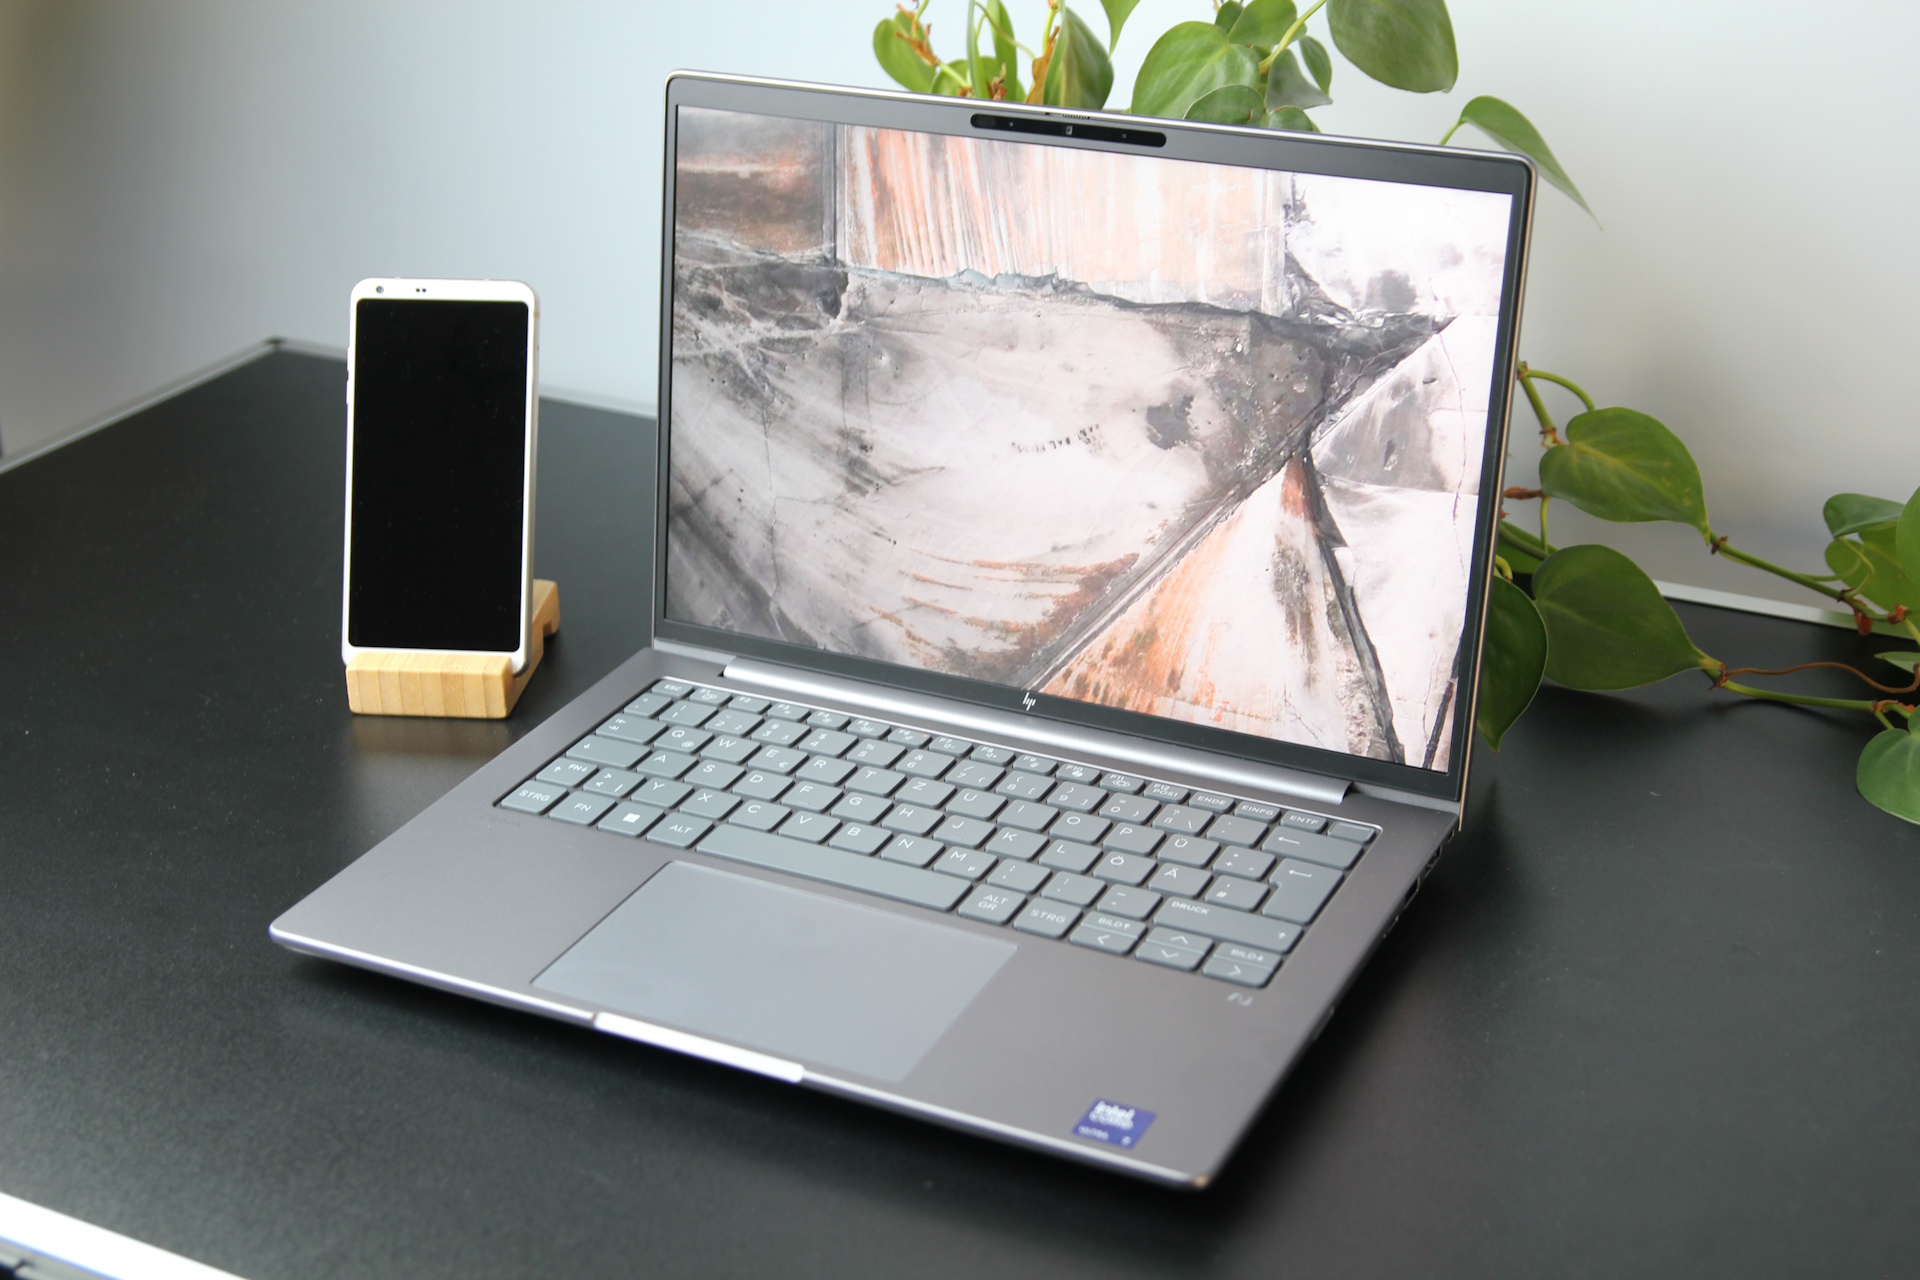
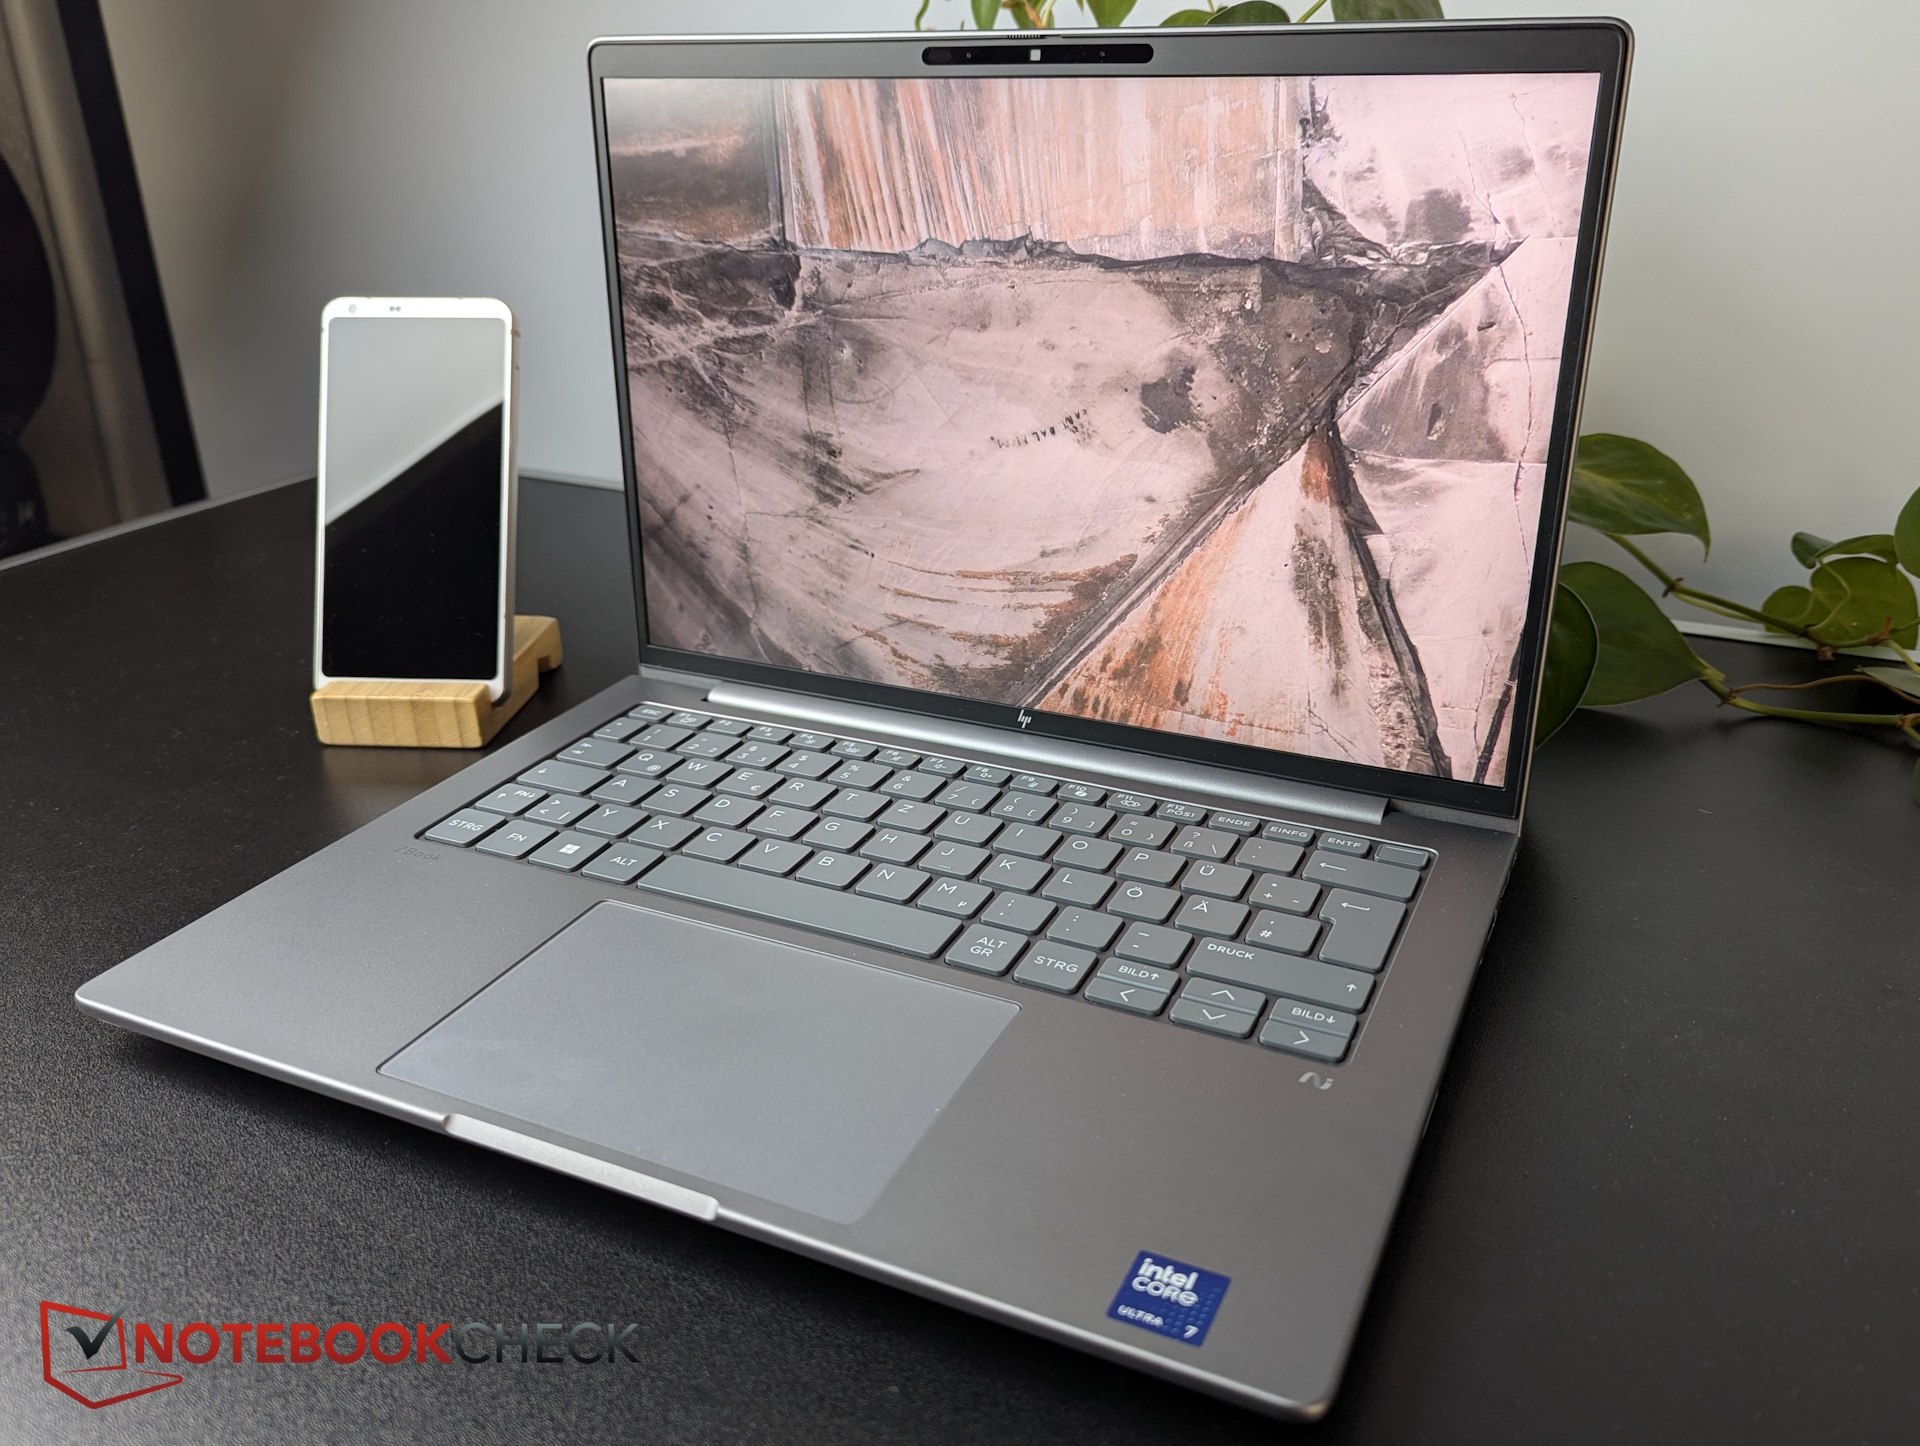
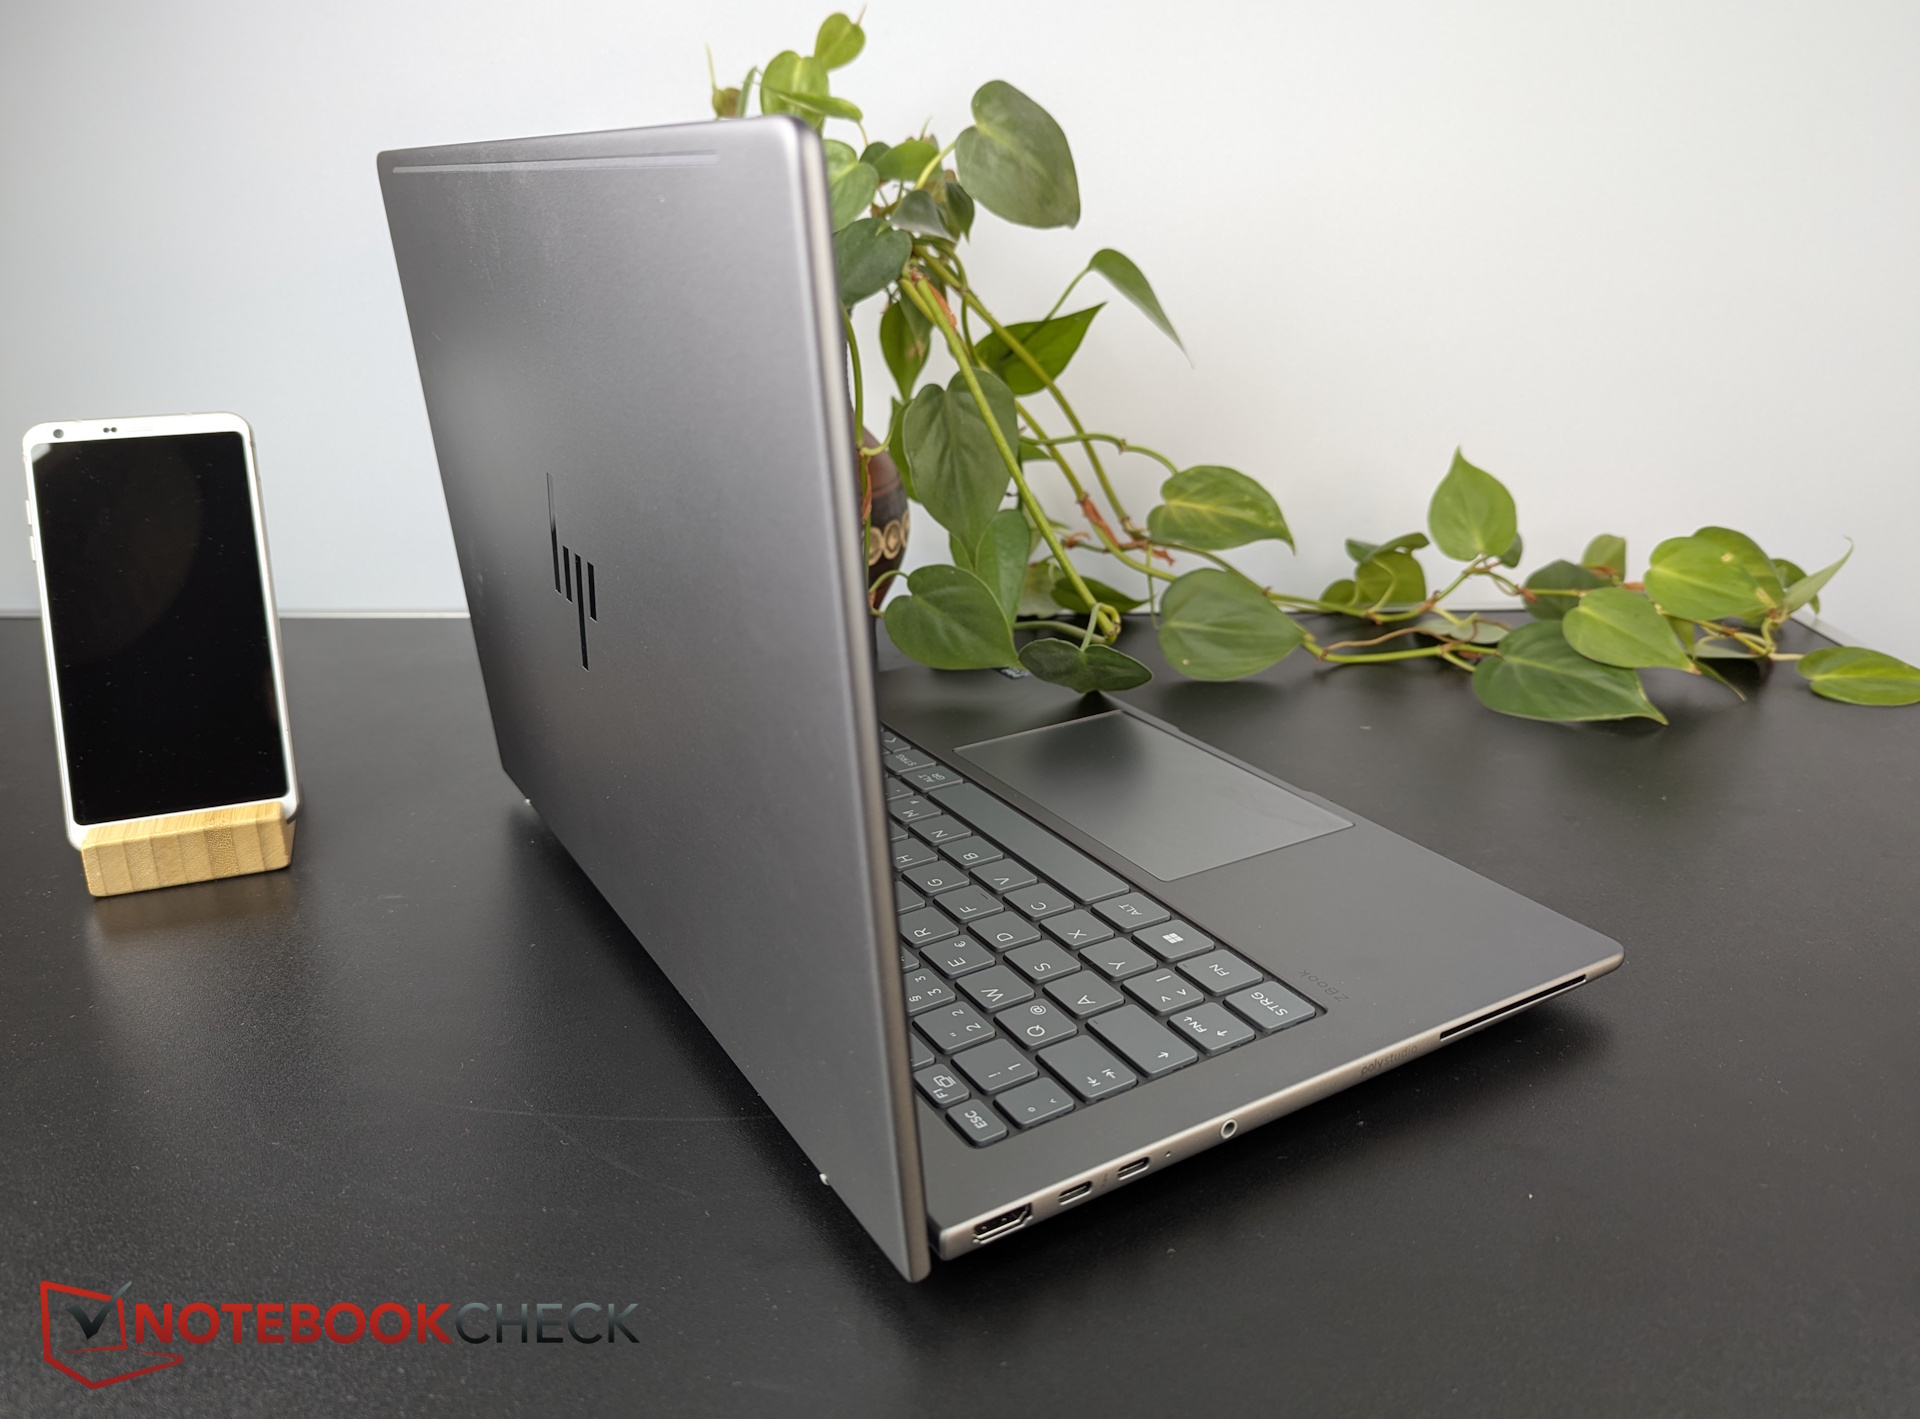
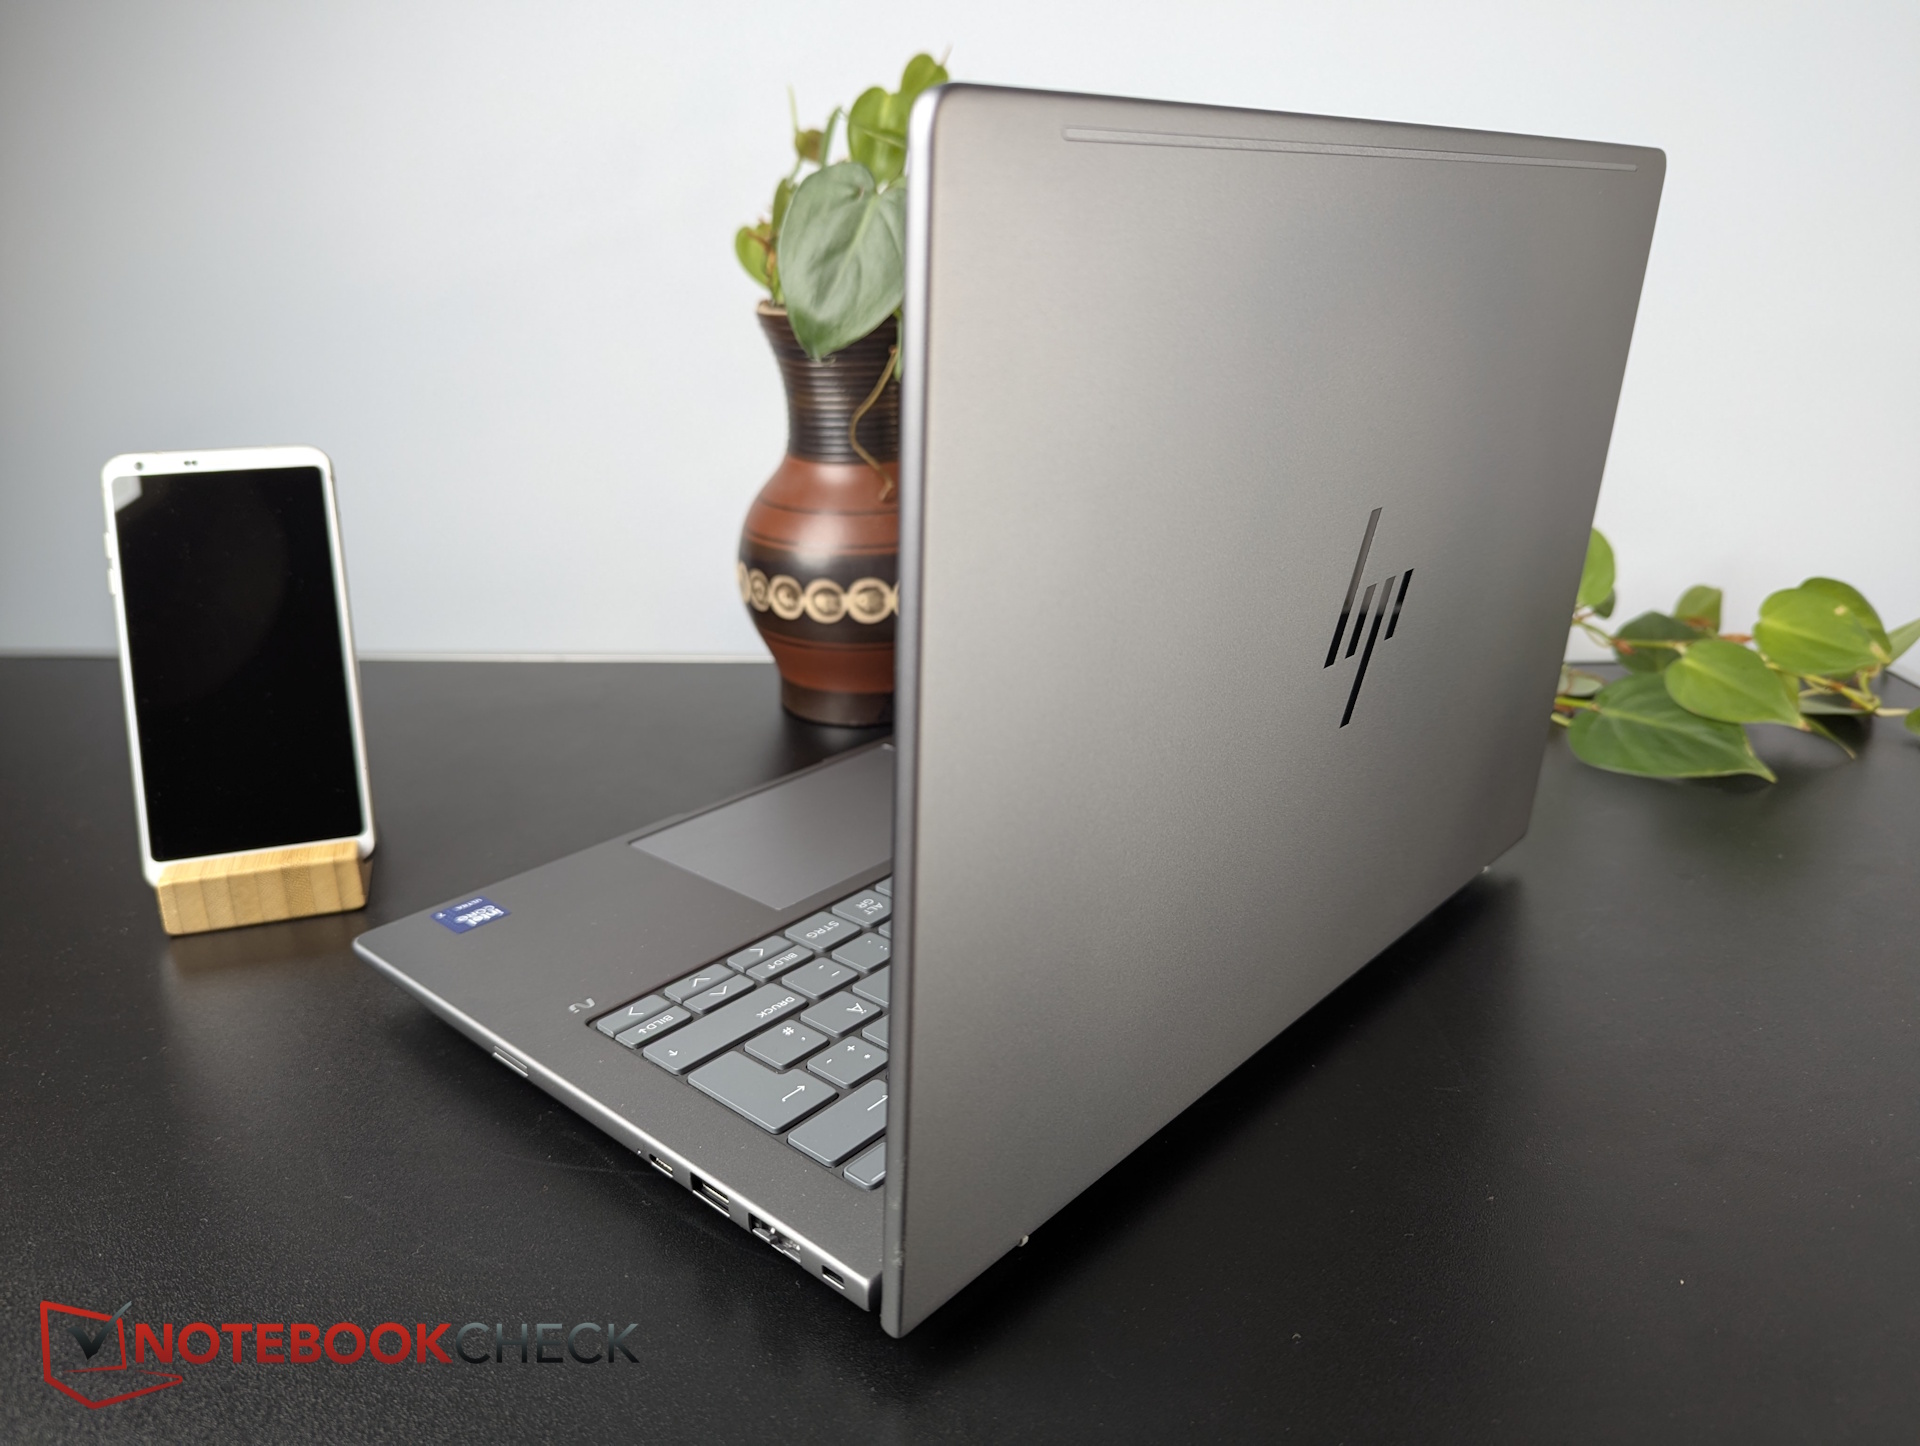
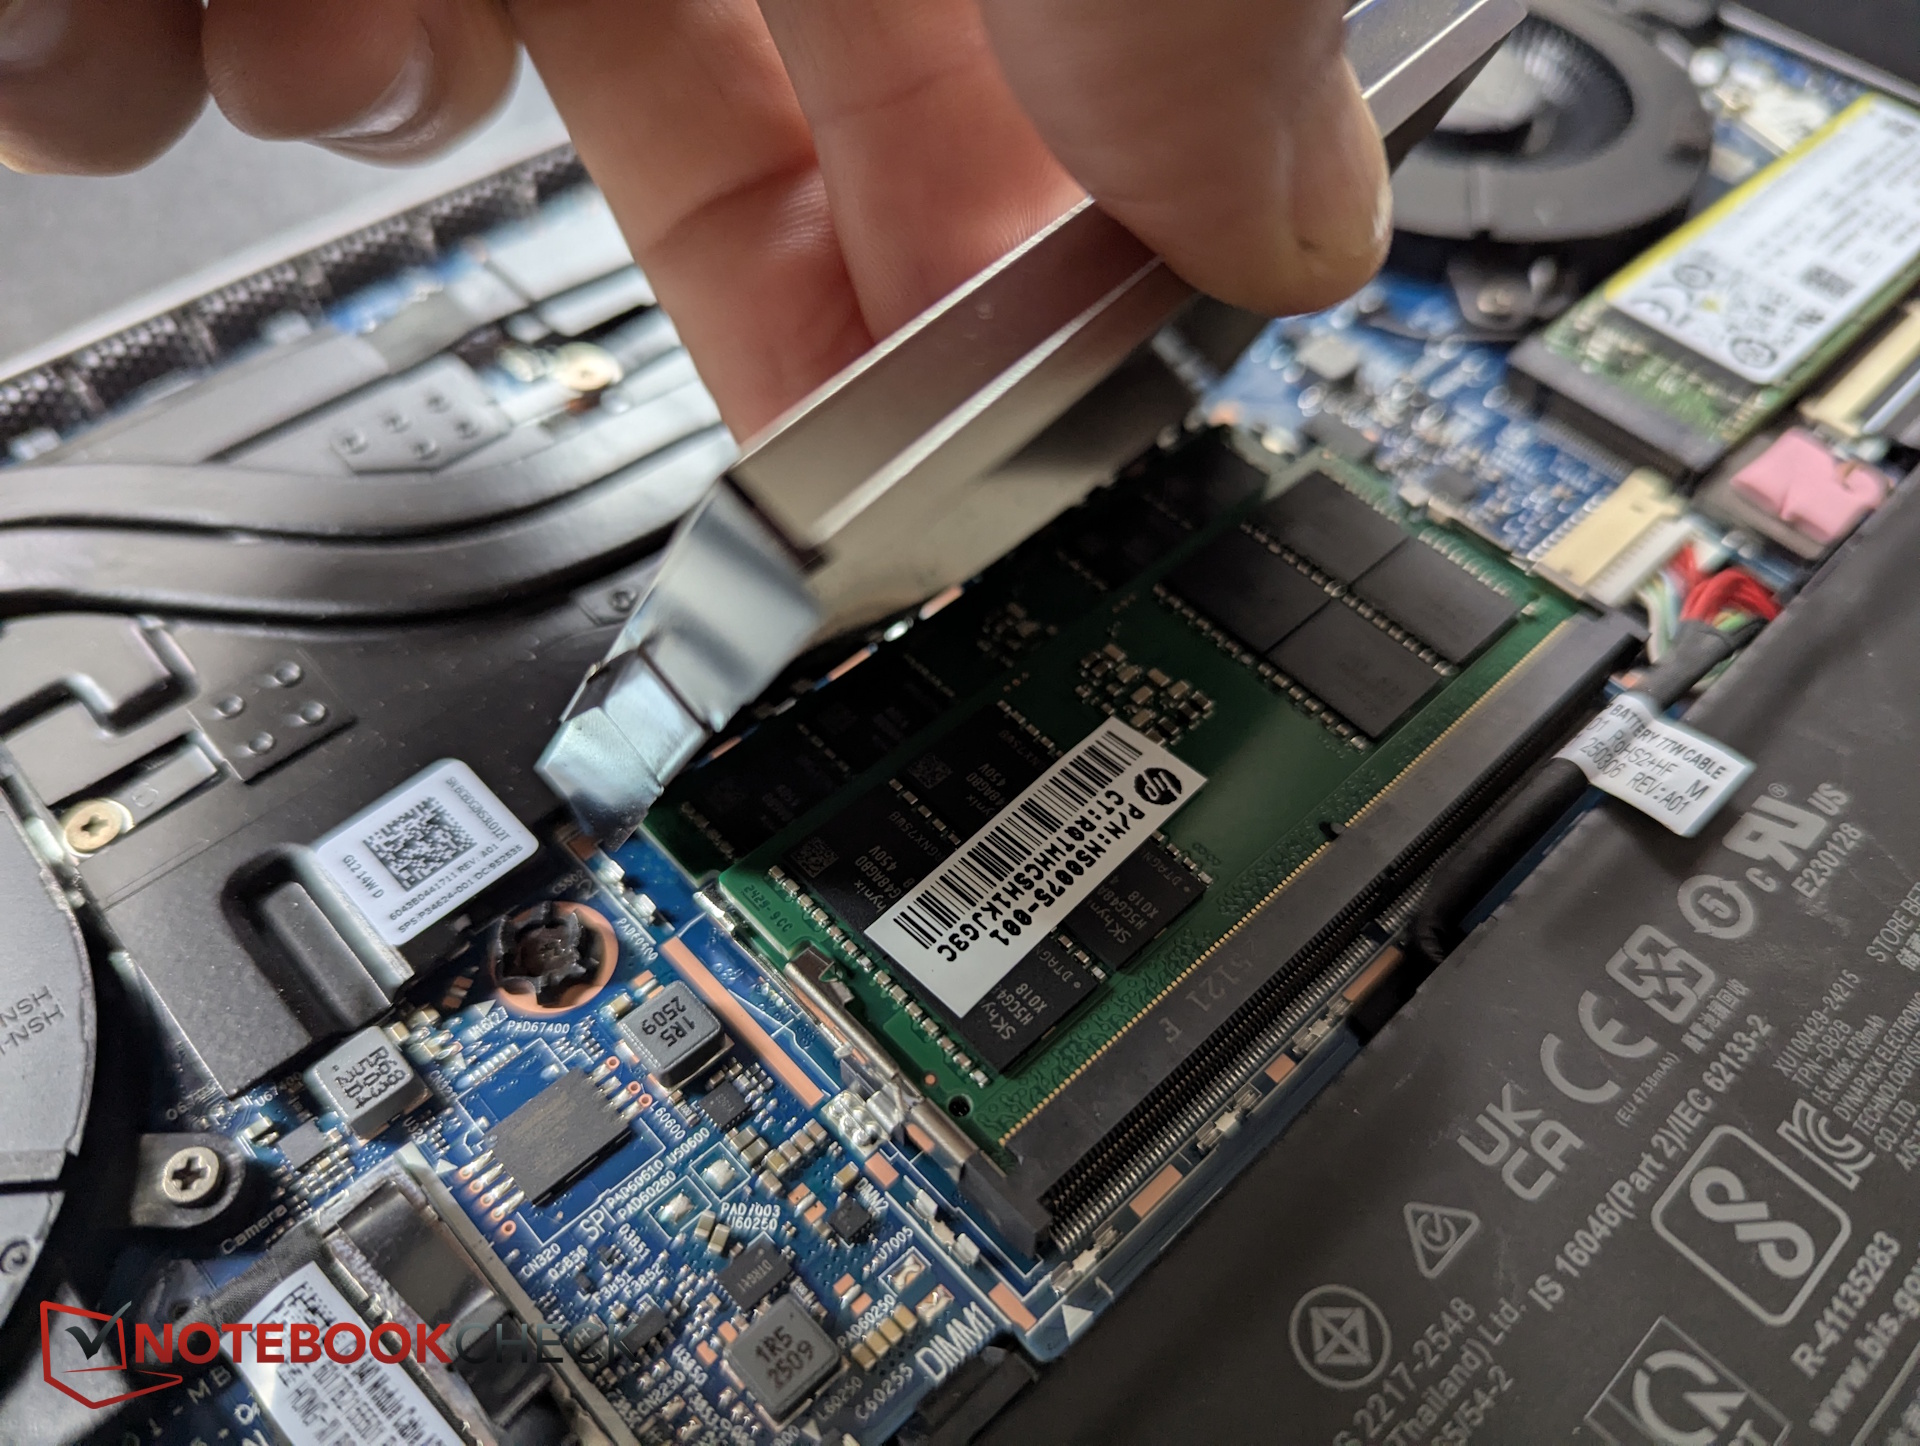
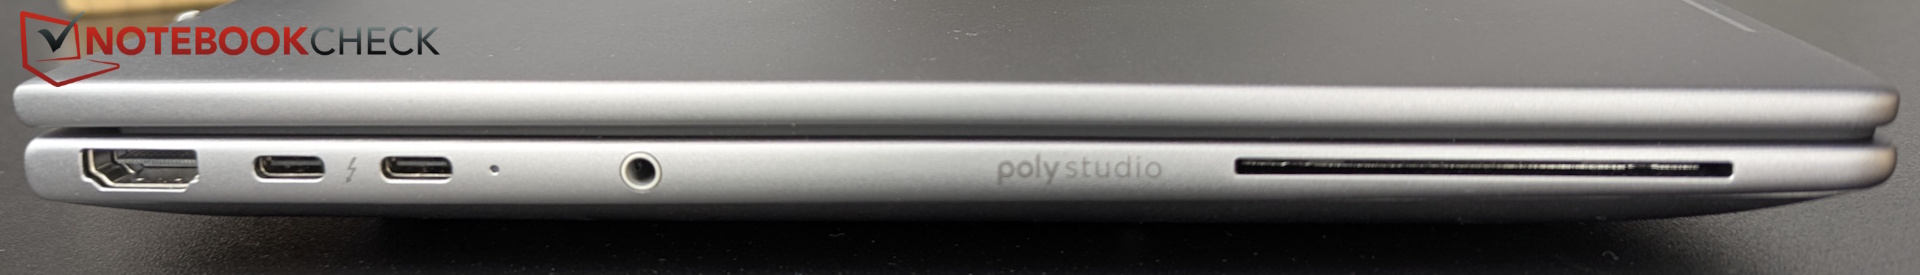
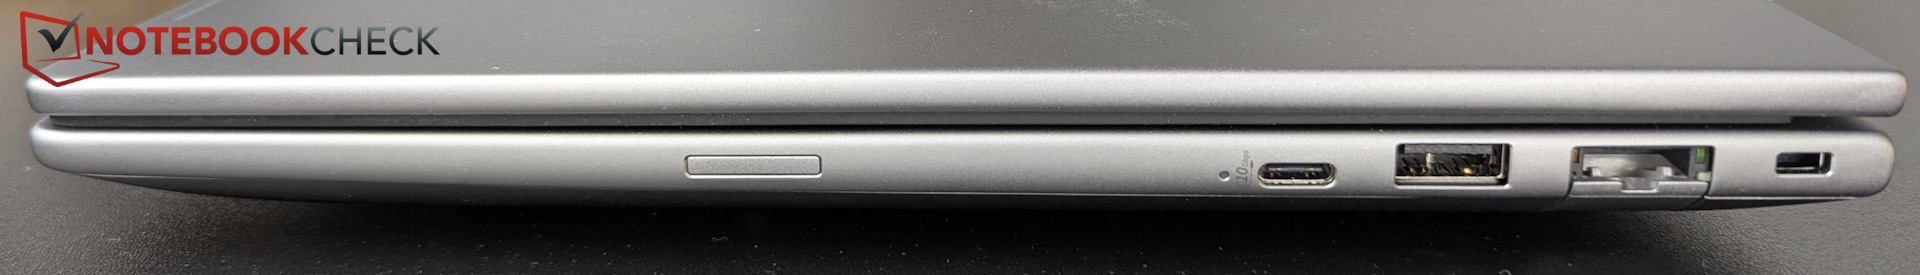
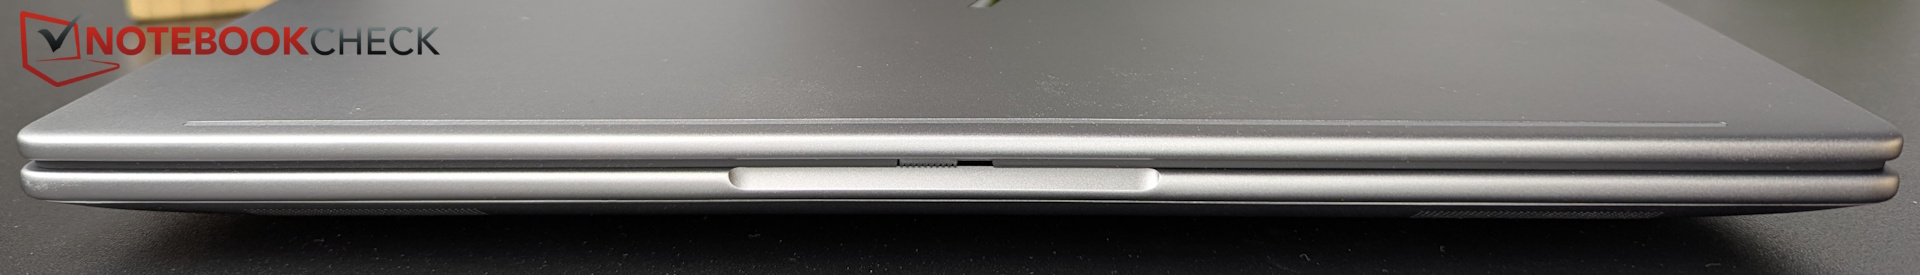
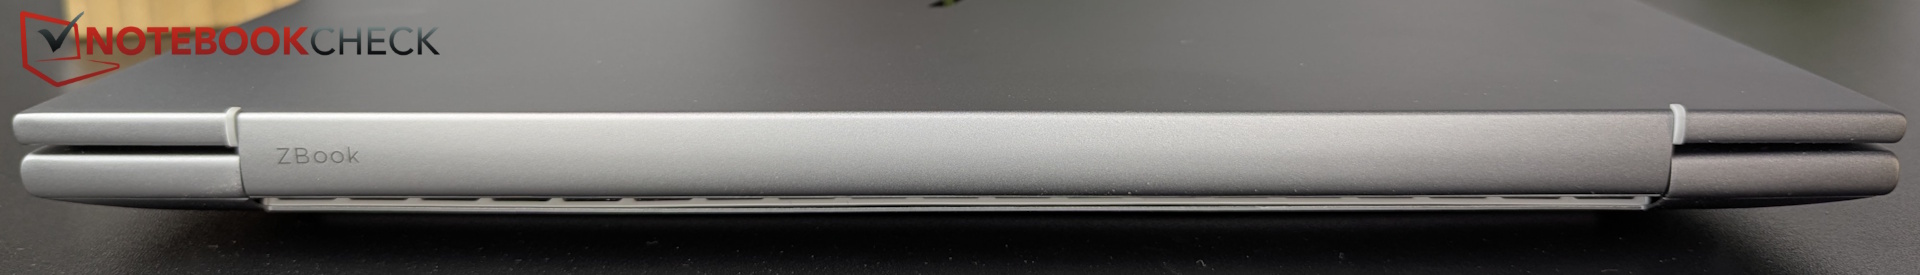
Boîtier et connectivité - métal argenté robuste
Le châssis métallique gris argenté de haute qualité semble solide, avec des charnières qui ne présentent qu'un léger jeu.
Le lecteur de cartes SmartCard est particulièrement remarquable, bien qu'il n'y ait pas de lecteur de cartes SD. Un emplacement pour carte SIM est disponible en option.
Webcam


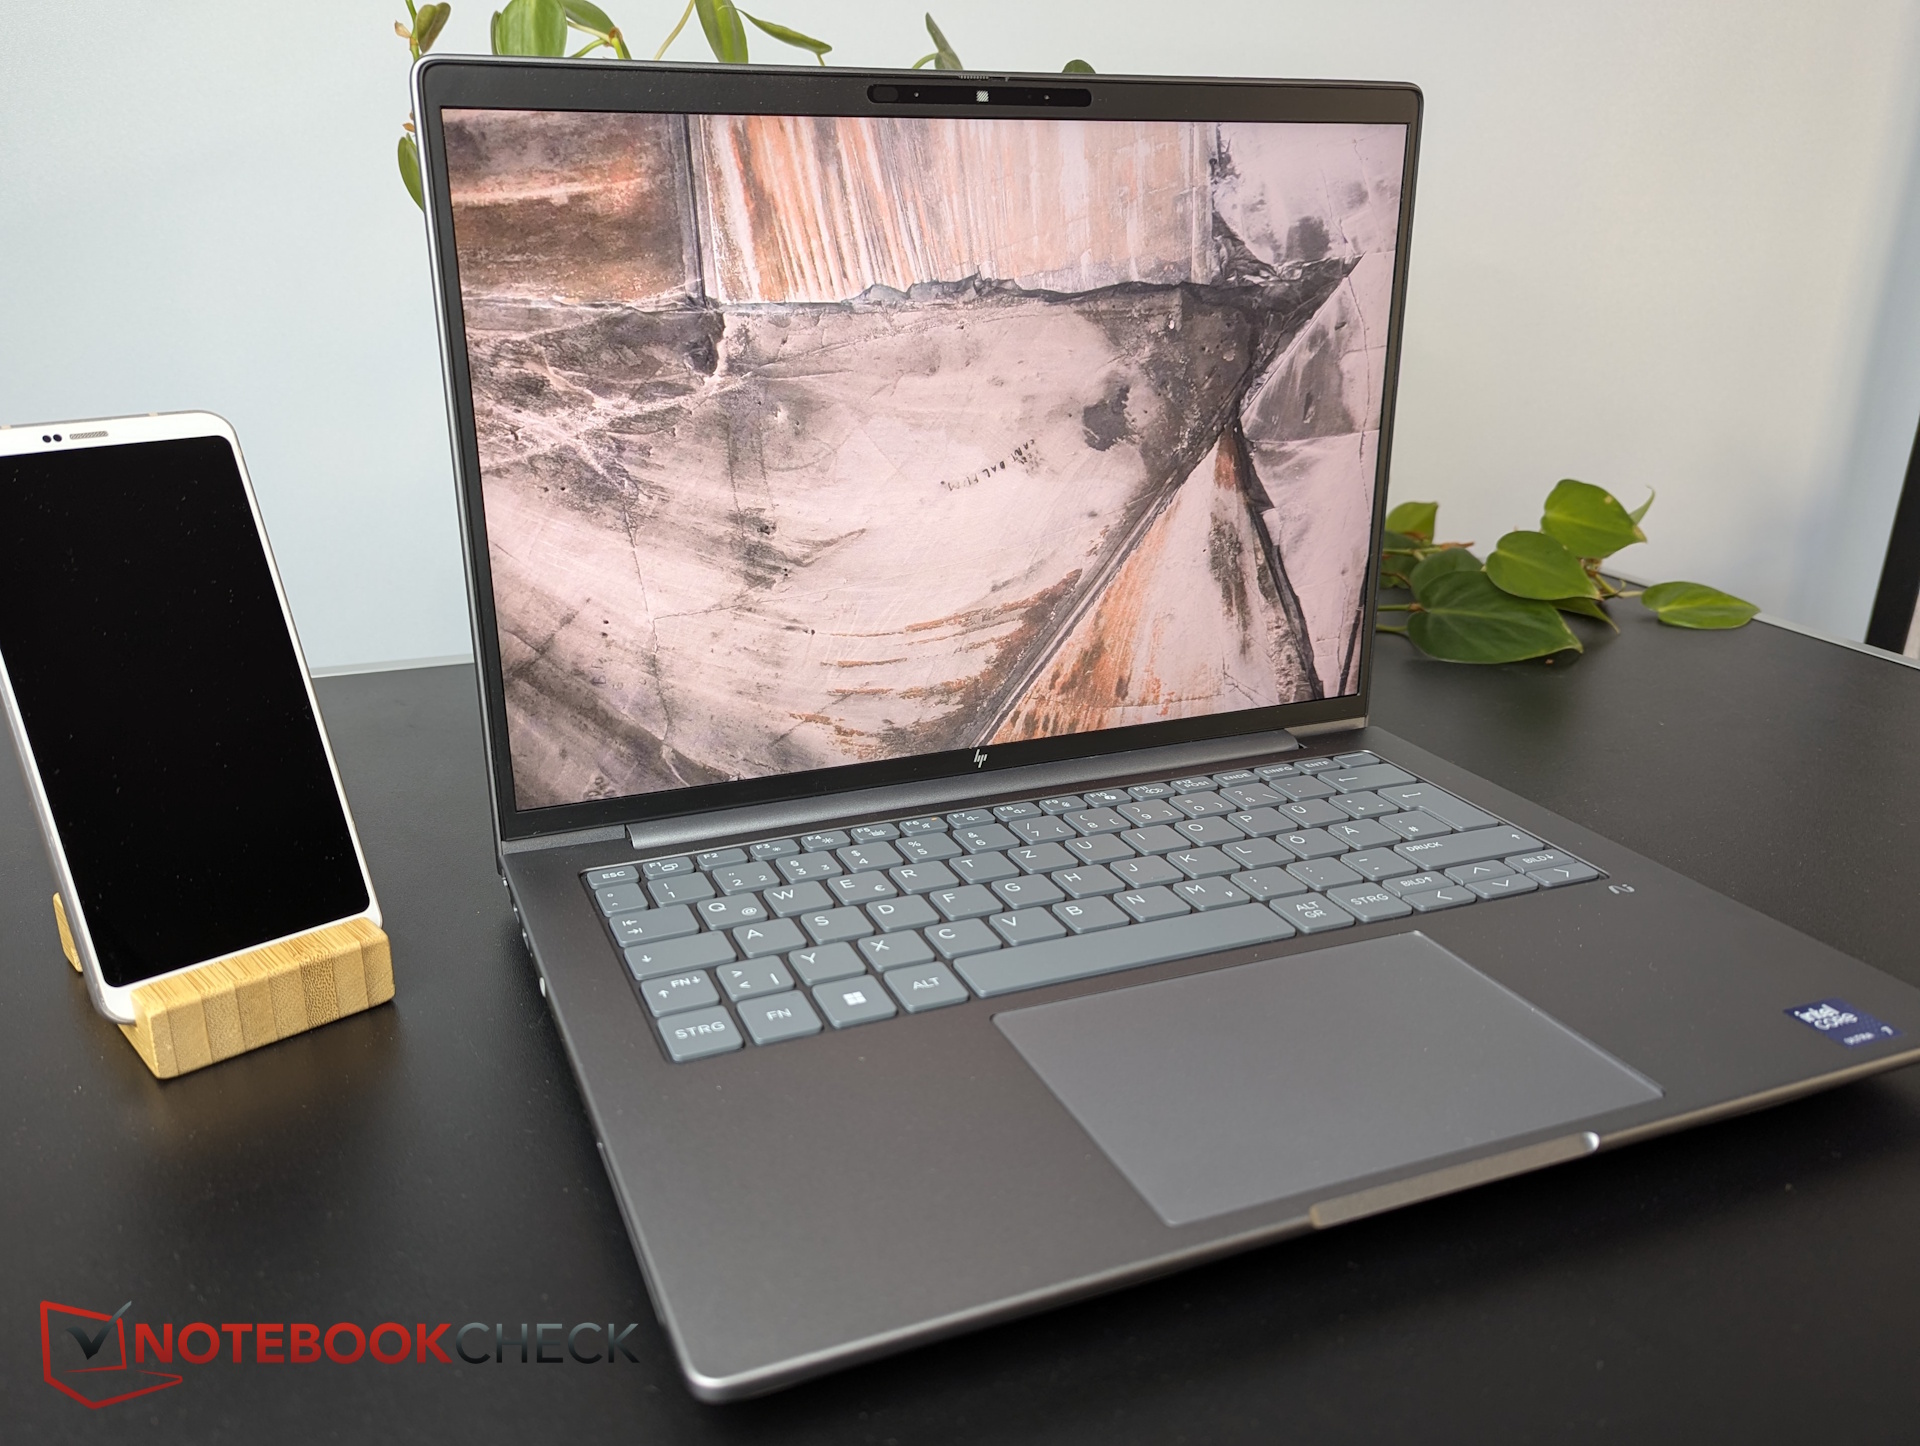
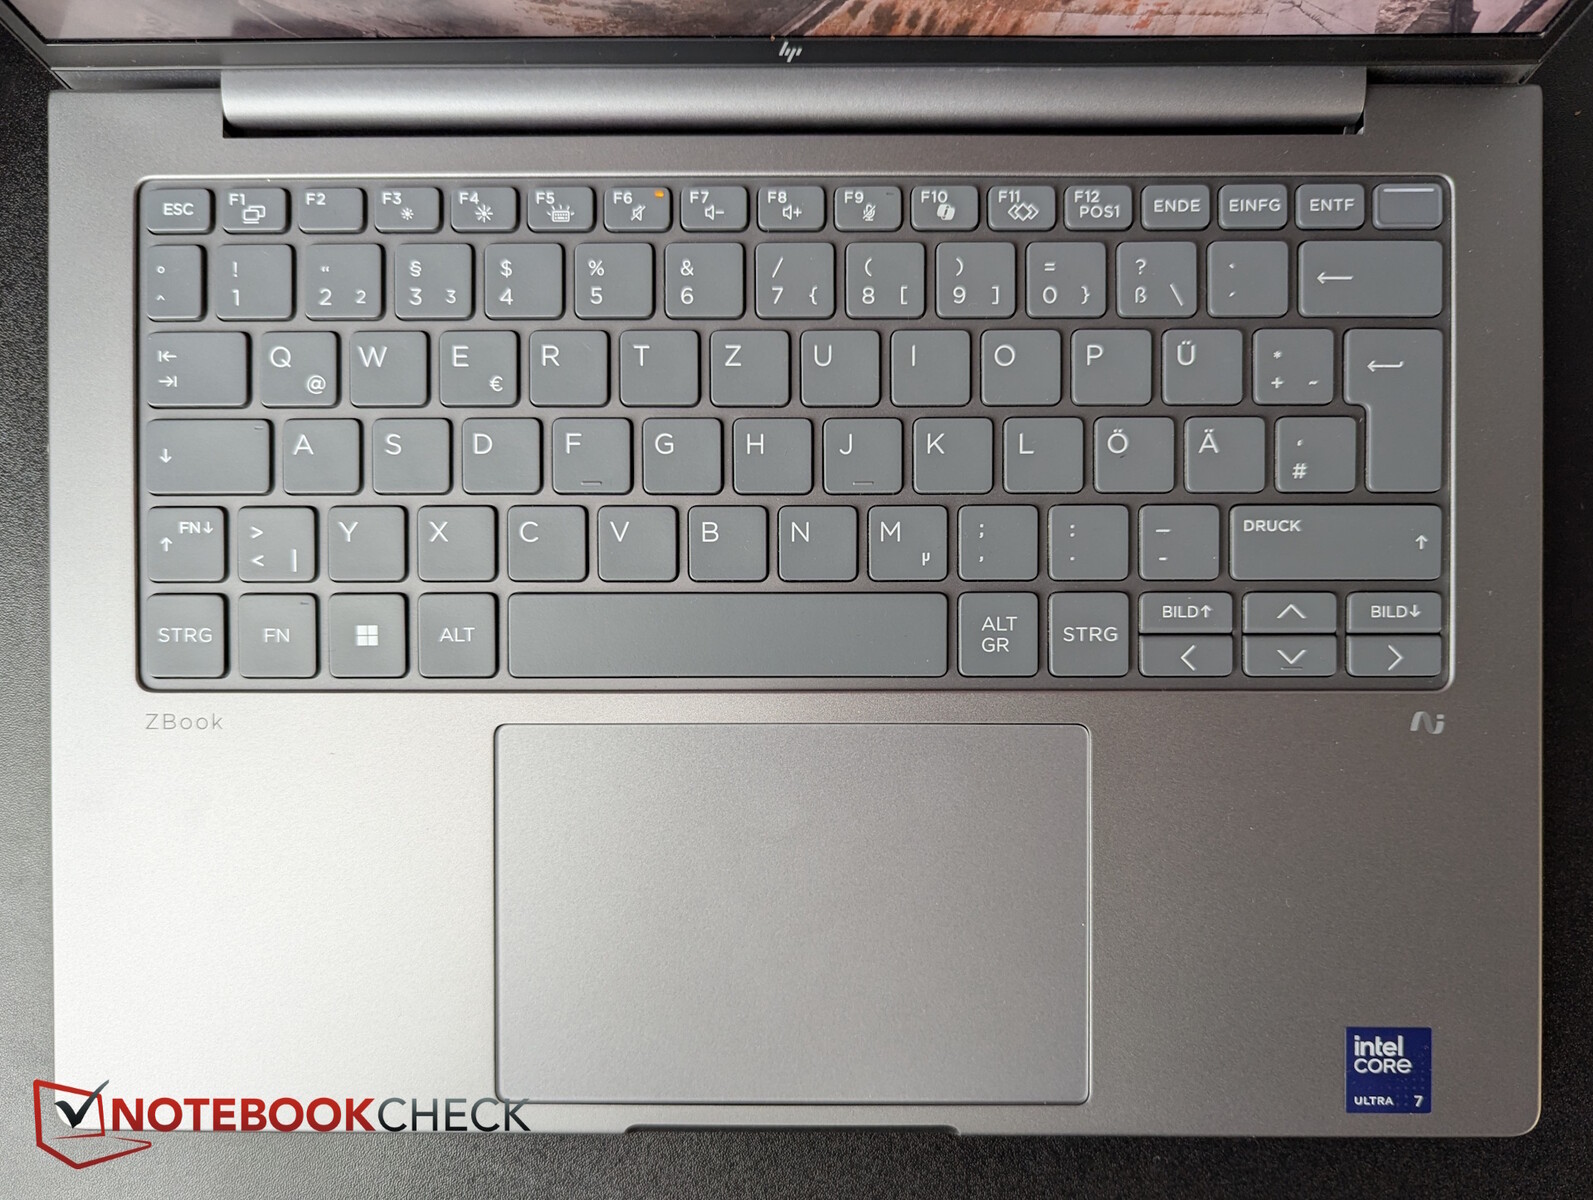
Périphériques d'entrée - HP ZBook avec clavier silencieux
Les touches grises du clavier HP Premium Quiet sont bien amorties et très silencieuses. Malgré la course courte à moyenne des touches, le retour d'information est excellent, bien que les touches fléchées soient à mi-hauteur.
Le pavé tactile mesure environ 12,5 × 8 cm et offre d'excellentes caractéristiques de glissement, une réponse d'entrée précise et des boutons de clics fiables et silencieux avec un retour d'information clair.
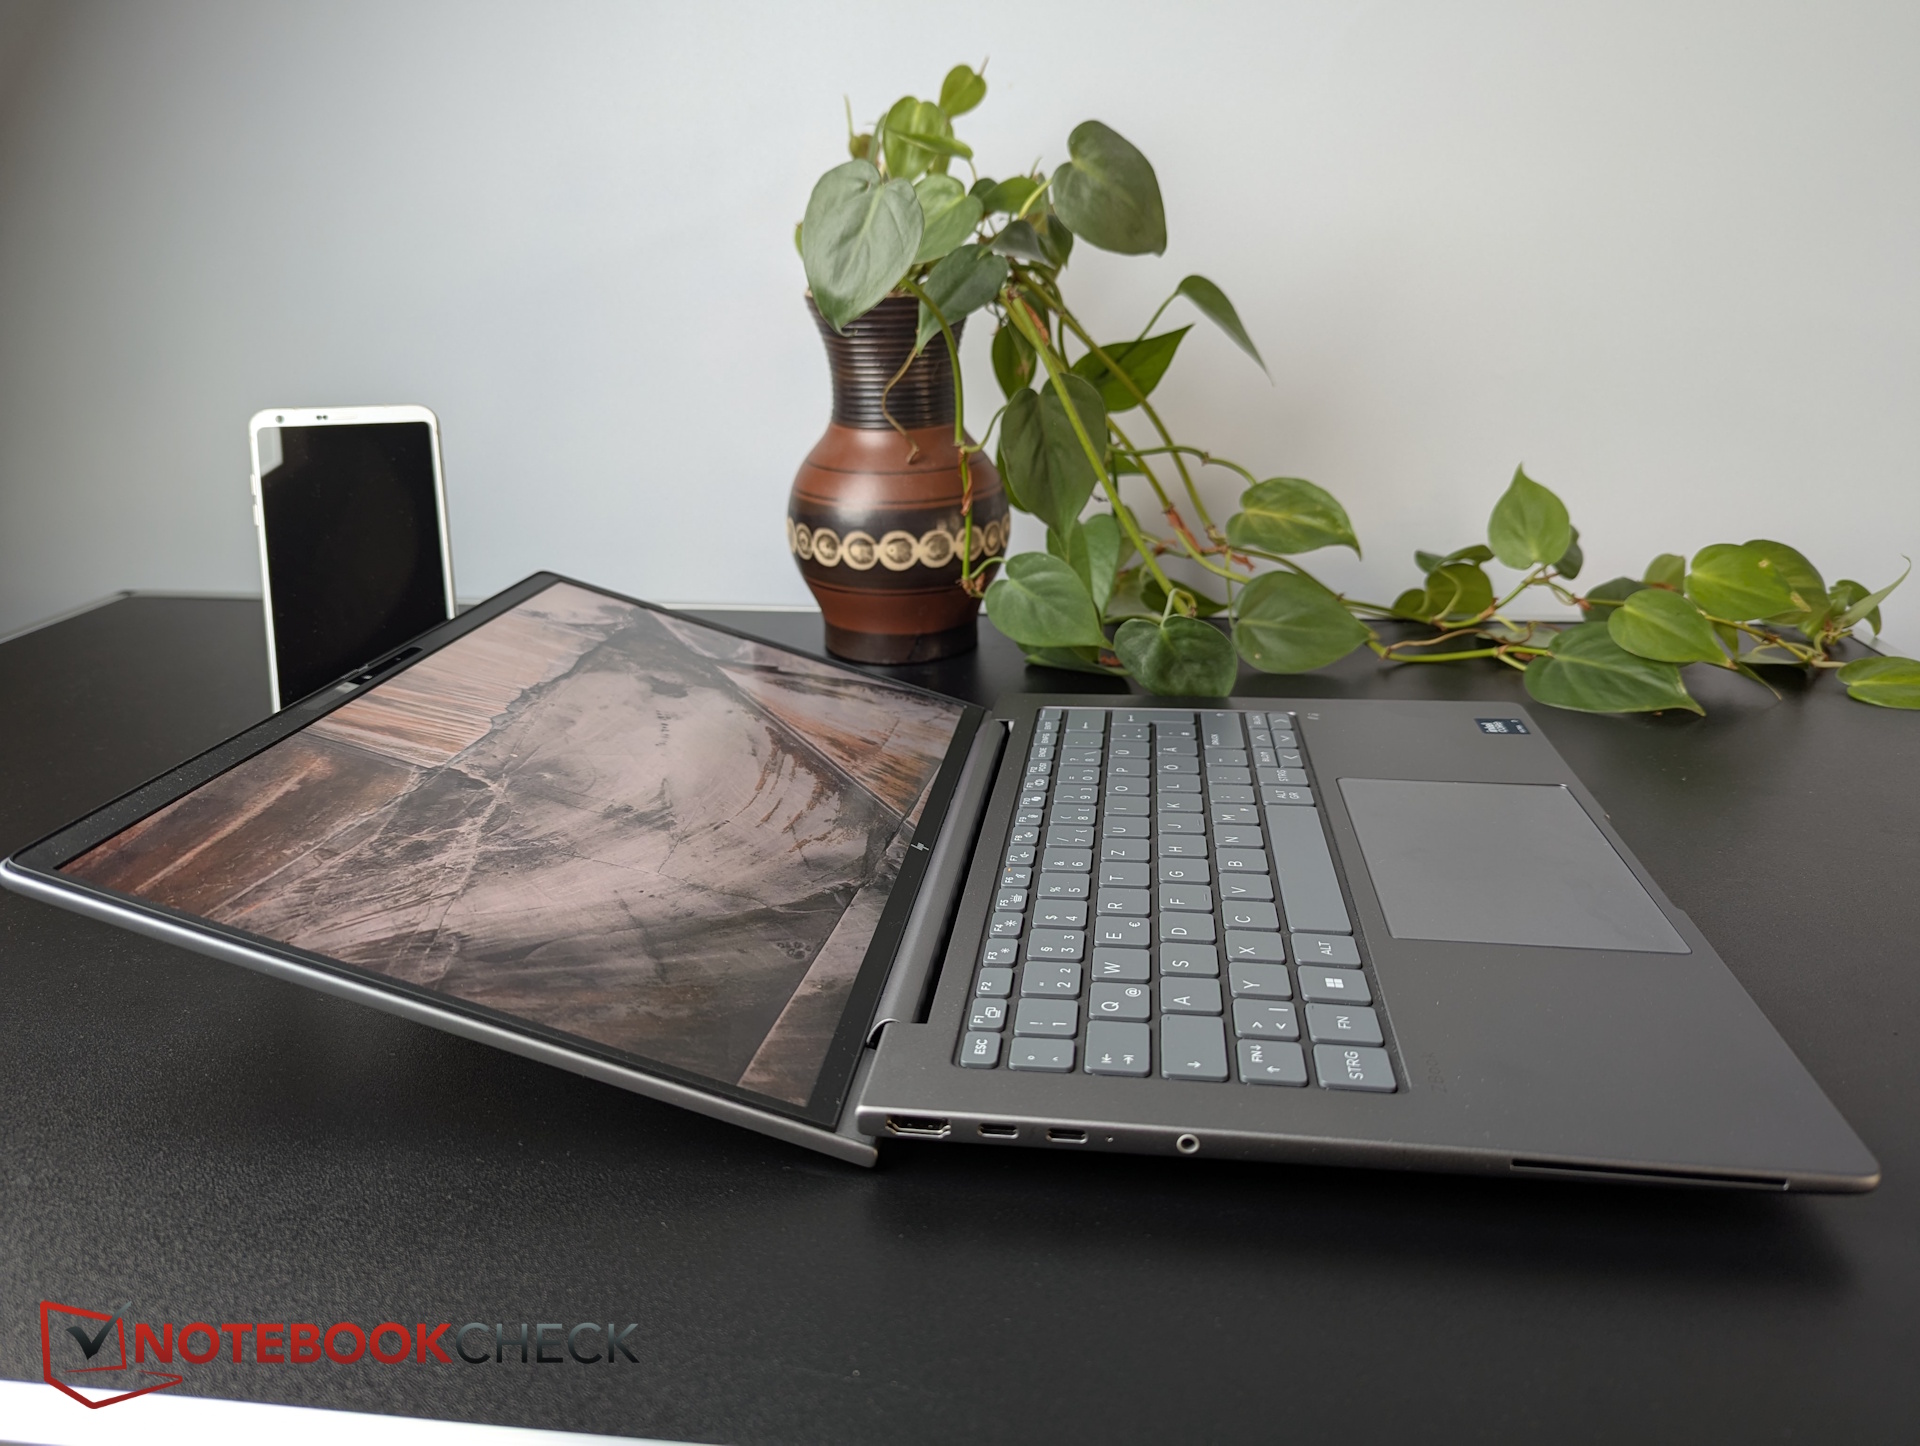
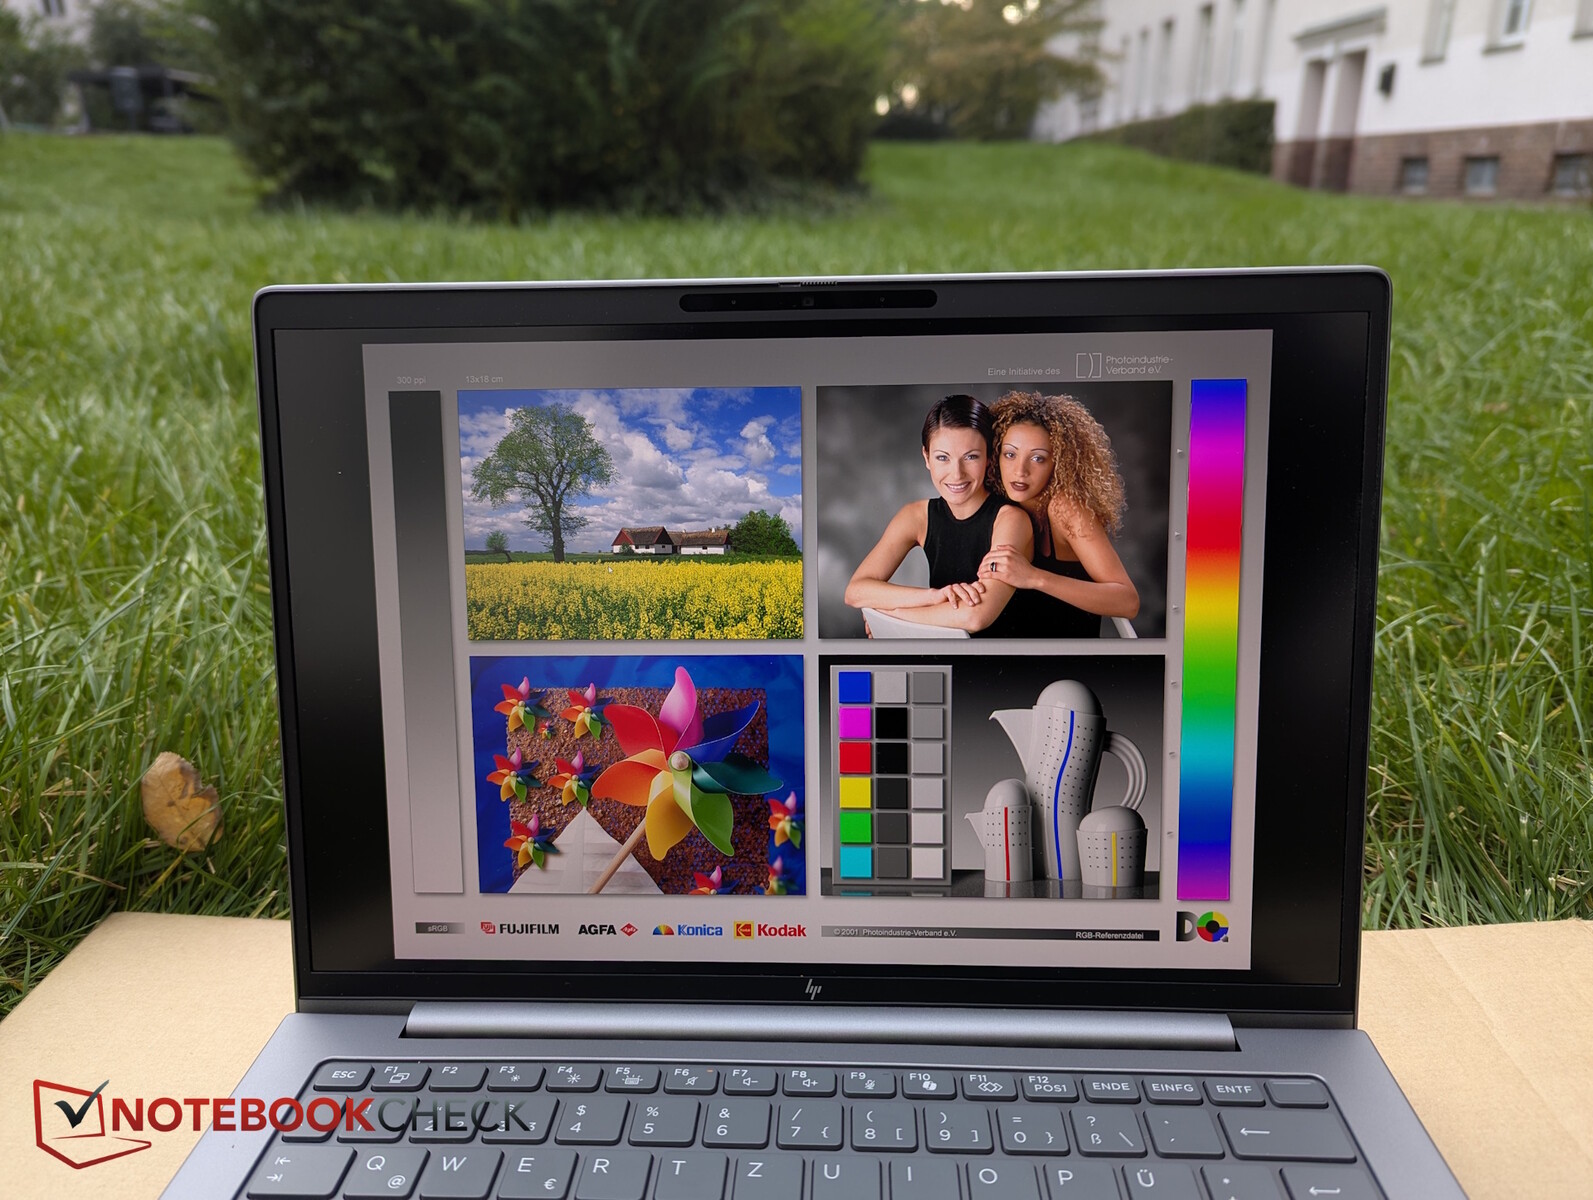
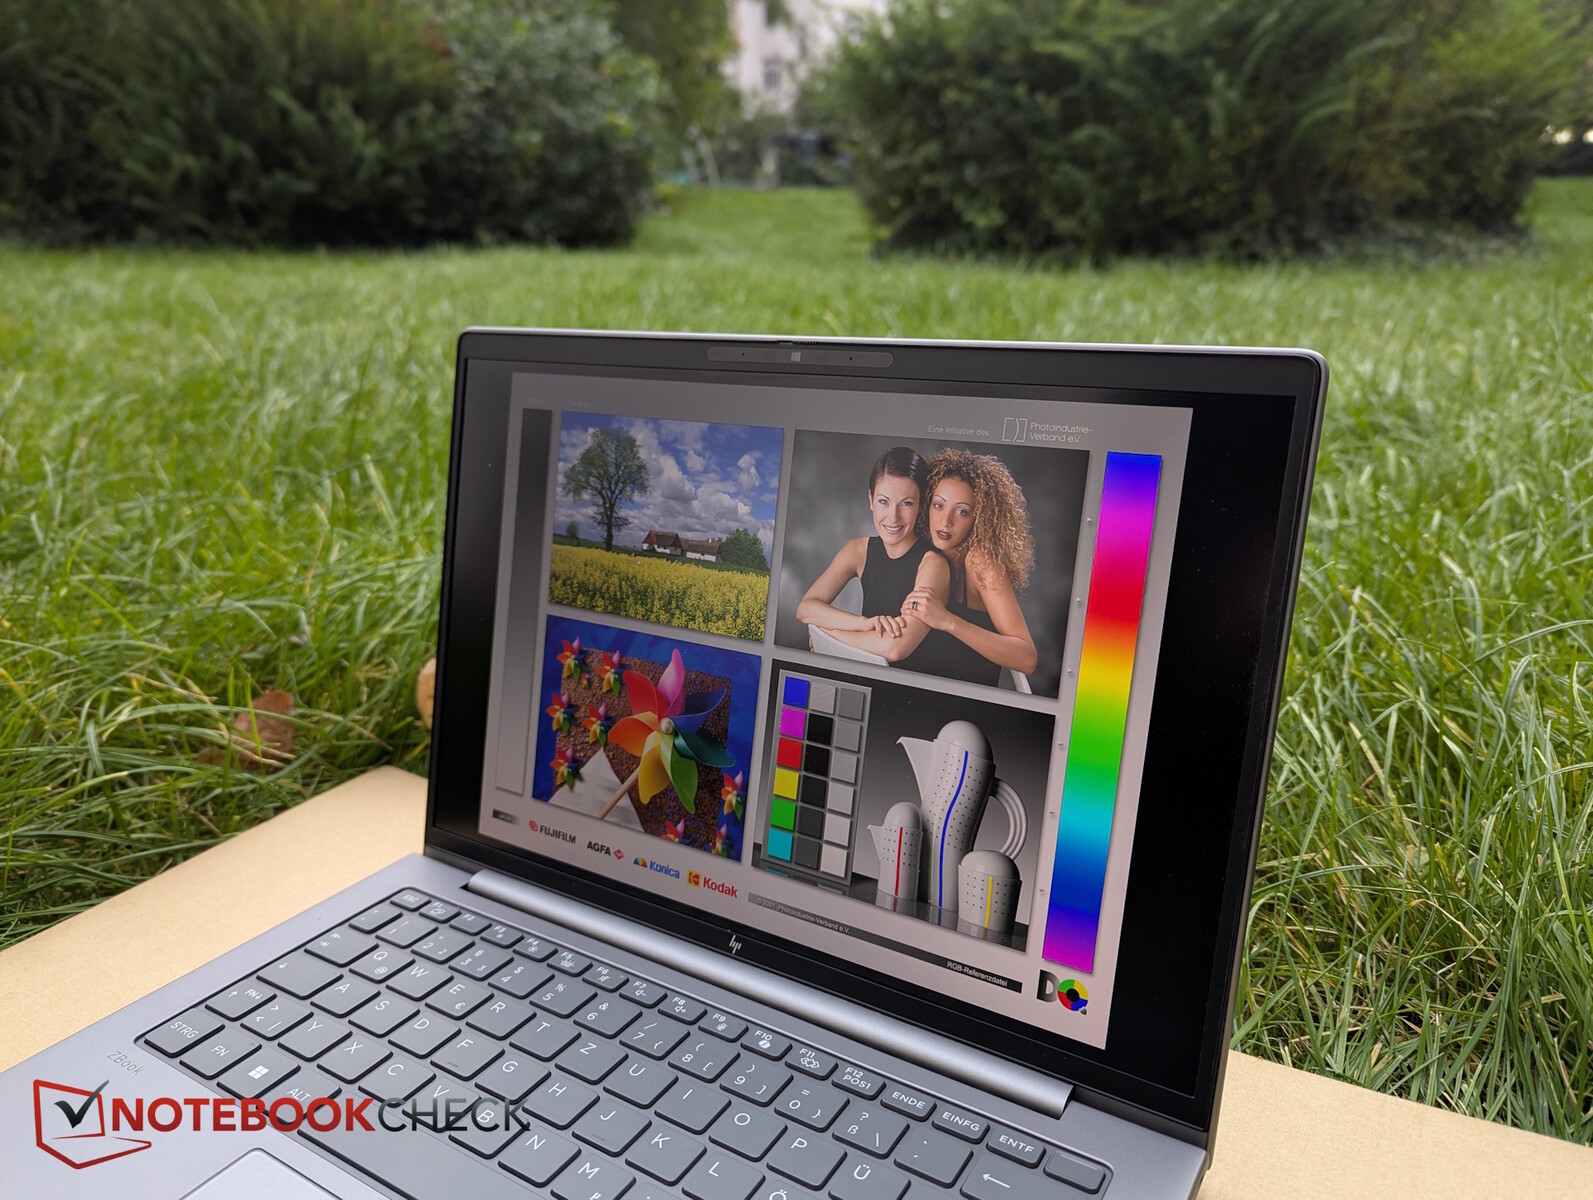
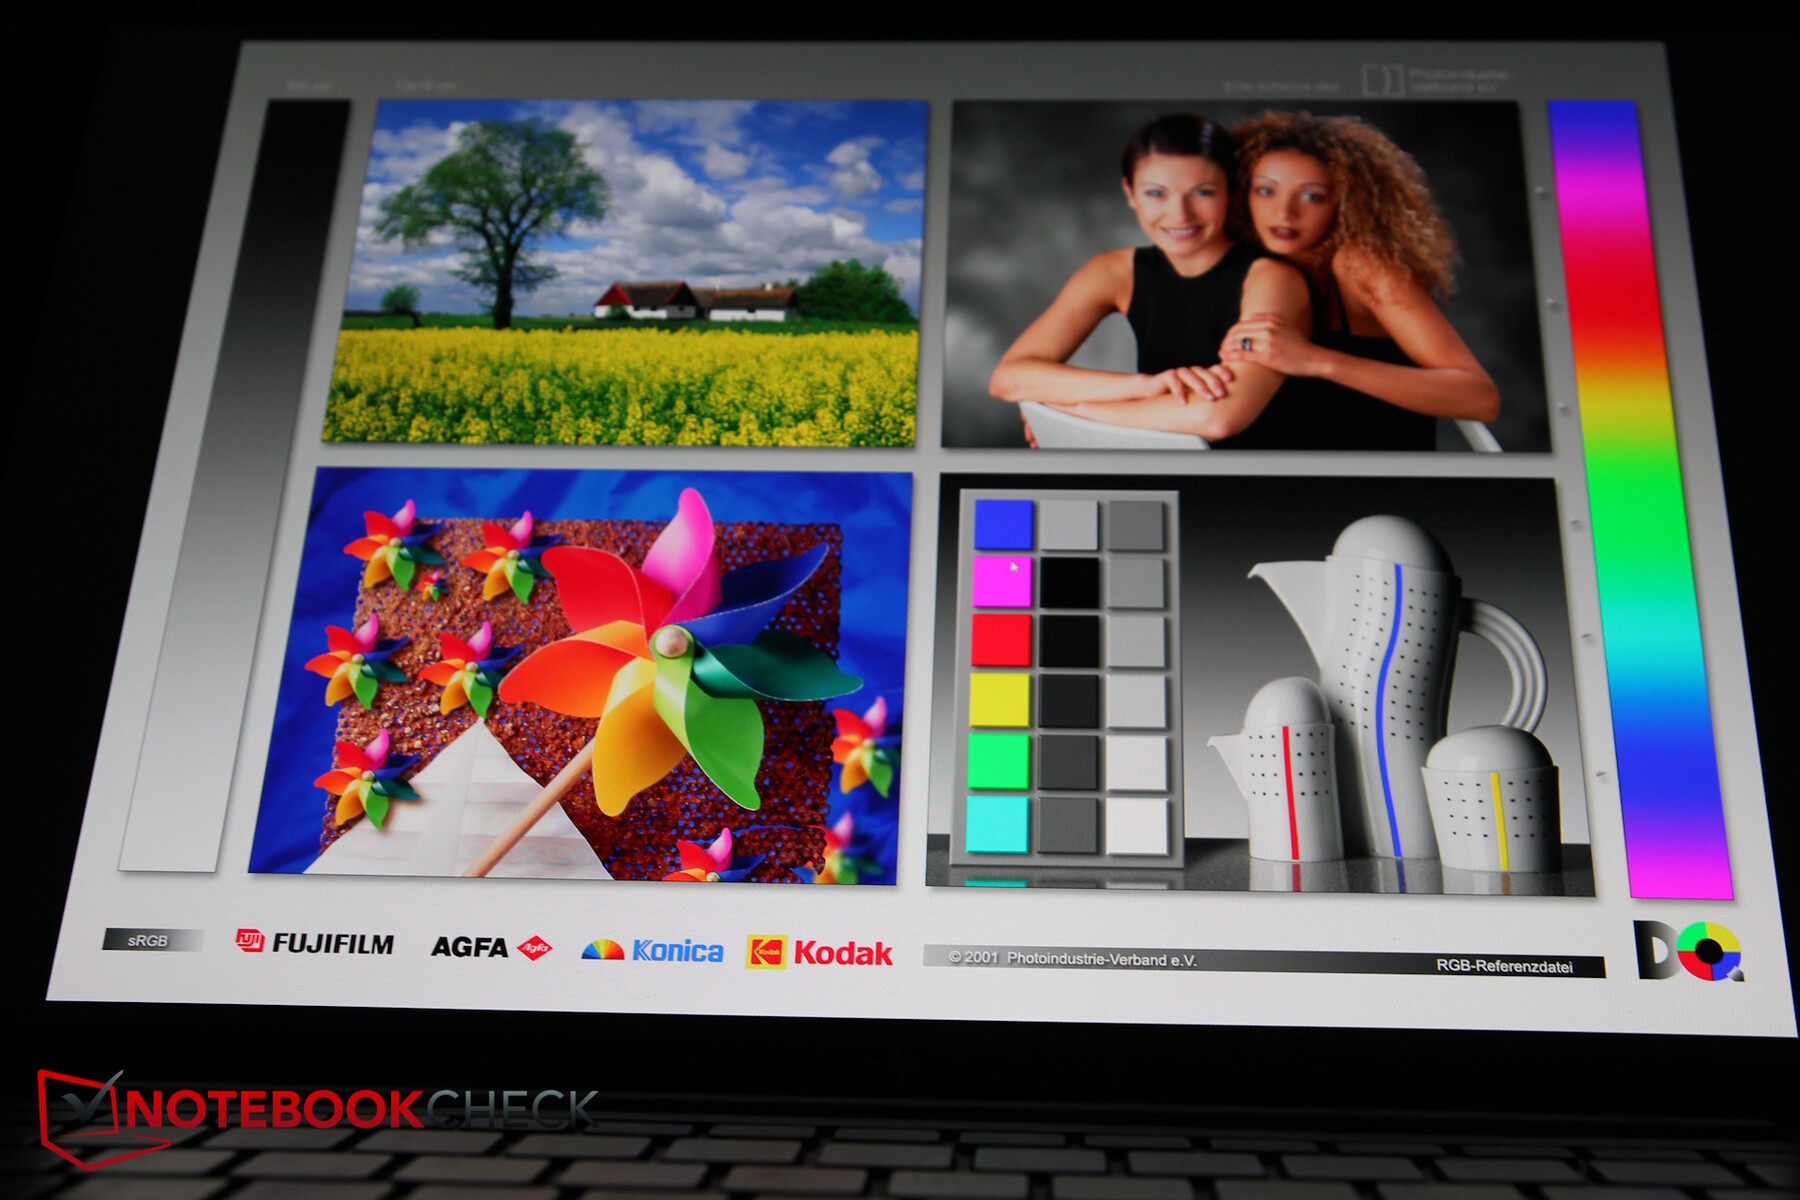
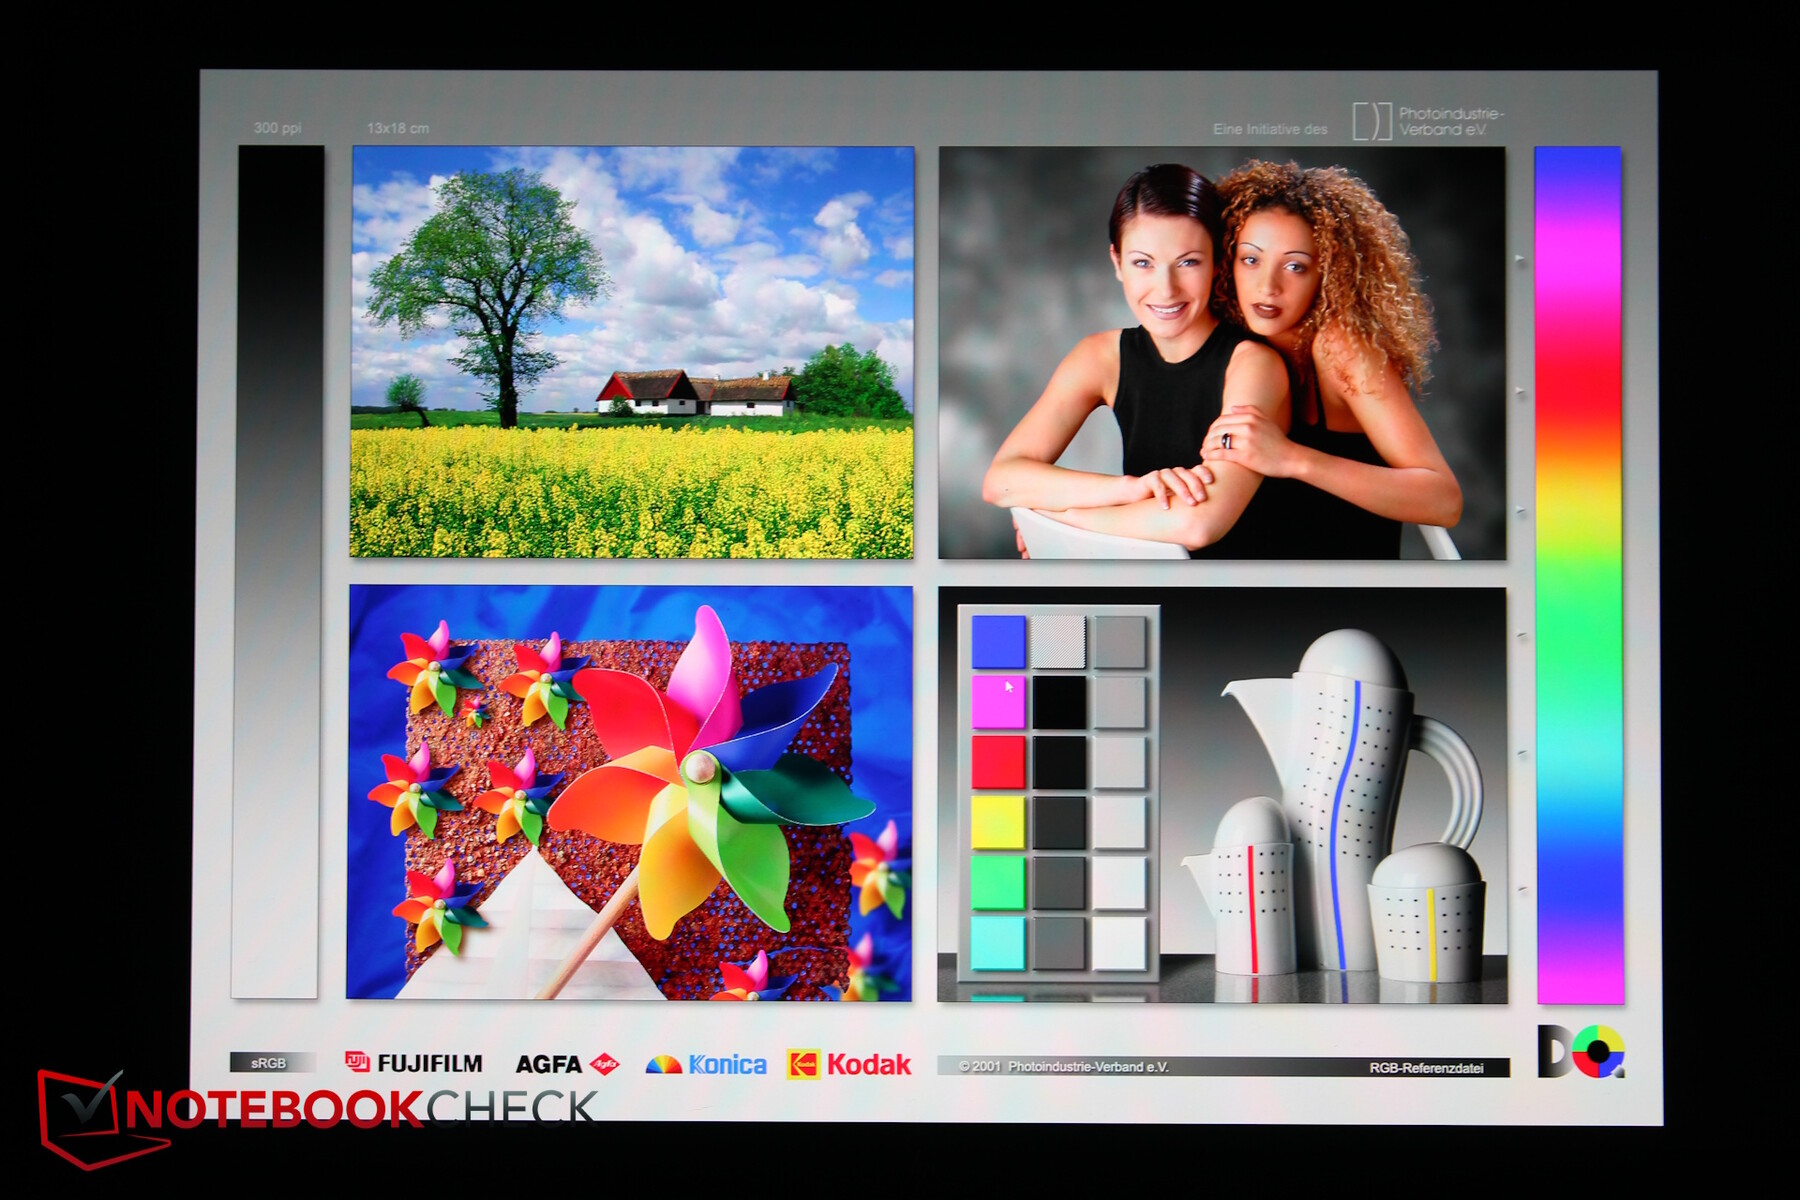
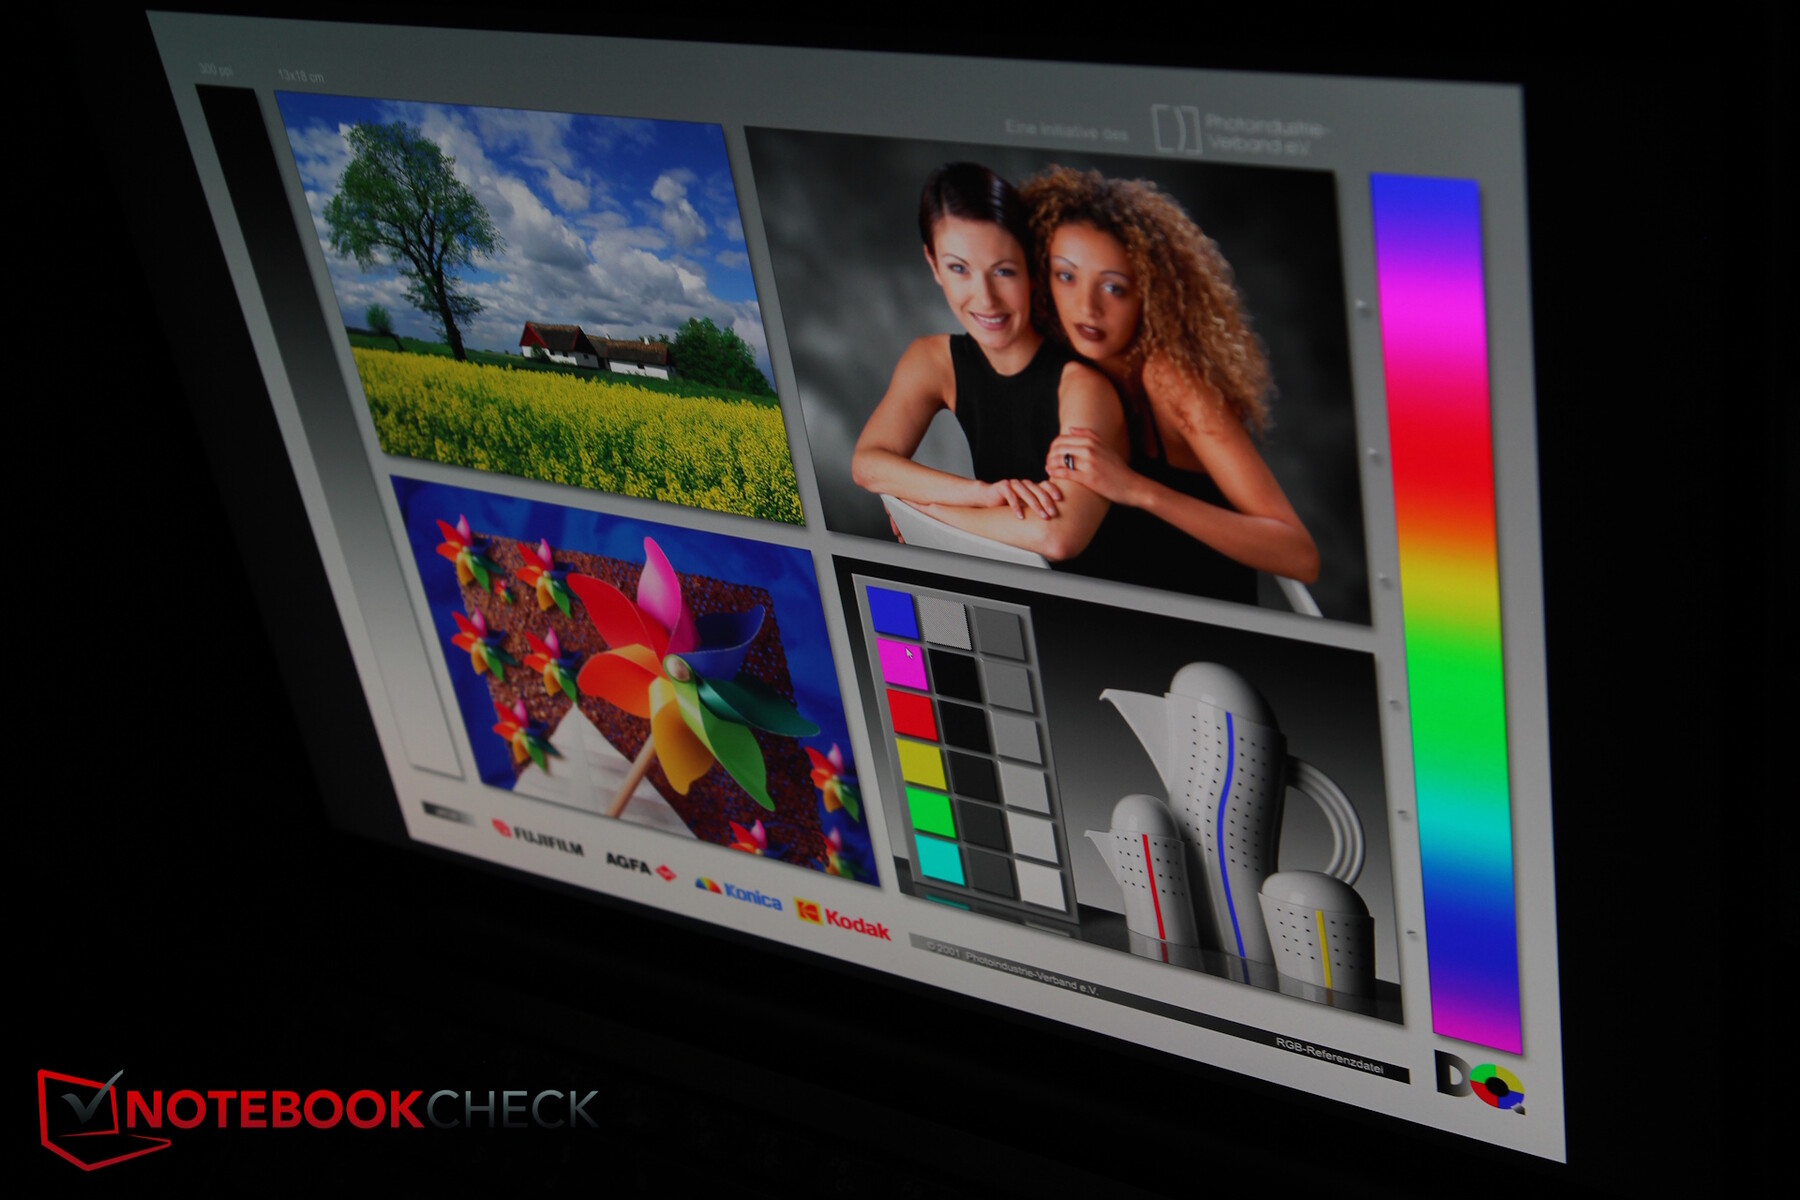
Affichage - ZBook 8 G1i 14 avec 14 options
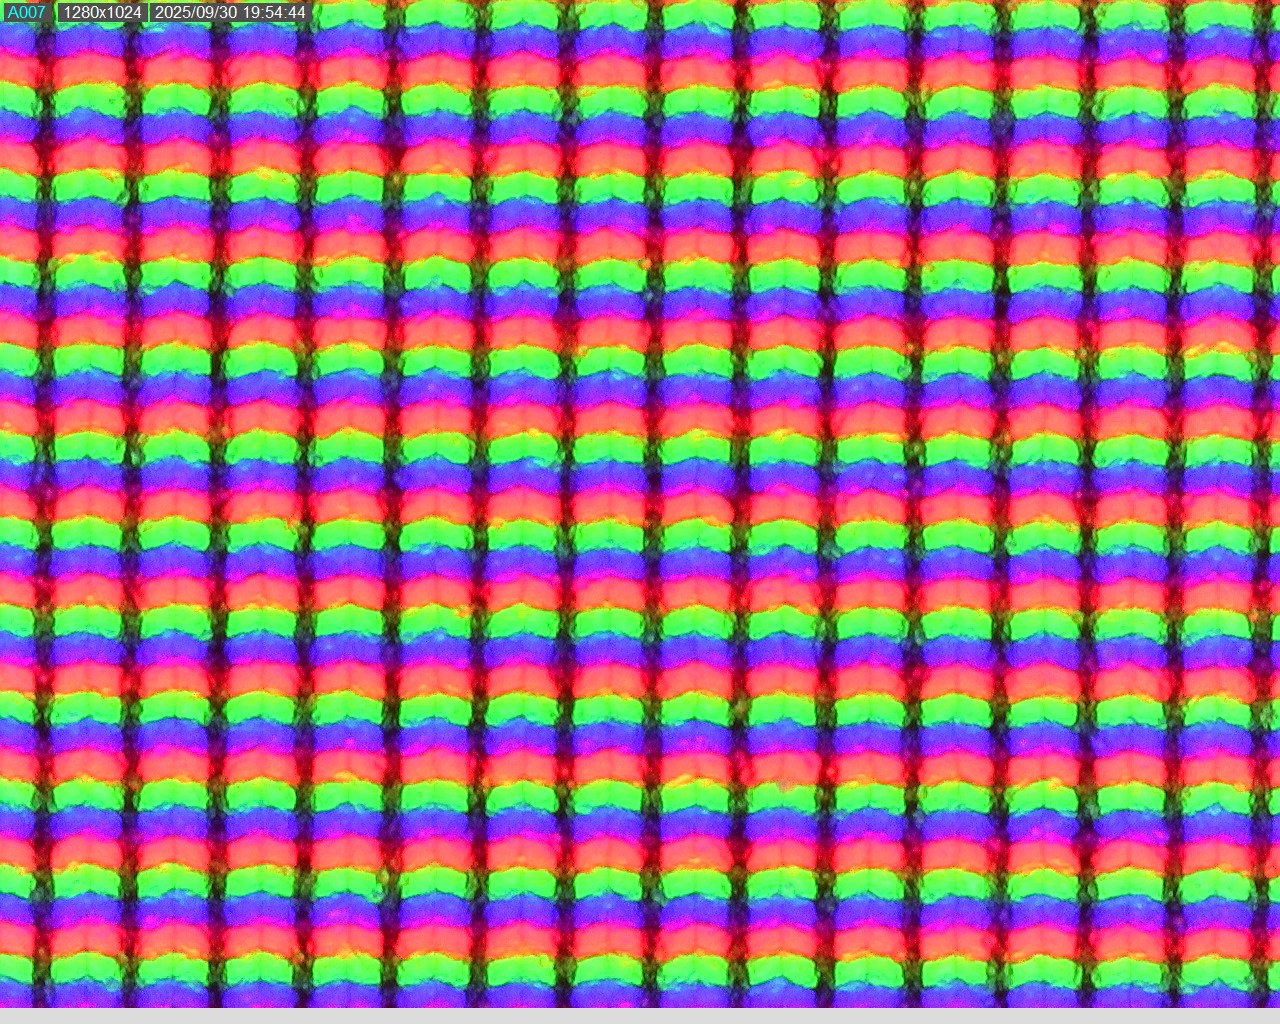
Nous avons dénombré pas moins de 14 options d'affichage, allant de panneaux 1200p avec ou sans tactile (300 à 800 nits) à notre version 1600p avec 120 Hz, 500 nits, et sans support tactile.
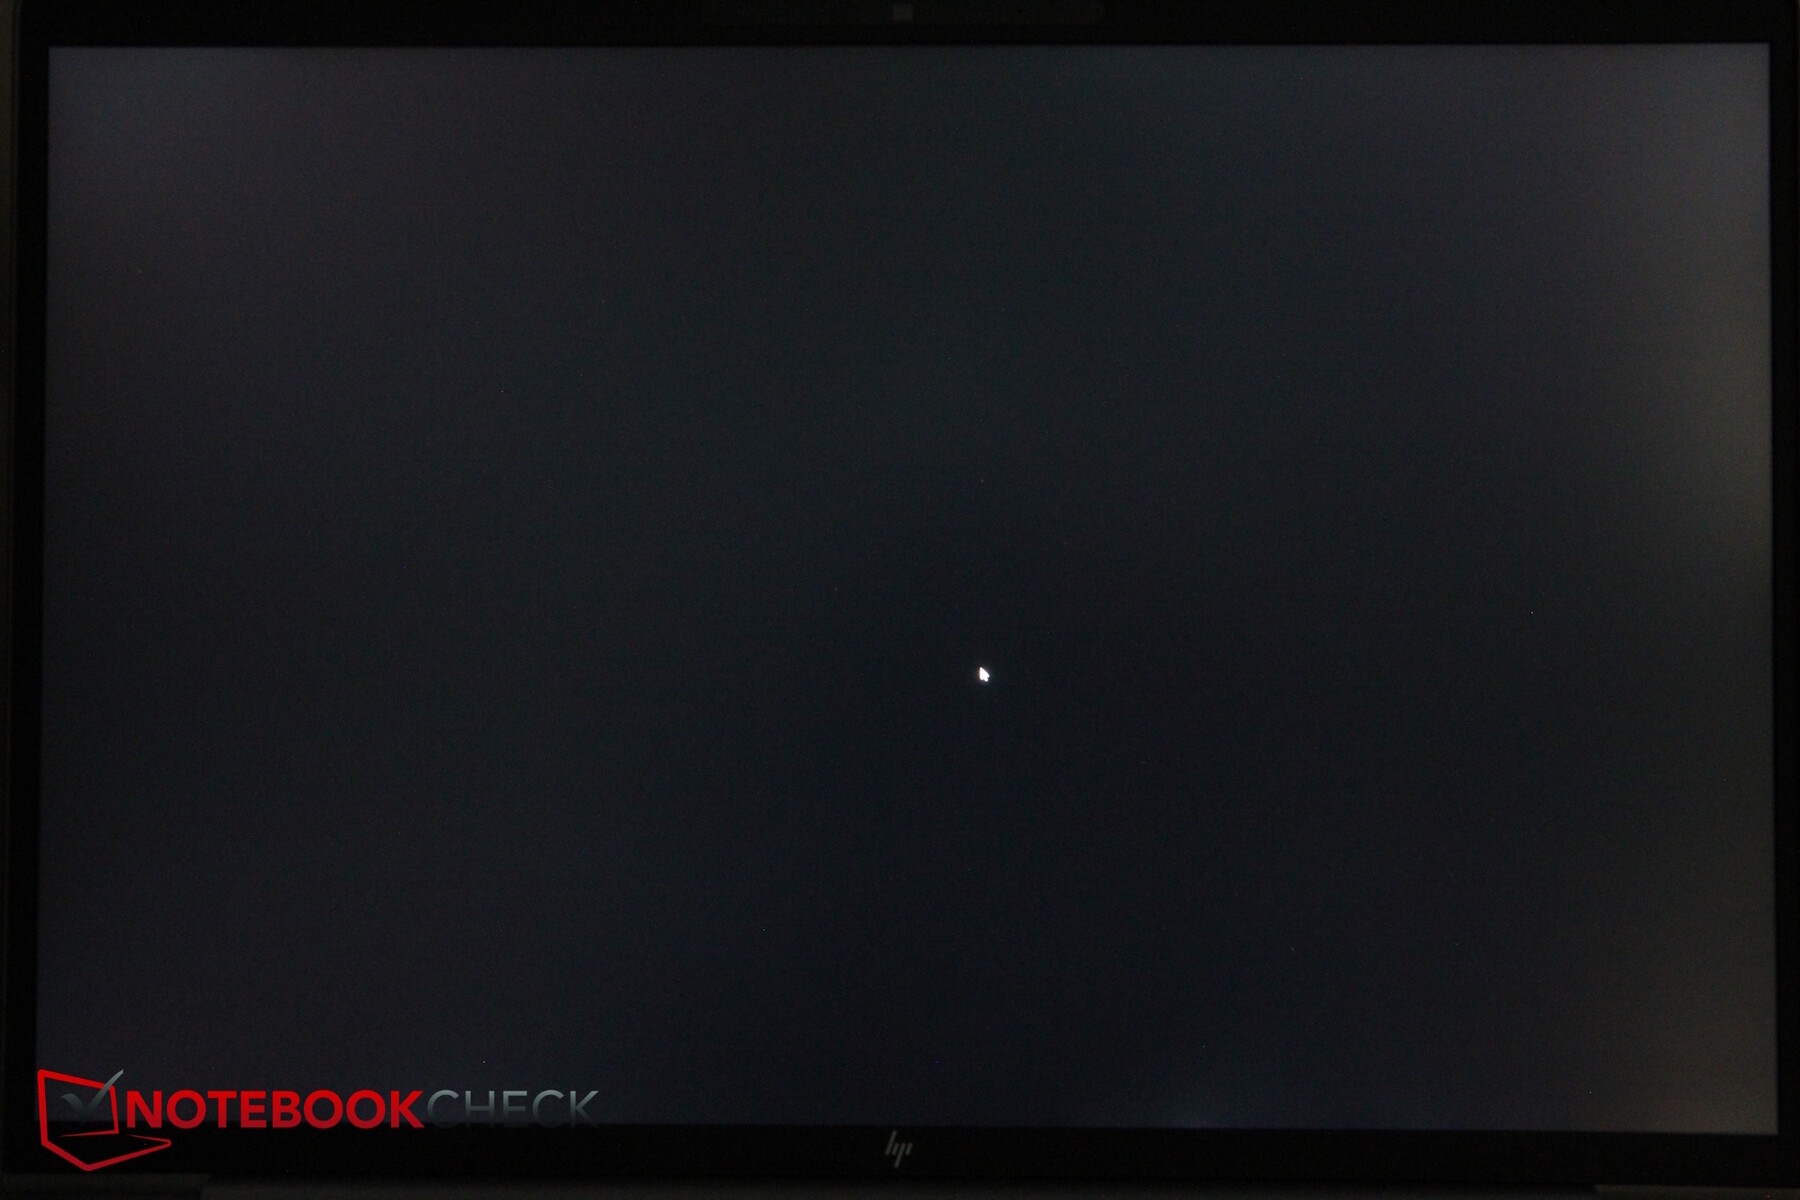
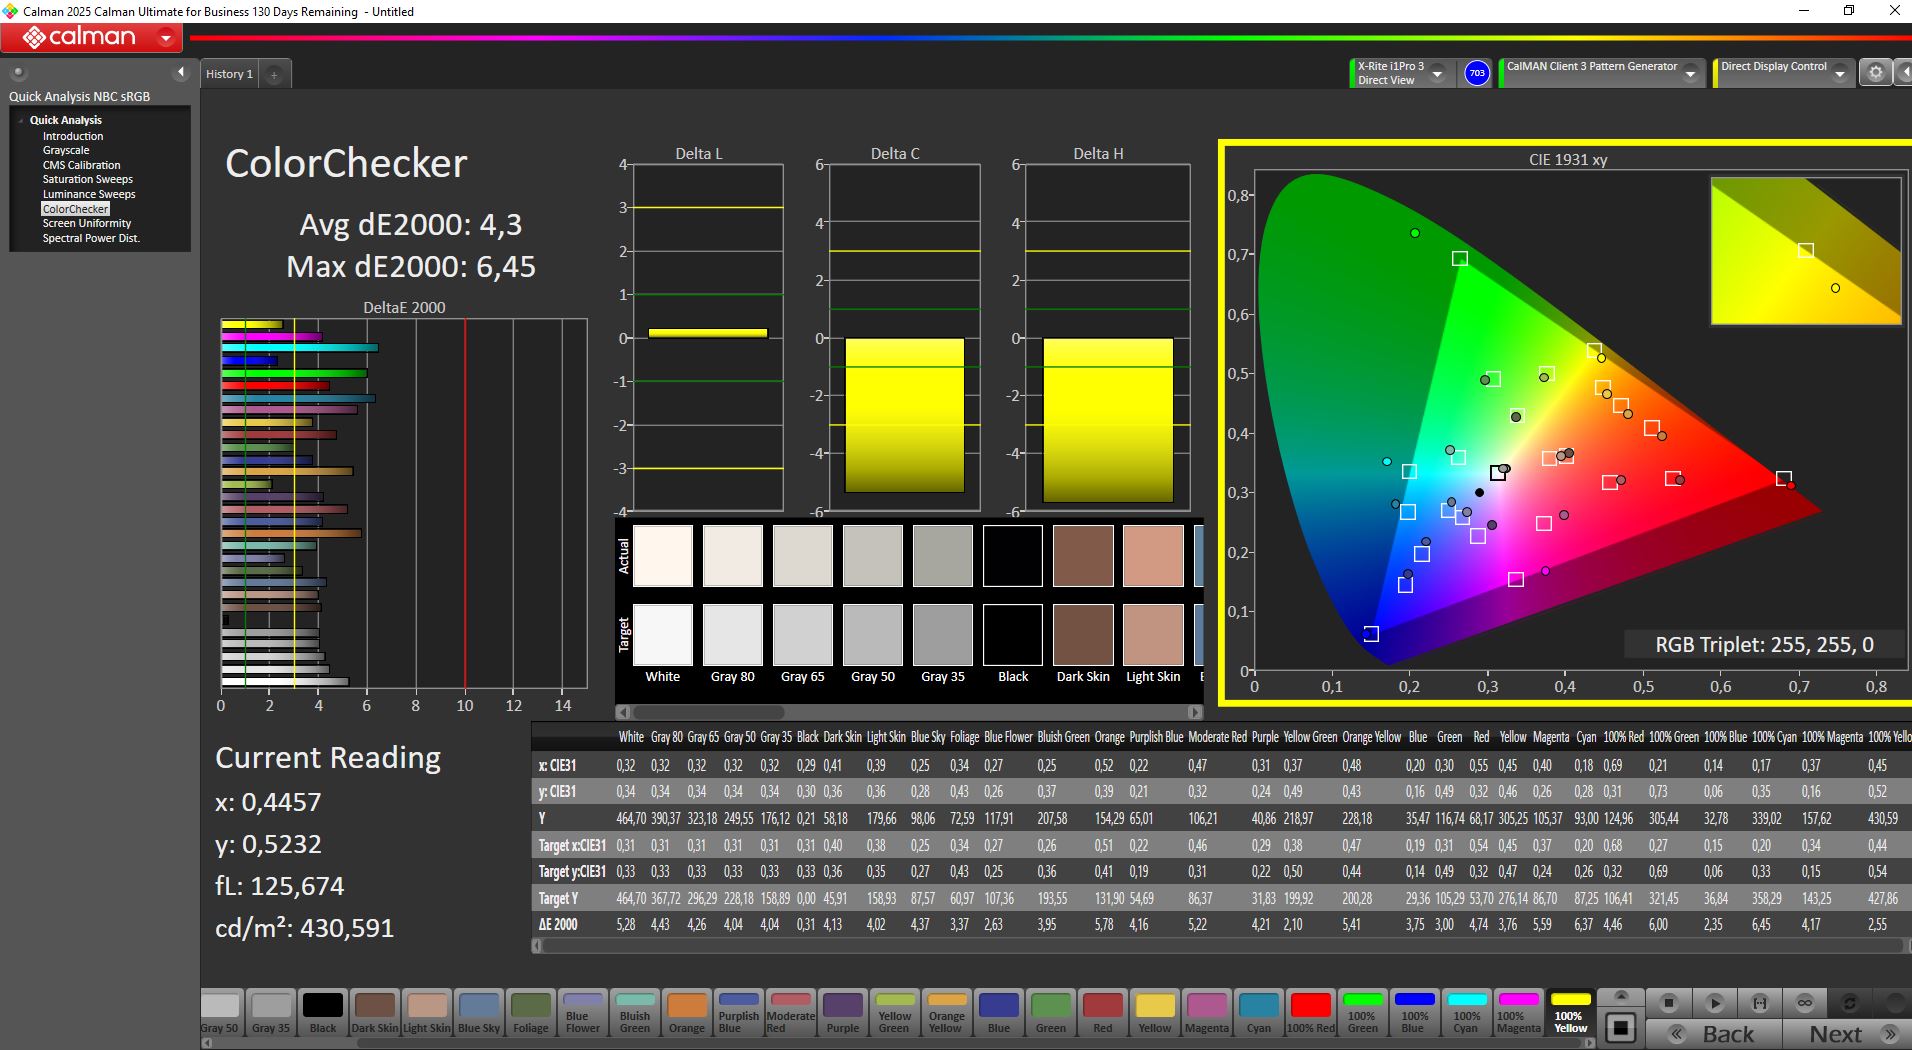
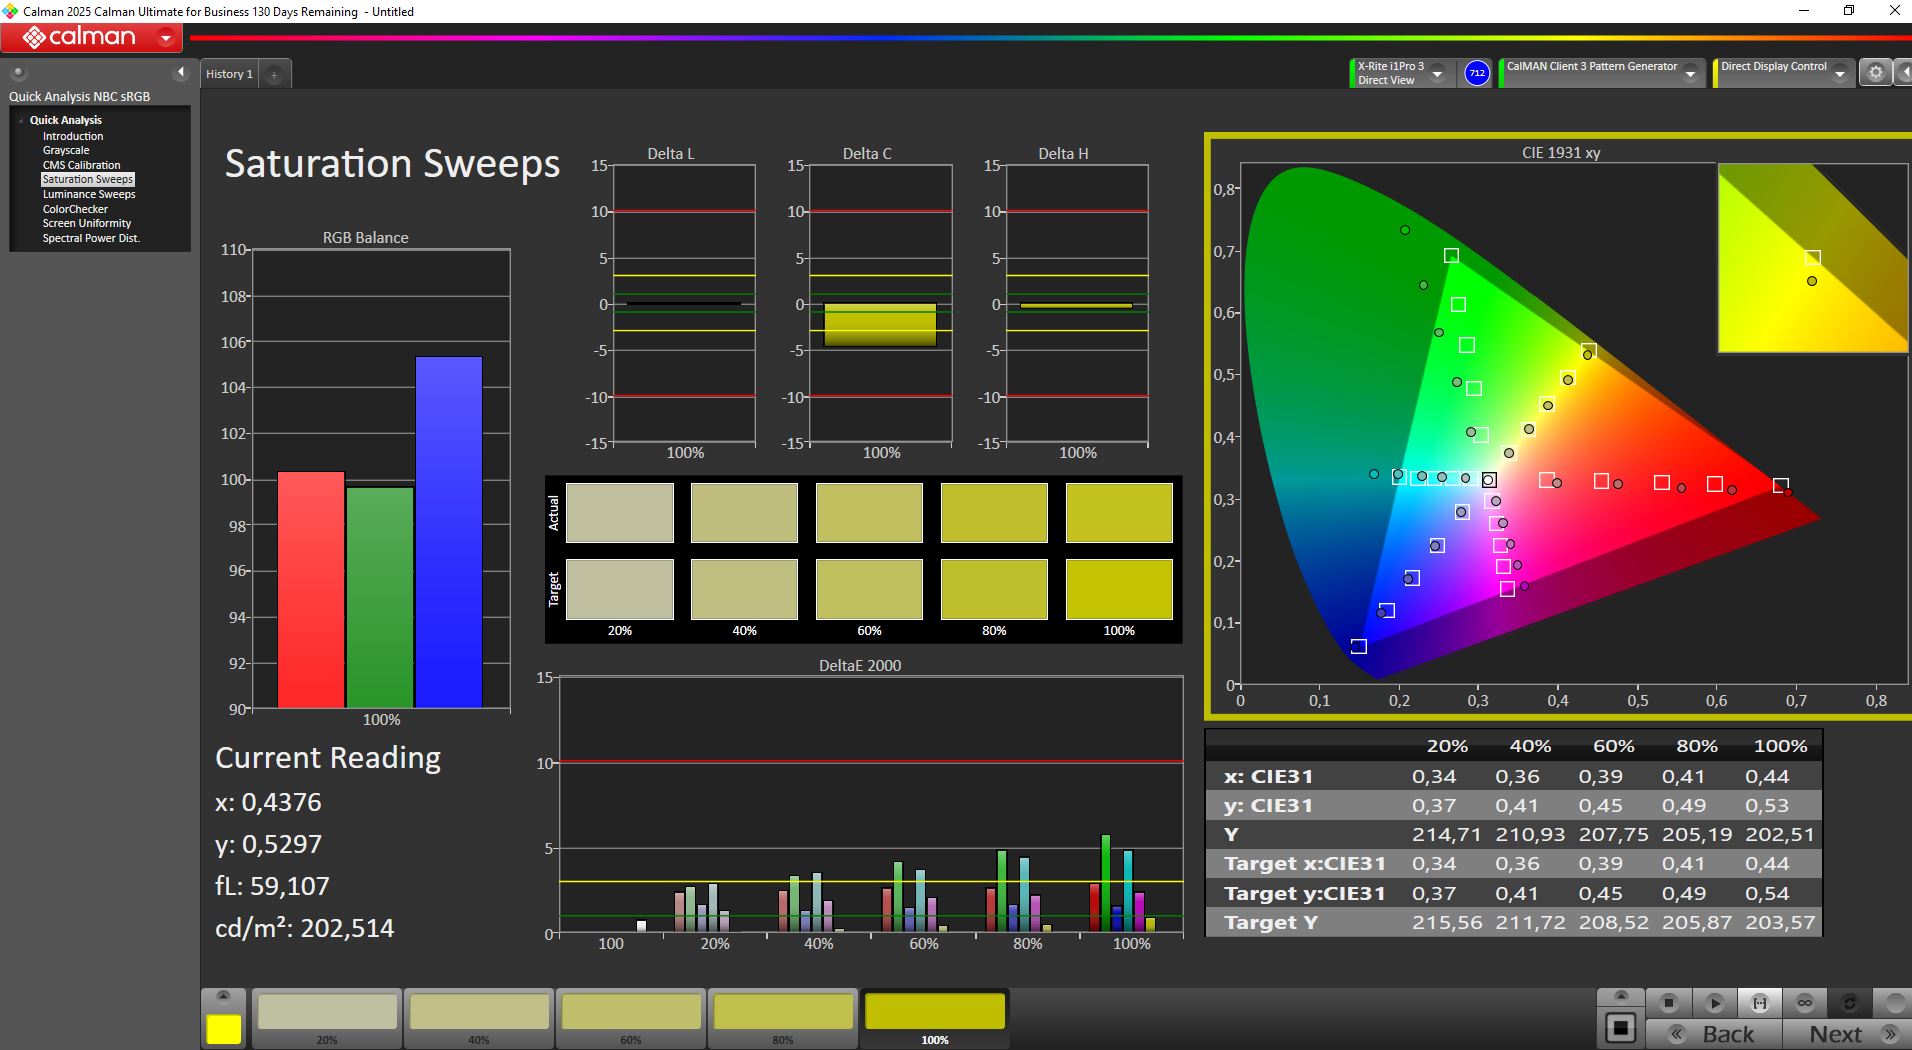
Notre appareil n'atteignait "que" 429 nits, mais le niveau de noir et le contraste sont impressionnants, et l'écran couvre presque entièrement les espaces colorimétriques sRGB, DisplayP3 et AdobeRGB.
En dessous de 75 % de luminosité, le PWM est utilisé à une fréquence de 25 kHz.
| |||||||||||||||||||||||||
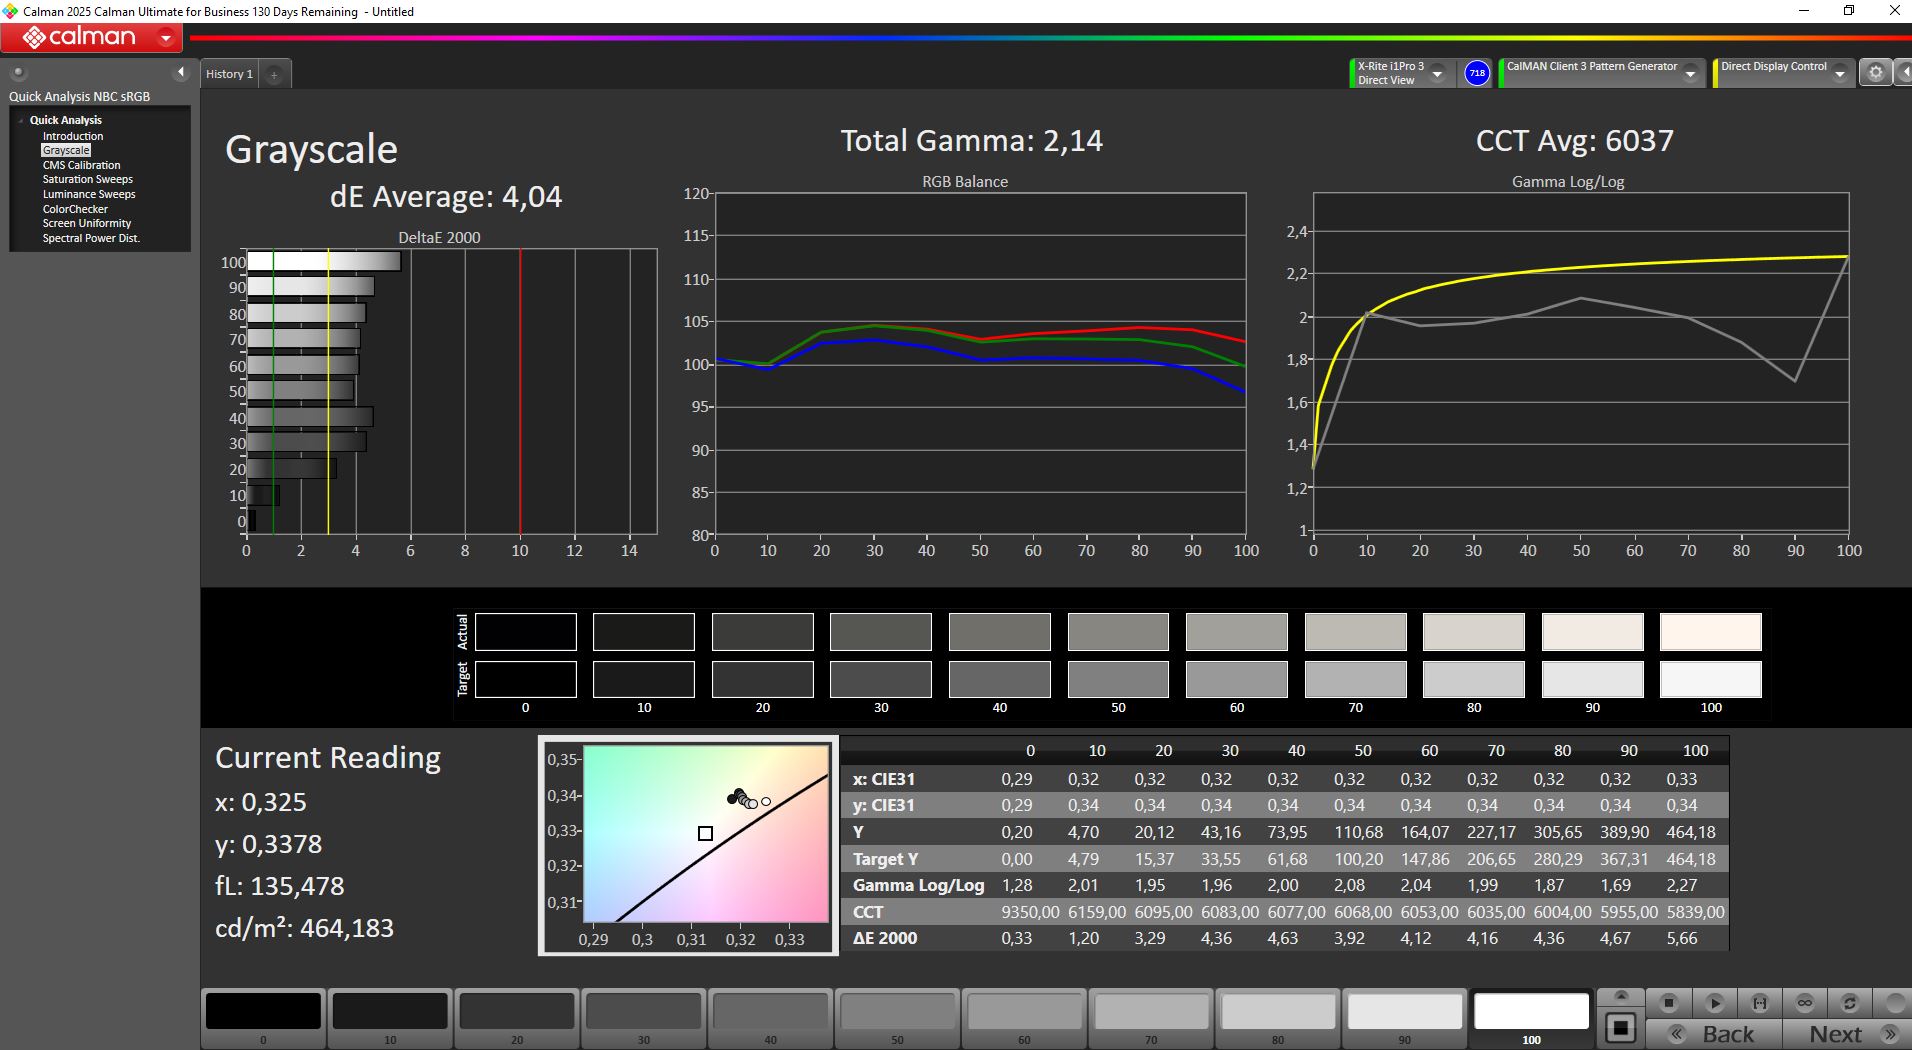
Homogénéité de la luminosité: 87 %
Valeur mesurée au centre, sur batterie: 464 cd/m²
Contraste: 2320:1 (Valeurs des noirs: 0.2 cd/m²)
ΔE ColorChecker Calman: 4.3 | ∀{0.5-29.43 Ø4.79}
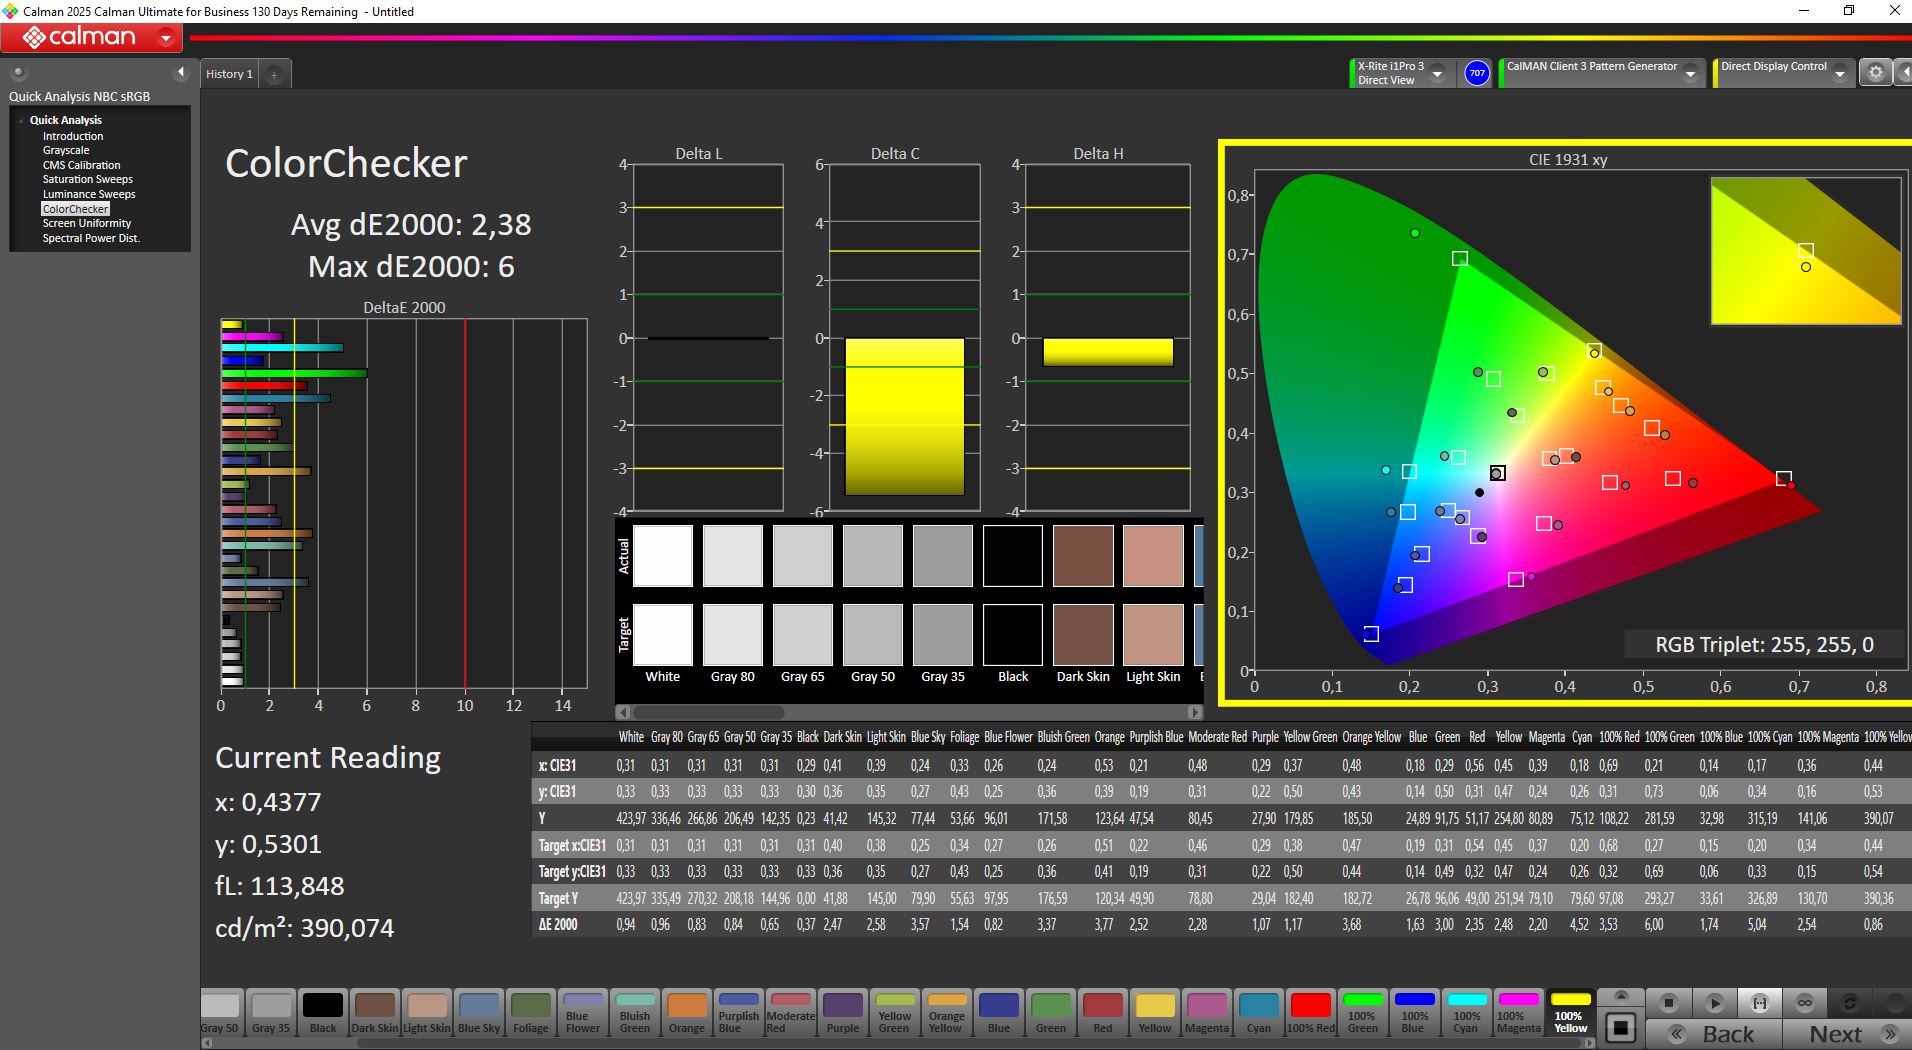
calibrated: 2.38
ΔE Greyscale Calman: 4.04 | ∀{0.09-98 Ø5}
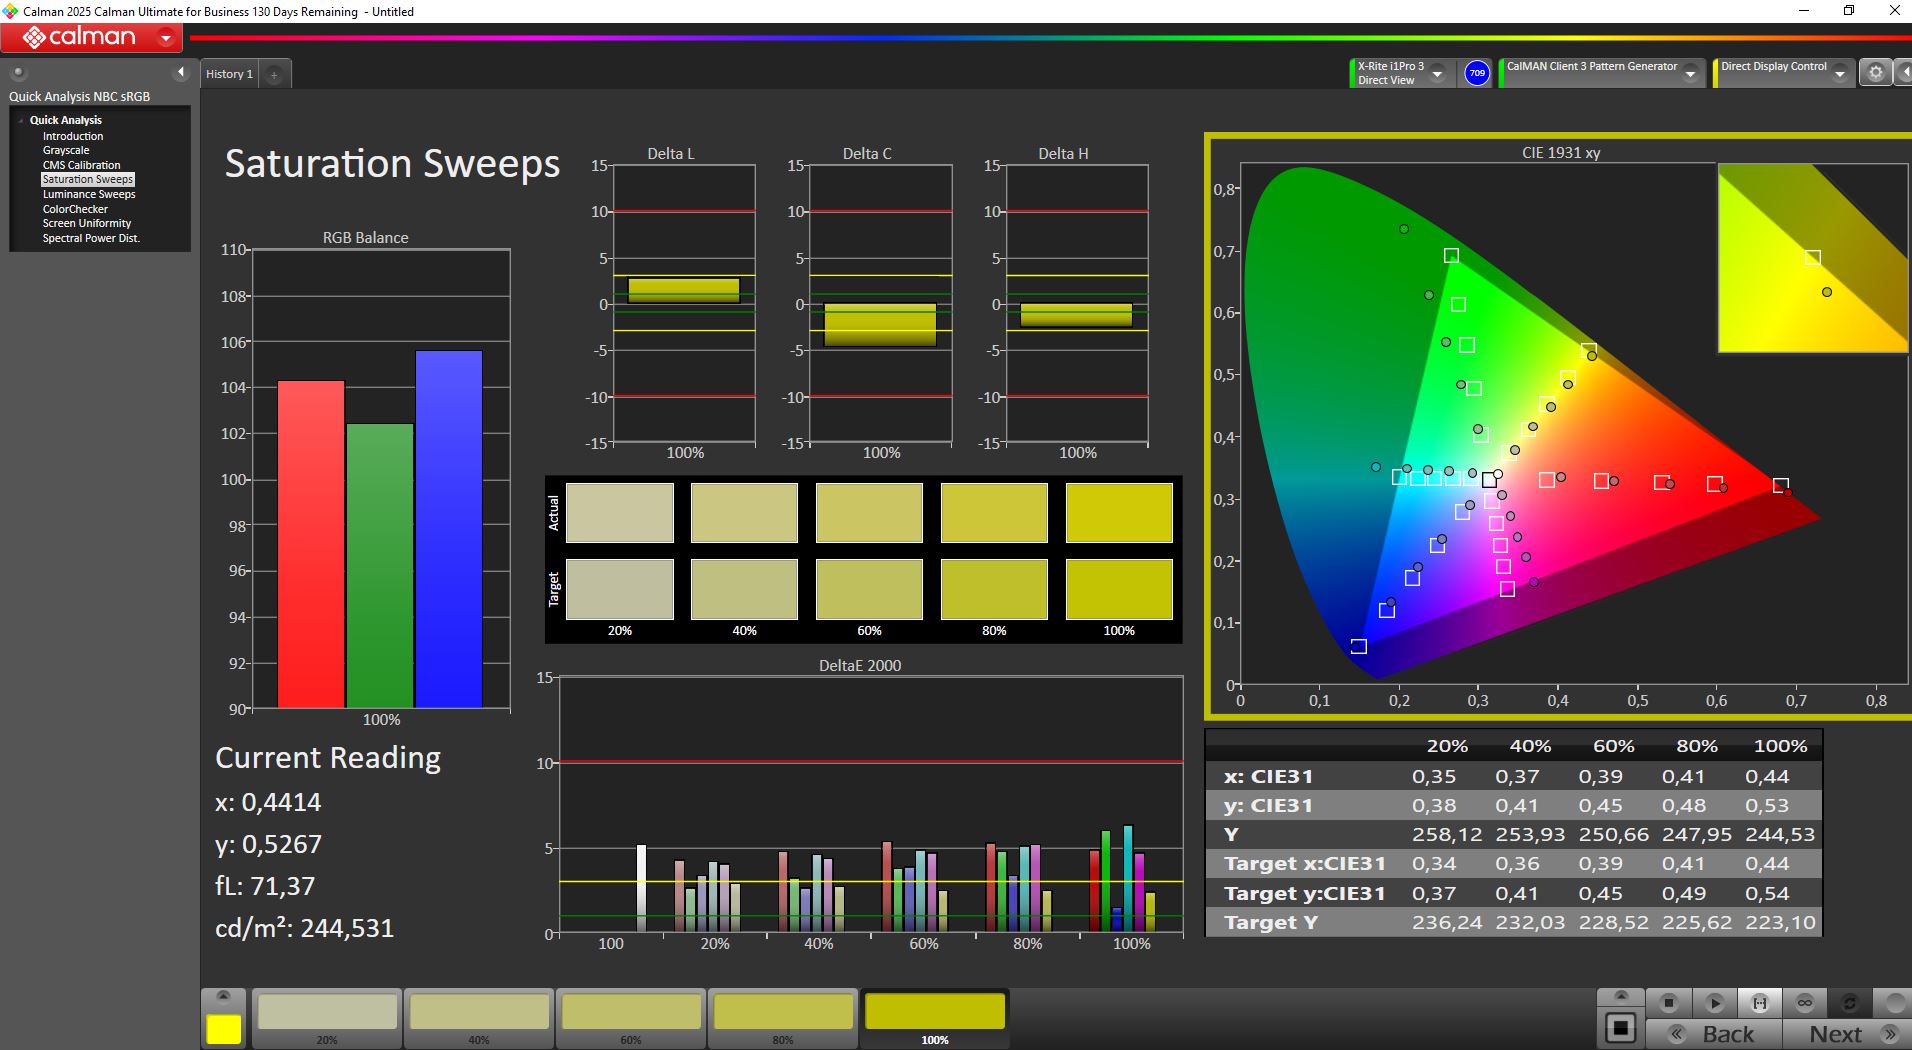
99.9% AdobeRGB 1998 (Argyll 3D)
99.9% sRGB (Argyll 3D)
96.5% Display P3 (Argyll 3D)
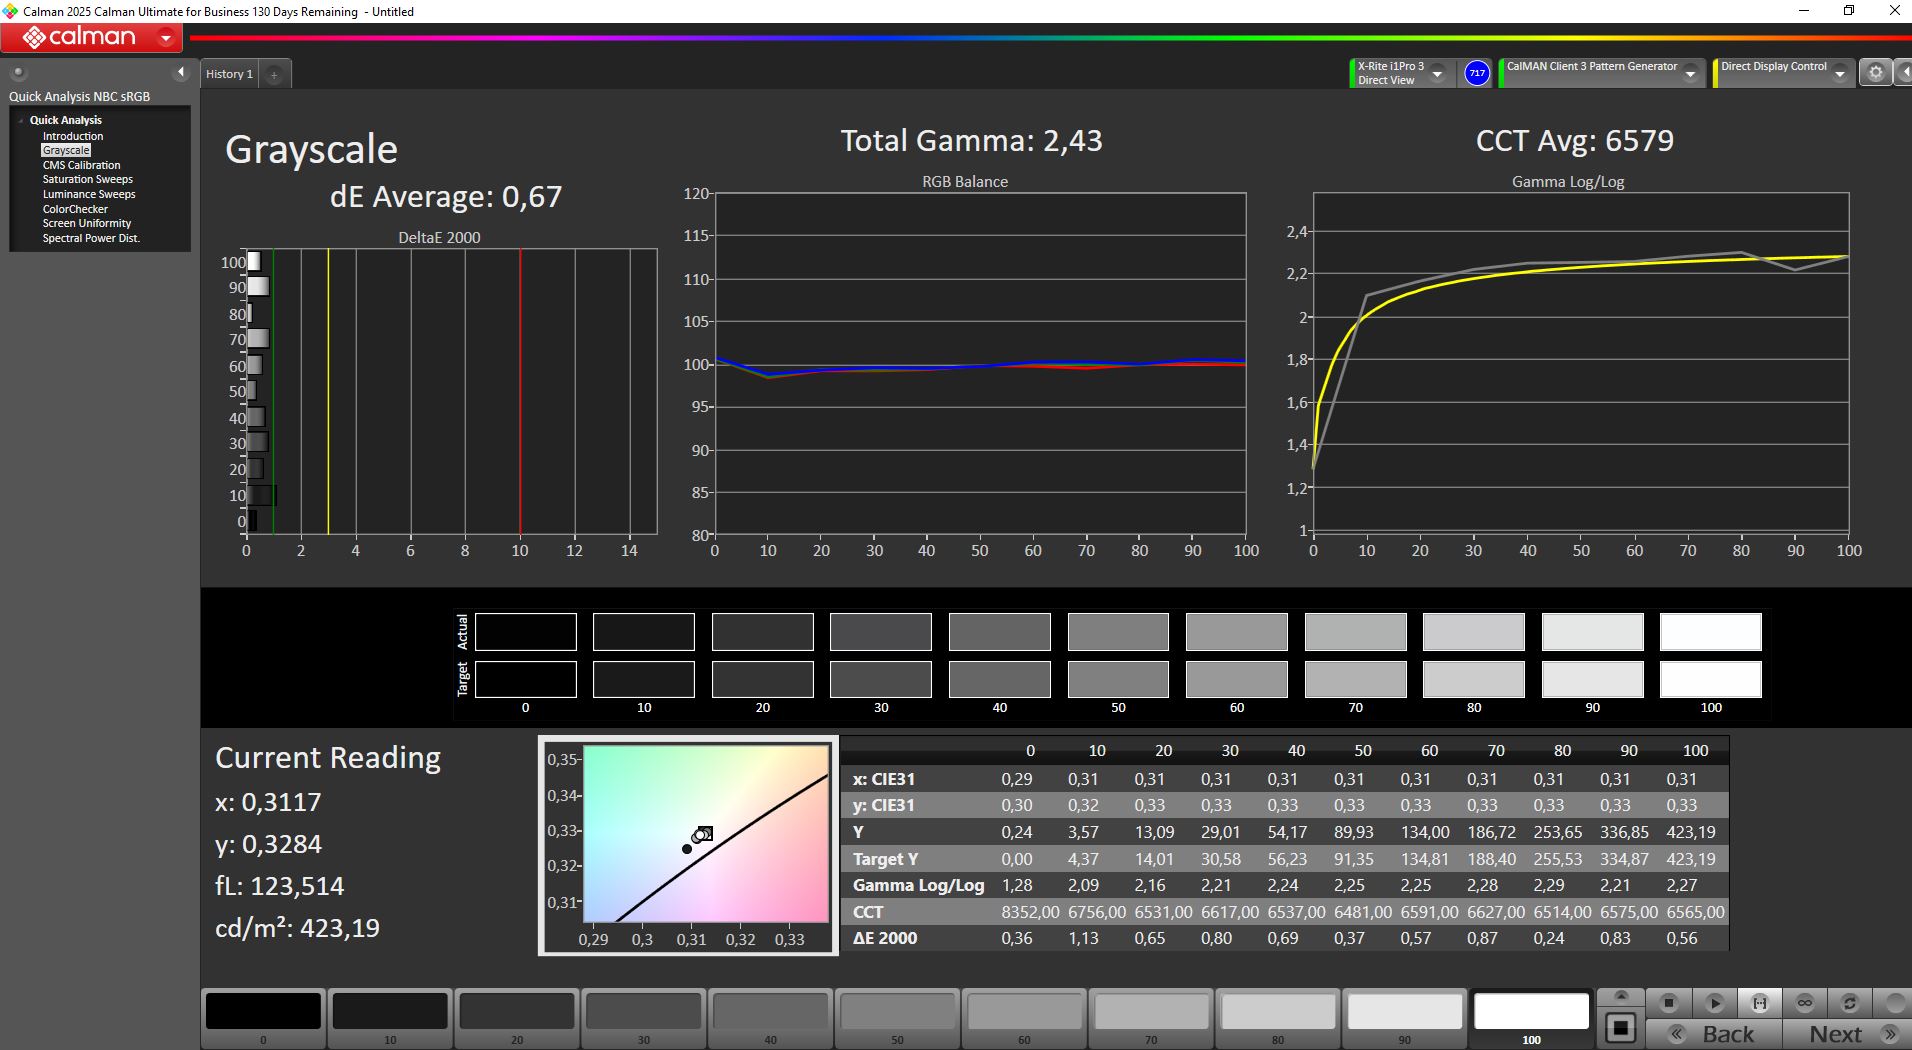
Gamma: 2.14
CCT: 6037 K
| HP ZBook 8 G1i 14, RTX 500 LG Philips LGD07B5, IPS, 2560x1600, 14", 120 Hz | HP ZBook 8 G1i 14 LGD07B5, IPS LED, 2560x1600, 14", 120 Hz | HP ZBook Ultra G1a A3ZQ0ET LGD07A1, IPS LED, 1920x1200, 14", 60 Hz | Lenovo ThinkPad P14s Gen 6 21RV0017GE NE140WUM-N6M, IPS LED, 1920x1200, 14", 60 Hz | Dell Precision 5000 5490 AU Optronics B140QAN, IPS, 2560x1600, 14", 60 Hz | HP ZBook Firefly 14 G11 AUO6DA8, IPS, 2560x1600, 14", 120 Hz | |
|---|---|---|---|---|---|---|
| Display | -0% | -23% | -21% | -12% | -4% | |
| Display P3 Coverage (%) | 96.5 | 95.8 -1% | 65.8 -32% | 67.1 -30% | 79.7 -17% | 98.9 2% |
| sRGB Coverage (%) | 99.9 | 99.9 0% | 97.4 -3% | 98.6 -1% | 100 0% | 99.9 0% |
| AdobeRGB 1998 Coverage (%) | 99.9 | 99.9 0% | 67.1 -33% | 69.2 -31% | 79.5 -20% | 86.6 -13% |
| Response Times | -4% | -26% | 12% | -45% | 65% | |
| Response Time Grey 50% / Grey 80% * (ms) | 39.6 ? | 30.3 ? 23% | 52 ? -31% | 31.1 ? 21% | 52.3 ? -32% | 12.3 ? 69% |
| Response Time Black / White * (ms) | 21.05 ? | 22.2 ? -5% | 25.3 ? -20% | 20.5 ? 3% | 33.3 ? -58% | 8.3 ? 61% |
| PWM Frequency (Hz) | 26000 | 24000 ? | ||||
| PWM Amplitude * (%) | 58.3 | 75 -29% | ||||
| Screen | -26% | -5% | 12% | 8% | 2% | |
| Brightness middle (cd/m²) | 464 | 441 -5% | 406 -12% | 558 20% | 485.1 5% | 554.1 19% |
| Brightness (cd/m²) | 429 | 417 -3% | 379 -12% | 545 27% | 471 10% | 540 26% |
| Brightness Distribution (%) | 87 | 92 6% | 89 2% | 91 5% | 90 3% | 93 7% |
| Black Level * (cd/m²) | 0.2 | 0.2 -0% | 0.28 -40% | 0.32 -60% | 0.38 -90% | 0.58 -190% |
| Contrast (:1) | 2320 | 2205 -5% | 1450 -37% | 1744 -25% | 1277 -45% | 955 -59% |
| Colorchecker dE 2000 * | 4.3 | 6.4 -49% | 3.3 23% | 2.7 37% | 2.15 50% | 2.54 41% |
| Colorchecker dE 2000 max. * | 6.45 | 11 -71% | 6.4 1% | 5.3 18% | 5.39 16% | 4.99 23% |
| Colorchecker dE 2000 calibrated * | 2.38 | 4.8 -102% | 1.1 54% | 0.7 71% | 0.67 72% | 0.56 76% |
| Greyscale dE 2000 * | 4.04 | 4.3 -6% | 5 -24% | 3.5 13% | 2 50% | 1 75% |
| Gamma | 2.14 103% | 1.92 115% | 2.33 94% | 2.1 105% | 2.3 96% | 2.3 96% |
| CCT | 6037 108% | 6017 108% | 6163 105% | 7191 90% | 6826 95% | 6556 99% |
| Moyenne finale (programmes/paramètres) | -10% /
-16% | -18% /
-12% | 1% /
5% | -16% /
-4% | 21% /
10% |
* ... Moindre est la valeur, meilleures sont les performances
L'étalonnage manuel réduit les écarts de niveaux de gris et de couleurs.
Temps de réponse de l'écran
| ↔ Temps de réponse noir à blanc | ||
|---|---|---|
| 21.05 ms ... hausse ↗ et chute ↘ combinées | ↗ 5.2 ms hausse |  |
| ↘ 15.85 ms chute | ||
| L'écran montre de bons temps de réponse, mais insuffisant pour du jeu compétitif. En comparaison, tous les appareils testés affichent entre 0.1 (minimum) et 240 (maximum) ms. » 46 % des appareils testés affichent de meilleures performances. Cela signifie que les latences relevées sont similaires à la moyenne (20.3 ms) de tous les appareils testés. | ||
| ↔ Temps de réponse gris 50% à gris 80% | ||
| 39.6 ms ... hausse ↗ et chute ↘ combinées | ↗ 13.4 ms hausse | 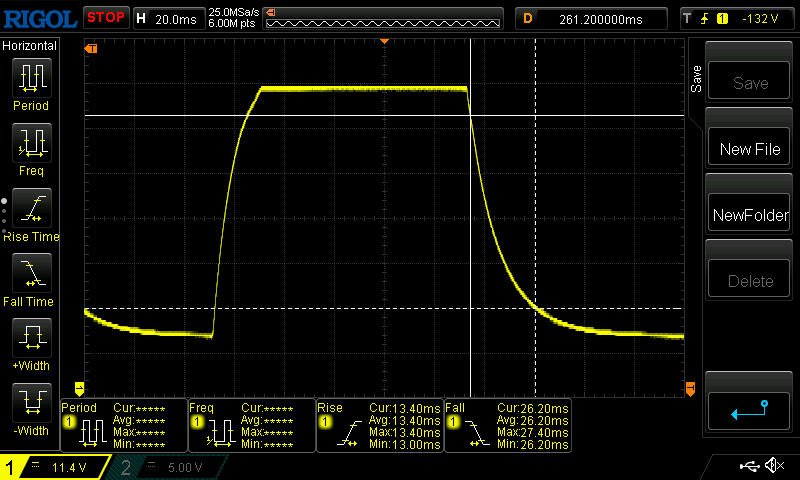 |
| ↘ 26.2 ms chute | ||
| L'écran souffre de latences très élevées, à éviter pour le jeu. En comparaison, tous les appareils testés affichent entre 0.165 (minimum) et 636 (maximum) ms. » 59 % des appareils testés affichent de meilleures performances. Cela signifie que les latences relevées sont moins bonnes que la moyenne (31.7 ms) de tous les appareils testés. | ||
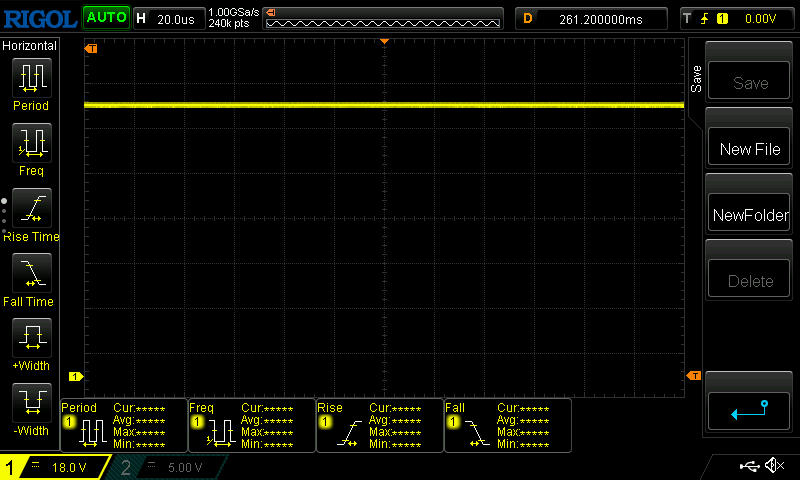
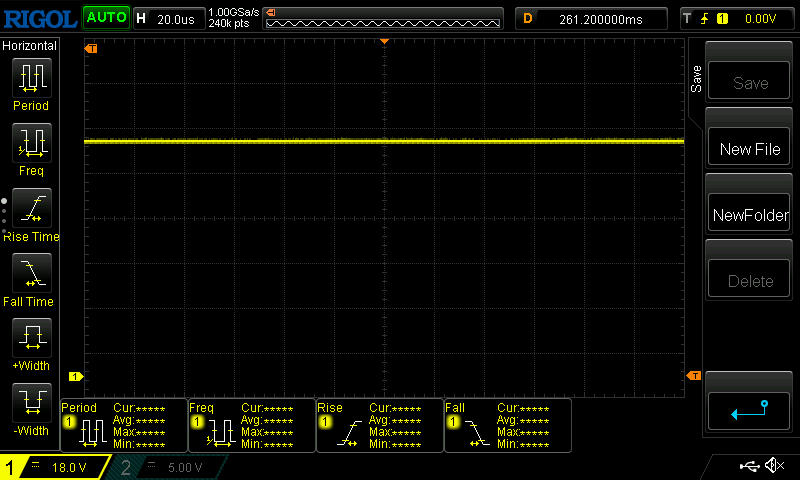
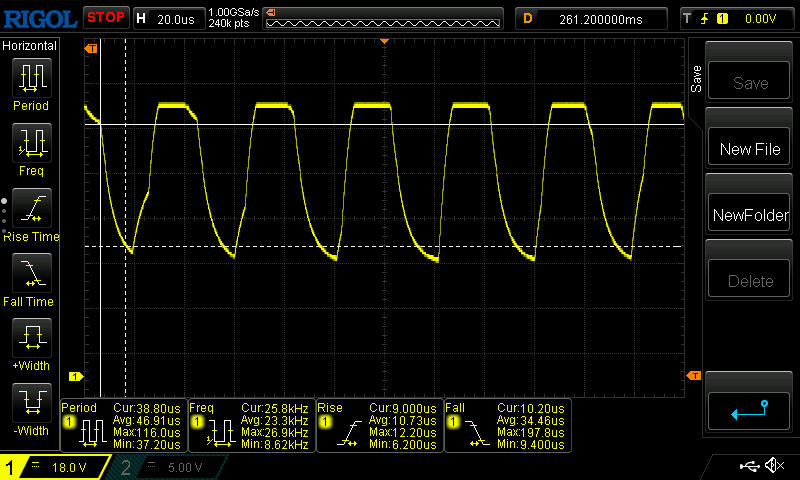
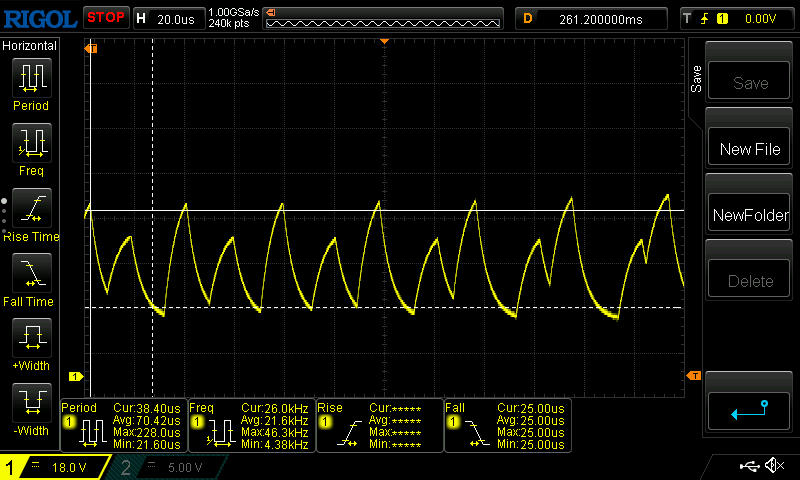
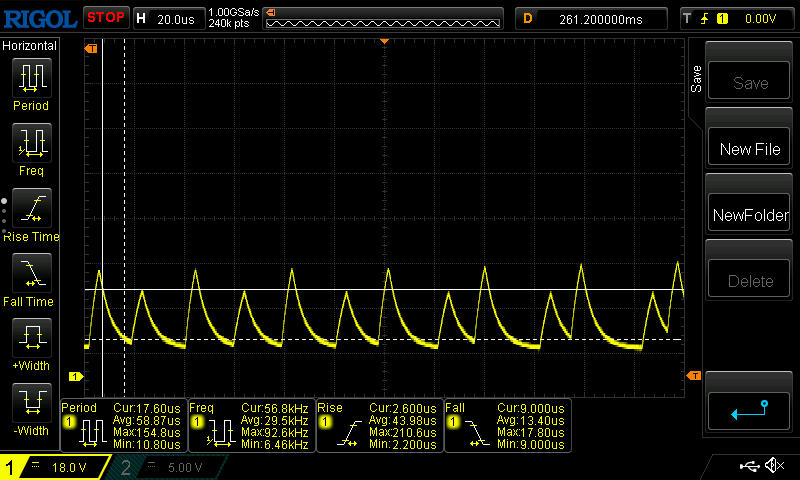
Scintillement / MLI (Modulation de largeur d'impulsion)
| Scintillement / MLI (Modulation de largeur d'impulsion) décelé | 26000 Hz Amplitude: 58.3 % |  | |
Le rétroéclairage de l'écran scintille à la fréquence de 26000 Hz (certainement du fait de l'utilisation d'une MDI - Modulation de largeur d'impulsion) . La fréquence de rafraîchissement de 26000 Hz est élevée, la grande majorité des utilisateurs ne devrait pas percevoir de scintillements et être sujette à une fatigue oculaire accrue. En comparaison, 53 % des appareils testés n'emploient pas MDI pour assombrir leur écran. Nous avons relevé une moyenne à 8162 (minimum : 5 - maximum : 343500) Hz dans le cas où une MDI était active. | |||

Performances - performances élevées et constantes du ZBook
En tant que station de travail, le ZBook 8 G1i s'adresse aux chefs de projet, aux professionnels, aux concepteurs, aux ingénieurs et aux créateurs de contenu. Son matériel performant, comprenant 64 Go de RAM, un processeur Core Ultra 7 265H et une carte RTX 500le ZBook 8 G1i offre les performances nécessaires pour les charges de travail exigeantes.
Conditions d'essai
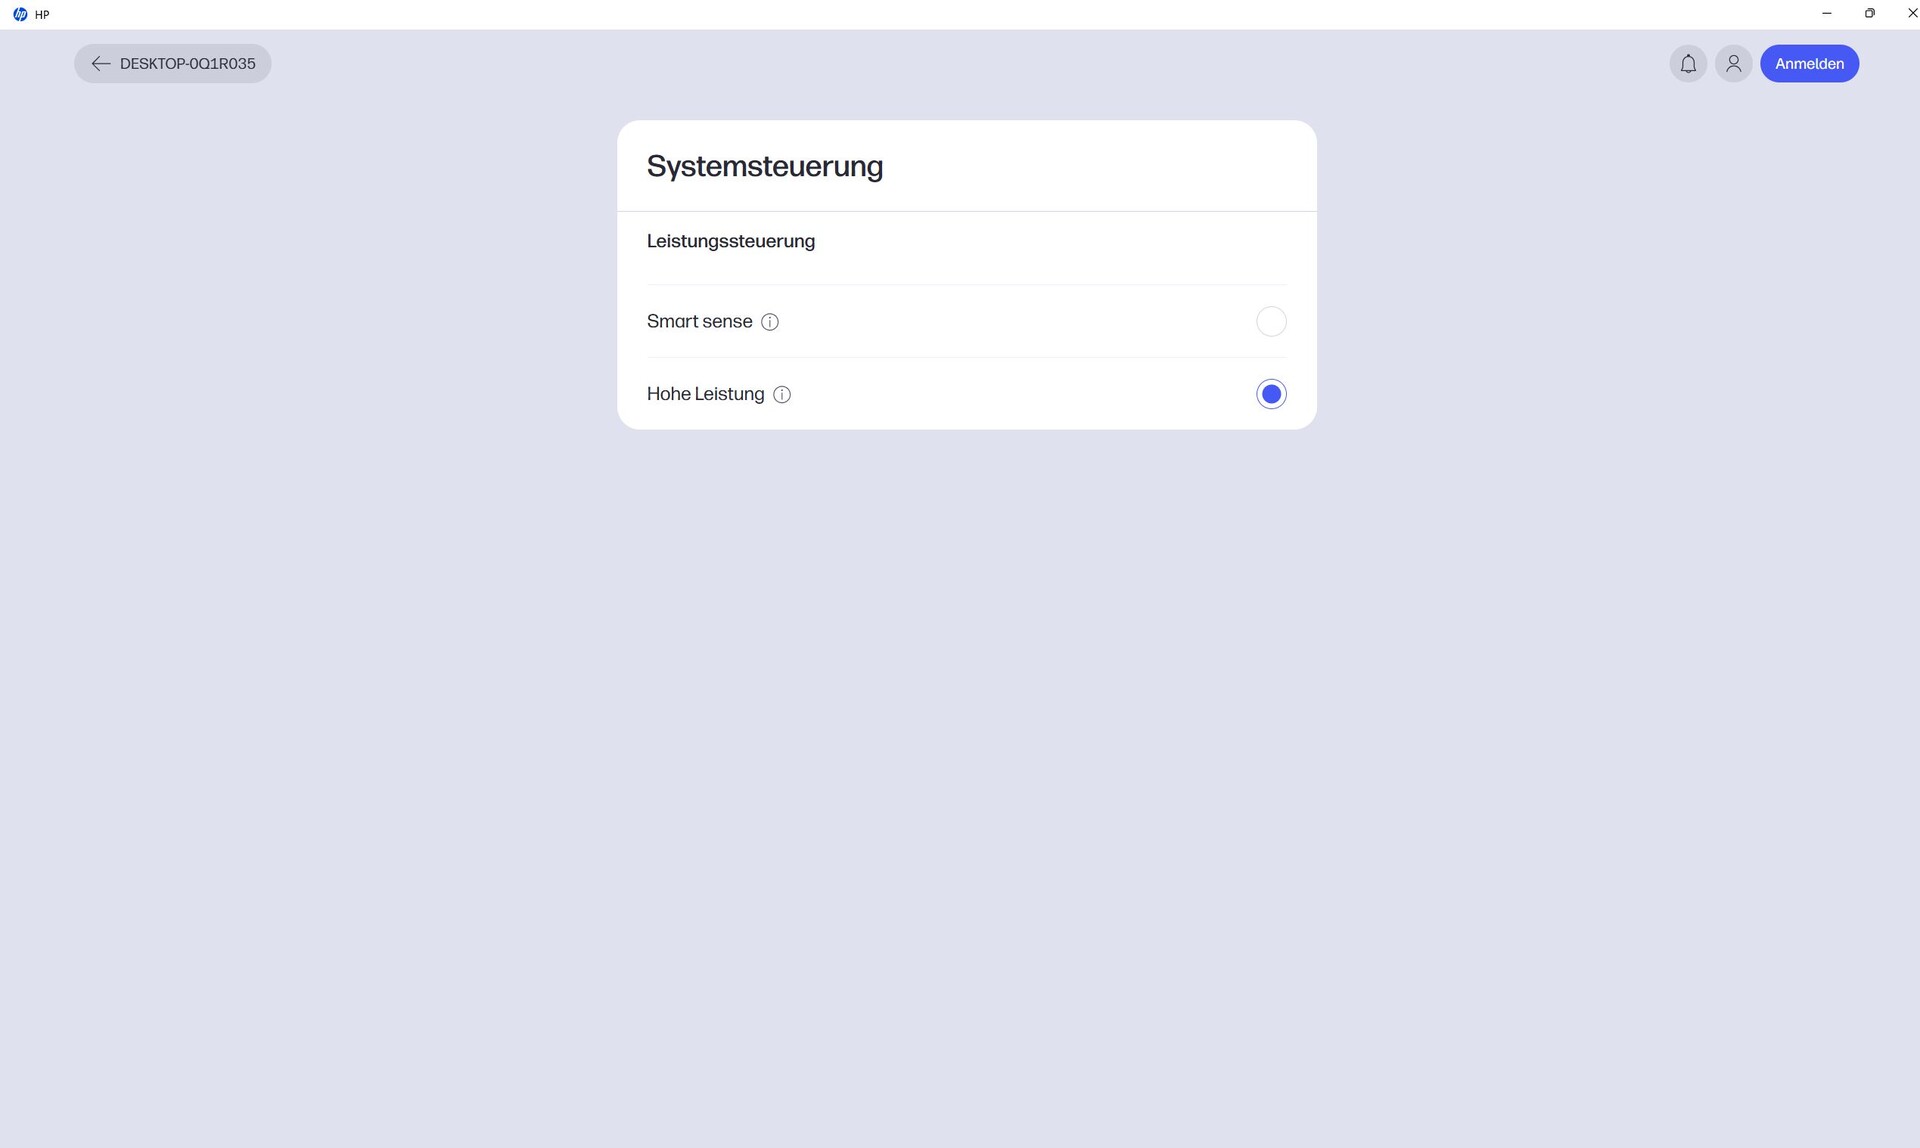
Les applications "Support Assistant", "System Information", "PC Diagnostics Windows" et "HP Device Control" auraient pu être intégrées dans une seule application.
L'application "HP App" est beaucoup trop longue à charger (parfois elle ne se termine pas du tout), et certaines parties sont traduites de manière incorrecte ou incomplète. Sous "System control", nous trouvons deux modes de performance, dont nous avons utilisé "High performance" pour nos tests.
En raison d'un bogue, il arrive que la batterie ne se charge pas complètement, même lorsque le paramètre "Gestionnaire de batterie" est réglé sur "Minimiser la gestion de l'état de la batterie".

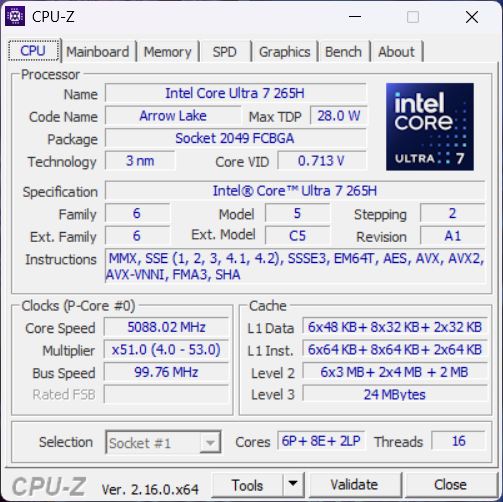
Processeur
Notre Core Ultra 7 265H affiche des performances relativement constantes dans Cinebench R15, avec seulement une légère baisse après le cinquième essai.
Les résultats globaux du CPU sont très bons, bien que la puce ne soit pas significativement plus rapide que le Core Ultra 7 255H dans notre configuration de test précédente. Le ZBook Ultra G1a avec le processeur Ryzen AI Max PRO 390 conserve une nette avance.
En mode batterie, les performances du processeur chutent d'environ 13 %.
Test d'endurance multiple Cinebench R15
Cinebench R23: Multi Core | Single Core
Cinebench R20: CPU (Multi Core) | CPU (Single Core)
Cinebench R15: CPU Multi 64Bit | CPU Single 64Bit
Blender: v2.79 BMW27 CPU
7-Zip 18.03: 7z b 4 | 7z b 4 -mmt1
Geekbench 6.5: Multi-Core | Single-Core
Geekbench 5.5: Multi-Core | Single-Core
HWBOT x265 Benchmark v2.2: 4k Preset
LibreOffice : 20 Documents To PDF
R Benchmark 2.5: Overall mean
| CPU Performance rating | |
| HP ZBook Ultra G1a A3ZQ0ET | |
| Moyenne Intel Core Ultra 7 265H | |
| HP ZBook 8 G1i 14 | |
| HP ZBook 8 G1i 14, RTX 500 | |
| Moyenne de la classe Workstation | |
| Lenovo ThinkPad P14s Gen 6 21RV0017GE | |
| Dell Precision 5000 5490 | |
| HP ZBook Firefly 14 G11 | |
| Cinebench R23 / Multi Core | |
| HP ZBook Ultra G1a A3ZQ0ET | |
| Moyenne Intel Core Ultra 7 265H (19421 - 21369, n=2) | |
| Moyenne de la classe Workstation (13971 - 36692, n=27, 2 dernières années) | |
| HP ZBook 8 G1i 14, RTX 500 | |
| HP ZBook 8 G1i 14 | |
| Lenovo ThinkPad P14s Gen 6 21RV0017GE | |
| Dell Precision 5000 5490 | |
| HP ZBook Firefly 14 G11 | |
| Cinebench R23 / Single Core | |
| HP ZBook 8 G1i 14, RTX 500 | |
| HP ZBook 8 G1i 14 | |
| Moyenne Intel Core Ultra 7 265H (2011 - 2081, n=2) | |
| HP ZBook Ultra G1a A3ZQ0ET | |
| Lenovo ThinkPad P14s Gen 6 21RV0017GE | |
| Moyenne de la classe Workstation (1691 - 2206, n=27, 2 dernières années) | |
| Dell Precision 5000 5490 | |
| HP ZBook Firefly 14 G11 | |
| Cinebench R20 / CPU (Multi Core) | |
| HP ZBook Ultra G1a A3ZQ0ET | |
| Moyenne Intel Core Ultra 7 265H (7532 - 8400, n=2) | |
| Moyenne de la classe Workstation (5327 - 14341, n=27, 2 dernières années) | |
| HP ZBook 8 G1i 14, RTX 500 | |
| HP ZBook 8 G1i 14 | |
| Lenovo ThinkPad P14s Gen 6 21RV0017GE | |
| Dell Precision 5000 5490 | |
| HP ZBook Firefly 14 G11 | |
| Cinebench R20 / CPU (Single Core) | |
| HP ZBook 8 G1i 14, RTX 500 | |
| HP ZBook 8 G1i 14 | |
| Moyenne Intel Core Ultra 7 265H (776 - 791, n=2) | |
| HP ZBook Ultra G1a A3ZQ0ET | |
| Lenovo ThinkPad P14s Gen 6 21RV0017GE | |
| Moyenne de la classe Workstation (651 - 849, n=27, 2 dernières années) | |
| Dell Precision 5000 5490 | |
| HP ZBook Firefly 14 G11 | |
| Cinebench R15 / CPU Multi 64Bit | |
| HP ZBook Ultra G1a A3ZQ0ET | |
| Moyenne de la classe Workstation (2240 - 5509, n=27, 2 dernières années) | |
| Moyenne Intel Core Ultra 7 265H (2851 - 3440, n=2) | |
| Lenovo ThinkPad P14s Gen 6 21RV0017GE | |
| HP ZBook 8 G1i 14, RTX 500 | |
| HP ZBook 8 G1i 14 | |
| Dell Precision 5000 5490 | |
| HP ZBook Firefly 14 G11 | |
| Cinebench R15 / CPU Single 64Bit | |
| HP ZBook 8 G1i 14, RTX 500 | |
| Moyenne Intel Core Ultra 7 265H (305 - 312, n=2) | |
| HP ZBook 8 G1i 14 | |
| HP ZBook Ultra G1a A3ZQ0ET | |
| Moyenne de la classe Workstation (191.4 - 324, n=27, 2 dernières années) | |
| HP ZBook Firefly 14 G11 | |
| Dell Precision 5000 5490 | |
| Lenovo ThinkPad P14s Gen 6 21RV0017GE | |
| Blender / v2.79 BMW27 CPU | |
| HP ZBook Firefly 14 G11 | |
| Dell Precision 5000 5490 | |
| Moyenne de la classe Workstation (91 - 261, n=27, 2 dernières années) | |
| HP ZBook 8 G1i 14 | |
| HP ZBook 8 G1i 14, RTX 500 | |
| Lenovo ThinkPad P14s Gen 6 21RV0017GE | |
| Moyenne Intel Core Ultra 7 265H (164 - 172, n=2) | |
| HP ZBook Ultra G1a A3ZQ0ET | |
| 7-Zip 18.03 / 7z b 4 | |
| HP ZBook Ultra G1a A3ZQ0ET | |
| Moyenne de la classe Workstation (53407 - 109760, n=27, 2 dernières années) | |
| Lenovo ThinkPad P14s Gen 6 21RV0017GE | |
| Dell Precision 5000 5490 | |
| Moyenne Intel Core Ultra 7 265H (64940 - 68913, n=2) | |
| HP ZBook 8 G1i 14, RTX 500 | |
| HP ZBook 8 G1i 14 | |
| HP ZBook Firefly 14 G11 | |
| 7-Zip 18.03 / 7z b 4 -mmt1 | |
| HP ZBook 8 G1i 14, RTX 500 | |
| Moyenne Intel Core Ultra 7 265H (6160 - 6304, n=2) | |
| HP ZBook Ultra G1a A3ZQ0ET | |
| Moyenne de la classe Workstation (4981 - 6960, n=27, 2 dernières années) | |
| Lenovo ThinkPad P14s Gen 6 21RV0017GE | |
| HP ZBook 8 G1i 14 | |
| Dell Precision 5000 5490 | |
| HP ZBook Firefly 14 G11 | |
| Geekbench 6.5 / Multi-Core | |
| HP ZBook 8 G1i 14, RTX 500 | |
| HP ZBook 8 G1i 14 | |
| Moyenne Intel Core Ultra 7 265H (14502 - 17144, n=3) | |
| HP ZBook Ultra G1a A3ZQ0ET | |
| Lenovo ThinkPad P14s Gen 6 21RV0017GE | |
| Moyenne de la classe Workstation (10518 - 20630, n=26, 2 dernières années) | |
| Dell Precision 5000 5490 | |
| HP ZBook Firefly 14 G11 | |
| Geekbench 6.5 / Single-Core | |
| Moyenne Intel Core Ultra 7 265H (2905 - 2911, n=3) | |
| HP ZBook 8 G1i 14, RTX 500 | |
| HP ZBook 8 G1i 14 | |
| Lenovo ThinkPad P14s Gen 6 21RV0017GE | |
| HP ZBook Ultra G1a A3ZQ0ET | |
| Moyenne de la classe Workstation (2384 - 2939, n=26, 2 dernières années) | |
| HP ZBook Firefly 14 G11 | |
| Dell Precision 5000 5490 | |
| Geekbench 5.5 / Multi-Core | |
| HP ZBook Ultra G1a A3ZQ0ET | |
| Moyenne Intel Core Ultra 7 265H (14945 - 16453, n=2) | |
| HP ZBook 8 G1i 14, RTX 500 | |
| HP ZBook 8 G1i 14 | |
| Moyenne de la classe Workstation (9968 - 24910, n=27, 2 dernières années) | |
| Lenovo ThinkPad P14s Gen 6 21RV0017GE | |
| Dell Precision 5000 5490 | |
| HP ZBook Firefly 14 G11 | |
| Geekbench 5.5 / Single-Core | |
| Lenovo ThinkPad P14s Gen 6 21RV0017GE | |
| HP ZBook 8 G1i 14, RTX 500 | |
| Moyenne Intel Core Ultra 7 265H (2079 - 2110, n=2) | |
| HP ZBook 8 G1i 14 | |
| HP ZBook Ultra G1a A3ZQ0ET | |
| Moyenne de la classe Workstation (1740 - 2130, n=27, 2 dernières années) | |
| HP ZBook Firefly 14 G11 | |
| Dell Precision 5000 5490 | |
| HWBOT x265 Benchmark v2.2 / 4k Preset | |
| HP ZBook Ultra G1a A3ZQ0ET | |
| Moyenne Intel Core Ultra 7 265H (23.1 - 25.3, n=2) | |
| Lenovo ThinkPad P14s Gen 6 21RV0017GE | |
| HP ZBook 8 G1i 14, RTX 500 | |
| Moyenne de la classe Workstation (14.4 - 36.8, n=27, 2 dernières années) | |
| HP ZBook 8 G1i 14 | |
| Dell Precision 5000 5490 | |
| HP ZBook Firefly 14 G11 | |
| LibreOffice / 20 Documents To PDF | |
| HP ZBook 8 G1i 14, RTX 500 | |
| Moyenne Intel Core Ultra 7 265H (42.2 - 74.7, n=2) | |
| HP ZBook Ultra G1a A3ZQ0ET | |
| Lenovo ThinkPad P14s Gen 6 21RV0017GE | |
| HP ZBook Firefly 14 G11 | |
| Moyenne de la classe Workstation (37.1 - 74.7, n=27, 2 dernières années) | |
| HP ZBook 8 G1i 14 | |
| Dell Precision 5000 5490 | |
| R Benchmark 2.5 / Overall mean | |
| Dell Precision 5000 5490 | |
| HP ZBook Firefly 14 G11 | |
| Moyenne de la classe Workstation (0.3825 - 0.603, n=27, 2 dernières années) | |
| HP ZBook 8 G1i 14 | |
| HP ZBook 8 G1i 14, RTX 500 | |
| Moyenne Intel Core Ultra 7 265H (0.4241 - 0.4291, n=2) | |
| Lenovo ThinkPad P14s Gen 6 21RV0017GE | |
| HP ZBook Ultra G1a A3ZQ0ET | |
* ... Moindre est la valeur, meilleures sont les performances
AIDA64: FP32 Ray-Trace | FPU Julia | CPU SHA3 | CPU Queen | FPU SinJulia | FPU Mandel | CPU AES | CPU ZLib | FP64 Ray-Trace | CPU PhotoWorxx
| Performance rating | |
| HP ZBook Ultra G1a A3ZQ0ET | |
| Lenovo ThinkPad P14s Gen 6 21RV0017GE | |
| Moyenne de la classe Workstation | |
| HP ZBook 8 G1i 14 | |
| HP ZBook 8 G1i 14, RTX 500 | |
| Moyenne Intel Core Ultra 7 265H | |
| Dell Precision 5000 5490 | |
| HP ZBook Firefly 14 G11 | |
| AIDA64 / FP32 Ray-Trace | |
| HP ZBook Ultra G1a A3ZQ0ET | |
| Lenovo ThinkPad P14s Gen 6 21RV0017GE | |
| Moyenne de la classe Workstation (10658 - 61611, n=27, 2 dernières années) | |
| HP ZBook 8 G1i 14 | |
| HP ZBook 8 G1i 14, RTX 500 | |
| Moyenne Intel Core Ultra 7 265H (n=1) | |
| Dell Precision 5000 5490 | |
| HP ZBook Firefly 14 G11 | |
| AIDA64 / FPU Julia | |
| HP ZBook Ultra G1a A3ZQ0ET | |
| Lenovo ThinkPad P14s Gen 6 21RV0017GE | |
| Moyenne de la classe Workstation (56664 - 186971, n=27, 2 dernières années) | |
| HP ZBook 8 G1i 14, RTX 500 | |
| Moyenne Intel Core Ultra 7 265H (n=1) | |
| HP ZBook 8 G1i 14 | |
| Dell Precision 5000 5490 | |
| HP ZBook Firefly 14 G11 | |
| AIDA64 / CPU SHA3 | |
| HP ZBook Ultra G1a A3ZQ0ET | |
| Lenovo ThinkPad P14s Gen 6 21RV0017GE | |
| Moyenne de la classe Workstation (2608 - 8975, n=27, 2 dernières années) | |
| HP ZBook 8 G1i 14 | |
| HP ZBook 8 G1i 14, RTX 500 | |
| Moyenne Intel Core Ultra 7 265H (n=1) | |
| Dell Precision 5000 5490 | |
| HP ZBook Firefly 14 G11 | |
| AIDA64 / CPU Queen | |
| Moyenne de la classe Workstation (60778 - 144411, n=27, 2 dernières années) | |
| HP ZBook Ultra G1a A3ZQ0ET | |
| Dell Precision 5000 5490 | |
| Lenovo ThinkPad P14s Gen 6 21RV0017GE | |
| HP ZBook Firefly 14 G11 | |
| HP ZBook 8 G1i 14 | |
| HP ZBook 8 G1i 14, RTX 500 | |
| Moyenne Intel Core Ultra 7 265H (n=1) | |
| AIDA64 / FPU SinJulia | |
| HP ZBook Ultra G1a A3ZQ0ET | |
| Lenovo ThinkPad P14s Gen 6 21RV0017GE | |
| Moyenne de la classe Workstation (7906 - 29343, n=27, 2 dernières années) | |
| Dell Precision 5000 5490 | |
| HP ZBook 8 G1i 14, RTX 500 | |
| Moyenne Intel Core Ultra 7 265H (n=1) | |
| HP ZBook 8 G1i 14 | |
| HP ZBook Firefly 14 G11 | |
| AIDA64 / FPU Mandel | |
| HP ZBook Ultra G1a A3ZQ0ET | |
| Lenovo ThinkPad P14s Gen 6 21RV0017GE | |
| Moyenne de la classe Workstation (27301 - 98153, n=27, 2 dernières années) | |
| HP ZBook 8 G1i 14, RTX 500 | |
| Moyenne Intel Core Ultra 7 265H (n=1) | |
| HP ZBook 8 G1i 14 | |
| Dell Precision 5000 5490 | |
| HP ZBook Firefly 14 G11 | |
| AIDA64 / CPU AES | |
| HP ZBook Ultra G1a A3ZQ0ET | |
| Lenovo ThinkPad P14s Gen 6 21RV0017GE | |
| Moyenne de la classe Workstation (56077 - 187841, n=27, 2 dernières années) | |
| Dell Precision 5000 5490 | |
| HP ZBook 8 G1i 14 | |
| HP ZBook 8 G1i 14, RTX 500 | |
| Moyenne Intel Core Ultra 7 265H (n=1) | |
| HP ZBook Firefly 14 G11 | |
| AIDA64 / CPU ZLib | |
| HP ZBook Ultra G1a A3ZQ0ET | |
| Moyenne de la classe Workstation (742 - 2116, n=27, 2 dernières années) | |
| Lenovo ThinkPad P14s Gen 6 21RV0017GE | |
| HP ZBook 8 G1i 14 | |
| HP ZBook 8 G1i 14, RTX 500 | |
| Moyenne Intel Core Ultra 7 265H (n=1) | |
| Dell Precision 5000 5490 | |
| HP ZBook Firefly 14 G11 | |
| AIDA64 / FP64 Ray-Trace | |
| HP ZBook Ultra G1a A3ZQ0ET | |
| Lenovo ThinkPad P14s Gen 6 21RV0017GE | |
| Moyenne de la classe Workstation (5580 - 32891, n=27, 2 dernières années) | |
| HP ZBook 8 G1i 14, RTX 500 | |
| Moyenne Intel Core Ultra 7 265H (n=1) | |
| HP ZBook 8 G1i 14 | |
| Dell Precision 5000 5490 | |
| HP ZBook Firefly 14 G11 | |
| AIDA64 / CPU PhotoWorxx | |
| HP ZBook Ultra G1a A3ZQ0ET | |
| HP ZBook 8 G1i 14, RTX 500 | |
| Moyenne Intel Core Ultra 7 265H (n=1) | |
| HP ZBook 8 G1i 14 | |
| Dell Precision 5000 5490 | |
| Lenovo ThinkPad P14s Gen 6 21RV0017GE | |
| Moyenne de la classe Workstation (24325 - 93684, n=27, 2 dernières années) | |
| HP ZBook Firefly 14 G11 | |
Performance du système
Les performances globales sont conformes aux attentes, les excellents résultats de CrossMark contribuant à relever la moyenne.
PCMark 10: Score | Essentials | Productivity | Digital Content Creation
CrossMark: Overall | Productivity | Creativity | Responsiveness
WebXPRT 3: Overall
WebXPRT 4: Overall
Mozilla Kraken 1.1: Total
| Performance rating | |
| HP ZBook 8 G1i 14 | |
| HP ZBook 8 G1i 14, RTX 500 | |
| Lenovo ThinkPad P14s Gen 6 21RV0017GE | |
| Moyenne Intel Core Ultra 7 265H, Nvidia RTX 500 Ada Generation Laptop GPU | |
| HP ZBook Ultra G1a A3ZQ0ET | |
| Moyenne de la classe Workstation | |
| Dell Precision 5000 5490 | |
| HP ZBook Firefly 14 G11 | |
| PCMark 10 / Score | |
| HP ZBook Ultra G1a A3ZQ0ET | |
| HP ZBook 8 G1i 14 | |
| Moyenne de la classe Workstation (6436 - 8519, n=25, 2 dernières années) | |
| Lenovo ThinkPad P14s Gen 6 21RV0017GE | |
| Dell Precision 5000 5490 | |
| HP ZBook 8 G1i 14, RTX 500 | |
| Moyenne Intel Core Ultra 7 265H, Nvidia RTX 500 Ada Generation Laptop GPU (n=1) | |
| HP ZBook Firefly 14 G11 | |
| PCMark 10 / Essentials | |
| Dell Precision 5000 5490 | |
| HP ZBook 8 G1i 14 | |
| Lenovo ThinkPad P14s Gen 6 21RV0017GE | |
| HP ZBook Ultra G1a A3ZQ0ET | |
| Moyenne de la classe Workstation (9622 - 11195, n=25, 2 dernières années) | |
| HP ZBook Firefly 14 G11 | |
| HP ZBook 8 G1i 14, RTX 500 | |
| Moyenne Intel Core Ultra 7 265H, Nvidia RTX 500 Ada Generation Laptop GPU (n=1) | |
| PCMark 10 / Productivity | |
| Lenovo ThinkPad P14s Gen 6 21RV0017GE | |
| HP ZBook 8 G1i 14 | |
| HP ZBook 8 G1i 14, RTX 500 | |
| Moyenne Intel Core Ultra 7 265H, Nvidia RTX 500 Ada Generation Laptop GPU (n=1) | |
| HP ZBook Ultra G1a A3ZQ0ET | |
| Moyenne de la classe Workstation (8829 - 10548, n=25, 2 dernières années) | |
| HP ZBook Firefly 14 G11 | |
| Dell Precision 5000 5490 | |
| PCMark 10 / Digital Content Creation | |
| HP ZBook Ultra G1a A3ZQ0ET | |
| HP ZBook 8 G1i 14 | |
| Moyenne de la classe Workstation (7744 - 15631, n=25, 2 dernières années) | |
| HP ZBook 8 G1i 14, RTX 500 | |
| Moyenne Intel Core Ultra 7 265H, Nvidia RTX 500 Ada Generation Laptop GPU (n=1) | |
| Dell Precision 5000 5490 | |
| Lenovo ThinkPad P14s Gen 6 21RV0017GE | |
| HP ZBook Firefly 14 G11 | |
| CrossMark / Overall | |
| HP ZBook 8 G1i 14, RTX 500 | |
| Moyenne Intel Core Ultra 7 265H, Nvidia RTX 500 Ada Generation Laptop GPU (n=1) | |
| HP ZBook 8 G1i 14 | |
| Lenovo ThinkPad P14s Gen 6 21RV0017GE | |
| Moyenne de la classe Workstation (1307 - 2208, n=26, 2 dernières années) | |
| HP ZBook Ultra G1a A3ZQ0ET | |
| Dell Precision 5000 5490 | |
| HP ZBook Firefly 14 G11 | |
| CrossMark / Productivity | |
| HP ZBook 8 G1i 14, RTX 500 | |
| Moyenne Intel Core Ultra 7 265H, Nvidia RTX 500 Ada Generation Laptop GPU (n=1) | |
| HP ZBook 8 G1i 14 | |
| Lenovo ThinkPad P14s Gen 6 21RV0017GE | |
| Moyenne de la classe Workstation (1130 - 2020, n=26, 2 dernières années) | |
| Dell Precision 5000 5490 | |
| HP ZBook Firefly 14 G11 | |
| HP ZBook Ultra G1a A3ZQ0ET | |
| CrossMark / Creativity | |
| HP ZBook Ultra G1a A3ZQ0ET | |
| HP ZBook 8 G1i 14, RTX 500 | |
| Moyenne Intel Core Ultra 7 265H, Nvidia RTX 500 Ada Generation Laptop GPU (n=1) | |
| HP ZBook 8 G1i 14 | |
| Lenovo ThinkPad P14s Gen 6 21RV0017GE | |
| Moyenne de la classe Workstation (1655 - 2575, n=26, 2 dernières années) | |
| Dell Precision 5000 5490 | |
| HP ZBook Firefly 14 G11 | |
| CrossMark / Responsiveness | |
| Lenovo ThinkPad P14s Gen 6 21RV0017GE | |
| Moyenne de la classe Workstation (993 - 1908, n=26, 2 dernières années) | |
| Dell Precision 5000 5490 | |
| HP ZBook 8 G1i 14 | |
| HP ZBook 8 G1i 14, RTX 500 | |
| Moyenne Intel Core Ultra 7 265H, Nvidia RTX 500 Ada Generation Laptop GPU (n=1) | |
| HP ZBook Firefly 14 G11 | |
| HP ZBook Ultra G1a A3ZQ0ET | |
| WebXPRT 3 / Overall | |
| Lenovo ThinkPad P14s Gen 6 21RV0017GE | |
| HP ZBook 8 G1i 14, RTX 500 | |
| Moyenne Intel Core Ultra 7 265H, Nvidia RTX 500 Ada Generation Laptop GPU (n=1) | |
| HP ZBook 8 G1i 14 | |
| Moyenne de la classe Workstation (259 - 415, n=27, 2 dernières années) | |
| HP ZBook Firefly 14 G11 | |
| Dell Precision 5000 5490 | |
| HP ZBook Ultra G1a A3ZQ0ET | |
| WebXPRT 4 / Overall | |
| HP ZBook 8 G1i 14 | |
| HP ZBook 8 G1i 14, RTX 500 | |
| Moyenne Intel Core Ultra 7 265H, Nvidia RTX 500 Ada Generation Laptop GPU (n=1) | |
| HP ZBook Ultra G1a A3ZQ0ET | |
| Lenovo ThinkPad P14s Gen 6 21RV0017GE | |
| Moyenne de la classe Workstation (189.2 - 315, n=25, 2 dernières années) | |
| Dell Precision 5000 5490 | |
| HP ZBook Firefly 14 G11 | |
| Mozilla Kraken 1.1 / Total | |
| Dell Precision 5000 5490 | |
| HP ZBook Firefly 14 G11 | |
| Moyenne de la classe Workstation (424 - 571, n=27, 2 dernières années) | |
| HP ZBook 8 G1i 14, RTX 500 | |
| Moyenne Intel Core Ultra 7 265H, Nvidia RTX 500 Ada Generation Laptop GPU (n=1) | |
| Lenovo ThinkPad P14s Gen 6 21RV0017GE | |
| HP ZBook 8 G1i 14 | |
| HP ZBook Ultra G1a A3ZQ0ET | |
* ... Moindre est la valeur, meilleures sont les performances
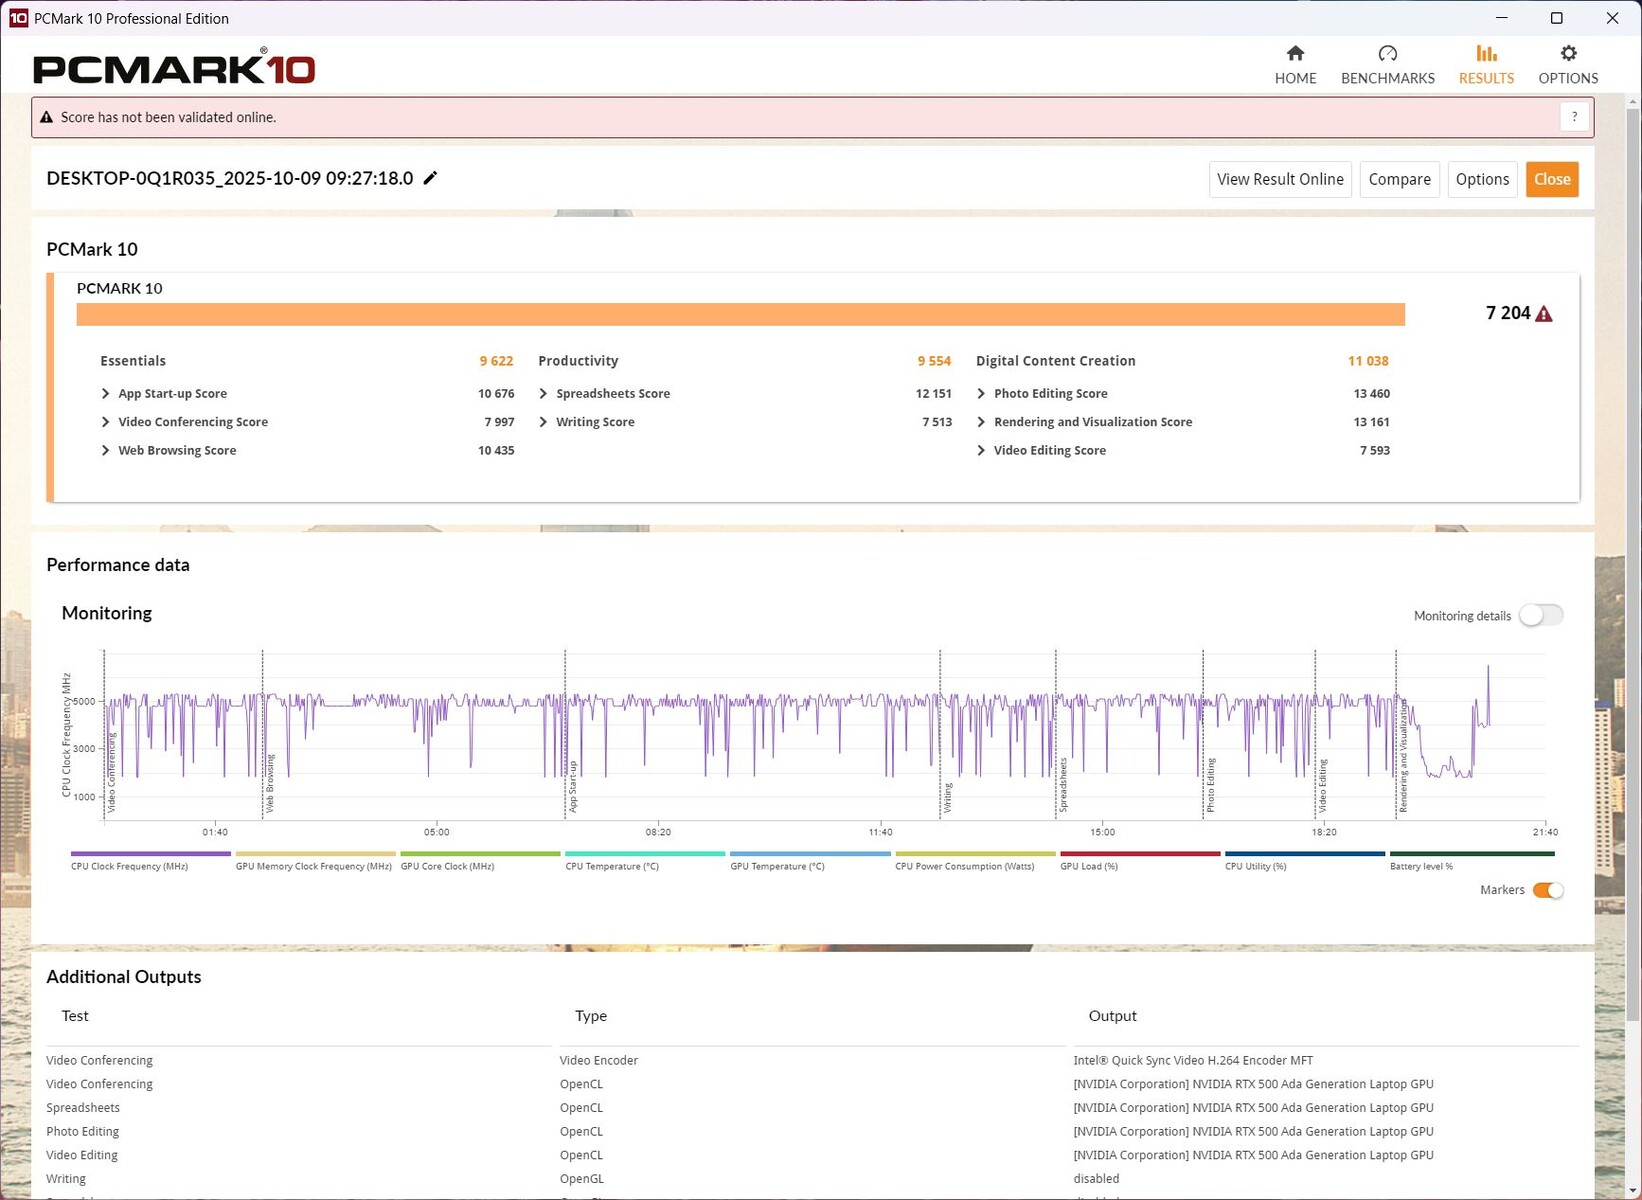
| PCMark 10 Score | 7204 points | |
Aide | ||
| AIDA64 / Memory Copy | |
| HP ZBook Ultra G1a A3ZQ0ET | |
| Dell Precision 5000 5490 | |
| HP ZBook 8 G1i 14 | |
| HP ZBook 8 G1i 14, RTX 500 | |
| Moyenne Intel Core Ultra 7 265H (n=1) | |
| Moyenne de la classe Workstation (34323 - 164795, n=27, 2 dernières années) | |
| HP ZBook Firefly 14 G11 | |
| Lenovo ThinkPad P14s Gen 6 21RV0017GE | |
| AIDA64 / Memory Read | |
| HP ZBook Ultra G1a A3ZQ0ET | |
| HP ZBook 8 G1i 14 | |
| Dell Precision 5000 5490 | |
| Lenovo ThinkPad P14s Gen 6 21RV0017GE | |
| HP ZBook 8 G1i 14, RTX 500 | |
| Moyenne Intel Core Ultra 7 265H (n=1) | |
| HP ZBook Firefly 14 G11 | |
| Moyenne de la classe Workstation (30787 - 121563, n=27, 2 dernières années) | |
| AIDA64 / Memory Write | |
| HP ZBook Ultra G1a A3ZQ0ET | |
| Dell Precision 5000 5490 | |
| Moyenne de la classe Workstation (39362 - 214520, n=27, 2 dernières années) | |
| Lenovo ThinkPad P14s Gen 6 21RV0017GE | |
| HP ZBook 8 G1i 14, RTX 500 | |
| Moyenne Intel Core Ultra 7 265H (n=1) | |
| HP ZBook 8 G1i 14 | |
| HP ZBook Firefly 14 G11 | |
| AIDA64 / Memory Latency | |
| HP ZBook Ultra G1a A3ZQ0ET | |
| Dell Precision 5000 5490 | |
| HP ZBook Firefly 14 G11 | |
| Moyenne de la classe Workstation (84.5 - 165.2, n=27, 2 dernières années) | |
| HP ZBook 8 G1i 14 | |
| HP ZBook 8 G1i 14, RTX 500 | |
| Moyenne Intel Core Ultra 7 265H (n=1) | |
| Lenovo ThinkPad P14s Gen 6 21RV0017GE | |
* ... Moindre est la valeur, meilleures sont les performances
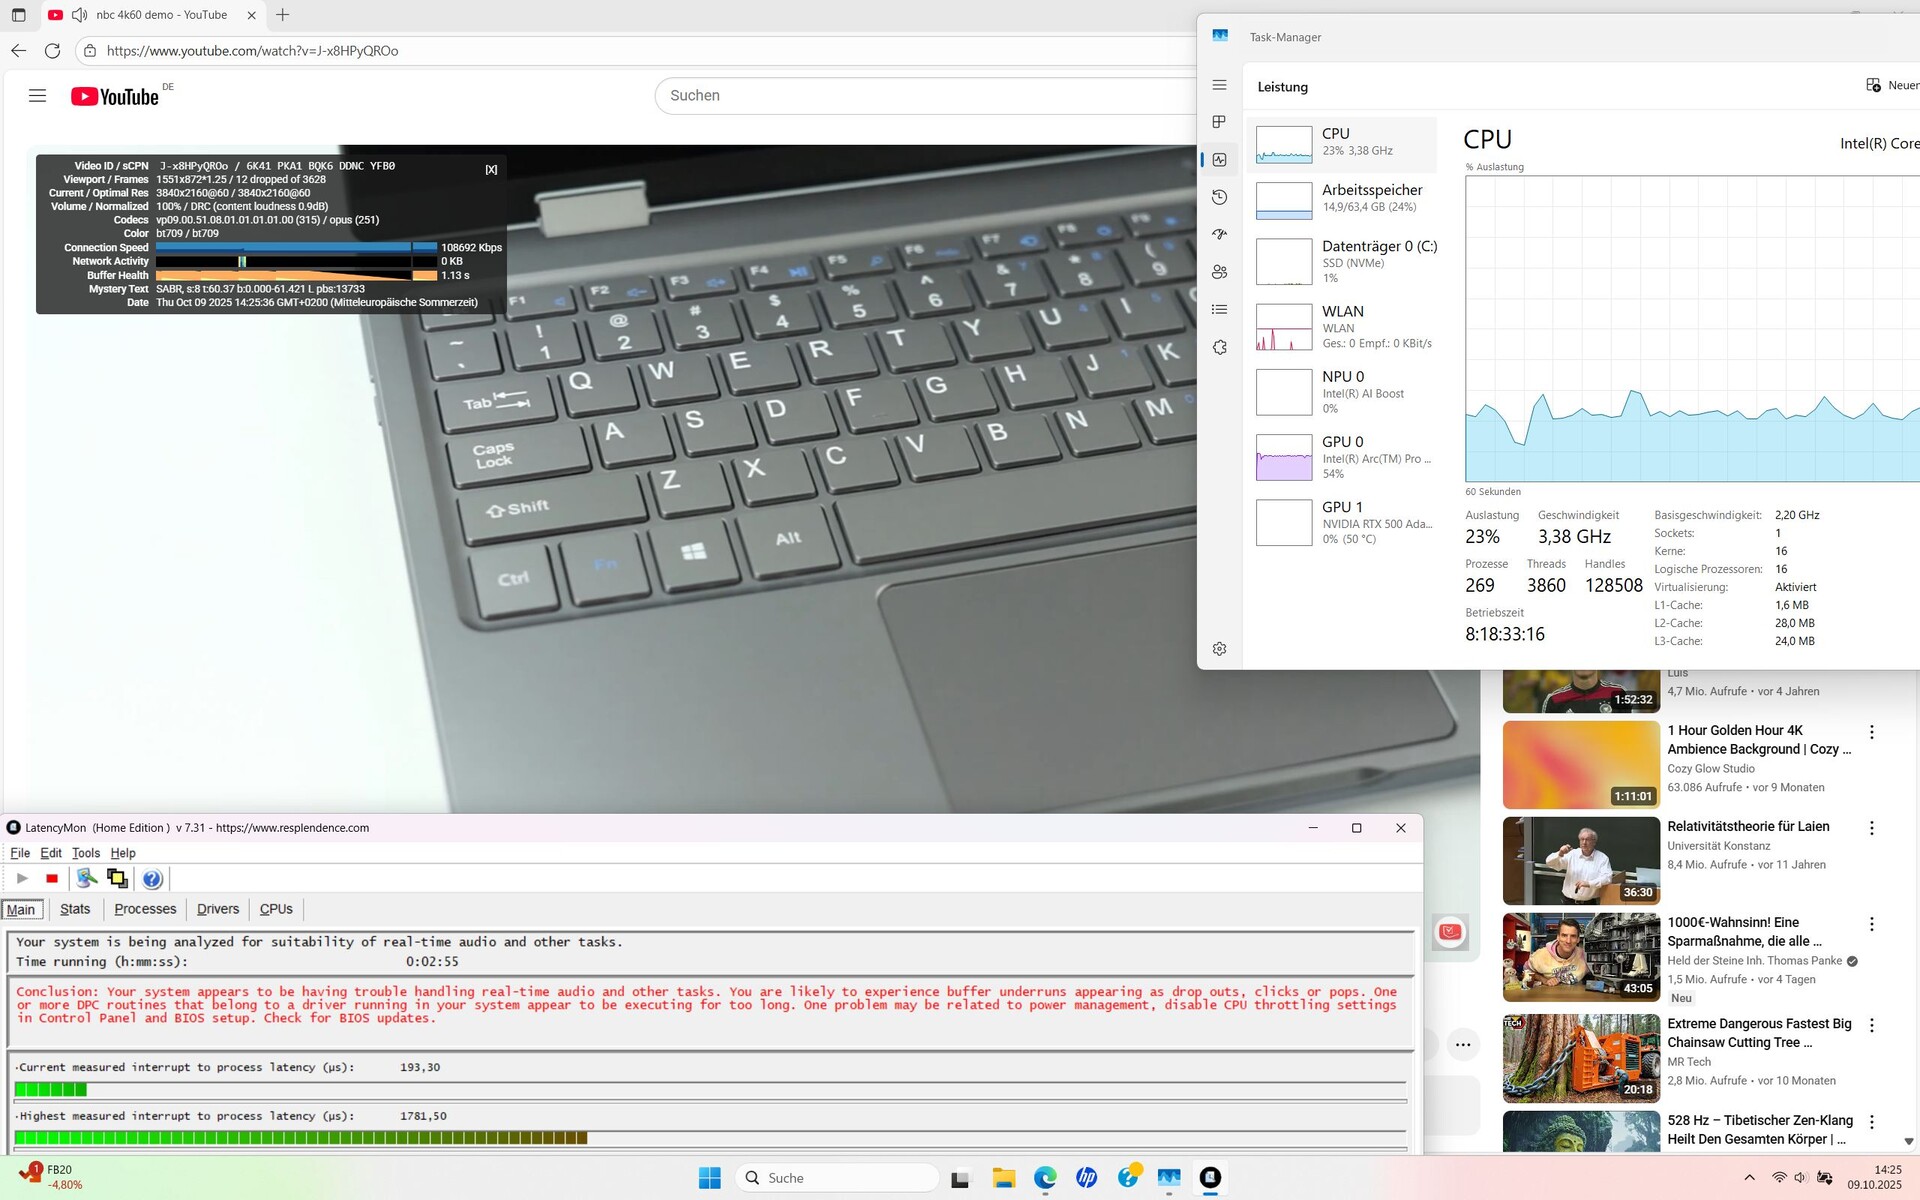
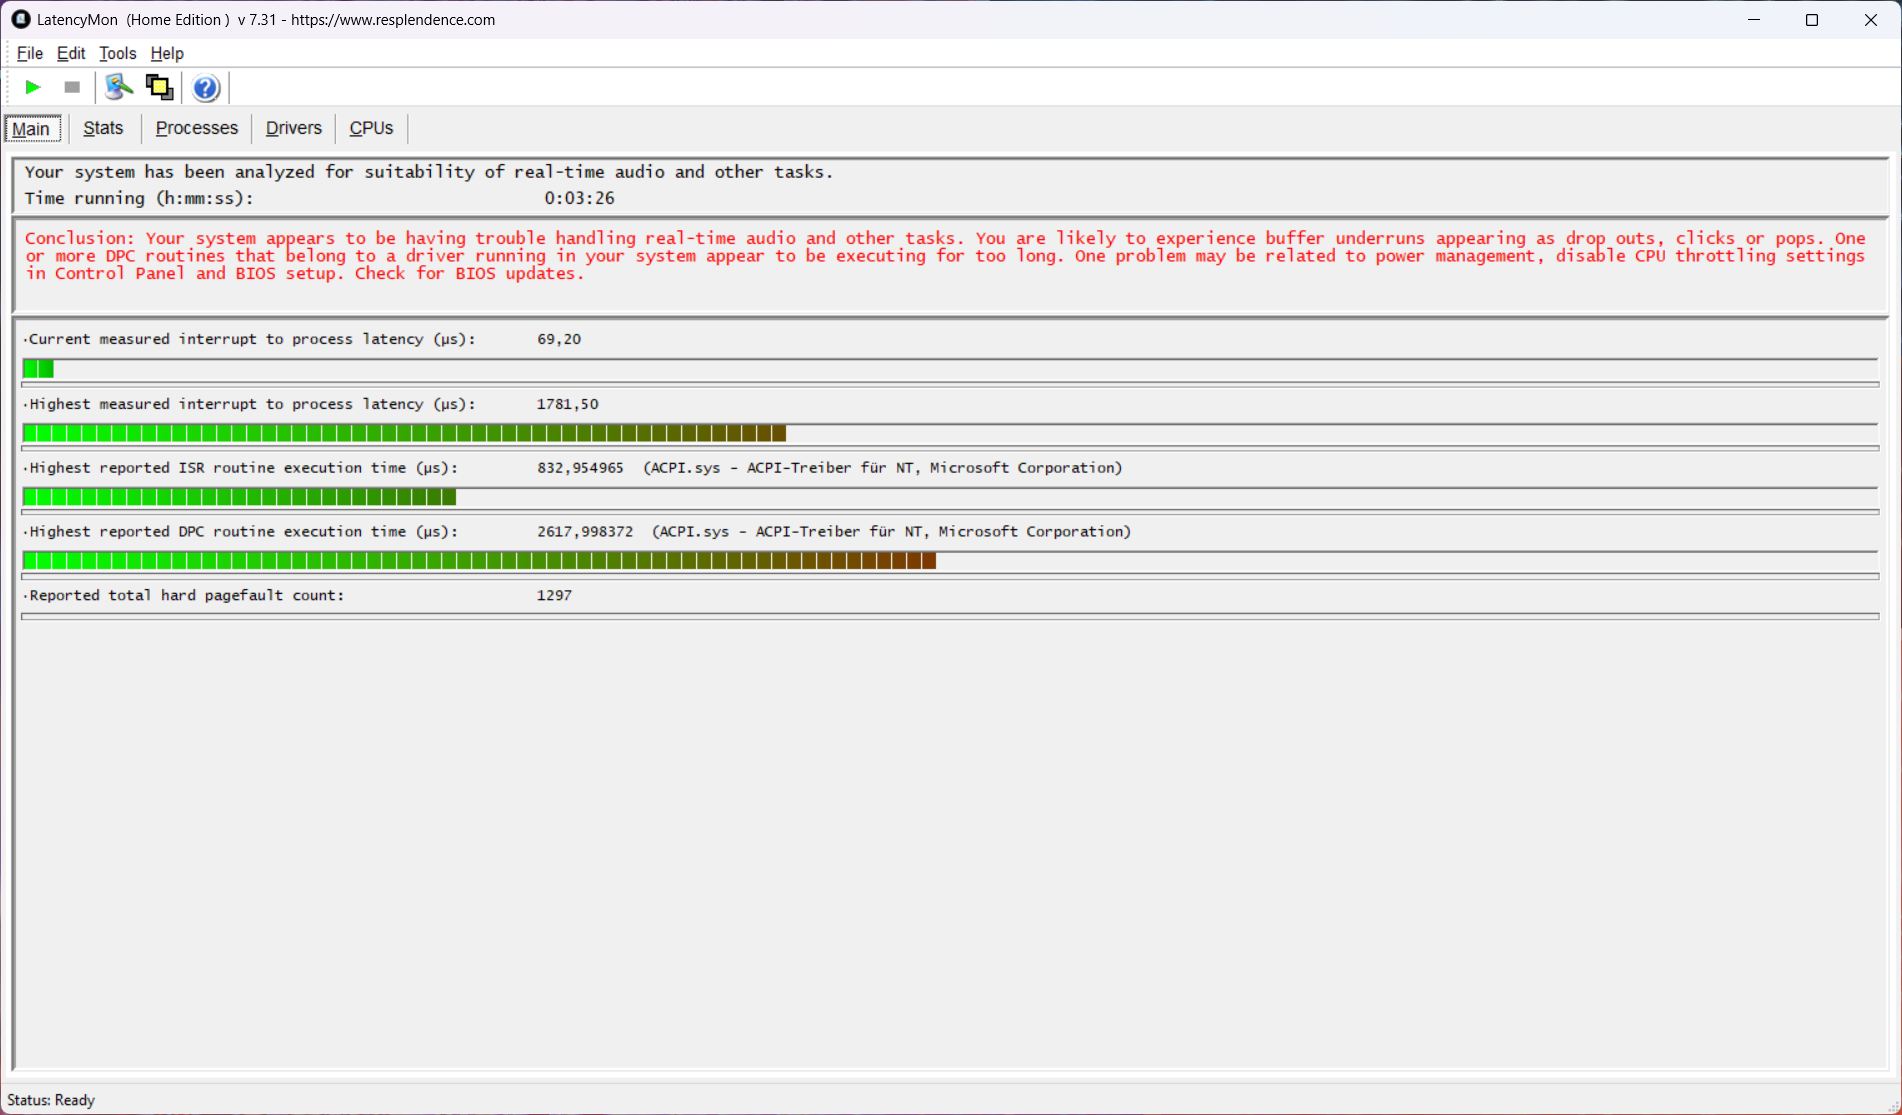
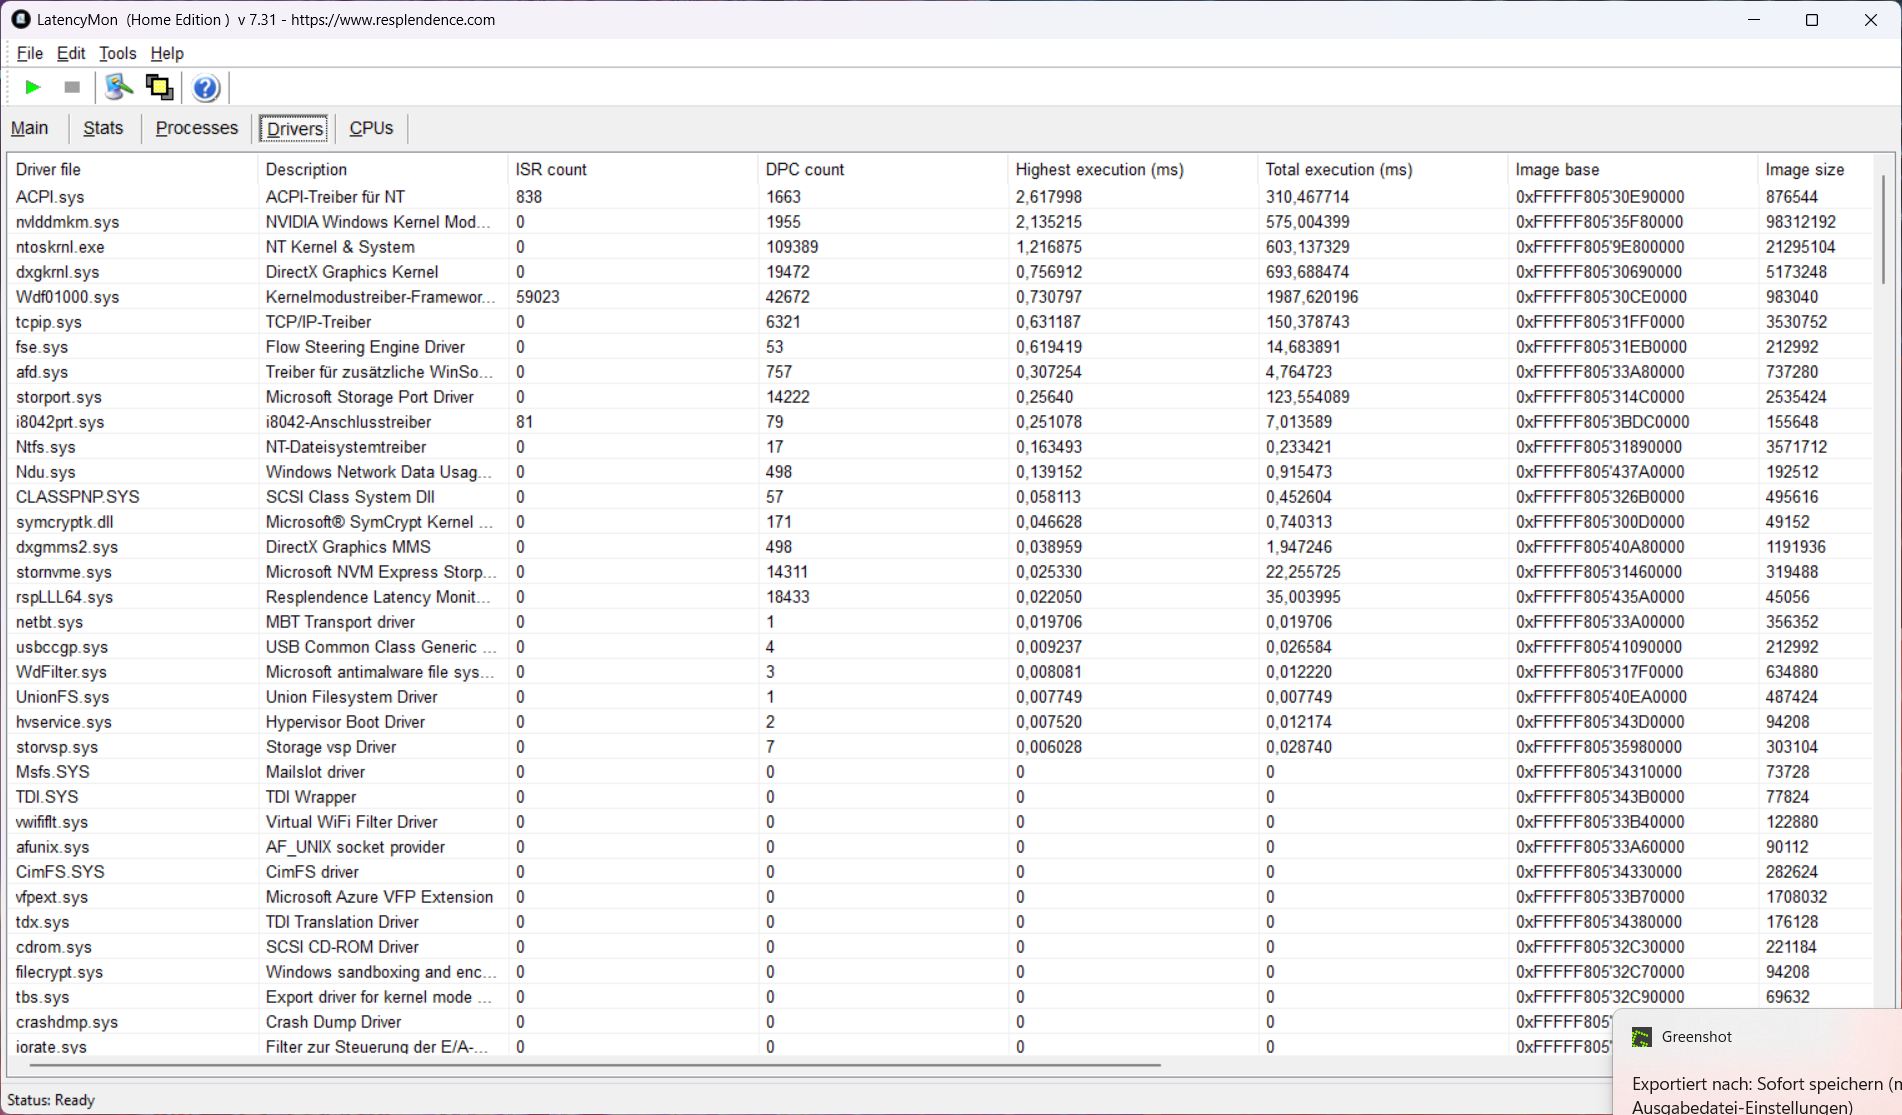
Latences DPC
L'ouverture du navigateur provoque des pics de latence initiaux, qui augmentent pendant la lecture de notre vidéo de test YouTube. La vidéo présente également 12 images perdues. Pour une station de travail, ces résultats ne sont pas optimaux, bien que plusieurs concurrents affichent des performances similaires.
| DPC Latencies / LatencyMon - interrupt to process latency (max), Web, Youtube, Prime95 | |
| HP ZBook Firefly 14 G11 | |
| Dell Precision 5000 5490 | |
| HP ZBook 8 G1i 14, RTX 500 | |
| HP ZBook Ultra G1a A3ZQ0ET | |
| HP ZBook 8 G1i 14 | |
| Lenovo ThinkPad P14s Gen 6 21RV0017GE | |
* ... Moindre est la valeur, meilleures sont les performances
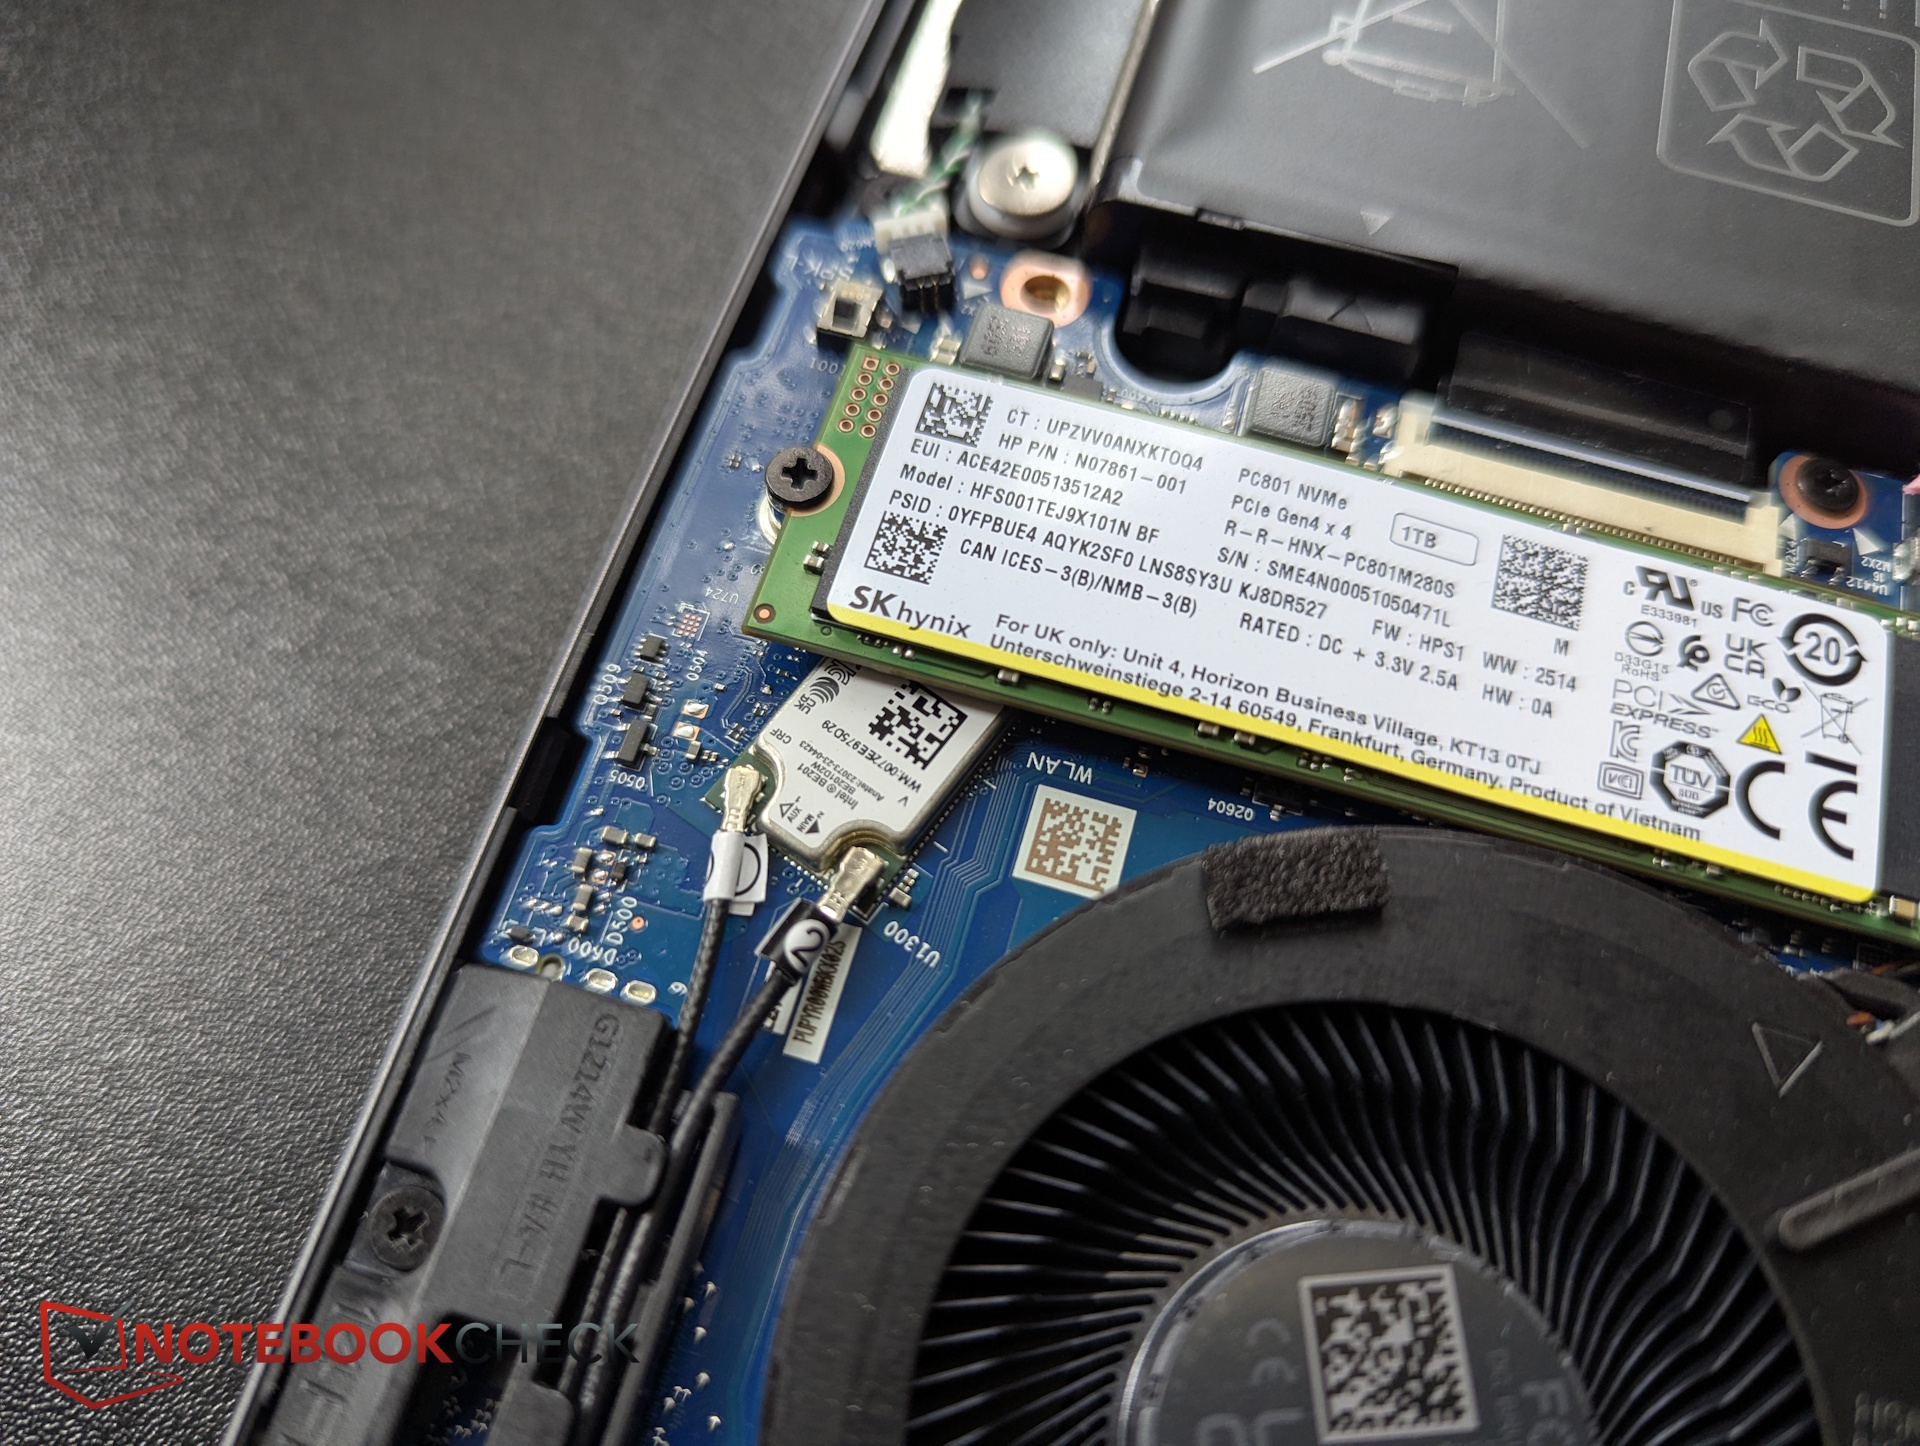
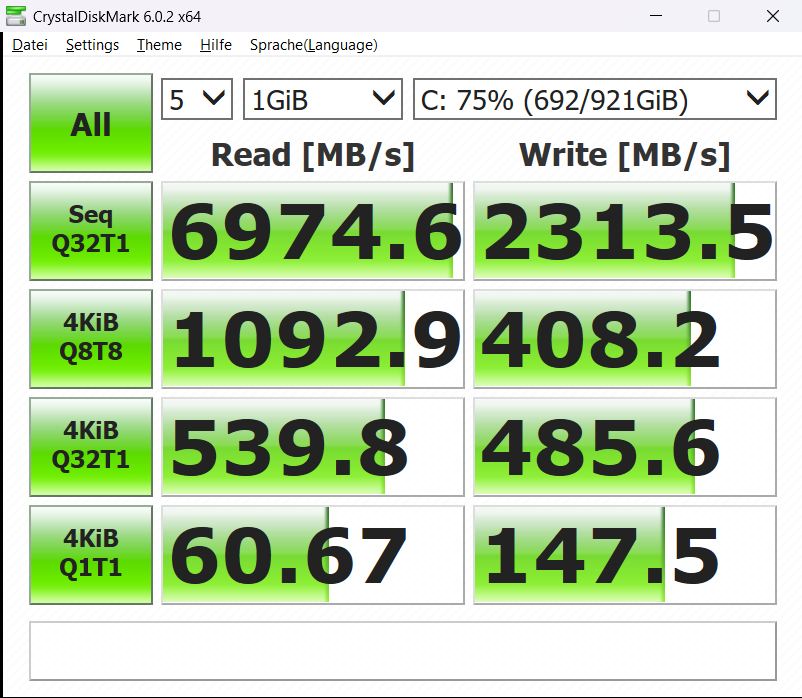
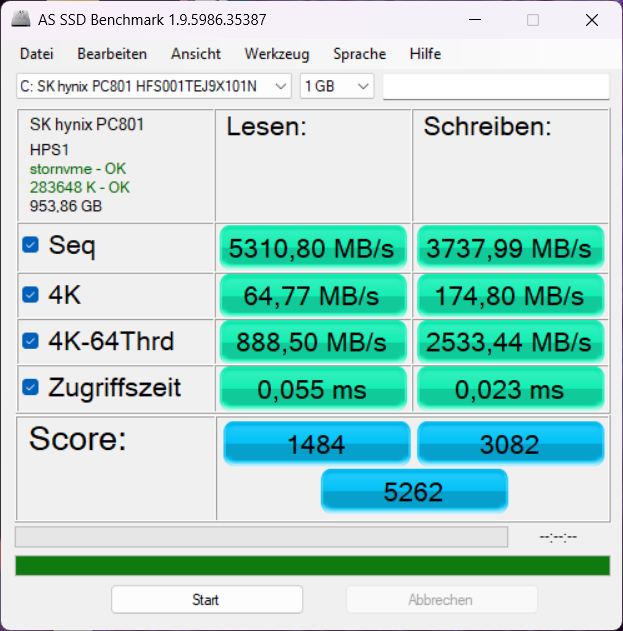
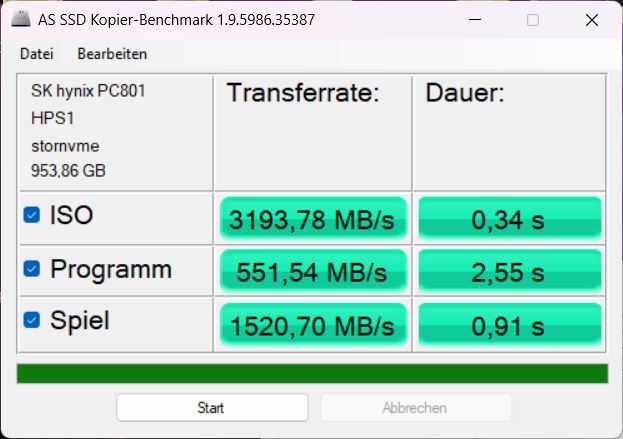
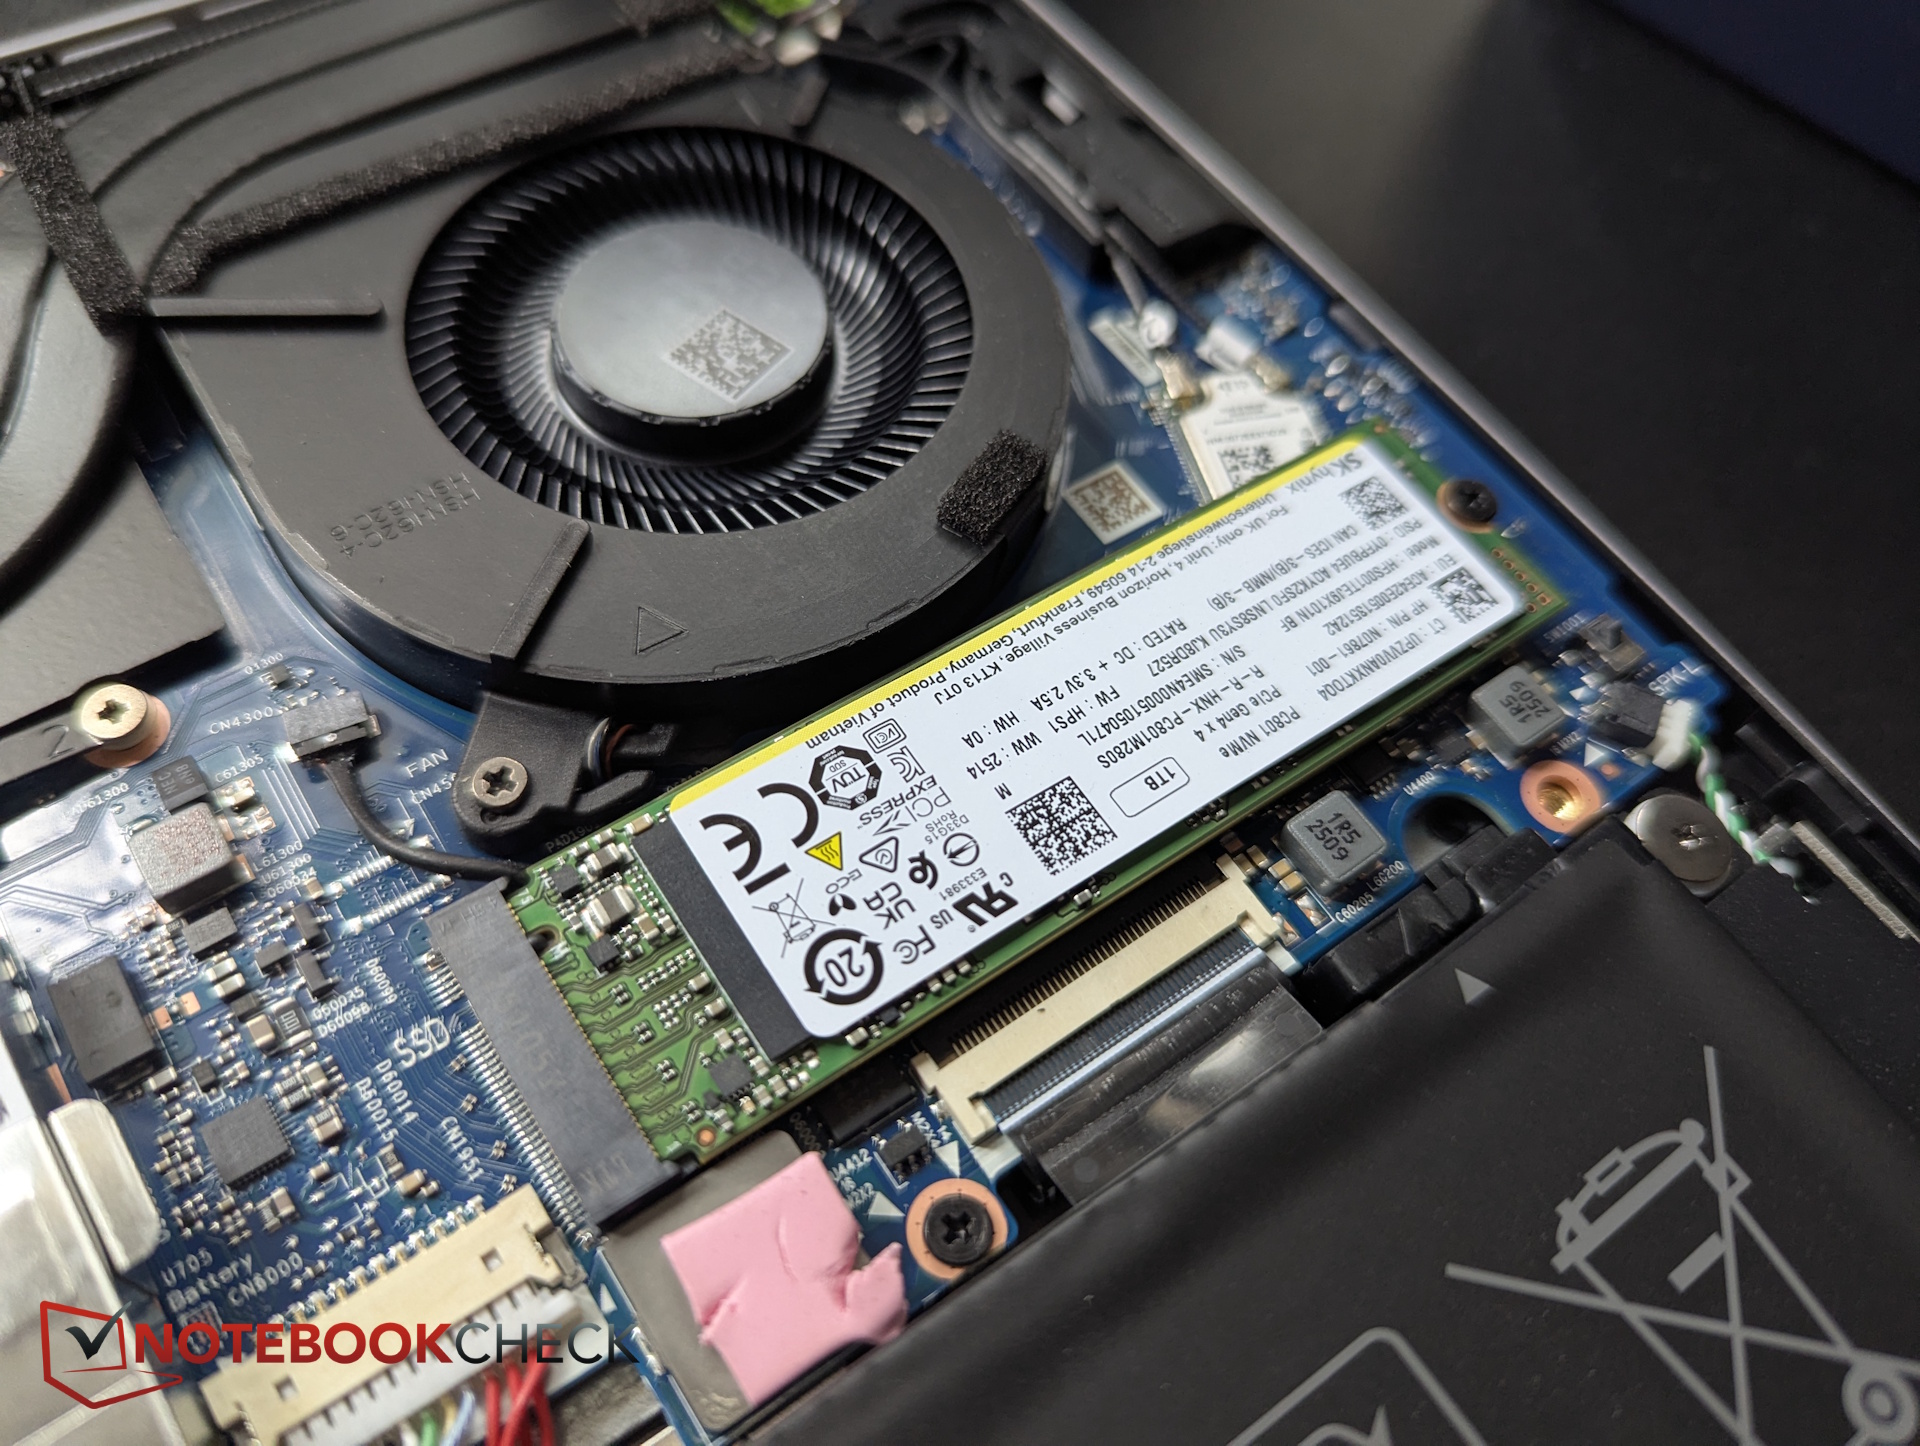
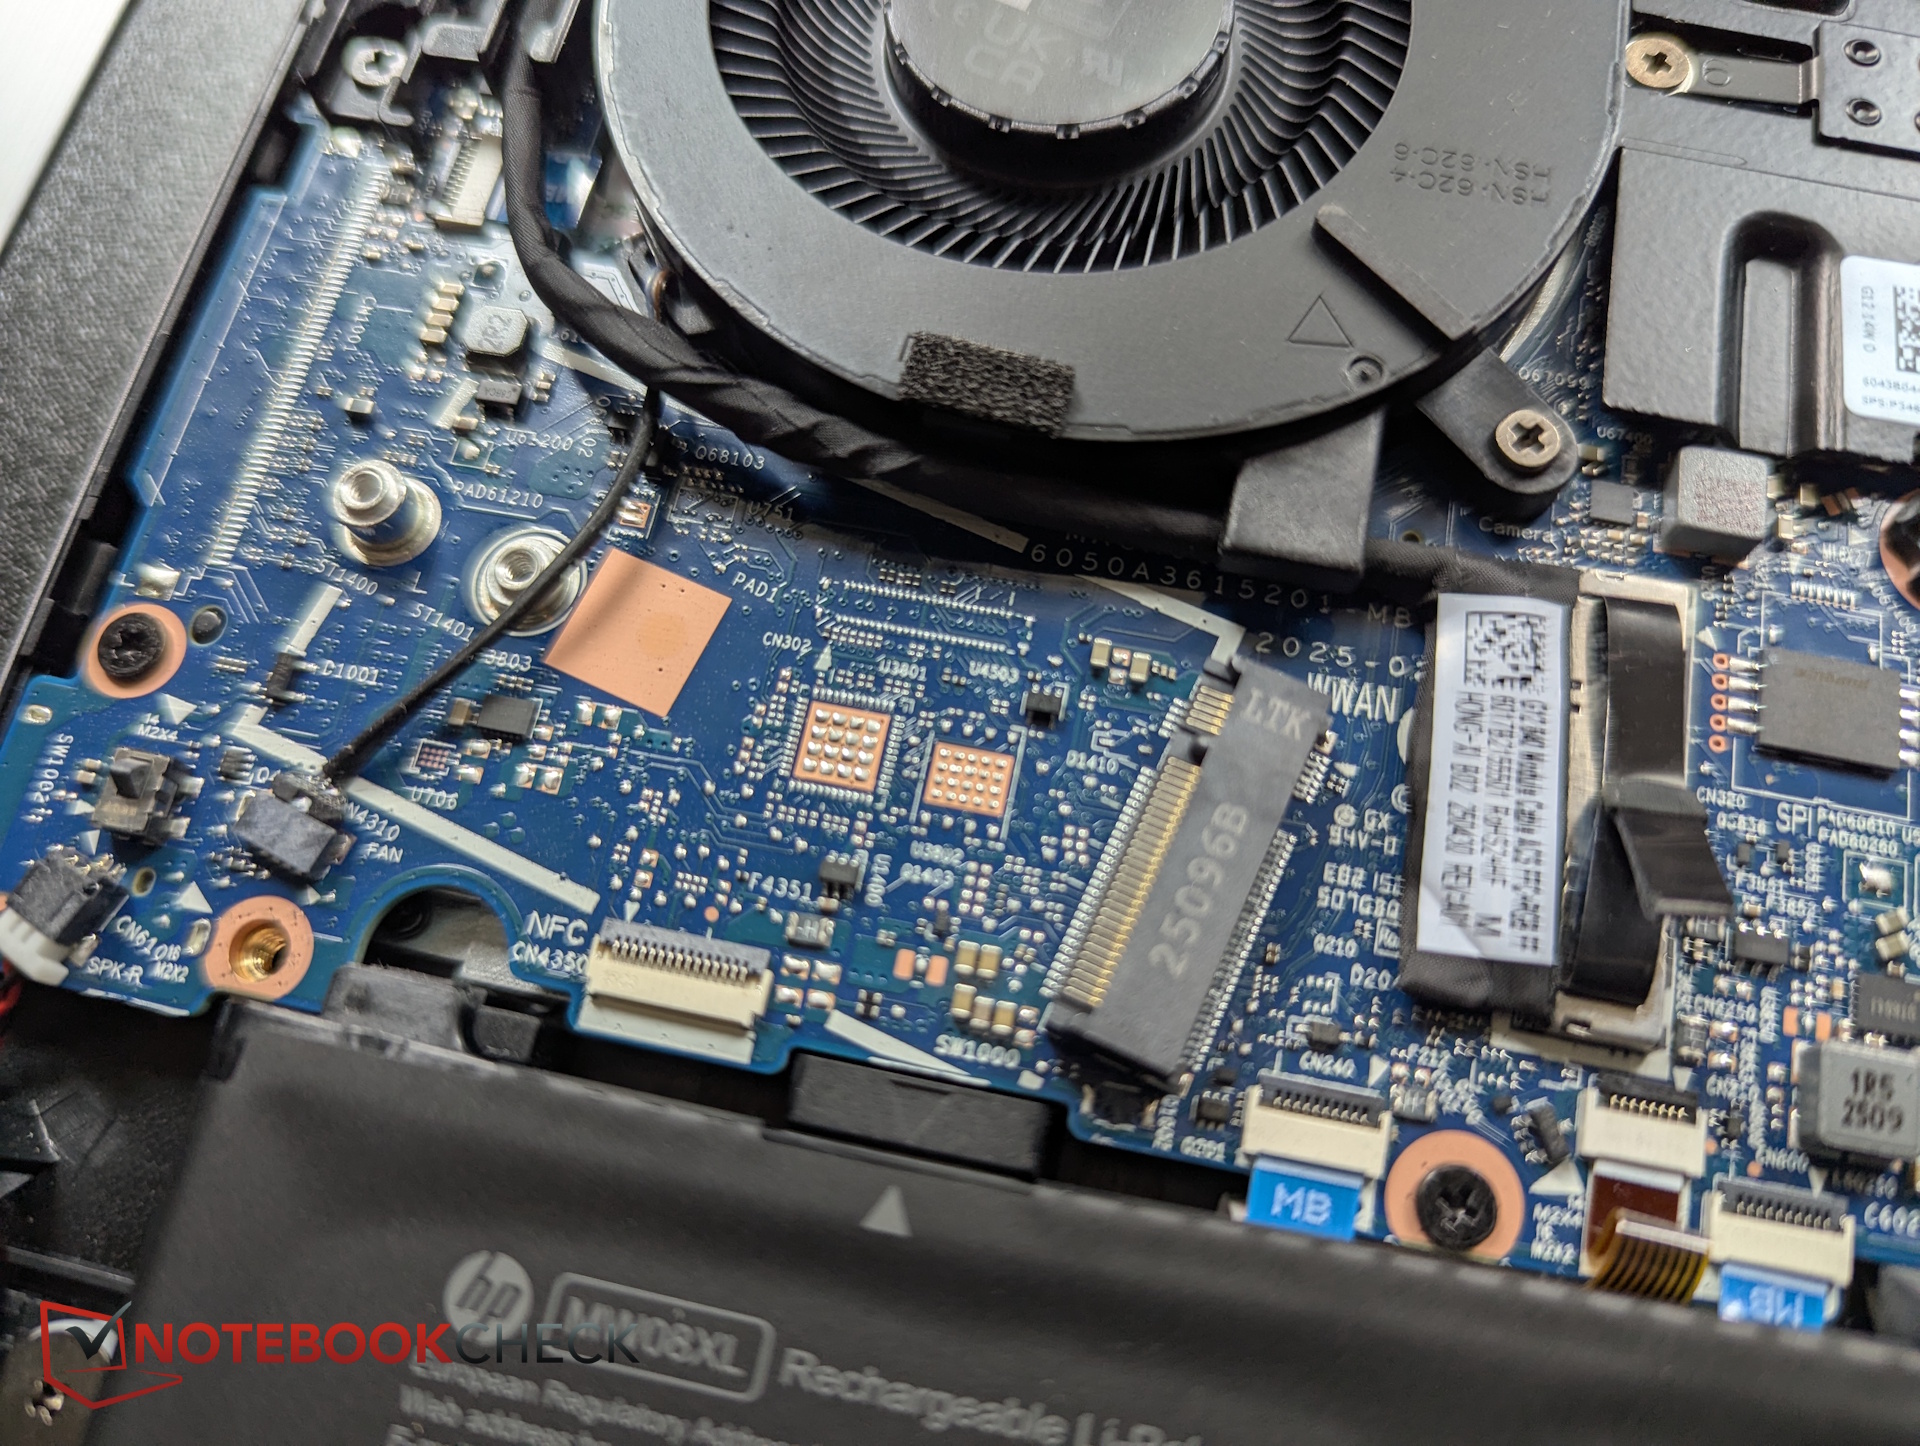
Stockage
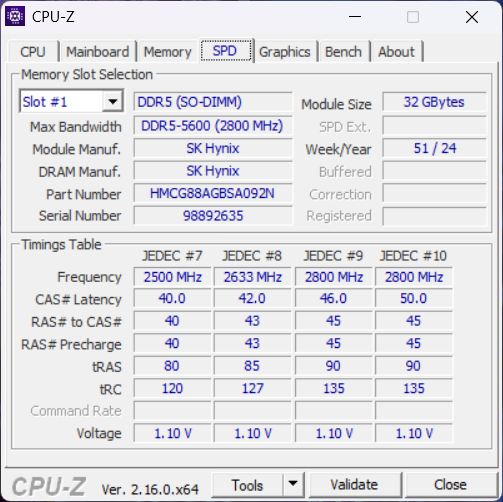
HP utilise un disque SSD SK Hynix de 1 To avec PCIe 4×4, qui, malheureusement, subit un étranglement thermique au fil du temps.

* ... Moindre est la valeur, meilleures sont les performances
Performances en lecture continue : Boucle de lecture DiskSpd, profondeur de la file d'attente 8
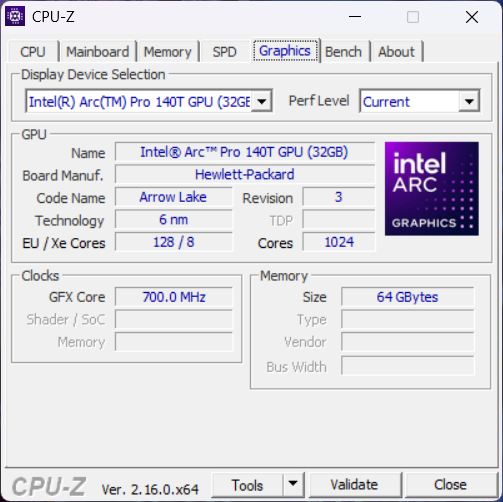
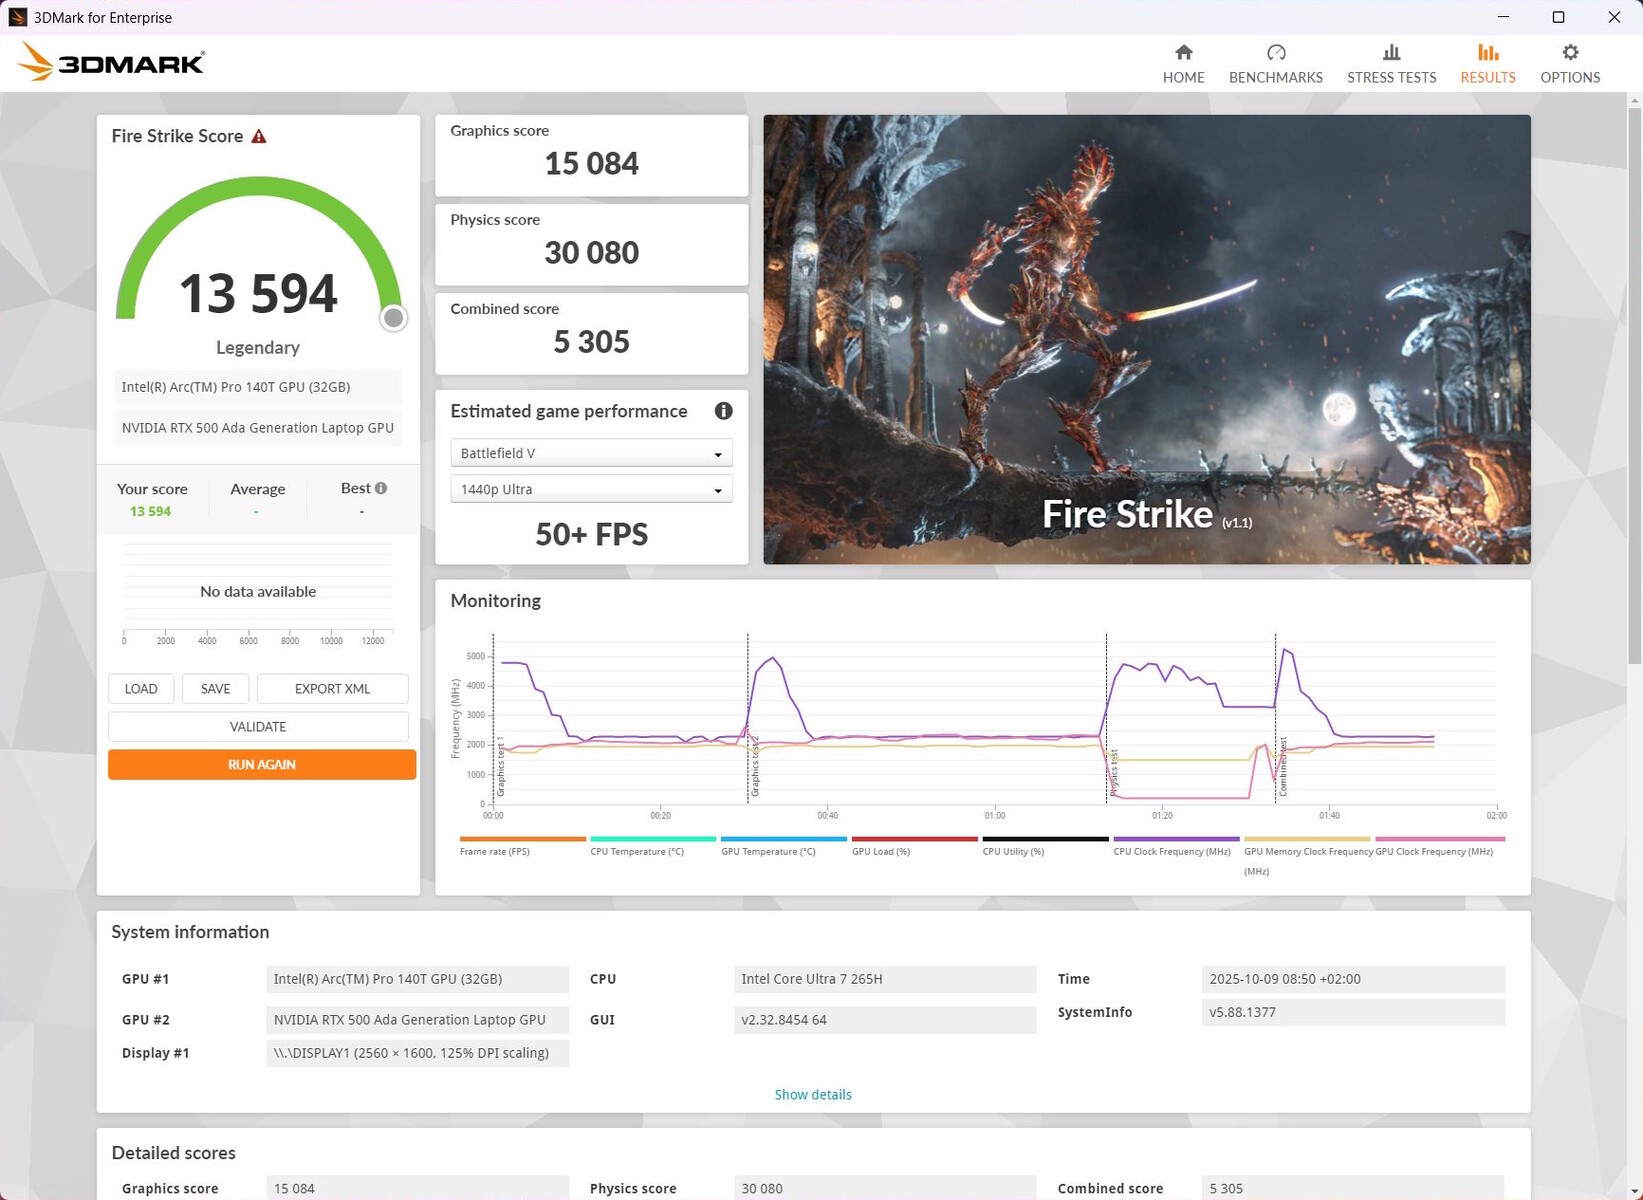
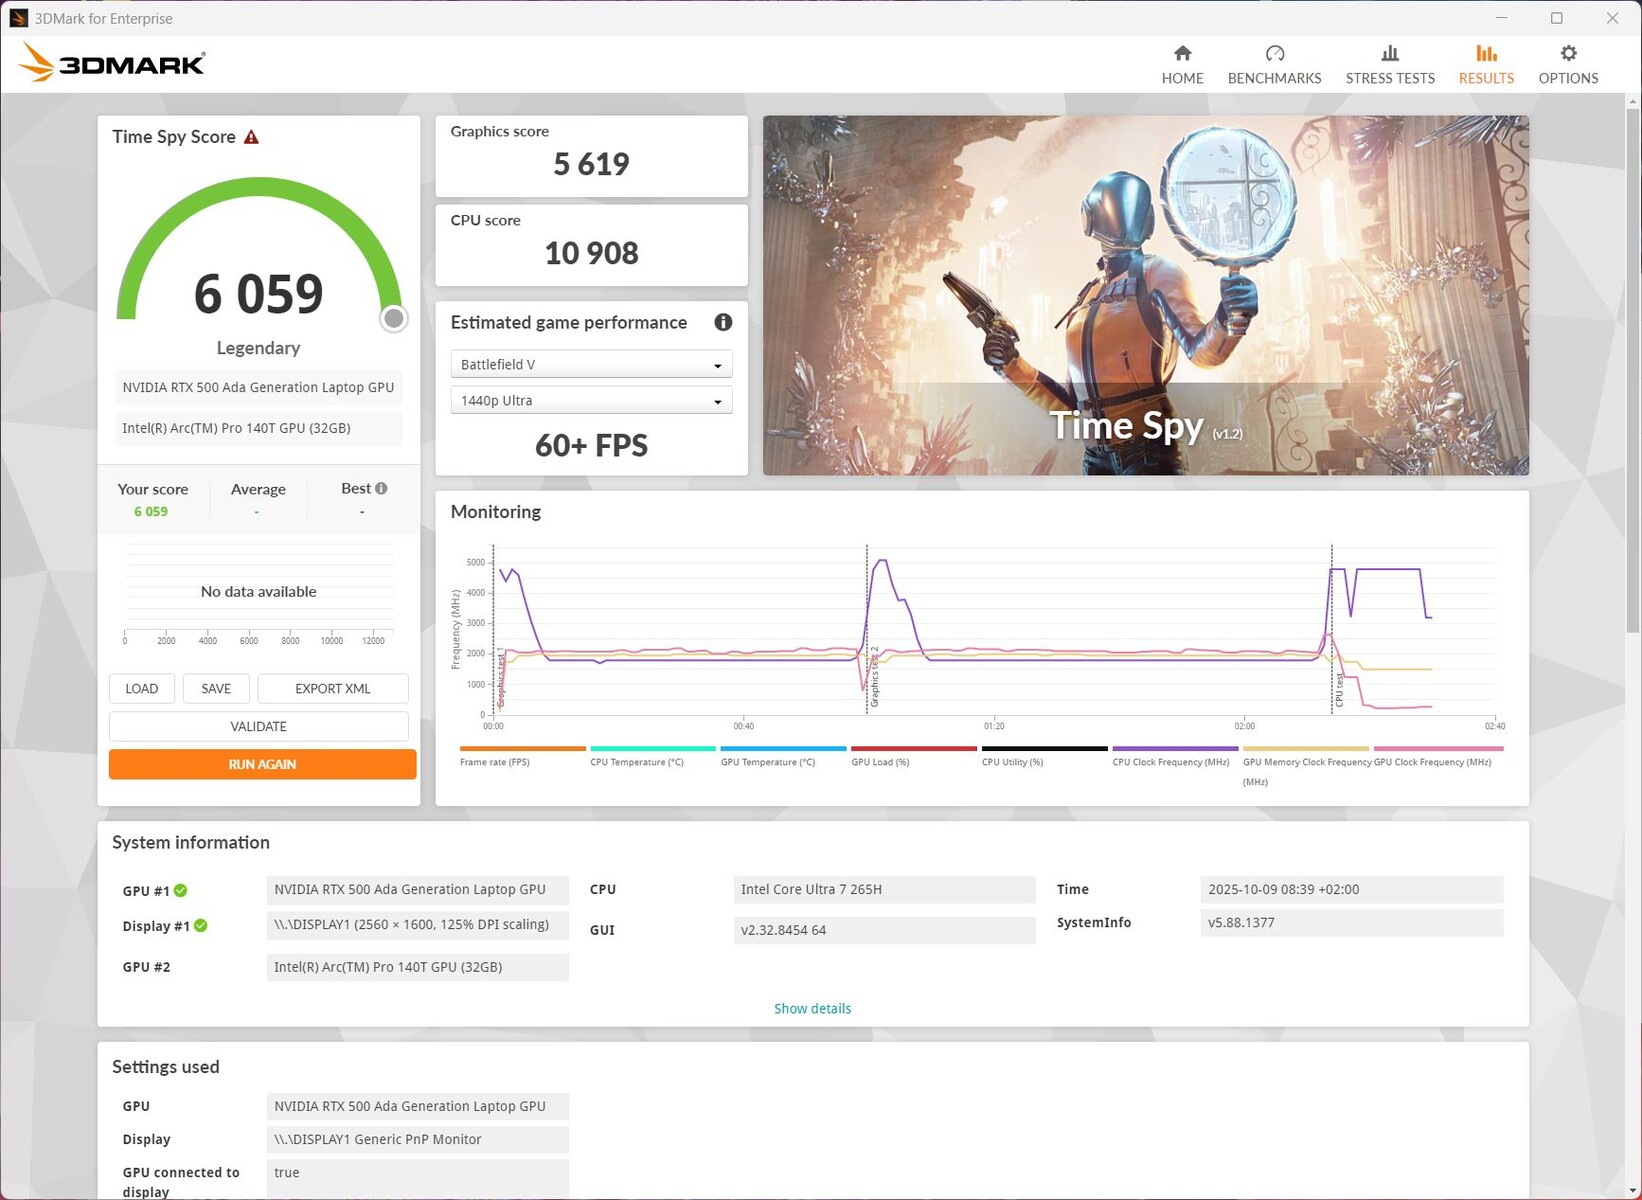
Performance du GPU
La Nvidia RTX 500un GPU professionnel d'entrée de gamme, obtient des résultats légèrement supérieurs à la moyenne dans les tests 3DMark, mais n'arrive pas à la cheville de l'impressionnante Radeon 8050S intégrée dans le ZBook Ultra. Le Yoga Pro 7 14 de Lenovo avec la RTX 4050 est également plus rapide.
Les jeux sont possibles avec la RTX 500, qui est probablement basée sur une version réduite de la RTX 4050 (environ 20 à 25 % plus rapide), mais seulement en Full HD et avec des paramètres moyens. Ses 4 Go de mémoire vidéo ne sont plus tout à fait à jour pour les jeux modernes. Avec la qualité DLSS activée, le taux de rafraîchissement dans Baldur's Gate 3 peut être augmenté d'environ 53 à 75 fps (Full HD). Dans le test à long terme Cyberpunk 2077, les performances restent très constantes.
Lorsque le jeu fonctionne sur batterie, les performances du GPU chutent d'environ 30 %.
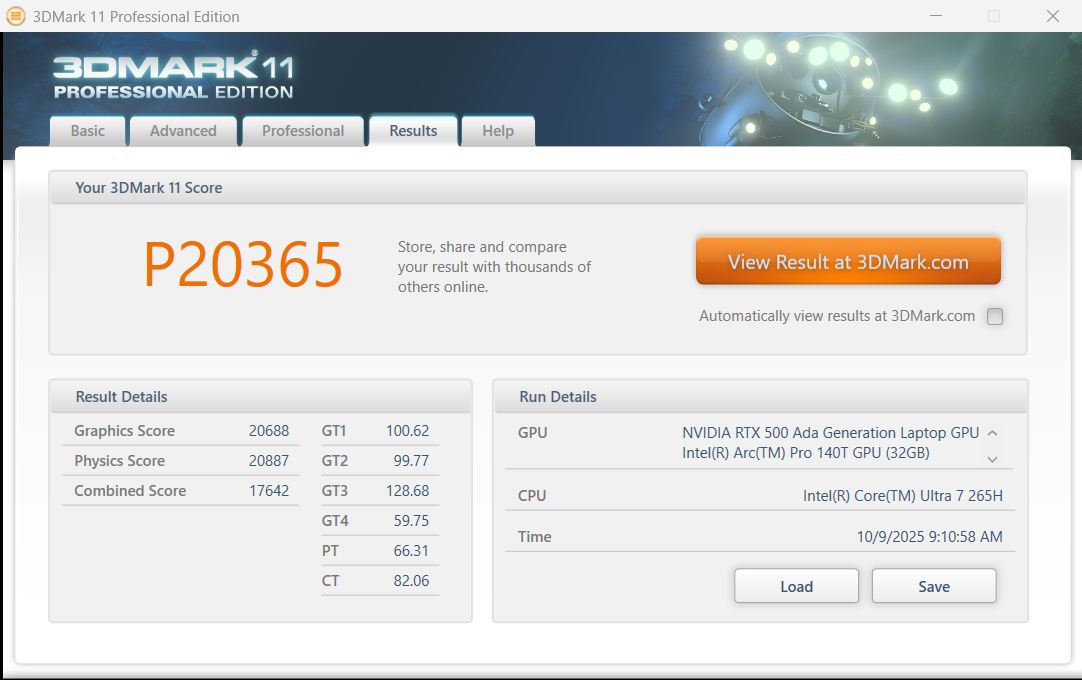
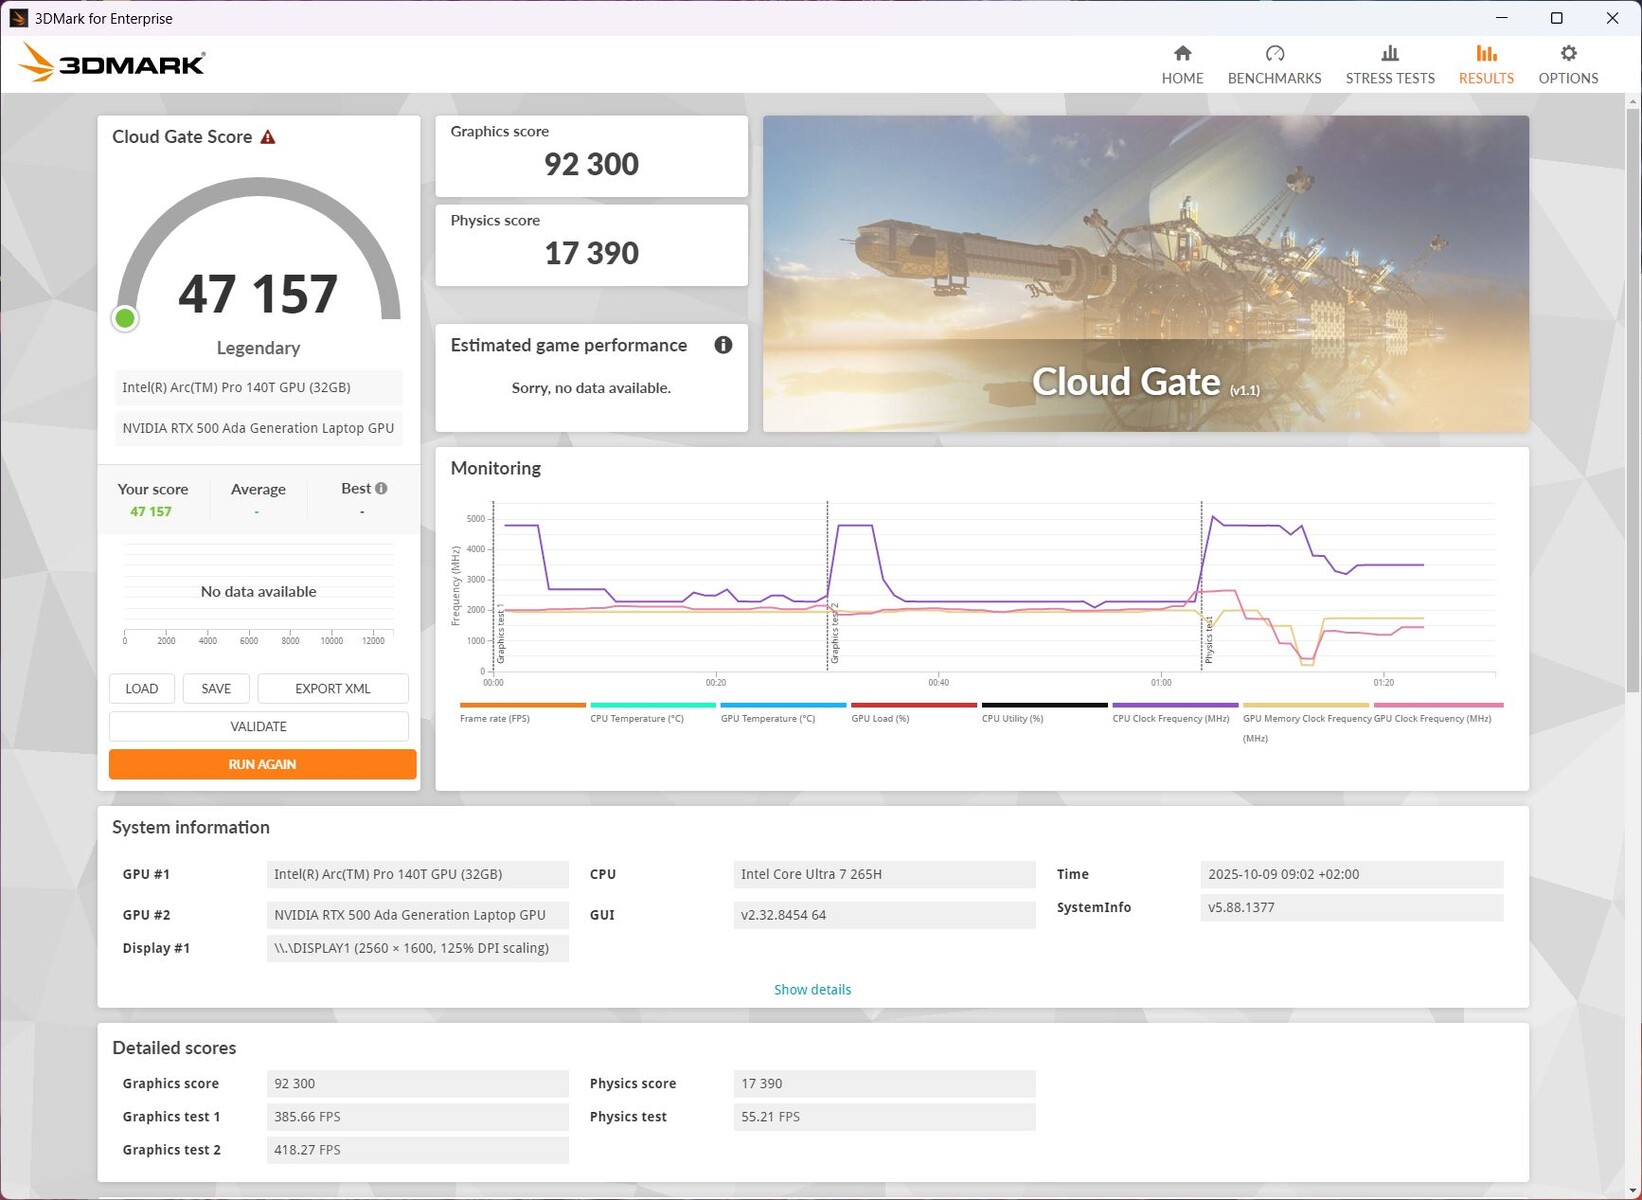
| 3DMark 11 Performance | 20365 points | |
| 3DMark Cloud Gate Standard Score | 47157 points | |
| 3DMark Fire Strike Score | 13594 points | |
| 3DMark Time Spy Score | 6059 points | |
Aide | ||
* ... Moindre est la valeur, meilleures sont les performances
| Cyberpunk 2077 2.2 Phantom Liberty - 1920x1080 Ultra Preset (FSR off) | |
| HP ZBook Ultra G1a A3ZQ0ET | |
| Moyenne de la classe Workstation (19.6 - 144, n=24, 2 dernières années) | |
| Dell Precision 5000 5490 | |
| Lenovo Yoga Pro 7 14IMH9, RTX 4050 | |
| HP ZBook 8 G1i 14, RTX 500 | |
| Lenovo ThinkPad P14s Gen 6 21RV0017GE | |
| HP ZBook 8 G1i 14 | |
| HP ZBook Firefly 14 G11 | |
| GTA V - 1920x1080 Highest Settings possible AA:4xMSAA + FX AF:16x | |
| Lenovo Yoga Pro 7 14IMH9, RTX 4050 | |
| Moyenne de la classe Workstation (18.1 - 145.6, n=24, 2 dernières années) | |
| HP ZBook Ultra G1a A3ZQ0ET | |
| HP ZBook 8 G1i 14, RTX 500 | |
| Lenovo ThinkPad P14s Gen 6 21RV0017GE | |
| HP ZBook 8 G1i 14 | |
| Strange Brigade - 1920x1080 ultra AA:ultra AF:16 | |
| Moyenne de la classe Workstation (46.9 - 368, n=21, 2 dernières années) | |
| HP ZBook Ultra G1a A3ZQ0ET | |
| Dell Precision 5000 5490 | |
| Lenovo Yoga Pro 7 14IMH9, RTX 4050 | |
| HP ZBook 8 G1i 14, RTX 500 | |
| HP ZBook Firefly 14 G11 | |
Cyberpunk 2077 ultra FPS chart
| Bas | Moyen | Élevé | Ultra | |
|---|---|---|---|---|
| GTA V (2015) | 183.8 | 178.9 | 139.1 | 69.7 |
| Dota 2 Reborn (2015) | 178 | 163.3 | 145.6 | 136 |
| Final Fantasy XV Benchmark (2018) | 148.5 | 77.8 | 57.1 | |
| X-Plane 11.11 (2018) | 98 | 79.4 | 67 | |
| Strange Brigade (2018) | 333 | 129.6 | 106.7 | 93.2 |
| Baldur's Gate 3 (2023) | 79.6 | 61.9 | 54.9 | 53.1 |
| Cyberpunk 2077 2.2 Phantom Liberty (2023) | 72.8 | 55.5 | 45.6 | 39.6 |
| F1 25 (2025) | 130 | 96.9 | 73.6 | 7.44 |
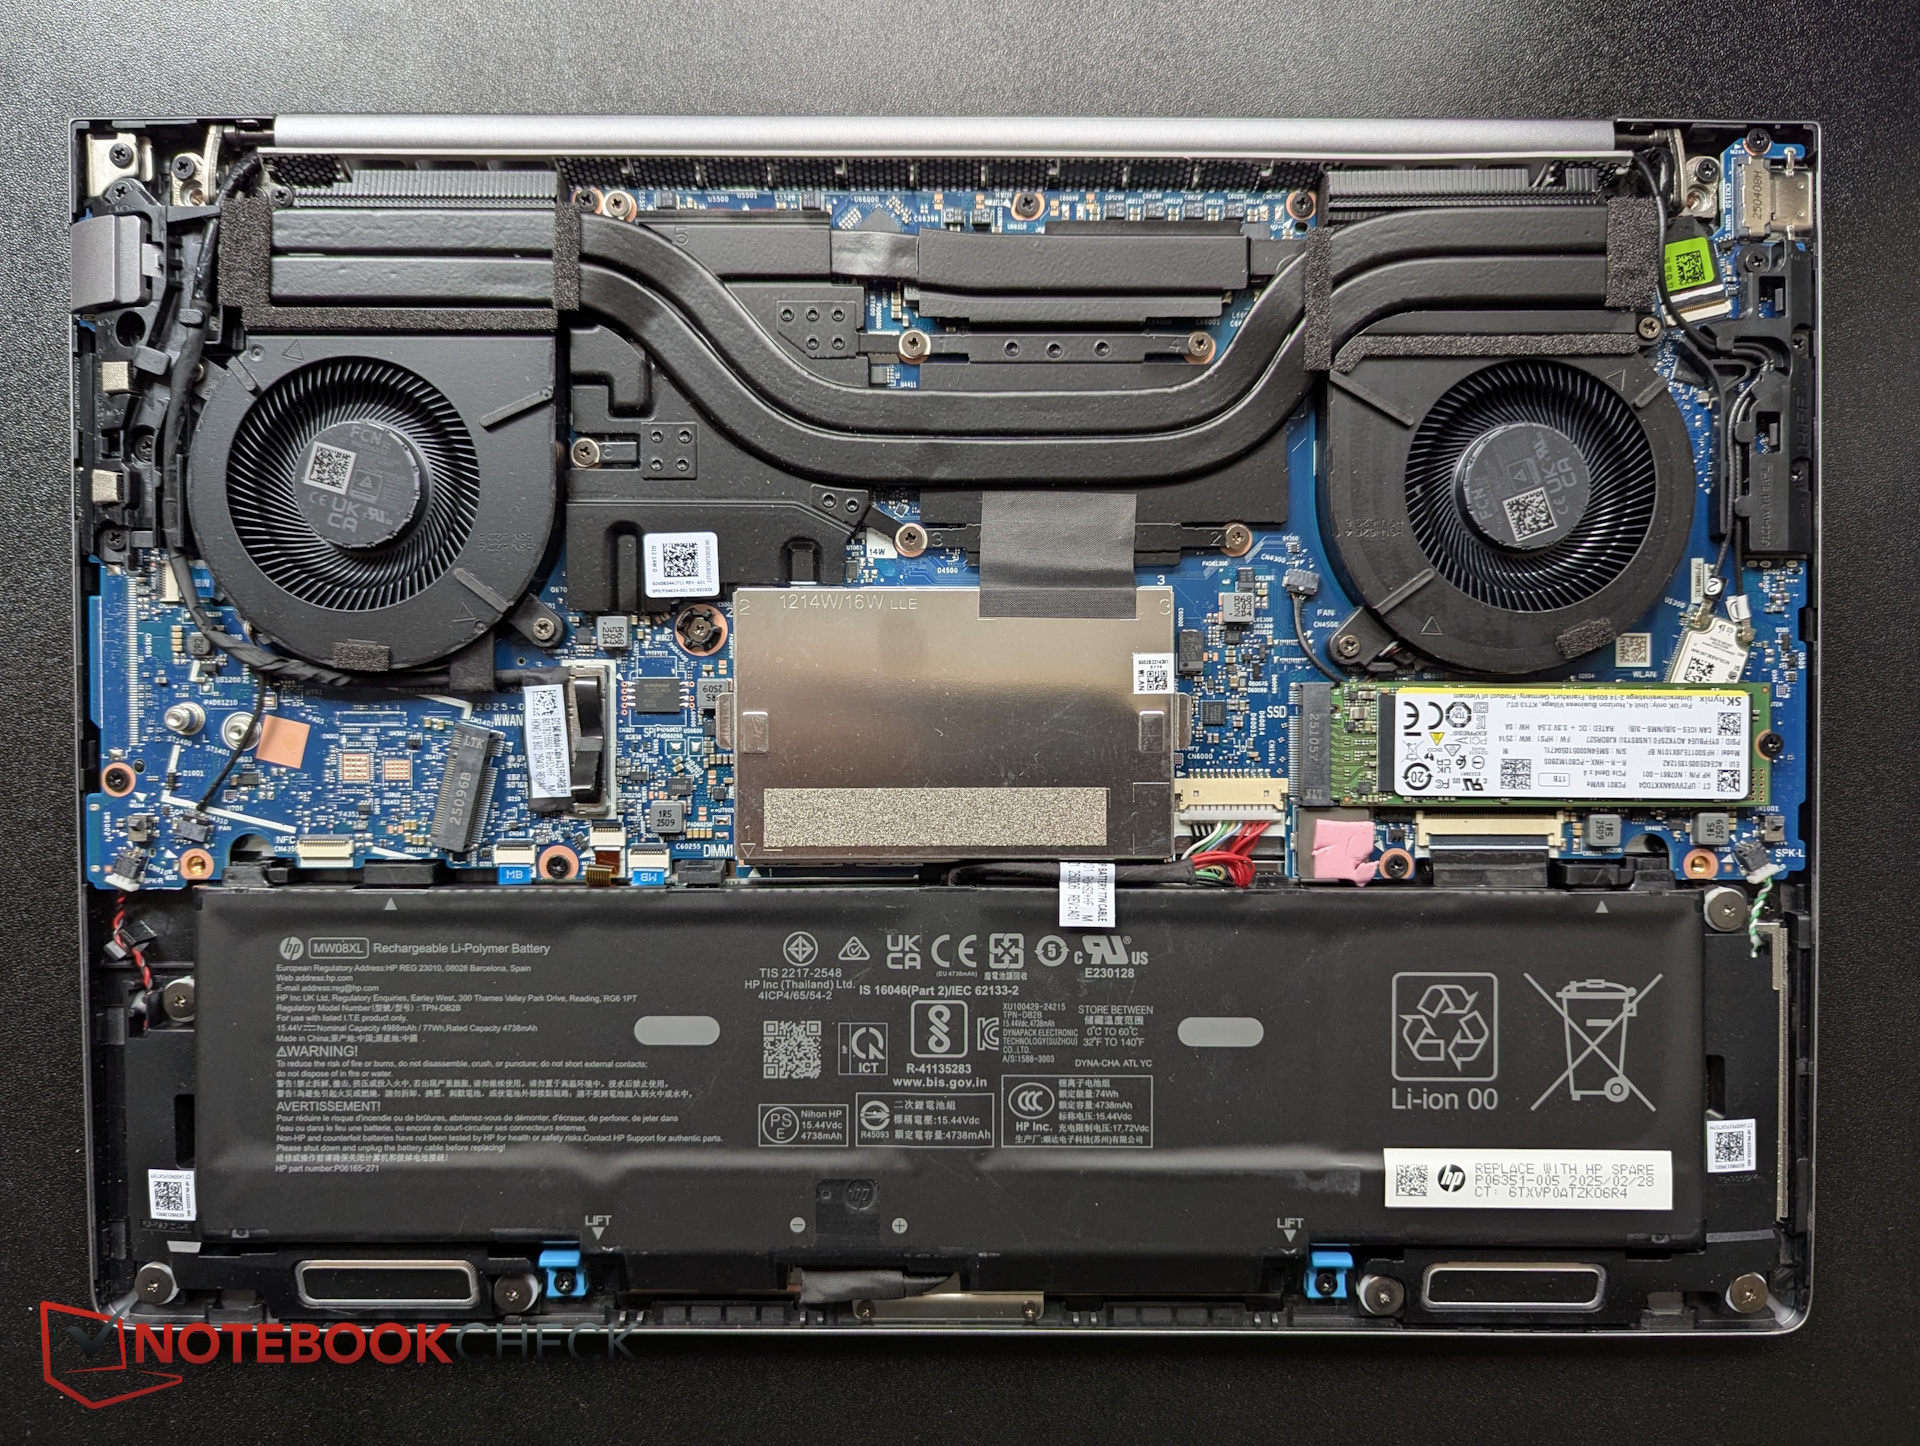
Émissions et énergie - les bons orateurs
Émissions sonores
Au repos, les ventilateurs sont généralement éteints. En cas de stress ou de jeu, le bruit des ventilateurs fluctue entre 44 et 46 dB. Après une période de charge, les ventilateurs redeviennent rapidement silencieux. Malheureusement, la vitesse maximale des ventilateurs est déjà atteinte en cas de charge moyenne.
Degré de la nuisance sonore
| Au repos |
| 23 / 23 / 23 dB(A) |
| Fortement sollicité |
| 46.26 / 46.26 dB(A) |
 | ||
30 dB silencieux 40 dB(A) audible 50 dB(A) bruyant |
||
min: | ||
| HP ZBook 8 G1i 14, RTX 500 Nvidia RTX 500 Ada Generation Laptop GPU, Ultra 7 265H, SK hynix PC801 HFS001TEJ9X101N | HP ZBook 8 G1i 14 Arc 140T, Ultra 7 255H, SK hynix PC801 HFS001TEJ9X101N | HP ZBook Ultra G1a A3ZQ0ET Radeon 8050S, Ryzen AI Max PRO 390, SK hynix PC801 HFS001TEJ9X101N | Lenovo ThinkPad P14s Gen 6 21RV0017GE Radeon 890M, Ryzen AI 9 HX PRO 370, SK hynix PC801 HFS001TEJ9X162N | Dell Precision 5000 5490 NVIDIA RTX 3000 Ada Generation Laptop GPU, Ultra 9 185H, Kioxia XG8 KXG80ZNV1T02 | HP ZBook Firefly 14 G11 RTX A500 Laptop GPU, Ultra 7 165H, Kioxia XG8 KXG80ZNV512G | |
|---|---|---|---|---|---|---|
| Noise | -5% | -2% | -0% | -1% | -2% | |
| arrêt / environnement * (dB) | 23 | 24.9 -8% | 24.6 -7% | 24.5 -7% | 22.8 1% | 24.3 -6% |
| Idle Minimum * (dB) | 23 | 24.9 -8% | 24.6 -7% | 24.5 -7% | 23.8 -3% | 24.6 -7% |
| Idle Average * (dB) | 23 | 24.9 -8% | 24.6 -7% | 24.5 -7% | 23.8 -3% | 25.2 -10% |
| Idle Maximum * (dB) | 23 | 30.3 -32% | 24.6 -7% | 24.5 -7% | 24.7 -7% | 26.8 -17% |
| Load Average * (dB) | 46.26 | 44.1 5% | 40.7 12% | 36.5 21% | 38.9 16% | 38.9 16% |
| Cyberpunk 2077 ultra * (dB) | 46.23 | 40.4 13% | 45.4 2% | 44.7 3% | 41.8 10% | |
| Load Maximum * (dB) | 46.26 | 44.1 5% | 45.4 2% | 44.9 3% | 51.4 -11% | 45.8 1% |
| Witcher 3 ultra * (dB) | 49.9 |
* ... Moindre est la valeur, meilleures sont les performances
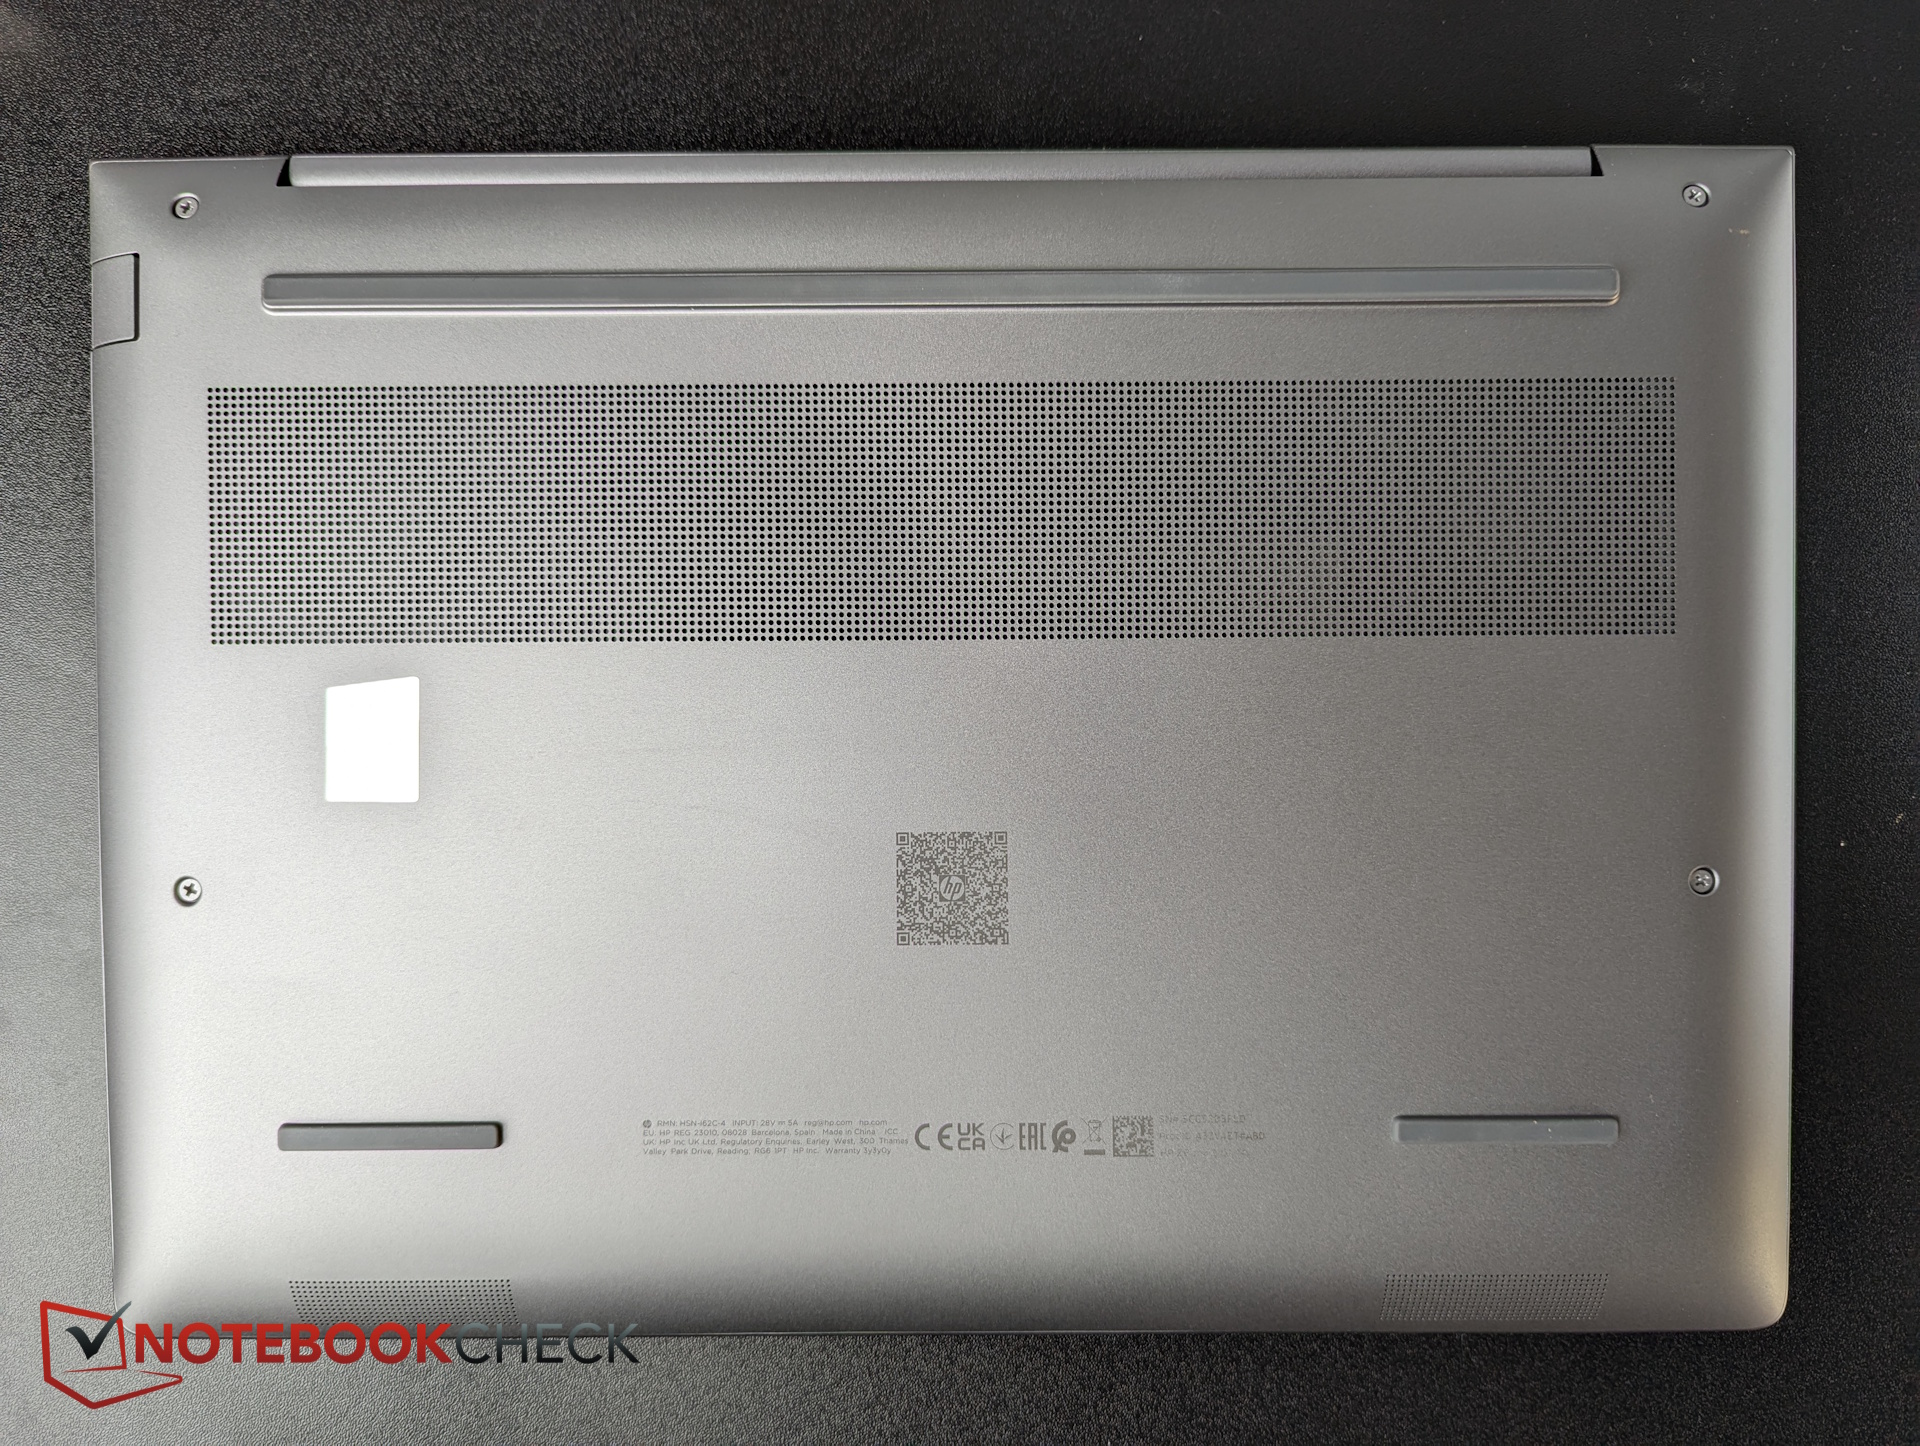
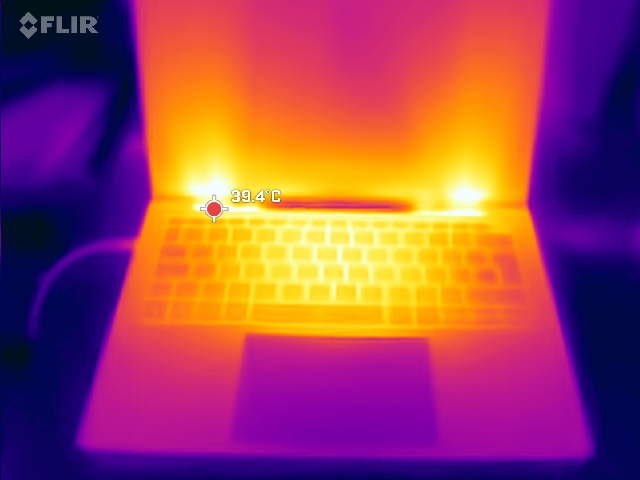
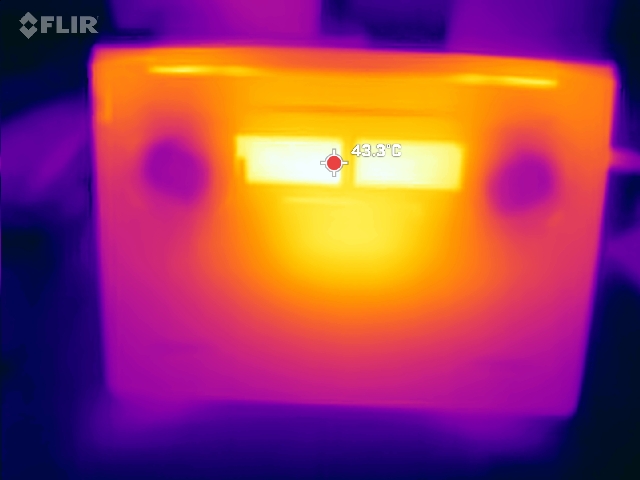
Température
Lors du test de résistance, le point chaud atteint 43 °C sur la face inférieure, près du centre, en direction de l'écran. La zone centrale du clavier se réchauffe également, mais les deux côtés restent plus frais et les repose-paumes restent confortablement froids.
(±) La température maximale du côté supérieur est de 41 °C / 106 F, par rapport à la moyenne de 38.2 °C / 101 F, allant de 22.2 à 69.8 °C pour la classe Workstation.
(±) Le fond chauffe jusqu'à un maximum de 43 °C / 109 F, contre une moyenne de 41.2 °C / 106 F
(+) En utilisation inactive, la température moyenne du côté supérieur est de 28.2 °C / 83 F, par rapport à la moyenne du dispositif de 32 °C / 90 F.
(±) 3: The average temperature for the upper side is 34.3 °C / 94 F, compared to the average of 32 °C / 90 F for the class Workstation.
(+) Les repose-poignets et le pavé tactile sont plus froids que la température de la peau avec un maximum de 29 °C / 84.2 F et sont donc froids au toucher.
(±) La température moyenne de la zone de l'appui-paume de dispositifs similaires était de 27.9 °C / 82.2 F (-1.1 °C / #-2 F).
| HP ZBook 8 G1i 14, RTX 500 Intel Core Ultra 7 265H, Nvidia RTX 500 Ada Generation Laptop GPU | HP ZBook 8 G1i 14 Intel Core Ultra 7 255H, Intel Arc Graphics 140T | HP ZBook Ultra G1a A3ZQ0ET AMD Ryzen AI Max PRO 390, AMD Radeon 8050S | Lenovo ThinkPad P14s Gen 6 21RV0017GE AMD Ryzen AI 9 HX PRO 370, AMD Radeon 890M | Dell Precision 5000 5490 Intel Core Ultra 9 185H, NVIDIA RTX 3000 Ada Generation Laptop GPU | HP ZBook Firefly 14 G11 Intel Core Ultra 7 165H, NVIDIA RTX A500 Laptop GPU | |
|---|---|---|---|---|---|---|
| Heat | 8% | 2% | -5% | 4% | 1% | |
| Maximum Upper Side * (°C) | 41 | 40.3 2% | 43 -5% | 50.5 -23% | 43.2 -5% | 42.8 -4% |
| Maximum Bottom * (°C) | 43 | 38.4 11% | 40.4 6% | 50.2 -17% | 38.4 11% | 44 -2% |
| Idle Upper Side * (°C) | 30 | 29.4 2% | 31.2 -4% | 29.1 3% | 31.6 -5% | 30.6 -2% |
| Idle Bottom * (°C) | 36 | 30.3 16% | 32.5 10% | 30.1 16% | 30.6 15% | 31.4 13% |
* ... Moindre est la valeur, meilleures sont les performances
| Horloge CPU (MHz) | Horloge GPU (MHz) | Température moyenne du CPU (°C) | Température moyenne du GPU (°C) | |
| Prime95 + FurMark Stress | 1,333 | 1,576 | 71 | 64 |
| Cyberpunk 2077 Stress | 673 | 1 576 | 66 | 64 |
Intervenants
Des médiums et des aigus équilibrés, un volume maximal puissant et des basses modérément prononcées en font des haut-parleurs d'ordinateur portable supérieurs à la moyenne.
HP ZBook 8 G1i 14, RTX 500 analyse audio
(+) | les haut-parleurs peuvent jouer relativement fort (87.55# dB)
Basses 100 - 315 Hz
(±) | basse réduite - en moyenne 14.7% inférieure à la médiane
(±) | la linéarité des basses est moyenne (9.8% delta à la fréquence précédente)
Médiums 400 - 2000 Hz
(+) | médiane équilibrée - seulement 2.4% de la médiane
(+) | les médiums sont linéaires (2.4% delta à la fréquence précédente)
Aiguës 2 - 16 kHz
(+) | des sommets équilibrés - à seulement 3.2% de la médiane
(+) | les aigus sont linéaires (4.7% delta à la fréquence précédente)
Globalement 100 - 16 000 Hz
(+) | le son global est linéaire (10.2% différence à la médiane)
Par rapport à la même classe
» 5% de tous les appareils testés de cette catégorie étaient meilleurs, 4% similaires, 91% pires
» Le meilleur avait un delta de 7%, la moyenne était de 18%, le pire était de 35%.
Par rapport à tous les appareils testés
» 4% de tous les appareils testés étaient meilleurs, 1% similaires, 94% pires
» Le meilleur avait un delta de 4%, la moyenne était de 24%, le pire était de 134%.
Dell Precision 5000 5490 analyse audio
(+) | les haut-parleurs peuvent jouer relativement fort (87.8# dB)
Basses 100 - 315 Hz
(±) | basse réduite - en moyenne 10.9% inférieure à la médiane
(±) | la linéarité des basses est moyenne (7.2% delta à la fréquence précédente)
Médiums 400 - 2000 Hz
(+) | médiane équilibrée - seulement 1.7% de la médiane
(+) | les médiums sont linéaires (3.5% delta à la fréquence précédente)
Aiguës 2 - 16 kHz
(+) | des sommets équilibrés - à seulement 4.4% de la médiane
(+) | les aigus sont linéaires (3.4% delta à la fréquence précédente)
Globalement 100 - 16 000 Hz
(+) | le son global est linéaire (9.2% différence à la médiane)
Par rapport à la même classe
» 3% de tous les appareils testés de cette catégorie étaient meilleurs, 2% similaires, 95% pires
» Le meilleur avait un delta de 7%, la moyenne était de 18%, le pire était de 35%.
Par rapport à tous les appareils testés
» 3% de tous les appareils testés étaient meilleurs, 1% similaires, 96% pires
» Le meilleur avait un delta de 4%, la moyenne était de 24%, le pire était de 134%.
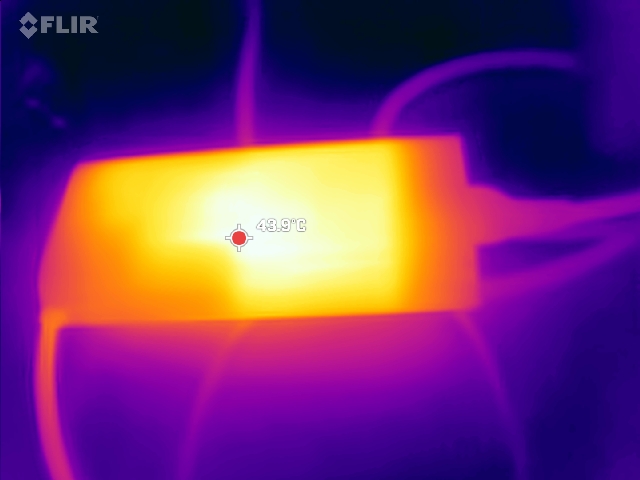
Consommation électrique
La consommation d'énergie en mode veille est généralement faible. En charge de jeu, elle est raisonnable, bien qu'à charge moyenne, le ZBook consomme un peu plus d'énergie que prévu. Avec de courtes pointes allant jusqu'à 137 W, l'adaptateur d'alimentation USB-C de 140 W gère bien la demande, même avec ses longs câbles.
| Éteint/en veille | |
| Au repos | |
| Fortement sollicité |
|
Légende:
min: | |
| HP ZBook 8 G1i 14, RTX 500 Ultra 7 265H, Nvidia RTX 500 Ada Generation Laptop GPU, SK hynix PC801 HFS001TEJ9X101N, IPS, 2560x1600, 14" | HP ZBook 8 G1i 14 Ultra 7 255H, Arc 140T, SK hynix PC801 HFS001TEJ9X101N, IPS LED, 2560x1600, 14" | HP ZBook Ultra G1a A3ZQ0ET Ryzen AI Max PRO 390, Radeon 8050S, SK hynix PC801 HFS001TEJ9X101N, IPS LED, 1920x1200, 14" | Lenovo ThinkPad P14s Gen 6 21RV0017GE Ryzen AI 9 HX PRO 370, Radeon 890M, SK hynix PC801 HFS001TEJ9X162N, IPS LED, 1920x1200, 14" | Dell Precision 5000 5490 Ultra 9 185H, NVIDIA RTX 3000 Ada Generation Laptop GPU, Kioxia XG8 KXG80ZNV1T02, IPS, 2560x1600, 14" | HP ZBook Firefly 14 G11 Ultra 7 165H, RTX A500 Laptop GPU, Kioxia XG8 KXG80ZNV512G, IPS, 2560x1600, 14" | Moyenne Nvidia RTX 500 Ada Generation Laptop GPU | Moyenne de la classe Workstation | |
|---|---|---|---|---|---|---|---|---|
| Power Consumption | 11% | -1% | 26% | -50% | -2% | -18% | -39% | |
| Idle Minimum * (Watt) | 5.5 | 4.7 15% | 4.5 18% | 4.7 15% | 11.1 -102% | 6.6 -20% | 6.5 ? -18% | 8.25 ? -50% |
| Idle Average * (Watt) | 8.4 | 8.2 2% | 7.5 11% | 7.7 8% | 14.8 -76% | 12.7 -51% | 11 ? -31% | 12.1 ? -44% |
| Idle Maximum * (Watt) | 8.7 | 10.8 -24% | 8.3 5% | 8 8% | 16.5 -90% | 13.3 -53% | 11.5 ? -32% | 16.1 ? -85% |
| Load Average * (Watt) | 87.9 | 64.1 27% | 80.7 8% | 53.3 39% | 70.1 20% | 67 24% | 94.1 ? -7% | 87.6 ? -0% |
| Cyberpunk 2077 ultra * (Watt) | 84 | 71.4 15% | 106.5 -27% | 58.3 31% | 63.4 25% | |||
| Cyberpunk 2077 ultra external monitor * (Watt) | 80.6 | 69.2 14% | 104.1 -29% | 58.6 27% | 58.1 28% | |||
| Load Maximum * (Watt) | 137 | 98 28% | 125.1 9% | 67.5 51% | 137.5 -0% | 94.9 31% | 137.2 ? -0% | 160.1 ? -17% |
| Witcher 3 ultra * (Watt) | 93.1 |
* ... Moindre est la valeur, meilleures sont les performances
consommation d'énergie Cyberpunk / Stress test
consommation d'énergie avec moniteur externe
Durée de vie de la batterie
La batterie de 72 Wh offre une autonomie d'environ 10 heures de navigation sur le web ou de lecture de vidéos.
| HP ZBook 8 G1i 14, RTX 500 Ultra 7 265H, Nvidia RTX 500 Ada Generation Laptop GPU, 72 Wh | HP ZBook 8 G1i 14 Ultra 7 255H, Arc 140T, 77 Wh | HP ZBook Ultra G1a A3ZQ0ET Ryzen AI Max PRO 390, Radeon 8050S, 74.5 Wh | Lenovo ThinkPad P14s Gen 6 21RV0017GE Ryzen AI 9 HX PRO 370, Radeon 890M, 57 Wh | Dell Precision 5000 5490 Ultra 9 185H, NVIDIA RTX 3000 Ada Generation Laptop GPU, 72 Wh | HP ZBook Firefly 14 G11 Ultra 7 165H, RTX A500 Laptop GPU, 56 Wh | Moyenne de la classe Workstation | |
|---|---|---|---|---|---|---|---|
| Autonomie de la batterie | -12% | -16% | -25% | 2% | -20% | -9% | |
| H.264 (h) | 10.1 | 12 ? 19% | |||||
| WiFi v1.3 (h) | 10.8 | 12 11% | 10.5 -3% | 9.3 -14% | 11 2% | 8.6 -20% | 8.35 ? -23% |
| Load (h) | 1.7 | 1.1 -35% | 1.2 -29% | 1.1 -35% | 1.304 ? -23% |
HP ZBook 8 G1i 14, RTX 500
- 10/16/2025 v8
Christian Hintze
 Total Sustainability Score:
 Les alternatives en un coup d'œil
Image | Modèle | Prix | Poids | Épaisseur | Écran |
|---|---|---|---|---|---|
1. 85.1%  | HP ZBook 8 G1i 14, RTX 500 Intel Core Ultra 7 265H ⎘ Nvidia RTX 500 Ada Generation Laptop GPU ⎘ 64 Go Mémoire, 1024 Go SSD | Amazon: $2,968.00 | 1.7 kg | 18.9 mm | 14.00" 2560x1600 216 PPI IPS |
2. 82%  | HP ZBook 8 G1i 14 Intel Core Ultra 7 255H ⎘ Intel Arc Graphics 140T ⎘ 32 Go Mémoire, 1024 Go SSD | Amazon: $2,968.00 Prix de liste: 1860 Euro | 1.7 kg | 23 mm | 14.00" 2560x1600 216 PPI IPS LED |
3. 85.4%  | HP ZBook Ultra G1a A3ZQ0ET AMD Ryzen AI Max PRO 390 ⎘ AMD Radeon 8050S ⎘ 32 Go Mémoire, 1024 Go SSD | Amazon: $2,655.19 Prix de liste: 2545 Euro | 1.6 kg | 19 mm | 14.00" 1920x1200 162 PPI IPS LED |
4. 81.6%  | Lenovo ThinkPad P14s Gen 6 21RV0017GE AMD Ryzen AI 9 HX PRO 370 ⎘ AMD Radeon 890M ⎘ 64 Go Mémoire, 1024 Go SSD | Amazon: 1. $1,120.00 Lenovo ThinkPad P14s Gen 6 L... 2. $1,315.00 Lenovo ThinkPad P14s Gen 6 L... 3. $1,491.51 Lenovo ThinkPad P14s Gen 5 L... Prix de liste: 2289 Euro | 1.4 kg | 22 mm | 14.00" 1920x1200 162 PPI IPS LED |
5. 89.3% v7 (old)  | Dell Precision 5000 5490 Intel Core Ultra 9 185H ⎘ NVIDIA RTX 3000 Ada Generation Laptop GPU ⎘ 64 Go Mémoire, 1024 Go SSD | Amazon: $1,603.43 Prix de liste: 3800 USD | 1.6 kg | 18.95 mm | 14.00" 2560x1600 216 PPI IPS |
6. 80.3%  | HP ZBook Firefly 14 G11 Intel Core Ultra 7 165H ⎘ NVIDIA RTX A500 Laptop GPU ⎘ 32 Go Mémoire, 512 Go SSD | Amazon: $2,199.00 Prix de liste: 3500 USD | 1.5 kg | 19.2 mm | 14.00" 2560x1600 216 PPI IPS |
Transparency
La sélection des appareils à examiner est effectuée par notre équipe éditoriale. L'échantillon de test a été prêté à l'auteur par le fabricant ou le détaillant pour les besoins de cet examen. Le prêteur n'a pas eu d'influence sur cette évaluation et le fabricant n'a pas reçu de copie de cette évaluation avant sa publication. Il n'y avait aucune obligation de publier cet article. En tant que média indépendant, Notebookcheck n'est pas soumis à l'autorité des fabricants, des détaillants ou des éditeurs.
Voici comment Notebookcheck teste
Chaque année, Notebookcheck examine de manière indépendante des centaines d'ordinateurs portables et de smartphones en utilisant des procédures standardisées afin de garantir que tous les résultats sont comparables. Nous avons continuellement développé nos méthodes de test depuis environ 20 ans et avons établi des normes industrielles dans le processus. Dans nos laboratoires de test, des équipements de mesure de haute qualité sont utilisés par des techniciens et des rédacteurs expérimentés. Ces tests impliquent un processus de validation en plusieurs étapes. Notre système d'évaluation complexe repose sur des centaines de mesures et de points de référence bien fondés, ce qui garantit l'objectivité.