Verdict - Le ThinkPad P16v Gen 3 est une bonne station de travail mobile
Lors du test, le ThinkPad P16v Gen 3 s'est montré très convaincant en tant que station de travail mobile et a obtenu une bonne note globale. Outre les longues durées de fonctionnement de la batterie, il offre de bonnes performances système, de nombreuses connexions et de très bonnes options de maintenance. Les touches TouchPad et TrackPoint sont d'une très grande qualité, mais le clavier n'est que moyen et il y a vraiment matière à amélioration (surtout par rapport au ThinkPad P1 16 Gen 8).
La classification en tant que station de travail relativement abordable est surtout visible dans le boîtier, car il n'y a que du plastique et il y a aussi des critiques en termes de stabilité (en particulier la zone centrale du clavier) et les charnières (basculement notable). Seules des dalles 60 Hz sont disponibles pour les écrans (y compris OLED), alors que le modèle IPS standard fait un travail raisonnable avec plus de 500 cd/m² de luminosité, des couleurs précises et une couverture sRGB complète.
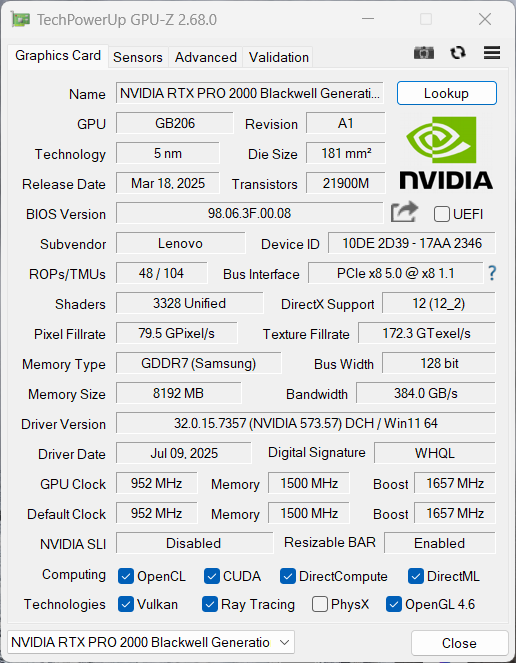
Nous aurions aimé un peu plus de performance, surtout de la part de la carte graphique. La Nvidia RTX PRO 2000 (Blackwell, comparable à GeForce RTX 5060) ne fonctionne qu'avec un maximum de 60 watts et est donc bien loin du maximum de 115 watts (qui permettrait d'augmenter les performances d'environ 30%). Compte tenu du grand boîtier de 16 pouces, c'est relativement faible.
Points positifs
Points négatifs
Prix et disponibilité
L'appareil de test est disponible sur notre site de prêt Campuspoint pour 2,825 Euros (~$3277)(ou 2,529 Euros/~$2933 dans le programme Campus) et le P16v G3 peut être configuré chez Lenovo à partir de 2,469 Euros (~$2864).
Table des matières
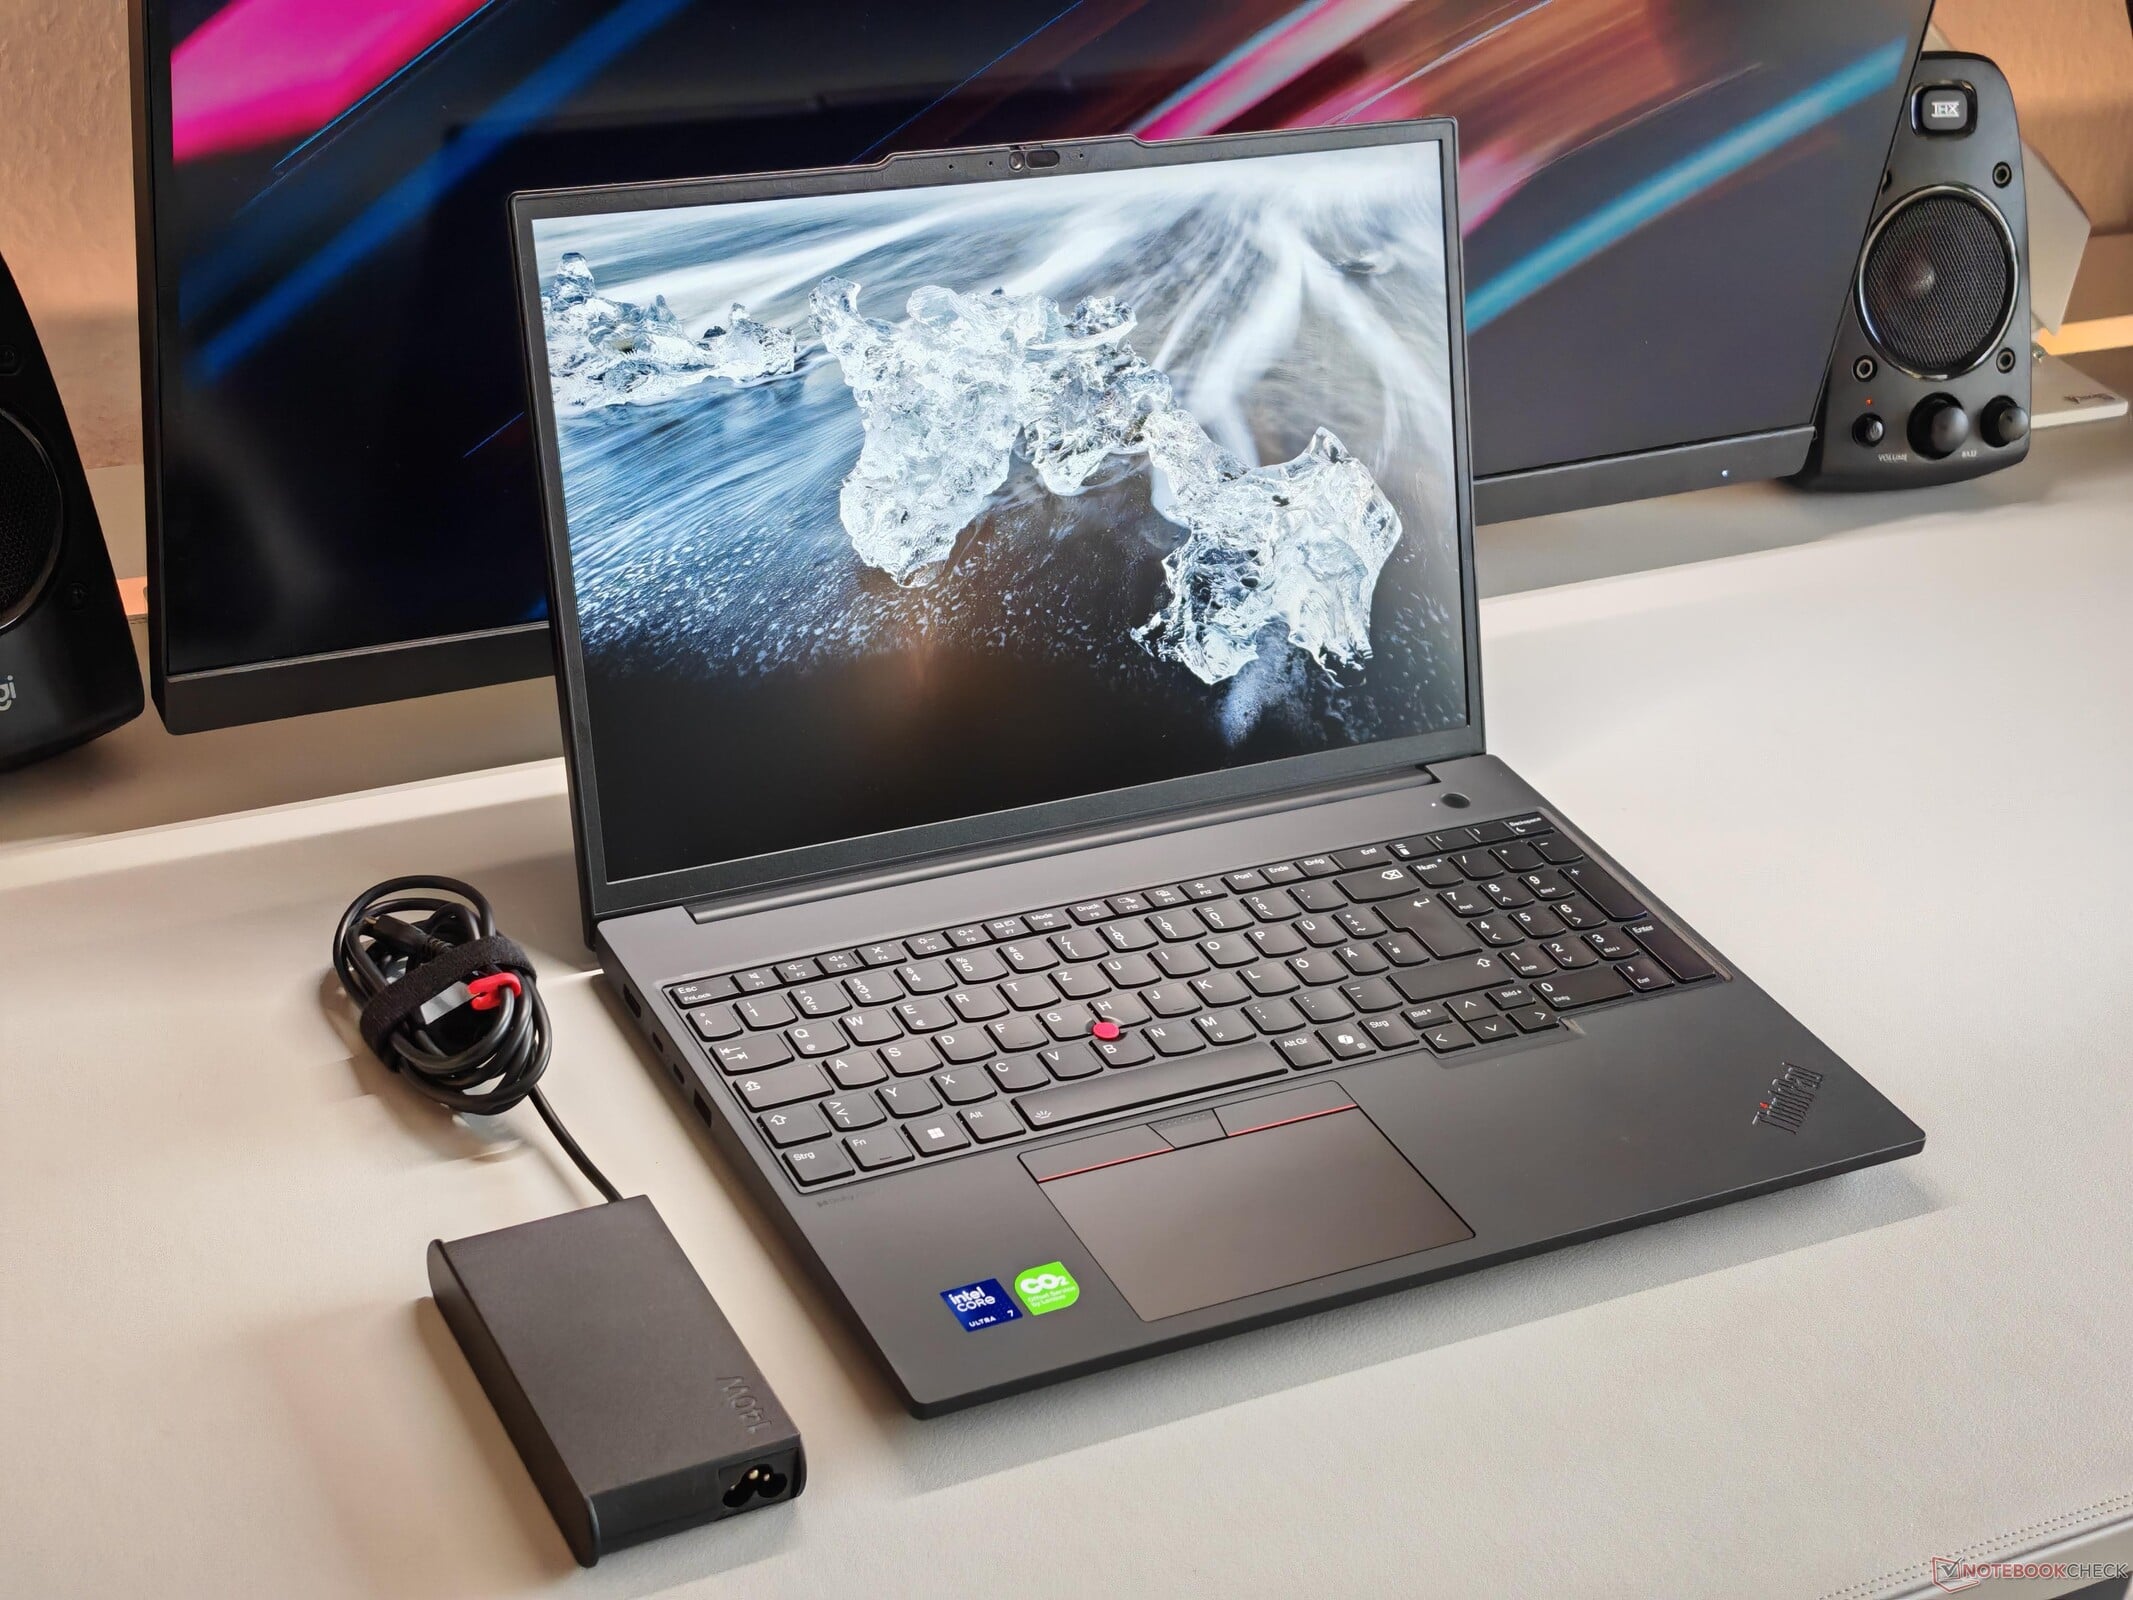
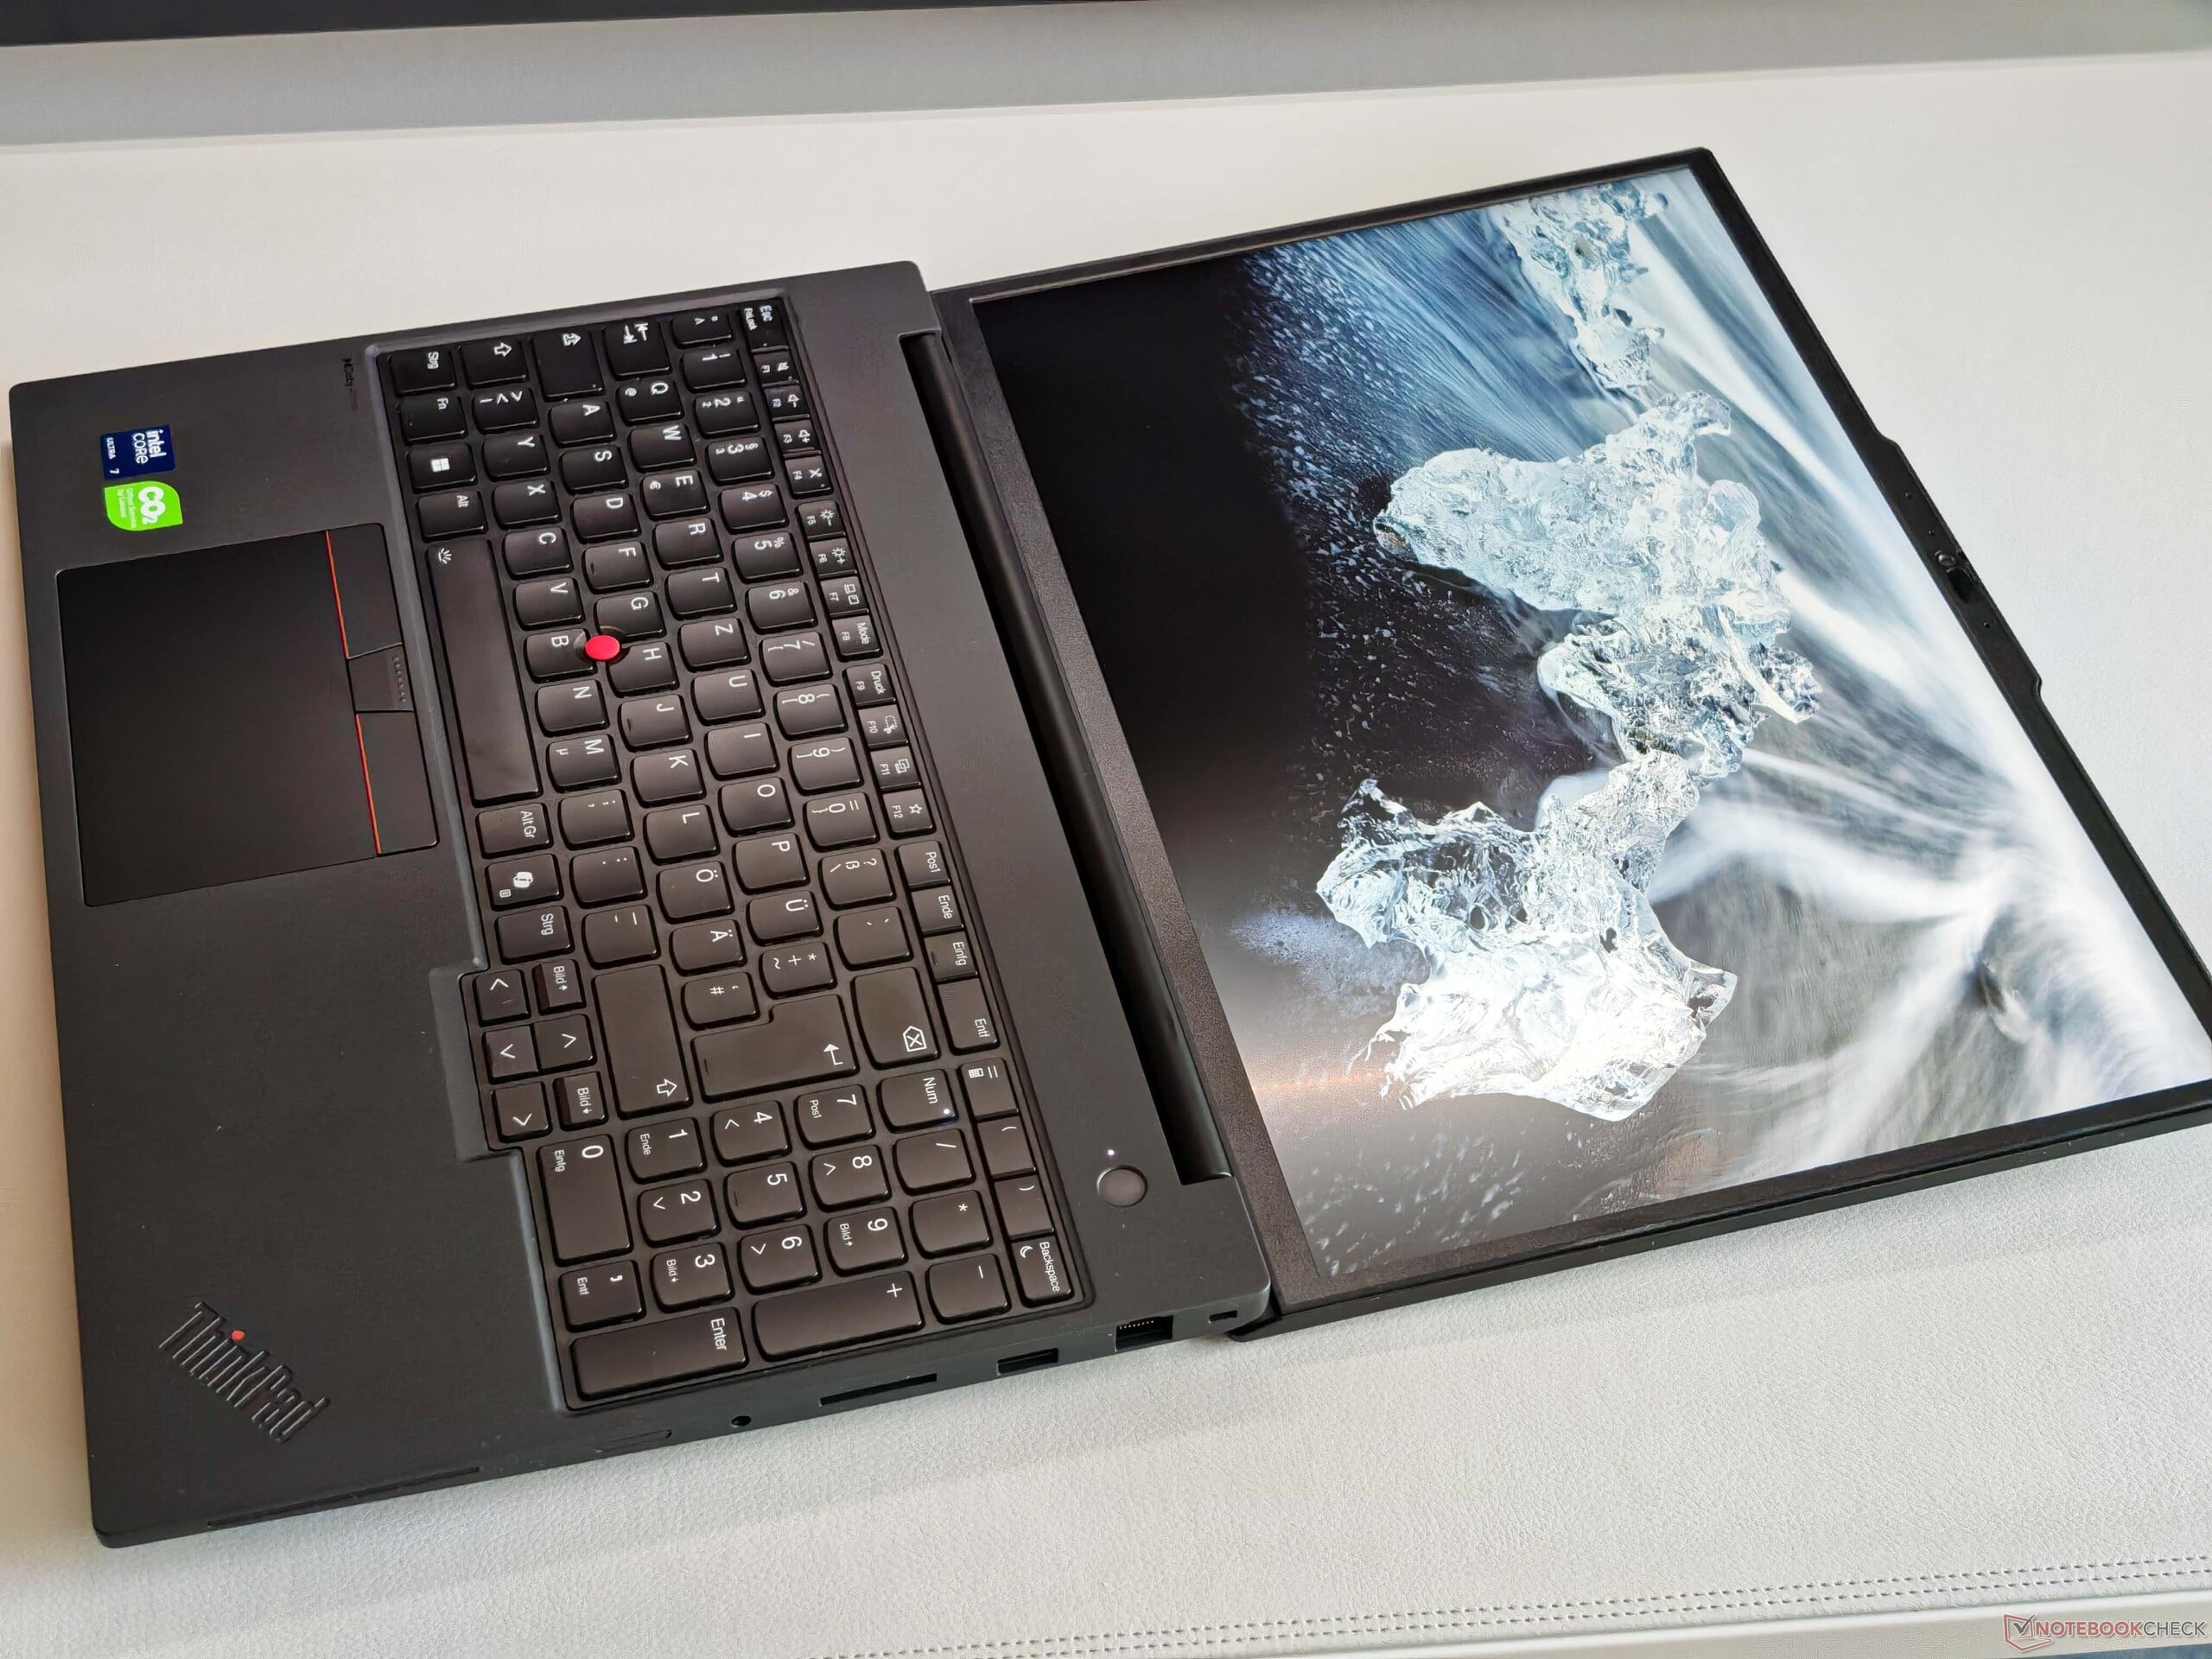
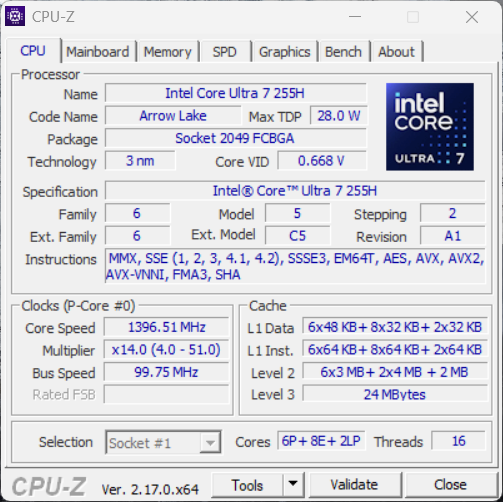
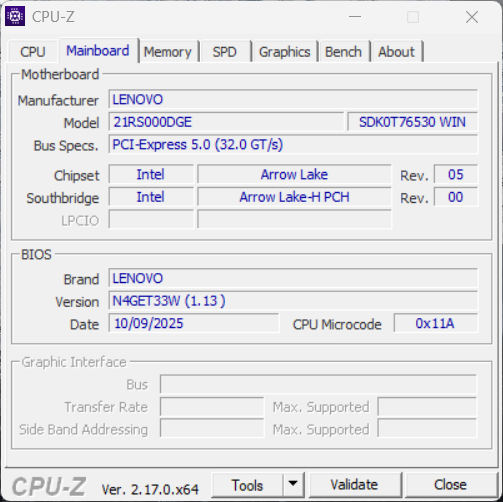
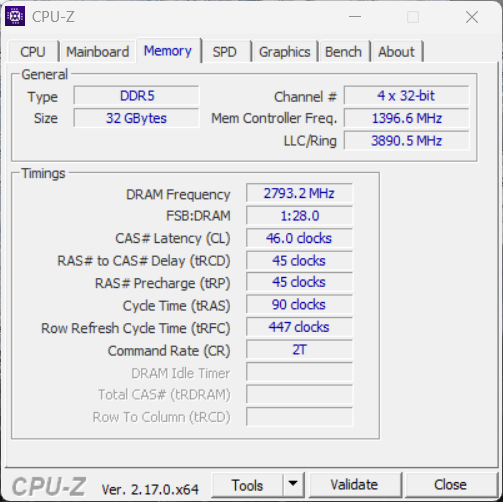
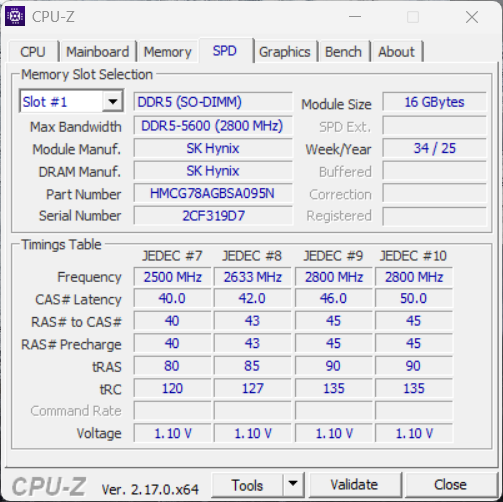
Le ThinkPad P16v Gen3 est le modèle d'entrée de gamme de Lenovo en matière de stations de travail mobiles. Nous testons le modèle 21RS000DGE avec le processeur Core Ultra 7 255H32 Go de RAM, la Nvidia RTX PRO 2000un SSD de 1 TB et un écran Full HD avec une luminosité de 500 cd/m² pour 2.825 Euros (~$3277).
Spécifications
Mallette et équipement
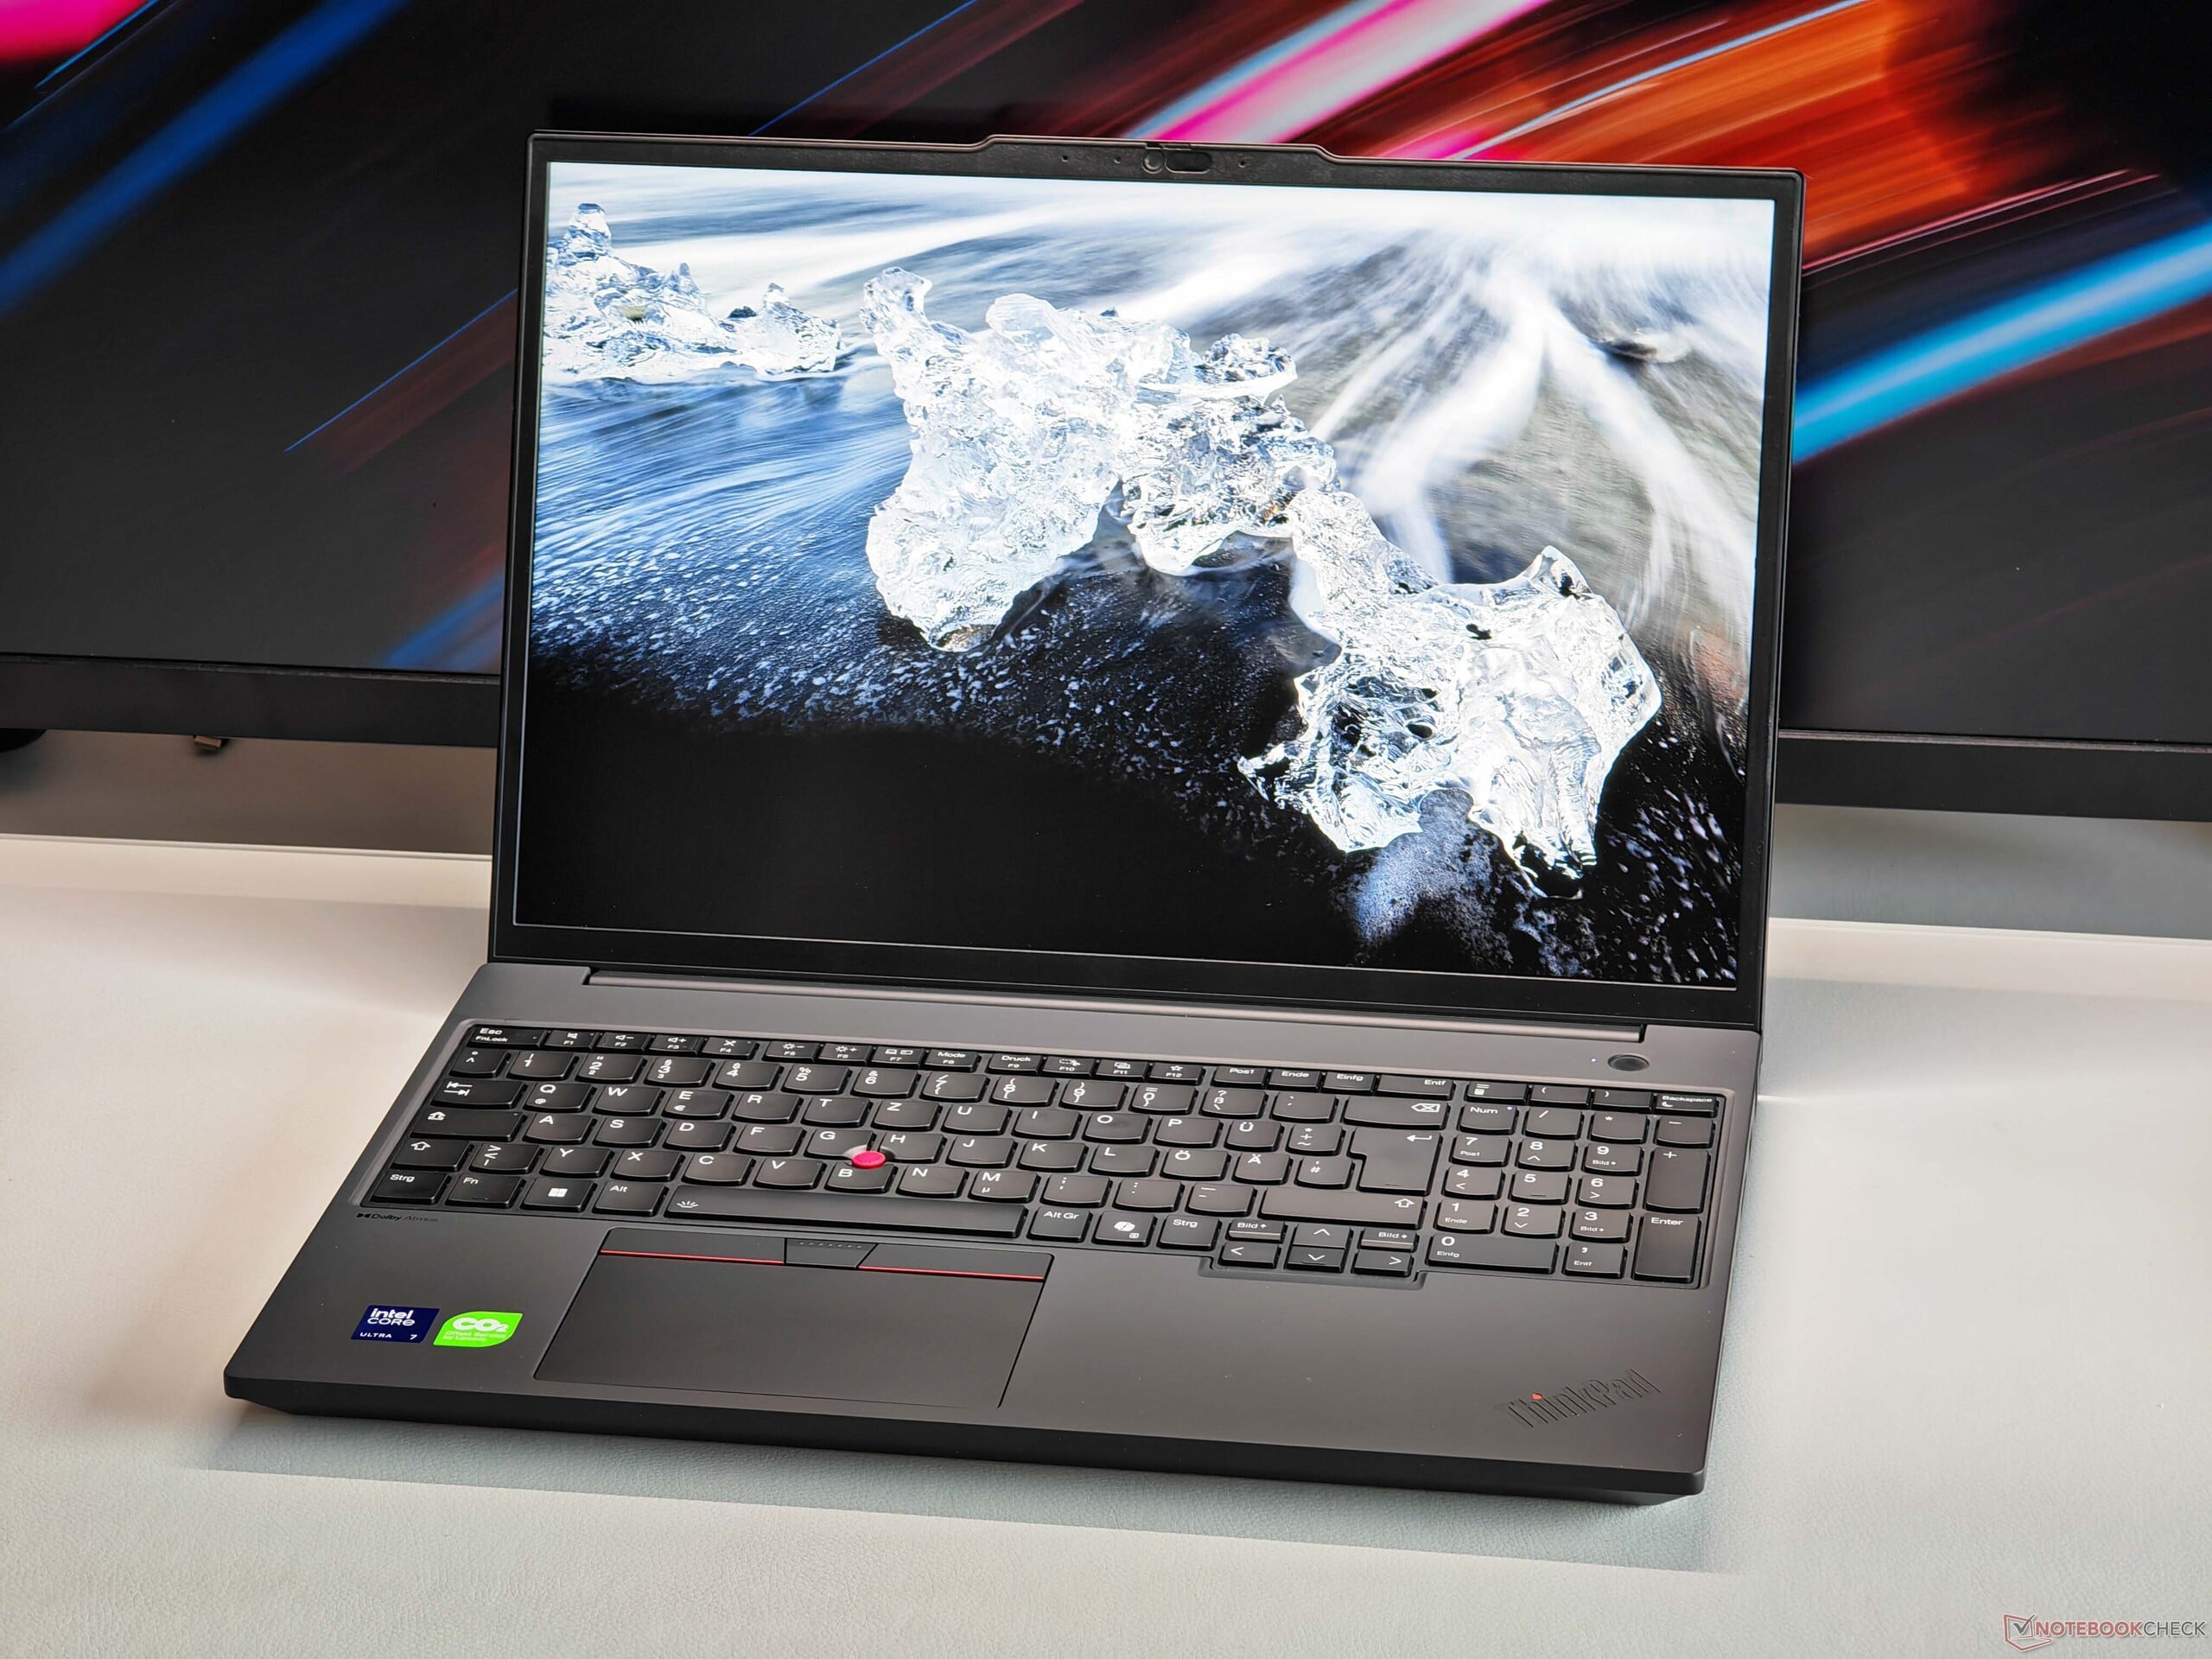
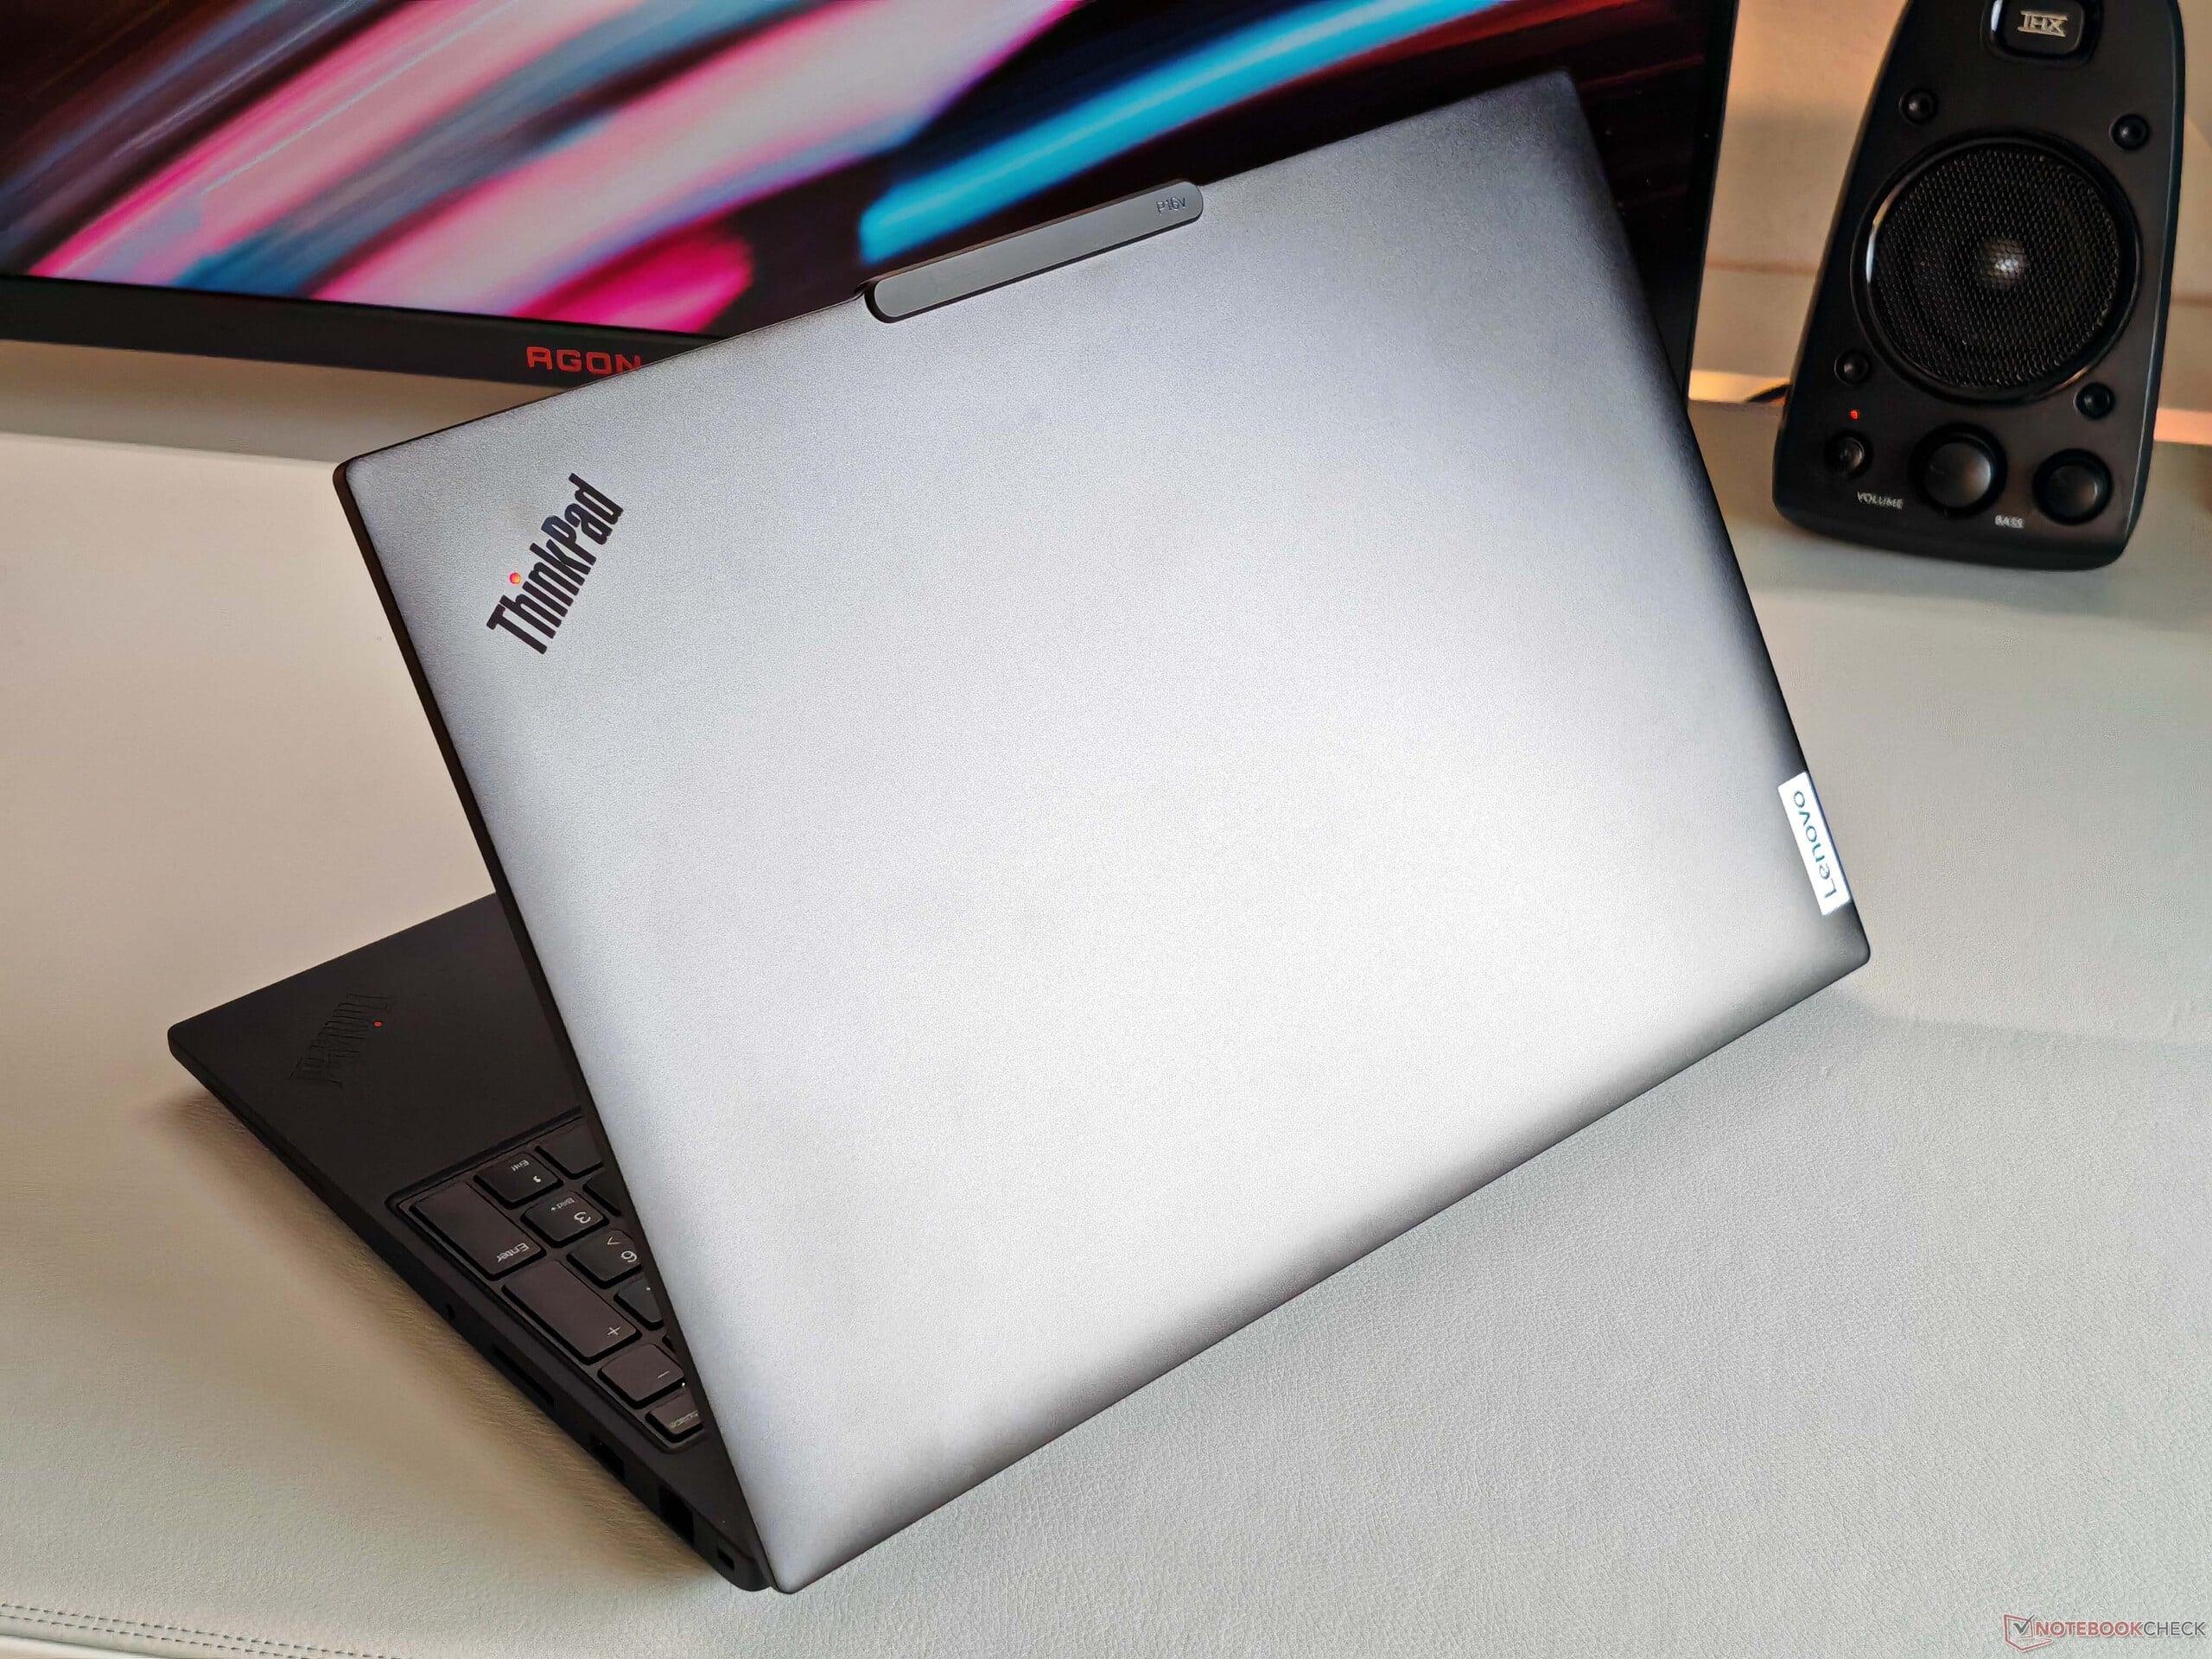
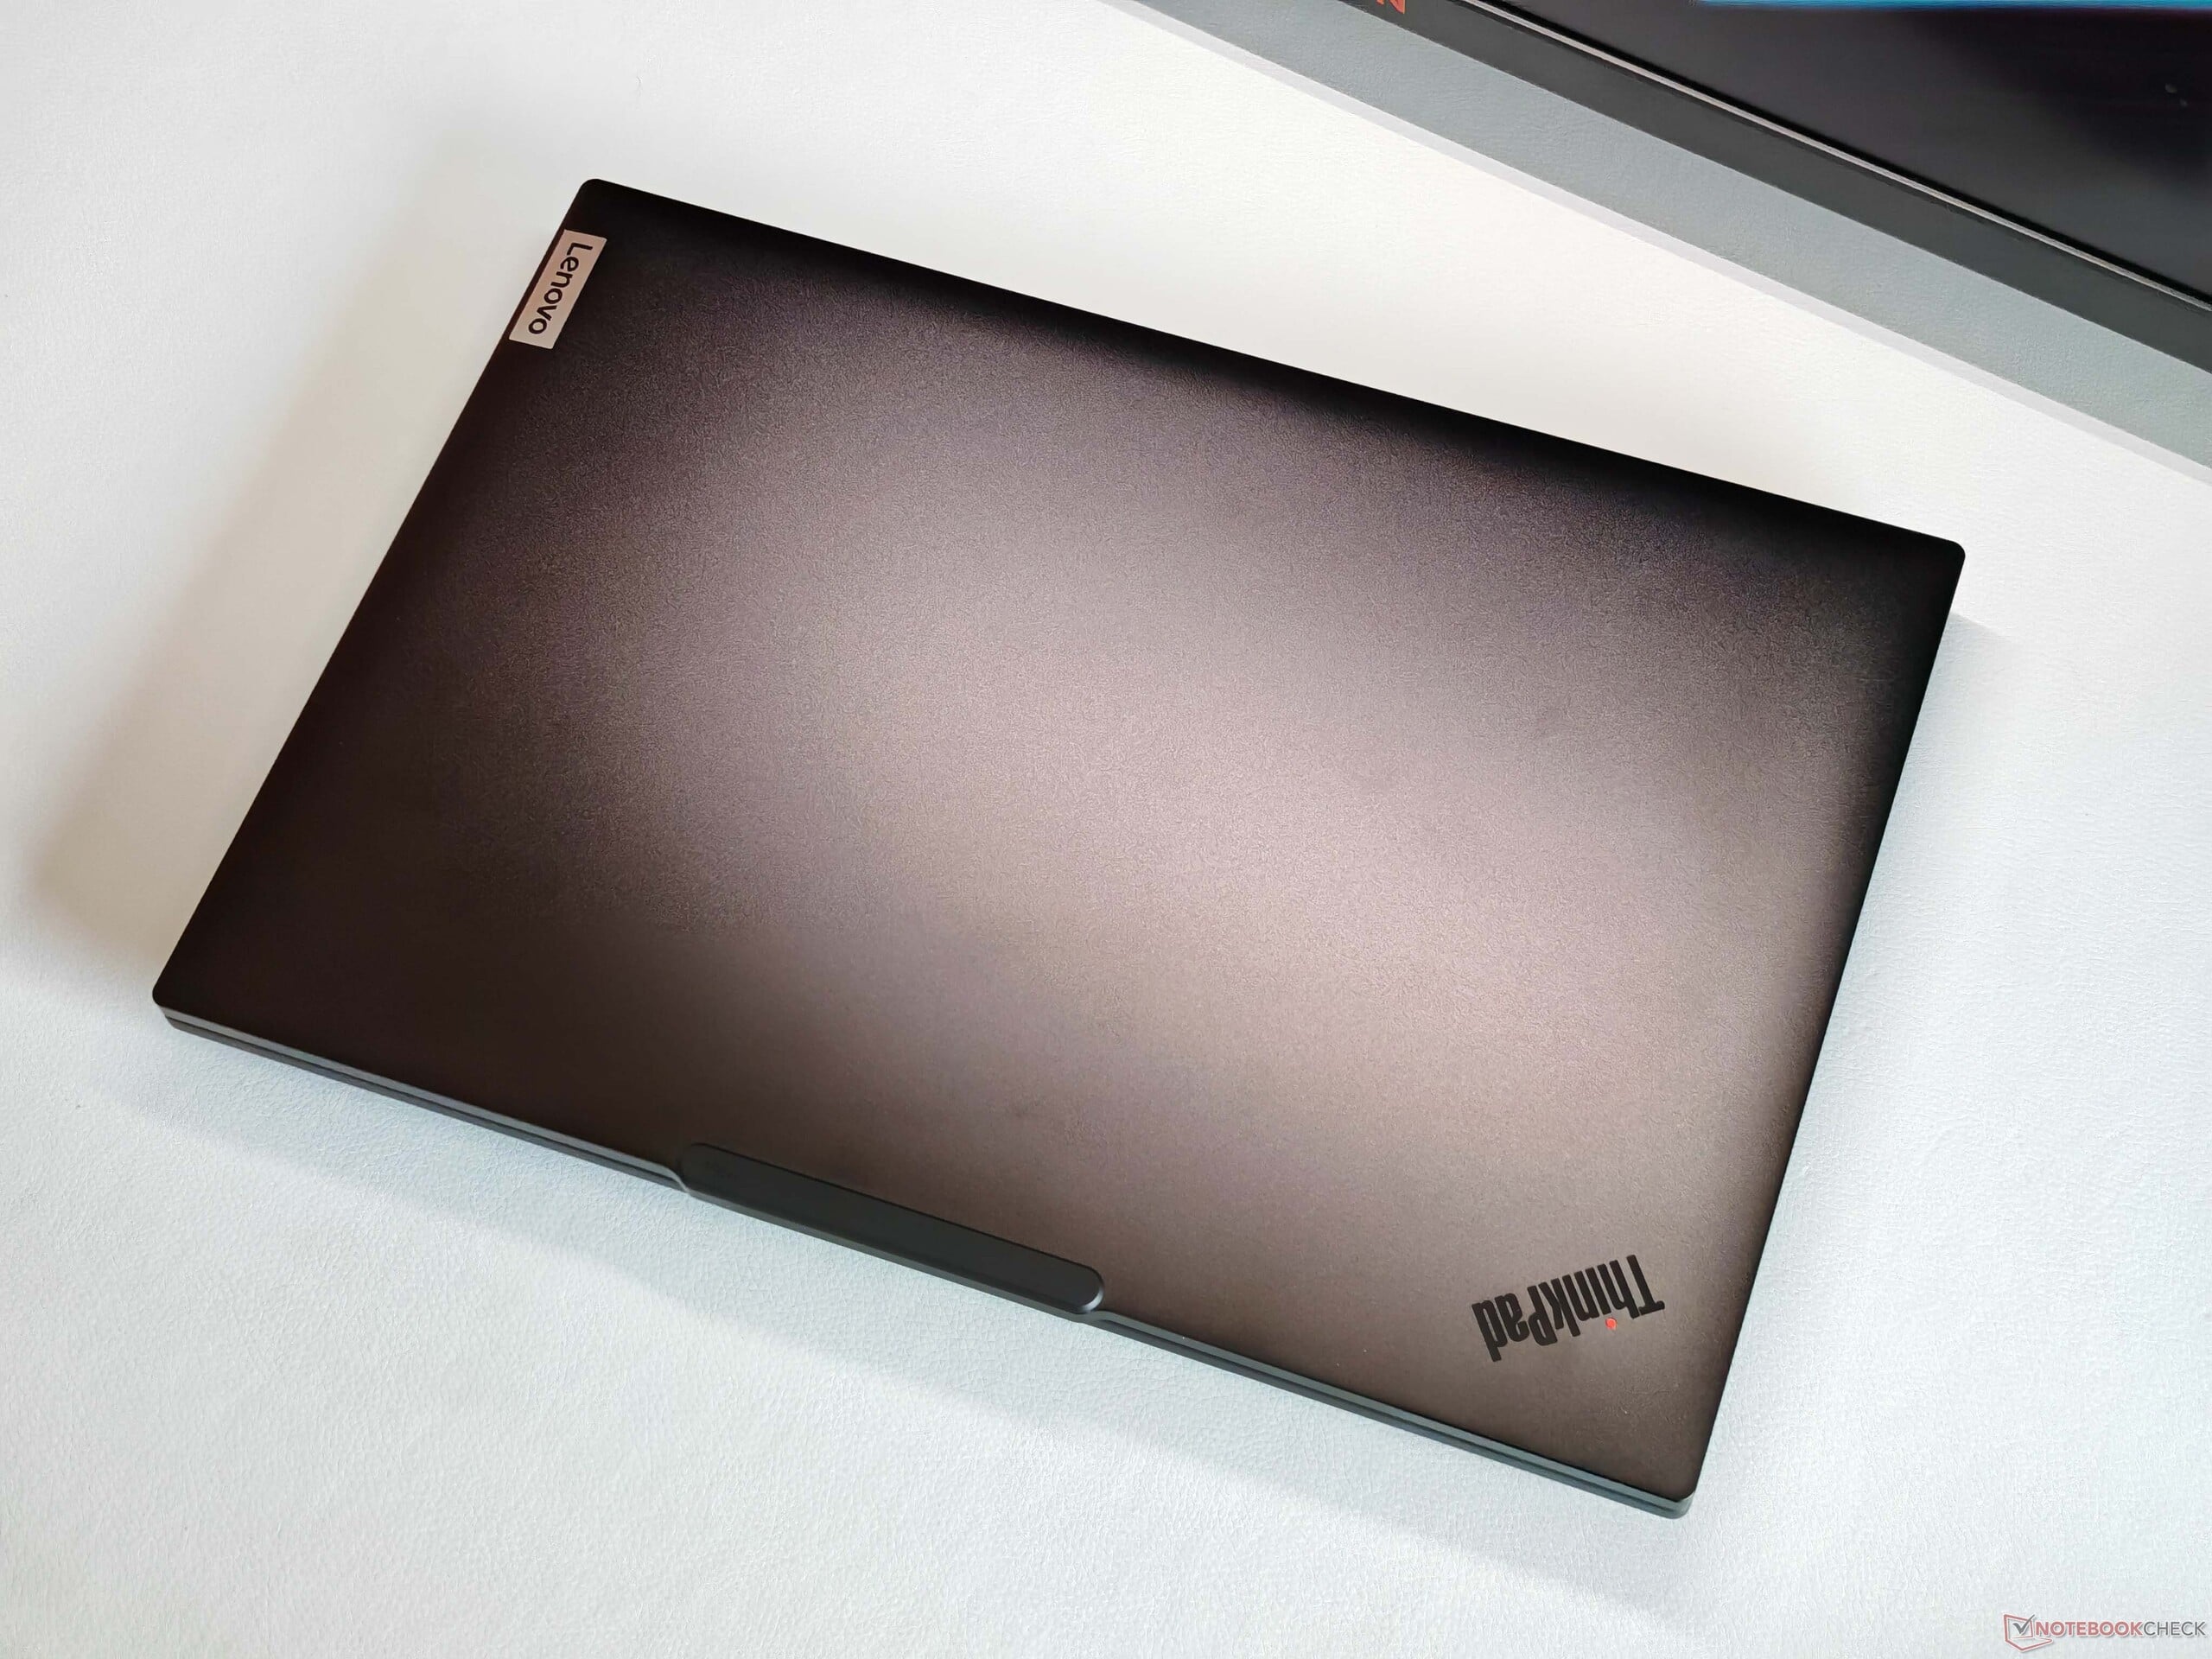
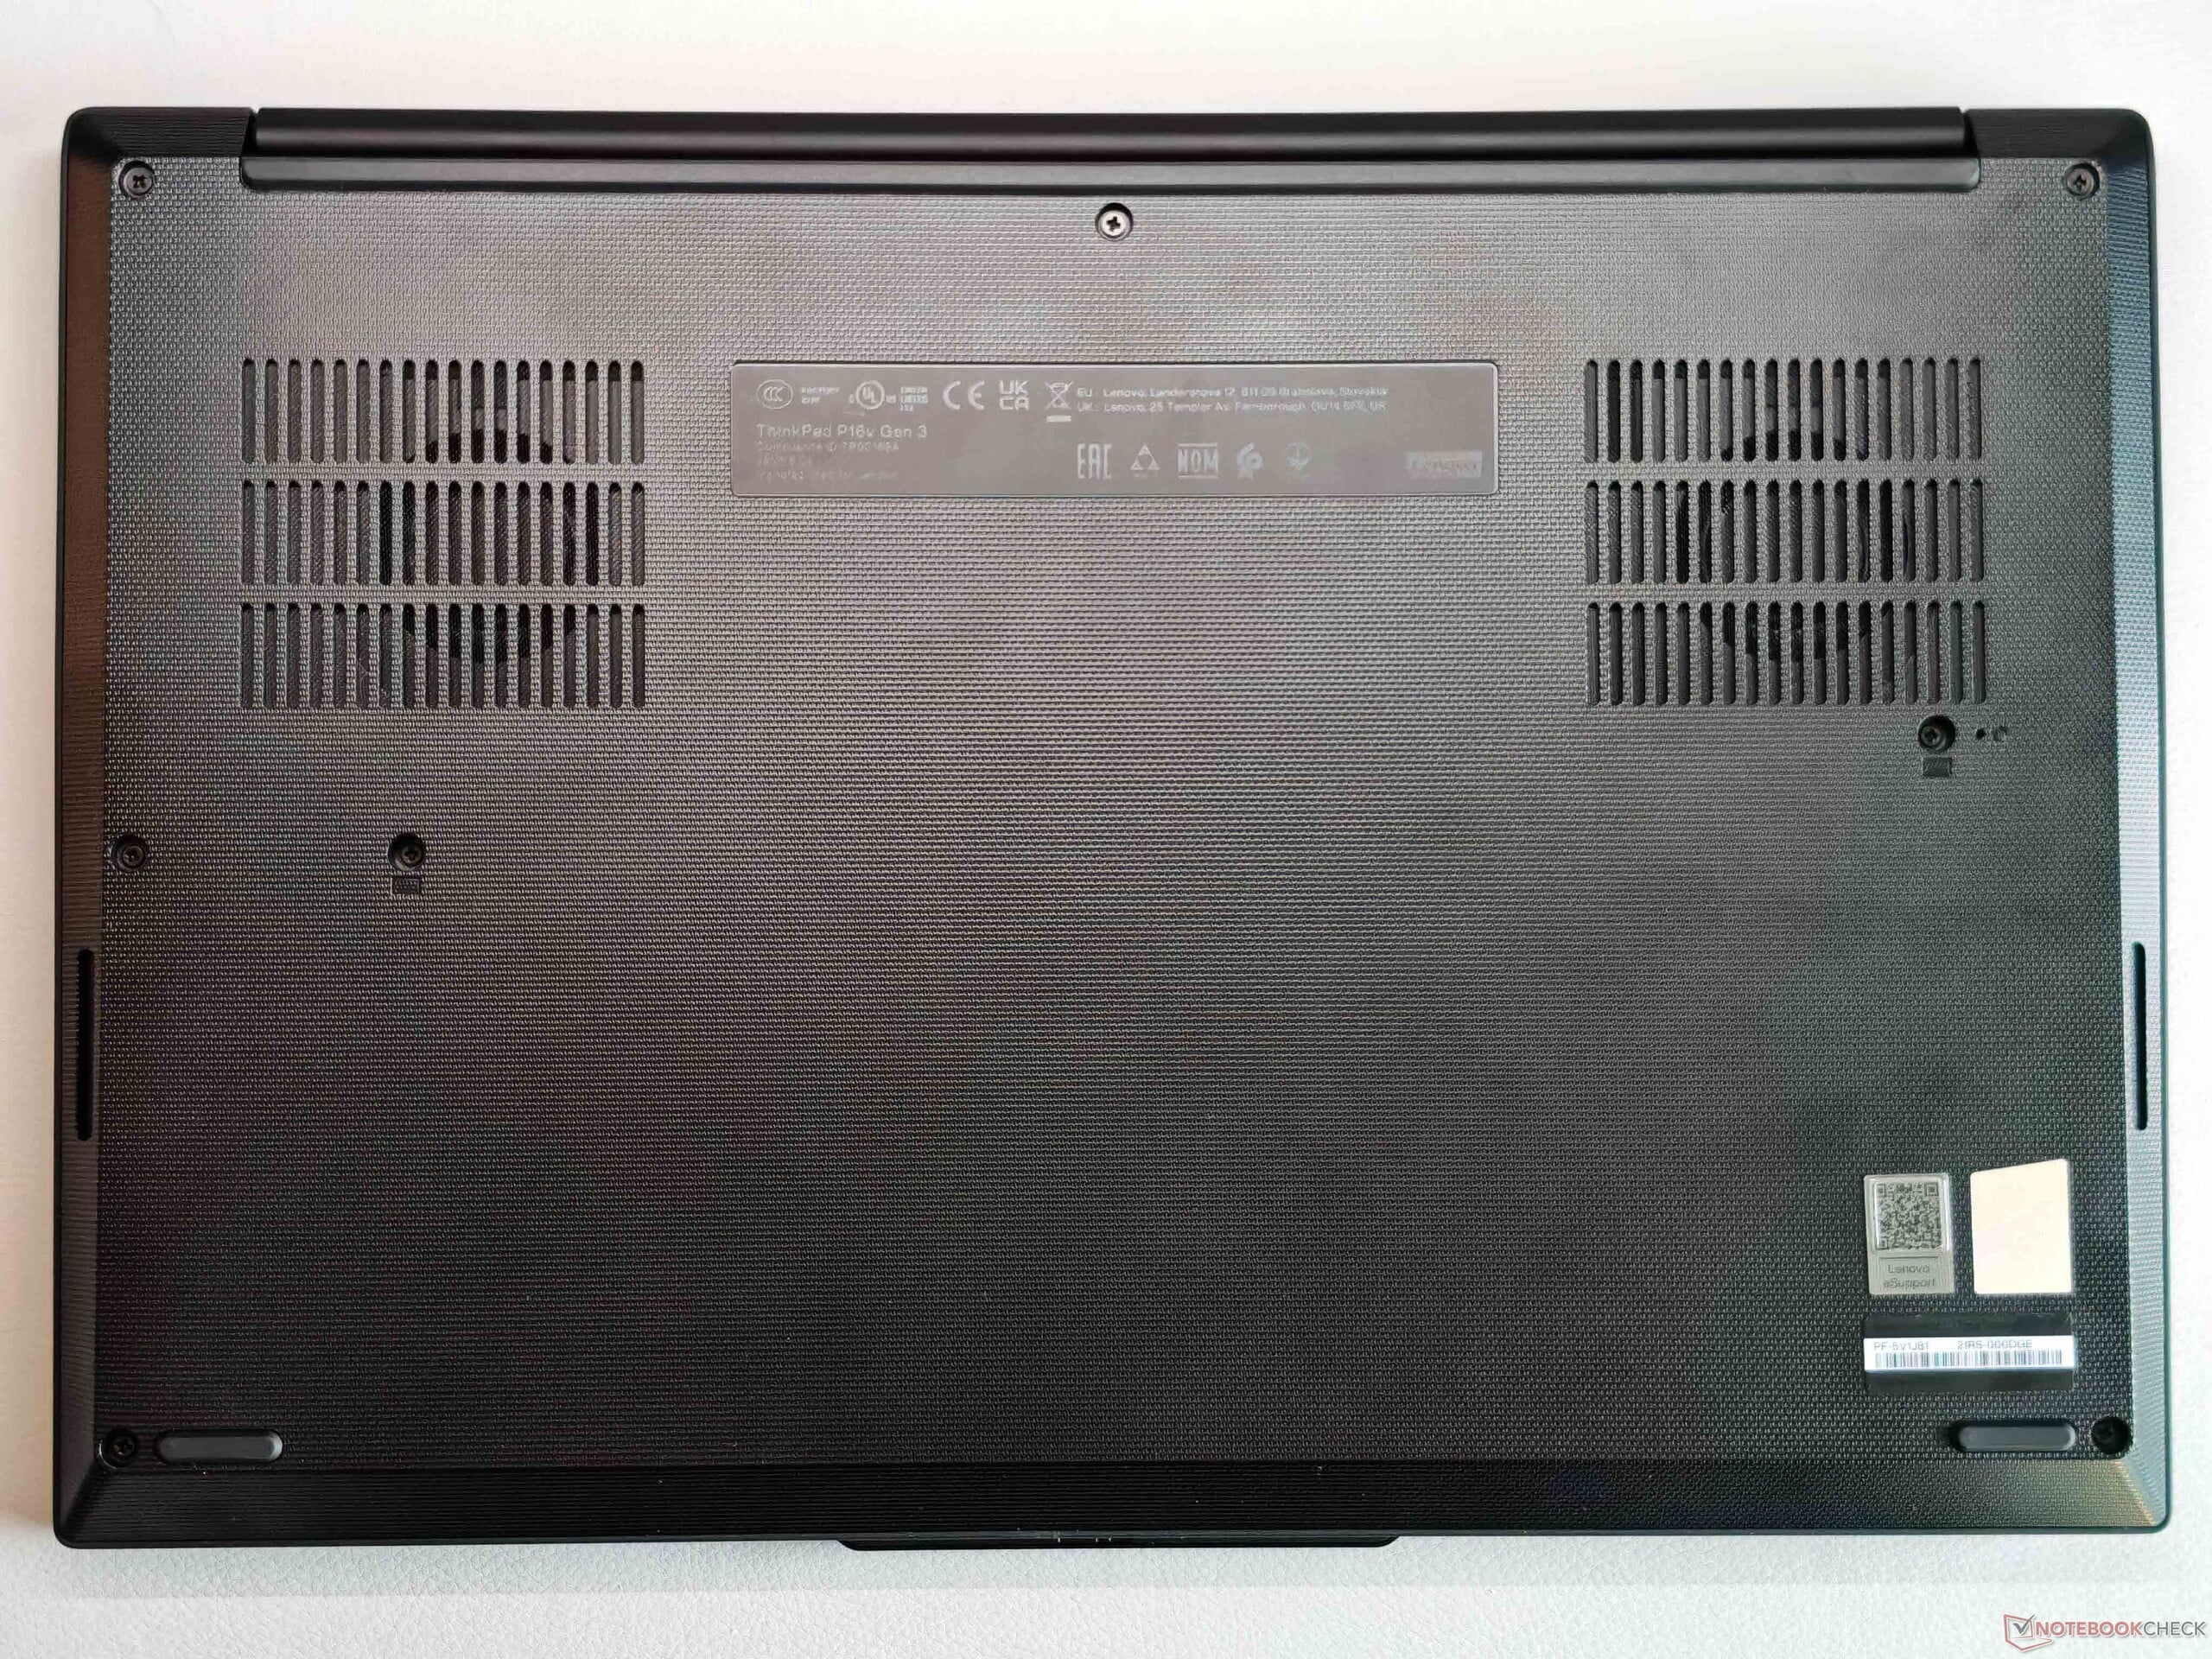
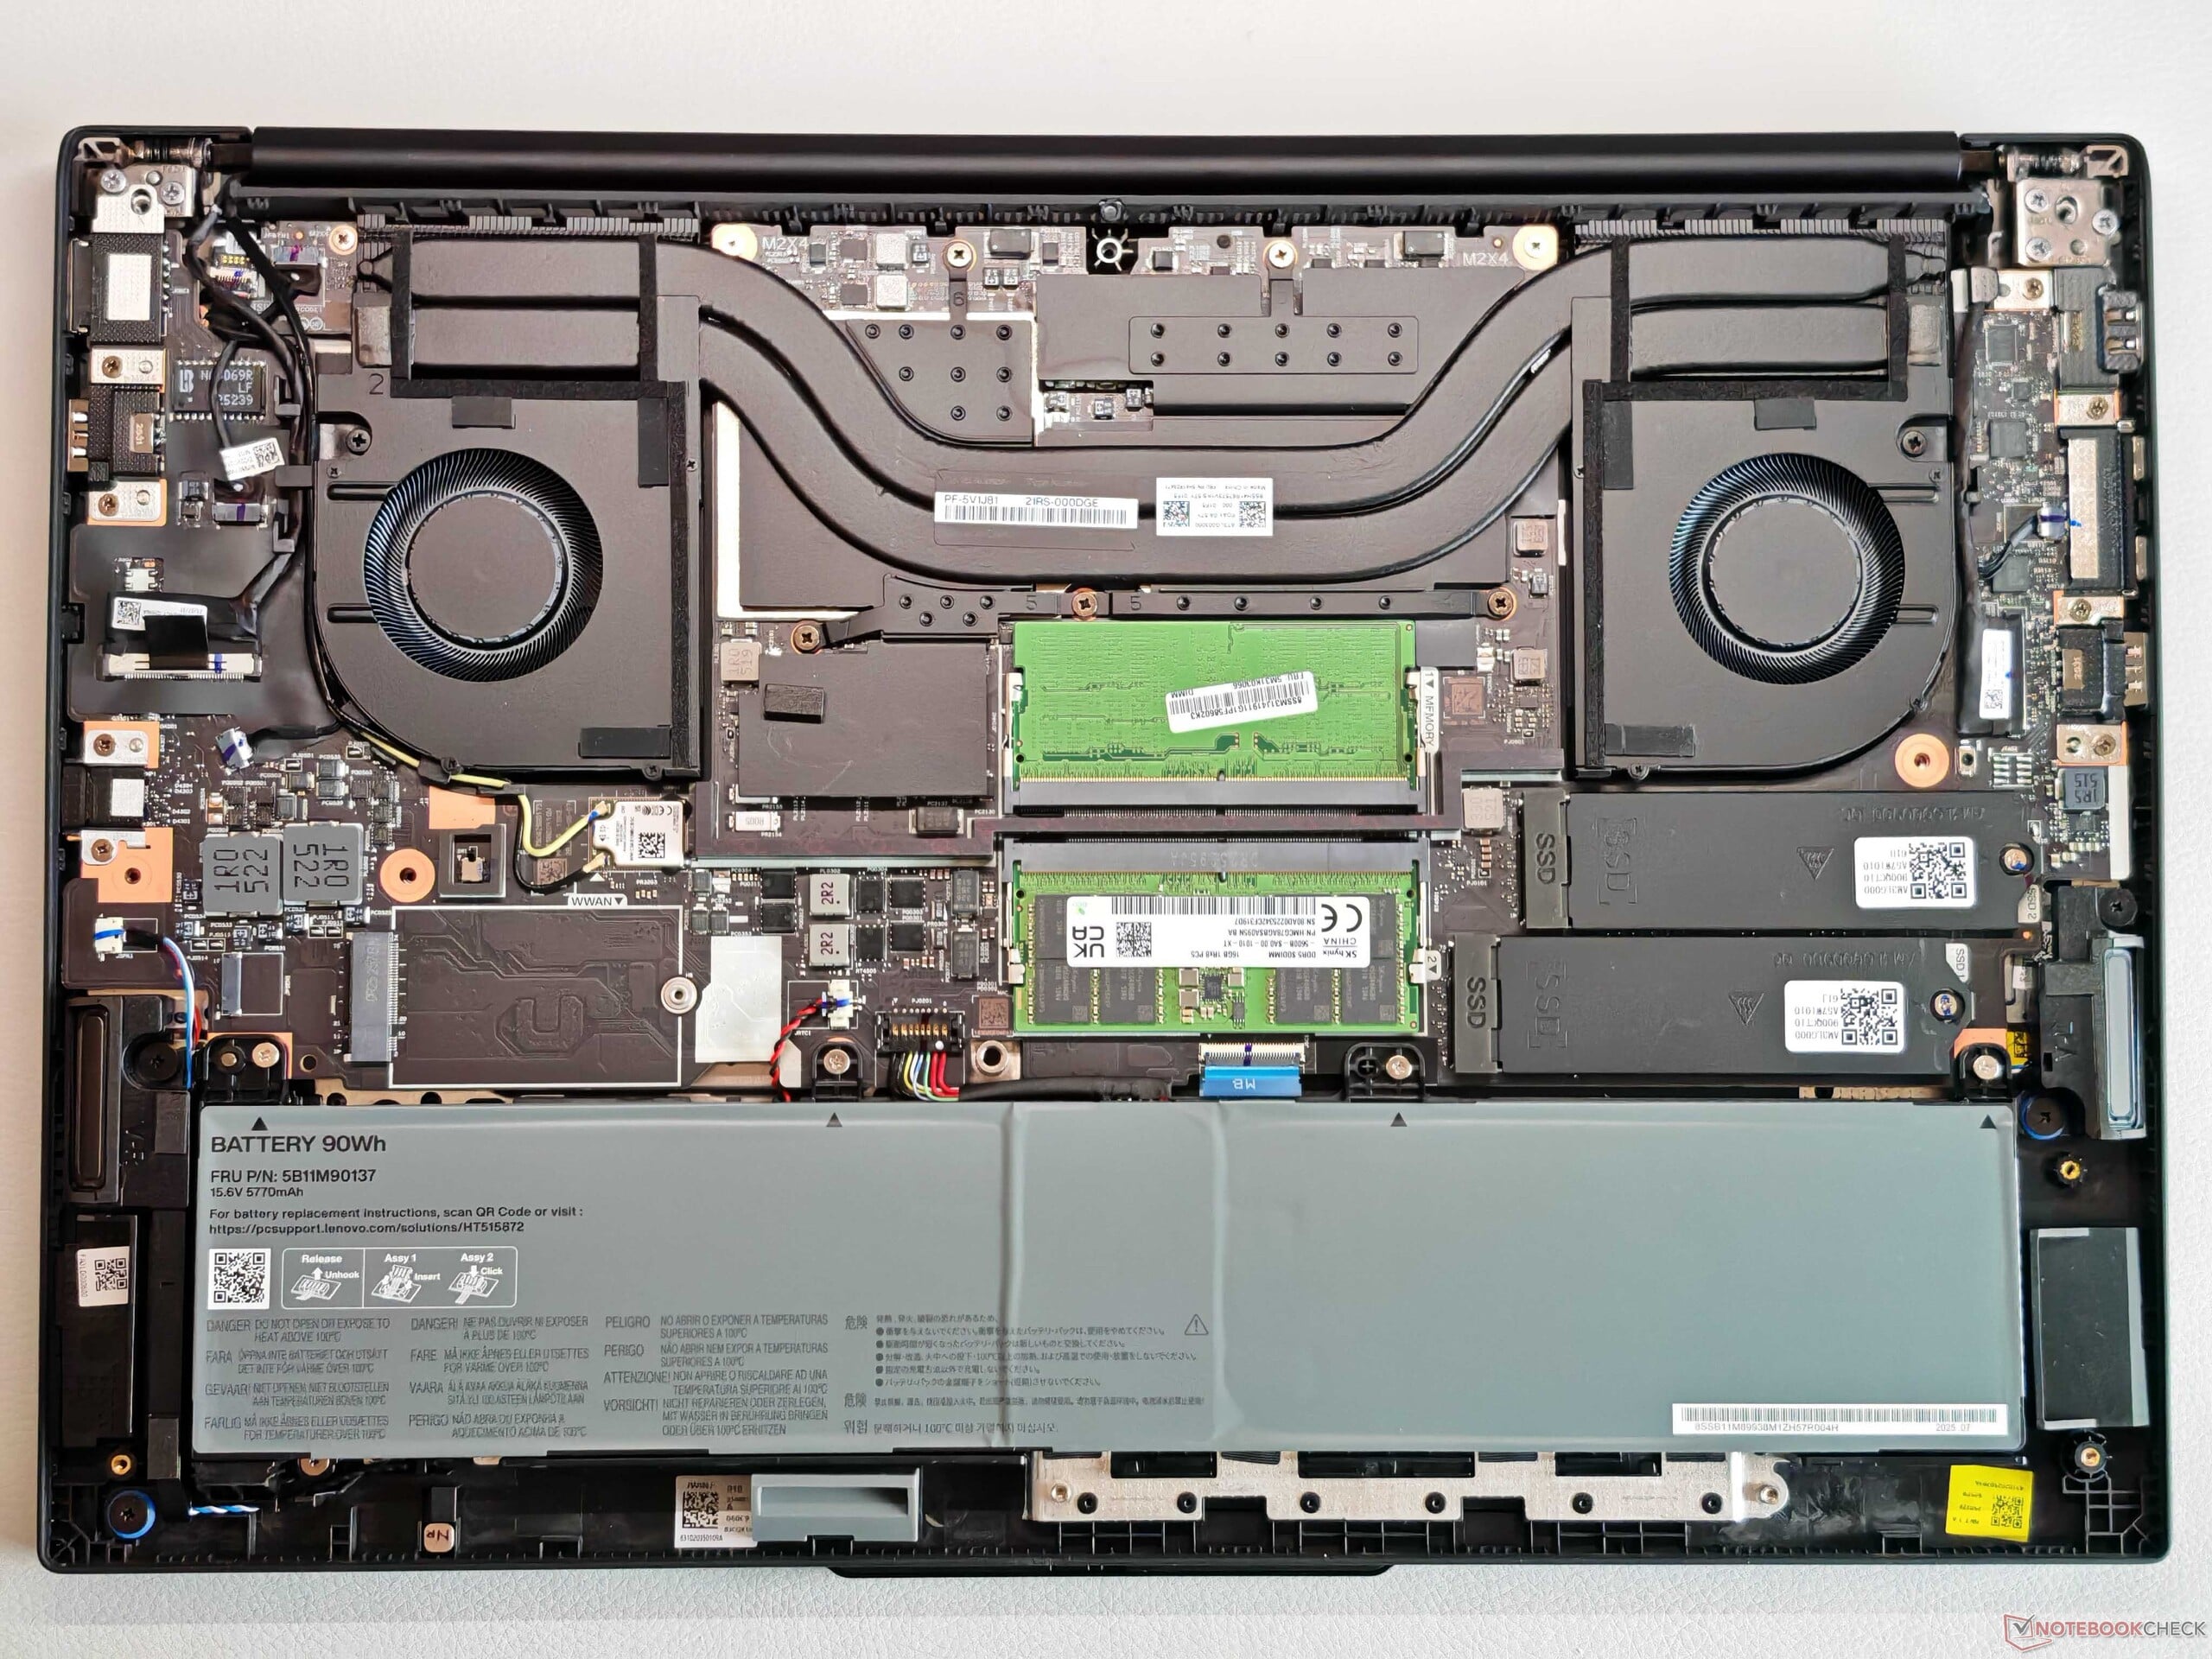
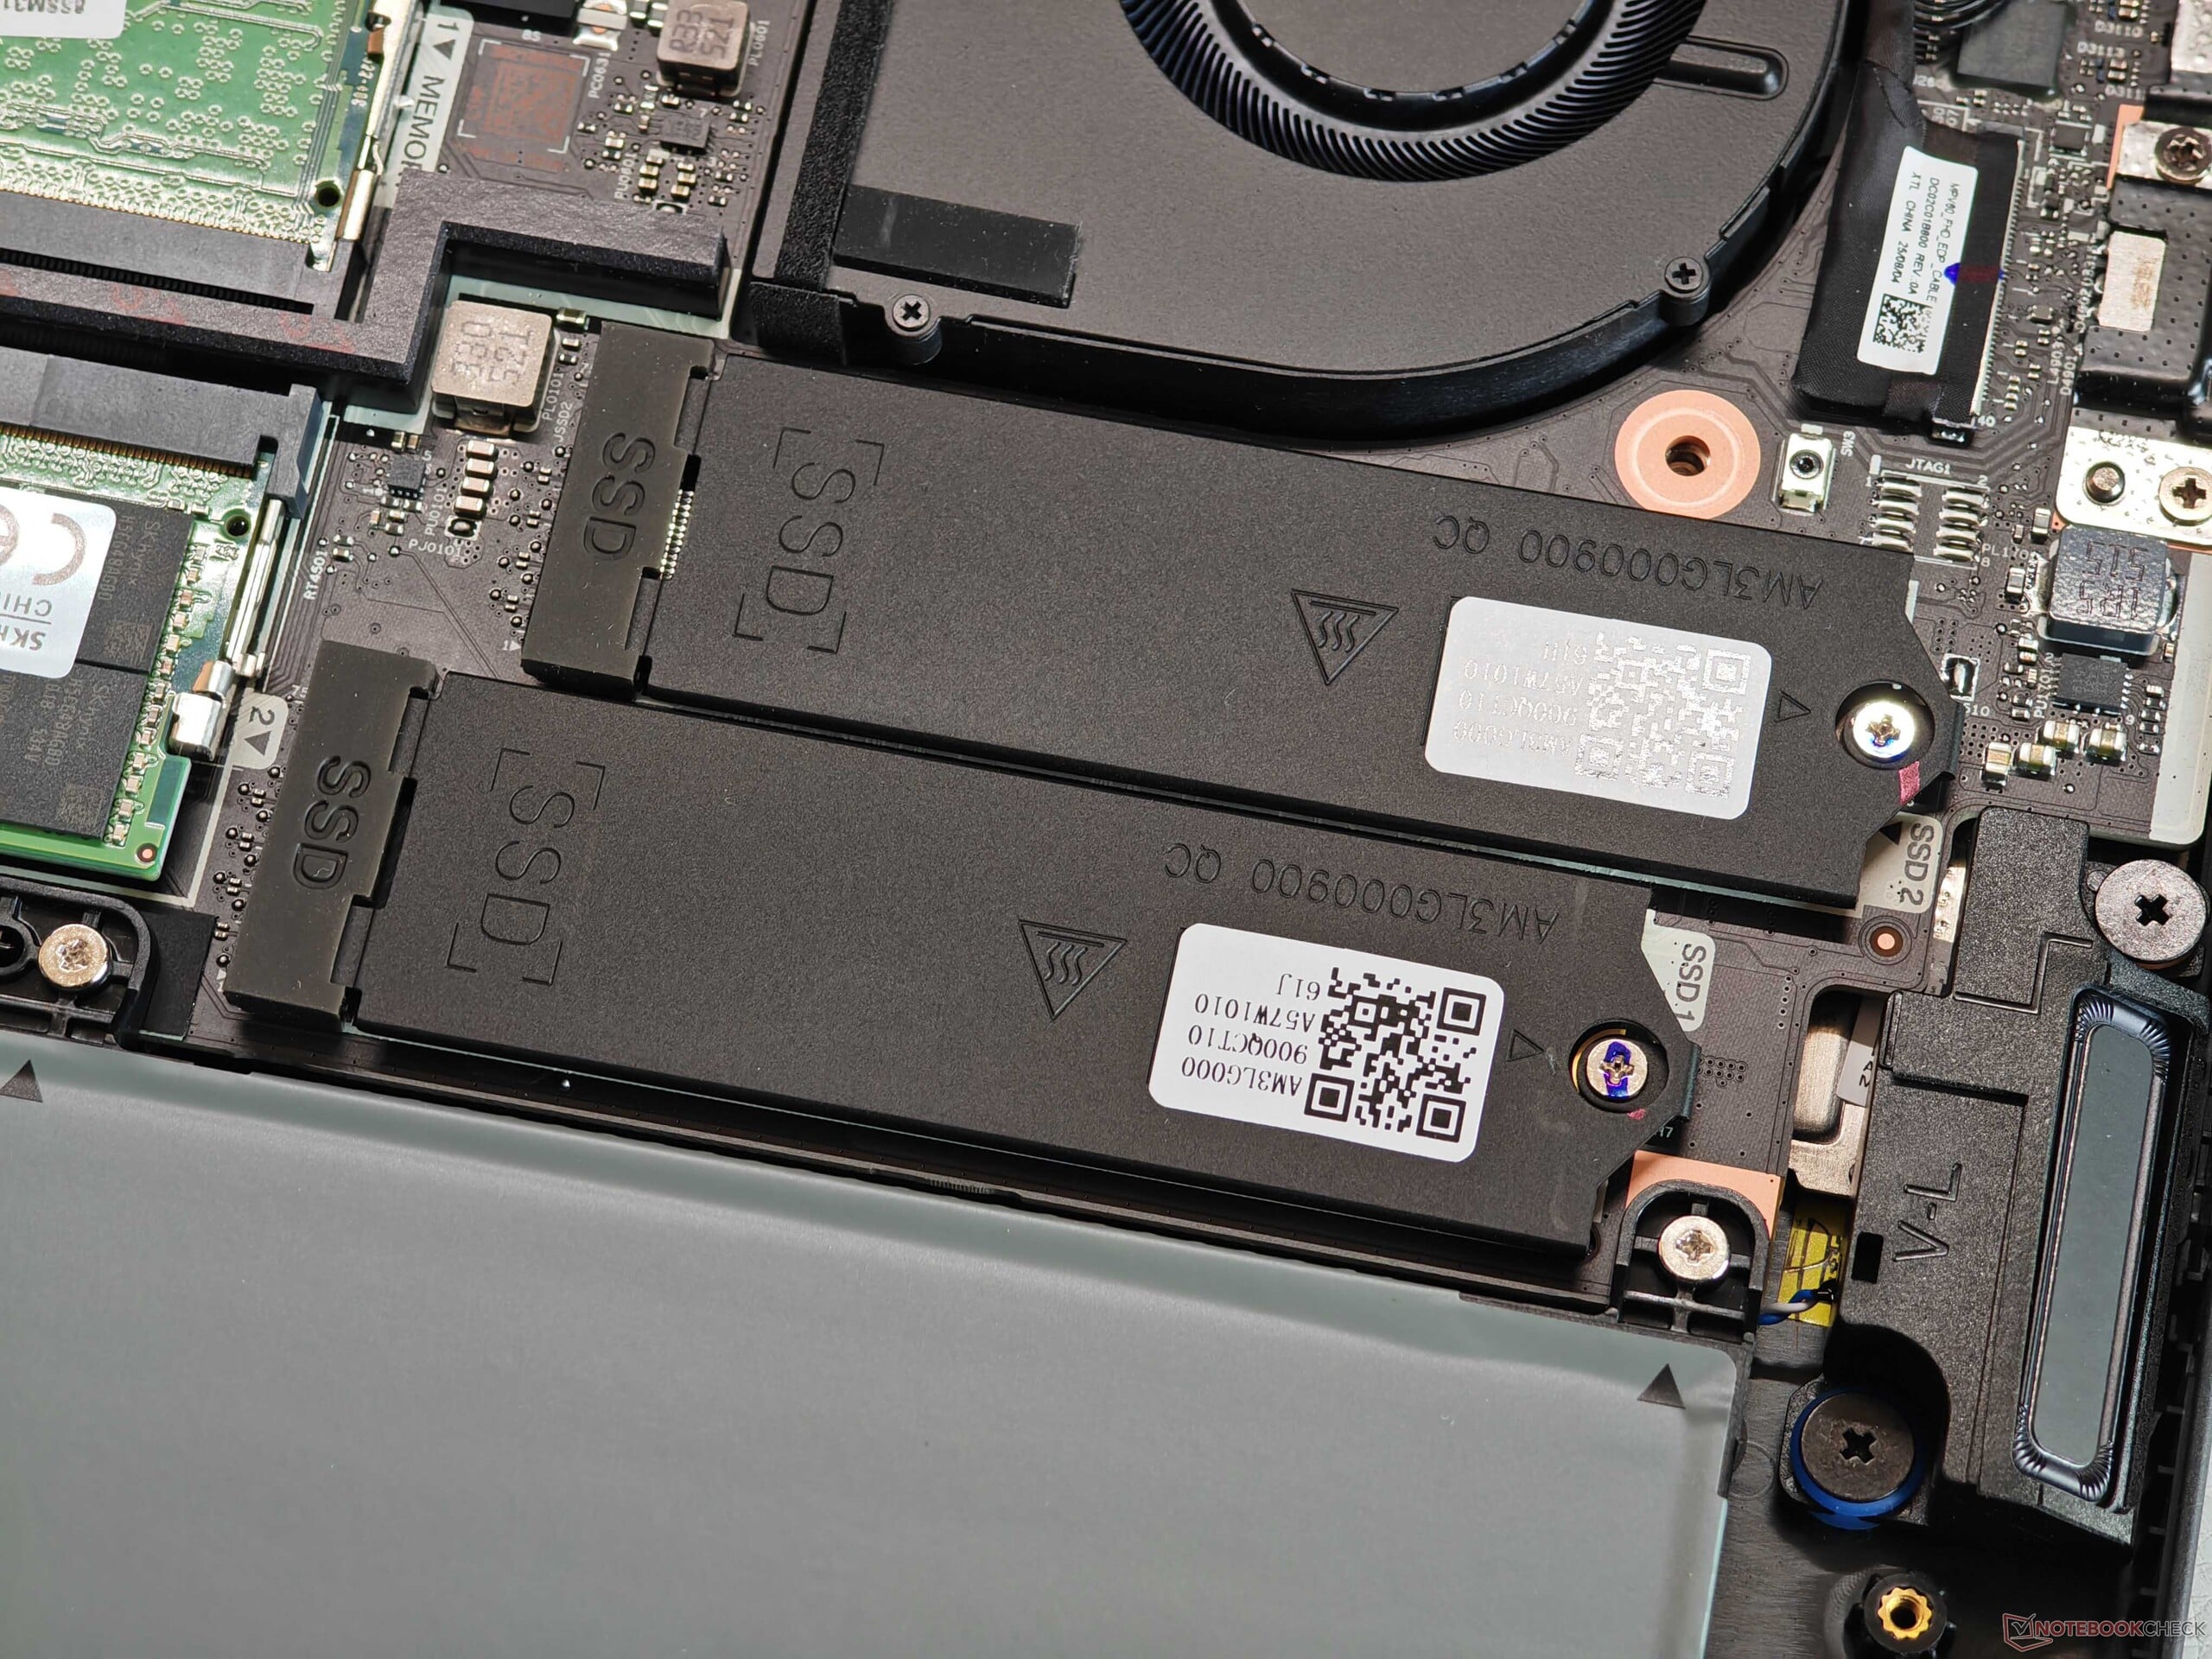
Malgré son prix élevé, le boîtier indique qu'il s'agit d'une station de travail d'entrée de gamme, car il n'est fait usage que de plastique. Le design est typique des ThinkPads actuels, y compris la disgracieuse bosse de l'appareil photo. La finition est globalement bonne, mais la stabilité est décevante, surtout si l'on considère que l'unité de base est plutôt épaisse. La zone centrale du clavier en particulier peut être visiblement bosselée, mais nous n'avons pas réussi à provoquer de craquements. Le couvercle de l'écran se comporte mieux, mais les charnières rebondissent un peu (angle d'ouverture maximal de 180 degrés). Le couvercle lisse en particulier est très sensible aux traces de doigts et difficile à nettoyer. Les options de maintenance sont globalement très bonnes (2 x RAM, 2 x SSD).
Il n'y a pas grand-chose à redire sur les connexions, mais l'un des deux ports Thunderbolt 4 est toujours occupé par le bloc d'alimentation. Le module Wi-Fi 7 atteint des taux de transfert bons et stables, et un port Ethernet est également disponible. Il y a également de la place pour un module WWAN, mais les antennes ne sont pas pré-acheminées (pas de WWAN-ready). Le lecteur de cartes offre des taux de transfert moyens et la webcam de 5 MP (avec obturateur + IR) prend des photos utilisables.


| SD Card Reader | |
| average JPG Copy Test (av. of 3 runs) | |
| HP ZBook X G1i 16 (Toshiba Exceria Pro SDXC 64 GB UHS-II) | |
| HP ZBook Power 16 G11 A (Toshiba Exceria Pro SDXC 64 GB UHS-II) | |
| Moyenne de la classe Workstation (49.6 - 681, n=13, 2 dernières années) | |
| Lenovo ThinkPad P1 Gen 8 (Toshiba Exceria Pro SDXC 64 GB UHS-II) | |
| Lenovo ThinkPad P16v G3 21RS000DGE (Angelbird AV Pro V60) | |
| maximum AS SSD Seq Read Test (1GB) | |
| HP ZBook Power 16 G11 A (Toshiba Exceria Pro SDXC 64 GB UHS-II) | |
| Moyenne de la classe Workstation (87.6 - 1455, n=13, 2 dernières années) | |
| HP ZBook X G1i 16 (Toshiba Exceria Pro SDXC 64 GB UHS-II) | |
| Lenovo ThinkPad P16v G3 21RS000DGE (Angelbird AV Pro V60) | |
| Lenovo ThinkPad P1 Gen 8 (Toshiba Exceria Pro SDXC 64 GB UHS-II) | |
| Networking | |
| Lenovo ThinkPad P16v G3 21RS000DGE | |
| iperf3 transmit AXE11000 | |
| iperf3 receive AXE11000 | |
| Lenovo ThinkPad P1 Gen 8 | |
| iperf3 transmit AXE11000 | |
| iperf3 receive AXE11000 | |
| iperf3 transmit AXE11000 6GHz | |
| iperf3 receive AXE11000 6GHz | |
| HP ZBook X G1i 16 | |
| iperf3 transmit AXE11000 | |
| iperf3 receive AXE11000 | |
| iperf3 transmit AXE11000 6GHz | |
| iperf3 receive AXE11000 6GHz | |
| HP ZBook Power 16 G11 A | |
| iperf3 transmit AXE11000 | |
| iperf3 receive AXE11000 | |
| iperf3 transmit AXE11000 6GHz | |
| iperf3 receive AXE11000 6GHz | |
| Lenovo ThinkPad P16s Gen 4 21RX000YGE | |
| iperf3 transmit AXE11000 | |
| iperf3 receive AXE11000 | |
| iperf3 transmit AXE11000 6GHz | |
| iperf3 receive AXE11000 6GHz | |


Durabilité
Lenovo fournit des informations détaillées sur le bilanCO2 et l'utilisation de matériaux recyclés.


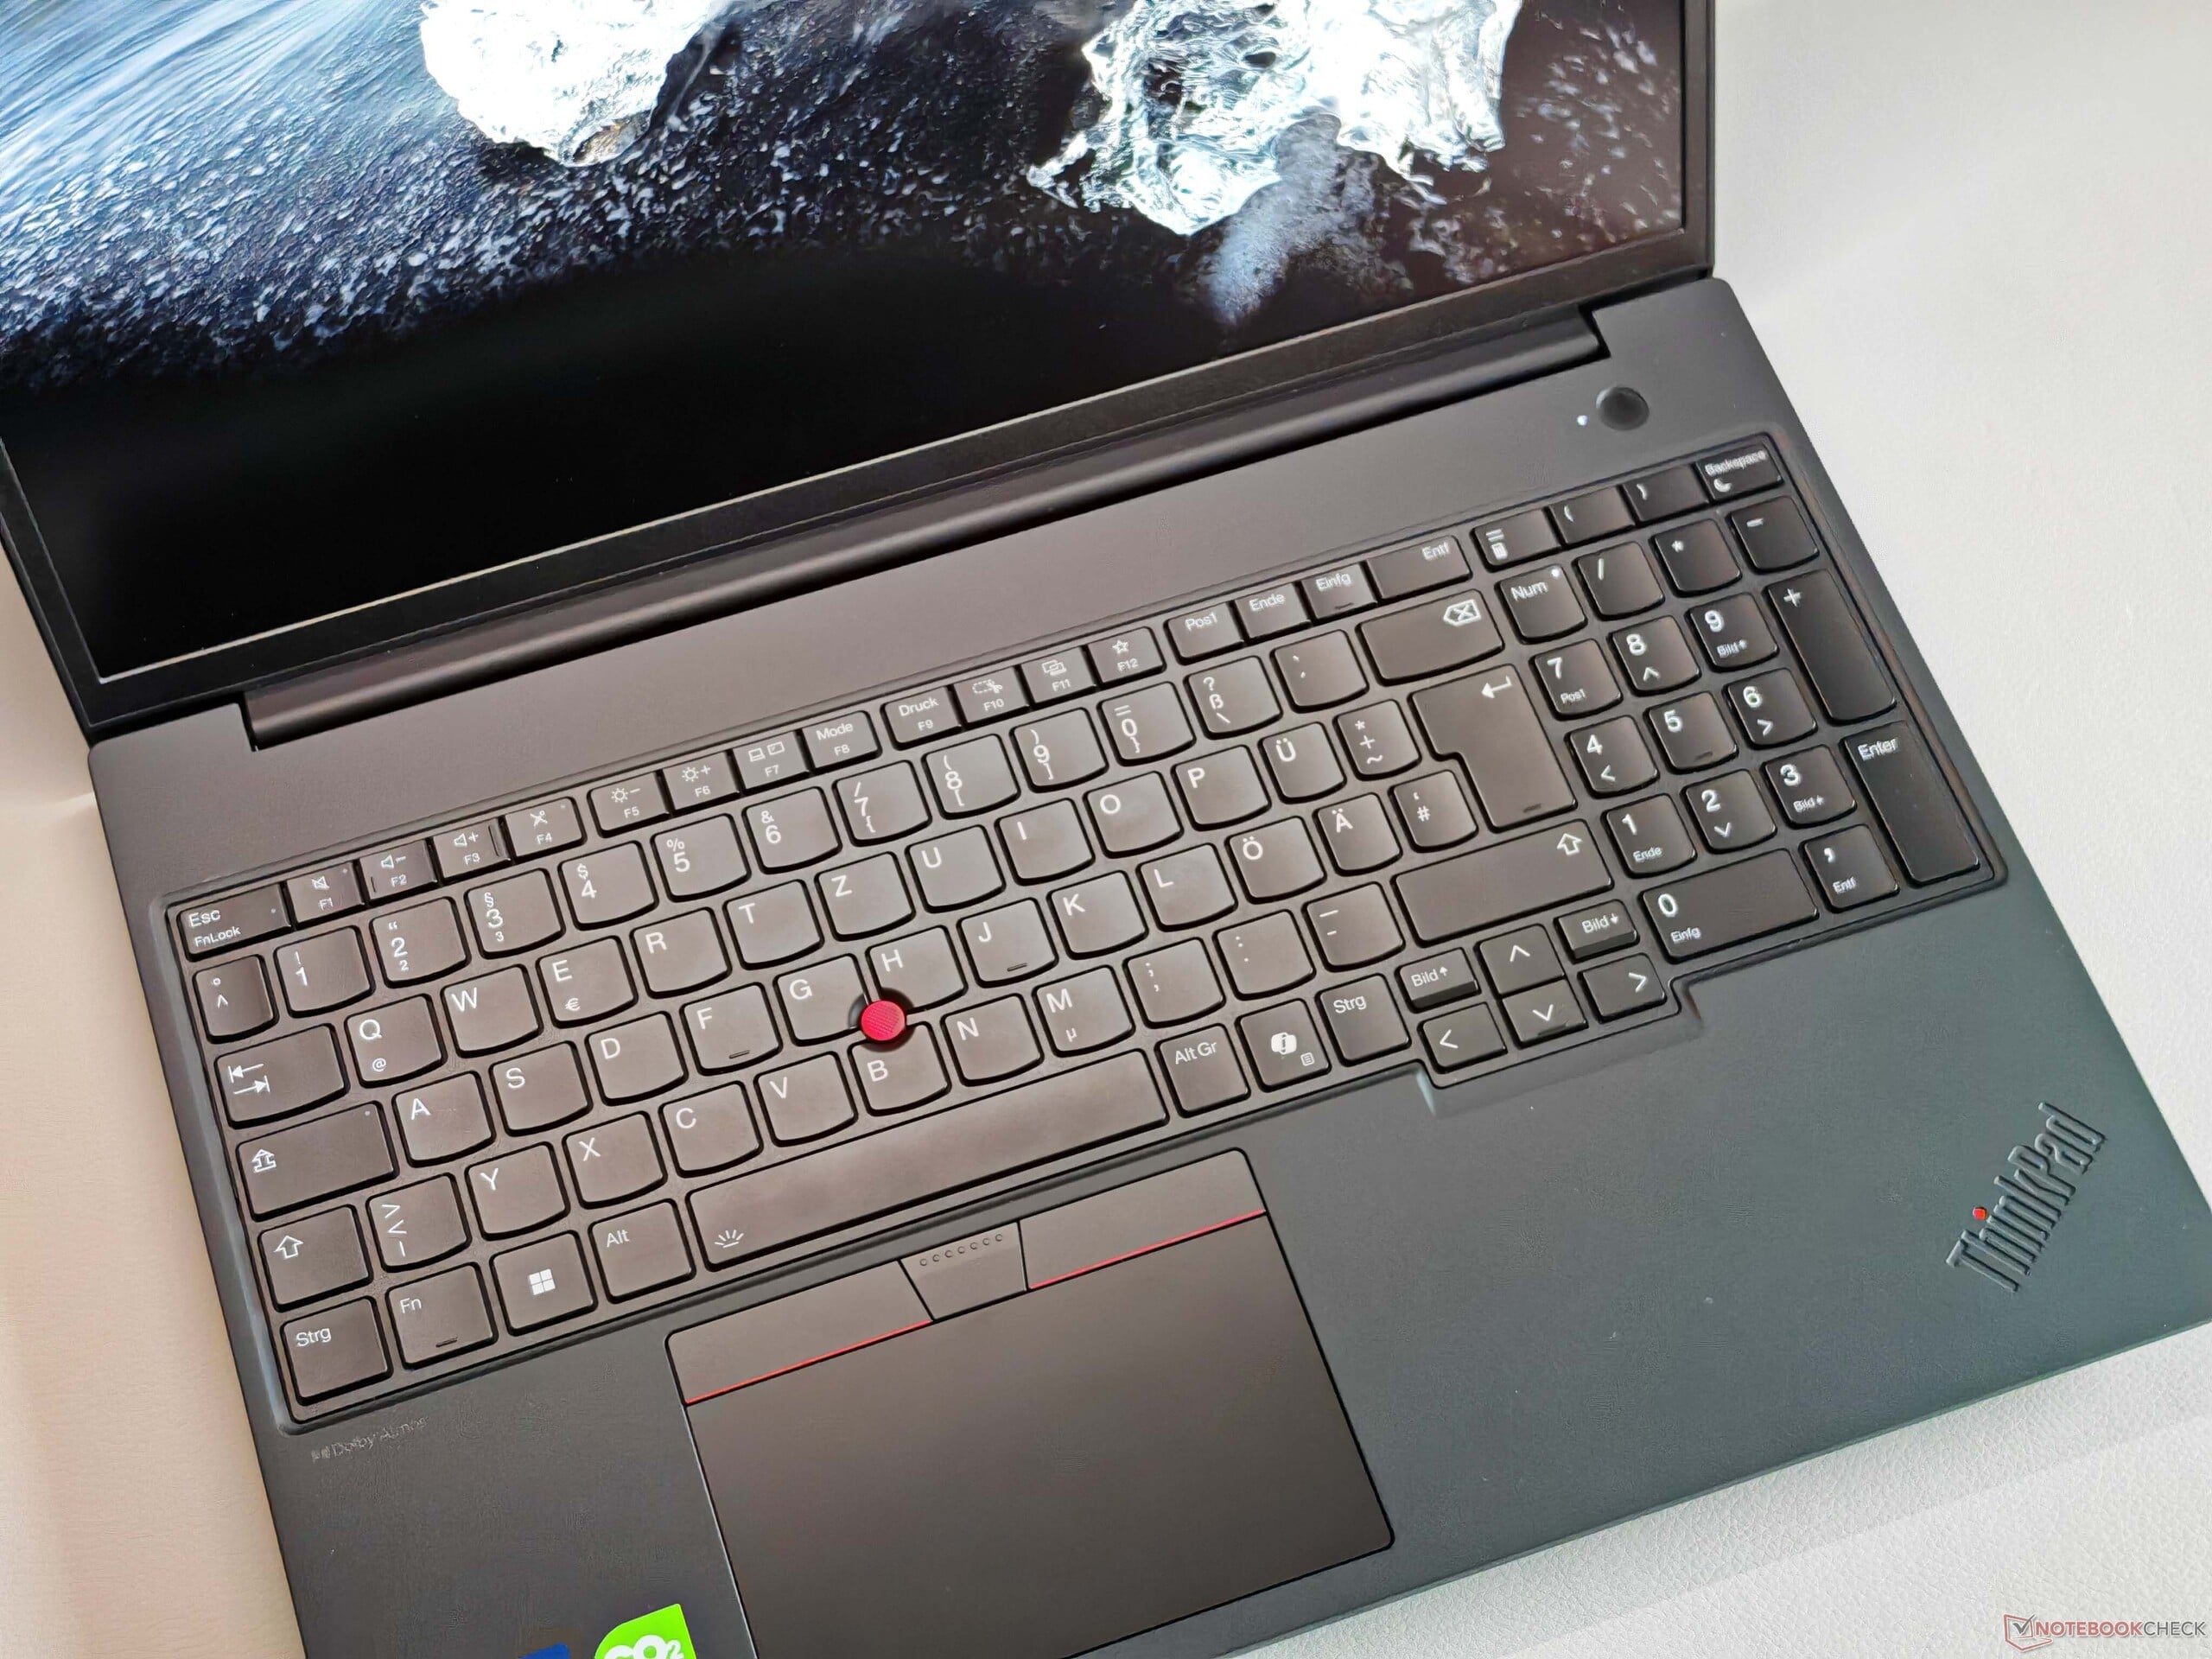
Dispositifs d'entrée - Clavier moyen
Le clavier rétroéclairé, y compris le pavé numérique, est également conforme à la norme ThinkPad actuelle, bien qu'il existe des modèles nettement plus performants dans la gamme actuelle (par ex ThinkPad P1 16 G8). Dans l'ensemble, nous décririons la sensation de frappe comme confortable et précise, mais la concurrence peut faire au moins aussi bien. Le ClickPad (11,5 x 6,7 cm) est assez petit par rapport aux normes modernes en raison des boutons TrackPoint dédiés, mais le fonctionnement est excellent et les clics mécaniques dans la zone inférieure sont également de très haute qualité. Cela vaut également pour les boutons TrackPoint.


Écran - IPS avec 500 cd/m²

Lenovo ne propose que des écrans 60 Hz (IPS et OLED) pour le P16v Gen 3, ce qui est quelque peu surprenant compte tenu du prix élevé. Le modèle standard Full HD IPS (1 920 x 1 200 pixels, 16:10) avec une surface mate est installé dans notre appareil de test. L'impression subjective de l'image est généralement bonne, mais les zones lumineuses semblent légèrement granuleuses lorsqu'on y regarde de plus près. Il n'y a pas de scintillement PWM et les temps de réponse sont généralement peu remarquables.
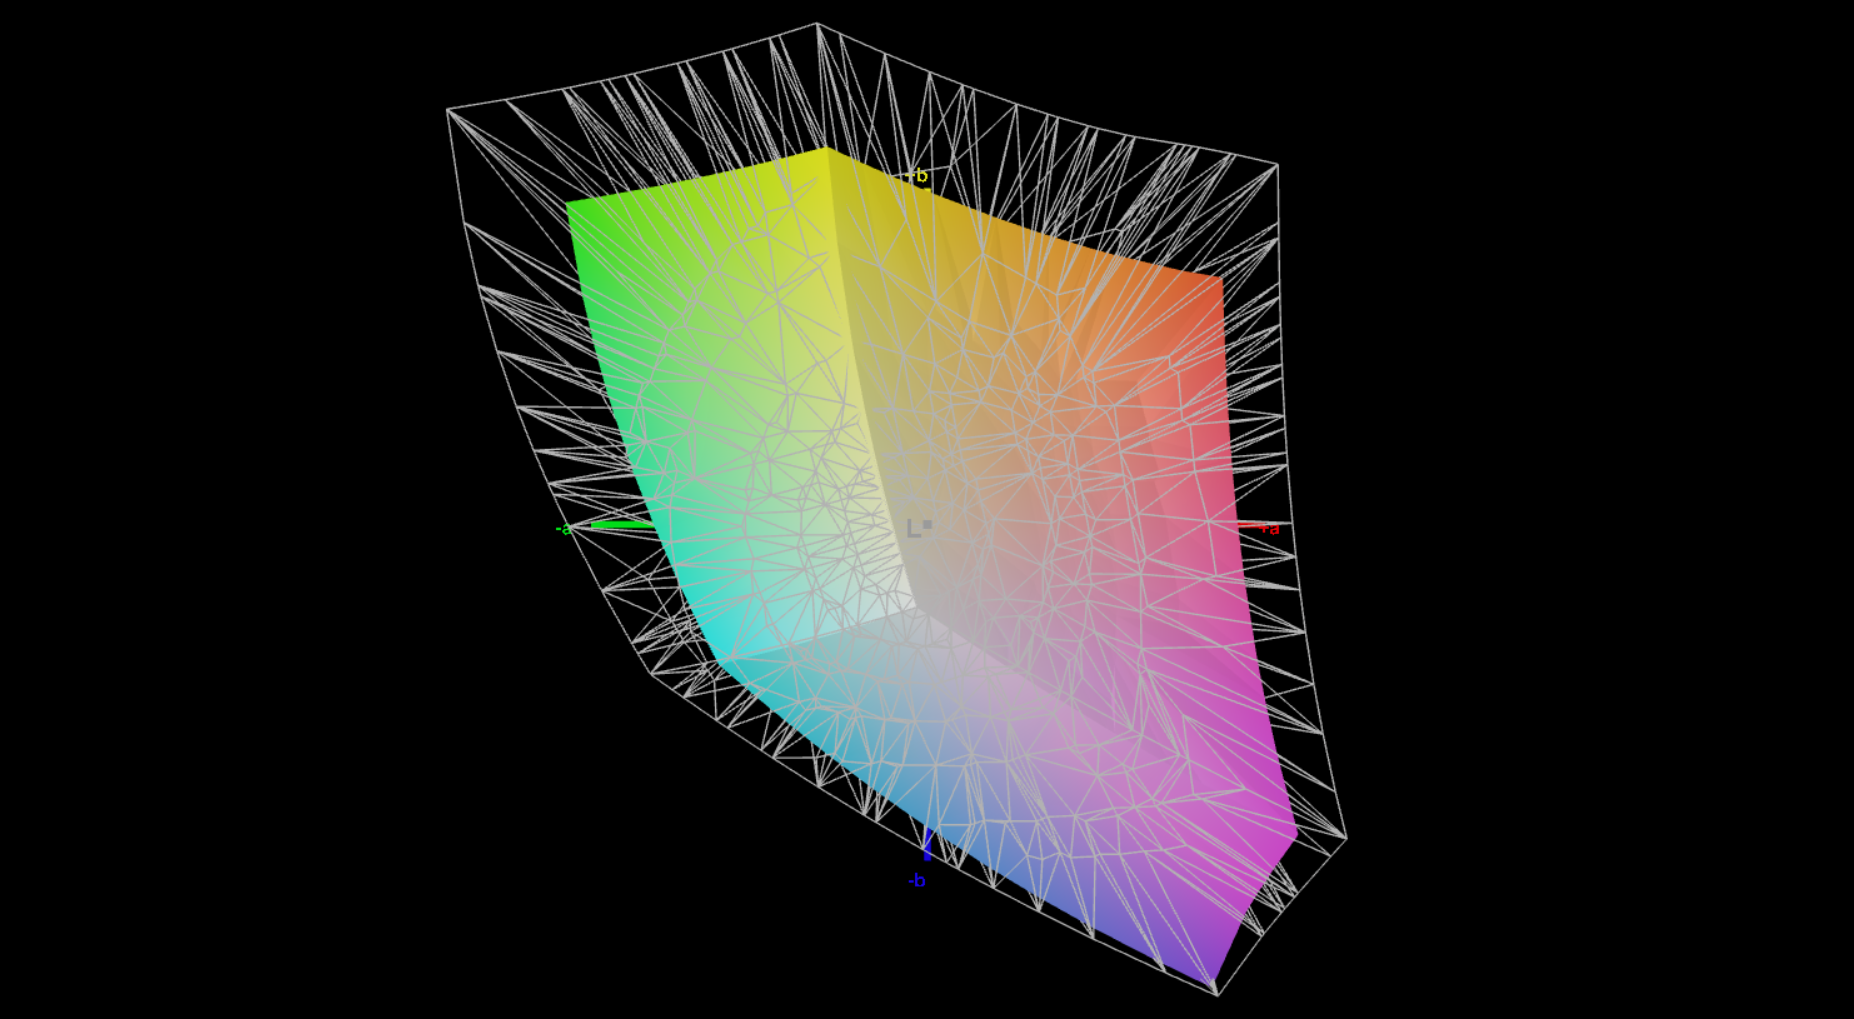
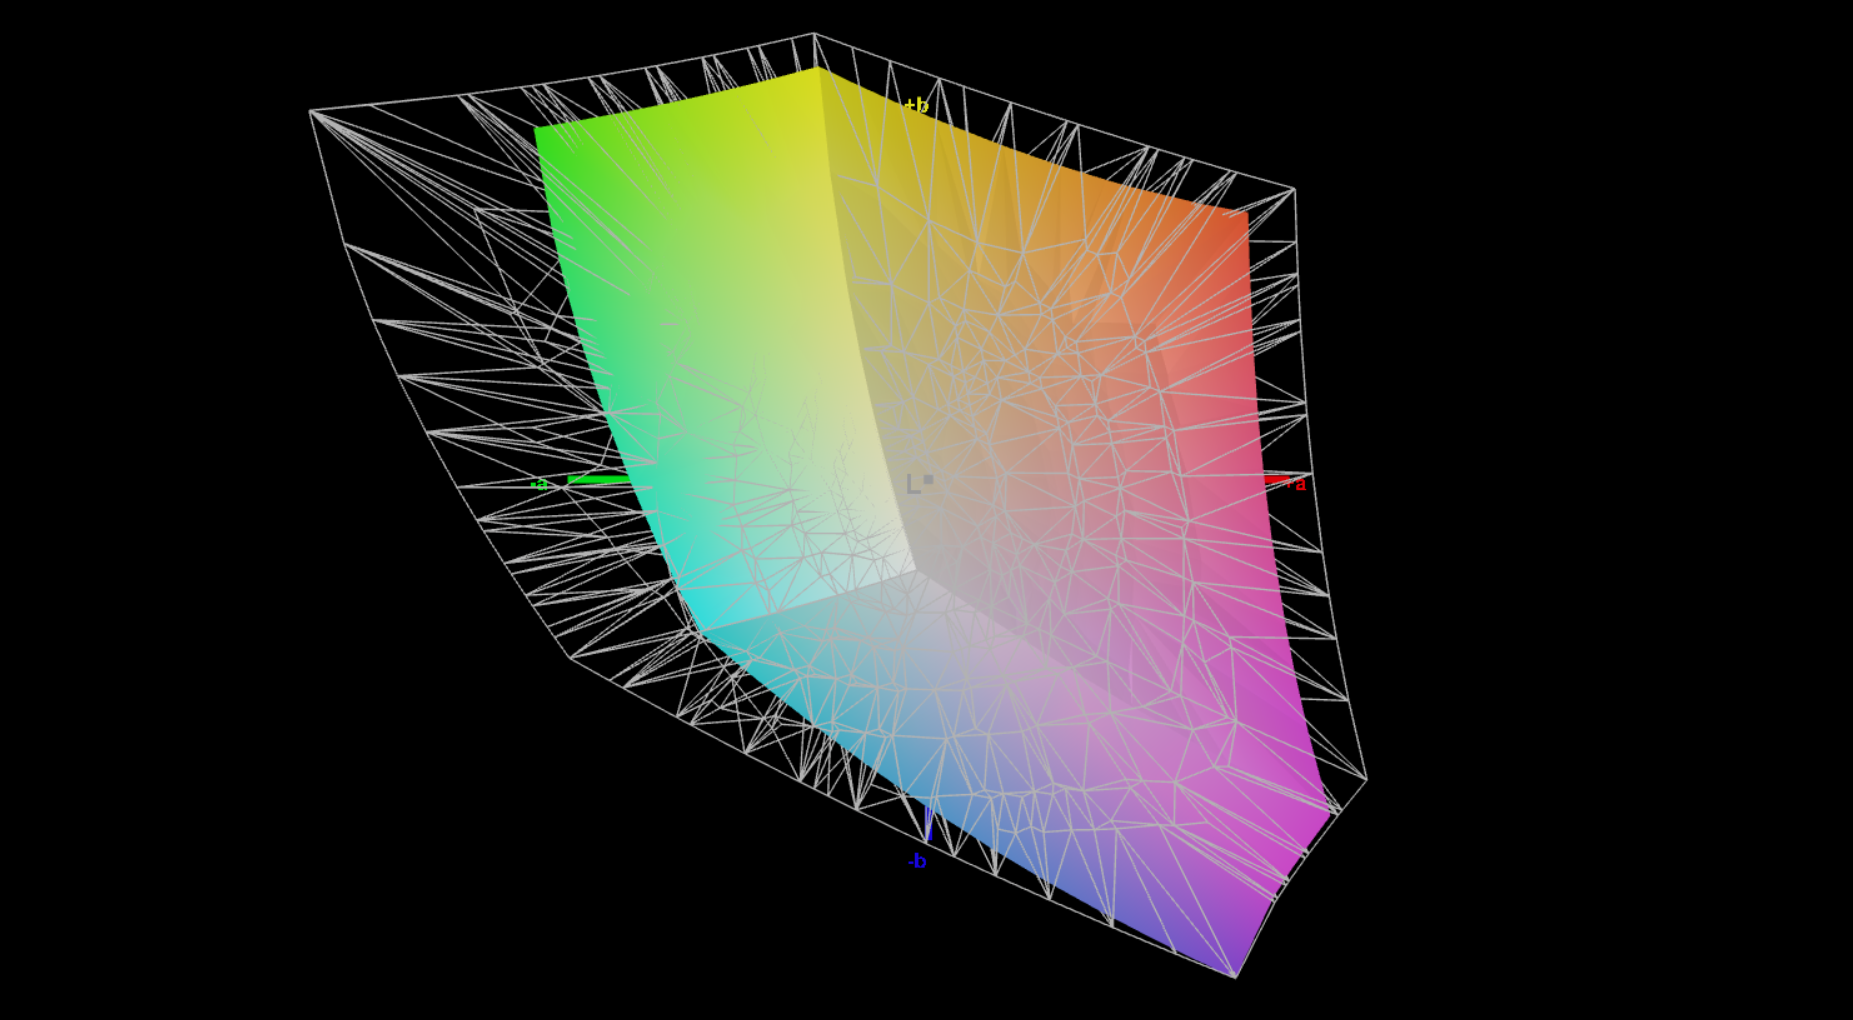
La luminosité moyenne est de ~554 cd/m² et, en conjonction avec le niveau de noir de 0,33 cd/m², il en résulte un rapport de contraste élevé (~1.700:1). Le profil de couleur d'usine montre déjà une bonne performance dans notre analyse avec le logiciel professionnel CalMAN, mais nous avons été en mesure d'améliorer l'écran encore plus avec notre propre étalonnage.
| |||||||||||||||||||||||||
Homogénéité de la luminosité: 90 %
Valeur mesurée au centre, sur batterie: 565 cd/m²
Contraste: 1712:1 (Valeurs des noirs: 0.33 cd/m²)
ΔE ColorChecker Calman: 1.8 | ∀{0.5-29.43 Ø4.74}
calibrated: 0.7
ΔE Greyscale Calman: 2.9 | ∀{0.09-98 Ø4.99}
70.6% AdobeRGB 1998 (Argyll 3D)
99.7% sRGB (Argyll 3D)
68.4% Display P3 (Argyll 3D)
Gamma: 2.23
CCT: 6534 K
| Lenovo ThinkPad P16v G3 21RS000DGE M160NW49 R0, IPS, 1920x1200, 16", 60 Hz | Lenovo ThinkPad P1 Gen 8 Samsung ATNA60KA02-0, Tandem OLED, 3200x2000, 16", 120 Hz | HP ZBook X G1i 16 LG Philips LGD07B3, IPS, 2560x1600, 16", 120 Hz | HP ZBook Power 16 G11 A AUOA0A9, IPS, 2560x1600, 16", 120 Hz | Lenovo ThinkPad P16s Gen 4 21RX000YGE N160JCA-GT1, IPS LED, 1920x1200, 16", 60 Hz | |
|---|---|---|---|---|---|
| Display | 27% | 28% | 0% | -4% | |
| Display P3 Coverage (%) | 68.4 | 98.8 44% | 97.2 42% | 69.1 1% | 65.8 -4% |
| sRGB Coverage (%) | 99.7 | 100 0% | 100 0% | 97.7 -2% | 96.8 -3% |
| AdobeRGB 1998 Coverage (%) | 70.6 | 97.5 38% | 99.9 42% | 71 1% | 67.8 -4% |
| Response Times | 97% | -51% | 53% | -17% | |
| Response Time Grey 50% / Grey 80% * (ms) | 39.2 ? | 0.57 ? 99% | 45.5 ? -16% | 13.6 ? 65% | 29.4 ? 25% |
| Response Time Black / White * (ms) | 14.1 ? | 0.73 ? 95% | 26.1 ? -85% | 8.4 ? 40% | 22.4 ? -59% |
| PWM Frequency (Hz) | 1199 | 26536 ? | |||
| PWM Amplitude * (%) | 18 | 47 | |||
| Screen | 15% | -41% | -35% | -27% | |
| Brightness middle (cd/m²) | 565 | 561.8 -1% | 461.8 -18% | 470.7 -17% | 540 -4% |
| Brightness (cd/m²) | 554 | 566 2% | 427 -23% | 431 -22% | 516 -7% |
| Brightness Distribution (%) | 90 | 99 10% | 88 -2% | 88 -2% | 93 3% |
| Black Level * (cd/m²) | 0.33 | 0.46 -39% | 0.57 -73% | 0.37 -12% | |
| Contrast (:1) | 1712 | 1004 -41% | 826 -52% | 1459 -15% | |
| Colorchecker dE 2000 * | 1.8 | 1.29 28% | 4.08 -127% | 2.16 -20% | 3.4 -89% |
| Colorchecker dE 2000 max. * | 4.2 | 2.96 30% | 8.1 -93% | 4.39 -5% | 5.6 -33% |
| Colorchecker dE 2000 calibrated * | 0.7 | 0.81 -16% | 0.75 -7% | 1.37 -96% | 0.9 -29% |
| Greyscale dE 2000 * | 2.9 | 1.4 52% | 3.5 -21% | 3.7 -28% | 4.5 -55% |
| Gamma | 2.23 99% | 2.23 99% | 2.15 102% | 2.38 92% | 2.51 88% |
| CCT | 6534 99% | 6319 103% | 6715 97% | 6765 96% | 6294 103% |
| Moyenne finale (programmes/paramètres) | 46% /
32% | -21% /
-28% | 6% /
-15% | -16% /
-20% |
* ... Moindre est la valeur, meilleures sont les performances


Temps de réponse de l'écran
| ↔ Temps de réponse noir à blanc | ||
|---|---|---|
| 14.1 ms ... hausse ↗ et chute ↘ combinées | ↗ 4.6 ms hausse |  |
| ↘ 9.5 ms chute | ||
| L'écran montre de bons temps de réponse, mais insuffisant pour du jeu compétitif. En comparaison, tous les appareils testés affichent entre 0.1 (minimum) et 240 (maximum) ms. » 35 % des appareils testés affichent de meilleures performances. Cela signifie que les latences relevées sont meilleures que la moyenne (20 ms) de tous les appareils testés. | ||
| ↔ Temps de réponse gris 50% à gris 80% | ||
| 39.2 ms ... hausse ↗ et chute ↘ combinées | ↗ 17.5 ms hausse |  |
| ↘ 21.7 ms chute | ||
| L'écran souffre de latences très élevées, à éviter pour le jeu. En comparaison, tous les appareils testés affichent entre 0.165 (minimum) et 636 (maximum) ms. » 59 % des appareils testés affichent de meilleures performances. Cela signifie que les latences relevées sont moins bonnes que la moyenne (31.3 ms) de tous les appareils testés. | ||
Scintillement / MLI (Modulation de largeur d'impulsion)
| Scintillement / MLI (Modulation de largeur d'impulsion) non décelé | 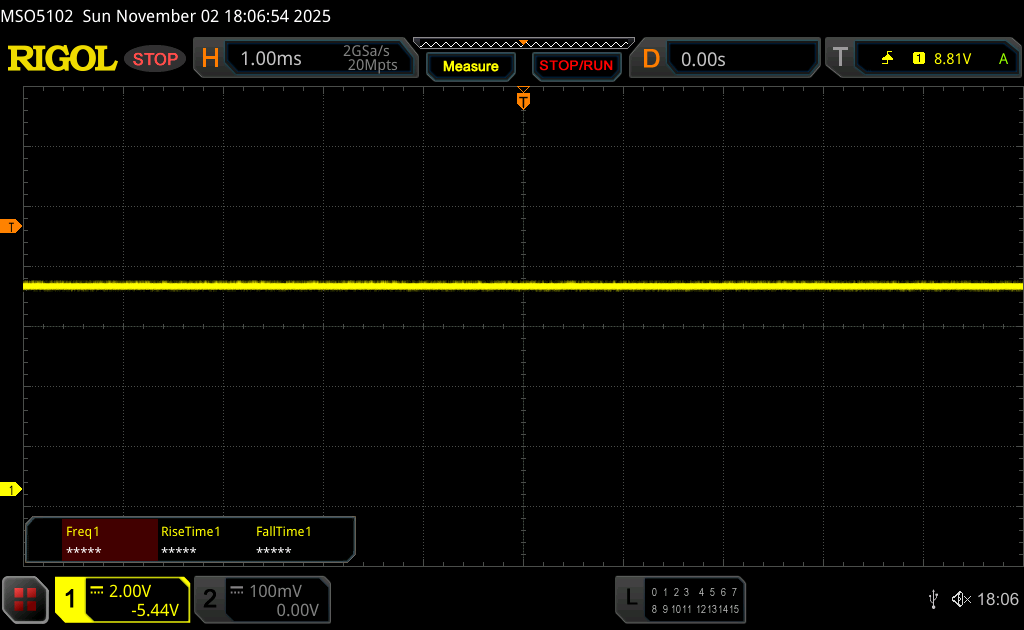 | ||
En comparaison, 53 % des appareils testés n'emploient pas MDI pour assombrir leur écran. Nous avons relevé une moyenne à 7923 (minimum : 5 - maximum : 343500) Hz dans le cas où une MDI était active. | |||


Performance - Arrow Lake & RTX PRO 2000

Conditions d'essai
Les profils énergétiques de Lenovo sont directement liés aux paramètres Windows des ThinkPad. Nous avons effectué les tests et les mesures en mode " Meilleures performances".
Processeur
Le dispositif de test contient les éléments suivants Intel Core Ultra 7 255H (Arrow Lake), qui peut consommer jusqu'à 115 watts sur de courtes périodes et 70 watts en continu. Les performances du processeur sont bonnes dans l'ensemble, même si certains concurrents sont légèrement plus rapides. En mode batterie, le processeur peut consommer un maximum de 40 watts, ce qui explique que les performances multicœurs soient inférieures d'environ 14 %.
Test d'endurance multiple Cinebench R15
Cinebench R23: Multi Core | Single Core
Cinebench R20: CPU (Multi Core) | CPU (Single Core)
Cinebench R15: CPU Multi 64Bit | CPU Single 64Bit
Blender: v2.79 BMW27 CPU
7-Zip 18.03: 7z b 4 | 7z b 4 -mmt1
Geekbench 6.6: Multi-Core | Single-Core
Geekbench 5.5: Multi-Core | Single-Core
HWBOT x265 Benchmark v2.2: 4k Preset
LibreOffice : 20 Documents To PDF
R Benchmark 2.5: Overall mean
| CPU Performance rating | |
| Moyenne de la classe Workstation | |
| HP ZBook X G1i 16 | |
| Lenovo ThinkPad P16v G3 21RS000DGE | |
| Lenovo ThinkPad P1 Gen 8 | |
| Moyenne Intel Core Ultra 7 255H | |
| Lenovo ThinkPad P16s Gen 4 21RX000YGE | |
| HP ZBook Power 16 G11 A | |
| Cinebench R23 / Multi Core | |
| Moyenne de la classe Workstation (14055 - 38520, n=27, 2 dernières années) | |
| Lenovo ThinkPad P1 Gen 8 | |
| HP ZBook X G1i 16 | |
| Lenovo ThinkPad P16v G3 21RS000DGE | |
| Moyenne Intel Core Ultra 7 255H (16105 - 22578, n=20) | |
| Lenovo ThinkPad P16s Gen 4 21RX000YGE | |
| HP ZBook Power 16 G11 A | |
| Cinebench R23 / Single Core | |
| Lenovo ThinkPad P16v G3 21RS000DGE | |
| Moyenne Intel Core Ultra 7 255H (1874 - 2152, n=20) | |
| HP ZBook X G1i 16 | |
| Lenovo ThinkPad P1 Gen 8 | |
| Lenovo ThinkPad P16s Gen 4 21RX000YGE | |
| Moyenne de la classe Workstation (1712 - 2228, n=27, 2 dernières années) | |
| HP ZBook Power 16 G11 A | |
| Cinebench R20 / CPU (Multi Core) | |
| Moyenne de la classe Workstation (5471 - 15043, n=27, 2 dernières années) | |
| Lenovo ThinkPad P1 Gen 8 | |
| HP ZBook X G1i 16 | |
| Lenovo ThinkPad P16v G3 21RS000DGE | |
| Moyenne Intel Core Ultra 7 255H (6356 - 8860, n=19) | |
| Lenovo ThinkPad P16s Gen 4 21RX000YGE | |
| HP ZBook Power 16 G11 A | |
| Cinebench R20 / CPU (Single Core) | |
| Lenovo ThinkPad P16v G3 21RS000DGE | |
| Lenovo ThinkPad P16s Gen 4 21RX000YGE | |
| Moyenne Intel Core Ultra 7 255H (743 - 826, n=19) | |
| HP ZBook X G1i 16 | |
| Moyenne de la classe Workstation (671 - 857, n=27, 2 dernières années) | |
| Lenovo ThinkPad P1 Gen 8 | |
| HP ZBook Power 16 G11 A | |
| Cinebench R15 / CPU Multi 64Bit | |
| Moyenne de la classe Workstation (2489 - 5810, n=27, 2 dernières années) | |
| HP ZBook X G1i 16 | |
| Lenovo ThinkPad P1 Gen 8 | |
| Lenovo ThinkPad P16v G3 21RS000DGE | |
| Lenovo ThinkPad P16s Gen 4 21RX000YGE | |
| Moyenne Intel Core Ultra 7 255H (2414 - 3444, n=19) | |
| HP ZBook Power 16 G11 A | |
| Cinebench R15 / CPU Single 64Bit | |
| Lenovo ThinkPad P16s Gen 4 21RX000YGE | |
| HP ZBook X G1i 16 | |
| Moyenne Intel Core Ultra 7 255H (258 - 322, n=20) | |
| Lenovo ThinkPad P1 Gen 8 | |
| Lenovo ThinkPad P16v G3 21RS000DGE | |
| Moyenne de la classe Workstation (191.4 - 328, n=27, 2 dernières années) | |
| HP ZBook Power 16 G11 A | |
| Blender / v2.79 BMW27 CPU | |
| HP ZBook Power 16 G11 A | |
| Moyenne Intel Core Ultra 7 255H (156 - 293, n=19) | |
| Lenovo ThinkPad P16s Gen 4 21RX000YGE | |
| Lenovo ThinkPad P16v G3 21RS000DGE | |
| Lenovo ThinkPad P1 Gen 8 | |
| HP ZBook X G1i 16 | |
| Moyenne de la classe Workstation (91 - 261, n=27, 2 dernières années) | |
| 7-Zip 18.03 / 7z b 4 | |
| Moyenne de la classe Workstation (54741 - 116969, n=27, 2 dernières années) | |
| Lenovo ThinkPad P16s Gen 4 21RX000YGE | |
| HP ZBook X G1i 16 | |
| Lenovo ThinkPad P16v G3 21RS000DGE | |
| HP ZBook Power 16 G11 A | |
| Lenovo ThinkPad P1 Gen 8 | |
| Moyenne Intel Core Ultra 7 255H (42155 - 70397, n=20) | |
| 7-Zip 18.03 / 7z b 4 -mmt1 | |
| HP ZBook Power 16 G11 A | |
| Lenovo ThinkPad P16s Gen 4 21RX000YGE | |
| Lenovo ThinkPad P16v G3 21RS000DGE | |
| HP ZBook X G1i 16 | |
| Moyenne de la classe Workstation (4981 - 6960, n=27, 2 dernières années) | |
| Moyenne Intel Core Ultra 7 255H (4589 - 6385, n=20) | |
| Lenovo ThinkPad P1 Gen 8 | |
| Geekbench 6.6 / Multi-Core | |
| HP ZBook X G1i 16 | |
| Lenovo ThinkPad P1 Gen 8 | |
| Lenovo ThinkPad P16v G3 21RS000DGE | |
| Moyenne de la classe Workstation (12196 - 20887, n=27, 2 dernières années) | |
| Moyenne Intel Core Ultra 7 255H (11979 - 17489, n=20) | |
| Lenovo ThinkPad P16s Gen 4 21RX000YGE | |
| HP ZBook Power 16 G11 A | |
| Geekbench 6.6 / Single-Core | |
| Lenovo ThinkPad P16s Gen 4 21RX000YGE | |
| Lenovo ThinkPad P16v G3 21RS000DGE | |
| HP ZBook X G1i 16 | |
| Moyenne Intel Core Ultra 7 255H (2712 - 2939, n=20) | |
| Lenovo ThinkPad P1 Gen 8 | |
| Moyenne de la classe Workstation (2384 - 3065, n=27, 2 dernières années) | |
| HP ZBook Power 16 G11 A | |
| Geekbench 5.5 / Multi-Core | |
| Moyenne de la classe Workstation (11542 - 25554, n=27, 2 dernières années) | |
| Lenovo ThinkPad P1 Gen 8 | |
| HP ZBook X G1i 16 | |
| Lenovo ThinkPad P16v G3 21RS000DGE | |
| Lenovo ThinkPad P16s Gen 4 21RX000YGE | |
| Moyenne Intel Core Ultra 7 255H (11348 - 17218, n=19) | |
| HP ZBook Power 16 G11 A | |
| Geekbench 5.5 / Single-Core | |
| Lenovo ThinkPad P16s Gen 4 21RX000YGE | |
| Lenovo ThinkPad P16v G3 21RS000DGE | |
| HP ZBook X G1i 16 | |
| Moyenne Intel Core Ultra 7 255H (1938 - 2121, n=19) | |
| Moyenne de la classe Workstation (1759 - 2183, n=27, 2 dernières années) | |
| Lenovo ThinkPad P1 Gen 8 | |
| HP ZBook Power 16 G11 A | |
| HWBOT x265 Benchmark v2.2 / 4k Preset | |
| Lenovo ThinkPad P1 Gen 8 | |
| Moyenne de la classe Workstation (14.4 - 40.5, n=27, 2 dernières années) | |
| HP ZBook X G1i 16 | |
| Lenovo ThinkPad P16v G3 21RS000DGE | |
| Lenovo ThinkPad P16s Gen 4 21RX000YGE | |
| Moyenne Intel Core Ultra 7 255H (13.7 - 26.5, n=19) | |
| HP ZBook Power 16 G11 A | |
| LibreOffice / 20 Documents To PDF | |
| Lenovo ThinkPad P16s Gen 4 21RX000YGE | |
| HP ZBook Power 16 G11 A | |
| Moyenne Intel Core Ultra 7 255H (41.1 - 61.6, n=19) | |
| Moyenne de la classe Workstation (37.1 - 74.7, n=27, 2 dernières années) | |
| HP ZBook X G1i 16 | |
| Lenovo ThinkPad P1 Gen 8 | |
| Lenovo ThinkPad P16v G3 21RS000DGE | |
| R Benchmark 2.5 / Overall mean | |
| Lenovo ThinkPad P16s Gen 4 21RX000YGE | |
| HP ZBook Power 16 G11 A | |
| Moyenne Intel Core Ultra 7 255H (0.4233 - 0.515, n=19) | |
| Lenovo ThinkPad P16v G3 21RS000DGE | |
| Moyenne de la classe Workstation (0.3825 - 0.603, n=27, 2 dernières années) | |
| Lenovo ThinkPad P1 Gen 8 | |
| HP ZBook X G1i 16 | |
* ... Moindre est la valeur, meilleures sont les performances
AIDA64: FP32 Ray-Trace | FPU Julia | CPU SHA3 | CPU Queen | FPU SinJulia | FPU Mandel | CPU AES | CPU ZLib | FP64 Ray-Trace | CPU PhotoWorxx
| Performance rating | |
| Moyenne de la classe Workstation | |
| Lenovo ThinkPad P16s Gen 4 21RX000YGE | |
| HP ZBook Power 16 G11 A | |
| Lenovo ThinkPad P1 Gen 8 | |
| Lenovo ThinkPad P16v G3 21RS000DGE | |
| Moyenne Intel Core Ultra 7 255H | |
| AIDA64 / FP32 Ray-Trace | |
| Lenovo ThinkPad P16s Gen 4 21RX000YGE | |
| Moyenne de la classe Workstation (10658 - 61611, n=27, 2 dernières années) | |
| HP ZBook Power 16 G11 A | |
| Lenovo ThinkPad P1 Gen 8 | |
| Lenovo ThinkPad P16v G3 21RS000DGE | |
| Moyenne Intel Core Ultra 7 255H (13863 - 24741, n=17) | |
| AIDA64 / FPU Julia | |
| Moyenne de la classe Workstation (56664 - 186971, n=27, 2 dernières années) | |
| Lenovo ThinkPad P1 Gen 8 | |
| HP ZBook Power 16 G11 A | |
| Lenovo ThinkPad P16s Gen 4 21RX000YGE | |
| Lenovo ThinkPad P16v G3 21RS000DGE | |
| Moyenne Intel Core Ultra 7 255H (71030 - 119222, n=17) | |
| AIDA64 / CPU SHA3 | |
| Moyenne de la classe Workstation (2608 - 8975, n=27, 2 dernières années) | |
| Lenovo ThinkPad P1 Gen 8 | |
| Lenovo ThinkPad P16s Gen 4 21RX000YGE | |
| Lenovo ThinkPad P16v G3 21RS000DGE | |
| HP ZBook Power 16 G11 A | |
| Moyenne Intel Core Ultra 7 255H (3408 - 5548, n=17) | |
| AIDA64 / CPU Queen | |
| HP ZBook Power 16 G11 A | |
| Moyenne de la classe Workstation (60778 - 144411, n=27, 2 dernières années) | |
| Lenovo ThinkPad P16s Gen 4 21RX000YGE | |
| Lenovo ThinkPad P1 Gen 8 | |
| Lenovo ThinkPad P16v G3 21RS000DGE | |
| Moyenne Intel Core Ultra 7 255H (59098 - 68460, n=16) | |
| AIDA64 / FPU SinJulia | |
| Lenovo ThinkPad P16s Gen 4 21RX000YGE | |
| HP ZBook Power 16 G11 A | |
| Moyenne de la classe Workstation (8165 - 29343, n=27, 2 dernières années) | |
| Lenovo ThinkPad P1 Gen 8 | |
| Lenovo ThinkPad P16v G3 21RS000DGE | |
| Moyenne Intel Core Ultra 7 255H (6716 - 9006, n=17) | |
| AIDA64 / FPU Mandel | |
| Moyenne de la classe Workstation (27301 - 98153, n=27, 2 dernières années) | |
| Lenovo ThinkPad P1 Gen 8 | |
| Lenovo ThinkPad P16s Gen 4 21RX000YGE | |
| Lenovo ThinkPad P16v G3 21RS000DGE | |
| HP ZBook Power 16 G11 A | |
| Moyenne Intel Core Ultra 7 255H (37031 - 63347, n=17) | |
| AIDA64 / CPU AES | |
| Lenovo ThinkPad P16s Gen 4 21RX000YGE | |
| Moyenne de la classe Workstation (56077 - 187841, n=27, 2 dernières années) | |
| Lenovo ThinkPad P1 Gen 8 | |
| HP ZBook Power 16 G11 A | |
| Lenovo ThinkPad P16v G3 21RS000DGE | |
| Moyenne Intel Core Ultra 7 255H (58402 - 83568, n=17) | |
| AIDA64 / CPU ZLib | |
| Moyenne de la classe Workstation (742 - 2148, n=27, 2 dernières années) | |
| Lenovo ThinkPad P1 Gen 8 | |
| Lenovo ThinkPad P16s Gen 4 21RX000YGE | |
| Lenovo ThinkPad P16v G3 21RS000DGE | |
| Moyenne Intel Core Ultra 7 255H (822 - 1316, n=17) | |
| HP ZBook Power 16 G11 A | |
| AIDA64 / FP64 Ray-Trace | |
| Lenovo ThinkPad P16s Gen 4 21RX000YGE | |
| Moyenne de la classe Workstation (5580 - 32891, n=27, 2 dernières années) | |
| Lenovo ThinkPad P1 Gen 8 | |
| HP ZBook Power 16 G11 A | |
| Lenovo ThinkPad P16v G3 21RS000DGE | |
| Moyenne Intel Core Ultra 7 255H (7384 - 13231, n=17) | |
| AIDA64 / CPU PhotoWorxx | |
| Lenovo ThinkPad P1 Gen 8 | |
| Moyenne Intel Core Ultra 7 255H (23836 - 65787, n=17) | |
| Moyenne de la classe Workstation (37151 - 93684, n=27, 2 dernières années) | |
| Lenovo ThinkPad P16s Gen 4 21RX000YGE | |
| Lenovo ThinkPad P16v G3 21RS000DGE | |
| HP ZBook Power 16 G11 A | |
Performance du système
En utilisation quotidienne, le ThinkPad P16v Gen 3 est un ordinateur très réactif et les résultats des tests de référence sont très bons. Aucun problème de stabilité n'a été constaté pendant le test.
PCMark 10: Score | Essentials | Productivity | Digital Content Creation
CrossMark: Overall | Productivity | Creativity | Responsiveness
WebXPRT 3: Overall
WebXPRT 4: Overall
Mozilla Kraken 1.1: Total
| Performance rating | |
| Lenovo ThinkPad P16v G3 21RS000DGE | |
| Moyenne Intel Core Ultra 7 255H, NVIDIA RTX PRO 2000 Blackwell Generation Laptop | |
| Lenovo ThinkPad P1 Gen 8 | |
| HP ZBook X G1i 16 -4! | |
| Moyenne de la classe Workstation | |
| HP ZBook Power 16 G11 A | |
| Lenovo ThinkPad P16s Gen 4 21RX000YGE | |
| PCMark 10 / Score | |
| Lenovo ThinkPad P16v G3 21RS000DGE | |
| Moyenne Intel Core Ultra 7 255H, NVIDIA RTX PRO 2000 Blackwell Generation Laptop (9625 - 9723, n=2) | |
| Lenovo ThinkPad P1 Gen 8 | |
| Moyenne de la classe Workstation (6436 - 10409, n=22, 2 dernières années) | |
| Lenovo ThinkPad P16s Gen 4 21RX000YGE | |
| HP ZBook Power 16 G11 A | |
| PCMark 10 / Essentials | |
| Lenovo ThinkPad P16v G3 21RS000DGE | |
| Moyenne Intel Core Ultra 7 255H, NVIDIA RTX PRO 2000 Blackwell Generation Laptop (10650 - 10921, n=2) | |
| Lenovo ThinkPad P16s Gen 4 21RX000YGE | |
| Lenovo ThinkPad P1 Gen 8 | |
| Moyenne de la classe Workstation (9622 - 11157, n=22, 2 dernières années) | |
| HP ZBook Power 16 G11 A | |
| PCMark 10 / Productivity | |
| Lenovo ThinkPad P1 Gen 8 | |
| Moyenne Intel Core Ultra 7 255H, NVIDIA RTX PRO 2000 Blackwell Generation Laptop (18083 - 18261, n=2) | |
| Lenovo ThinkPad P16v G3 21RS000DGE | |
| Moyenne de la classe Workstation (8789 - 20616, n=22, 2 dernières années) | |
| Lenovo ThinkPad P16s Gen 4 21RX000YGE | |
| HP ZBook Power 16 G11 A | |
| PCMark 10 / Digital Content Creation | |
| Lenovo ThinkPad P16v G3 21RS000DGE | |
| Moyenne Intel Core Ultra 7 255H, NVIDIA RTX PRO 2000 Blackwell Generation Laptop (12443 - 12631, n=2) | |
| Lenovo ThinkPad P1 Gen 8 | |
| Moyenne de la classe Workstation (7744 - 15631, n=22, 2 dernières années) | |
| HP ZBook Power 16 G11 A | |
| Lenovo ThinkPad P16s Gen 4 21RX000YGE | |
| CrossMark / Overall | |
| HP ZBook X G1i 16 | |
| Lenovo ThinkPad P1 Gen 8 | |
| Moyenne Intel Core Ultra 7 255H, NVIDIA RTX PRO 2000 Blackwell Generation Laptop (1942 - 1953, n=2) | |
| Lenovo ThinkPad P16v G3 21RS000DGE | |
| Moyenne de la classe Workstation (1307 - 2267, n=26, 2 dernières années) | |
| HP ZBook Power 16 G11 A | |
| Lenovo ThinkPad P16s Gen 4 21RX000YGE | |
| CrossMark / Productivity | |
| HP ZBook X G1i 16 | |
| Lenovo ThinkPad P1 Gen 8 | |
| Moyenne Intel Core Ultra 7 255H, NVIDIA RTX PRO 2000 Blackwell Generation Laptop (1834 - 1836, n=2) | |
| Lenovo ThinkPad P16v G3 21RS000DGE | |
| Moyenne de la classe Workstation (1130 - 2122, n=26, 2 dernières années) | |
| HP ZBook Power 16 G11 A | |
| Lenovo ThinkPad P16s Gen 4 21RX000YGE | |
| CrossMark / Creativity | |
| HP ZBook X G1i 16 | |
| Lenovo ThinkPad P16v G3 21RS000DGE | |
| Moyenne Intel Core Ultra 7 255H, NVIDIA RTX PRO 2000 Blackwell Generation Laptop (2211 - 2232, n=2) | |
| Lenovo ThinkPad P1 Gen 8 | |
| Moyenne de la classe Workstation (1657 - 2725, n=26, 2 dernières années) | |
| HP ZBook Power 16 G11 A | |
| Lenovo ThinkPad P16s Gen 4 21RX000YGE | |
| CrossMark / Responsiveness | |
| Lenovo ThinkPad P1 Gen 8 | |
| Moyenne Intel Core Ultra 7 255H, NVIDIA RTX PRO 2000 Blackwell Generation Laptop (1520 - 1622, n=2) | |
| Moyenne de la classe Workstation (993 - 2096, n=26, 2 dernières années) | |
| HP ZBook X G1i 16 | |
| Lenovo ThinkPad P16v G3 21RS000DGE | |
| HP ZBook Power 16 G11 A | |
| Lenovo ThinkPad P16s Gen 4 21RX000YGE | |
| WebXPRT 3 / Overall | |
| Lenovo ThinkPad P1 Gen 8 | |
| Moyenne Intel Core Ultra 7 255H, NVIDIA RTX PRO 2000 Blackwell Generation Laptop (322 - 330, n=2) | |
| Lenovo ThinkPad P16v G3 21RS000DGE | |
| HP ZBook X G1i 16 | |
| Lenovo ThinkPad P16s Gen 4 21RX000YGE | |
| Moyenne de la classe Workstation (260 - 360, n=27, 2 dernières années) | |
| HP ZBook Power 16 G11 A | |
| WebXPRT 4 / Overall | |
| Lenovo ThinkPad P16v G3 21RS000DGE | |
| Moyenne Intel Core Ultra 7 255H, NVIDIA RTX PRO 2000 Blackwell Generation Laptop (298 - 307, n=2) | |
| HP ZBook X G1i 16 | |
| Lenovo ThinkPad P1 Gen 8 | |
| Moyenne de la classe Workstation (189.2 - 326, n=27, 2 dernières années) | |
| HP ZBook Power 16 G11 A | |
| Lenovo ThinkPad P16s Gen 4 21RX000YGE | |
| Mozilla Kraken 1.1 / Total | |
| HP ZBook Power 16 G11 A | |
| Moyenne de la classe Workstation (411 - 538, n=27, 2 dernières années) | |
| Lenovo ThinkPad P16s Gen 4 21RX000YGE | |
| Lenovo ThinkPad P1 Gen 8 | |
| HP ZBook X G1i 16 | |
| Moyenne Intel Core Ultra 7 255H, NVIDIA RTX PRO 2000 Blackwell Generation Laptop (448 - 461, n=2) | |
| Lenovo ThinkPad P16v G3 21RS000DGE | |
* ... Moindre est la valeur, meilleures sont les performances
| PCMark 10 Score | 9723 points | |
Aide | ||
| AIDA64 / Memory Copy | |
| Lenovo ThinkPad P1 Gen 8 | |
| Moyenne Intel Core Ultra 7 255H (39188 - 110930, n=17) | |
| Moyenne de la classe Workstation (56003 - 164795, n=27, 2 dernières années) | |
| Lenovo ThinkPad P16v G3 21RS000DGE | |
| Lenovo ThinkPad P16s Gen 4 21RX000YGE | |
| HP ZBook Power 16 G11 A | |
| AIDA64 / Memory Read | |
| Lenovo ThinkPad P16s Gen 4 21RX000YGE | |
| Lenovo ThinkPad P16v G3 21RS000DGE | |
| Moyenne Intel Core Ultra 7 255H (43703 - 90552, n=17) | |
| Moyenne de la classe Workstation (55795 - 121563, n=27, 2 dernières années) | |
| Lenovo ThinkPad P1 Gen 8 | |
| HP ZBook Power 16 G11 A | |
| AIDA64 / Memory Write | |
| Moyenne de la classe Workstation (55663 - 214520, n=27, 2 dernières années) | |
| HP ZBook Power 16 G11 A | |
| Lenovo ThinkPad P16s Gen 4 21RX000YGE | |
| Lenovo ThinkPad P16v G3 21RS000DGE | |
| Moyenne Intel Core Ultra 7 255H (36438 - 87199, n=17) | |
| Lenovo ThinkPad P1 Gen 8 | |
| AIDA64 / Memory Latency | |
| Lenovo ThinkPad P1 Gen 8 | |
| Moyenne de la classe Workstation (84.5 - 165.2, n=27, 2 dernières années) | |
| Moyenne Intel Core Ultra 7 255H (107.6 - 147.2, n=17) | |
| Lenovo ThinkPad P16v G3 21RS000DGE | |
| Lenovo ThinkPad P16s Gen 4 21RX000YGE | |
| HP ZBook Power 16 G11 A | |
* ... Moindre est la valeur, meilleures sont les performances
Latences DPC
Dans notre test de latence standardisé (navigation sur Internet, lecture YouTube 4K, charge du processeur), l'appareil de test avec la version actuelle du BIOS montre de légères limitations lors de l'utilisation d'applications audio en temps réel.

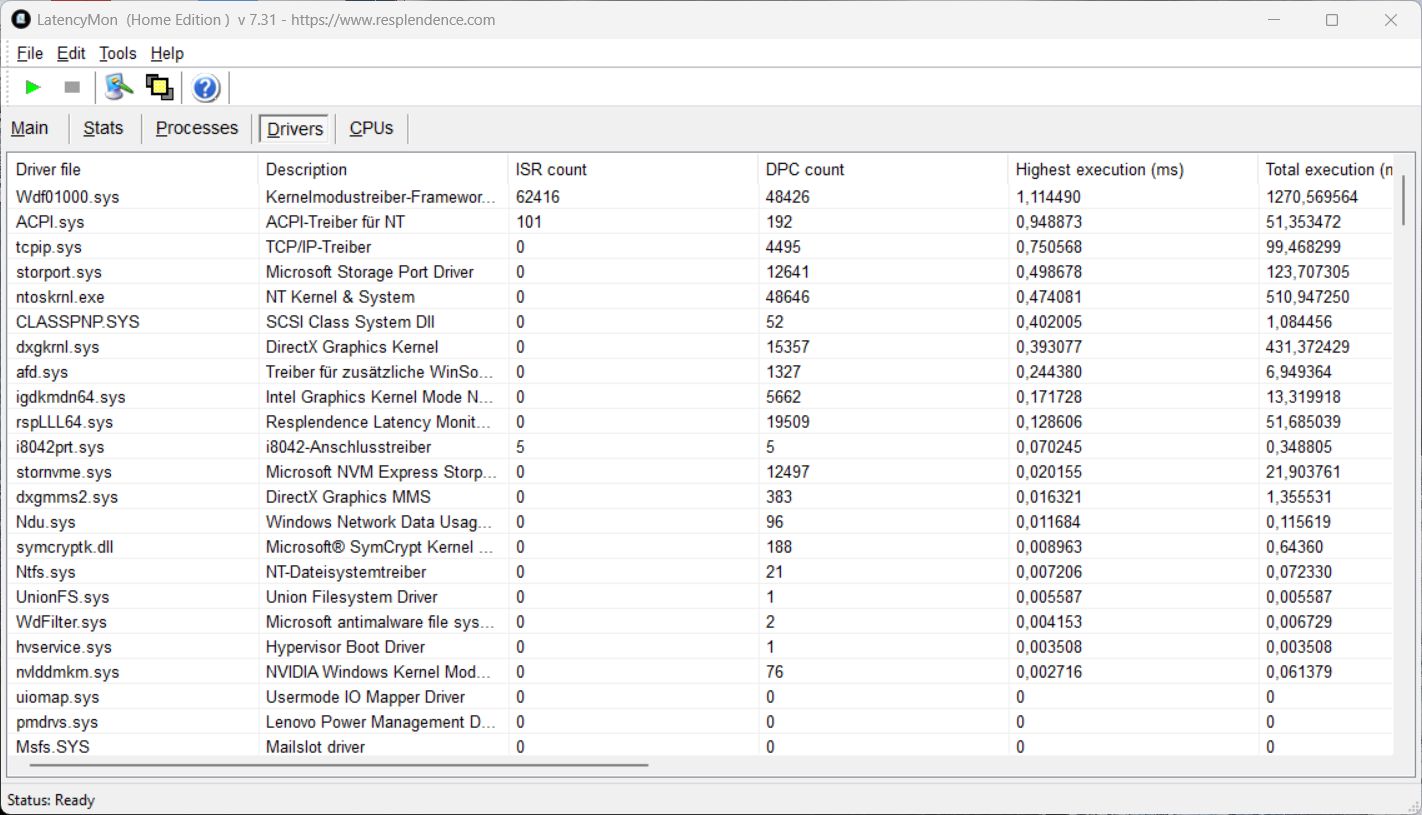
| DPC Latencies / LatencyMon - interrupt to process latency (max), Web, Youtube, Prime95 | |
| HP ZBook Power 16 G11 A | |
| Lenovo ThinkPad P1 Gen 8 | |
| Lenovo ThinkPad P16s Gen 4 21RX000YGE | |
| HP ZBook X G1i 16 | |
| Lenovo ThinkPad P16v G3 21RS000DGE | |
* ... Moindre est la valeur, meilleures sont les performances
Dispositifs de stockage
Le Samsung PM9E1 (1 TB, 879 GB libres), un SSD PCIe 5.0, est déjà installé dans notre appareil de test, mais les deux slots M.2-2280 ne sont connectés que via PCIe 4.0. Par conséquent, les taux de transfert sont également un maximum d'environ 7 GB/s au lieu de 13-14 GB/s. Cependant, les performances restent bonnes et stables même en cas de charge prolongée.

* ... Moindre est la valeur, meilleures sont les performances
Performances en lecture continue : Boucle de lecture DiskSpd, profondeur de la file d'attente 8
Performance du GPU
Le GPU est le professionnel Nvidia RTX PRO 2000 (Blackwell, 8 Go VRAM), qui est activée par la technologie Optimus. La puce elle-même est identique à la GeForce RTX 5060mais dans le cas du P16v Gen 3, seule la version 60 watts est implémentée (un maximum de 115 watts serait possible), ce qui est quelque peu décevant étant donné le grand boîtier. Cependant, les autres stations de travail mobiles de ce segment sont similaires (max. 75 watts), ce qui explique que les performances graphiques soient également comparables. Nous avons également inclus la version 115 watts de l'ordinateur portable RTX 5060 dans la comparaison, qui fonctionne 31% plus vite. Les performances graphiques restent parfaitement stables en charge continue, mais le GPU ne consomme que 25 watts en mode batterie (-56 % de performances).
| 3DMark 11 Performance | 29308 points | |
| 3DMark Fire Strike Score | 23134 points | |
| 3DMark Time Spy Score | 9371 points | |
| 3DMark Steel Nomad Score | 1932 points | |
| 3DMark Steel Nomad Light Score | 9029 points | |
Aide | ||
| Blender / v3.3 Classroom OPTIX/RTX | |
| HP ZBook Power 16 G11 A | |
| Moyenne de la classe Workstation (10 - 95, n=21, 2 dernières années) | |
| HP ZBook X G1i 16 | |
| Moyenne NVIDIA RTX PRO 2000 Blackwell Generation Laptop (22 - 25, n=3) | |
| Lenovo ThinkPad P1 Gen 8 | |
| Lenovo ThinkPad P16v G3 21RS000DGE | |
| Blender / v3.3 Classroom CUDA | |
| HP ZBook Power 16 G11 A | |
| HP ZBook X G1i 16 | |
| Moyenne NVIDIA RTX PRO 2000 Blackwell Generation Laptop (42 - 45, n=3) | |
| Lenovo ThinkPad P1 Gen 8 | |
| Lenovo ThinkPad P16v G3 21RS000DGE | |
| Moyenne de la classe Workstation (16 - 142, n=22, 2 dernières années) | |
| Blender / v3.3 Classroom CPU | |
| HP ZBook Power 16 G11 A | |
| Lenovo ThinkPad P1 Gen 8 | |
| Lenovo ThinkPad P16v G3 21RS000DGE | |
| Moyenne NVIDIA RTX PRO 2000 Blackwell Generation Laptop (266 - 273, n=3) | |
| Lenovo ThinkPad P16s Gen 4 21RX000YGE | |
| HP ZBook X G1i 16 | |
| Moyenne de la classe Workstation (148 - 464, n=27, 2 dernières années) | |
* ... Moindre est la valeur, meilleures sont les performances
| SPECviewperf 15 | |
| 3840x2160 Siemens NX 2406 (snx-05) | |
| Lenovo ThinkPad P16v G3 21RS000DGE | |
| 3840x2160 Unreal Engine 5.4.2 (unreal_engine-01) | |
| Lenovo ThinkPad P1 Gen 8 | |
| Lenovo ThinkPad P16v G3 21RS000DGE | |
| 3840x2160 Solidworks 2024 (solidworks-08) | |
| Lenovo ThinkPad P1 Gen 8 | |
| Lenovo ThinkPad P16v G3 21RS000DGE | |
| 3840x2160 Tuvok (medical-04) | |
| Lenovo ThinkPad P1 Gen 8 | |
| Lenovo ThinkPad P16v G3 21RS000DGE | |
| 3840x2160 Maya 2025 (maya-07) | |
| Lenovo ThinkPad P1 Gen 8 | |
| Lenovo ThinkPad P16v G3 21RS000DGE | |
| 3840x2160 Enscape 4.0 (enscape-01) | |
| Lenovo ThinkPad P1 Gen 8 | |
| Lenovo ThinkPad P16v G3 21RS000DGE | |
| 3840x2160 OpendTect (energy-04) | |
| Lenovo ThinkPad P1 Gen 8 | |
| Lenovo ThinkPad P16v G3 21RS000DGE | |
| 3840x2160 Creo 9 (creo-04) | |
| Lenovo ThinkPad P1 Gen 8 | |
| Lenovo ThinkPad P16v G3 21RS000DGE | |
| 3840x2160 Blender 3.6 (blender-01) | |
| Lenovo ThinkPad P1 Gen 8 | |
| Lenovo ThinkPad P16v G3 21RS000DGE | |
| 3840x2160 3ds Max 2023 (3dsmax-08) | |
| Lenovo ThinkPad P1 Gen 8 | |
| Lenovo ThinkPad P16v G3 21RS000DGE | |
Performances des jeux
La RTX PRO 2000 est parfaitement capable de gérer les jeux et les pilotes professionnels n'ont posé aucun problème. En principe, la plupart des titres modernes peuvent être joués sans problème dans la résolution native et avec des détails élevés/maximaux. Nous avons récemment écrit sur les limites d'une VRAM de 8 Go dans un article séparé.
| Cyberpunk 2077 - 1920x1080 Ultra Preset (FSR off) | |
| Lenovo ThinkPad P1 Gen 8 | |
| Moyenne de la classe Workstation (19.6 - 152.4, n=27, 2 dernières années) | |
| HP ZBook X G1i 16 | |
| Lenovo ThinkPad P16v G3 21RS000DGE | |
| HP ZBook Power 16 G11 A | |
| Lenovo ThinkPad P16s Gen 4 21RX000YGE | |
| Final Fantasy XV Benchmark - 1920x1080 High Quality | |
| Lenovo ThinkPad P1 Gen 8 | |
| Moyenne de la classe Workstation (26.4 - 197.6, n=27, 2 dernières années) | |
| HP ZBook X G1i 16 | |
| Lenovo ThinkPad P16v G3 21RS000DGE | |
| HP ZBook Power 16 G11 A | |
| Lenovo ThinkPad P16s Gen 4 21RX000YGE | |
| Strange Brigade - 1920x1080 ultra AA:ultra AF:16 | |
| Moyenne de la classe Workstation (54.5 - 418, n=21, 2 dernières années) | |
| Lenovo ThinkPad P1 Gen 8 | |
| HP ZBook X G1i 16 | |
| Lenovo ThinkPad P16v G3 21RS000DGE | |
| HP ZBook Power 16 G11 A | |
| Dota 2 Reborn - 1920x1080 ultra (3/3) best looking | |
| Lenovo ThinkPad P16v G3 21RS000DGE | |
| HP ZBook X G1i 16 | |
| Moyenne de la classe Workstation (50.7 - 178.4, n=27, 2 dernières années) | |
| Lenovo ThinkPad P1 Gen 8 | |
| HP ZBook Power 16 G11 A | |
| Lenovo ThinkPad P16s Gen 4 21RX000YGE | |
Cyberpunk 2077 ultra FPS chart
| Bas | Moyen | Élevé | Ultra | |
|---|---|---|---|---|
| GTA V (2015) | 174.7 | 117.7 | ||
| Dota 2 Reborn (2015) | 174.2 | 159.8 | 151.6 | 142.8 |
| Final Fantasy XV Benchmark (2018) | 199.5 | 127.3 | 98.1 | |
| X-Plane 11.11 (2018) | 105.4 | 95.2 | 78.8 | |
| Strange Brigade (2018) | 469 | 241 | 194.1 | 167.8 |
| Baldur's Gate 3 (2023) | 121.3 | 96 | 81.4 | 81.2 |
| Cyberpunk 2077 (2023) | 119.5 | 93.5 | 79.1 | 70.1 |
| F1 24 (2024) | 200 | 194.8 | 165.5 | 53.3 |
Émissions et énergie
Émissions sonores

L'unité de refroidissement reste très silencieuse pendant les tâches quotidiennes (max. 29,2 dB(A)), mais elle devient nettement plus bruyante lorsque les composants sont mis à rude épreuve. En mode Meilleures performances, nous avons mesuré 47,1 dB(A) pendant les jeux et le test de stress(équilibré: 43,2 dB(A), Meilleure efficacité énergétique: 39,9 dB(A), batterie : 37 dB(A)). Le gémissement de la bobine ne s'est pas produit sur l'appareil testé.
Degré de la nuisance sonore
| Au repos |
| 25.9 / 25.9 / 29.2 dB(A) |
| Fortement sollicité |
| 37.5 / 47.1 dB(A) |
 | ||
30 dB silencieux 40 dB(A) audible 50 dB(A) bruyant |
||
min: | ||
| Lenovo ThinkPad P16v G3 21RS000DGE Ultra 7 255H, RTX PRO 2000 Blackwell Generation Laptop | Lenovo ThinkPad P1 Gen 8 Ultra 7 255H, RTX PRO 2000 Blackwell Generation Laptop | HP ZBook X G1i 16 Ultra 7 265H, RTX PRO 2000 Blackwell Generation Laptop | HP ZBook Power 16 G11 A R7 8845HS, RTX 2000 Ada Generation Laptop | Lenovo ThinkPad P16s Gen 4 21RX000YGE Ryzen AI 9 HX PRO 370, Radeon 890M | |
|---|---|---|---|---|---|
| Noise | 13% | 7% | 12% | -3% | |
| arrêt / environnement * (dB) | 25.9 | 23.1 11% | 23.7 8% | 23.5 9% | 25.9 -0% |
| Idle Minimum * (dB) | 25.9 | 23.1 11% | 23.7 8% | 23.8 8% | 25.9 -0% |
| Idle Average * (dB) | 25.9 | 23.1 11% | 23.7 8% | 24.2 7% | 25.9 -0% |
| Idle Maximum * (dB) | 29.2 | 23.1 21% | 23.7 19% | 24.2 17% | 28.5 2% |
| Load Average * (dB) | 37.5 | 27.3 27% | 32.7 13% | 25.4 32% | 42.9 -14% |
| Cyberpunk 2077 ultra * (dB) | 47.1 | 50.9 -8% | 43 9% | 48.7 -3% | |
| Load Maximum * (dB) | 47.1 | 47.9 -2% | 48 -2% | 45 4% | 48.5 -3% |
* ... Moindre est la valeur, meilleures sont les performances
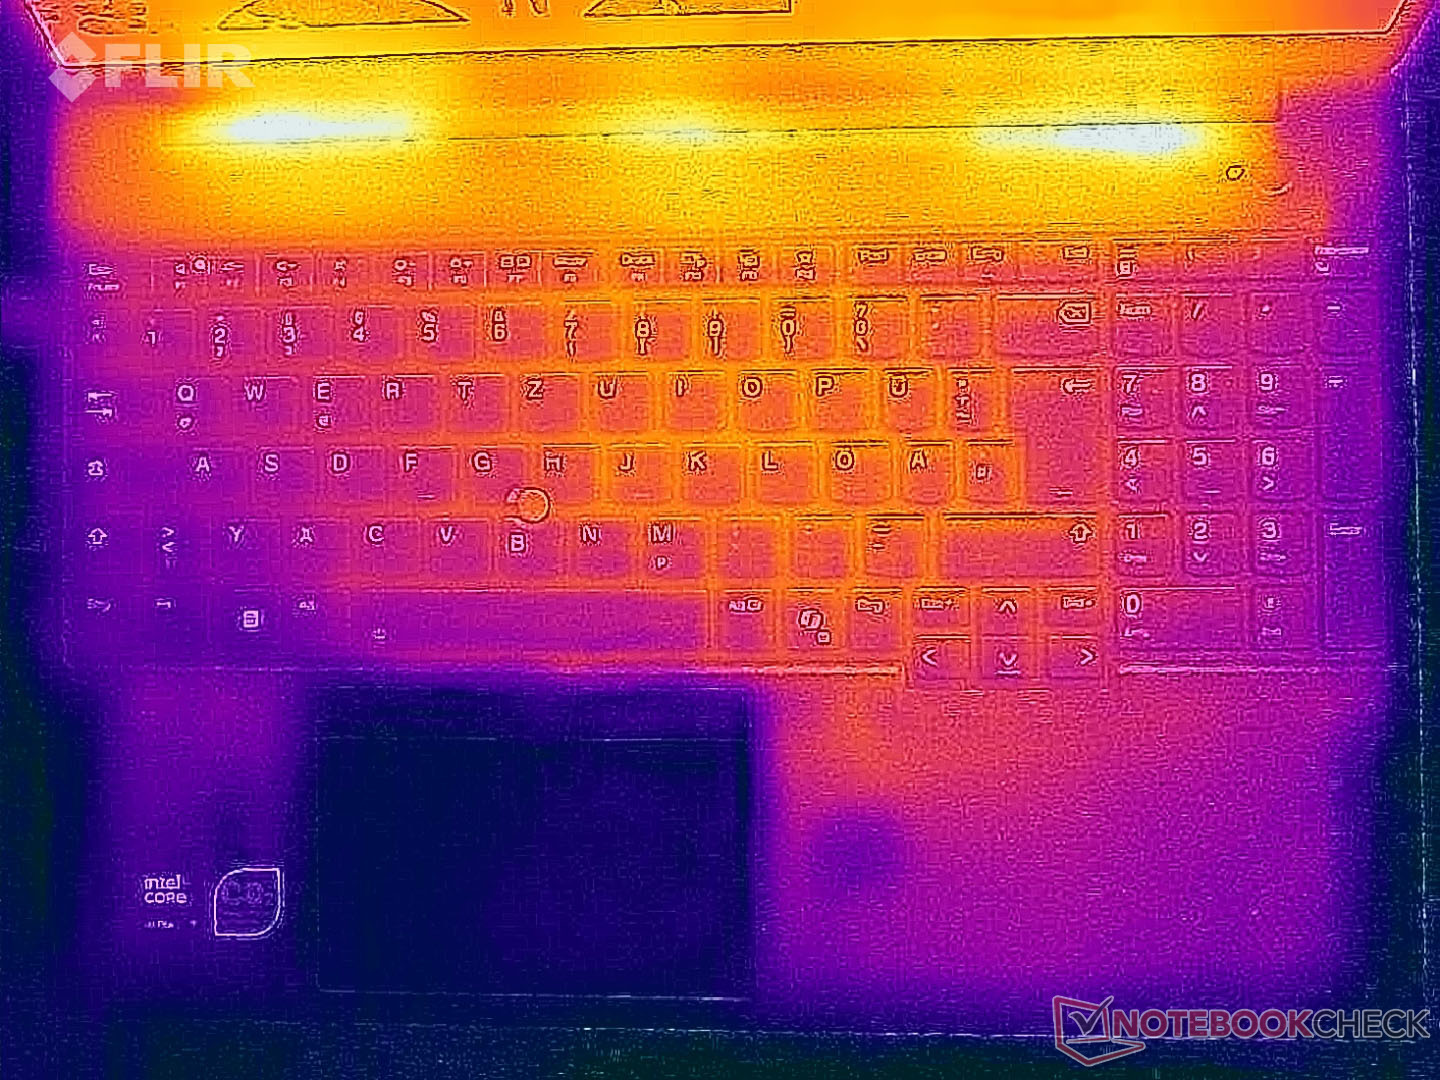
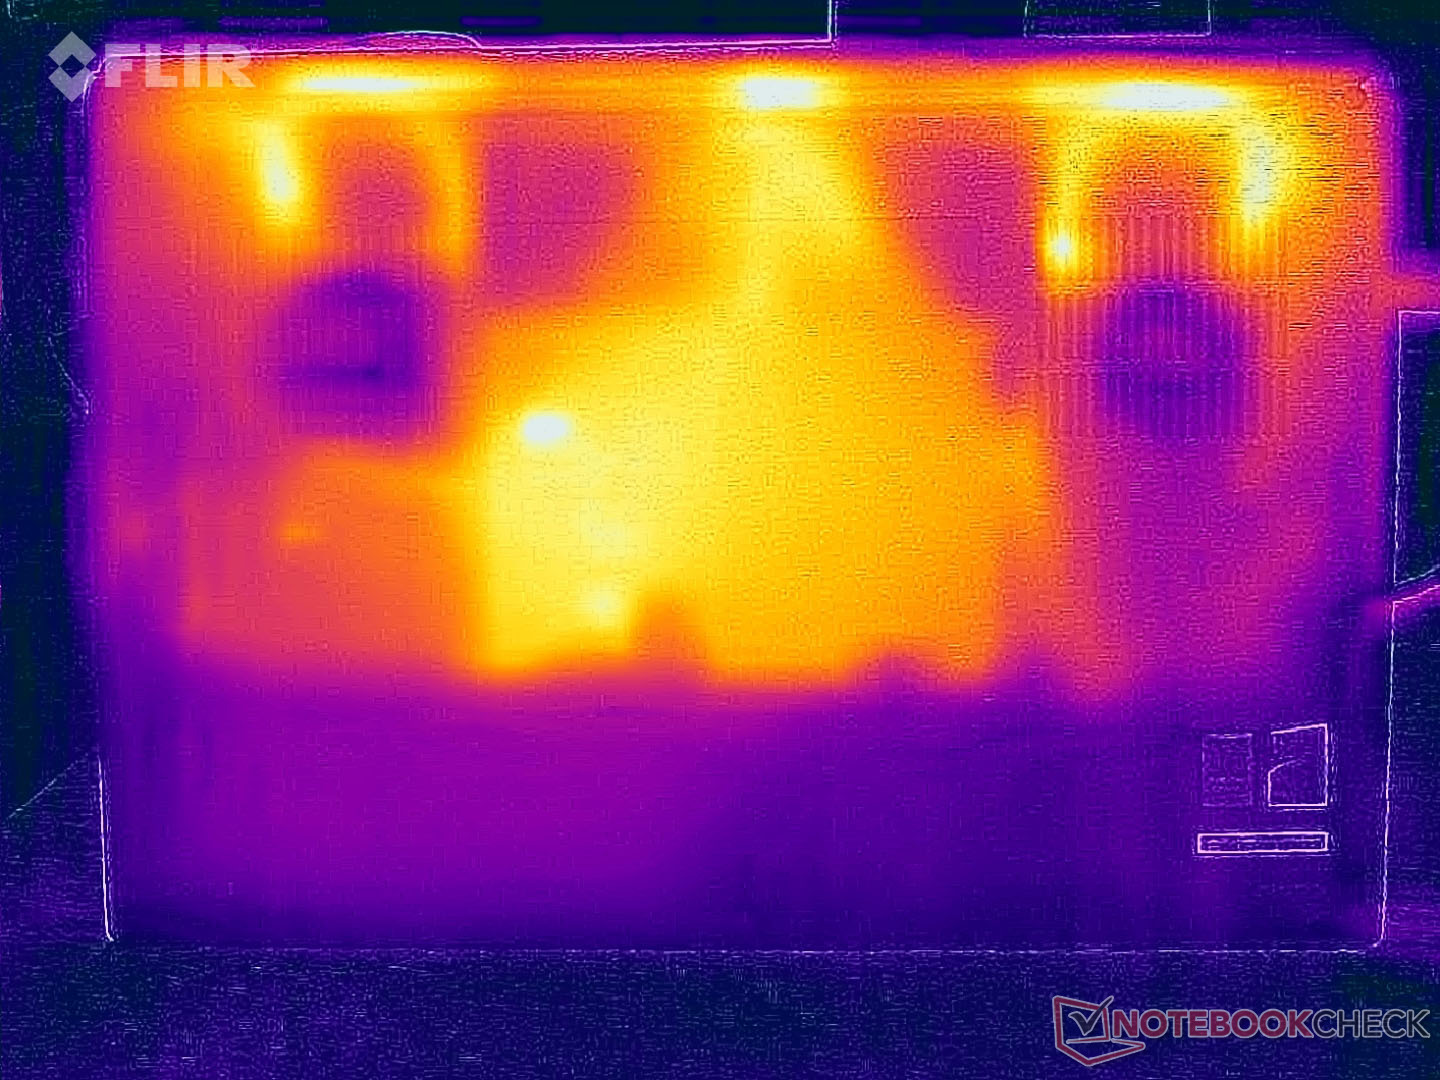
Température
Les températures de surface restent tout à fait inoffensives, même lors du test de stress, puisque nous n'avons mesuré qu'un peu moins de 45 °C en un point de la face inférieure ; les autres points de mesure restent nettement plus froids. Lors du test de stress, le processeur s'est stabilisé à ~34 watts (81 °C/177,8 °F) et le GPU à ~55 watts (76 °C/168,8 °F). Ce n'est pas particulièrement élevé compte tenu de la taille du boîtier.

(+) La température maximale du côté supérieur est de 39.9 °C / 104 F, par rapport à la moyenne de 38.2 °C / 101 F, allant de 22.2 à 69.8 °C pour la classe Workstation.
(±) Le fond chauffe jusqu'à un maximum de 44.8 °C / 113 F, contre une moyenne de 41.1 °C / 106 F
(+) En utilisation inactive, la température moyenne du côté supérieur est de 23.5 °C / 74 F, par rapport à la moyenne du dispositif de 32 °C / 90 F.
(±) 3: The average temperature for the upper side is 33 °C / 91 F, compared to the average of 32 °C / 90 F for the class Workstation.
(+) Les repose-poignets et le pavé tactile atteignent la température maximale de la peau (32.1 °C / 89.8 F) et ne sont donc pas chauds.
(-) La température moyenne de la zone de l'appui-paume de dispositifs similaires était de 27.8 °C / 82 F (-4.3 °C / #-7.8 F).
| Lenovo ThinkPad P16v G3 21RS000DGE Ultra 7 255H, RTX PRO 2000 Blackwell Generation Laptop | Lenovo ThinkPad P1 Gen 8 Ultra 7 255H, RTX PRO 2000 Blackwell Generation Laptop | HP ZBook X G1i 16 Ultra 7 265H, RTX PRO 2000 Blackwell Generation Laptop | HP ZBook Power 16 G11 A R7 8845HS, RTX 2000 Ada Generation Laptop | Lenovo ThinkPad P16s Gen 4 21RX000YGE Ryzen AI 9 HX PRO 370, Radeon 890M | |
|---|---|---|---|---|---|
| Heat | -10% | -8% | -2% | -37% | |
| Maximum Upper Side * (°C) | 39.9 | 45 -13% | 36 10% | 40.6 -2% | 50.6 -27% |
| Maximum Bottom * (°C) | 44.8 | 33 26% | 39.4 12% | 40.6 9% | 54.3 -21% |
| Idle Upper Side * (°C) | 24 | 30.6 -28% | 30.4 -27% | 26 -8% | 35.3 -47% |
| Idle Bottom * (°C) | 25 | 31.6 -26% | 31.8 -27% | 26.6 -6% | 38.5 -54% |
* ... Moindre est la valeur, meilleures sont les performances
Intervenants
Les haut-parleurs stéréo ne sont guère convaincants ThinkPad P1 16 G8 a un net avantage.
Lenovo ThinkPad P16v G3 21RS000DGE analyse audio
(±) | le niveau sonore du haut-parleur est moyen mais bon (78.2# dB)
Basses 100 - 315 Hz
(±) | basse réduite - en moyenne 10.7% inférieure à la médiane
(±) | la linéarité des basses est moyenne (10% delta à la fréquence précédente)
Médiums 400 - 2000 Hz
(±) | médiane supérieure - en moyenne 7.2% supérieure à la médiane
(+) | les médiums sont linéaires (5.3% delta à la fréquence précédente)
Aiguës 2 - 16 kHz
(+) | des sommets équilibrés - à seulement 1.3% de la médiane
(+) | les aigus sont linéaires (3.8% delta à la fréquence précédente)
Globalement 100 - 16 000 Hz
(±) | la linéarité du son global est moyenne (15.6% de différence avec la médiane)
Par rapport à la même classe
» 35% de tous les appareils testés de cette catégorie étaient meilleurs, 11% similaires, 54% pires
» Le meilleur avait un delta de 7%, la moyenne était de 17%, le pire était de 35%.
Par rapport à tous les appareils testés
» 23% de tous les appareils testés étaient meilleurs, 5% similaires, 72% pires
» Le meilleur avait un delta de 4%, la moyenne était de 24%, le pire était de 134%.
Lenovo ThinkPad P1 Gen 8 analyse audio
(+) | les haut-parleurs peuvent jouer relativement fort (87.5# dB)
Basses 100 - 315 Hz
(±) | basse réduite - en moyenne 9.8% inférieure à la médiane
(±) | la linéarité des basses est moyenne (11.2% delta à la fréquence précédente)
Médiums 400 - 2000 Hz
(+) | médiane équilibrée - seulement 2.9% de la médiane
(+) | les médiums sont linéaires (2.8% delta à la fréquence précédente)
Aiguës 2 - 16 kHz
(+) | des sommets équilibrés - à seulement 3% de la médiane
(+) | les aigus sont linéaires (4.7% delta à la fréquence précédente)
Globalement 100 - 16 000 Hz
(+) | le son global est linéaire (8.3% différence à la médiane)
Par rapport à la même classe
» 1% de tous les appareils testés de cette catégorie étaient meilleurs, 1% similaires, 97% pires
» Le meilleur avait un delta de 7%, la moyenne était de 17%, le pire était de 35%.
Par rapport à tous les appareils testés
» 2% de tous les appareils testés étaient meilleurs, 1% similaires, 97% pires
» Le meilleur avait un delta de 4%, la moyenne était de 24%, le pire était de 134%.
HP ZBook X G1i 16 analyse audio
(+) | les haut-parleurs peuvent jouer relativement fort (84# dB)
Basses 100 - 315 Hz
(-) | presque aucune basse - en moyenne 28% plus bas que la médiane
(±) | la linéarité des basses est moyenne (8.8% delta à la fréquence précédente)
Médiums 400 - 2000 Hz
(+) | médiane équilibrée - seulement 1.9% de la médiane
(+) | les médiums sont linéaires (6.1% delta à la fréquence précédente)
Aiguës 2 - 16 kHz
(+) | des sommets équilibrés - à seulement 2.9% de la médiane
(+) | les aigus sont linéaires (5.1% delta à la fréquence précédente)
Globalement 100 - 16 000 Hz
(±) | la linéarité du son global est moyenne (15.6% de différence avec la médiane)
Par rapport à la même classe
» 35% de tous les appareils testés de cette catégorie étaient meilleurs, 11% similaires, 54% pires
» Le meilleur avait un delta de 7%, la moyenne était de 17%, le pire était de 35%.
Par rapport à tous les appareils testés
» 23% de tous les appareils testés étaient meilleurs, 5% similaires, 72% pires
» Le meilleur avait un delta de 4%, la moyenne était de 24%, le pire était de 134%.
HP ZBook Power 16 G11 A analyse audio
(+) | les haut-parleurs peuvent jouer relativement fort (87.9# dB)
Basses 100 - 315 Hz
(-) | presque aucune basse - en moyenne 28.1% plus bas que la médiane
(±) | la linéarité des basses est moyenne (9% delta à la fréquence précédente)
Médiums 400 - 2000 Hz
(+) | médiane équilibrée - seulement 1.9% de la médiane
(+) | les médiums sont linéaires (4.8% delta à la fréquence précédente)
Aiguës 2 - 16 kHz
(+) | des sommets équilibrés - à seulement 3.6% de la médiane
(+) | les aigus sont linéaires (2.4% delta à la fréquence précédente)
Globalement 100 - 16 000 Hz
(±) | la linéarité du son global est moyenne (15.1% de différence avec la médiane)
Par rapport à la même classe
» 33% de tous les appareils testés de cette catégorie étaient meilleurs, 7% similaires, 60% pires
» Le meilleur avait un delta de 7%, la moyenne était de 17%, le pire était de 35%.
Par rapport à tous les appareils testés
» 21% de tous les appareils testés étaient meilleurs, 4% similaires, 75% pires
» Le meilleur avait un delta de 4%, la moyenne était de 24%, le pire était de 134%.
Lenovo ThinkPad P16s Gen 4 21RX000YGE analyse audio
(±) | le niveau sonore du haut-parleur est moyen mais bon (79.6# dB)
Basses 100 - 315 Hz
(-) | presque aucune basse - en moyenne 15.7% plus bas que la médiane
(±) | la linéarité des basses est moyenne (11.9% delta à la fréquence précédente)
Médiums 400 - 2000 Hz
(±) | médiane supérieure - en moyenne 5.8% supérieure à la médiane
(+) | les médiums sont linéaires (5.9% delta à la fréquence précédente)
Aiguës 2 - 16 kHz
(+) | des sommets équilibrés - à seulement 1.5% de la médiane
(+) | les aigus sont linéaires (4.6% delta à la fréquence précédente)
Globalement 100 - 16 000 Hz
(±) | la linéarité du son global est moyenne (16.2% de différence avec la médiane)
Par rapport à la même classe
» 43% de tous les appareils testés de cette catégorie étaient meilleurs, 7% similaires, 50% pires
» Le meilleur avait un delta de 7%, la moyenne était de 17%, le pire était de 35%.
Par rapport à tous les appareils testés
» 26% de tous les appareils testés étaient meilleurs, 5% similaires, 69% pires
» Le meilleur avait un delta de 4%, la moyenne était de 24%, le pire était de 134%.
Consommation d'énergie

La consommation maximale en mode veille est de 12,7 watts, ce qui est relativement élevé compte tenu de la faible résolution de l'écran. Nous avons brièvement mesuré ~140 watts lors du test de stress, mais cette consommation s'est rapidement stabilisée à ~120 watts. L'alimentation de 140 watts est donc suffisamment dimensionnée.
| Éteint/en veille | |
| Au repos | |
| Fortement sollicité |
|
Légende:
min: | |
| Lenovo ThinkPad P16v G3 21RS000DGE Ultra 7 255H, RTX PRO 2000 Blackwell Generation Laptop, Samsung PM9E1 1 TB MZVLC1T0HFLU, IPS, 1920x1200, 16" | Lenovo ThinkPad P1 Gen 8 Ultra 7 255H, RTX PRO 2000 Blackwell Generation Laptop, Samsung PM9E1 1 TB MZVLC1T0HFLU, Tandem OLED, 3200x2000, 16" | HP ZBook X G1i 16 Ultra 7 265H, RTX PRO 2000 Blackwell Generation Laptop, Samsung PM9A1 MZVL22T0HBLB, IPS, 2560x1600, 16" | HP ZBook Power 16 G11 A R7 8845HS, RTX 2000 Ada Generation Laptop, Samsung PM9A1 MZVL22T0HBLB, IPS, 2560x1600, 16" | Lenovo ThinkPad P16s Gen 4 21RX000YGE Ryzen AI 9 HX PRO 370, Radeon 890M, Micron 3500 1TB MTFDKBA1T0TGD, IPS LED, 1920x1200, 16" | Moyenne NVIDIA RTX PRO 2000 Blackwell Generation Laptop | Moyenne de la classe Workstation | |
|---|---|---|---|---|---|---|---|
| Power Consumption | -50% | 12% | 14% | 41% | -18% | -34% | |
| Idle Minimum * (Watt) | 4.8 | 15.4 -221% | 4.1 15% | 4.6 4% | 3.9 19% | 8.1 ? -69% | 8.98 ? -87% |
| Idle Average * (Watt) | 12.3 | 16.5 -34% | 9 27% | 10 19% | 8.3 33% | 12.6 ? -2% | 13.7 ? -11% |
| Idle Maximum * (Watt) | 12.7 | 23.1 -82% | 9.4 26% | 10.6 17% | 8.7 31% | 15.1 ? -19% | 17.9 ? -41% |
| Load Average * (Watt) | 89.6 | 86.6 3% | 86.7 3% | 60.9 32% | 51.6 42% | 87.6 ? 2% | 94.3 ? -5% |
| Cyberpunk 2077 ultra external monitor * (Watt) | 115.8 | 121.8 -5% | 102 12% | 92.8 20% | 54.6 53% | ||
| Cyberpunk 2077 ultra * (Watt) | 115.1 | 123.1 -7% | 106.1 8% | 96.8 16% | 55.4 52% | ||
| Load Maximum * (Watt) | 139.5 | 143.6 -3% | 152.9 -10% | 154.8 -11% | 63.7 54% | 145.3 ? -4% | 173.8 ? -25% |
* ... Moindre est la valeur, meilleures sont les performances
Consommation d'énergie Cyberpunk / Stress test
Consommation d'énergie avec moniteur externe
Durée de vie de la batterie
Avec la batterie de 90 Wh, nous avons mesuré 14:11 heures (150 cd/m²) et 8:51 heures (pleine luminosité) dans le test WLAN, ce qui est un bon résultat.

| Lenovo ThinkPad P16v G3 21RS000DGE Ultra 7 255H, RTX PRO 2000 Blackwell Generation Laptop, 90 Wh | Lenovo ThinkPad P1 Gen 8 Ultra 7 255H, RTX PRO 2000 Blackwell Generation Laptop, 90 Wh | HP ZBook X G1i 16 Ultra 7 265H, RTX PRO 2000 Blackwell Generation Laptop, 83 Wh | HP ZBook Power 16 G11 A R7 8845HS, RTX 2000 Ada Generation Laptop, 83 Wh | Lenovo ThinkPad P16s Gen 4 21RX000YGE Ryzen AI 9 HX PRO 370, Radeon 890M, 86 Wh | Moyenne de la classe Workstation | |
|---|---|---|---|---|---|---|
| Battery Runtime | -61% | -12% | -32% | -2% | -31% | |
| WiFi Websurfing (h) | 14.2 | 5.5 -61% | 12.5 -12% | 9.7 -32% | 13.9 -2% | 8.64 ? -39% |
| WiFi Websurfing max. Brightness (h) | 8.9 | 6.96 ? -22% |
Notebookcheck note globale
Lenovo ThinkPad P16v G3 21RS000DGE
- 01/14/2026 v8
Andreas Osthoff
 Total Sustainability Score:
 Comparaison des alternatives possibles
Image | Modèle | Prix | Poids | Épaisseur | Écran |
|---|---|---|---|---|---|
1. 87.3%  | Lenovo ThinkPad P16v G3 21RS000DGE Intel Core Ultra 7 255H ⎘ NVIDIA RTX PRO 2000 Blackwell Generation Laptop ⎘ 32 Go Mémoire, 1024 Go SSD | Amazon: Prix de liste: 2825€ | 2.2 kg | 19.6 mm | 16.00" 1920x1200 IPS |
2. 91.6%  | Lenovo ThinkPad P1 Gen 8 Intel Core Ultra 7 255H ⎘ NVIDIA RTX PRO 2000 Blackwell Generation Laptop ⎘ 32 Go Mémoire, 1024 Go SSD | Amazon: Prix de liste: 2000 USD | 1.9 kg | 20.6 mm | 16.00" 3200x2000 236 PPI Tandem OLED |
3. 87.4%  | HP ZBook X G1i 16 Intel Core Ultra 7 265H ⎘ NVIDIA RTX PRO 2000 Blackwell Generation Laptop ⎘ 64 Go Mémoire, 2048 Go SSD | Amazon: Prix de liste: 2700 USD | 2.2 kg | 23 mm | 16.00" 2560x1600 189 PPI IPS |
4. 85.4%  | HP ZBook Power 16 G11 A AMD Ryzen 7 8845HS ⎘ NVIDIA RTX 2000 Ada Generation Laptop ⎘ 64 Go Mémoire, 2048 Go SSD | Amazon: $4,862.75 Prix de liste: 2100 USD | 2.2 kg | 22.9 mm | 16.00" 2560x1600 189 PPI IPS |
5. 82%  | Lenovo ThinkPad P16s Gen 4 21RX000YGE AMD Ryzen AI 9 HX PRO 370 ⎘ AMD Radeon 890M ⎘ 64 Go Mémoire, 1024 Go SSD | Amazon: Prix de liste: 2440 Euro | 2 kg | 23 mm | 16.00" 1920x1200 142 PPI IPS LED |
Transparency
La sélection des appareils à examiner est effectuée par notre équipe éditoriale. L'échantillon de test a été prêté à l'auteur par le fabricant ou le détaillant pour les besoins de cet examen. Le prêteur n'a pas eu d'influence sur cette évaluation et le fabricant n'a pas reçu de copie de cette évaluation avant sa publication. Il n'y avait aucune obligation de publier cet article. En tant que média indépendant, Notebookcheck n'est pas soumis à l'autorité des fabricants, des détaillants ou des éditeurs.
Voici comment Notebookcheck teste
Chaque année, Notebookcheck examine de manière indépendante des centaines d'ordinateurs portables et de smartphones en utilisant des procédures standardisées afin de garantir que tous les résultats sont comparables. Nous avons continuellement développé nos méthodes de test depuis environ 20 ans et avons établi des normes industrielles dans le processus. Dans nos laboratoires de test, des équipements de mesure de haute qualité sont utilisés par des techniciens et des rédacteurs expérimentés. Ces tests impliquent un processus de validation en plusieurs étapes. Notre système d'évaluation complexe repose sur des centaines de mesures et de points de référence bien fondés, ce qui garantit l'objectivité.