Verdict sur le HP ZBook X G1i 16 : performances et portabilité équilibrées
Le ZBook X G1i 16 se situe confortablement entre la série ZBook 8, plus lente, et la série ZBook Fury, plus rapide mais plus lourde. Extérieurement, presque rien n'a changé par rapport au ZBook Power 16 G11i de l'année dernière ZBook Power 16 G11 de l'année dernière et l'expérience utilisateur reste donc identique, y compris les ports riches en fonctionnalités et les touches confortables. L'autonomie et les performances ont été améliorées, mais la consommation d'énergie est légèrement plus élevée lors de l'exécution de charges exigeantes.
Certaines fonctionnalités restent absentes de la machine. Si les options CPU et GPU haut de gamme sont hors de portée, comme on pouvait s'y attendre, le modèle ne prend pas en charge l'OLED, le HDR et la RAM ECC, ce qui pourrait irriter un petit sous-ensemble d'utilisateurs. Les ports semblent encombrés sur le bord gauche, d'autant plus qu'il n'y a pas de ports USB-C sur le bord droit. Les utilisateurs qui aiment solliciter le CPU et le GPU constateront également que le système ne fonctionnera pas plus silencieusement que son homologue de dernière génération.
Pour les prochains modèles, nous aimerions voir la série ZBook X s'éloigner de la recharge propriétaire par barillet AC tout en offrant de meilleures performances CPU Turbo Boost. Le processeur atteint rapidement plus de 100°C lorsqu'il est sollicité, ce qui suggère qu'une solution de refroidissement plus puissante pourrait être bénéfique.
Points positifs
Points négatifs
Prix et disponibilité
La configuration présentée ici est maintenant disponible sur HP.com au prix de 2900$, ainsi que de nombreuses autres options. La configuration Core Ultra 9 et 2400p est disponible sur Amazon pour 3500 $.
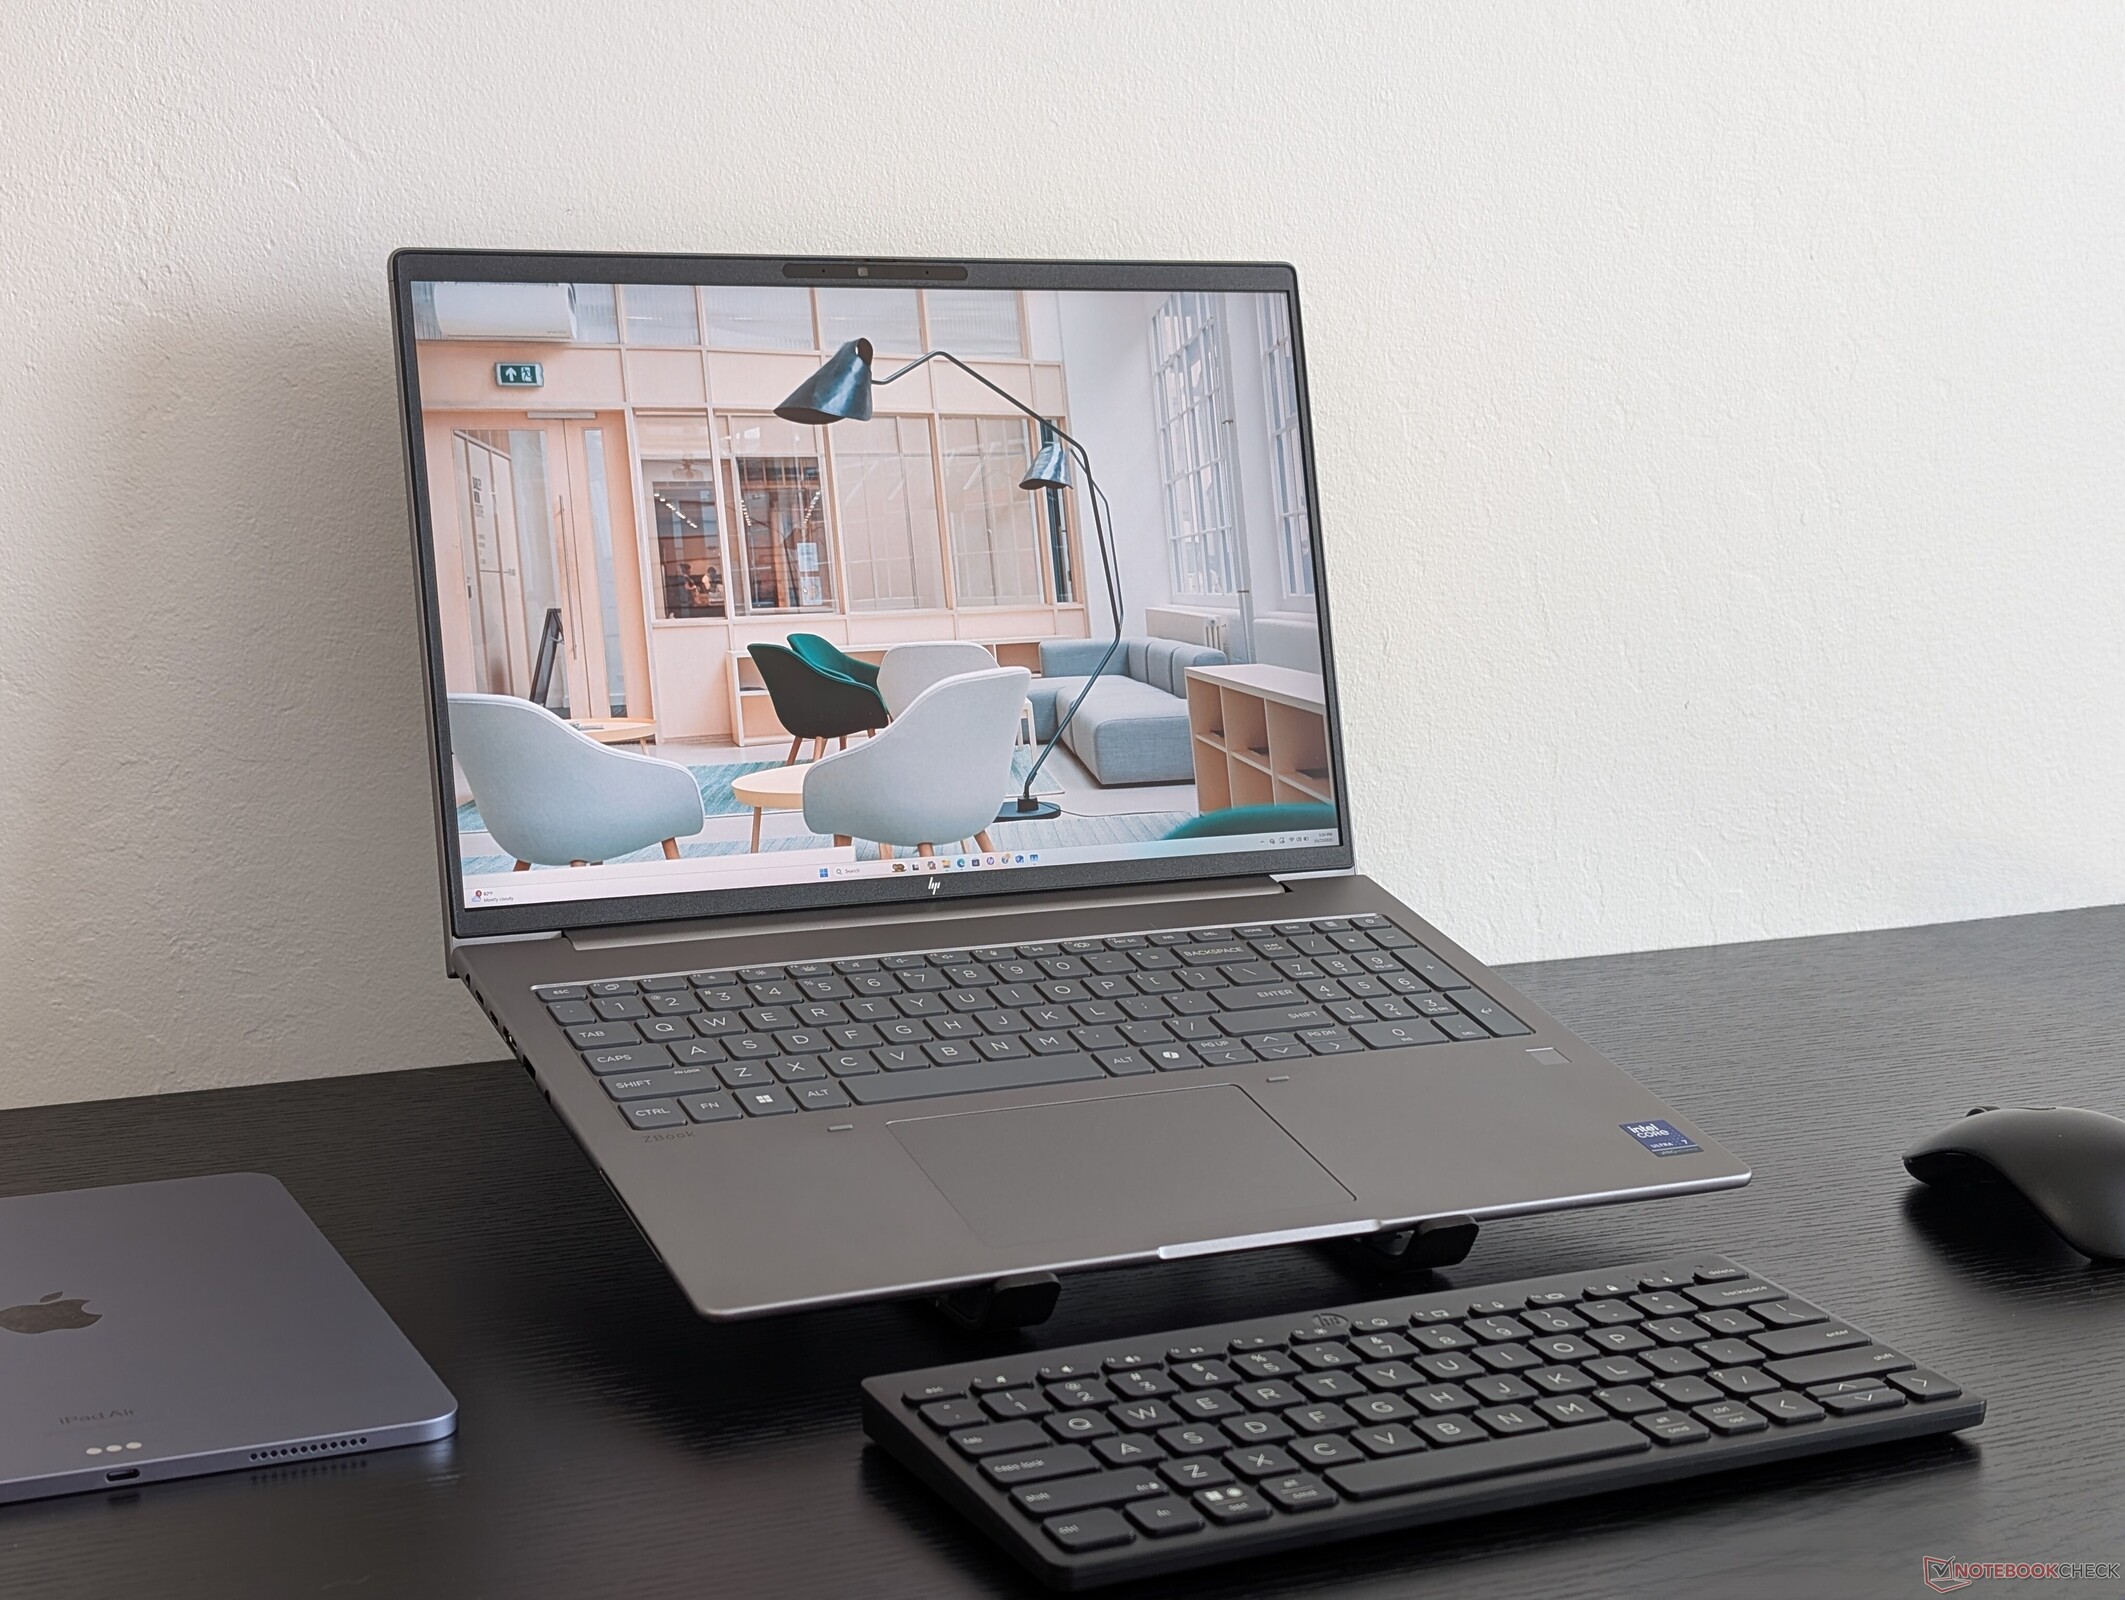
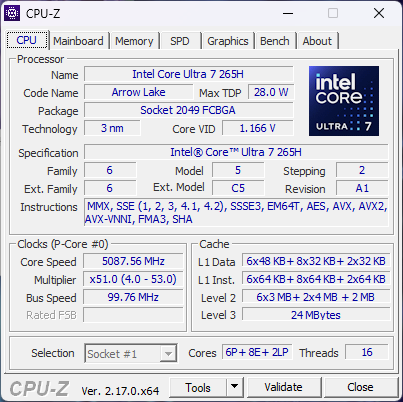
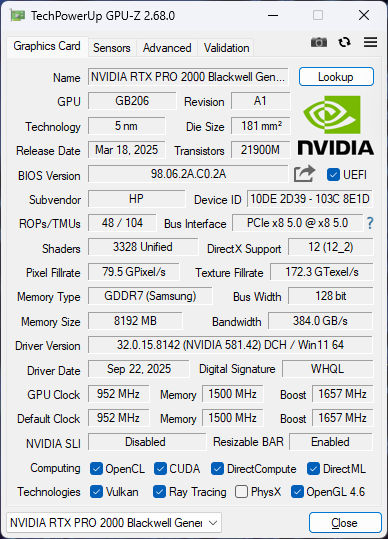
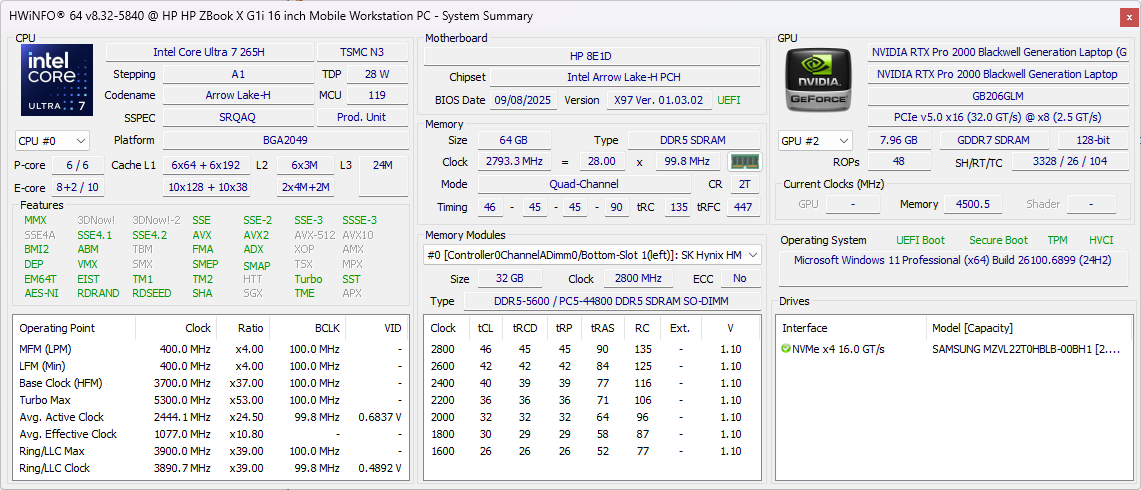
Le HP ZBook X G1i 16 est une station de travail mobile ultra-mince équipée de processeurs Arrow Lake-H de milieu de gamme et de cartes graphiques Nvidia RTX Pro Blackwell. Il est équipé d'un processeur Core Ultra 9 285H et d'un GPU RTX Pro 2000, tandis que le ZBook Fury G1i 16, plus épais, peut être équipé d'un processeur Arrow Lake-HX plus rapide et d'un GPU RTX Pro 5000.
Notre unité de test est la configuration intermédiaire avec le Core Ultra 7 265H, l'écran 2K 1600p120, et le GPU RTX Pro 2000 pour environ $2700 USD. Une liste complète des configurations disponibles peut être consultée à l'adresse https://www.hp.com/us-en/workstations/zbook-x-configure.html.
Les alternatives au ZBook X G1i 16 comprennent d'autres stations de travail ultrafines de 16 pouces comme le Dell Precision 5690, Lenovo ThinkPad P16s G2ou la série MSI CreatorPro series. Le ZBook X G1i 16 ne doit pas être confondu avec le ZBook 8 G1i 16, qui est une version plus bas de gamme, avec un GPU RTX Pro 500 plus lent.
Plus d'avis sur HP :
Spécifications
Cas
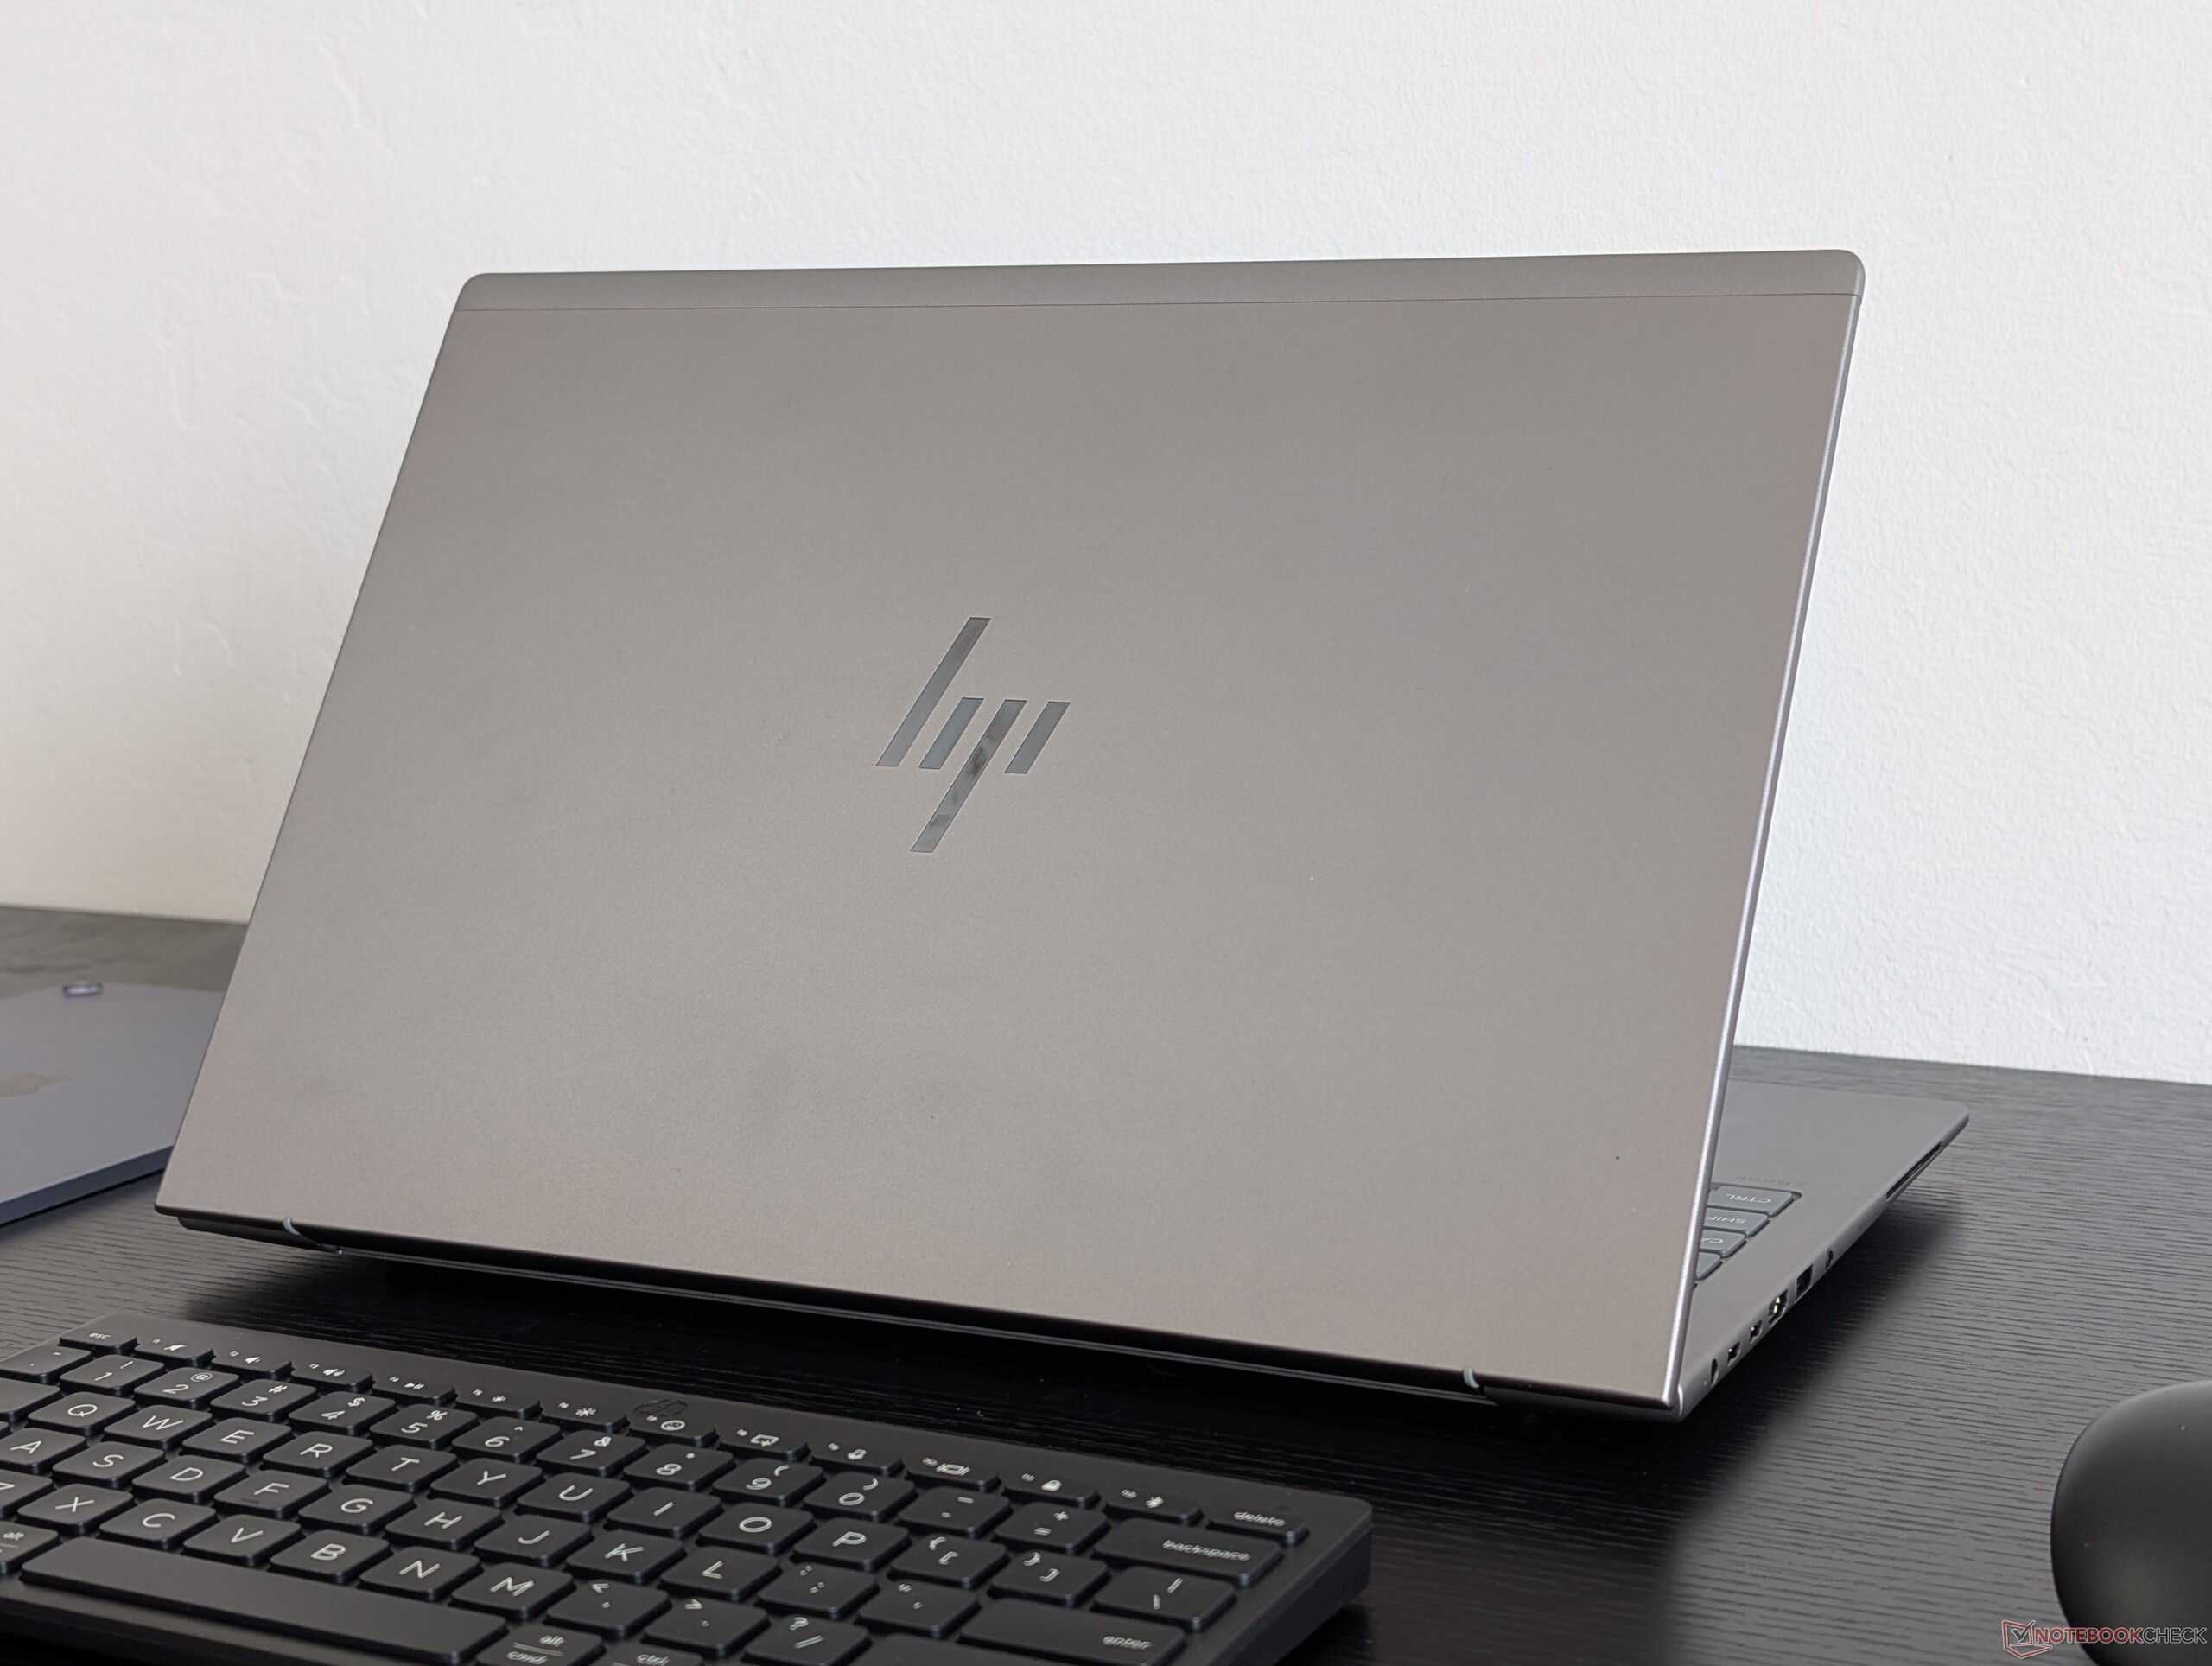
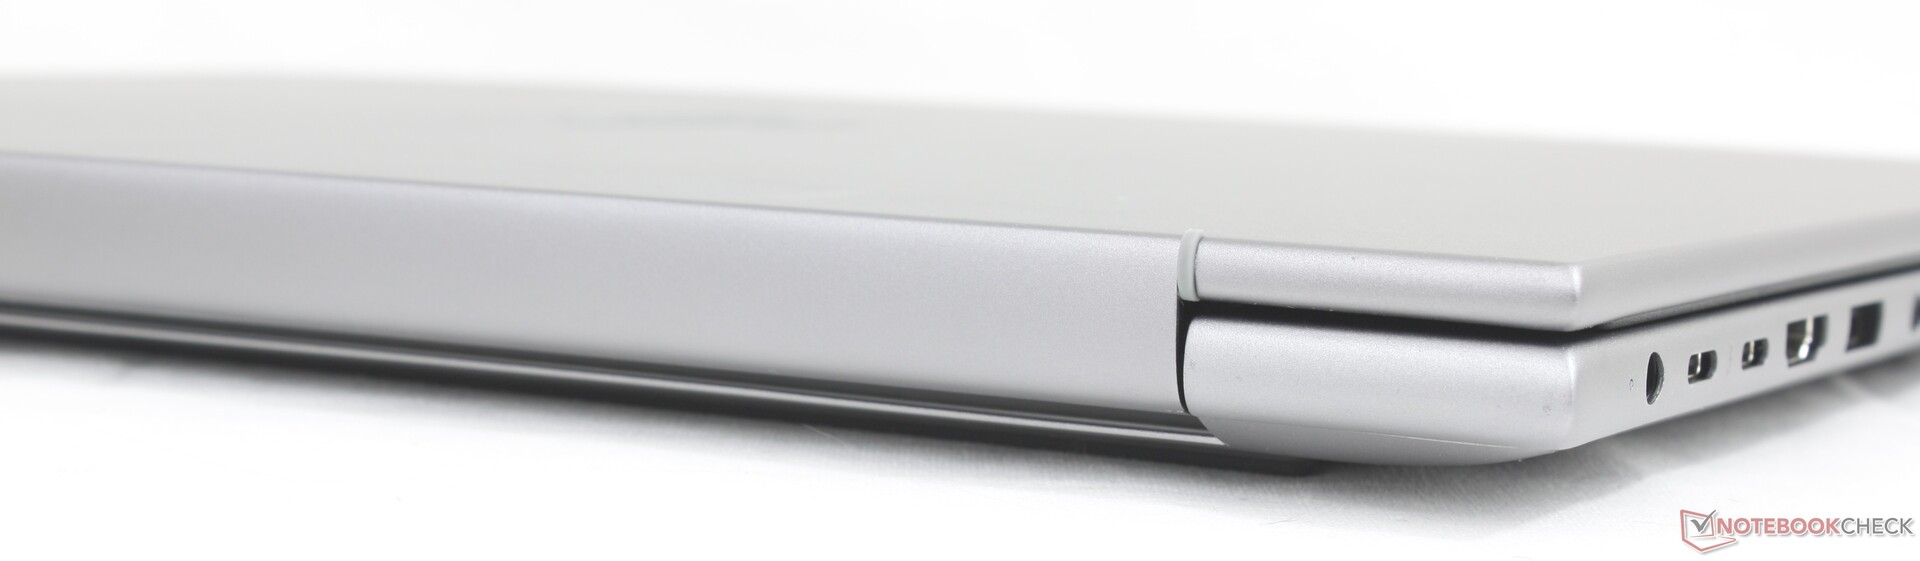
Le ZBook X G1i 16 remplace directement le ZBook Power 16 G11 et, malgré le changement de nom, les deux modèles sont pratiquement identiques sur le plan visuel. Les caractéristiques physiques restent pratiquement les mêmes, notamment le poids, les dimensions et les ports. Nos commentaires sur le ZBook Power 16 G11 s'appliquent donc également au ZBook X G1i 16.
Connectivité
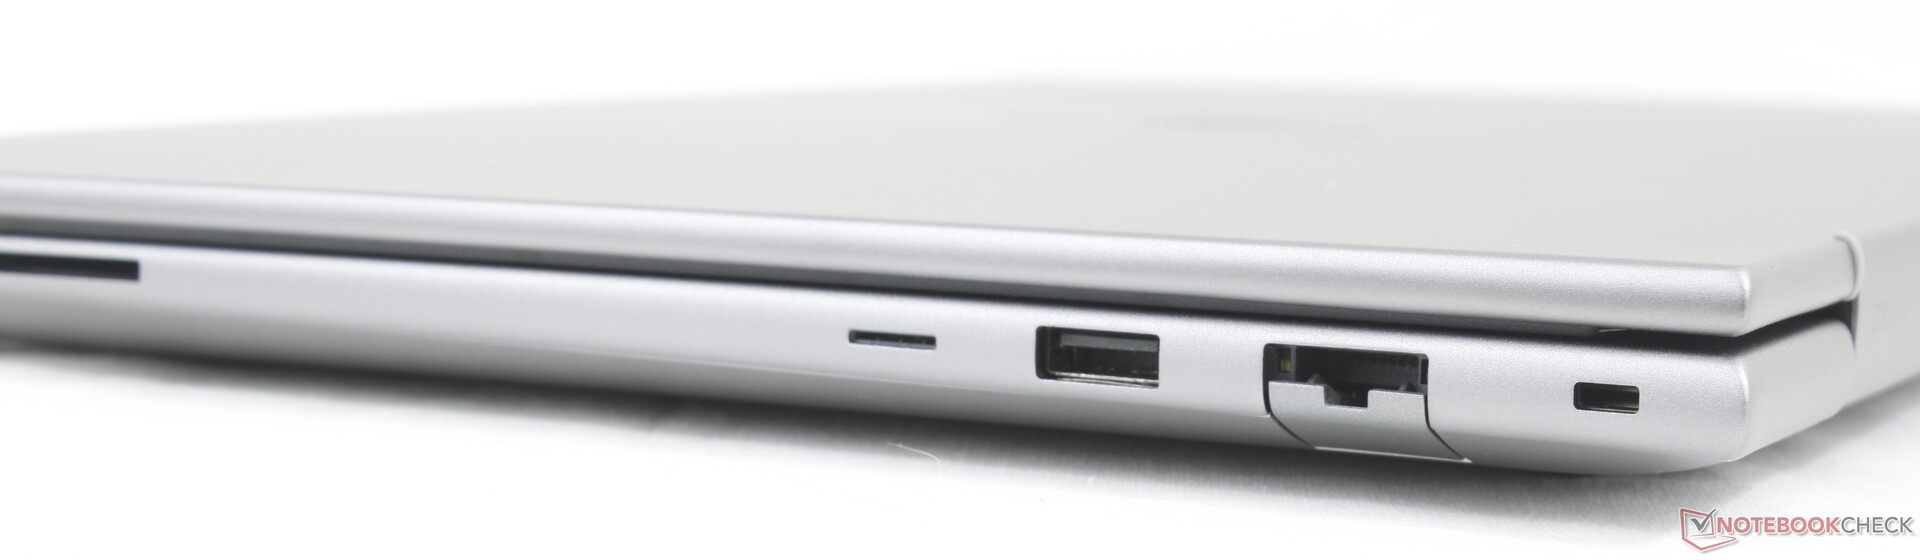
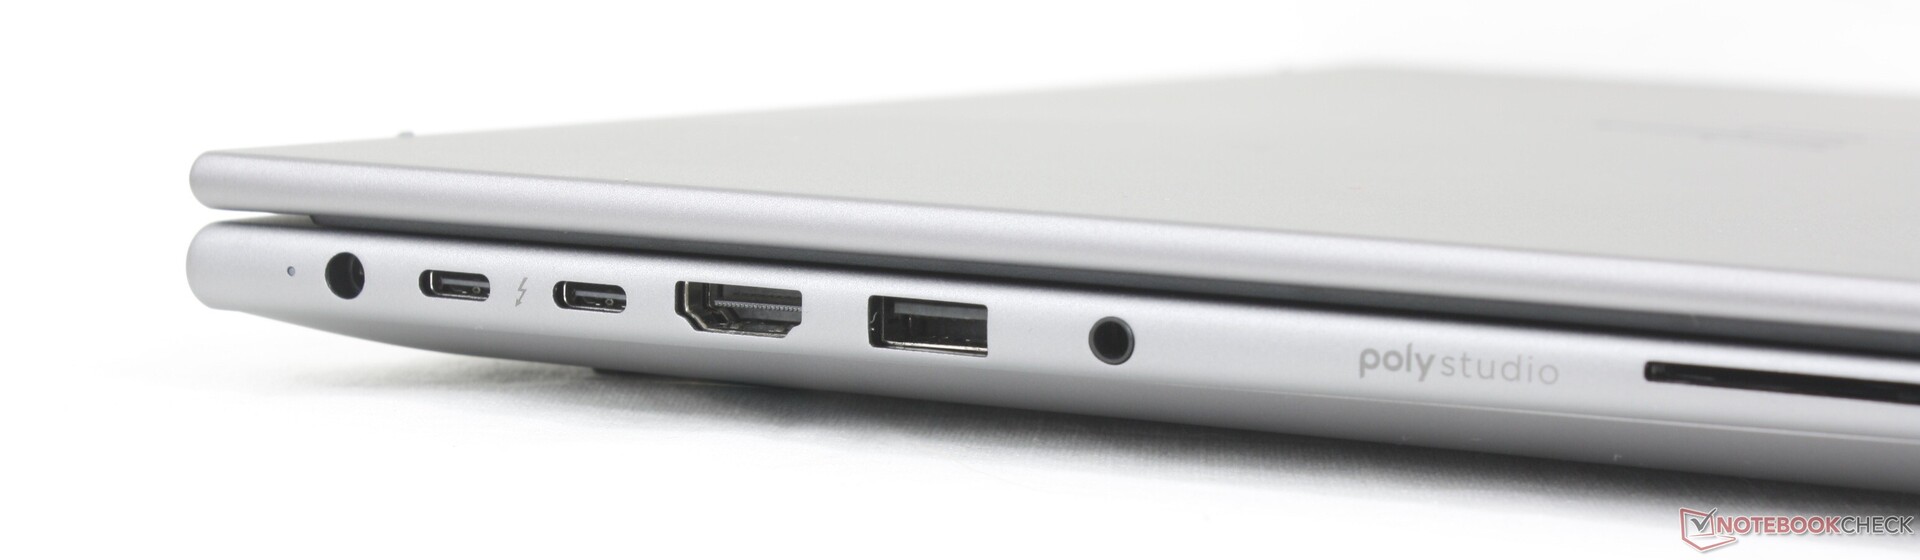
Les options de port ont été améliorées par rapport à l'année dernière ZBook Studio 16 G11 à une exception près. Alors que le ZBook X G1i 16 inclut des ports supplémentaires tels que RJ-45, HDMI et plus de ports USB-A, il a supprimé l'un des ports USB-C. De plus, nous aimerions voir une transition complète vers la charge USB-C, similaire à celle du récent Dell Pro Max 16 Plus.
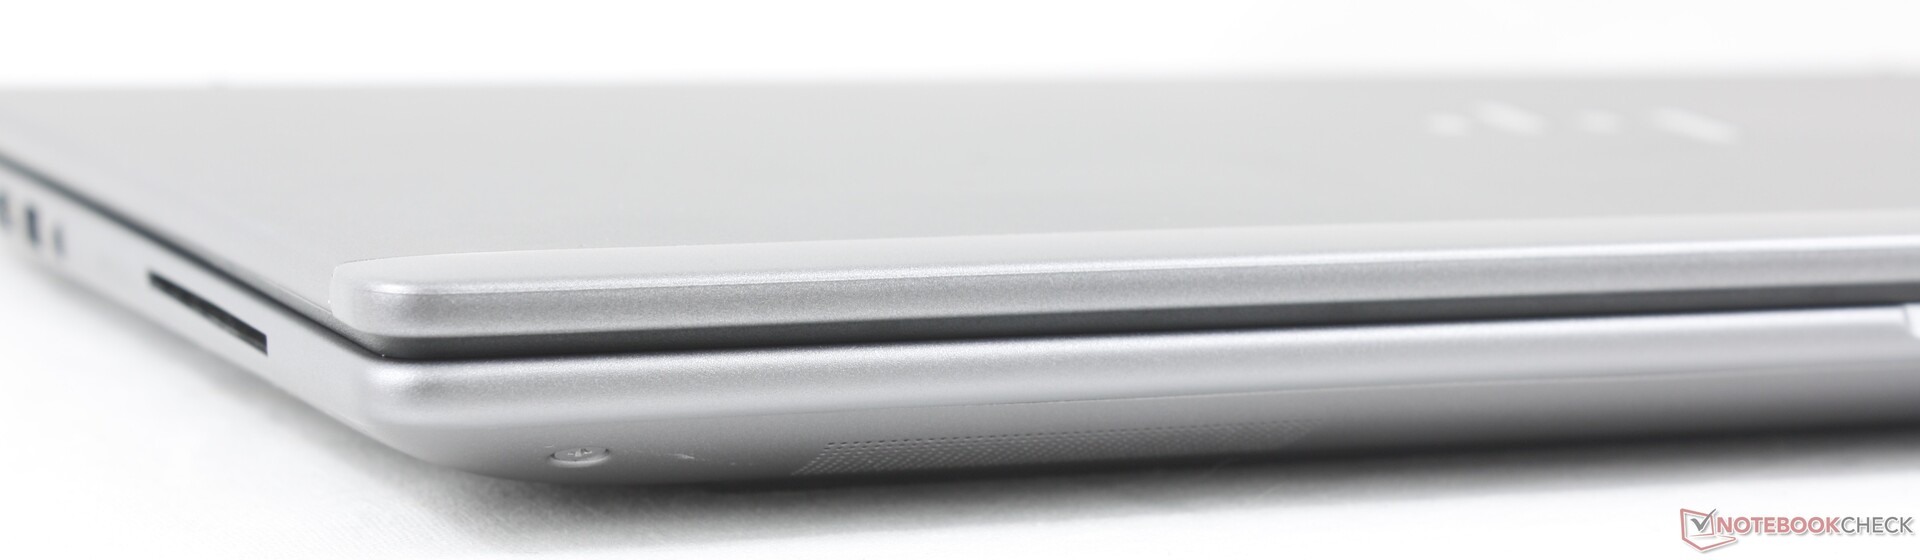
Lecteur de carte SD
| SD Card Reader | |
| average JPG Copy Test (av. of 3 runs) | |
| HP ZBook X G1i 16 (Toshiba Exceria Pro SDXC 64 GB UHS-II) | |
| HP ZBook Power 16 G11 A (Toshiba Exceria Pro SDXC 64 GB UHS-II) | |
| Lenovo ThinkPad P16 Gen 2 (Toshiba Exceria Pro SDXC 64 GB UHS-II) | |
| Dell Pro Max 16 Plus (Toshiba Exceria Pro SDXC 64 GB UHS-II) | |
| maximum AS SSD Seq Read Test (1GB) | |
| HP ZBook Power 16 G11 A (Toshiba Exceria Pro SDXC 64 GB UHS-II) | |
| HP ZBook X G1i 16 (Toshiba Exceria Pro SDXC 64 GB UHS-II) | |
| Dell Pro Max 16 Plus (Toshiba Exceria Pro SDXC 64 GB UHS-II) | |
| Lenovo ThinkPad P16 Gen 2 (Toshiba Exceria Pro SDXC 64 GB UHS-II) | |
Communication
Webcam
Les options de webcam comprennent 2 MP ou 5 MP avec IR et un obturateur physique.


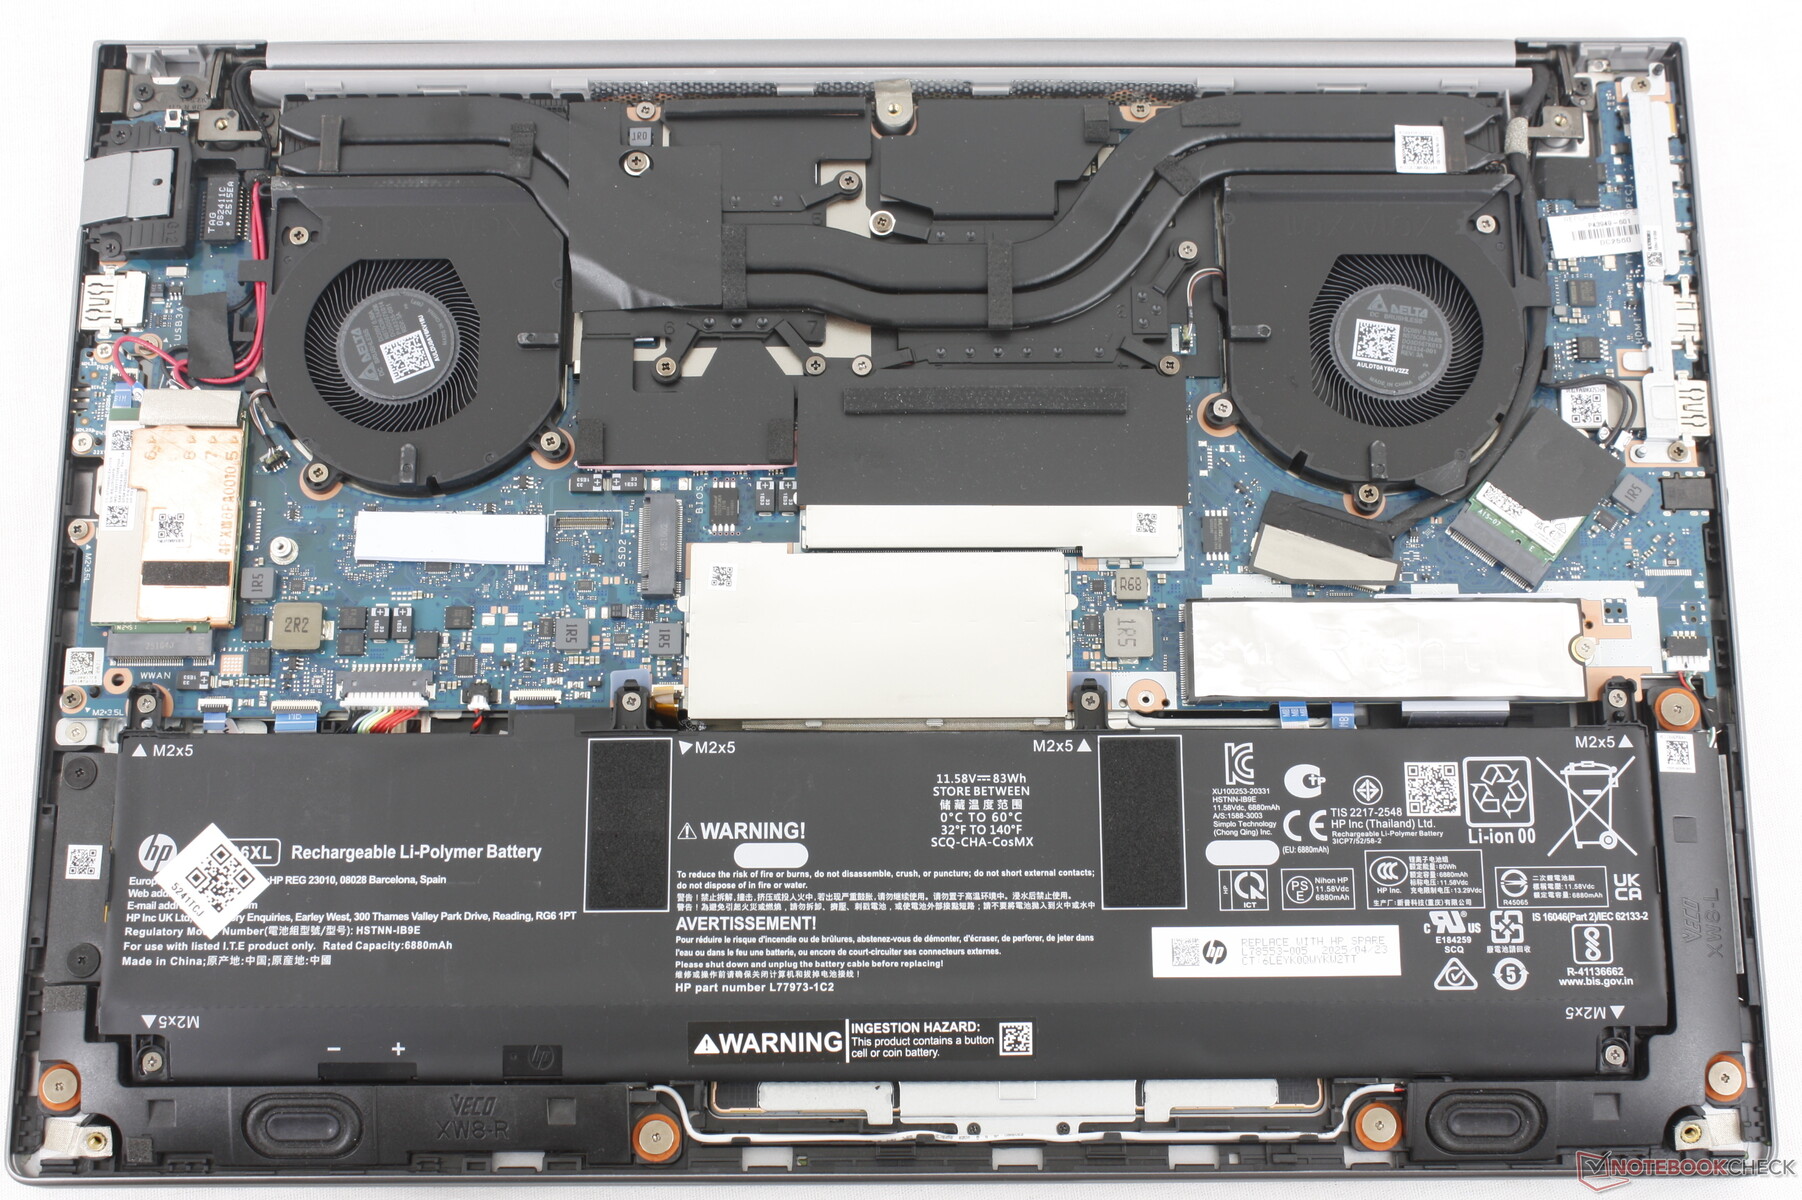
Maintenance
HP fournit des vidéos de démontage et des guides écrits pour l'entretien du ZBook X G1i 16.
Durabilité
Toutes les stations de travail HP Z sont certifiées EPEAT Gold ou Silver et intègrent des plastiques ou des métaux issus de l'océan et recyclés au cours du processus de fabrication.
Accessoires et garantie
La boîte ne contient pas d'autres éléments que l'adaptateur secteur et la documentation. Une garantie limitée de trois ans est offerte en standard si vous l'achetez sur le site web du fabricant.
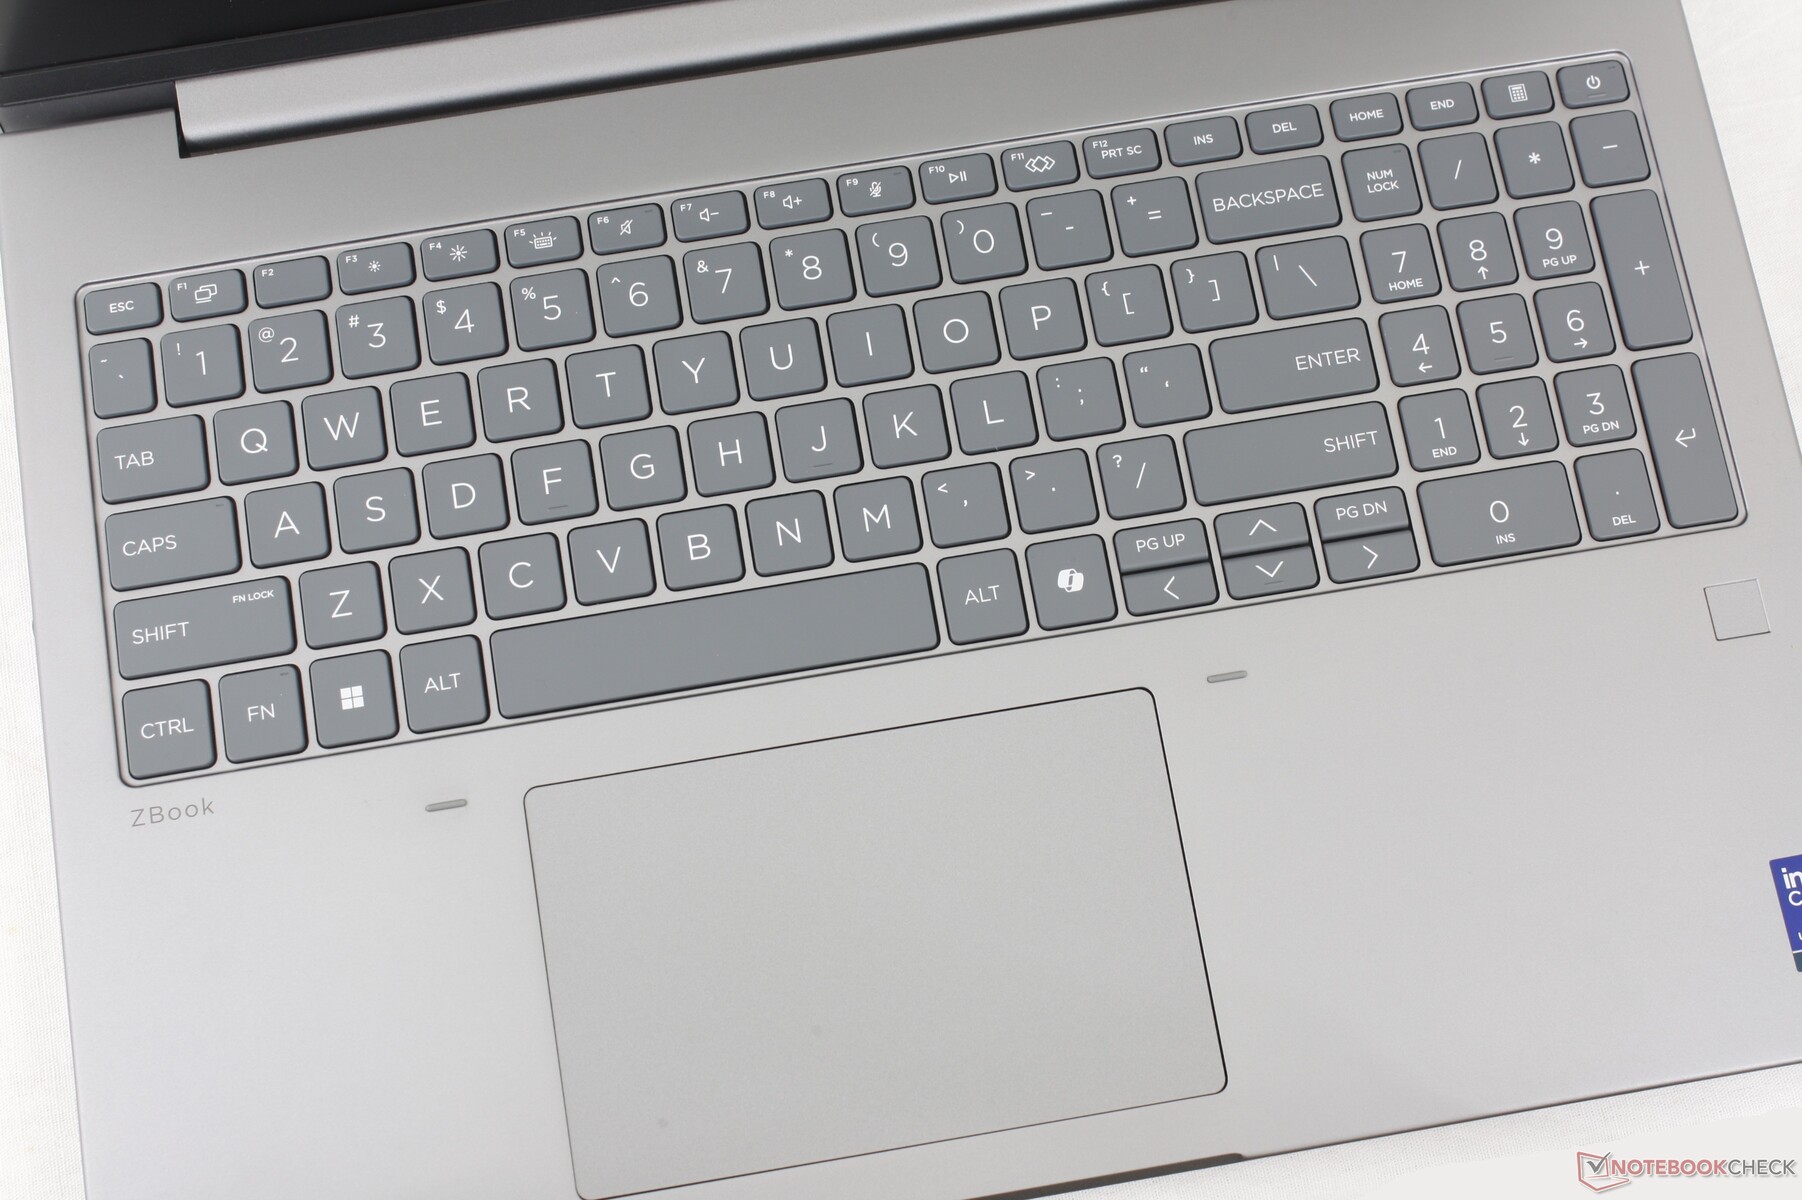
Périphériques d'entrée
L'expérience de frappe est similaire à celle de l'ancien ZBook Fury 16 G9 la disposition du clavier ayant peu évolué au fil des générations de ZBook. Sur le ZBook X G1i 16, HP a toutefois supprimé les boutons dédiés à la souris sans augmenter la surface (12 x 8 cm contre 12,4 x 8,3 cm sur le ZBook Fury 16 G9).
Affichage
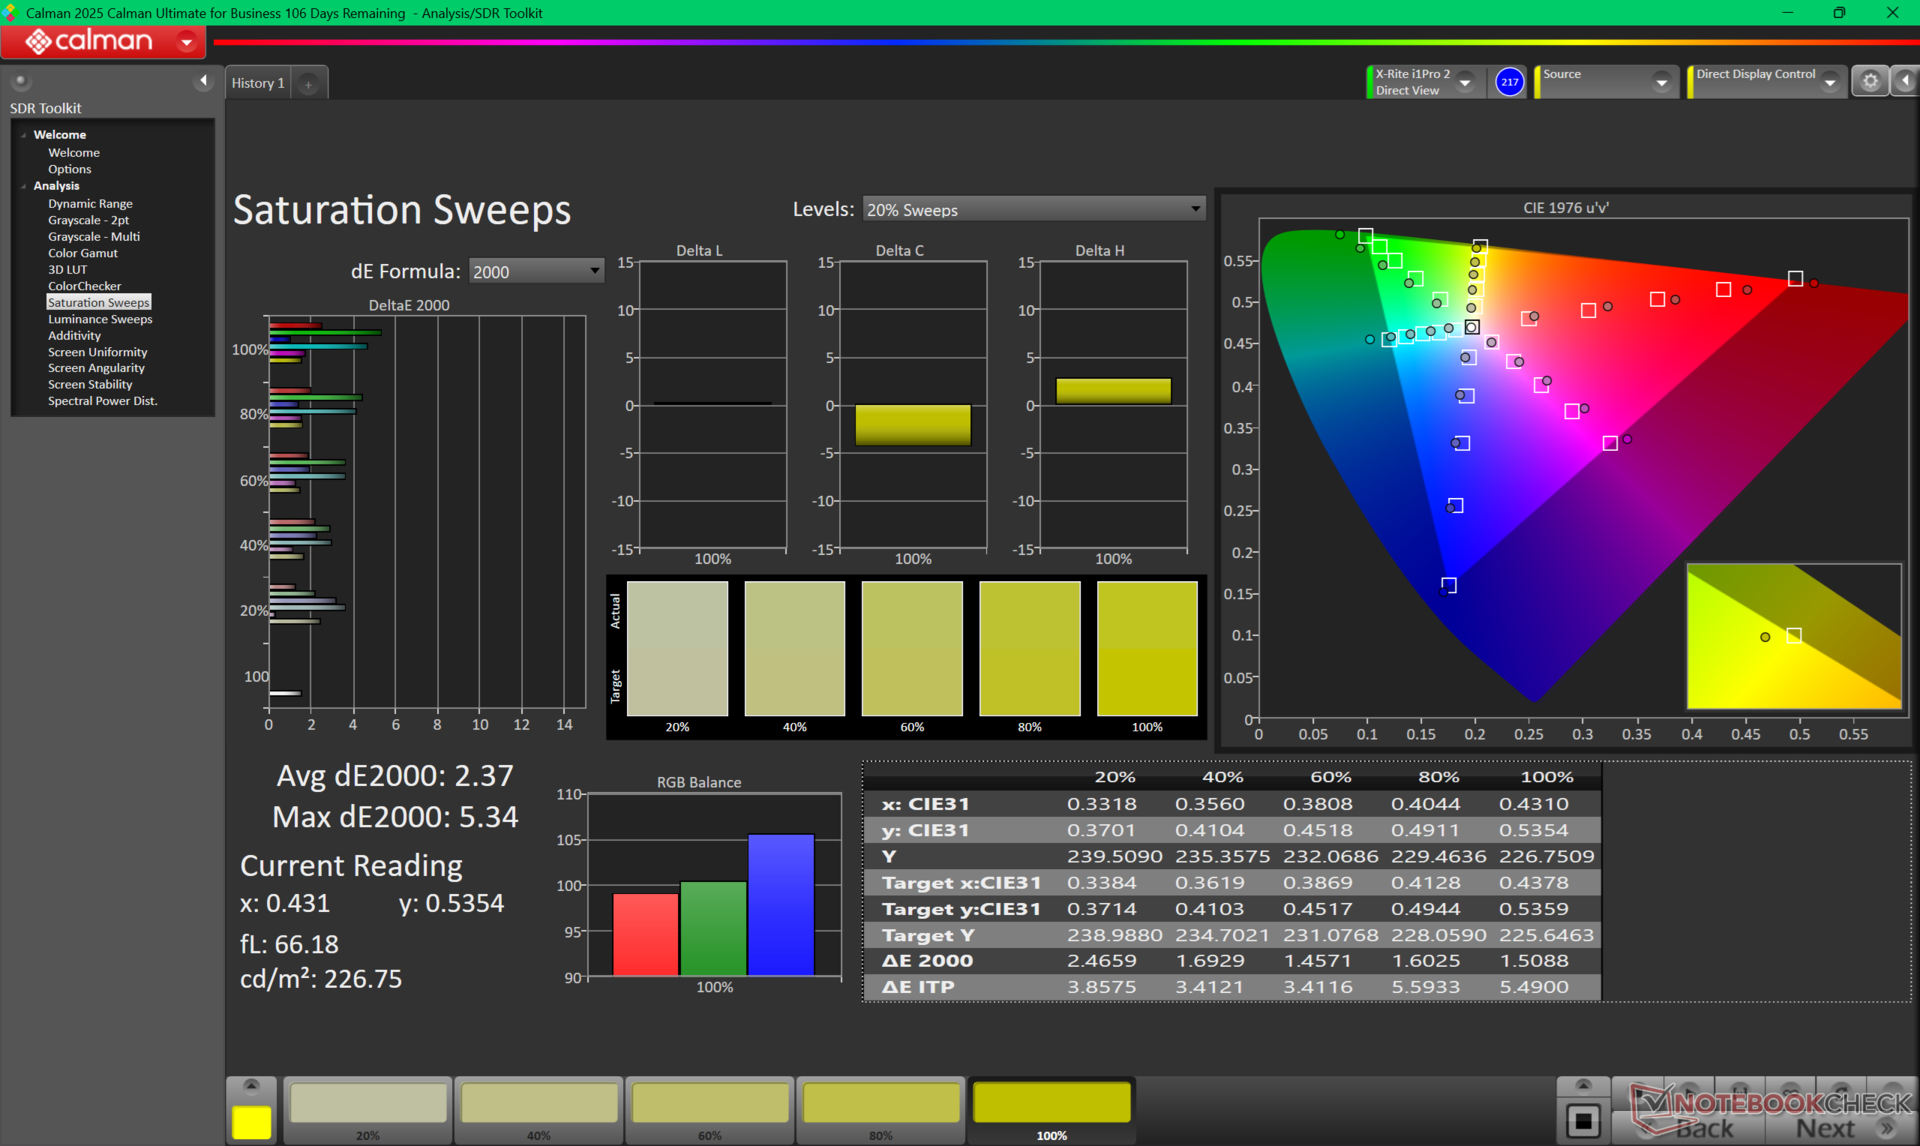
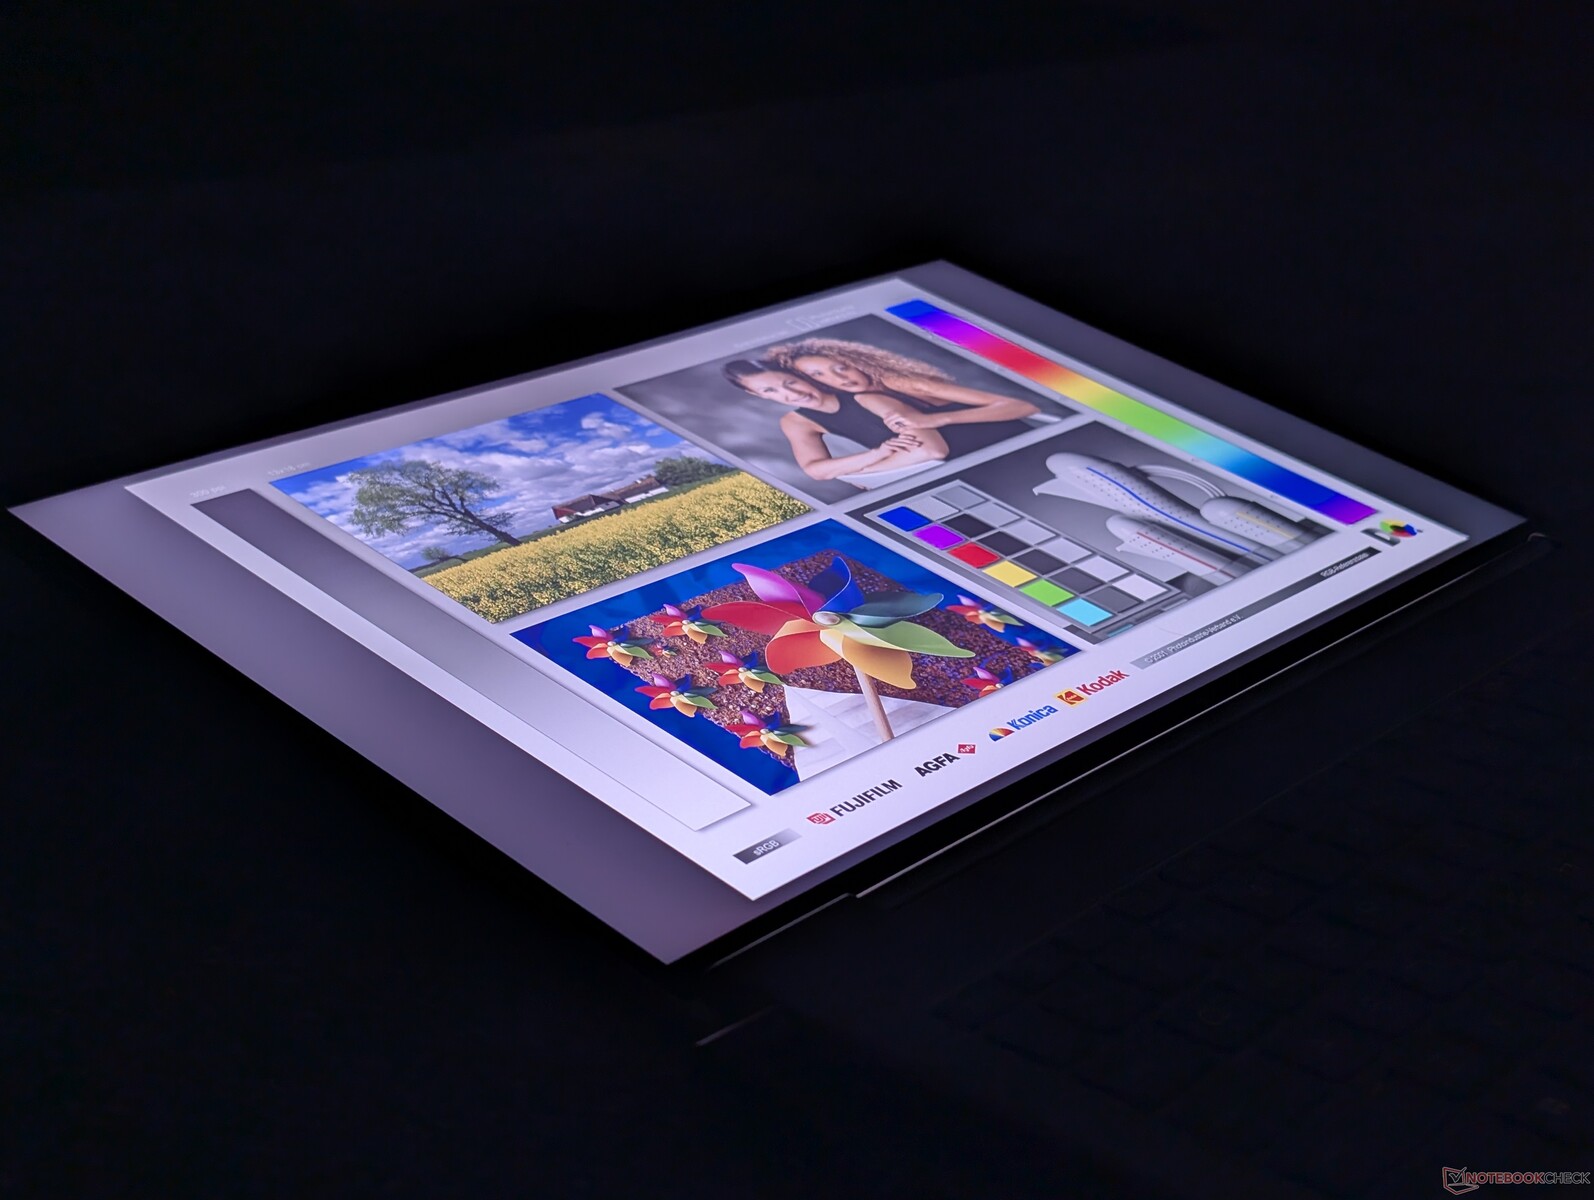
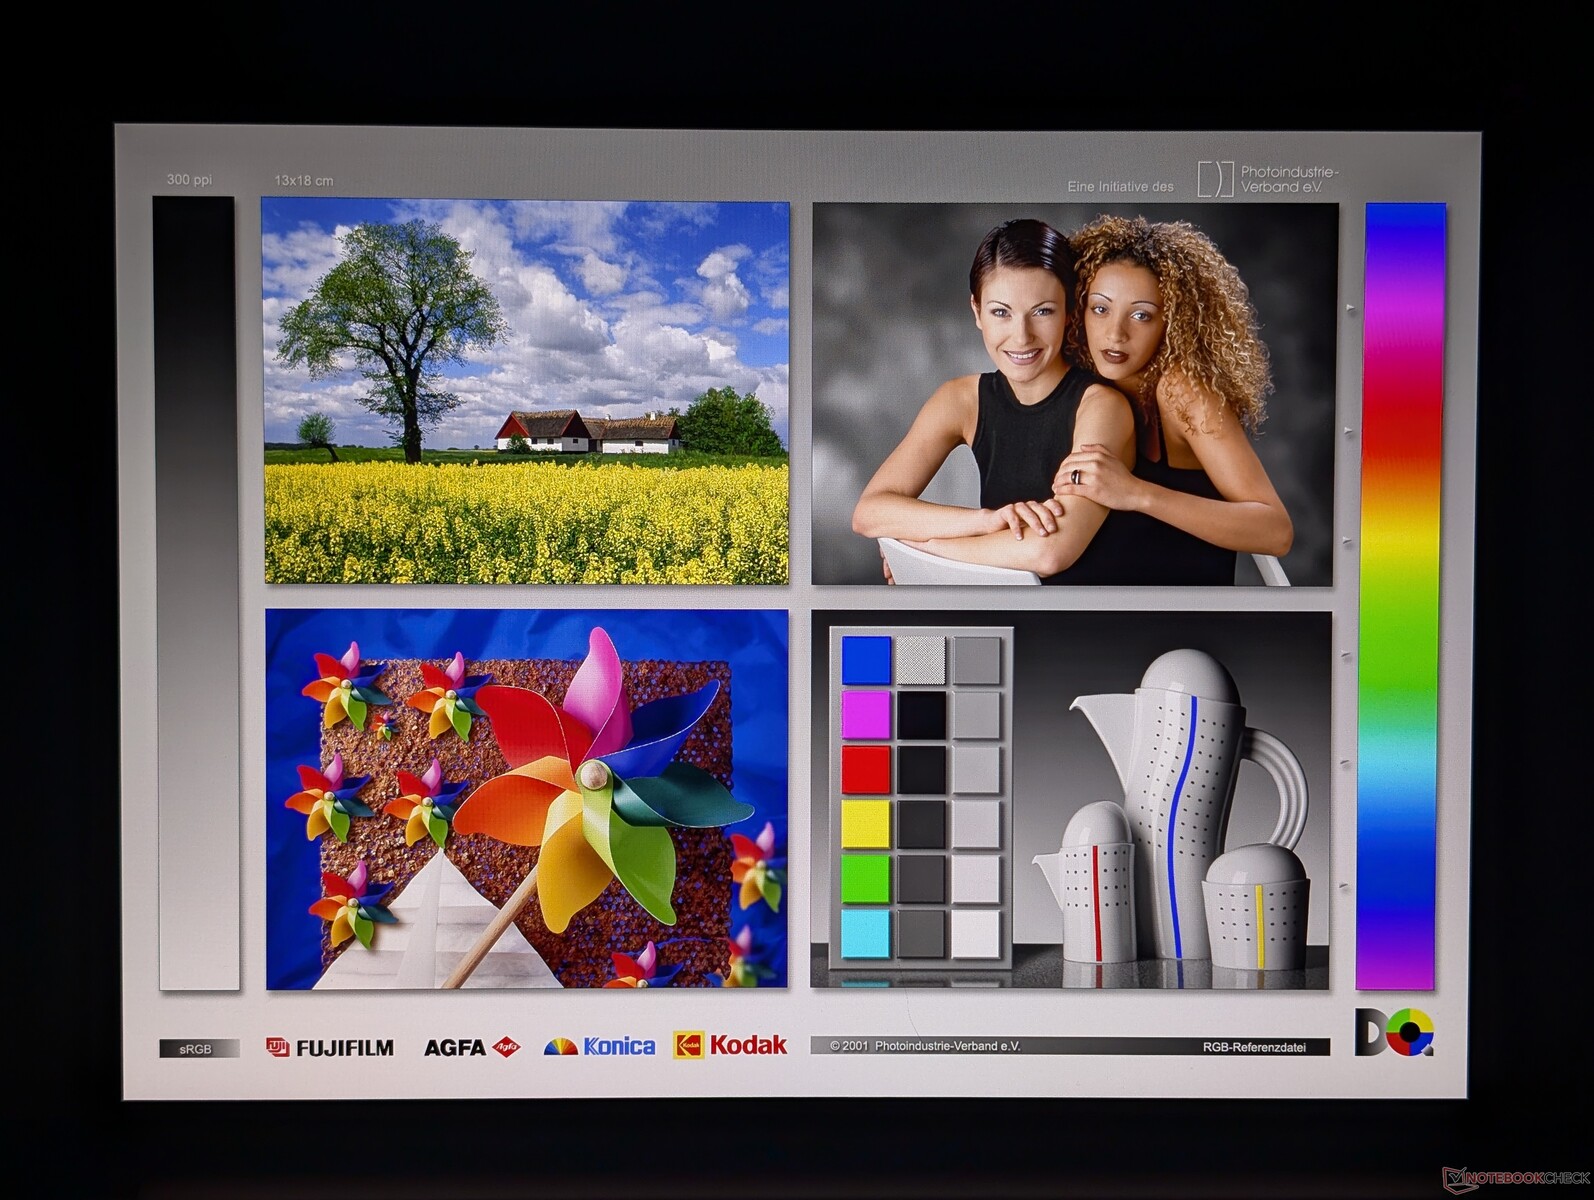
Six options d'affichage IPS sont disponibles, allant de 1200p60 et 300 nits jusqu'à 2400p120 et 500 nits avec des couleurs DCI-P3. Notre unité de test est livrée avec l'option intermédiaire 1600p 120 Hz matte qui offre toujours des couleurs P3 mais pas d'écran tactile ni de fonctionnalités Sure View. En fait, cette dernière n'est disponible que sur la dalle 1200p non tactile.
Notez qu'il n'y a pas d'options OLED ou de support HDR pour ce modèle. Si la précision des couleurs est importante, nous vous recommandons d'éviter les options 1200p bas de gamme car elles n'offrent que 60 % des couleurs sRGB.

| |||||||||||||||||||||||||
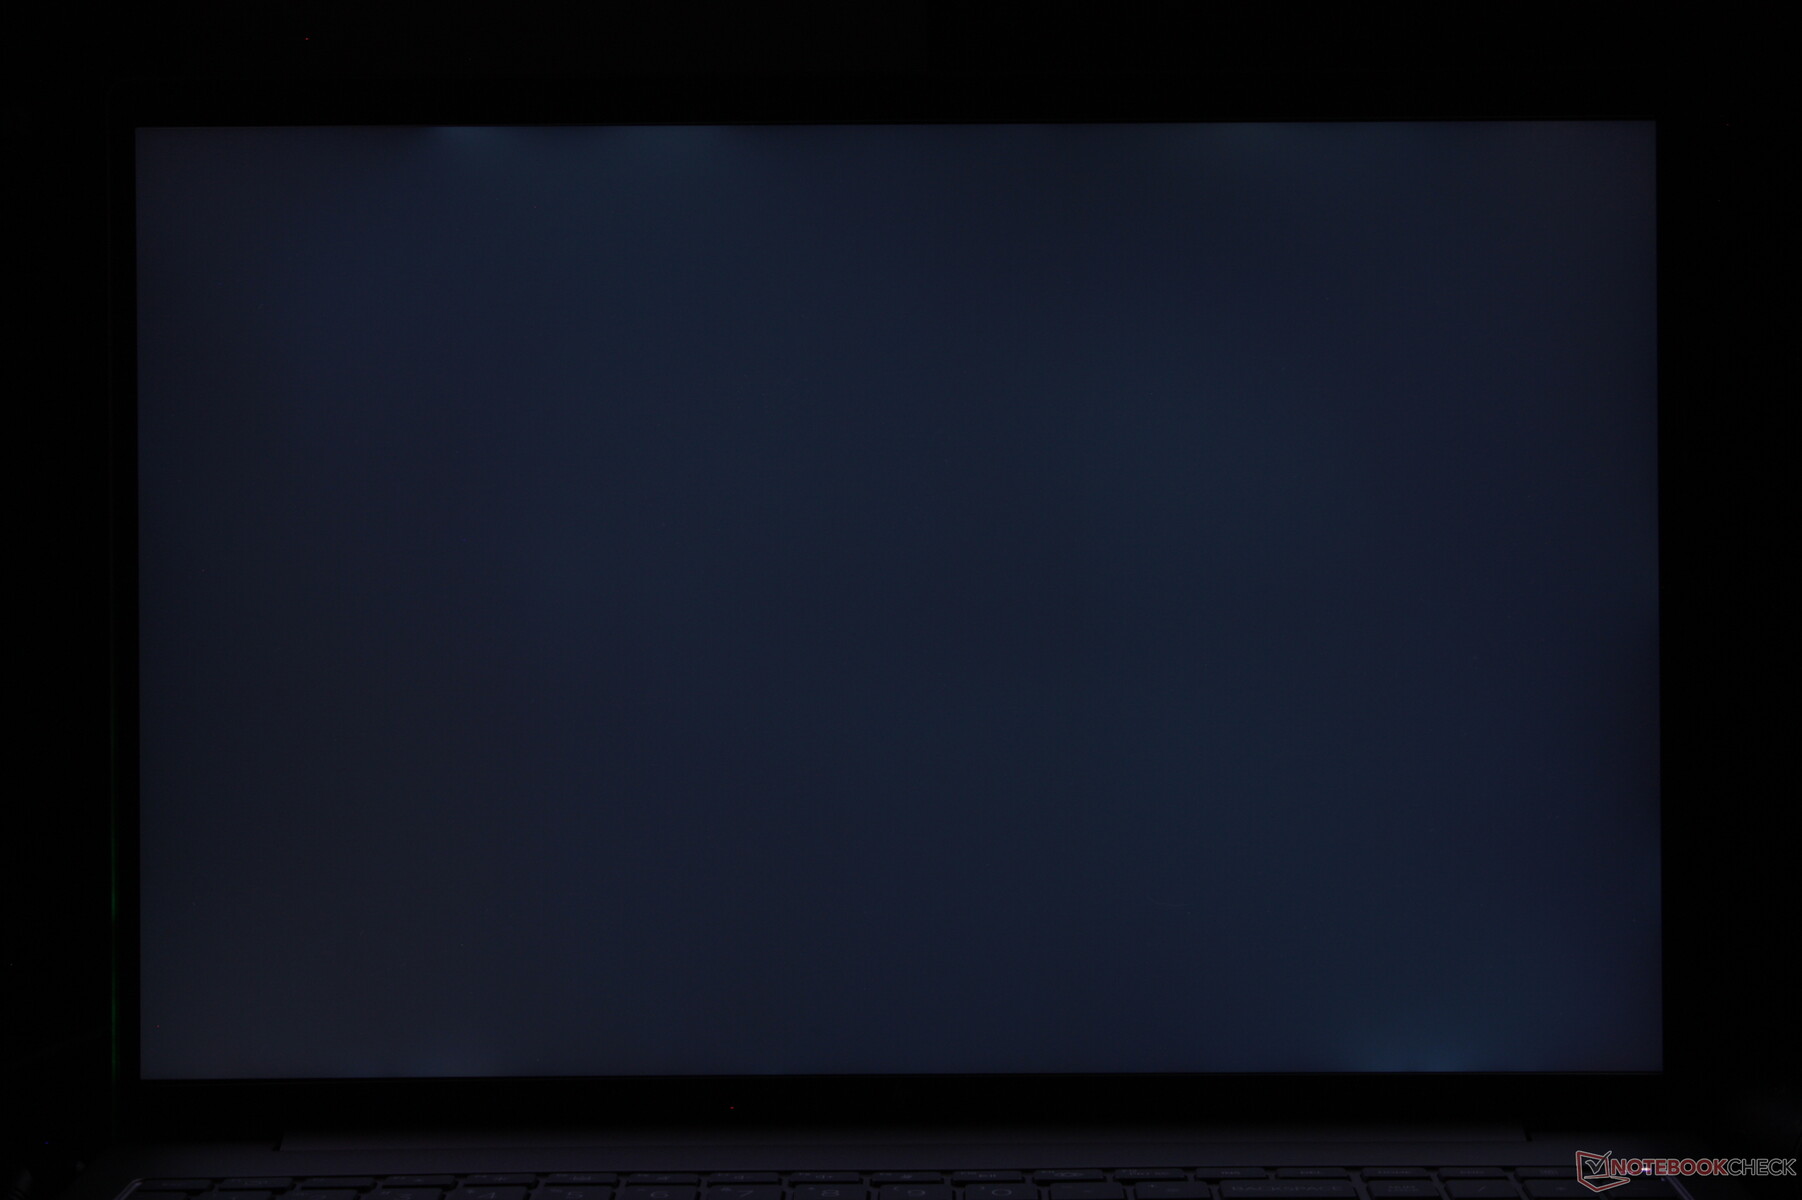
Homogénéité de la luminosité: 88 %
Valeur mesurée au centre, sur batterie: 461.8 cd/m²
Contraste: 1004:1 (Valeurs des noirs: 0.46 cd/m²)
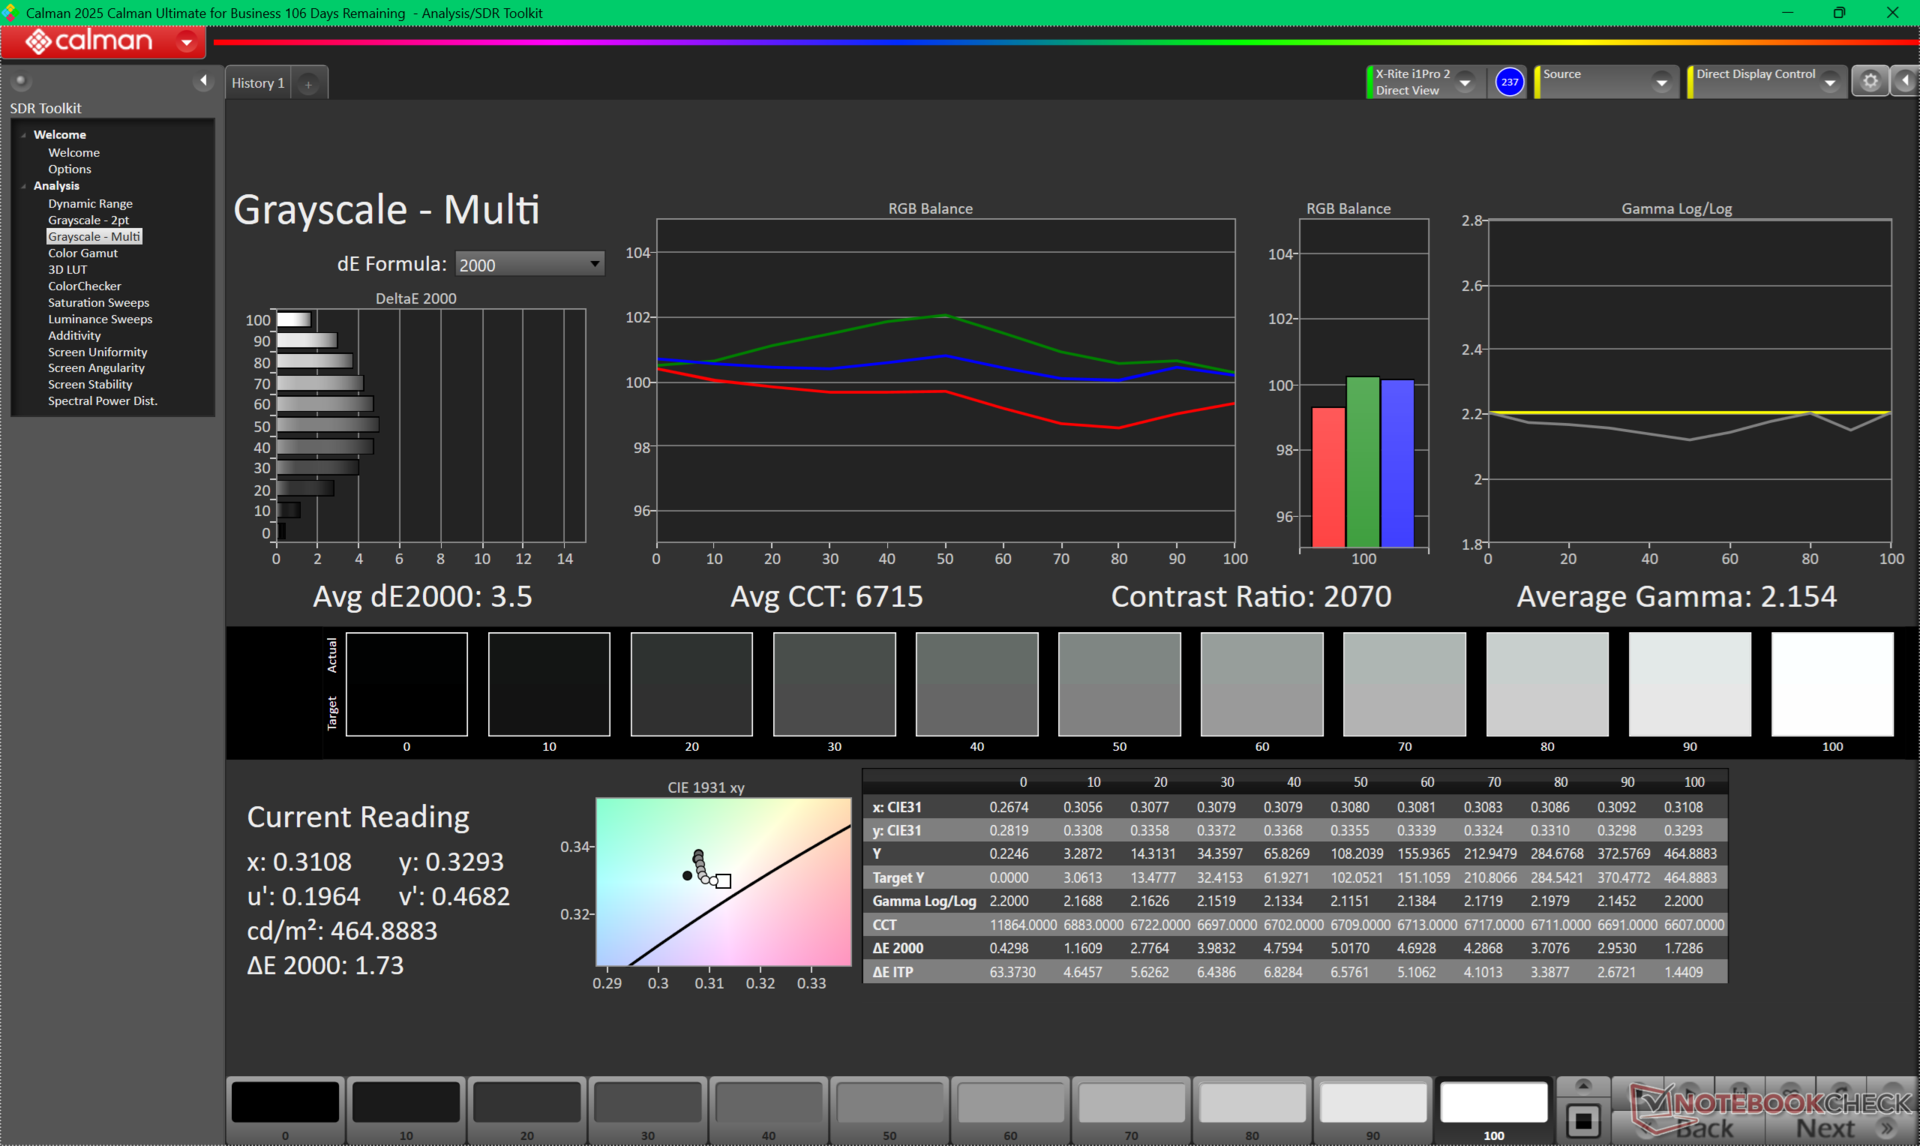
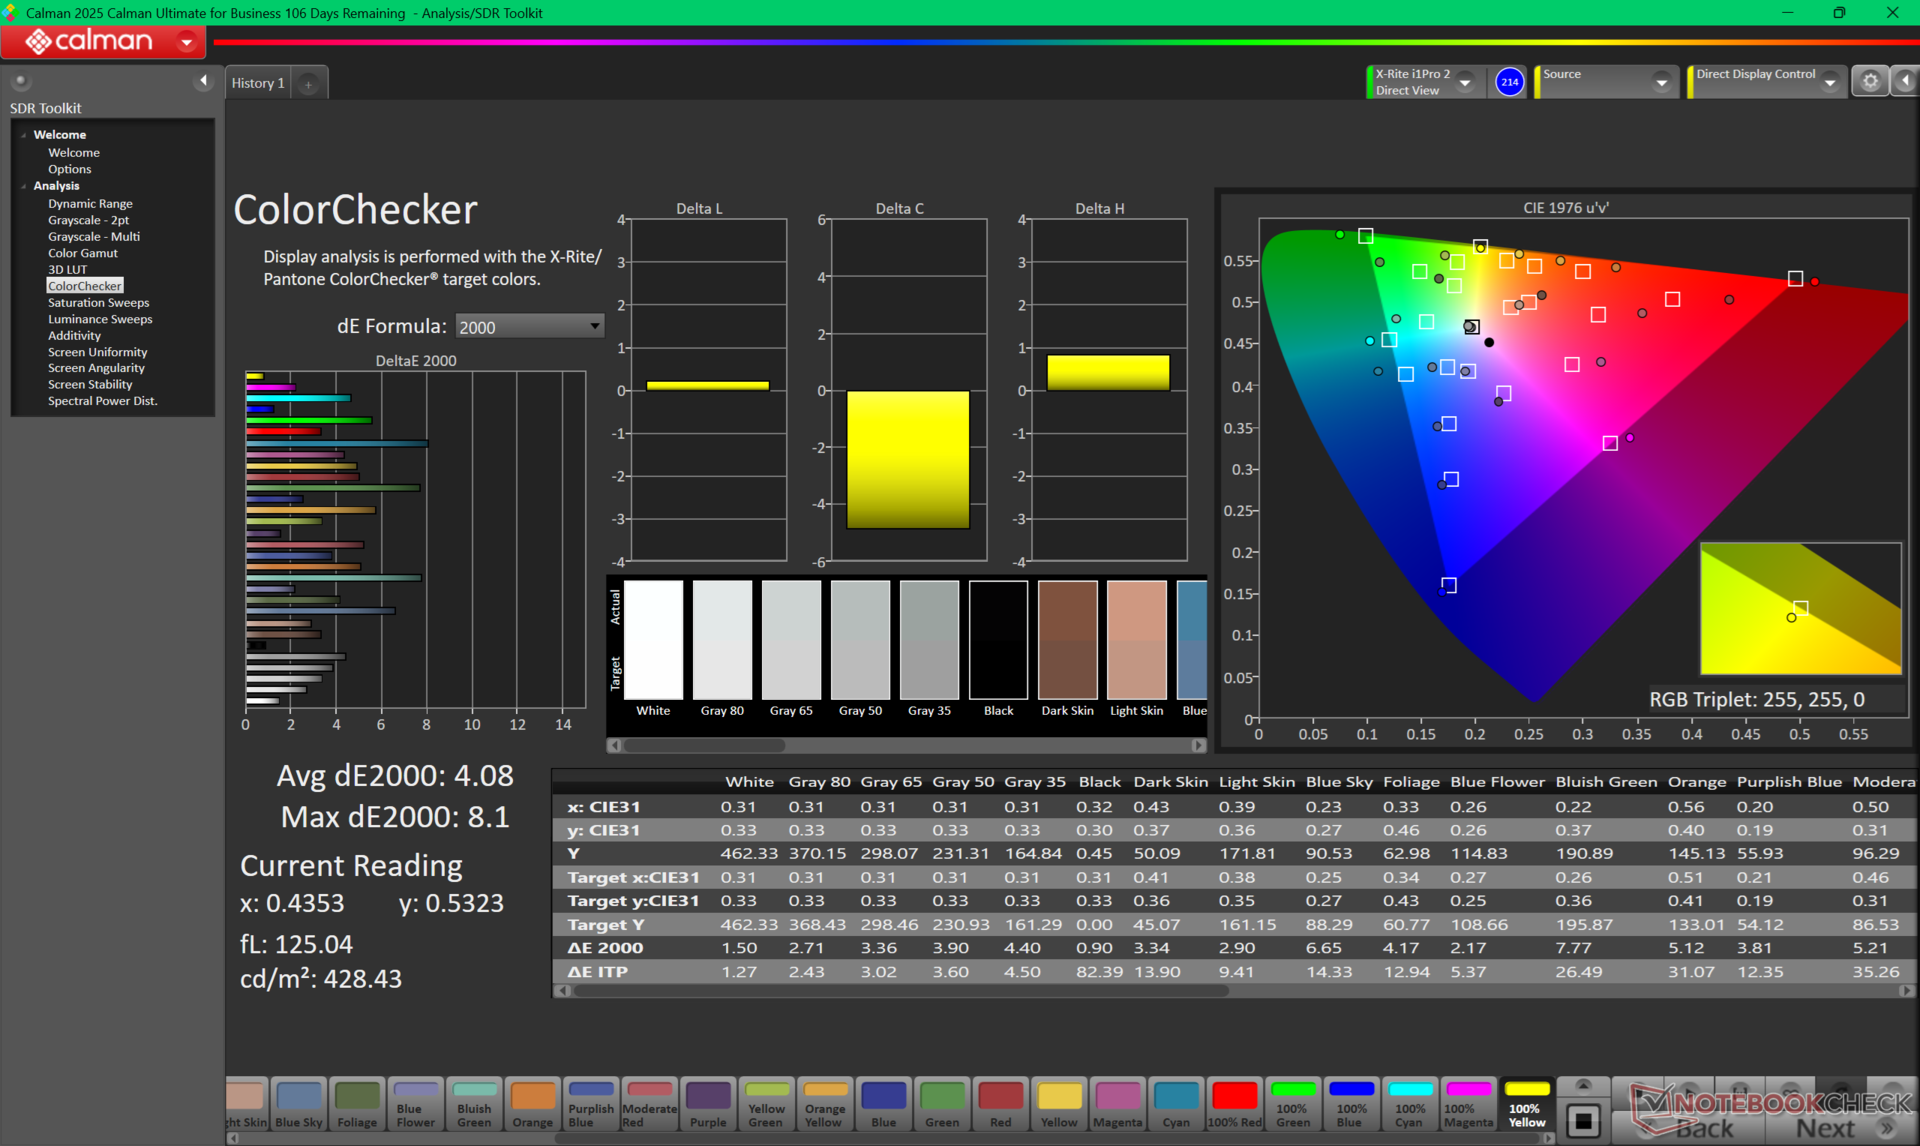
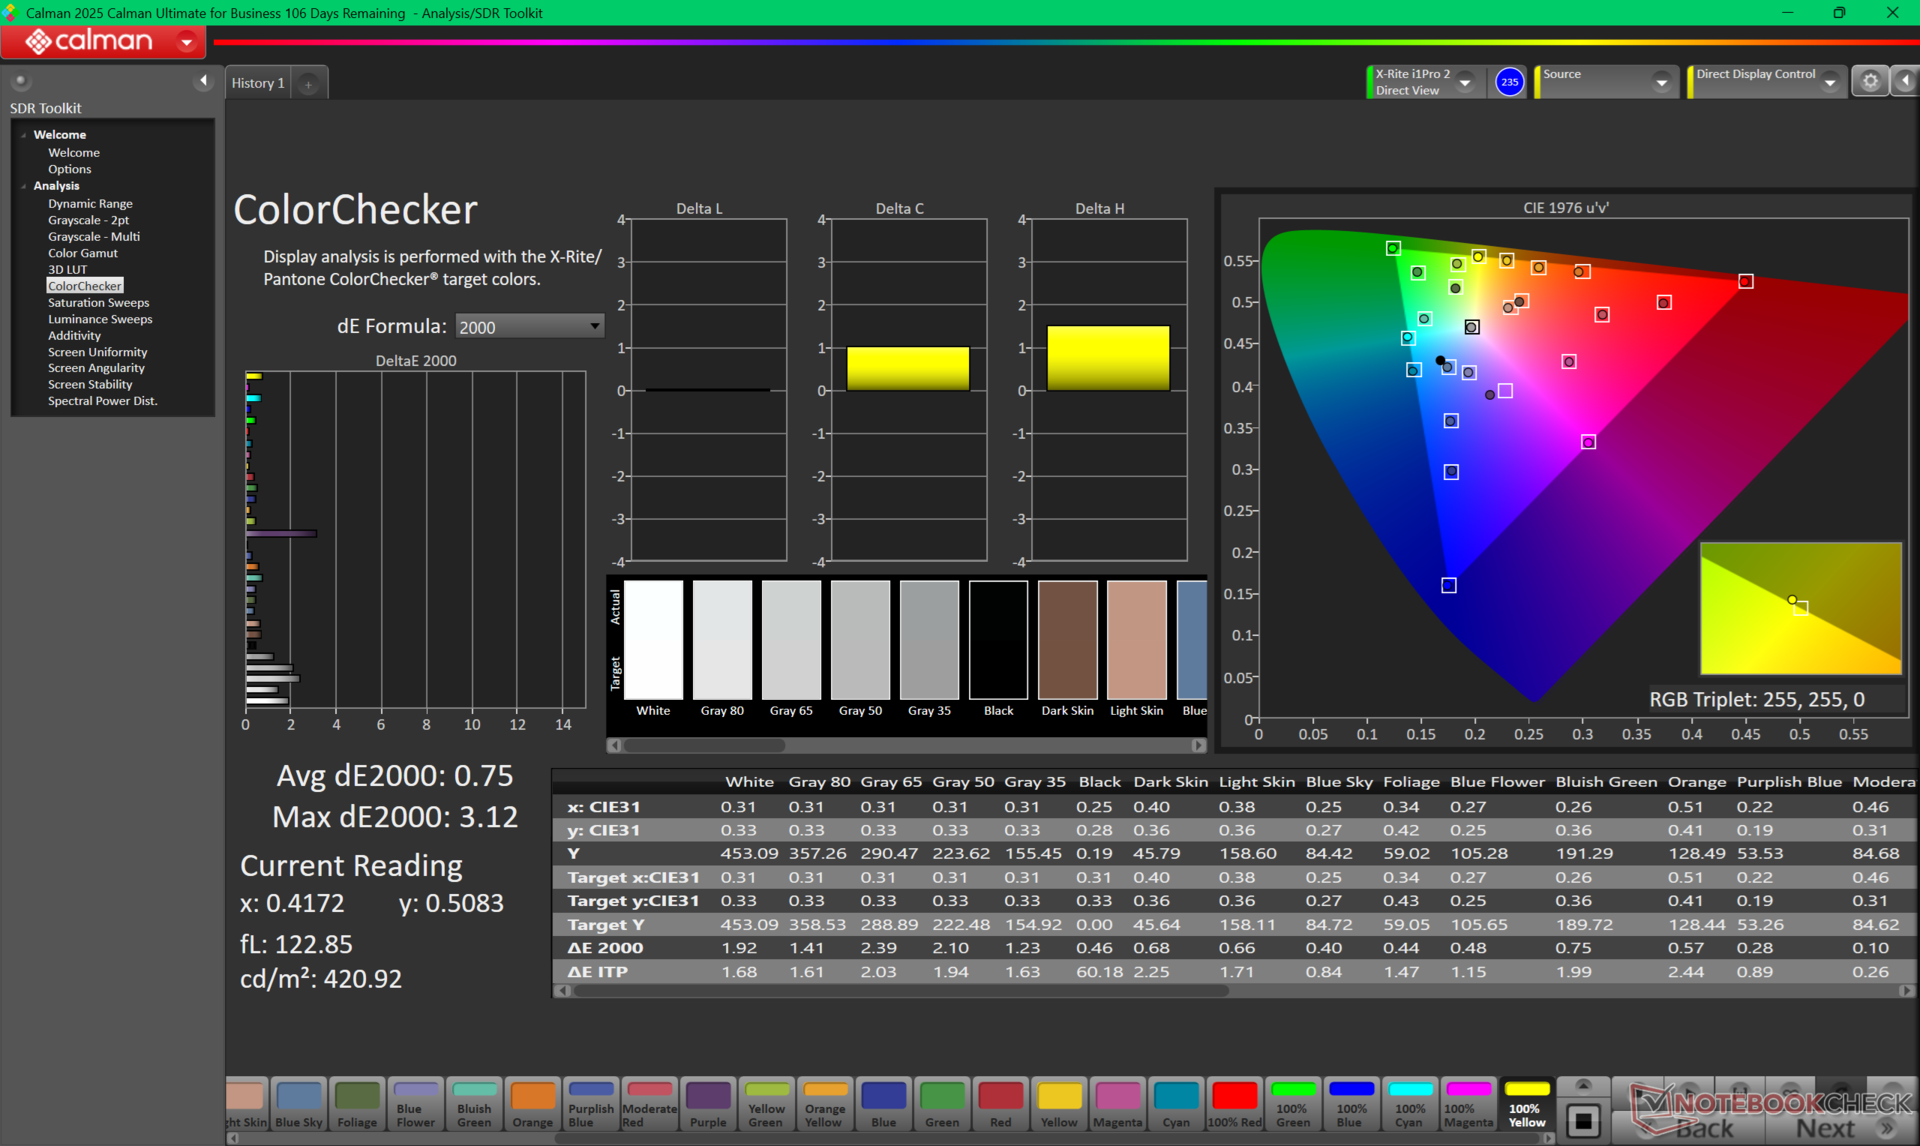
ΔE ColorChecker Calman: 4.08 | ∀{0.5-29.43 Ø4.71}
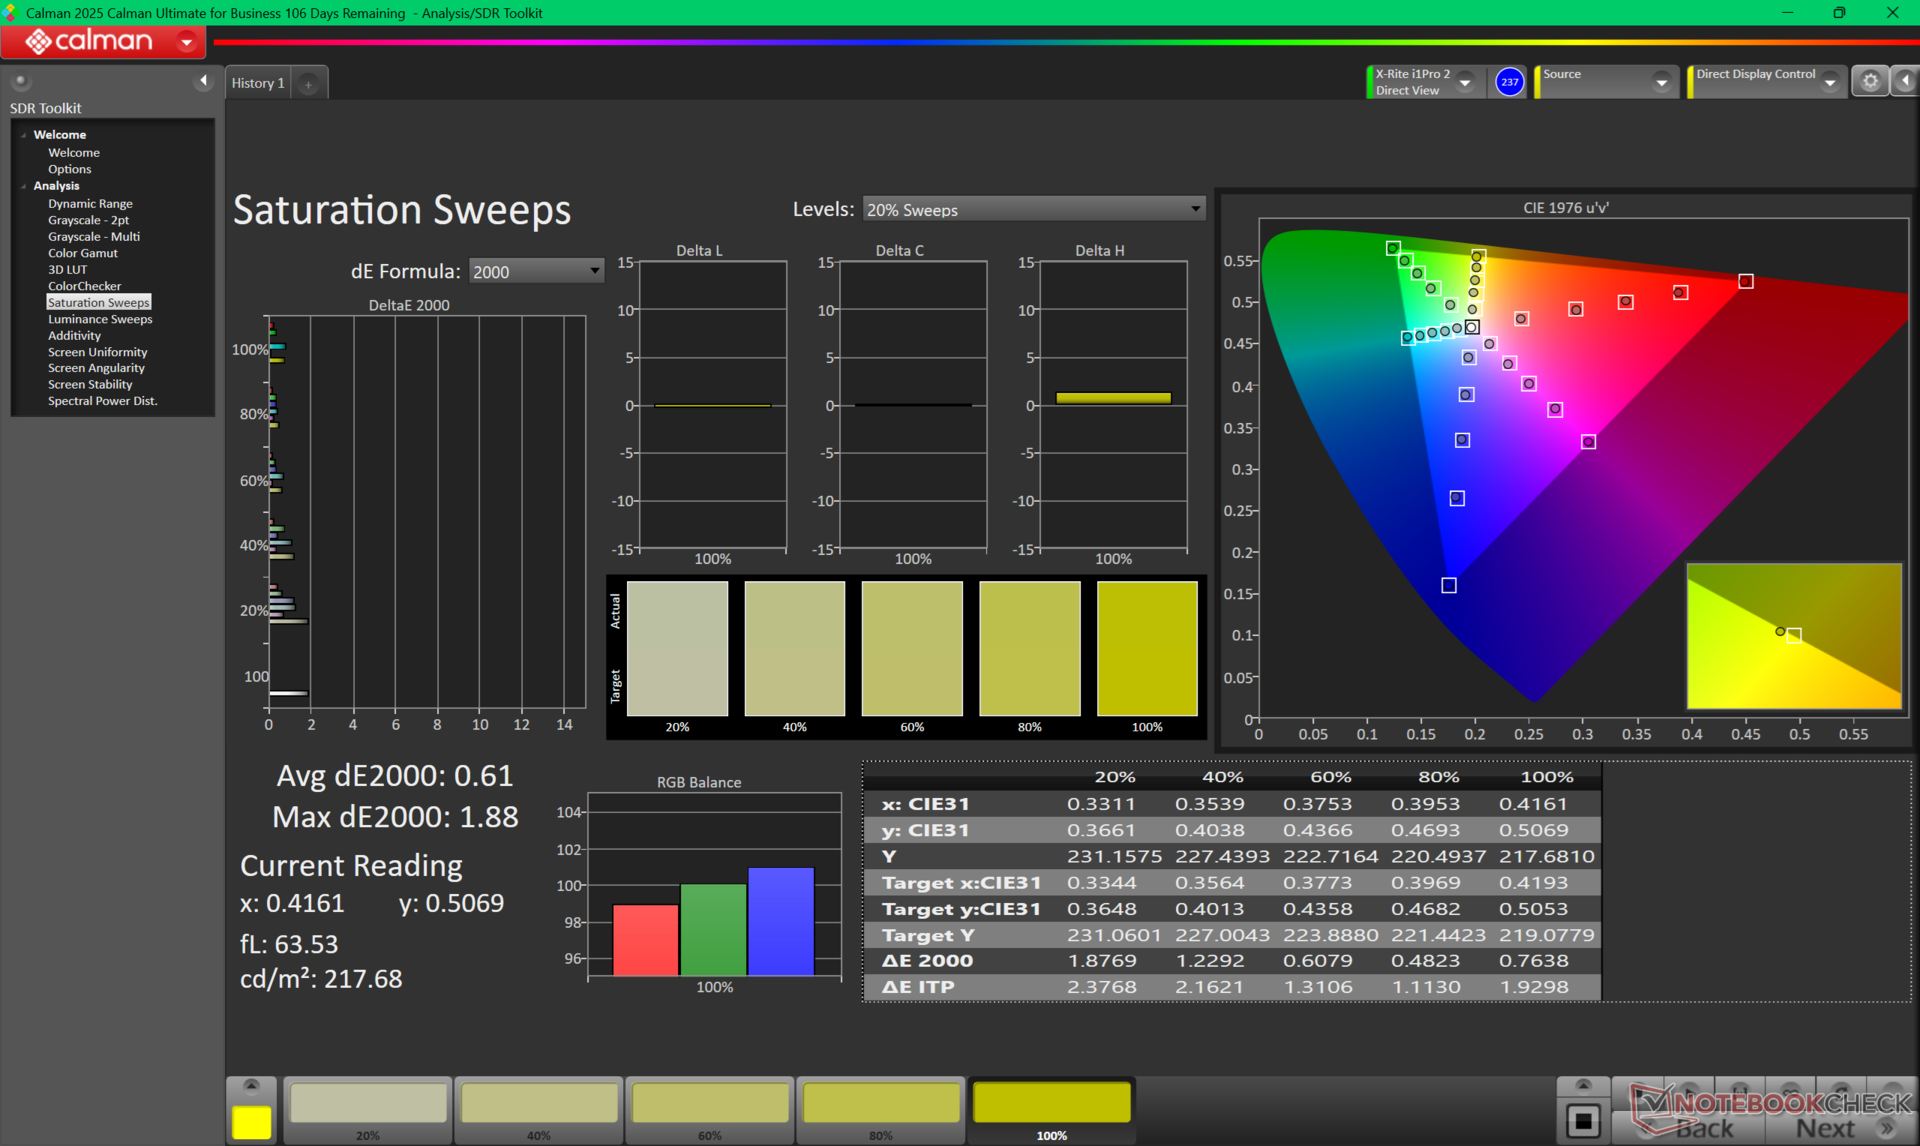
calibrated: 0.75
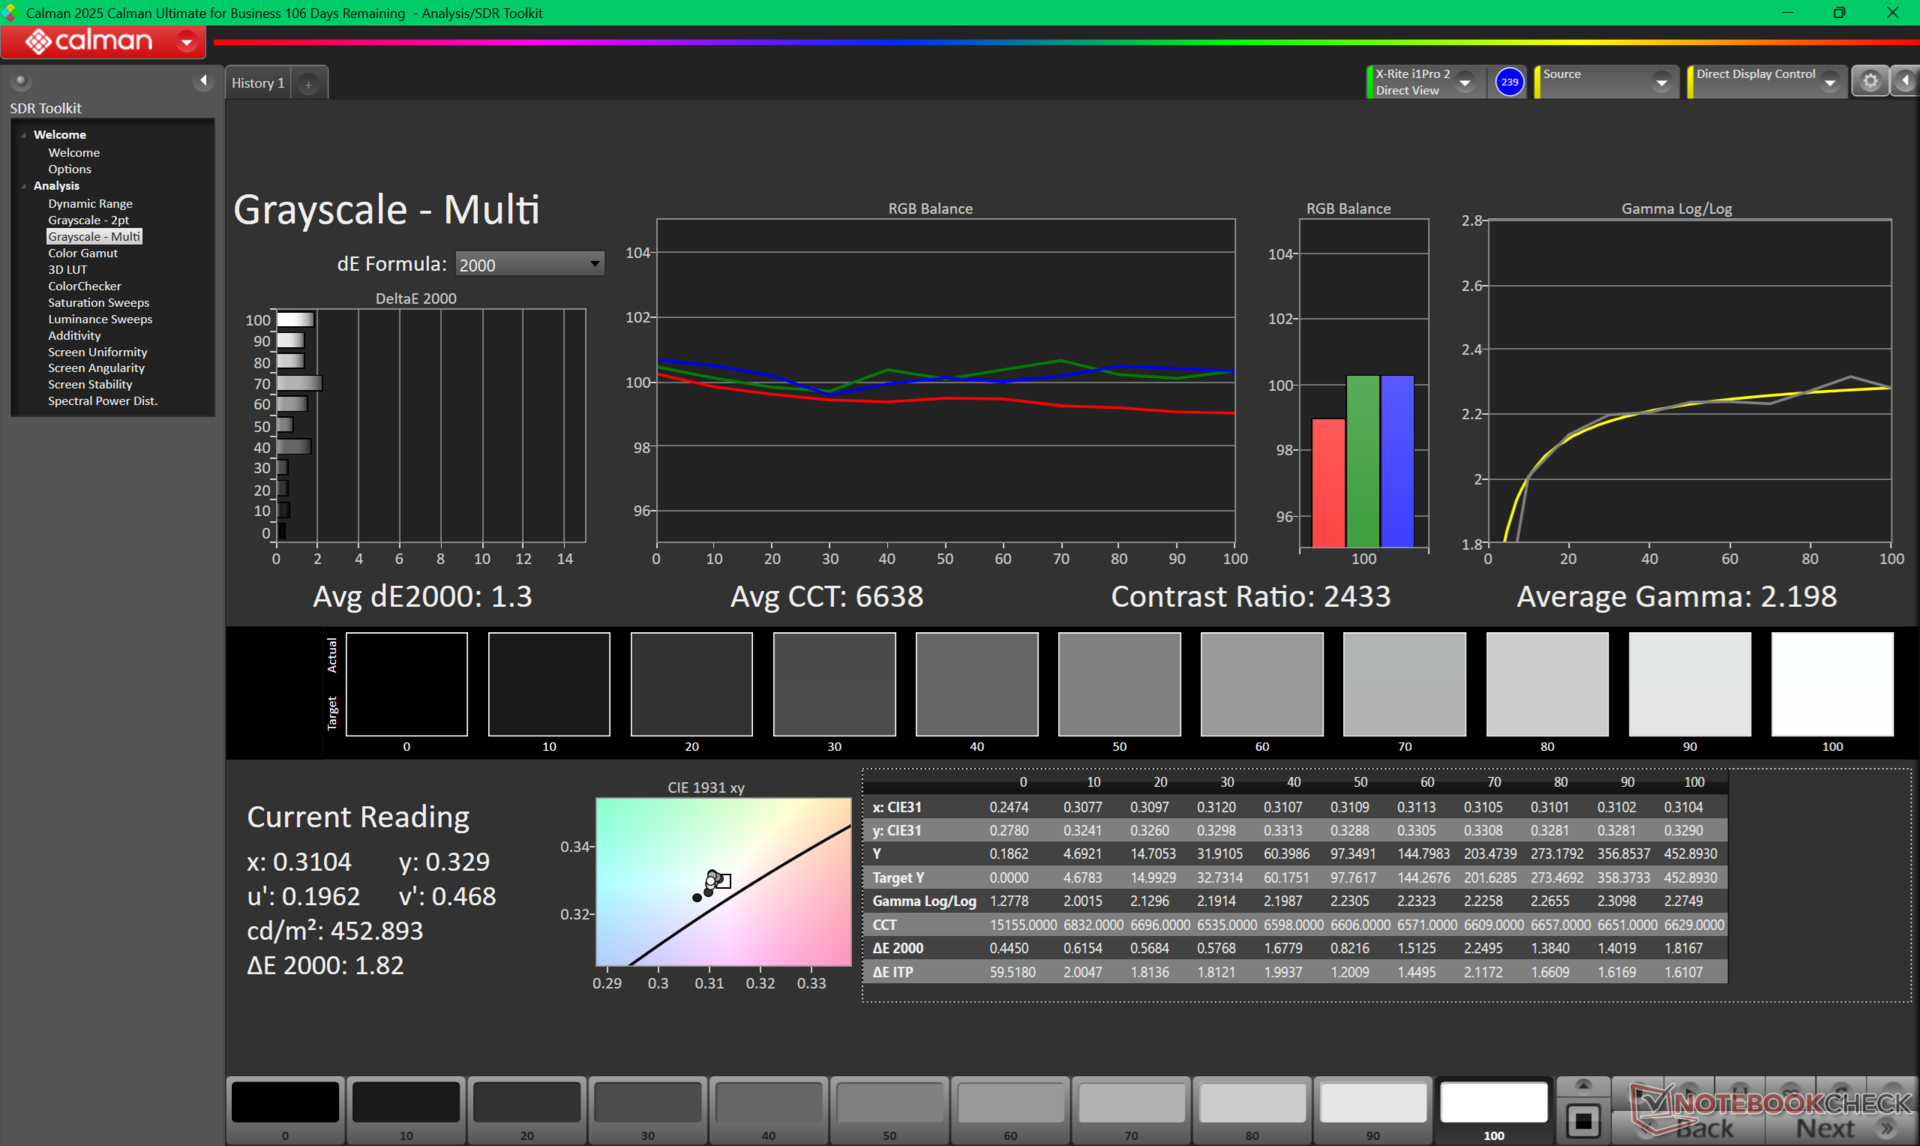
ΔE Greyscale Calman: 3.5 | ∀{0.09-98 Ø4.96}
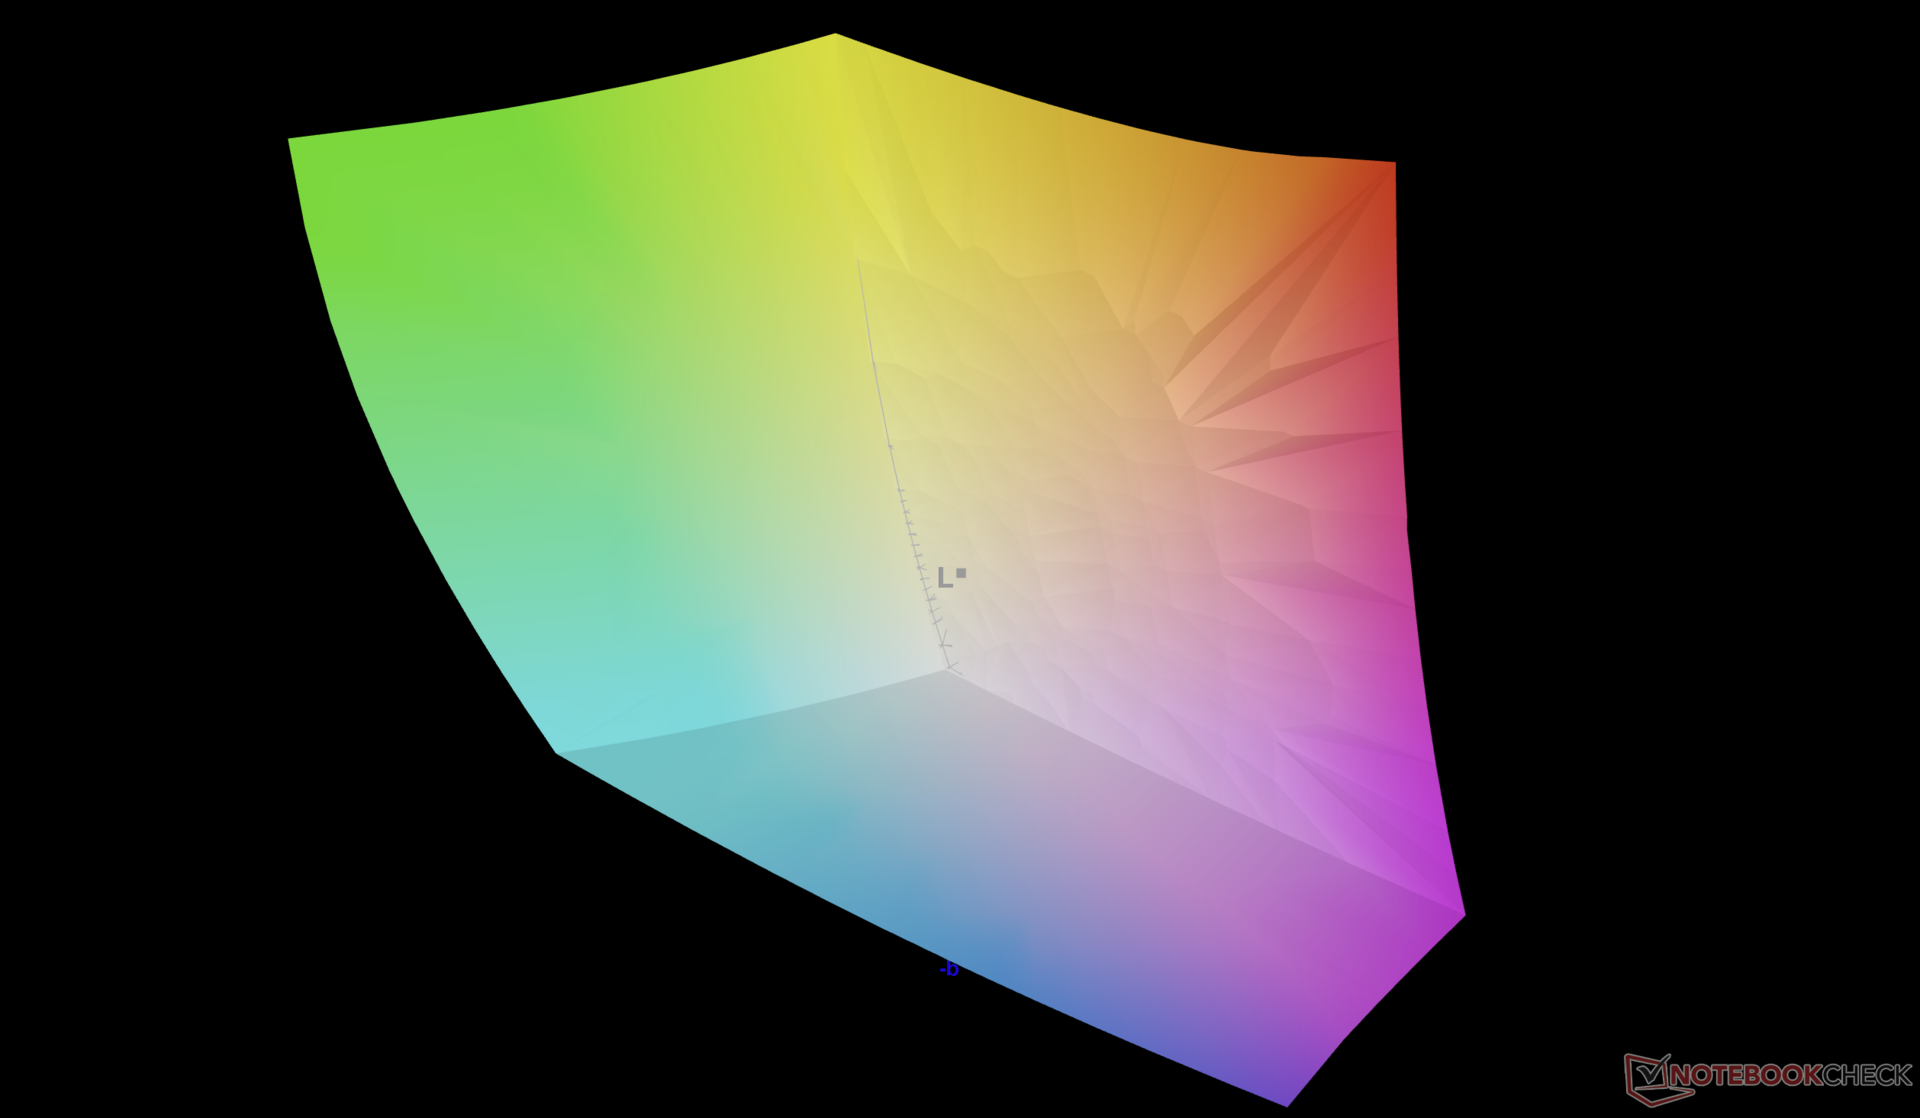
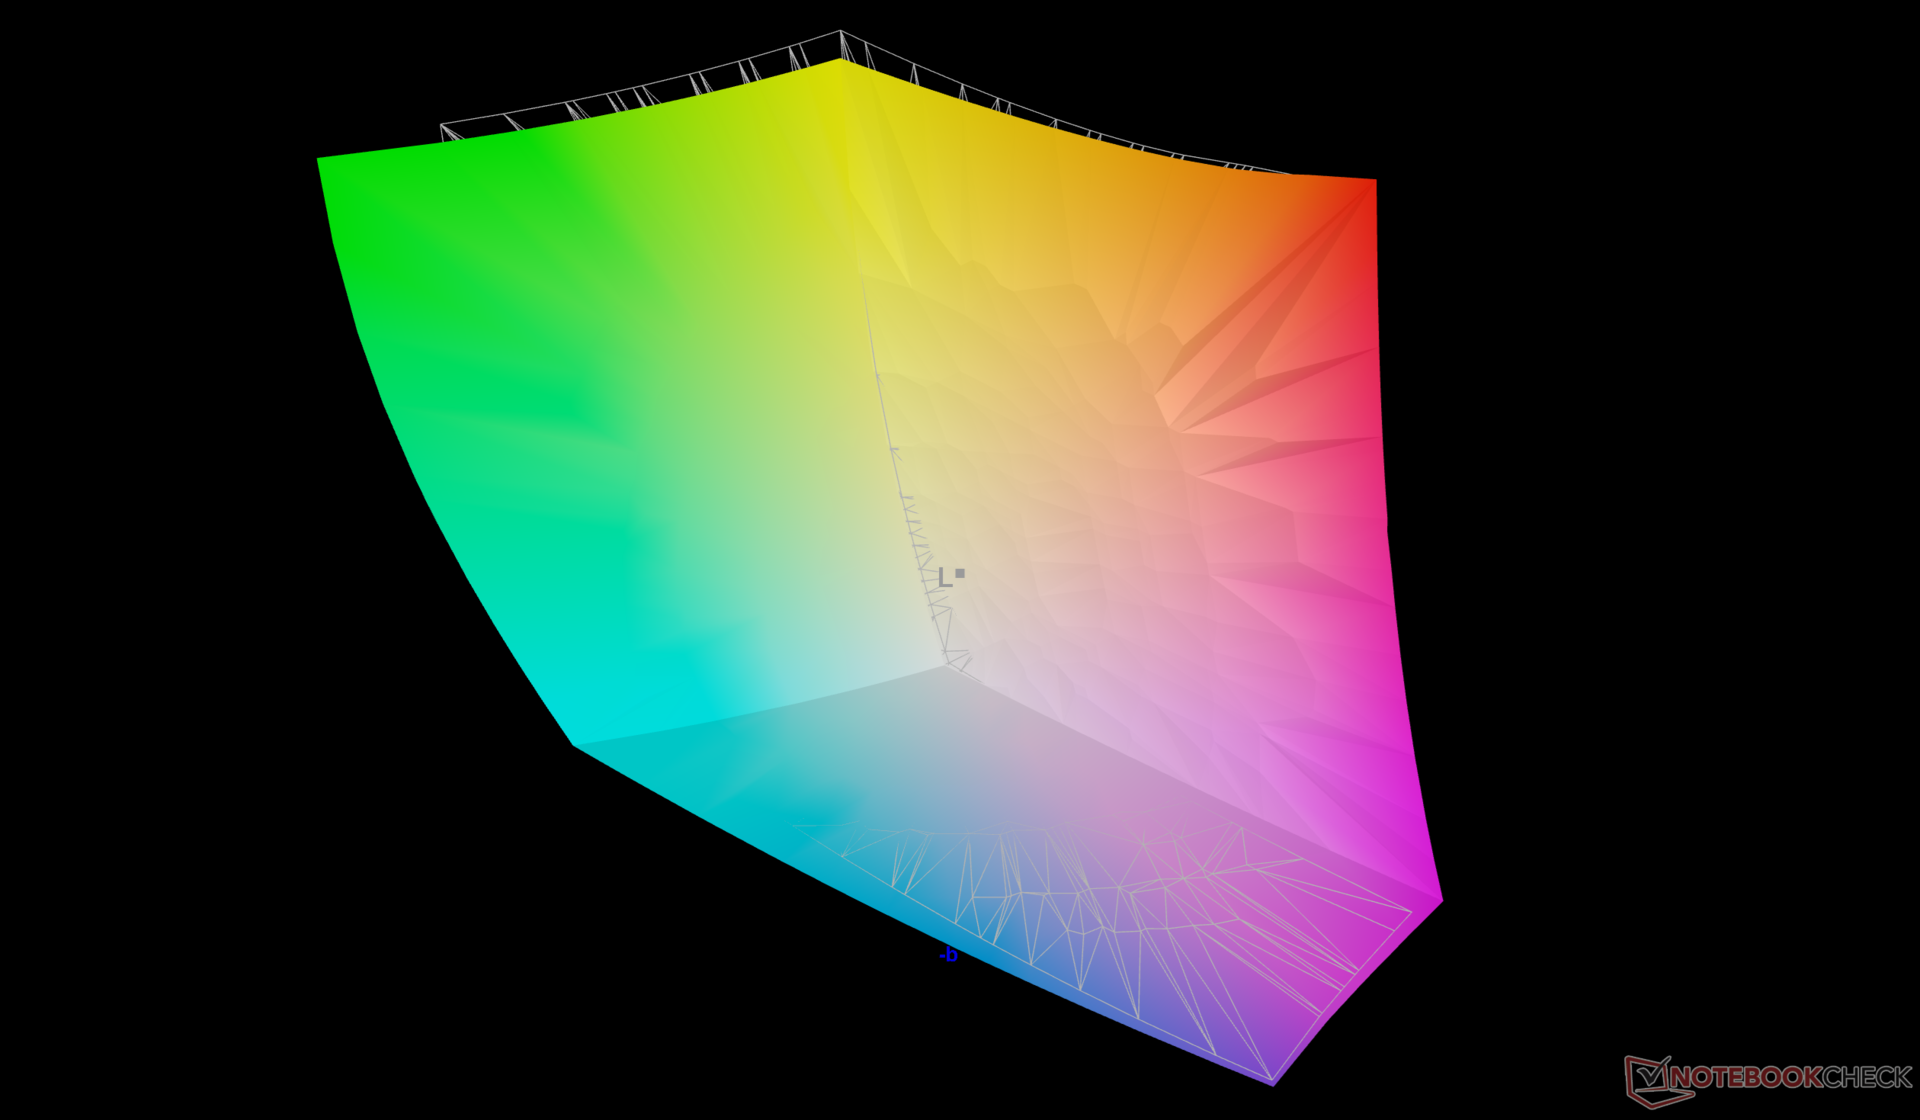
99.9% AdobeRGB 1998 (Argyll 3D)
100% sRGB (Argyll 3D)
97.2% Display P3 (Argyll 3D)
Gamma: 2.15
CCT: 6715 K
| HP ZBook X G1i 16 LG Philips LGD07B3, IPS, 2560x1600, 16", 120 Hz | HP ZBook Power 16 G11 A AUOA0A9, IPS, 2560x1600, 16", 120 Hz | HP ZBook Studio 16 G11 AUO87A8, IPS, 3840x2400, 16", 120 Hz | Lenovo ThinkPad P16 Gen 2 NE160QDM-NY1, IPS, 2560x1600, 16", 165 Hz | Dell Pro Max 16 Plus Samsung 160HC01, OLED, 3840x2400, 16", 120 Hz | Dell Precision 5690 Samsung 160YV03, OLED, 3840x2400, 16", 60 Hz | |
|---|---|---|---|---|---|---|
| Display | -20% | -4% | -21% | -4% | 0% | |
| Display P3 Coverage (%) | 97.2 | 69.1 -29% | 97.7 1% | 68.4 -30% | 97.3 0% | 99.8 3% |
| sRGB Coverage (%) | 100 | 97.7 -2% | 99.9 0% | 96.9 -3% | 100 0% | 100 0% |
| AdobeRGB 1998 Coverage (%) | 99.9 | 71 -29% | 85.7 -14% | 70.6 -29% | 88.8 -11% | 96.6 -3% |
| Response Times | 69% | 64% | 66% | 79% | 95% | |
| Response Time Grey 50% / Grey 80% * (ms) | 45.5 ? | 13.6 ? 70% | 14.2 ? 69% | 14.1 ? 69% | 0.63 ? 99% | 1.7 ? 96% |
| Response Time Black / White * (ms) | 26.1 ? | 8.4 ? 68% | 10.6 ? 59% | 9.9 ? 62% | 0.89 ? 97% | 1.7 ? 93% |
| PWM Frequency (Hz) | 26536 ? | 479.9 ? | 60 ? | |||
| PWM Amplitude * (%) | 47 | 28 40% | ||||
| Screen | -4% | 11% | 31% | 29% | 1% | |
| Brightness middle (cd/m²) | 461.8 | 470.7 2% | 404.3 -12% | 531.5 15% | 530.9 15% | 348.1 -25% |
| Brightness (cd/m²) | 427 | 431 1% | 405 -5% | 499 17% | 540 26% | 351 -18% |
| Brightness Distribution (%) | 88 | 88 0% | 92 5% | 89 1% | 95 8% | 97 10% |
| Black Level * (cd/m²) | 0.46 | 0.57 -24% | 0.28 39% | 0.38 17% | ||
| Contrast (:1) | 1004 | 826 -18% | 1444 44% | 1399 39% | ||
| Colorchecker dE 2000 * | 4.08 | 2.16 47% | 2.63 36% | 1.82 55% | 2.42 41% | 4.18 -2% |
| Colorchecker dE 2000 max. * | 8.1 | 4.39 46% | 4.48 45% | 4.1 49% | 5.76 29% | 6.68 18% |
| Colorchecker dE 2000 calibrated * | 0.75 | 1.37 -83% | 1.46 -95% | 0.63 16% | 0.7 7% | 0.97 -29% |
| Greyscale dE 2000 * | 3.5 | 3.7 -6% | 2.1 40% | 1.2 66% | 0.8 77% | 1.7 51% |
| Gamma | 2.15 102% | 2.38 92% | 2.3 96% | 2.15 102% | 2.23 99% | 2.2 100% |
| CCT | 6715 97% | 6765 96% | 6810 95% | 6484 100% | 6488 100% | 6198 105% |
| Moyenne finale (programmes/paramètres) | 15% /
3% | 24% /
15% | 25% /
25% | 35% /
33% | 32% /
16% |
* ... Moindre est la valeur, meilleures sont les performances
Temps de réponse de l'écran
| ↔ Temps de réponse noir à blanc | ||
|---|---|---|
| 26.1 ms ... hausse ↗ et chute ↘ combinées | ↗ 11.8 ms hausse | 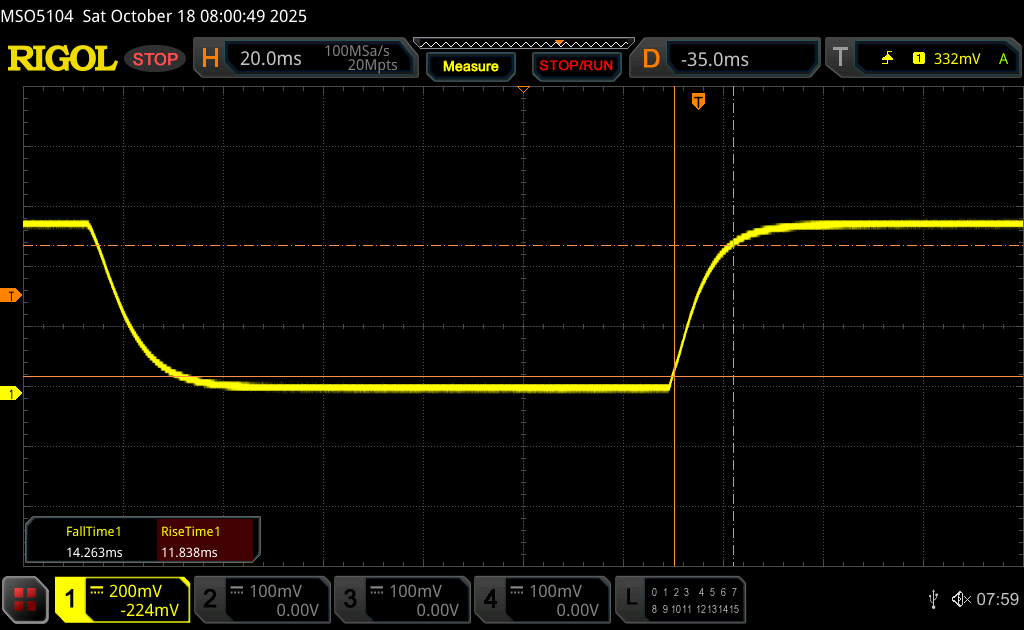 |
| ↘ 14.3 ms chute | ||
| L'écran souffre de latences relativement élevées, insuffisant pour le jeu. En comparaison, tous les appareils testés affichent entre 0.1 (minimum) et 240 (maximum) ms. » 65 % des appareils testés affichent de meilleures performances. Cela signifie que les latences relevées sont moins bonnes que la moyenne (19.8 ms) de tous les appareils testés. | ||
| ↔ Temps de réponse gris 50% à gris 80% | ||
| 45.5 ms ... hausse ↗ et chute ↘ combinées | ↗ 21.1 ms hausse | 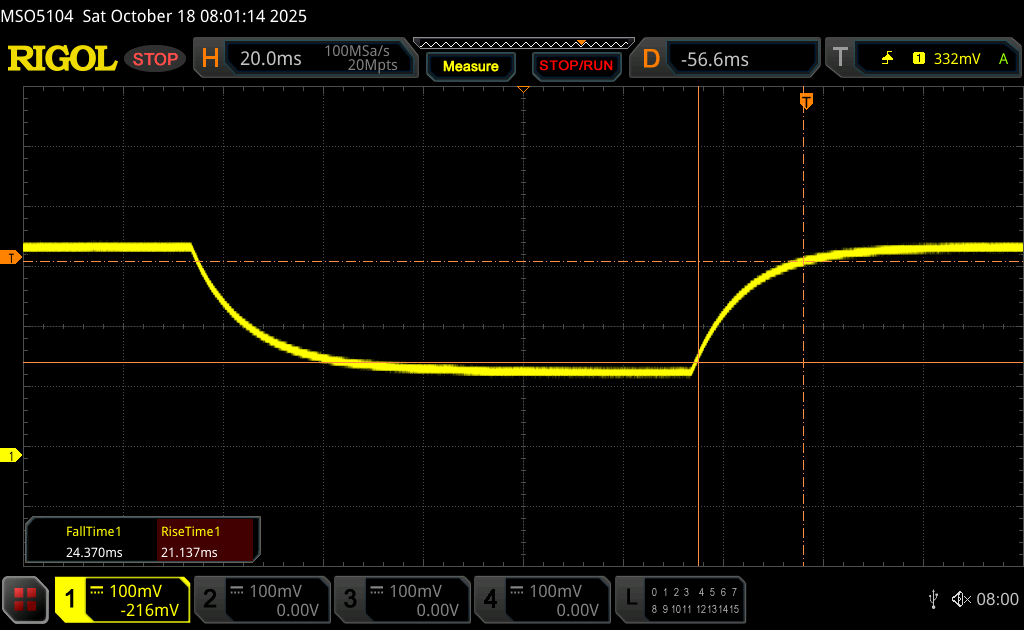 |
| ↘ 24.4 ms chute | ||
| L'écran souffre de latences très élevées, à éviter pour le jeu. En comparaison, tous les appareils testés affichent entre 0.165 (minimum) et 636 (maximum) ms. » 78 % des appareils testés affichent de meilleures performances. Cela signifie que les latences relevées sont moins bonnes que la moyenne (31 ms) de tous les appareils testés. | ||
Scintillement / MLI (Modulation de largeur d'impulsion)
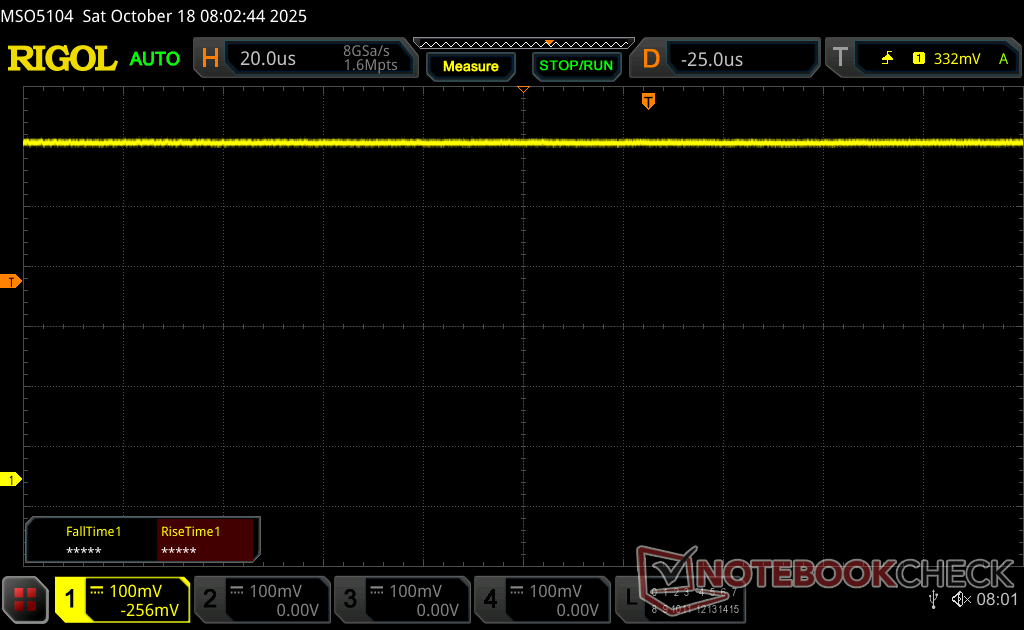
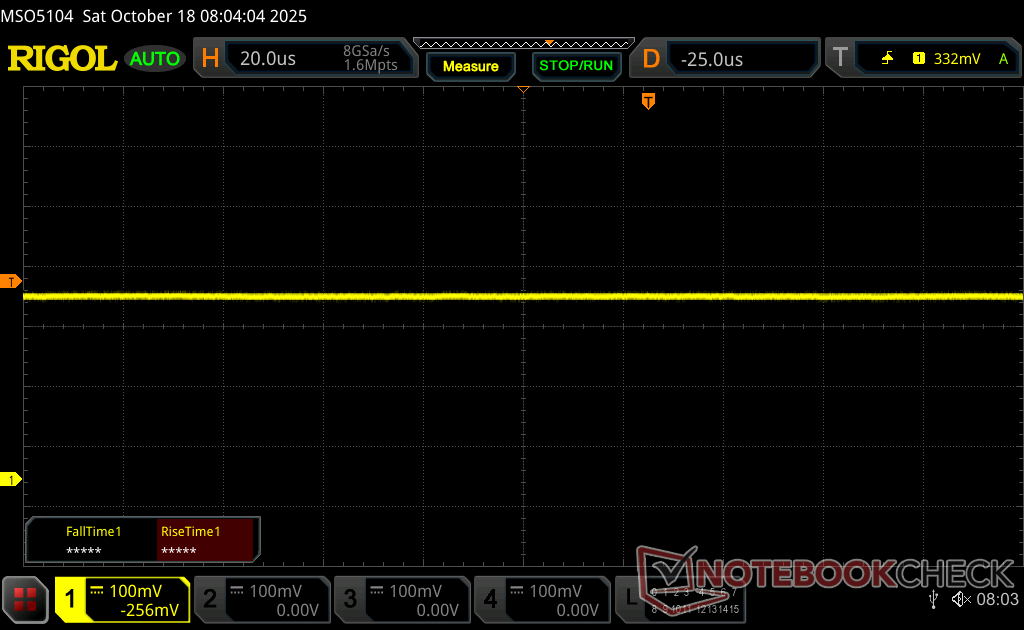
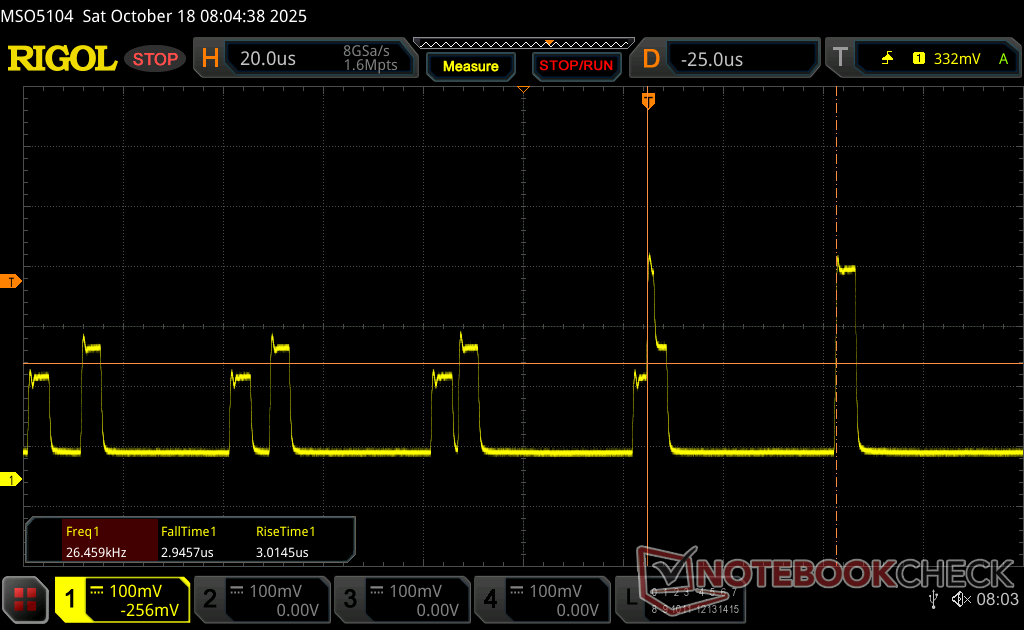
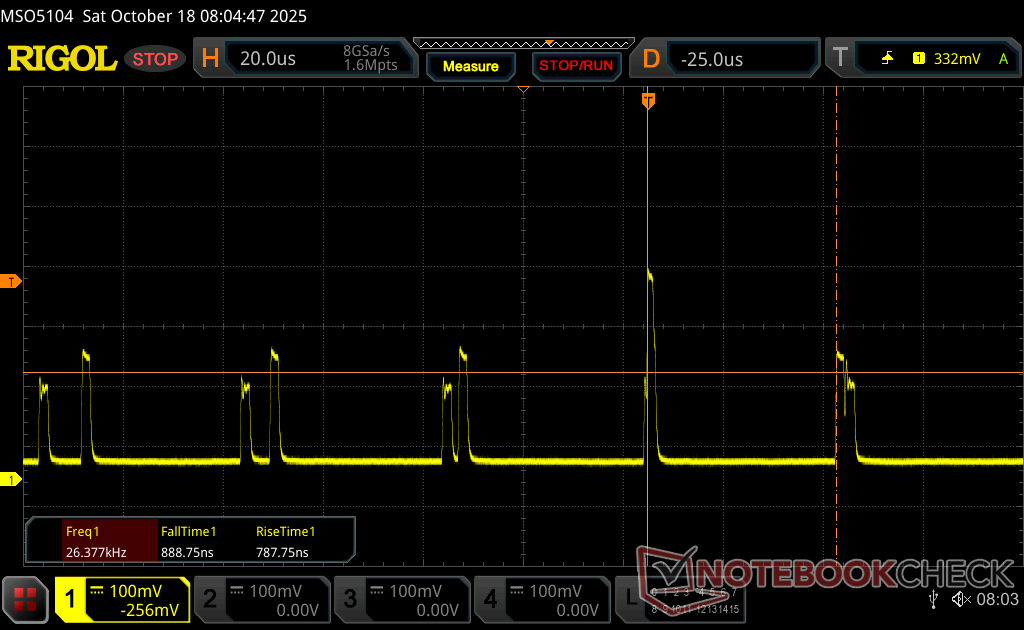
| Scintillement / MLI (Modulation de largeur d'impulsion) décelé | 26536 Hz Amplitude: 47 % | ≤ 74 Niveau de luminosité | 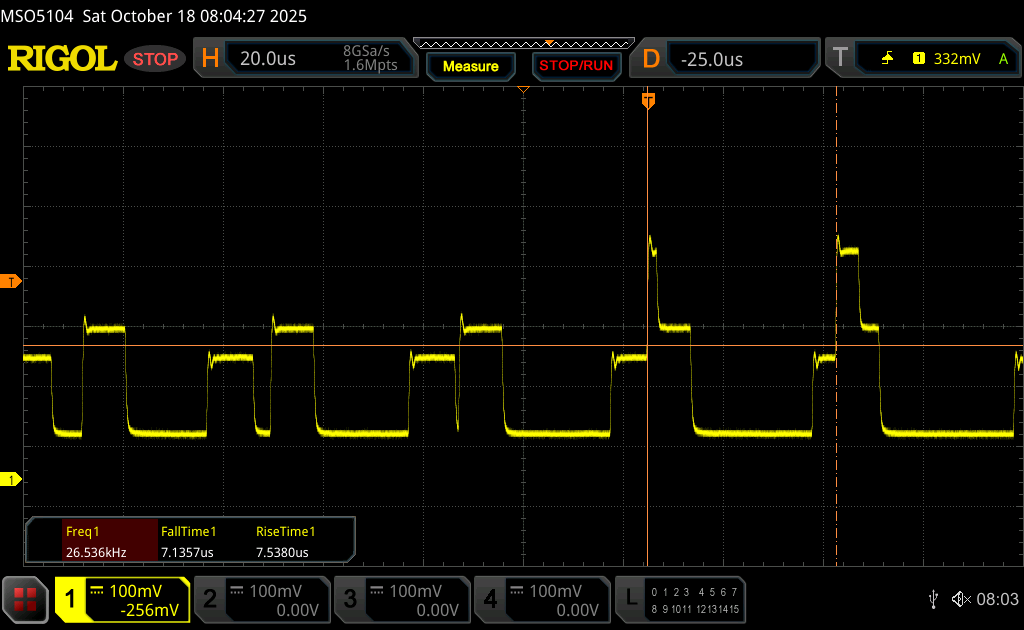 |
Le rétroéclairage de l'écran scintille à la fréquence de 26536 Hz (certainement du fait de l'utilisation d'une MDI - Modulation de largeur d'impulsion) à un niveau de luminosité inférieur ou égal à 74 % . Aucun scintillement ne devrait être perceptible au-dessus de cette valeur. La fréquence de rafraîchissement de 26536 Hz est élevée, la grande majorité des utilisateurs ne devrait pas percevoir de scintillements et être sujette à une fatigue oculaire accrue. En comparaison, 52 % des appareils testés n'emploient pas MDI pour assombrir leur écran. Nous avons relevé une moyenne à 7747 (minimum : 5 - maximum : 343500) Hz dans le cas où une MDI était active. | |||


Performance
Conditions d'essai
Nous avons réglé Windows sur le mode Performance avant d'effectuer les tests ci-dessous.
Processeur
Le Core Ultra 7 265H n'offre qu'une amélioration relativement mineure des performances par rapport au Core Ultra 7 155H de l'année dernière, d'environ 15 %. Les utilisateurs qui passent d'un modèle beaucoup plus ancien comme le HP ZBook Studio 16 G9 bénéficieront d'une augmentation plus significative d'environ 30 %.
Les performances chutent d'environ 10 % lors de notre test de stress en boucle CineBench R15 xT en raison des limitations de Turbo Boost, comme indiqué dans la section Test de stress ci-dessous.
Cinebench R15 Multi Loop
Cinebench R23: Multi Core | Single Core
Cinebench R20: CPU (Multi Core) | CPU (Single Core)
Cinebench R15: CPU Multi 64Bit | CPU Single 64Bit
Blender: v2.79 BMW27 CPU
7-Zip 18.03: 7z b 4 | 7z b 4 -mmt1
Geekbench 6.7: Multi-Core | Single-Core
Geekbench 5.5: Multi-Core | Single-Core
HWBOT x265 Benchmark v2.2: 4k Preset
LibreOffice : 20 Documents To PDF
R Benchmark 2.5: Overall mean
* ... Moindre est la valeur, meilleures sont les performances
Performance du système
Une petite poignée de benchmarks se plantaient ou ne se terminaient pas sur notre unité de test, notamment PCMark 10, SpecViewPerf 13 Maya et AIDA64 Engineer.
CrossMark: Overall | Productivity | Creativity | Responsiveness
WebXPRT 3: Overall
WebXPRT 4: Overall
Mozilla Kraken 1.1: Total
| Performance rating | |
| Dell Pro Max 16 Plus | |
| Lenovo ThinkPad P16 Gen 2 | |
| HP ZBook X G1i 16 | |
| Moyenne Intel Core Ultra 7 265H, NVIDIA RTX PRO 2000 Blackwell Generation Laptop | |
| Dell Precision 5690 | |
| HP ZBook Studio 16 G11 | |
| HP ZBook Power 16 G11 A | |
| CrossMark / Overall | |
| Dell Pro Max 16 Plus | |
| Lenovo ThinkPad P16 Gen 2 | |
| HP ZBook X G1i 16 | |
| Moyenne Intel Core Ultra 7 265H, NVIDIA RTX PRO 2000 Blackwell Generation Laptop (n=1) | |
| Dell Precision 5690 | |
| HP ZBook Power 16 G11 A | |
| HP ZBook Studio 16 G11 | |
| CrossMark / Productivity | |
| Dell Pro Max 16 Plus | |
| HP ZBook X G1i 16 | |
| Moyenne Intel Core Ultra 7 265H, NVIDIA RTX PRO 2000 Blackwell Generation Laptop (n=1) | |
| Lenovo ThinkPad P16 Gen 2 | |
| Dell Precision 5690 | |
| HP ZBook Power 16 G11 A | |
| HP ZBook Studio 16 G11 | |
| CrossMark / Creativity | |
| Dell Pro Max 16 Plus | |
| Lenovo ThinkPad P16 Gen 2 | |
| HP ZBook X G1i 16 | |
| Moyenne Intel Core Ultra 7 265H, NVIDIA RTX PRO 2000 Blackwell Generation Laptop (n=1) | |
| HP ZBook Power 16 G11 A | |
| Dell Precision 5690 | |
| HP ZBook Studio 16 G11 | |
| CrossMark / Responsiveness | |
| Dell Pro Max 16 Plus | |
| Lenovo ThinkPad P16 Gen 2 | |
| Dell Precision 5690 | |
| HP ZBook X G1i 16 | |
| Moyenne Intel Core Ultra 7 265H, NVIDIA RTX PRO 2000 Blackwell Generation Laptop (n=1) | |
| HP ZBook Studio 16 G11 | |
| HP ZBook Power 16 G11 A | |
| WebXPRT 3 / Overall | |
| Lenovo ThinkPad P16 Gen 2 | |
| Dell Pro Max 16 Plus | |
| HP ZBook X G1i 16 | |
| Moyenne Intel Core Ultra 7 265H, NVIDIA RTX PRO 2000 Blackwell Generation Laptop (n=1) | |
| HP ZBook Power 16 G11 A | |
| HP ZBook Studio 16 G11 | |
| Dell Precision 5690 | |
| WebXPRT 4 / Overall | |
| Dell Pro Max 16 Plus | |
| Lenovo ThinkPad P16 Gen 2 | |
| HP ZBook X G1i 16 | |
| Moyenne Intel Core Ultra 7 265H, NVIDIA RTX PRO 2000 Blackwell Generation Laptop (n=1) | |
| Dell Precision 5690 | |
| HP ZBook Studio 16 G11 | |
| HP ZBook Power 16 G11 A | |
| Mozilla Kraken 1.1 / Total | |
| HP ZBook Power 16 G11 A | |
| HP ZBook Studio 16 G11 | |
| Dell Precision 5690 | |
| HP ZBook X G1i 16 | |
| Moyenne Intel Core Ultra 7 265H, NVIDIA RTX PRO 2000 Blackwell Generation Laptop (n=1) | |
| Lenovo ThinkPad P16 Gen 2 | |
| Dell Pro Max 16 Plus | |
* ... Moindre est la valeur, meilleures sont les performances
» No benchmarks for this notebook found!
Latence DPC
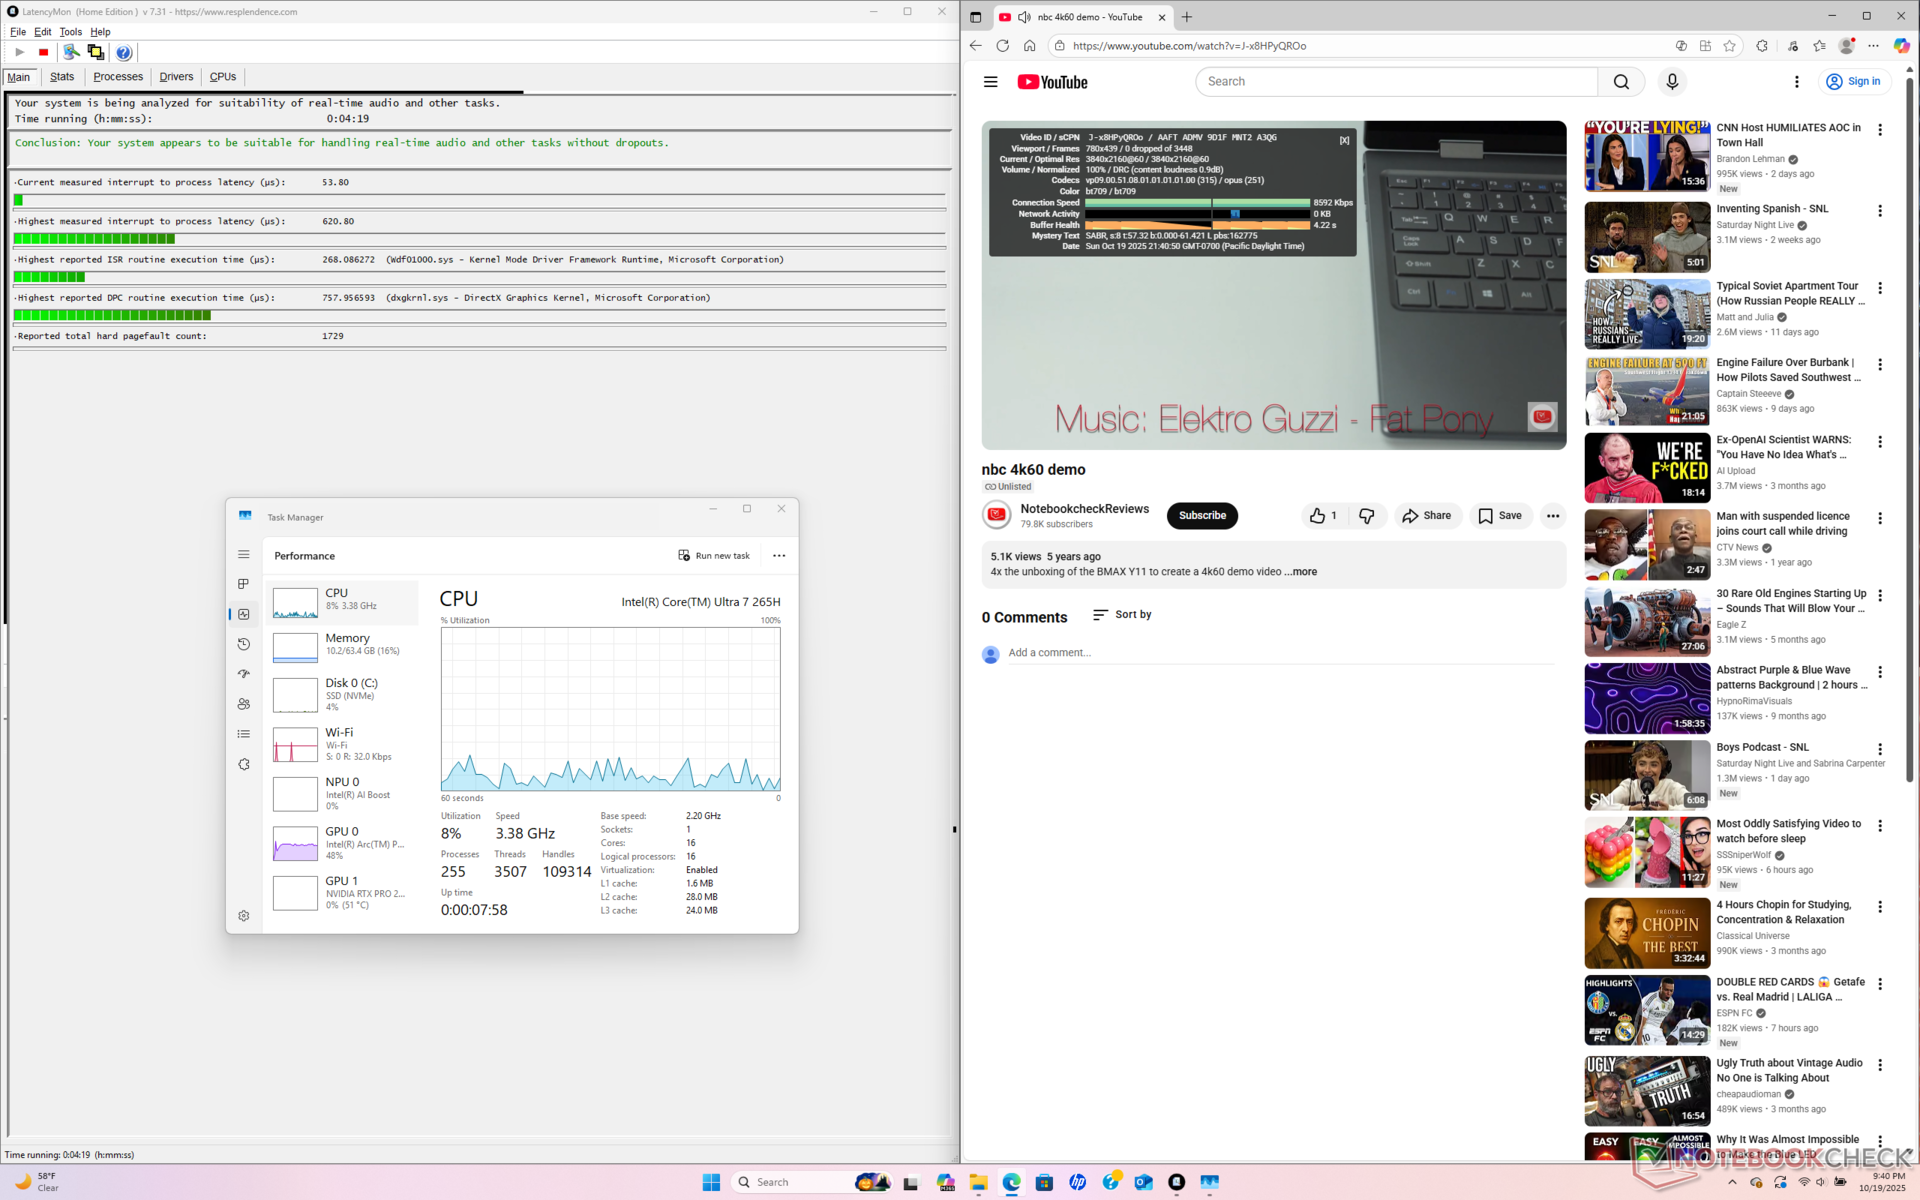
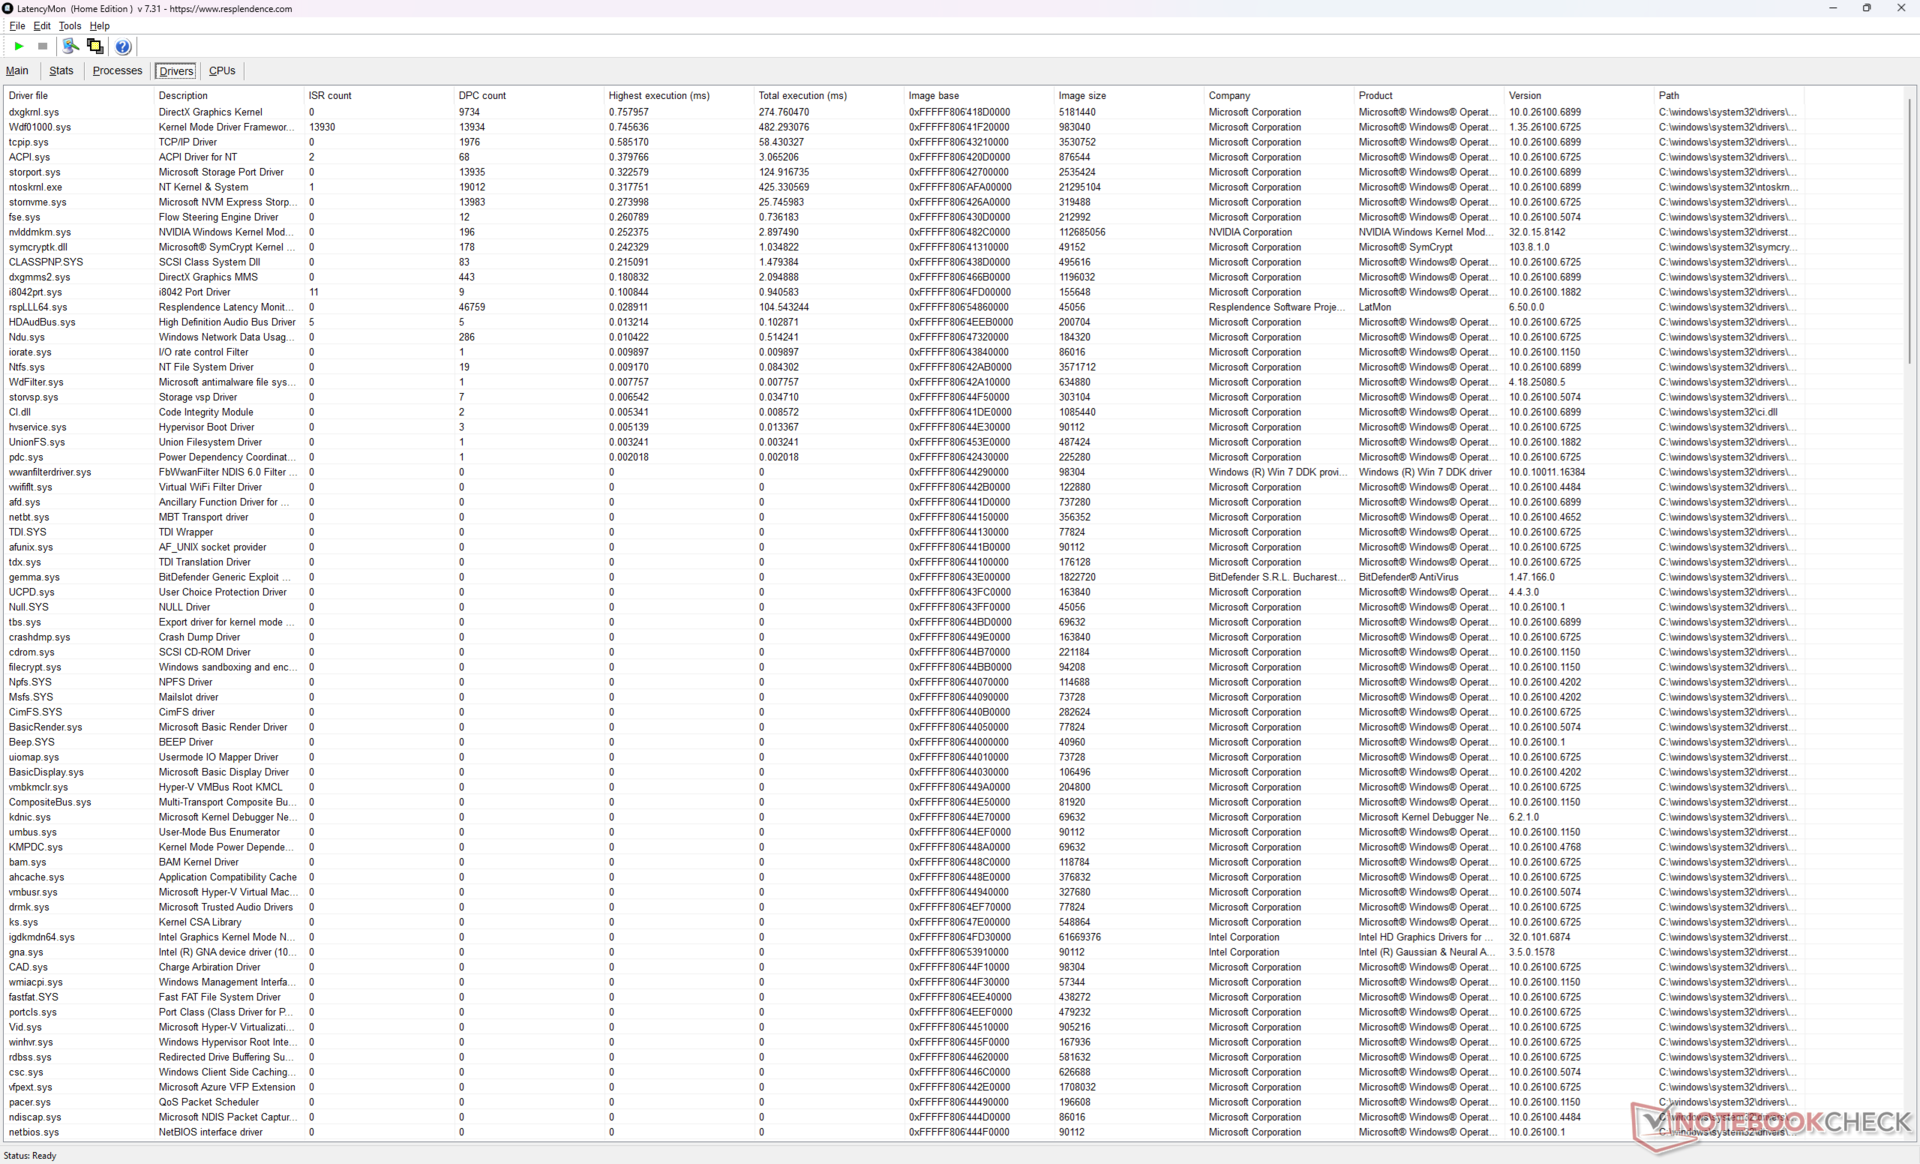
| DPC Latencies / LatencyMon - interrupt to process latency (max), Web, Youtube, Prime95 | |
| HP ZBook Power 16 G11 A | |
| Dell Pro Max 16 Plus | |
| HP ZBook Studio 16 G11 | |
| Lenovo ThinkPad P16 Gen 2 | |
| HP ZBook X G1i 16 | |
| Dell Precision 5690 | |
* ... Moindre est la valeur, meilleures sont les performances
Dispositifs de stockage
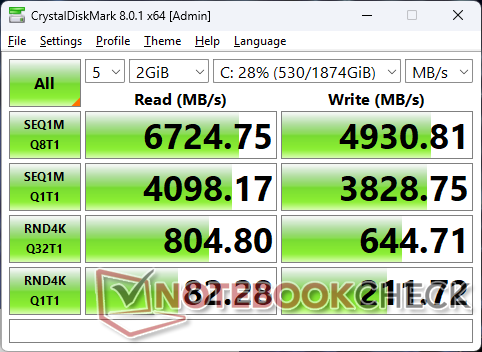
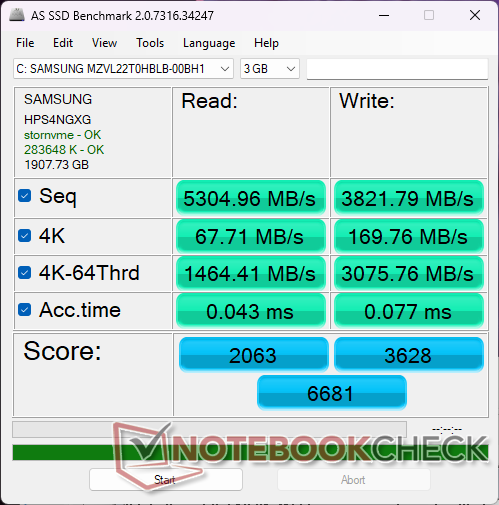

| Drive Performance rating - Percent | |
| HP ZBook X G1i 16 | |
| Dell Pro Max 16 Plus | |
| Dell Precision 5690 | |
| Lenovo ThinkPad P16 Gen 2 | |
| HP ZBook Power 16 G11 A | |
| HP ZBook Studio 16 G11 | |
* ... Moindre est la valeur, meilleures sont les performances
Throttoir de disque : Boucle de lecture DiskSpd, profondeur de la file d'attente 8
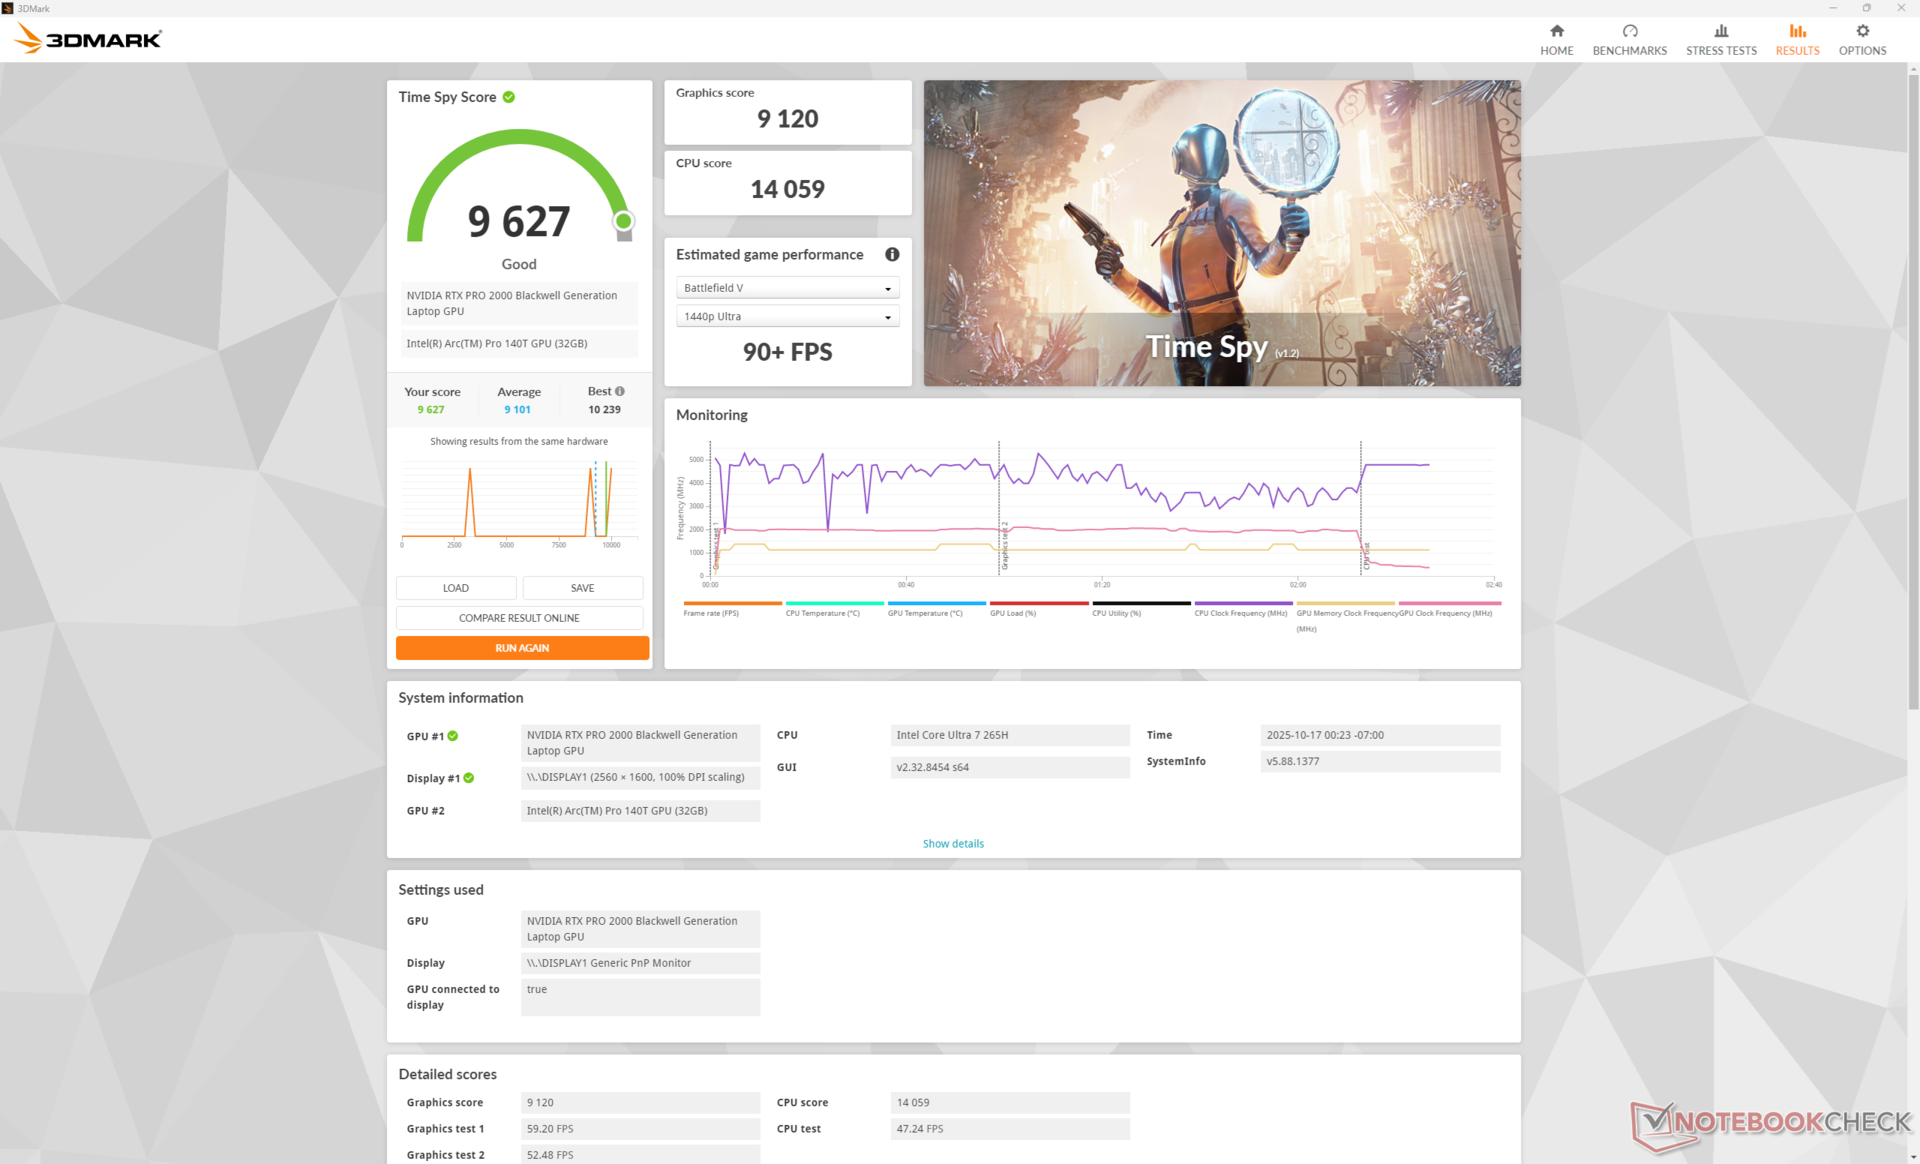
Performance du GPU
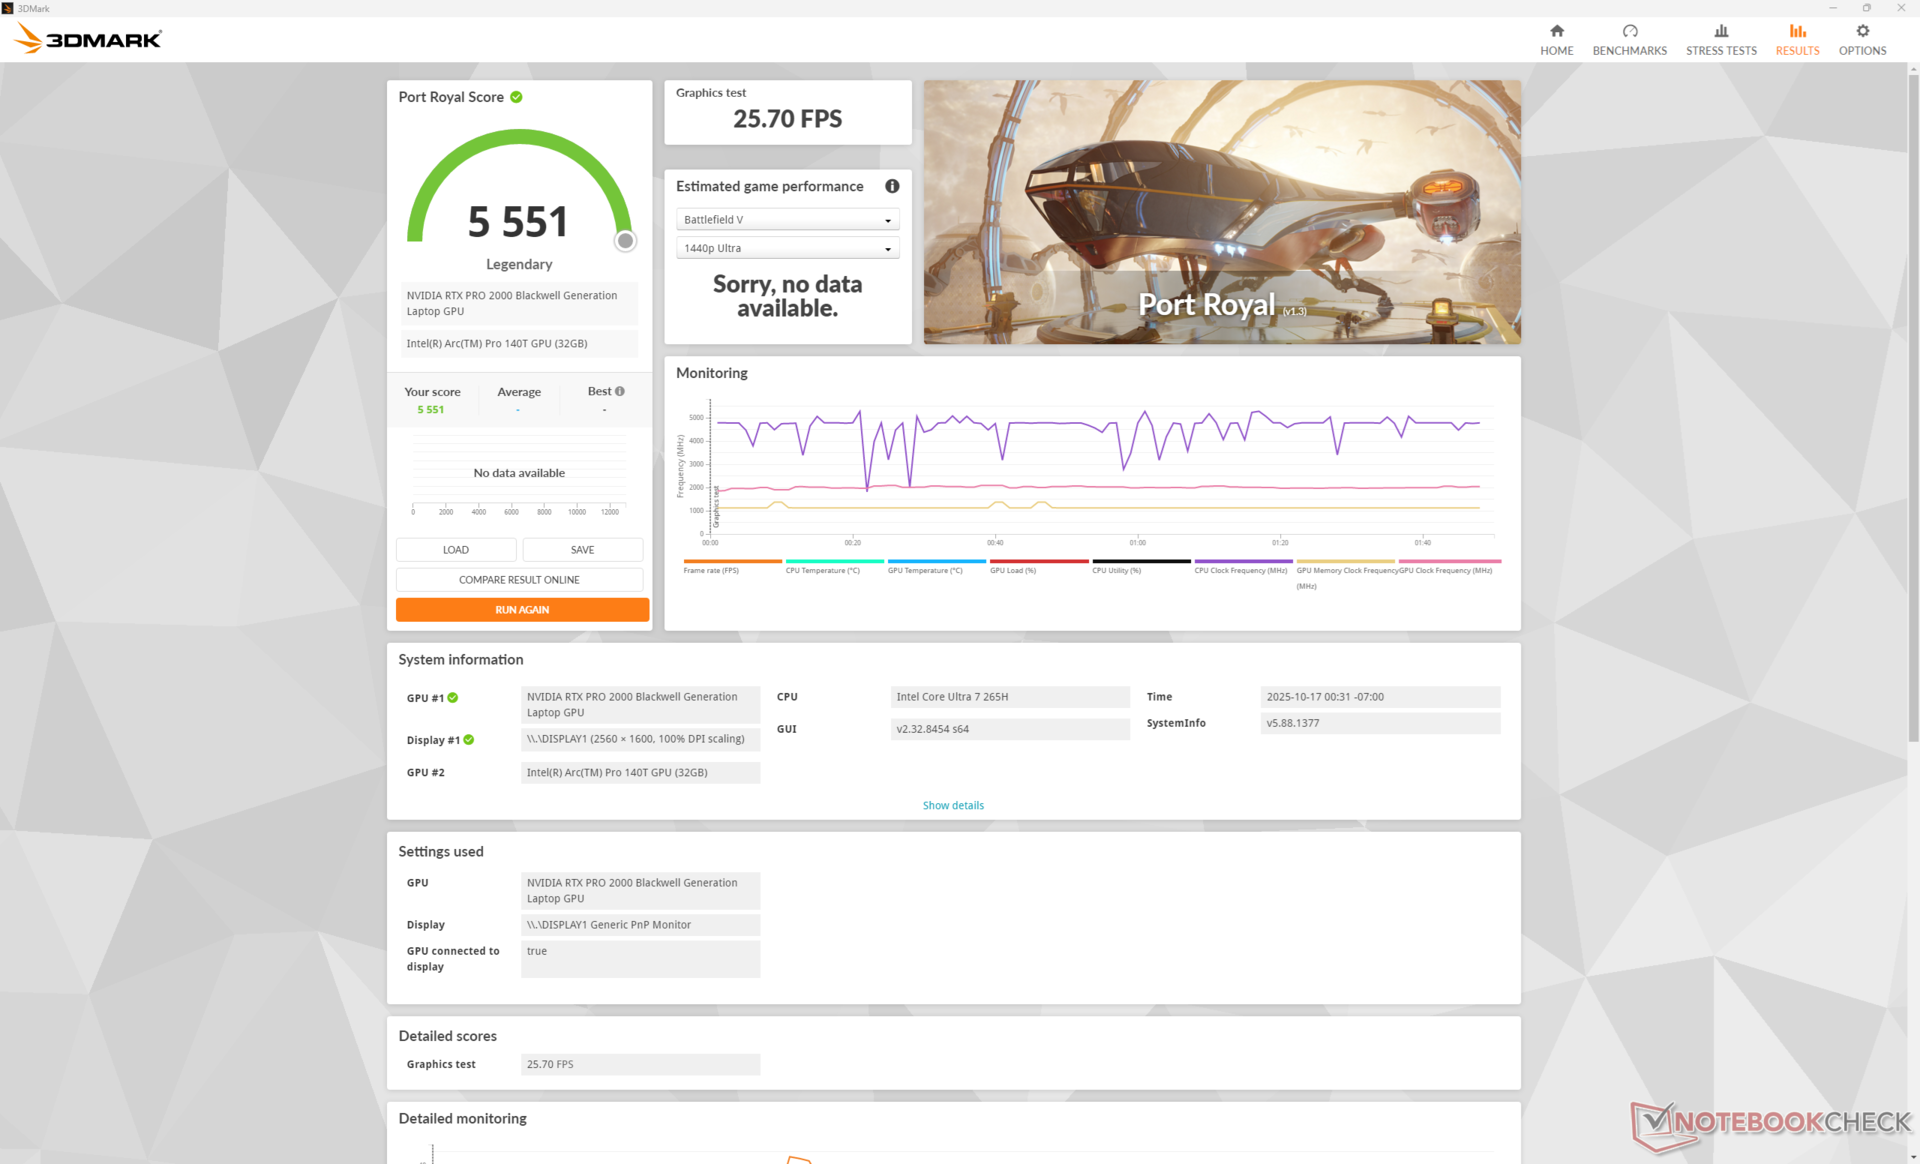
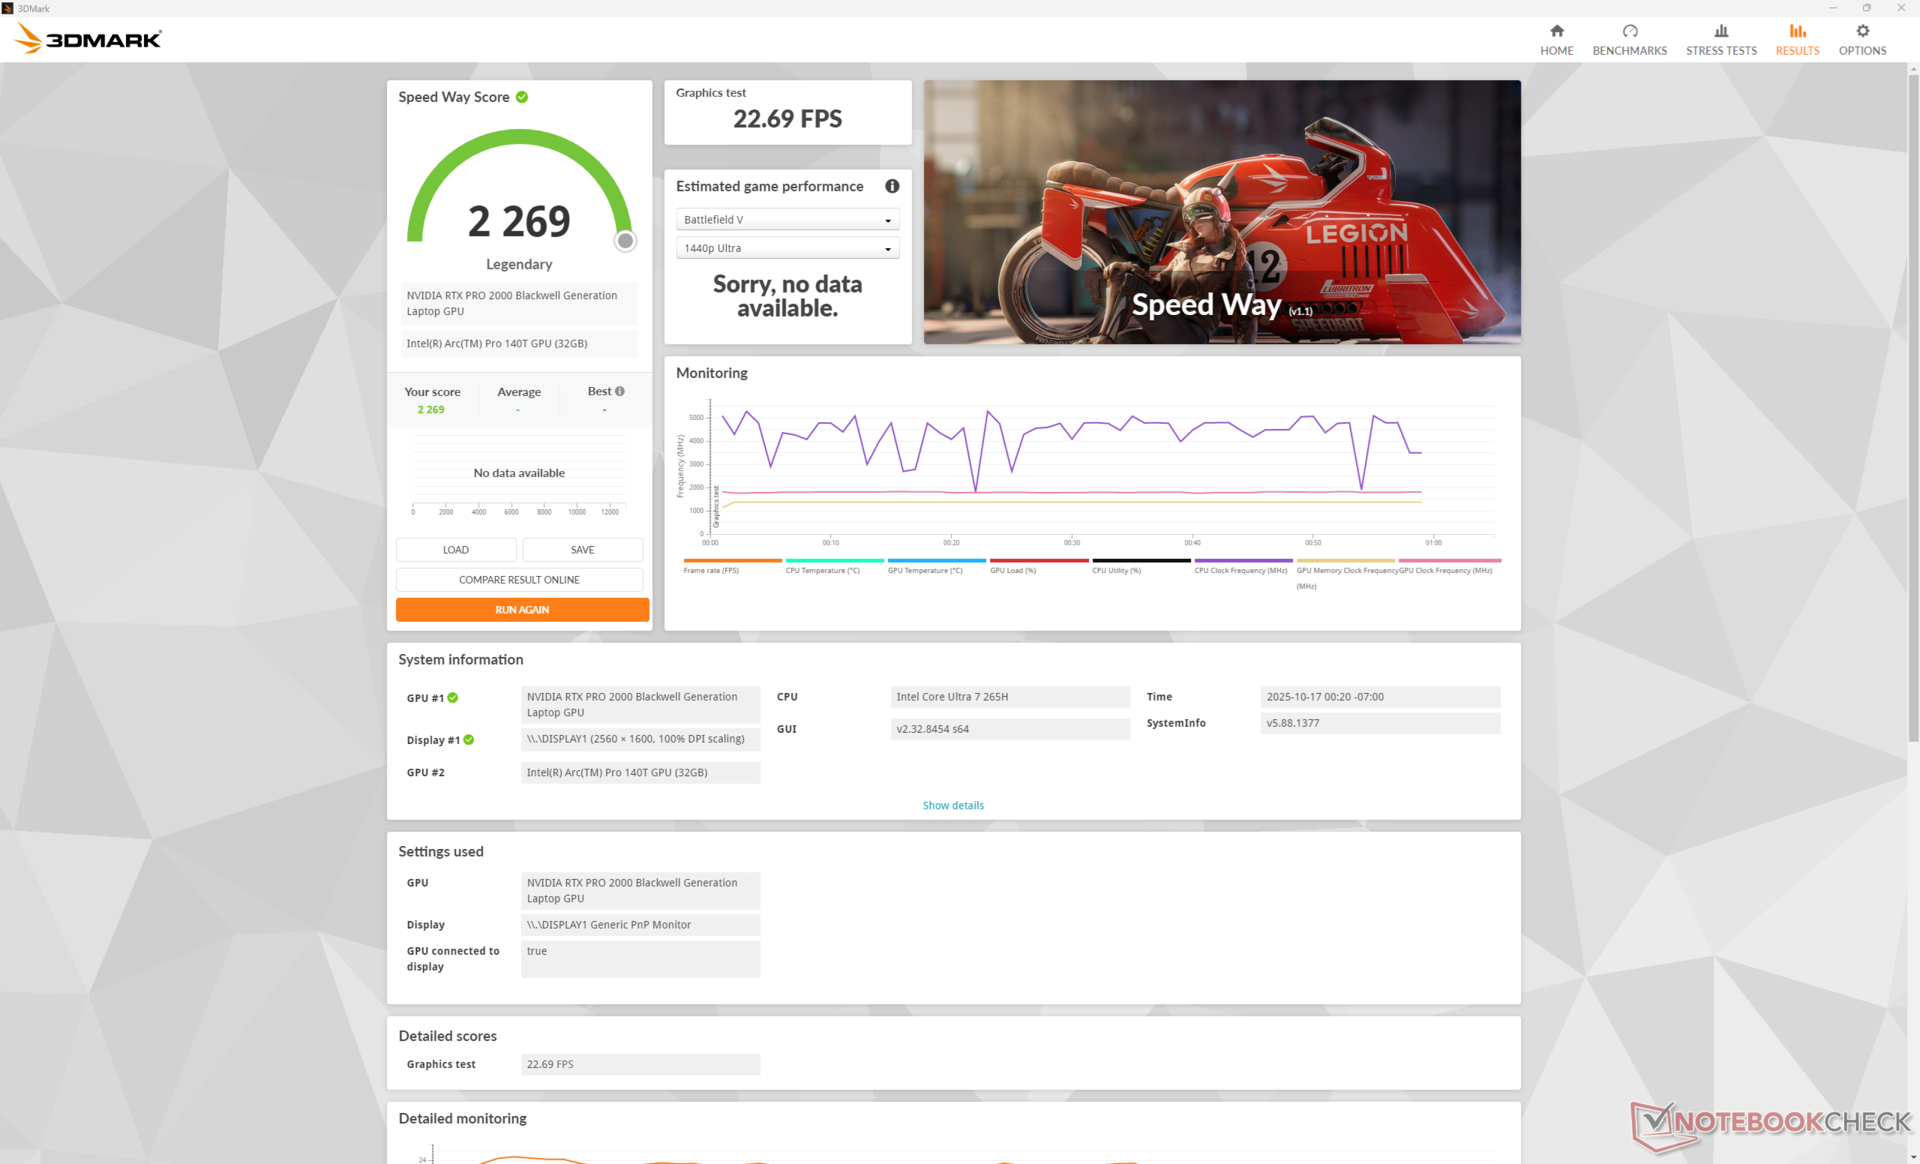
Le RTX Pro 2000 Blackwell dans la HP vise 60 W pour un niveau de performance brute à peine supérieur à celui de la dernière génération RTX 2000 Ada Lovelace. Pendant ce temps, les utilisateurs qui passent de la RTX A2000 sur des modèles tels que le 2022 ZBook Studio 16 G9 verront des augmentations plus significatives de 1,5x à 1,9x.
L'exécution en mode équilibré au lieu du mode performance aurait un impact sur les performances graphiques d'environ 5 %, comme le montre notre tableau de résultats Fire Strike ci-dessous. Si vous jouez, la RTX Pro 2000 a des performances similaires à celles de la carte graphique mobile mobile GeForce RTX 4060 ou 5060.
| Profil de puissance | Score graphique | Score physique | Score combiné |
| Mode Performance | 25085 | 33858 | 11010 |
| Mode équilibré | 23771 (-5%) | 35309 (+4%) | 9366 (-15%) |
| Alimentation par batterie | 18195 (-27%) | 25739 (-24%) | 5646 (-49%) |
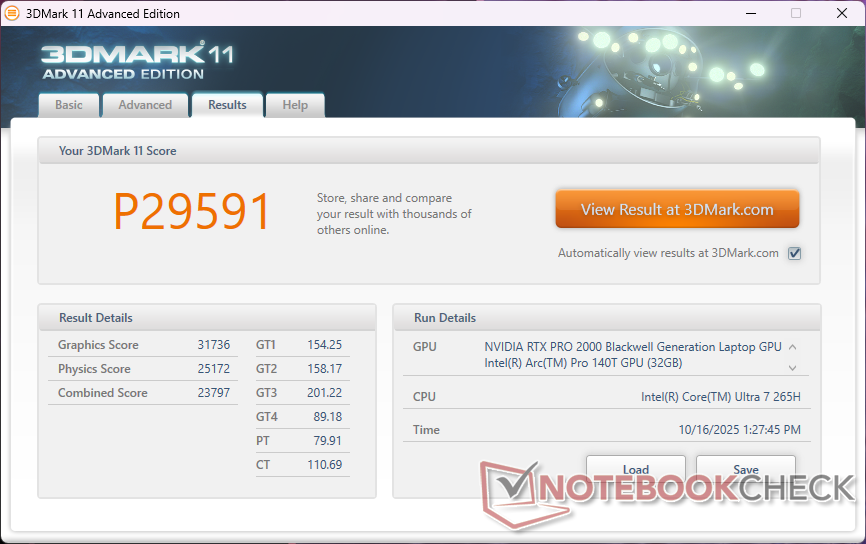

| 3DMark 11 Performance | 29591 points | |
| 3DMark Cloud Gate Standard Score | 60675 points | |
| 3DMark Fire Strike Score | 23035 points | |
| 3DMark Time Spy Score | 9627 points | |
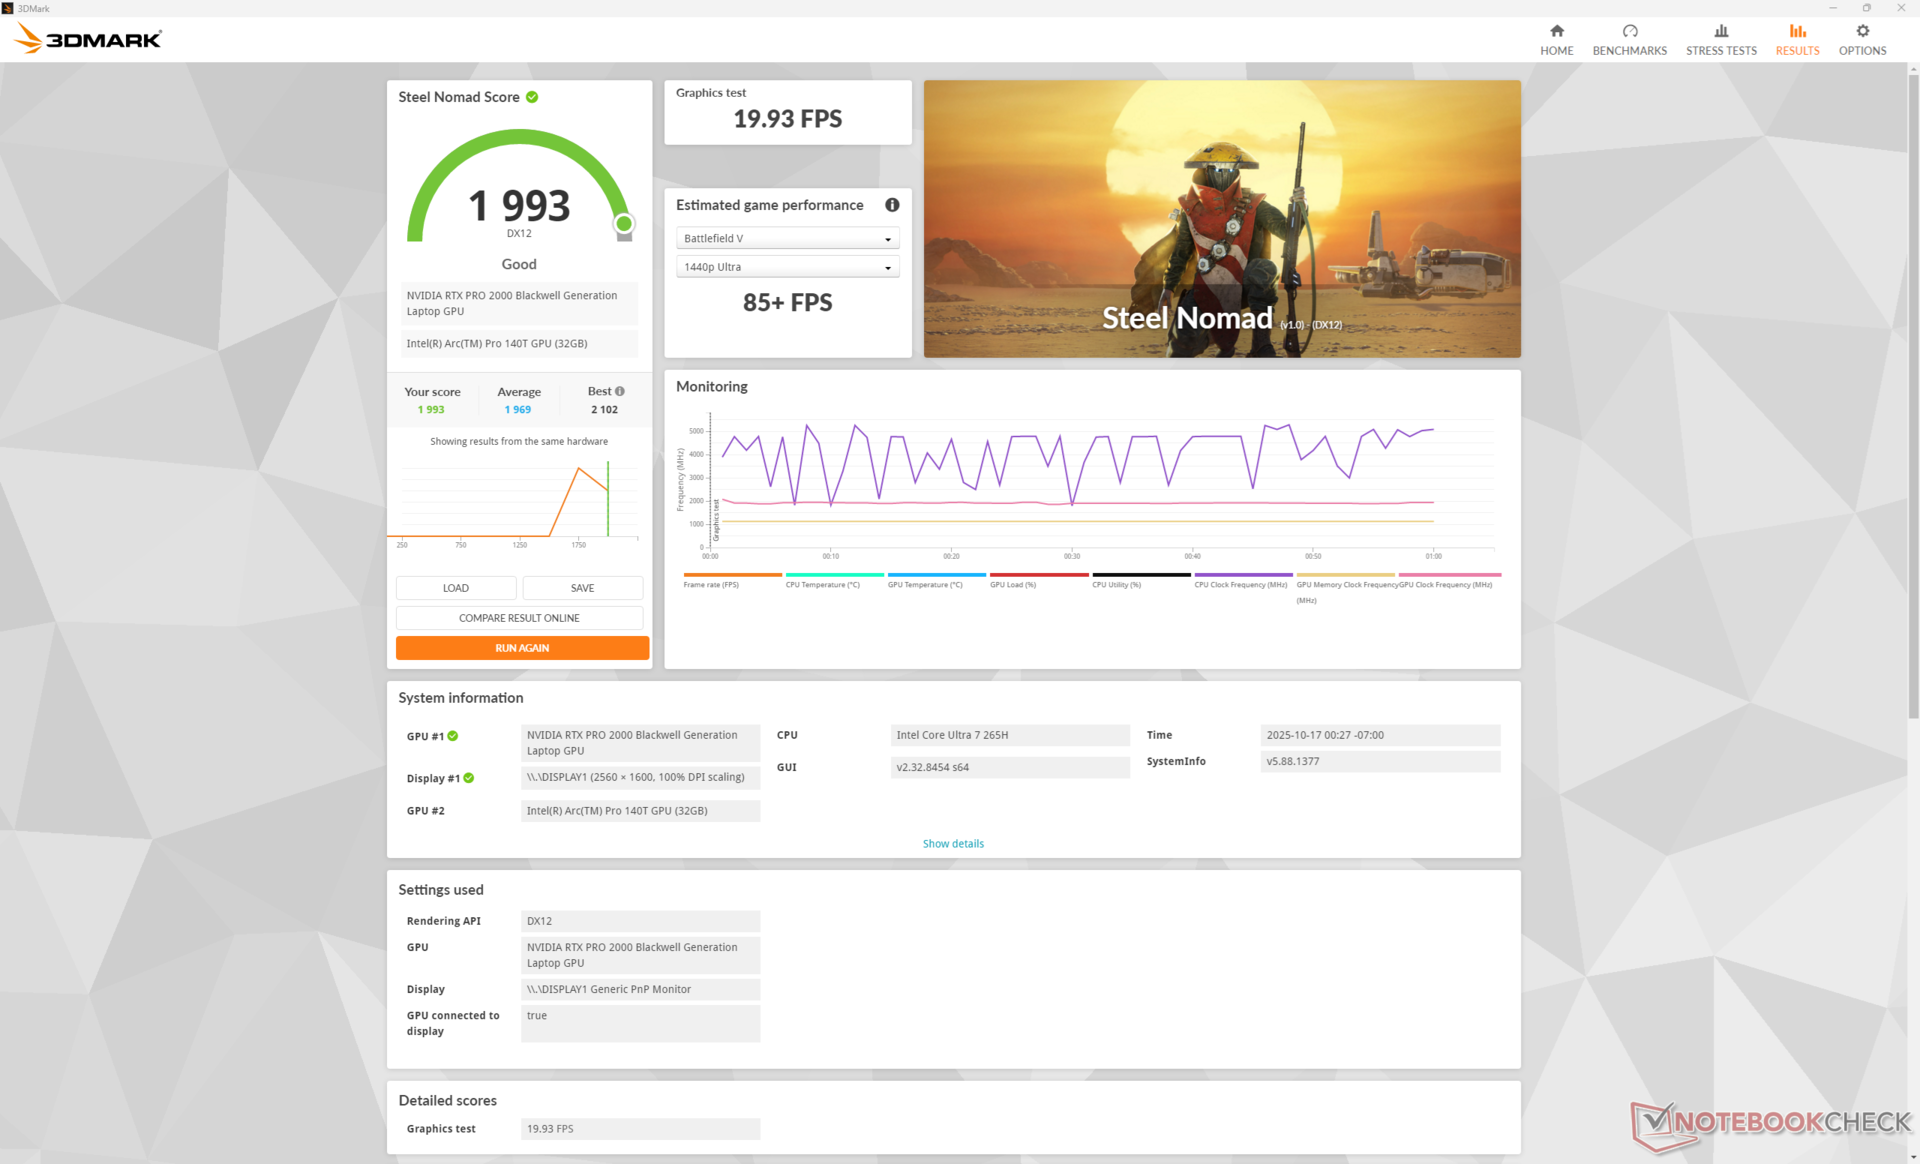
| 3DMark Steel Nomad Score | 1993 points | |
Aide | ||
* ... Moindre est la valeur, meilleures sont les performances
| Performance rating - Percent | |
| Dell Pro Max 16 Plus | |
| Lenovo ThinkPad P16 Gen 2 | |
| Dell Precision 5690 -1! | |
| HP ZBook X G1i 16 | |
| HP ZBook Studio 16 G11 | |
| HP ZBook Power 16 G11 A | |
| Cyberpunk 2077 - 1920x1080 Ultra Preset (FSR off) | |
| Dell Pro Max 16 Plus | |
| Dell Precision 5690 | |
| Lenovo ThinkPad P16 Gen 2 | |
| HP ZBook X G1i 16 | |
| HP ZBook Studio 16 G11 | |
| HP ZBook Power 16 G11 A | |
| Baldur's Gate 3 - 1920x1080 Ultra Preset AA:T | |
| Dell Pro Max 16 Plus | |
| Lenovo ThinkPad P16 Gen 2 | |
| Dell Precision 5690 | |
| HP ZBook Studio 16 G11 | |
| HP ZBook X G1i 16 | |
| HP ZBook Power 16 G11 A | |
| GTA V - 1920x1080 Highest AA:4xMSAA + FX AF:16x | |
| Dell Pro Max 16 Plus | |
| Lenovo ThinkPad P16 Gen 2 | |
| HP ZBook X G1i 16 | |
| HP ZBook Studio 16 G11 | |
| HP ZBook Power 16 G11 A | |
| Final Fantasy XV Benchmark - 1920x1080 High Quality | |
| Dell Pro Max 16 Plus | |
| Lenovo ThinkPad P16 Gen 2 | |
| Dell Precision 5690 | |
| HP ZBook X G1i 16 | |
| HP ZBook Studio 16 G11 | |
| HP ZBook Power 16 G11 A | |
| Strange Brigade - 1920x1080 ultra AA:ultra AF:16 | |
| Lenovo ThinkPad P16 Gen 2 | |
| Dell Pro Max 16 Plus | |
| Dell Precision 5690 | |
| HP ZBook Studio 16 G11 | |
| HP ZBook X G1i 16 | |
| HP ZBook Power 16 G11 A | |
| Dota 2 Reborn - 1920x1080 ultra (3/3) best looking | |
| Dell Pro Max 16 Plus | |
| Lenovo ThinkPad P16 Gen 2 | |
| HP ZBook Studio 16 G11 | |
| HP ZBook X G1i 16 | |
| Dell Precision 5690 | |
| HP ZBook Power 16 G11 A | |
| X-Plane 11.11 - 1920x1080 high (fps_test=3) | |
| Lenovo ThinkPad P16 Gen 2 | |
| Dell Pro Max 16 Plus | |
| Dell Precision 5690 | |
| HP ZBook Studio 16 G11 | |
| HP ZBook X G1i 16 | |
| HP ZBook Power 16 G11 A | |
Cyberpunk 2077 ultra FPS Chart
| Bas | Moyen | Élevé | Ultra | QHD DLSS | QHD | |
|---|---|---|---|---|---|---|
| GTA V (2015) | 186.2 | 183.1 | 177.8 | 112.7 | 88.4 | |
| Dota 2 Reborn (2015) | 170.1 | 158.1 | 151.1 | 141.8 | ||
| Final Fantasy XV Benchmark (2018) | 206 | 129.5 | 100.2 | 71 | ||
| X-Plane 11.11 (2018) | 102 | 92.2 | 80.6 | |||
| Strange Brigade (2018) | 480 | 252 | 198.7 | 171.3 | 119.2 | |
| Baldur's Gate 3 (2023) | 116.1 | 99.7 | 89.6 | 89.5 | 90 | 60.4 |
| Cyberpunk 2077 (2023) | 112.5 | 93.5 | 80 | 72.1 | 52.4 | 43.6 |
| F1 24 (2024) | 214 | 205 | 161.4 | 48.2 | 48.8 | 32.2 |
Émissions
Bruit du système
Les ventilateurs sont léthargiques lorsqu'ils fonctionnent avec des charges peu exigeantes, mais ils peuvent devenir assez bruyants (un peu plus de 50 dB(A)) lorsqu'ils fonctionnent avec des charges plus exigeantes pendant des périodes prolongées, comme Cyberpunk 2077.
Degré de la nuisance sonore
| Au repos |
| 23.7 / 23.7 / 23.7 dB(A) |
| Fortement sollicité |
| 32.7 / 48 dB(A) |
 | ||
30 dB silencieux 40 dB(A) audible 50 dB(A) bruyant |
||
min: | ||
| HP ZBook X G1i 16 RTX PRO 2000 Blackwell Generation Laptop, Ultra 7 265H, Samsung PM9A1 MZVL22T0HBLB | HP ZBook Power 16 G11 A RTX 2000 Ada Generation Laptop, R7 8845HS, Samsung PM9A1 MZVL22T0HBLB | HP ZBook Studio 16 G11 RTX 3000 Ada Generation Laptop, Ultra 9 185H, Kioxia XG8 KXG80ZNV1T02 | Lenovo ThinkPad P16 Gen 2 RTX 4000 Ada Generation Laptop, i7-14700HX, SK hynix PC801 HFS001TEJ9X162N | Dell Pro Max 16 Plus RTX PRO 5000 Blackwell Generation Laptop, Ultra 9 285HX, SK hynix PCB01 HFS001TFM9X186N | Dell Precision 5690 RTX 5000 Ada Generation Laptop, Ultra 9 185H, 2x Samsung PM9A1 1TB (RAID 0) | |
|---|---|---|---|---|---|---|
| Noise | 6% | -4% | -16% | -18% | -11% | |
| arrêt / environnement * (dB) | 23.7 | 23.5 1% | 23.8 -0% | 23.9 -1% | 23.2 2% | 23.4 1% |
| Idle Minimum * (dB) | 23.7 | 23.8 -0% | 23.8 -0% | 29.1 -23% | 26.7 -13% | 23.6 -0% |
| Idle Average * (dB) | 23.7 | 24.2 -2% | 26.4 -11% | 29.1 -23% | 30.5 -29% | 24.9 -5% |
| Idle Maximum * (dB) | 23.7 | 24.2 -2% | 26.4 -11% | 29.1 -23% | 34 -43% | 30.9 -30% |
| Load Average * (dB) | 32.7 | 25.4 22% | 33.7 -3% | 41 -25% | 39.8 -22% | 40.4 -24% |
| Cyberpunk 2077 ultra * (dB) | 50.9 | 43 16% | 46.1 9% | 52.8 -4% | 54.3 -7% | |
| Load Maximum * (dB) | 48 | 45 6% | 53.2 -11% | 52.9 -10% | 54.3 -13% | 51.9 -8% |
| Witcher 3 ultra * (dB) | 48.3 |
* ... Moindre est la valeur, meilleures sont les performances
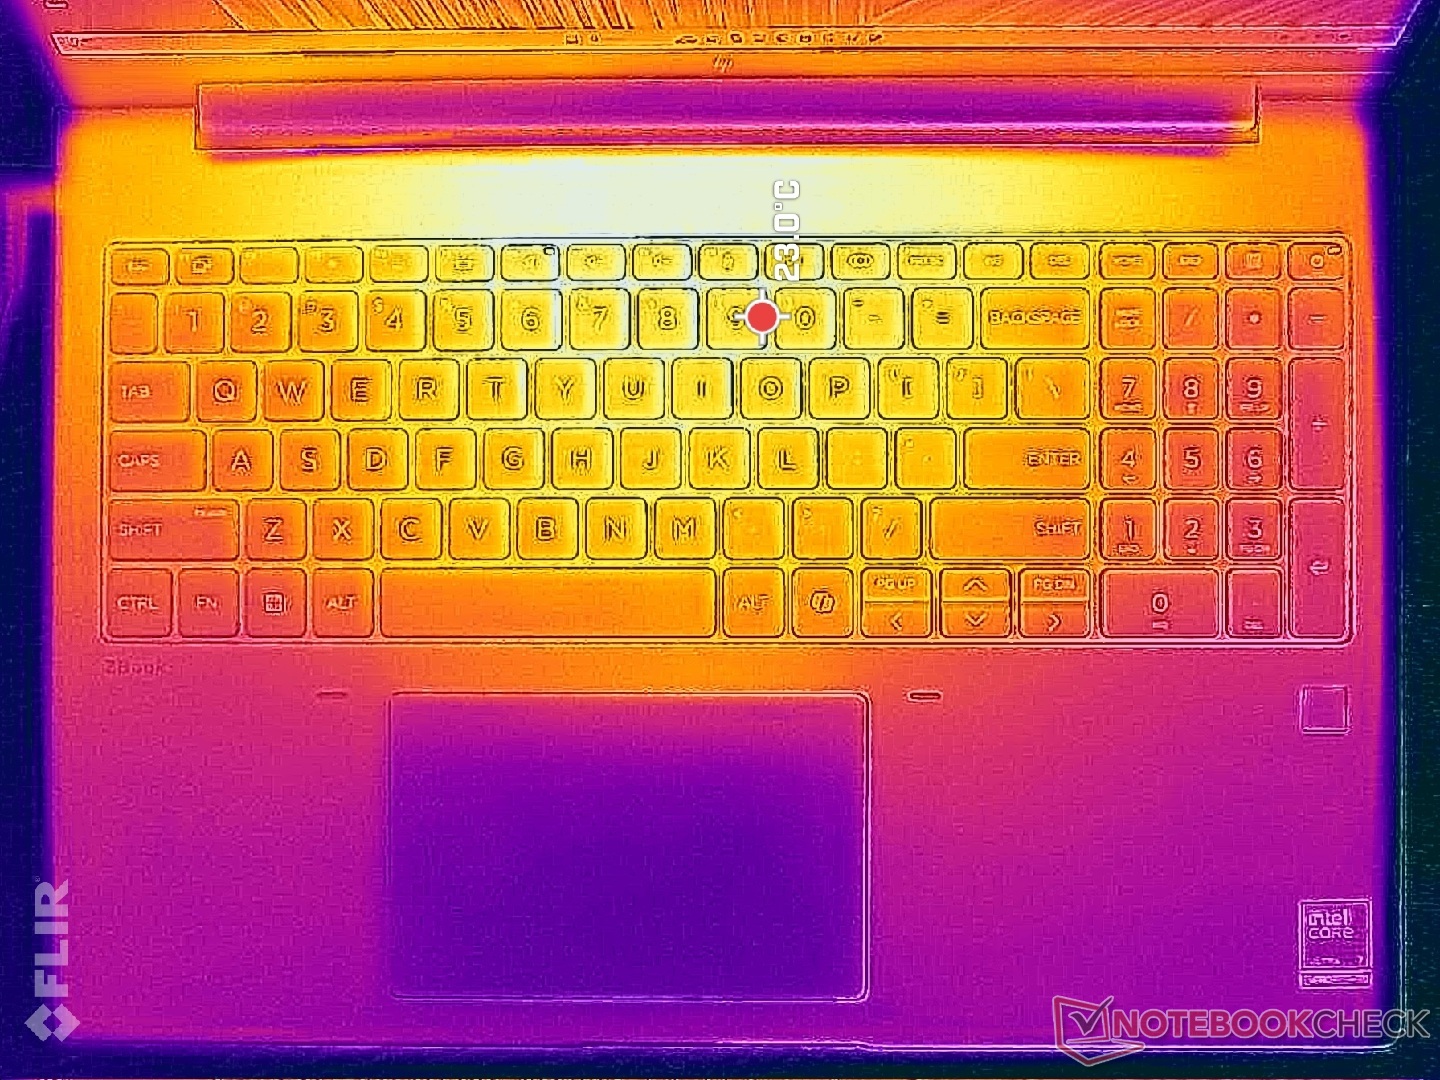
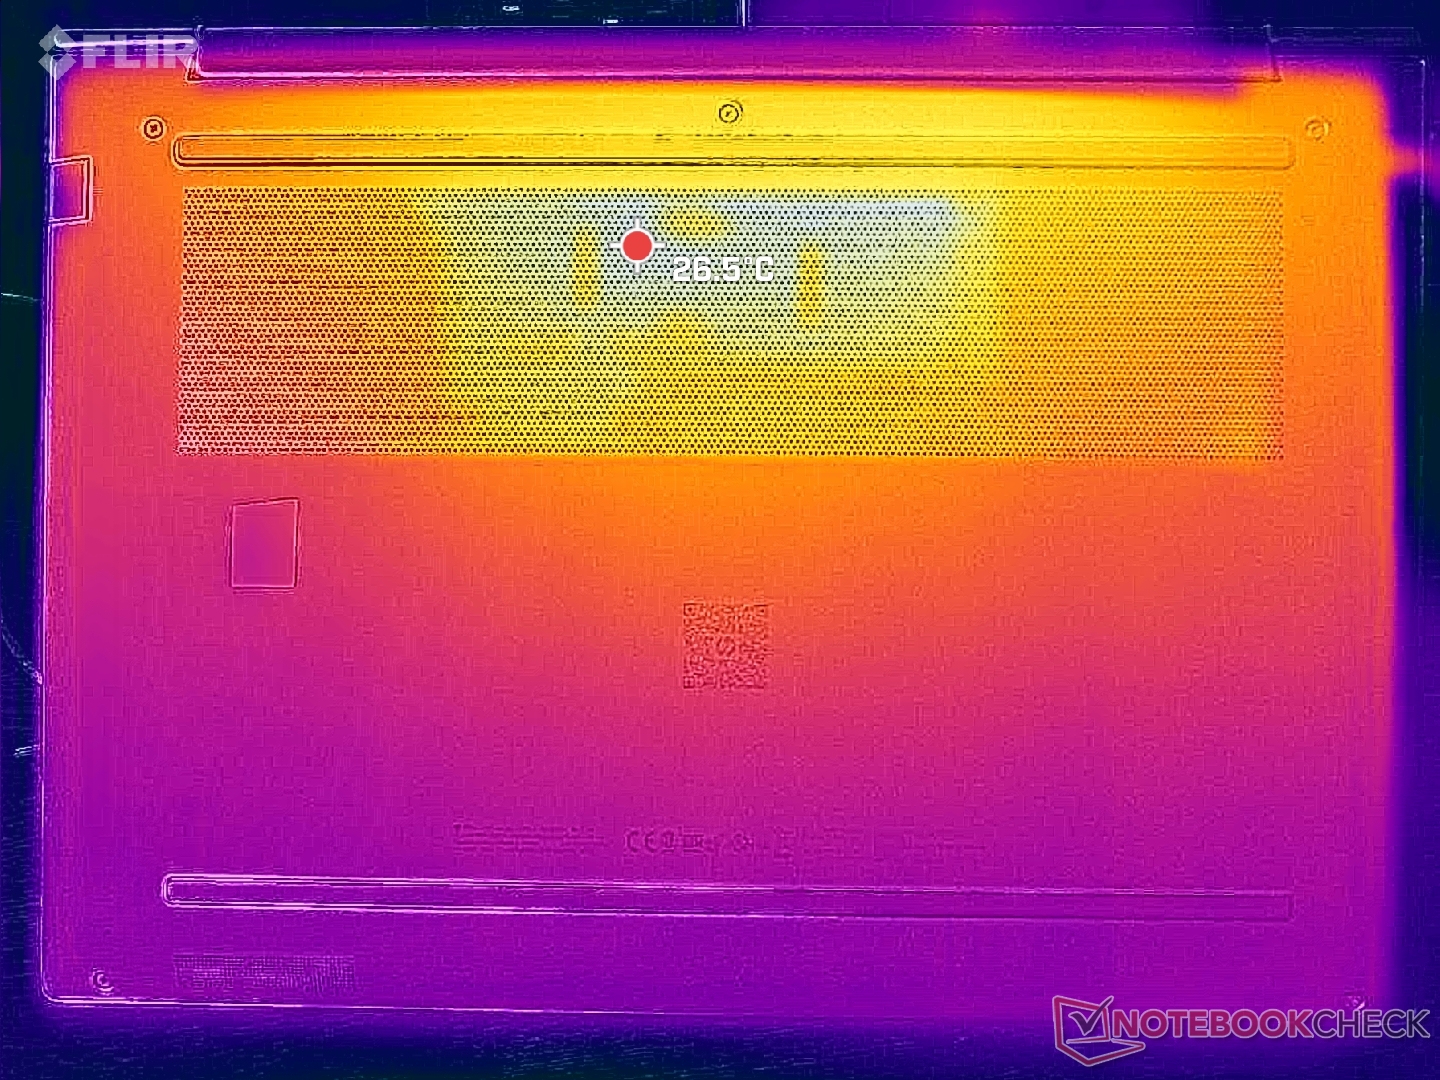
Température
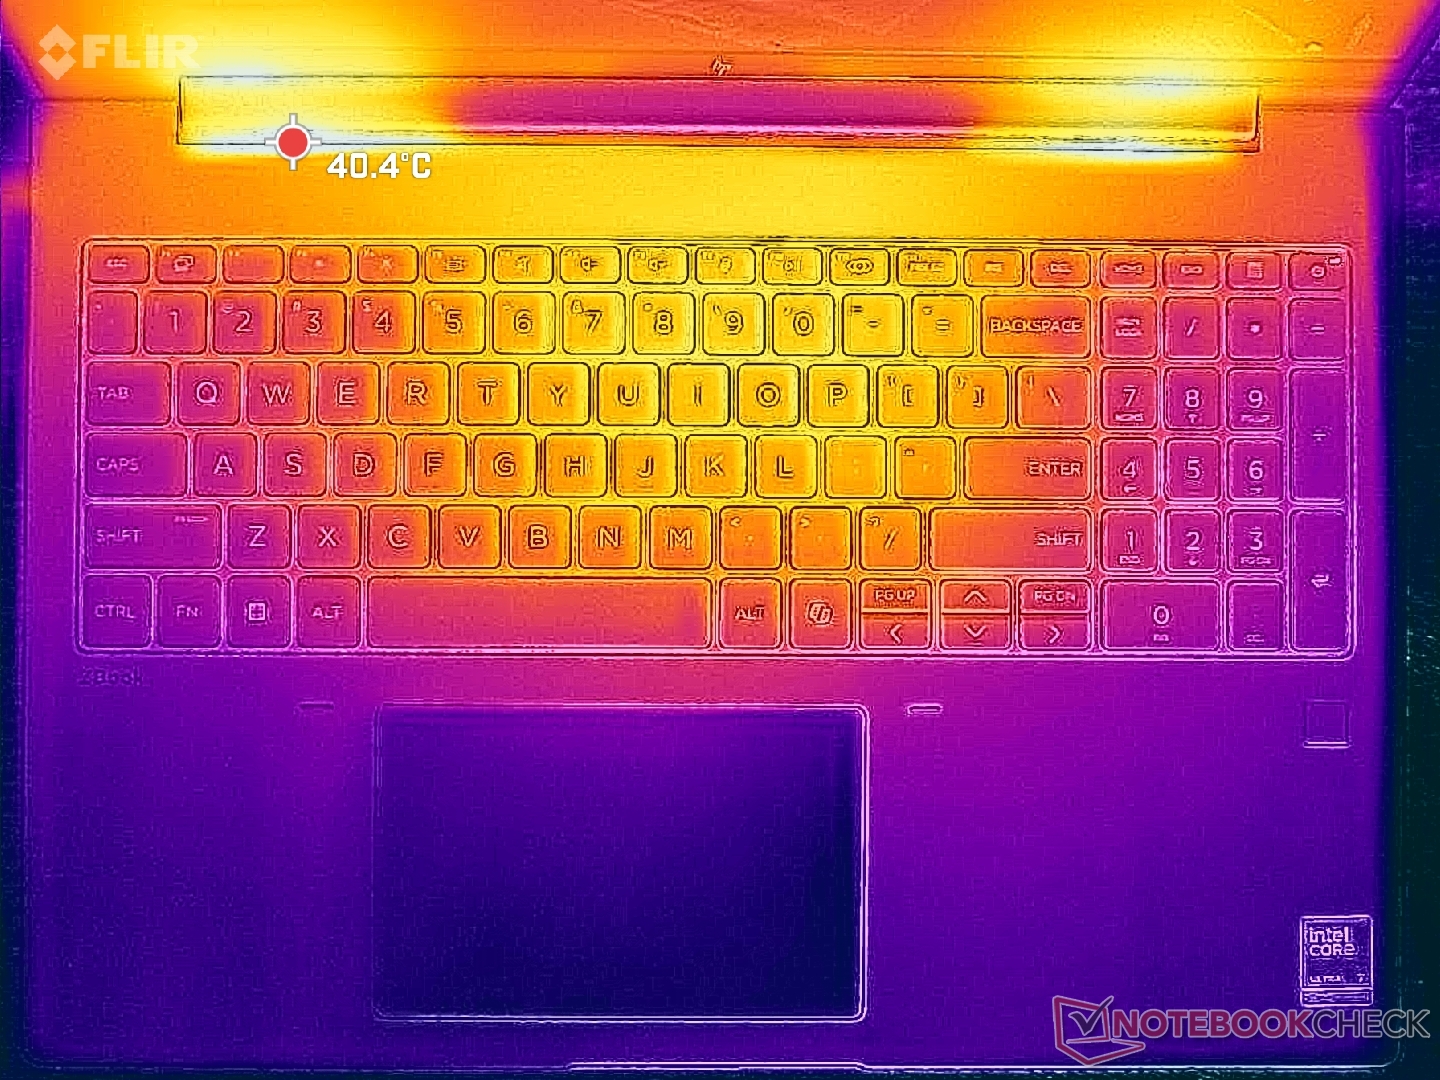
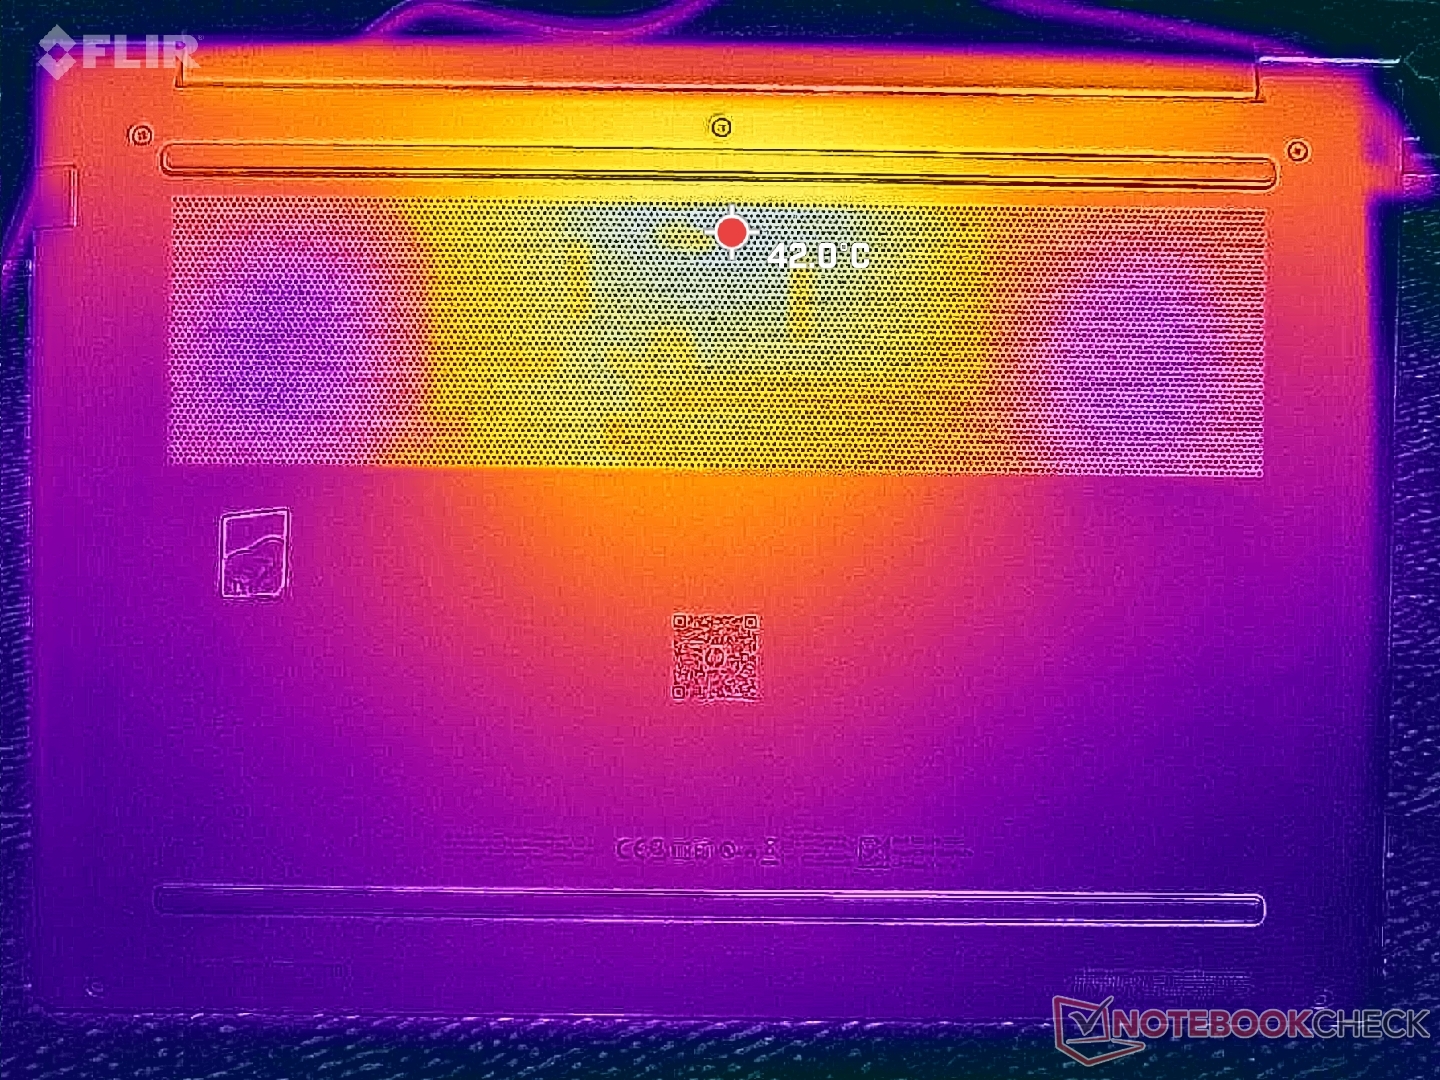
L'évolution de la température de surface est la plus chaude vers le centre, où elle peut atteindre plus de 36 °C lorsque l'ordinateur est soumis à des charges exigeantes, ce qui est nettement plus froid que ce que nous avons enregistré sur le ThinkPad P16 Gen 2 ou Dell Precision 5690.
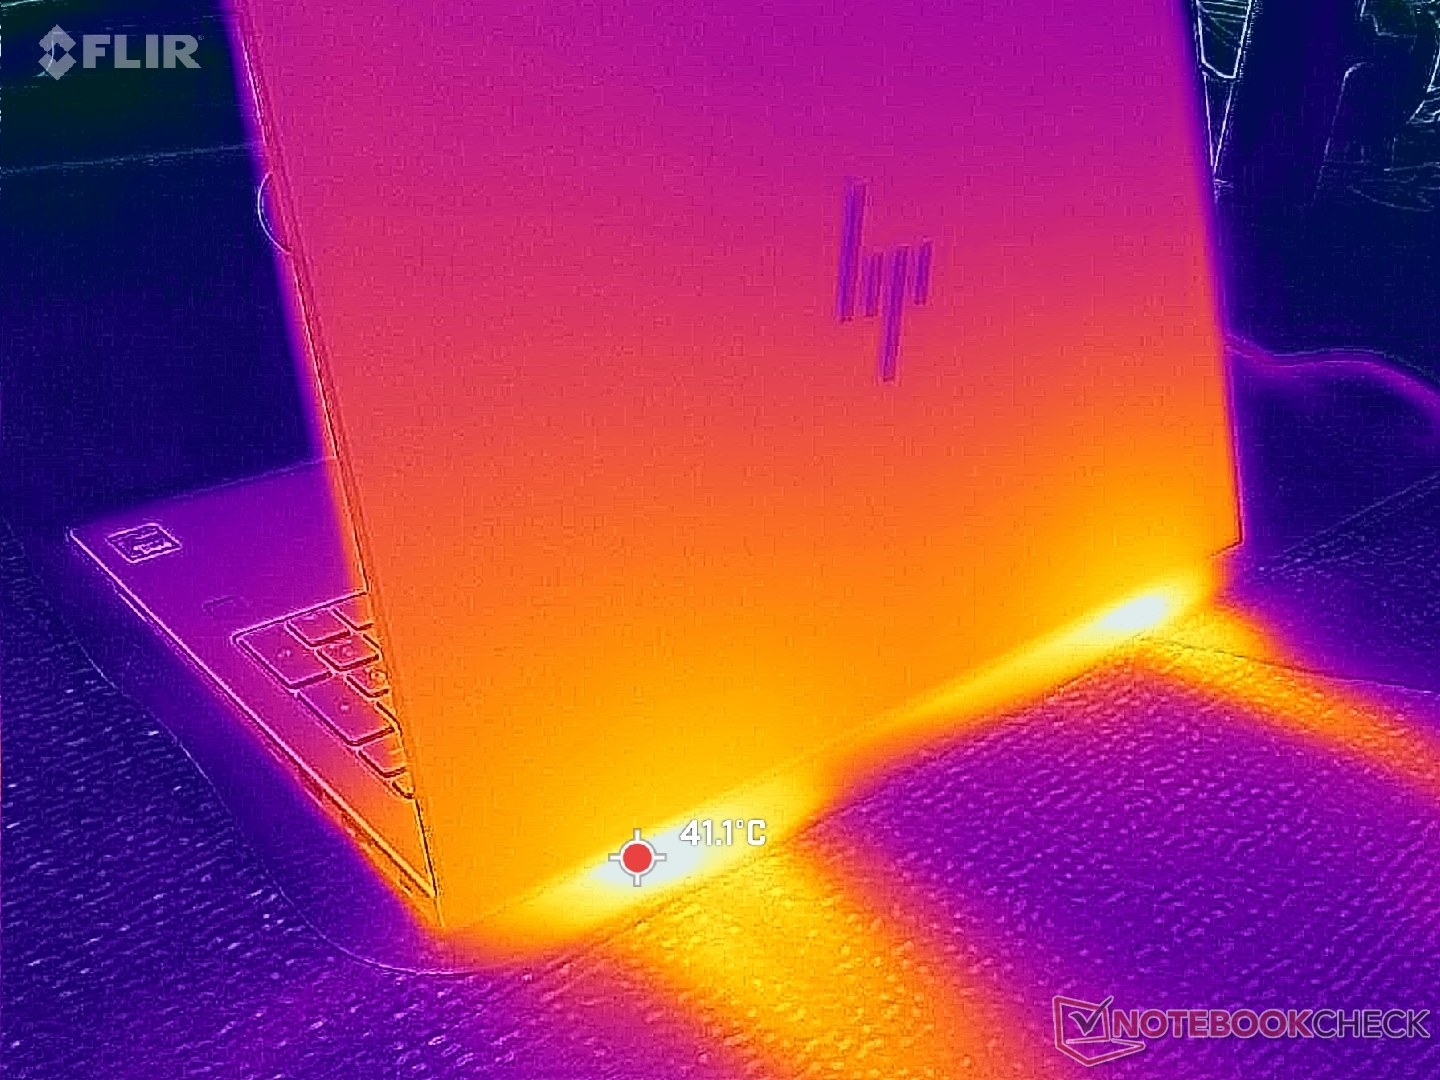
(+) La température maximale du côté supérieur est de 36 °C / 97 F, par rapport à la moyenne de 38.2 °C / 101 F, allant de 22.2 à 69.8 °C pour la classe Workstation.
(+) Le fond chauffe jusqu'à un maximum de 39.4 °C / 103 F, contre une moyenne de 41.1 °C / 106 F
(+) En utilisation inactive, la température moyenne du côté supérieur est de 26.9 °C / 80 F, par rapport à la moyenne du dispositif de 32 °C / 90 F.
(+) Les repose-poignets et le pavé tactile sont plus froids que la température de la peau avec un maximum de 24.2 °C / 75.6 F et sont donc froids au toucher.
(+) La température moyenne de la zone de l'appui-paume de dispositifs similaires était de 27.8 °C / 82 F (+3.6 °C / #6.4 F).
| HP ZBook X G1i 16 Intel Core Ultra 7 265H, NVIDIA RTX PRO 2000 Blackwell Generation Laptop | HP ZBook Power 16 G11 A AMD Ryzen 7 8845HS, NVIDIA RTX 2000 Ada Generation Laptop | HP ZBook Studio 16 G11 Intel Core Ultra 9 185H, NVIDIA RTX 3000 Ada Generation Laptop | Lenovo ThinkPad P16 Gen 2 Intel Core i7-14700HX, NVIDIA RTX 4000 Ada Generation Laptop | Dell Pro Max 16 Plus Intel Core Ultra 9 285HX, NVIDIA RTX PRO 5000 Blackwell Generation Laptop | Dell Precision 5690 Intel Core Ultra 9 185H, NVIDIA RTX 5000 Ada Generation Laptop | |
|---|---|---|---|---|---|---|
| Heat | 4% | -10% | -5% | -10% | -3% | |
| Maximum Upper Side * (°C) | 36 | 40.6 -13% | 36.6 -2% | 46.6 -29% | 40.4 -12% | 46.6 -29% |
| Maximum Bottom * (°C) | 39.4 | 40.6 -3% | 47.8 -21% | 51 -29% | 45.6 -16% | 33 16% |
| Idle Upper Side * (°C) | 30.4 | 26 14% | 31.4 -3% | 24.8 18% | 32.8 -8% | 32.4 -7% |
| Idle Bottom * (°C) | 31.8 | 26.6 16% | 35.6 -12% | 25.6 19% | 33 -4% | 29.4 8% |
* ... Moindre est la valeur, meilleures sont les performances
Test de stress
Le processeur atteignait 3,6 GHz, 108 W et 104°C lors de l'exécution de Prime95, avant de retomber et de se stabiliser à 3,0 GHz, 62 W et 88°C quelques instants plus tard, ce qui représentait la durabilité maximale limitée de Turbo Boost. Il est intéressant de noter que les fréquences d'horloge du CPU varient alors que les fréquences d'horloge du GPU restent constantes lors de l'exécution simultanée de Prime95 et FurMark.
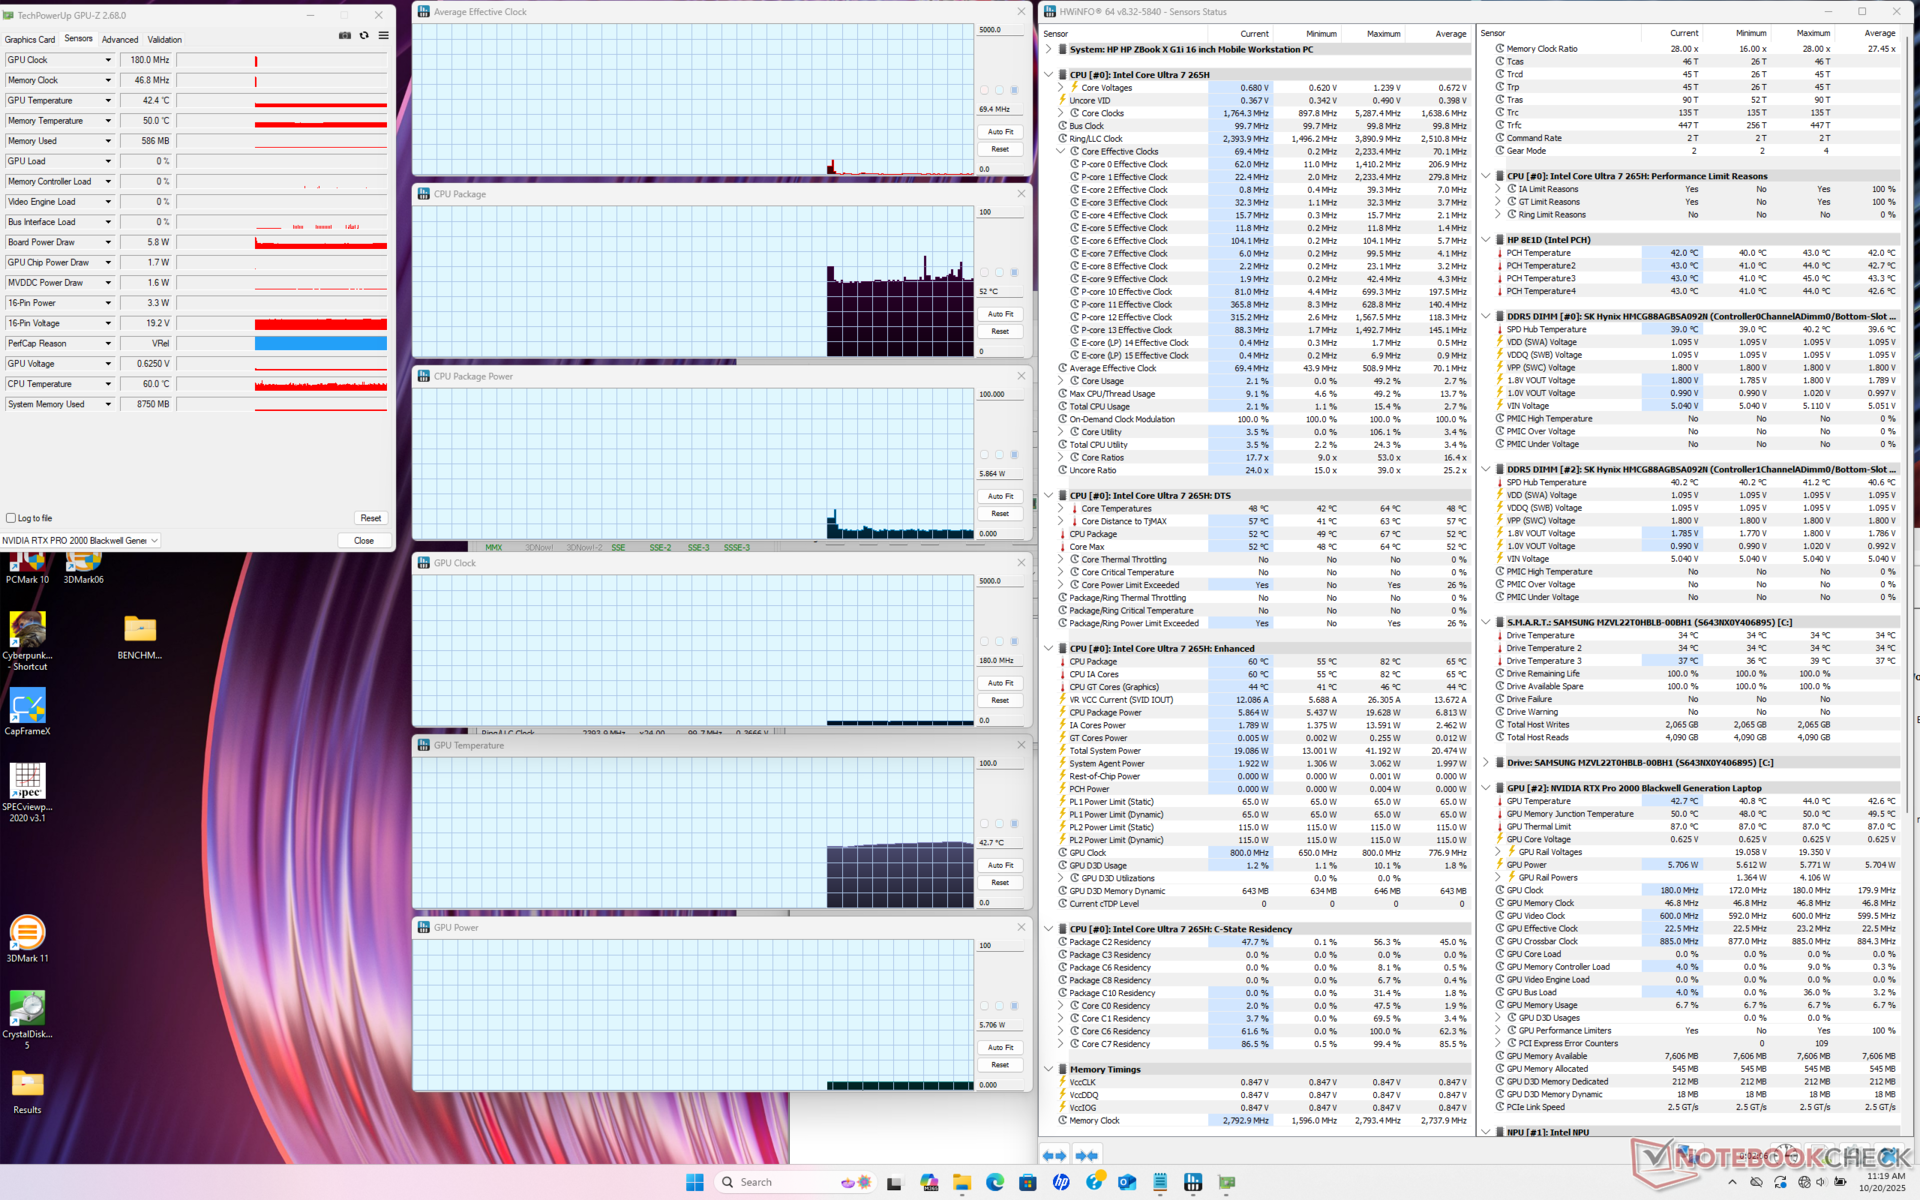
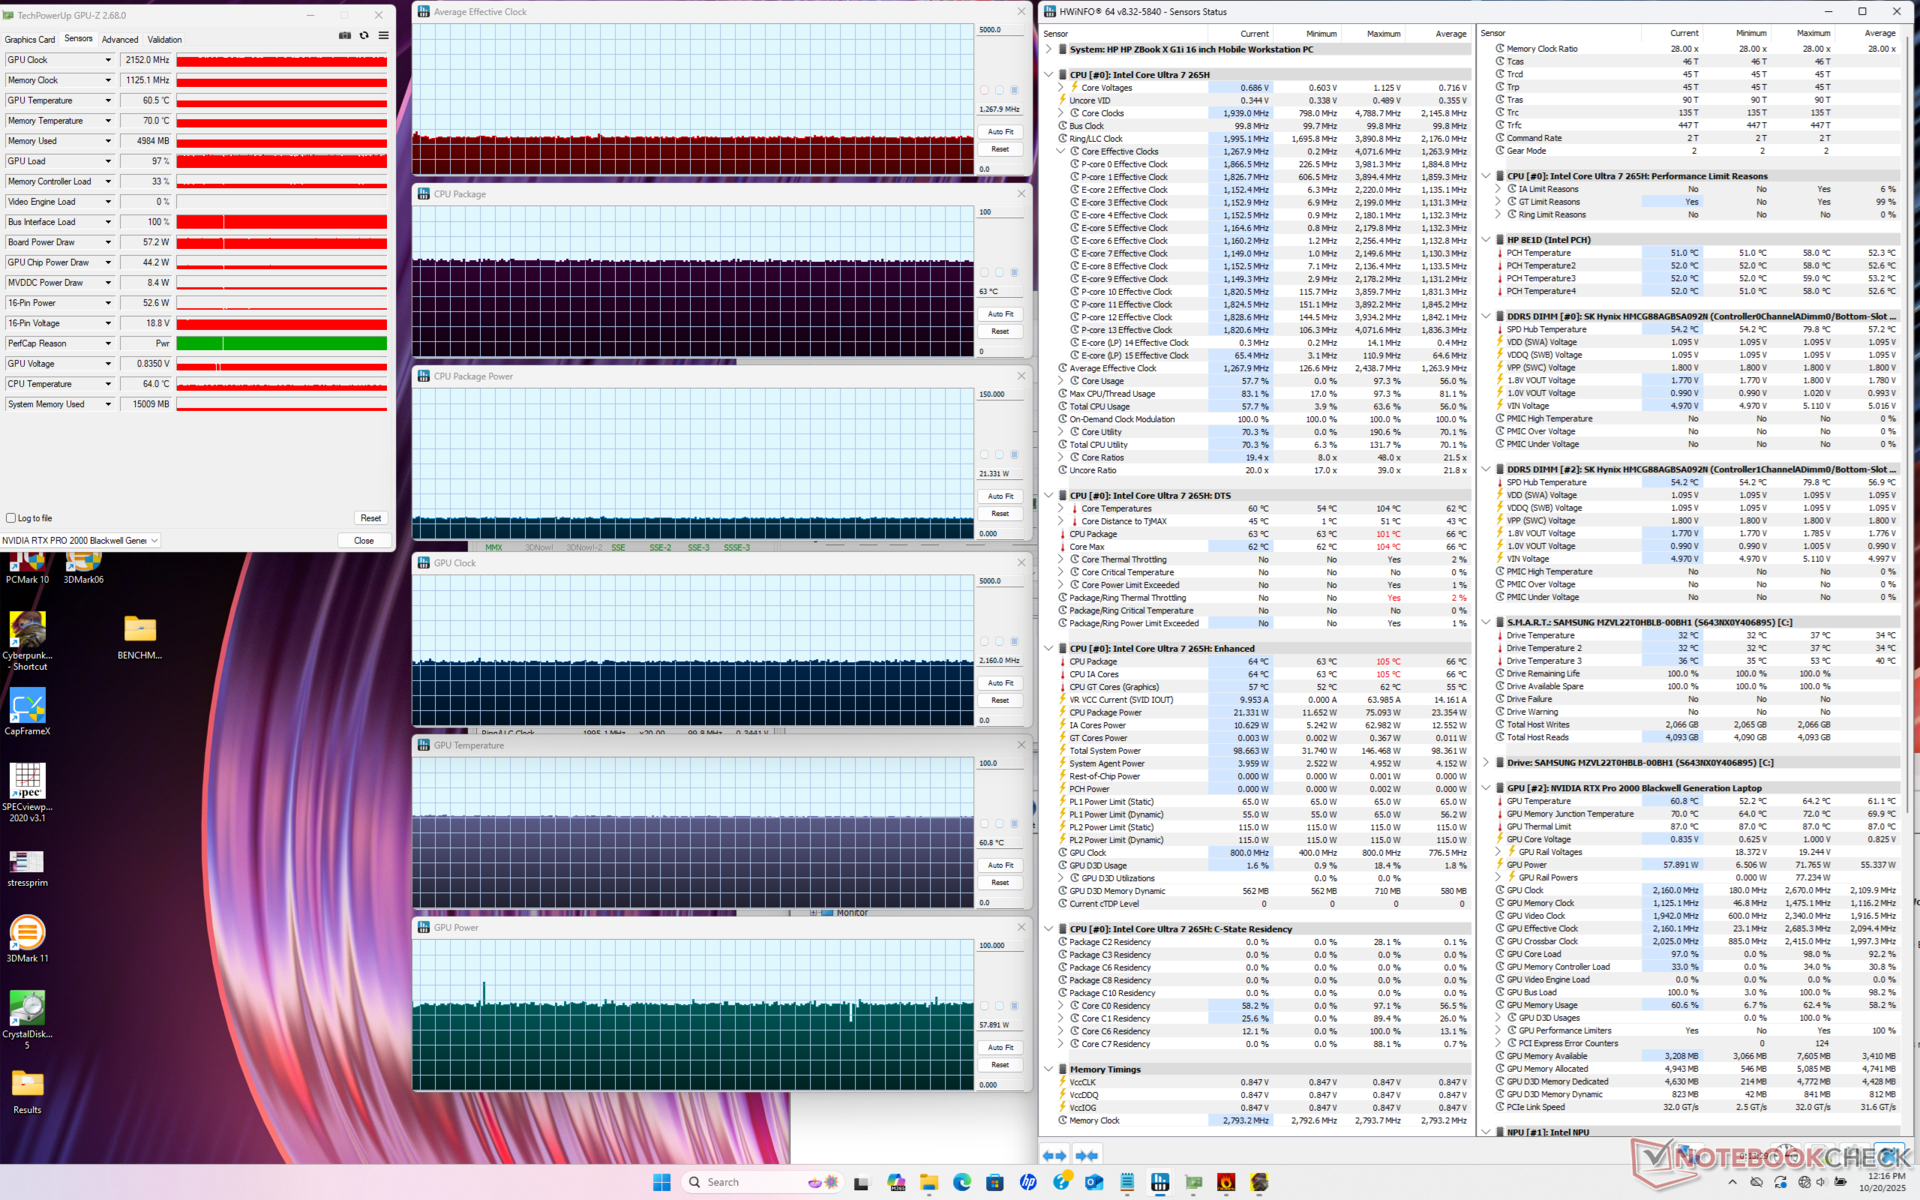
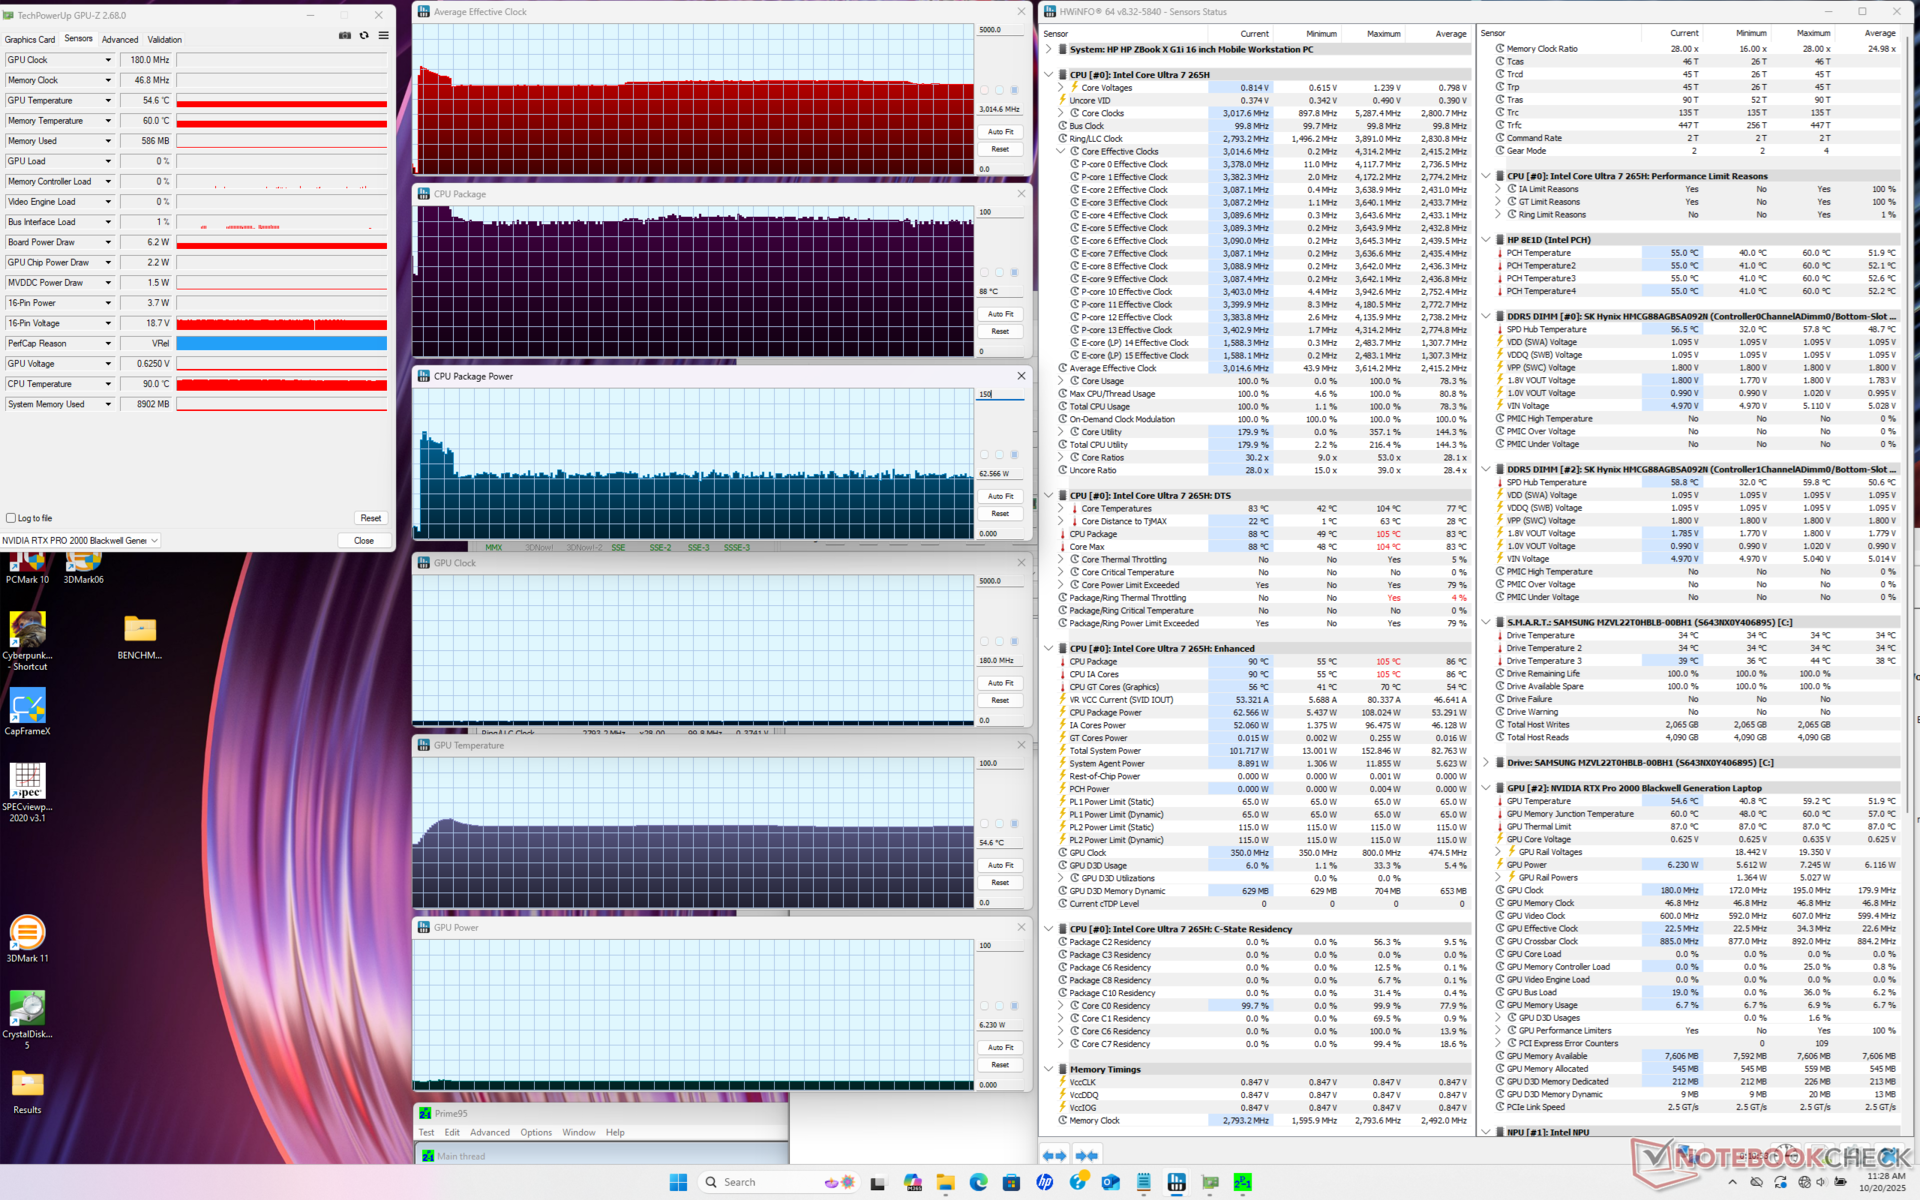

| Horloge moyenne du CPU (GHz) | Horloge du GPU (MHz) | Température moyenne du CPU (°C) | Température moyenne du GPU (°C) | |
| Système en veille | -- | -- | 52 | 43 |
| Prime95 Stress | 3.0 | -- | 88 | 55 |
| Prime95 + FurMark Stress | 2.5 - 2.9 | 1215 | 83 - 91 | 65 |
| Cyberpunk 2077 Stress | 1.3 | 2160 | 63 | 61 |
Intervenants
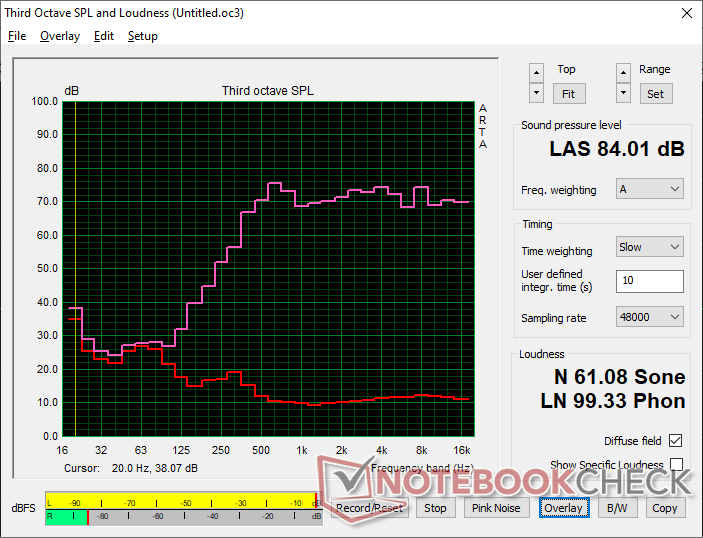
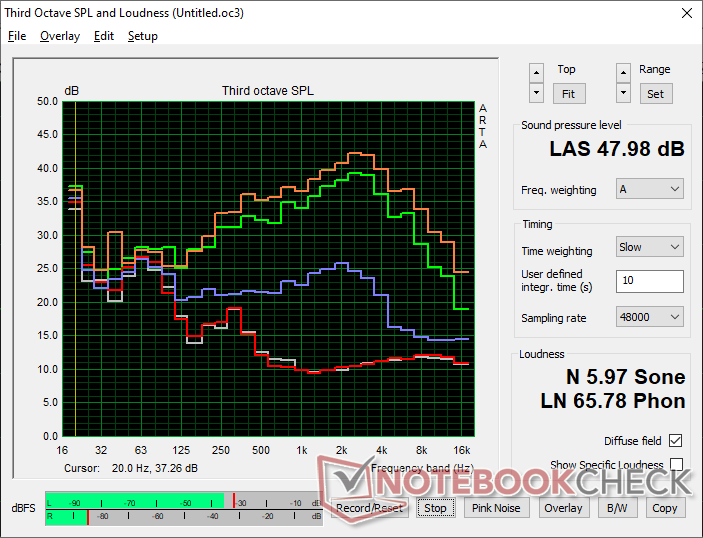
HP ZBook X G1i 16 analyse audio
(+) | les haut-parleurs peuvent jouer relativement fort (84# dB)
Basses 100 - 315 Hz
(-) | presque aucune basse - en moyenne 28% plus bas que la médiane
(±) | la linéarité des basses est moyenne (8.8% delta à la fréquence précédente)
Médiums 400 - 2000 Hz
(+) | médiane équilibrée - seulement 1.9% de la médiane
(+) | les médiums sont linéaires (6.1% delta à la fréquence précédente)
Aiguës 2 - 16 kHz
(+) | des sommets équilibrés - à seulement 2.9% de la médiane
(+) | les aigus sont linéaires (5.1% delta à la fréquence précédente)
Globalement 100 - 16 000 Hz
(±) | la linéarité du son global est moyenne (15.6% de différence avec la médiane)
Par rapport à la même classe
» 35% de tous les appareils testés de cette catégorie étaient meilleurs, 11% similaires, 54% pires
» Le meilleur avait un delta de 7%, la moyenne était de 17%, le pire était de 35%.
Par rapport à tous les appareils testés
» 23% de tous les appareils testés étaient meilleurs, 5% similaires, 72% pires
» Le meilleur avait un delta de 4%, la moyenne était de 23%, le pire était de 134%.
Apple MacBook Pro 16 2021 M1 Pro analyse audio
(+) | les haut-parleurs peuvent jouer relativement fort (84.7# dB)
Basses 100 - 315 Hz
(+) | bonne basse - seulement 3.8% loin de la médiane
(+) | les basses sont linéaires (5.2% delta à la fréquence précédente)
Médiums 400 - 2000 Hz
(+) | médiane équilibrée - seulement 1.3% de la médiane
(+) | les médiums sont linéaires (2.1% delta à la fréquence précédente)
Aiguës 2 - 16 kHz
(+) | des sommets équilibrés - à seulement 1.9% de la médiane
(+) | les aigus sont linéaires (2.7% delta à la fréquence précédente)
Globalement 100 - 16 000 Hz
(+) | le son global est linéaire (4.6% différence à la médiane)
Par rapport à la même classe
» 0% de tous les appareils testés de cette catégorie étaient meilleurs, 0% similaires, 100% pires
» Le meilleur avait un delta de 5%, la moyenne était de 17%, le pire était de 45%.
Par rapport à tous les appareils testés
» 0% de tous les appareils testés étaient meilleurs, 0% similaires, 100% pires
» Le meilleur avait un delta de 4%, la moyenne était de 23%, le pire était de 134%.
Gestion de l'énergie
Consommation électrique
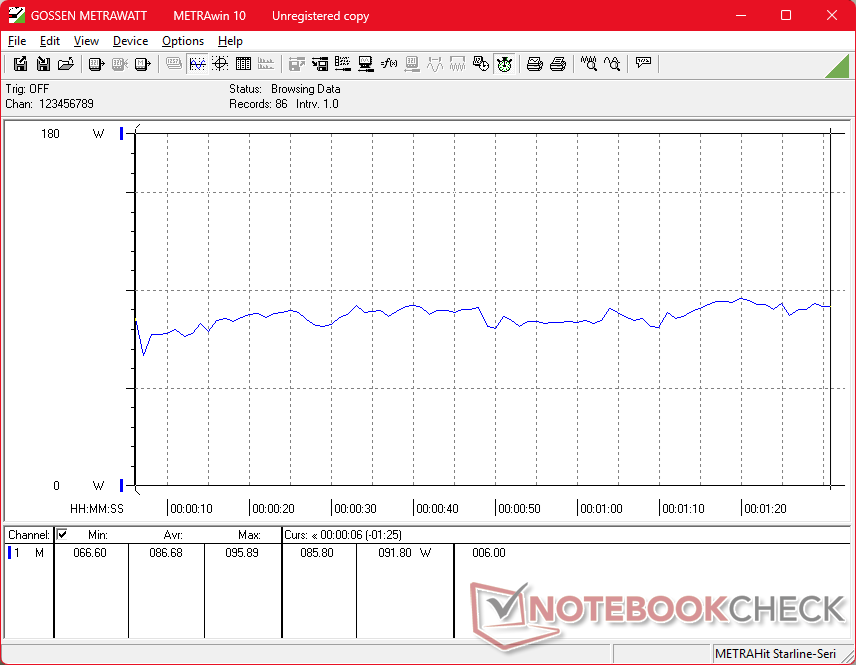
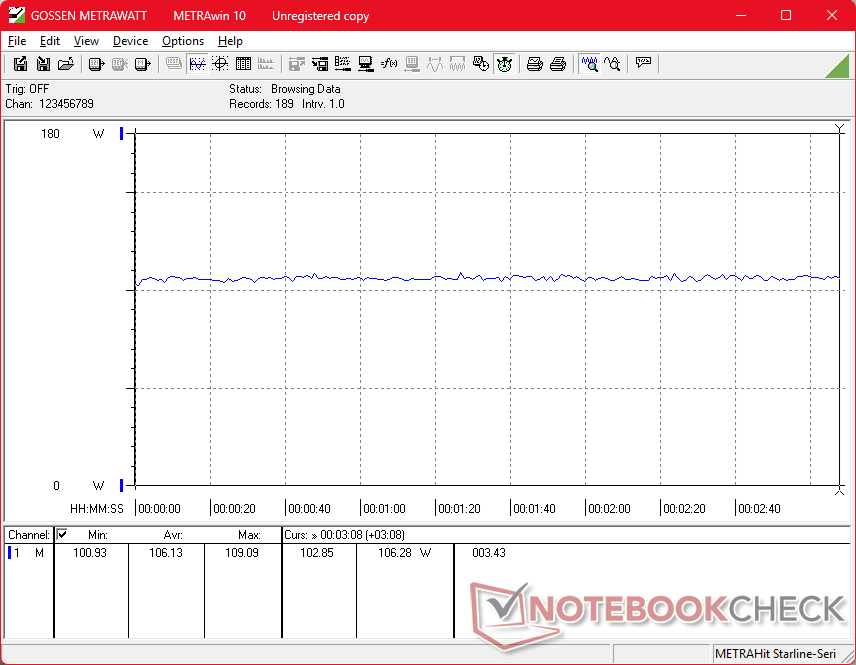
La consommation en charge est en moyenne légèrement supérieure à celle que nous avons enregistrée sur l'ancien modèle équipé d'AMD, le ZBook Power 16 G11 A. Cependant, notre ZBook X G1i 16 est aussi la machine la plus rapide et la plus légère et donc la performance élevée par watt est préservée.
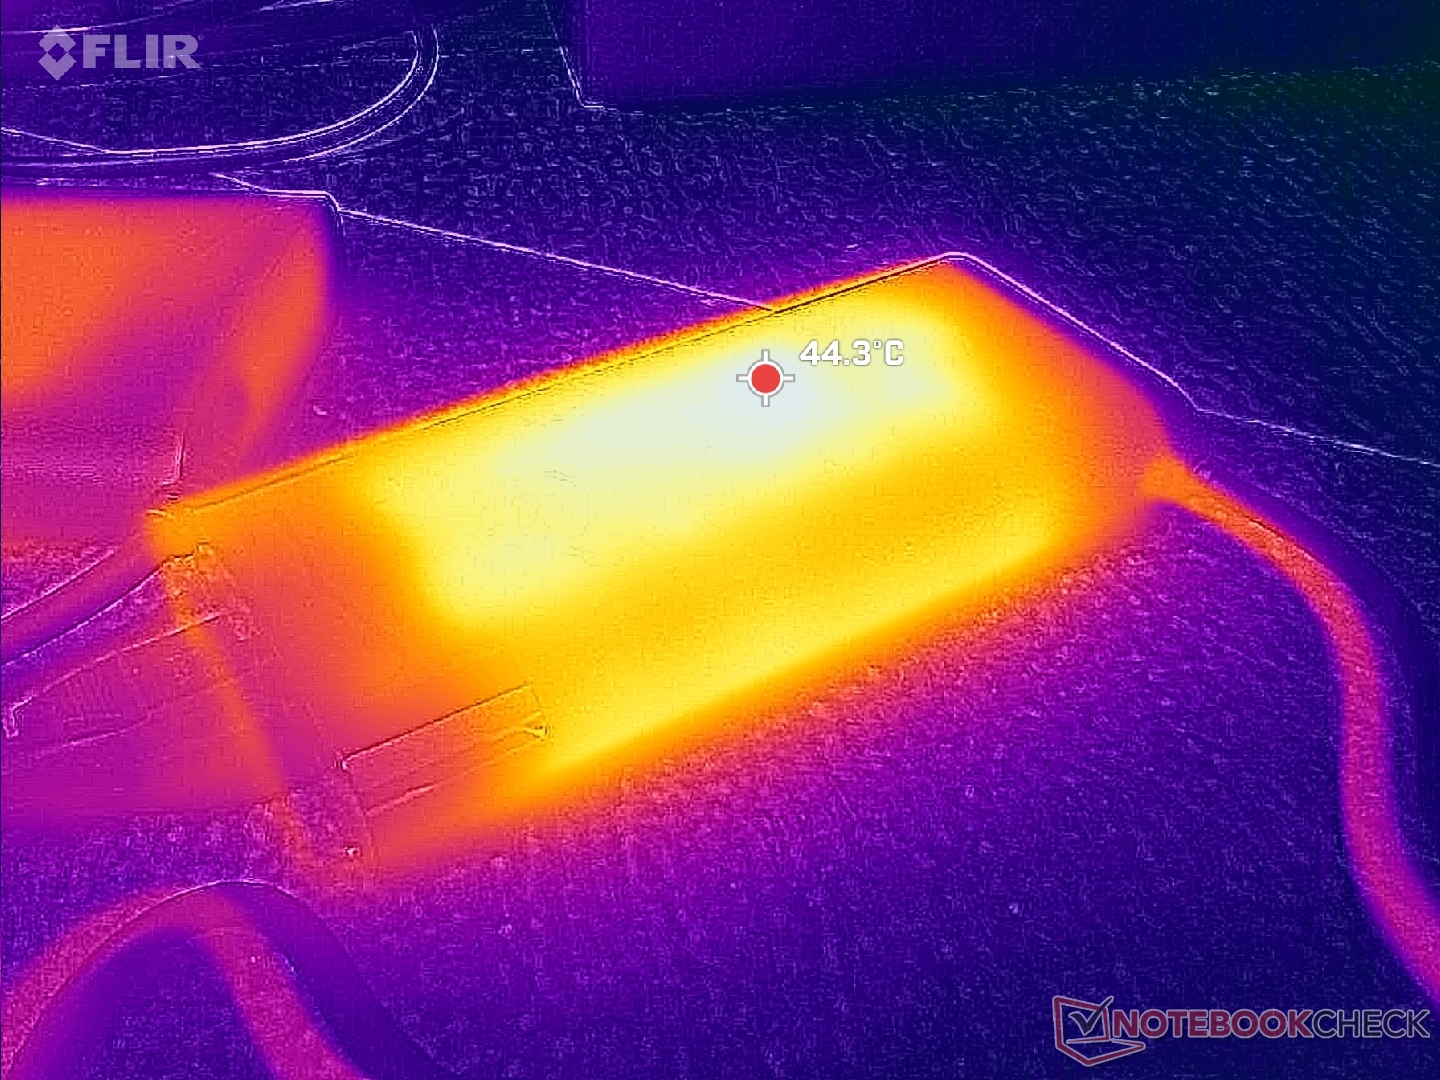
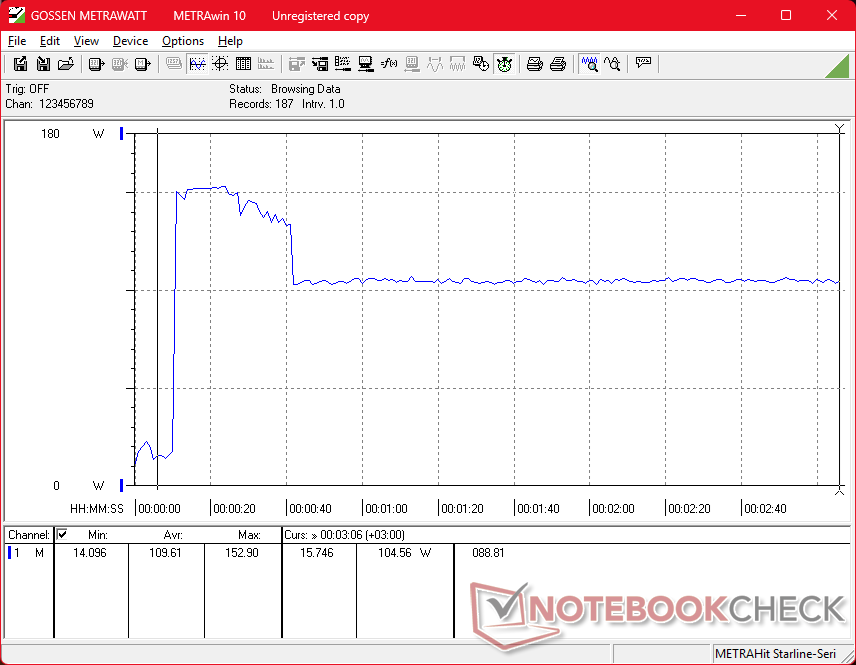
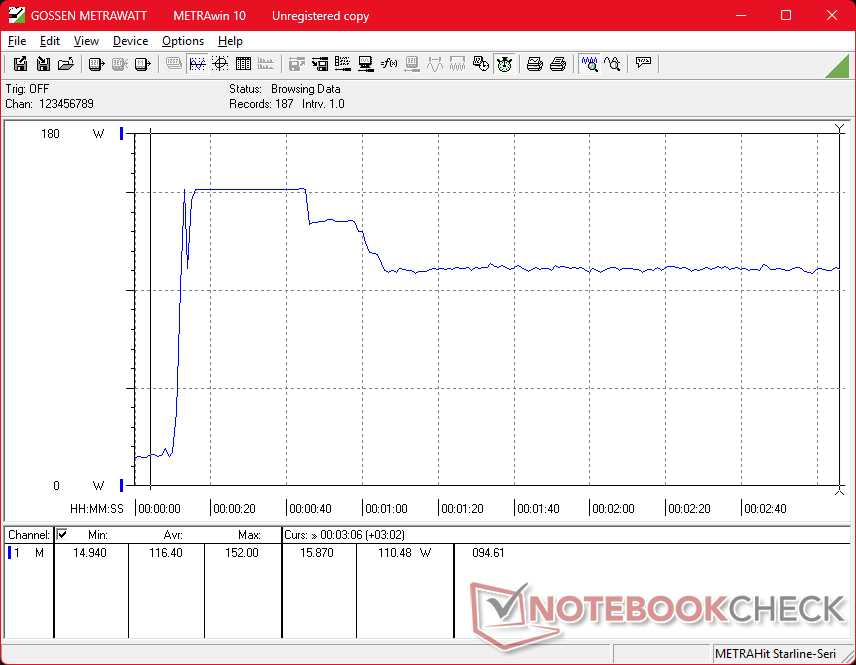
Nous avons pu mesurer une consommation maximale temporaire de 153 W sur le petit adaptateur secteur de 150 W (~13,8 x 6,5 x 2,2 cm) lorsque le CPU et le GPU sont pleinement sollicités.
| Éteint/en veille | |
| Au repos | |
| Fortement sollicité |
|
Légende:
min: | |
| HP ZBook X G1i 16 Ultra 7 265H, RTX PRO 2000 Blackwell Generation Laptop, Samsung PM9A1 MZVL22T0HBLB, IPS, 2560x1600, 16" | HP ZBook Power 16 G11 A R7 8845HS, RTX 2000 Ada Generation Laptop, Samsung PM9A1 MZVL22T0HBLB, IPS, 2560x1600, 16" | HP ZBook Studio 16 G11 Ultra 9 185H, RTX 3000 Ada Generation Laptop, Kioxia XG8 KXG80ZNV1T02, IPS, 3840x2400, 16" | Lenovo ThinkPad P16 Gen 2 i7-14700HX, RTX 4000 Ada Generation Laptop, SK hynix PC801 HFS001TEJ9X162N, IPS, 2560x1600, 16" | Dell Pro Max 16 Plus Ultra 9 285HX, RTX PRO 5000 Blackwell Generation Laptop, SK hynix PCB01 HFS001TFM9X186N, OLED, 3840x2400, 16" | Dell Precision 5690 Ultra 9 185H, RTX 5000 Ada Generation Laptop, 2x Samsung PM9A1 1TB (RAID 0), OLED, 3840x2400, 16" | |
|---|---|---|---|---|---|---|
| Power Consumption | 2% | -85% | -90% | -279% | -72% | |
| Idle Minimum * (Watt) | 4.1 | 4.6 -12% | 14 -241% | 7.9 -93% | 35.1 -756% | 7.9 -93% |
| Idle Average * (Watt) | 9 | 10 -11% | 22.4 -149% | 13.1 -46% | 39.2 -336% | 12 -33% |
| Idle Maximum * (Watt) | 9.4 | 10.6 -13% | 25.7 -173% | 24.2 -157% | 56 -496% | 28.6 -204% |
| Load Average * (Watt) | 86.7 | 60.9 30% | 90.2 -4% | 127.4 -47% | 130.2 -50% | 98.8 -14% |
| Cyberpunk 2077 ultra external monitor * (Watt) | 102 | 92.8 9% | 120.3 -18% | 219 -115% | 213 -109% | |
| Cyberpunk 2077 ultra * (Watt) | 106.1 | 96.8 9% | 125.4 -18% | 225 -112% | 229 -116% | |
| Load Maximum * (Watt) | 152.9 | 154.8 -1% | 142 7% | 248.5 -63% | 285.2 -87% | 174.8 -14% |
| Witcher 3 ultra * (Watt) | 144.5 |
* ... Moindre est la valeur, meilleures sont les performances
Consommation électrique Cyberpunk / Stress Test
Consommation électrique du moniteur externe
Autonomie de la batterie
L'autonomie du WLAN est excellente (12,5 heures) et dépasse de quelques heures celle de la dernière génération Precision 5690 ou du ZBook Power 16 G11 A.
| HP ZBook X G1i 16 Ultra 7 265H, RTX PRO 2000 Blackwell Generation Laptop, 83 Wh | HP ZBook Power 16 G11 A R7 8845HS, RTX 2000 Ada Generation Laptop, 83 Wh | HP ZBook Studio 16 G11 Ultra 9 185H, RTX 3000 Ada Generation Laptop, 86 Wh | Lenovo ThinkPad P16 Gen 2 i7-14700HX, RTX 4000 Ada Generation Laptop, 94 Wh | Dell Pro Max 16 Plus Ultra 9 285HX, RTX PRO 5000 Blackwell Generation Laptop, 96 Wh | Dell Precision 5690 Ultra 9 185H, RTX 5000 Ada Generation Laptop, 98 Wh | |
|---|---|---|---|---|---|---|
| Autonomie de la batterie | -22% | -62% | -80% | -71% | -26% | |
| WiFi v1.3 (h) | 12.5 | 9.7 -22% | 4.8 -62% | 2.5 -80% | 3.6 -71% | 9.2 -26% |
| Reader / Idle (h) | 26.1 | |||||
| Load (h) | 1.7 |
Notebookcheck Rating
Station de travail mobile de haute qualité et légère avec des performances de milieu de gamme.
HP ZBook X G1i 16
- 10/22/2025 v8
Allen Ngo
 Total Sustainability Score:
 Comparaison avec des concurrents potentiels
Image | Modèle | Prix | Poids | Épaisseur | Écran |
|---|---|---|---|---|---|
1. 87.4%  | HP ZBook X G1i 16 Intel Core Ultra 7 265H ⎘ NVIDIA RTX PRO 2000 Blackwell Generation Laptop ⎘ 64 Go Mémoire, 2048 Go SSD | Amazon: Prix de liste: 2700 USD | 2.2 kg | 23 mm | 16.00" 2560x1600 189 PPI IPS |
2. 85.4%  | HP ZBook Power 16 G11 A AMD Ryzen 7 8845HS ⎘ NVIDIA RTX 2000 Ada Generation Laptop ⎘ 64 Go Mémoire, 2048 Go SSD | Amazon: Prix de liste: 2100 USD | 2.2 kg | 22.9 mm | 16.00" 2560x1600 189 PPI IPS |
3. 84.2%  | HP ZBook Studio 16 G11 Intel Core Ultra 9 185H ⎘ NVIDIA RTX 3000 Ada Generation Laptop ⎘ 64 Go Mémoire, 1024 Go SSD | Amazon: Prix de liste: 4300 USD | 1.8 kg | 19 mm | 16.00" 3840x2400 283 PPI IPS |
4. 85.9%  | Lenovo ThinkPad P16 Gen 2 Intel Core i7-14700HX ⎘ NVIDIA RTX 4000 Ada Generation Laptop ⎘ 32 Go Mémoire, 1024 Go SSD | Amazon: Prix de liste: 3500 USD | 3.1 kg | 30.23 mm | 16.00" 2560x1600 189 PPI IPS |
5. 88.4% 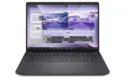 | Dell Pro Max 16 Plus Intel Core Ultra 9 285HX ⎘ NVIDIA RTX PRO 5000 Blackwell Generation Laptop ⎘ 128 Go Mémoire, SSD | Amazon: Prix de liste: 5000 USD | 2.8 kg | 30.9 mm | 16.00" 3840x2400 283 PPI OLED |
6. 88.3% v7 (old)  | Dell Precision 5690 Intel Core Ultra 9 185H ⎘ NVIDIA RTX 5000 Ada Generation Laptop ⎘ 32 Go Mémoire, 2048 Go SSD | Amazon: Prix de liste: 5900 USD | 2.3 kg | 22.17 mm | 16.00" 3840x2400 283 PPI OLED |
Transparency
La sélection des appareils à examiner est effectuée par notre équipe éditoriale. L'échantillon de test a été prêté à l'auteur par le fabricant ou le détaillant pour les besoins de cet examen. Le prêteur n'a pas eu d'influence sur cette évaluation et le fabricant n'a pas reçu de copie de cette évaluation avant sa publication. Il n'y avait aucune obligation de publier cet article. En tant que média indépendant, Notebookcheck n'est pas soumis à l'autorité des fabricants, des détaillants ou des éditeurs.
Voici comment Notebookcheck teste
Chaque année, Notebookcheck examine de manière indépendante des centaines d'ordinateurs portables et de smartphones en utilisant des procédures standardisées afin de garantir que tous les résultats sont comparables. Nous avons continuellement développé nos méthodes de test depuis environ 20 ans et avons établi des normes industrielles dans le processus. Dans nos laboratoires de test, des équipements de mesure de haute qualité sont utilisés par des techniciens et des rédacteurs expérimentés. Ces tests impliquent un processus de validation en plusieurs étapes. Notre système d'évaluation complexe repose sur des centaines de mesures et de points de référence bien fondés, ce qui garantit l'objectivité.
