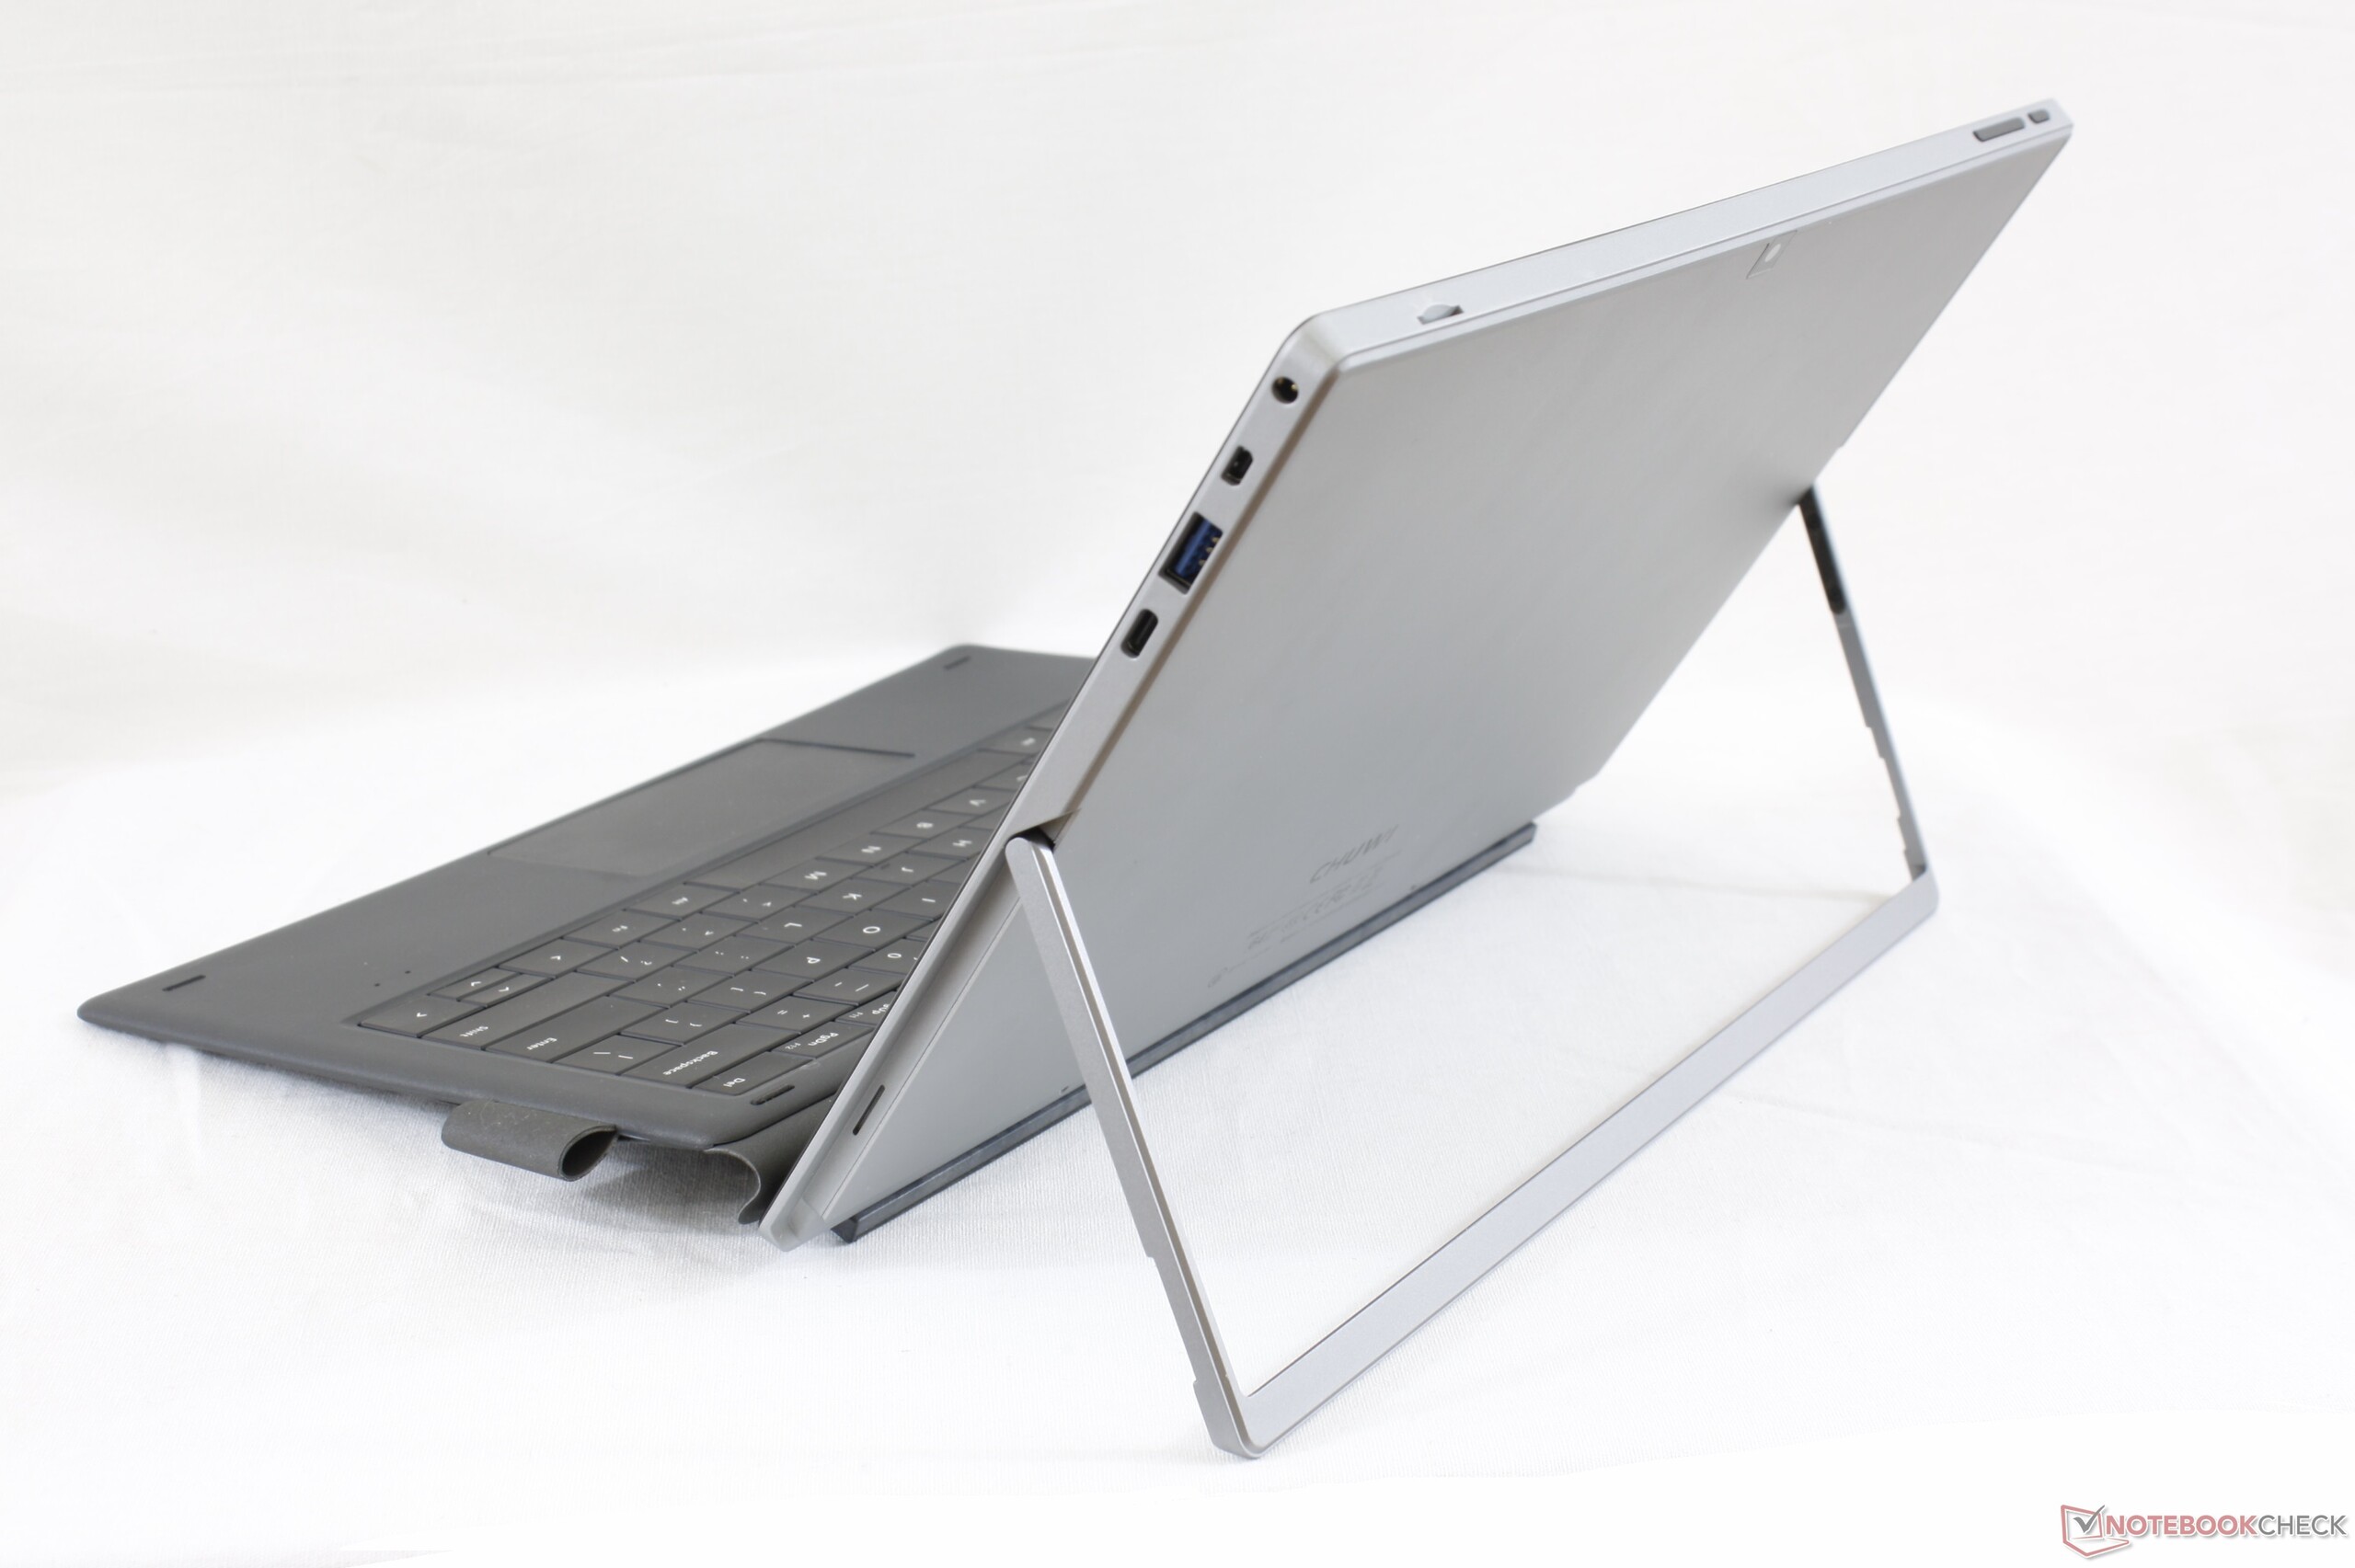
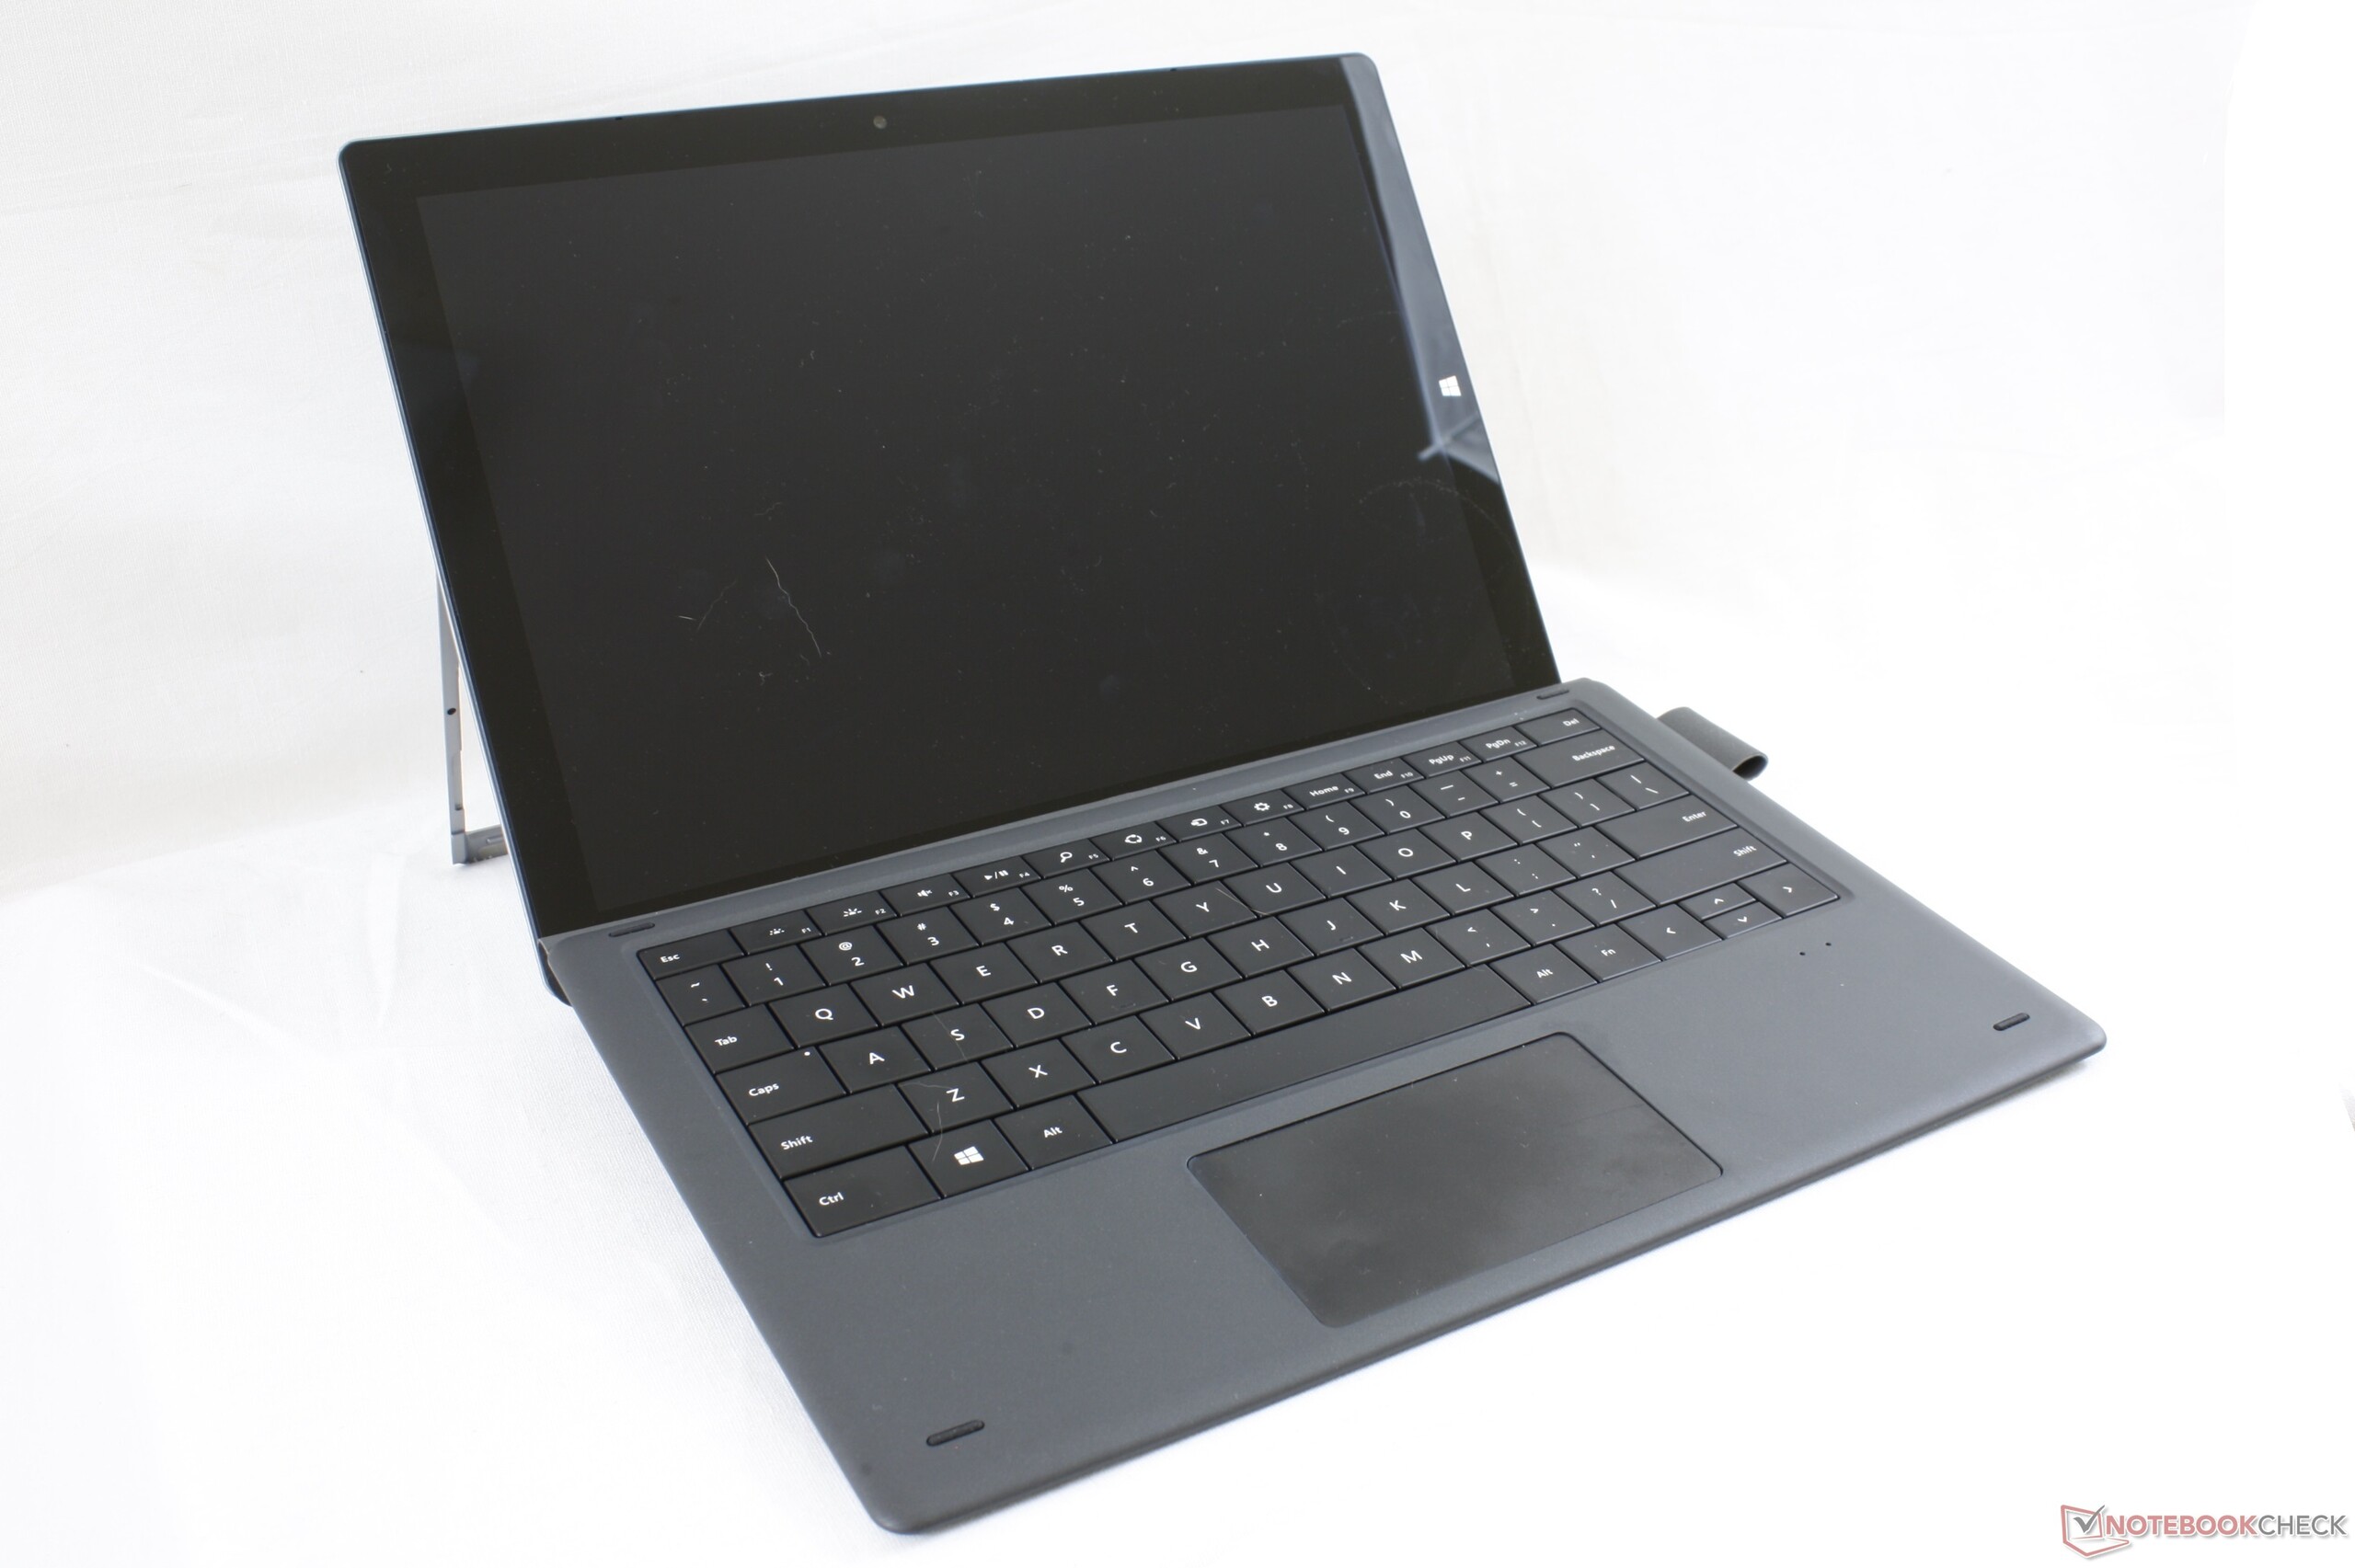
Test de la Chuwi UBook Pro (m3-8100Y, UHD 615, FHD) : la clone de la Microsoft Surface Pro
Note | Date | Modèle | Poids | Épaisseur | Taille | Résolution | Prix |
|---|---|---|---|---|---|---|---|
| 70.1 % v7 (old) | 11/19 | Chuwi UBook Pro m3-8100Y, UHD Graphics 615 | 780 g | 9 mm | 12.30" | 1920x1280 | |
| 87.2 % v7 (old) | 01/19 | Microsoft Surface Pro 6, Core i5, 128 GB i5-8250U, UHD Graphics 620 | 781 g | 8.5 mm | 12.30" | 2736x1834 | |
| 82.2 % v6 (old) | 02/18 | Lenovo Miix 520-12IKB 81CG i5-8250U, UHD Graphics 620 | 1.2 kg | 15.9 mm | 12.20" | 1920x1200 | |
| 87 % v7 (old) | 10/18 | HP Elite x2 1013 G3-2TT14EA i5-8350U, UHD Graphics 620 | 1.2 kg | 7.9 mm | 13.00" | 3000x2000 | |
| 83.3 % v7 (old) | 10/18 | Microsoft Surface Go MHN-00003 Pentium 4415Y, UHD Graphics 615 | 523 g | 8.3 mm | 10.00" | 1800x1200 |
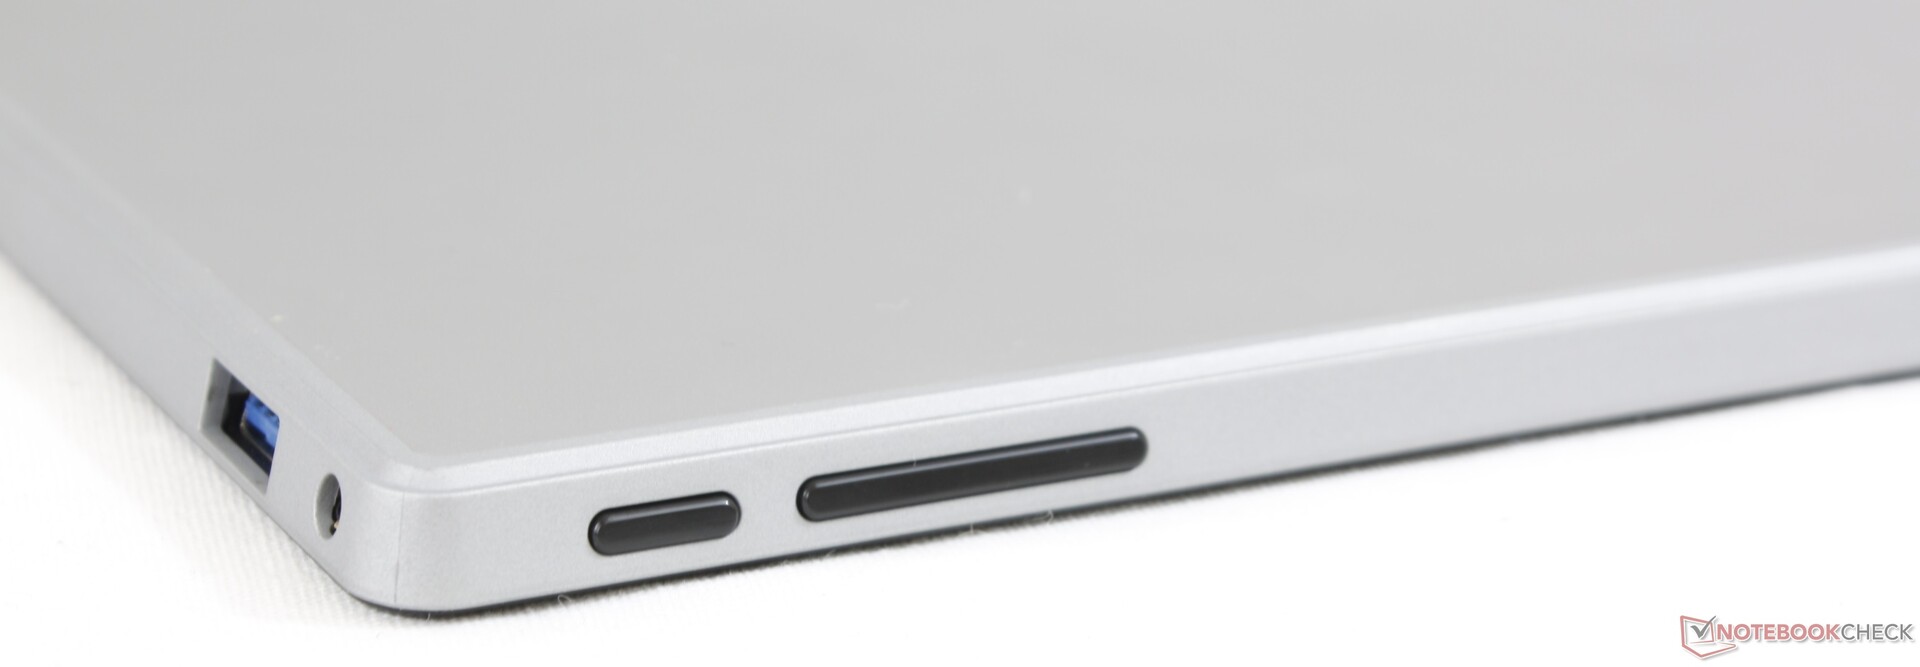
| SD Card Reader | |
| average JPG Copy Test (av. of 3 runs) | |
| Dell Latitude 7200 (Toshiba Exceria Pro M501 64 GB UHS-II) | |
| Lenovo Miix 520-12IKB 81CG | |
| Microsoft Surface Pro 6, Core i5, 128 GB (Toshiba Exceria Pro M501 microSDXC 64GB) | |
| Chuwi UBook Pro (Toshiba Exceria Pro M501 64 GB UHS-II) | |
| maximum AS SSD Seq Read Test (1GB) | |
| Dell Latitude 7200 (Toshiba Exceria Pro M501 64 GB UHS-II) | |
| Lenovo Miix 520-12IKB 81CG | |
| Microsoft Surface Pro 6, Core i5, 128 GB (Toshiba Exceria Pro M501 microSDXC 64GB) | |
| Chuwi UBook Pro (Toshiba Exceria Pro M501 64 GB UHS-II) | |
| |||||||||||||||||||||||||
Homogénéité de la luminosité: 83 %
Valeur mesurée au centre, sur batterie: 867.7 cd/m²
Contraste: 1112:1 (Valeurs des noirs: 0.78 cd/m²)
ΔE ColorChecker Calman: 4.64 | ∀{0.5-29.43 Ø4.73}
calibrated: 2.31
ΔE Greyscale Calman: 6.1 | ∀{0.09-98 Ø4.97}
93.7% sRGB (Argyll 1.6.3 3D)
59% AdobeRGB 1998 (Argyll 1.6.3 3D)
65.1% AdobeRGB 1998 (Argyll 3D)
94% sRGB (Argyll 3D)
63.3% Display P3 (Argyll 3D)
Gamma: 2.22
CCT: 7346 K
| Chuwi UBook Pro BOE TV123WAM-ND0, IPS, 12.3", 1920x1280 | Microsoft Surface Pro 6, Core i5, 128 GB LGPhilips LP123WQ112604, IPS, 12.3", 2736x1834 | Lenovo Miix 520-12IKB 81CG Unknown, IPS, 12.2", 1920x1200 | Dell Latitude 7200 SHP14A3 LQ123N1, IPS LED, 12.3", 1920x1280 | Apple iPad 7 2019 IPS, 10.2", 2160x1620 | HP Elite x2 1013 G3-2TT14EA AU Optronics AUO101A, IPS, 13", 3000x2000 | |
|---|---|---|---|---|---|---|
| Display | 0% | -0% | 10% | 5% | ||
| Display P3 Coverage (%) | 63.3 | 65.5 3% | 64.4 2% | 71.6 13% | 67.5 7% | |
| sRGB Coverage (%) | 94 | 90.4 -4% | 90.8 -3% | 99.5 6% | 96.7 3% | |
| AdobeRGB 1998 Coverage (%) | 65.1 | 65.6 1% | 65.4 0% | 72.6 12% | 68.2 5% | |
| Response Times | -15% | -10% | -50% | 5% | -25% | |
| Response Time Grey 50% / Grey 80% * (ms) | 30.8 ? | 42 ? -36% | 35.6 ? -16% | 52 ? -69% | 38 ? -23% | 47 ? -53% |
| Response Time Black / White * (ms) | 26.8 ? | 25 ? 7% | 28 ? -4% | 34.8 ? -30% | 18 ? 33% | 26 ? 3% |
| PWM Frequency (Hz) | 20800 ? | 198.4 ? | 1645 ? | |||
| Screen | 6% | -28% | 24% | 24% | 3% | |
| Brightness middle (cd/m²) | 867.6 | 463 -47% | 348.8 -60% | 401 -54% | 499 -42% | 452 -48% |
| Brightness (cd/m²) | 818 | 450 -45% | 339 -59% | 385 -53% | 470 -43% | 412 -50% |
| Brightness Distribution (%) | 83 | 83 0% | 87 5% | 88 6% | 87 5% | 85 2% |
| Black Level * (cd/m²) | 0.78 | 0.32 59% | 0.4 49% | 0.28 64% | 0.49 37% | 0.48 38% |
| Contrast (:1) | 1112 | 1447 30% | 872 -22% | 1432 29% | 1018 -8% | 942 -15% |
| Colorchecker dE 2000 * | 4.64 | 3.76 19% | 7 -51% | 1.8 61% | 0.97 79% | 4.05 13% |
| Colorchecker dE 2000 max. * | 9.22 | 7.35 20% | 16.2 -76% | 3.4 63% | 1.98 79% | 6.64 28% |
| Colorchecker dE 2000 calibrated * | 2.31 | 2.68 -16% | 1.1 52% | 1.56 32% | ||
| Greyscale dE 2000 * | 6.1 | 3.18 48% | 10.1 -66% | 1.6 74% | 0.9 85% | 4.87 20% |
| Gamma | 2.22 99% | 2.53 87% | 2.22 99% | 2.14 103% | 2.135 103% | 2.71 81% |
| CCT | 7346 88% | 6994 93% | 9065 72% | 6702 97% | 6571 99% | 7160 91% |
| Color Space (Percent of AdobeRGB 1998) (%) | 59 | 59 0% | 58.7 -1% | 66.6 13% | 62 5% | |
| Color Space (Percent of sRGB) (%) | 93.7 | 90 -4% | 90.9 -3% | 99.4 6% | 97 4% | |
| Moyenne finale (programmes/paramètres) | -3% /
2% | -13% /
-20% | -5% /
12% | 15% /
20% | -6% /
-0% |
* ... Moindre est la valeur, meilleures sont les performances
Temps de réponse de l'écran
| ↔ Temps de réponse noir à blanc | ||
|---|---|---|
| 26.8 ms ... hausse ↗ et chute ↘ combinées | ↗ 15.6 ms hausse | 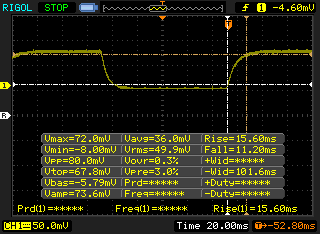 |
| ↘ 11.2 ms chute | ||
| L'écran souffre de latences relativement élevées, insuffisant pour le jeu. En comparaison, tous les appareils testés affichent entre 0.1 (minimum) et 240 (maximum) ms. » 67 % des appareils testés affichent de meilleures performances. Cela signifie que les latences relevées sont moins bonnes que la moyenne (19.9 ms) de tous les appareils testés. | ||
| ↔ Temps de réponse gris 50% à gris 80% | ||
| 30.8 ms ... hausse ↗ et chute ↘ combinées | ↗ 14.8 ms hausse | 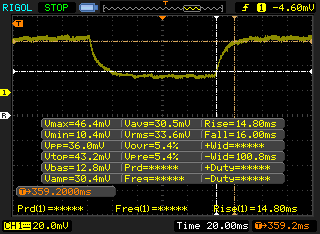 |
| ↘ 16 ms chute | ||
| L'écran souffre de latences très élevées, à éviter pour le jeu. En comparaison, tous les appareils testés affichent entre 0.165 (minimum) et 636 (maximum) ms. » 41 % des appareils testés affichent de meilleures performances. Cela signifie que les latences relevées sont similaires à la moyenne (31.1 ms) de tous les appareils testés. | ||
Scintillement / MLI (Modulation de largeur d'impulsion)
| Scintillement / MLI (Modulation de largeur d'impulsion) non décelé | 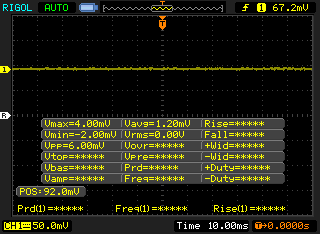 | ||
En comparaison, 52 % des appareils testés n'emploient pas MDI pour assombrir leur écran. Nous avons relevé une moyenne à 7798 (minimum : 5 - maximum : 343500) Hz dans le cas où une MDI était active. | |||
| wPrime 2.10 - 1024m | |
| Chuwi HeroBook 14 | |
| Microsoft Surface Go MHN-00003 | |
| Chuwi LapBook Plus | |
| Moyenne Intel Core m3-8100Y (n=1) | |
| Dell XPS 13 7390 2-in-1 Core i3 | |
* ... Moindre est la valeur, meilleures sont les performances
| PCMark 8 Home Score Accelerated v2 | 2209 points | |
| PCMark 8 Work Score Accelerated v2 | 3700 points | |
| PCMark 10 Score | 2341 points | |
Aide | ||
| Chuwi UBook Pro Netac SSD 256GB | Microsoft Surface Pro 6, Core i5, 128 GB Toshiba KBG30ZPZ128G | Lenovo Miix 520-12IKB 81CG Samsung PM961 MZVLW256HEHP | Dell Latitude 7200 WDC PC SN520 SDAPNUW-512G | HP Elite x2 1013 G3-2TT14EA Samsung PM961 MZVLW256HEHP | |
|---|---|---|---|---|---|
| AS SSD | -21% | 206% | 344% | 232% | |
| Seq Read (MB/s) | 246.8 | 1114 351% | 1523 517% | 1294 424% | 2062 735% |
| Seq Write (MB/s) | 147.2 | 340 131% | 1182 703% | 856 482% | 832 465% |
| 4K Read (MB/s) | 21.63 | 40.46 87% | 48.69 125% | 42.52 97% | 41.45 92% |
| 4K Write (MB/s) | 71.1 | 80.6 13% | 107.9 52% | 141 98% | 91.1 28% |
| 4K-64 Read (MB/s) | 166.3 | 277.9 67% | 999 501% | 983 491% | 669 302% |
| 4K-64 Write (MB/s) | 171 | 129.3 -24% | 345.5 102% | 1183 592% | 596 249% |
| Access Time Read * (ms) | 0.084 | 0.913 -987% | 0.49 -483% | 0.057 32% | 0.063 25% |
| Access Time Write * (ms) | 0.374 | 0.301 20% | 0.33 12% | 0.026 93% | 0.041 89% |
| Score Read (Points) | 213 | 430 102% | 1200 463% | 1155 442% | 917 331% |
| Score Write (Points) | 257 | 244 -5% | 572 123% | 1410 449% | 770 200% |
| Score Total (Points) | 582 | 870 49% | 2378 309% | 3142 440% | 2105 262% |
| Copy ISO MB/s (MB/s) | 233.9 | 128.1 -45% | 659 182% | 1387 493% | 761 225% |
| Copy Program MB/s (MB/s) | 101.1 | 94 -7% | 310.4 207% | 449.5 345% | 237.3 135% |
| Copy Game MB/s (MB/s) | 243.6 | 124.4 -49% | 410.8 69% | 1059 335% | 512 110% |
* ... Moindre est la valeur, meilleures sont les performances

| 3DMark 11 Performance | 893 points | |
| 3DMark Cloud Gate Standard Score | 3490 points | |
| 3DMark Fire Strike Score | 509 points | |
Aide | ||
| Bas | Moyen | Élevé | Ultra | |
|---|---|---|---|---|
| BioShock Infinite (2013) | 27.5 | 15.8 | 13.3 | 4.4 |
(+) La température maximale du côté supérieur est de 37.6 °C / 100 F, par rapport à la moyenne de 33.6 °C / 92 F, allant de 20.7 à 53.2 °C pour la classe Tablet.
(+) Le fond chauffe jusqu'à un maximum de 38.6 °C / 101 F, contre une moyenne de 33.2 °C / 92 F
(+) En utilisation inactive, la température moyenne du côté supérieur est de 27.2 °C / 81 F, par rapport à la moyenne du dispositif de 30 °C / 86 F.
Chuwi UBook Pro analyse audio
(-) | haut-parleurs pas très forts (67.8 dB)
Basses 100 - 315 Hz
(±) | basse réduite - en moyenne 14.4% inférieure à la médiane
(±) | la linéarité des basses est moyenne (8.4% delta à la fréquence précédente)
Médiums 400 - 2000 Hz
(±) | médiane supérieure - en moyenne 5.4% supérieure à la médiane
(-) | les médiums ne sont pas linéaires (15.1% delta à la fréquence précédente)
Aiguës 2 - 16 kHz
(±) | sommets plus élevés - en moyenne 5% plus élevés que la médiane
(-) | les aigus ne sont pas linéaires (15.2% delta à la fréquence précédente)
Globalement 100 - 16 000 Hz
(-) | le son global n'est pas linéaire (40% de différence à la médiane)
Par rapport à la même classe
» 98% de tous les appareils testés de cette catégorie étaient meilleurs, 0% similaires, 2% pires
» Le meilleur avait un delta de 7%, la moyenne était de 20%, le pire était de 129%.
Par rapport à tous les appareils testés
» 95% de tous les appareils testés étaient meilleurs, 0% similaires, 5% pires
» Le meilleur avait un delta de 4%, la moyenne était de 24%, le pire était de 134%.
Apple MacBook 12 (Early 2016) 1.1 GHz analyse audio
(+) | les haut-parleurs peuvent jouer relativement fort (83.6# dB)
Basses 100 - 315 Hz
(±) | basse réduite - en moyenne 11.3% inférieure à la médiane
(±) | la linéarité des basses est moyenne (14.2% delta à la fréquence précédente)
Médiums 400 - 2000 Hz
(+) | médiane équilibrée - seulement 2.4% de la médiane
(+) | les médiums sont linéaires (5.5% delta à la fréquence précédente)
Aiguës 2 - 16 kHz
(+) | des sommets équilibrés - à seulement 2% de la médiane
(+) | les aigus sont linéaires (4.5% delta à la fréquence précédente)
Globalement 100 - 16 000 Hz
(+) | le son global est linéaire (10.2% différence à la médiane)
Par rapport à la même classe
» 7% de tous les appareils testés de cette catégorie étaient meilleurs, 2% similaires, 91% pires
» Le meilleur avait un delta de 5%, la moyenne était de 18%, le pire était de 53%.
Par rapport à tous les appareils testés
» 5% de tous les appareils testés étaient meilleurs, 1% similaires, 94% pires
» Le meilleur avait un delta de 4%, la moyenne était de 24%, le pire était de 134%.
| Éteint/en veille | |
| Au repos | |
| Fortement sollicité |
|
Légende:
min: | |
| Chuwi UBook Pro m3-8100Y, UHD Graphics 615, Netac SSD 256GB, IPS, 1920x1280, 12.3" | Microsoft Surface Pro 6, Core i5, 128 GB i5-8250U, UHD Graphics 620, Toshiba KBG30ZPZ128G, IPS, 2736x1834, 12.3" | Lenovo Miix 520-12IKB 81CG i5-8250U, UHD Graphics 620, Samsung PM961 MZVLW256HEHP, IPS, 1920x1200, 12.2" | Dell Latitude 7200 i5-8365U, UHD Graphics 620, WDC PC SN520 SDAPNUW-512G, IPS LED, 1920x1280, 12.3" | Apple iPad 7 2019 A10 Fusion, A10 Fusion GPU, 128 GB NVMe, IPS, 2160x1620, 10.2" | HP Elite x2 1013 G3-2TT14EA i5-8350U, UHD Graphics 620, Samsung PM961 MZVLW256HEHP, IPS, 3000x2000, 13" | |
|---|---|---|---|---|---|---|
| Power Consumption | 0% | -22% | -11% | 45% | -12% | |
| Idle Minimum * (Watt) | 5.4 | 4.3 20% | 5.5 -2% | 3.3 39% | 2.2 59% | 4.9 9% |
| Idle Average * (Watt) | 11.2 | 8.7 22% | 8.3 26% | 5.8 48% | 6.7 40% | 8.9 21% |
| Idle Maximum * (Watt) | 12.5 | 9.4 25% | 11.5 8% | 6.5 48% | 8.2 34% | 11 12% |
| Load Average * (Watt) | 19.5 | 24.5 -26% | 38.3 -96% | 37 -90% | 11.3 42% | 32 -64% |
| Load Maximum * (Watt) | 25.9 | 36 -39% | 37.7 -46% | 51.3 -98% | 12.5 52% | 36 -39% |
* ... Moindre est la valeur, meilleures sont les performances
| Chuwi UBook Pro m3-8100Y, UHD Graphics 615, 38 Wh | Microsoft Surface Pro 6, Core i5, 128 GB i5-8250U, UHD Graphics 620, 45 Wh | Lenovo Miix 520-12IKB 81CG i5-8250U, UHD Graphics 620, 38 Wh | Dell Latitude 7200 i5-8365U, UHD Graphics 620, 38 Wh | Apple iPad 7 2019 A10 Fusion, A10 Fusion GPU, 32.4 Wh | HP Elite x2 1013 G3-2TT14EA i5-8350U, UHD Graphics 620, 50 Wh | |
|---|---|---|---|---|---|---|
| Autonomie de la batterie | 65% | 2% | 27% | 115% | 40% | |
| WiFi v1.3 (h) | 5.5 | 9.1 65% | 5.6 2% | 7 27% | 11.8 115% | 7.7 40% |
| Reader / Idle (h) | 17.8 | 12.3 | 24.8 | 13 | ||
| Load (h) | 2 | 1.1 | 1.8 | 3.3 | 2.3 |
Points positifs
Points négatifs
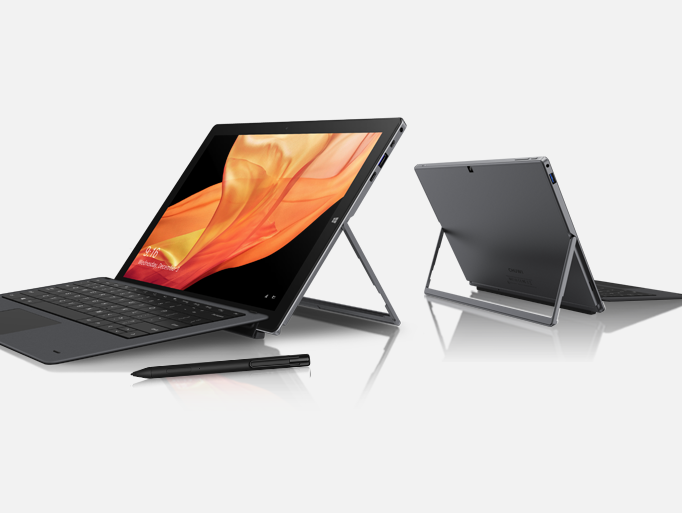
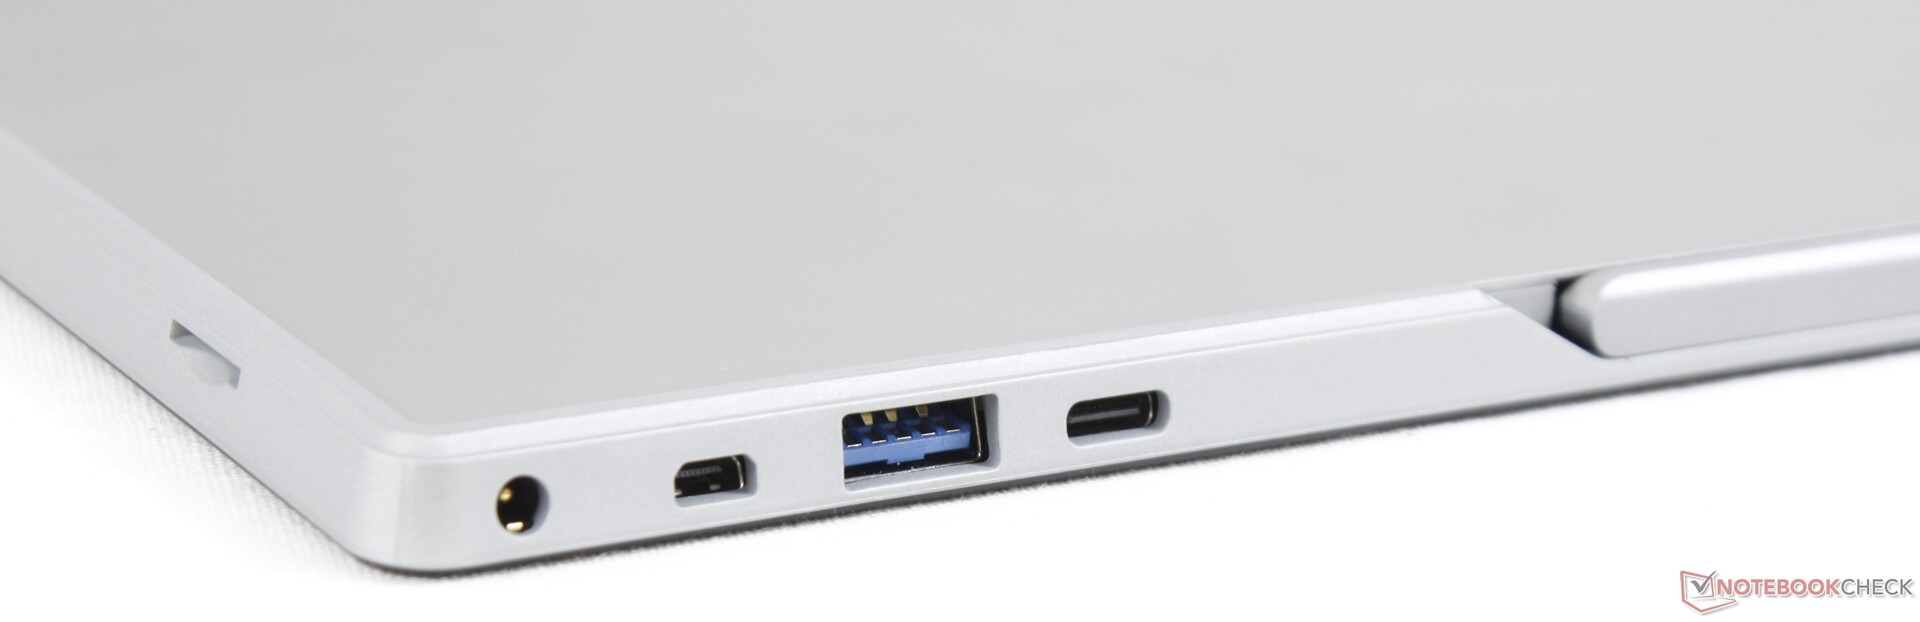
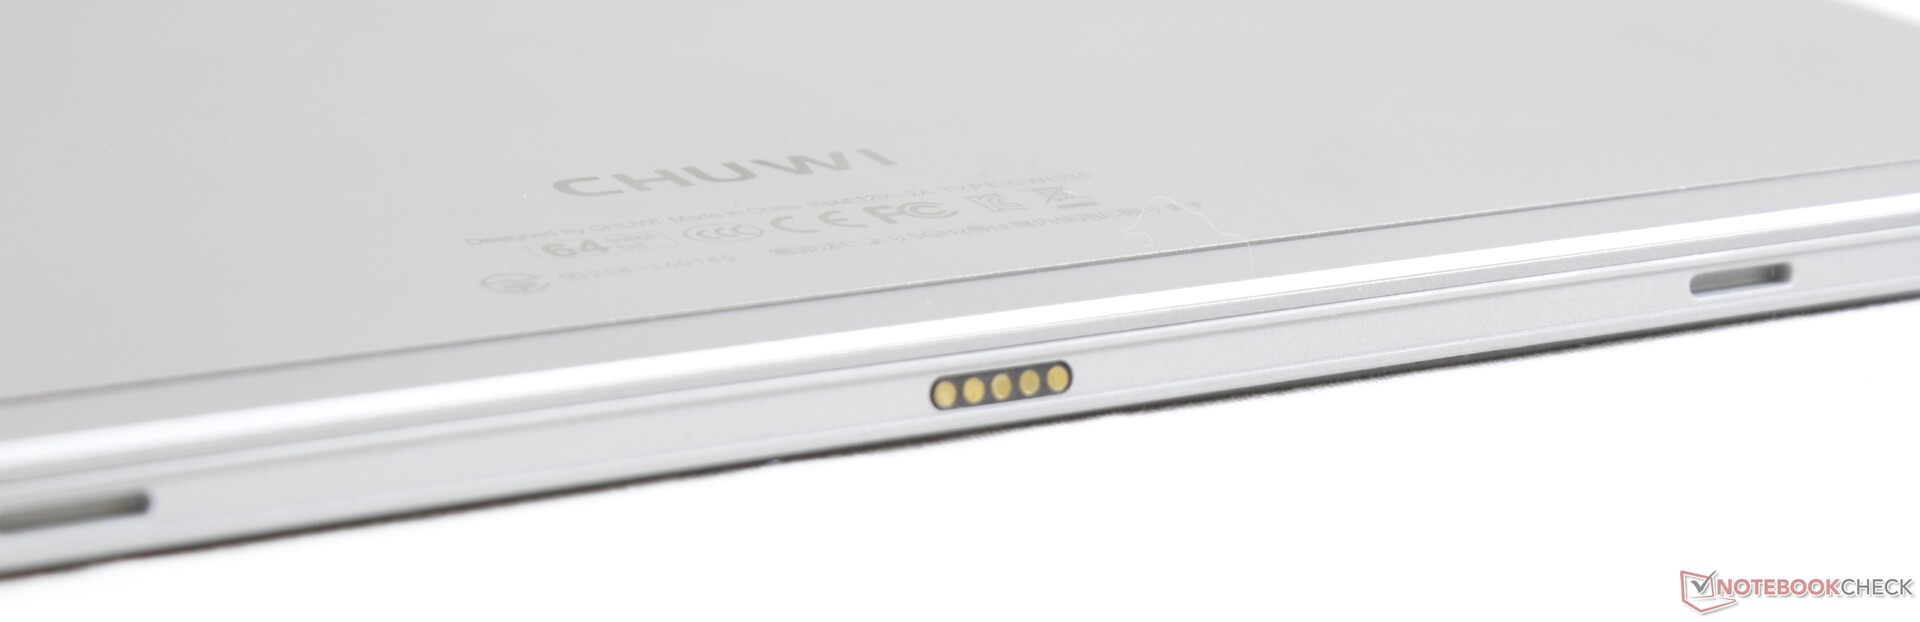
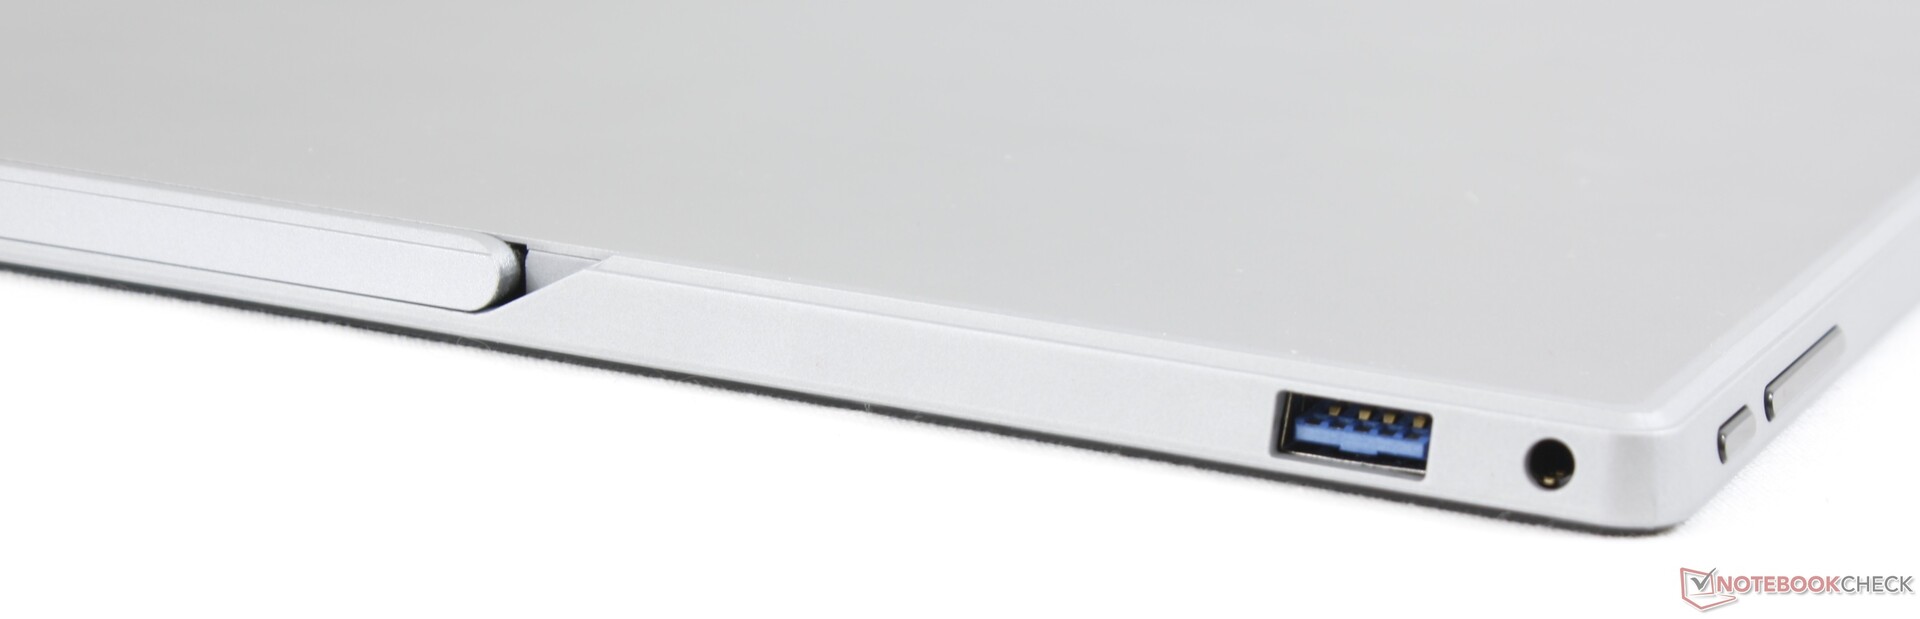
L’UBook Pro fait mieux que la Surface Pro dans deux domaines-clés : la luminosité d’écran et les ports. Il est à la fois plus facile de l’utiliser à l’extérieur et moins nécessaire d’utiliser des stations d’accueil, puisqu’elle intègre plus de ports que n’importe quelle tablette Surface.
Mais passés ces deux avantages, l’UBook Pro est une tablette Windows médiocre. Son processeur Core m3 est notablement plus lent que les Core i5 ou i7 de la Surface Pro, et son clavier amovible est moins bon que celui de Windows, à la fois en ce qui concerne la qualité et le retour des touches - on sera mieux servi avec une Surface si l’on rédige beaucoup. Pour un peu de navigation web et de traitement de texte, l’UBook Pro peut cependant s’avérer suffisante, surtout à ce niveau de prix.
Une tablette Windows avec un écran plus lumineux et plus de ports que la Surface Pro, pour des centaines d’Euros de moins. Les gros défauts de la machine sont son manque de puissance et le retour peu réussi des touches du clavier, qui ne devrait cependant pas trop gêner la web et l’emailing occasionnel.
L’intégralité de cette critique est disponible en anglais en suivant ce lien.
Chuwi UBook Pro
- 11/14/2019 v7 (old)
Allen Ngo
Price comparison
