Critiques du AMD Ryzen 3 3200U processeur
Test du HP 255 G7 : de multiples faiblesses, aucun point fort
Le HP 255 G7 propose un APU Ryzen 3, 8 Go de RAM, un lecteur DVD et un SSD NVMe de 512 Go. Windows 10 Pro fait office de système d'exploitation. En outre, l'écran intégré déçoit à tous les égards.
AMD Ryzen 3 3200U, Vega 3, 15.6", 1.8 kgTest de l'Asus Vivobook 15 F512DA (Ryzen 3, RX Vega 3, FHD) : bon processeur à petit prix
Peut-on avoir un bon PC portable pour seulement quelques centaines d’euros ? L’Asus VivoBook 15 d’entrée de gamme, avec un processeur AMD Ryzen 3 3200U est vendu pour 100 € de moins que la version Intel Core i3, sans être vraiment moins puissante.
AMD Ryzen 3 3200U, Vega 3, 15.6", 1.8 kgTest de l'Asus M509DA (Ryzen 3 3200U, RX Vega 3, FHD) : portable Ryzen 3 au Wifi en retrait
Avec le M509DA, Asus propose un portable de 15,6 pouces qui marque des points avec son SSD NVMe de bonne taille, de bonnes performances, et une chauffe réduite. Mais l’écran peu lumineux, au faible contraste, et aux angles de vision réduits, n’est pas emballant.
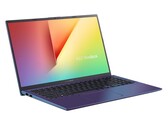
AMD Ryzen 3 3200U, Vega 3, 15.6", 1.8 kgAsus Vivobook 15 F512DA-SH31: AMD Radeon RX Vega 3, 15.60", 1.8 kg
Autres tests » Asus Vivobook 15 F512DA-SH31
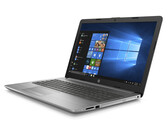
HP 15s-eq0803ng: AMD Radeon RX Vega 3, 15.60", 1.7 kg
Autres tests » HP 15s-eq0803ng
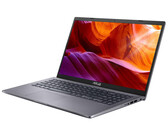
Asus M509DA-BR241: AMD Radeon RX Vega 3, 15.60", 1.9 kg
Autres tests » Asus M509DA-BR241
Lenovo Ideapad S340-14API-81NB00D4SP: AMD Radeon RX Vega 3, 14.00", 1.6 kg
Autres tests » Lenovo Ideapad S340-14API-81NB00D4SP
Asus VivoBook 15 S512DA-BR658T: AMD Radeon RX Vega 3, 15.60"
Autres tests » Asus VivoBook 15 S512DA-BR658T
Lenovo Ideapad C340-14API 81N600A8GE: AMD Radeon RX Vega 3, 14.00", 1.7 kg
Autres tests » Lenovo Ideapad C340-14API 81N600A8GE
Lenovo V155-15API-81V50004SP: AMD Radeon RX Vega 3, 15.60", 2.2 kg
Autres tests » Lenovo V155-15API-81V50004SP
Asus VivoBook D509DA-EJ102T: AMD Radeon RX Vega 3, 15.60", 1.8 kg
Autres tests » Asus VivoBook D509DA-EJ102T
Lenovo Ideapad S340-15API-81NC007QSP: AMD Radeon RX Vega 3, 15.60", 1.8 kg
Autres tests » Lenovo Ideapad S340-15API-81NC007QSP
Lenovo Ideapad S145-15API-81UT00DYMB: AMD Radeon RX Vega 3, 15.60", 1.9 kg
Autres tests » Lenovo Ideapad S145-15API-81UT00DYMB
HP 15-db1000ng: AMD Radeon RX Vega 3, 15.60", 1.9 kg
Autres tests » HP 15-db1000ng
Asus M509DA-BR151: AMD Radeon RX Vega 3, 15.60", 1.9 kg
Autres tests » Asus M509DA-BR151
Asus VivoBook 14 D409DA, Ryzen 3-3200U: AMD Radeon RX Vega 3, 14.00", 1.5 kg
Autres tests » Asus VivoBook 14 D409DA, Ryzen 3-3200U
Acer Aspire 3 A315-42-R1BU: AMD Radeon RX Vega 3, 15.60", 1.9 kg
Autres tests » Acer Aspire 3 A315-42-R1BU
Asus D509DA-BR128: AMD Radeon RX Vega 3, 15.60", 1.9 kg
Autres tests » Asus D509DA-BR128
HP 15-db1002ns: AMD Radeon RX Vega 3, 15.60", 1.8 kg
Autres tests » HP 15-db1002ns
Lenovo Ideapad S340-14API-81NB0045GE: AMD Radeon RX Vega 3, 14.00", 1.7 kg
Autres tests » Lenovo Ideapad S340-14API-81NB0045GE
HP 14-dk0014ns: AMD Radeon RX Vega 3, 14.00", 1.5 kg
Autres tests » HP 14-dk0014ns
Asus VivoBook S512DA-BR608: AMD Radeon RX Vega 3, 15.60", 1.6 kg
Autres tests » Asus VivoBook S512DA-BR608
Acer Swift 3 SF314-41-R4J1: AMD Radeon RX Vega 3, 14.00", 1.5 kg
Autres tests » Acer Swift 3 SF314-41-R4J1
Acer Aspire 5 A515-43-R19L: AMD Radeon RX Vega 3, 15.60", 1.8 kg
Autres tests » Acer Aspire 5 A515-43-R19L
HP 14s-dk0001ax: AMD Radeon RX Vega 3, 14.00", 1.5 kg
Autres tests » HP 14s-dk0001ax
HP 15-db1013ns: AMD Radeon RX Vega 3, 15.60", 1.8 kg
Autres tests » HP 15-db1013ns
HP 15-db1002ng: AMD Radeon RX Vega 3, 15.60", 1.8 kg
Autres tests » HP 15-db1002ng
HP 14-dk0001ns: AMD Radeon RX Vega 3, 14.00", 1.5 kg
Autres tests » HP 14-dk0001ns