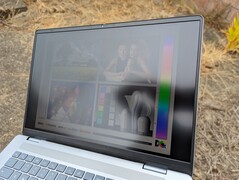
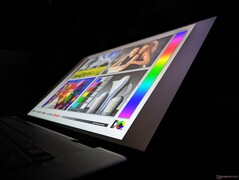
Test du Dell Inspiron 16 Plus 7640 : de petites évolutions importantes
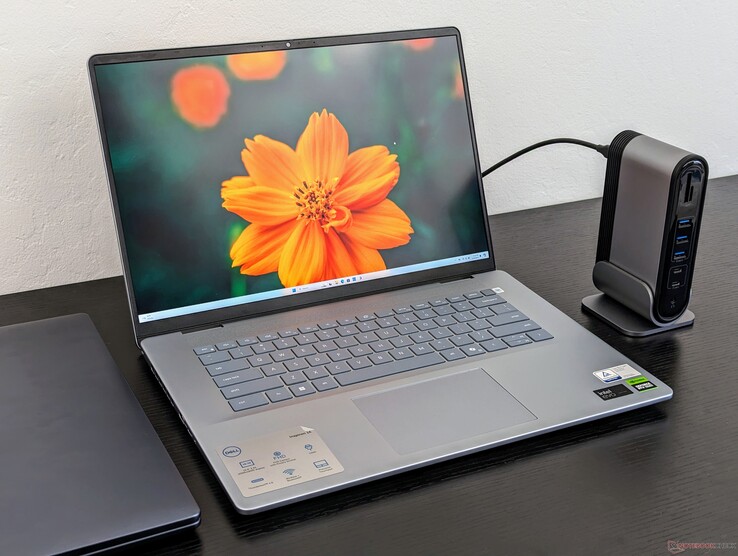
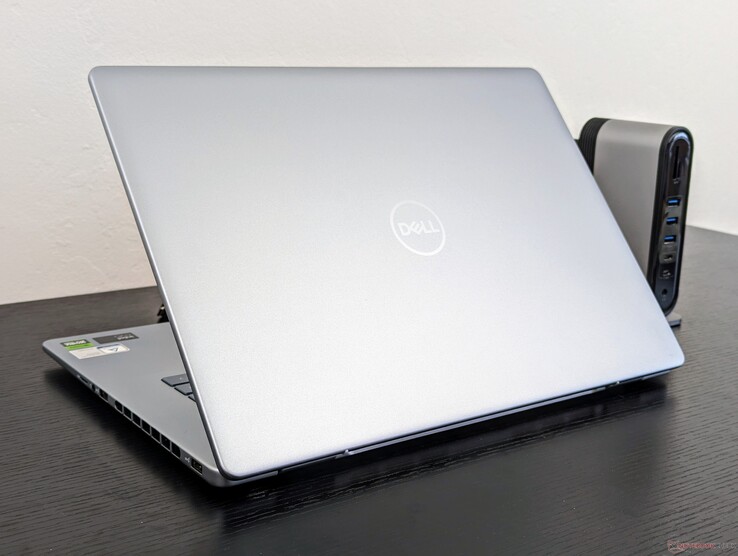
Le bien nommé Inspiron 16 Plus 7640 remplace l'Inspiron 16 Plus 7630 de 2023 avec de nouveaux processeurs AI-ready au lieu des options Raptor Lake-H de l'année dernière. À l'exception de quelques autres changements mineurs à l'intérieur et à l'extérieur, le modèle est largement identique à son prédécesseur et nous vous recommandons donc de consulter notre revue de l'Inspiron 15 Plus 7630 pour en savoir plus sur les caractéristiques physiques de l'Inspiron 15 Plus 7640.
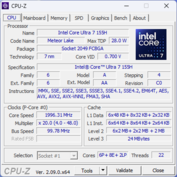
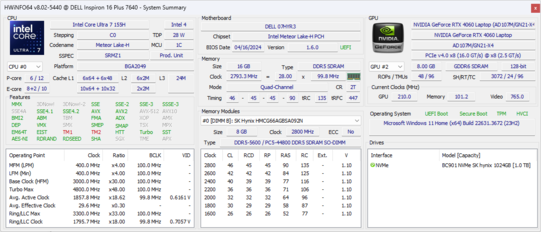
L'Inspiron 16 Plus 7640 est disponible dans de nombreuses configurations allant du Core i7-13620H de 13ème génération au Core Ultra 9 185H de 14ème génération, des cartes graphiques UHD ou Arc intégrées à la RTX 4060 discrète GeForce, et des options d'affichage 1200p ou 1600p. Les SKUs AMD Zen 4 avec les Ryzen 5 8540U ou Ryzen 7 8840U sont également disponibles, mais seulement pour le modèle Inspiron 16 7640 non-Plus, sans carte graphique discrète ni option 1600p. Notre unité de test est une configuration haut de gamme avec le Core Ultra 7 155H, l'écran 1600p et la carte graphique RTX 4060 pour un prix de détail d'environ 1300 $.
Parmi les concurrents, on trouve d'autres ordinateurs portables multimédias de 16 pouces de milieu de gamme, comme le Asus VivoBook Pro 16, Le Lenovo Yoga 7 2-en-1 16IML9ou la série HP Envy 16.
Plus d'avis sur Dell :
Comparaison avec les concurrents potentiels
Note | Date | Modèle | Poids | Épaisseur | Taille | Résolution | Prix |
|---|---|---|---|---|---|---|---|
| 83.4 % | 06/24 | Dell Inspiron 16 Plus 7640 Ultra 7 155H, GeForce RTX 4060 Laptop GPU | 2.2 kg | 19.9 mm | 16.00" | 2560x1600 | |
| 87.1 % v7 (old) | 08/23 | Dell Inspiron 16 Plus 7630 i7-13700H, GeForce RTX 4060 Laptop GPU | 2.2 kg | 19.95 mm | 16.00" | 2560x1600 | |
| 87.4 % v7 (old) | 08/22 | Dell Inspiron 16 Plus 7620 i7-12700H, GeForce RTX 3050 Ti Laptop GPU | 2.1 kg | 18.99 mm | 16.00" | 3072x1920 | |
| 90.4 % v7 (old) | 03/24 | Samsung Galaxy Book4 Ultra Ultra 7 155H, GeForce RTX 4050 Laptop GPU | 1.8 kg | 17 mm | 16.00" | 2880x1800 | |
| 89.1 % v7 (old) | 02/24 | Lenovo Legion 5 16IRX G9 i7-14650HX, GeForce RTX 4060 Laptop GPU | 2.4 kg | 25.2 mm | 16.00" | 2560x1600 | |
| 87.6 % v7 (old) | 11/23 | Asus VivoBook Pro 16 K6602VU i9-13900H, GeForce RTX 4050 Laptop GPU | 1.9 kg | 19 mm | 16.00" | 3200x2000 |
Top 10
» Le Top 10 des PC portables multimédia
» Le Top 10 des PC portables de jeu
» Le Top 10 des PC portables de jeu légers
» Le Top 10 des ordinateurs portables bureautiques
» Le Top 10 des PC portables bureautiques premium/professionnels
» Le Top 10 des Stations de travail mobiles
» Le Top 10 des Ultraportables
» Le Top 10 des Ultrabooks
» Le Top 10 des Convertibles
» Le Top 10 des Tablettes
» Le Top 10 des Tablettes Windows
» Le Top 10 des Smartphones
» Le Top 10 des PC Portables á moins de 300 euros
» Le Top 10 des PC Portables á moins de 500 euros
» Le Top 25 des meilleurs écrans d'ordinateurs
Boîtier - Des évents plus nombreux et plus grands
Le modèle est doté d'une nouvelle touche Co-Pilot dédiée qui remplace la touche Ctrl sur la moitié droite du clavier. La zone du repose-paume est plus plate, le périmètre de la base est plus rond et les grilles d'aération à l'arrière et sur les côtés ont été redessinées pour être plus grandes qu'auparavant. Les matériaux du châssis et les ports restent inchangés pour une première impression et des dimensions similaires.
Lecteur de carte SD
| SD Card Reader | |
| average JPG Copy Test (av. of 3 runs) | |
| Asus VivoBook Pro 16 K6602VU (Angelbird AV Pro V60) | |
| Samsung Galaxy Book4 Ultra (Angelbird AV Pro V60) | |
| Lenovo Legion 5 16IRX G9 | |
| Dell Inspiron 16 Plus 7620 (Toshiba Exceria Pro SDXC 64 GB UHS-II) | |
| Dell Inspiron 16 Plus 7640 (Angelbird AV Pro V60) | |
| Dell Inspiron 16 Plus 7630 (AV Pro SD microSD 128 GB V60) | |
| maximum AS SSD Seq Read Test (1GB) | |
| Asus VivoBook Pro 16 K6602VU (Angelbird AV Pro V60) | |
| Samsung Galaxy Book4 Ultra (Angelbird AV Pro V60) | |
| Lenovo Legion 5 16IRX G9 | |
| Dell Inspiron 16 Plus 7640 (Angelbird AV Pro V60) | |
| Dell Inspiron 16 Plus 7620 (Toshiba Exceria Pro SDXC 64 GB UHS-II) | |
| Dell Inspiron 16 Plus 7630 (AV Pro SD microSD 128 GB V60) | |
Communication
| Networking | |
| iperf3 transmit AXE11000 | |
| Samsung Galaxy Book4 Ultra | |
| Asus VivoBook Pro 16 K6602VU | |
| Lenovo Legion 5 16IRX G9 | |
| Dell Inspiron 16 Plus 7630 | |
| Dell Inspiron 16 Plus 7640 | |
| iperf3 receive AXE11000 | |
| Samsung Galaxy Book4 Ultra | |
| Asus VivoBook Pro 16 K6602VU | |
| Lenovo Legion 5 16IRX G9 | |
| Dell Inspiron 16 Plus 7630 | |
| Dell Inspiron 16 Plus 7640 | |
| iperf3 transmit AXE11000 6GHz | |
| Dell Inspiron 16 Plus 7630 | |
| Asus VivoBook Pro 16 K6602VU | |
| Dell Inspiron 16 Plus 7620 | |
| Dell Inspiron 16 Plus 7640 | |
| iperf3 receive AXE11000 6GHz | |
| Asus VivoBook Pro 16 K6602VU | |
| Dell Inspiron 16 Plus 7630 | |
| Dell Inspiron 16 Plus 7620 | |
| Dell Inspiron 16 Plus 7640 | |
Webcam
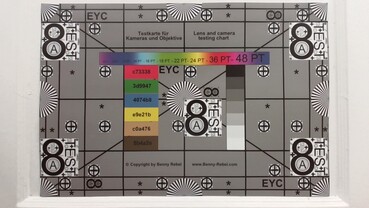
Décrivez la qualité de la webcam, ajoutez des images de mire.
Maintenance
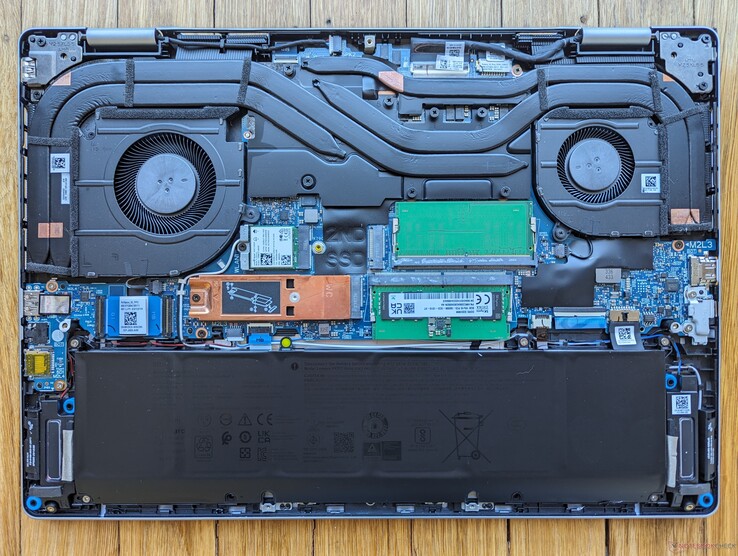
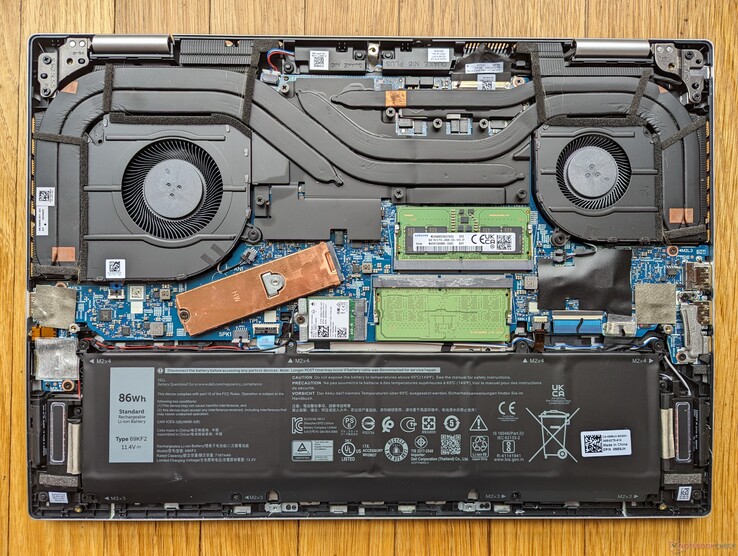
L'ouverture du système montre une différence majeure par rapport à son prédécesseur immédiat : la prise en charge d'un SSD secondaire M.2 2230. Sinon, tout le reste semble être pratiquement identique à l'Inspiron 16 Plus 7630, comme le montrent les images ci-dessous.
Écran - Options FHD+ et QHD
Deux options d'affichage sont disponibles :
- 1920 x 1200, 60 Hz, écran tactile, brillant
- 2560 x 1600, 120 Hz, écran non tactile, mat
Notre unité est livrée avec l'écran en gras ci-dessus. Notez que la page produit officielle de Dell indique à tort 60 Hz pour la dalle 1600p ; nous pouvons confirmer que cette dalle supporte les taux de rafraîchissement natifs de 120 Hz et 48 Hz sans support G-Sync, comme sur l'Inspiron 16 Plus 7630 de l'année dernière.
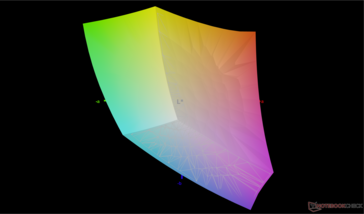
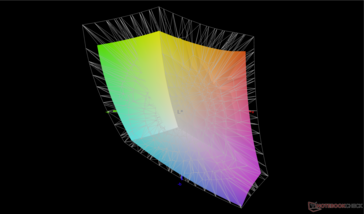
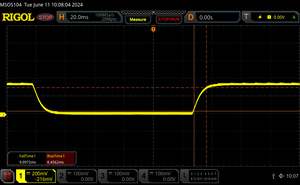
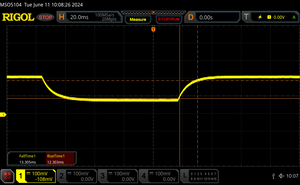
Il est intéressant de noter que Dell a remplacé LG Philips par AU Optronics pour l'Inspiron 16 Plus 7640 de cette année. La nouvelle dalle offre des temps de réponse plus rapides pour minimiser les images fantômes tout en offrant des couleurs sRGB, des niveaux de luminosité et des taux de contraste similaires à ceux de l'année dernière.
| |||||||||||||||||||||||||
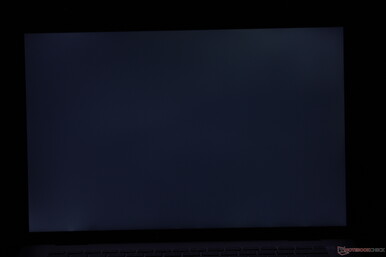
Homogénéité de la luminosité: 89 %
Valeur mesurée au centre, sur batterie: 314.7 cd/m²
Contraste: 1124:1 (Valeurs des noirs: 0.28 cd/m²)
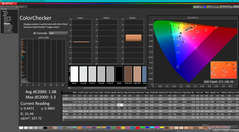
ΔE ColorChecker Calman: 1.62 | ∀{0.5-29.43 Ø4.76}
calibrated: 1.08
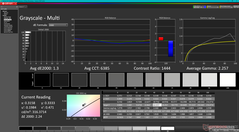
ΔE Greyscale Calman: 1.3 | ∀{0.09-98 Ø5}
76.7% AdobeRGB 1998 (Argyll 3D)
99.8% sRGB (Argyll 3D)
76% Display P3 (Argyll 3D)
Gamma: 2.26
CCT: 6385 K
| Dell Inspiron 16 Plus 7640 AU Optronics B160QAN, IPS, 2560x1600, 16" | Dell Inspiron 16 Plus 7630 LG Philips 160WQ2, IPS, 2560x1600, 16" | Dell Inspiron 16 Plus 7620 BOE NE16N41, IPS, 3072x1920, 16" | Samsung Galaxy Book4 Ultra ATNA60CL07-0, OLED, 2880x1800, 16" | Lenovo Legion 5 16IRX G9 NE160QDM-NZ3, IPS, 2560x1600, 16" | Asus VivoBook Pro 16 K6602VU Samsung ATNA60BX01-1, OLED, 3200x2000, 16" | |
|---|---|---|---|---|---|---|
| Display | -5% | -4% | 15% | -3% | 19% | |
| Display P3 Coverage (%) | 76 | 70.1 -8% | 70.8 -7% | 98.6 30% | 72.4 -5% | 98.7 30% |
| sRGB Coverage (%) | 99.8 | 99.6 0% | 99.5 0% | 99.9 0% | 100 0% | 99.7 0% |
| AdobeRGB 1998 Coverage (%) | 76.7 | 72.3 -6% | 73.2 -5% | 88.5 15% | 74.1 -3% | 96.5 26% |
| Response Times | -37% | -54% | 97% | 51% | 61% | |
| Response Time Grey 50% / Grey 80% * (ms) | 25.6 ? | 35 ? -37% | 38 ? -48% | 0.54 ? 98% | 12.5 ? 51% | 0.68 ? 97% |
| Response Time Black / White * (ms) | 17.6 ? | 24.2 ? -37% | 28 ? -59% | 0.69 ? 96% | 8.7 ? 51% | 13.2 ? 25% |
| PWM Frequency (Hz) | 240 ? | 240 ? | ||||
| Screen | -57% | -2% | 5% | 25% | -68% | |
| Brightness middle (cd/m²) | 314.7 | 299.4 -5% | 288.9 -8% | 390 24% | 526 67% | 353 12% |
| Brightness (cd/m²) | 291 | 290 0% | 276 -5% | 393 35% | 500 72% | 354 22% |
| Brightness Distribution (%) | 89 | 92 3% | 92 3% | 98 10% | 87 -2% | 98 10% |
| Black Level * (cd/m²) | 0.28 | 0.21 25% | 0.26 7% | 0.33 -18% | ||
| Contrast (:1) | 1124 | 1426 27% | 1111 -1% | 1594 42% | ||
| Colorchecker dE 2000 * | 1.62 | 4.25 -162% | 1.88 -16% | 1.4 14% | 1.2 26% | 4.23 -161% |
| Colorchecker dE 2000 max. * | 2.94 | 6.71 -128% | 4.37 -49% | 2.7 8% | 2.1 29% | 7.13 -143% |
| Colorchecker dE 2000 calibrated * | 1.08 | 0.52 52% | 0.42 61% | 1 7% | 2.42 -124% | |
| Greyscale dE 2000 * | 1.3 | 5.5 -323% | 1.4 -8% | 2.1 -62% | 1.3 -0% | 2.5 -92% |
| Gamma | 2.26 97% | 2.35 94% | 2.3 96% | 2.27 97% | 2.23 99% | 2.4 92% |
| CCT | 6385 102% | 6368 102% | 6634 98% | 6431 101% | 6391 102% | 6642 98% |
| Moyenne finale (programmes/paramètres) | -33% /
-43% | -20% /
-10% | 39% /
24% | 24% /
23% | 4% /
-25% |
* ... Moindre est la valeur, meilleures sont les performances
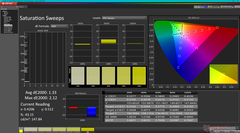
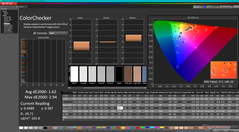
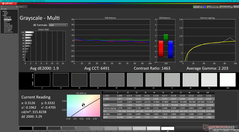
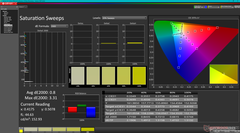
L'écran est bien calibré dès sa sortie de l'emballage, ce qui est surprenant étant donné que la série Inspiron est généralement plus économique et moins axée sur la précision des couleurs que la série XPS, plus haut de gamme. Si nous essayons de calibrer l'écran nous-mêmes, nous n'obtiendrons que de légères améliorations des valeurs deltaE moyennes, comme le montrent les captures d'écran ci-dessous. Un étalonnage par l'utilisateur final n'est donc pas nécessaire pour la plupart des utilisateurs.
Temps de réponse de l'écran
| ↔ Temps de réponse noir à blanc | ||
|---|---|---|
| 17.6 ms ... hausse ↗ et chute ↘ combinées | ↗ 8.5 ms hausse | |
| ↘ 9.1 ms chute | ||
| L'écran montre de bons temps de réponse, mais insuffisant pour du jeu compétitif. En comparaison, tous les appareils testés affichent entre 0.1 (minimum) et 240 (maximum) ms. » 39 % des appareils testés affichent de meilleures performances. Cela signifie que les latences relevées sont meilleures que la moyenne (20.1 ms) de tous les appareils testés. | ||
| ↔ Temps de réponse gris 50% à gris 80% | ||
| 25.6 ms ... hausse ↗ et chute ↘ combinées | ↗ 12.3 ms hausse | |
| ↘ 13.3 ms chute | ||
| L'écran souffre de latences relativement élevées, insuffisant pour le jeu. En comparaison, tous les appareils testés affichent entre 0.165 (minimum) et 636 (maximum) ms. » 35 % des appareils testés affichent de meilleures performances. Cela signifie que les latences relevées sont meilleures que la moyenne (31.5 ms) de tous les appareils testés. | ||
Scintillement / MLI (Modulation de largeur d'impulsion)
| Scintillement / MLI (Modulation de largeur d'impulsion) non décelé | |||
En comparaison, 53 % des appareils testés n'emploient pas MDI pour assombrir leur écran. Nous avons relevé une moyenne à 8023 (minimum : 5 - maximum : 343500) Hz dans le cas où une MDI était active. | |||
Performance - Prêt pour l'IA
Conditions d'essai
Nous avons réglé Windows sur le mode Performance avant d'effectuer les tests ci-dessous.
Processeur
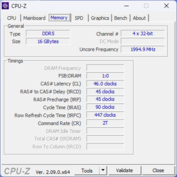
Notre Core Ultra 7 155H sont excellentes, avec des résultats multithreads de 15 à 20 % plus rapides que ceux d'autres ordinateurs portables équipés du même processeur. Par rapport au Core i7-13700H de l'Inspiron 16 Plus 7630 de l'année dernière, le nouveau processeur n'est qu'environ 10 % plus rapide, ce qui passe inaperçu pour la grande majorité des tâches. En fait, l'ancien processeur semble avoir un léger avantage lorsqu'il s'agit de charges de travail à un seul fil.
Bien sûr, la carte maîtresse du Core Ultra 7 155H réside dans son NPU intégré, qui devrait s'avérer utile pour les tâches accélérées par l'IA lorsqu'elles seront plus facilement disponibles. Sinon, son utilité est extrêmement limitée à l'heure où nous écrivons ces lignes.
Cinebench R15 Multi Loop
Cinebench R23: Multi Core | Single Core
Cinebench R20: CPU (Multi Core) | CPU (Single Core)
Cinebench R15: CPU Multi 64Bit | CPU Single 64Bit
Blender: v2.79 BMW27 CPU
7-Zip 18.03: 7z b 4 | 7z b 4 -mmt1
Geekbench 6.5: Multi-Core | Single-Core
Geekbench 5.5: Multi-Core | Single-Core
HWBOT x265 Benchmark v2.2: 4k Preset
LibreOffice : 20 Documents To PDF
R Benchmark 2.5: Overall mean
* ... Moindre est la valeur, meilleures sont les performances
AIDA64: FP32 Ray-Trace | FPU Julia | CPU SHA3 | CPU Queen | FPU SinJulia | FPU Mandel | CPU AES | CPU ZLib | FP64 Ray-Trace | CPU PhotoWorxx
| Performance rating | |
| Lenovo Legion 5 16IRX G9 | |
| Asus VivoBook Pro 16 K6602VU | |
| Samsung Galaxy Book4 Ultra | |
| Dell Inspiron 16 Plus 7640 | |
| Moyenne Intel Core Ultra 7 155H | |
| Dell Inspiron 16 Plus 7630 | |
| Dell Inspiron 16 Plus 7620 | |
| AIDA64 / FP32 Ray-Trace | |
| Lenovo Legion 5 16IRX G9 | |
| Dell Inspiron 16 Plus 7640 | |
| Dell Inspiron 16 Plus 7630 | |
| Asus VivoBook Pro 16 K6602VU | |
| Samsung Galaxy Book4 Ultra | |
| Moyenne Intel Core Ultra 7 155H (6670 - 18470, n=50) | |
| Dell Inspiron 16 Plus 7620 | |
| AIDA64 / FPU Julia | |
| Lenovo Legion 5 16IRX G9 | |
| Asus VivoBook Pro 16 K6602VU | |
| Samsung Galaxy Book4 Ultra | |
| Dell Inspiron 16 Plus 7640 | |
| Moyenne Intel Core Ultra 7 155H (40905 - 93181, n=50) | |
| Dell Inspiron 16 Plus 7630 | |
| Dell Inspiron 16 Plus 7620 | |
| AIDA64 / CPU SHA3 | |
| Lenovo Legion 5 16IRX G9 | |
| Dell Inspiron 16 Plus 7640 | |
| Asus VivoBook Pro 16 K6602VU | |
| Samsung Galaxy Book4 Ultra | |
| Moyenne Intel Core Ultra 7 155H (1940 - 4436, n=50) | |
| Dell Inspiron 16 Plus 7630 | |
| Dell Inspiron 16 Plus 7620 | |
| AIDA64 / CPU Queen | |
| Dell Inspiron 16 Plus 7630 | |
| Lenovo Legion 5 16IRX G9 | |
| Asus VivoBook Pro 16 K6602VU | |
| Dell Inspiron 16 Plus 7620 | |
| Dell Inspiron 16 Plus 7640 | |
| Samsung Galaxy Book4 Ultra | |
| Moyenne Intel Core Ultra 7 155H (64698 - 94181, n=50) | |
| AIDA64 / FPU SinJulia | |
| Lenovo Legion 5 16IRX G9 | |
| Dell Inspiron 16 Plus 7640 | |
| Samsung Galaxy Book4 Ultra | |
| Moyenne Intel Core Ultra 7 155H (5639 - 10647, n=50) | |
| Dell Inspiron 16 Plus 7630 | |
| Asus VivoBook Pro 16 K6602VU | |
| Dell Inspiron 16 Plus 7620 | |
| AIDA64 / FPU Mandel | |
| Lenovo Legion 5 16IRX G9 | |
| Dell Inspiron 16 Plus 7640 | |
| Samsung Galaxy Book4 Ultra | |
| Moyenne Intel Core Ultra 7 155H (18236 - 47685, n=50) | |
| Asus VivoBook Pro 16 K6602VU | |
| Dell Inspiron 16 Plus 7630 | |
| Dell Inspiron 16 Plus 7620 | |
| AIDA64 / CPU AES | |
| Asus VivoBook Pro 16 K6602VU | |
| Lenovo Legion 5 16IRX G9 | |
| Moyenne Intel Core Ultra 7 155H (45713 - 152179, n=50) | |
| Samsung Galaxy Book4 Ultra | |
| Dell Inspiron 16 Plus 7640 | |
| Dell Inspiron 16 Plus 7620 | |
| Dell Inspiron 16 Plus 7630 | |
| AIDA64 / CPU ZLib | |
| Lenovo Legion 5 16IRX G9 | |
| Dell Inspiron 16 Plus 7640 | |
| Dell Inspiron 16 Plus 7620 | |
| Samsung Galaxy Book4 Ultra | |
| Asus VivoBook Pro 16 K6602VU | |
| Moyenne Intel Core Ultra 7 155H (557 - 1250, n=50) | |
| Dell Inspiron 16 Plus 7630 | |
| AIDA64 / FP64 Ray-Trace | |
| Lenovo Legion 5 16IRX G9 | |
| Asus VivoBook Pro 16 K6602VU | |
| Dell Inspiron 16 Plus 7640 | |
| Dell Inspiron 16 Plus 7630 | |
| Samsung Galaxy Book4 Ultra | |
| Moyenne Intel Core Ultra 7 155H (3569 - 9802, n=50) | |
| Dell Inspiron 16 Plus 7620 | |
| AIDA64 / CPU PhotoWorxx | |
| Samsung Galaxy Book4 Ultra | |
| Moyenne Intel Core Ultra 7 155H (32719 - 54223, n=50) | |
| Dell Inspiron 16 Plus 7640 | |
| Asus VivoBook Pro 16 K6602VU | |
| Dell Inspiron 16 Plus 7630 | |
| Dell Inspiron 16 Plus 7620 | |
| Lenovo Legion 5 16IRX G9 | |
Test de stress
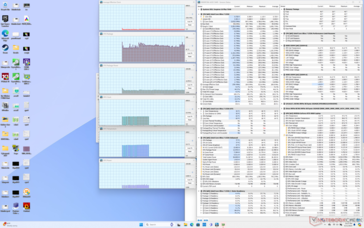
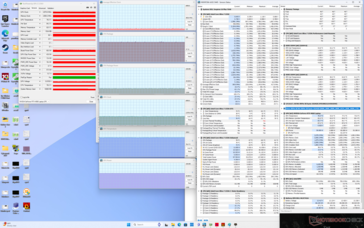
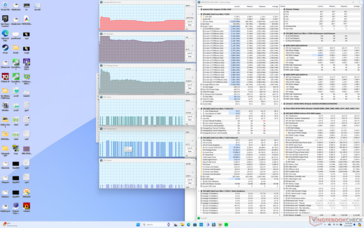
Le processeur atteignait 3,2 GHz en moyenne, 97 W et 101 C pendant environ 25 secondes lors de l'exécution du test Prime95. Ensuite, il redescend à ~2,3 GHz et 44 W afin de maintenir une température de 83 C. La performance Turbo Boost est donc de courte durée sur le système, comme nous l'avons observé sur le modèle précédent.
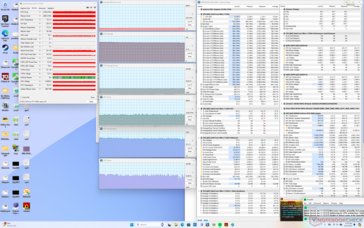
Le GPU Nvidia se stabilise à 2070 MHz, 76 C, et 60 W lorsqu'il fonctionne Witcher 3 contre 2250 MHz, 72 C, et 69 W sur le modèle de l'année dernière dans des conditions de test similaires. Ces résultats complètent les performances généralement plus lentes dans les jeux, comme indiqué dans la section Performances des jeux ci-dessous. La puissance du GPU sur le nouveau modèle Dell atteindrait un plafond de 60 W contre 70 W sur l'ancien modèle Dell, même en mode Performance.
| Horloge moyenne du CPU (GHz) | Horloge du GPU (MHz) | Température moyenne du CPU (°C) | Température moyenne du GPU (°C) | |
| Système en veille | -- | -- | 63 | 45 |
| Prime95 Stress | 2.1 - 2.4 | -- | 83 | 56 |
| Prime95 + FurMark Stress | 0.5 | 2160 | 74 | 70 |
| Witcher 3 Stress | 0,4 | 2070 | 77 | 77 |
Performance du système
CrossMark: Overall | Productivity | Creativity | Responsiveness
WebXPRT 3: Overall
WebXPRT 4: Overall
Mozilla Kraken 1.1: Total
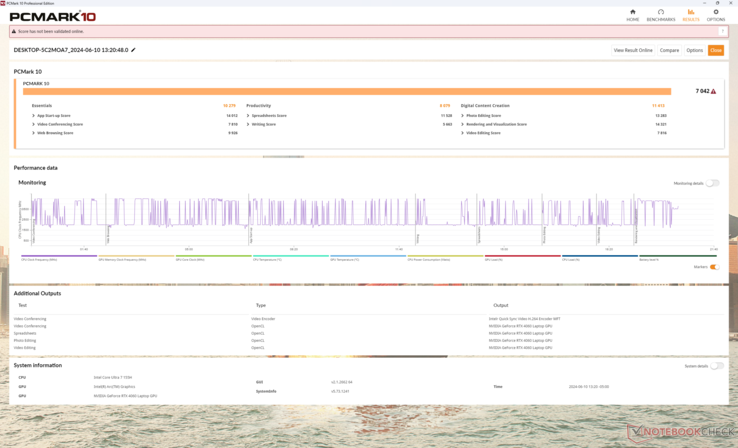
| PCMark 10 / Score | |
| Dell Inspiron 16 Plus 7630 | |
| Lenovo Legion 5 16IRX G9 | |
| Asus VivoBook Pro 16 K6602VU | |
| Dell Inspiron 16 Plus 7640 | |
| Moyenne Intel Core Ultra 7 155H, NVIDIA GeForce RTX 4060 Laptop GPU (6751 - 7370, n=5) | |
| Samsung Galaxy Book4 Ultra | |
| Dell Inspiron 16 Plus 7620 | |
| PCMark 10 / Essentials | |
| Dell Inspiron 16 Plus 7630 | |
| Lenovo Legion 5 16IRX G9 | |
| Samsung Galaxy Book4 Ultra | |
| Dell Inspiron 16 Plus 7640 | |
| Asus VivoBook Pro 16 K6602VU | |
| Dell Inspiron 16 Plus 7620 | |
| Moyenne Intel Core Ultra 7 155H, NVIDIA GeForce RTX 4060 Laptop GPU (9476 - 10446, n=5) | |
| PCMark 10 / Productivity | |
| Dell Inspiron 16 Plus 7630 | |
| Lenovo Legion 5 16IRX G9 | |
| Samsung Galaxy Book4 Ultra | |
| Dell Inspiron 16 Plus 7620 | |
| Moyenne Intel Core Ultra 7 155H, NVIDIA GeForce RTX 4060 Laptop GPU (8079 - 9477, n=5) | |
| Asus VivoBook Pro 16 K6602VU | |
| Dell Inspiron 16 Plus 7640 | |
| PCMark 10 / Digital Content Creation | |
| Lenovo Legion 5 16IRX G9 | |
| Dell Inspiron 16 Plus 7630 | |
| Dell Inspiron 16 Plus 7640 | |
| Asus VivoBook Pro 16 K6602VU | |
| Moyenne Intel Core Ultra 7 155H, NVIDIA GeForce RTX 4060 Laptop GPU (9811 - 11620, n=5) | |
| Samsung Galaxy Book4 Ultra | |
| Dell Inspiron 16 Plus 7620 | |
| CrossMark / Overall | |
| Lenovo Legion 5 16IRX G9 | |
| Dell Inspiron 16 Plus 7630 | |
| Dell Inspiron 16 Plus 7620 | |
| Samsung Galaxy Book4 Ultra | |
| Asus VivoBook Pro 16 K6602VU | |
| Dell Inspiron 16 Plus 7640 | |
| Moyenne Intel Core Ultra 7 155H, NVIDIA GeForce RTX 4060 Laptop GPU (1540 - 1746, n=5) | |
| CrossMark / Productivity | |
| Lenovo Legion 5 16IRX G9 | |
| Dell Inspiron 16 Plus 7630 | |
| Asus VivoBook Pro 16 K6602VU | |
| Samsung Galaxy Book4 Ultra | |
| Dell Inspiron 16 Plus 7620 | |
| Moyenne Intel Core Ultra 7 155H, NVIDIA GeForce RTX 4060 Laptop GPU (1436 - 1684, n=5) | |
| Dell Inspiron 16 Plus 7640 | |
| CrossMark / Creativity | |
| Lenovo Legion 5 16IRX G9 | |
| Dell Inspiron 16 Plus 7630 | |
| Samsung Galaxy Book4 Ultra | |
| Dell Inspiron 16 Plus 7640 | |
| Dell Inspiron 16 Plus 7620 | |
| Moyenne Intel Core Ultra 7 155H, NVIDIA GeForce RTX 4060 Laptop GPU (1811 - 1929, n=5) | |
| Asus VivoBook Pro 16 K6602VU | |
| CrossMark / Responsiveness | |
| Lenovo Legion 5 16IRX G9 | |
| Dell Inspiron 16 Plus 7630 | |
| Asus VivoBook Pro 16 K6602VU | |
| Dell Inspiron 16 Plus 7620 | |
| Samsung Galaxy Book4 Ultra | |
| Moyenne Intel Core Ultra 7 155H, NVIDIA GeForce RTX 4060 Laptop GPU (1165 - 1631, n=5) | |
| Dell Inspiron 16 Plus 7640 | |
| WebXPRT 3 / Overall | |
| Dell Inspiron 16 Plus 7630 | |
| Lenovo Legion 5 16IRX G9 | |
| Dell Inspiron 16 Plus 7620 | |
| Dell Inspiron 16 Plus 7640 | |
| Moyenne Intel Core Ultra 7 155H, NVIDIA GeForce RTX 4060 Laptop GPU (274 - 290, n=5) | |
| Samsung Galaxy Book4 Ultra | |
| WebXPRT 4 / Overall | |
| Lenovo Legion 5 16IRX G9 | |
| Dell Inspiron 16 Plus 7630 | |
| Dell Inspiron 16 Plus 7620 | |
| Samsung Galaxy Book4 Ultra | |
| Dell Inspiron 16 Plus 7640 | |
| Moyenne Intel Core Ultra 7 155H, NVIDIA GeForce RTX 4060 Laptop GPU (236 - 262, n=5) | |
| Asus VivoBook Pro 16 K6602VU | |
| Mozilla Kraken 1.1 / Total | |
| Moyenne Intel Core Ultra 7 155H, NVIDIA GeForce RTX 4060 Laptop GPU (519 - 585, n=5) | |
| Asus VivoBook Pro 16 K6602VU | |
| Dell Inspiron 16 Plus 7620 | |
| Dell Inspiron 16 Plus 7640 | |
| Dell Inspiron 16 Plus 7630 | |
| Lenovo Legion 5 16IRX G9 | |
| Samsung Galaxy Book4 Ultra | |
* ... Moindre est la valeur, meilleures sont les performances
| PCMark 10 Score | 7042 points | |
Aide | ||
| AIDA64 / Memory Copy | |
| Samsung Galaxy Book4 Ultra | |
| Moyenne Intel Core Ultra 7 155H (62397 - 96791, n=50) | |
| Dell Inspiron 16 Plus 7640 | |
| Lenovo Legion 5 16IRX G9 | |
| Dell Inspiron 16 Plus 7630 | |
| Asus VivoBook Pro 16 K6602VU | |
| Dell Inspiron 16 Plus 7620 | |
| AIDA64 / Memory Read | |
| Samsung Galaxy Book4 Ultra | |
| Moyenne Intel Core Ultra 7 155H (60544 - 90647, n=50) | |
| Dell Inspiron 16 Plus 7640 | |
| Lenovo Legion 5 16IRX G9 | |
| Dell Inspiron 16 Plus 7630 | |
| Asus VivoBook Pro 16 K6602VU | |
| Dell Inspiron 16 Plus 7620 | |
| AIDA64 / Memory Write | |
| Samsung Galaxy Book4 Ultra | |
| Moyenne Intel Core Ultra 7 155H (58692 - 93451, n=50) | |
| Dell Inspiron 16 Plus 7640 | |
| Asus VivoBook Pro 16 K6602VU | |
| Dell Inspiron 16 Plus 7630 | |
| Dell Inspiron 16 Plus 7620 | |
| Lenovo Legion 5 16IRX G9 | |
| AIDA64 / Memory Latency | |
| Moyenne Intel Core Ultra 7 155H (116.2 - 233, n=50) | |
| Samsung Galaxy Book4 Ultra | |
| Dell Inspiron 16 Plus 7640 | |
| Dell Inspiron 16 Plus 7620 | |
| Dell Inspiron 16 Plus 7630 | |
| Asus VivoBook Pro 16 K6602VU | |
| Lenovo Legion 5 16IRX G9 | |
* ... Moindre est la valeur, meilleures sont les performances
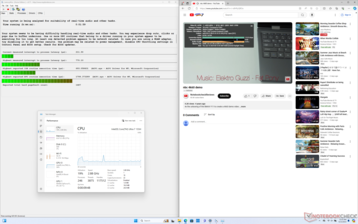
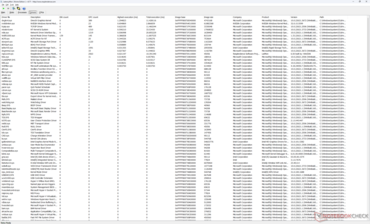
Latence DPC
| DPC Latencies / LatencyMon - interrupt to process latency (max), Web, Youtube, Prime95 | |
| Lenovo Legion 5 16IRX G9 | |
| Asus VivoBook Pro 16 K6602VU | |
| Dell Inspiron 16 Plus 7630 | |
| Dell Inspiron 16 Plus 7620 | |
| Dell Inspiron 16 Plus 7640 | |
| Samsung Galaxy Book4 Ultra | |
* ... Moindre est la valeur, meilleures sont les performances
Dispositifs de stockage
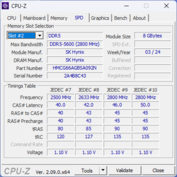
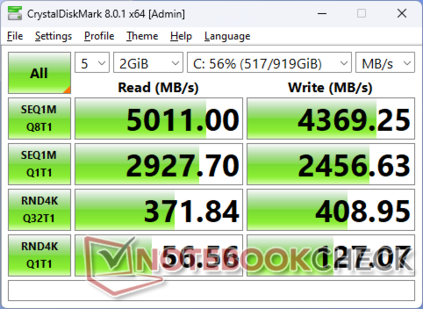
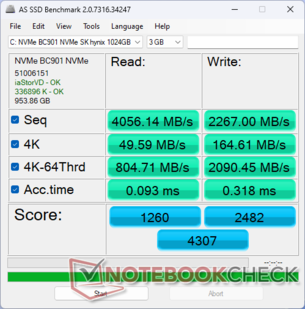
Notre unité de test est livrée avec un disque SK Hynix plus lent disque SK Hynix plus lent plus lent, au lieu du disque Western Digital du modèle de l'année dernière. Le disque SK Hynix est nettement plus lent, comme le montrent nos tests de référence, mais il ne souffre d'aucun problème d'étranglement des performances, ce qui se traduit par des taux de transfert plus stables dans l'ensemble.
| Drive Performance rating - Percent | |
| Lenovo Legion 5 16IRX G9 | |
| Samsung Galaxy Book4 Ultra | |
| Dell Inspiron 16 Plus 7630 | |
| Asus VivoBook Pro 16 K6602VU | |
| Dell Inspiron 16 Plus 7640 | |
| Dell Inspiron 16 Plus 7620 | |
* ... Moindre est la valeur, meilleures sont les performances
Disk Throttling: DiskSpd Read Loop, Queue Depth 8
Performance du GPU
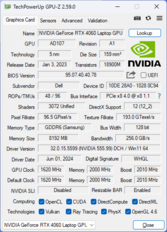
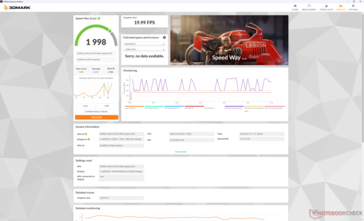
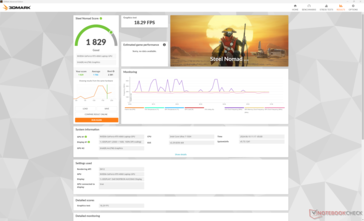
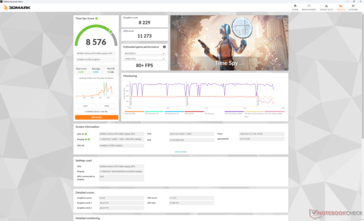
Les options de GPU Nvidia restent les mêmes avec la GeForce RTX 4050 et 4060 . Les résultats de 3DMark sont plus élevés de quelques points de pourcentage. les résultats 3DMark sont quelques points de pourcentage plus élevés qu'auparavant, mais cela ne se traduit malheureusement pas par des performances de jeu réelles.
Le passage à la RTX 4050 devrait avoir un impact sur les performances de seulement 10 %. Le choix de ne pas utiliser de carte graphique discrète aura un impact beaucoup plus important sur les performances, de l'ordre de 60 à 80 %.
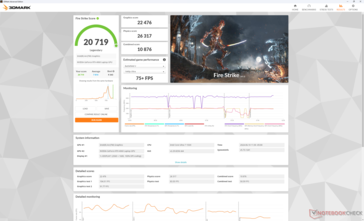
| Profil de puissance | Score graphique | Score physique | Score combiné |
| Mode Performance | 22476 | 26317 | 10876 |
| Mode équilibré | 22542 (-0%) | 27226 (-0%) | 10829 (-0%) |
| Alimentation par batterie | 21957 (-2%) | 26817 (-0%) | 9623 (-12%) |
L'exécution en mode équilibré au lieu du mode performance ne semble pas avoir d'impact significatif sur les performances, comme le montre notre tableau de résultats Fire Strike ci-dessus. Même le fonctionnement sur batterie préserve assez bien les performances.
| 3DMark 11 Performance | 21491 points | |
| 3DMark Fire Strike Score | 20719 points | |
| 3DMark Time Spy Score | 8576 points | |
| 3DMark Steel Nomad Score | 1829 points | |
Aide | ||
* ... Moindre est la valeur, meilleures sont les performances
Performances des jeux
Les performances dans les jeux n'ont pas changé et peuvent même être légèrement moins bonnes qu'auparavant. Final Fantasy XV, par exemple, peut tourner 10 % plus lentement que sur l'Inspiron 16 Plus 7630. Des déficits moins importants peuvent être observés sur d'autres jeux, notamment F1 22 et Strange Brigade.
| Performance rating - Percent | |
| Lenovo Legion 5 16IRX G9 | |
| Dell Inspiron 16 Plus 7630 | |
| Dell Inspiron 16 Plus 7640 | |
| Asus VivoBook Pro 16 K6602VU | |
| Dell Inspiron 16 Plus 7620 -1! | |
| Samsung Galaxy Book4 Ultra | |
| The Witcher 3 - 1920x1080 Ultra Graphics & Postprocessing (HBAO+) | |
| Lenovo Legion 5 16IRX G9 | |
| Dell Inspiron 16 Plus 7630 | |
| Dell Inspiron 16 Plus 7640 | |
| Asus VivoBook Pro 16 K6602VU | |
| Dell Inspiron 16 Plus 7620 | |
| Samsung Galaxy Book4 Ultra | |
| Final Fantasy XV Benchmark - 1920x1080 High Quality | |
| Lenovo Legion 5 16IRX G9 | |
| Dell Inspiron 16 Plus 7630 | |
| Dell Inspiron 16 Plus 7640 | |
| Asus VivoBook Pro 16 K6602VU | |
| Samsung Galaxy Book4 Ultra | |
| Dell Inspiron 16 Plus 7620 | |
| Strange Brigade - 1920x1080 ultra AA:ultra AF:16 | |
| Lenovo Legion 5 16IRX G9 | |
| Dell Inspiron 16 Plus 7630 | |
| Dell Inspiron 16 Plus 7640 | |
| Asus VivoBook Pro 16 K6602VU | |
| Samsung Galaxy Book4 Ultra | |
| Dell Inspiron 16 Plus 7620 | |
| Dota 2 Reborn - 1920x1080 ultra (3/3) best looking | |
| Lenovo Legion 5 16IRX G9 | |
| Dell Inspiron 16 Plus 7630 | |
| Dell Inspiron 16 Plus 7620 | |
| Dell Inspiron 16 Plus 7640 | |
| Samsung Galaxy Book4 Ultra | |
| Asus VivoBook Pro 16 K6602VU | |
| X-Plane 11.11 - 1920x1080 high (fps_test=3) | |
| Lenovo Legion 5 16IRX G9 | |
| Dell Inspiron 16 Plus 7630 | |
| Asus VivoBook Pro 16 K6602VU | |
| Dell Inspiron 16 Plus 7620 | |
| Dell Inspiron 16 Plus 7640 | |
| Samsung Galaxy Book4 Ultra | |
| Far Cry 5 - 1920x1080 Ultra Preset AA:T | |
| Lenovo Legion 5 16IRX G9 | |
| Dell Inspiron 16 Plus 7640 | |
| Asus VivoBook Pro 16 K6602VU | |
| Dell Inspiron 16 Plus 7630 | |
| Samsung Galaxy Book4 Ultra | |
| Baldur's Gate 3 | |
| 1920x1080 Low Preset AA:SM | |
| Moyenne NVIDIA GeForce RTX 4060 Laptop GPU (102.8 - 160.3, n=15) | |
| Dell Inspiron 16 Plus 7640 | |
| Framework Laptop 16 | |
| Lenovo Yoga 7 2-in-1 16IML9 | |
| 1920x1080 Medium Preset AA:T | |
| Moyenne NVIDIA GeForce RTX 4060 Laptop GPU (77.5 - 125.7, n=18) | |
| Dell Inspiron 16 Plus 7640 | |
| Framework Laptop 16 | |
| 1920x1080 High Preset AA:T | |
| Moyenne NVIDIA GeForce RTX 4060 Laptop GPU (68.7 - 110.7, n=18) | |
| Dell Inspiron 16 Plus 7640 | |
| Framework Laptop 16 | |
| 1920x1080 Ultra Preset AA:T | |
| Moyenne NVIDIA GeForce RTX 4060 Laptop GPU (66.5 - 105.5, n=19) | |
| Dell Inspiron 16 Plus 7640 | |
| Framework Laptop 16 | |
| 2560x1440 Ultra Preset AA:T | |
| Moyenne NVIDIA GeForce RTX 4060 Laptop GPU (45.2 - 72.2, n=14) | |
| Dell Inspiron 16 Plus 7640 | |
| Framework Laptop 16 | |
| Cyberpunk 2077 | |
| 1920x1080 Low Preset (FSR off) | |
| Lenovo Legion 5 16IRX G9 | |
| Moyenne NVIDIA GeForce RTX 4060 Laptop GPU (96.7 - 136.1, n=22) | |
| Framework Laptop 16 | |
| Dell Inspiron 16 Plus 7640 | |
| Lenovo Yoga 7 2-in-1 16IML9 | |
| 1920x1080 Medium Preset (FSR off) | |
| Lenovo Legion 5 16IRX G9 | |
| Moyenne NVIDIA GeForce RTX 4060 Laptop GPU (77.7 - 110.4, n=23) | |
| Dell Inspiron 16 Plus 7640 | |
| Framework Laptop 16 | |
| Lenovo Yoga 7 2-in-1 16IML9 | |
| 1920x1080 High Preset (FSR off) | |
| Lenovo Legion 5 16IRX G9 | |
| Moyenne NVIDIA GeForce RTX 4060 Laptop GPU (65.2 - 102, n=26) | |
| Dell Inspiron 16 Plus 7640 | |
| Framework Laptop 16 | |
| Lenovo Yoga 7 2-in-1 16IML9 | |
| 1920x1080 Ultra Preset (FSR off) | |
| Lenovo Legion 5 16IRX G9 | |
| Moyenne NVIDIA GeForce RTX 4060 Laptop GPU (56.4 - 93.1, n=31) | |
| Framework Laptop 16 | |
| Dell Inspiron 16 Plus 7640 | |
| Lenovo Yoga 7 2-in-1 16IML9 | |
| 2560x1440 Ultra Preset (FSR off) | |
| Lenovo Legion 5 16IRX G9 | |
| Moyenne NVIDIA GeForce RTX 4060 Laptop GPU (32.9 - 51.8, n=19) | |
| Framework Laptop 16 | |
| Dell Inspiron 16 Plus 7640 | |
Witcher 3 FPS Chart
| Bas | Moyen | Élevé | Ultra | QHD | |
|---|---|---|---|---|---|
| The Witcher 3 (2015) | 375.8 | 276.8 | 160.3 | 84.1 | 61.9 |
| Dota 2 Reborn (2015) | 173.5 | 152.1 | 143.2 | 135.1 | |
| Final Fantasy XV Benchmark (2018) | 137.6 | 98.4 | 78.8 | 58.8 | |
| X-Plane 11.11 (2018) | 123.7 | 109 | 86.5 | ||
| Far Cry 5 (2018) | 138 | 125 | 118 | 110 | 83 |
| Strange Brigade (2018) | 360 | 225 | 178.1 | 153.5 | 105.2 |
| Tiny Tina's Wonderlands (2022) | 177.4 | 116 | 91.9 | 71.1 | 48 |
| F1 22 (2022) | 197 | 184.3 | 151.3 | 51.8 | 32.1 |
| Baldur's Gate 3 (2023) | 111.1 | 93.2 | 82.4 | 76.7 | 53.2 |
| Cyberpunk 2077 (2023) | 96.8 | 83.1 | 69.9 | 59.8 | 36.8 |
Émissions
Bruit du système - Fort lors des jeux
Les ventilateurs internes restent plus longtemps silencieux que sur le modèle de l'année dernière. Lors de l'exécution de 3DMark 06, par exemple, le bruit des ventilateurs se maintient autour de 29 dB(A) jusqu'à la fin de la première scène de benchmark, alors que l'Inspiron 16 Plus 7630 devient beaucoup plus bruyant à 35 dB(A). Les deux portables se stabilisent à plus de 50 dB(A) chacun lors de l'exécution de charges plus exigeantes comme les jeux sur une période plus longue.
Degré de la nuisance sonore
| Au repos |
| 24.2 / 24.2 / 24.2 dB(A) |
| Fortement sollicité |
| 28.9 / 51 dB(A) |
 | ||
30 dB silencieux 40 dB(A) audible 50 dB(A) bruyant |
||
min: | ||
| Dell Inspiron 16 Plus 7640 GeForce RTX 4060 Laptop GPU, Ultra 7 155H, SK hynix BC901 HFS001TEJ4X164N | Dell Inspiron 16 Plus 7630 GeForce RTX 4060 Laptop GPU, i7-13700H, WD PC SN740 SDDPTQD-1T00 | Dell Inspiron 16 Plus 7620 GeForce RTX 3050 Ti Laptop GPU, i7-12700H, Kioxia BG5 KBG50ZNS512G | Samsung Galaxy Book4 Ultra GeForce RTX 4050 Laptop GPU, Ultra 7 155H, Samsung PM9A1 MZVL2512HCJQ | Lenovo Legion 5 16IRX G9 GeForce RTX 4060 Laptop GPU, i7-14650HX, Samsung PM9A1 MZVL21T0HCLR | Asus VivoBook Pro 16 K6602VU GeForce RTX 4050 Laptop GPU, i9-13900H, Micron 2400 MTFDKBA1T0QFM | |
|---|---|---|---|---|---|---|
| Noise | -2% | -13% | 0% | -17% | -11% | |
| arrêt / environnement * (dB) | 23.8 | 23.2 3% | 23.3 2% | 24.2 -2% | 24 -1% | 20.96 12% |
| Idle Minimum * (dB) | 24.2 | 23.2 4% | 25.7 -6% | 24.2 -0% | 24 1% | 25.28 -4% |
| Idle Average * (dB) | 24.2 | 23.2 4% | 26.1 -8% | 24.2 -0% | 28.8 -19% | 25.28 -4% |
| Idle Maximum * (dB) | 24.2 | 23.2 4% | 30.6 -26% | 24.2 -0% | 32 -32% | 25.28 -4% |
| Load Average * (dB) | 28.9 | 35.1 -21% | 46.2 -60% | 37.9 -31% | 45.5 -57% | 51.88 -80% |
| Witcher 3 ultra * (dB) | 51 | 52.5 -3% | 49.2 4% | 41.7 18% | 53.1 -4% | 49 4% |
| Load Maximum * (dB) | 51 | 52.5 -3% | 49.4 3% | 41.7 18% | 55.7 -9% | 51.8 -2% |
* ... Moindre est la valeur, meilleures sont les performances
Température
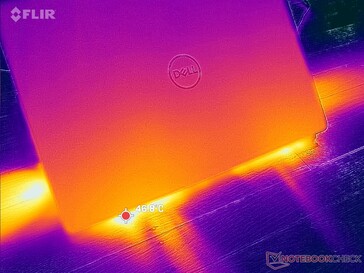
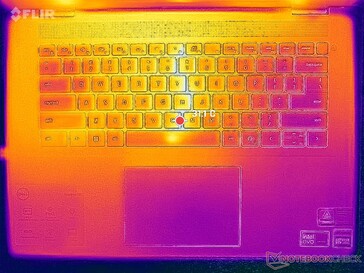
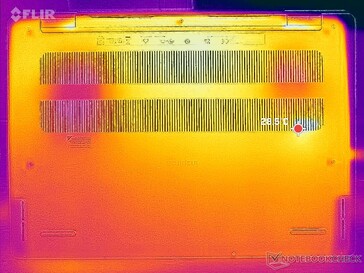
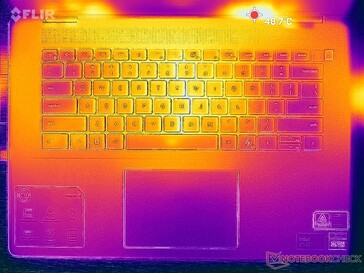
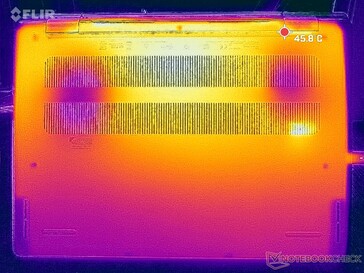
Les températures de surface peuvent devenir assez élevées malgré les nombreuses grilles d'aération le long des bords. Les points chauds en jeu peuvent atteindre 43°C sur les couvercles C et D du châssis, ce qui est comparable à l'écran de l'ordinateur de bureau Lenovo Legion 5i 16 G9 de Lenovo.
(±) La température maximale du côté supérieur est de 43.4 °C / 110 F, par rapport à la moyenne de 36.9 °C / 98 F, allant de 21.1 à 71 °C pour la classe Multimedia.
(±) Le fond chauffe jusqu'à un maximum de 41.6 °C / 107 F, contre une moyenne de 39.1 °C / 102 F
(+) En utilisation inactive, la température moyenne du côté supérieur est de 29.9 °C / 86 F, par rapport à la moyenne du dispositif de 31.3 °C / 88 F.
(+) Les repose-poignets et le pavé tactile atteignent la température maximale de la peau (35.2 °C / 95.4 F) et ne sont donc pas chauds.
(-) La température moyenne de la zone de l'appui-paume de dispositifs similaires était de 28.7 °C / 83.7 F (-6.5 °C / #-11.7 F).
| Dell Inspiron 16 Plus 7640 Intel Core Ultra 7 155H, NVIDIA GeForce RTX 4060 Laptop GPU | Dell Inspiron 16 Plus 7630 Intel Core i7-13700H, NVIDIA GeForce RTX 4060 Laptop GPU | Dell Inspiron 16 Plus 7620 Intel Core i7-12700H, NVIDIA GeForce RTX 3050 Ti Laptop GPU | Samsung Galaxy Book4 Ultra Intel Core Ultra 7 155H, NVIDIA GeForce RTX 4050 Laptop GPU | Lenovo Legion 5 16IRX G9 Intel Core i7-14650HX, NVIDIA GeForce RTX 4060 Laptop GPU | Asus VivoBook Pro 16 K6602VU Intel Core i9-13900H, NVIDIA GeForce RTX 4050 Laptop GPU | |
|---|---|---|---|---|---|---|
| Heat | -7% | -0% | 17% | 0% | -14% | |
| Maximum Upper Side * (°C) | 43.4 | 47.8 -10% | 46 -6% | 38.5 11% | 40.4 7% | 42.6 2% |
| Maximum Bottom * (°C) | 41.6 | 42.2 -1% | 45.8 -10% | 41.2 1% | 43.8 -5% | 48.4 -16% |
| Idle Upper Side * (°C) | 32.8 | 35.2 -7% | 29.2 11% | 23.5 28% | 30.3 8% | 39.4 -20% |
| Idle Bottom * (°C) | 32.4 | 35 -8% | 31 4% | 24.1 26% | 35.3 -9% | 39.8 -23% |
* ... Moindre est la valeur, meilleures sont les performances
Intervenants
Dell Inspiron 16 Plus 7640 analyse audio
(+) | les haut-parleurs peuvent jouer relativement fort (87.1# dB)
Basses 100 - 315 Hz
(±) | basse réduite - en moyenne 13.9% inférieure à la médiane
(±) | la linéarité des basses est moyenne (13.7% delta à la fréquence précédente)
Médiums 400 - 2000 Hz
(+) | médiane équilibrée - seulement 3.6% de la médiane
(+) | les médiums sont linéaires (3.4% delta à la fréquence précédente)
Aiguës 2 - 16 kHz
(+) | des sommets équilibrés - à seulement 4.3% de la médiane
(+) | les aigus sont linéaires (5.7% delta à la fréquence précédente)
Globalement 100 - 16 000 Hz
(+) | le son global est linéaire (11.3% différence à la médiane)
Par rapport à la même classe
» 15% de tous les appareils testés de cette catégorie étaient meilleurs, 4% similaires, 81% pires
» Le meilleur avait un delta de 5%, la moyenne était de 17%, le pire était de 45%.
Par rapport à tous les appareils testés
» 7% de tous les appareils testés étaient meilleurs, 2% similaires, 91% pires
» Le meilleur avait un delta de 4%, la moyenne était de 24%, le pire était de 134%.
Apple MacBook Pro 16 2021 M1 Pro analyse audio
(+) | les haut-parleurs peuvent jouer relativement fort (84.7# dB)
Basses 100 - 315 Hz
(+) | bonne basse - seulement 3.8% loin de la médiane
(+) | les basses sont linéaires (5.2% delta à la fréquence précédente)
Médiums 400 - 2000 Hz
(+) | médiane équilibrée - seulement 1.3% de la médiane
(+) | les médiums sont linéaires (2.1% delta à la fréquence précédente)
Aiguës 2 - 16 kHz
(+) | des sommets équilibrés - à seulement 1.9% de la médiane
(+) | les aigus sont linéaires (2.7% delta à la fréquence précédente)
Globalement 100 - 16 000 Hz
(+) | le son global est linéaire (4.6% différence à la médiane)
Par rapport à la même classe
» 0% de tous les appareils testés de cette catégorie étaient meilleurs, 0% similaires, 100% pires
» Le meilleur avait un delta de 5%, la moyenne était de 17%, le pire était de 45%.
Par rapport à tous les appareils testés
» 0% de tous les appareils testés étaient meilleurs, 0% similaires, 100% pires
» Le meilleur avait un delta de 4%, la moyenne était de 24%, le pire était de 134%.
Gestion de l'énergie
Consommation électrique
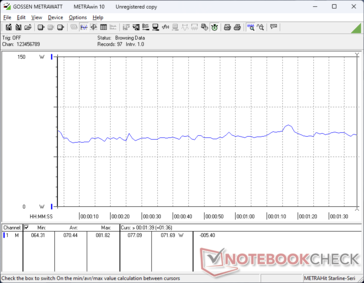
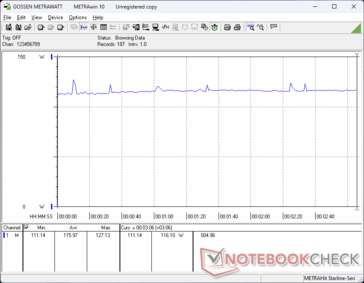
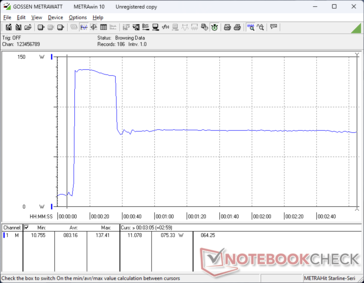
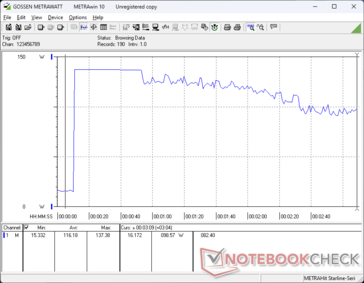
La consommation d'énergie est nettement inférieure à celle du modèle de l'année dernière lorsqu'il fonctionne au ralenti sur le bureau, ce qui peut expliquer la durée de vie généralement plus longue de la batterie dans la section suivante. Le système consomme entre 4 et 16 W, contre 16 à 21 W pour l'Inspiron 16 Plus 7630. La consommation lors de l'exécution d'applications plus exigeantes comme les jeux est pratiquement la même, voire légèrement inférieure de quelques watts.
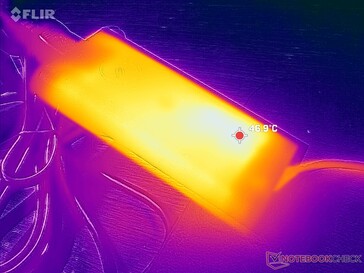
Il est intéressant de noter que le modèle est livré avec un adaptateur secteur USB-C universel de 130 W (~14,3 x 6,5 x 2,2 cm) au lieu du chargeur secteur propriétaire à barillet de 130 W qui accompagnait le modèle de l'année dernière. Le port de l'adaptateur secteur à barillet demeure toutefois, ce qui signifie que vous pouvez toujours recharger le système via un chargeur à barillet compatible. Nous avons pu enregistrer une consommation maximale temporaire de 138 W lors de l'exécution simultanée de Prime95 et FurMark.
| Éteint/en veille | |
| Au repos | |
| Fortement sollicité |
|
Légende:
min: | |
| Dell Inspiron 16 Plus 7640 Ultra 7 155H, GeForce RTX 4060 Laptop GPU, SK hynix BC901 HFS001TEJ4X164N, IPS, 2560x1600, 16" | Dell Inspiron 16 Plus 7630 i7-13700H, GeForce RTX 4060 Laptop GPU, WD PC SN740 SDDPTQD-1T00, IPS, 2560x1600, 16" | Dell Inspiron 16 Plus 7620 i7-12700H, GeForce RTX 3050 Ti Laptop GPU, Kioxia BG5 KBG50ZNS512G, IPS, 3072x1920, 16" | Samsung Galaxy Book4 Ultra Ultra 7 155H, GeForce RTX 4050 Laptop GPU, Samsung PM9A1 MZVL2512HCJQ, OLED, 2880x1800, 16" | Lenovo Legion 5 16IRX G9 i7-14650HX, GeForce RTX 4060 Laptop GPU, Samsung PM9A1 MZVL21T0HCLR, IPS, 2560x1600, 16" | Asus VivoBook Pro 16 K6602VU i9-13900H, GeForce RTX 4050 Laptop GPU, Micron 2400 MTFDKBA1T0QFM, OLED, 3200x2000, 16" | |
|---|---|---|---|---|---|---|
| Power Consumption | -82% | -30% | 9% | -113% | -116% | |
| Idle Minimum * (Watt) | 4.2 | 15.6 -271% | 6.8 -62% | 4.8 -14% | 15.4 -267% | 21.06 -401% |
| Idle Average * (Watt) | 6.9 | 17.7 -157% | 9.6 -39% | 7.5 -9% | 19.7 -186% | 24.27 -252% |
| Idle Maximum * (Watt) | 15.2 | 20.6 -36% | 17 -12% | 7.9 48% | 20.7 -36% | 25.12 -65% |
| Load Average * (Watt) | 70.4 | 87.4 -24% | 117.5 -67% | 79.3 -13% | 102.6 -46% | 52.4 26% |
| Witcher 3 ultra * (Watt) | 115.9 | 121.7 -5% | 113.1 2% | 79.2 32% | 191.3 -65% | 110.2 5% |
| Load Maximum * (Watt) | 137.4 | 138 -0% | 137.4 -0% | 125 9% | 246.6 -79% | 146 -6% |
* ... Moindre est la valeur, meilleures sont les performances
Power Consumption Witcher 3 / Stresstest
Power Consumption external Monitor
Autonomie de la batterie
Les durées d'exécution sont beaucoup plus longues qu'auparavant, probablement grâce aux optimisations et au passage à un processeur Intel de nouvelle génération. Nous sommes en mesure d'enregistrer une autonomie de batterie WLAN en conditions réelles de près de 13,5 heures, contre 9,5 heures sur le modèle de l'année dernière.
Le chargement de la batterie vide à la pleine capacité prend environ 2 heures avec l'adaptateur USB-C inclus.
| Dell Inspiron 16 Plus 7640 Ultra 7 155H, GeForce RTX 4060 Laptop GPU, 90 Wh | Dell Inspiron 16 Plus 7630 i7-13700H, GeForce RTX 4060 Laptop GPU, 86 Wh | Dell Inspiron 16 Plus 7620 i7-12700H, GeForce RTX 3050 Ti Laptop GPU, 86 Wh | Samsung Galaxy Book4 Ultra Ultra 7 155H, GeForce RTX 4050 Laptop GPU, 76 Wh | Lenovo Legion 5 16IRX G9 i7-14650HX, GeForce RTX 4060 Laptop GPU, 80 Wh | Asus VivoBook Pro 16 K6602VU i9-13900H, GeForce RTX 4050 Laptop GPU, 96 Wh | |
|---|---|---|---|---|---|---|
| Autonomie de la batterie | -29% | -28% | -18% | -44% | -24% | |
| WiFi v1.3 (h) | 13.3 | 9.4 -29% | 9.6 -28% | 10.9 -18% | 7.4 -44% | 10.1 -24% |
| Reader / Idle (h) | 17.6 | 18.6 | ||||
| Load (h) | 1.4 | 1.2 | 1.3 | 0.8 | ||
| H.264 (h) | 17.9 | 9.6 | 9.8 |
Points positifs
Points négatifs
Verdict - Rattraper quelques petites lacunes
Si l'Inspiron 16 Plus 7640 2024 ressemble beaucoup à la version version 2023il apporte suffisamment de nouveautés, au-delà de la mise à jour annuelle du processeur, pour que les acheteurs intéressés puissent en prendre connaissance. Le nouveau modèle prend en charge jusqu'à deux disques SSD, offre des temps de réponse plus rapides en noir et blanc et en gris, une meilleure autonomie de la batterie et une accélération de l'IA. Ces changements sous le capot sont importants pour les passionnés qui apprécient l'extension du stockage, les jeux rapides, les voyages et les programmes assistés par l'IA comme Co-Pilot. À cet égard, l'Inspiron 16 Plus 7640 s'impose comme une évidence par rapport à son prédécesseur.
L'Inspiron 16 Plus 7640 corrige certains des inconvénients de son prédécesseur pour devenir une machine multimédia encore plus performante qu'auparavant. Les performances du processeur à un seul thread et les performances des jeux font cependant un petit pas en arrière.
Malheureusement, les performances de jeu en prennent un coup avec le nouveau modèle, car la plupart des jeux ont tendance à tourner un peu plus lentement qu'auparavant. Les joueurs invétérés peuvent être déçus, mais le déficit ne devrait pas être suffisant pour décourager les joueurs occasionnels pour lesquels la série Inspiron a été conçue. Les joueurs qui souhaitent vraiment tirer davantage de performances de leur ordinateur portable devront se tourner vers des modèles plus grands et plus coûteux tels que ceux de la Série Dell G16, Asus Zephyrus G16ou Razer Blade 16 où le TGP peut souvent atteindre trois chiffres.
Prix et disponibilité
Notre configuration Core Ultra 7, RTX 4060 et 1600p est actuellement livrée directement par Dell au prix de 1300$. Parallèlement, le Core i7 bas de gamme avec UHD Graphics SKU est proposé à partir de 900 $.
Dell Inspiron 16 Plus 7640
- 06/21/2024 v8
Allen Ngo
Transparency
La sélection des appareils à examiner est effectuée par notre équipe éditoriale. L'échantillon de test a été prêté à l'auteur par le fabricant ou le détaillant pour les besoins de cet examen. Le prêteur n'a pas eu d'influence sur cette évaluation et le fabricant n'a pas reçu de copie de cette évaluation avant sa publication. Il n'y avait aucune obligation de publier cet article. En tant que média indépendant, Notebookcheck n'est pas soumis à l'autorité des fabricants, des détaillants ou des éditeurs.
Voici comment Notebookcheck teste
Chaque année, Notebookcheck examine de manière indépendante des centaines d'ordinateurs portables et de smartphones en utilisant des procédures standardisées afin de garantir que tous les résultats sont comparables. Nous avons continuellement développé nos méthodes de test depuis environ 20 ans et avons établi des normes industrielles dans le processus. Dans nos laboratoires de test, des équipements de mesure de haute qualité sont utilisés par des techniciens et des rédacteurs expérimentés. Ces tests impliquent un processus de validation en plusieurs étapes. Notre système d'évaluation complexe repose sur des centaines de mesures et de points de référence bien fondés, ce qui garantit l'objectivité.

