Test du Framework Laptop 16 : les débuts de la Radeon RX 7700S

Dévoilé à la GDC 2023le Framework Laptop 16 reprend les aspects de réparabilité et de durabilité du Framework 13.5, mais dans un format plus grand de 16 pouces. Il s'agit cependant de bien plus qu'une simple version plus grande, car la taille plus importante de l'écran a permis de personnaliser encore plus l'ordinateur et d'ajouter des pièces optionnelles par rapport au design original de 13,5 pouces, notamment des graphiques discrets amovibles, des entretoises de pavé tactile, des LED et un pavé numérique.
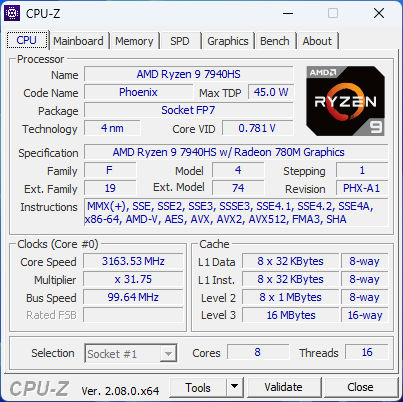
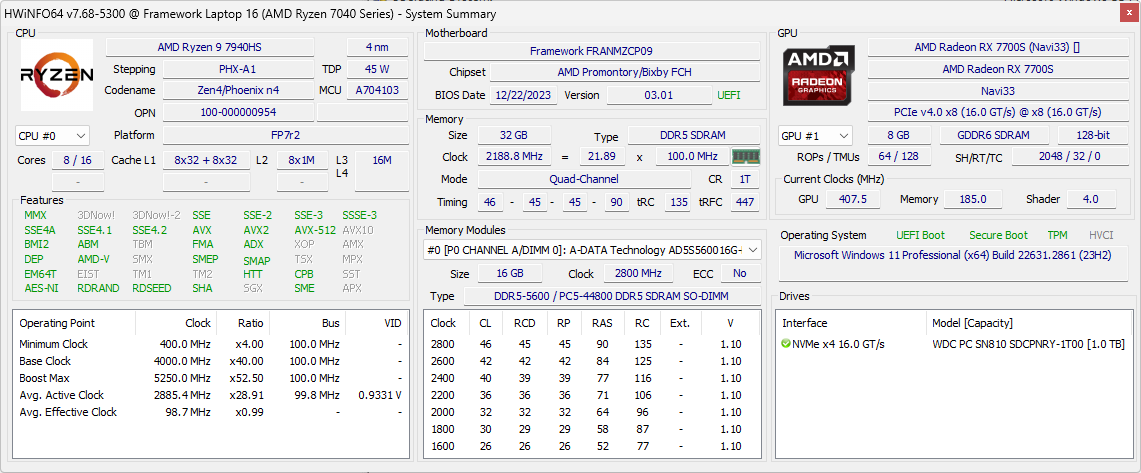
Notre unité de test est la configuration la plus haut de gamme avec le Ryzen 9 7940HS et la Radeon RX 7700S de 100 W pour un prix de détail d'environ 2400 USD. Les SKUs plus bas de gamme sont livrés avec le Ryzen 7 7840HS et sans GPU discret, mais toutes les options sont livrées avec le même écran IPS VRR 1600p 165 Hz. Des kits Barebone et DIY sont également disponibles, comme pour le Laptop 13.5. Framework indique que la société a travaillé en étroite collaboration avec AMD sur la conception du Laptop 16, ce qui implique que nous ne devrions pas retenir notre souffle pour des options Intel-Nvidia de sitôt.
Bien que le Laptop 16 soit tout à fait capable de jouer grâce à ses spécifications, Framework évite soigneusement de le qualifier de portable de jeu, de peur de cataloguer le modèle. Le Laptop 16 vise plutôt un public plus large composé d'utilisateurs multimédias, de créateurs de contenu et de joueurs. Parmi les concurrents du Laptop 16, on trouve des ordinateurs portables de 16 pouces de fabricants plus traditionnels, comme le HP Spectre x360 16et le futur Dell XPS 16, Le Lenovo ThinkPad Z16ou le Apple MacBook Pro 16.
Plus d'avis sur le cadre :
Comparaison avec les concurrents potentiels
Note | Date | Modèle | Poids | Épaisseur | Taille | Résolution | Prix |
|---|---|---|---|---|---|---|---|
| 89.6 % v7 (old) | 01/24 | Framework Laptop 16 R9 7940HS, Radeon RX 7700S | 2.4 kg | 20.95 mm | 16.00" | 2560x1600 | |
| 88.1 % v7 (old) | 12/23 | MSI Prestige 16 B1MG-001US Ultra 7 155H, Arc 8-Core | 1.6 kg | 19.1 mm | 16.00" | 2560x1600 | |
| 88.6 % v7 (old) | 12/23 | Lenovo ThinkPad Z16 Gen 2 R9 PRO 7940HS, Radeon RX 6550M | 1.8 kg | 15.8 mm | 16.00" | 3840x2400 | |
| 93.2 % v7 (old) | 11/23 | Apple MacBook Pro 16 2023 M3 Max Apple M3 Max 16-Core, M3 Max 40-Core GPU | 2.1 kg | 16.9 mm | 16.00" | 3456x2234 | |
| 87.1 % v7 (old) | 08/23 | Dell Inspiron 16 Plus 7630 i7-13700H, GeForce RTX 4060 Laptop GPU | 2.2 kg | 19.95 mm | 16.00" | 2560x1600 | |
| 87.3 % v7 (old) | 01/23 | HP Spectre x360 2-in-1 16-f1075ng i7-12700H, Iris Xe G7 96EUs | 2 kg | 19.9 mm | 16.00" | 3072x1920 |
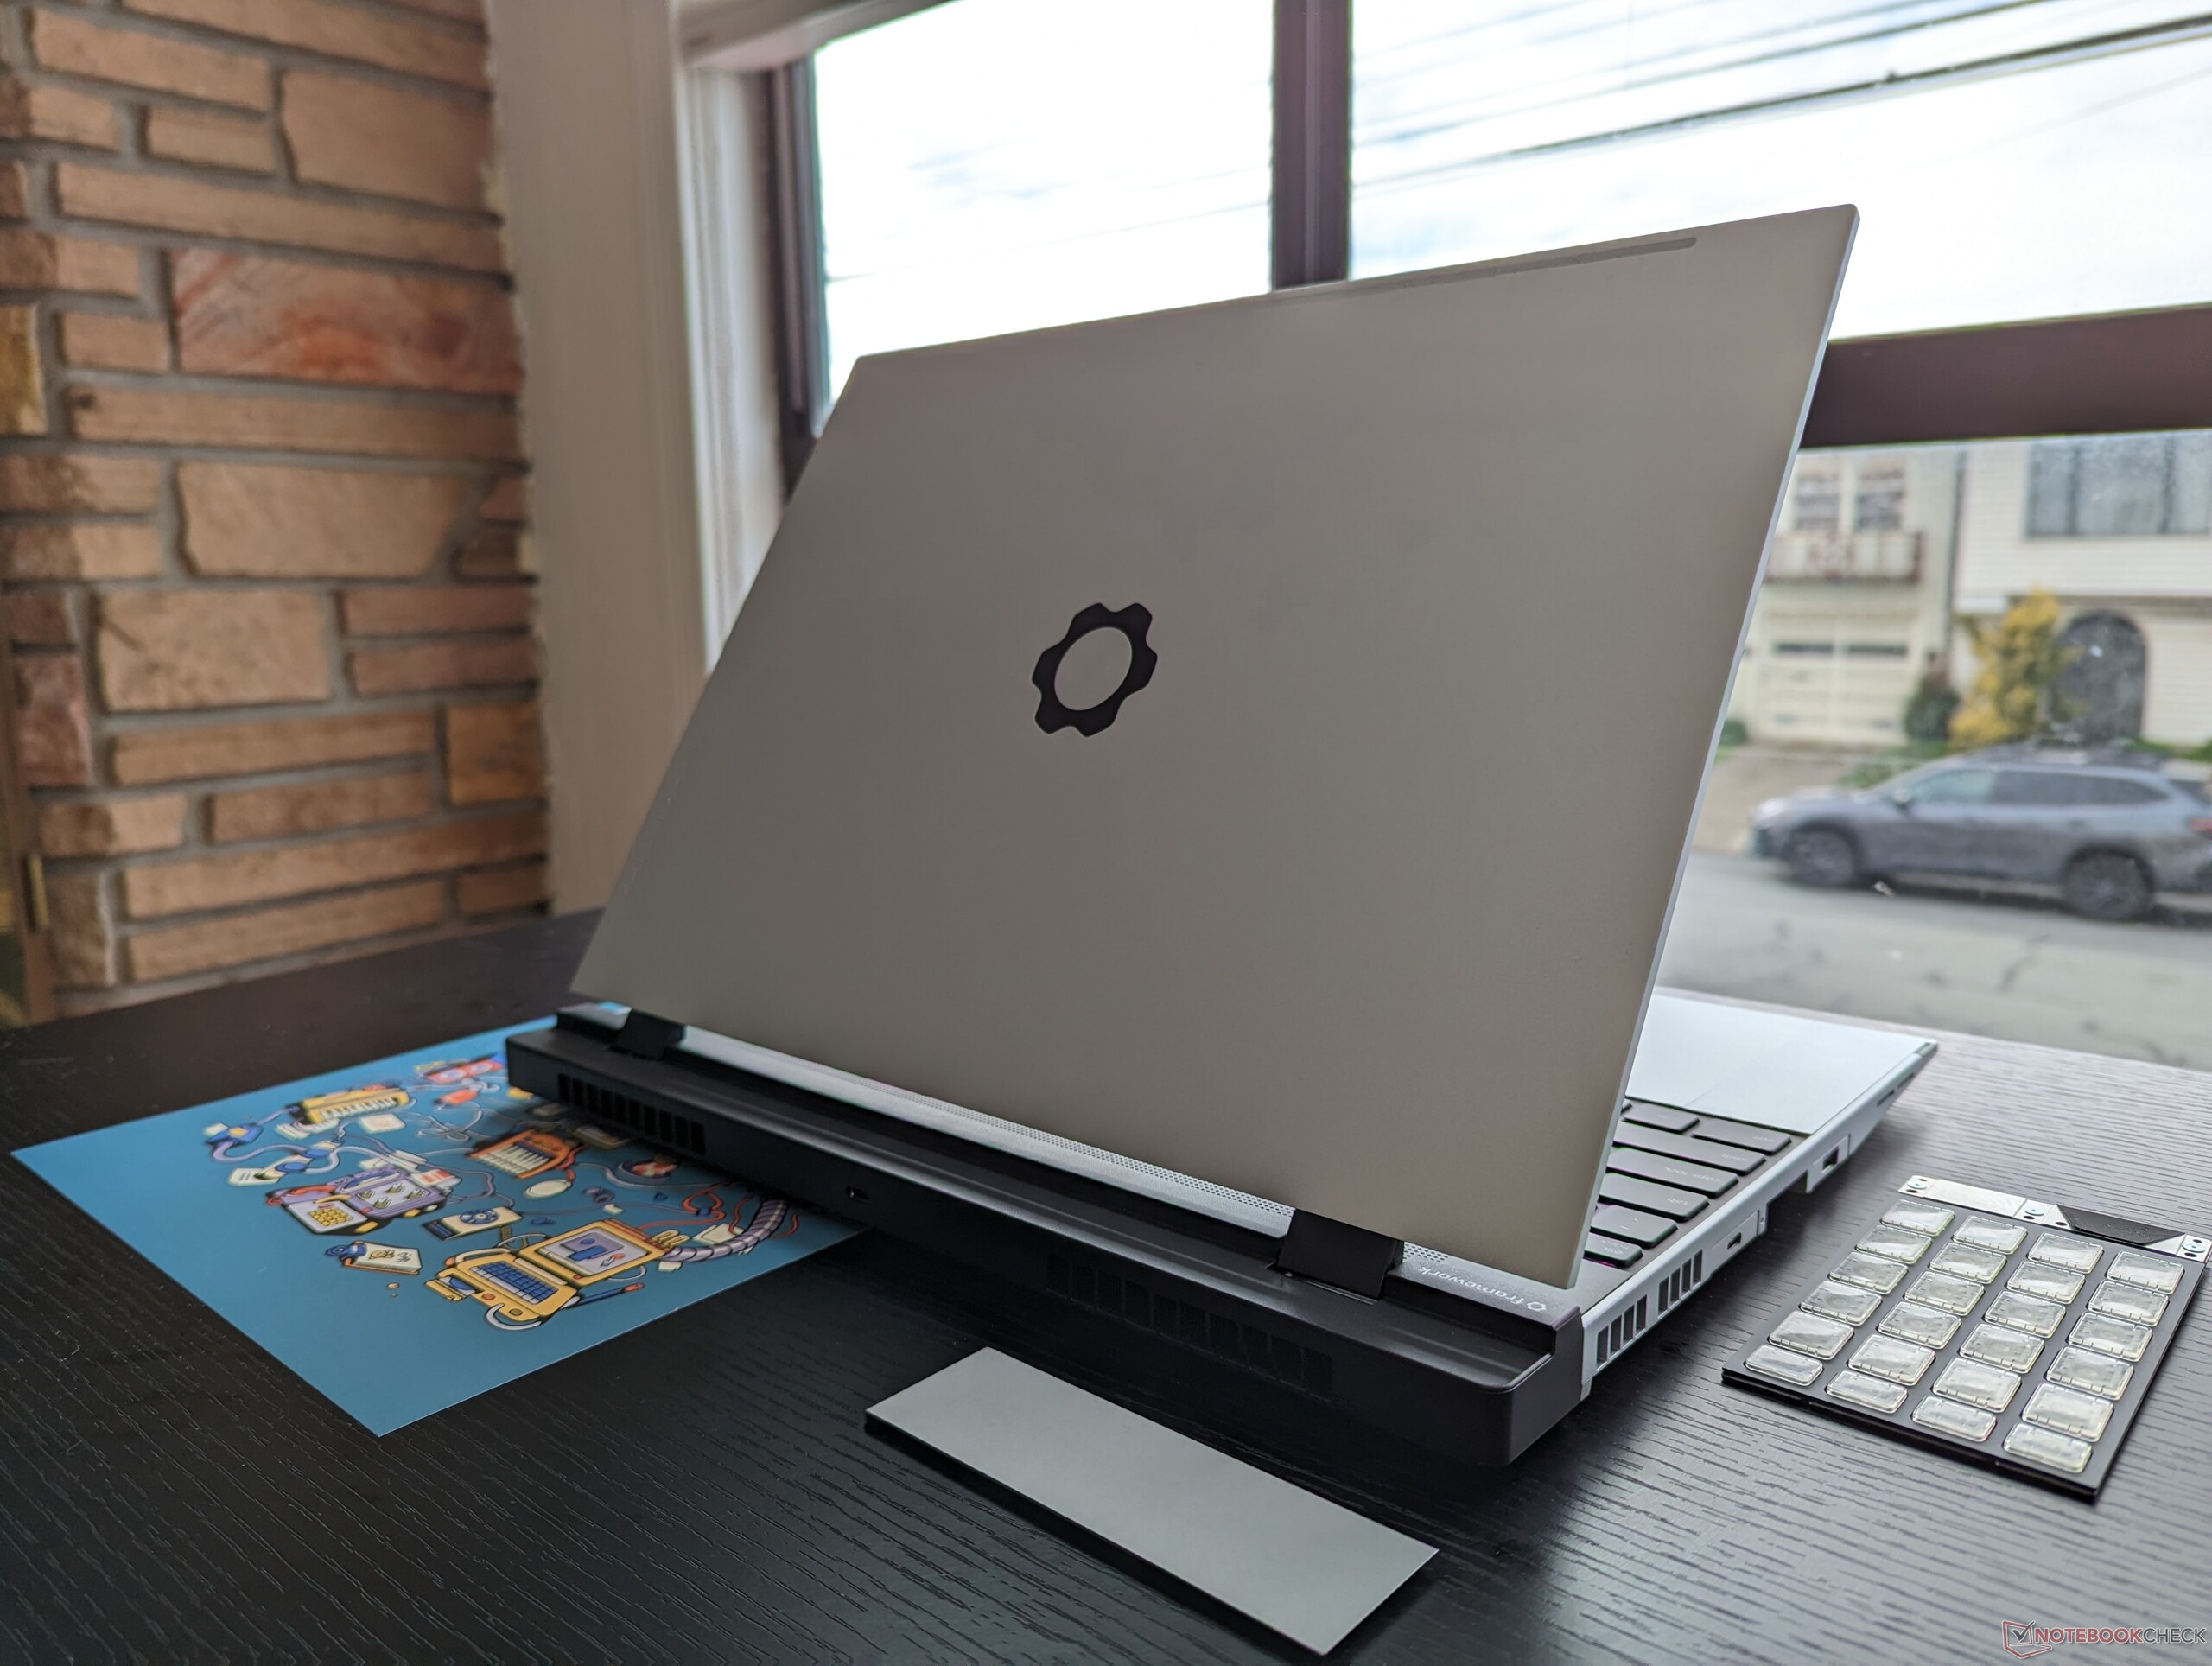
Cas - Quand la forme rencontre la fonction
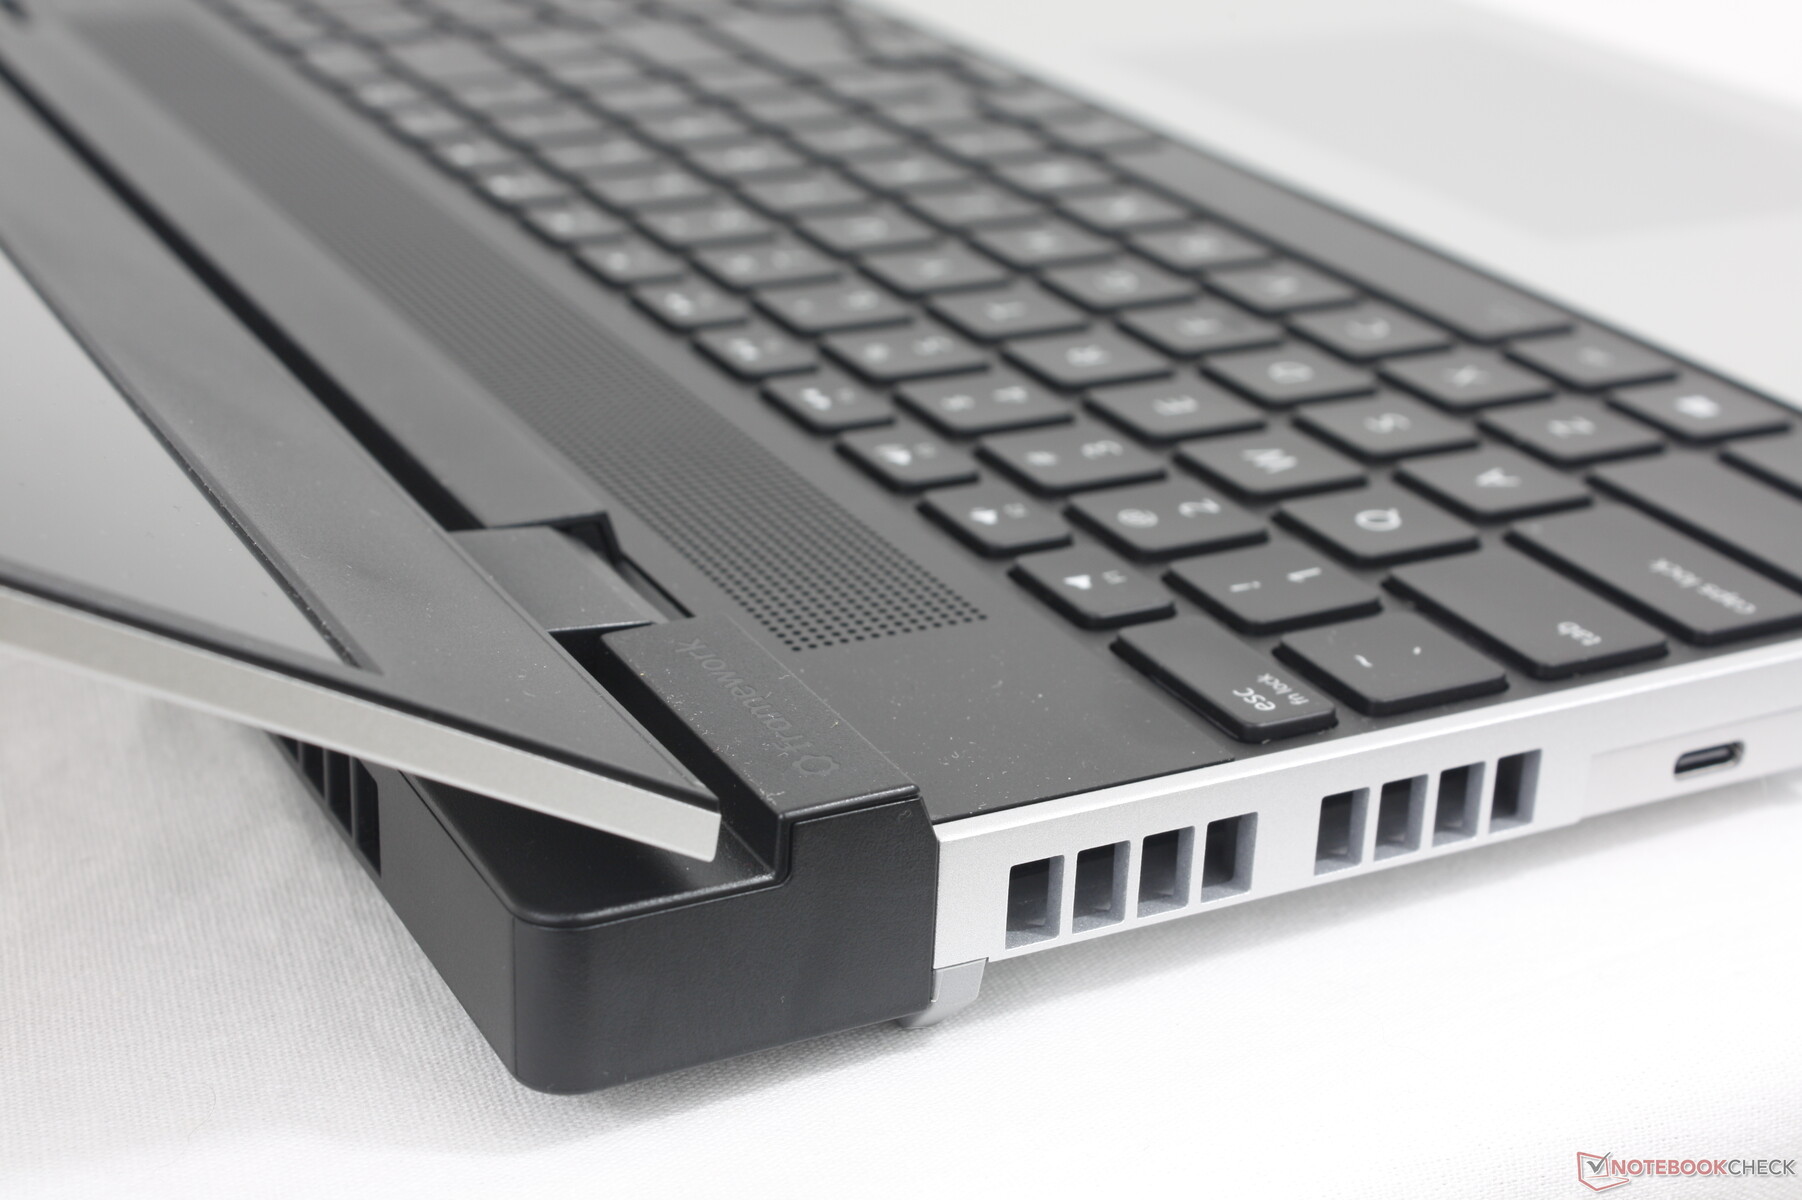
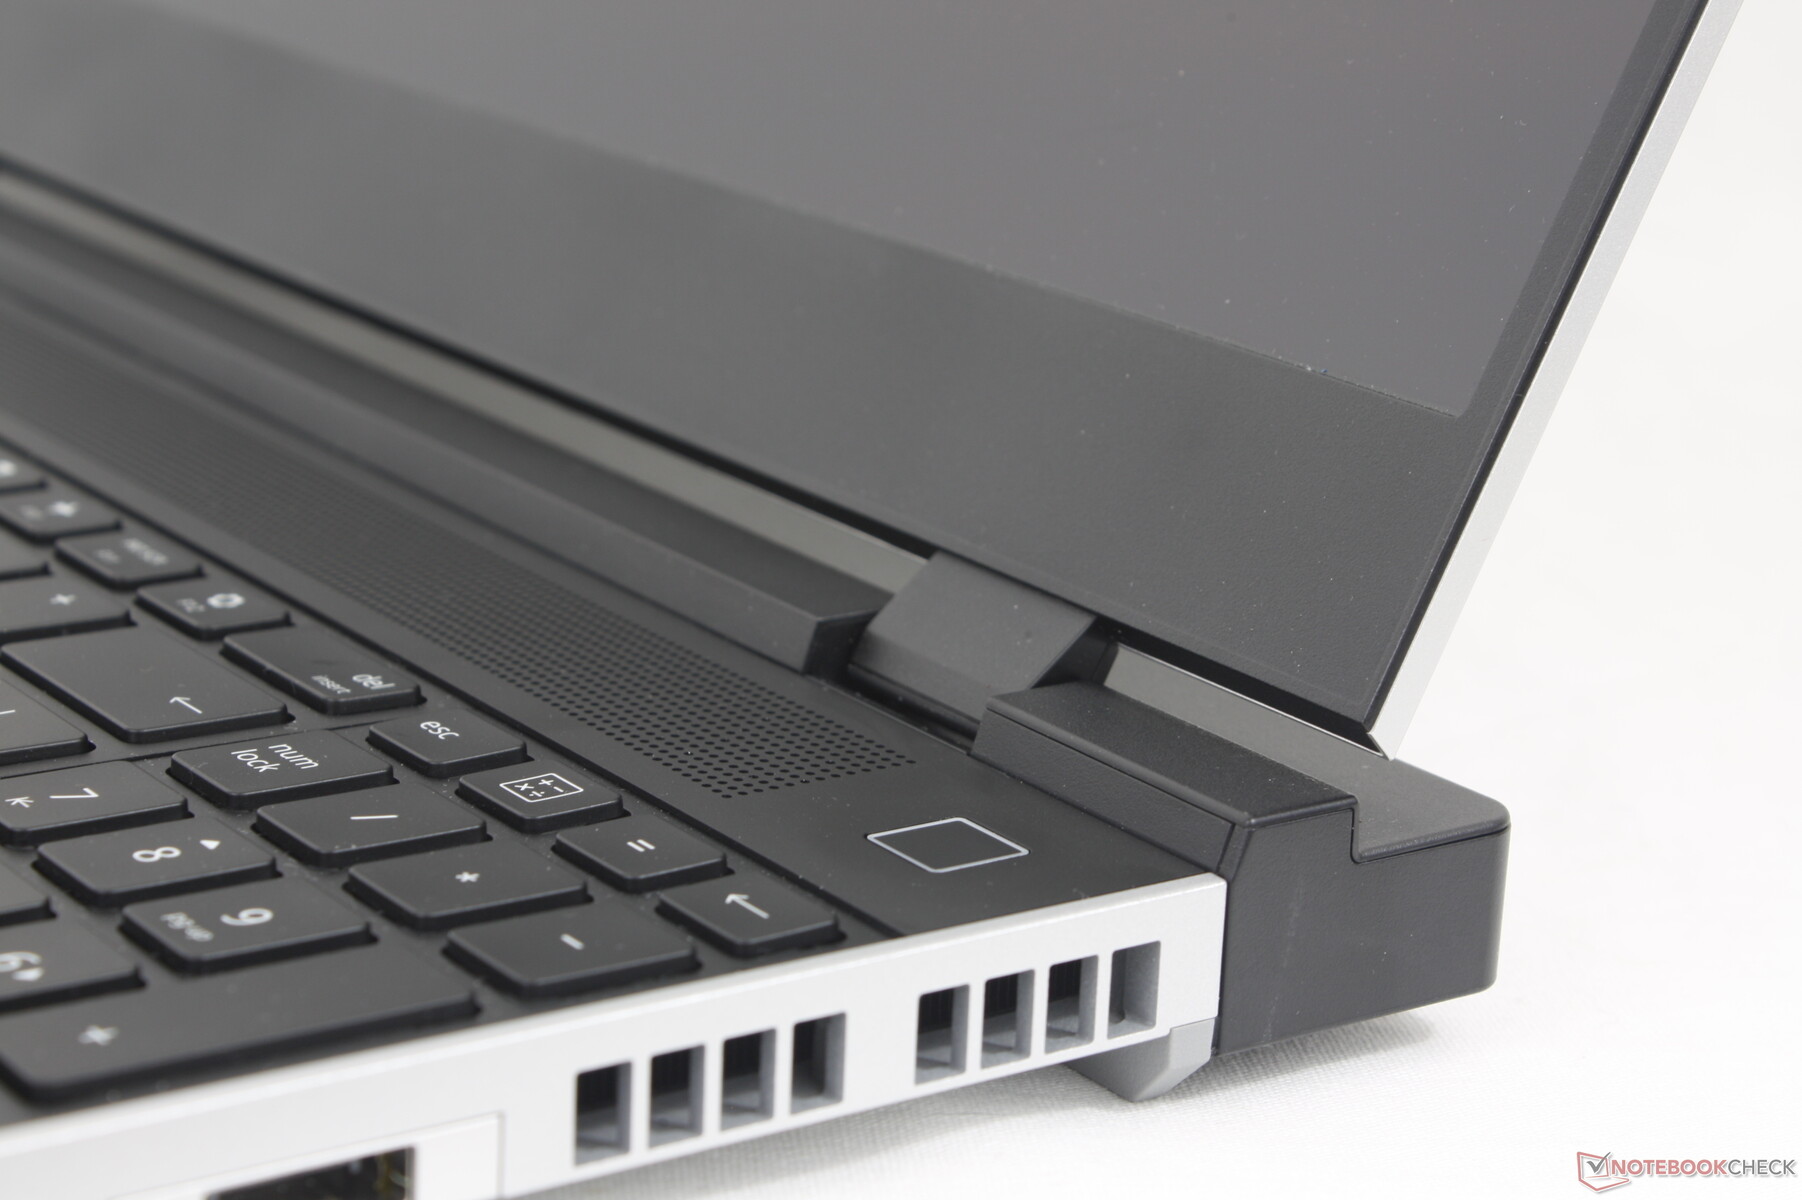
Le châssis est une évolution du plus petit Laptop 13.5. Bien que les matériaux soient en grande partie les mêmes, le Laptop 16 semble plus épais et plus rigide autour de la base pour une meilleure première impression, même en tenant compte de toutes les nouvelles pièces amovibles. Si vous tentez de tordre la base ou de déformer le clavier, vous n'obtiendrez pratiquement aucun grincement et des distorsions minimes, ce qui constitue déjà une grande amélioration par rapport au fragile Laptop 13.5.
Malheureusement, un attribut n'a pas été amélioré, il s'agit du couvercle. Comme sur le Laptop 13.5, le couvercle du Laptop 16 est plus susceptible de se tordre et de se déformer par rapport à d'autres modèles de 16 pouces comme le HP Spectre x360 16 ou le Blade 16. Les charnières peuvent être décentes, mais le couvercle semble être l'aspect le plus faible du châssis encore une fois.
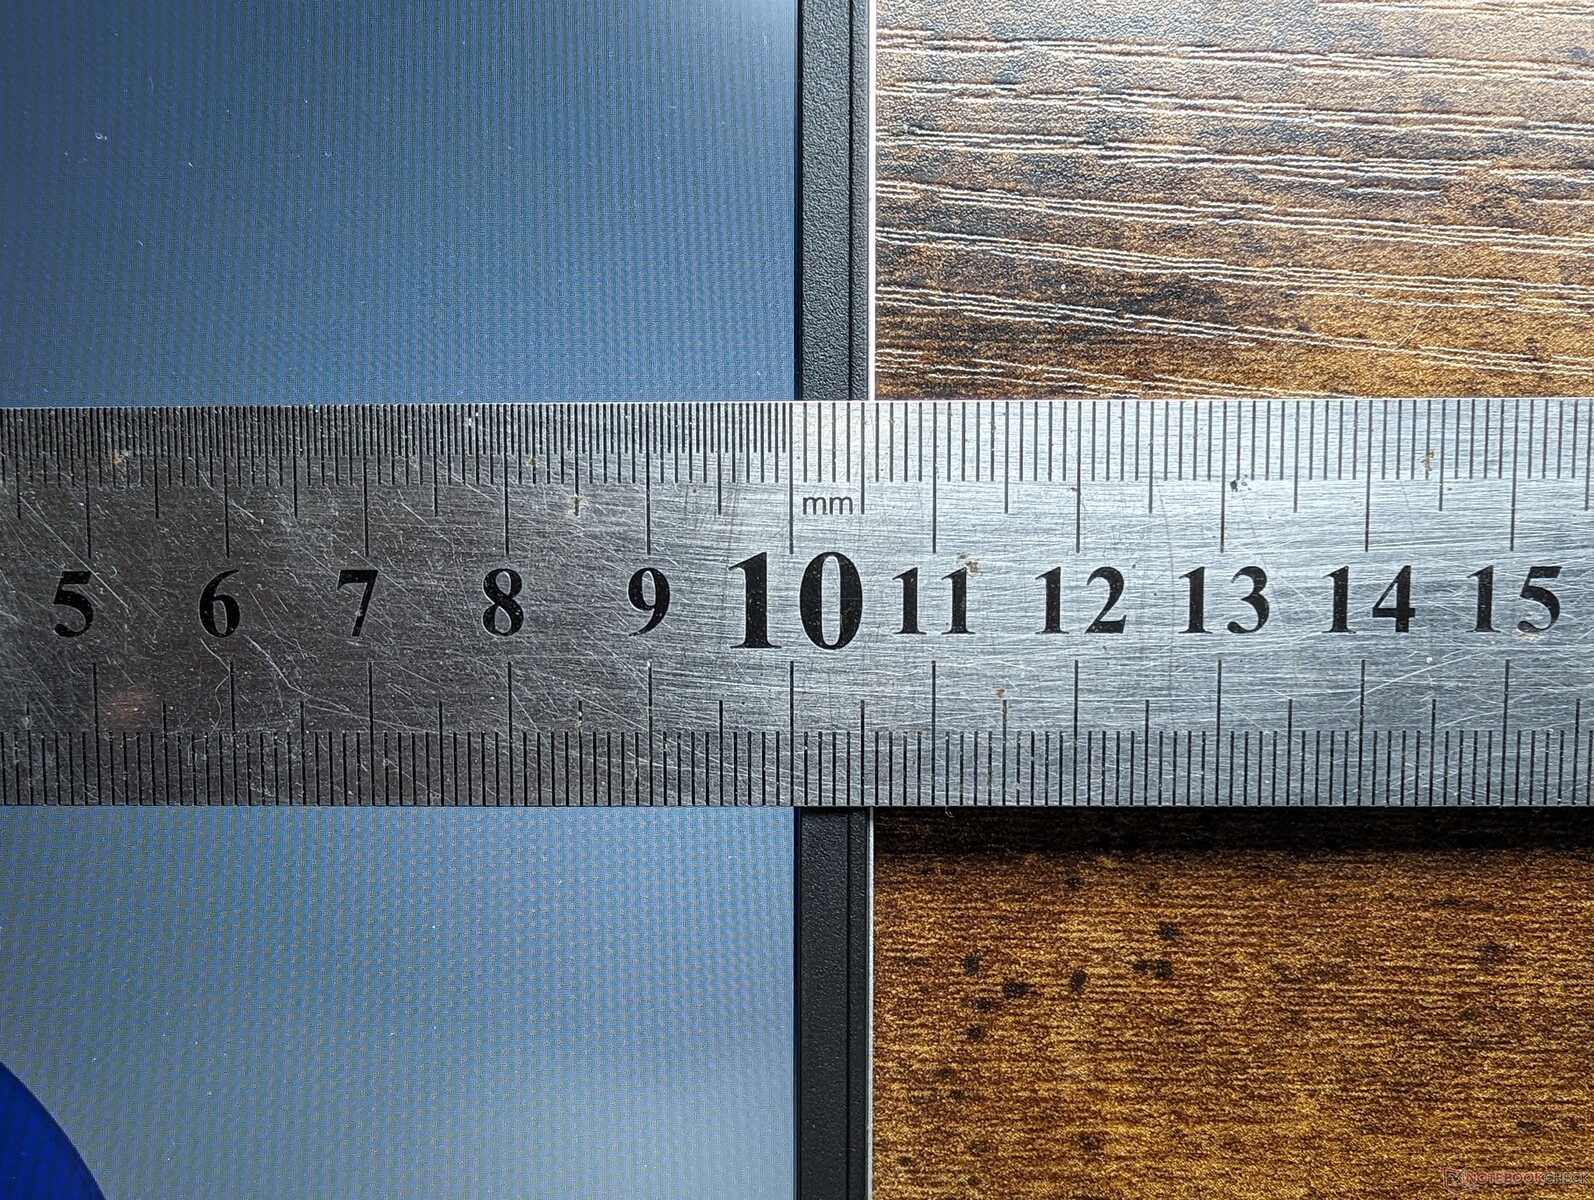
Les dimensions et le poids diffèrent selon que le module dGPU est attaché ou que le module de couverture standard plus petit est attaché à la place. En effet, le Laptop 16 devient sensiblement plus lourd et plus long que les autres ordinateurs portables multimédias de 16 pouces lorsque son module dGPU est fixé. Son design est déjà assez long (270 mm) avec le module de couverture standard. Si la portabilité est une préoccupation, vous pouvez certainement faire mieux avec des ordinateurs portables plus traditionnels de Apple ou la Série LG Gram.
| Avec le module d'extension standard | 356.58 x 270,0 x 17,95 mm | 2.1 kg |
| Avec module de baie graphique discrète | 356.58 x 290,2 x 20,95 mm | 2.4 kg |
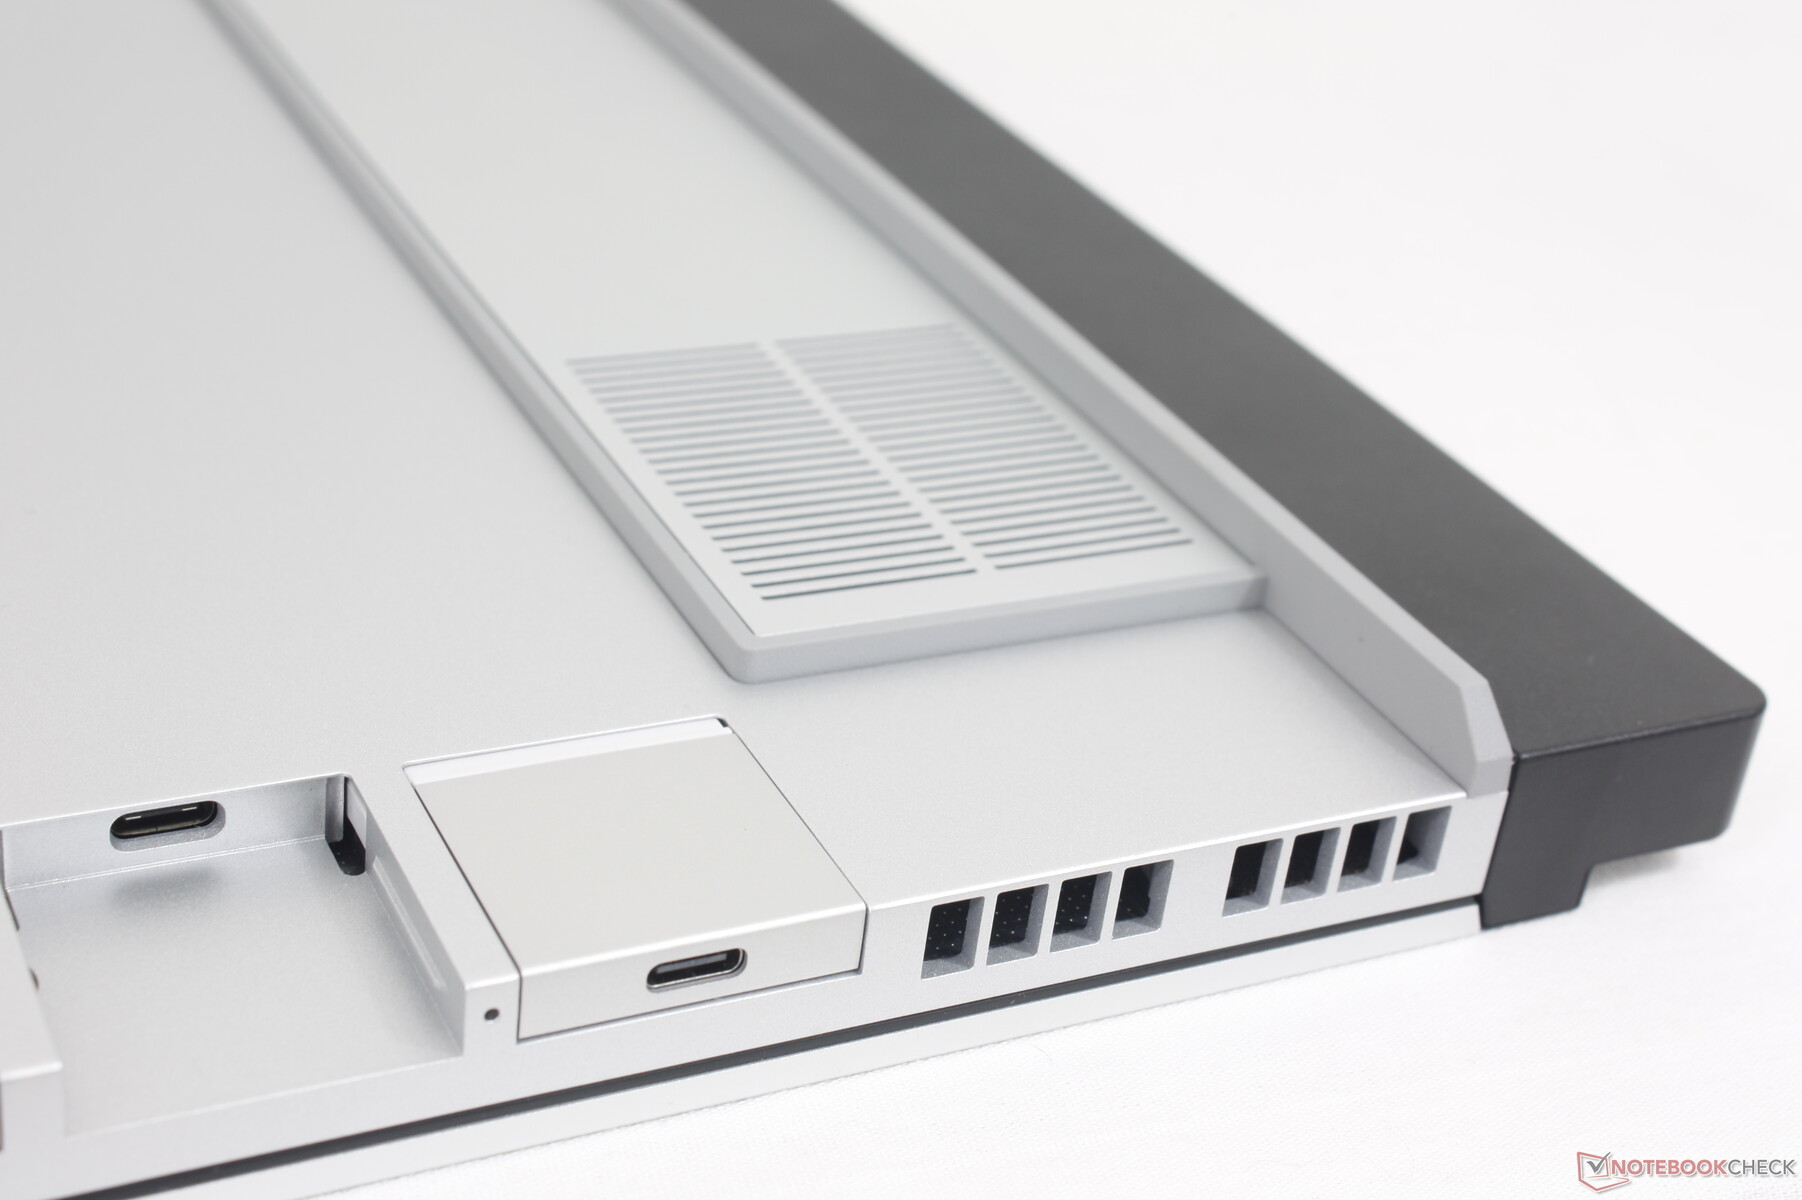
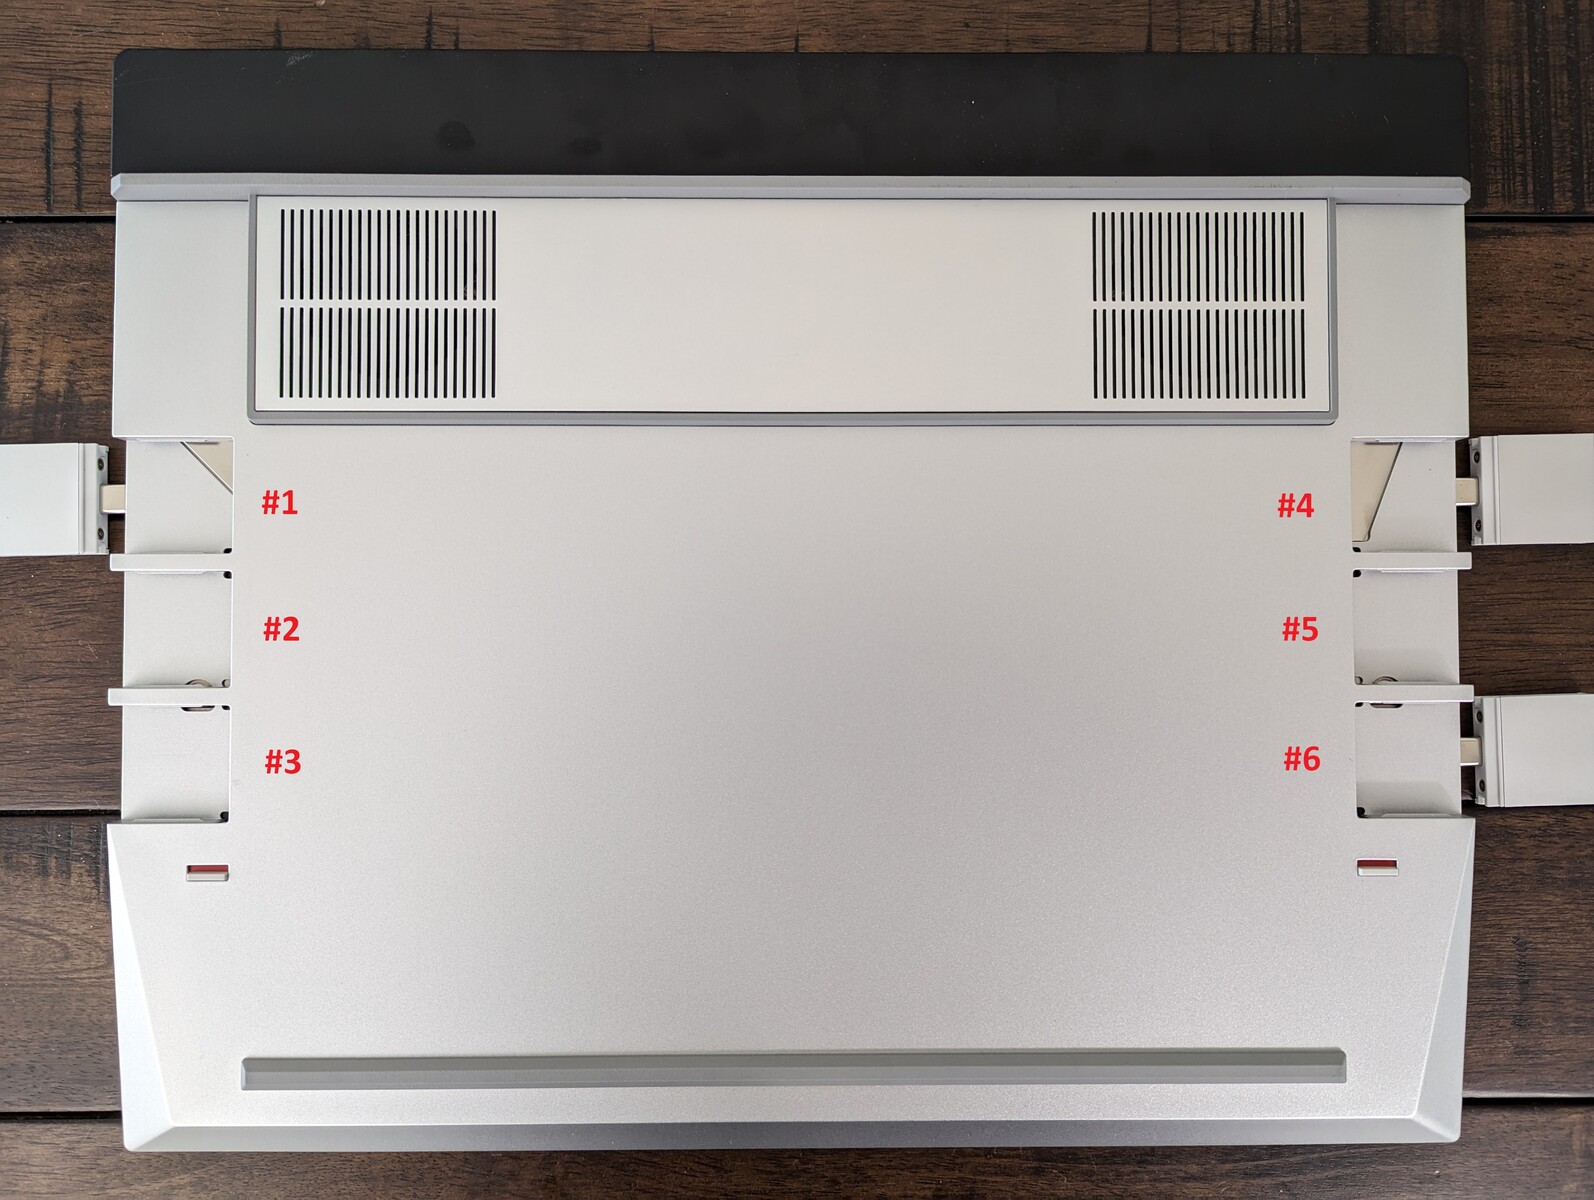
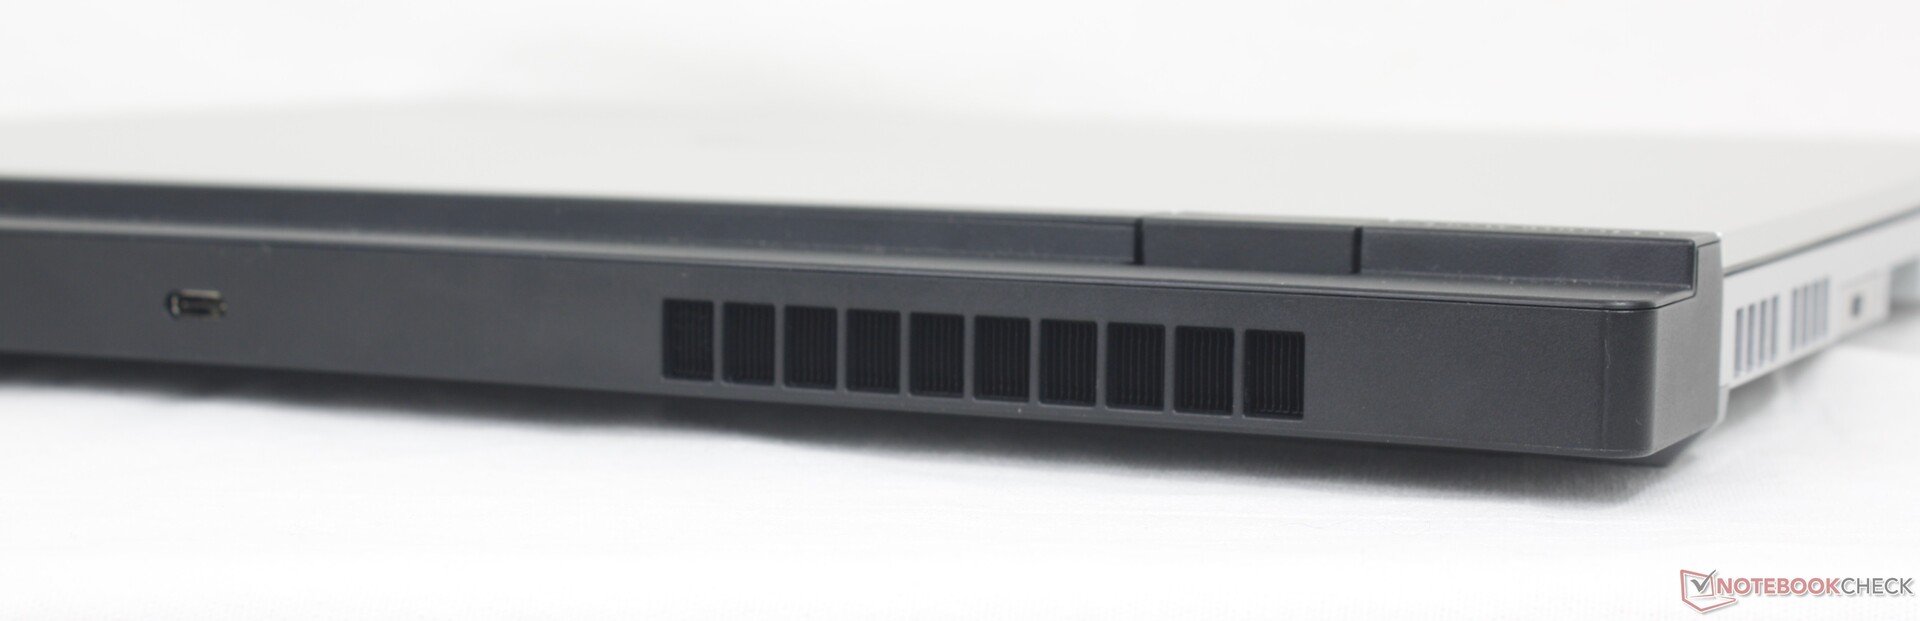
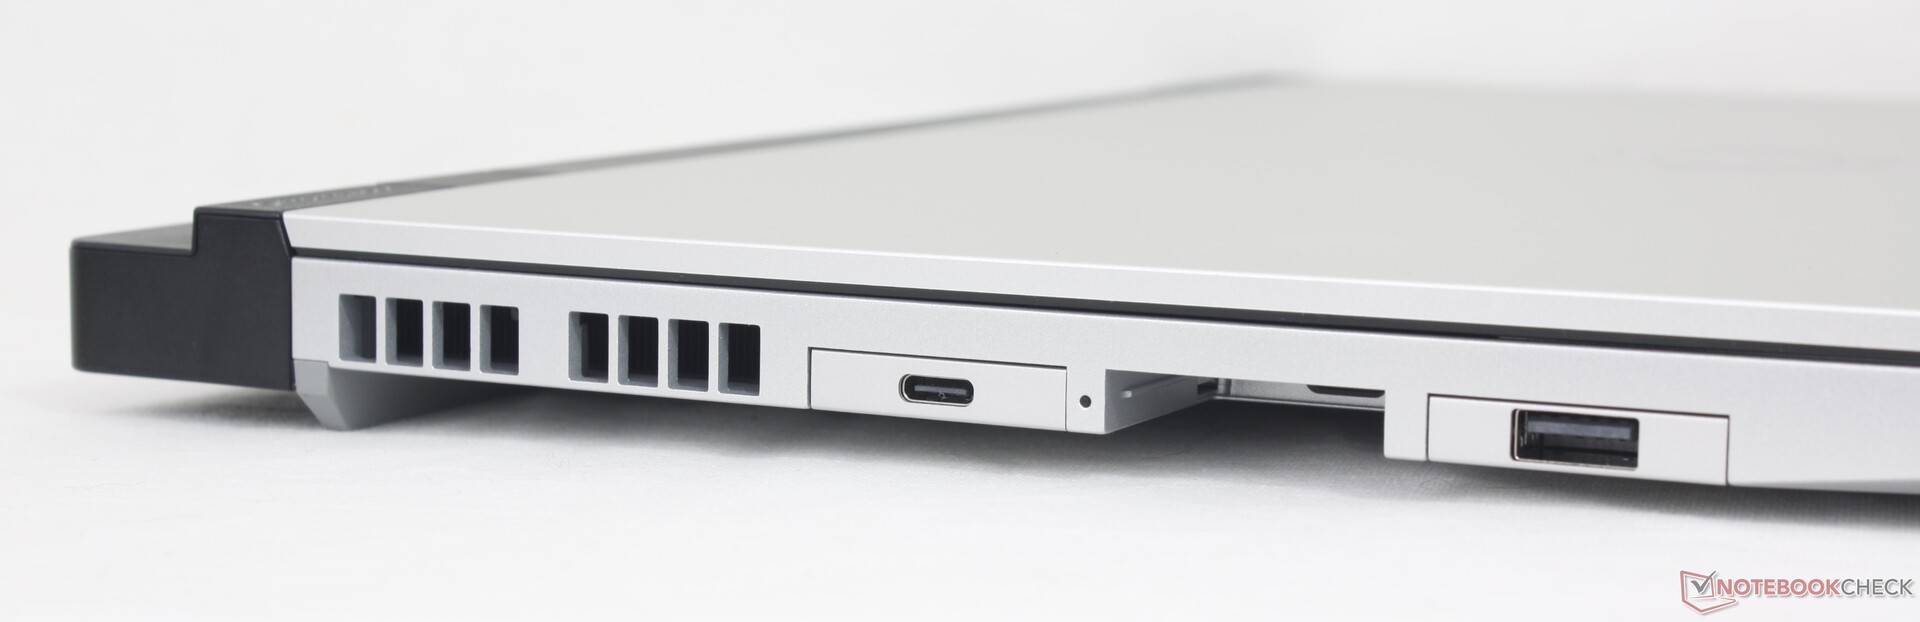
Connectivité - Six ports personnalisables
C'est le seul ordinateur portable de mémoire récente à intégrer un total de six ports USB-C et rien d'autre - pas même une prise audio ou un verrou Kensington. Les six ports sont compatibles avec la gamme existante de cartes d'extension de Framework et fonctionnent donc de la même manière que sur le Laptop 13.5.
Il est important de noter que les six ports USB-C ne sont pas créés égaux, comme le montre notre tableau ci-dessous. Seuls deux sont USB4, trois sont compatibles avec DP et quatre sont compatibles avec l'adaptateur secteur USB-C. Il n'y a pas d'indicateurs visuels pour différencier les ports.
| Emplacement de carte d'extension # | Interface | Compatible DisplayPort ? | 240 W USB-C Compatible avec la charge ? | USB-A Consommation élevée ? |
| 1 | USB4 | Y | Y | Y |
| 2 | USB 3.2 | N | Y | N |
| 3 | USB 3.2 | N | N | N |
| 4 | USB4 | Y | Y | Y |
| 5 | USB 3.2 | Y | Y | N |
| 6 | USB 3.2 | N | N | N |
En outre, il n'y a toujours pas de cartes d'extension pour les lecteurs SD pleine taille, WAN ou RJ-45. Si ces ports sont importants pour vous, vous devrez vous tourner vers des adaptateurs USB ou des stations d'accueil.
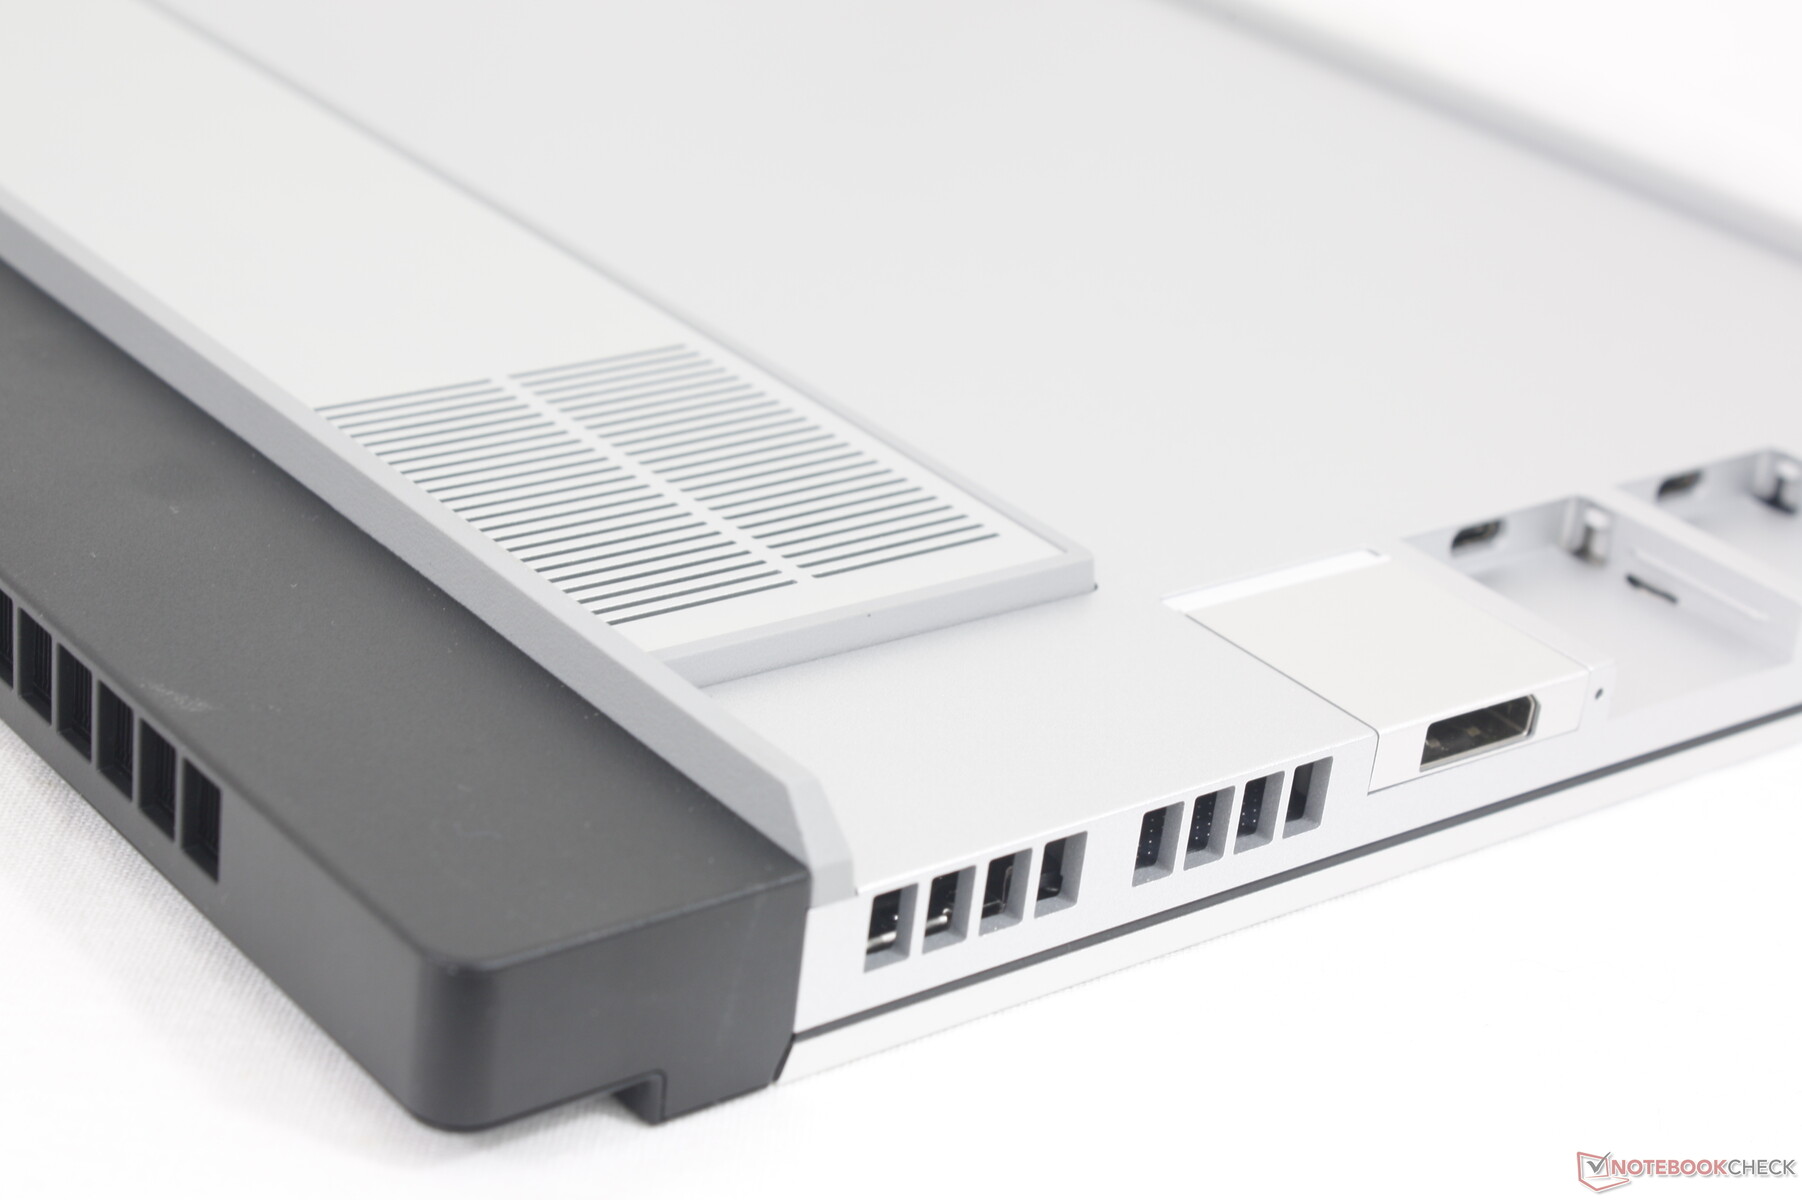
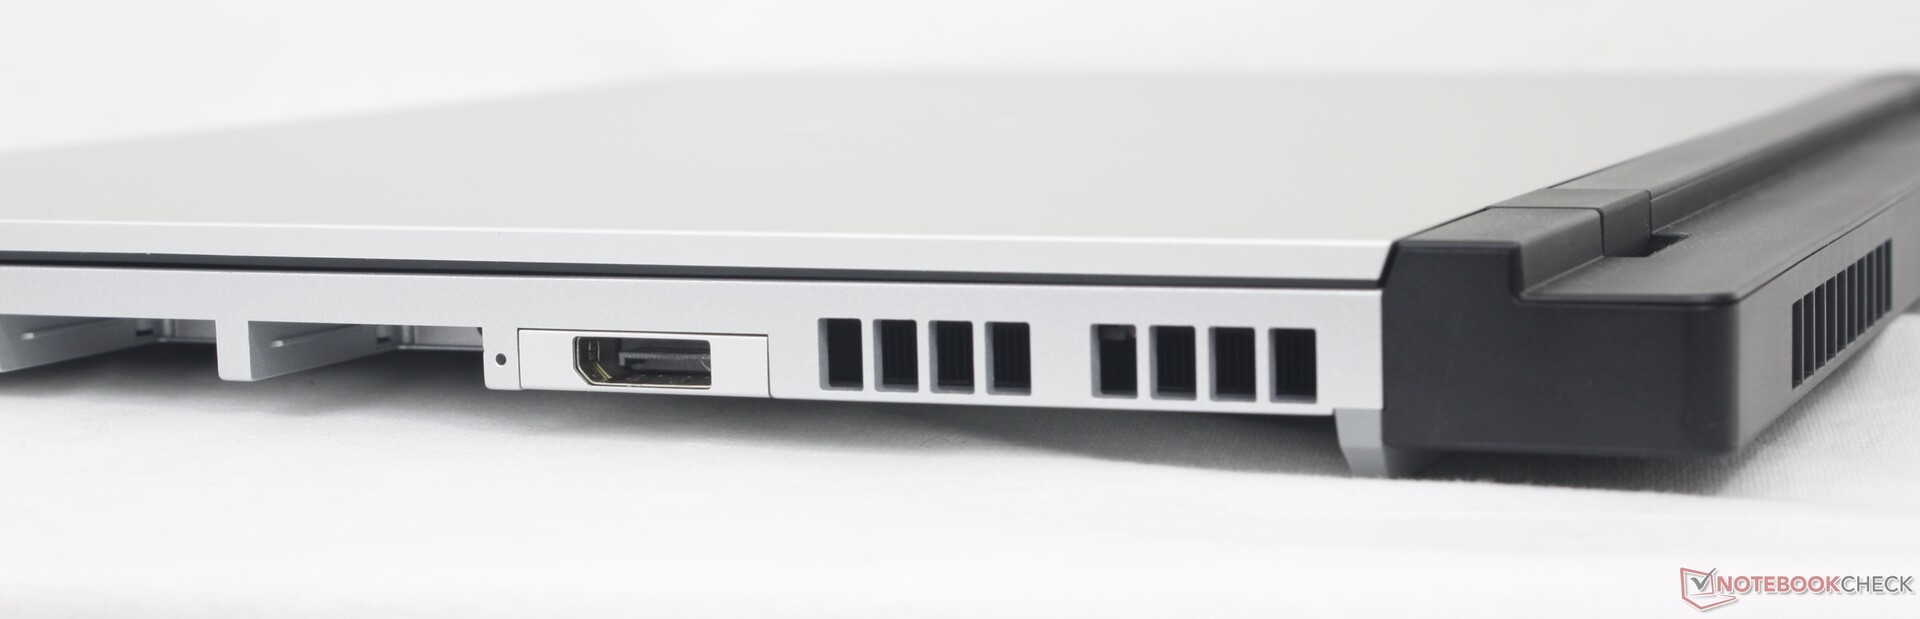
Un septième port USB-C le long du bord arrière devient disponible si le module GPU discret est installé. Ce port est compatible avec le DP mais pas avec l'adaptateur secteur.
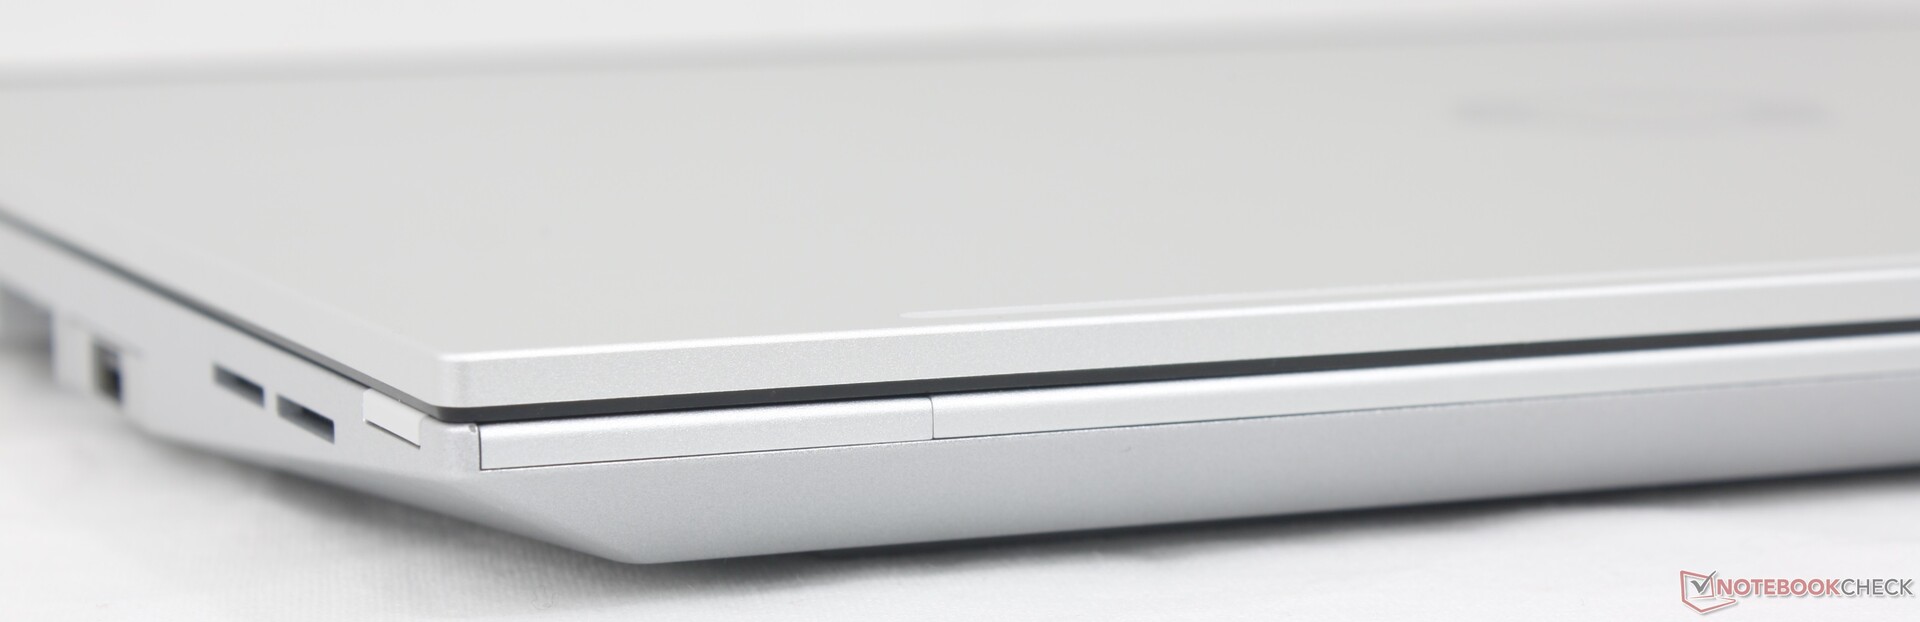
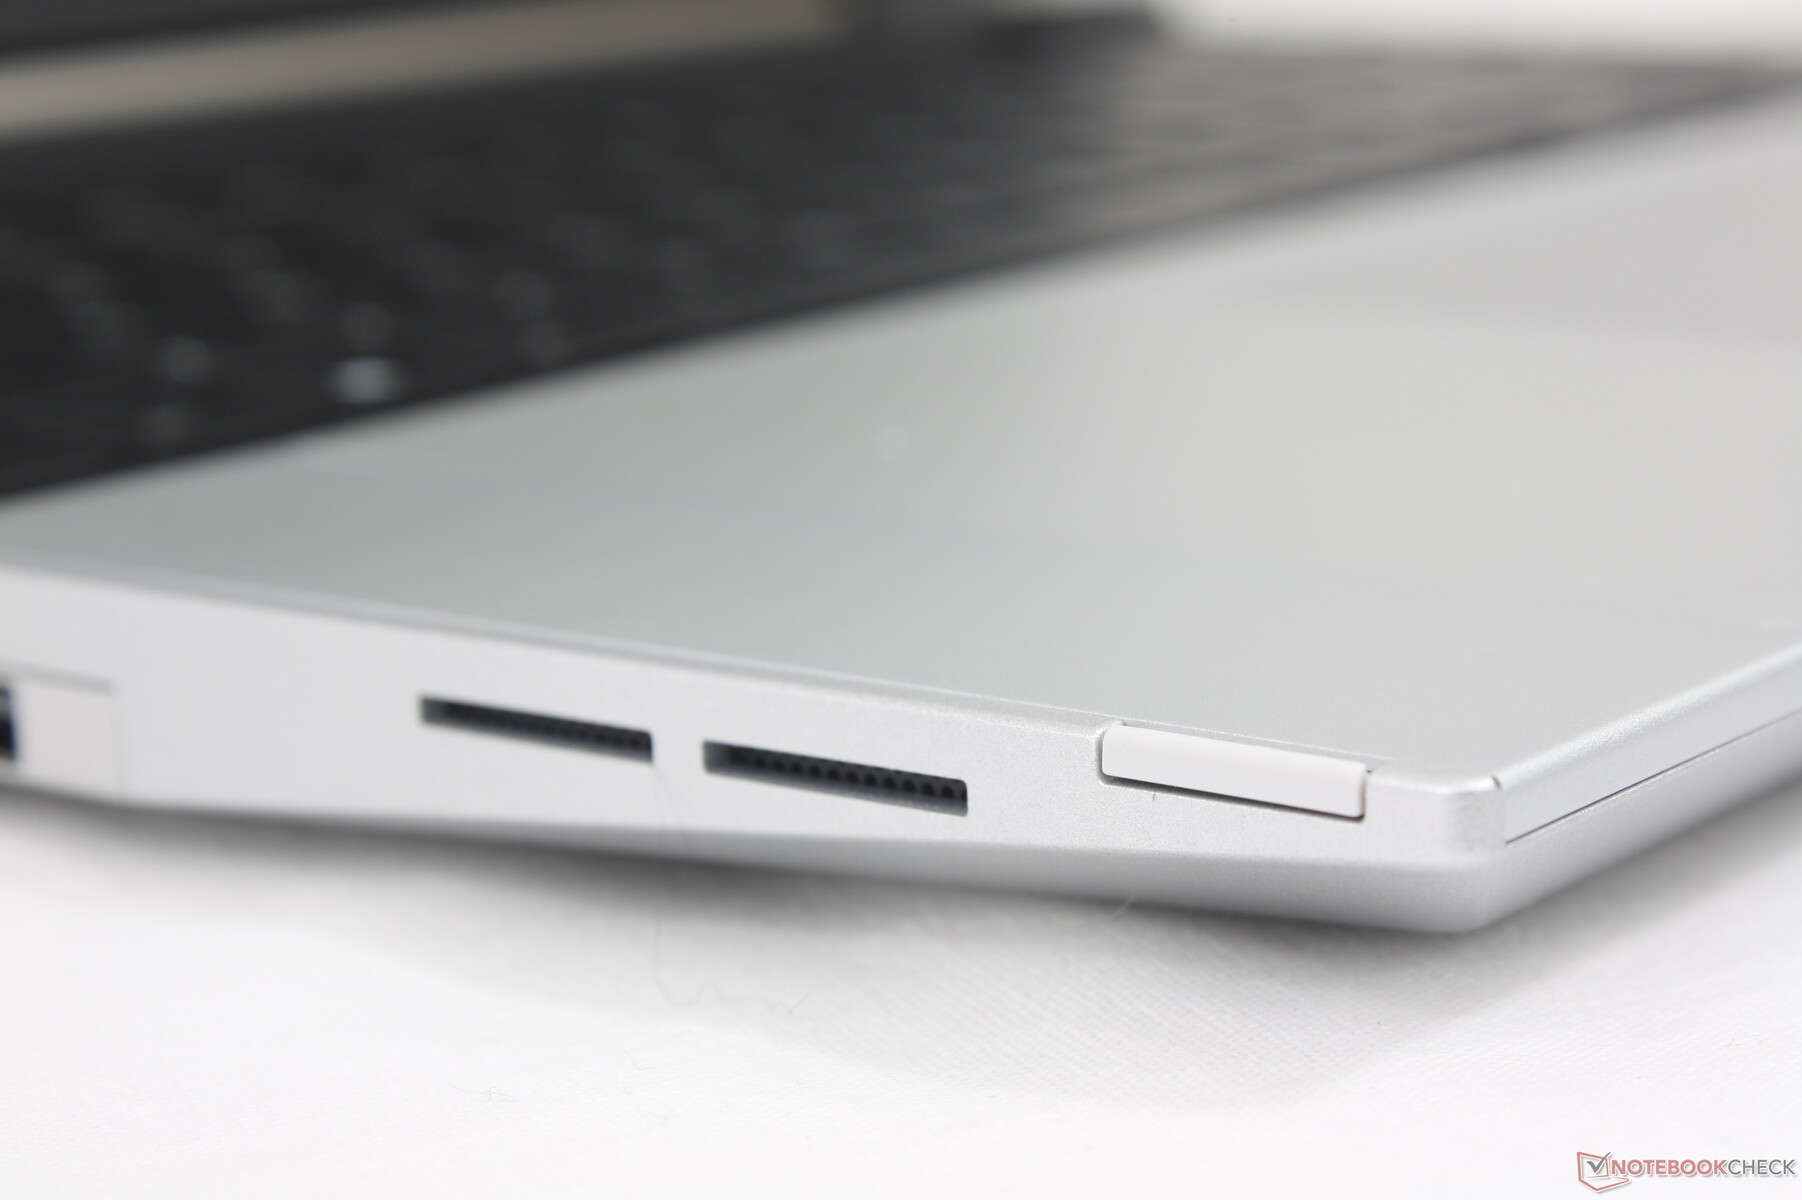
Lecteur de carte SD
Le Laptop 16 utilise le même lecteur de carte d'extension MicroSD que celui du Laptop 13.5 pour des taux de lecture et d'écriture similaires. Avec seulement 80 Mo/s, les performances sont beaucoup plus lentes que celles des lecteurs de cartes des modèles concurrents tels que le ThinkPad Z16 Gen 2 ou le MacBook Pro 16.
Nous n'avons pas accès à la carte d'extension du lecteur de carte SD de notre Laptop 16 et les données du Laptop 13.5 sont donc fournies ci-dessous à sa place.
| SD Card Reader | |
| average JPG Copy Test (av. of 3 runs) | |
| MSI Prestige 16 B1MG-001US (Toshiba Exceria Pro SDXC 64 GB UHS-II) | |
| Apple MacBook Pro 16 2023 M3 Max (Angelbird AV Pro V60) | |
| Lenovo ThinkPad Z16 Gen 2 (Toshiba Exceria Pro SDXC 64 GB UHS-II) | |
| HP Spectre x360 2-in-1 16-f1075ng | |
| Framework Laptop 13.5 (AV Pro UHS-II V60) | |
| Dell Inspiron 16 Plus 7630 (AV Pro SD microSD 128 GB V60) | |
| maximum AS SSD Seq Read Test (1GB) | |
| Lenovo ThinkPad Z16 Gen 2 (Toshiba Exceria Pro SDXC 64 GB UHS-II) | |
| Apple MacBook Pro 16 2023 M3 Max (Angelbird AV Pro V60) | |
| MSI Prestige 16 B1MG-001US (Toshiba Exceria Pro SDXC 64 GB UHS-II) | |
| HP Spectre x360 2-in-1 16-f1075ng | |
| Framework Laptop 13.5 (AV Pro UHS-II V60) | |
| Dell Inspiron 16 Plus 7630 (AV Pro SD microSD 128 GB V60) | |
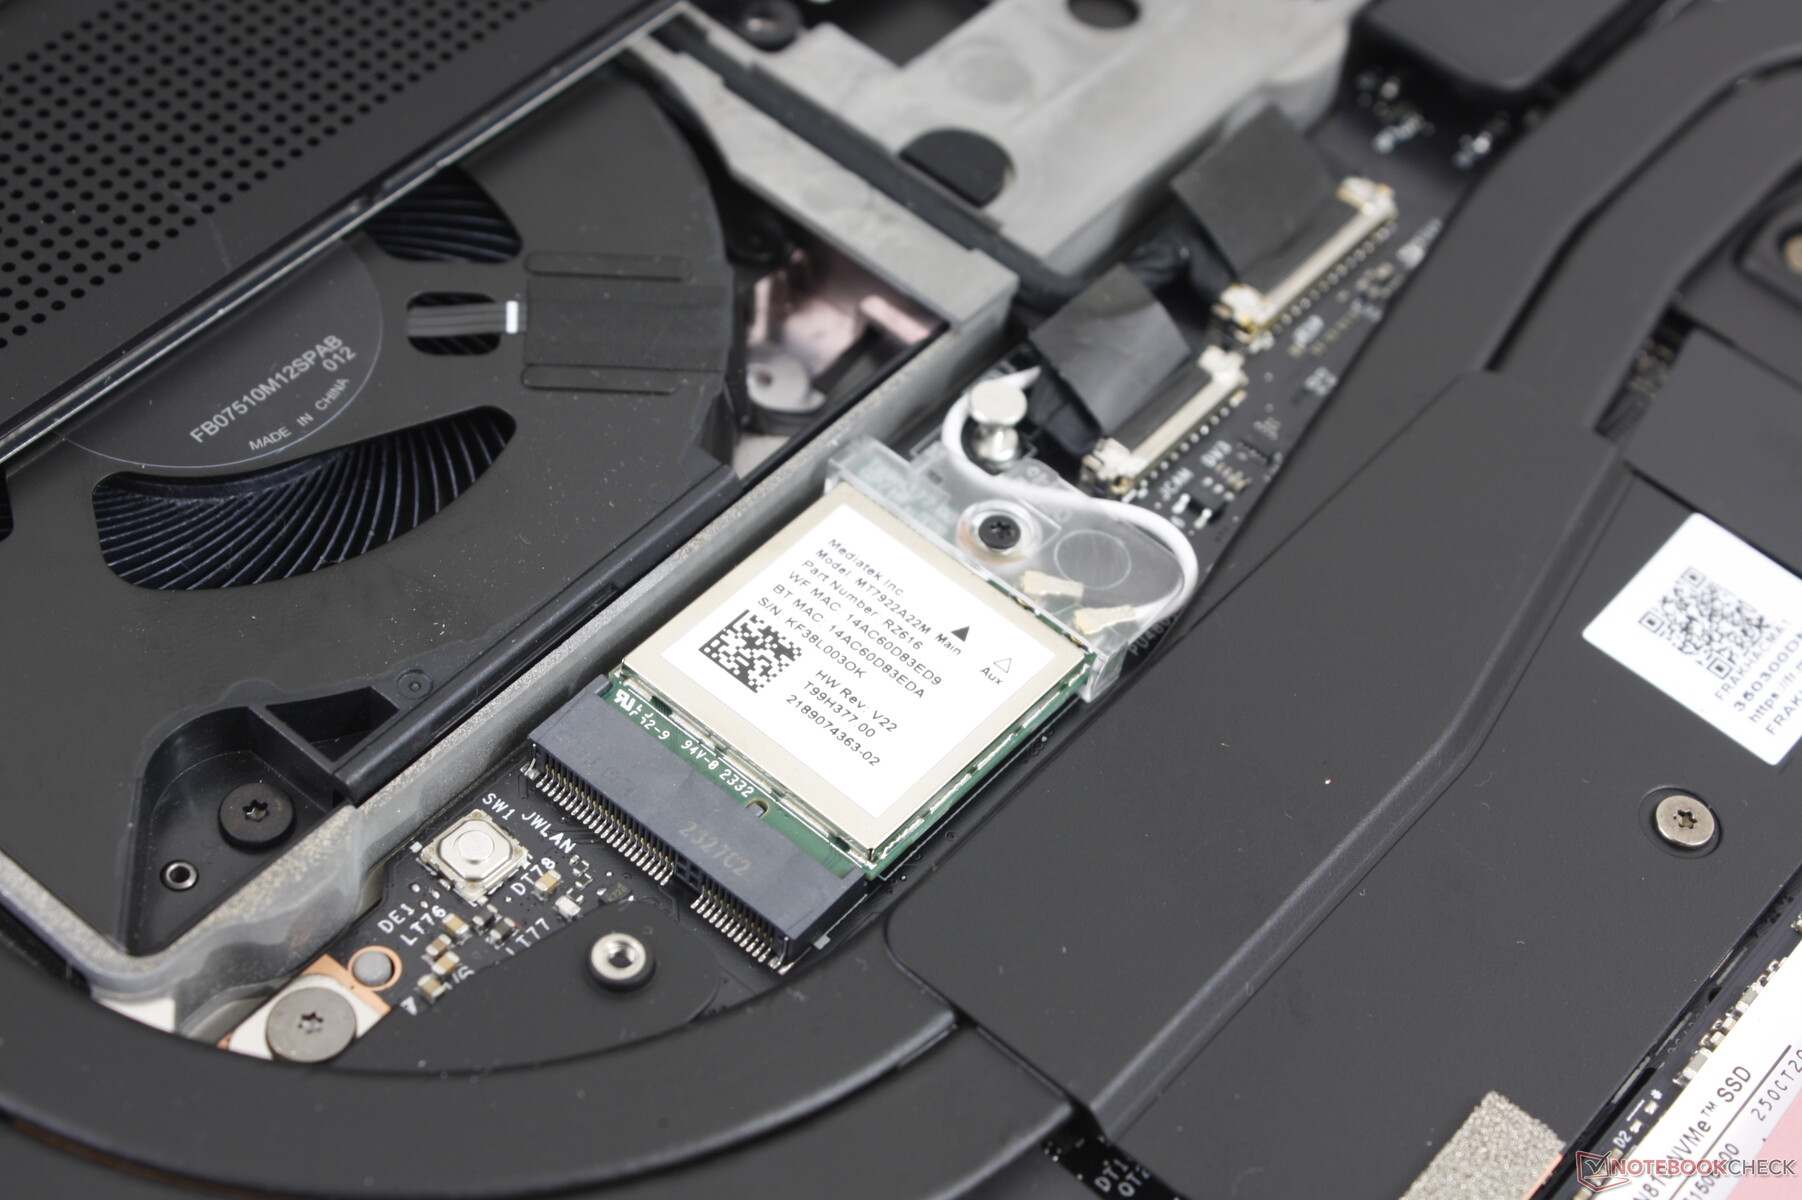
Communication
Le Wi-Fi 6 et 6E est assuré par un MediaTek MT7922 au lieu de l'AX211 habituel, conformément à la conception sans Intel du modèle. Nous avons constaté des connexions régulières et fiables lorsque nous l'avons couplé à notre routeur de test Asus AXE11000.
Le WAN n'est malheureusement pas pris en charge.
Webcam
Une webcam de 2 mégapixels avec infrarouge et obturateur manuel est fournie en standard, alors que des concurrents comme les séries HP Spectre ou Elite sont livrés avec des webcams de 5 mégapixels ou plus depuis plus d'un an. Espérons que Framework proposera de meilleures options de webcam à l'avenir.


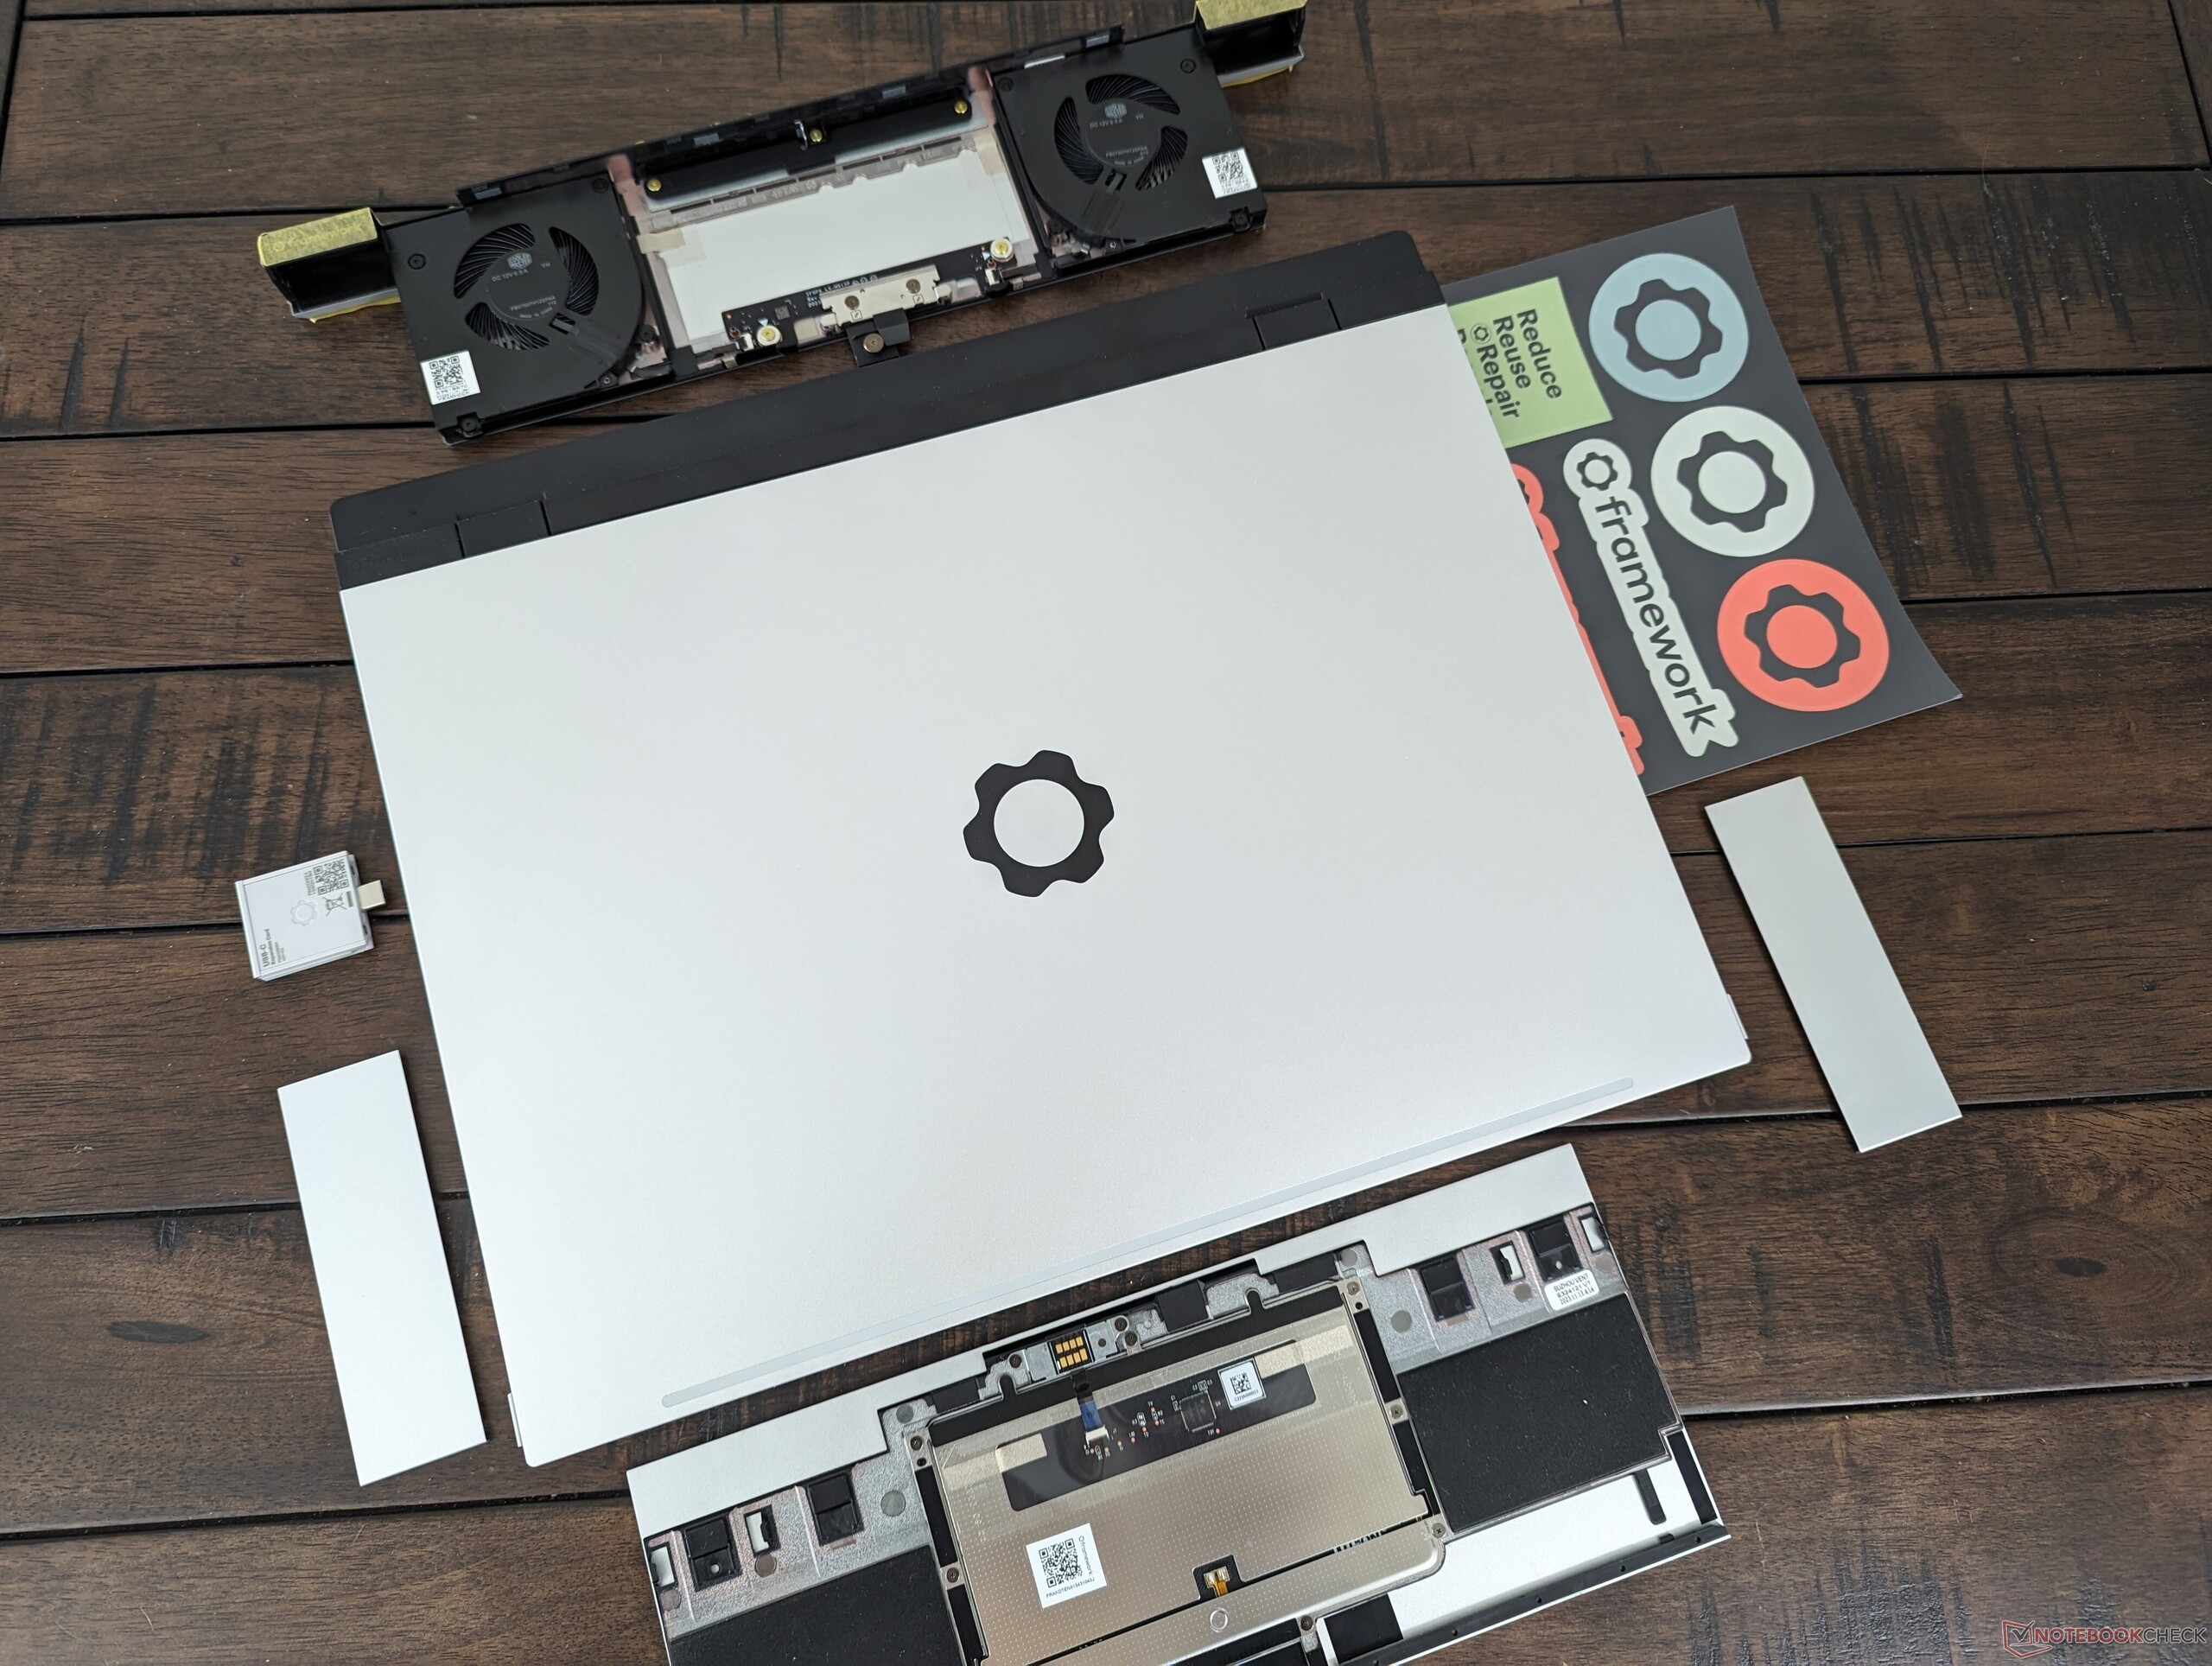
Accessoires - Plus d'options que la ceinture utilitaire de Batman
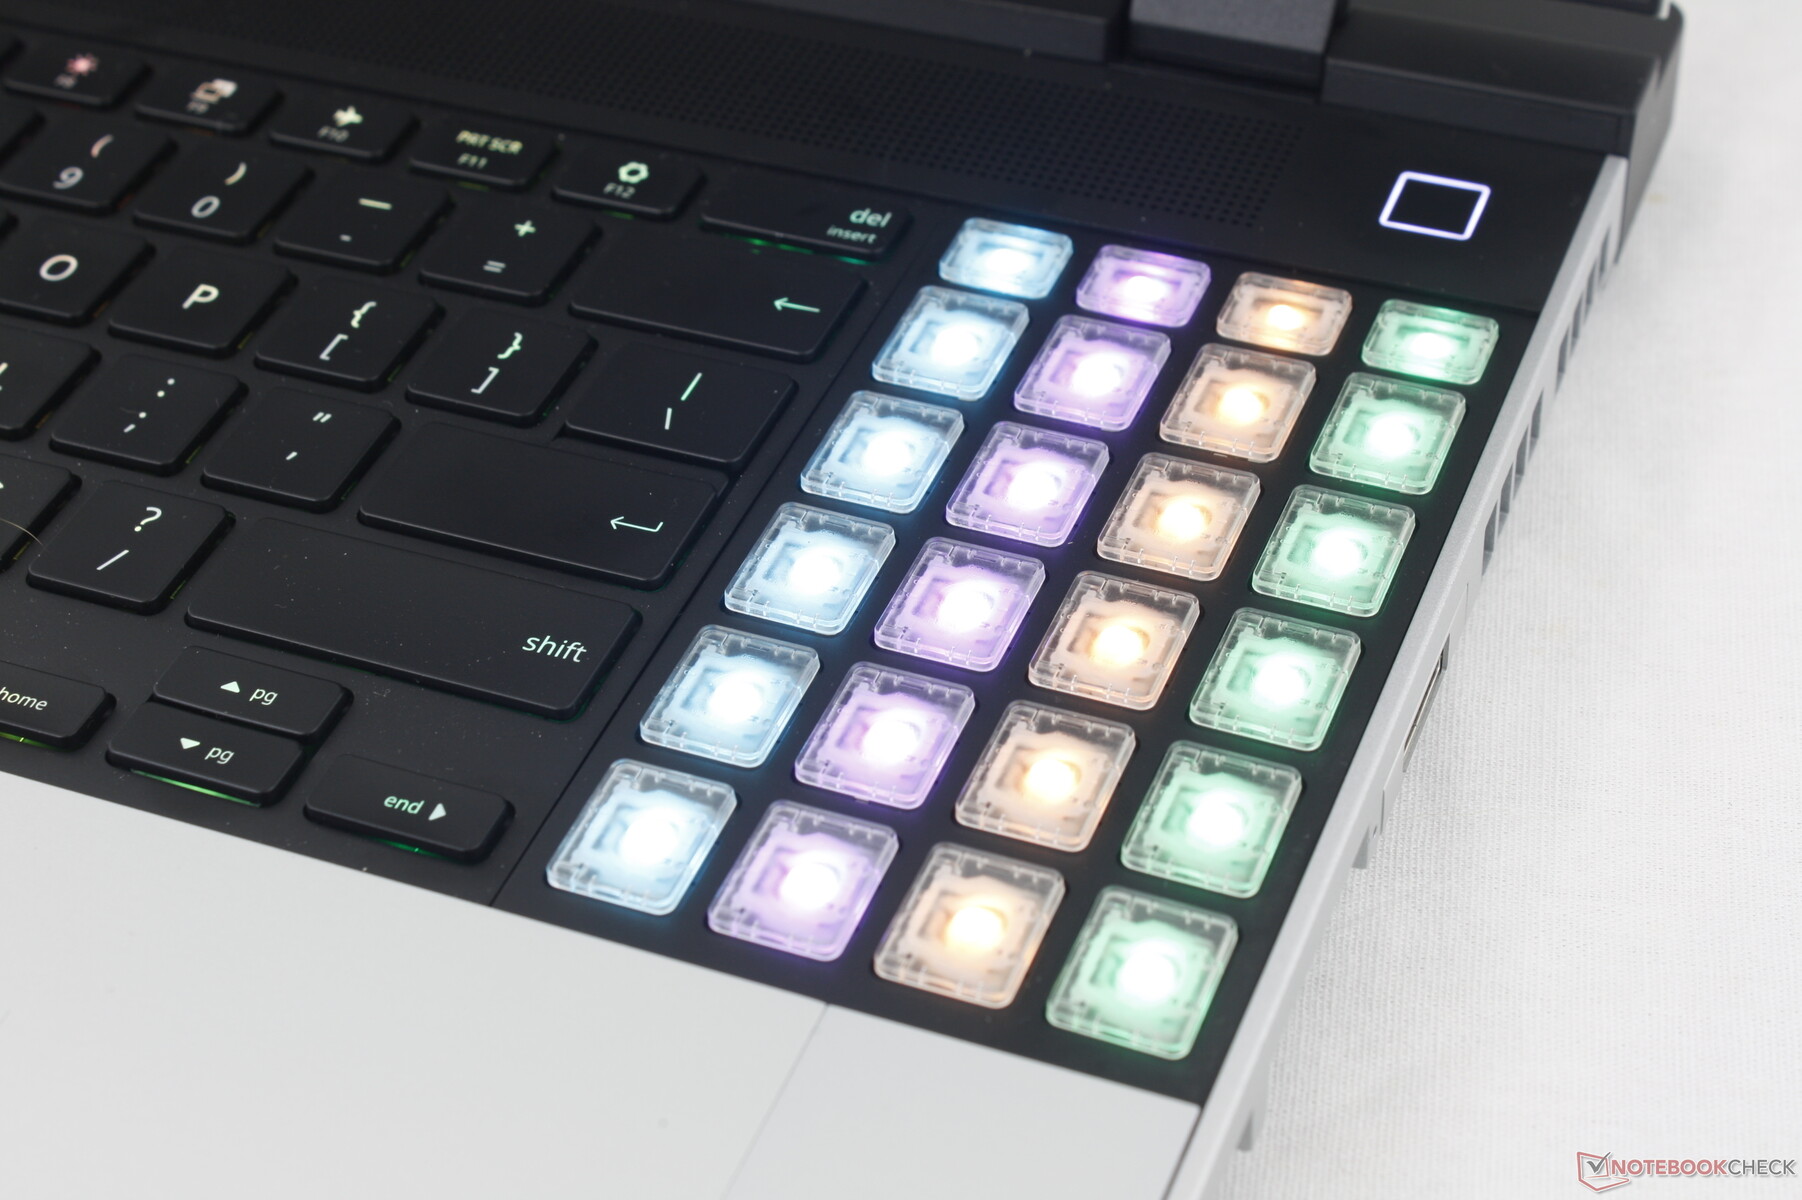
Contrairement à un ordinateur portable classique, le Laptop 16 est sans doute défini par ses accessoires. Les plus remarquables sont le module graphique discret amovible à l'arrière, les modules LED Matrix et le module Macropad RGB. Il n'y a qu'un seul dGPU à choisir pour le moment, mais il est probable que d'autres options seront disponibles à l'avenir.
Le Macropad RGB est une option secondaire au pavé numérique standard. Ses entrées sont exactement les mêmes que celles d'un pavé numérique classique, mais les touches sont visuellement différentes, car elles sont transparentes et rétroéclairées en RVB, alors que le pavé numérique standard est imprimé et n'a qu'un rétroéclairage blanc. Les touches claires et colorées du Macropad peuvent séduire les utilisateurs invétérés ou les joueurs qui aiment personnaliser leurs entrées de touches.
Quant aux modules LED Matrix, ils remplacent les entretoises classiques et consistent en de nombreuses LED disposées en une grille en forme de pixel qui peut être programmée pour afficher les niveaux d'autonomie de la batterie, des textes défilants, des notifications ou une horloge. Les modules LED Matrix ne nous ont pas été envoyés pour évaluation et nous ne les avons donc pas testés personnellement.
Les utilisateurs qui ne souhaitent pas utiliser les modules dGPU ou LED Matrix peuvent installer des couvercles de plaque standard à leurs places respectives. Ces caches sont livrés avec toutes les configurations du Laptop 16.
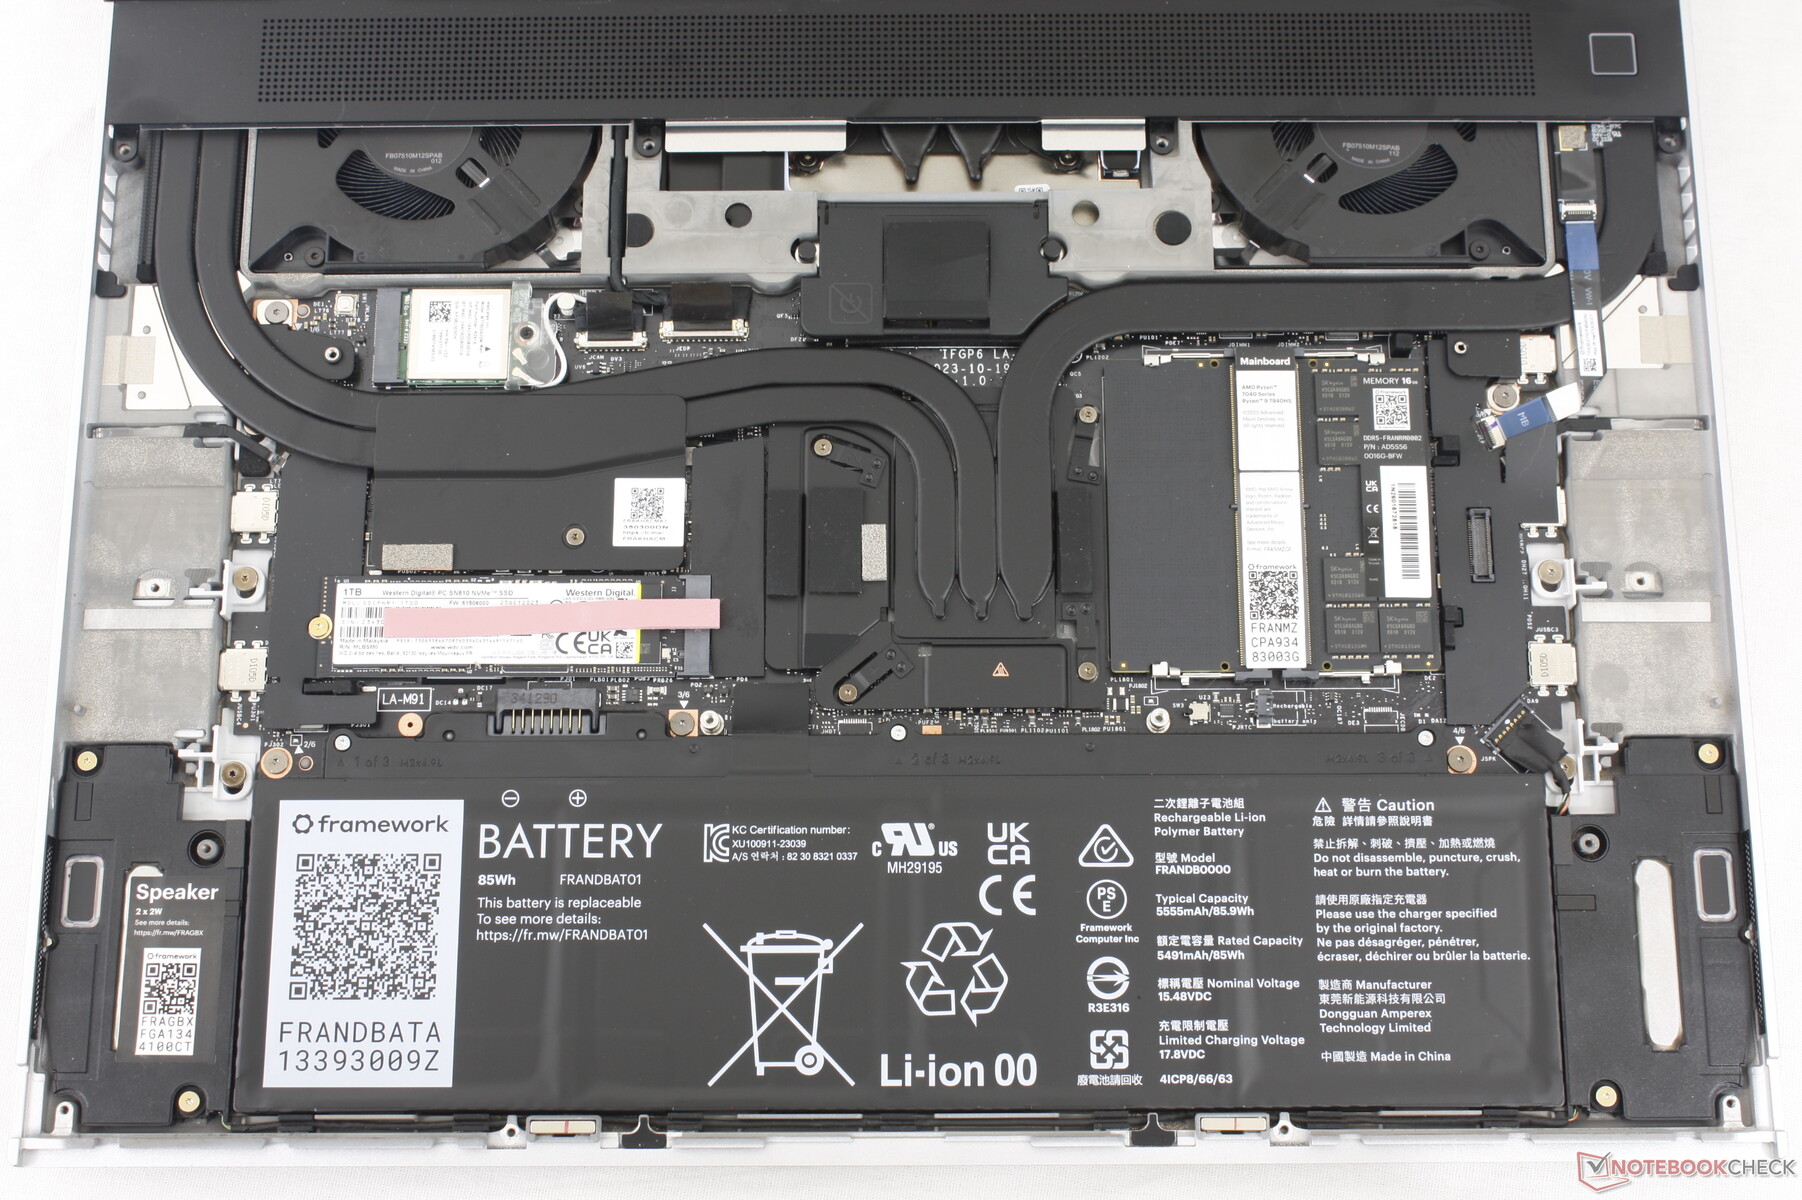
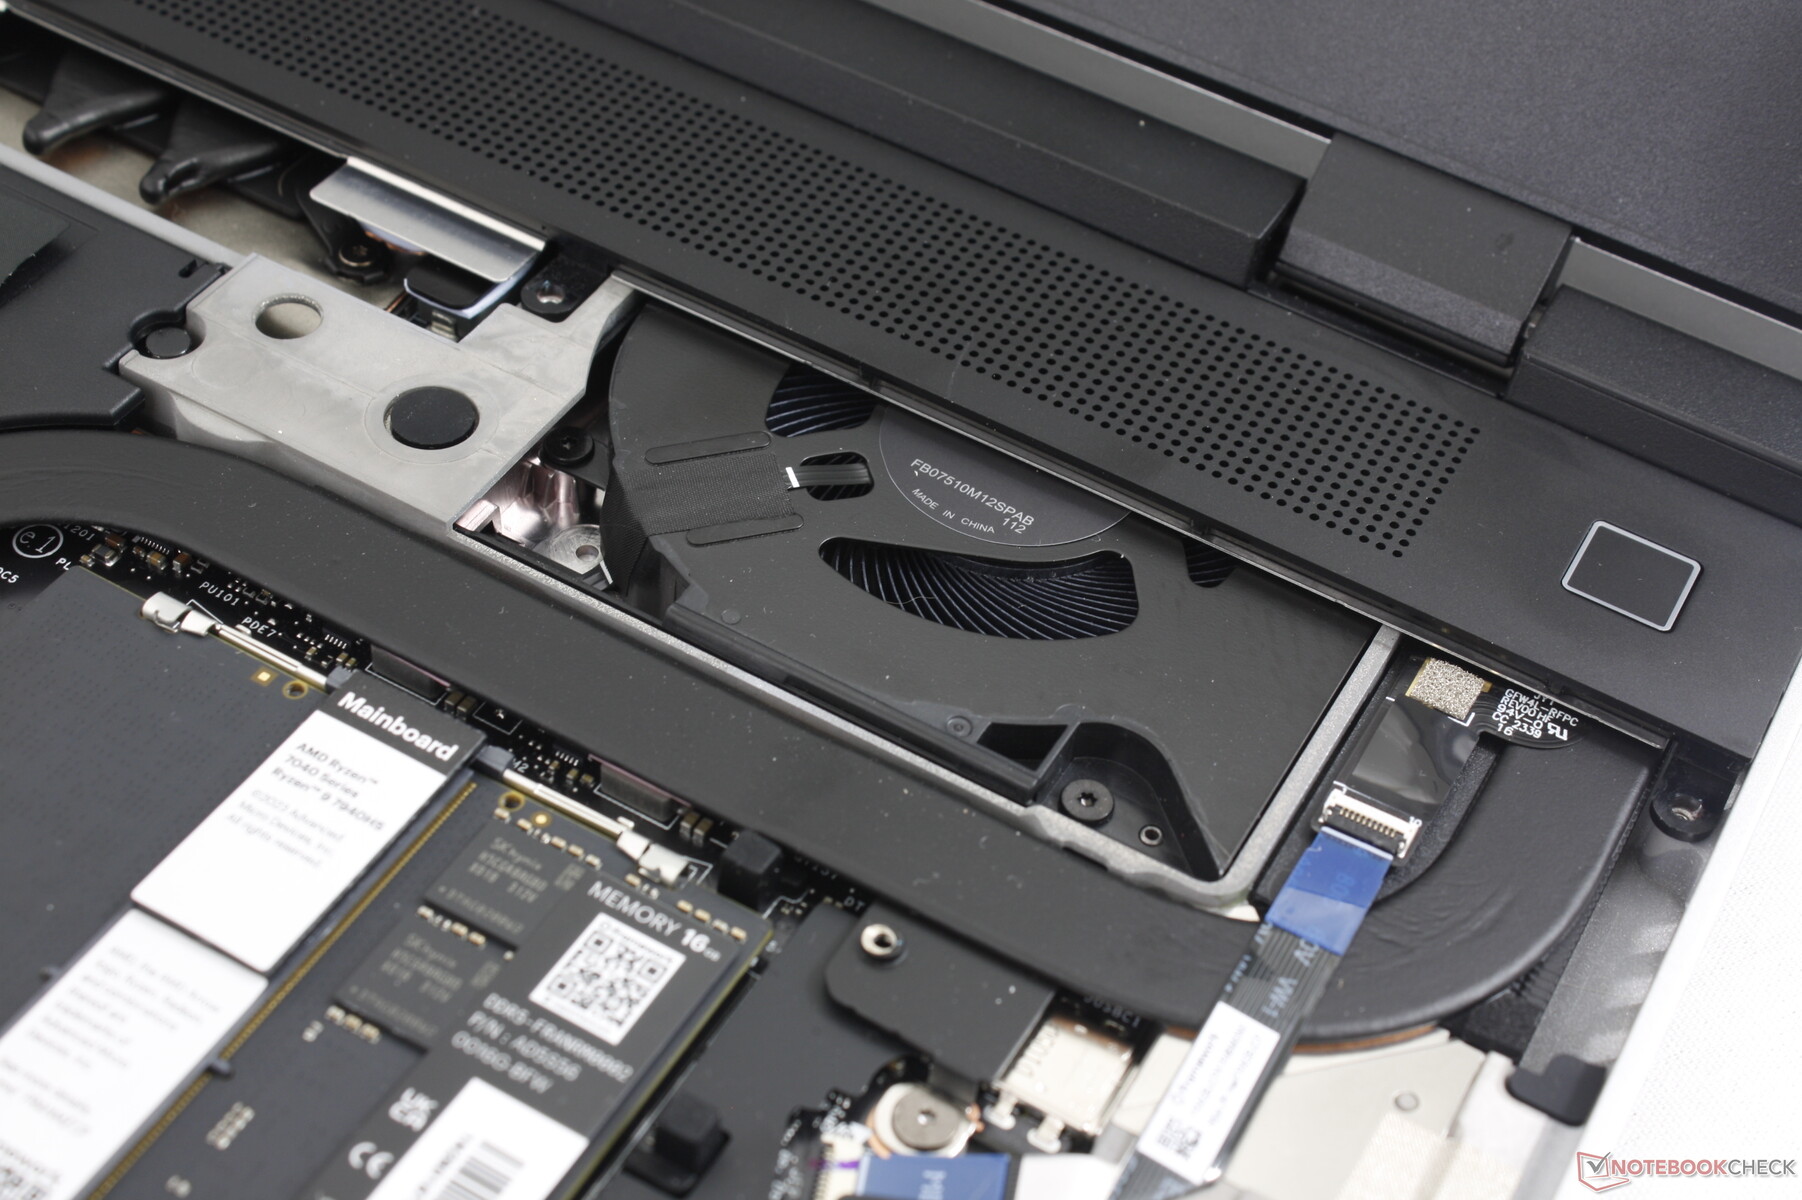
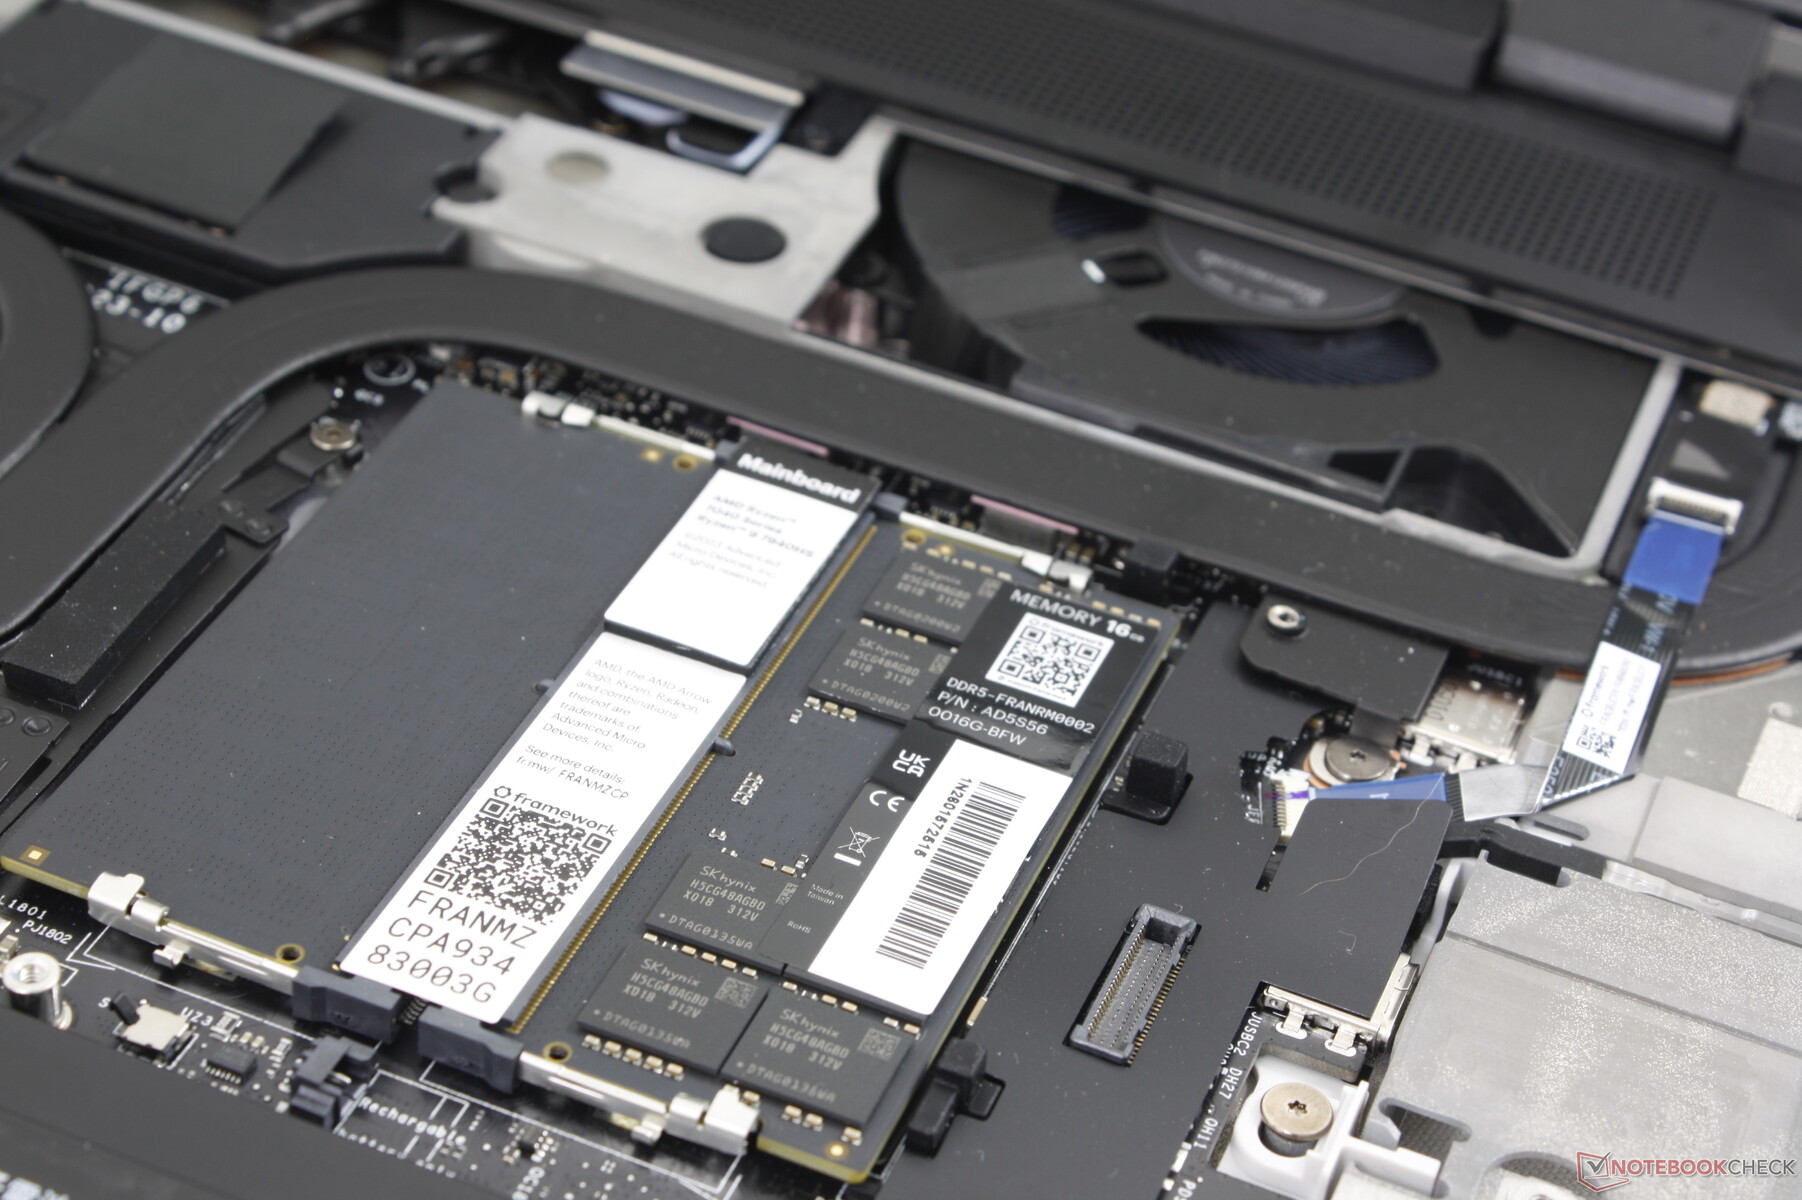
Au-delà des accessoires, la plupart des pièces internes sont remplaçables et peuvent être achetées individuellement auprès du fabricant, y compris la carte mère, comme sur le Framework 13.5.
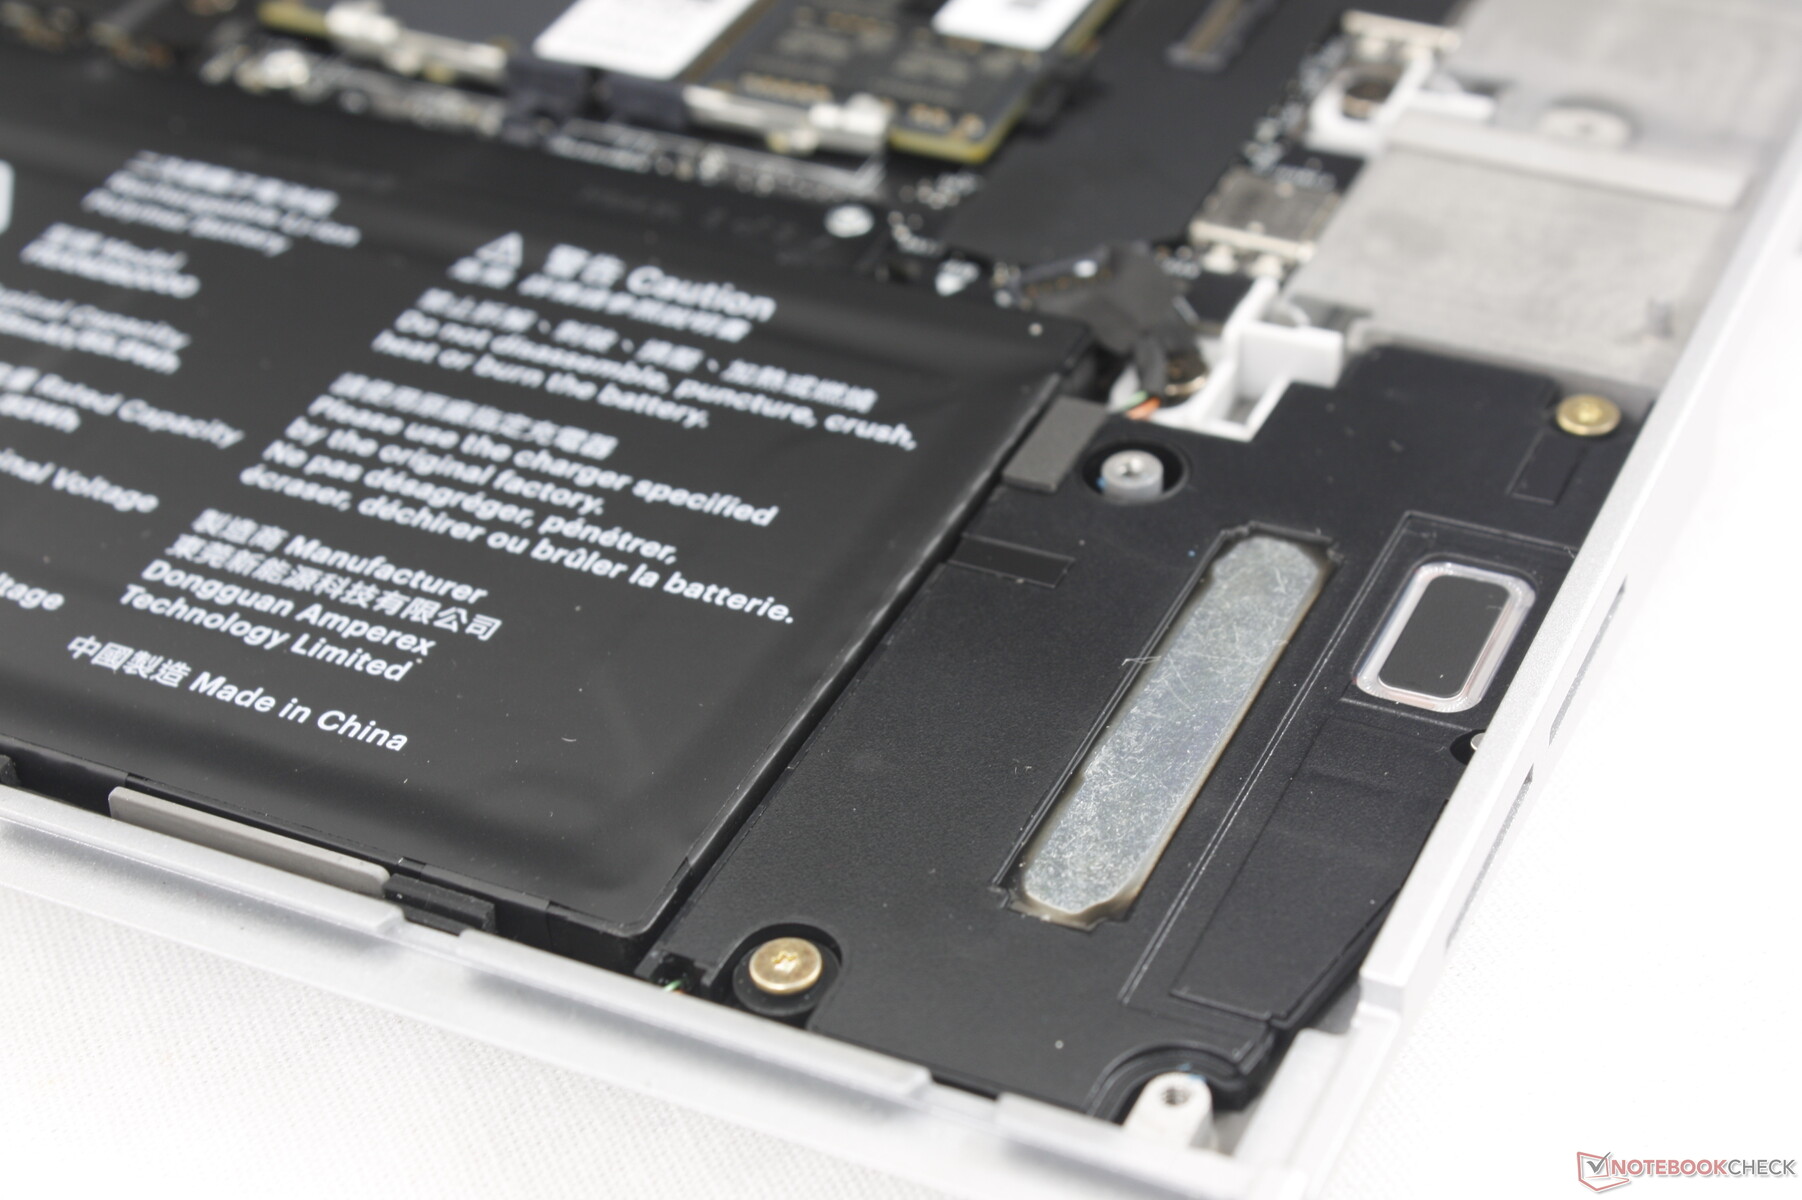
Maintenance
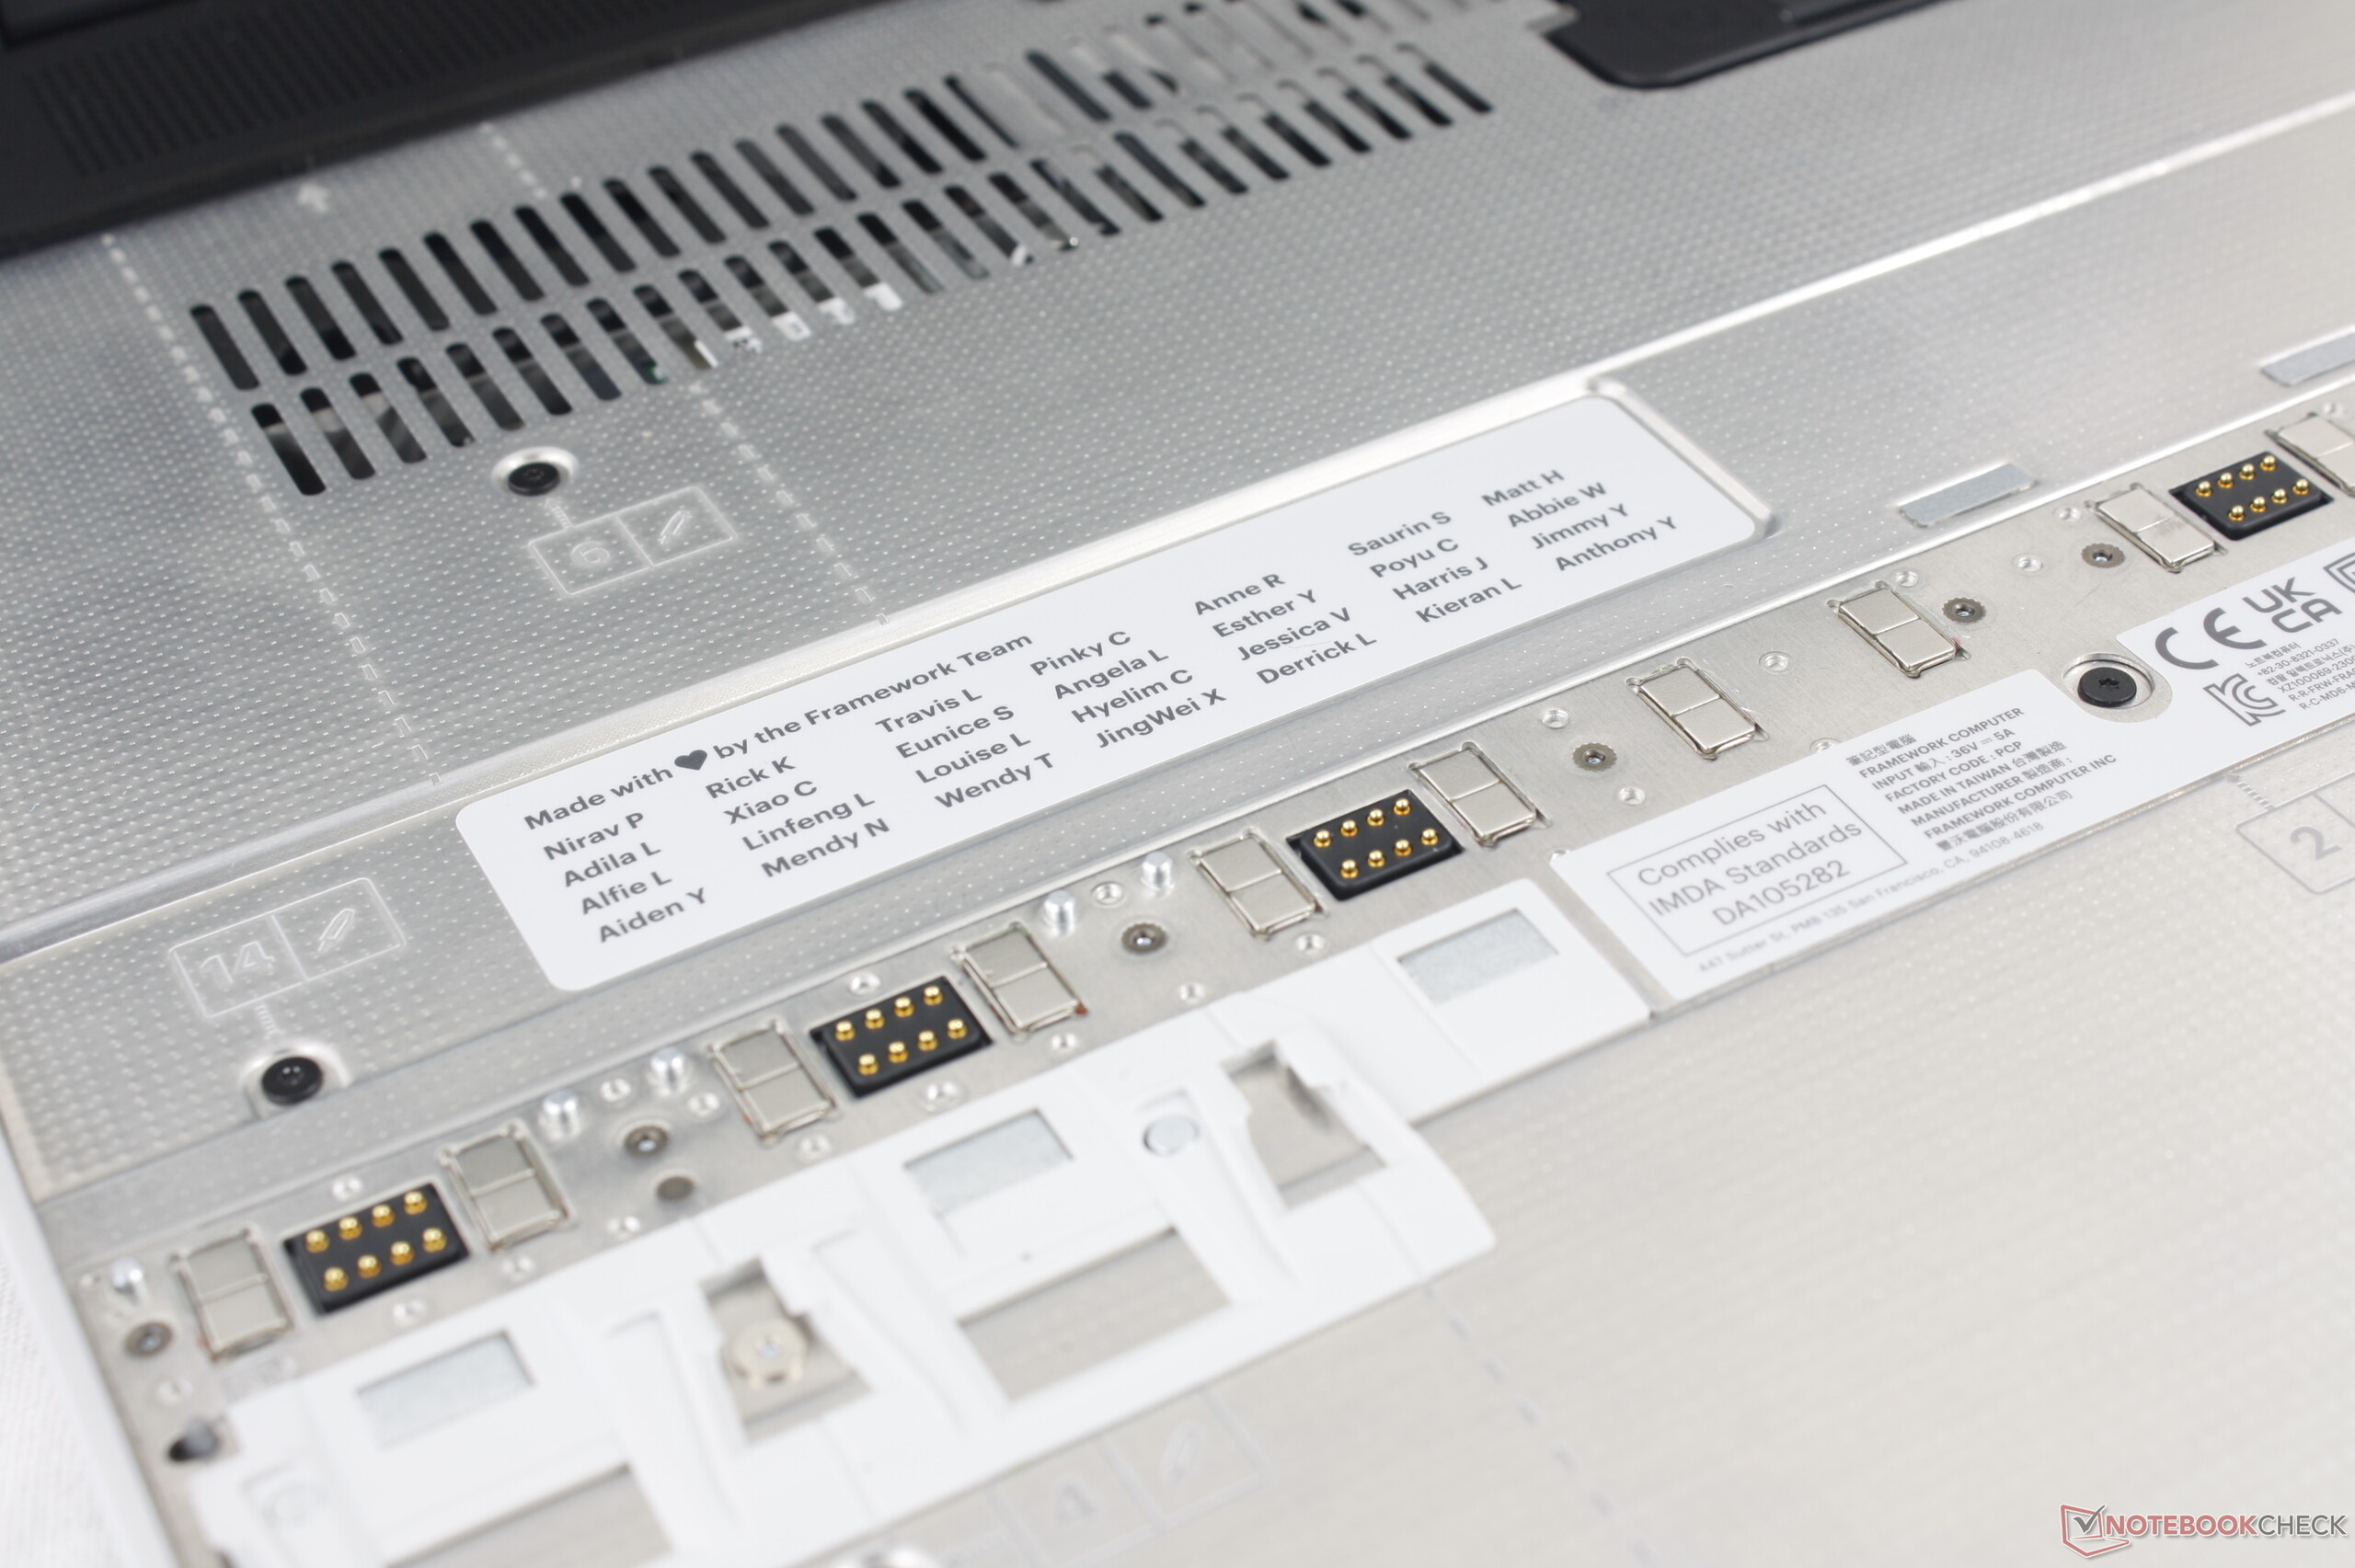
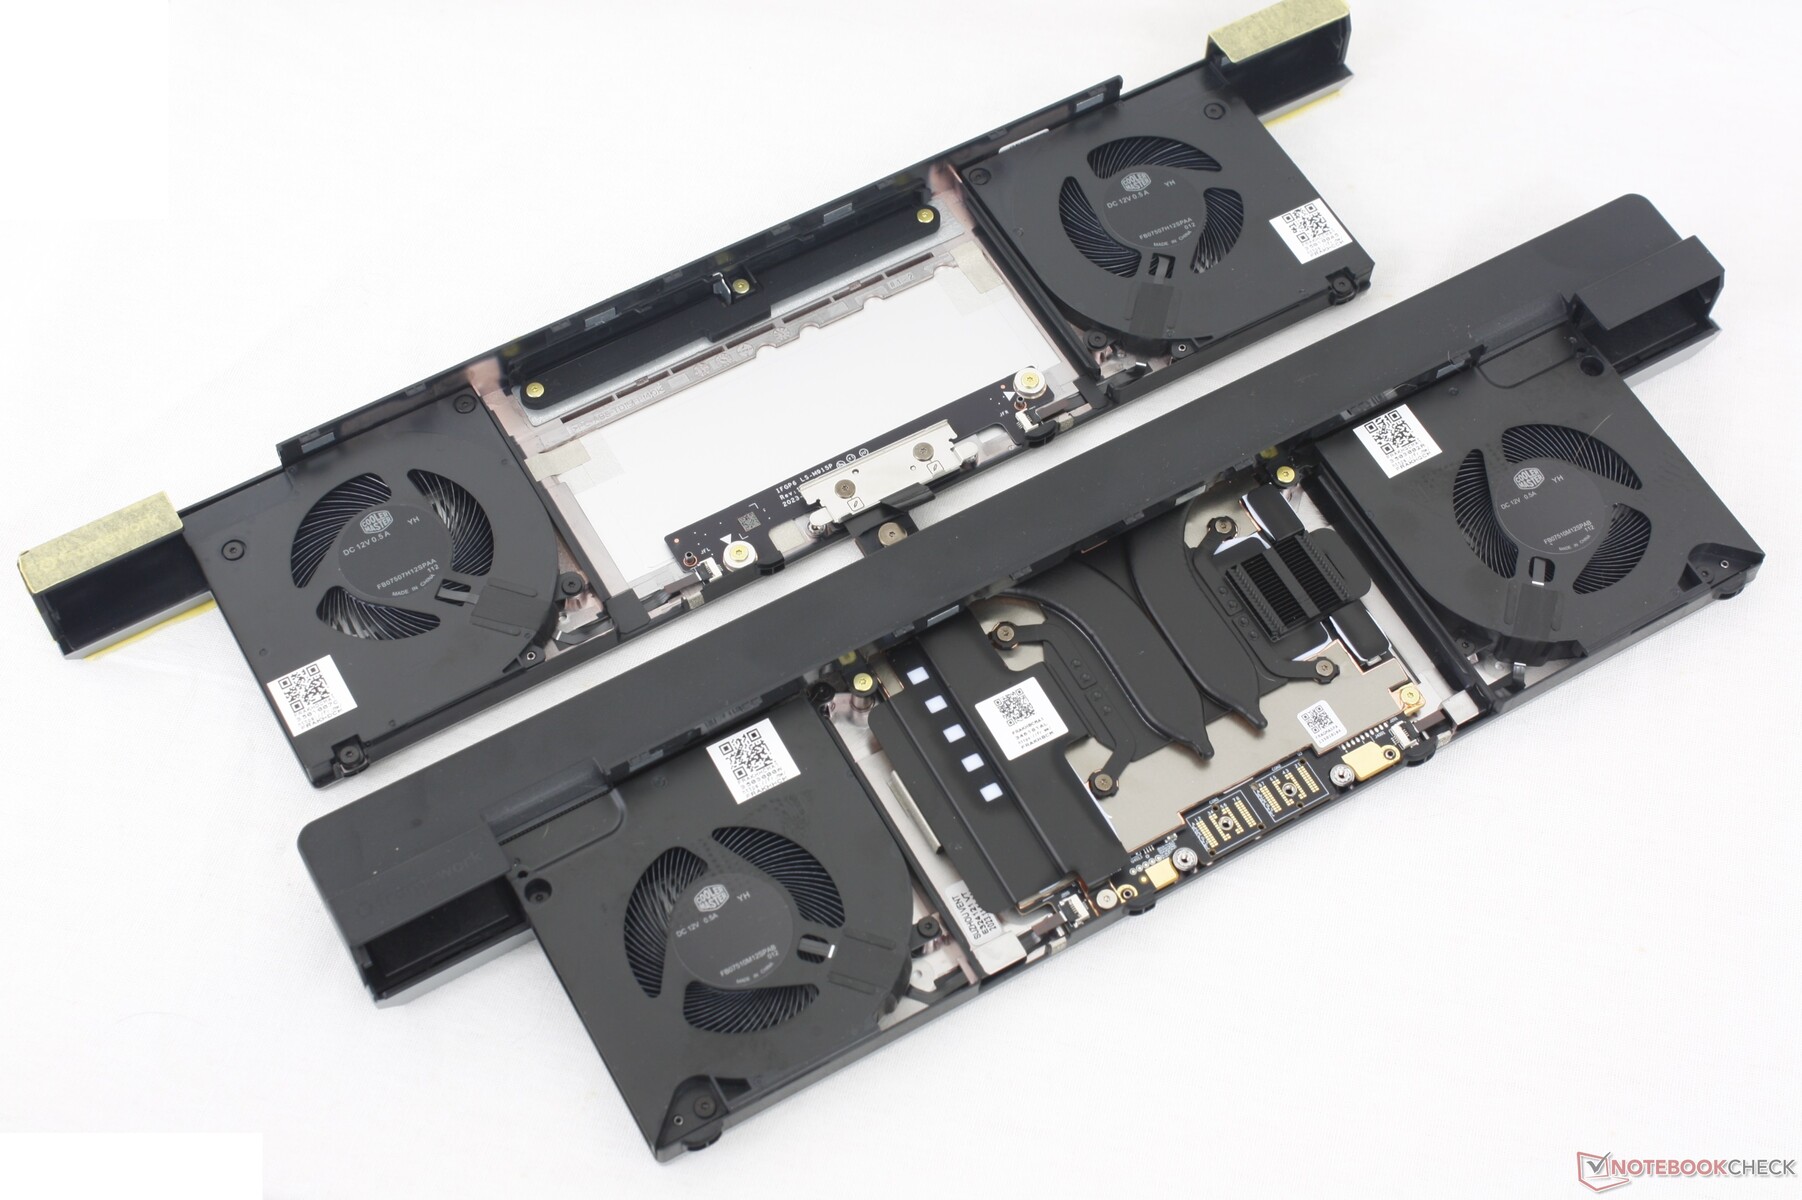
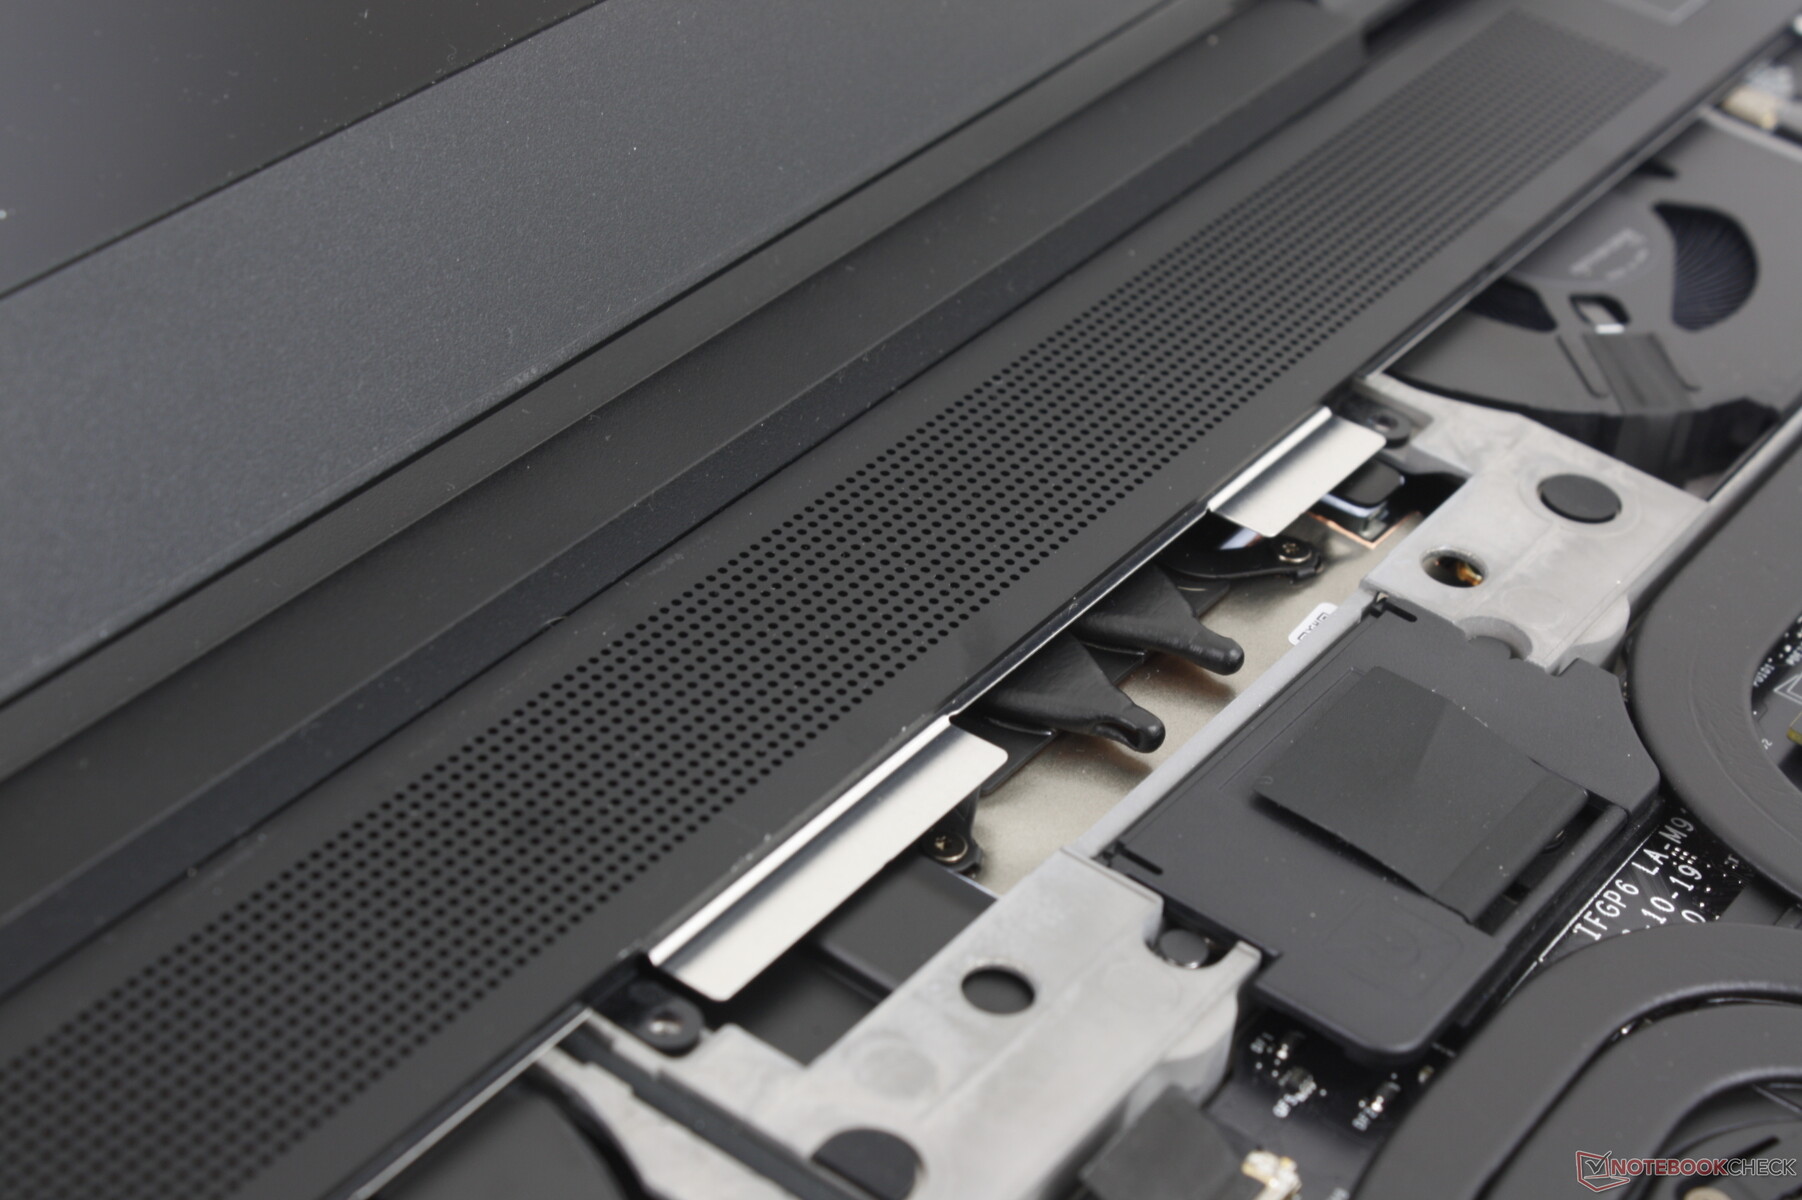
L'accès à la carte mère est plus compliqué que d'habitude. Alors que la plupart des autres ordinateurs portables ne nécessitent que le retrait du panneau inférieur, le Laptop 16 exige que vous retiriez le clavier, le pavé numérique, un câble ruban, 15 vis Torx et une plaque centrale en métal pour révéler les entrailles de l'ordinateur. Ce n'est pas difficile, mais le processus est un peu plus long que pour un ThinkPad ou un EliteBook traditionnel.
Heureusement, Framework propose certains des guides de réparation les plus détaillés et les plus faciles à suivre que nous ayons vus de la part d'un fabricant d'ordinateurs portables, pour que la maintenance soit un jeu d'enfant. Nous vous recommandons vivement de consulter la page d'assistance officielle https://frame.work/laptop-16-support#customize-your-laptopqui couvre tout de la simple mise à niveau de la RAM et du SSD au remplacement de la carte mère et à l'installation d'un module dGPU. Nous n'avons pas besoin de réimprimer l'ensemble du processus de maintenance, mais les procédures ont une courbe d'apprentissage légèrement supérieure à celle du Laptop 13.5 en raison de la complexité des nouveaux modules dGPU amovibles et des modules d'entrée plus grands.
Bien que la plupart des modules soient magnétiques, un tournevis est toujours nécessaire pour installer le dGPU arrière et certains modules doivent être installés dans un certain ordre. Le module arrière, en particulier, n'est pas prêt à l'emploi, car le système doit être éteint et le clavier et le pavé tactile doivent d'abord être retirés. La bonne nouvelle, c'est qu'il suffit de démonter et de remonter le système une seule fois pour que les procédures de maintenance deviennent une seconde nature. Framework encourage même cette démarche en livrant le clavier et le pavé tactile détachés, ce qui oblige l'utilisateur à apprendre le fonctionnement de certains modules avant d'allumer l'ordinateur portable pour la première fois.
L'utilisation d'aimants et de loquets pour les modules du pavé tactile est une approche intuitive de l'entretien. Nous espérons que cette approche sera développée jusqu'à ce que tous les modules et toutes les mises à jour puissent se faire sans outil.
Garantie
La garantie limitée standard d'un an du fabricant s'applique si l'ordinateur est acheté aux États-Unis. La protection couvre l'ordinateur portable ainsi que ses pièces et modules.
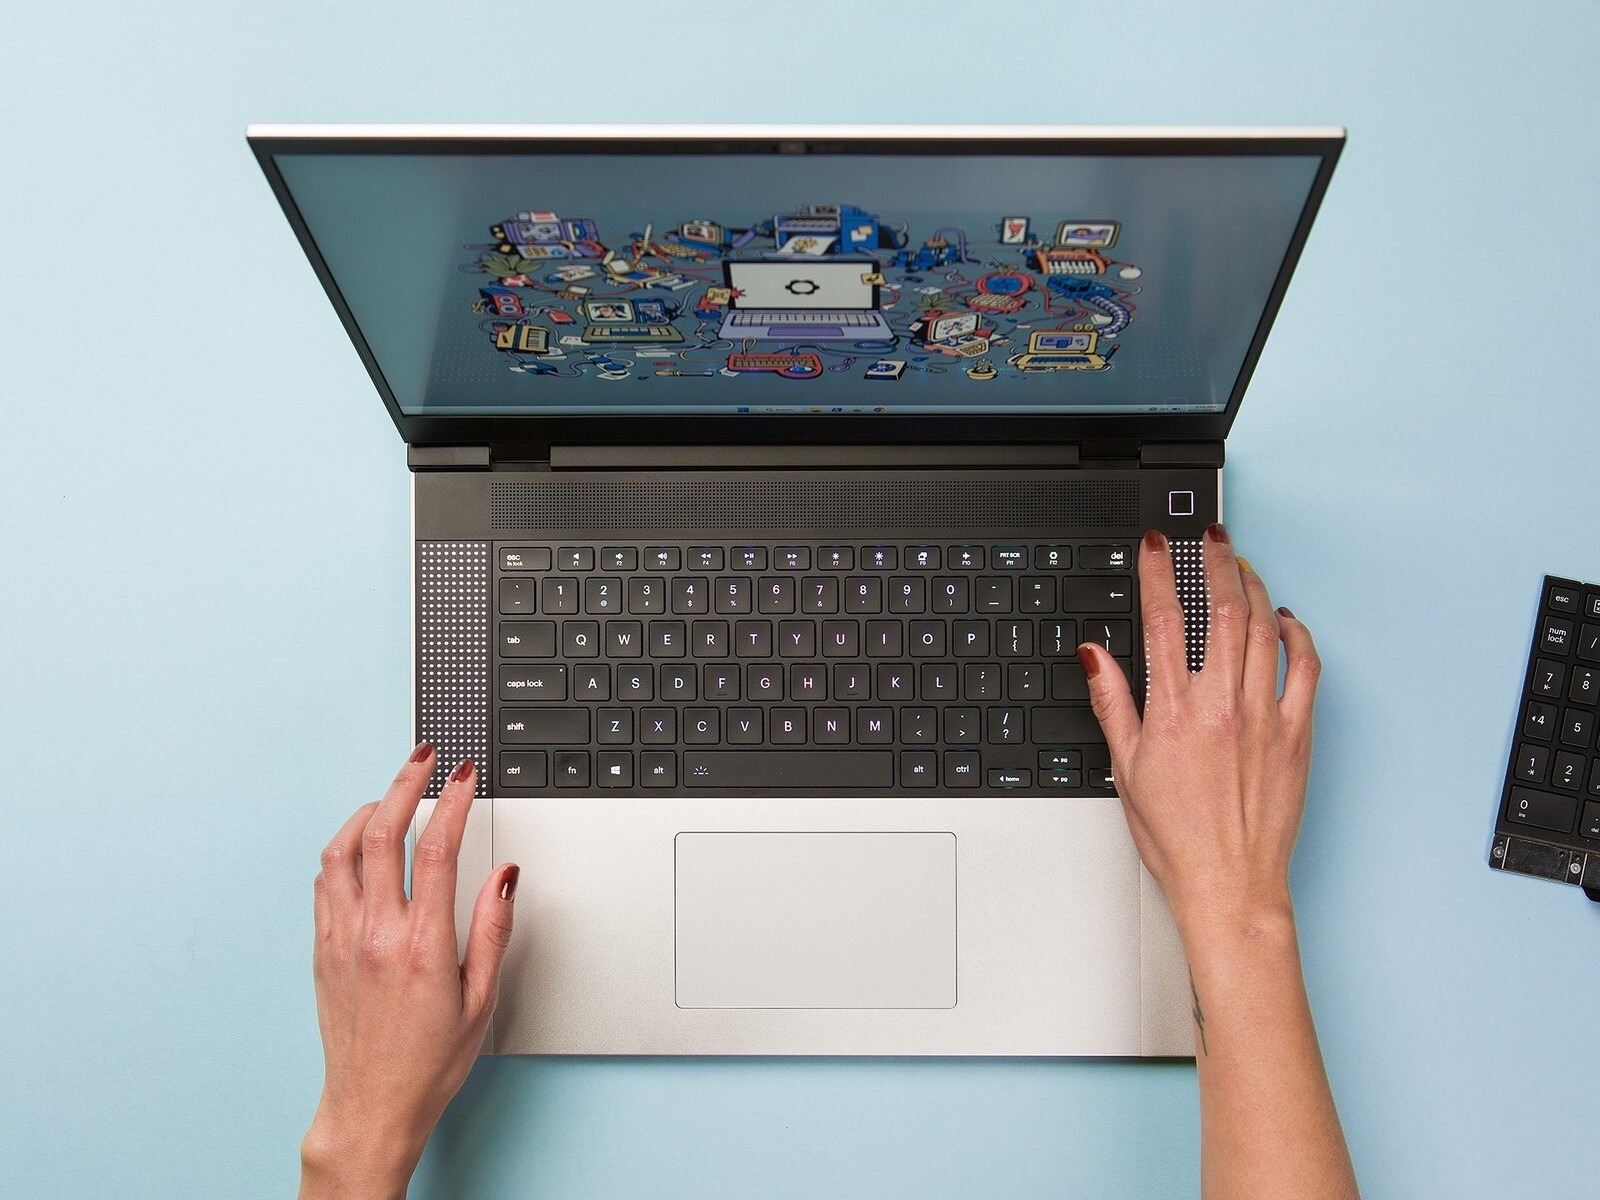
Dispositifs d'entrée - amovibles, remplaçables et réarrangeables
Clavier
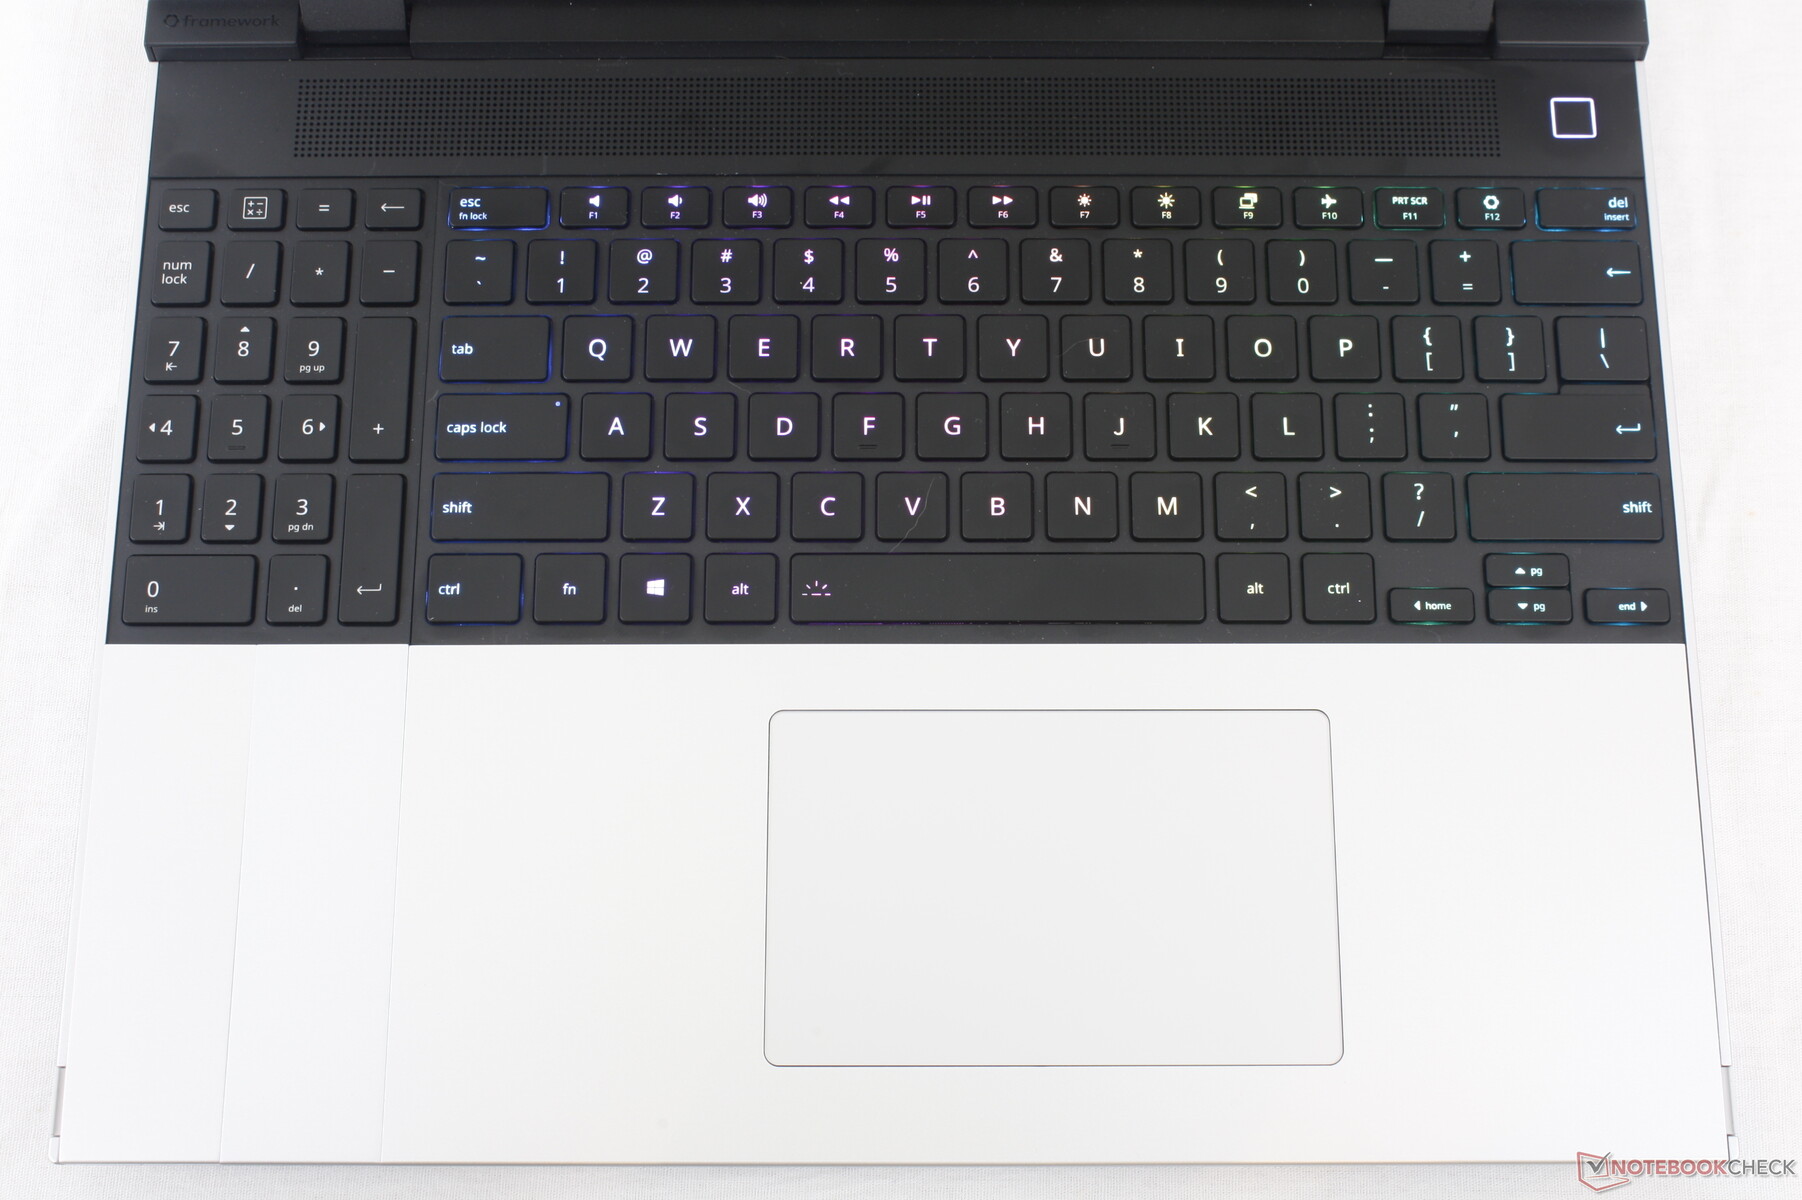
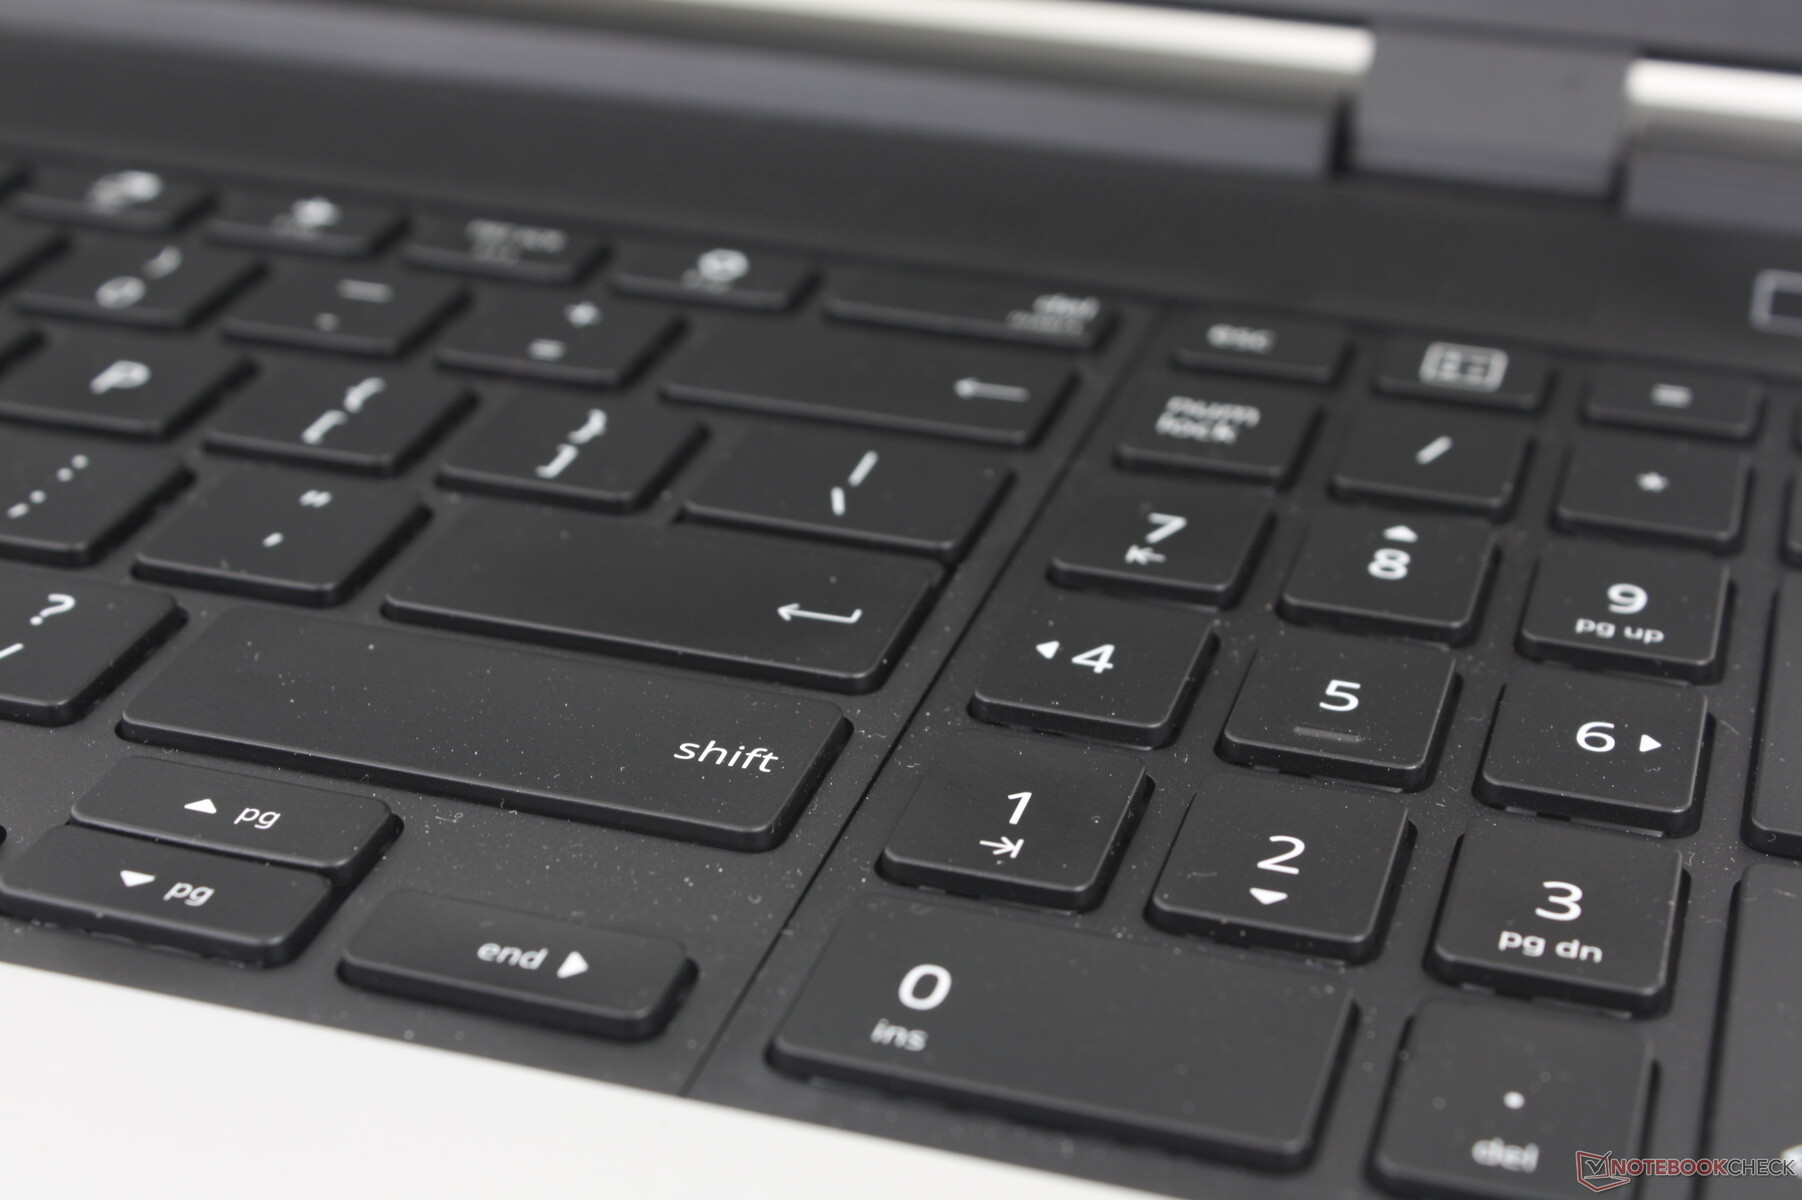
Les touches RGB ont une course de 1,5 mm, ce qui est courant sur la plupart des ultrabooks. L'expérience de frappe n'est pas entravée par l'aspect amovible du clavier, ce qui est exactement ce que nous aimons voir. Les utilisateurs qui préfèrent les ordinateurs portables avec une course de touches plus profonde et plus ferme devraient essayer le HP Spectre.
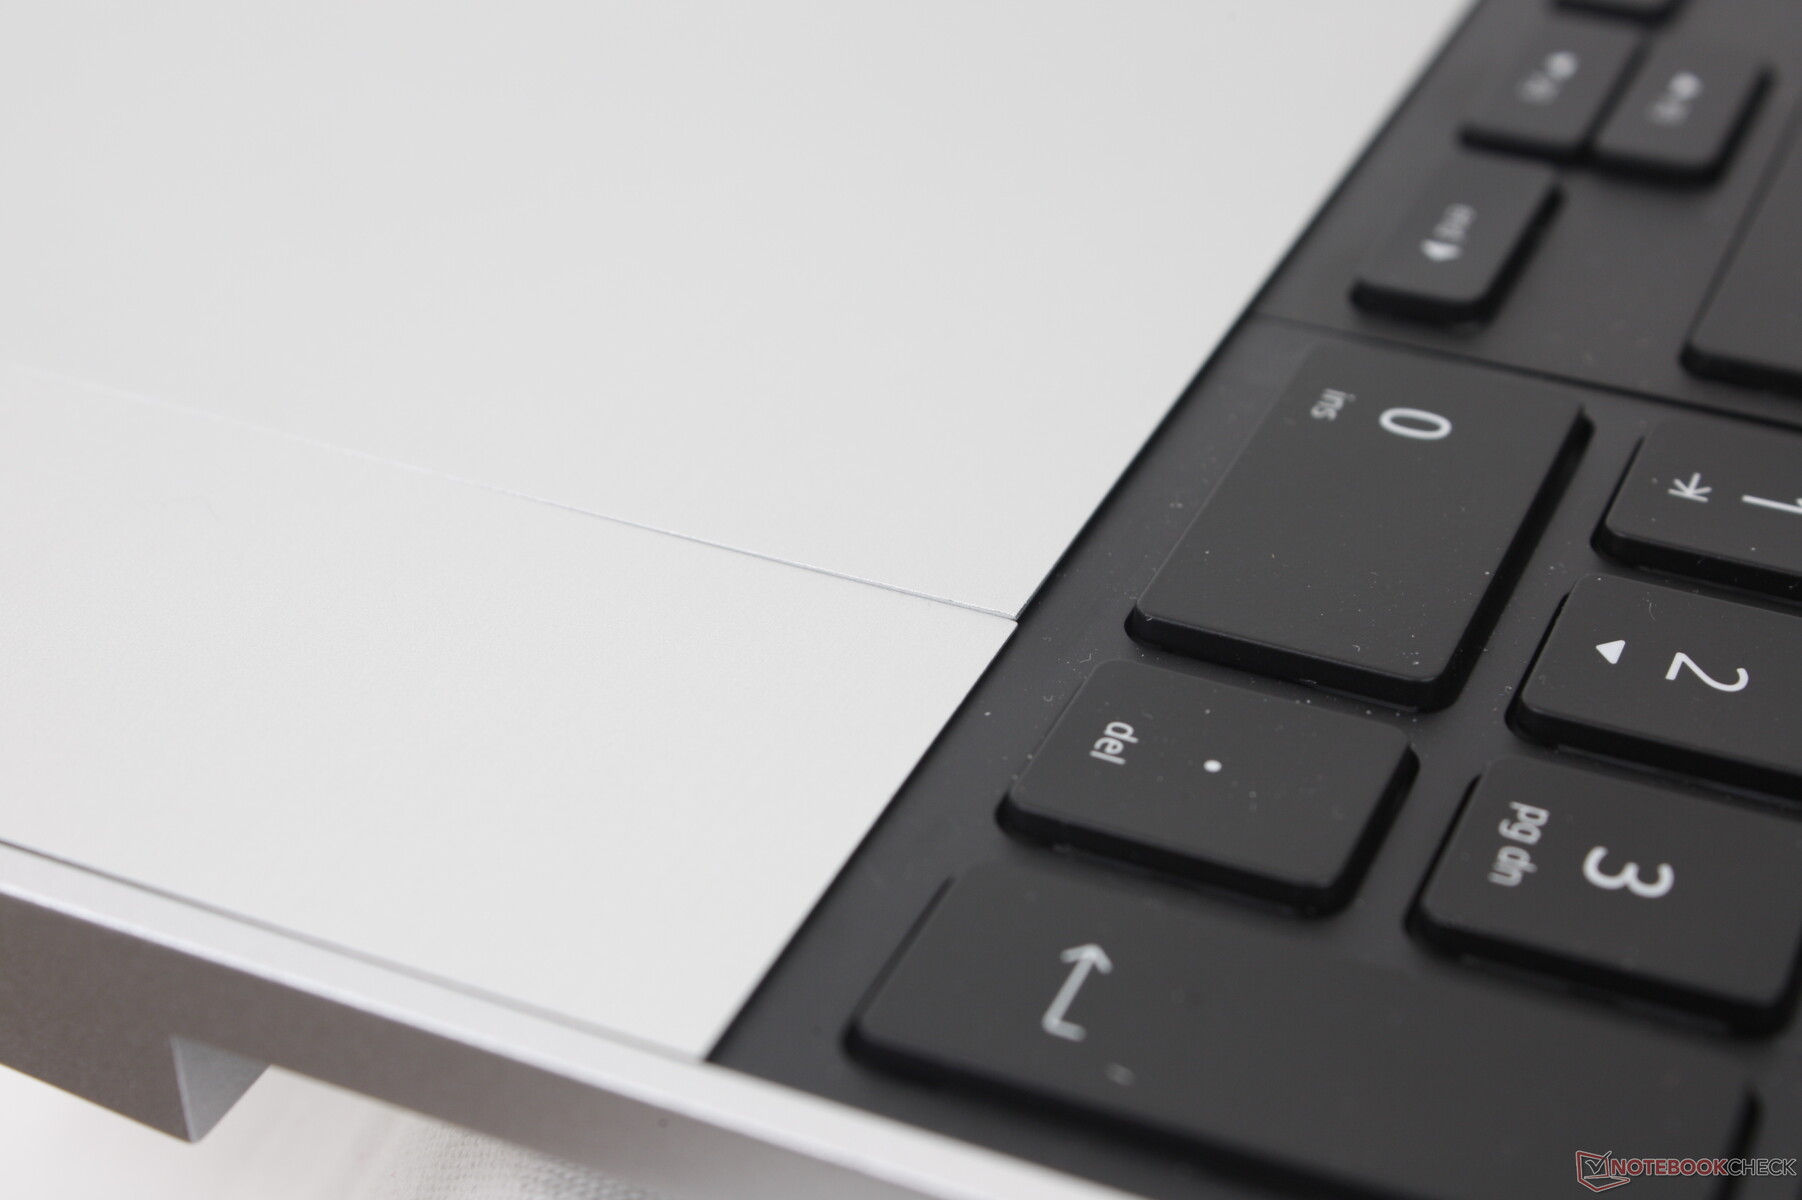
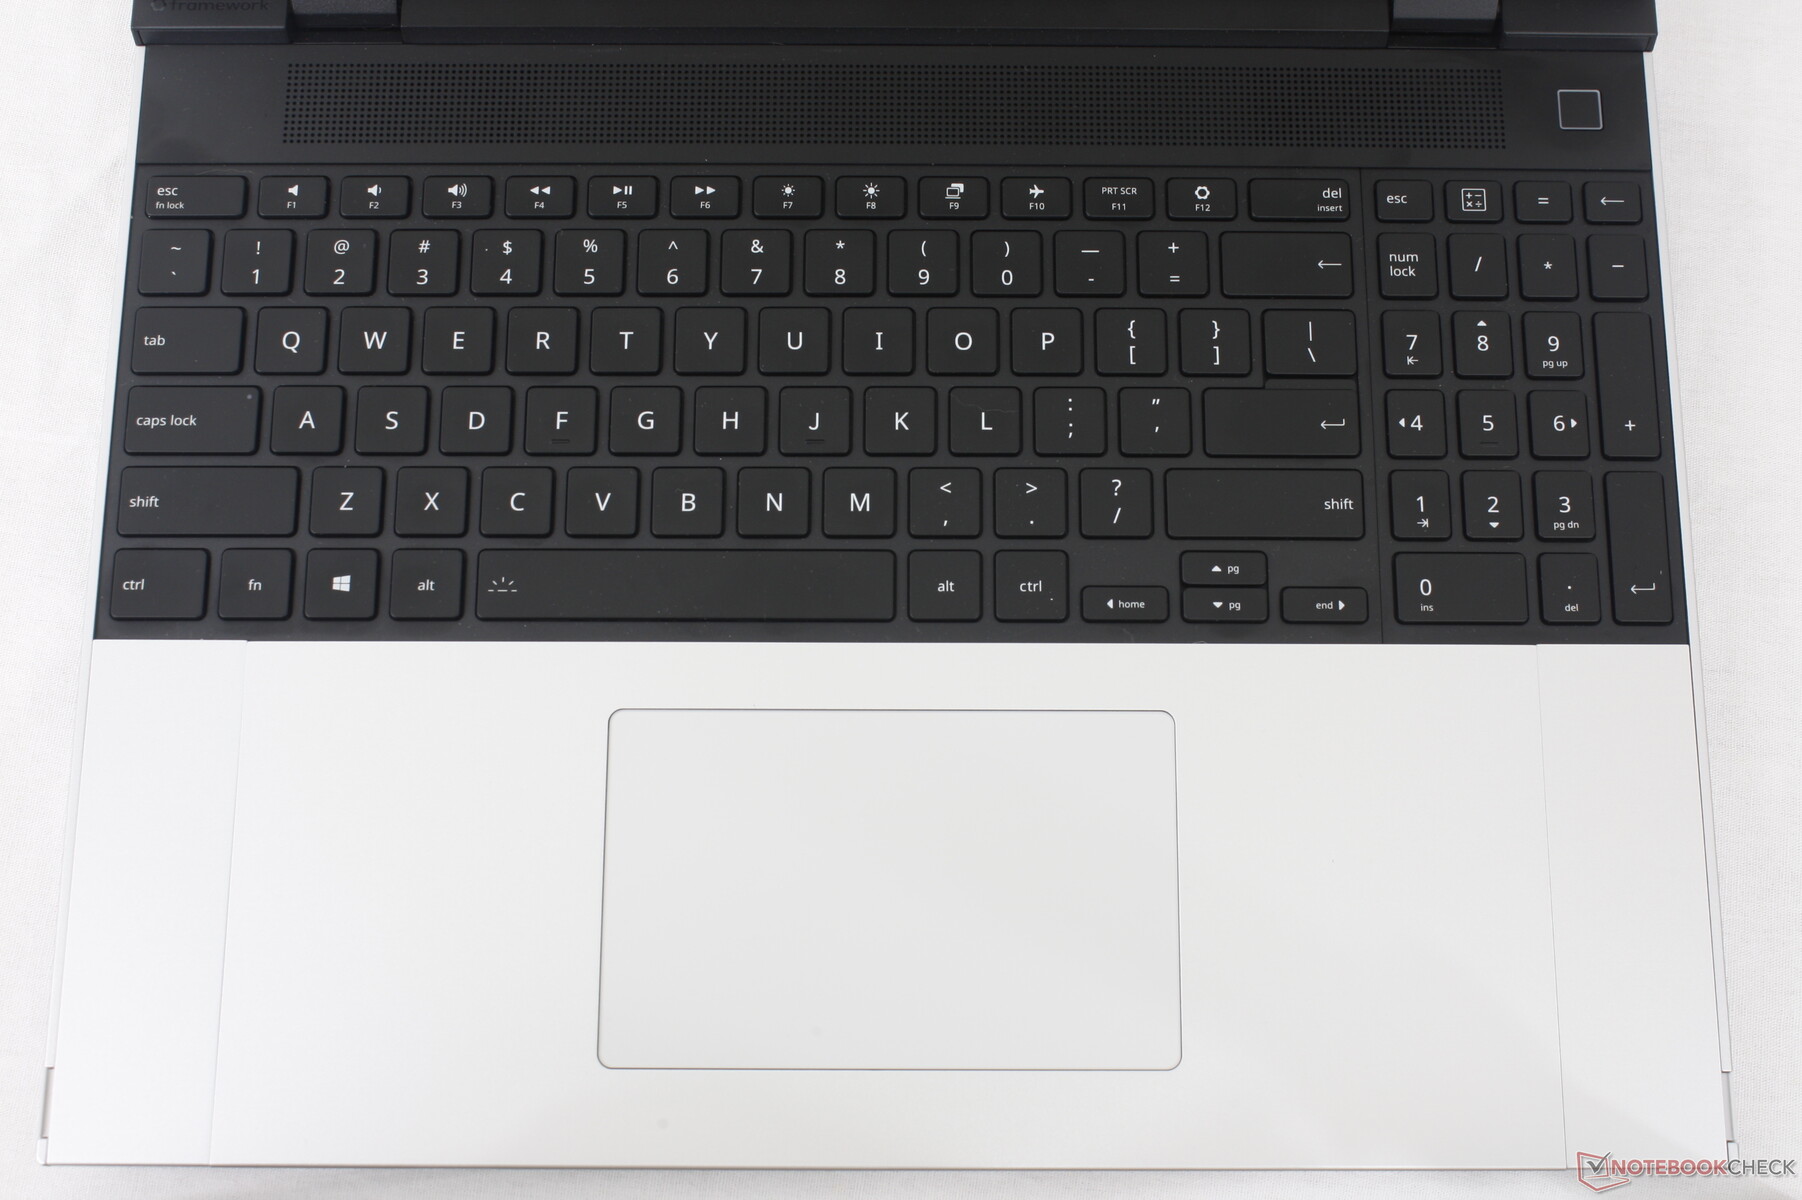
Curieusement, les touches du pavé numérique n'ont qu'un rétroéclairage blanc alors que les touches principales du clavier QWERTY sont éclairées en RVB. Les utilisateurs qui préfèrent ne pas avoir de pavé numérique peuvent installer des entretoises pour centrer le clavier QWERTY ou installer un macropad RGB avec des touches personnalisables. La possibilité de repositionner ou de centrer le clavier à votre guise n'est pas une caractéristique que nous avons déjà vue sur d'autres ordinateurs portables. Le pavé numérique, par exemple, peut être installé à gauche ou à droite du clavier QWERTY pour des configurations vraiment intéressantes.
Pavé tactile
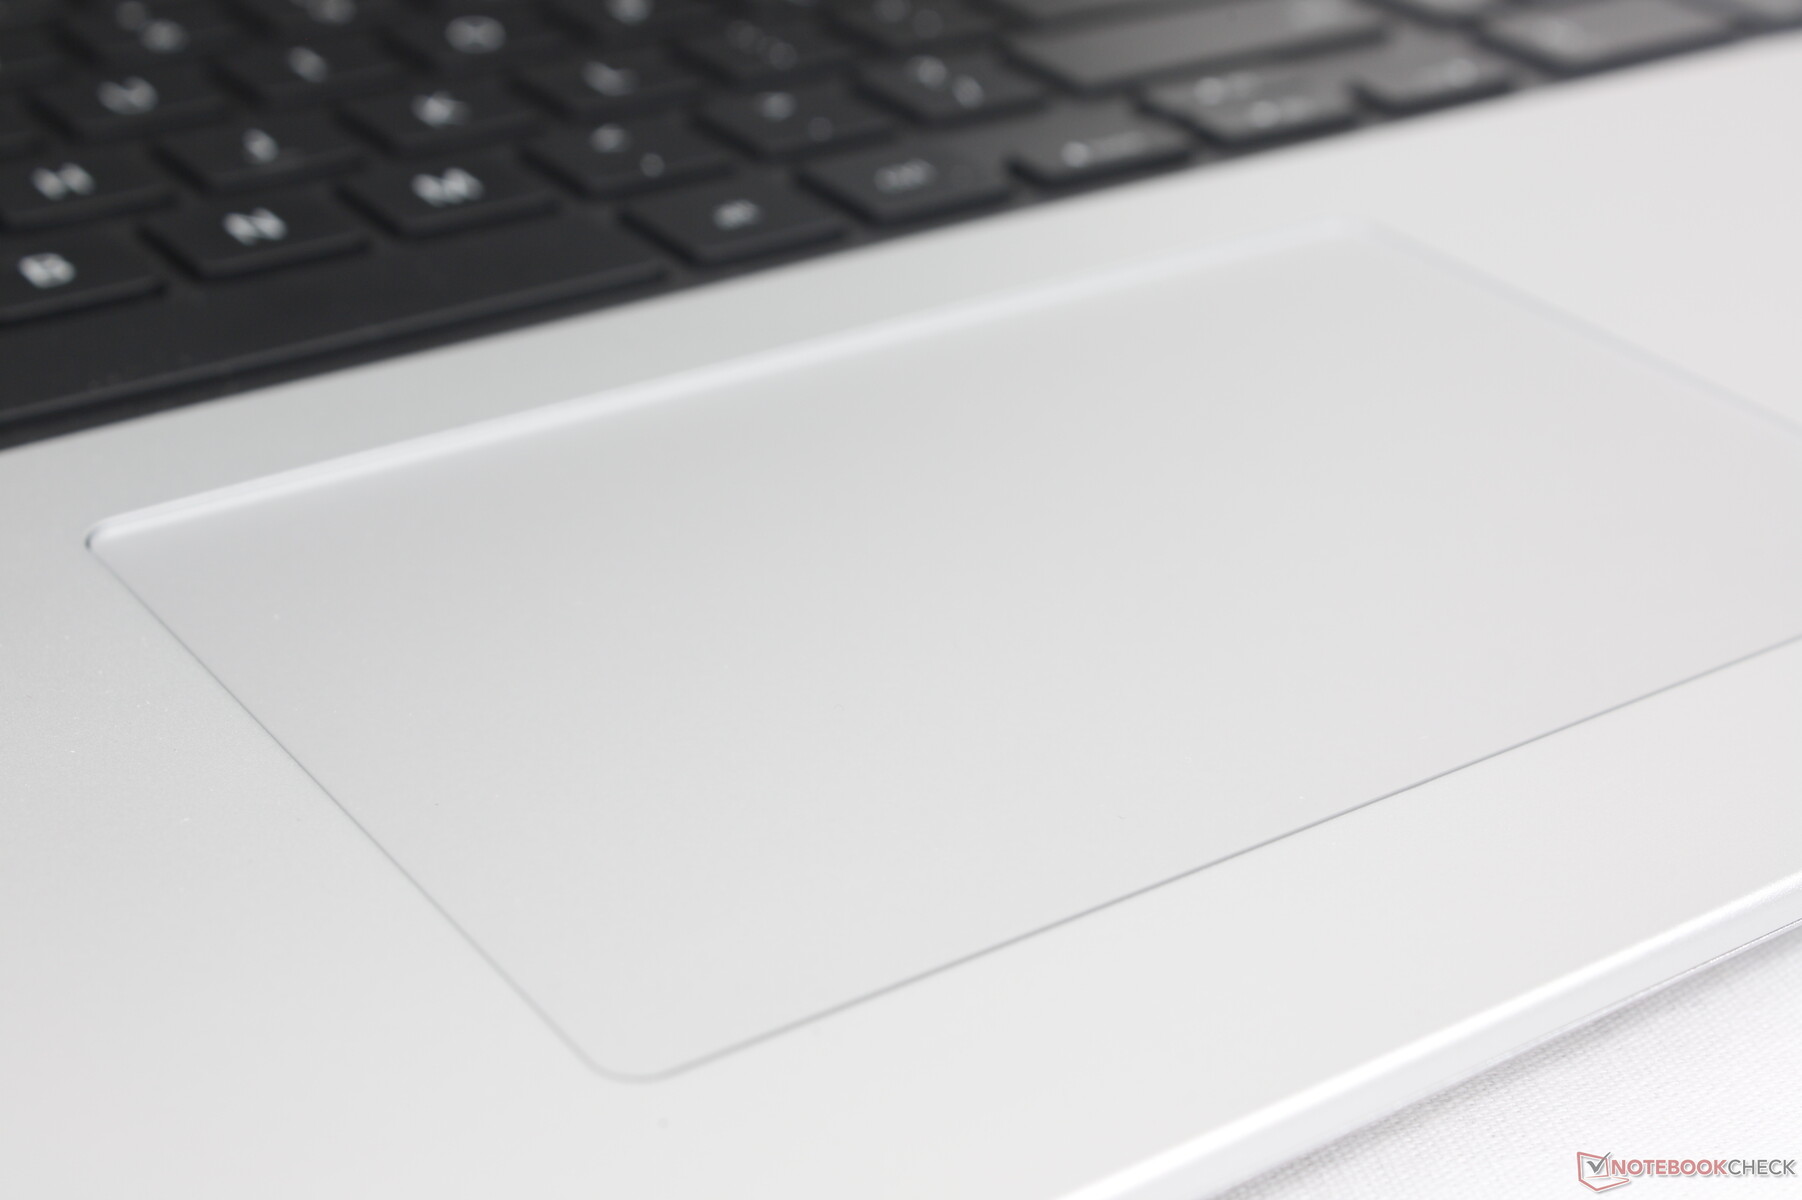
Avec ses 12,3 x 7,7 cm, le clickpad de Precision est plus petit que celui du MSI Prestige 16 (15 x 9 cm) et à peu près de la même taille que celui de l Inspiron 16 Plus (11,5 x 8 cm). La traction est fluide sur la surface en verre mat avec juste un peu d'adhérence lorsque vous glissez à des vitesses plus lentes pour améliorer la précision. Le clic est également agréable car le retour d'information n'est pas aussi spongieux que sur la Prestige 16, mais les bruits sont légèrement plus forts en conséquence.
Un aspect unique du clickpad est qu'il peut être déplacé vers la gauche ou vers la droite sur les repose-poignets en fonction de la façon dont il est installé, comme le montrent les photos ci-dessous. Il s'agit d'une fonction intéressante pour les utilisateurs qui préfèrent que le pavé tactile soit décentré.

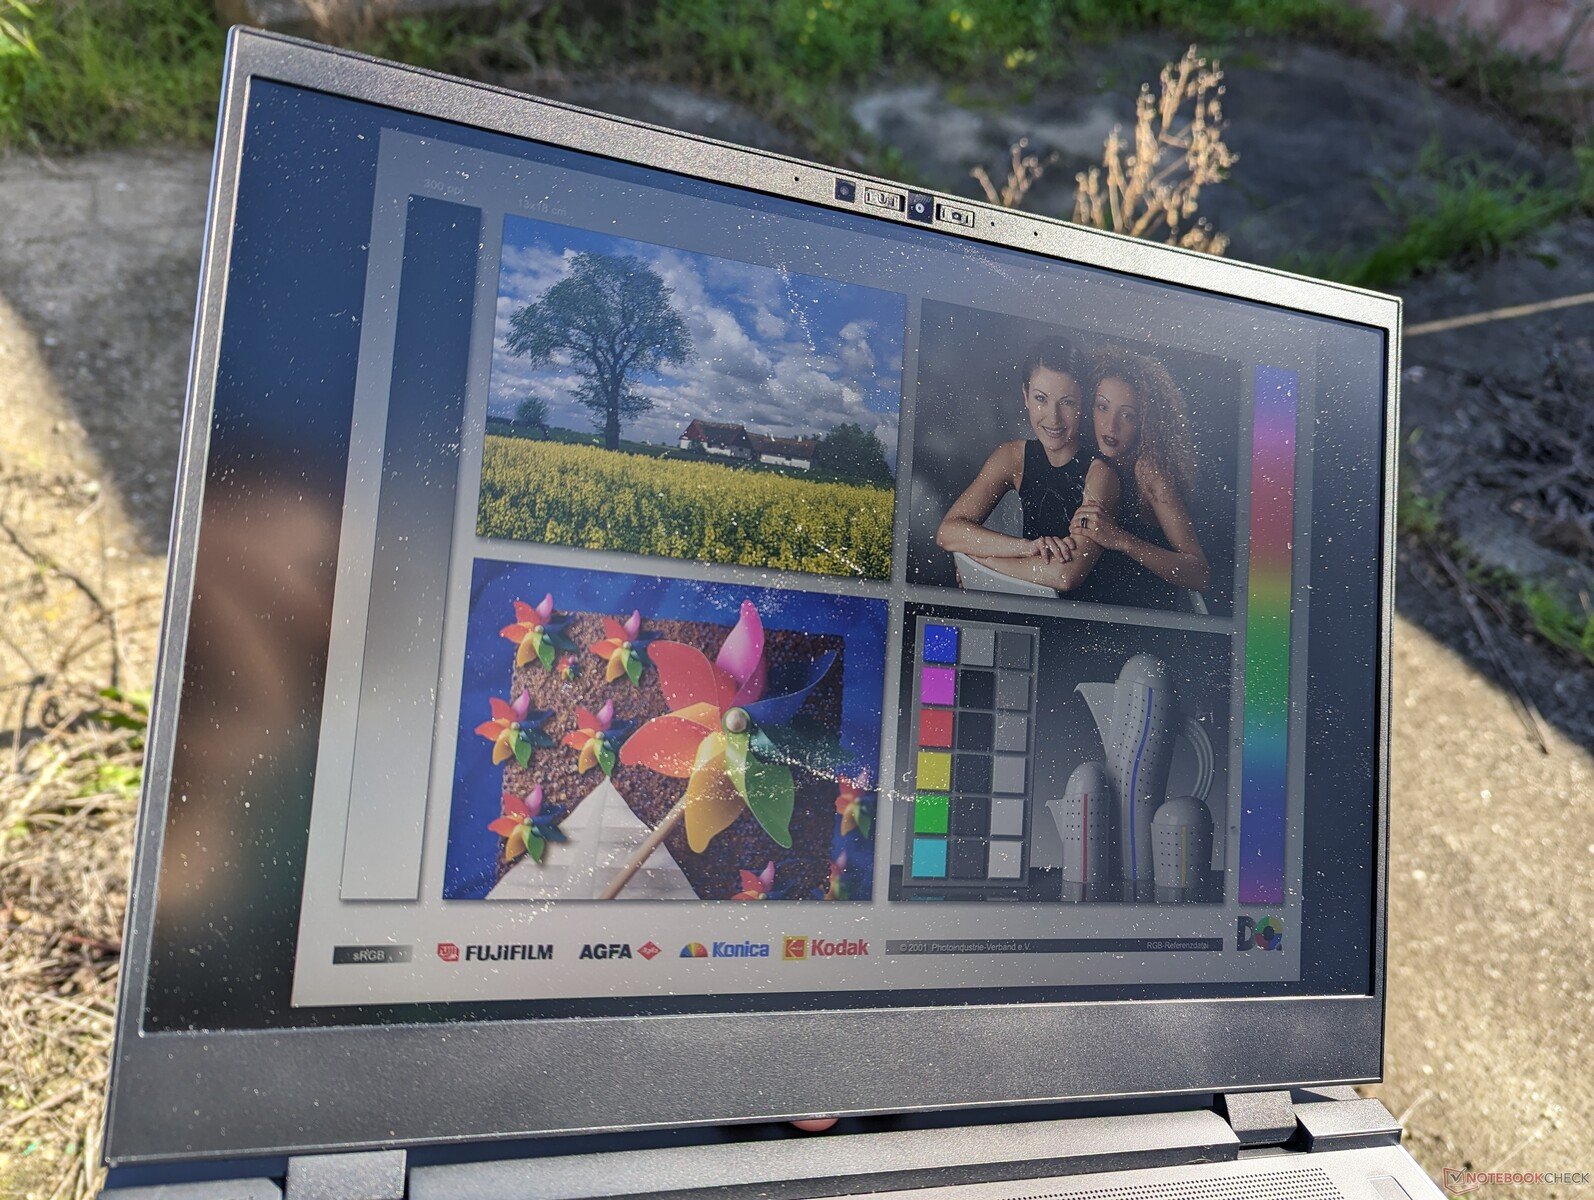
Écran - Désolé, pas d'OLED
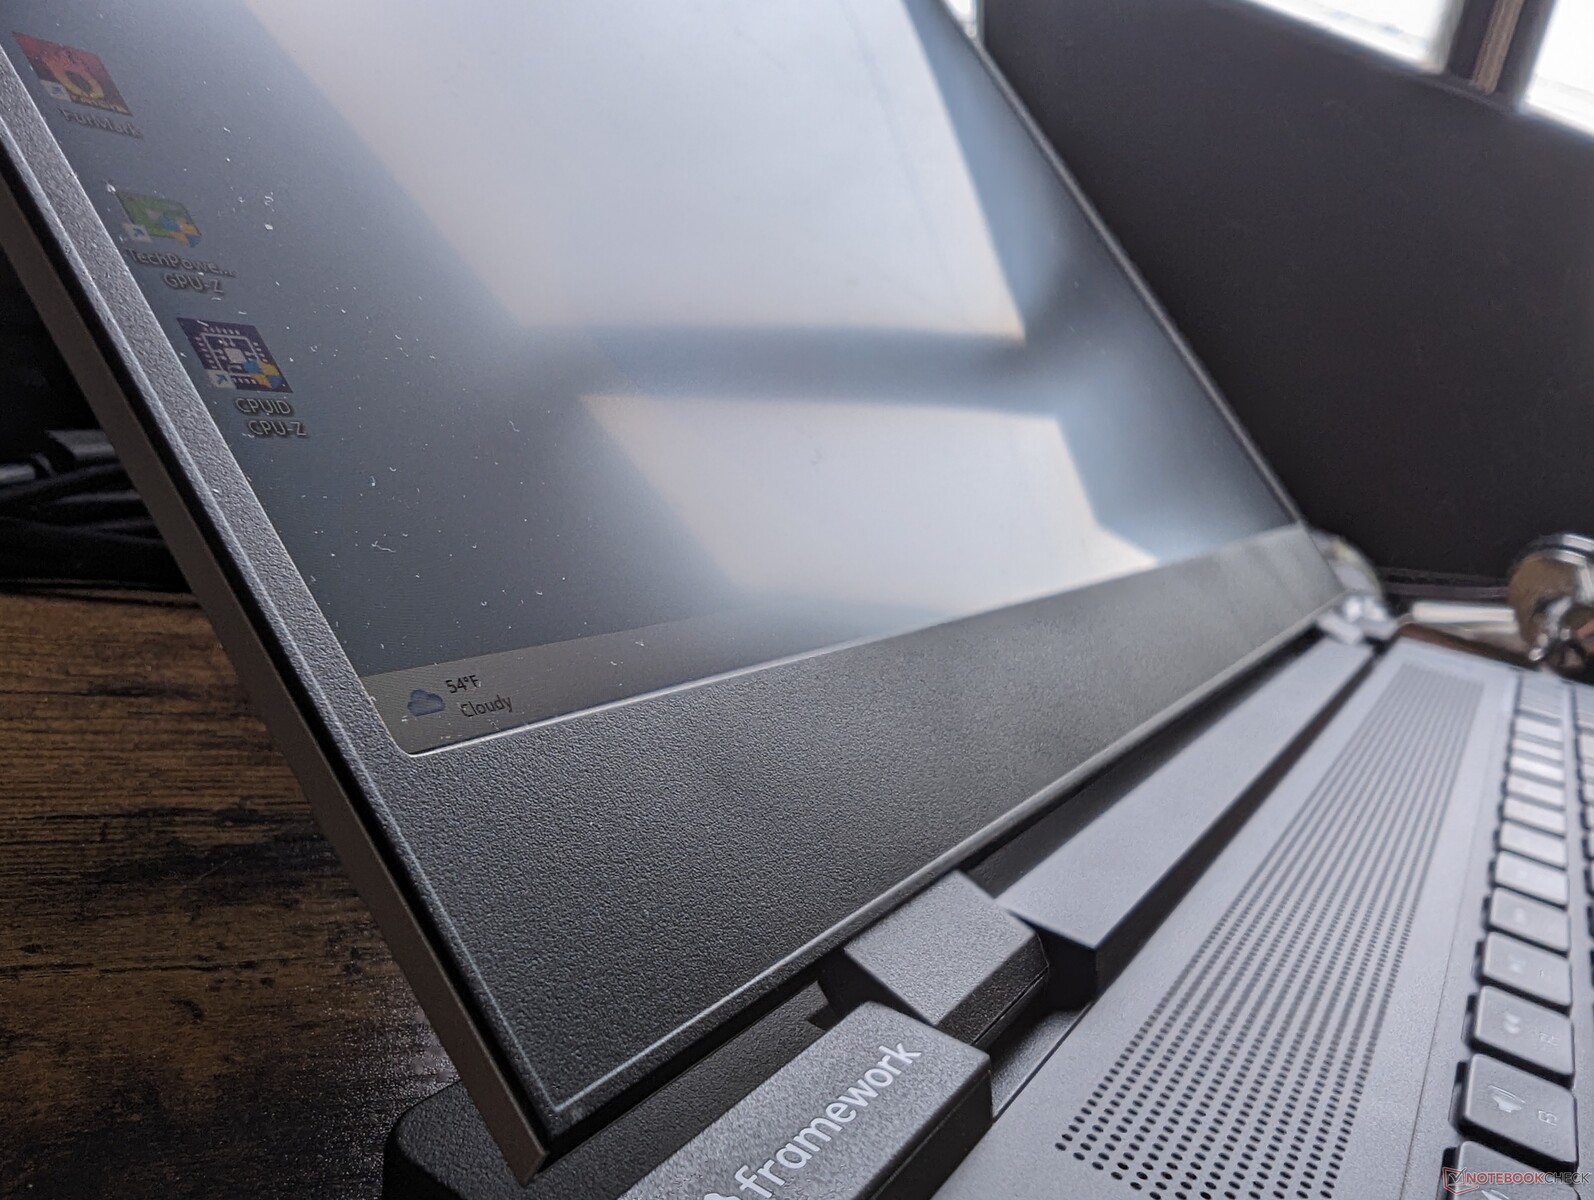
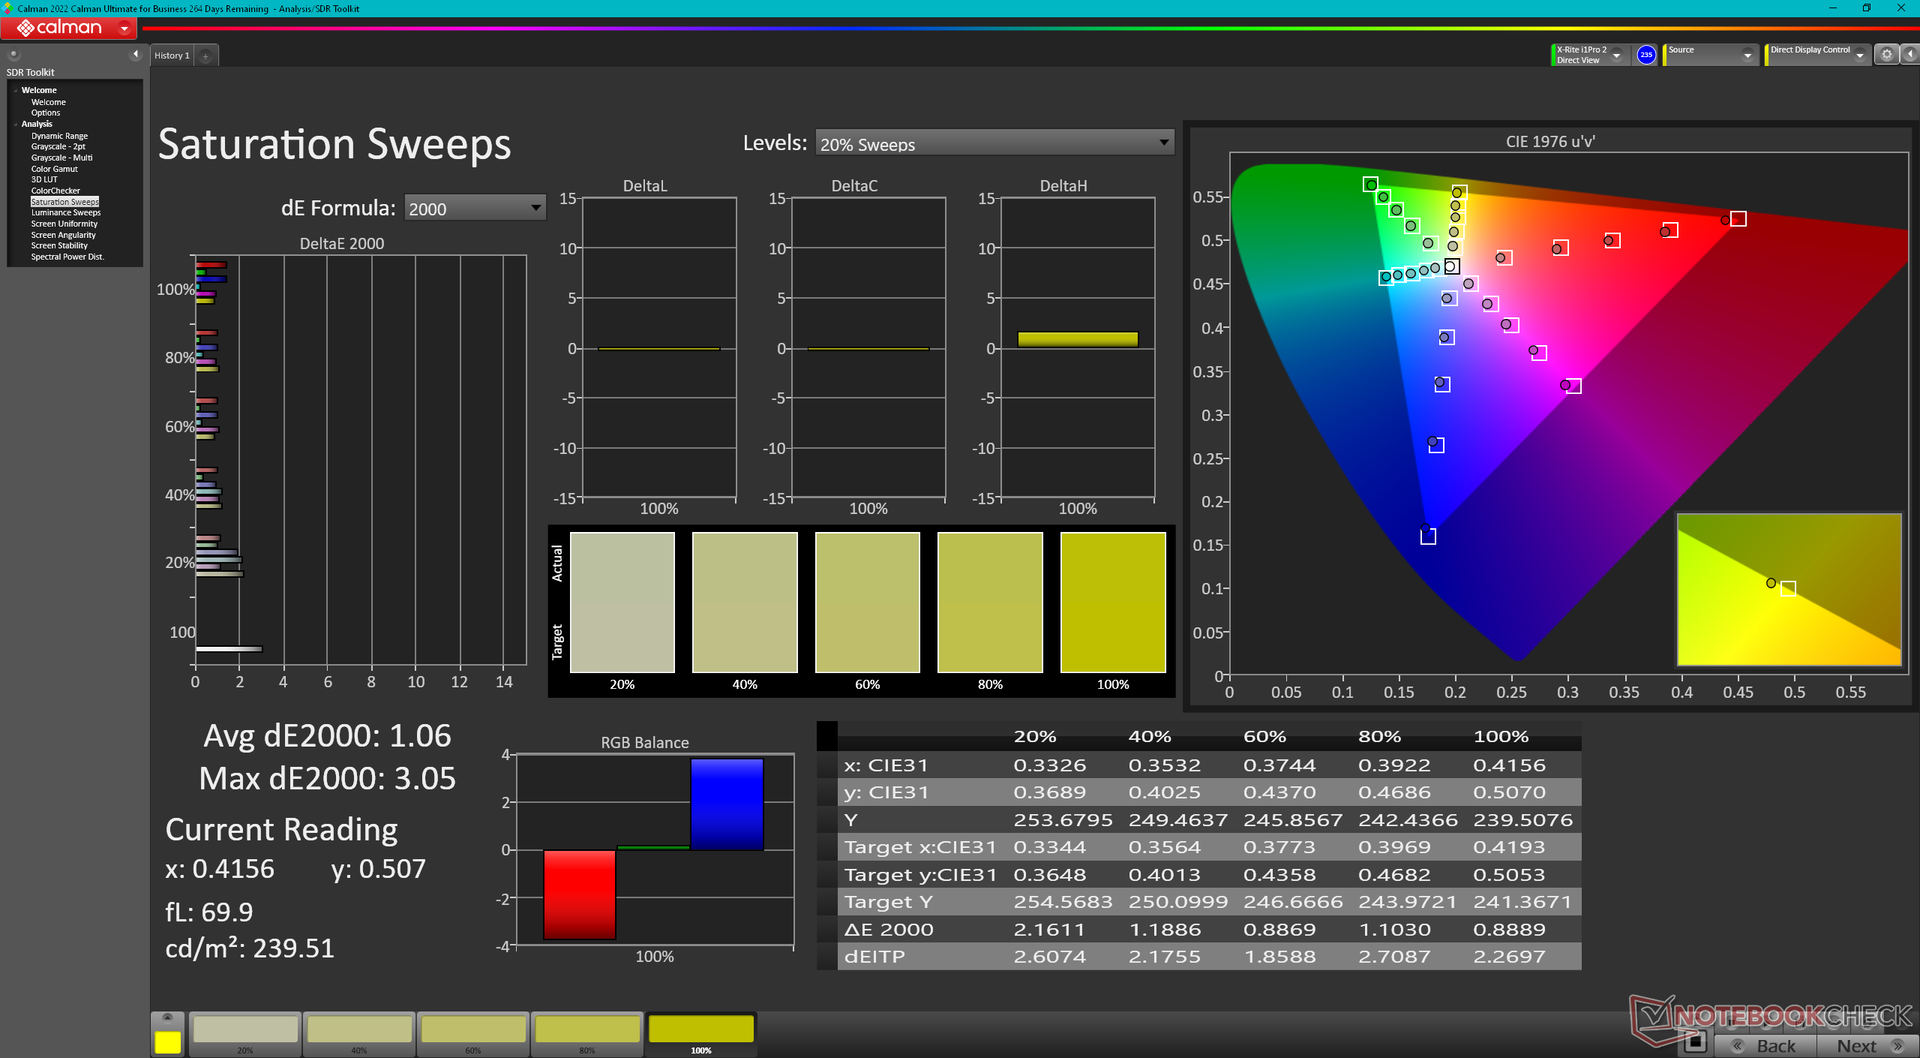
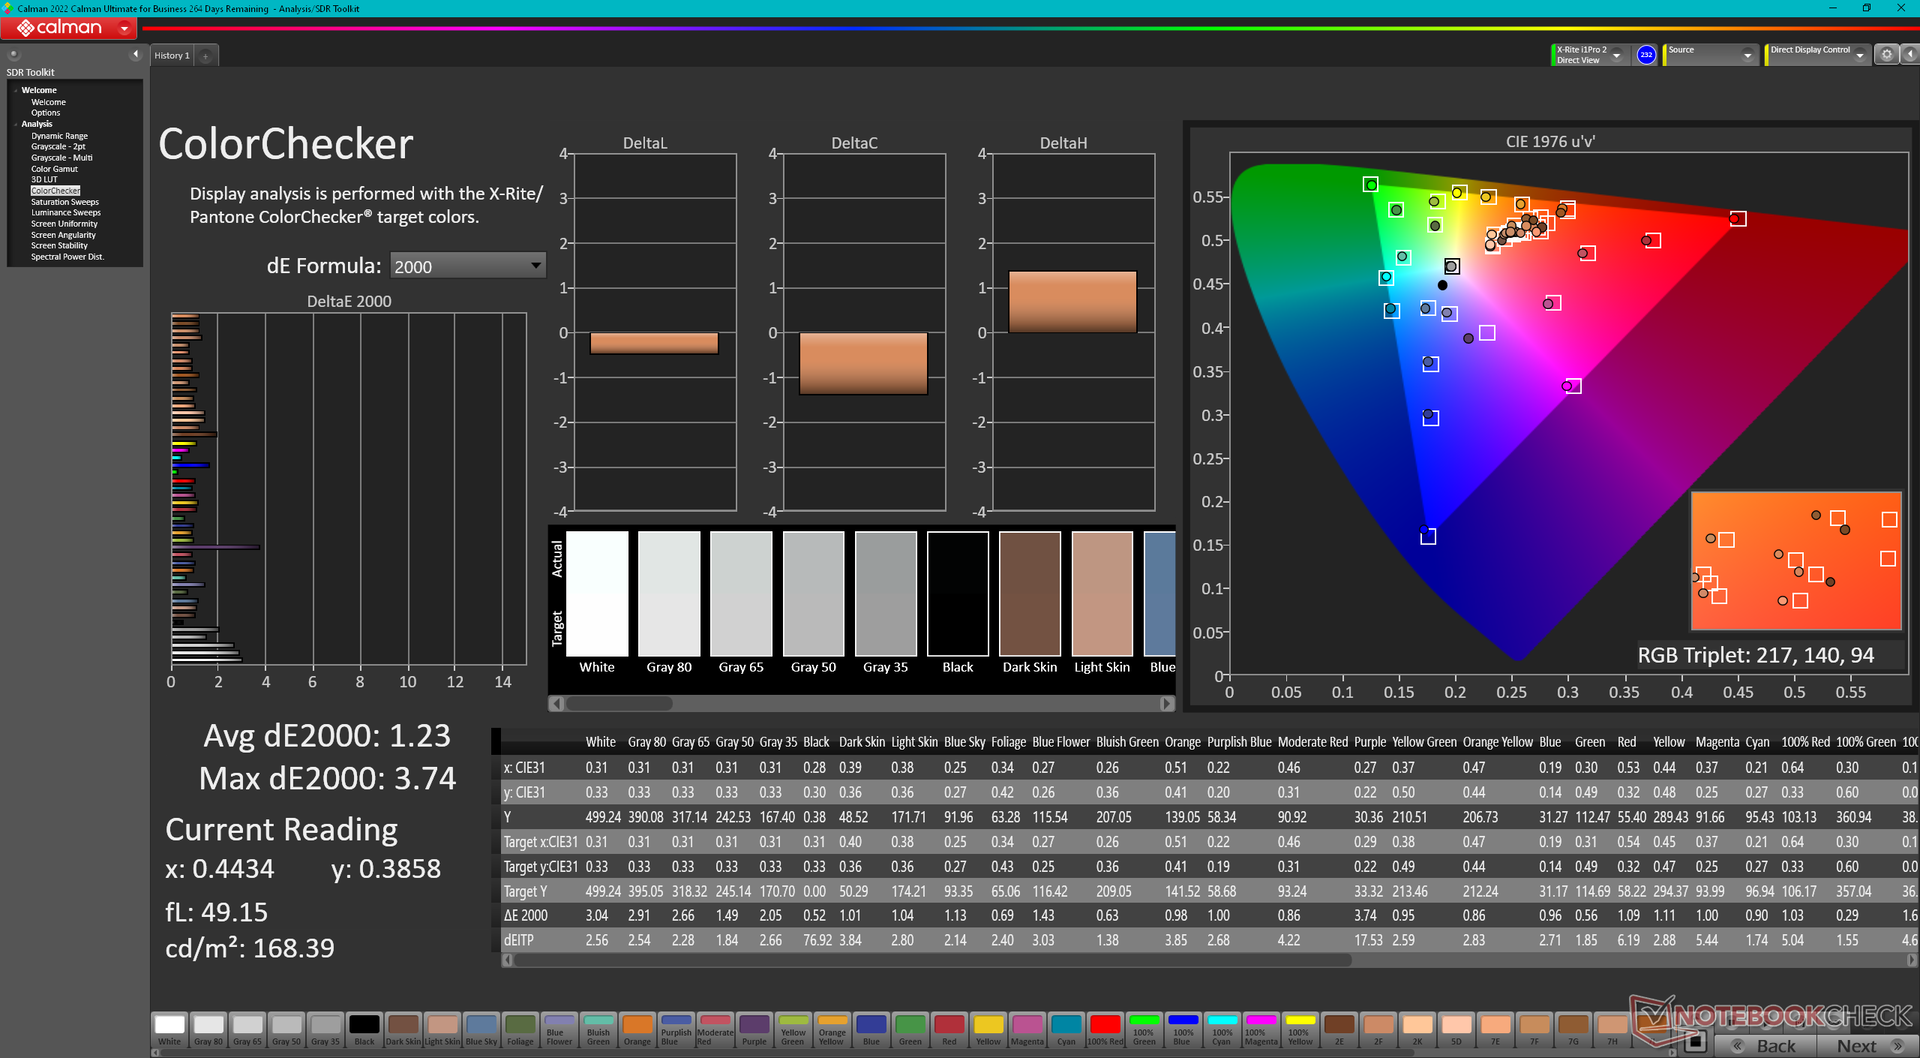
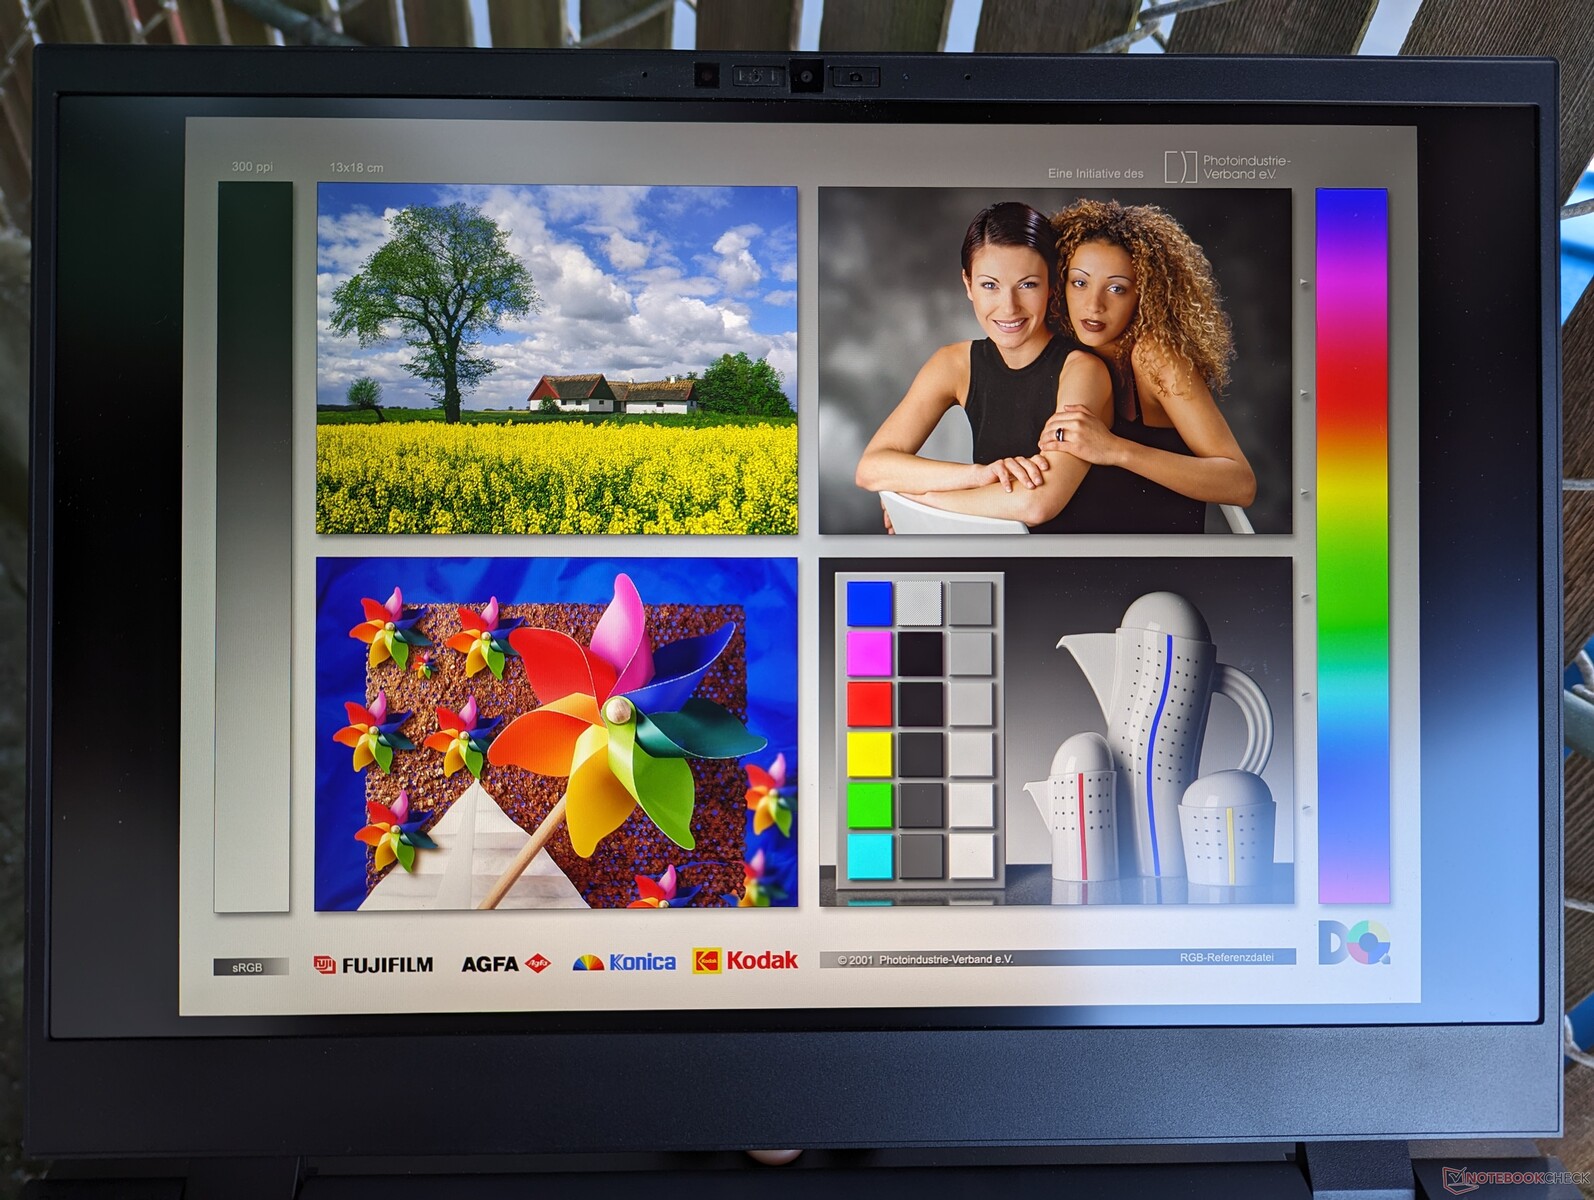
En l'absence de toute autre option d'affichage au moment où nous écrivons ces lignes, nous attendons beaucoup de l'unique écran IPS fourni avec toutes les configurations du Laptop 16. Heureusement, nous pouvons affirmer que Framework n'a pas lésiné sur l'affichage. La dalle 2560 x 1600 offre des temps de réponse rapides, des couleurs DCI-P3, un rétroéclairage lumineux, un taux de contraste relativement élevé et même un taux de rafraîchissement variable de 165 Hz avec le support FreeSync. Le Laptop 16 est donc l'un des premiers ordinateurs portables à être livré avec l'écran BOE NE160QDM-NZ6 VRR.
En tant que panneau IPS, cependant, il n'atteint pas les mêmes taux de contraste ou les mêmes temps de réponse qu'un panneau OLED typique comme ceux du Asus VivoBook 16 d'Asus. Il ne prend pas non plus en charge le HDR, qui devient une caractéristique de plus en plus courante sur les ordinateurs portables multimédias. Pour un ordinateur portable qui se targue d'être évolutif pour l'utilisateur final, il est étrange de ne pas voir d'option de second écran. Malgré tout, il s'agit de l'un des meilleurs écrans IPS de 16 pouces que nous ayons vus, tant pour l'édition que pour les jeux.

| |||||||||||||||||||||||||
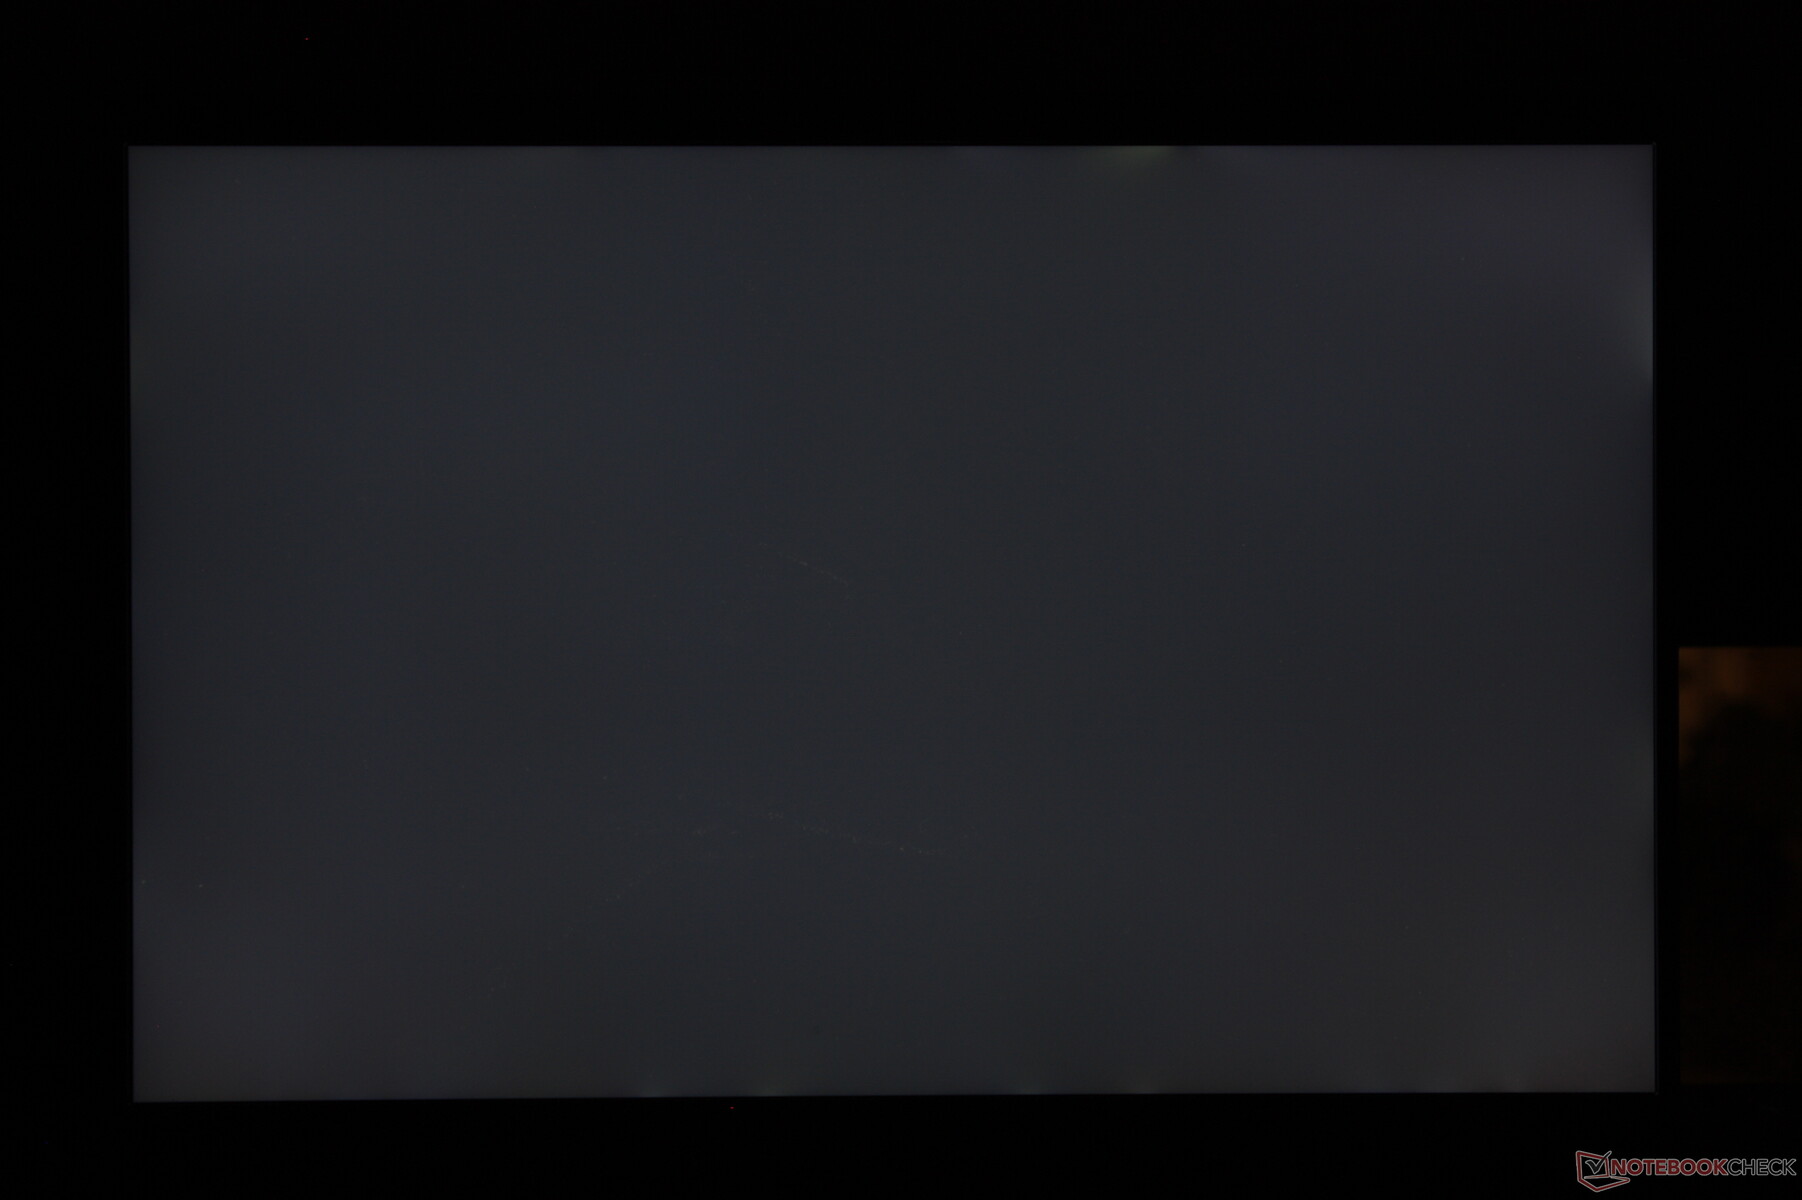
Homogénéité de la luminosité: 84 %
Valeur mesurée au centre, sur batterie: 504.8 cd/m²
Contraste: 1231:1 (Valeurs des noirs: 0.41 cd/m²)
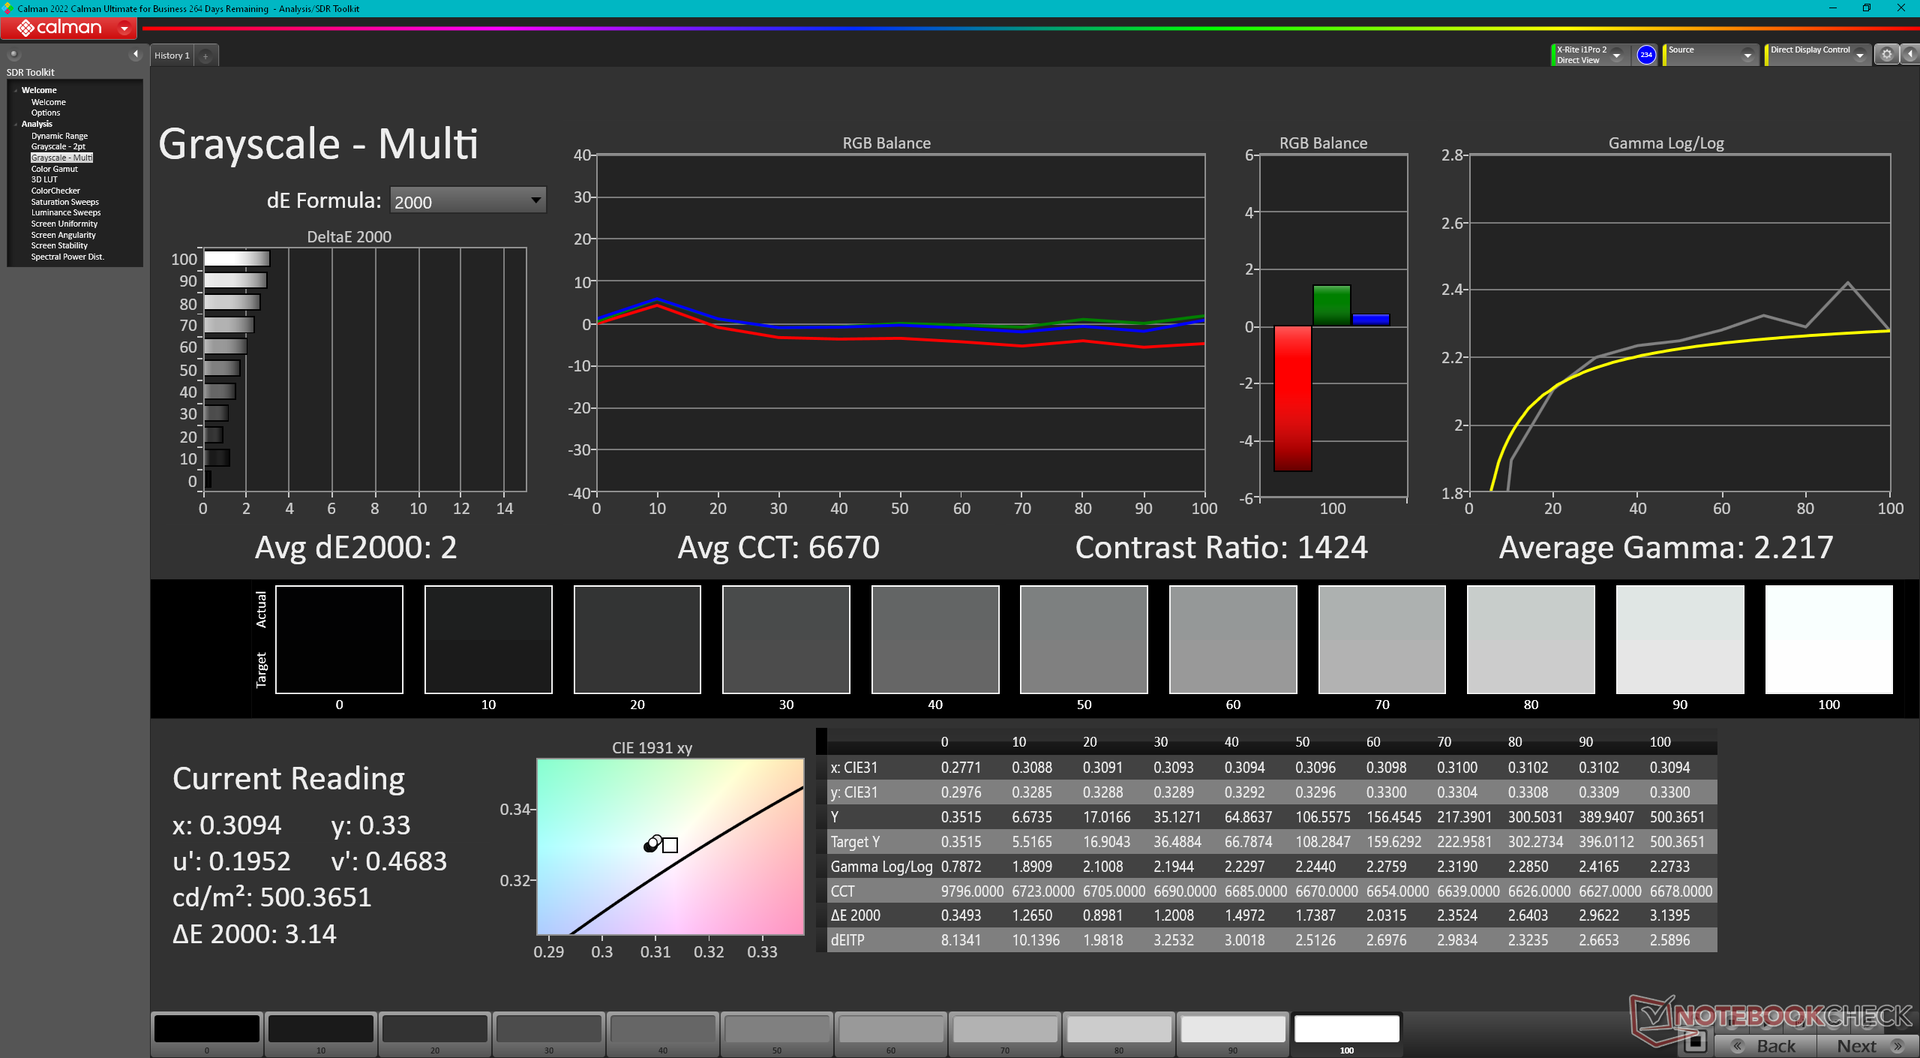
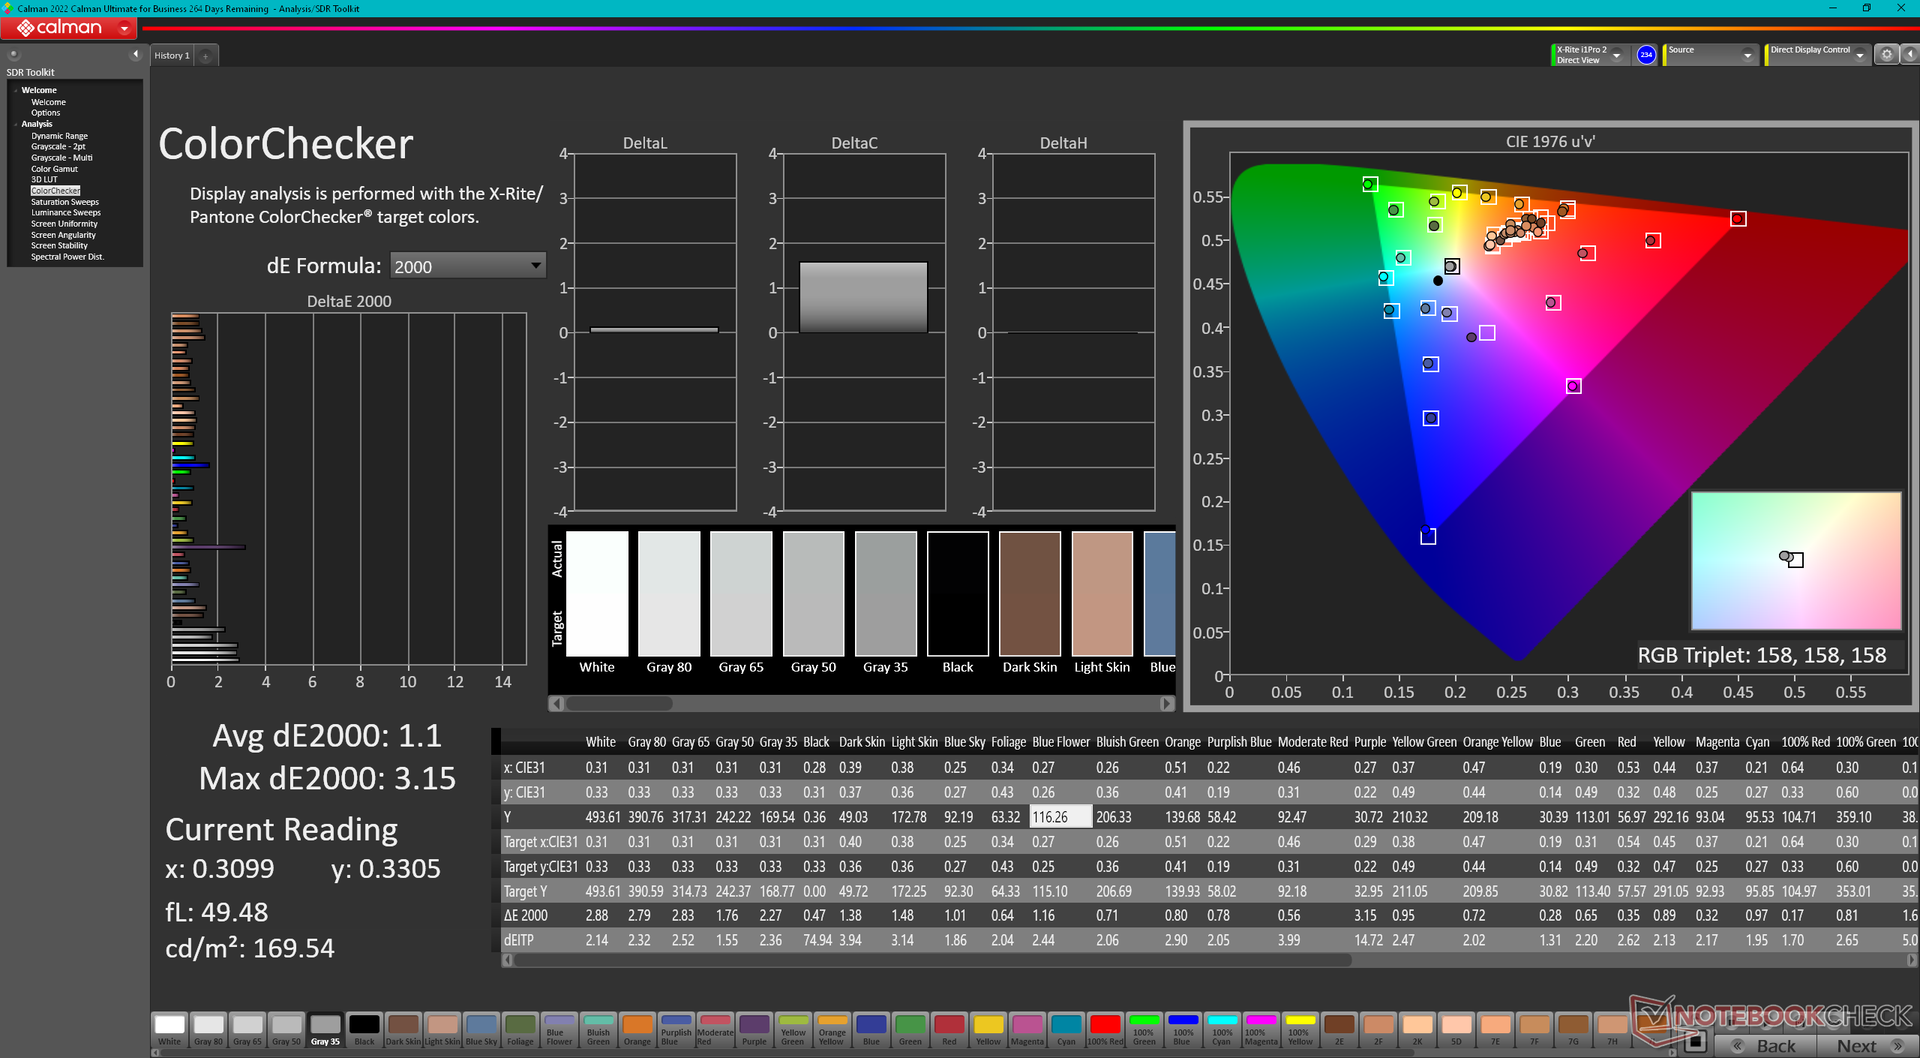
ΔE ColorChecker Calman: 1.23 | ∀{0.5-29.43 Ø4.71}
calibrated: 1.1
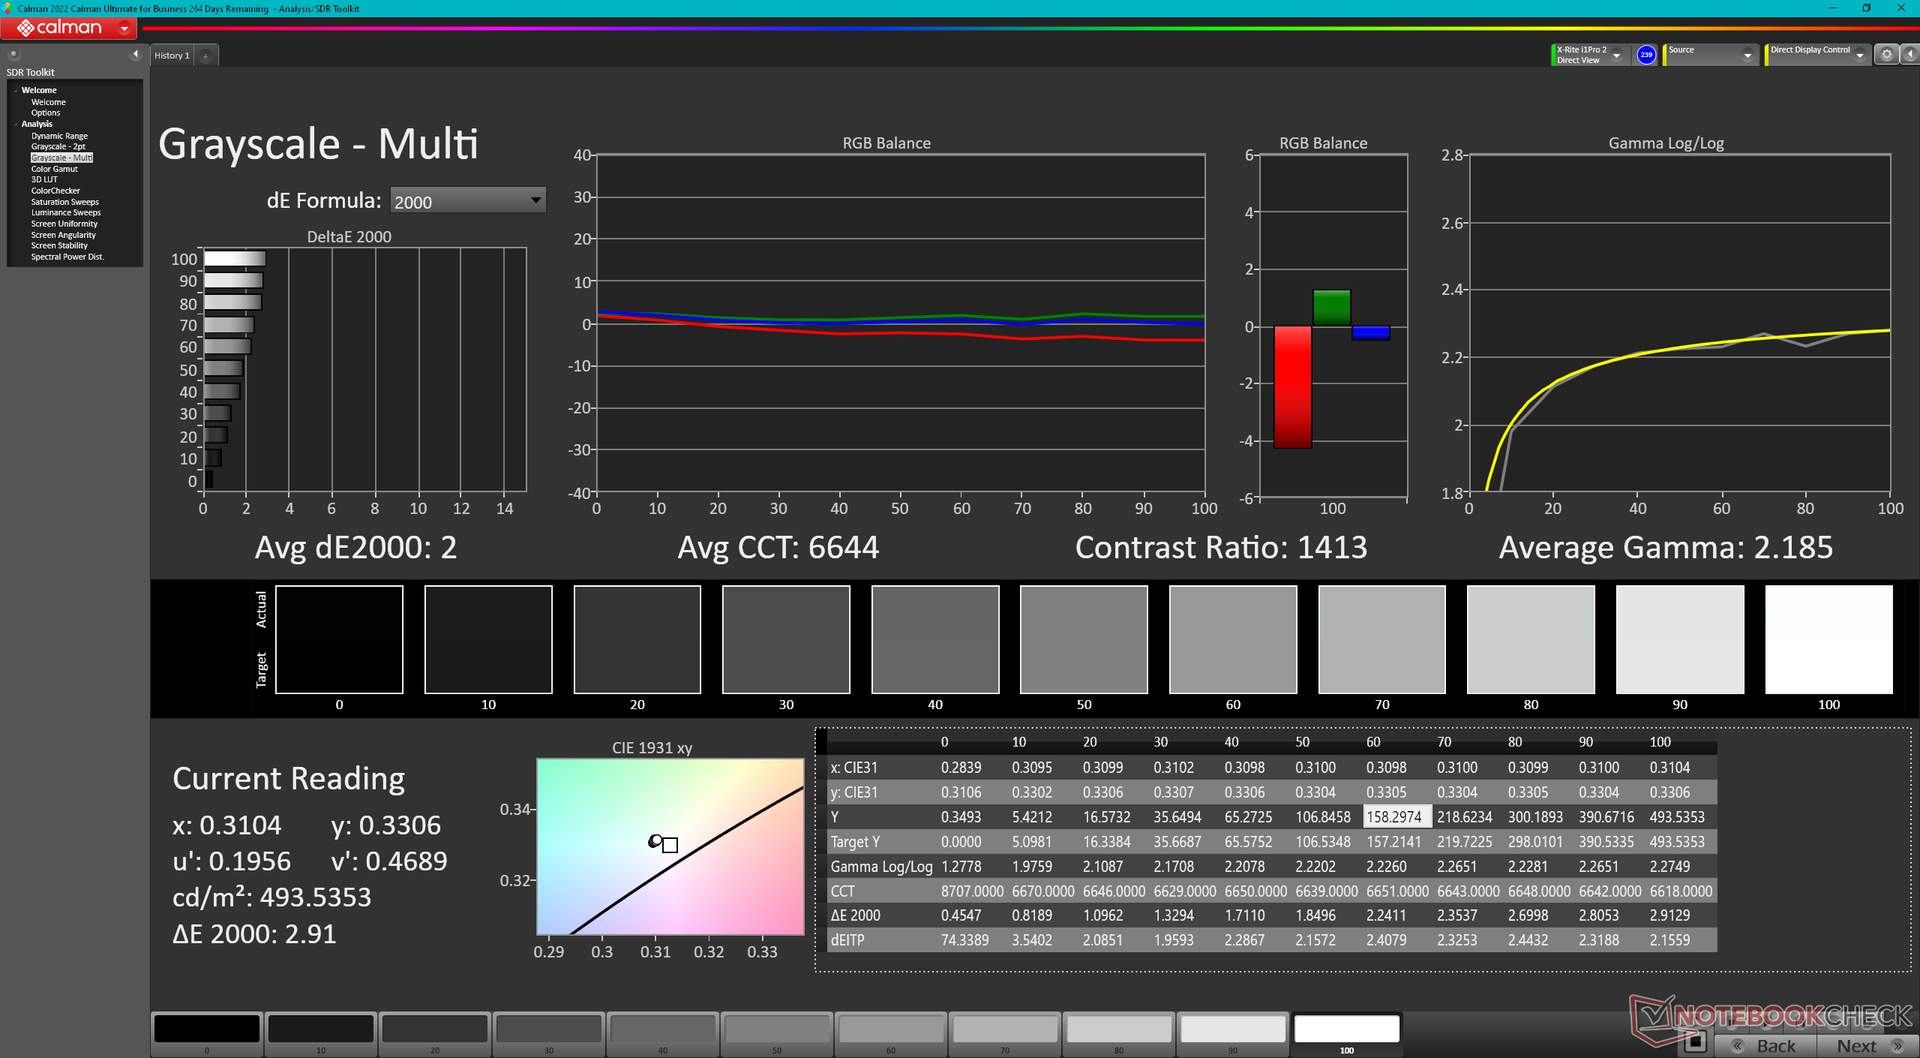
ΔE Greyscale Calman: 2 | ∀{0.09-98 Ø4.96}
87% AdobeRGB 1998 (Argyll 3D)
99.7% sRGB (Argyll 3D)
97.7% Display P3 (Argyll 3D)
Gamma: 2.22
CCT: 6670 K
| Framework Laptop 16 2560x1600, 16" | MSI Prestige 16 B1MG-001US AU Optronics B160QAN03.R, IPS, 2560x1600, 16" | Lenovo ThinkPad Z16 Gen 2 Samsung ATNA60YV04-0, OLED, 3840x2400, 16" | Apple MacBook Pro 16 2023 M3 Max Mini-LED, 3456x2234, 16" | Dell Inspiron 16 Plus 7630 LG Philips 160WQ2, IPS, 2560x1600, 16" | HP Spectre x360 2-in-1 16-f1075ng AU Optronics AUO50A3, IPS, 3072x1920, 16" | |
|---|---|---|---|---|---|---|
| Display | -1% | 4% | 2% | -15% | -11% | |
| Display P3 Coverage (%) | 97.7 | 96.7 -1% | 99.7 2% | 99.2 2% | 70.1 -28% | 75.6 -23% |
| sRGB Coverage (%) | 99.7 | 99.8 0% | 100 0% | 99.6 0% | 100.2 1% | |
| AdobeRGB 1998 Coverage (%) | 87 | 84.6 -3% | 96.7 11% | 72.3 -17% | 77.2 -11% | |
| Response Times | -219% | 85% | -322% | -127% | -202% | |
| Response Time Grey 50% / Grey 80% * (ms) | 14.6 ? | 49.4 ? -238% | 1.86 ? 87% | 66.9 ? -358% | 35 ? -140% | 52 ? -256% |
| Response Time Black / White * (ms) | 11.3 ? | 33.9 ? -200% | 1.89 ? 83% | 43.6 ? -286% | 24.2 ? -114% | 28 ? -148% |
| PWM Frequency (Hz) | 60 ? | 14877 | ||||
| Screen | -70% | -6% | 15% | -50% | -120% | |
| Brightness middle (cd/m²) | 504.8 | 473.6 -6% | 390.1 -23% | 630 25% | 299.4 -41% | 425 -16% |
| Brightness (cd/m²) | 490 | 456 -7% | 393 -20% | 604 23% | 290 -41% | 406 -17% |
| Brightness Distribution (%) | 84 | 87 4% | 97 15% | 94 12% | 92 10% | 78 -7% |
| Black Level * (cd/m²) | 0.41 | 0.19 54% | 0.21 49% | 0.24 41% | ||
| Contrast (:1) | 1231 | 2493 103% | 1426 16% | 1771 44% | ||
| Colorchecker dE 2000 * | 1.23 | 5.9 -380% | 1.41 -15% | 1.2 2% | 4.25 -246% | 5.8 -372% |
| Colorchecker dE 2000 max. * | 3.74 | 9.37 -151% | 3.43 8% | 2.8 25% | 6.71 -79% | 11.03 -195% |
| Colorchecker dE 2000 calibrated * | 1.1 | 0.89 19% | 0.52 53% | 4.16 -278% | ||
| Greyscale dE 2000 * | 2 | 7.3 -265% | 2 -0% | 1.9 5% | 5.5 -175% | 7.57 -279% |
| Gamma | 2.22 99% | 1.9 116% | 2.22 99% | 2.29 96% | 2.35 94% | 6600 0% |
| CCT | 6670 97% | 7260 90% | 6324 103% | 6812 95% | 6368 102% | |
| Moyenne finale (programmes/paramètres) | -97% /
-77% | 28% /
13% | -102% /
-61% | -64% /
-54% | -111% /
-108% |
* ... Moindre est la valeur, meilleures sont les performances
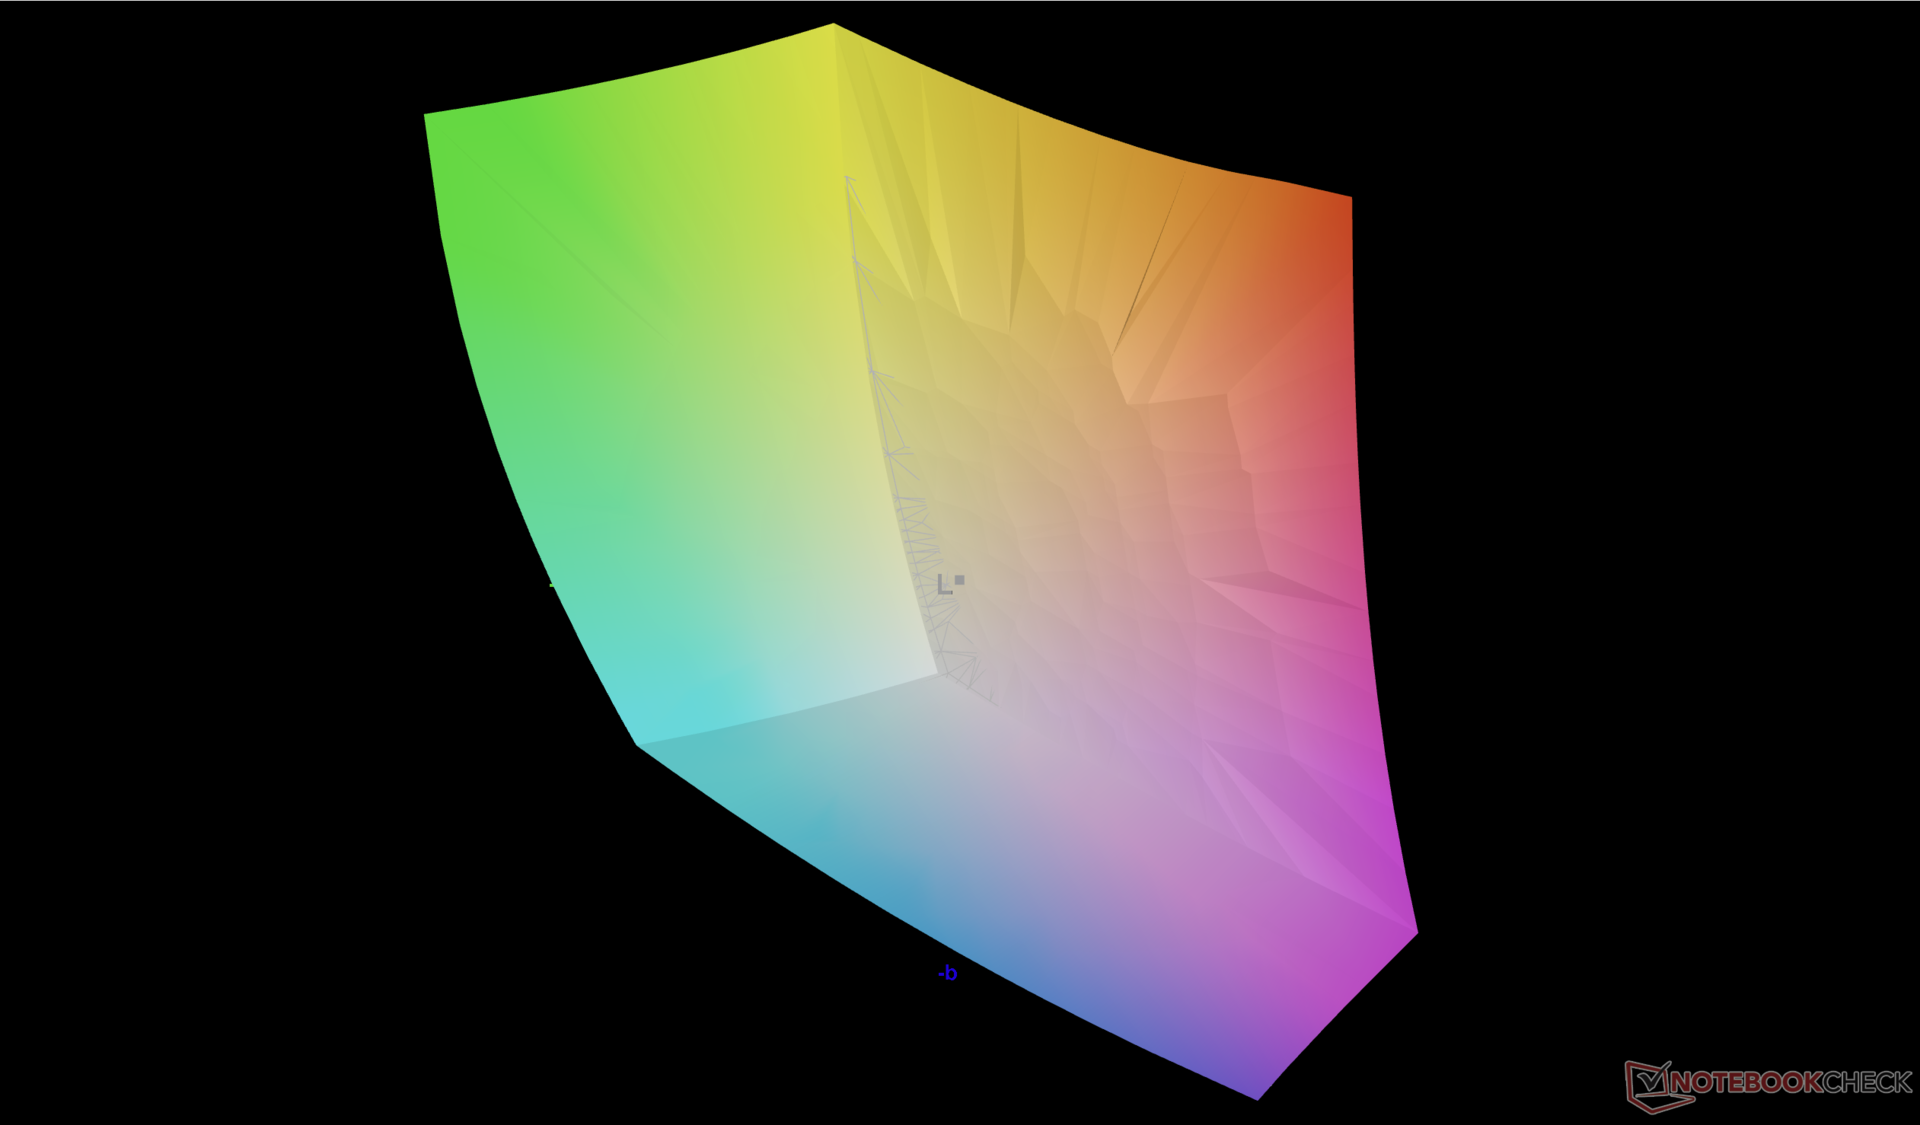
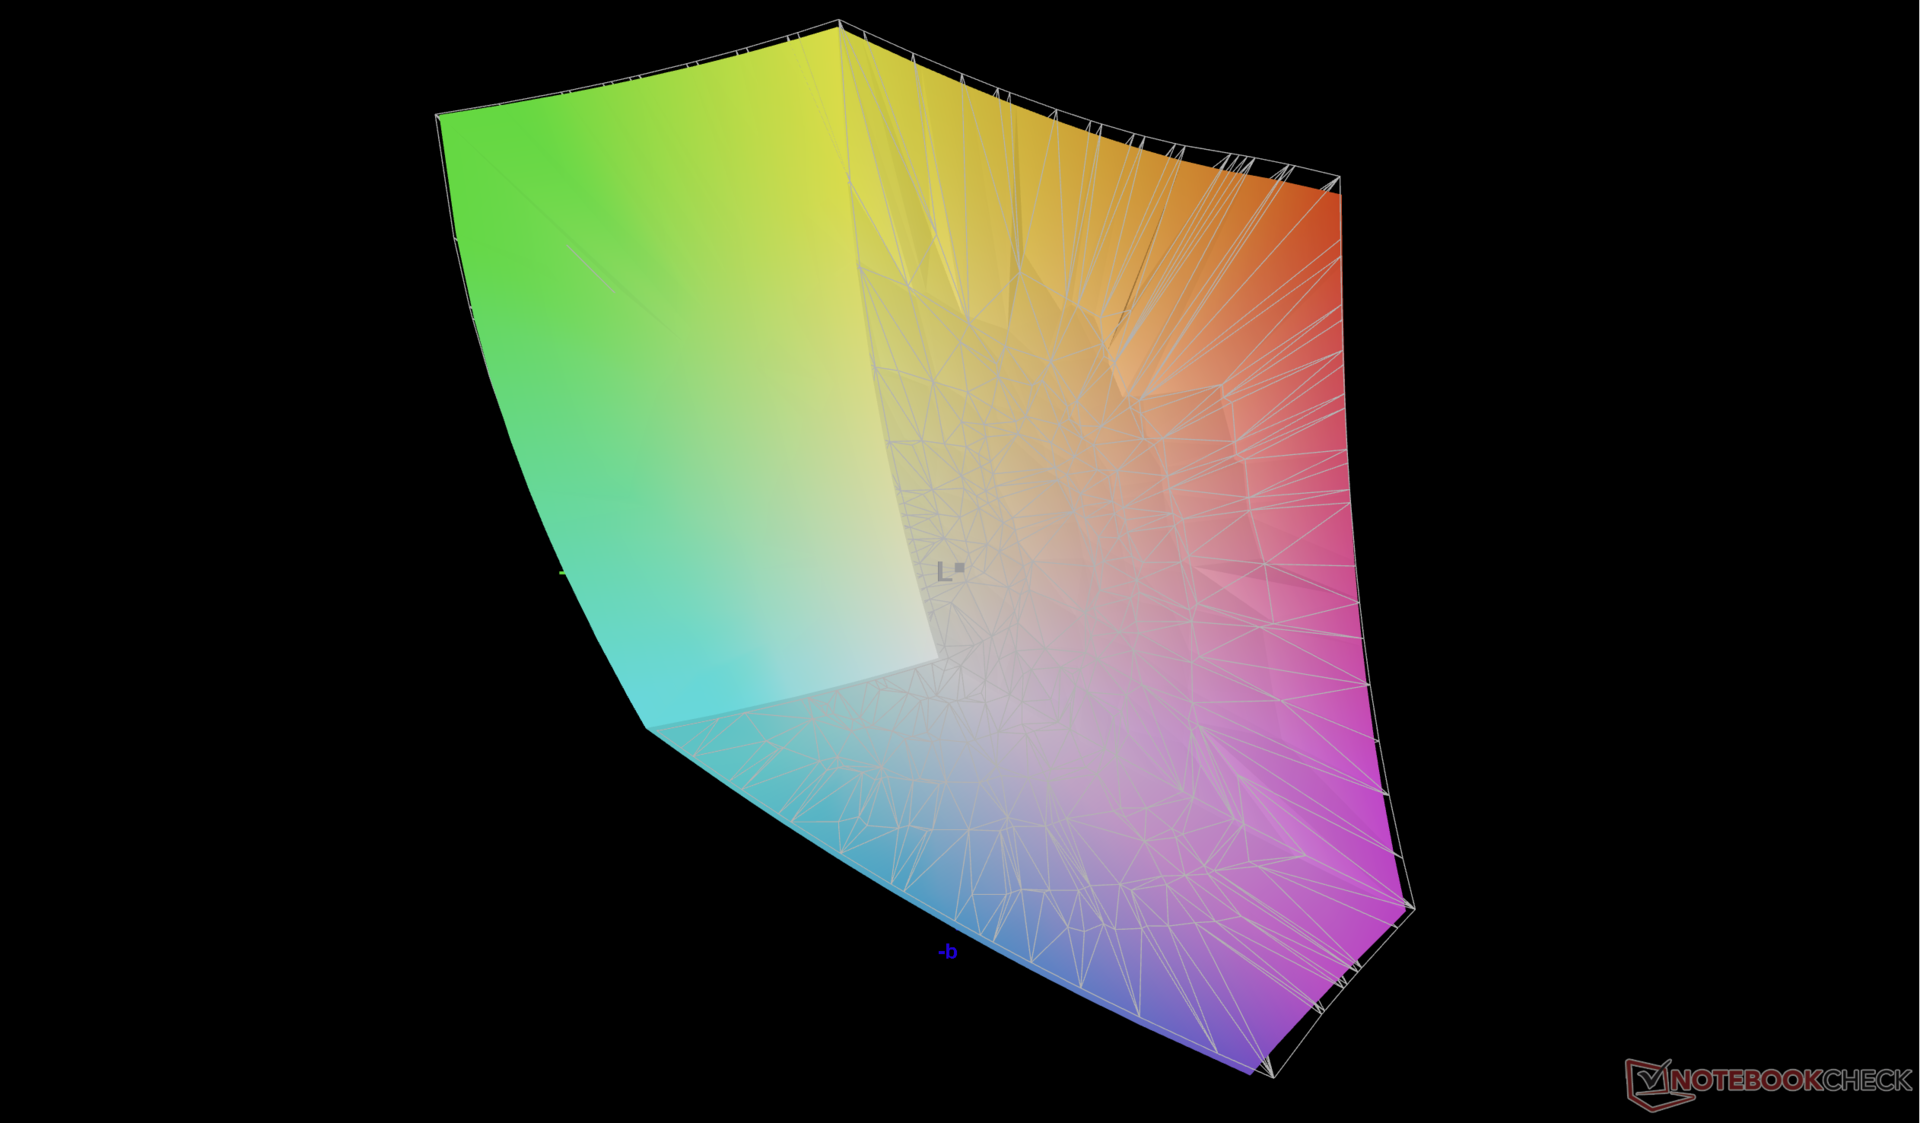
L'écran est bien calibré par rapport à la norme sRGB, même s'il couvre 100 % de la norme DCI-P3. L'étalonnage de l'écran par nos soins n'améliorerait pas ses valeurs deltaE moyennes de manière notable et un étalonnage par l'utilisateur final ne sera donc pas nécessaire pour la plupart des utilisateurs.

Temps de réponse de l'écran
| ↔ Temps de réponse noir à blanc | ||
|---|---|---|
| 11.3 ms ... hausse ↗ et chute ↘ combinées | ↗ 6.1 ms hausse | 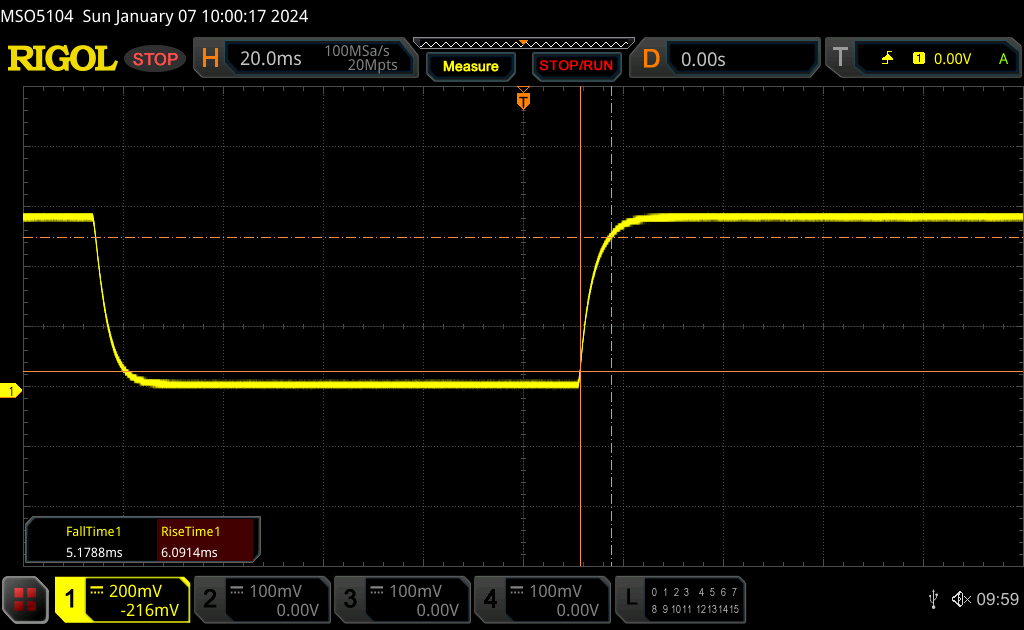 |
| ↘ 5.2 ms chute | ||
| L'écran montre de bons temps de réponse, mais insuffisant pour du jeu compétitif. En comparaison, tous les appareils testés affichent entre 0.1 (minimum) et 240 (maximum) ms. » 31 % des appareils testés affichent de meilleures performances. Cela signifie que les latences relevées sont meilleures que la moyenne (19.8 ms) de tous les appareils testés. | ||
| ↔ Temps de réponse gris 50% à gris 80% | ||
| 14.6 ms ... hausse ↗ et chute ↘ combinées | ↗ 7.1 ms hausse | 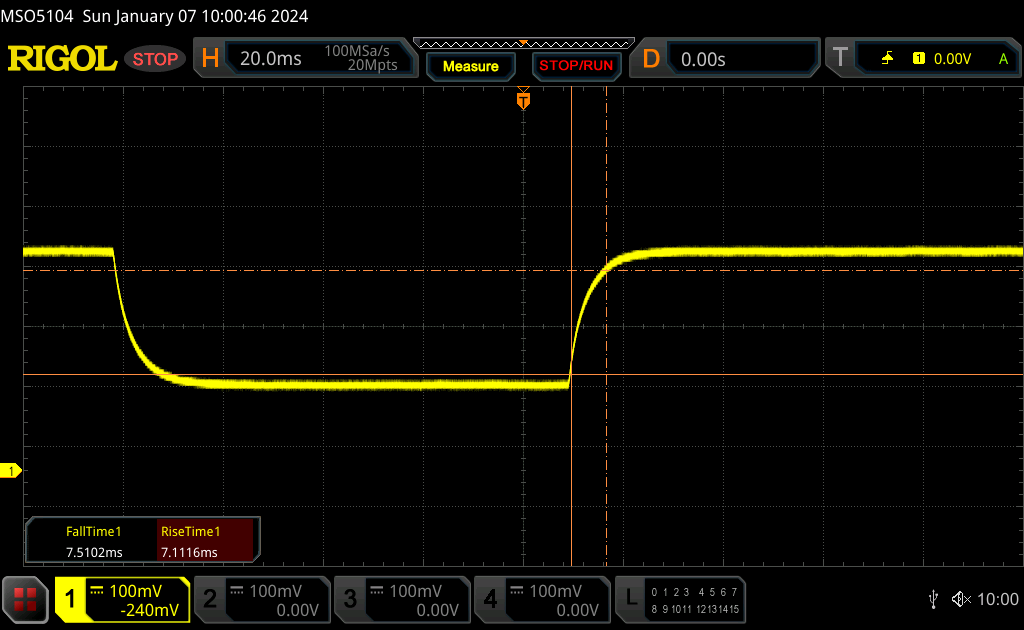 |
| ↘ 7.5 ms chute | ||
| L'écran montre de bons temps de réponse, mais insuffisant pour du jeu compétitif. En comparaison, tous les appareils testés affichent entre 0.165 (minimum) et 636 (maximum) ms. » 29 % des appareils testés affichent de meilleures performances. Cela signifie que les latences relevées sont meilleures que la moyenne (31 ms) de tous les appareils testés. | ||
Scintillement / MLI (Modulation de largeur d'impulsion)
| Scintillement / MLI (Modulation de largeur d'impulsion) non décelé | 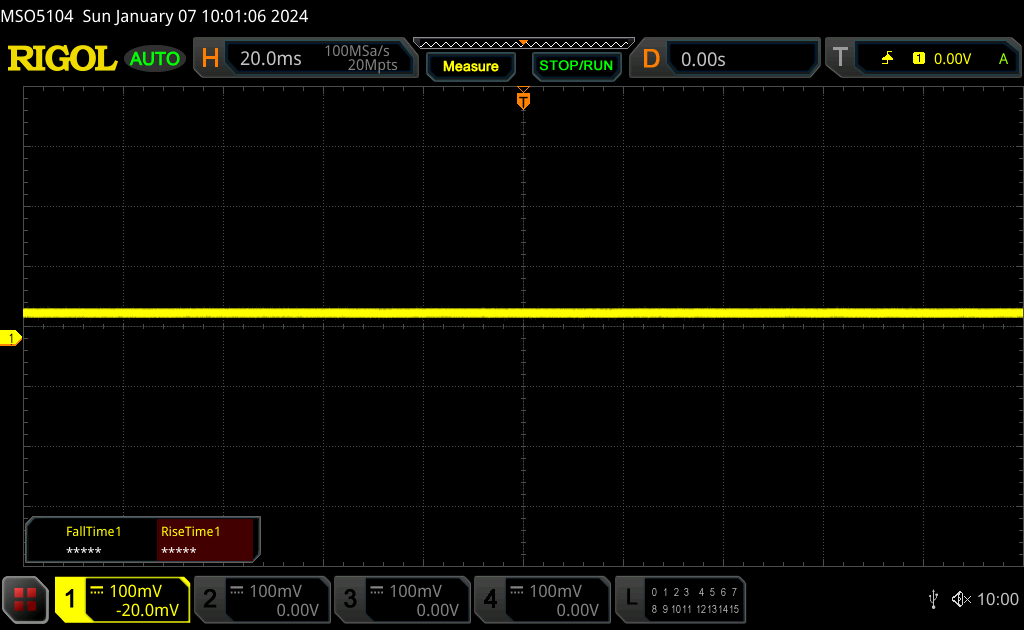 | ||
En comparaison, 52 % des appareils testés n'emploient pas MDI pour assombrir leur écran. Nous avons relevé une moyenne à 7754 (minimum : 5 - maximum : 343500) Hz dans le cas où une MDI était active. | |||
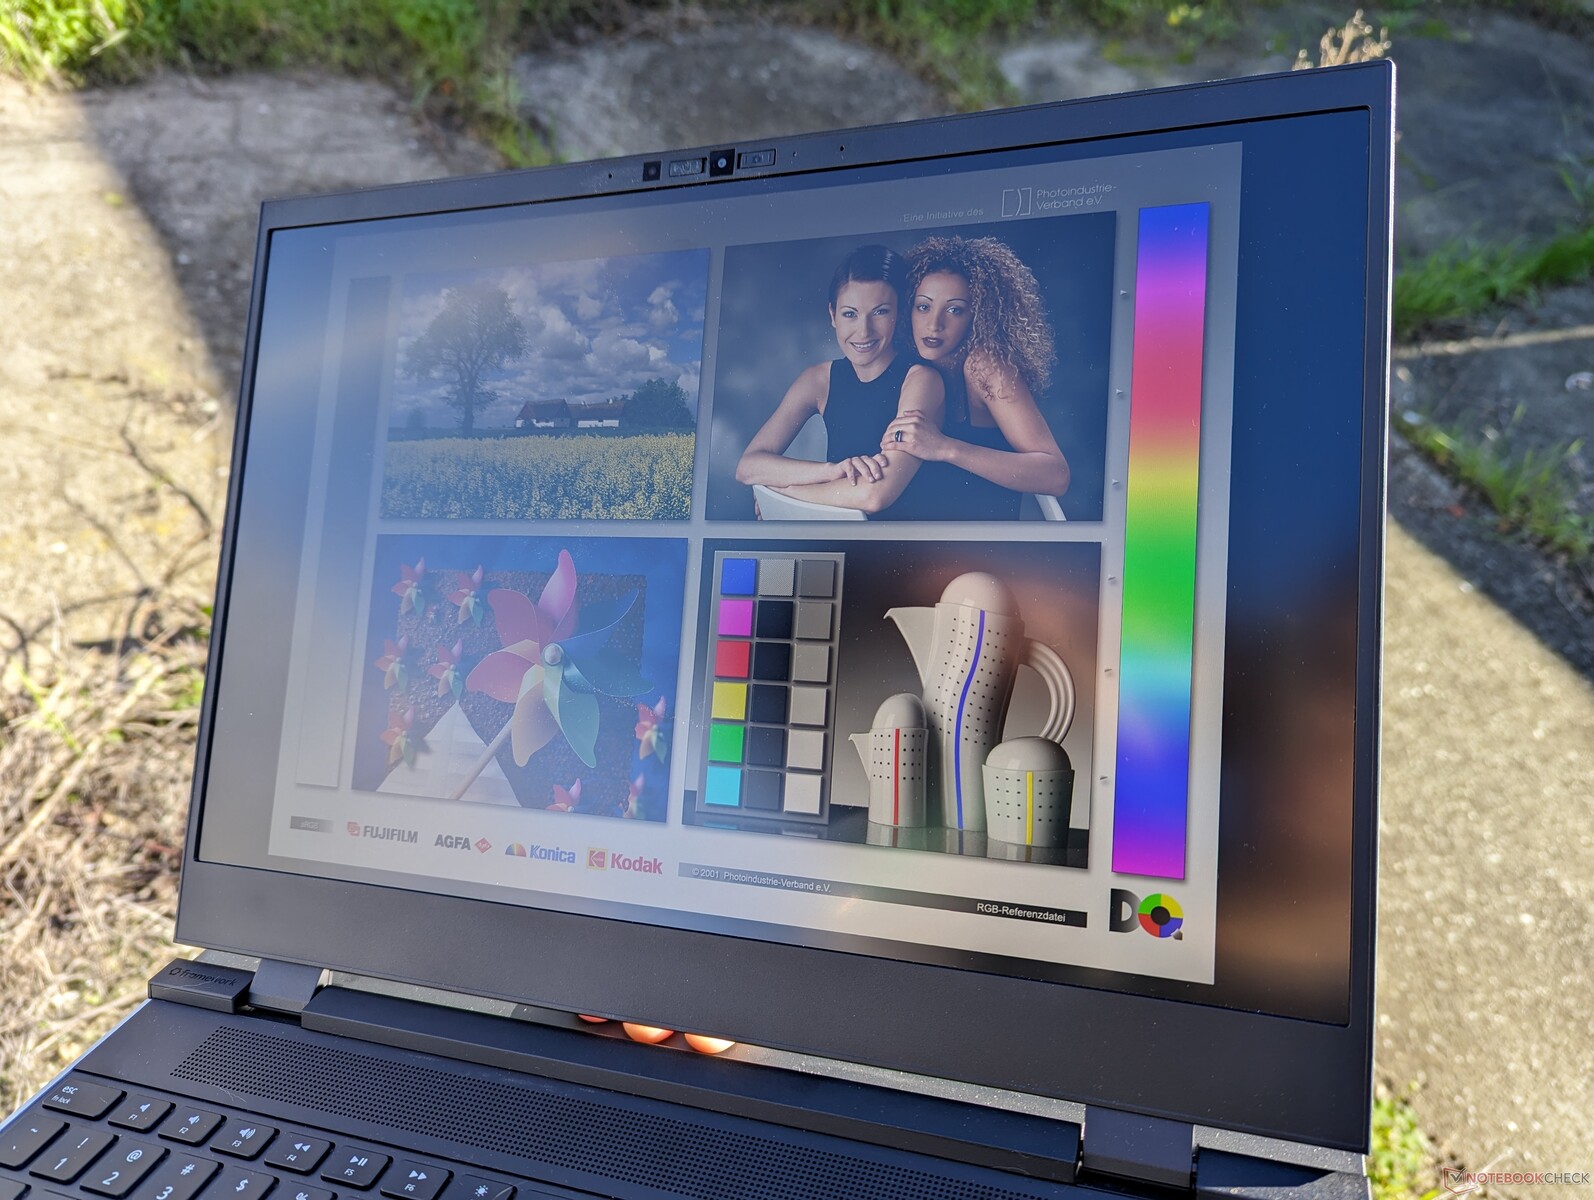
Avec 500 nits, l'écran est plus lumineux que beaucoup d'autres ordinateurs portables multimédias, y compris les panneaux OLED des ThinkPad Z16 Genesis ThinkPad Z16 Gen 2 ou du MSI Stealth 16. La luminosité élevée et le panneau mat rendent l'écran plus facile à voir dans des conditions extérieures.
Performance - Pas besoin d'Intel ou de Nvidia
Conditions d'essai
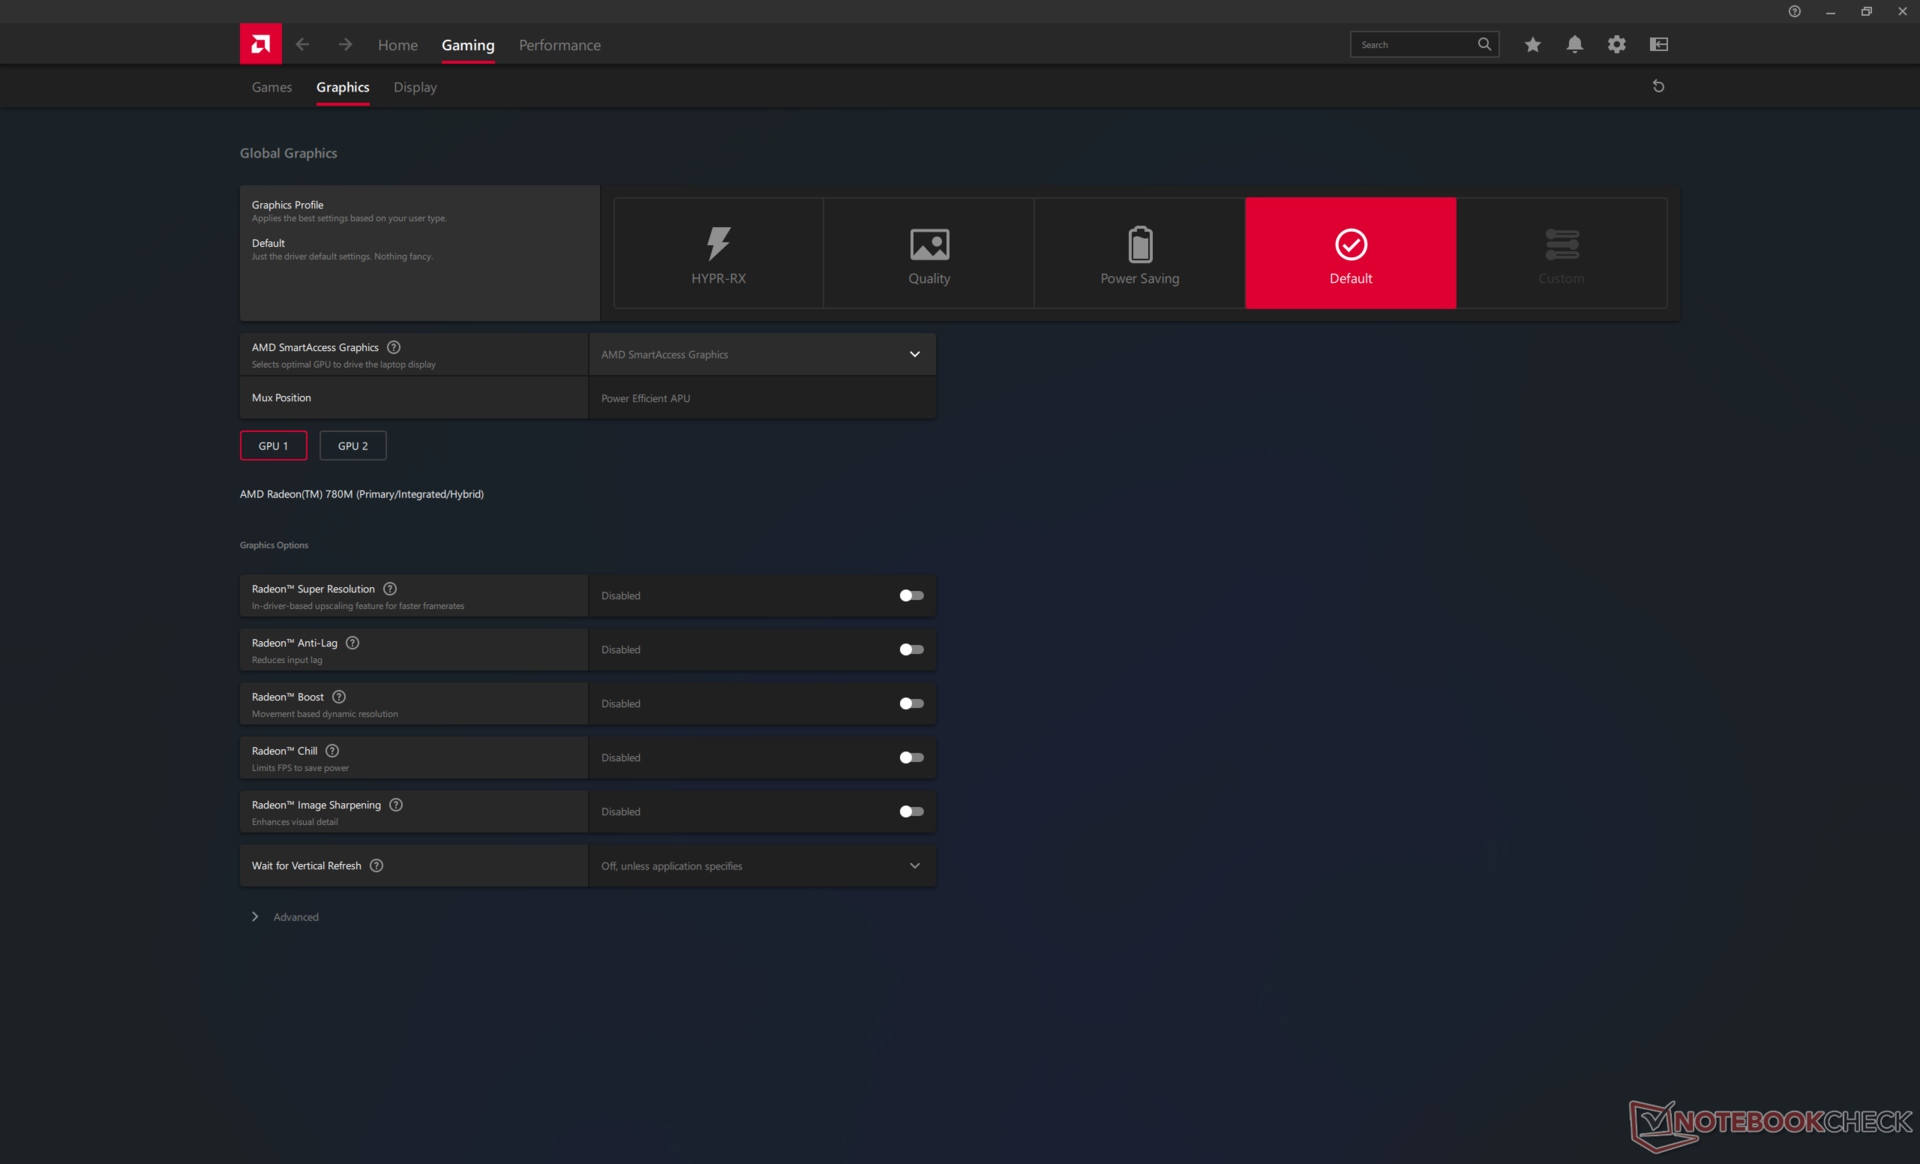
Nous avons réglé Windows sur le mode Performance et AMD Adrenalin sur Default avant d'effectuer les tests de référence ci-dessous. SmartAccess Graphics est la solution MUX d'AMD qui permet de basculer automatiquement entre l'iGPU et le dGPU en fonction de l'application. Le problème est que, contrairement aux ordinateurs portables équipés de GeForce, SmartAccess Graphics ne propose pas de mode "dGPU-only" ou "iGPU-only", de sorte que votre expérience graphique repose entièrement sur la commutation automatique. Le système doit se figer pendant quelques secondes chaque fois qu'il détecte une application gourmande en GPU, ce qui peut s'avérer gênant en cas de multitâche entre différentes fenêtres. La mise en place d'un mode "dGPU-only" aurait permis de résoudre ce problème.
Processeur
Le Ryzen 9 7940HS est couramment utilisé sur les ordinateurs portables multimédia ou de jeu rapides tels que le Asus ROG Zephyrus G14 ou le TUF Gaming A17. Il est en concurrence directe avec le Core i7-13700H et les deux processeurs sont donc à peu près comparables.
Framework propose le Ryzen 7 7840HS sur les configurations inférieures du Laptop 16. D'après notre expérience avec le Lenovo Legion Slim 7 16APH8cependant, le Ryzen 7 7840HS est essentiellement au coude à coude avec le Ryzen 9 7940HS, malgré les différences de prix et la convention de dénomination qui peuvent le suggérer. Si vous n'avez pas besoin des 5 % de performances supplémentaires des Ryzen 9, vous pouvez économiser des centaines d'euros en optant pour les Ryzen 7.
Il est dommage que Framework ne propose pas le Ryzen 9 Pro 7940HS qui aurait rendu le Laptop 16 plus attractif pour les professionnels.
Cinebench R15 Multi Loop
Cinebench R23: Multi Core | Single Core
Cinebench R20: CPU (Multi Core) | CPU (Single Core)
Cinebench R15: CPU Multi 64Bit | CPU Single 64Bit
Blender: v2.79 BMW27 CPU
7-Zip 18.03: 7z b 4 | 7z b 4 -mmt1
Geekbench 5.5: Multi-Core | Single-Core
HWBOT x265 Benchmark v2.2: 4k Preset
LibreOffice : 20 Documents To PDF
R Benchmark 2.5: Overall mean
* ... Moindre est la valeur, meilleures sont les performances
AIDA64: FP32 Ray-Trace | FPU Julia | CPU SHA3 | CPU Queen | FPU SinJulia | FPU Mandel | CPU AES | CPU ZLib | FP64 Ray-Trace | CPU PhotoWorxx
| Performance rating | |
| Framework Laptop 16 | |
| Moyenne AMD Ryzen 9 7940HS | |
| Lenovo ThinkPad Z16 Gen 2 | |
| MSI Prestige 16 B1MG-001US | |
| Dell Inspiron 16 Plus 7630 | |
| HP Spectre x360 2-in-1 16-f1075ng | |
| AIDA64 / FP32 Ray-Trace | |
| Lenovo ThinkPad Z16 Gen 2 | |
| Framework Laptop 16 | |
| Moyenne AMD Ryzen 9 7940HS (25226 - 29109, n=10) | |
| MSI Prestige 16 B1MG-001US | |
| Dell Inspiron 16 Plus 7630 | |
| HP Spectre x360 2-in-1 16-f1075ng | |
| AIDA64 / FPU Julia | |
| Lenovo ThinkPad Z16 Gen 2 | |
| Moyenne AMD Ryzen 9 7940HS (106512 - 123214, n=10) | |
| Framework Laptop 16 | |
| MSI Prestige 16 B1MG-001US | |
| Dell Inspiron 16 Plus 7630 | |
| HP Spectre x360 2-in-1 16-f1075ng | |
| AIDA64 / CPU SHA3 | |
| Lenovo ThinkPad Z16 Gen 2 | |
| Framework Laptop 16 | |
| Moyenne AMD Ryzen 9 7940HS (4566 - 5119, n=10) | |
| MSI Prestige 16 B1MG-001US | |
| Dell Inspiron 16 Plus 7630 | |
| HP Spectre x360 2-in-1 16-f1075ng | |
| AIDA64 / CPU Queen | |
| Lenovo ThinkPad Z16 Gen 2 | |
| Framework Laptop 16 | |
| Moyenne AMD Ryzen 9 7940HS (118174 - 124783, n=10) | |
| Dell Inspiron 16 Plus 7630 | |
| MSI Prestige 16 B1MG-001US | |
| HP Spectre x360 2-in-1 16-f1075ng | |
| AIDA64 / FPU SinJulia | |
| Lenovo ThinkPad Z16 Gen 2 | |
| Moyenne AMD Ryzen 9 7940HS (14663 - 15551, n=10) | |
| Framework Laptop 16 | |
| MSI Prestige 16 B1MG-001US | |
| Dell Inspiron 16 Plus 7630 | |
| HP Spectre x360 2-in-1 16-f1075ng | |
| AIDA64 / FPU Mandel | |
| Lenovo ThinkPad Z16 Gen 2 | |
| Moyenne AMD Ryzen 9 7940HS (56839 - 66238, n=10) | |
| Framework Laptop 16 | |
| MSI Prestige 16 B1MG-001US | |
| Dell Inspiron 16 Plus 7630 | |
| HP Spectre x360 2-in-1 16-f1075ng | |
| AIDA64 / CPU AES | |
| Framework Laptop 16 | |
| Moyenne AMD Ryzen 9 7940HS (86309 - 171350, n=10) | |
| HP Spectre x360 2-in-1 16-f1075ng | |
| Lenovo ThinkPad Z16 Gen 2 | |
| MSI Prestige 16 B1MG-001US | |
| Dell Inspiron 16 Plus 7630 | |
| AIDA64 / CPU ZLib | |
| Lenovo ThinkPad Z16 Gen 2 | |
| Moyenne AMD Ryzen 9 7940HS (866 - 1152, n=10) | |
| MSI Prestige 16 B1MG-001US | |
| Framework Laptop 16 | |
| Dell Inspiron 16 Plus 7630 | |
| HP Spectre x360 2-in-1 16-f1075ng | |
| AIDA64 / FP64 Ray-Trace | |
| Lenovo ThinkPad Z16 Gen 2 | |
| Moyenne AMD Ryzen 9 7940HS (13175 - 15675, n=10) | |
| Framework Laptop 16 | |
| MSI Prestige 16 B1MG-001US | |
| Dell Inspiron 16 Plus 7630 | |
| HP Spectre x360 2-in-1 16-f1075ng | |
| AIDA64 / CPU PhotoWorxx | |
| MSI Prestige 16 B1MG-001US | |
| Framework Laptop 16 | |
| Dell Inspiron 16 Plus 7630 | |
| Lenovo ThinkPad Z16 Gen 2 | |
| Moyenne AMD Ryzen 9 7940HS (22477 - 41567, n=10) | |
| HP Spectre x360 2-in-1 16-f1075ng | |
Performance du système
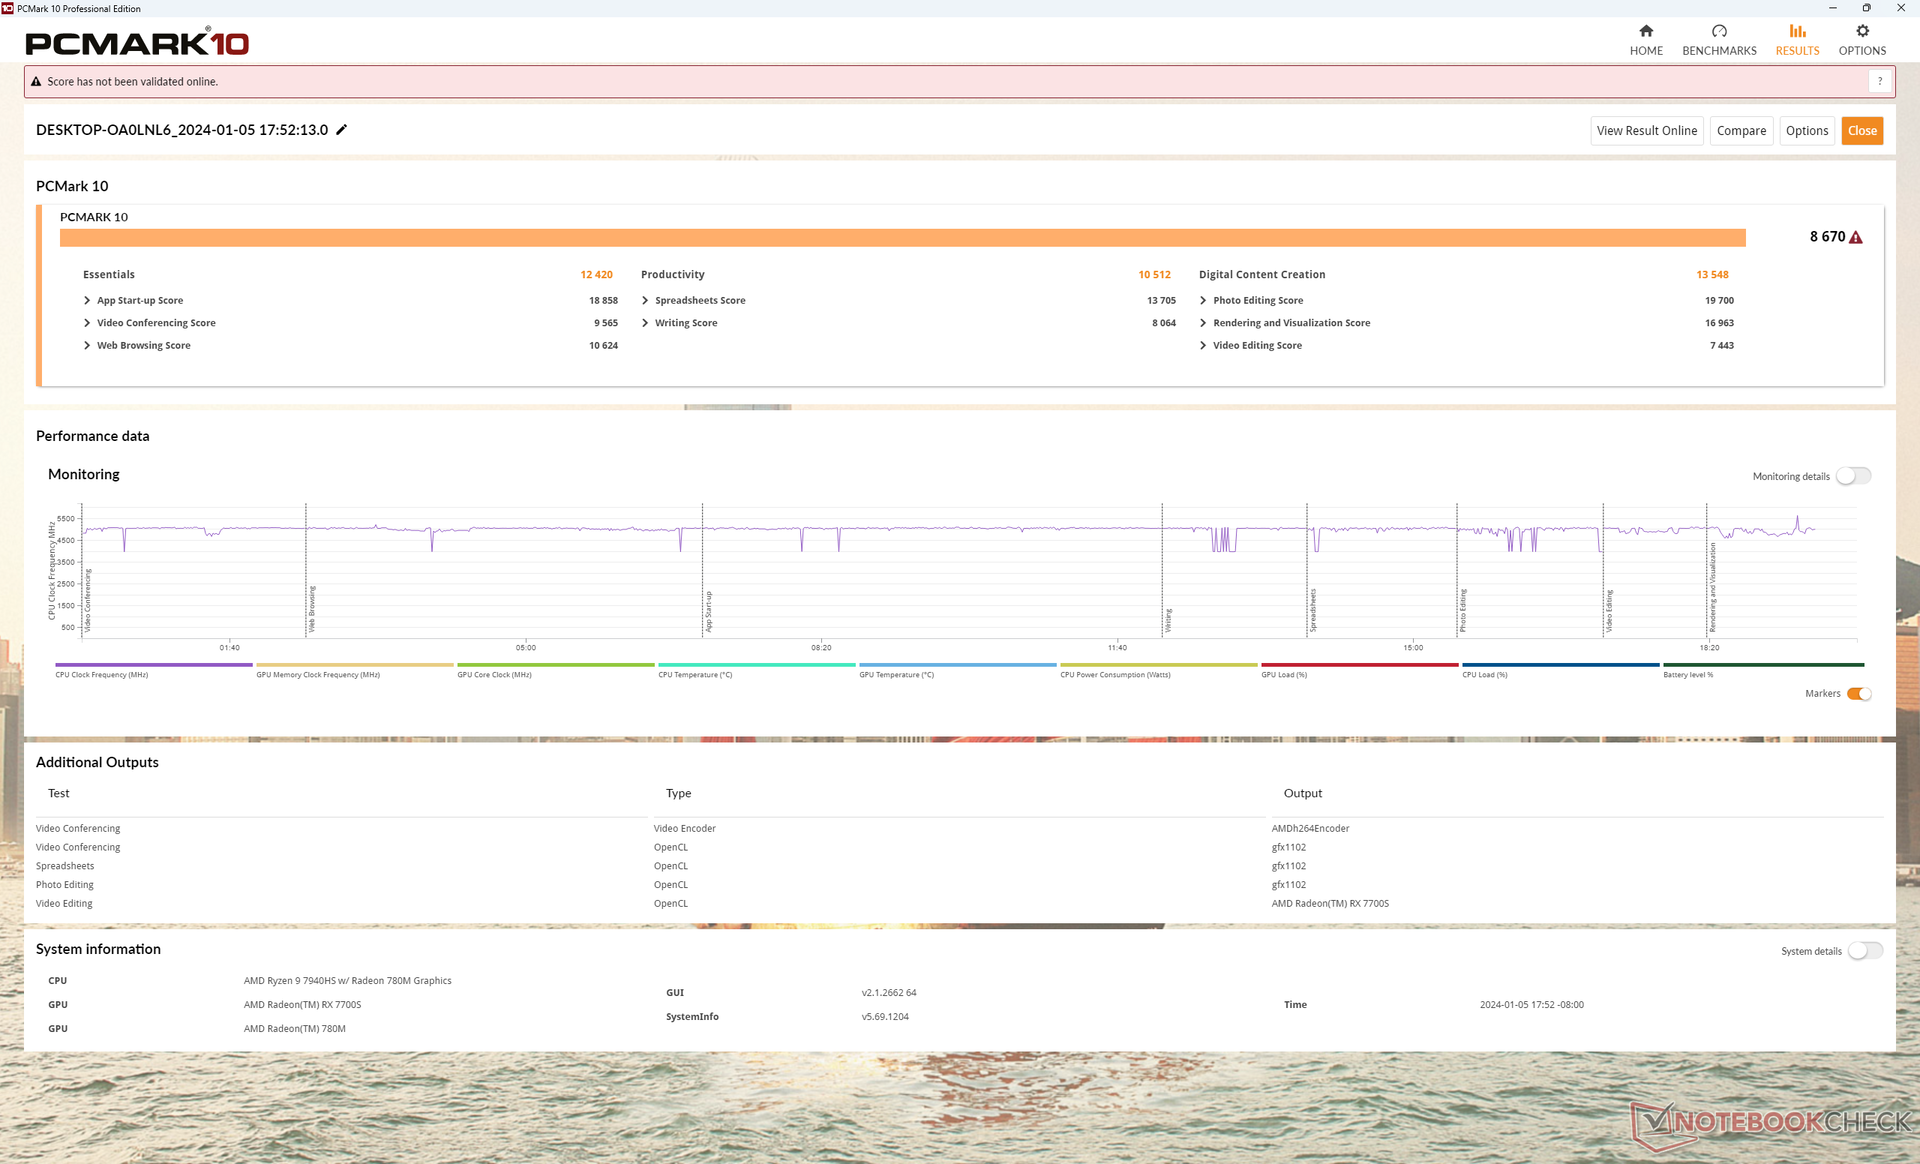
Les scores PCMark 10 sont parmi les plus élevés de tous les ordinateurs portables multimédias de 16 pouces, grâce au CPU Ryzen 9 Zen 4 et à la carte graphique Radeon associée. Les scores élevés de PCMark montrent que le Framework 16 peut être aussi rapide que d'autres ordinateurs portables hautes performances lorsqu'il exécute des tâches quotidiennes allant des navigateurs aux éditeurs graphiques.
CrossMark: Overall | Productivity | Creativity | Responsiveness
WebXPRT 3: Overall
WebXPRT 4: Overall
Mozilla Kraken 1.1: Total
| PCMark 10 / Score | |
| Framework Laptop 16 | |
| Moyenne AMD Ryzen 9 7940HS, AMD Radeon RX 7700S (n=1) | |
| Lenovo ThinkPad Z16 Gen 2 | |
| Dell Inspiron 16 Plus 7630 | |
| MSI Prestige 16 B1MG-001US | |
| HP Spectre x360 2-in-1 16-f1075ng | |
| PCMark 10 / Essentials | |
| Framework Laptop 16 | |
| Moyenne AMD Ryzen 9 7940HS, AMD Radeon RX 7700S (n=1) | |
| Lenovo ThinkPad Z16 Gen 2 | |
| Dell Inspiron 16 Plus 7630 | |
| MSI Prestige 16 B1MG-001US | |
| HP Spectre x360 2-in-1 16-f1075ng | |
| PCMark 10 / Productivity | |
| Framework Laptop 16 | |
| Moyenne AMD Ryzen 9 7940HS, AMD Radeon RX 7700S (n=1) | |
| Lenovo ThinkPad Z16 Gen 2 | |
| Dell Inspiron 16 Plus 7630 | |
| MSI Prestige 16 B1MG-001US | |
| HP Spectre x360 2-in-1 16-f1075ng | |
| PCMark 10 / Digital Content Creation | |
| Framework Laptop 16 | |
| Moyenne AMD Ryzen 9 7940HS, AMD Radeon RX 7700S (n=1) | |
| Dell Inspiron 16 Plus 7630 | |
| Lenovo ThinkPad Z16 Gen 2 | |
| MSI Prestige 16 B1MG-001US | |
| HP Spectre x360 2-in-1 16-f1075ng | |
| CrossMark / Overall | |
| Apple MacBook Pro 16 2023 M3 Max | |
| Dell Inspiron 16 Plus 7630 | |
| MSI Prestige 16 B1MG-001US | |
| HP Spectre x360 2-in-1 16-f1075ng | |
| Framework Laptop 16 | |
| Moyenne AMD Ryzen 9 7940HS, AMD Radeon RX 7700S (n=1) | |
| Lenovo ThinkPad Z16 Gen 2 | |
| CrossMark / Productivity | |
| Apple MacBook Pro 16 2023 M3 Max | |
| Dell Inspiron 16 Plus 7630 | |
| HP Spectre x360 2-in-1 16-f1075ng | |
| MSI Prestige 16 B1MG-001US | |
| Framework Laptop 16 | |
| Moyenne AMD Ryzen 9 7940HS, AMD Radeon RX 7700S (n=1) | |
| Lenovo ThinkPad Z16 Gen 2 | |
| CrossMark / Creativity | |
| Apple MacBook Pro 16 2023 M3 Max | |
| Dell Inspiron 16 Plus 7630 | |
| MSI Prestige 16 B1MG-001US | |
| Framework Laptop 16 | |
| Moyenne AMD Ryzen 9 7940HS, AMD Radeon RX 7700S (n=1) | |
| Lenovo ThinkPad Z16 Gen 2 | |
| HP Spectre x360 2-in-1 16-f1075ng | |
| CrossMark / Responsiveness | |
| HP Spectre x360 2-in-1 16-f1075ng | |
| Dell Inspiron 16 Plus 7630 | |
| MSI Prestige 16 B1MG-001US | |
| Apple MacBook Pro 16 2023 M3 Max | |
| Framework Laptop 16 | |
| Moyenne AMD Ryzen 9 7940HS, AMD Radeon RX 7700S (n=1) | |
| Lenovo ThinkPad Z16 Gen 2 | |
| WebXPRT 3 / Overall | |
| Apple MacBook Pro 16 2023 M3 Max | |
| Framework Laptop 16 | |
| Moyenne AMD Ryzen 9 7940HS, AMD Radeon RX 7700S (n=1) | |
| Lenovo ThinkPad Z16 Gen 2 | |
| Dell Inspiron 16 Plus 7630 | |
| MSI Prestige 16 B1MG-001US | |
| HP Spectre x360 2-in-1 16-f1075ng | |
| WebXPRT 4 / Overall | |
| Dell Inspiron 16 Plus 7630 | |
| Framework Laptop 16 | |
| Moyenne AMD Ryzen 9 7940HS, AMD Radeon RX 7700S (n=1) | |
| MSI Prestige 16 B1MG-001US | |
| Lenovo ThinkPad Z16 Gen 2 | |
| HP Spectre x360 2-in-1 16-f1075ng | |
| Mozilla Kraken 1.1 / Total | |
| Lenovo ThinkPad Z16 Gen 2 | |
| MSI Prestige 16 B1MG-001US | |
| HP Spectre x360 2-in-1 16-f1075ng | |
| Dell Inspiron 16 Plus 7630 | |
| Framework Laptop 16 | |
| Moyenne AMD Ryzen 9 7940HS, AMD Radeon RX 7700S (n=1) | |
| Apple MacBook Pro 16 2023 M3 Max | |
* ... Moindre est la valeur, meilleures sont les performances
| PCMark 10 Score | 8670 points | |
Aide | ||
| AIDA64 / Memory Copy | |
| MSI Prestige 16 B1MG-001US | |
| Framework Laptop 16 | |
| Lenovo ThinkPad Z16 Gen 2 | |
| Moyenne AMD Ryzen 9 7940HS (35327 - 78739, n=10) | |
| Dell Inspiron 16 Plus 7630 | |
| HP Spectre x360 2-in-1 16-f1075ng | |
| AIDA64 / Memory Read | |
| MSI Prestige 16 B1MG-001US | |
| Dell Inspiron 16 Plus 7630 | |
| Framework Laptop 16 | |
| Moyenne AMD Ryzen 9 7940HS (30769 - 61836, n=10) | |
| Lenovo ThinkPad Z16 Gen 2 | |
| HP Spectre x360 2-in-1 16-f1075ng | |
| AIDA64 / Memory Write | |
| Lenovo ThinkPad Z16 Gen 2 | |
| Framework Laptop 16 | |
| Moyenne AMD Ryzen 9 7940HS (42217 - 91567, n=10) | |
| MSI Prestige 16 B1MG-001US | |
| Dell Inspiron 16 Plus 7630 | |
| HP Spectre x360 2-in-1 16-f1075ng | |
| AIDA64 / Memory Latency | |
| MSI Prestige 16 B1MG-001US | |
| Lenovo ThinkPad Z16 Gen 2 | |
| Dell Inspiron 16 Plus 7630 | |
| Moyenne AMD Ryzen 9 7940HS (87.6 - 111.1, n=10) | |
| Framework Laptop 16 | |
| HP Spectre x360 2-in-1 16-f1075ng | |
* ... Moindre est la valeur, meilleures sont les performances
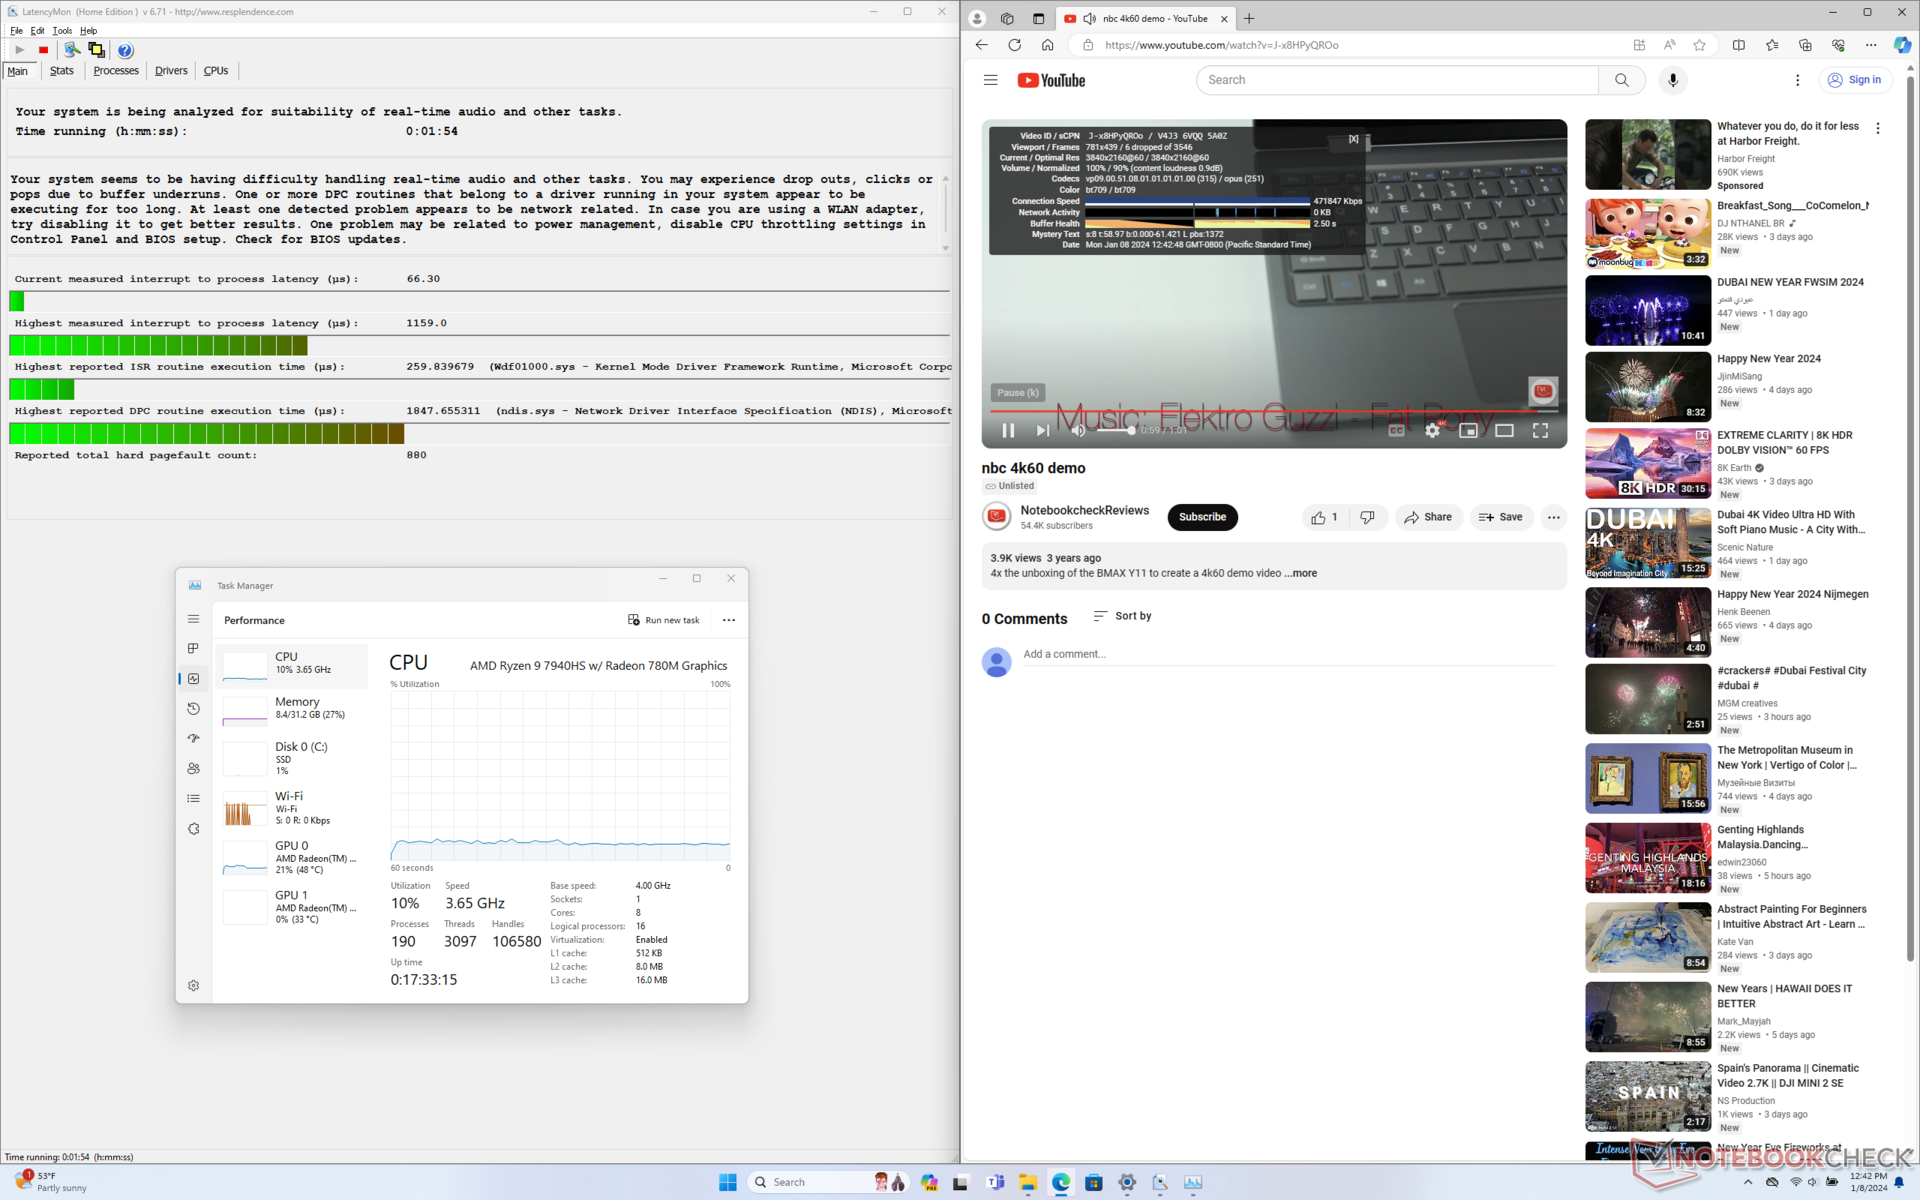
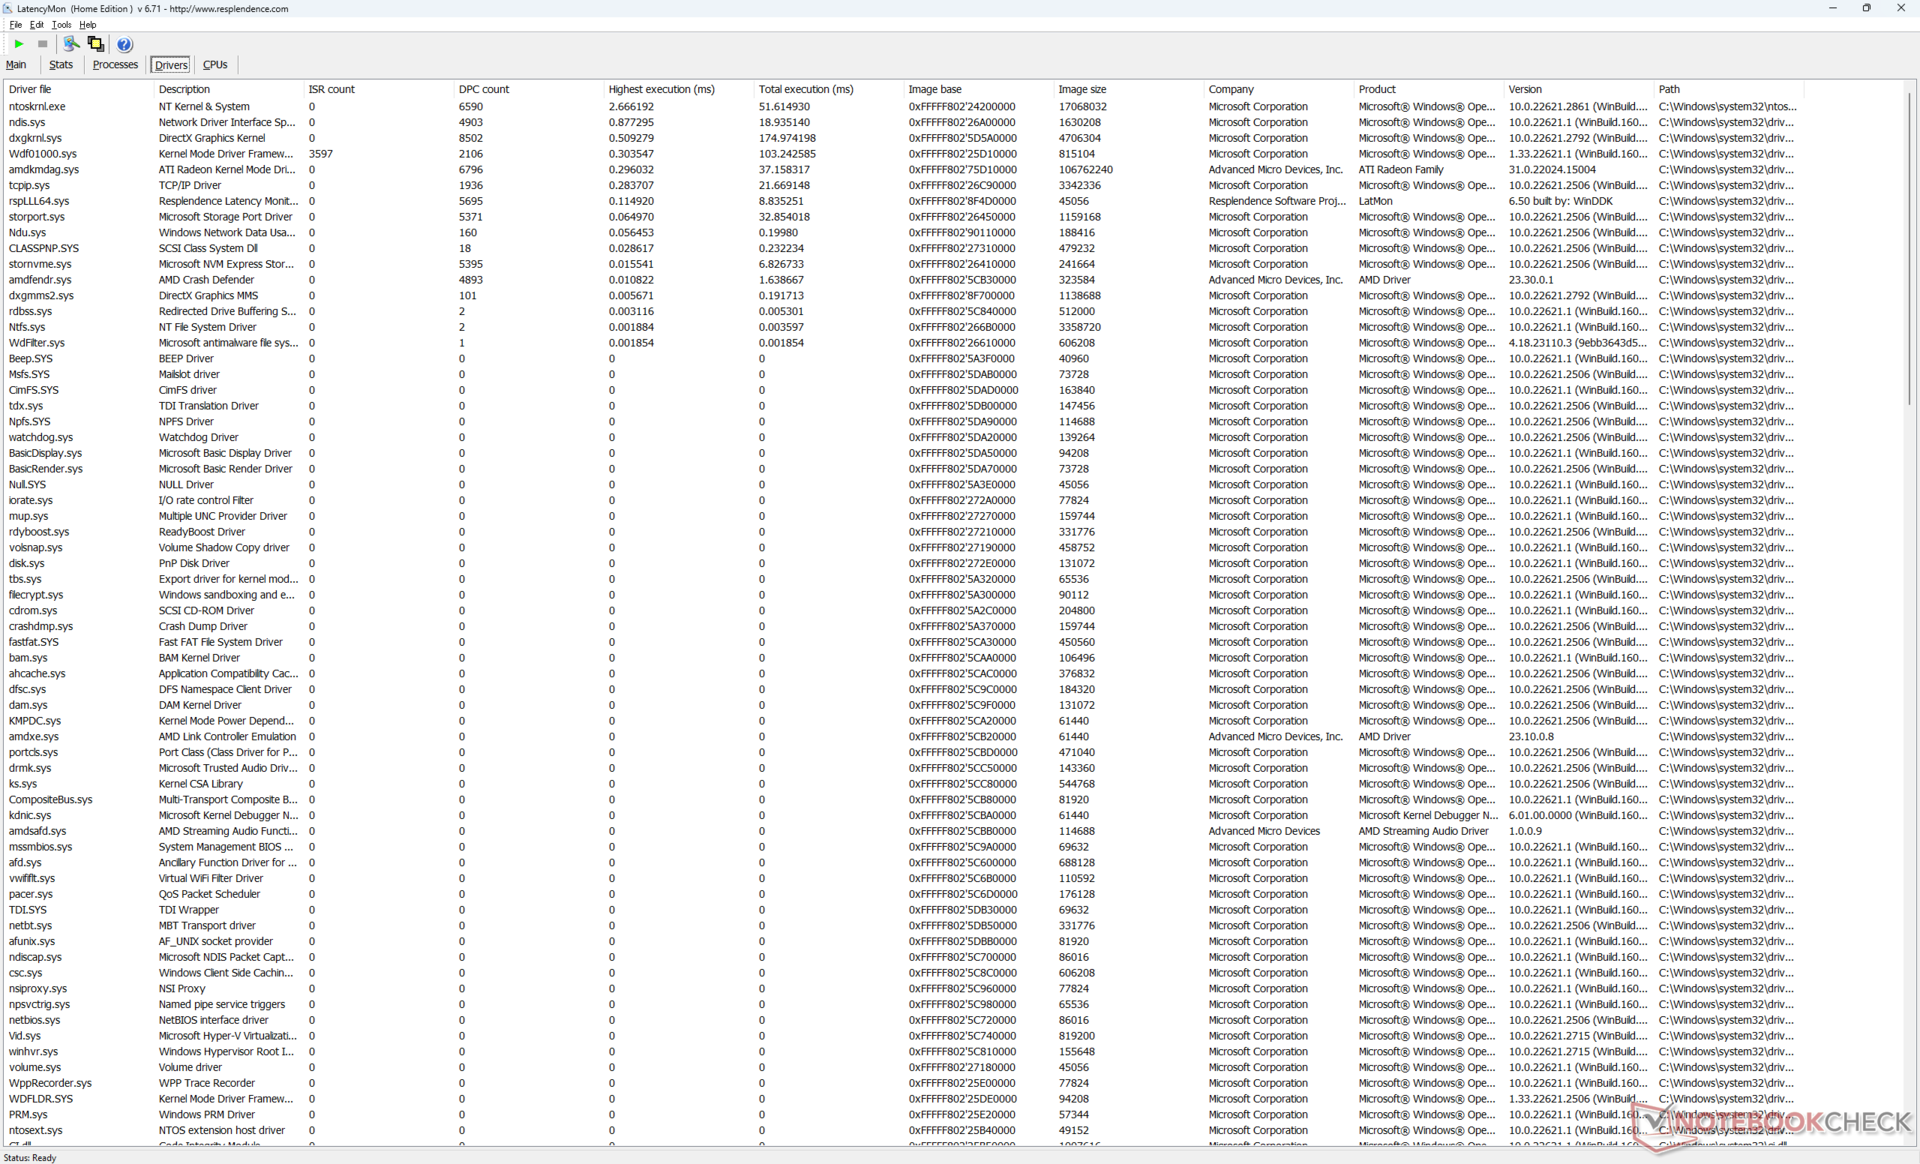
Latence DPC
LatencyMon révèle des problèmes de DPC lors de l'ouverture de plusieurs onglets de notre page d'accueil. En outre, nous avons pu enregistrer 6 images perdues pendant une minute lors de la lecture d'une vidéo 4K60. Chaque image perdue se produit à intervalles presque réguliers, ce qui suggère un problème de pilote sous-jacent potentiellement lié aux GPU AMD. D'après notre expérience, la plupart des ordinateurs portables équipés de processeurs Intel ne souffrent pas de problèmes similaires et sont plus susceptibles de ne pas perdre d'images lors du même test.
| DPC Latencies / LatencyMon - interrupt to process latency (max), Web, Youtube, Prime95 | |
| Lenovo ThinkPad Z16 Gen 2 | |
| Framework Laptop 16 | |
| HP Spectre x360 2-in-1 16-f1075ng | |
| Dell Inspiron 16 Plus 7630 | |
| MSI Prestige 16 B1MG-001US | |
* ... Moindre est la valeur, meilleures sont les performances
Dispositifs de stockage
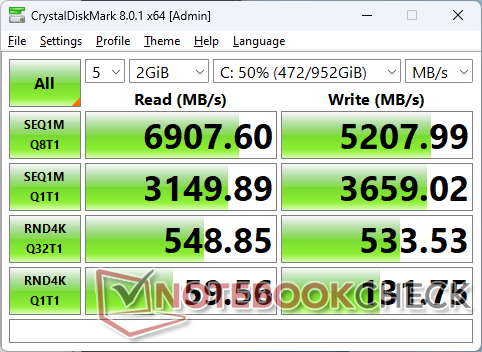
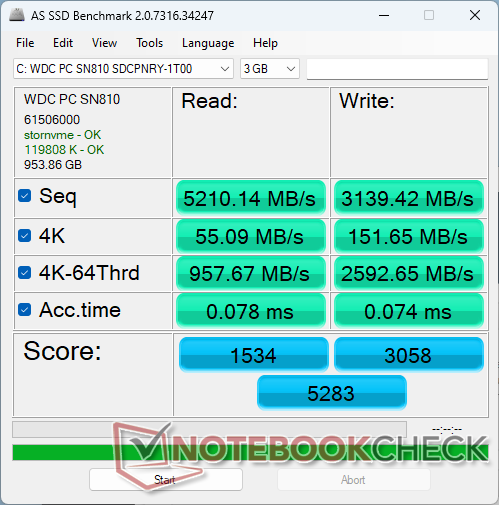
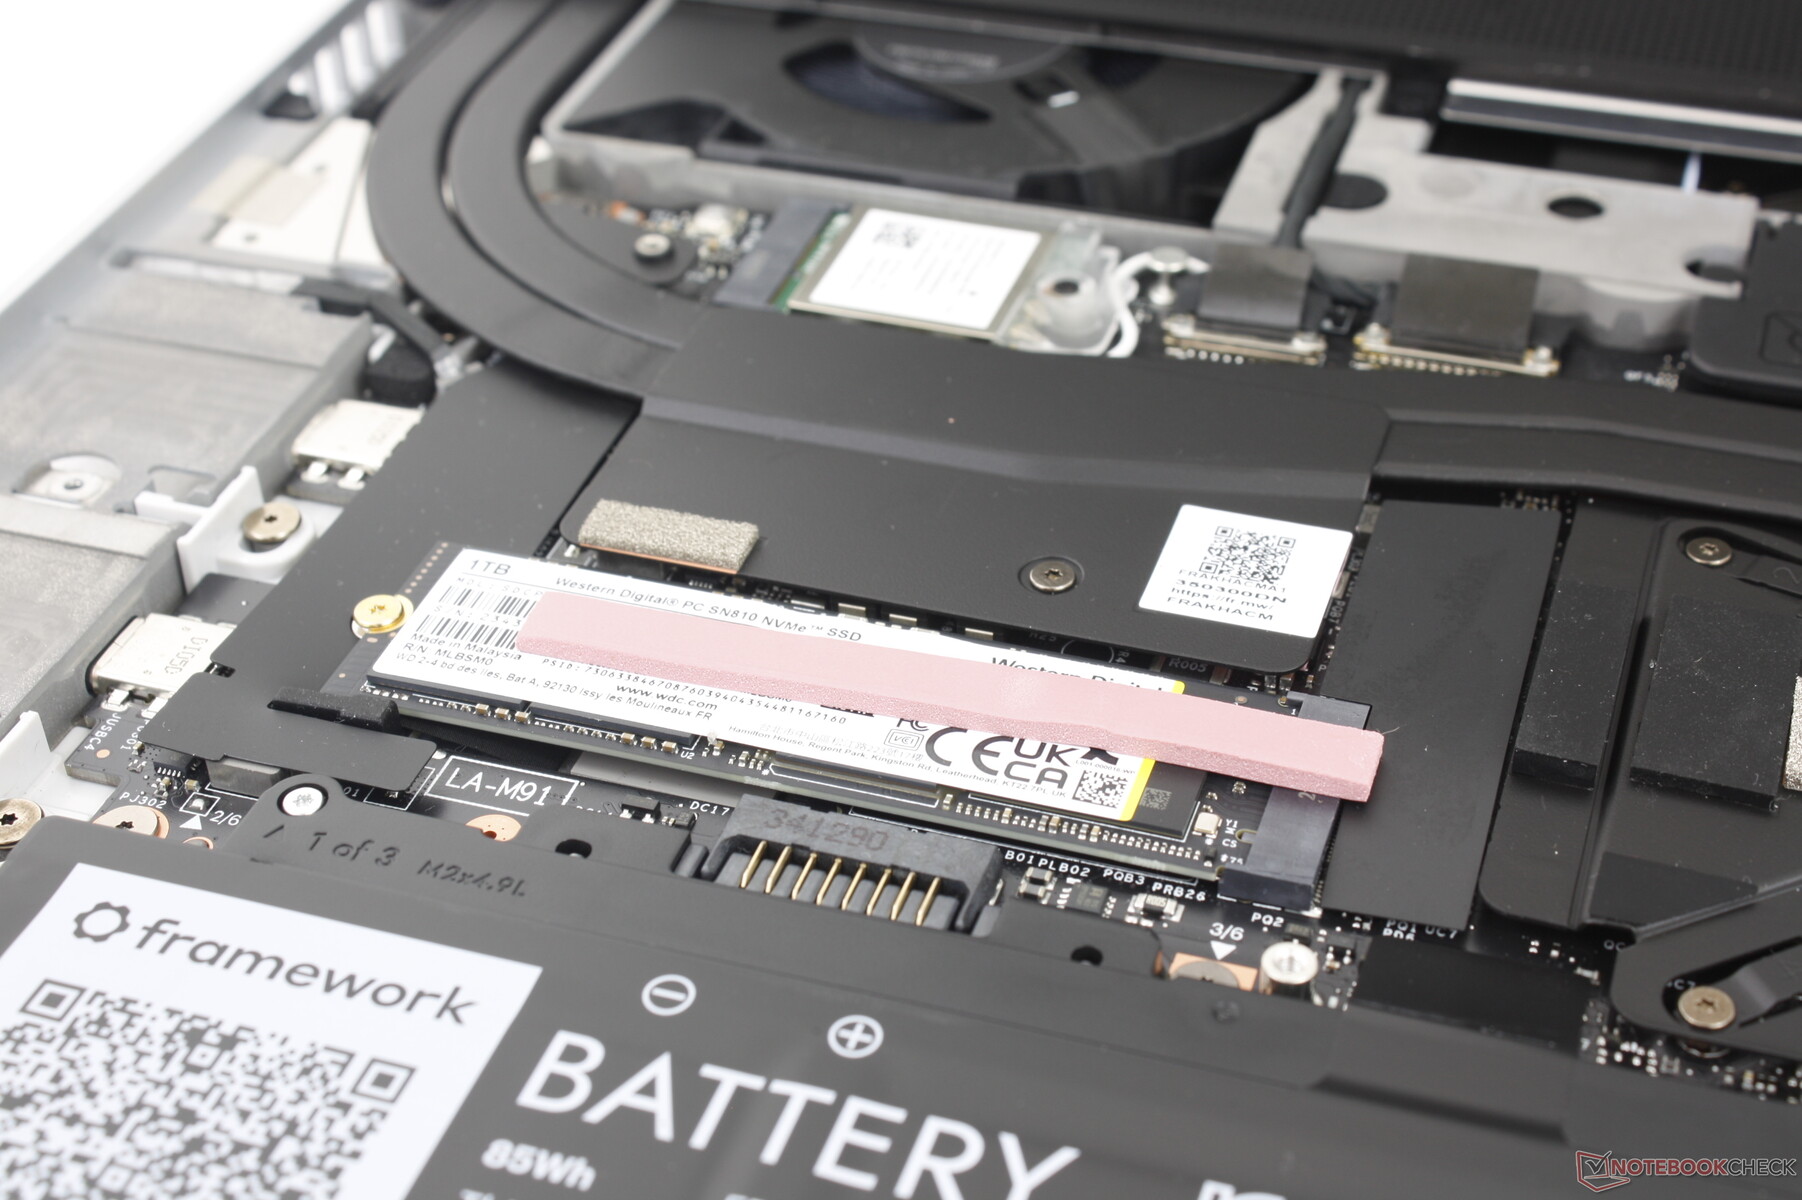
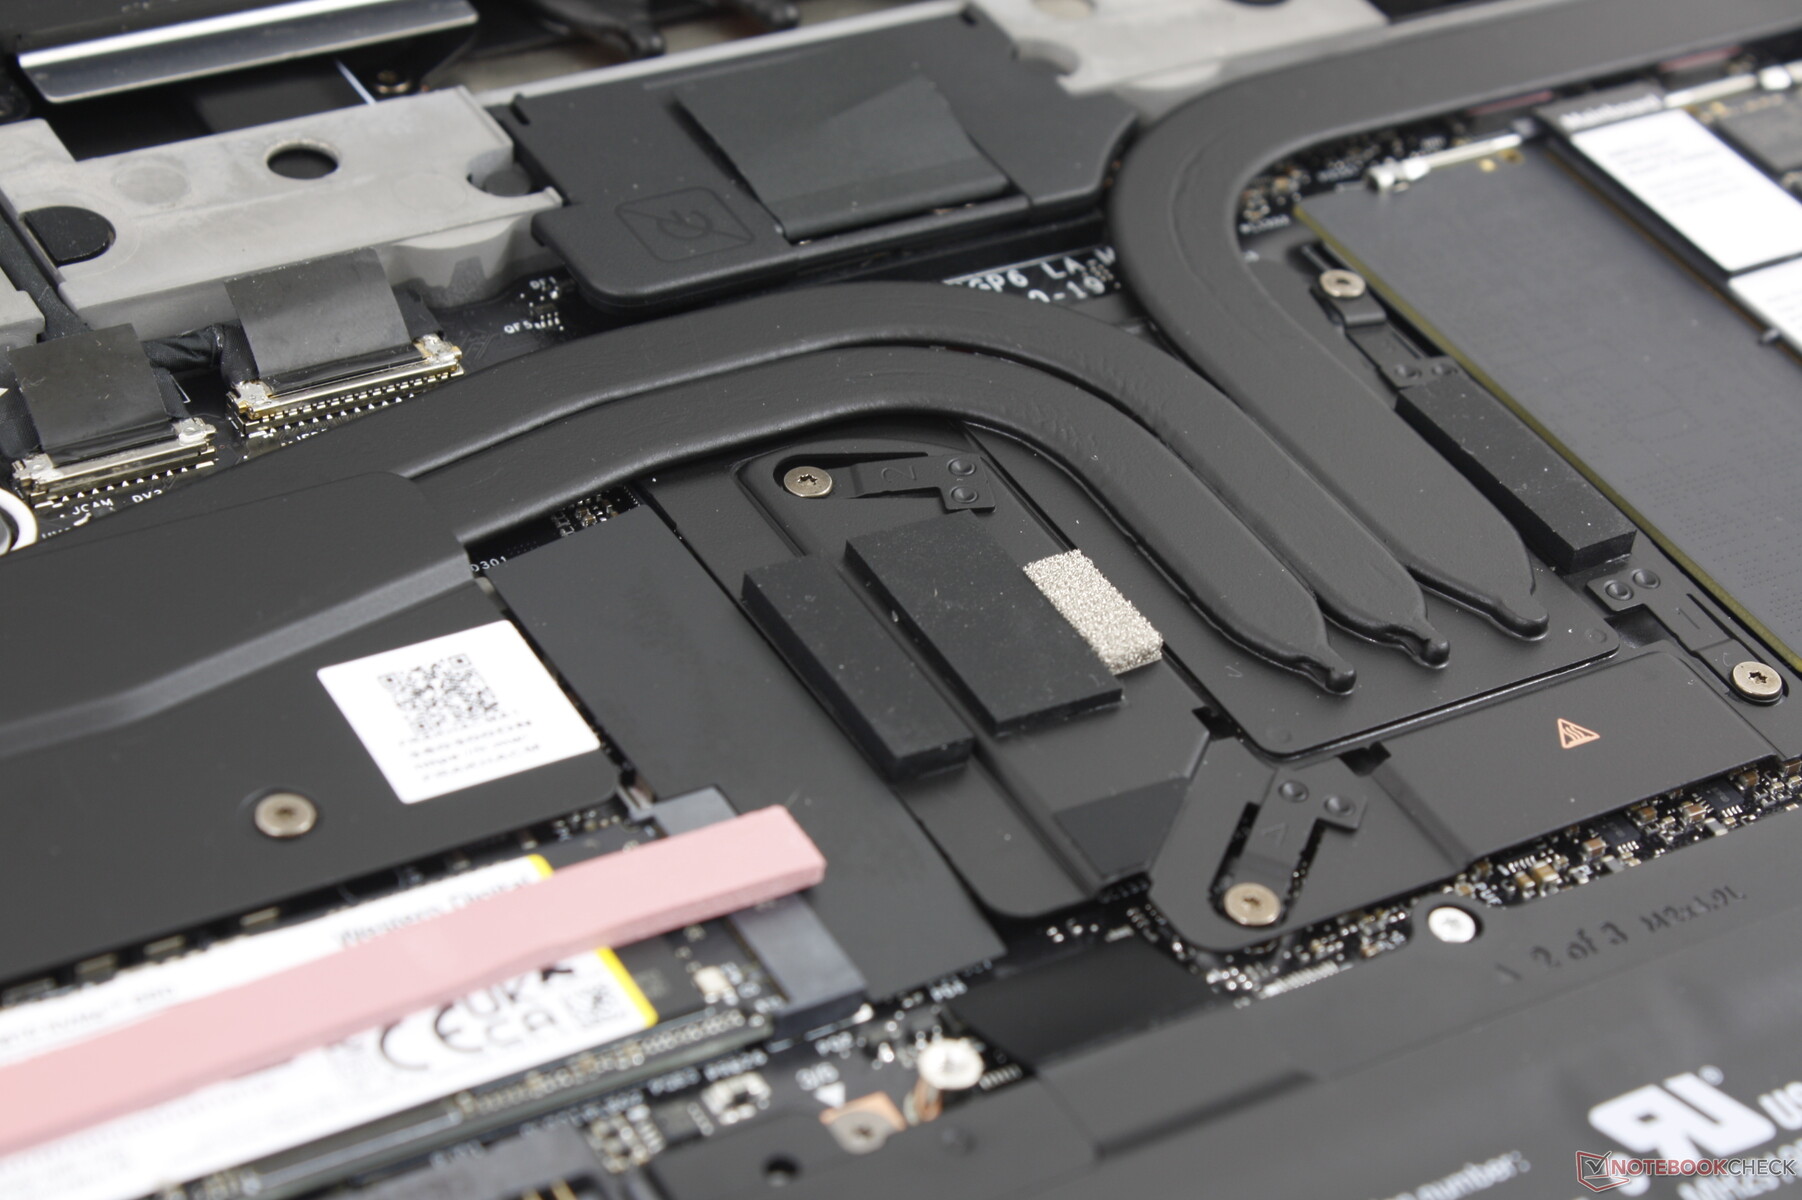
Notre unité de test est livrée avec la carte Western Digital SN810 PCIe4 x4 NVMe SSD qui est une mise à jour du SN740 actuellement disponible sur le Framework 13.5. Le disque ne présente aucun problème pour maintenir un taux de transfert de ~7000 MB/s pendant de longues périodes, contrairement à ce que nous avons observé sur le HP Pavilion Plus 14 équipé du même disque SSD WD. Cela suggère que le Framework 16 a été conçu avec un meilleur refroidissement du disque SSD afin d'éviter un ralentissement des performances.

| Drive Performance rating - Percent | |
| MSI Prestige 16 B1MG-001US | |
| Moyenne WDC PC SN810 1TB | |
| Framework Laptop 16 | |
| HP Spectre x360 2-in-1 16-f1075ng | |
| Lenovo ThinkPad Z16 Gen 2 | |
| Dell Inspiron 16 Plus 7630 | |
* ... Moindre est la valeur, meilleures sont les performances
Disk Throttling: DiskSpd Read Loop, Queue Depth 8
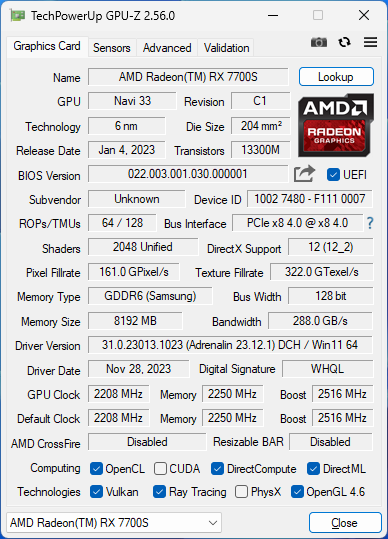
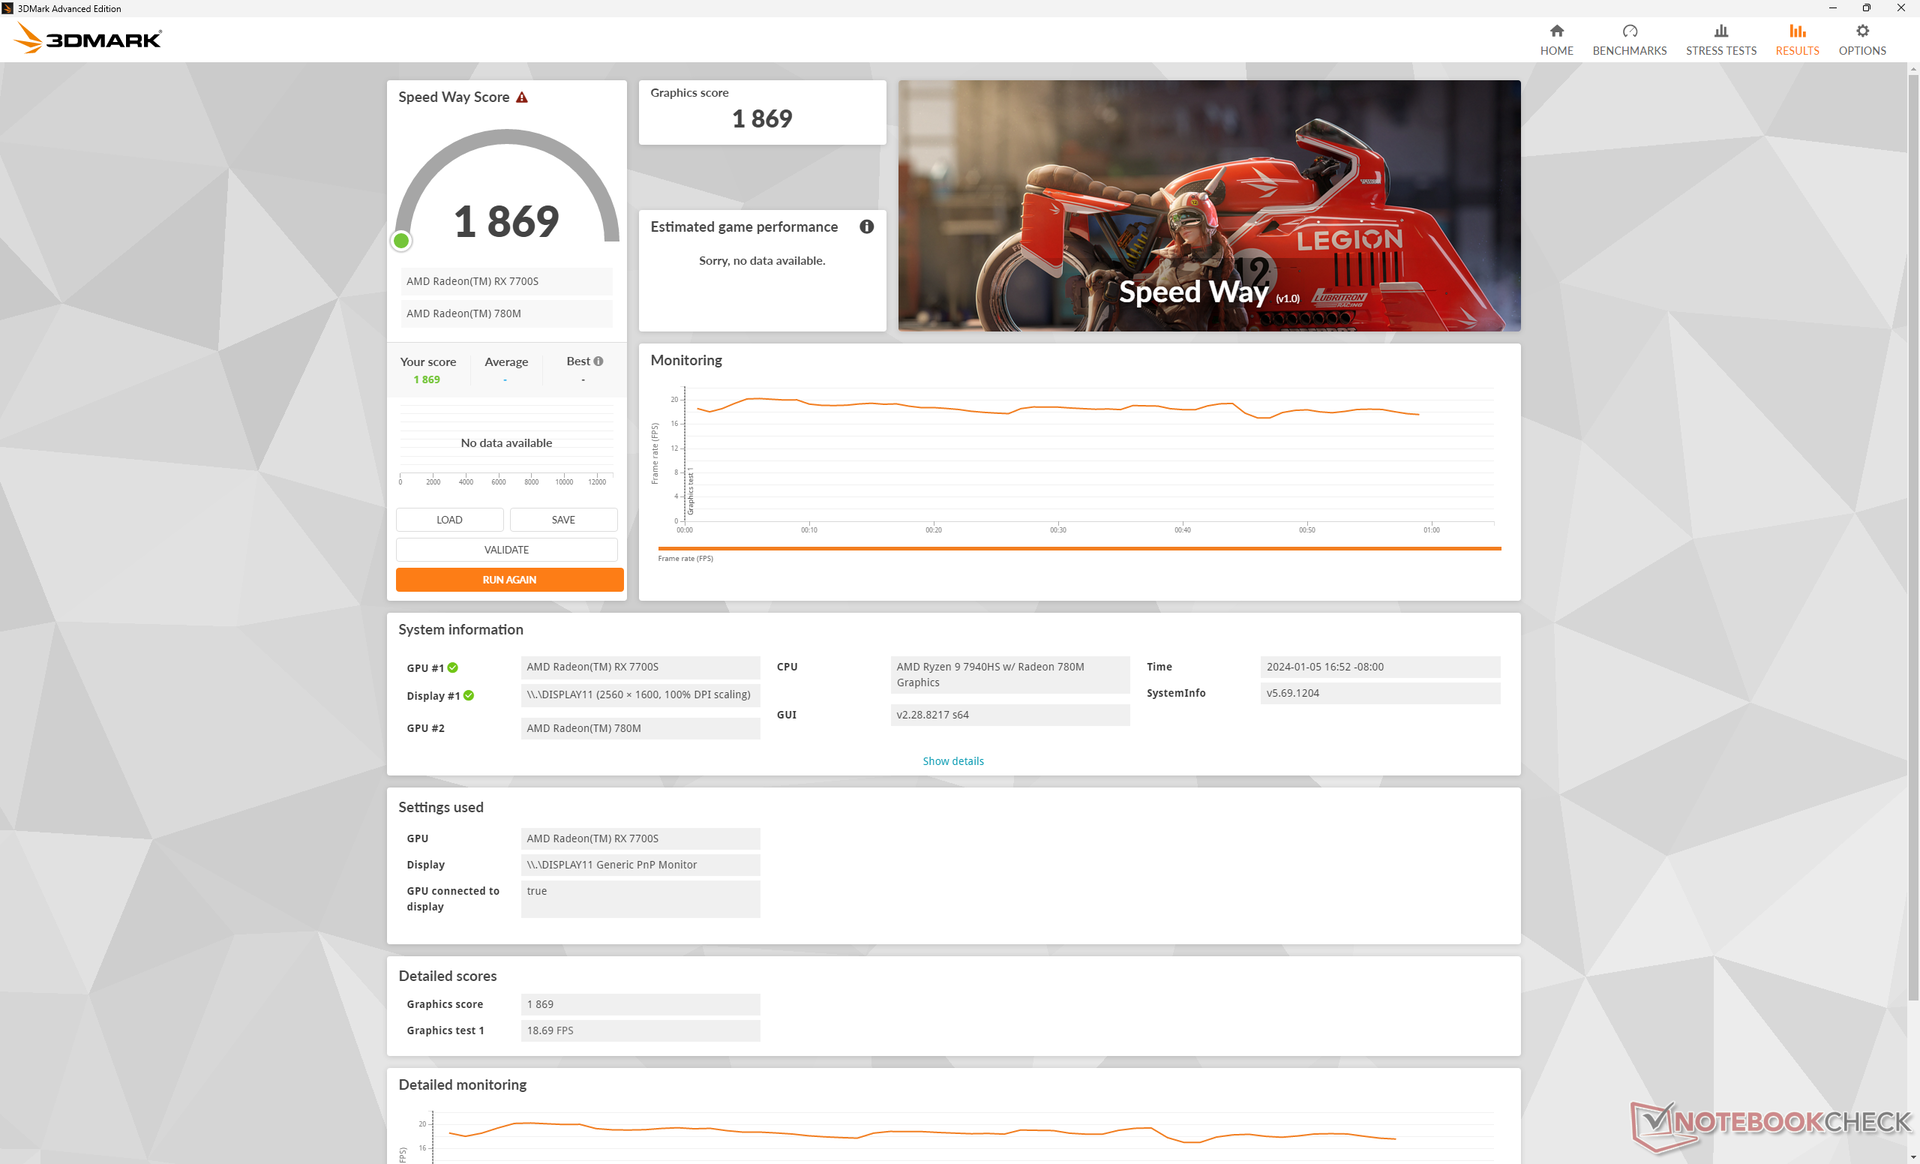
Performances des GPU - RDNA 3 à la rescousse
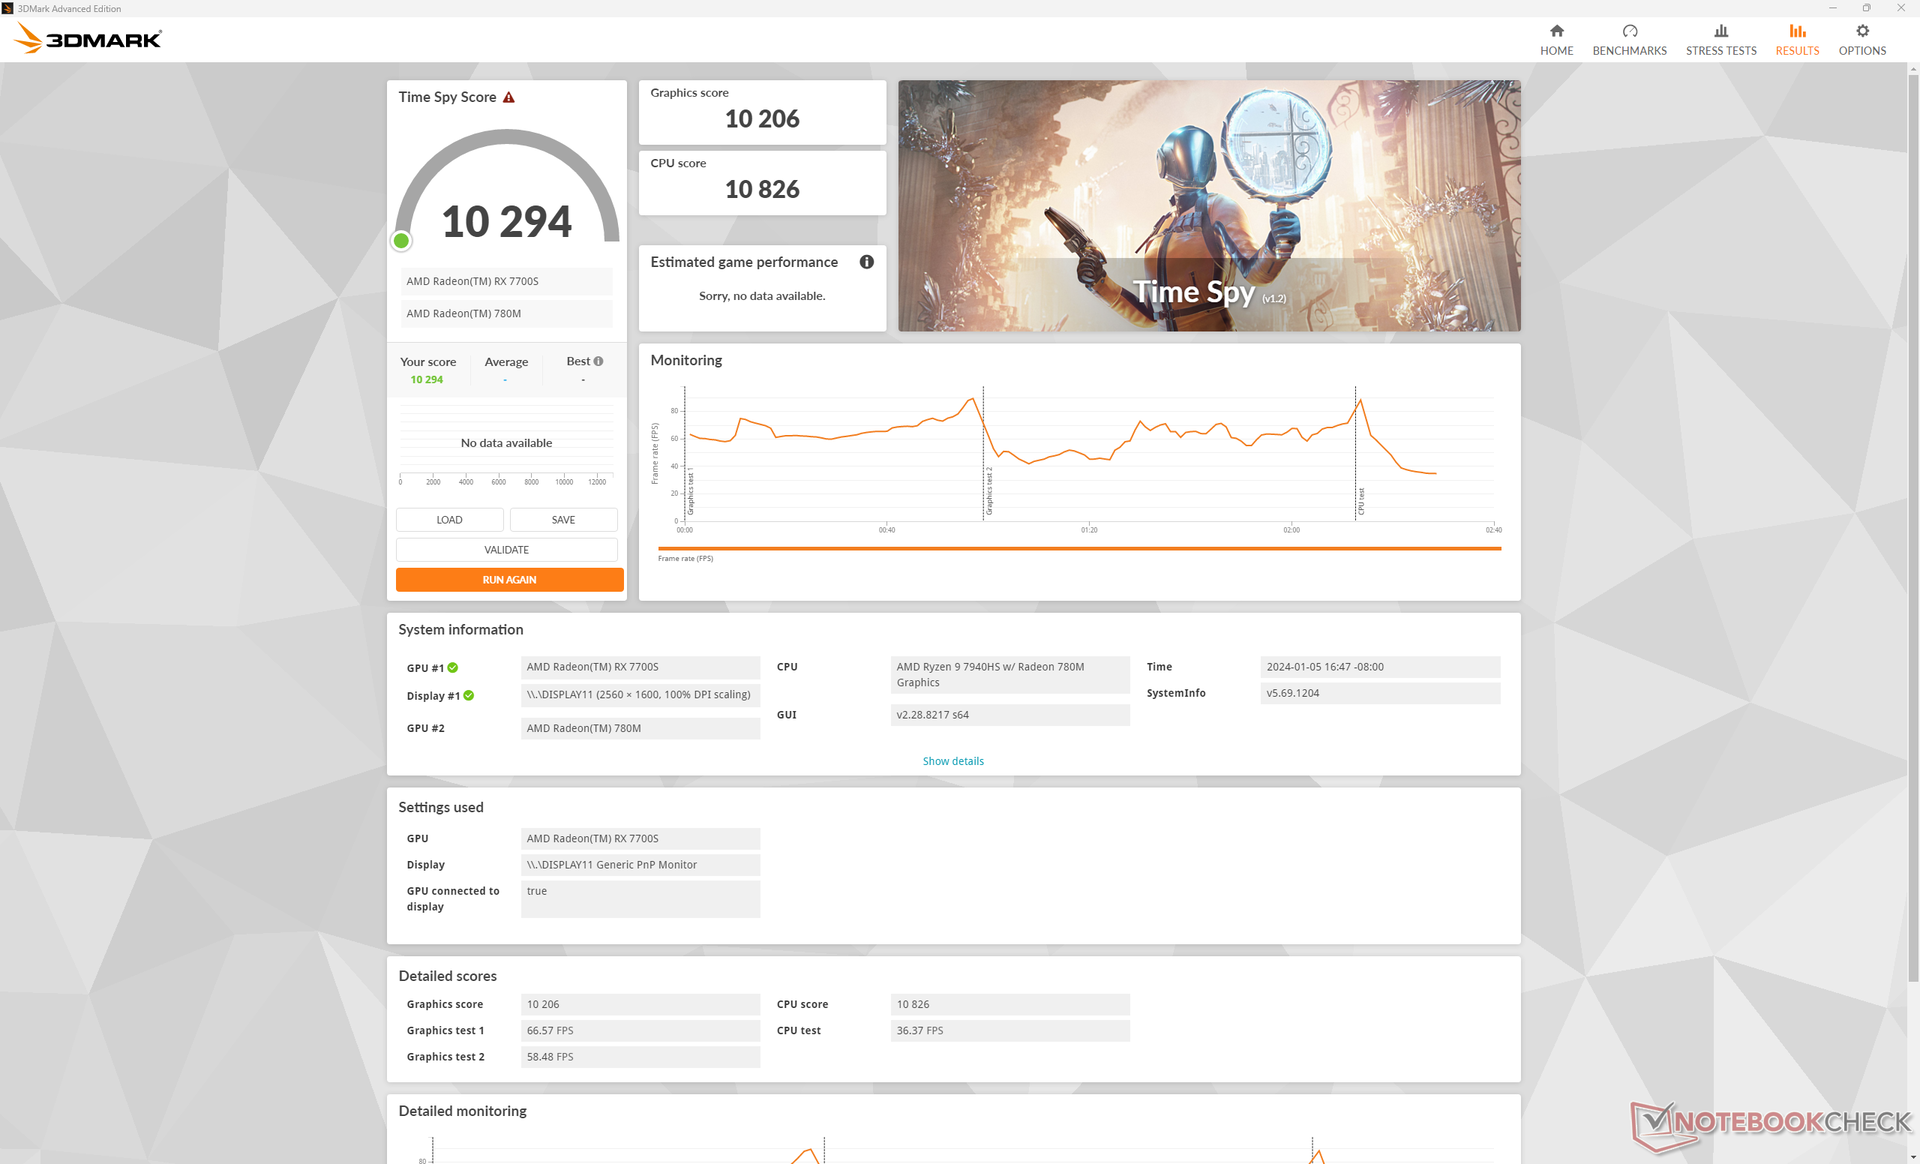
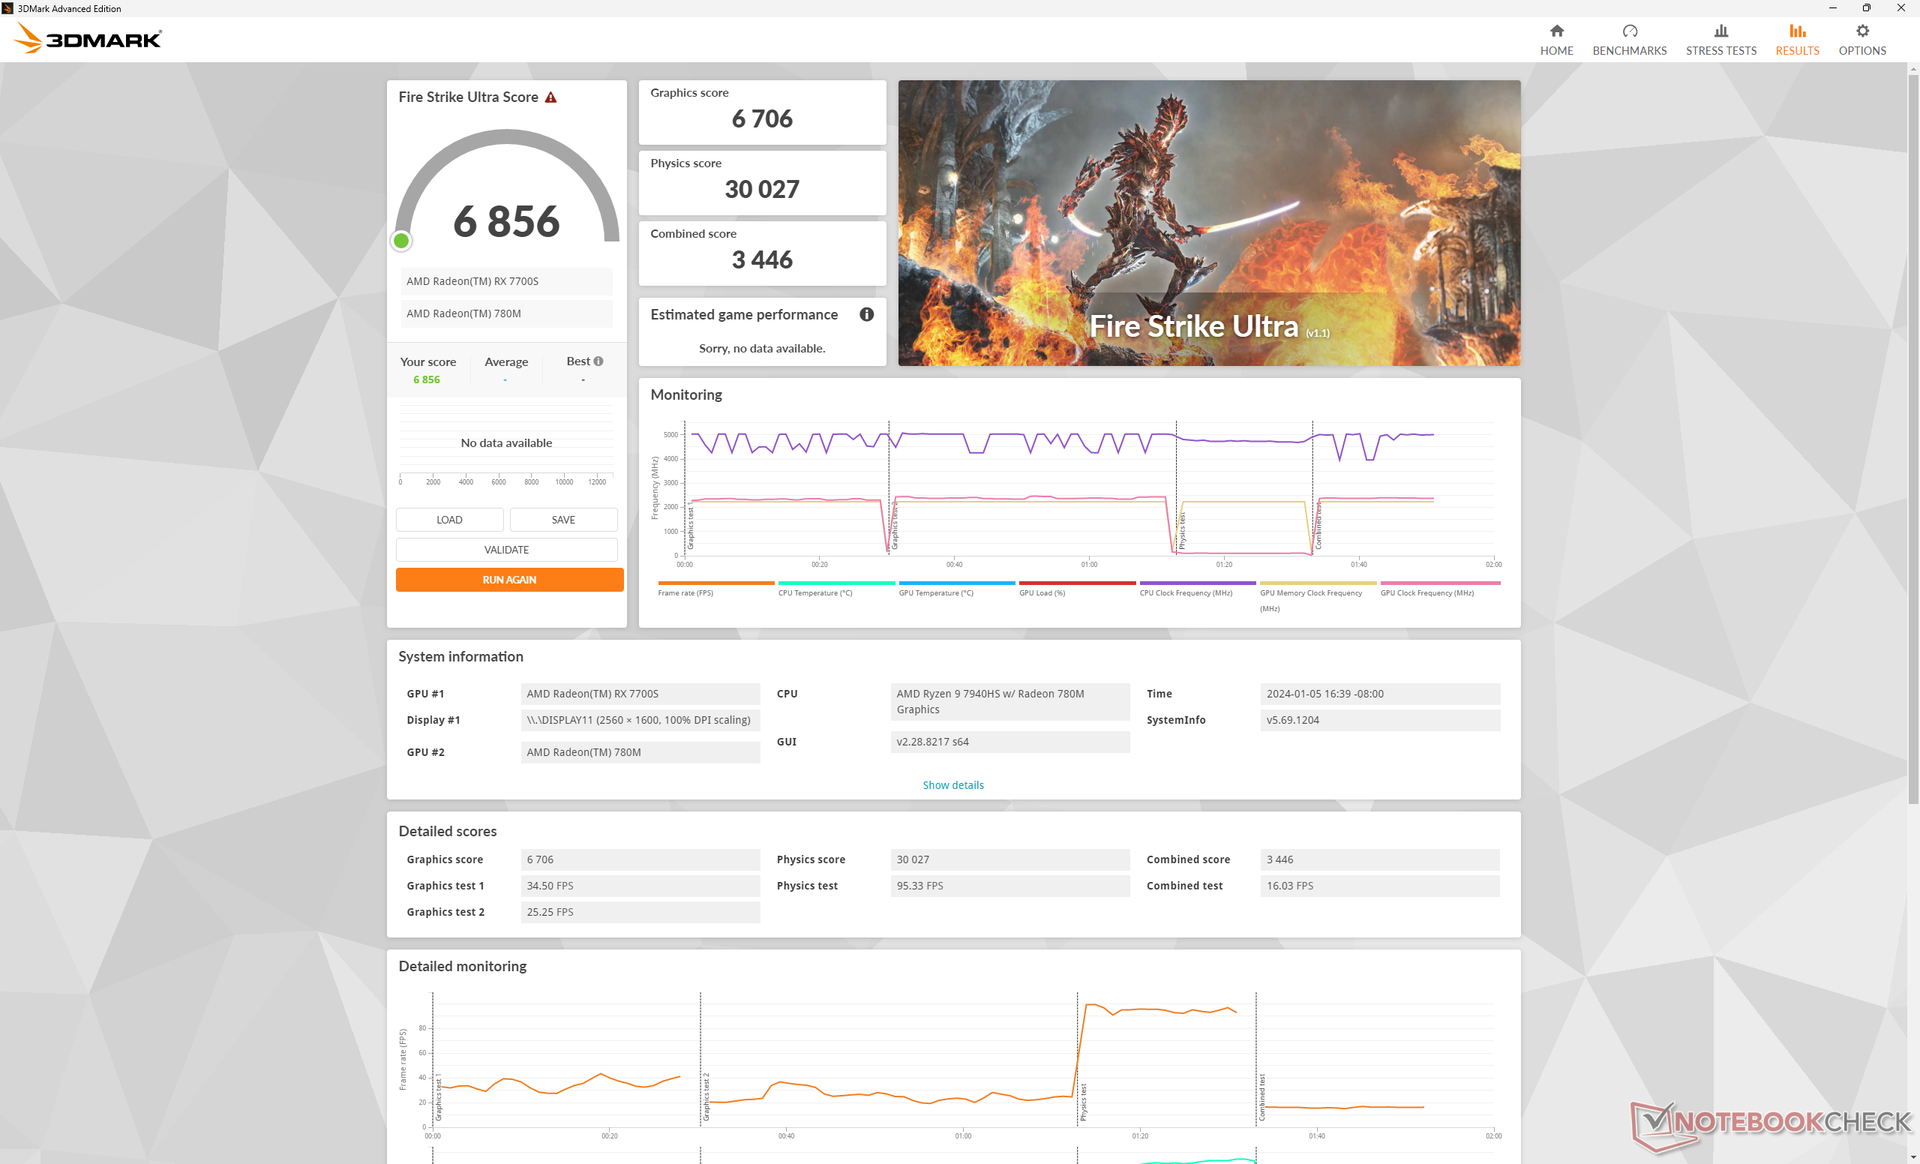
La RDNA 3 Radeon RX 7700S succède directement à la RDNA 2 de l'année dernière Radeon RX 6700S. Les résultats de 3DMark Fire Strike sont presque identiques entre les deux GPU, tandis que les résultats de Time Spy sont 20 à 25 % plus rapides qu'auparavant. Les gains les plus importants sont observés au niveau des performances RT, qui constituaient un point faible de l'ancienne architecture RDNA 2. Les performances globales sont comparables à celles d'un ordinateur portable équipé de la GeForce RTX 4060 comme le Lenovo Legion Slim 7 16.
Même sans le dGPU, la Radeon RX 780M iGPU est toujours plus que capable d'exécuter des tâches multimédias. Le GPU AMD reste l'une des solutions iGPU les plus rapides du marché, même s'il a été récemment dépassé par la série Intel Arc series.
L'exécution en mode Windows Balanced au lieu du mode Performance ne semble pas avoir d'impact sur les performances, comme le montre notre tableau de résultats Fire Strike ci-dessous. L'utilisation de la batterie réduirait les performances d'environ 15 %.
| Profil d'alimentation | Score graphique | Score physique | Score combiné |
| Performance | 24246 | 29487 | 10294 |
| Équilibré | 24125 (-0%) | 29101 (-0%) | 10389 (-0%) |
| Mode batterie | 20380 (-16%) | 25009 (-15%) | 6769 (-34%) |
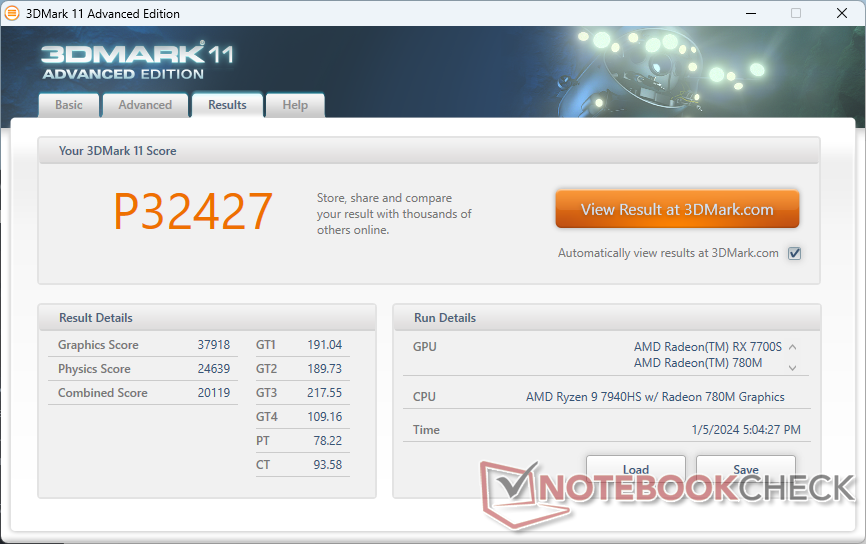
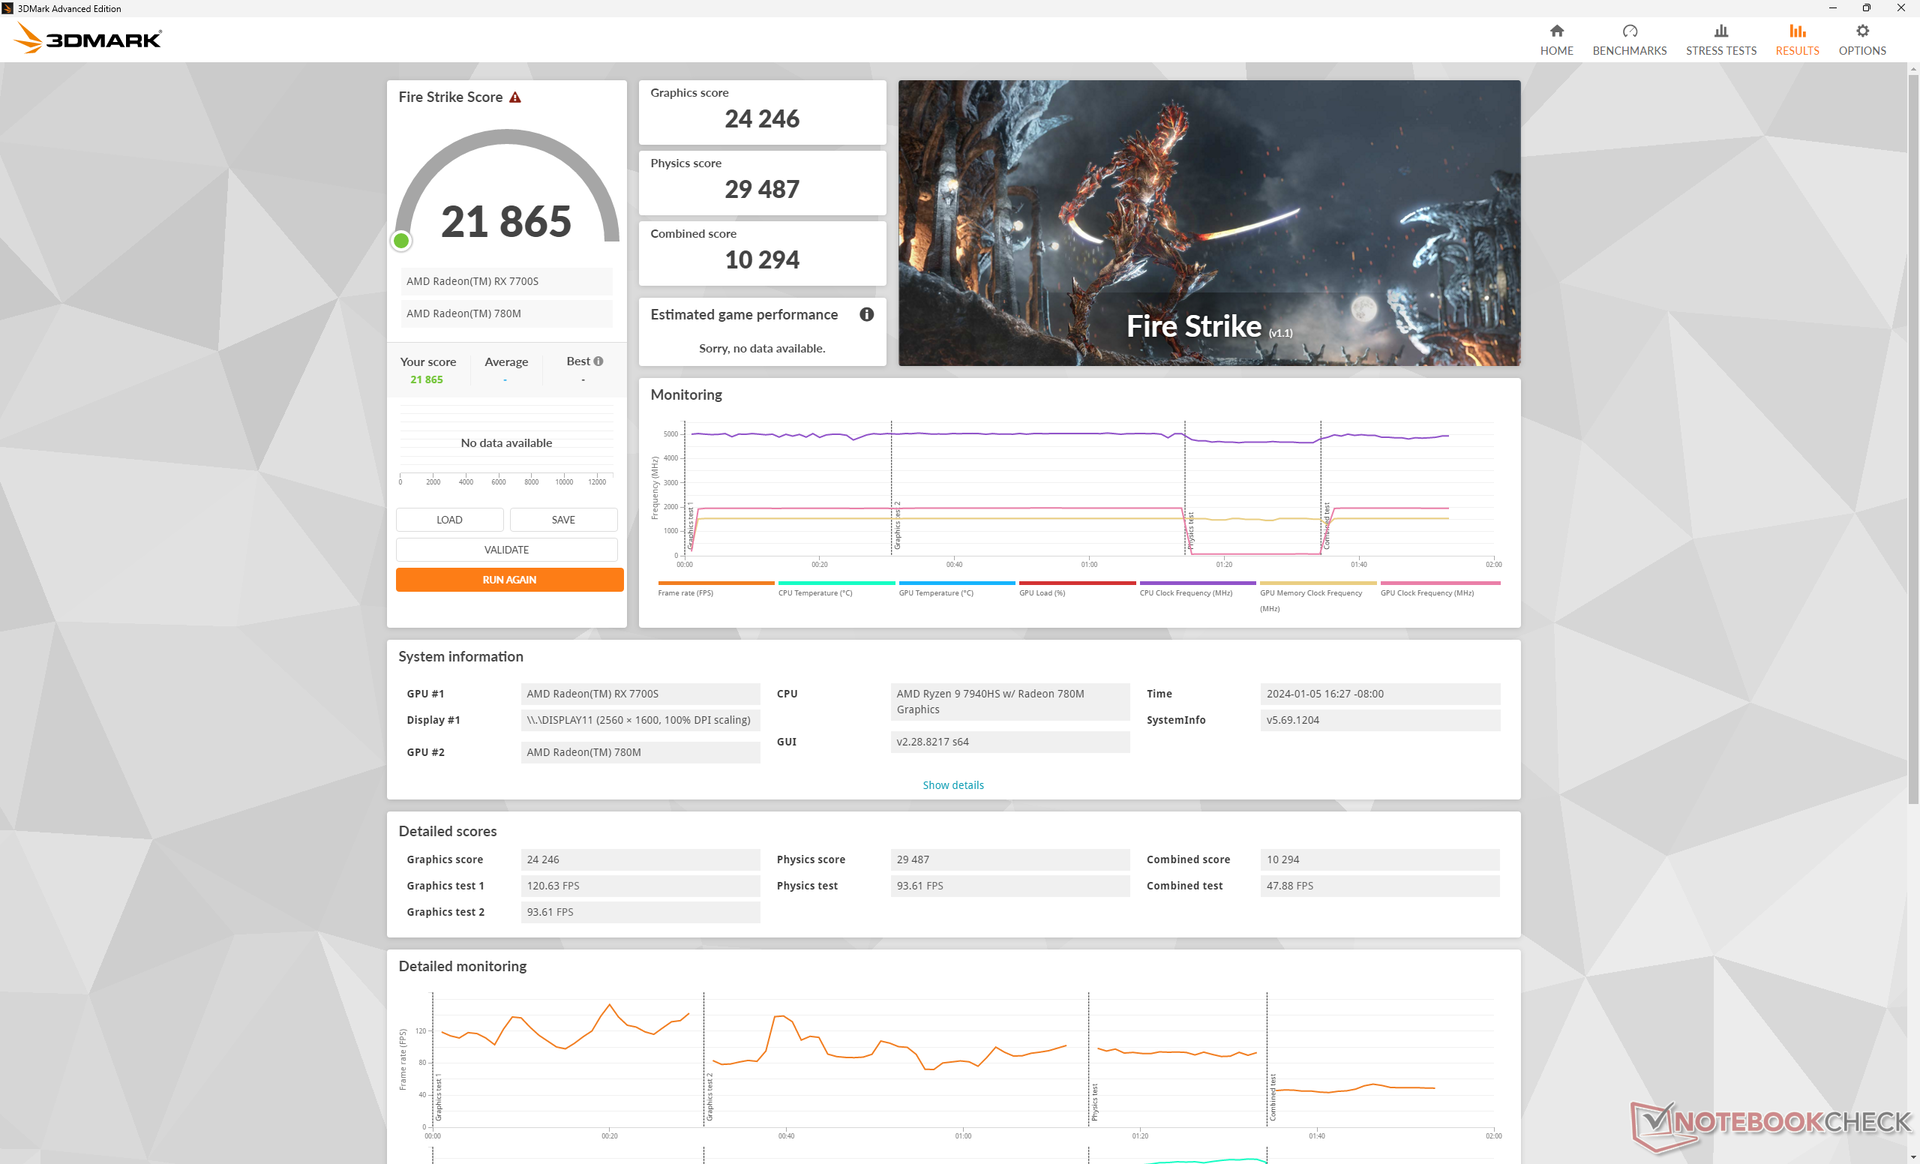
| 3DMark 11 Performance | 32427 points | |
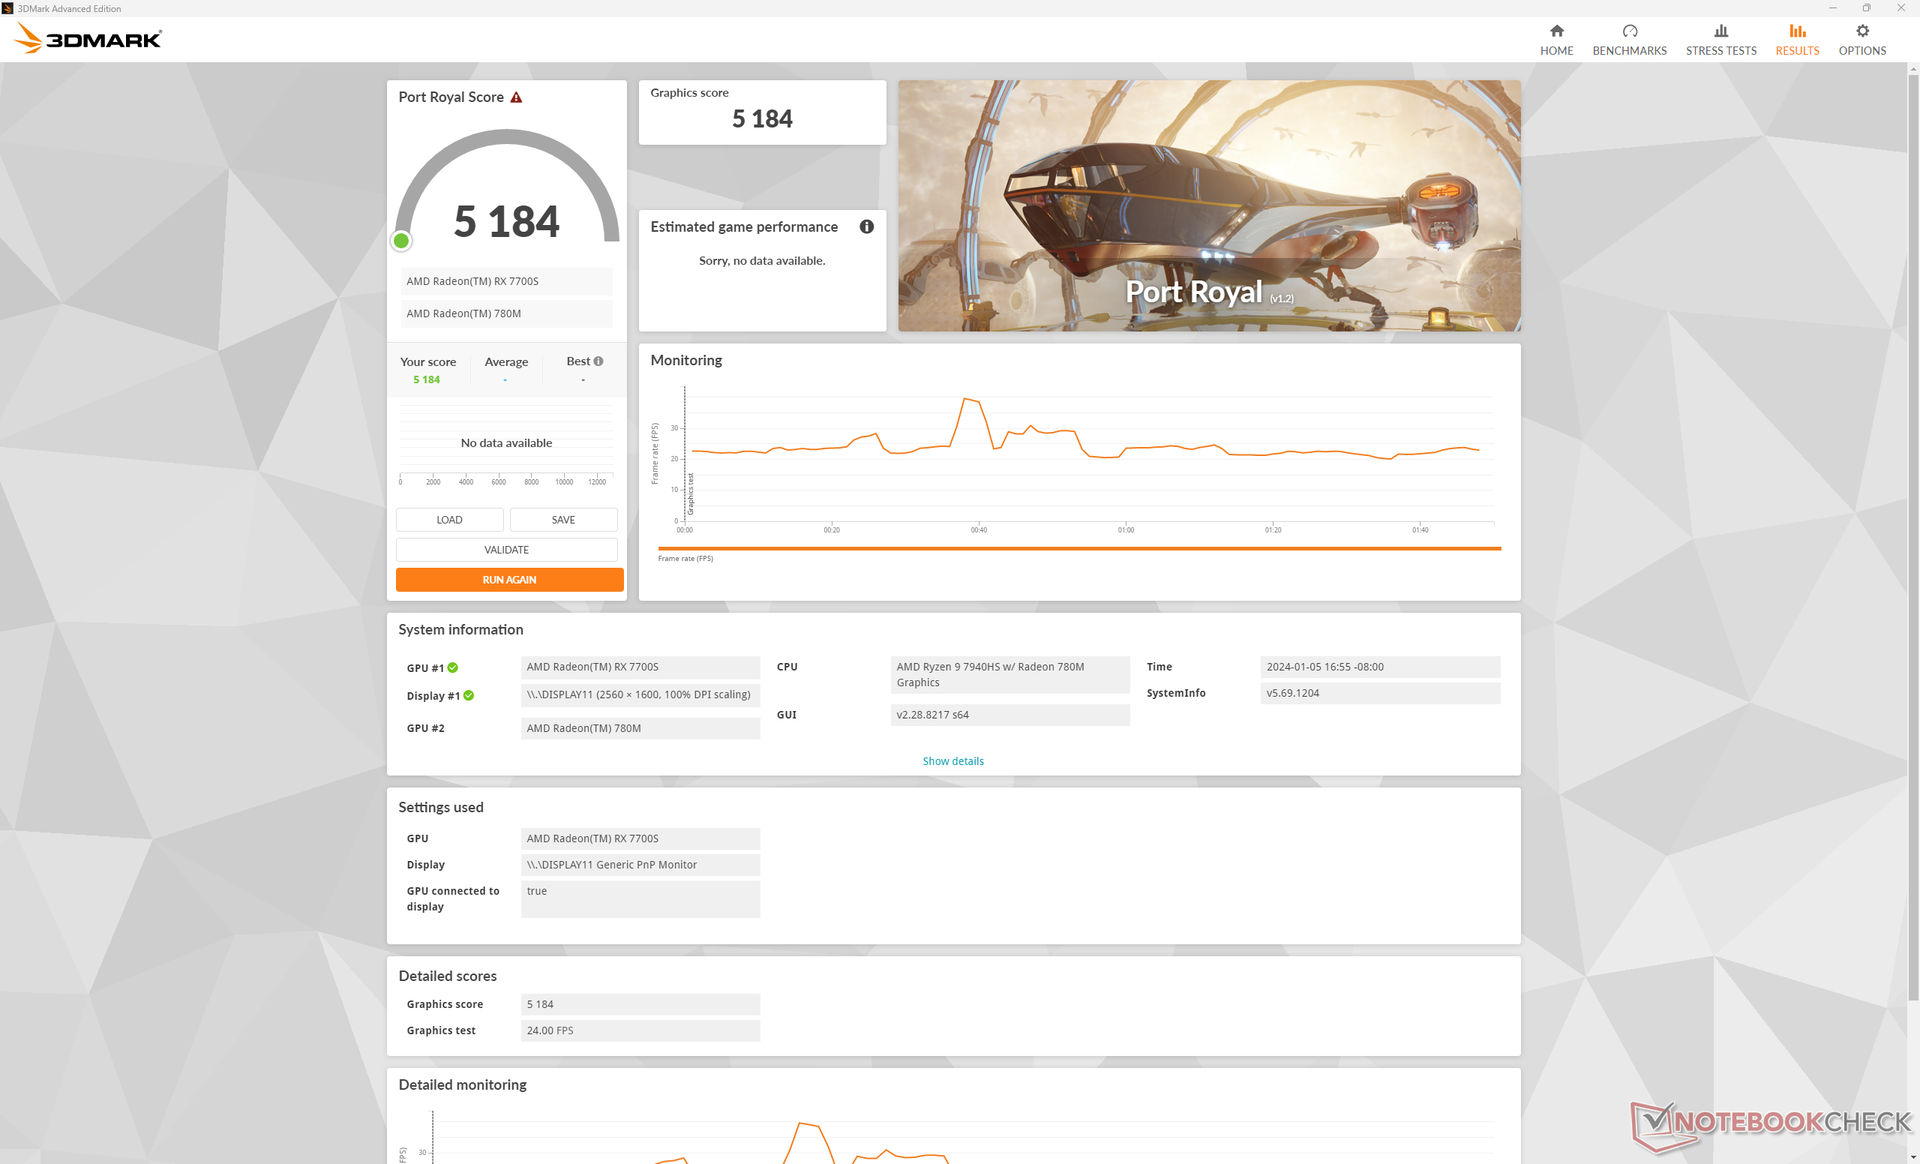
| 3DMark Fire Strike Score | 21865 points | |
| 3DMark Time Spy Score | 10294 points | |
Aide | ||
* ... Moindre est la valeur, meilleures sont les performances
Performances des jeux
Les performances de jeu de la Radeon RX 7700S de 100 W sont inférieures de 10 à 30 % à celles de la RTX 4060 mobile GeForce, en fonction du TDP. Par exemple, les performances sont beaucoup plus proches de celles de la RTX 4060 de 60 W dans le modèle Dell Inspiron 16 Plus 7630 tandis que la RTX 4060 de 140 W surpasserait notre Radeon avec des marges plus importantes. Par conséquent, attendez-vous à ce que les performances de jeu se situent entre celles de la rTX 4050 mobile et la RTX 4060 mobile.
Les performances seraient également légèrement supérieures à celles de la Radeon RX 6700S de l'année dernière dans la plupart des titres testés. Les gains les plus importants sont observés lorsque la RT est activée, comme prévu par 3DMark. F1 22, par exemple, tournerait 30 à 40 % plus vite qu'avant lorsque les paramètres RT sont activés, contre 5 à 15 % lorsque les paramètres RT sont désactivés.
| Baldur's Gate 3 | |
| 1920x1080 High Preset AA:T | |
| Alienware m18 R1 AMD | |
| Lenovo Legion Slim 7 16APH8 | |
| Framework Laptop 16 | |
| Moyenne AMD Radeon RX 7700S (n=1) | |
| Lenovo ThinkPad Z16 Gen 2 | |
| MSI Prestige 16 B1MG-001US | |
| 1920x1080 Ultra Preset AA:T | |
| Alienware m18 R1 AMD | |
| Lenovo Legion Slim 7 16APH8 | |
| Framework Laptop 16 | |
| Moyenne AMD Radeon RX 7700S (n=1) | |
| Lenovo ThinkPad Z16 Gen 2 | |
| MSI Prestige 16 B1MG-001US | |
| 2560x1440 Ultra Preset AA:T | |
| Alienware m18 R1 AMD | |
| Lenovo Legion Slim 7 16APH8 | |
| Framework Laptop 16 | |
| Moyenne AMD Radeon RX 7700S (n=1) | |
| Lenovo ThinkPad Z16 Gen 2 | |
| 3840x2160 Ultra Preset AA:T | |
| Alienware m18 R1 AMD | |
| Framework Laptop 16 | |
| Moyenne AMD Radeon RX 7700S (n=1) | |
Witcher 3 FPS Chart
| Bas | Moyen | Élevé | Ultra | QHD | 4K | |
|---|---|---|---|---|---|---|
| GTA V (2015) | 184 | 178.6 | 170.6 | 95.8 | 67.1 | 68.4 |
| The Witcher 3 (2015) | 392.2 | 277.5 | 147.1 | 84 | 43 | |
| Dota 2 Reborn (2015) | 174 | 159.8 | 156.5 | 136.8 | 85.3 | |
| Final Fantasy XV Benchmark (2018) | 206 | 106 | 74.8 | 54.5 | 29 | |
| X-Plane 11.11 (2018) | 97.6 | 79.3 | 65 | 46.8 | ||
| Far Cry 5 (2018) | 148 | 130 | 123 | 117 | 81 | 39 |
| Strange Brigade (2018) | 449 | 202 | 167.4 | 143.9 | 91.9 | 47.9 |
| Tiny Tina's Wonderlands (2022) | 183.5 | 140.4 | 92 | 71.2 | 47.3 | 23.1 |
| F1 22 (2022) | 251 | 221 | 168 | 47.7 | 29.9 | 11.3 |
| Baldur's Gate 3 (2023) | 106.8 | 88 | 76.4 | 73.6 | 51.1 | 24.7 |
| Cyberpunk 2077 (2023) | 100.7 | 80.5 | 68.1 | 60.7 | 37.3 | 15.8 |
Les performances par watt en mode Ultra sont comparables à celles d'une RTX 4070 Ti ou d'une RTX 4080 de bureau Witcher 3 en mode Ultra est comparable à celle d'un ordinateur de bureau GeForce RTX 4070 Ti ou RTX 4080. Ainsi, le GPU RDNA 3 est au moins efficace, même s'il est loin d'être aussi puissant que le plus rapide de Nvidia. Pendant ce temps, la RTX 4060 mobile, plus compétitive, est encore 30 % plus efficace et cette marge augmente en faveur de Nvidia lors de l'exécution de jeux compatibles avec la technologie RT.
Émissions
Bruit du système - Fort sous charge
Le bruit du ventilateur couvre assez bien les deux extrêmes en ce sens qu'il peut être très silencieux lors de l'exécution de charges peu exigeantes et très bruyant lors de l'exécution de charges plus exigeantes telles que les jeux. Lors d'une simple navigation ou d'un streaming vidéo, par exemple, le bruit du ventilateur se situe autour de 28,5 dB(A) sur un fond silencieux de 23,8 dB(A), ce qui le rend pratiquement inaudible. En revanche, sur le site Witcher 3, le bruit du ventilateur peut atteindre 52 dB(A), soit autant que l'Inspiron 16 Plus concurrent ou que certains ordinateurs portables de jeu comme le Razer Blade 16.
Degré de la nuisance sonore
| Au repos |
| 23.9 / 23.9 / 23.9 dB(A) |
| Fortement sollicité |
| 28.5 / 53.7 dB(A) |
 | ||
30 dB silencieux 40 dB(A) audible 50 dB(A) bruyant |
||
min: | ||
| Framework Laptop 16 Radeon RX 7700S, R9 7940HS, WDC PC SN810 1TB | MSI Prestige 16 B1MG-001US Arc 8-Core, Ultra 7 155H, Samsung PM9A1 MZVL22T0HBLB | Lenovo ThinkPad Z16 Gen 2 Radeon RX 6550M, R9 PRO 7940HS, Kioxia XG8 KXG8AZNV1T02 | Apple MacBook Pro 16 2023 M3 Max M3 Max 40-Core GPU, Apple M3 Max 16-Core, Apple SSD AP8192Z | Dell Inspiron 16 Plus 7630 GeForce RTX 4060 Laptop GPU, i7-13700H, WD PC SN740 SDDPTQD-1T00 | HP Spectre x360 2-in-1 16-f1075ng Iris Xe G7 96EUs, i7-12700H, SK Hynix PC711 1TB HFS001TDE9X073N | |
|---|---|---|---|---|---|---|
| Noise | -6% | -5% | -0% | -1% | -6% | |
| arrêt / environnement * (dB) | 23.8 | 24.5 -3% | 22.6 5% | 23.7 -0% | 23.2 3% | 26 -9% |
| Idle Minimum * (dB) | 23.9 | 24.5 -3% | 22.9 4% | 23.7 1% | 23.2 3% | 26 -9% |
| Idle Average * (dB) | 23.9 | 26.3 -10% | 29.4 -23% | 23.7 1% | 23.2 3% | 26 -9% |
| Idle Maximum * (dB) | 23.9 | 26.3 -10% | 29.4 -23% | 23.7 1% | 23.2 3% | 26 -9% |
| Load Average * (dB) | 28.5 | 36.5 -28% | 29.5 -4% | 40.8 -43% | 35.1 -23% | 42.9 -51% |
| Witcher 3 ultra * (dB) | 51.9 | 46.3 11% | 52 -0% | 42.8 18% | 52.5 -1% | 42.9 17% |
| Load Maximum * (dB) | 53.7 | 52.9 1% | 52 3% | 42.8 20% | 52.5 2% | 39.1 27% |
* ... Moindre est la valeur, meilleures sont les performances
Température
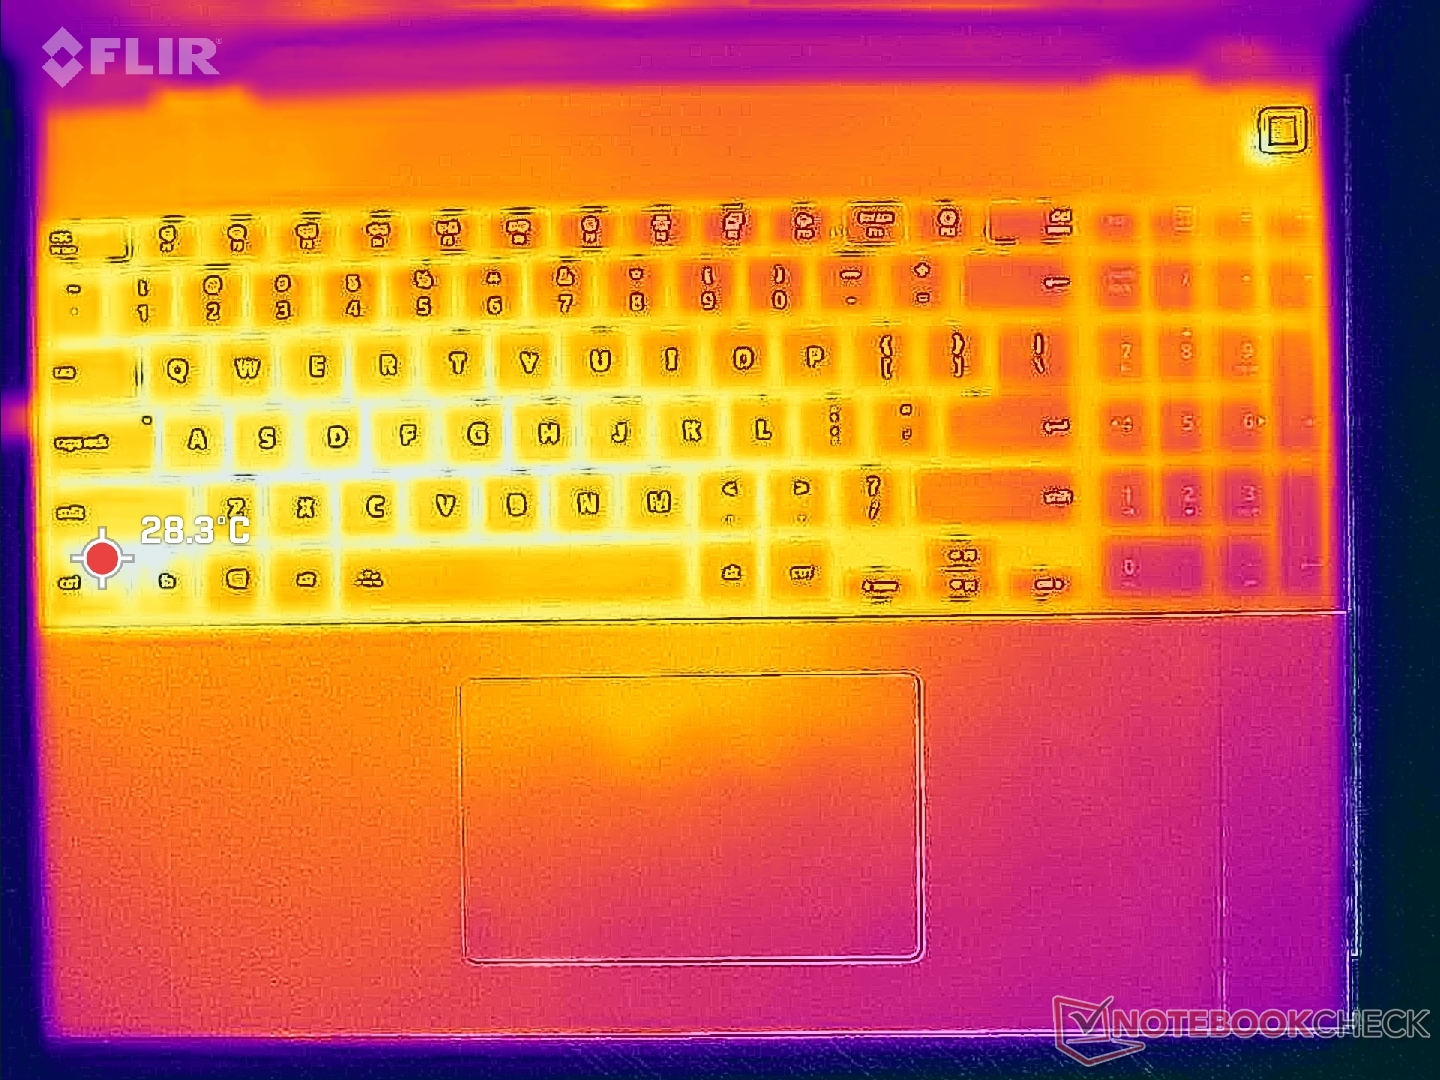
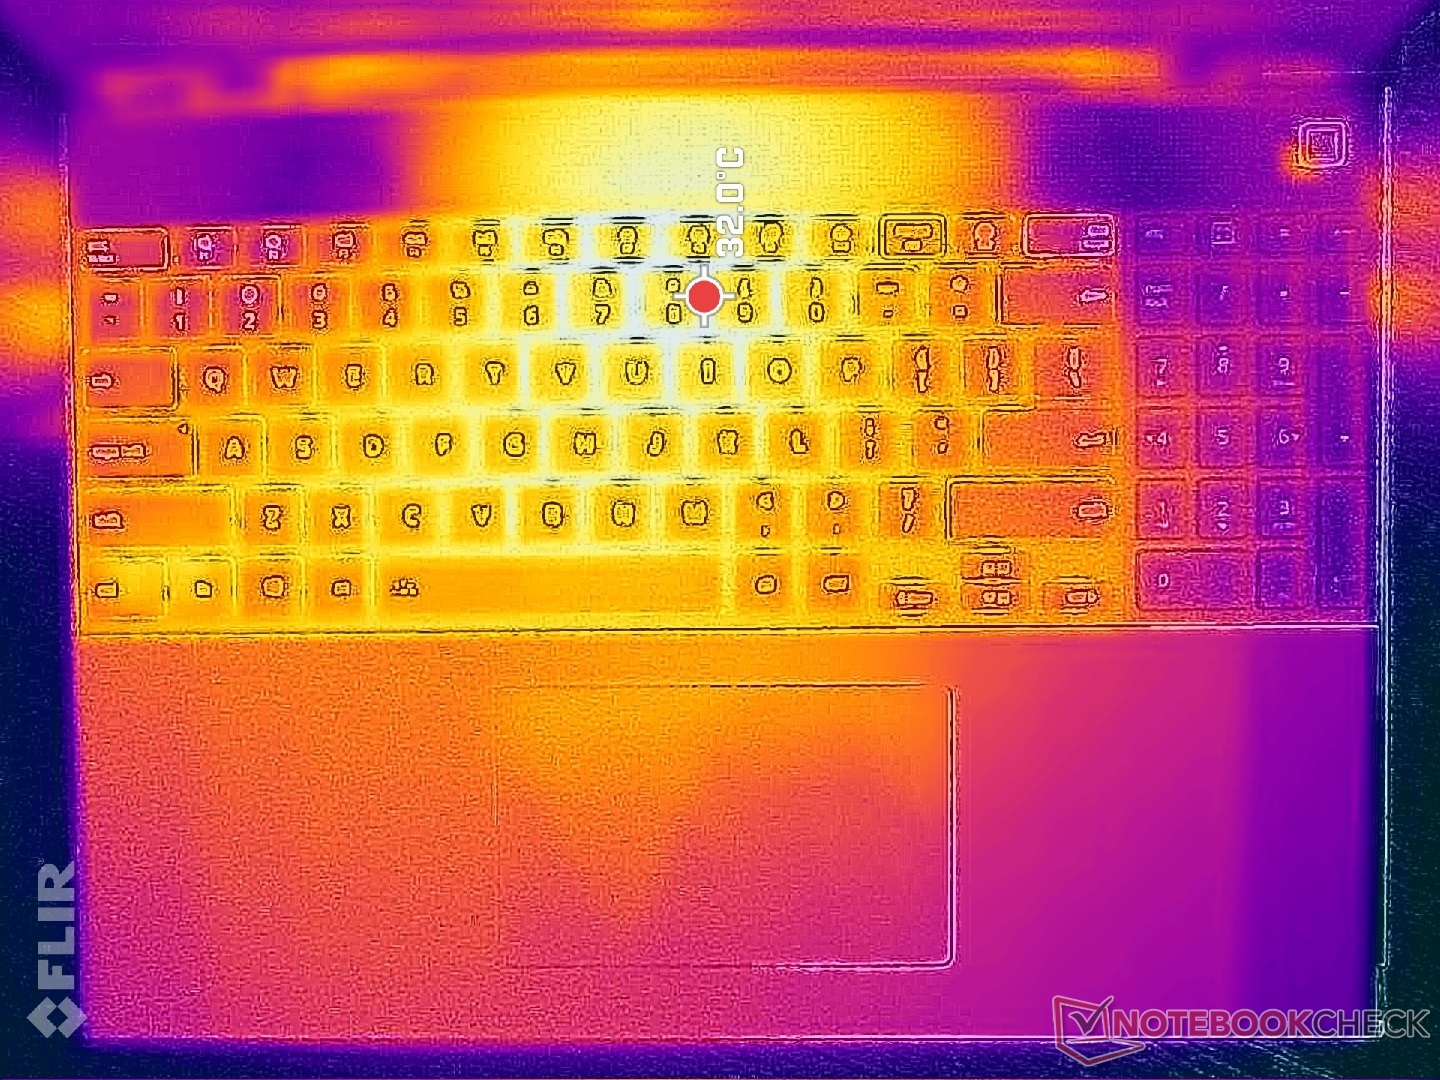
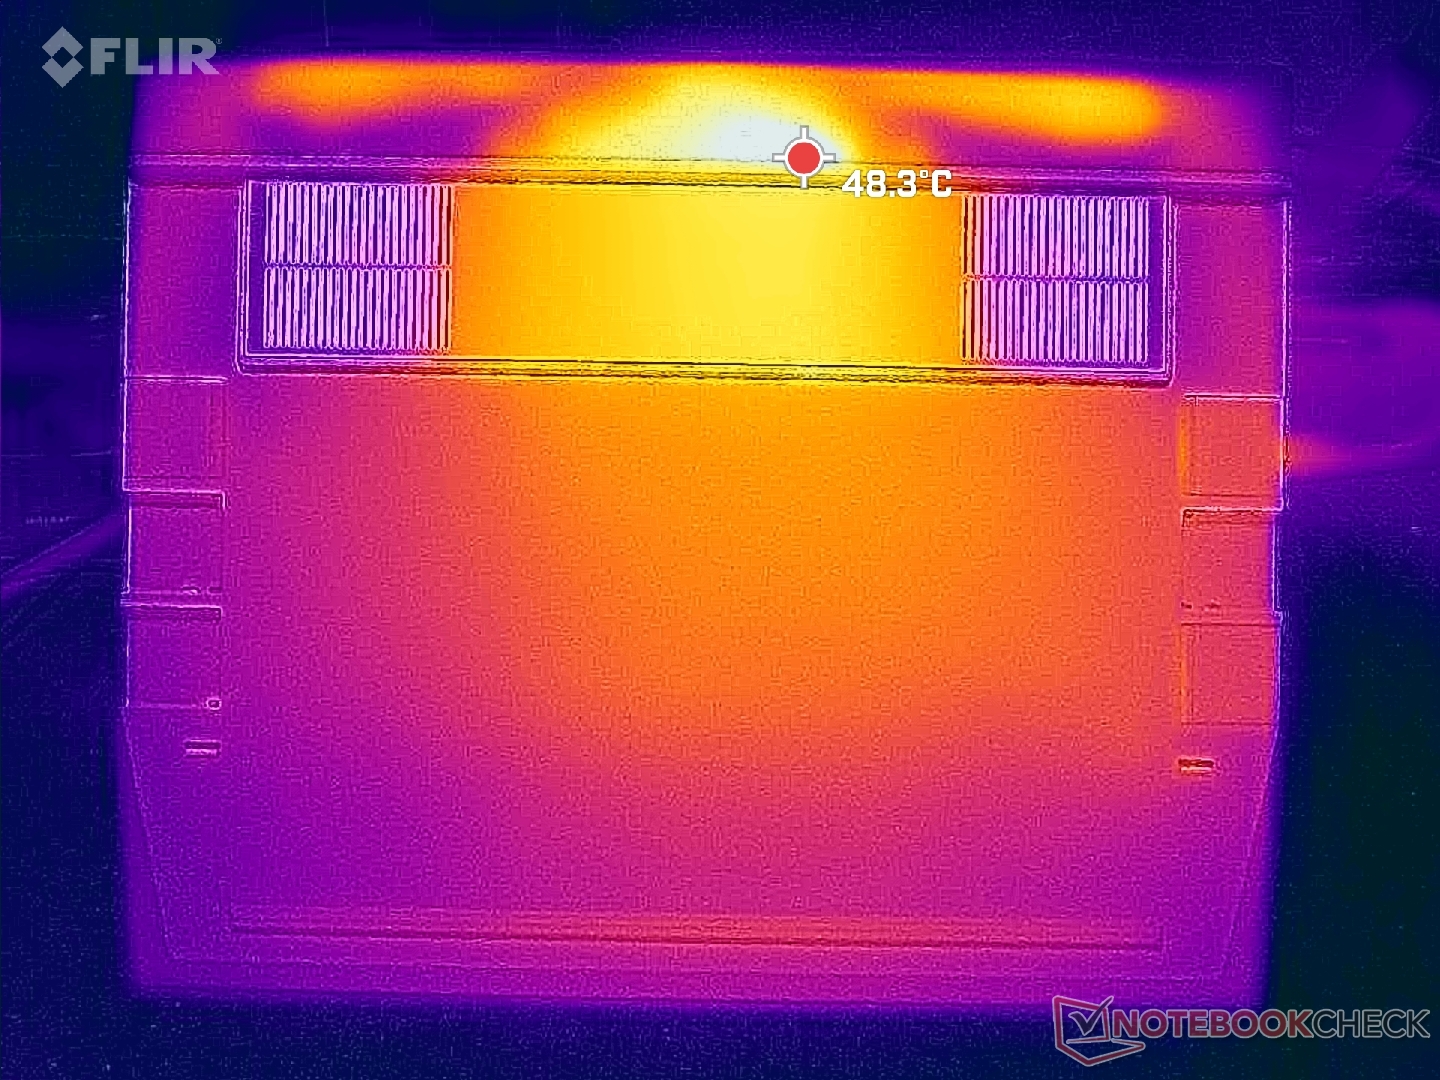
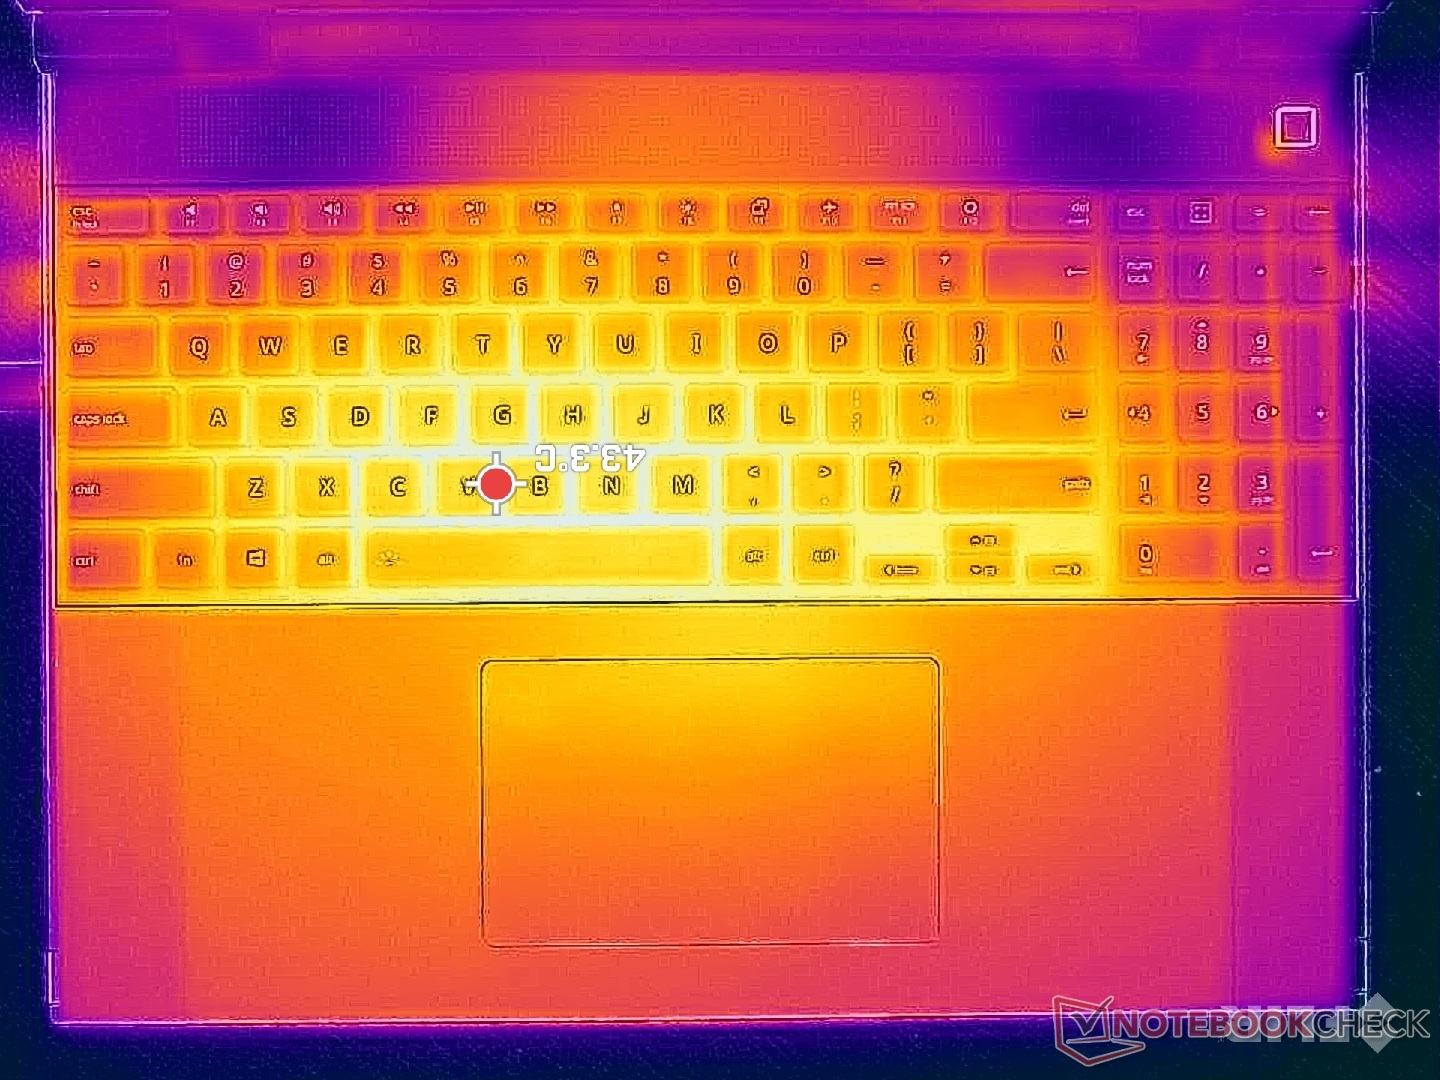
Les températures de surface sont toujours chaudes en raison du châssis métallique et des ventilateurs léthargiques. Lors de l'exécution de tâches plus exigeantes comme les jeux, les points chauds peuvent atteindre plus de 40°C sur les côtés supérieur et inférieur de la base de l'ordinateur portable. Les points chauds sont plus proches du centre du Laptop 16 alors qu'ils sont généralement situés à l'arrière sur la plupart des autres ordinateurs portables. Cela signifie que vous êtes plus susceptible de remarquer le réchauffement du système Framework pendant l'utilisation par rapport à quelque chose comme le HP Spectre x360 16 où les appuis palmaires et les zones frontales ont tendance à être plus froids. Malgré cela, nous n'avons jamais trouvé que le Laptop 16 était inconfortablement chaud sur la peau.
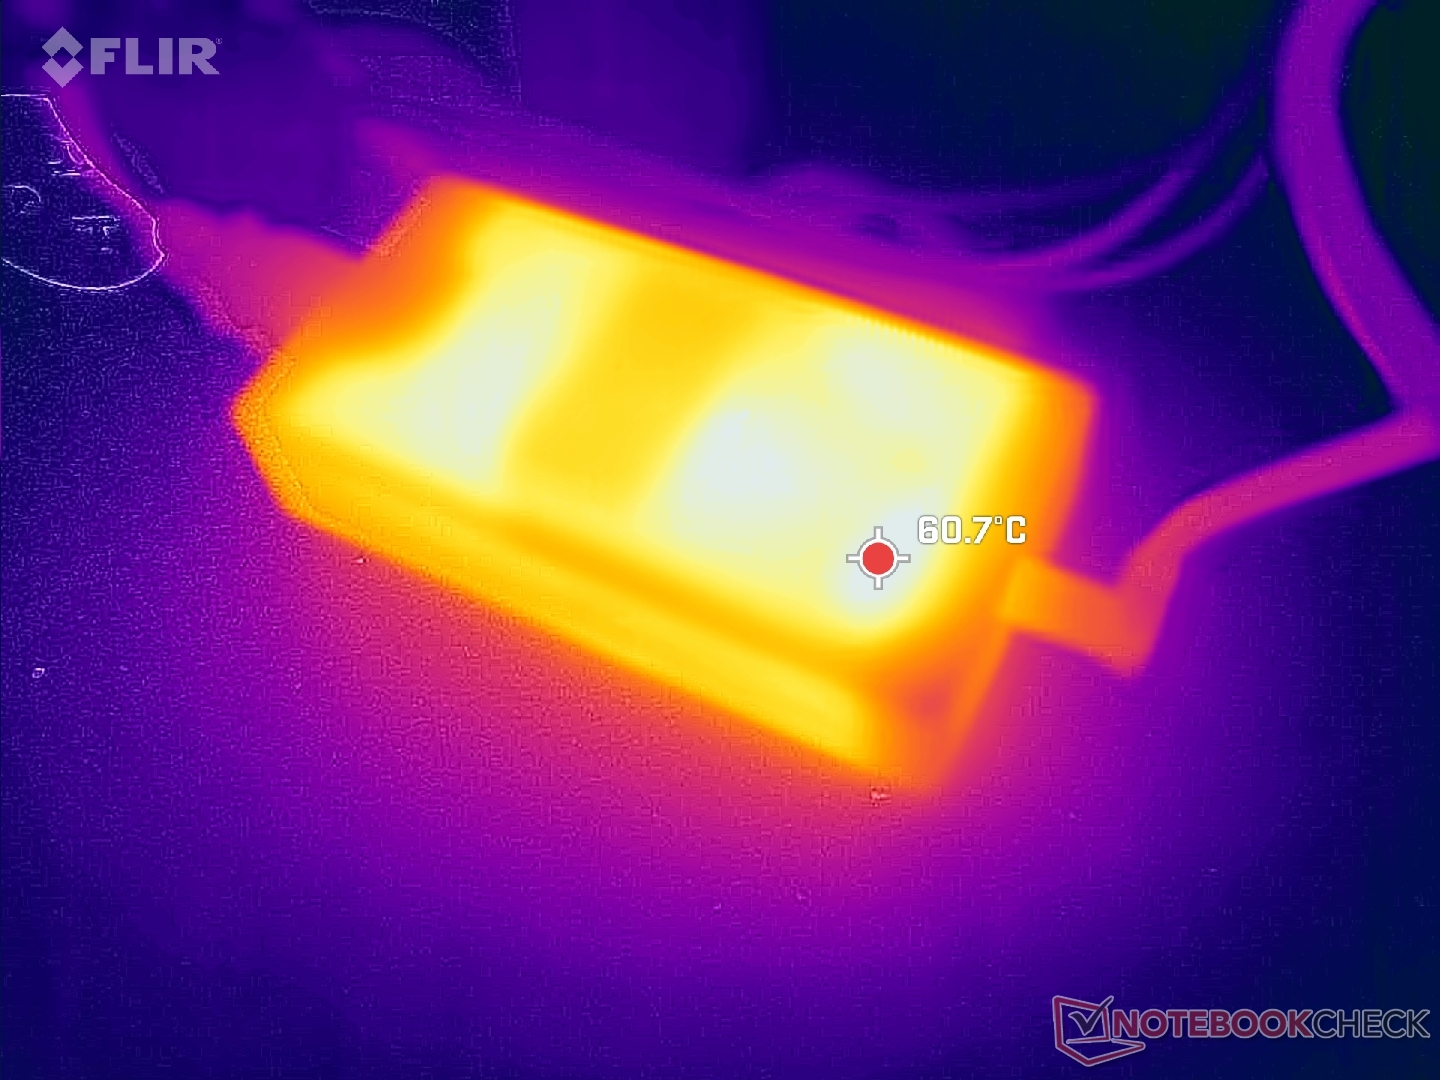
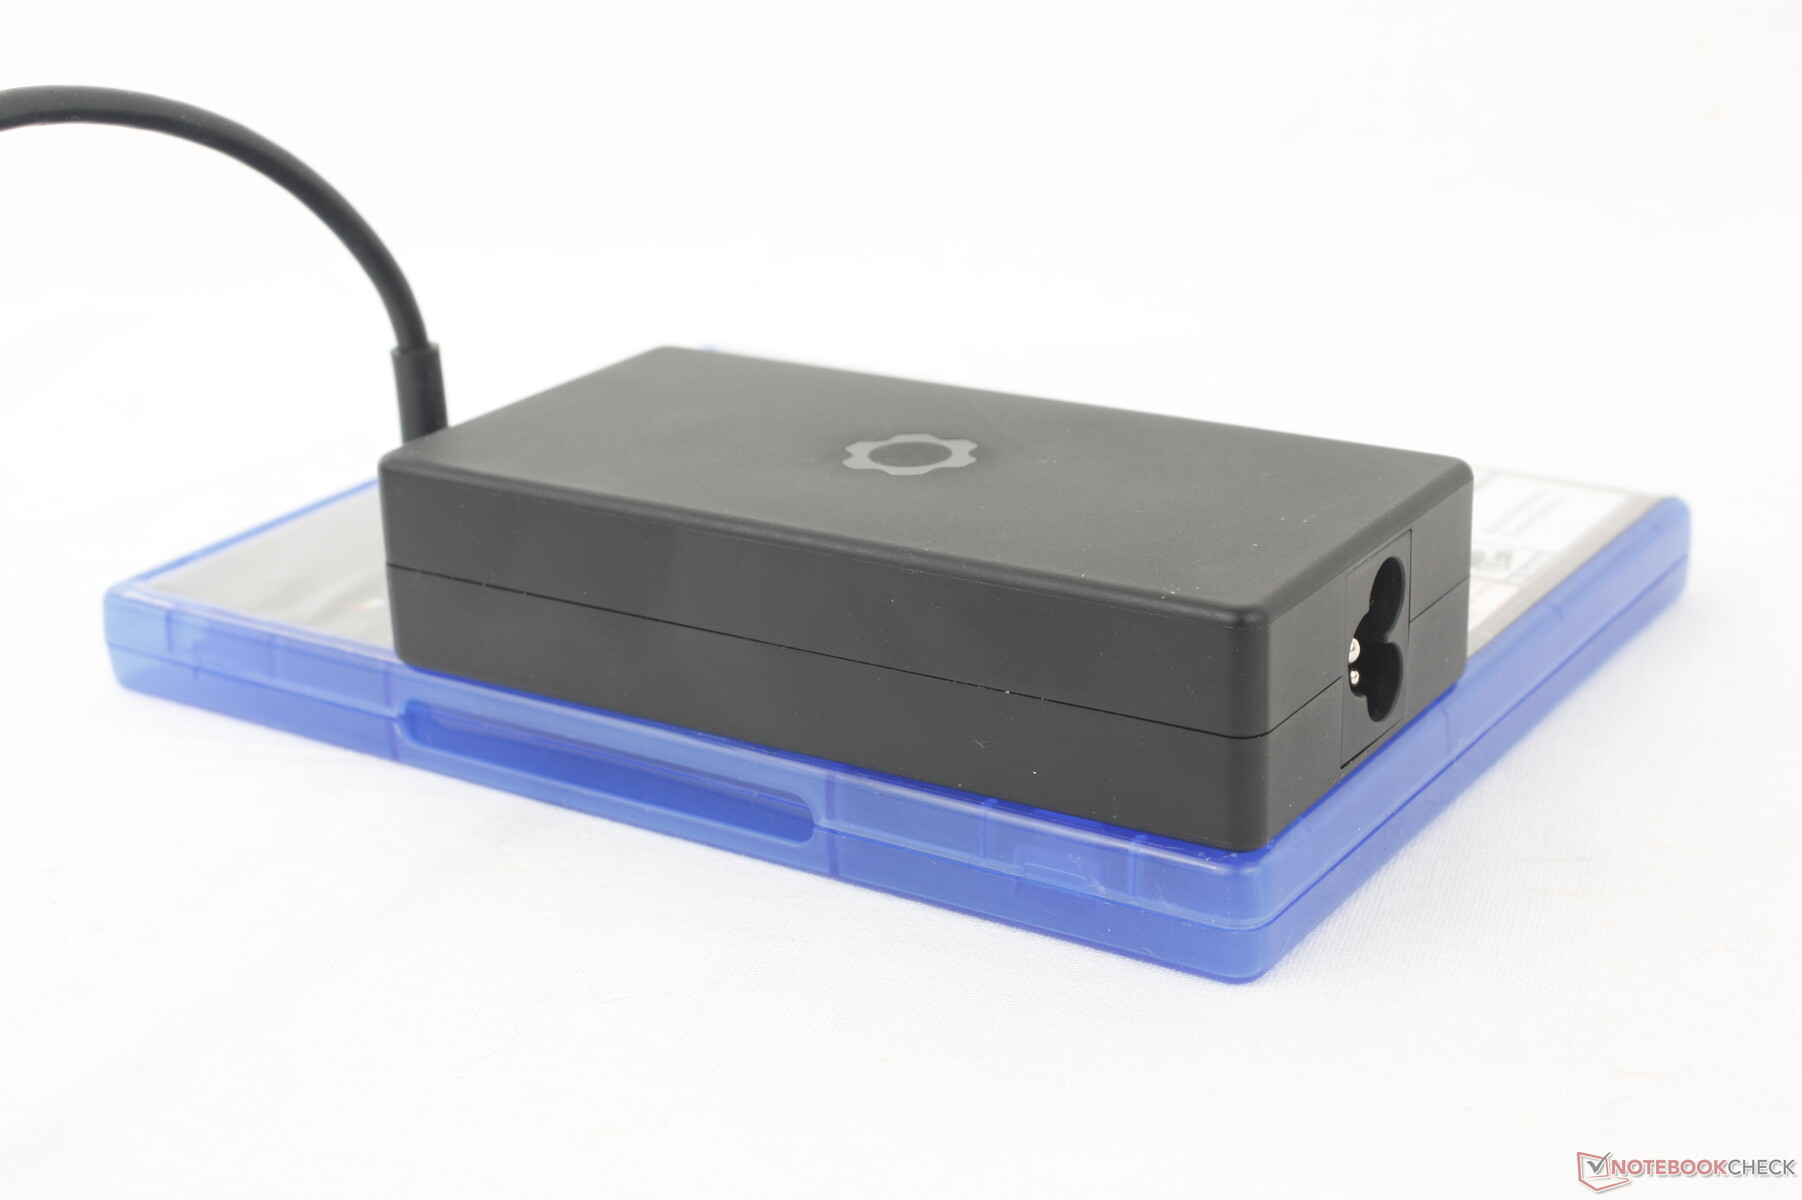
Gardez à l'esprit que l'adaptateur secteur USB-C 180 W est l'un des plus petits que nous ayons vus (~11,6 z 5,7 x 2,6 cm) pour sa puissance de sortie. Sa taille compacte est rendue possible par les transistors GaN qui est une technologie que Razer utilise également pour ses propres adaptateurs secteur. L'inconvénient du GaN est que les adaptateurs eux-mêmes peuvent devenir très chauds à plus de 60°C selon notre expérience. En comparaison, les chargeurs non GaN de plus grande taille se situent généralement entre 40 et 50°C en charge.
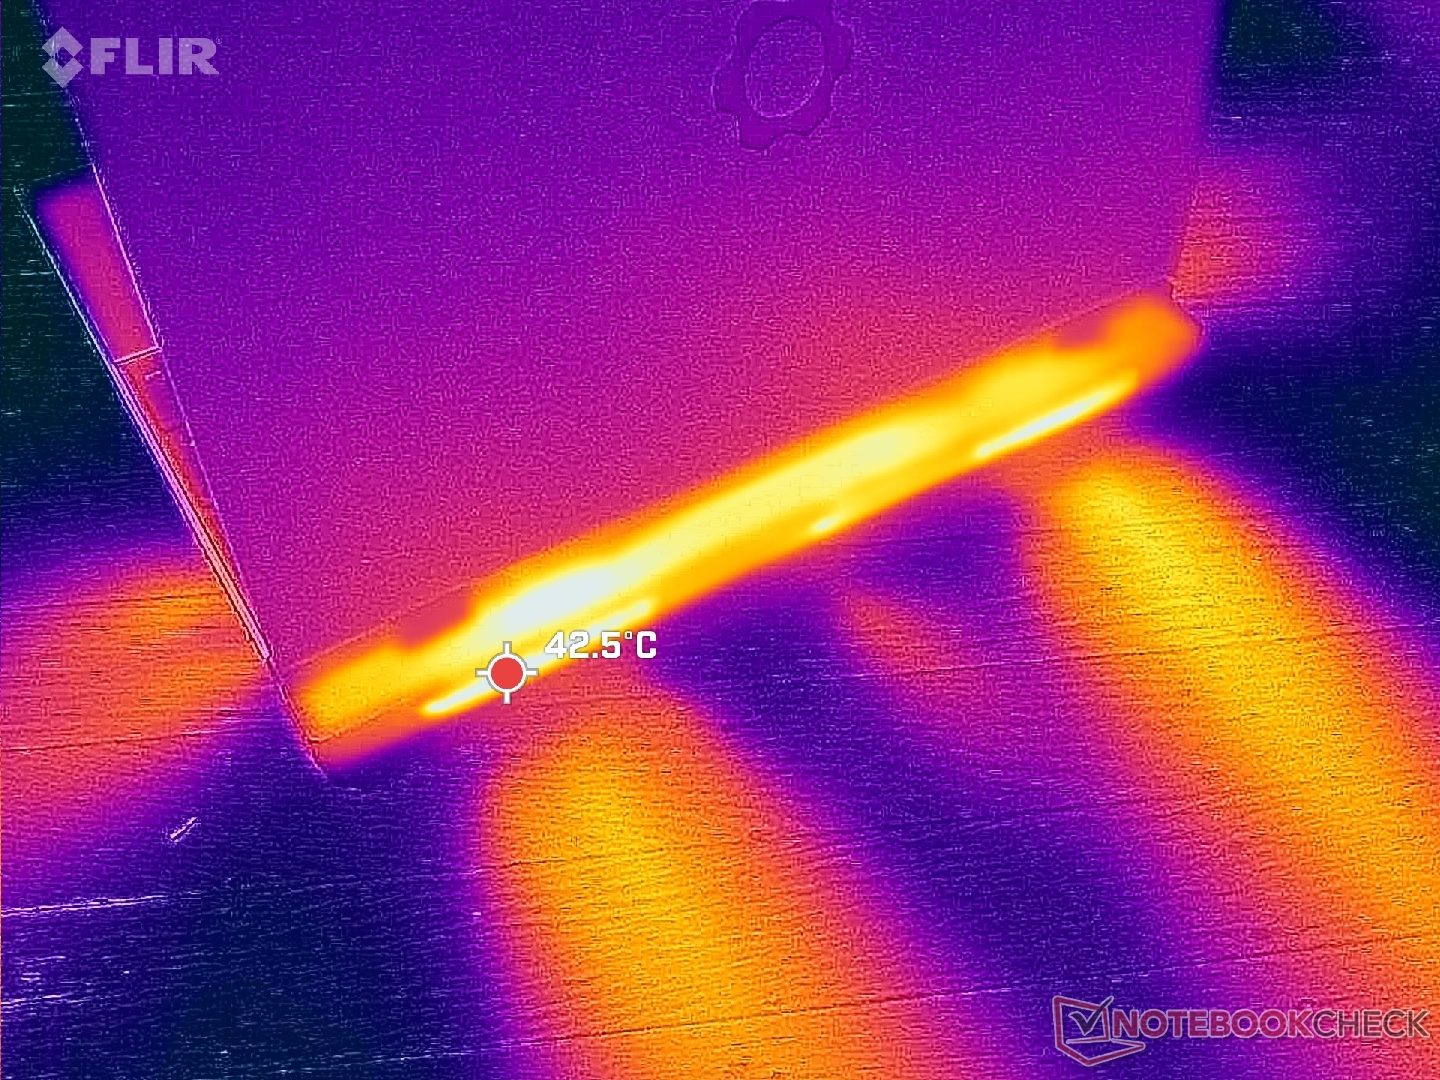
(±) La température maximale du côté supérieur est de 42.4 °C / 108 F, par rapport à la moyenne de 36.8 °C / 98 F, allant de 21 à 71 °C pour la classe Multimedia.
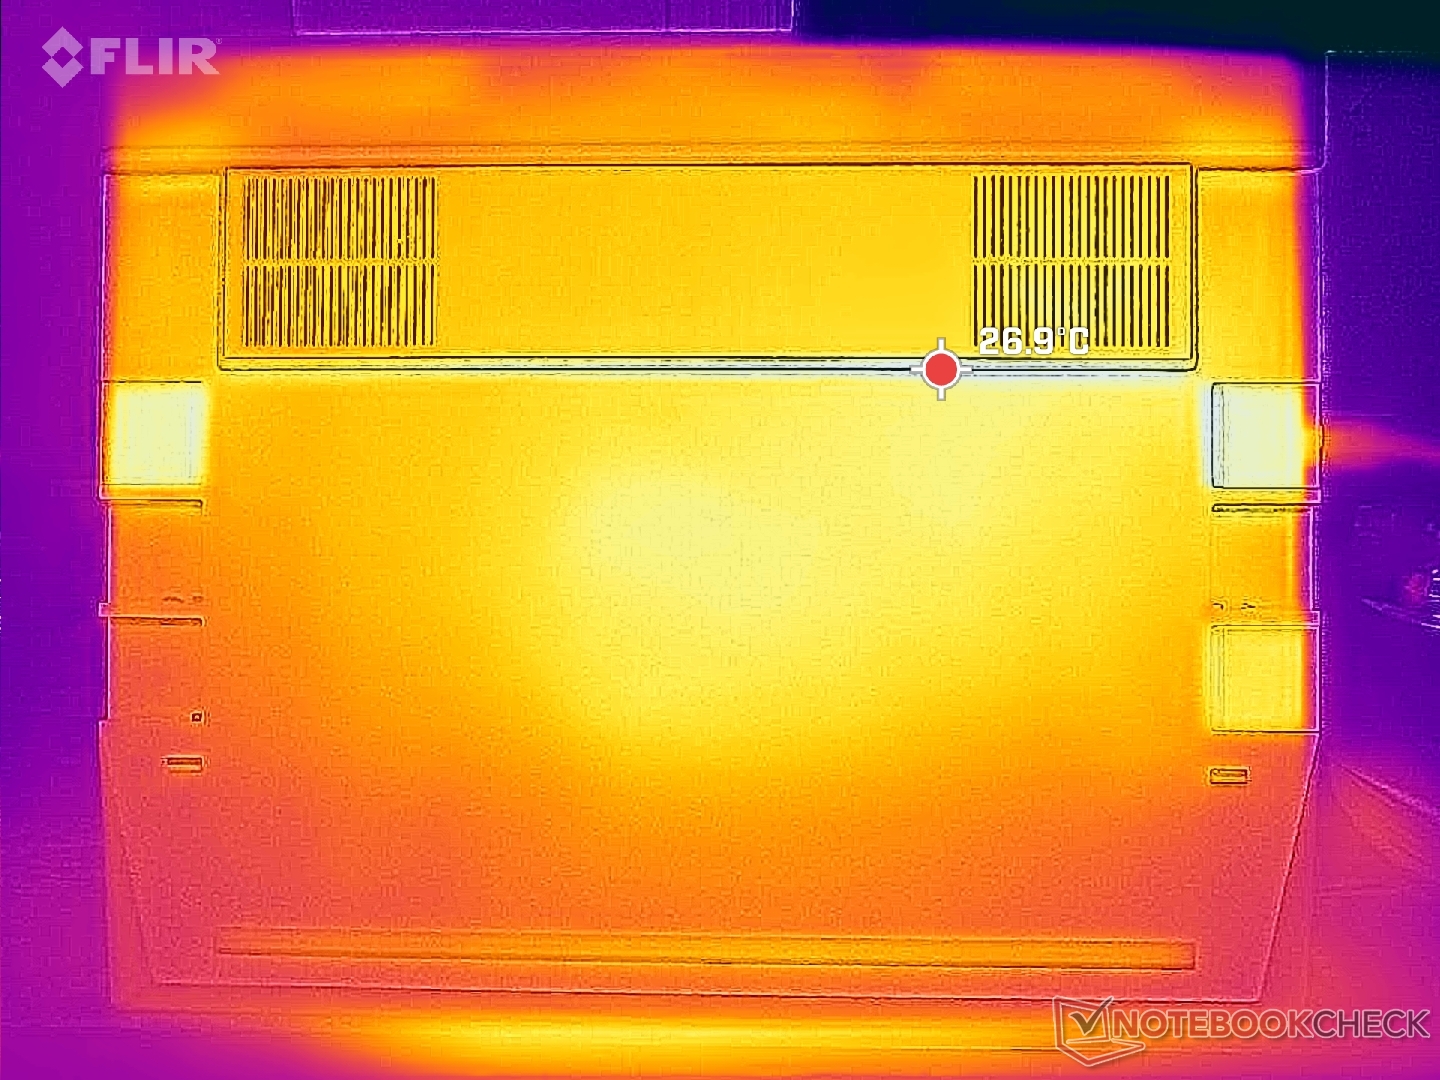
(±) Le fond chauffe jusqu'à un maximum de 40.8 °C / 105 F, contre une moyenne de 39.1 °C / 102 F
(+) En utilisation inactive, la température moyenne du côté supérieur est de 28.7 °C / 84 F, par rapport à la moyenne du dispositif de 31.3 °C / 88 F.
(+) En jouant à The Witcher 3, la température moyenne du côté supérieur est de 30.2 °C / 86 F, alors que la moyenne de l'appareil est de 31.3 °C / 88 F.
(+) Les repose-poignets et le pavé tactile atteignent la température maximale de la peau (33.2 °C / 91.8 F) et ne sont donc pas chauds.
(-) La température moyenne de la zone de l'appui-paume de dispositifs similaires était de 28.7 °C / 83.7 F (-4.5 °C / #-8.1 F).

| Framework Laptop 16 AMD Ryzen 9 7940HS, AMD Radeon RX 7700S | MSI Prestige 16 B1MG-001US Intel Core Ultra 7 155H, Intel Arc 8-Core iGPU | Lenovo ThinkPad Z16 Gen 2 AMD Ryzen 9 PRO 7940HS, AMD Radeon RX 6550M | Apple MacBook Pro 16 2023 M3 Max Apple M3 Max 16-Core, Apple M3 Max 40-Core GPU | Dell Inspiron 16 Plus 7630 Intel Core i7-13700H, NVIDIA GeForce RTX 4060 Laptop GPU | HP Spectre x360 2-in-1 16-f1075ng Intel Core i7-12700H, Intel Iris Xe Graphics G7 96EUs | |
|---|---|---|---|---|---|---|
| Heat | 2% | 13% | 11% | -14% | 9% | |
| Maximum Upper Side * (°C) | 42.4 | 48.8 -15% | 43 -1% | 42.3 -0% | 47.8 -13% | 37.4 12% |
| Maximum Bottom * (°C) | 40.8 | 47.6 -17% | 41.6 -2% | 42 -3% | 42.2 -3% | 39.1 4% |
| Idle Upper Side * (°C) | 31.4 | 24.2 23% | 21.2 32% | 22.5 28% | 35.2 -12% | 27.1 14% |
| Idle Bottom * (°C) | 27.8 | 23.6 15% | 21.4 23% | 22.9 18% | 35 -26% | 26.3 5% |
* ... Moindre est la valeur, meilleures sont les performances
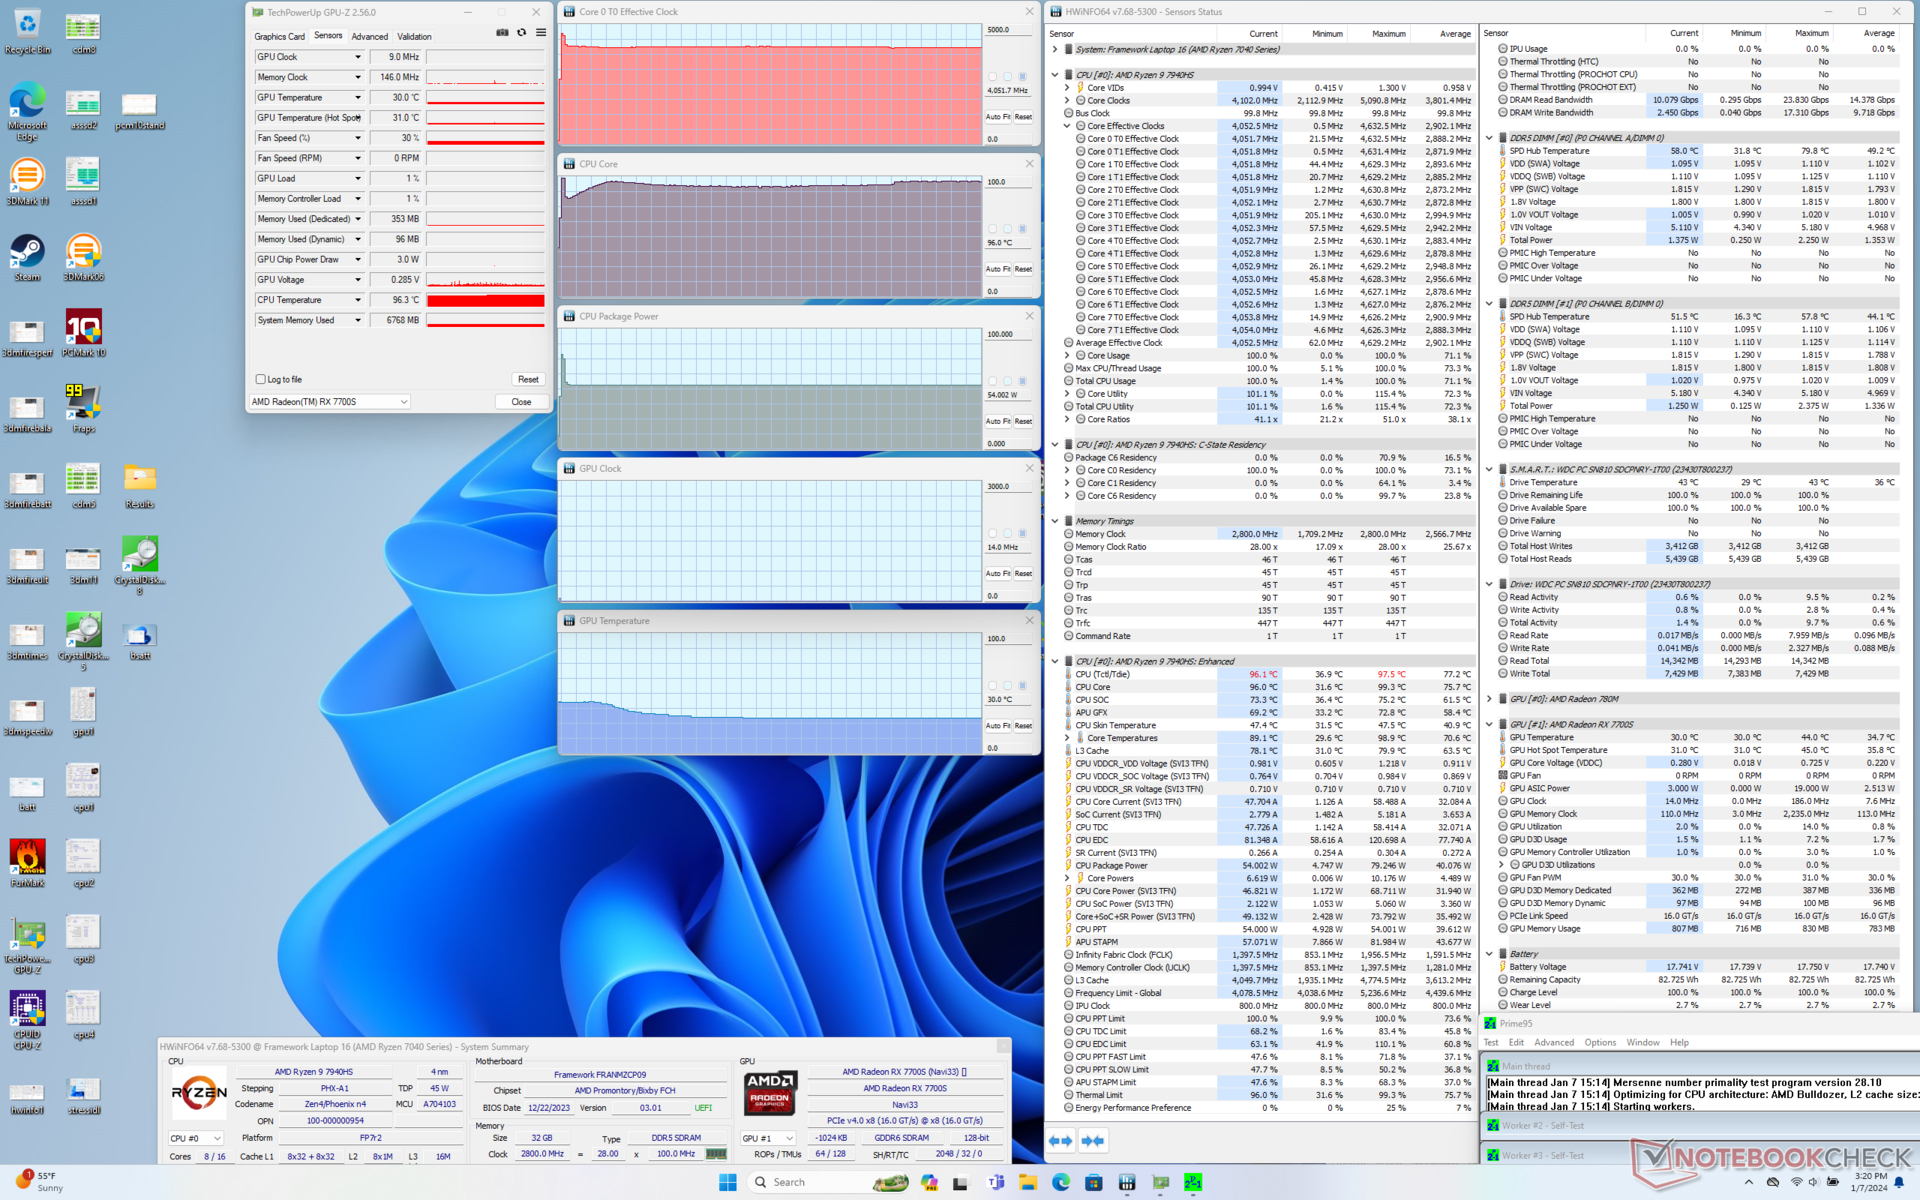
Test de stress
Le processeur atteignait 4,6 GHz et 80 W pendant les deux premières secondes du test Prime95, avant de redescendre rapidement et de se stabiliser à 4,0 GHz, 54 W et 96 C. En répétant ce même test sur l'ordinateur de bureau, nous avons constaté que le processeur n'était pas en mesure d'atteindre le niveau de performance escompté Lenovo Slim Pro 9i 16 avec le Core i9-13905H aboutirait à une température plus froide de 82°C. Cela suggère que Framework préfère augmenter les performances du processeur et limiter l'étranglement, même si cela signifie des températures moyennes plus élevées, ce que les enthousiastes pourraient apprécier.
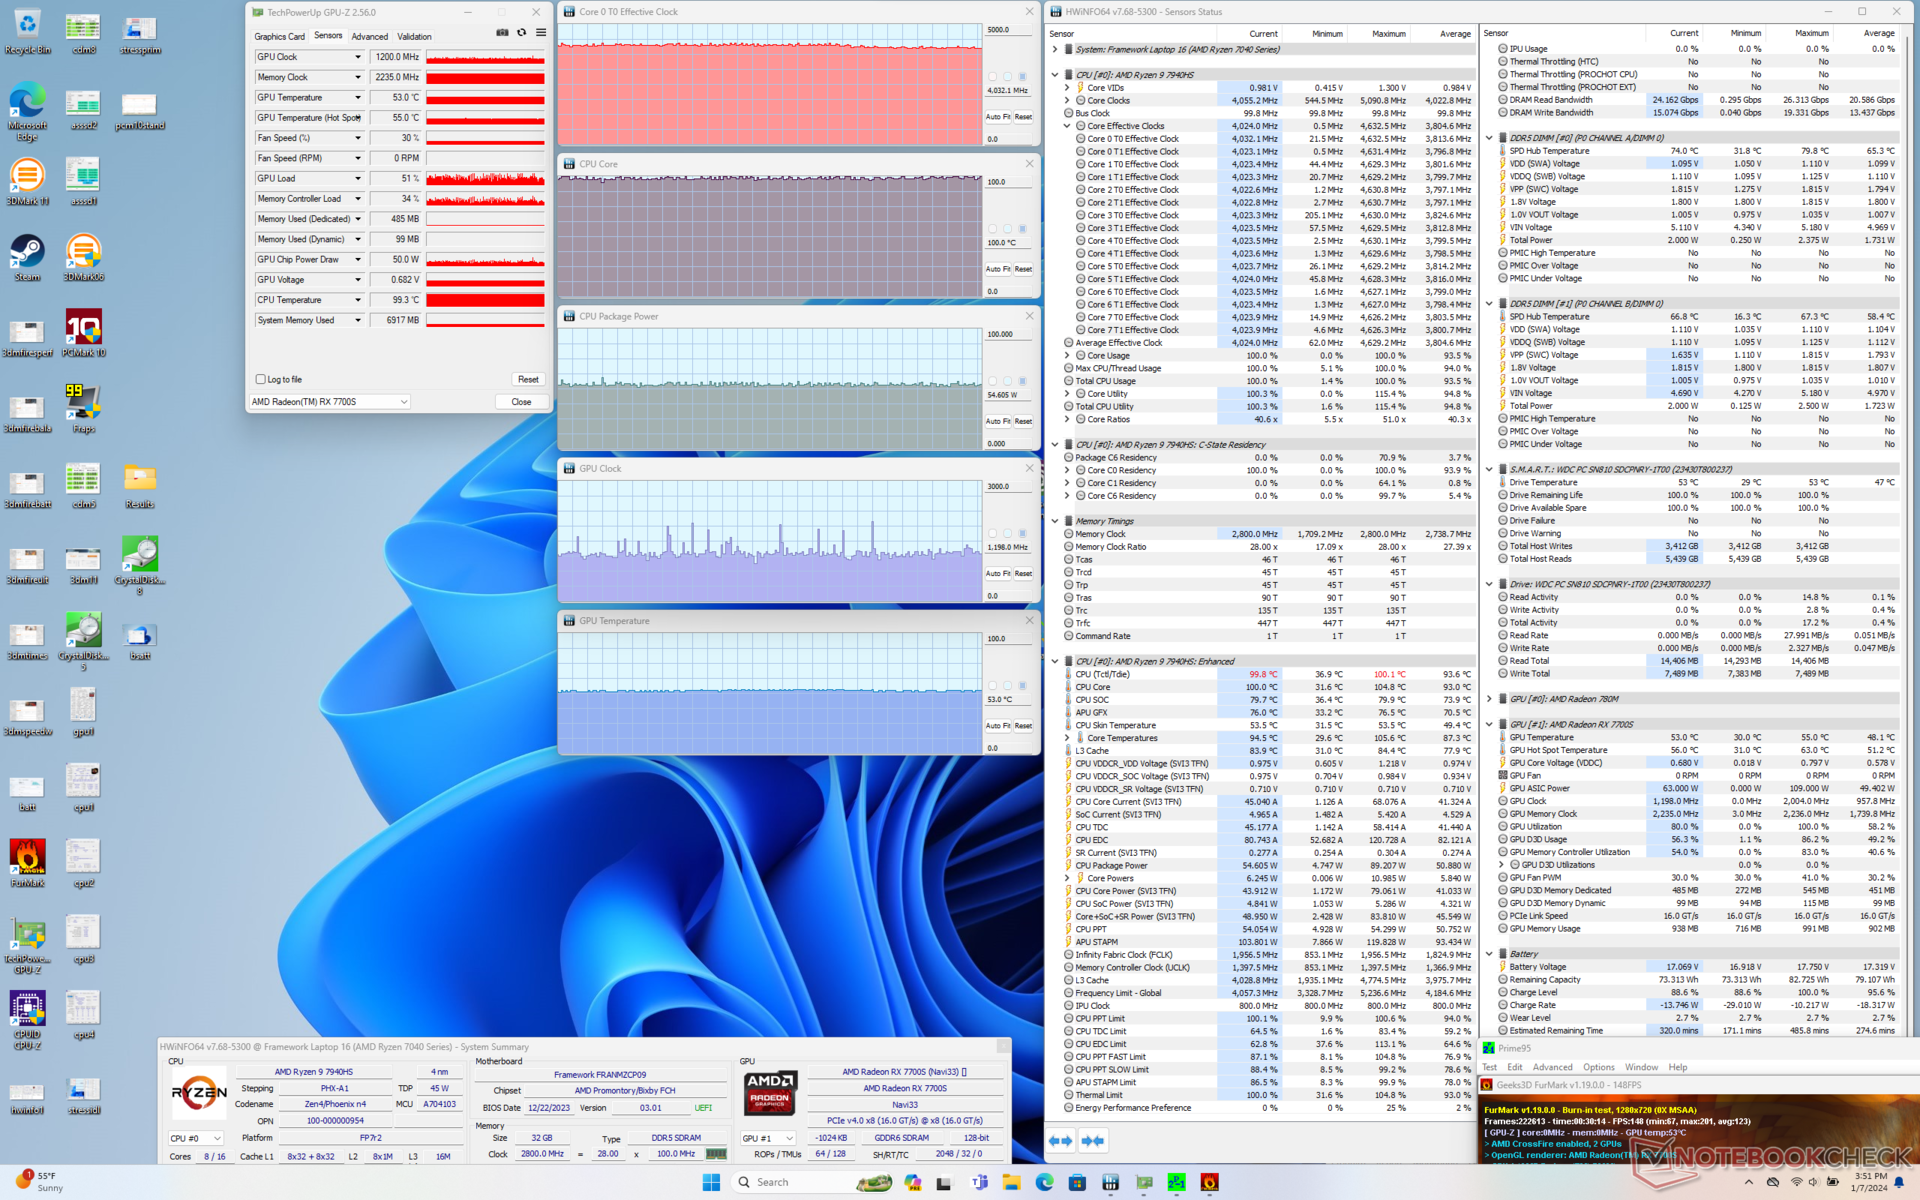
Le GPU se stabiliserait à 2363 MHz et 99 W lorsqu'il fonctionne Witcher 3 ce qui signifie qu'il peut utiliser la totalité de son budget de 100 W pour les jeux. La température du cœur reste raisonnablement basse à 66°C contre 62°C sur le Lenovo GeForce.
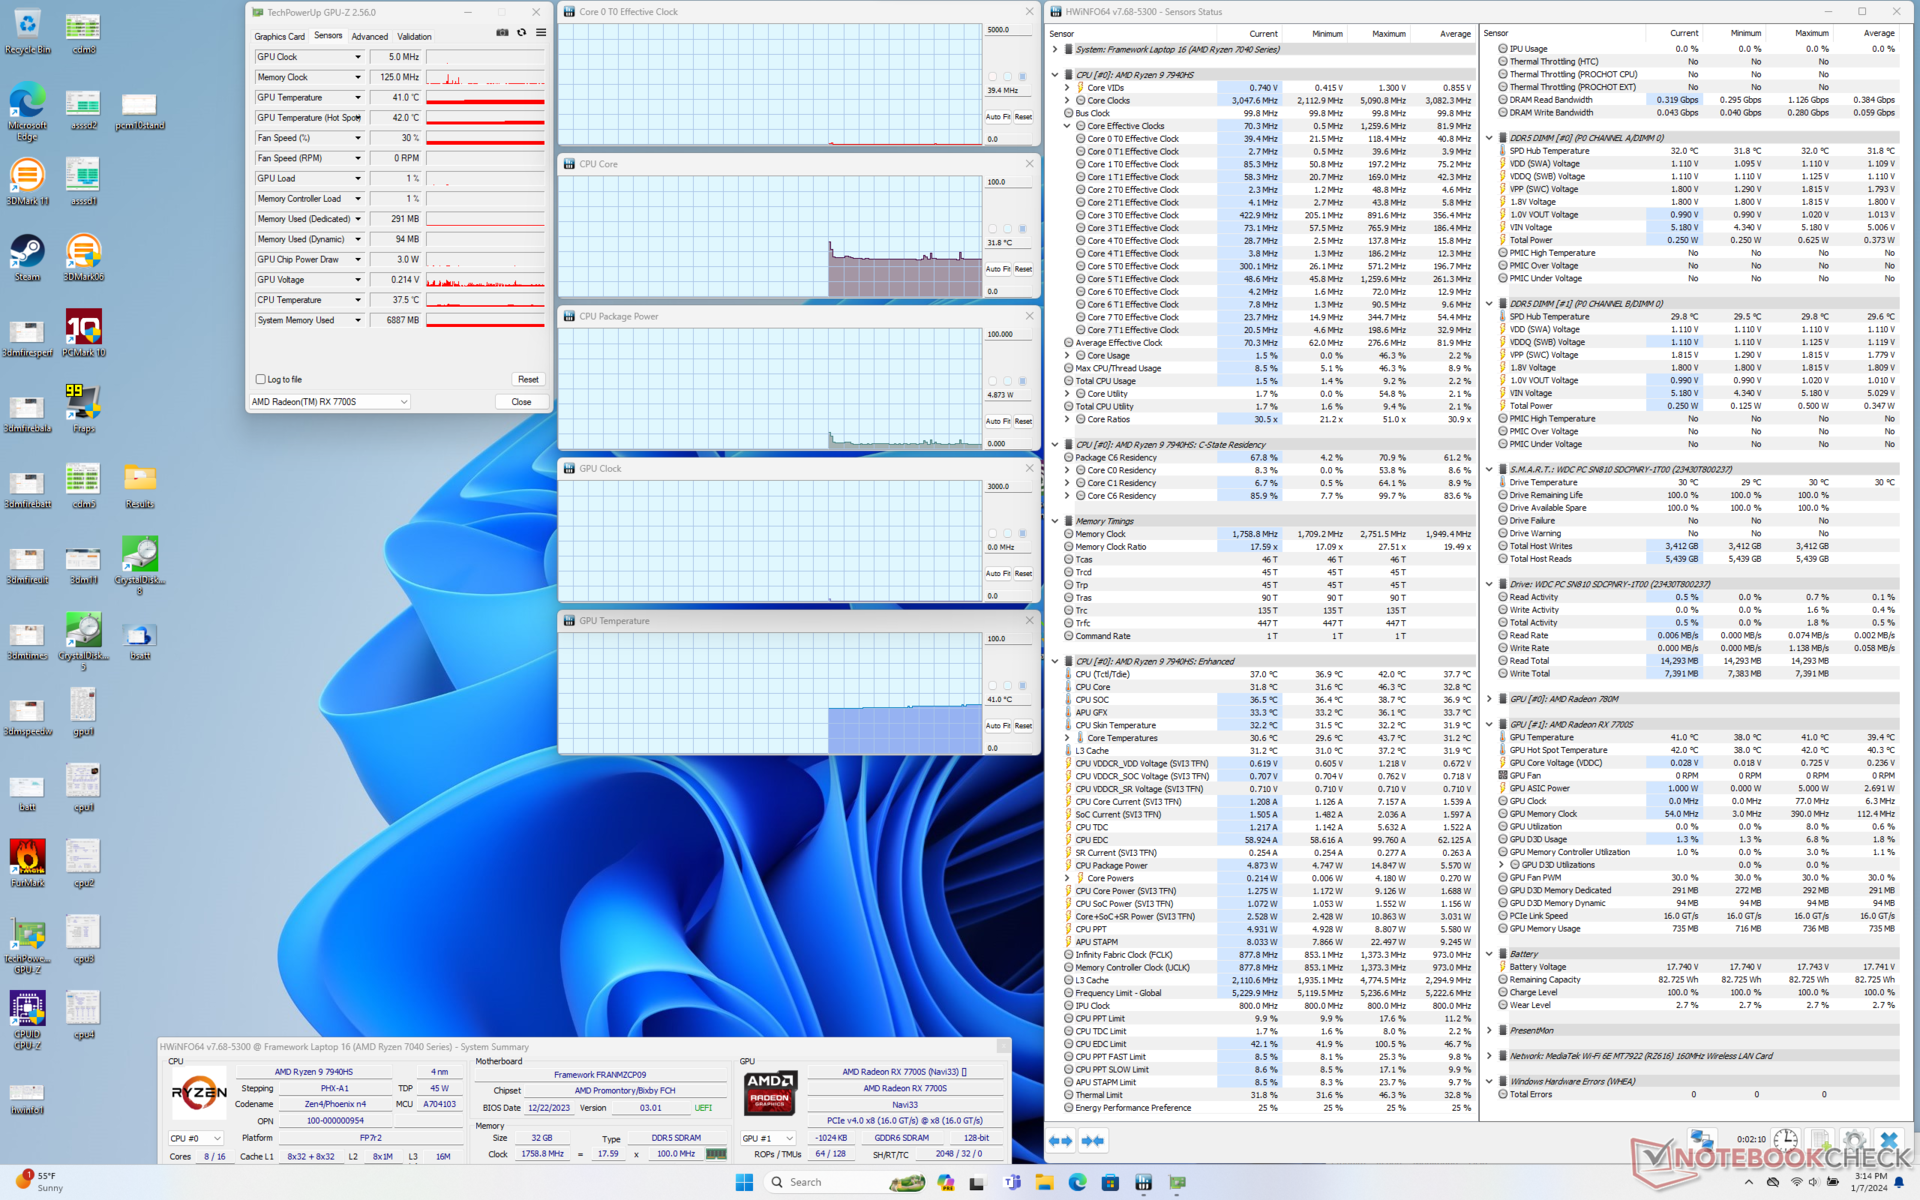
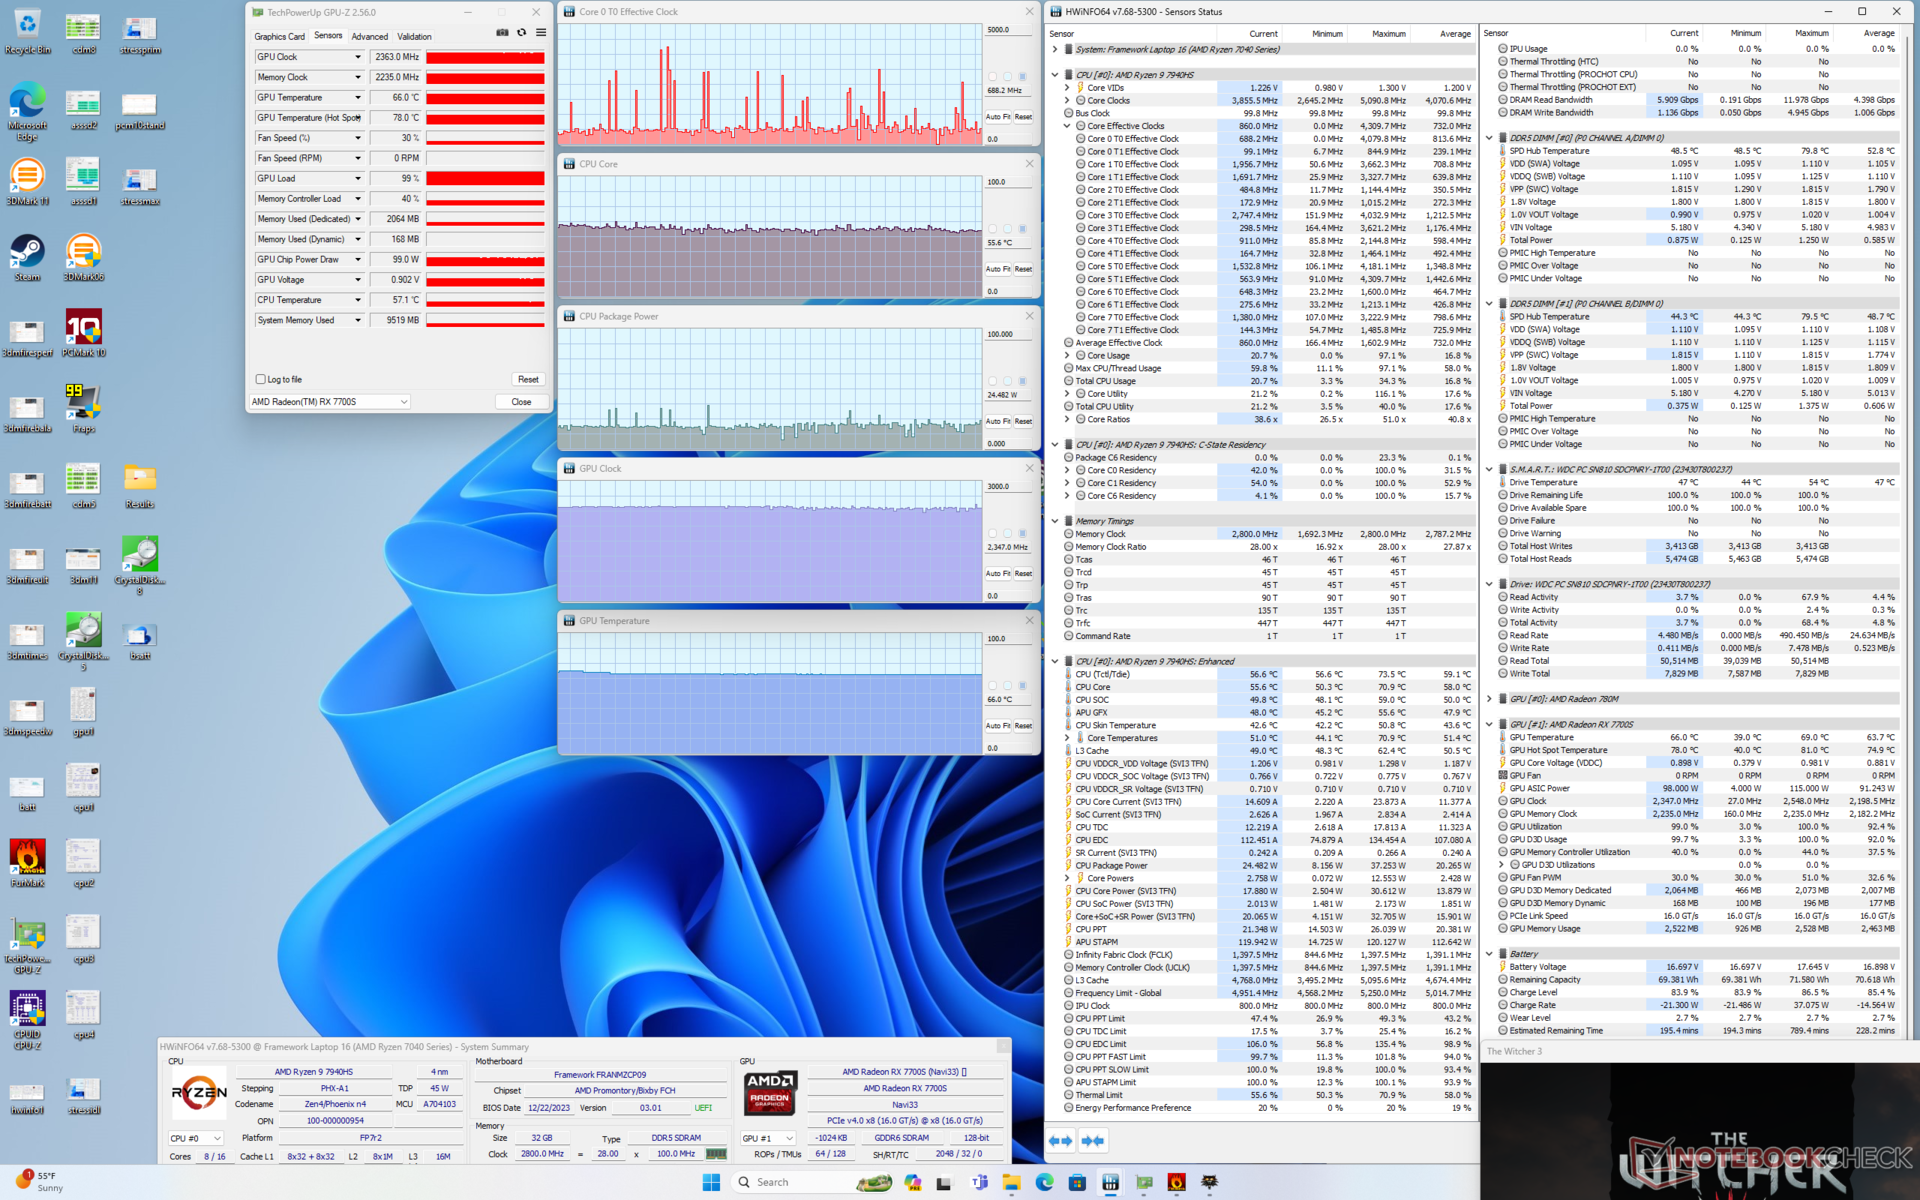
| Horloge du CPU (GHz) | Horloge du GPU (MHz) | Température moyenne du CPU (°C) | Température moyenne du GPU (°C) | |
| Système au repos | -- | -- | 32 | 41 |
| Prime95 Stress | 4.0 | -- | 96 | 30 |
| Prime95 + FurMark Stress | 4.0 | 1200 | 100 | 53 |
| Witcher 3 Stress | ~0.7 | 2363 | 56 | 66 |
Intervenants
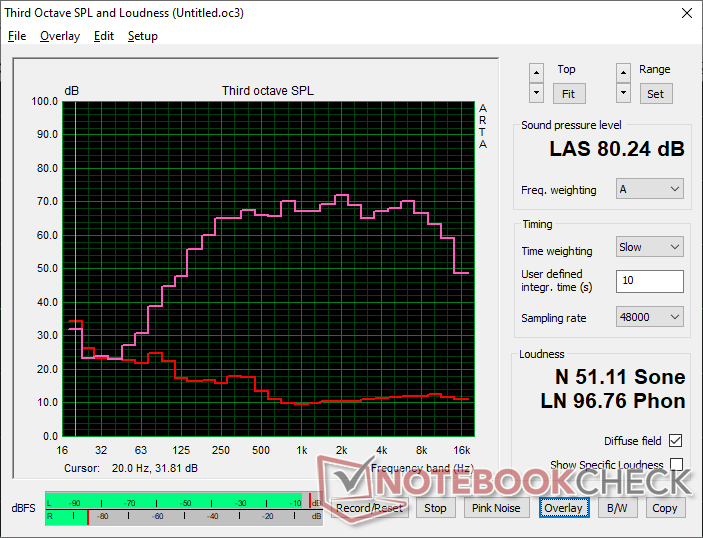
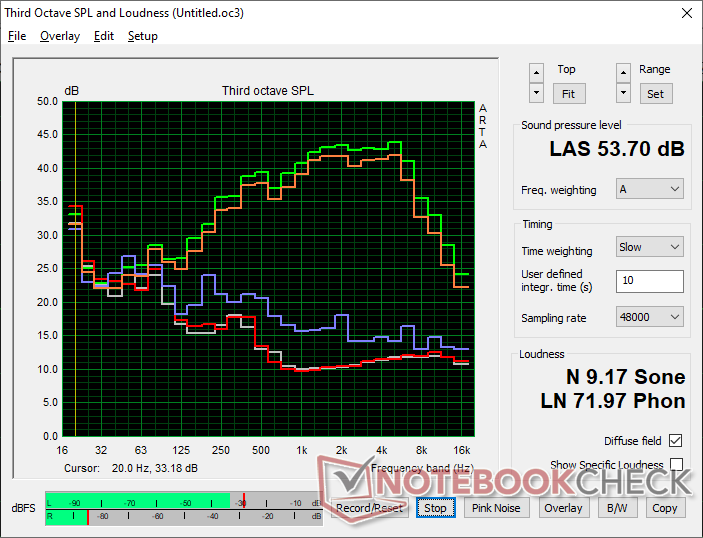
Framework Laptop 16 analyse audio
(±) | le niveau sonore du haut-parleur est moyen mais bon (80.2# dB)
Basses 100 - 315 Hz
(±) | basse réduite - en moyenne 9.6% inférieure à la médiane
(±) | la linéarité des basses est moyenne (8.1% delta à la fréquence précédente)
Médiums 400 - 2000 Hz
(+) | médiane équilibrée - seulement 2.2% de la médiane
(+) | les médiums sont linéaires (3.8% delta à la fréquence précédente)
Aiguës 2 - 16 kHz
(+) | des sommets équilibrés - à seulement 2% de la médiane
(+) | les aigus sont linéaires (4.9% delta à la fréquence précédente)
Globalement 100 - 16 000 Hz
(+) | le son global est linéaire (10.5% différence à la médiane)
Par rapport à la même classe
» 16% de tous les appareils testés de cette catégorie étaient meilleurs, 1% similaires, 83% pires
» Le meilleur avait un delta de 5%, la moyenne était de 17%, le pire était de 45%.
Par rapport à tous les appareils testés
» 5% de tous les appareils testés étaient meilleurs, 1% similaires, 93% pires
» Le meilleur avait un delta de 4%, la moyenne était de 23%, le pire était de 134%.
Apple MacBook Pro 16 2021 M1 Pro analyse audio
(+) | les haut-parleurs peuvent jouer relativement fort (84.7# dB)
Basses 100 - 315 Hz
(+) | bonne basse - seulement 3.8% loin de la médiane
(+) | les basses sont linéaires (5.2% delta à la fréquence précédente)
Médiums 400 - 2000 Hz
(+) | médiane équilibrée - seulement 1.3% de la médiane
(+) | les médiums sont linéaires (2.1% delta à la fréquence précédente)
Aiguës 2 - 16 kHz
(+) | des sommets équilibrés - à seulement 1.9% de la médiane
(+) | les aigus sont linéaires (2.7% delta à la fréquence précédente)
Globalement 100 - 16 000 Hz
(+) | le son global est linéaire (4.6% différence à la médiane)
Par rapport à la même classe
» 0% de tous les appareils testés de cette catégorie étaient meilleurs, 0% similaires, 100% pires
» Le meilleur avait un delta de 5%, la moyenne était de 17%, le pire était de 45%.
Par rapport à tous les appareils testés
» 0% de tous les appareils testés étaient meilleurs, 0% similaires, 100% pires
» Le meilleur avait un delta de 4%, la moyenne était de 23%, le pire était de 134%.
Gestion de l'énergie
Consommation électrique
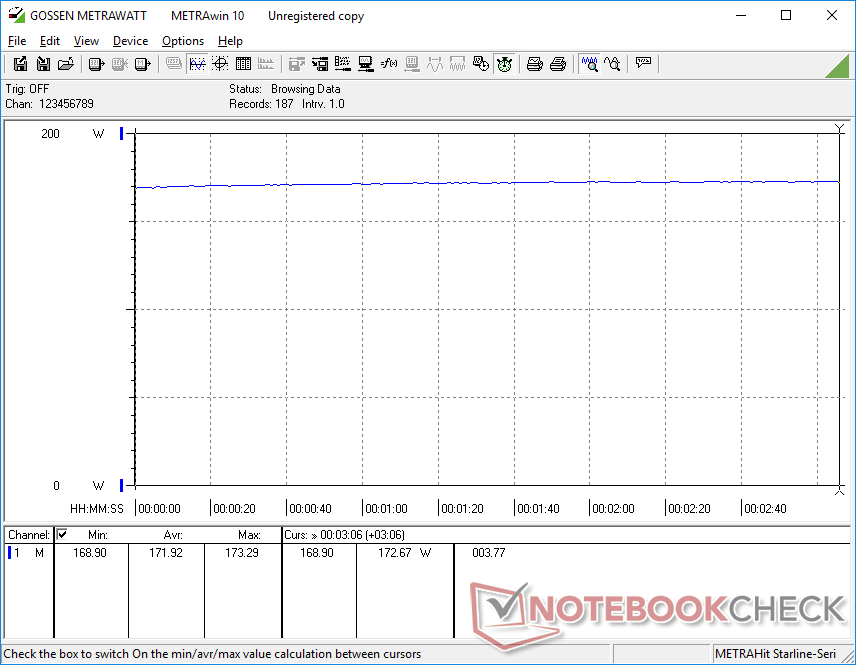
La consommation d'énergie est comparable à celle du Dell Inspiron 16 Plus ou du MacBook Pro 16 2023 lorsqu'il tourne au ralenti ou lorsqu'il exécute des charges peu exigeantes. En revanche, lorsque vous utilisez des charges plus importantes, comme des jeux, la consommation est plus élevée que prévu. En effet, l'exécution de Witcher 3 demande 172 W contre 122 W pour l'Inspiron 16 Plus équipé de la RTX 4060. Si l'on considère que la RTX 4060 peut fréquemment surpasser la Radeon RX 7700S dans de nombreux jeux, la performance GPU par watt du Laptop 16 n'est tout simplement pas aussi bonne que l'alternative de Nvidia, ce qui confirme nos affirmations ci-dessus.
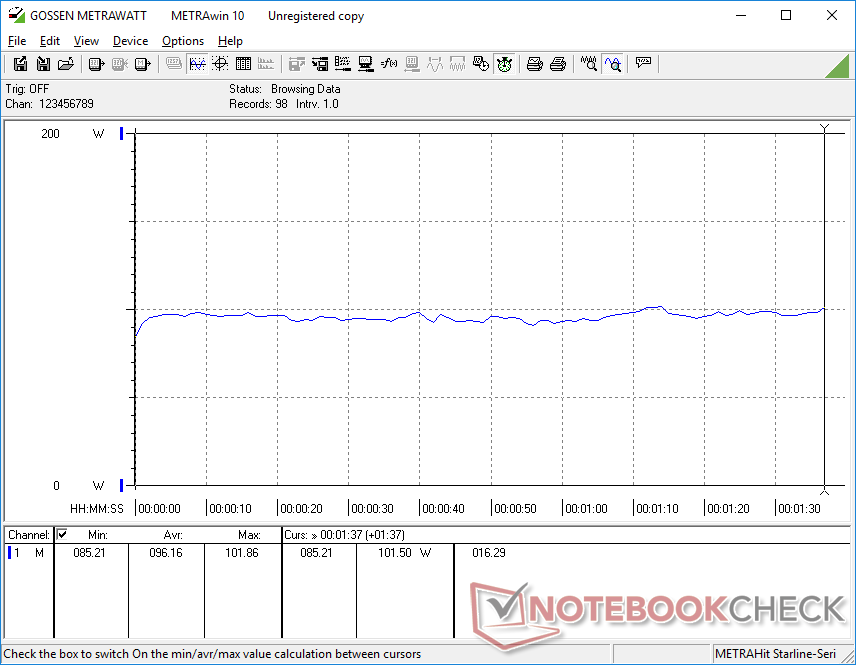
Le CPU peut également être assez exigeant avec une consommation de 110 W pour l'ensemble du système lors de l'exécution de Prime95, contre seulement 75 W sur le MSI Stealth 16 équipé d'un Core i9-13900H.
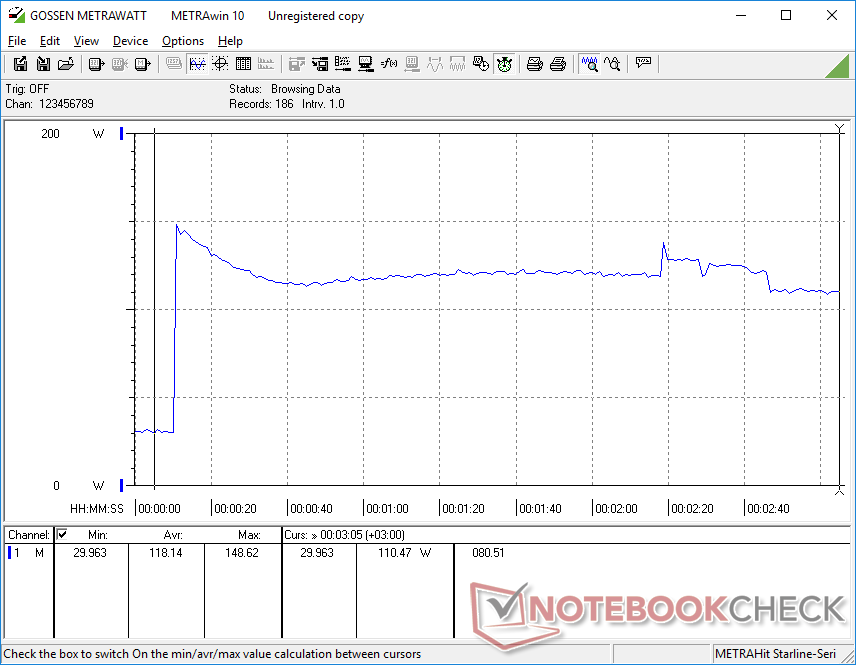
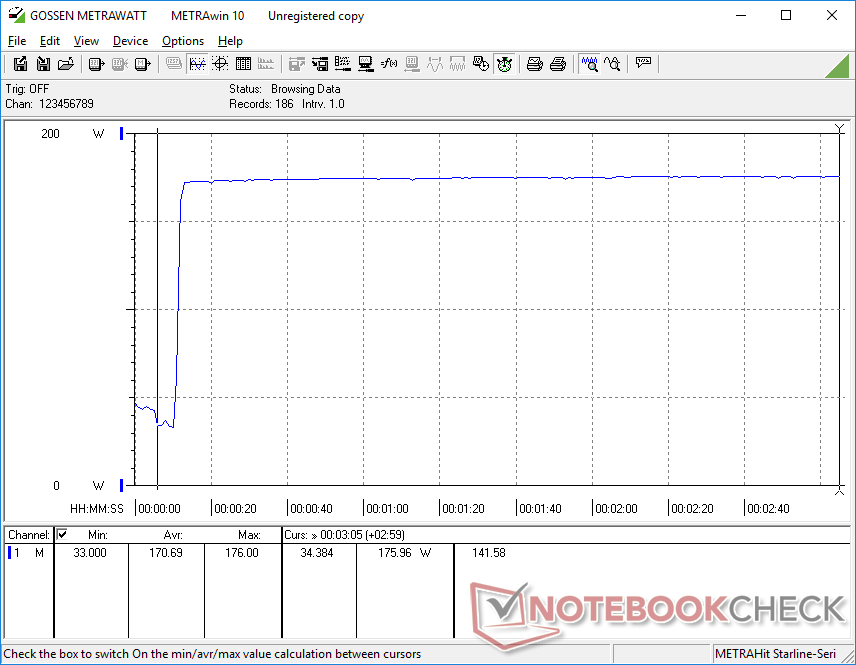
Nous sommes en mesure d'enregistrer une consommation maximale de 176 W à partir du petit adaptateur secteur USB-C de 180 W lors de l'exécution de jeux ou d'autres charges extrêmes comme Prime95 et FurMark. Il est important de le noter, car la surcharge limitée de l'adaptateur secteur peut bloquer les performances ou les capacités de charge de l'ordinateur portable. Dans ce cas, le taux de charge est affecté lors de l'exécution de charges exigeantes. Par exemple, nous pouvons observer que la batterie passe de 100 % à 85 % lorsqu'elle est connectée à une prise de courant et que l'ordinateur est en marche Witcher 3 ce qui signifie qu'il n'est pas possible de charger la batterie à un taux décent tout en exécutant simultanément des charges exigeantes. Un tel scénario ne se produirait jamais sur la plupart des autres ordinateurs portables.
| Éteint/en veille | |
| Au repos | |
| Fortement sollicité |
|
Légende:
min: | |
| Framework Laptop 16 R9 7940HS, Radeon RX 7700S, WDC PC SN810 1TB, , 2560x1600, 16" | MSI Prestige 16 B1MG-001US Ultra 7 155H, Arc 8-Core, Samsung PM9A1 MZVL22T0HBLB, IPS, 2560x1600, 16" | Lenovo ThinkPad Z16 Gen 2 R9 PRO 7940HS, Radeon RX 6550M, Kioxia XG8 KXG8AZNV1T02, OLED, 3840x2400, 16" | Apple MacBook Pro 16 2023 M3 Max Apple M3 Max 16-Core, M3 Max 40-Core GPU, Apple SSD AP8192Z, Mini-LED, 3456x2234, 16" | Dell Inspiron 16 Plus 7630 i7-13700H, GeForce RTX 4060 Laptop GPU, WD PC SN740 SDDPTQD-1T00, IPS, 2560x1600, 16" | HP Spectre x360 2-in-1 16-f1075ng i7-12700H, Iris Xe G7 96EUs, SK Hynix PC711 1TB HFS001TDE9X073N, IPS, 3072x1920, 16" | |
|---|---|---|---|---|---|---|
| Power Consumption | 46% | 26% | 18% | -5% | 40% | |
| Idle Minimum * (Watt) | 9.5 | 3 68% | 7.5 21% | 5.2 45% | 15.6 -64% | 9 5% |
| Idle Average * (Watt) | 17 | 9.5 44% | 9.6 44% | 16.9 1% | 17.7 -4% | 11.1 35% |
| Idle Maximum * (Watt) | 17.2 | 12 30% | 18.5 -8% | 17.2 -0% | 20.6 -20% | 16.4 5% |
| Load Average * (Watt) | 96.2 | 68.3 29% | 57.1 41% | 90.5 6% | 87.4 9% | 38.3 60% |
| Witcher 3 ultra * (Watt) | 171.9 | 59.8 65% | 115.8 33% | 109 37% | 121.7 29% | 34.4 80% |
| Load Maximum * (Watt) | 175.7 | 104.8 40% | 131.7 25% | 145.2 17% | 138 21% | 82.5 53% |
* ... Moindre est la valeur, meilleures sont les performances
Power Consumption Witcher 3 / Stresstest
Power Consumption external Monitor
Autonomie de la batterie
L'autonomie de la batterie de 85 Wh est respectable, avec un peu plus de 9 heures de navigation WLAN en conditions réelles, ce qui la rend similaire à celle de l'Inspiron Plus 7600 de Dell Dell Inspiron 16 Plus 7630 ou HP Spectre x360 2-en-1. Nous vous recommandons de régler l'écran sur une fréquence de rafraîchissement variable au lieu de la fréquence fixe par défaut de 165 Hz afin d'optimiser l'utilisation de la batterie. Avec le réglage dynamique de 83 Hz à 165 Hz, par exemple, le même test WLAN nous permet de tenir 20 minutes de plus. La plupart des smartphones utilisent cette même technique pour économiser la batterie.
La recharge de la batterie vide à la batterie pleine avec l'adaptateur secteur fourni prend environ 2 heures si l'ordinateur tourne au ralenti sur le bureau ou s'il exécute des charges peu exigeantes. En revanche, si vous utilisez des charges plus extrêmes, la batterie se chargera beaucoup plus lentement, comme indiqué ci-dessus. Un adaptateur secteur USB-C plus grand de 240 W aurait potentiellement pu résoudre ce problème.
| Framework Laptop 16 R9 7940HS, Radeon RX 7700S, 85 Wh | MSI Prestige 16 B1MG-001US Ultra 7 155H, Arc 8-Core, 99.9 Wh | Lenovo ThinkPad Z16 Gen 2 R9 PRO 7940HS, Radeon RX 6550M, 72 Wh | Apple MacBook Pro 16 2023 M3 Max Apple M3 Max 16-Core, M3 Max 40-Core GPU, 99.6 Wh | Dell Inspiron 16 Plus 7630 i7-13700H, GeForce RTX 4060 Laptop GPU, 86 Wh | HP Spectre x360 2-in-1 16-f1075ng i7-12700H, Iris Xe G7 96EUs, 83 Wh | |
|---|---|---|---|---|---|---|
| Autonomie de la batterie | 86% | -17% | 32% | 5% | 20% | |
| Reader / Idle (h) | 14.8 | 25.1 70% | 10.2 -31% | 17.6 19% | 20.6 39% | |
| WiFi v1.3 (h) | 9.1 | 18.3 101% | 6 -34% | 16.7 84% | 9.4 3% | 10.5 15% |
| Load (h) | 1.5 | 2.8 87% | 1.7 13% | 1.2 -20% | 1.4 -7% | 1.6 7% |
| H.264 (h) | 20.4 | 11.2 |
Points positifs
Points négatifs
Verdict - Plus de réparabilité signifie plus de taille et de poids
La tendance à l'amincissement et à l'allègement des ordinateurs portables est rendue possible par la fusion d'un nombre croissant de composants sur la carte mère. Le principal inconvénient de cette approche est qu'elle limite la réparabilité, car même un petit défaut peut nécessiter le remplacement de cartes entières. Framework est l'un des seuls fabricants à regarder dans l'autre sens pour tenter d'améliorer la personnalisation et l'entretien par l'utilisateur final. Il ne fait aucun doute que le Laptop 16 est plus facile à entretenir que n'importe quelle autre solution, mais cette caractéristique lucrative se fait au prix de la taille et du poids, car les composants individuels doivent être facilement remplaçables. Si vous n'avez l'intention de mettre à niveau la RAM ou le SSD qu'une ou deux fois au cours de la durée de vie d'un ordinateur portable, des solutions plus compactes et plus faciles à transporter comme l' Inspiron 16 Plus ou Asus VivoBook Pro 16 vous conviendront mieux à cet égard.
Le dGPU amovible est également une entreprise risquée, car il a toujours été un échec pour les grands constructeurs comme Dell et Lenovo. Le fait qu'il existe des options eGPU universelles basées sur l'USB4 ou le Thunderbolt rend le dGPU spécialisé du Laptop 16 encore moins convaincant. Si vous voulez vraiment des graphiques discrets pour la route, la RTX 4060 de GeForce peut offrir à la fois de meilleures performances et un meilleur rendement par watt que la Radeon 7700S. Framework devra donc soutenir la conception du Laptop 16 dGPU pendant des années avec de futures options RDNA pour que l'investissement en vaille la peine. En achetant aujourd'hui, vous ferez confiance à l'entreprise pour cela.
Le Framework Laptop 16 est plus grand et plus lourd que les autres ordinateurs portables de 16 pouces au nom de la réparabilité et de la durabilité. Si vous effectuez souvent des mises à jour ou prévoyez des réparations, le Laptop 16 peut être intéressant. Dans le cas contraire, les alternatives proposées par les grands constructeurs sont généralement plus rapides et plus légères.
Pour les raisons évoquées ci-dessus, les acheteurs intéressés devraient apprécier les cartes d'extension, la durabilité et la facilité de réparation du girthy Laptop 16, car les alternatives ont tendance à être plus minces, plus légères et parfois plus rapides, en particulier dans la gamme des 2 000 $. Si Framework peut d'une manière ou d'une autre égaler la taille du Razer Blade 16 ou du MacBook Pro tout en restant réparable, alors les futures révisions pourront potentiellement devenir quelque chose de très spécial. Pour l'instant, vous devrez sacrifier un peu de portabilité pour profiter de toutes les fonctionnalités uniques du Framework.
Prix et disponibilité
Framework accepte dès à présent les précommandes pour le Laptop 16 à partir de $1400 USD pour l'édition Ryzen 7 DIY de base jusqu'à plus de $2400 lorsqu'il est configuré avec Ryzen 9, des cartes graphiques discrètes Radeon 7700S, et de multiples cartes d'extension et modules.
Framework Laptop 16
- 01/23/2024 v7 (old)
Allen Ngo
Transparency
La sélection des appareils à examiner est effectuée par notre équipe éditoriale. L'échantillon de test a été prêté à l'auteur par le fabricant ou le détaillant pour les besoins de cet examen. Le prêteur n'a pas eu d'influence sur cette évaluation et le fabricant n'a pas reçu de copie de cette évaluation avant sa publication. Il n'y avait aucune obligation de publier cet article. En tant que média indépendant, Notebookcheck n'est pas soumis à l'autorité des fabricants, des détaillants ou des éditeurs.
Voici comment Notebookcheck teste
Chaque année, Notebookcheck examine de manière indépendante des centaines d'ordinateurs portables et de smartphones en utilisant des procédures standardisées afin de garantir que tous les résultats sont comparables. Nous avons continuellement développé nos méthodes de test depuis environ 20 ans et avons établi des normes industrielles dans le processus. Dans nos laboratoires de test, des équipements de mesure de haute qualité sont utilisés par des techniciens et des rédacteurs expérimentés. Ces tests impliquent un processus de validation en plusieurs étapes. Notre système d'évaluation complexe repose sur des centaines de mesures et de points de référence bien fondés, ce qui garantit l'objectivité.Price comparison

