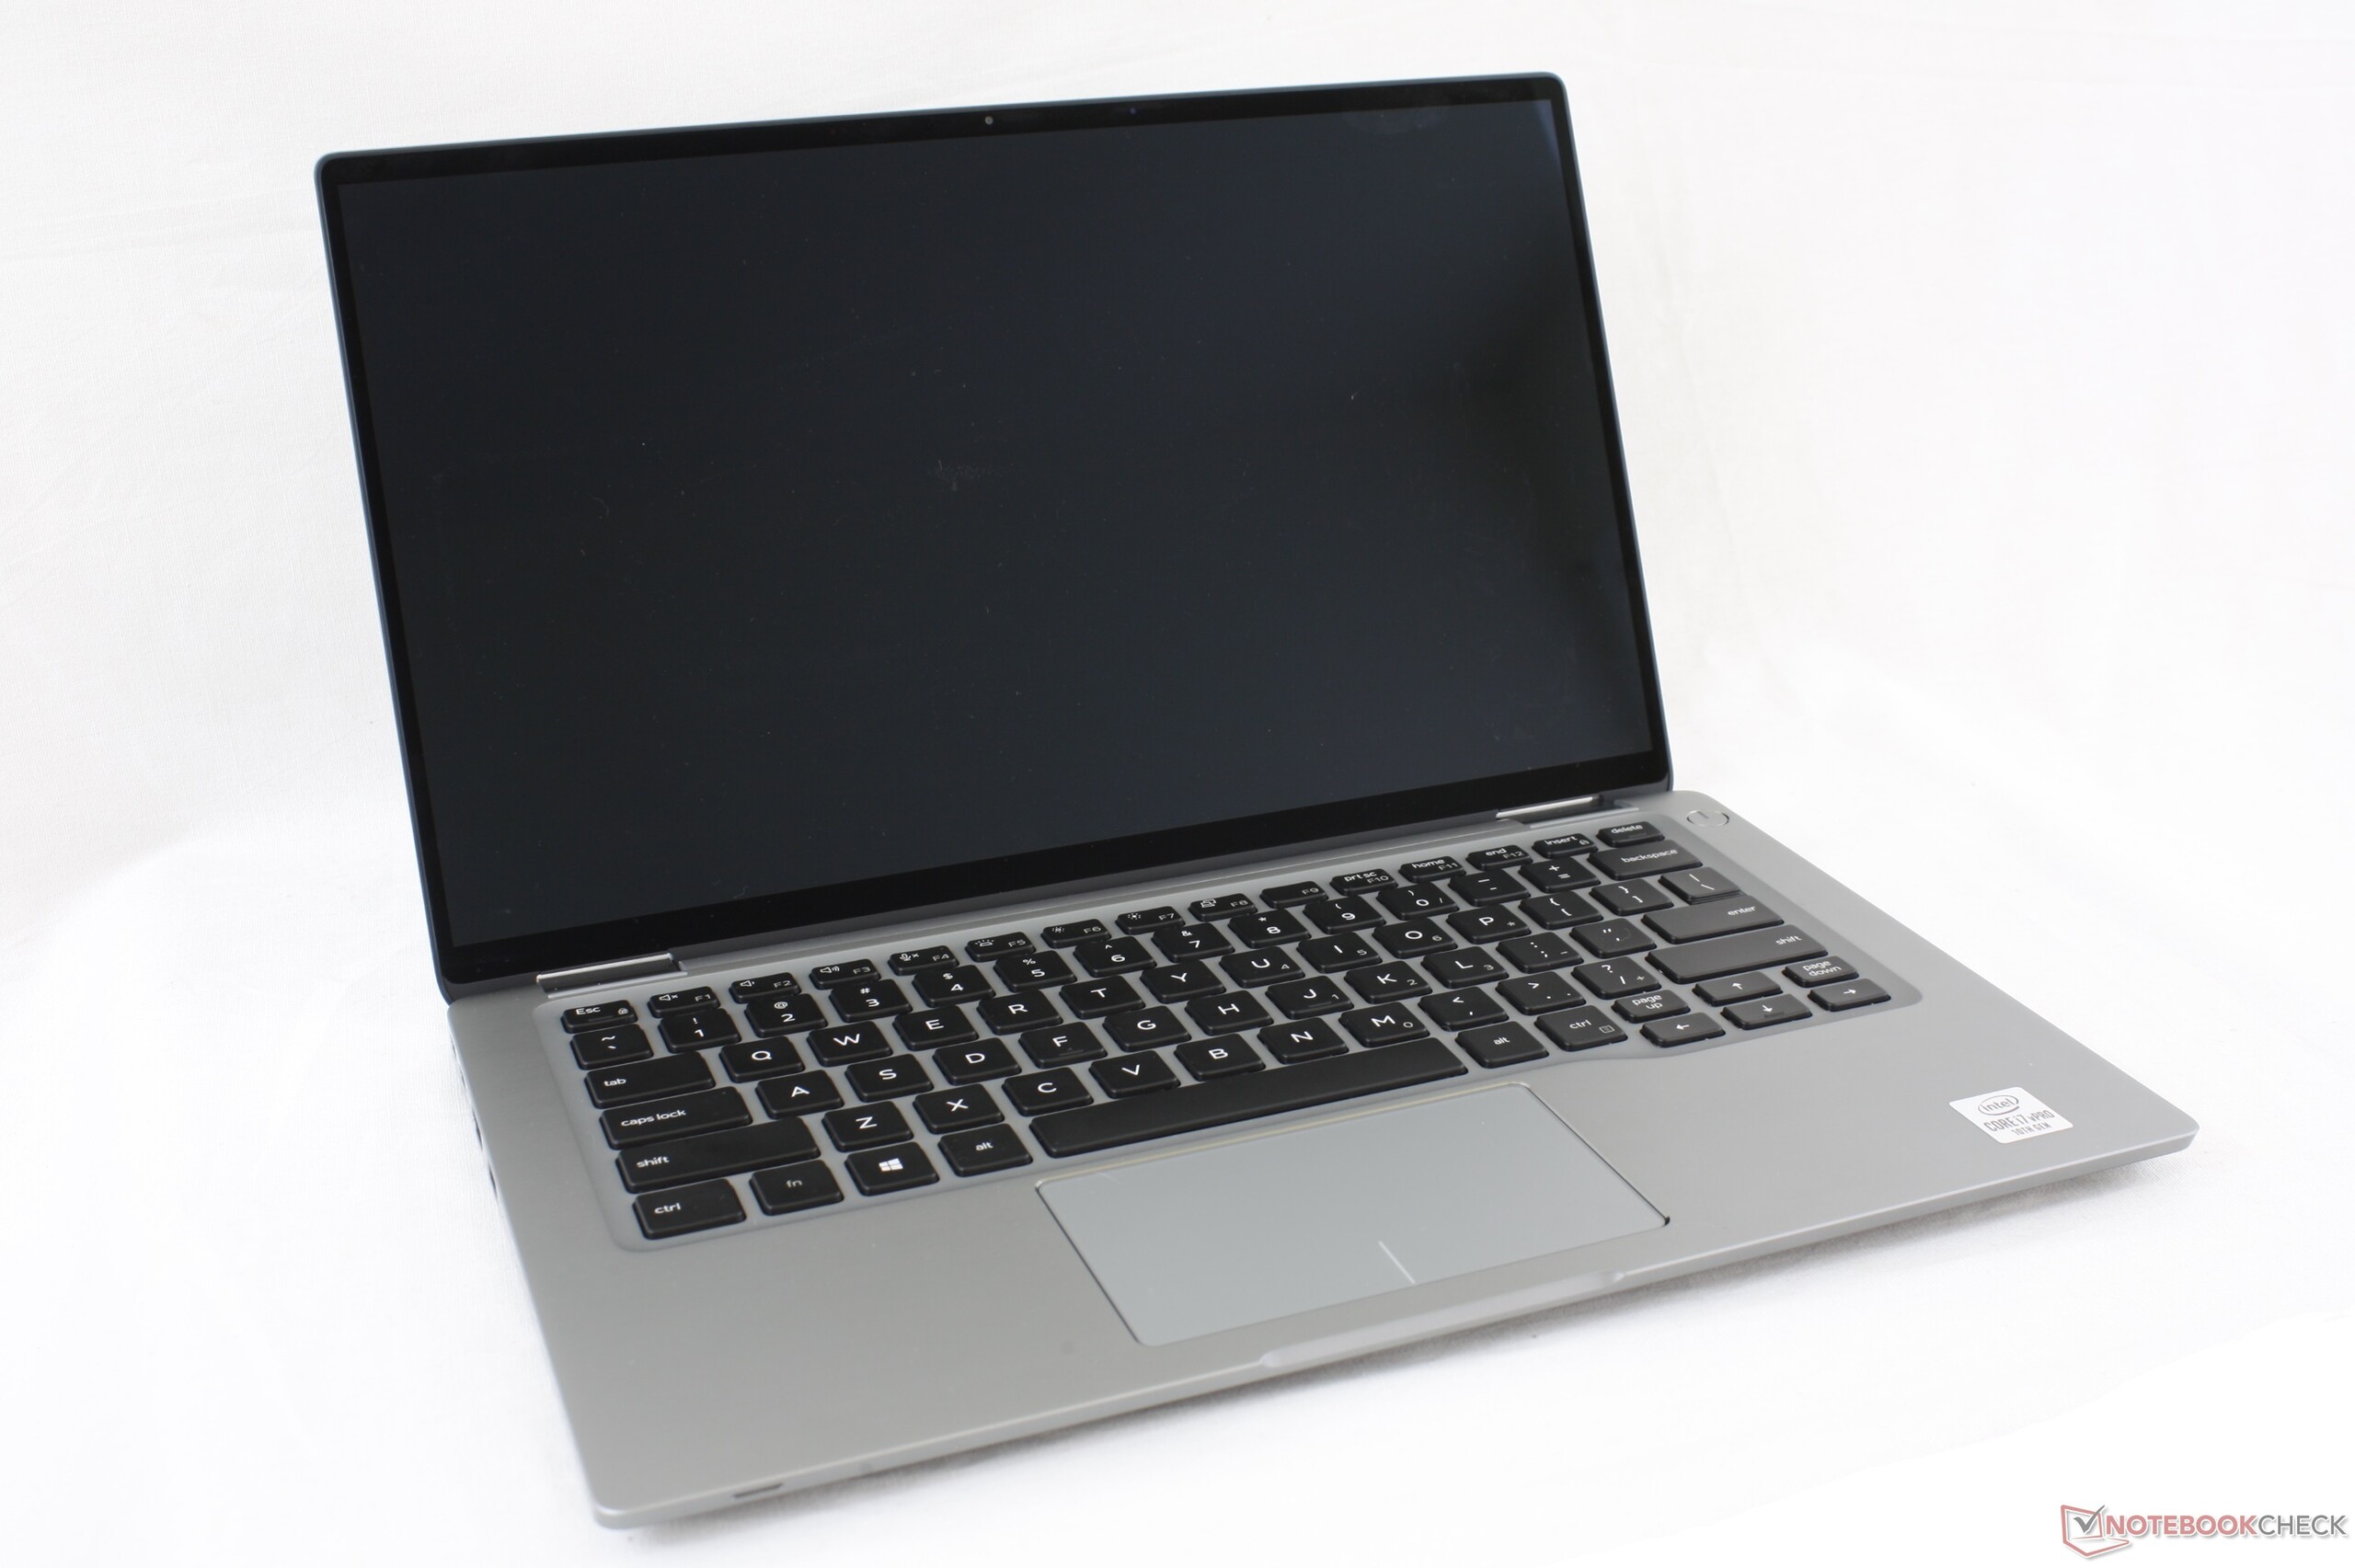
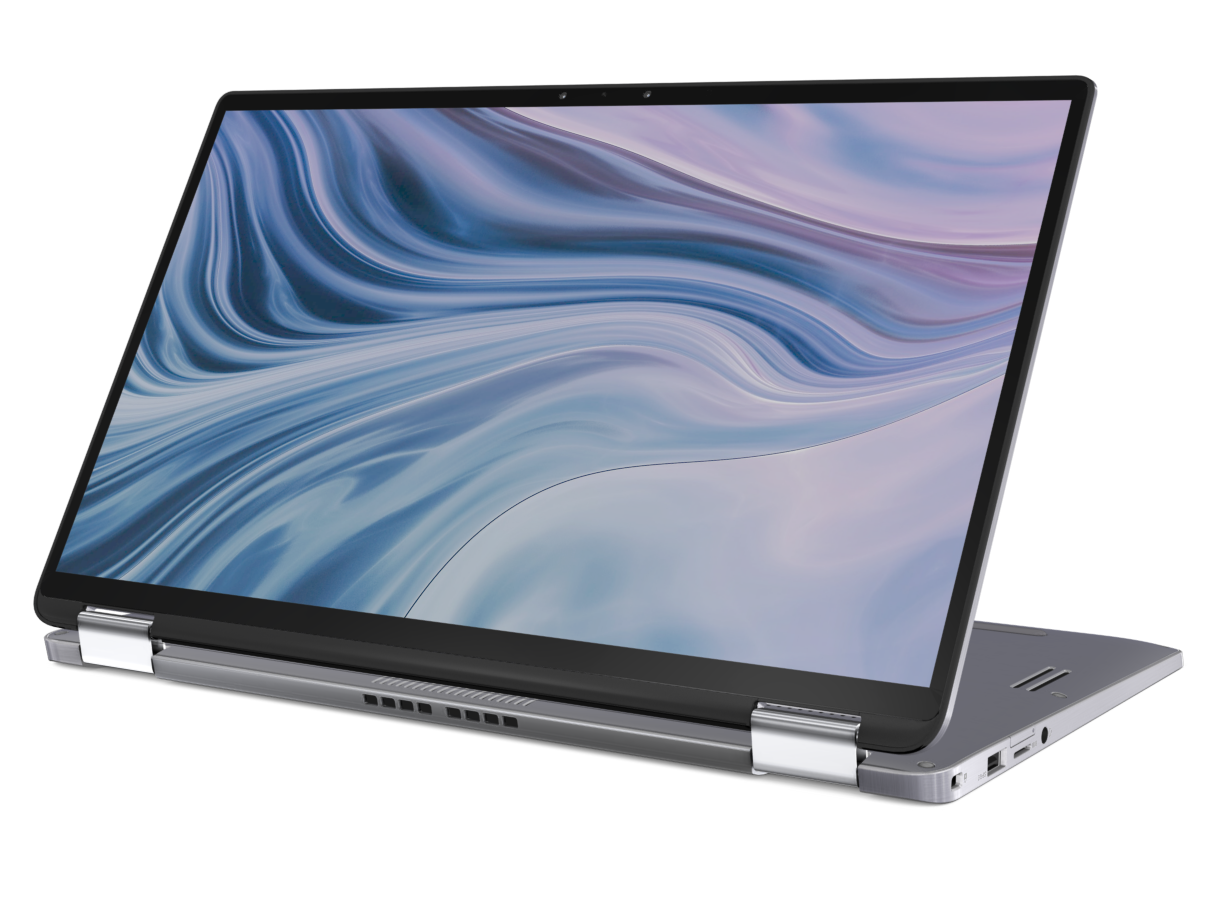
Test du Dell Latitude 14 9410 2-en-1 (i7-10610U, UHD 620, FHD) : un convertible avec le Latitude 7400 comme modèle
Note | Date | Modèle | Poids | Épaisseur | Taille | Résolution | Prix |
|---|---|---|---|---|---|---|---|
| 88.7 % v7 (old) | 09/20 | Dell Latitude 14 9410 2-in-1 P110G i7-10610U, UHD Graphics 620 | 1.5 kg | 14.89 mm | 14.00" | 1920x1080 | |
| 88.2 % v7 (old) | 10/19 | Lenovo Yoga C940-14IIL i7-1065G7, Iris Plus Graphics G7 (Ice Lake 64 EU) | 1.4 kg | 14.95 mm | 14.00" | 1920x1080 | |
| 81.2 % v7 (old) | 05/20 | LG Gram 14T90N i7-10510U, UHD Graphics 620 | 1.2 kg | 18 mm | 14.00" | 1920x1080 | |
| 90.5 % v7 (old) | 02/19 | HP Elitebook x360 1040 G5 i7-8650U, UHD Graphics 620 | 1.4 kg | 16.9 mm | 14.00" | 1920x1080 | |
| 87.8 % v7 (old) | 07/19 | Dell Latitude 7400 2-in-1 i7-8665U, UHD Graphics 620 | 1.5 kg | 15 mm | 14.00" | 1920x1080 | |
| 85 % v7 (old) | 07/20 | Asus ZenBook Flip 14 UX463FA-AI039T i5-10210U, UHD Graphics 620 | 1.4 kg | 18 mm | 14.00" | 1920x1080 |
| SD Card Reader | |
| average JPG Copy Test (av. of 3 runs) | |
| Dell Latitude 14 9410 2-in-1 P110G (Toshiba Exceria Pro M501 64 GB UHS-II) | |
| Dell Latitude 7400 2-in-1 (Toshiba Exceria Pro M501 UHS-II) | |
| LG Gram 14T90N (Toshiba Exceria Pro M501 64 GB UHS-II) | |
| Asus ZenBook Flip 14 UX463FA-AI039T (Toshiba Exceria Pro M501 microSDXC 64GB) | |
| maximum AS SSD Seq Read Test (1GB) | |
| Dell Latitude 7400 2-in-1 (Toshiba Exceria Pro M501 UHS-II) | |
| Dell Latitude 14 9410 2-in-1 P110G (Toshiba Exceria Pro M501 64 GB UHS-II) | |
| LG Gram 14T90N (Toshiba Exceria Pro M501 64 GB UHS-II) | |
| Asus ZenBook Flip 14 UX463FA-AI039T (Toshiba Exceria Pro M501 microSDXC 64GB) | |


| |||||||||||||||||||||||||
Homogénéité de la luminosité: 92 %
Valeur mesurée au centre, sur batterie: 293.4 cd/m²
Contraste: 1544:1 (Valeurs des noirs: 0.19 cd/m²)
ΔE ColorChecker Calman: 1.29 | ∀{0.5-29.43 Ø4.72}
calibrated: 0.88
ΔE Greyscale Calman: 1.7 | ∀{0.09-98 Ø4.97}
99.1% sRGB (Argyll 1.6.3 3D)
63.8% AdobeRGB 1998 (Argyll 1.6.3 3D)
69.4% AdobeRGB 1998 (Argyll 3D)
99.2% sRGB (Argyll 3D)
68.1% Display P3 (Argyll 3D)
Gamma: 2.18
CCT: 6394 K
| Dell Latitude 14 9410 2-in-1 P110G Sharp LQ140M1, IPS, 14", 1920x1080 | Lenovo Yoga C940-14IIL LP140WF9-SPE2, IPS LED, 14", 1920x1080 | LG Gram 14T90N LG Philips LP140WFA-SPY1, IPS, 14", 1920x1080 | HP Elitebook x360 1040 G5 AU Optronics AUO533D, IPS, 14", 1920x1080 | Dell Latitude 7400 2-in-1 SHP14A2, IPS, 14", 1920x1080 | Asus ZenBook Flip 14 UX463FA-AI039T AU AUO323D, IPS, 14", 1920x1080 | |
|---|---|---|---|---|---|---|
| Display | -2% | -4% | -6% | 1% | -13% | |
| Display P3 Coverage (%) | 68.1 | 66 -3% | 65 -5% | 64.3 -6% | 68.6 1% | 60.1 -12% |
| sRGB Coverage (%) | 99.2 | 97.9 -1% | 95.7 -4% | 94.1 -5% | 99.6 0% | 85.5 -14% |
| AdobeRGB 1998 Coverage (%) | 69.4 | 67.3 -3% | 66.7 -4% | 65.5 -6% | 70 1% | 61.1 -12% |
| Response Times | 17% | 10% | -7% | 1% | 32% | |
| Response Time Grey 50% / Grey 80% * (ms) | 58.4 ? | 49.6 ? 15% | 54 ? 8% | 70.8 ? -21% | 56 ? 4% | 36 ? 38% |
| Response Time Black / White * (ms) | 37.2 ? | 30 ? 19% | 32.8 ? 12% | 34.4 ? 8% | 38 ? -2% | 28 ? 25% |
| PWM Frequency (Hz) | 1667 ? | 735 ? | 1667 ? | |||
| Screen | -27% | -45% | -32% | -26% | -69% | |
| Brightness middle (cd/m²) | 293.4 | 384 31% | 322.2 10% | 416.3 42% | 277.2 -6% | 280 -5% |
| Brightness (cd/m²) | 290 | 363 25% | 301 4% | 400 38% | 263 -9% | 286 -1% |
| Brightness Distribution (%) | 92 | 90 -2% | 86 -7% | 89 -3% | 83 -10% | 78 -15% |
| Black Level * (cd/m²) | 0.19 | 0.17 11% | 0.25 -32% | 0.29 -53% | 0.2 -5% | 0.208 -9% |
| Contrast (:1) | 1544 | 2259 46% | 1289 -17% | 1436 -7% | 1386 -10% | 1346 -13% |
| Colorchecker dE 2000 * | 1.29 | 3.5 -171% | 3.62 -181% | 2.69 -109% | 2.1 -63% | 3.97 -208% |
| Colorchecker dE 2000 max. * | 3.61 | 5.5 -52% | 6.9 -91% | 4.95 -37% | 5.91 -64% | 8.29 -130% |
| Colorchecker dE 2000 calibrated * | 0.88 | 1 -14% | 1.22 -39% | 2.13 -142% | 1.03 -17% | 3.42 -289% |
| Greyscale dE 2000 * | 1.7 | 4.6 -171% | 3.9 -129% | 2.9 -71% | 3.4 -100% | 2.83 -66% |
| Gamma | 2.18 101% | 2.32 95% | 2.43 91% | 2.4 92% | 2.241 98% | 2.34 94% |
| CCT | 6394 102% | 6884 94% | 6344 102% | 6623 98% | 6030 108% | 6556 99% |
| Color Space (Percent of AdobeRGB 1998) (%) | 63.8 | 62 -3% | 61.3 -4% | 60.1 -6% | 64 0% | 56 -12% |
| Color Space (Percent of sRGB) (%) | 99.1 | 97.7 -1% | 95.6 -4% | 94.5 -5% | 100 1% | 85 -14% |
| Moyenne finale (programmes/paramètres) | -4% /
-17% | -13% /
-30% | -15% /
-24% | -8% /
-17% | -17% /
-46% |
* ... Moindre est la valeur, meilleures sont les performances
Temps de réponse de l'écran
| ↔ Temps de réponse noir à blanc | ||
|---|---|---|
| 37.2 ms ... hausse ↗ et chute ↘ combinées | ↗ 18.4 ms hausse | 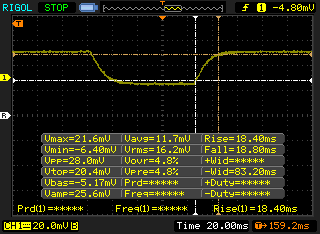 |
| ↘ 18.8 ms chute | ||
| L'écran souffre de latences très élevées, à éviter pour le jeu. En comparaison, tous les appareils testés affichent entre 0.1 (minimum) et 240 (maximum) ms. » 95 % des appareils testés affichent de meilleures performances. Cela signifie que les latences relevées sont moins bonnes que la moyenne (19.9 ms) de tous les appareils testés. | ||
| ↔ Temps de réponse gris 50% à gris 80% | ||
| 58.4 ms ... hausse ↗ et chute ↘ combinées | ↗ 26 ms hausse | 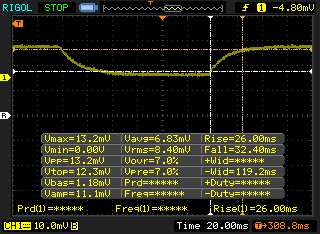 |
| ↘ 32.4 ms chute | ||
| L'écran souffre de latences très élevées, à éviter pour le jeu. En comparaison, tous les appareils testés affichent entre 0.165 (minimum) et 636 (maximum) ms. » 95 % des appareils testés affichent de meilleures performances. Cela signifie que les latences relevées sont moins bonnes que la moyenne (31.1 ms) de tous les appareils testés. | ||
Scintillement / MLI (Modulation de largeur d'impulsion)
| Scintillement / MLI (Modulation de largeur d'impulsion) décelé | 1667 Hz | ≤ 44 Niveau de luminosité | 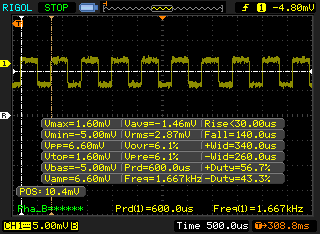 |
Le rétroéclairage de l'écran scintille à la fréquence de 1667 Hz (certainement du fait de l'utilisation d'une MDI - Modulation de largeur d'impulsion) à un niveau de luminosité inférieur ou égal à 44 % . Aucun scintillement ne devrait être perceptible au-dessus de cette valeur. La fréquence de rafraîchissement de 1667 Hz est élevée, la grande majorité des utilisateurs ne devrait pas percevoir de scintillements et être sujette à une fatigue oculaire accrue. En comparaison, 52 % des appareils testés n'emploient pas MDI pour assombrir leur écran. Nous avons relevé une moyenne à 7784 (minimum : 5 - maximum : 343500) Hz dans le cas où une MDI était active. | |||
Cinebench R15: CPU Multi 64Bit | CPU Single 64Bit
Blender: v2.79 BMW27 CPU
7-Zip 18.03: 7z b 4 -mmt1 | 7z b 4
Geekbench 5.5: Single-Core | Multi-Core
HWBOT x265 Benchmark v2.2: 4k Preset
LibreOffice : 20 Documents To PDF
R Benchmark 2.5: Overall mean
| Geekbench 5.5 / Single-Core | |
| LG Gram 14T90N | |
| Moyenne Intel Core i7-10610U (1155 - 1261, n=6) | |
| Acer TravelMate P6 P614-51T-G2-72ZU | |
| Dell Latitude 14 9410 2-in-1 P110G | |
| Asus VivoBook Flip 14 TM420IA | |
| Lenovo ThinkPad E14 Gen2-20T7S00W00 | |
| Lenovo ThinkPad T14s-20T00044GE | |
| Geekbench 5.5 / Multi-Core | |
| Asus VivoBook Flip 14 TM420IA | |
| Lenovo ThinkPad E14 Gen2-20T7S00W00 | |
| Acer TravelMate P6 P614-51T-G2-72ZU | |
| Moyenne Intel Core i7-10610U (3731 - 4622, n=6) | |
| Dell Latitude 14 9410 2-in-1 P110G | |
| Lenovo ThinkPad T14s-20T00044GE | |
| LG Gram 14T90N | |
| LibreOffice / 20 Documents To PDF | |
| Dell Latitude 14 9410 2-in-1 P110G | |
| Moyenne Intel Core i7-10610U (56.1 - 106, n=6) | |
| Lenovo ThinkPad E14 Gen2-20T7S00W00 | |
| LG Gram 14T90N | |
| Asus VivoBook Flip 14 TM420IA | |
| Acer TravelMate P6 P614-51T-G2-72ZU | |
| Lenovo ThinkPad T14s-20T00044GE | |
| R Benchmark 2.5 / Overall mean | |
| Dell Latitude 14 9410 2-in-1 P110G | |
| Lenovo ThinkPad T14s-20T00044GE | |
| Moyenne Intel Core i7-10610U (0.637 - 0.855, n=6) | |
| LG Gram 14T90N | |
| Acer TravelMate P6 P614-51T-G2-72ZU | |
| Lenovo ThinkPad E14 Gen2-20T7S00W00 | |
| Asus VivoBook Flip 14 TM420IA | |
Cinebench R15: CPU Multi 64Bit | CPU Single 64Bit
Blender: v2.79 BMW27 CPU
7-Zip 18.03: 7z b 4 -mmt1 | 7z b 4
Geekbench 5.5: Single-Core | Multi-Core
HWBOT x265 Benchmark v2.2: 4k Preset
LibreOffice : 20 Documents To PDF
R Benchmark 2.5: Overall mean
* ... Moindre est la valeur, meilleures sont les performances
| PCMark 8 | |
| Home Score Accelerated v2 | |
| Lenovo Yoga C940-14IIL | |
| Dell Latitude 14 9410 2-in-1 P110G | |
| LG Gram 14T90N | |
| Dell Latitude 7400 2-in-1 | |
| HP Elitebook x360 1040 G5 | |
| Work Score Accelerated v2 | |
| Lenovo Yoga C940-14IIL | |
| LG Gram 14T90N | |
| Dell Latitude 14 9410 2-in-1 P110G | |
| Dell Latitude 7400 2-in-1 | |
| HP Elitebook x360 1040 G5 | |
| PCMark 8 Home Score Accelerated v2 | 3725 points | |
| PCMark 8 Work Score Accelerated v2 | 5071 points | |
| PCMark 10 Score | 4410 points | |
Aide | ||
| DPC Latencies / LatencyMon - interrupt to process latency (max), Web, Youtube, Prime95 | |
| Acer TravelMate P6 P614-51T-G2-72ZU | |
| Lenovo ThinkPad T14s-20T00044GE | |
| LG Gram 14T90N | |
| Dell Latitude 14 9410 2-in-1 P110G | |
| Lenovo ThinkPad E14 Gen2-20T7S00W00 | |
| Asus VivoBook Flip 14 TM420IA | |
| Asus ZenBook Flip 14 UX463FA-AI039T | |
* ... Moindre est la valeur, meilleures sont les performances
| Dell Latitude 14 9410 2-in-1 P110G Micron 2200S 512GB | Lenovo Yoga C940-14IIL Samsung SSD PM981 MZVLB512HAJQ | LG Gram 14T90N Samsung SSD PM981a MZVLB512HBJQ | HP Elitebook x360 1040 G5 Samsung SSD PM981 MZVLB512HAJQ | Dell Latitude 7400 2-in-1 Toshiba XG6 KXG60ZNV512G | Asus ZenBook Flip 14 UX463FA-AI039T Kingston RBUSNS8154P3512GJ1 | |
|---|---|---|---|---|---|---|
| AS SSD | 48% | 60% | 38% | -24% | -16% | |
| Seq Read (MB/s) | 1117 | 2525 126% | 1829 64% | 1816 63% | 2289 105% | 1336 20% |
| Seq Write (MB/s) | 969 | 1253 29% | 2048 111% | 1270 31% | 1163 20% | 653 -33% |
| 4K Read (MB/s) | 41.93 | 59.1 41% | 54.2 29% | 46.25 10% | 22.29 -47% | 26.65 -36% |
| 4K Write (MB/s) | 76.4 | 134.1 76% | 120.5 58% | 104.1 36% | 28.92 -62% | 52.7 -31% |
| 4K-64 Read (MB/s) | 827 | 1010 22% | 1512 83% | 1342 62% | 415.6 -50% | 644 -22% |
| 4K-64 Write (MB/s) | 792 | 1461 84% | 1573 99% | 1209 53% | 199.5 -75% | 482.9 -39% |
| Access Time Read * (ms) | 0.055 | 0.052 5% | 0.046 16% | 0.043 22% | 0.122 -122% | 0.074 -35% |
| Access Time Write * (ms) | 0.366 | 0.029 92% | 0.091 75% | 0.035 90% | 0.143 61% | 0.072 80% |
| Score Read (Points) | 981 | 1322 35% | 1749 78% | 1569 60% | 667 -32% | 804 -18% |
| Score Write (Points) | 966 | 1721 78% | 1899 97% | 1440 49% | 345 -64% | 601 -38% |
| Score Total (Points) | 2450 | 3670 50% | 4560 86% | 3790 55% | 1300 -47% | 1786 -27% |
| Copy ISO MB/s (MB/s) | 1290 | 2016 56% | 1891 47% | 2034 58% | 1767 37% | |
| Copy Program MB/s (MB/s) | 661 | 542 -18% | 569 -14% | 450.3 -32% | 379.4 -43% | |
| Copy Game MB/s (MB/s) | 1271 | 1278 1% | 1425 12% | 1024 -19% | 1055 -17% | |
| CrystalDiskMark 5.2 / 6 | 30% | 42% | 20% | -29% | -32% | |
| Write 4K (MB/s) | 81.2 | 128.4 58% | 181.4 123% | 122.7 51% | 35.06 -57% | 54.6 -33% |
| Read 4K (MB/s) | 45.41 | 46.37 2% | 52.5 16% | 46.57 3% | 23.64 -48% | 28.19 -38% |
| Write Seq (MB/s) | 1190 | 1863 57% | 1592 34% | 1725 45% | 1537 29% | 840 -29% |
| Read Seq (MB/s) | 1766 | 2340 33% | 1617 -8% | 2392 35% | 1782 1% | 905 -49% |
| Write 4K Q32T1 (MB/s) | 436 | 451.1 3% | 556 28% | 470.6 8% | 100.3 -77% | 409.5 -6% |
| Read 4K Q32T1 (MB/s) | 374.4 | 415.3 11% | 539 44% | 313.2 -16% | 62.7 -83% | 292.4 -22% |
| Write Seq Q32T1 (MB/s) | 1582 | 2985 89% | 2955 87% | 1869 18% | 2698 71% | 1038 -34% |
| Read Seq Q32T1 (MB/s) | 3017 | 2565 -15% | 3270 8% | 3380 12% | 1073 -64% | 1607 -47% |
| Write 4K Q8T8 (MB/s) | 451.4 | |||||
| Read 4K Q8T8 (MB/s) | 1004 | |||||
| Moyenne finale (programmes/paramètres) | 39% /
42% | 51% /
53% | 29% /
32% | -27% /
-26% | -24% /
-23% |
* ... Moindre est la valeur, meilleures sont les performances

Disk Throttling: DiskSpd Read Loop, Queue Depth 8
| 3DMark 11 Performance | 2206 points | |
| 3DMark Cloud Gate Standard Score | 9933 points | |
| 3DMark Fire Strike Score | 1218 points | |
| 3DMark Time Spy Score | 486 points | |
Aide | ||
| Bas | Moyen | Élevé | Ultra | |
|---|---|---|---|---|
| Dota 2 Reborn (2015) | 59.1 | 48.4 | 20.5 | 18.7 |
| X-Plane 11.11 (2018) | 12 | 10.9 | 10.5 |
| Dell Latitude 14 9410 2-in-1 P110G UHD Graphics 620, i7-10610U, Micron 2200S 512GB | Lenovo Yoga C940-14IIL Iris Plus Graphics G7 (Ice Lake 64 EU), i7-1065G7, Samsung SSD PM981 MZVLB512HAJQ | LG Gram 14T90N UHD Graphics 620, i7-10510U, Samsung SSD PM981a MZVLB512HBJQ | HP Elitebook x360 1040 G5 UHD Graphics 620, i7-8650U, Samsung SSD PM981 MZVLB512HAJQ | Dell Latitude 7400 2-in-1 UHD Graphics 620, i7-8665U, Toshiba XG6 KXG60ZNV512G | Asus ZenBook Flip 14 UX463FA-AI039T UHD Graphics 620, i5-10210U, Kingston RBUSNS8154P3512GJ1 | |
|---|---|---|---|---|---|---|
| Noise | -1% | -5% | 1% | 6% | -1% | |
| arrêt / environnement * (dB) | 26.1 | 29.3 -12% | 29 -11% | 28.3 -8% | 28.2 -8% | 30.1 -15% |
| Idle Minimum * (dB) | 26.1 | 29.3 -12% | 30 -15% | 28.3 -8% | 28.2 -8% | 30.1 -15% |
| Idle Average * (dB) | 26.1 | 29.3 -12% | 30 -15% | 28.3 -8% | 28.2 -8% | 30.1 -15% |
| Idle Maximum * (dB) | 26.1 | 29.3 -12% | 30 -15% | 28.3 -8% | 28.3 -8% | 30.1 -15% |
| Load Average * (dB) | 39.9 | 33.3 17% | 35.2 12% | 32.6 18% | 28.2 29% | 30.1 25% |
| Load Maximum * (dB) | 44.7 | 33.3 26% | 37 17% | 36.6 18% | 28.8 36% | 32.02 28% |
* ... Moindre est la valeur, meilleures sont les performances
Degré de la nuisance sonore
| Au repos |
| 26.1 / 26.1 / 26.1 dB(A) |
| Fortement sollicité |
| 39.9 / 44.7 dB(A) |
 | ||
30 dB silencieux 40 dB(A) audible 50 dB(A) bruyant |
||
min: | ||
(-) La température maximale du côté supérieur est de 48.4 °C / 119 F, par rapport à la moyenne de 35.4 °C / 96 F, allant de 19.6 à 60 °C pour la classe Convertible.
(-) Le fond chauffe jusqu'à un maximum de 55.2 °C / 131 F, contre une moyenne de 36.9 °C / 98 F
(+) En utilisation inactive, la température moyenne du côté supérieur est de 23.8 °C / 75 F, par rapport à la moyenne du dispositif de 30.3 °C / 87 F.
(+) Les repose-poignets et le pavé tactile atteignent la température maximale de la peau (32.2 °C / 90 F) et ne sont donc pas chauds.
(-) La température moyenne de la zone de l'appui-paume de dispositifs similaires était de 28 °C / 82.4 F (-4.2 °C / #-7.6 F).
Dell Latitude 14 9410 2-in-1 P110G analyse audio
(±) | le niveau sonore du haut-parleur est moyen mais bon (80.8# dB)
Basses 100 - 315 Hz
(±) | basse réduite - en moyenne 14.6% inférieure à la médiane
(±) | la linéarité des basses est moyenne (12.9% delta à la fréquence précédente)
Médiums 400 - 2000 Hz
(+) | médiane équilibrée - seulement 4.1% de la médiane
(+) | les médiums sont linéaires (4% delta à la fréquence précédente)
Aiguës 2 - 16 kHz
(±) | sommets plus élevés - en moyenne 5.3% plus élevés que la médiane
(+) | les aigus sont linéaires (6.6% delta à la fréquence précédente)
Globalement 100 - 16 000 Hz
(±) | la linéarité du son global est moyenne (16.3% de différence avec la médiane)
Par rapport à la même classe
» 30% de tous les appareils testés de cette catégorie étaient meilleurs, 3% similaires, 67% pires
» Le meilleur avait un delta de 6%, la moyenne était de 20%, le pire était de 57%.
Par rapport à tous les appareils testés
» 27% de tous les appareils testés étaient meilleurs, 6% similaires, 68% pires
» Le meilleur avait un delta de 4%, la moyenne était de 24%, le pire était de 134%.
Apple MacBook 12 (Early 2016) 1.1 GHz analyse audio
(+) | les haut-parleurs peuvent jouer relativement fort (83.6# dB)
Basses 100 - 315 Hz
(±) | basse réduite - en moyenne 11.3% inférieure à la médiane
(±) | la linéarité des basses est moyenne (14.2% delta à la fréquence précédente)
Médiums 400 - 2000 Hz
(+) | médiane équilibrée - seulement 2.4% de la médiane
(+) | les médiums sont linéaires (5.5% delta à la fréquence précédente)
Aiguës 2 - 16 kHz
(+) | des sommets équilibrés - à seulement 2% de la médiane
(+) | les aigus sont linéaires (4.5% delta à la fréquence précédente)
Globalement 100 - 16 000 Hz
(+) | le son global est linéaire (10.2% différence à la médiane)
Par rapport à la même classe
» 7% de tous les appareils testés de cette catégorie étaient meilleurs, 2% similaires, 91% pires
» Le meilleur avait un delta de 5%, la moyenne était de 18%, le pire était de 53%.
Par rapport à tous les appareils testés
» 5% de tous les appareils testés étaient meilleurs, 1% similaires, 94% pires
» Le meilleur avait un delta de 4%, la moyenne était de 24%, le pire était de 134%.
| Éteint/en veille | |
| Au repos | |
| Fortement sollicité |
|
Légende:
min: | |
| Dell Latitude 14 9410 2-in-1 P110G i7-10610U, UHD Graphics 620, Micron 2200S 512GB, IPS, 1920x1080, 14" | Lenovo Yoga C940-14IIL i7-1065G7, Iris Plus Graphics G7 (Ice Lake 64 EU), Samsung SSD PM981 MZVLB512HAJQ, IPS LED, 1920x1080, 14" | LG Gram 14T90N i7-10510U, UHD Graphics 620, Samsung SSD PM981a MZVLB512HBJQ, IPS, 1920x1080, 14" | HP Elitebook x360 1040 G5 i7-8650U, UHD Graphics 620, Samsung SSD PM981 MZVLB512HAJQ, IPS, 1920x1080, 14" | Dell Latitude 7400 2-in-1 i7-8665U, UHD Graphics 620, Toshiba XG6 KXG60ZNV512G, IPS, 1920x1080, 14" | Asus ZenBook Flip 14 UX463FA-AI039T i5-10210U, UHD Graphics 620, Kingston RBUSNS8154P3512GJ1, IPS, 1920x1080, 14" | |
|---|---|---|---|---|---|---|
| Power Consumption | -40% | -9% | -37% | -3% | -42% | |
| Idle Minimum * (Watt) | 2.6 | 3.2 -23% | 2.9 -12% | 2.7 -4% | 2.6 -0% | 3.6 -38% |
| Idle Average * (Watt) | 3.9 | 7 -79% | 5.8 -49% | 6.5 -67% | 4.3 -10% | 7.5 -92% |
| Idle Maximum * (Watt) | 4.6 | 8.9 -93% | 6.2 -35% | 11.5 -150% | 5.5 -20% | 9.4 -104% |
| Load Average * (Watt) | 38.9 | 47.6 -22% | 32.9 15% | 38.7 1% | 32 18% | 42 -8% |
| Load Maximum * (Watt) | 76.2 | 63.1 17% | 48.5 36% | 50.5 34% | 78.8 -3% | 51 33% |
* ... Moindre est la valeur, meilleures sont les performances
| Dell Latitude 14 9410 2-in-1 P110G i7-10610U, UHD Graphics 620, 78 Wh | Lenovo Yoga C940-14IIL i7-1065G7, Iris Plus Graphics G7 (Ice Lake 64 EU), 60 Wh | LG Gram 14T90N i7-10510U, UHD Graphics 620, 72 Wh | HP Elitebook x360 1040 G5 i7-8650U, UHD Graphics 620, 56 Wh | Dell Latitude 7400 2-in-1 i7-8665U, UHD Graphics 620, 78 Wh | Asus ZenBook Flip 14 UX463FA-AI039T i5-10210U, UHD Graphics 620, 50 Wh | |
|---|---|---|---|---|---|---|
| Autonomie de la batterie | -56% | -30% | -32% | -36% | -59% | |
| Reader / Idle (h) | 48.2 | 32.8 -32% | 27.9 -42% | |||
| WiFi v1.3 (h) | 19 | 10.6 -44% | 12.5 -34% | 10.4 -45% | 12.2 -36% | 7.7 -59% |
| Load (h) | 3.4 | 1.1 -68% | 2.6 -24% | 3.1 -9% |
Points positifs
Points négatifs
La bonne nouvelle, c'est que le Latitude 9410 2-en-1 ne diffère pas beaucoup de l'excellent Latitude 7400 2-en-1. Dell n'a pas tenté le diable, et a simplement cherché à mettre à jour certains composants comme le processeur ou le WLAN, pour rester compétitif face aux séries convertibles HP EliteBook x360 et Lenovo Yoga.
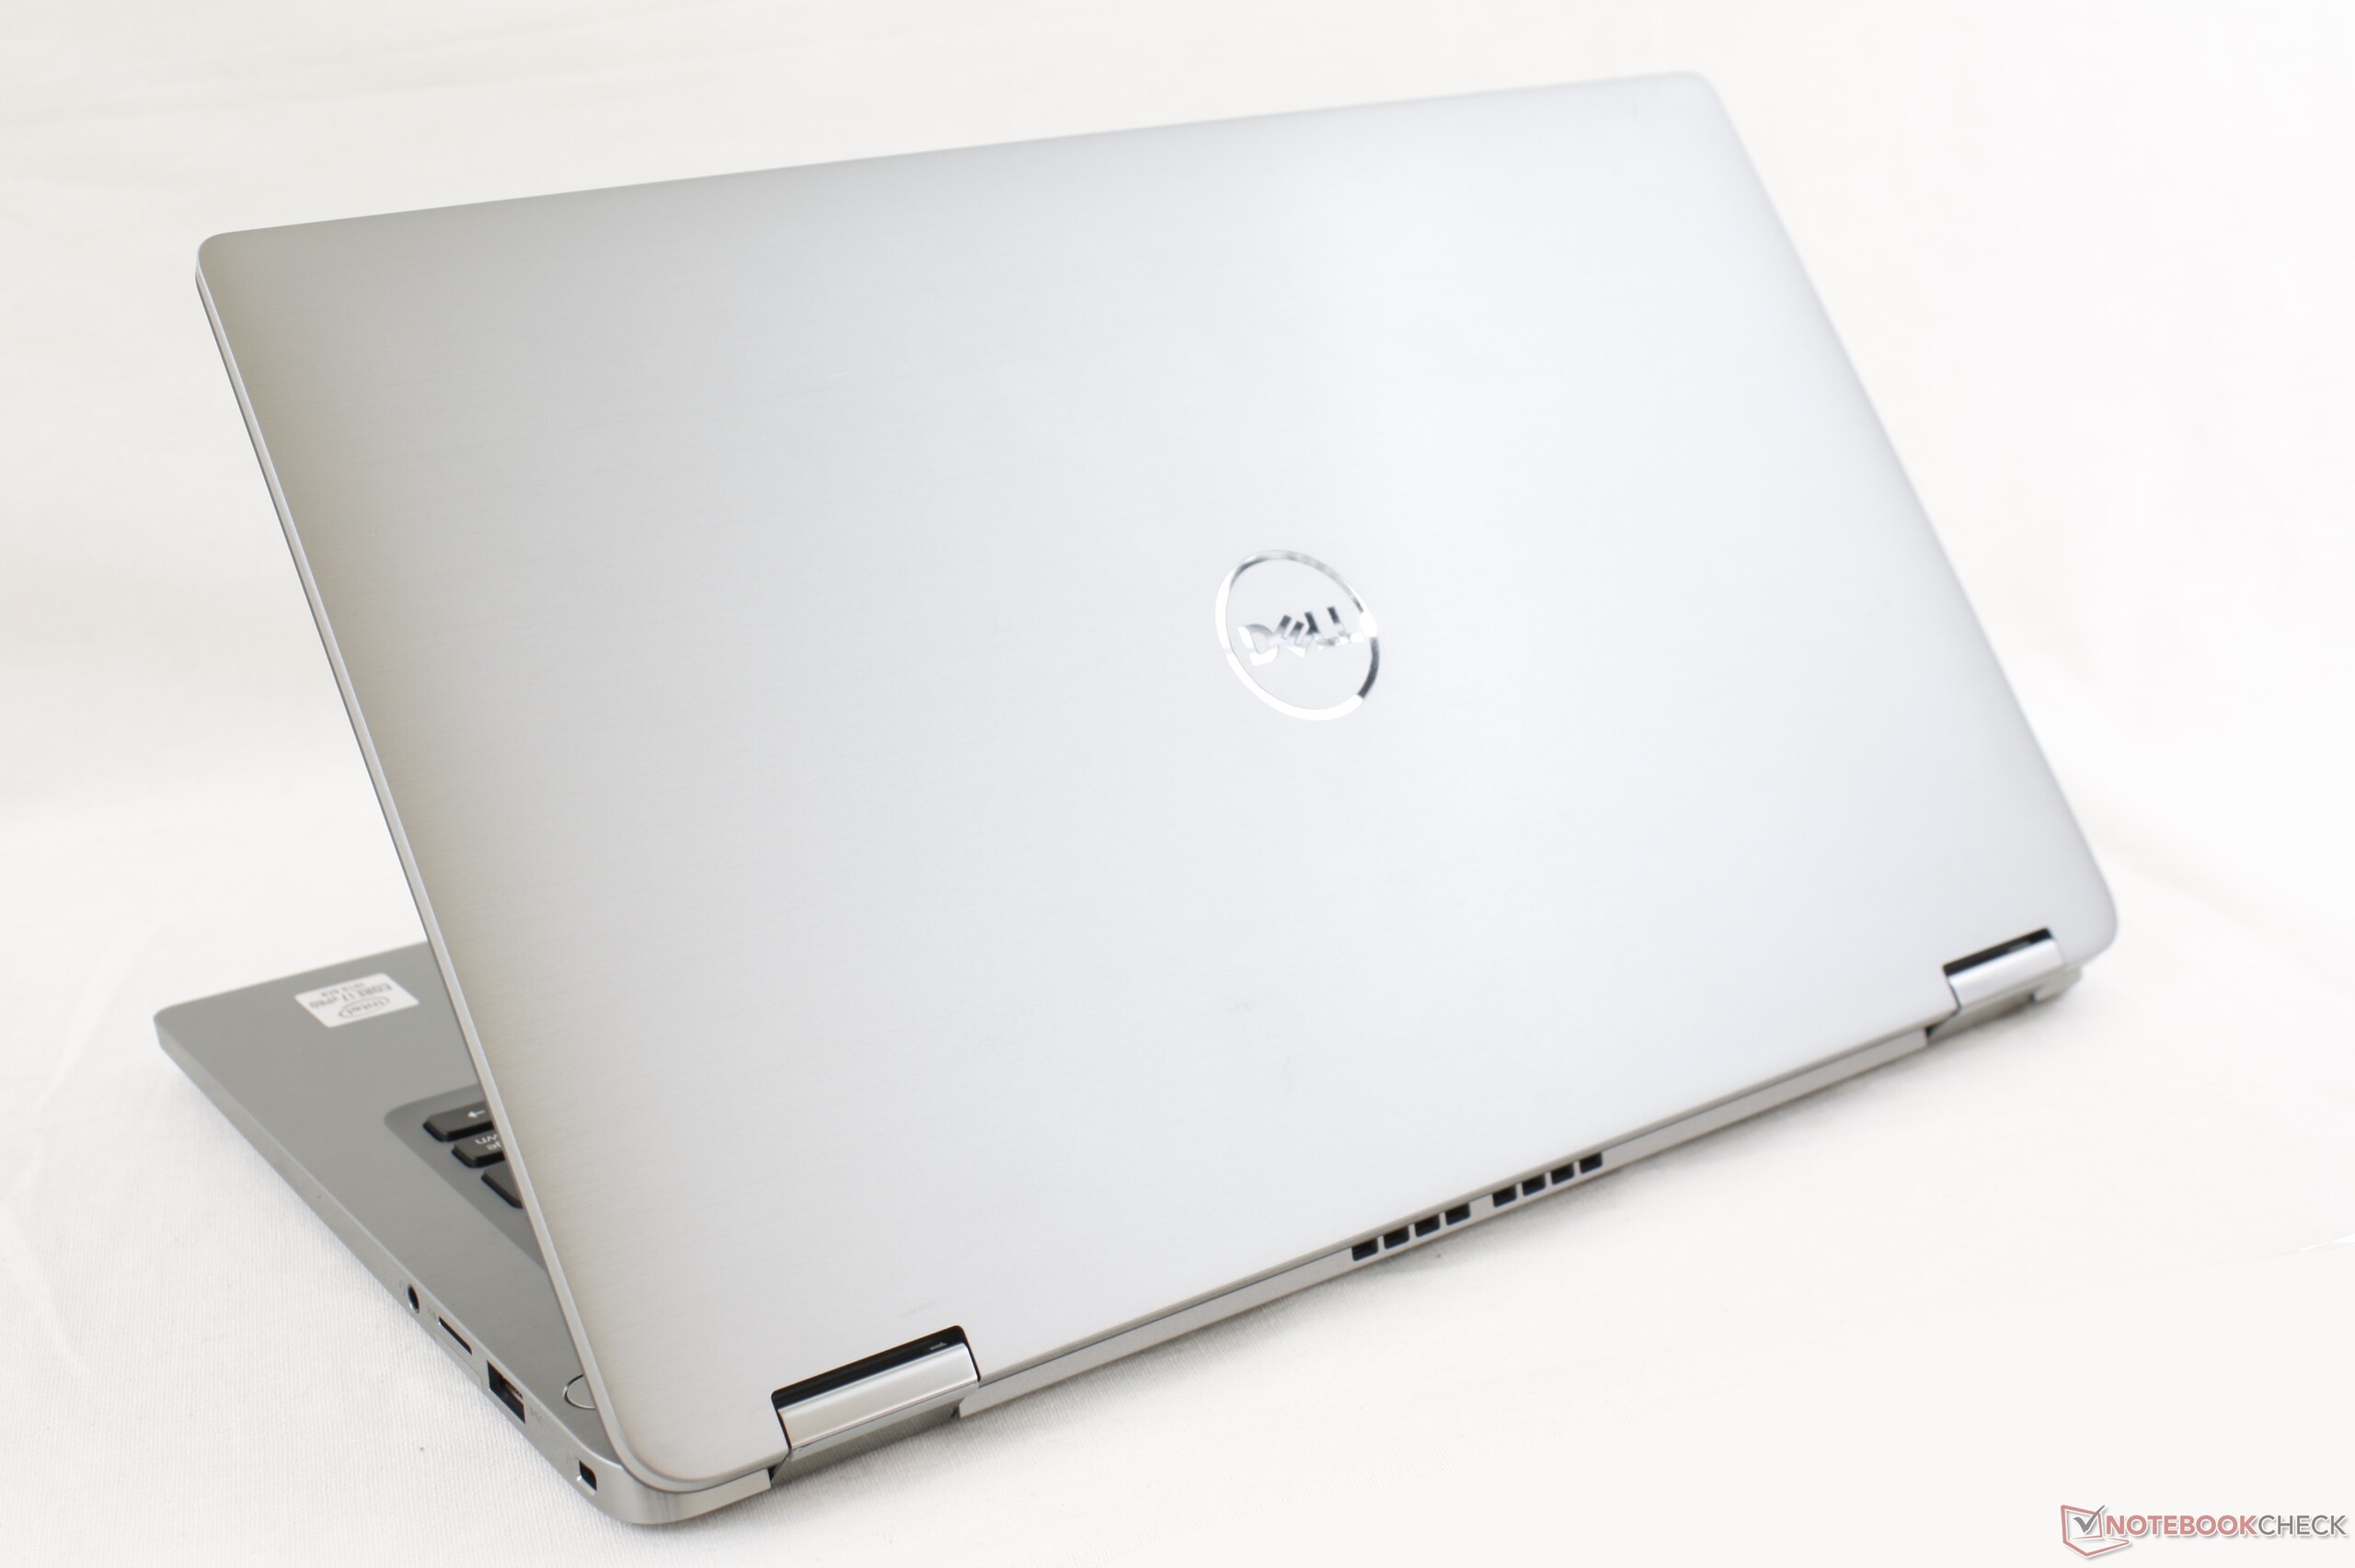
En revanche, la mauvaise nouvelle c'est que le Latitude 9410 2-en-1 n'est pas vraiment différent de l'excellent Latitude 7400 2-en-1. C'est à double tranchant, parce que l'on peut trouver le Latitude 7400 de l'an dernier à un prix inférieur à celui du Latitude 9410 de 2020, pour une expérience et des performances proches. De petits défauts n'ont pas été corrigés, telle l'absence de vraie Webcam ou le manque de luminosité de l'écran, ainsi que l'absence de version avec GPU dédié. Mais tout cela ne gâche pas un design qui n'a qu'environ un an d'âge.
Ne laissez pas le tout nouveau nom vous tromper, le Latitude 9410 2-en-1 étant qu'une évolution mineure de l'excellent Latitude 7400 2-en-1. Il s'agit toujours de l'un des meilleurs convertibles pros de 14 pouces disponibles, même si son écran n'est pas parmi les plus lumineux.
L’intégralité de cette critique est disponible en anglais en suivant ce lien.
Dell Latitude 14 9410 2-in-1 P110G
- 08/31/2020 v7 (old)
Allen Ngo
Price comparison
