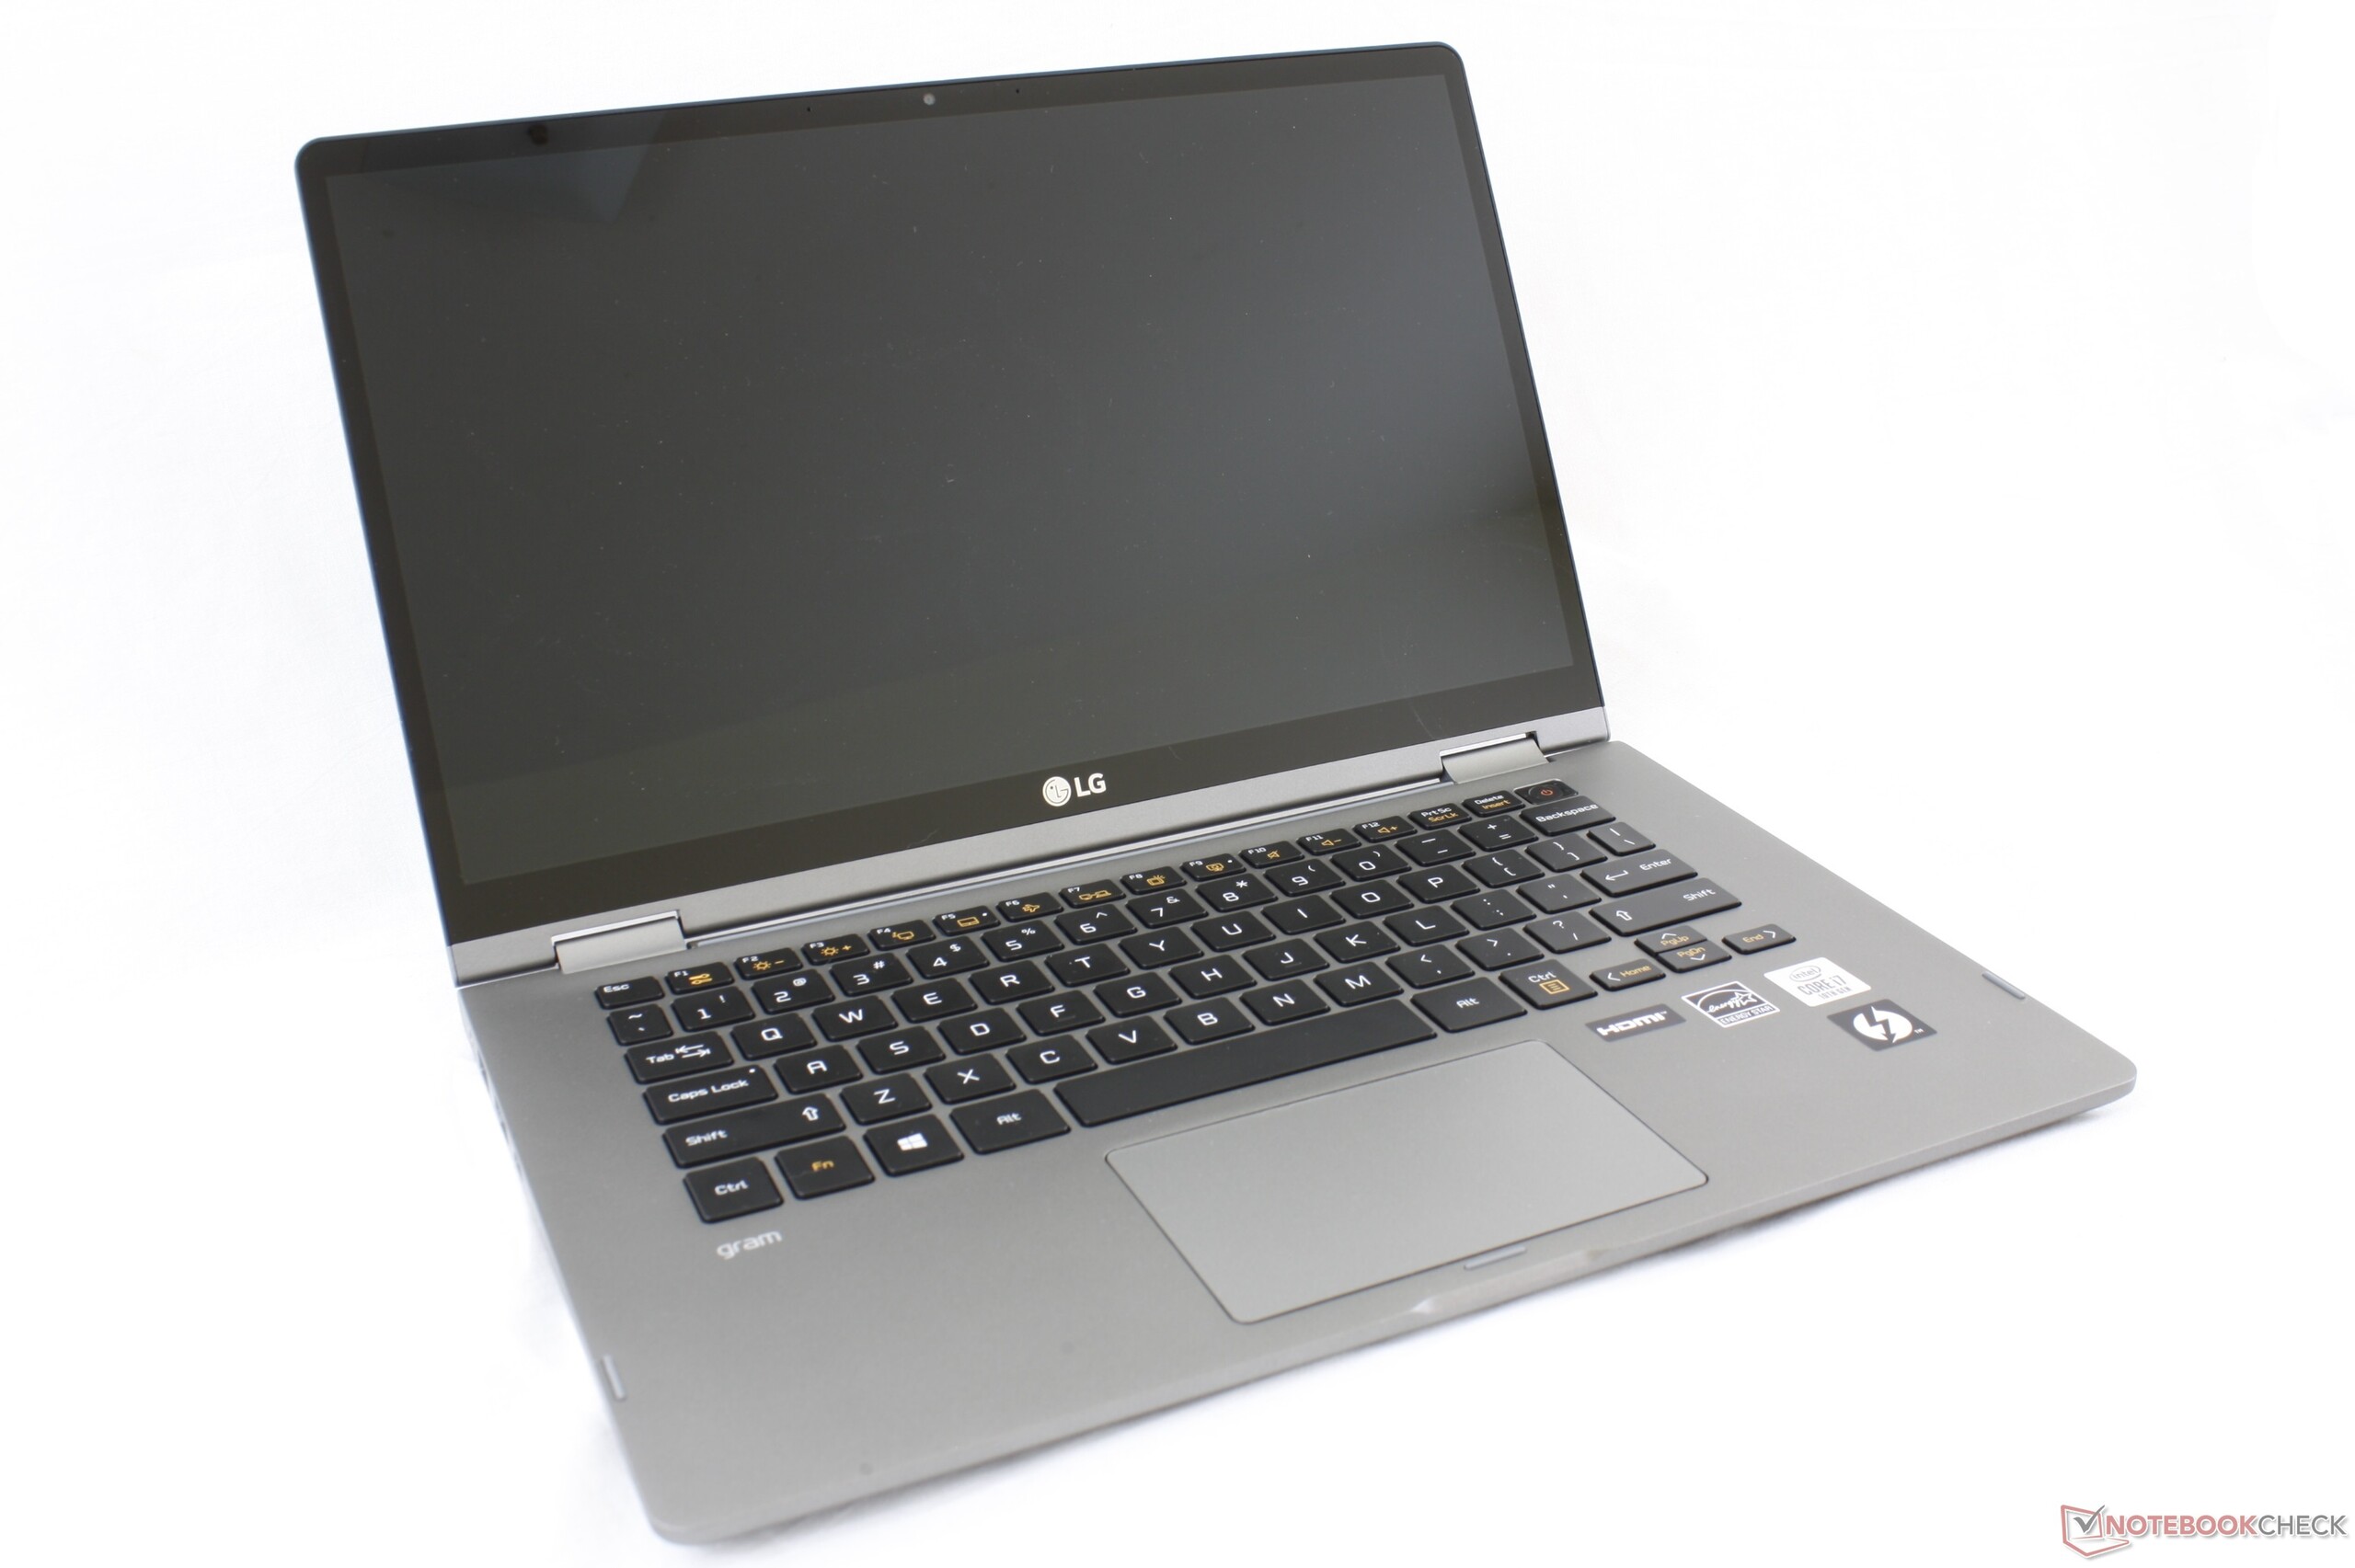
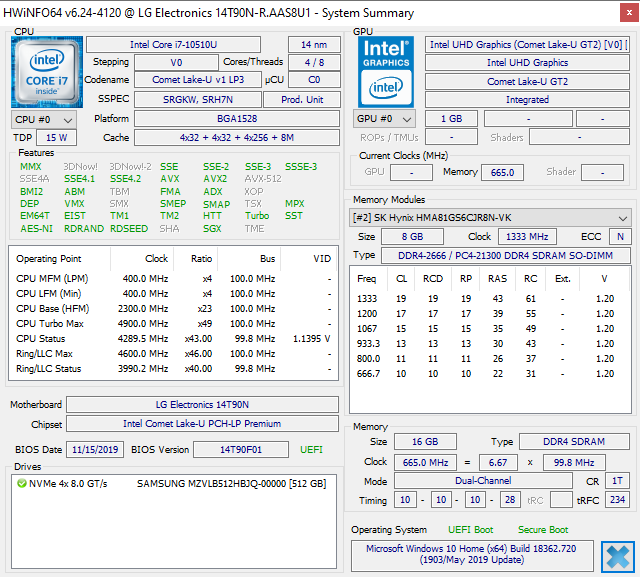
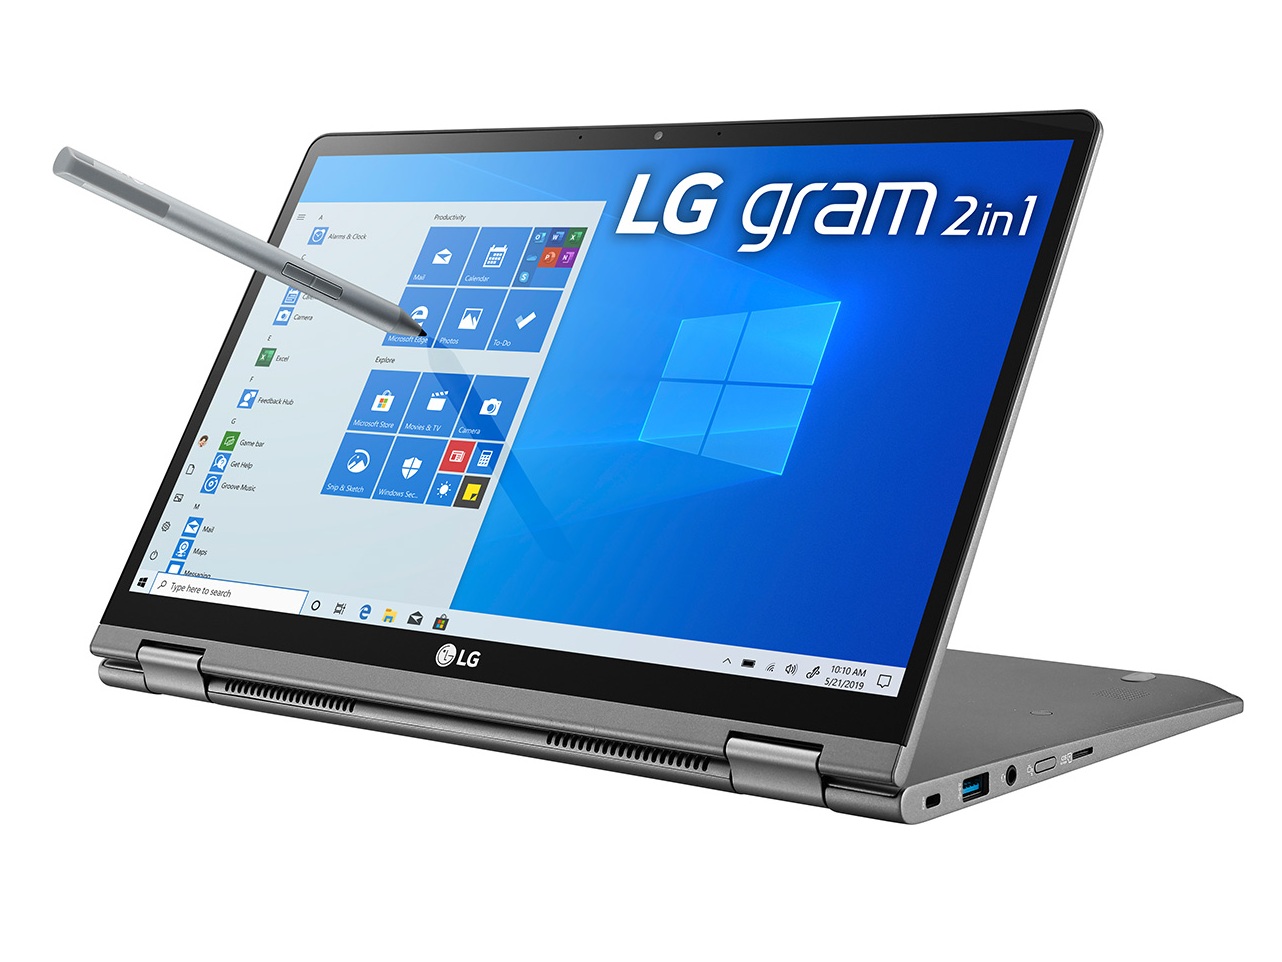
Test du LG Gram 14T90N (i7-10510U, UHD 620, FHD) : un processeur à la baisse
Note | Date | Modèle | Poids | Épaisseur | Taille | Résolution | Prix |
|---|---|---|---|---|---|---|---|
| 81.2 % v7 (old) | 05/20 | LG Gram 14T90N i7-10510U, UHD Graphics 620 | 1.2 kg | 18 mm | 14.00" | 1920x1080 | |
| 81.2 % v7 (old) | 02/20 | Asus ZenBook 14 UM431DA-AM020T R7 3700U, Vega 10 | 1.4 kg | 16 mm | 14.00" | 1920x1080 | |
| 86.3 % v7 (old) | 10/19 | Dell XPS 13 7390 2-in-1 Core i7 i7-1065G7, Iris Plus Graphics G7 (Ice Lake 64 EU) | 1.3 kg | 13 mm | 13.40" | 1920x1200 | |
| 88.5 % v7 (old) | 05/20 | Lenovo ThinkPad X1 Carbon G7 20R1-000YUS i7-10510U, UHD Graphics 620 | 1.2 kg | 15.4 mm | 14.00" | 3840x2160 | |
| 85.9 % v7 (old) | 11/19 | Dell XPS 13 7390 Core i7-10710U i7-10710U, UHD Graphics 620 | 1.2 kg | 11.6 mm | 13.30" | 3840x2160 |
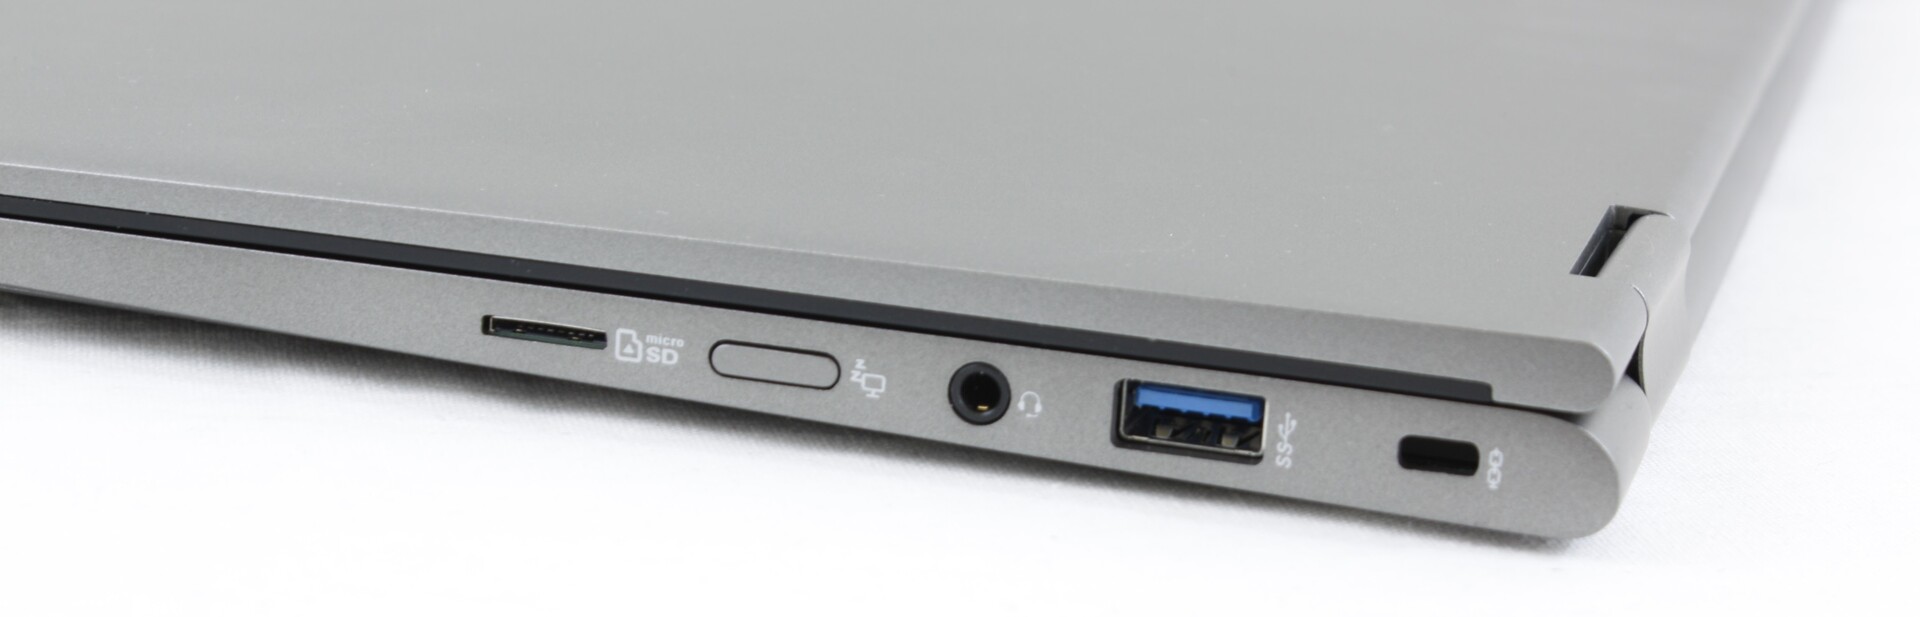
| SD Card Reader | |
| average JPG Copy Test (av. of 3 runs) | |
| Dell XPS 13 7390 2-in-1 Core i7 (Toshiba Exceria Pro M501 64 GB UHS-II) | |
| LG Gram 14T90N (Toshiba Exceria Pro M501 64 GB UHS-II) | |
| LG Gram 14Z980-U.AAW5U1 (Toshiba Exceria Pro M501 microSDXC 64GB) | |
| Asus ZenBook 14 UM431DA-AM020T (Toshiba Exceria Pro SDXC 64 GB UHS-II) | |
| maximum AS SSD Seq Read Test (1GB) | |
| Dell XPS 13 7390 2-in-1 Core i7 (Toshiba Exceria Pro M501 64 GB UHS-II) | |
| LG Gram 14Z980-U.AAW5U1 (Toshiba Exceria Pro M501 microSDXC 64GB) | |
| LG Gram 14T90N (Toshiba Exceria Pro M501 64 GB UHS-II) | |
| Asus ZenBook 14 UM431DA-AM020T (Toshiba Exceria Pro SDXC 64 GB UHS-II) | |

| |||||||||||||||||||||||||
Homogénéité de la luminosité: 86 %
Valeur mesurée au centre, sur batterie: 322.2 cd/m²
Contraste: 1289:1 (Valeurs des noirs: 0.25 cd/m²)
ΔE ColorChecker Calman: 3.62 | ∀{0.5-29.43 Ø4.71}
calibrated: 1.22
ΔE Greyscale Calman: 3.9 | ∀{0.09-98 Ø4.96}
95.6% sRGB (Argyll 1.6.3 3D)
61.3% AdobeRGB 1998 (Argyll 1.6.3 3D)
66.7% AdobeRGB 1998 (Argyll 3D)
95.7% sRGB (Argyll 3D)
65% Display P3 (Argyll 3D)
Gamma: 2.43
CCT: 6344 K
| LG Gram 14T90N LG Philips LP140WFA-SPY1, IPS, 14", 1920x1080 | LG Gram 14Z980-U.AAW5U1 LG Philips LP140WF7-SPG1, IPS, 14", 1920x1080 | Asus ZenBook 14 UM431DA-AM020T CEC PA LM140LF-3L03, IPS, 14", 1920x1080 | Dell XPS 13 7390 2-in-1 Core i7 Sharp LQ134N1, IPS, 13.4", 1920x1200 | Huawei Matebook X Pro i5 Tianma XM, IPS, 13.9", 3000x2000 | Lenovo ThinkPad X1 Carbon G7 20R1-000YUS BOE NV140QUM-N53, IPS, 14", 3840x2160 | |
|---|---|---|---|---|---|---|
| Display | -1% | 0% | 6% | 0% | 19% | |
| Display P3 Coverage (%) | 65 | 64.7 0% | 66.7 3% | 69.9 8% | 65.9 1% | 83 28% |
| sRGB Coverage (%) | 95.7 | 94.3 -1% | 92.3 -4% | 99.2 4% | 95.2 -1% | 99.7 4% |
| AdobeRGB 1998 Coverage (%) | 66.7 | 66 -1% | 67.5 1% | 71.5 7% | 67.6 1% | 83.1 25% |
| Response Times | 21% | 27% | 12% | 24% | 6% | |
| Response Time Grey 50% / Grey 80% * (ms) | 54 ? | 36.8 ? 32% | 36 ? 33% | 47.6 ? 12% | 40.4 ? 25% | 49.2 ? 9% |
| Response Time Black / White * (ms) | 32.8 ? | 30 ? 9% | 26 ? 21% | 29.2 ? 11% | 25.6 ? 22% | 32.2 ? 2% |
| PWM Frequency (Hz) | 44 ? | 2500 ? | 201.6 ? | |||
| Screen | -17% | -49% | 20% | -4% | -32% | |
| Brightness middle (cd/m²) | 322.2 | 333.8 4% | 253 -21% | 549.8 71% | 442.7 37% | 532 65% |
| Brightness (cd/m²) | 301 | 307 2% | 245 -19% | 520 73% | 428 42% | 513 70% |
| Brightness Distribution (%) | 86 | 83 -3% | 78 -9% | 86 0% | 84 -2% | 90 5% |
| Black Level * (cd/m²) | 0.25 | 0.4 -60% | 0.225 10% | 0.39 -56% | 0.31 -24% | 0.41 -64% |
| Contrast (:1) | 1289 | 835 -35% | 1124 -13% | 1410 9% | 1428 11% | 1298 1% |
| Colorchecker dE 2000 * | 3.62 | 3.54 2% | 8.89 -146% | 2.12 41% | 2.24 38% | 6.88 -90% |
| Colorchecker dE 2000 max. * | 6.9 | 5.8 16% | 4.56 34% | 3.66 47% | 7.19 -4% | 12.65 -83% |
| Colorchecker dE 2000 calibrated * | 1.22 | 2.36 -93% | 4.9 -302% | 1.37 -12% | 1.11 9% | 2.52 -107% |
| Greyscale dE 2000 * | 3.9 | 4.7 -21% | 6.33 -62% | 2.6 33% | 9.7 -149% | 10.5 -169% |
| Gamma | 2.43 91% | 2.14 103% | 2.52 87% | 2.3 96% | 1.42 155% | 1.98 111% |
| CCT | 6344 102% | 6261 104% | 6745 96% | 6884 94% | 6227 104% | 7394 88% |
| Color Space (Percent of AdobeRGB 1998) (%) | 61.3 | 61.2 0% | 60 -2% | 65.4 7% | 61.6 0% | 74.1 21% |
| Color Space (Percent of sRGB) (%) | 95.6 | 94.7 -1% | 91 -5% | 99.7 4% | 95 -1% | 99.7 4% |
| Moyenne finale (programmes/paramètres) | 1% /
-9% | -7% /
-30% | 13% /
16% | 7% /
0% | -2% /
-17% |
* ... Moindre est la valeur, meilleures sont les performances
Temps de réponse de l'écran
| ↔ Temps de réponse noir à blanc | ||
|---|---|---|
| 32.8 ms ... hausse ↗ et chute ↘ combinées | ↗ 19.6 ms hausse | 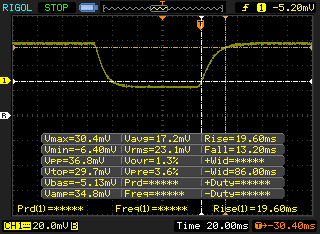 |
| ↘ 13.2 ms chute | ||
| L'écran souffre de latences très élevées, à éviter pour le jeu. En comparaison, tous les appareils testés affichent entre 0.1 (minimum) et 240 (maximum) ms. » 88 % des appareils testés affichent de meilleures performances. Cela signifie que les latences relevées sont moins bonnes que la moyenne (19.8 ms) de tous les appareils testés. | ||
| ↔ Temps de réponse gris 50% à gris 80% | ||
| 54 ms ... hausse ↗ et chute ↘ combinées | ↗ 28.8 ms hausse | 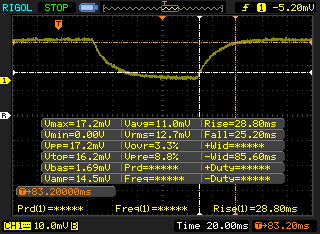 |
| ↘ 25.2 ms chute | ||
| L'écran souffre de latences très élevées, à éviter pour le jeu. En comparaison, tous les appareils testés affichent entre 0.165 (minimum) et 636 (maximum) ms. » 91 % des appareils testés affichent de meilleures performances. Cela signifie que les latences relevées sont moins bonnes que la moyenne (31 ms) de tous les appareils testés. | ||
Scintillement / MLI (Modulation de largeur d'impulsion)
| Scintillement / MLI (Modulation de largeur d'impulsion) non décelé | 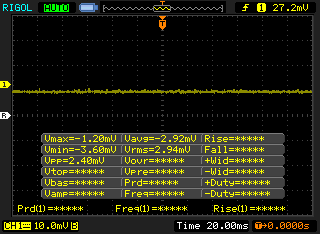 | ||
En comparaison, 52 % des appareils testés n'emploient pas MDI pour assombrir leur écran. Nous avons relevé une moyenne à 7757 (minimum : 5 - maximum : 343500) Hz dans le cas où une MDI était active. | |||
| wPrime 2.10 - 1024m | |
| Microsoft Surface Laptop 3 13 Core i5-1035G7 | |
| Dell XPS 13 7390 2-in-1 Core i7 | |
| Dell XPS 13 7390 Core i7-10710U | |
* ... Moindre est la valeur, meilleures sont les performances
| PCMark 8 Home Score Accelerated v2 | 3646 points | |
| PCMark 8 Work Score Accelerated v2 | 5153 points | |
| PCMark 10 Score | 4167 points | |
Aide | ||
| LG Gram 14T90N Samsung SSD PM981a MZVLB512HBJQ | LG Gram 14Z980-U.AAW5U1 SK Hynix SC313 HFS256G39TNF | Asus ZenBook 14 UM431DA-AM020T SK hynix BC501 HFM512GDHTNG-8310A | Dell XPS 13 7390 2-in-1 Core i7 Toshiba BG4 KBG40ZPZ512G | Lenovo ThinkPad X1 Carbon G7 20R1-000YUS WDC PC SN730 SDBPNTY-512G | |
|---|---|---|---|---|---|
| AS SSD | -63% | -32% | -76% | -21% | |
| Seq Read (MB/s) | 1829 | 476.1 -74% | 1417 -23% | 1801 -2% | 1786 -2% |
| Seq Write (MB/s) | 2048 | 487.4 -76% | 781 -62% | 1125 -45% | 1259 -39% |
| 4K Read (MB/s) | 54.2 | 30.57 -44% | 37.03 -32% | 39.7 -27% | 45.86 -15% |
| 4K Write (MB/s) | 120.5 | 66.1 -45% | 80.1 -34% | 67 -44% | 147.9 23% |
| 4K-64 Read (MB/s) | 1512 | 352.9 -77% | 740 -51% | 1253 -17% | 885 -41% |
| 4K-64 Write (MB/s) | 1573 | 263.1 -83% | 748 -52% | 209 -87% | 950 -40% |
| Access Time Read * (ms) | 0.046 | 0.092 -100% | 0.047 -2% | 0.069 -50% | 0.058 -26% |
| Access Time Write * (ms) | 0.091 | 0.055 40% | 0.045 51% | 0.625 -587% | 0.074 19% |
| Score Read (Points) | 1749 | 431 -75% | 918 -48% | 1472 -16% | 1110 -37% |
| Score Write (Points) | 1899 | 378 -80% | 906 -52% | 388 -80% | 1224 -36% |
| Score Total (Points) | 4560 | 1040 -77% | 2270 -50% | 2583 -43% | 2885 -37% |
| Copy ISO MB/s (MB/s) | 1891 | 514 -73% | 1293 -32% | 1384 -27% | |
| Copy Program MB/s (MB/s) | 569 | 259.3 -54% | 560 -2% | 525 -8% | |
| Copy Game MB/s (MB/s) | 1425 | 521 -63% | 927 -35% | 1008 -29% | |
| CrystalDiskMark 5.2 / 6 | -69% | -45% | -23% | -3% | |
| Write 4K (MB/s) | 181.4 | 74.7 -59% | 118.8 -35% | 106.7 -41% | 151.5 -16% |
| Read 4K (MB/s) | 52.5 | 14.89 -72% | 41.62 -21% | 49.94 -5% | 45.83 -13% |
| Write Seq (MB/s) | 1592 | 502 -68% | 796 -50% | 1223 -23% | 2060 29% |
| Read Seq (MB/s) | 1617 | 498.6 -69% | 1101 -32% | 1801 11% | 1973 22% |
| Write 4K Q32T1 (MB/s) | 556 | 214.3 -61% | 234.7 -58% | 325.3 -41% | 489.8 -12% |
| Read 4K Q32T1 (MB/s) | 539 | 225.5 -58% | 313.8 -42% | 551 2% | 386.2 -28% |
| Write Seq Q32T1 (MB/s) | 2955 | 505 -83% | 842 -72% | 1224 -59% | 2703 -9% |
| Read Seq Q32T1 (MB/s) | 3270 | 560 -83% | 1645 -50% | 2350 -28% | 3376 3% |
| Moyenne finale (programmes/paramètres) | -66% /
-65% | -39% /
-38% | -50% /
-57% | -12% /
-15% |
* ... Moindre est la valeur, meilleures sont les performances

| 3DMark 11 Performance | 1923 points | |
| 3DMark Ice Storm Standard Score | 14669 points | |
| 3DMark Cloud Gate Standard Score | 6582 points | |
| 3DMark Fire Strike Score | 1056 points | |
| 3DMark Time Spy Score | 429 points | |
Aide | ||
| Bas | Moyen | Élevé | Ultra | |
|---|---|---|---|---|
| BioShock Infinite (2013) | 59.8 | 38.4 | 32 | 10.2 |
| Dota 2 Reborn (2015) | 57.6 | 39.1 | 19 | 17 |
| X-Plane 11.11 (2018) | 20.5 | 13.2 | 12 |
| LG Gram 14T90N UHD Graphics 620, i7-10510U, Samsung SSD PM981a MZVLB512HBJQ | LG Gram 14Z980-U.AAW5U1 UHD Graphics 620, i5-8250U, SK Hynix SC313 HFS256G39TNF | Asus ZenBook 14 UM431DA-AM020T Vega 10, R7 3700U, SK hynix BC501 HFM512GDHTNG-8310A | Dell XPS 13 7390 2-in-1 Core i7 Iris Plus Graphics G7 (Ice Lake 64 EU), i7-1065G7, Toshiba BG4 KBG40ZPZ512G | Huawei Matebook X Pro i5 GeForce MX150, i5-8250U, Samsung PM961 MZVLW256HEHP | Lenovo Yoga C940-14IIL 81Q9 Iris Plus Graphics G7 (Ice Lake 64 EU), i7-1065G7, Samsung PM981a MZVLB1T0HBLR | |
|---|---|---|---|---|---|---|
| Noise | 4% | 1% | 2% | 0% | 2% | |
| arrêt / environnement * (dB) | 29 | 28.2 3% | 29.8 -3% | 28.1 3% | 27.9 4% | 28.5 2% |
| Idle Minimum * (dB) | 30 | 28.4 5% | 28 7% | 28.1 6% | 27.9 7% | 28.5 5% |
| Idle Average * (dB) | 30 | 28.4 5% | 28 7% | 28.1 6% | 27.9 7% | 28.5 5% |
| Idle Maximum * (dB) | 30 | 28.4 5% | 28 7% | 28.1 6% | 27.9 7% | 29 3% |
| Load Average * (dB) | 35.2 | 35.7 -1% | 36.8 -5% | 31.7 10% | 36.2 -3% | 33 6% |
| Load Maximum * (dB) | 37 | 34.2 8% | 39 -5% | 43.4 -17% | 45.2 -22% | 39.5 -7% |
| Witcher 3 ultra * (dB) | 43.4 | 45 | 40.7 |
* ... Moindre est la valeur, meilleures sont les performances
Degré de la nuisance sonore
| Au repos |
| 30 / 30 / 30 dB(A) |
| Fortement sollicité |
| 35.2 / 37 dB(A) |
 | ||
30 dB silencieux 40 dB(A) audible 50 dB(A) bruyant |
||
min: | ||
(±) La température maximale du côté supérieur est de 43.2 °C / 110 F, par rapport à la moyenne de 35.4 °C / 96 F, allant de 19.6 à 60 °C pour la classe Convertible.
(±) Le fond chauffe jusqu'à un maximum de 41.6 °C / 107 F, contre une moyenne de 36.9 °C / 98 F
(+) En utilisation inactive, la température moyenne du côté supérieur est de 26.7 °C / 80 F, par rapport à la moyenne du dispositif de 30.3 °C / 87 F.
(+) Les repose-poignets et le pavé tactile sont plus froids que la température de la peau avec un maximum de 30 °C / 86 F et sont donc froids au toucher.
(±) La température moyenne de la zone de l'appui-paume de dispositifs similaires était de 28 °C / 82.4 F (-2 °C / #-3.6 F).
| Éteint/en veille | |
| Au repos | |
| Fortement sollicité |
|
Légende:
min: | |
| LG Gram 14T90N i7-10510U, UHD Graphics 620, Samsung SSD PM981a MZVLB512HBJQ, IPS, 1920x1080, 14" | LG Gram 14Z980-U.AAW5U1 i5-8250U, UHD Graphics 620, SK Hynix SC313 HFS256G39TNF, IPS, 1920x1080, 14" | Asus ZenBook 14 UM431DA-AM020T R7 3700U, Vega 10, SK hynix BC501 HFM512GDHTNG-8310A, IPS, 1920x1080, 14" | Dell XPS 13 7390 2-in-1 Core i7 i7-1065G7, Iris Plus Graphics G7 (Ice Lake 64 EU), Toshiba BG4 KBG40ZPZ512G, IPS, 1920x1200, 13.4" | Huawei Matebook X Pro i5 i5-8250U, GeForce MX150, Samsung PM961 MZVLW256HEHP, IPS, 3000x2000, 13.9" | Lenovo Yoga C940-14IIL 81Q9 i7-1065G7, Iris Plus Graphics G7 (Ice Lake 64 EU), Samsung PM981a MZVLB1T0HBLR, IPS, 3840x2160, 14" | |
|---|---|---|---|---|---|---|
| Power Consumption | 5% | -26% | -5% | -49% | -73% | |
| Idle Minimum * (Watt) | 2.9 | 2.7 7% | 3.6 -24% | 2.6 10% | 3.5 -21% | 5.6 -93% |
| Idle Average * (Watt) | 5.8 | 6 -3% | 7.2 -24% | 5.3 9% | 8.9 -53% | 10.5 -81% |
| Idle Maximum * (Watt) | 6.2 | 6.5 -5% | 10.8 -74% | 7 -13% | 12.3 -98% | 12 -94% |
| Load Average * (Watt) | 32.9 | 32.5 1% | 38 -16% | 43.1 -31% | 54.2 -65% | 53.3 -62% |
| Load Maximum * (Watt) | 48.5 | 35.5 27% | 45.2 7% | 49 -1% | 52.1 -7% | 64.6 -33% |
| Witcher 3 ultra * (Watt) | 43.1 | 42.4 | 46.9 |
* ... Moindre est la valeur, meilleures sont les performances
| LG Gram 14T90N i7-10510U, UHD Graphics 620, 72 Wh | LG Gram 14Z980-U.AAW5U1 i5-8250U, UHD Graphics 620, 72 Wh | Asus ZenBook 14 UM431DA-AM020T R7 3700U, Vega 10, 47 Wh | Dell XPS 13 7390 2-in-1 Core i7 i7-1065G7, Iris Plus Graphics G7 (Ice Lake 64 EU), 51 Wh | Huawei Matebook X Pro i5 i5-8250U, GeForce MX150, 57.4 Wh | Lenovo ThinkPad X1 Carbon G7 20R1-000YUS i7-10510U, UHD Graphics 620, 51 Wh | |
|---|---|---|---|---|---|---|
| Autonomie de la batterie | 5% | -37% | -28% | -26% | -20% | |
| Reader / Idle (h) | 32.8 | 37.3 14% | 17.8 -46% | 20.7 -37% | ||
| WiFi v1.3 (h) | 12.5 | 12 -4% | 6.7 -46% | 9 -28% | 9.3 -26% | 10 -20% |
| Load (h) | 2.6 | 2.7 4% | 2.1 -19% | 2.2 -15% |
Points positifs
Points négatifs
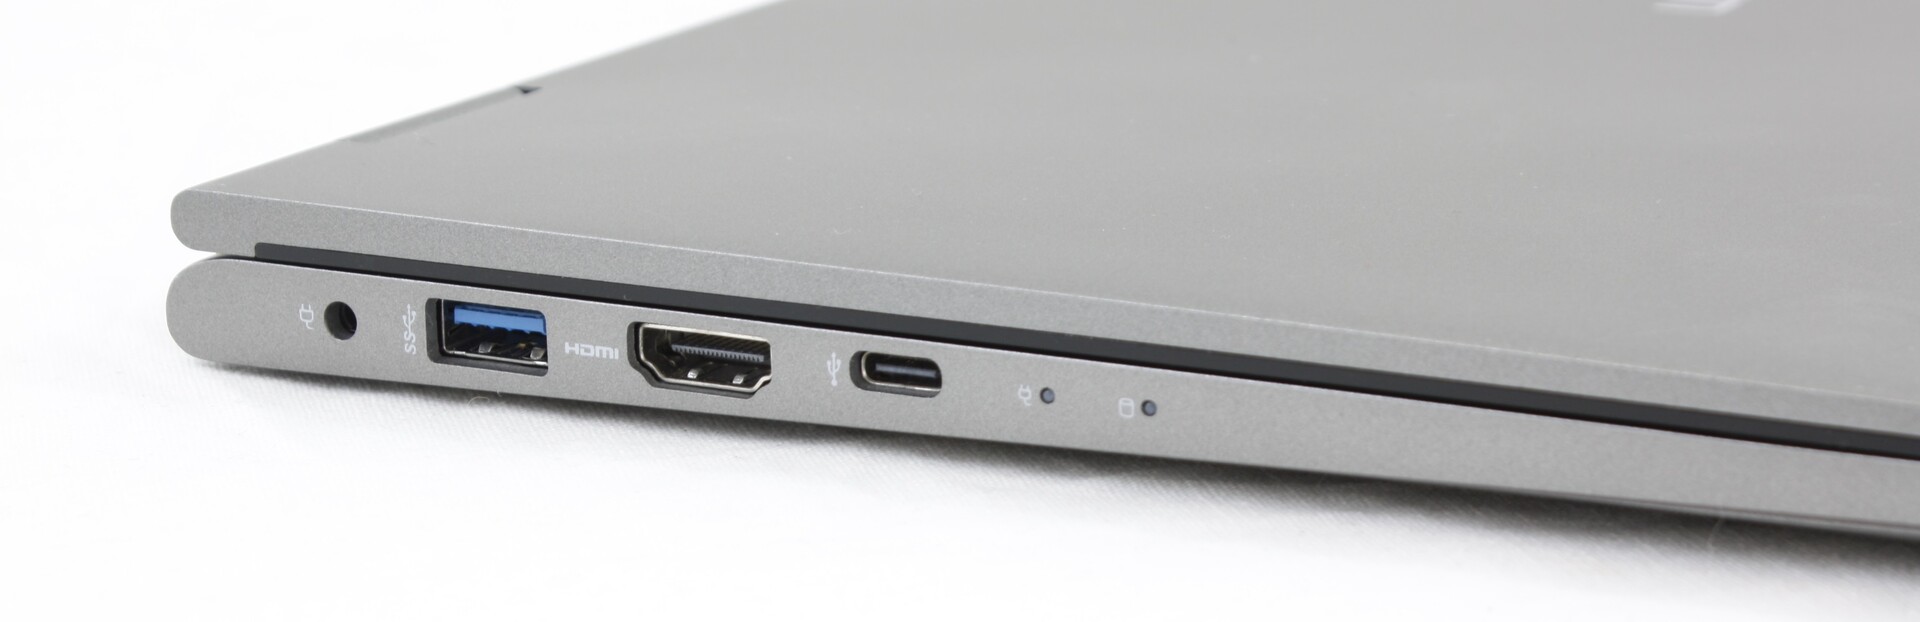
La différence entre l’ancien LG Gram14T990 et le nouveau LG Gram 14TN90N est minimale. Le passage à un nouveau processeur est à peine visible, ce qui fait du nouveau port Thunderbolt 3 la seule différence notable entre les deux modèles. Ceux qui utiliseraient ce port, par exemple pour une station d’accueil ou un écran externe, pourront être séduits par le Gram 14T90N. Les autres pourront économiser quelques centaines d’euros, et conserver ou choisir le Gram 14T990.
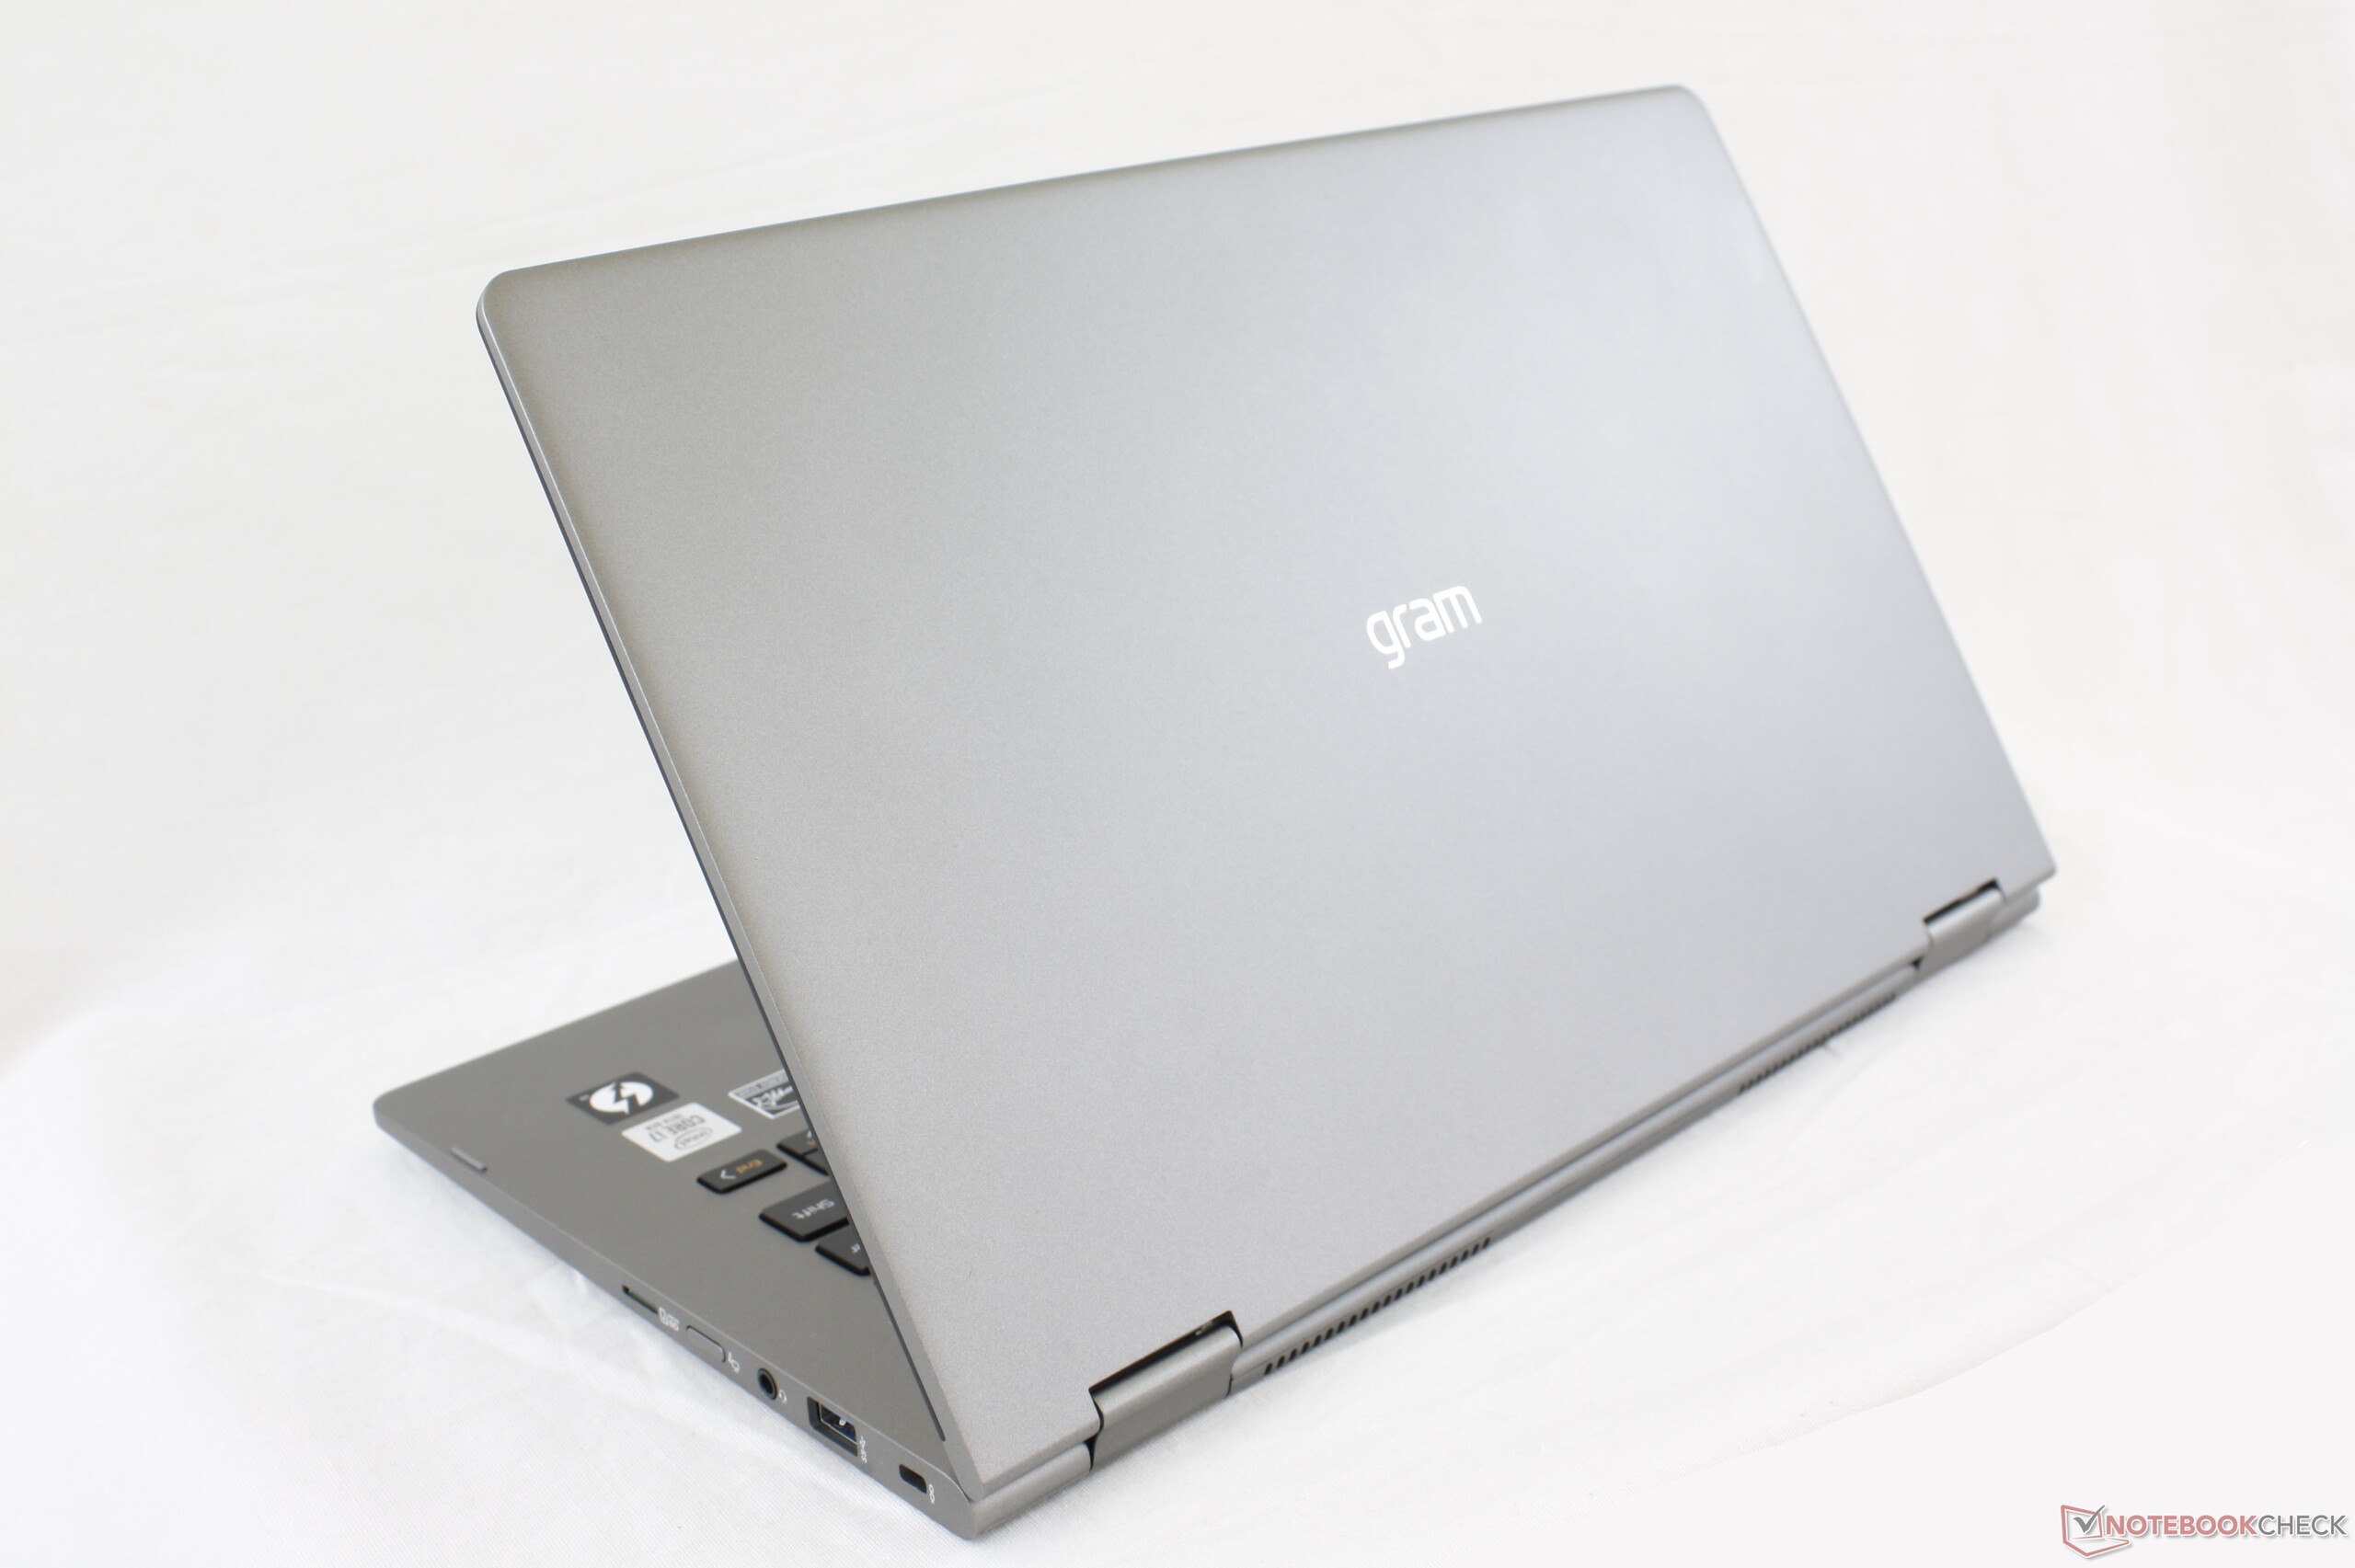
Le convertible LG possède néanmoins quelques avantages sur la concurrence. Son poids plume le rend plus facile à utiliser en mode tablette que le ZenBook 14 Flip par exemple, et les deux emplacements de stockage sont une rareté vu la catégorie de la machine. Mais même avec ces arguments, le système semble sous-équipé pour son prix, surtout en ce qui concerne les graphismes, tandis que des fonctionnalités comme un cache de webcam ou une webcam infrarouge sont tout simplement absentes. Un processeur Core i7 Ice lake aurait peut-être fait mieux les choses, vu l’audience-cible de la machine. L’écran aurait également pu être plus lumineux, pour rendre la lecture à l’extérieur plus confortable.
Le Gram 14T90N est un convertible à 1 400 € avec un processeur bridé et rien pour se démarquer. Il faudra exploiter poids, son autonomie et son port Thunderbolt 3 pour en tirer profit…
L’intégralité de cette critique est disponible en anglais en suivant LG Gram 14T90N.
LG Gram 14T90N
- 04/06/2020 v7 (old)
Allen Ngo
Price comparison
