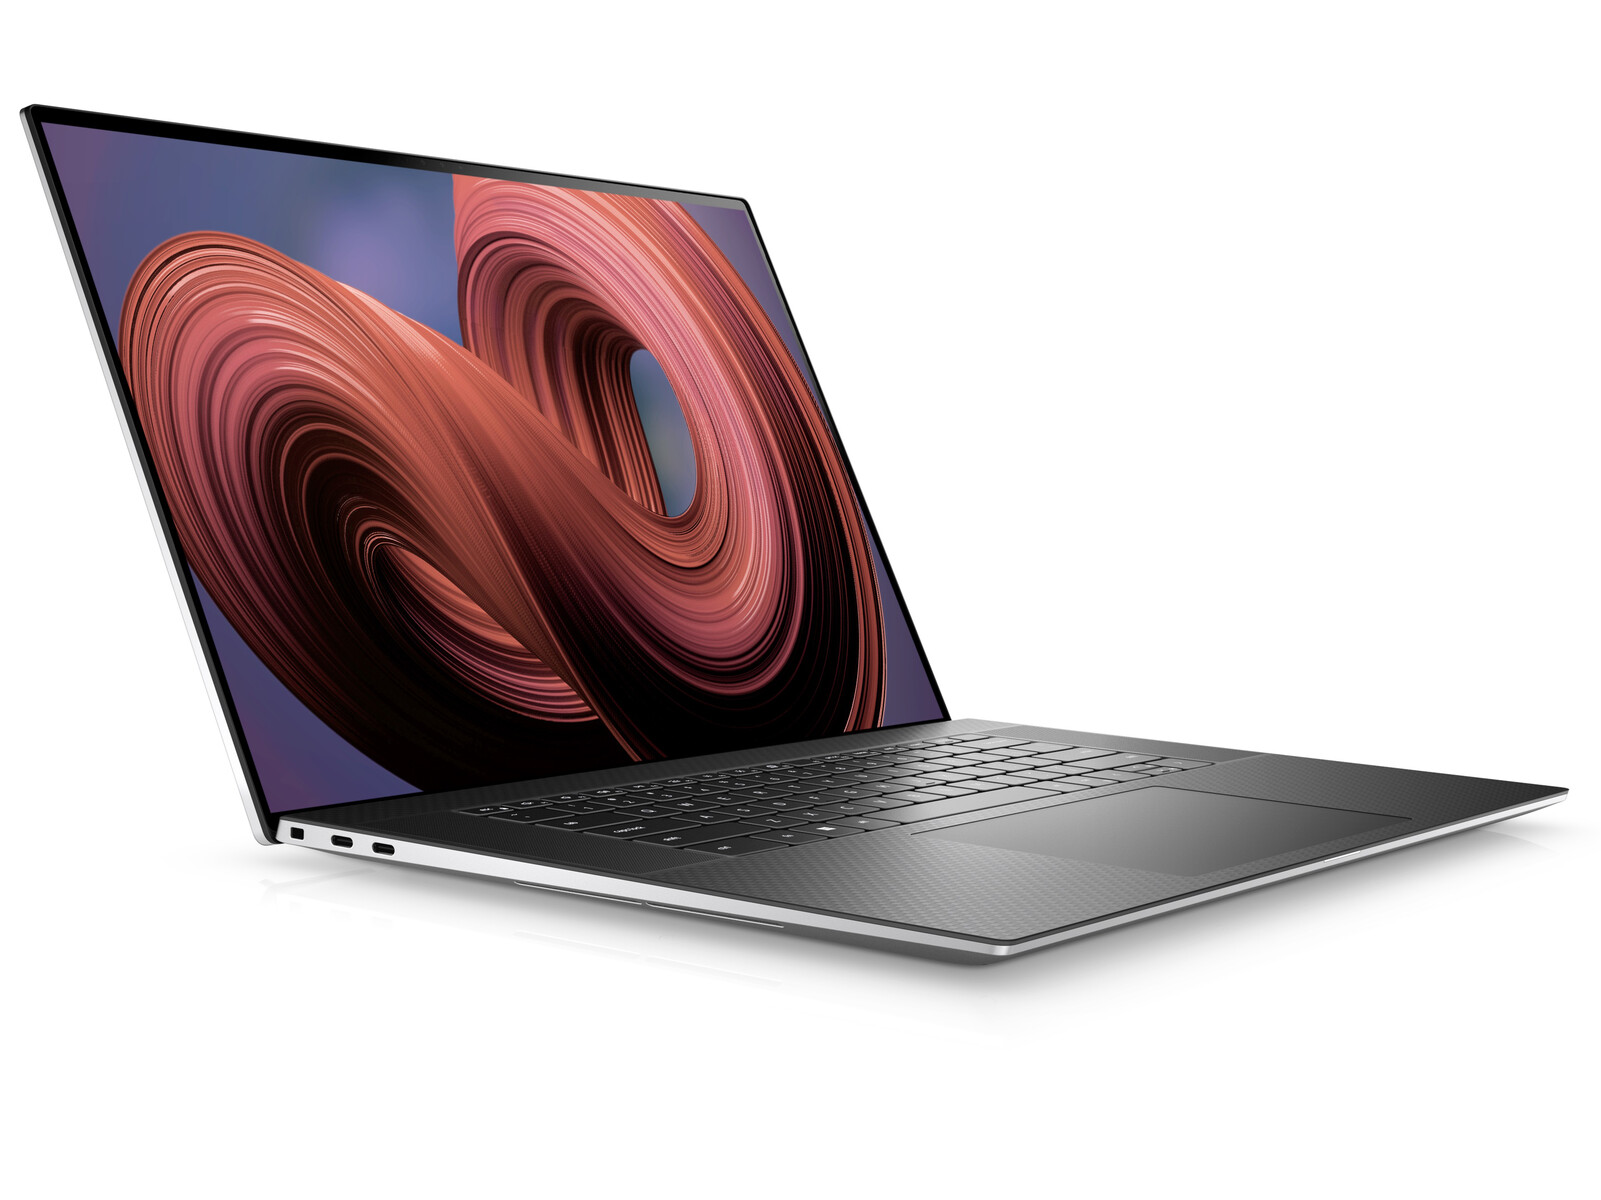
Test du Dell XPS 17 9730 : le monstre multimédia RTX 4070

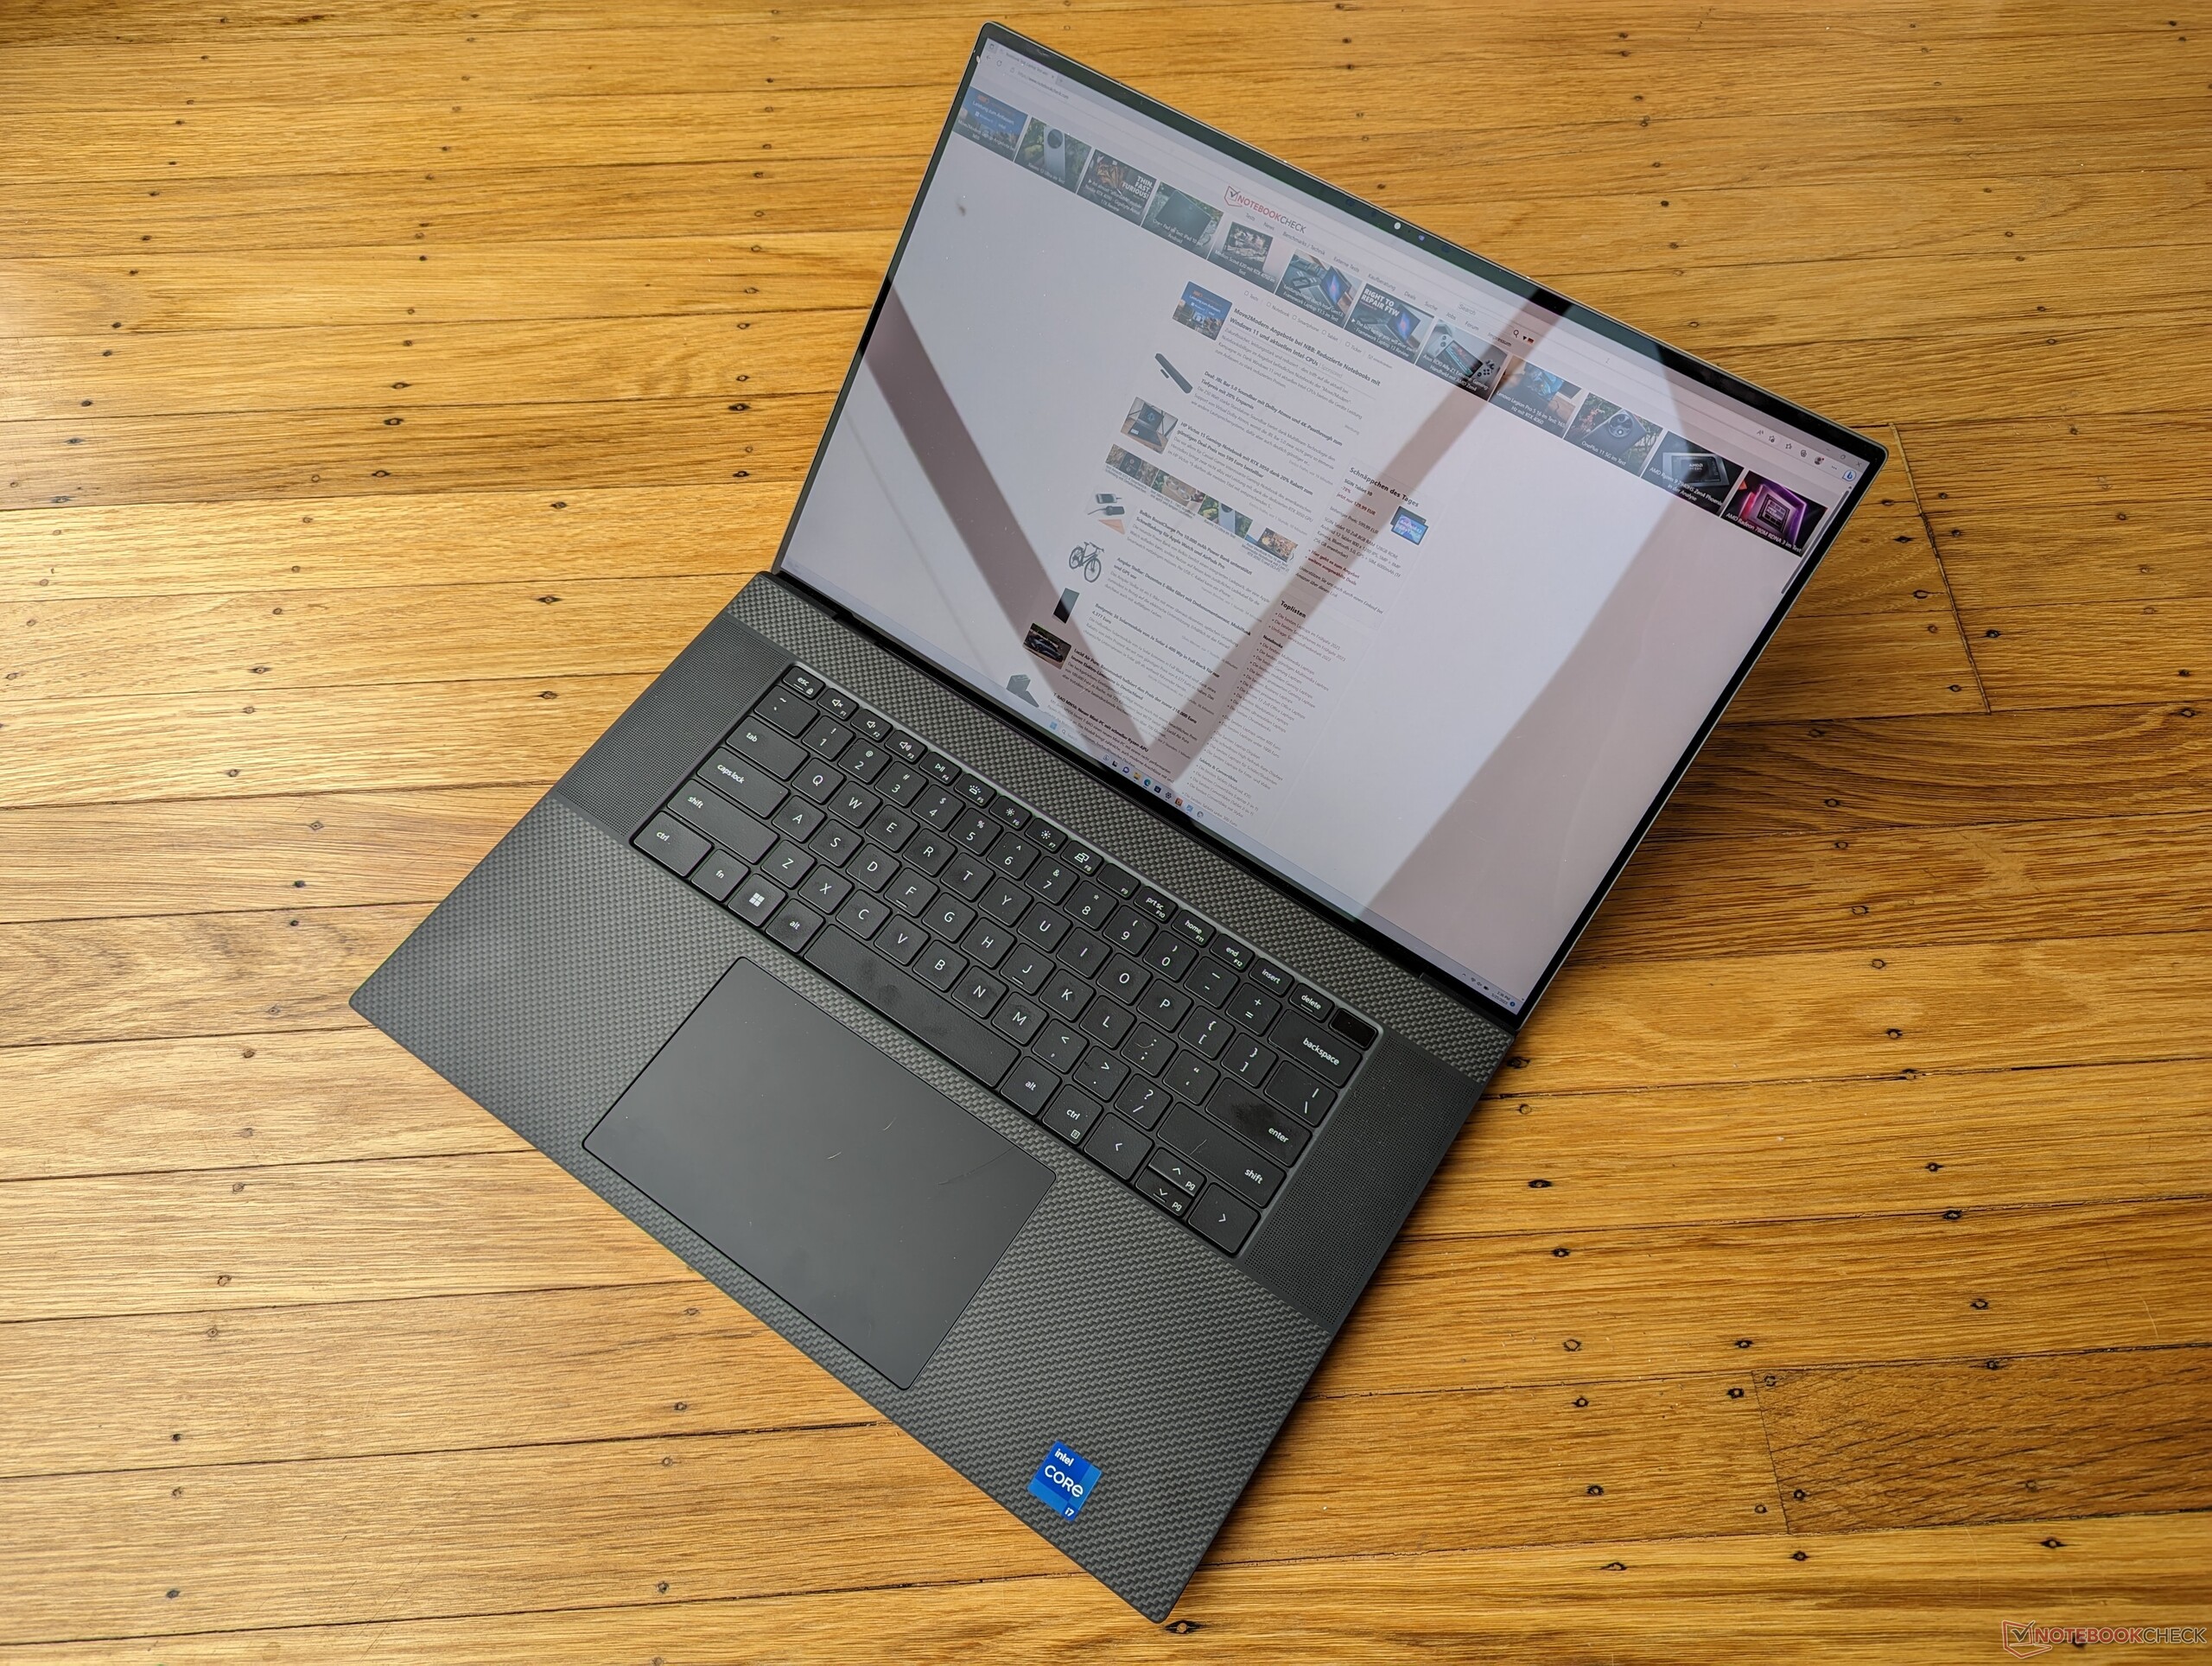
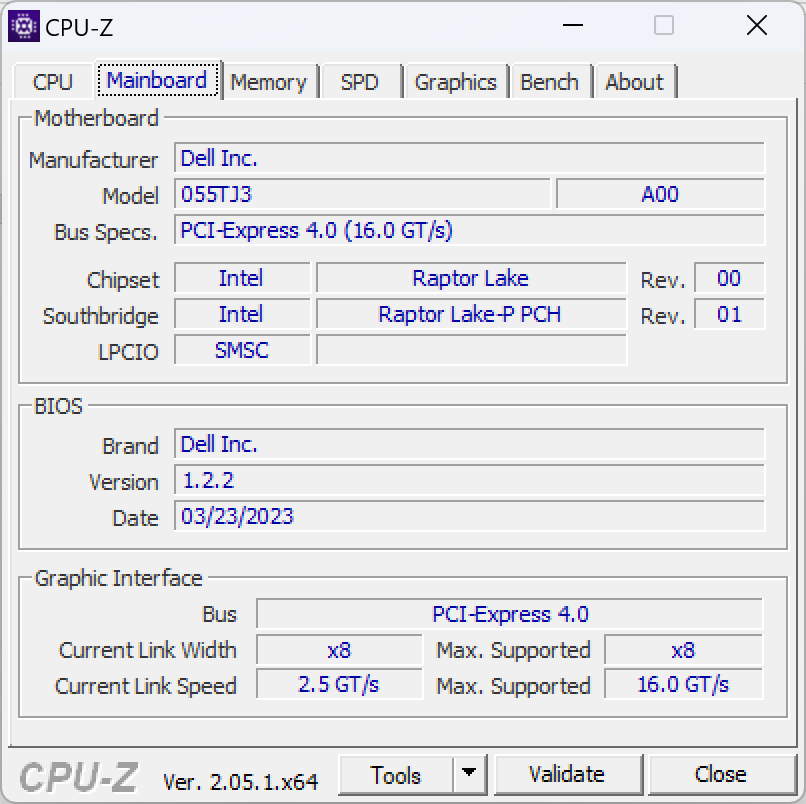
Le XPS 17 9730 2023 est la quatrième itération du xPS 17 9700 de 2020 de 2020. Il s'agit d'une mise à jour interne avec des CPU Intel Raptor Lake-H de 13ème génération et des GPU Nvidia Ada Lovelace pour remplacer les options Alder Lake-H et Ampere de 12ème génération de l'année dernière, respectivement. Il n'y a pas d'autres changements superficiels majeurs et nous recommandons donc de consulter notre revue sur le xPS 17 9700 original pour en savoir plus sur les caractéristiques physiques de l'ordinateur portable. Toute nouvelle conception devrait s'inspirer de la série des récents XPS 13 Plus.
Notre configuration spécifique est un modèle haut de gamme avec le Core i7-13700H, GeForce RTX 4070, et un écran tactile UHD+ 2400p brillant pour un prix de détail d'environ 3500 USD. D'autres modèles sont disponibles avec les RTX 4050, RTX 4060, RTX 4080, Core i9-13900H, ou un écran 1200p mat. Il est intéressant de noter que toutes les configurations doivent être accompagnées d'une carte graphique discrète, alors que les modèles XPS 17 précédents proposaient des options UHD ou Iris Xe intégrées moins chères.
Les concurrents dans ce domaine comprennent d'autres ordinateurs portables multimédias de 17 pouces comme le LG Gram 17, HP Envy 17,MSI Creator Z17ou le MacBook Pro 16 poucesApple MacBook Pro 16.
Plus d'avis sur Dell :
Comparaison avec les concurrents potentiels
Note | Date | Modèle | Poids | Épaisseur | Taille | Résolution | Prix |
|---|---|---|---|---|---|---|---|
| 90 % v7 (old) | 05/23 | Dell XPS 17 9730 RTX 4070 i7-13700H, GeForce RTX 4070 Laptop GPU | 2.5 kg | 19.5 mm | 17.00" | 3840x2400 | |
| 88.8 % v7 (old) | 06/22 | Dell XPS 17 9720 RTX 3060 i7-12700H, GeForce RTX 3060 Laptop GPU | 2.5 kg | 19.5 mm | 17.00" | 3840x2400 | |
| 86.4 % v7 (old) | 05/23 | LG Gram 17 (2023) i7-1360P, Iris Xe G7 96EUs | 1.4 kg | 17.8 mm | 17.00" | 2560x1600 | |
| 86.3 % v7 (old) | 04/23 | HP Envy 17-cr0079ng i7-1255U, GeForce RTX 2050 Mobile | 2.6 kg | 19.6 mm | 17.30" | 3840x2160 | |
| 83.8 % v7 (old) | 09/22 | MSI Creator Z17 A12UGST-054 i9-12900H, GeForce RTX 3070 Ti Laptop GPU | 2.5 kg | 19 mm | 17.00" | 2560x1600 | |
| 93.7 % v7 (old) | 03/23 | Apple MacBook Pro 16 2023 M2 Max M2 Max, M2 Max 38-Core GPU | 2.2 kg | 16.8 mm | 16.20" | 3456x2234 |
Cas - Le même modèle trois années de suite
Lecteur de carte SD
| SD Card Reader | |
| average JPG Copy Test (av. of 3 runs) | |
| Dell XPS 17 9720 RTX 3060 (Toshiba Exceria Pro SDXC 64 GB UHS-II) | |
| Dell XPS 17 9730 RTX 4070 (Toshiba Exceria Pro SDXC 64 GB UHS-II) | |
| Apple MacBook Pro 16 2023 M2 Max (Angelbird AV Pro V60) | |
| MSI Creator Z17 A12UGST-054 (AV Pro SD microSD 128 GB V60) | |
| HP Envy 17-cr0079ng (AV Pro SD microSD 128 GB V60) | |
| LG Gram 17 (2023) (AV Pro SD microSD 128 GB V60) | |
| maximum AS SSD Seq Read Test (1GB) | |
| Apple MacBook Pro 16 2023 M2 Max (Angelbird AV Pro V60) | |
| Dell XPS 17 9730 RTX 4070 (Toshiba Exceria Pro SDXC 64 GB UHS-II) | |
| Dell XPS 17 9720 RTX 3060 (Toshiba Exceria Pro SDXC 64 GB UHS-II) | |
| LG Gram 17 (2023) (AV Pro SD microSD 128 GB V60) | |
| MSI Creator Z17 A12UGST-054 (AV Pro SD microSD 128 GB V60) | |
| HP Envy 17-cr0079ng (AV Pro SD microSD 128 GB V60) | |
Communication - Pas de Wi-Fi 6E
Les XPS 15 et XPS 17 restent les seuls ordinateurs portables de mémoire récente à être livrés avec des modules WLAN Wi-Fi 6E sans pour autant prendre en charge la connectivité Wi-Fi 6E. Vous ne pourrez donc pas vous connecter aux réseaux Wi-Fi 6 GHz. Cela ne devrait pas être un problème majeur pour la plupart des utilisateurs, mais c'est tout de même décevant pour un ordinateur portable coûtant plus de 3500 $.
| Networking | |
| iperf3 transmit AXE11000 | |
| LG Gram 17 (2023) | |
| Dell XPS 17 9720 RTX 3060 | |
| HP Envy 17-cr0079ng | |
| Dell XPS 17 9730 RTX 4070 | |
| iperf3 receive AXE11000 | |
| LG Gram 17 (2023) | |
| HP Envy 17-cr0079ng | |
| Dell XPS 17 9720 RTX 3060 | |
| Dell XPS 17 9730 RTX 4070 | |
| iperf3 transmit AXE11000 6GHz | |
| Apple MacBook Pro 16 2023 M2 Max | |
| LG Gram 17 (2023) | |
| HP Envy 17-cr0079ng | |
| MSI Creator Z17 A12UGST-054 | |
| iperf3 receive AXE11000 6GHz | |
| Apple MacBook Pro 16 2023 M2 Max | |
| MSI Creator Z17 A12UGST-054 | |
| HP Envy 17-cr0079ng | |
| LG Gram 17 (2023) | |
Webcam - Seulement 720p
Les XPS 15 et XPS 17 sont probablement les seuls ordinateurs portables phares à être encore livrés avec des webcams basse résolution de 1 MP ou 720p et sans obturateur de confidentialité. Les fabricants concurrents comme Lenovo, HP, Asus et d'autres sont déjà passés à des solutions de 2 MP ou même de 8 MP. Dell explique que le cadre très étroit de l'écran du XPS limite la qualité du capteur de la webcam.


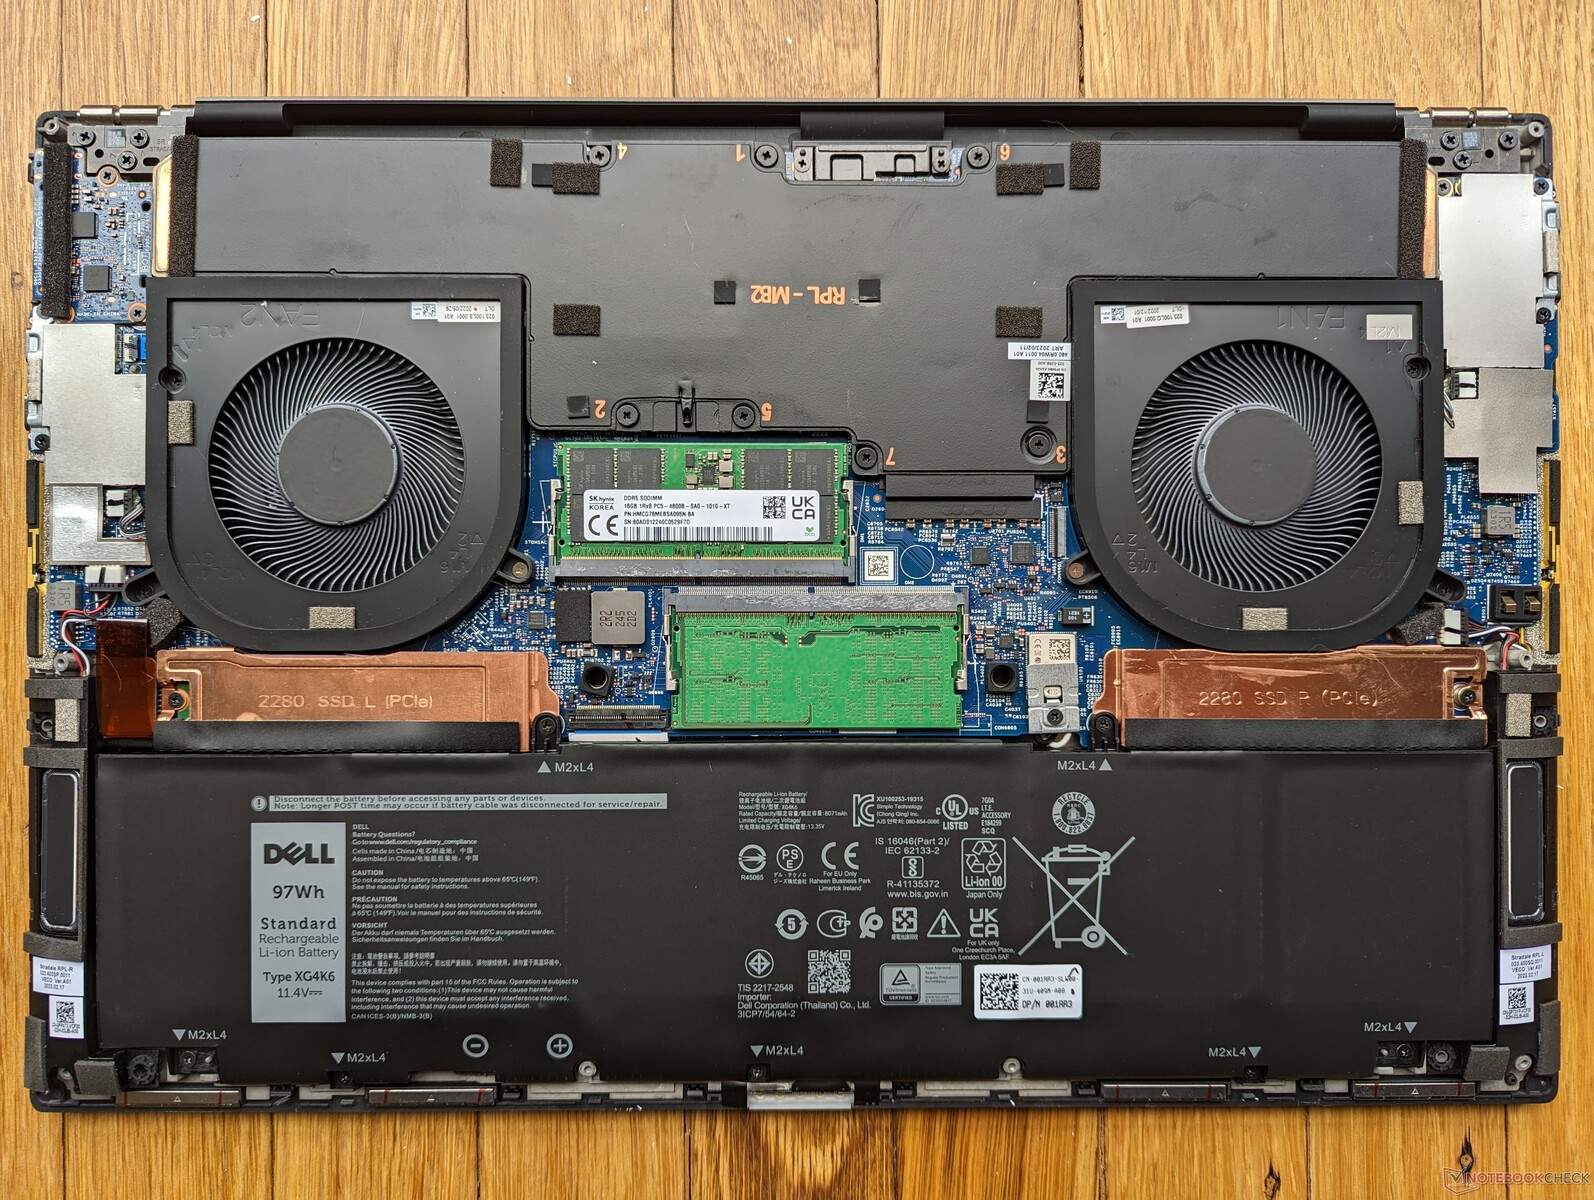
Maintenance
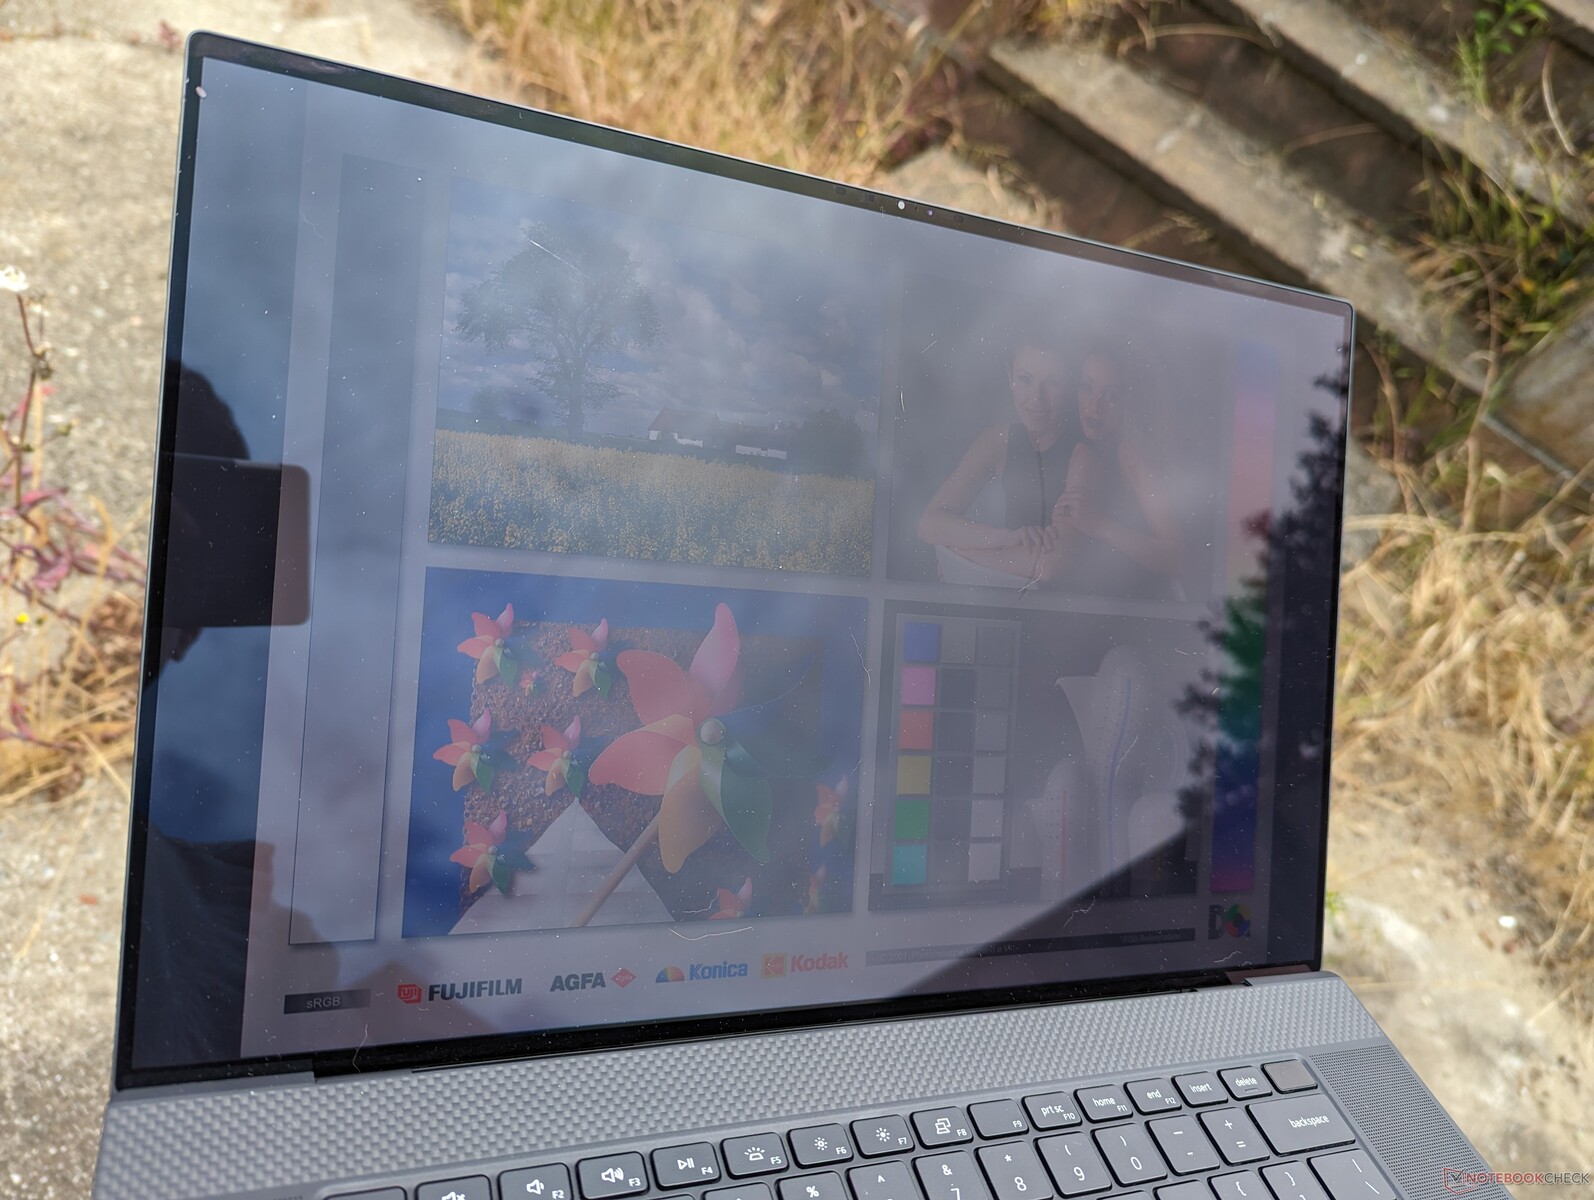
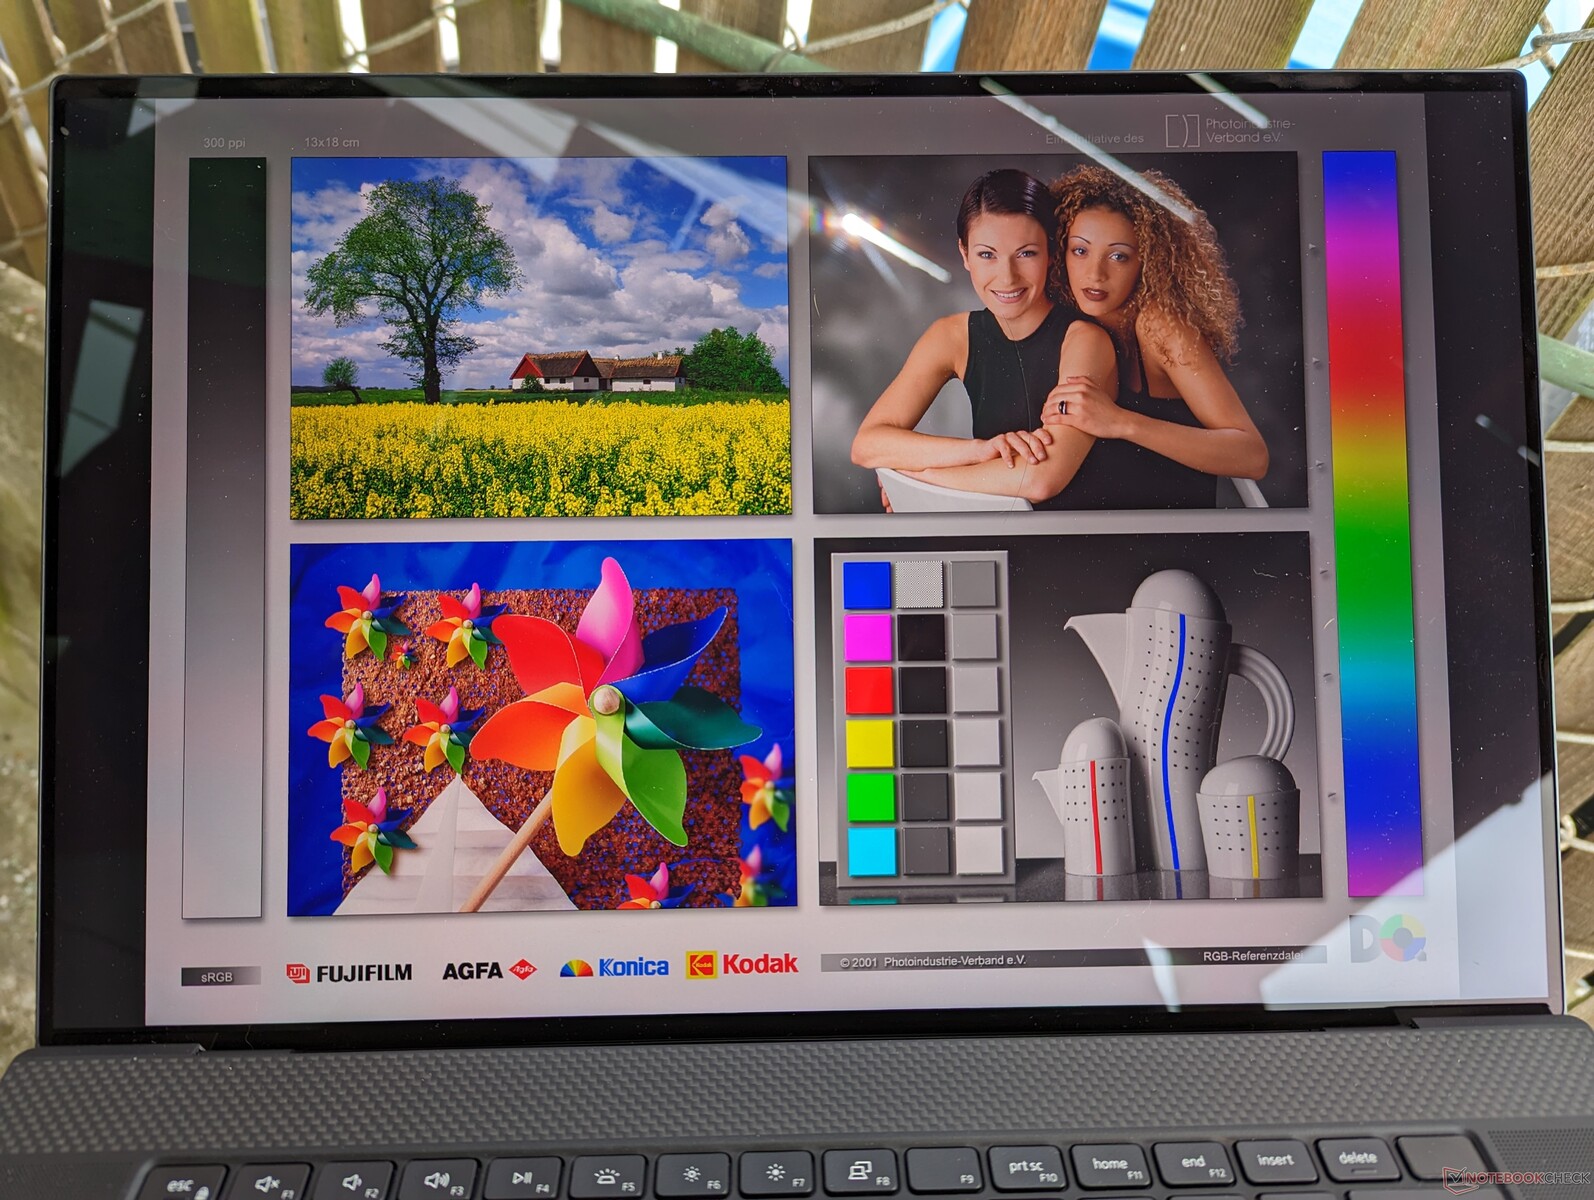
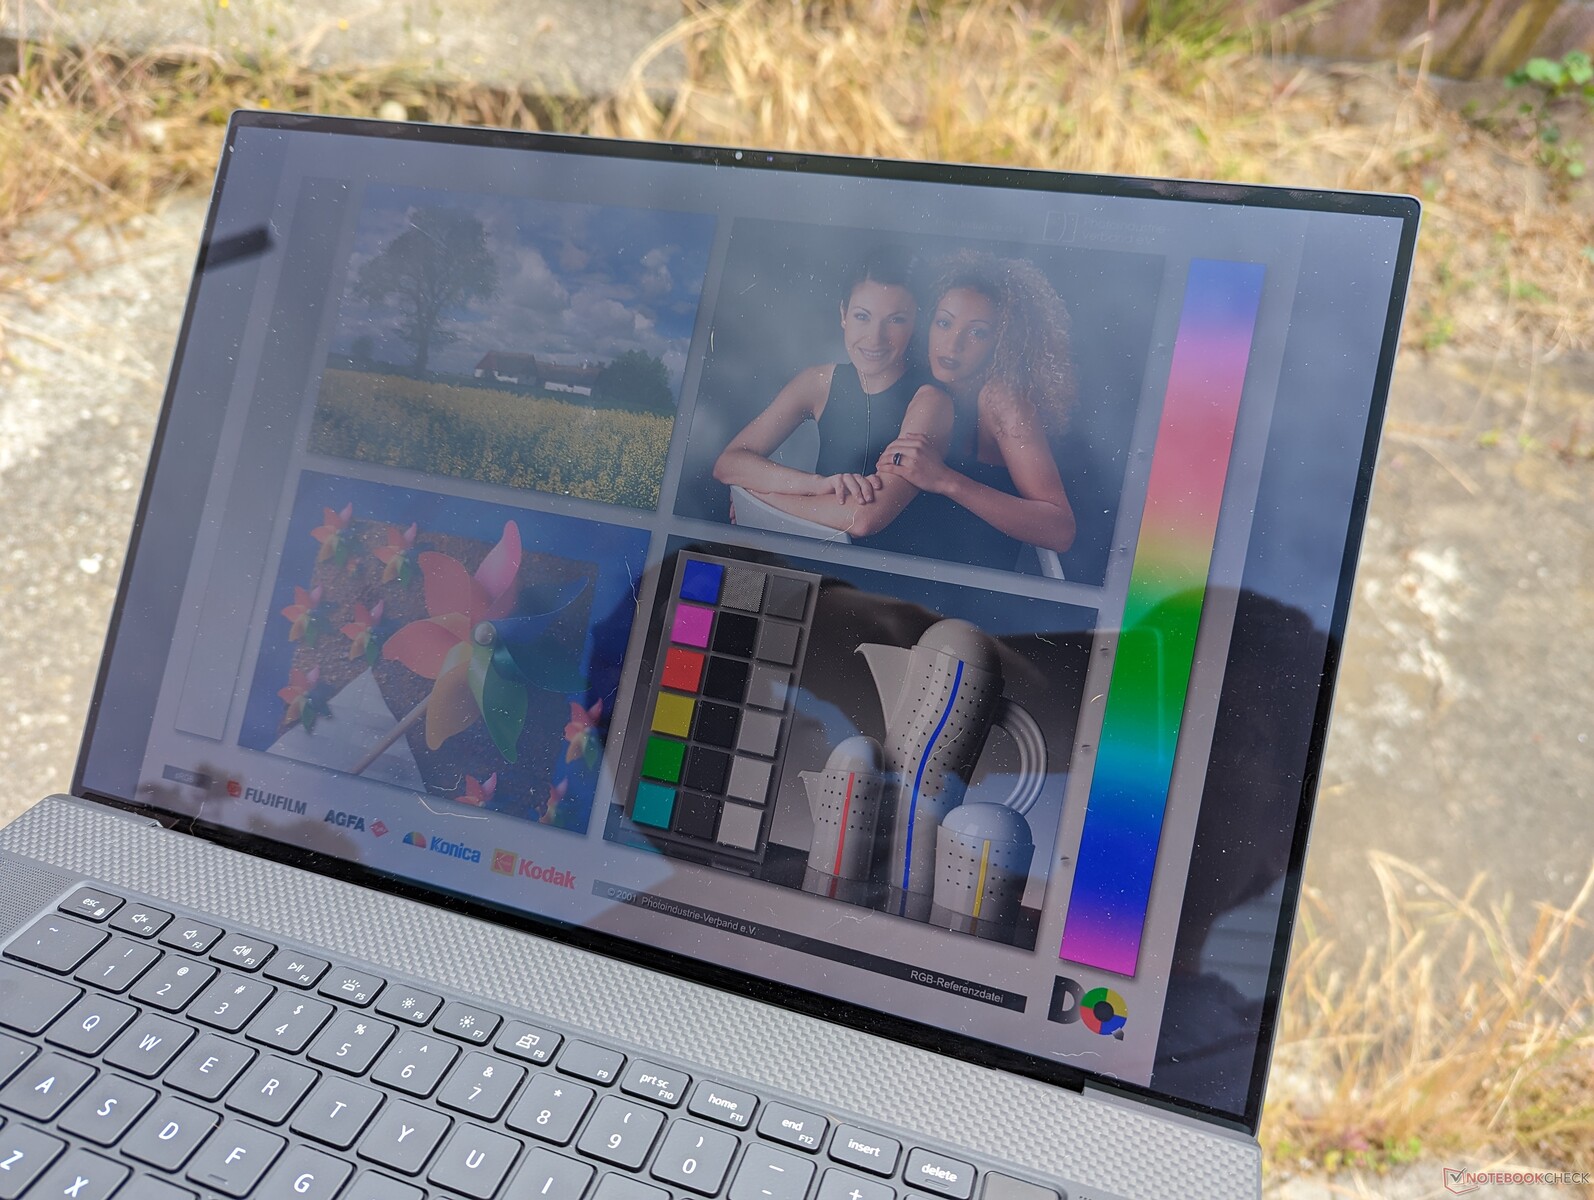
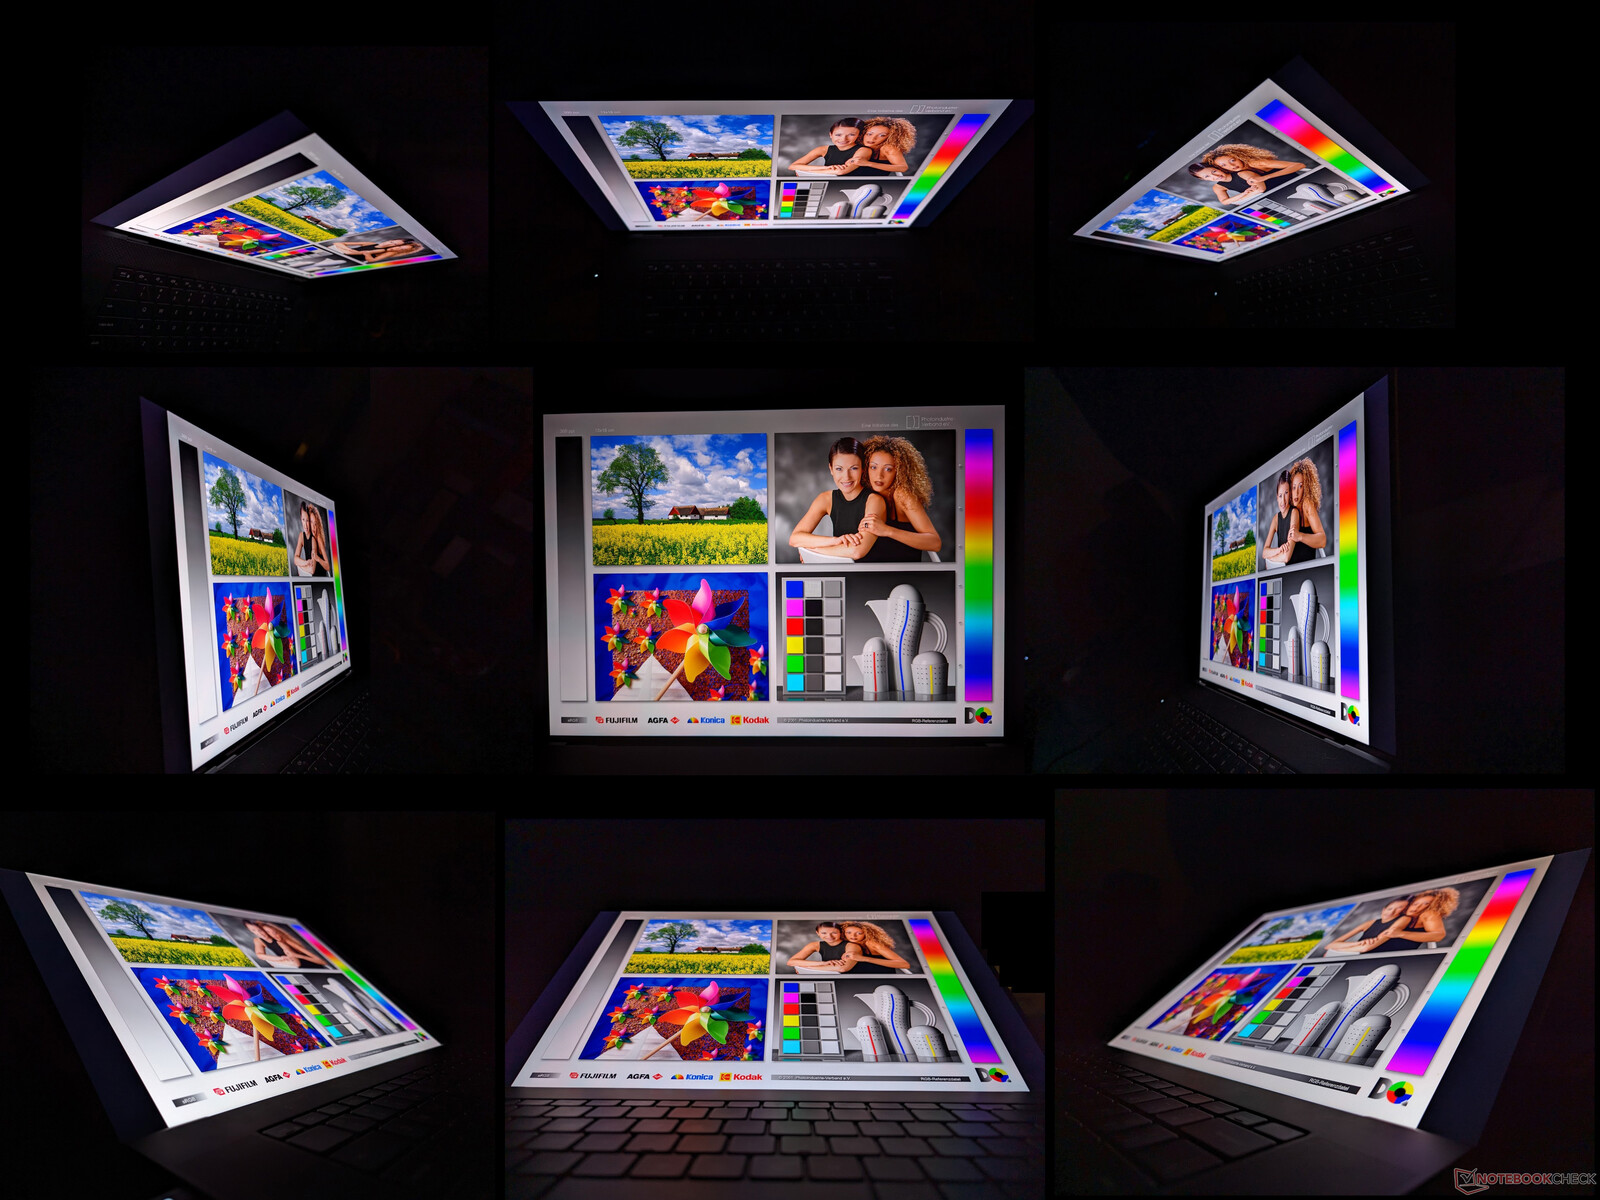
Affichage - Toujours bon, mais pas d'option 120 Hz
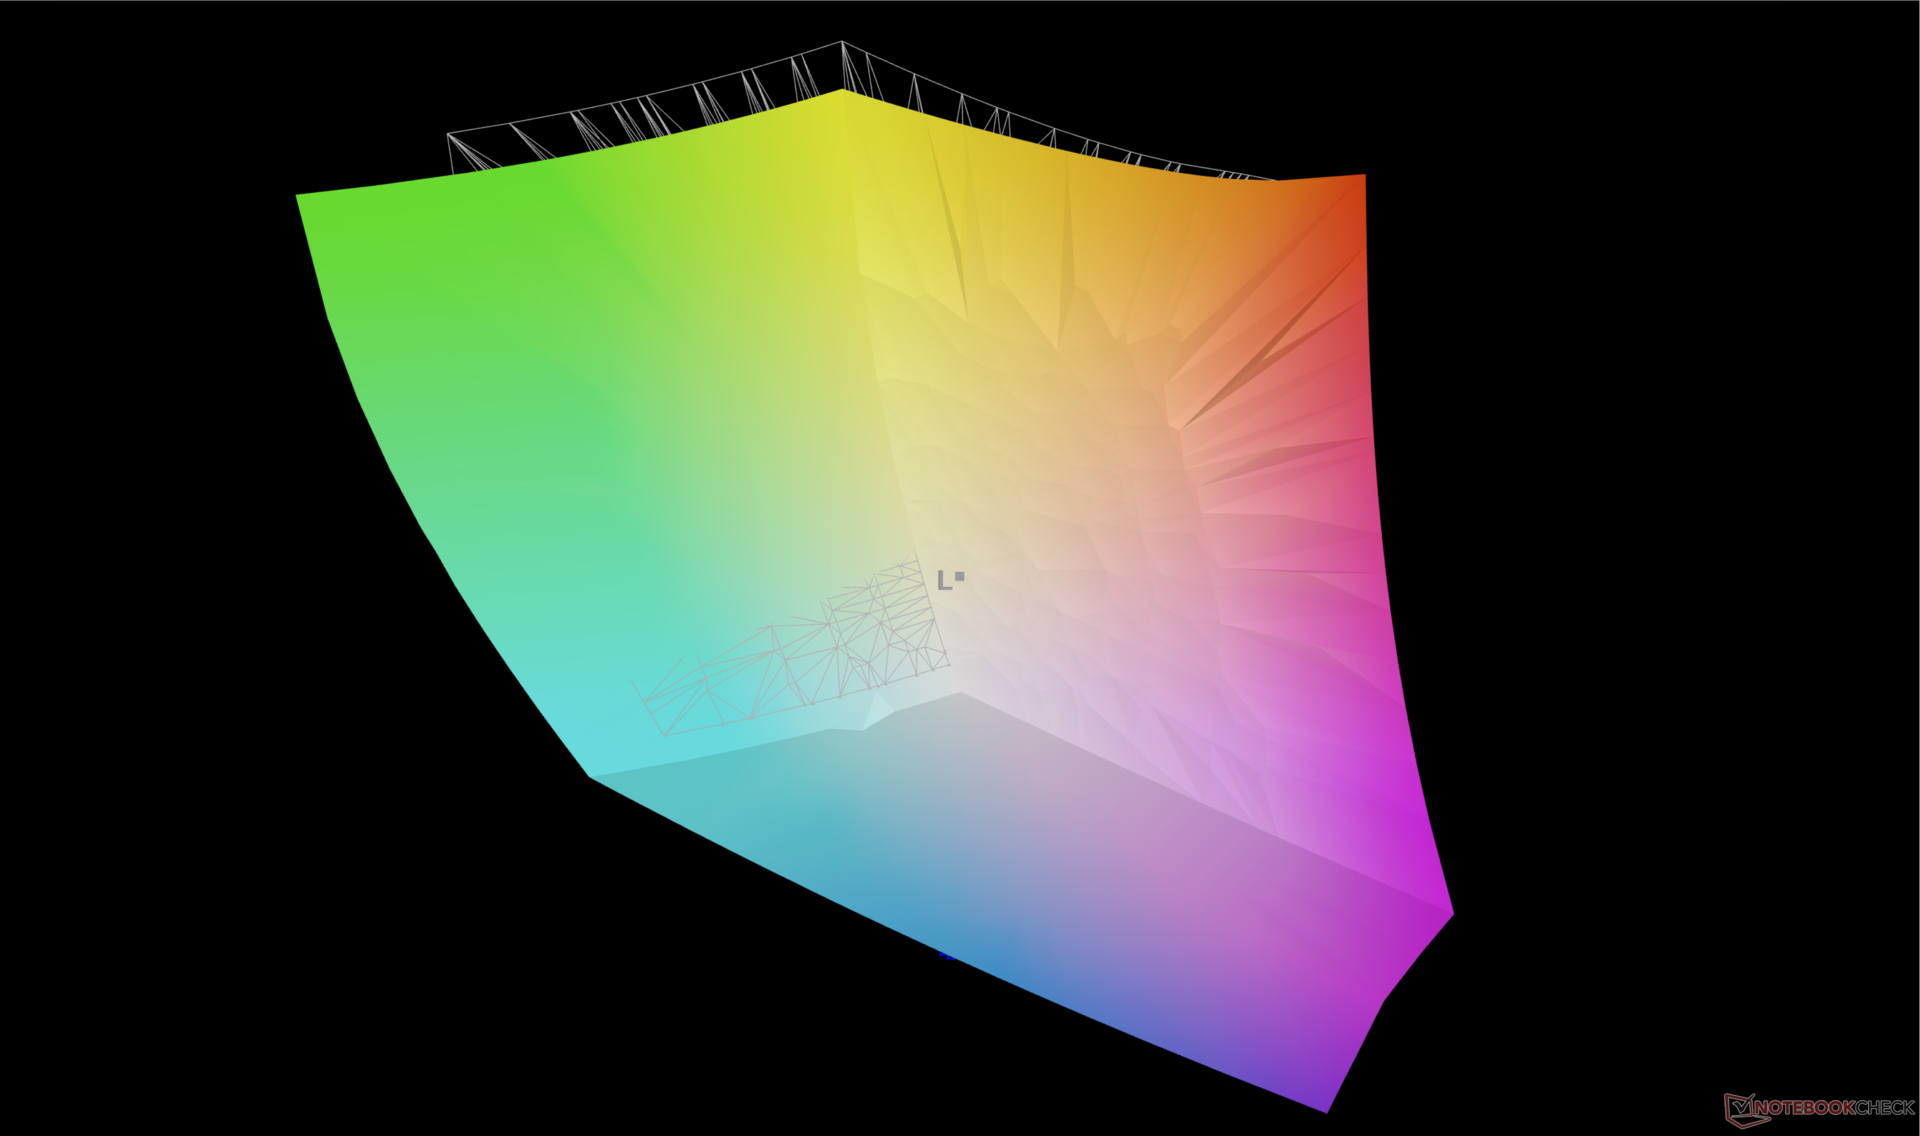
Dell utilise exactement le même écran tactile IPS Sharp LQ170R1 de 17,0 pouces pour sa série XPS 17 depuis le modèle original de 2020. L'expérience visuelle est donc restée identique depuis lors et nous vous recommandons de consulter nos avis sur les modèles 9720, 9710ou 9700 pour en savoir plus sur l'écran. Bien que les couleurs DCI-P3, la luminosité maximale, la résolution UHD+ et le rapport de contraste de 1500:1 soient encore excellents aujourd'hui, le taux de rafraîchissement de 60 Hz commence à montrer des signes de fatigue, car les écrans de 90 Hz ou plus sont de plus en plus répandus sur d'autres ordinateurs portables multimédias, comme le Asus ZenBook 14 ou le Lenovo Slim 7i.

| |||||||||||||||||||||||||
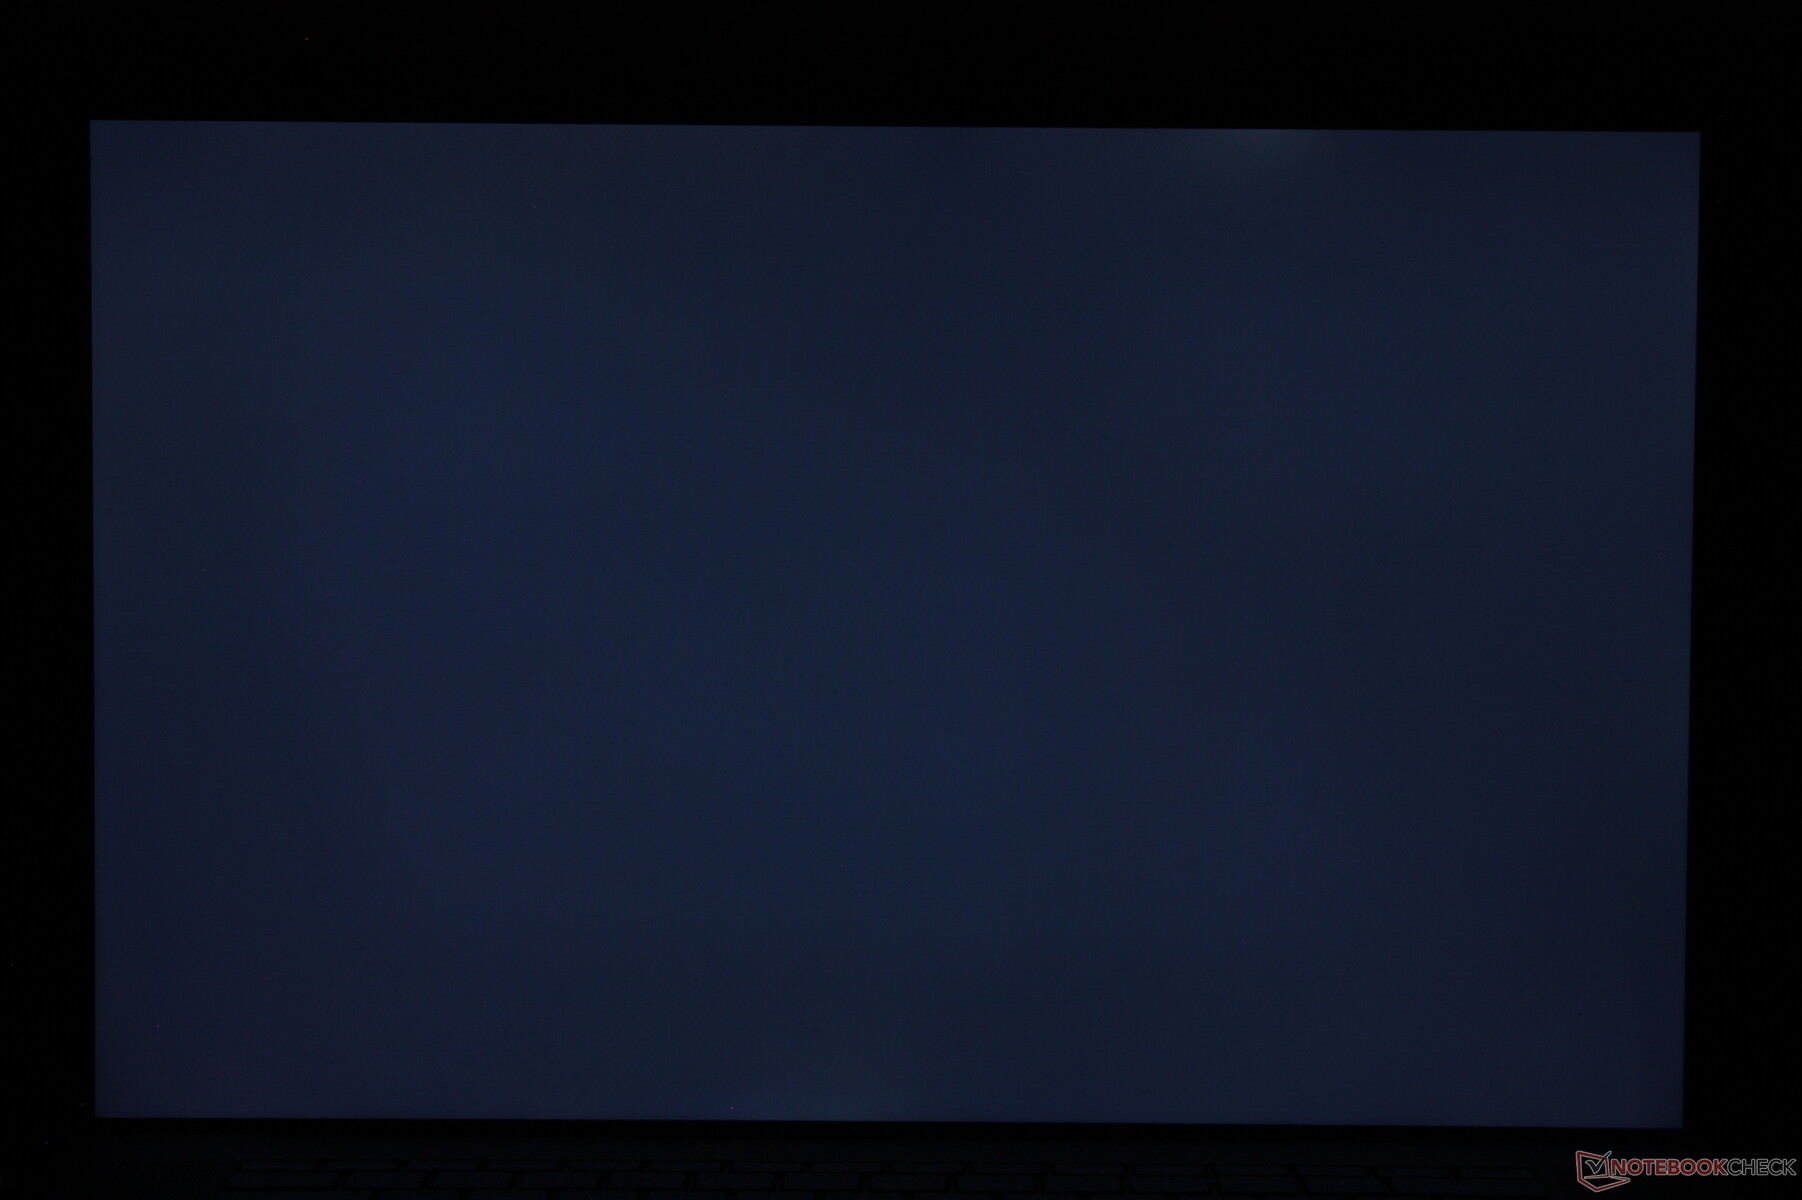
Homogénéité de la luminosité: 85 %
Valeur mesurée au centre, sur batterie: 457.4 cd/m²
Contraste: 1475:1 (Valeurs des noirs: 0.31 cd/m²)
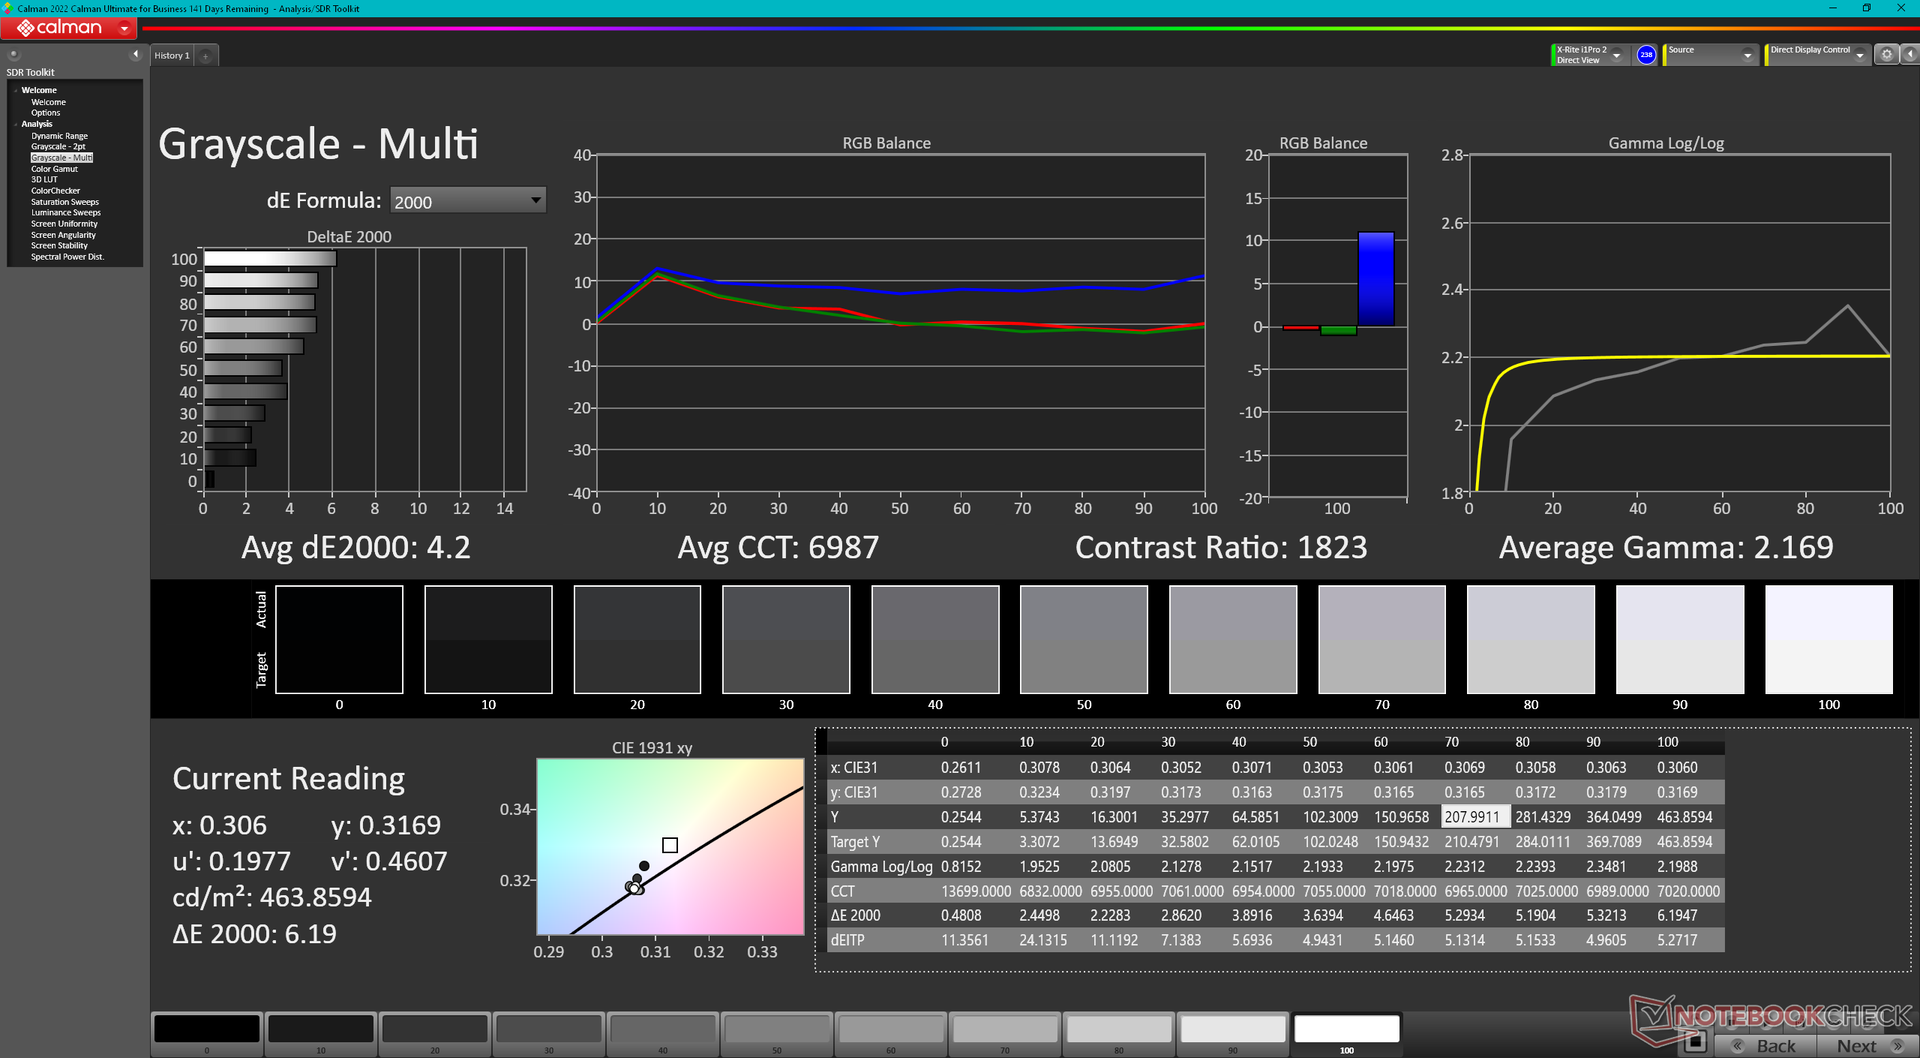
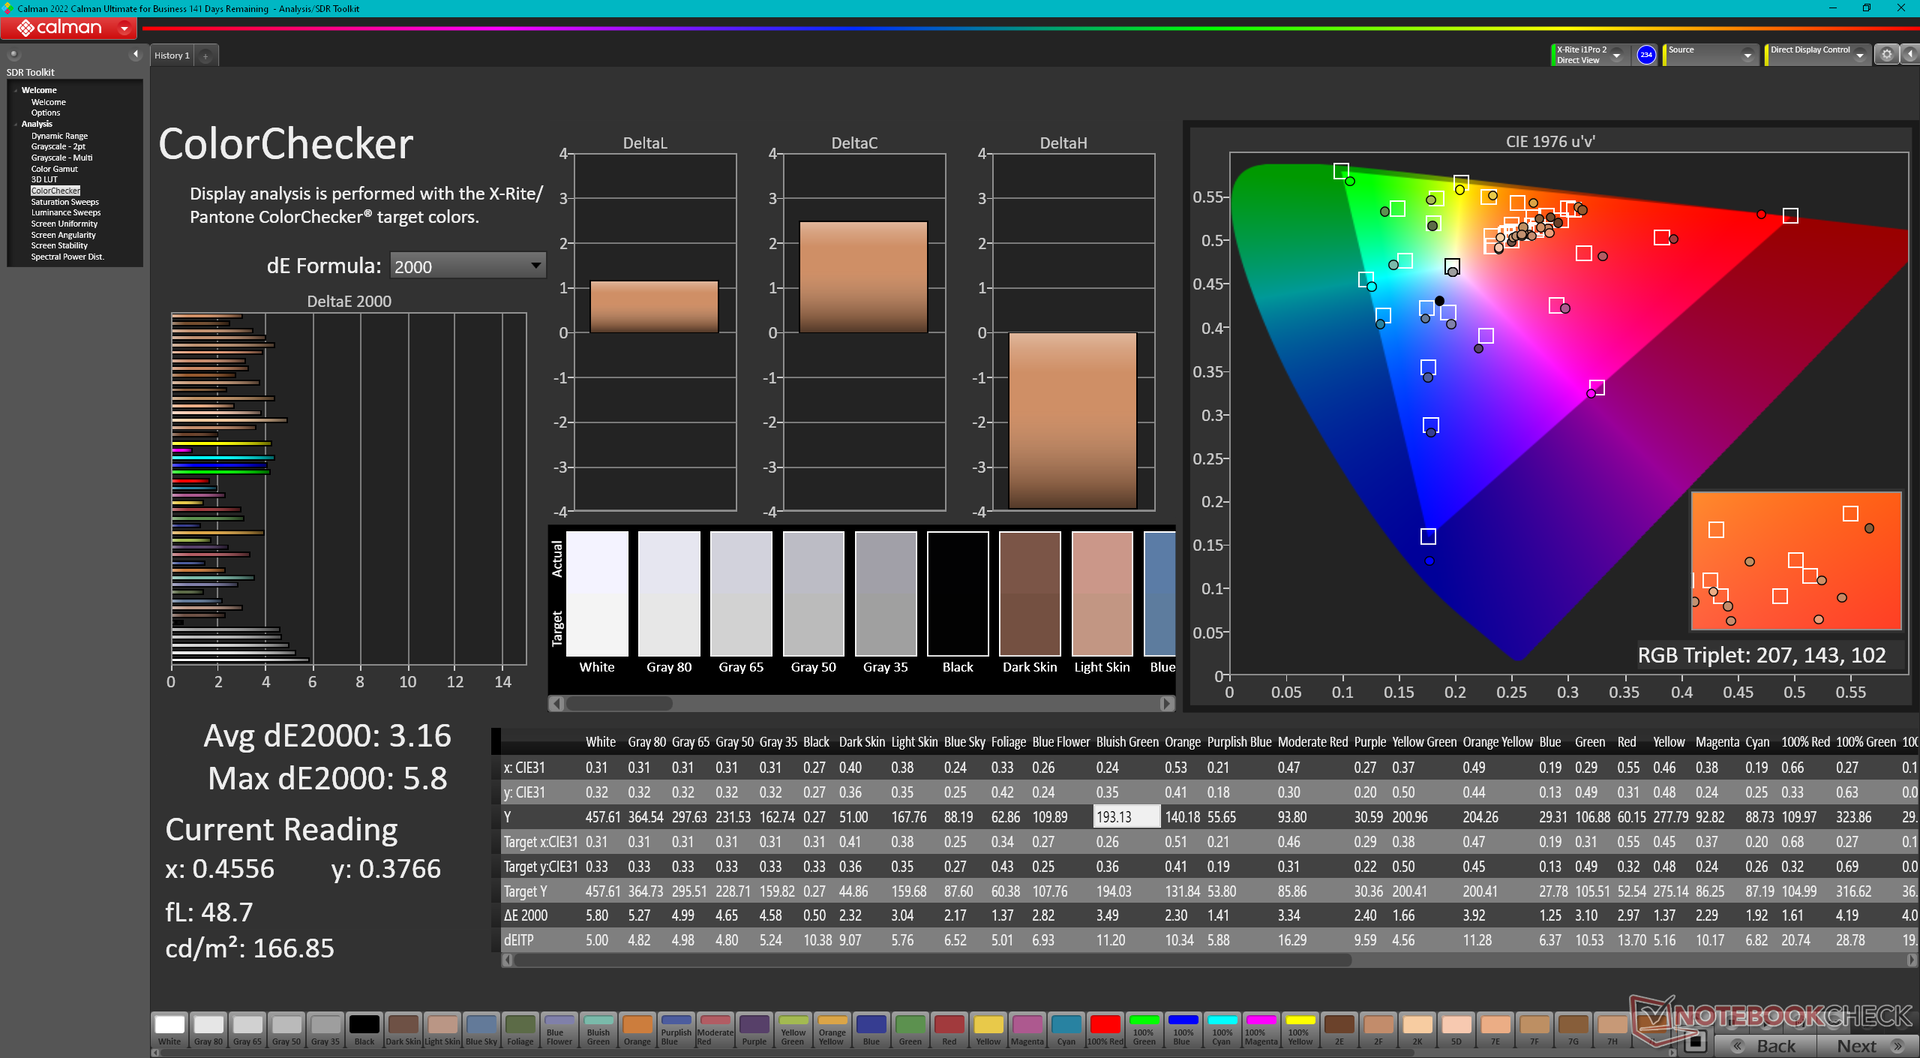
ΔE ColorChecker Calman: 3.16 | ∀{0.5-29.43 Ø4.71}
ΔE Greyscale Calman: 4.2 | ∀{0.09-98 Ø4.96}
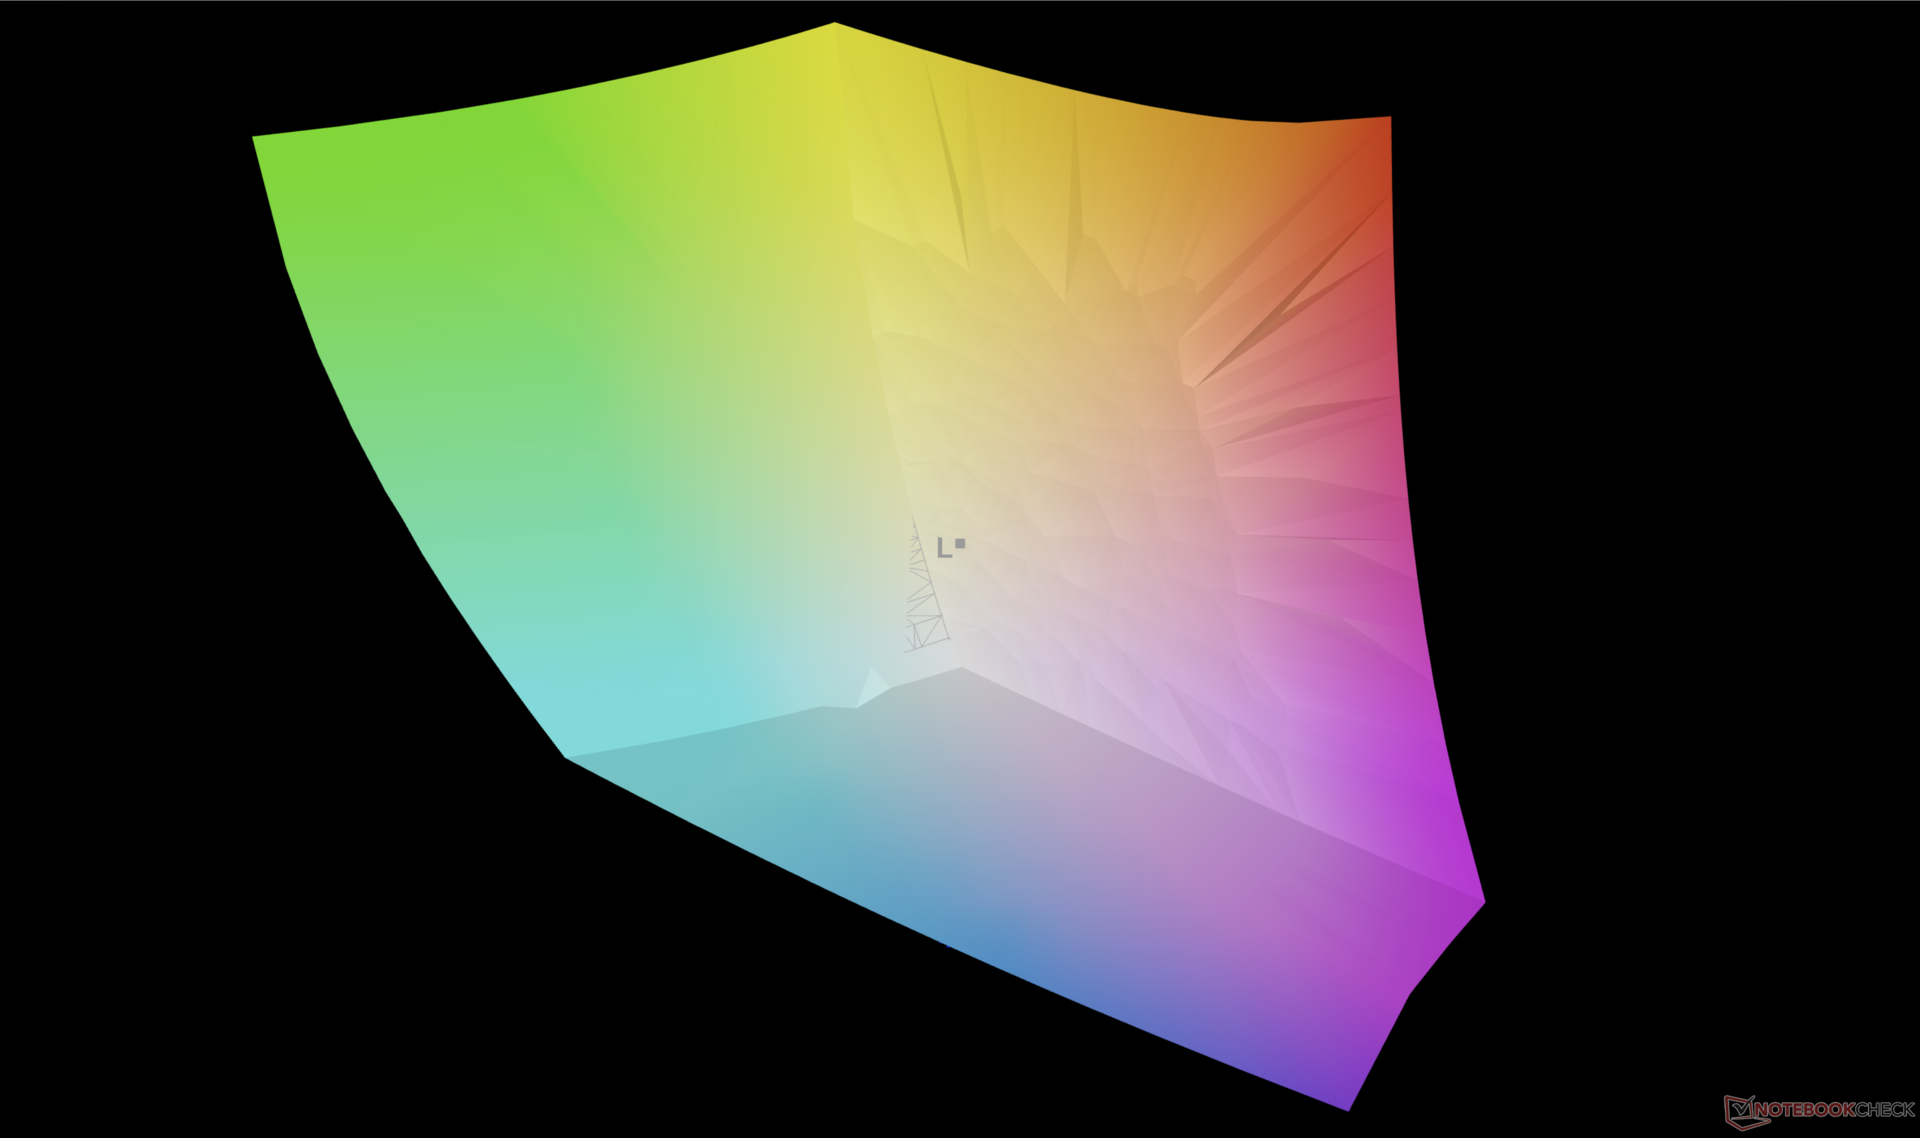
100% AdobeRGB 1998 (Argyll 3D)
100% sRGB (Argyll 3D)
95.2% Display P3 (Argyll 3D)
Gamma: 2.17
CCT: 6987 K
| Dell XPS 17 9730 RTX 4070 10-point capacitive, Sharp LQ170R1, 3840x2400, 17" | Dell XPS 17 9720 RTX 3060 Sharp LQ170R1, IPS, 3840x2400, 17" | LG Gram 17 (2023) LG Display LP170WQ1-SPF2, IPS, 2560x1600, 17" | HP Envy 17-cr0079ng BOE0A66, IPS, 3840x2160, 17.3" | MSI Creator Z17 A12UGST-054 AUO3C9B (B170QAN01.0), IPS, 2560x1600, 17" | Apple MacBook Pro 16 2023 M2 Max Mini-LED, 3456x2234, 16.2" | |
|---|---|---|---|---|---|---|
| Display | -6% | -4% | -3% | -3% | -2% | |
| Display P3 Coverage (%) | 95.2 | 92.9 -2% | 97 2% | 98.31 3% | 98.9 4% | 99 4% |
| sRGB Coverage (%) | 100 | 100 0% | 99.8 0% | 100 0% | 99.9 0% | 100 0% |
| AdobeRGB 1998 Coverage (%) | 100 | 85.3 -15% | 84.9 -15% | 87.03 -13% | 86.4 -14% | 88.5 -11% |
| Response Times | -16% | 80% | 88% | 79% | -70% | |
| Response Time Grey 50% / Grey 80% * (ms) | 42.9 ? | 51.2 ? -19% | 2 ? 95% | 1 98% | 11 ? 74% | 80.5 ? -88% |
| Response Time Black / White * (ms) | 31.3 ? | 35.2 ? -12% | 11 ? 65% | 7 ? 78% | 5 ? 84% | 47.2 ? -51% |
| PWM Frequency (Hz) | 14880 ? | |||||
| Screen | -30% | -6% | 9% | -13% | 4294% | |
| Brightness middle (cd/m²) | 457.4 | 512.7 12% | 405 -11% | 390 -15% | 444 -3% | 504 10% |
| Brightness (cd/m²) | 430 | 463 8% | 363 -16% | 385 -10% | 415 -3% | 487 13% |
| Brightness Distribution (%) | 85 | 85 0% | 82 -4% | 86 1% | 88 4% | 94 11% |
| Black Level * (cd/m²) | 0.31 | 0.32 -3% | 0.225 27% | 0.395 -27% | 0.7 -126% | 0.001 100% |
| Contrast (:1) | 1475 | 1602 9% | 1800 22% | 987 -33% | 634 -57% | 504000 34069% |
| Colorchecker dE 2000 * | 3.16 | 5.98 -89% | 3.35 -6% | 1.66 47% | 2.48 22% | 1.5 53% |
| Colorchecker dE 2000 max. * | 5.8 | 12.09 -108% | 7.96 -37% | 2.9 50% | 3.52 39% | 3.3 43% |
| Greyscale dE 2000 * | 4.2 | 7.2 -71% | 5.28 -26% | 1.83 56% | 3.33 21% | 2.1 50% |
| Gamma | 2.17 101% | 2.54 87% | 2.43 91% | 2.25 98% | 2.33 94% | 2.25 98% |
| CCT | 6987 93% | 6914 94% | 7424 88% | 6727 97% | 6230 104% | 6882 94% |
| Colorchecker dE 2000 calibrated * | 1.34 | 1.16 | 2.91 | |||
| Moyenne finale (programmes/paramètres) | -17% /
-22% | 23% /
7% | 31% /
18% | 21% /
3% | 1407% /
2631% |
* ... Moindre est la valeur, meilleures sont les performances
Temps de réponse de l'écran
| ↔ Temps de réponse noir à blanc | ||
|---|---|---|
| 31.3 ms ... hausse ↗ et chute ↘ combinées | ↗ 16.9 ms hausse | 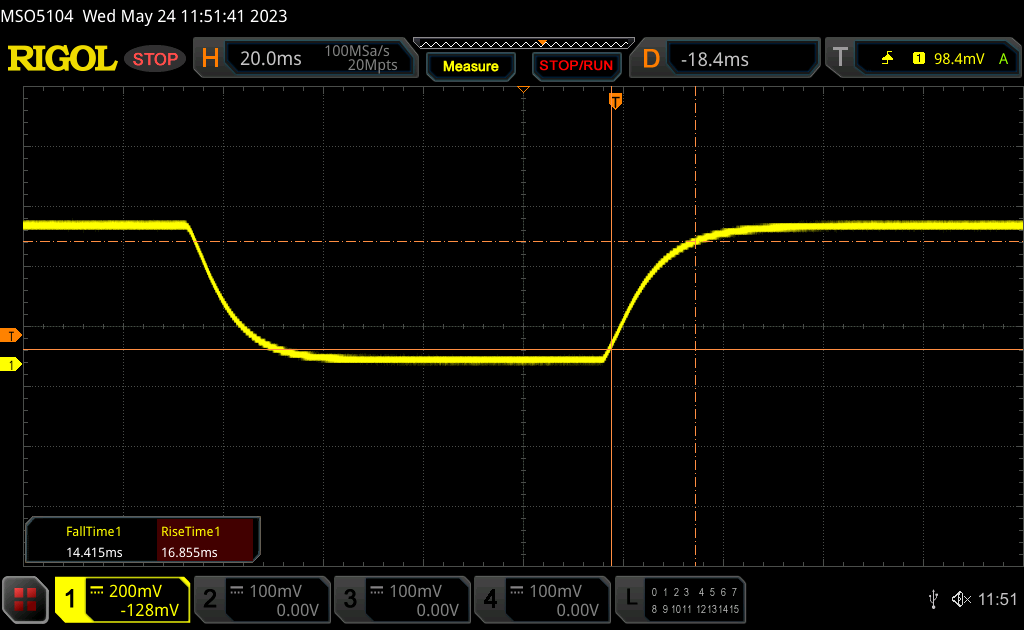 |
| ↘ 14.4 ms chute | ||
| L'écran souffre de latences très élevées, à éviter pour le jeu. En comparaison, tous les appareils testés affichent entre 0.1 (minimum) et 240 (maximum) ms. » 85 % des appareils testés affichent de meilleures performances. Cela signifie que les latences relevées sont moins bonnes que la moyenne (19.8 ms) de tous les appareils testés. | ||
| ↔ Temps de réponse gris 50% à gris 80% | ||
| 42.9 ms ... hausse ↗ et chute ↘ combinées | ↗ 19.9 ms hausse | 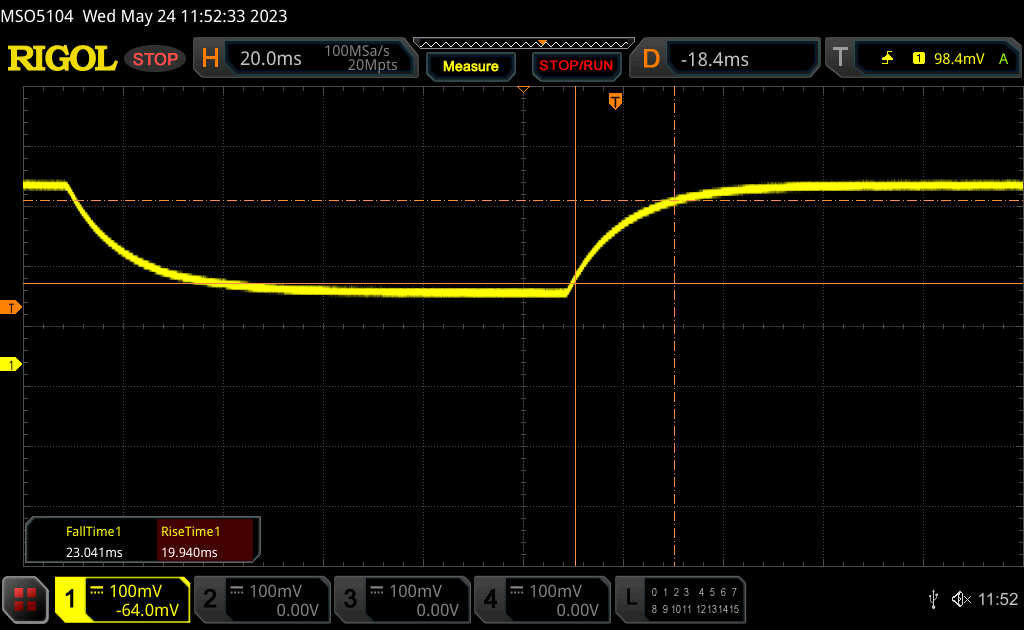 |
| ↘ 23 ms chute | ||
| L'écran souffre de latences très élevées, à éviter pour le jeu. En comparaison, tous les appareils testés affichent entre 0.165 (minimum) et 636 (maximum) ms. » 71 % des appareils testés affichent de meilleures performances. Cela signifie que les latences relevées sont moins bonnes que la moyenne (30.9 ms) de tous les appareils testés. | ||
Scintillement / MLI (Modulation de largeur d'impulsion)
| Scintillement / MLI (Modulation de largeur d'impulsion) non décelé | 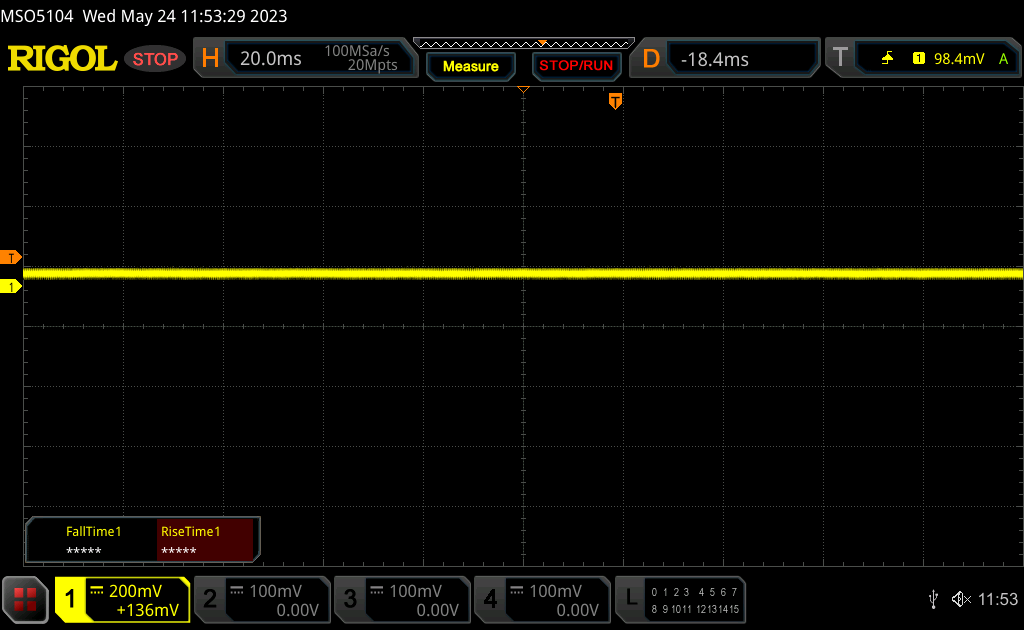 | ||
En comparaison, 52 % des appareils testés n'emploient pas MDI pour assombrir leur écran. Nous avons relevé une moyenne à 7741 (minimum : 5 - maximum : 343500) Hz dans le cas où une MDI était active. | |||
Performance - 13e génération Intel + Nvidia Ada Lovelace
Conditions d'essai
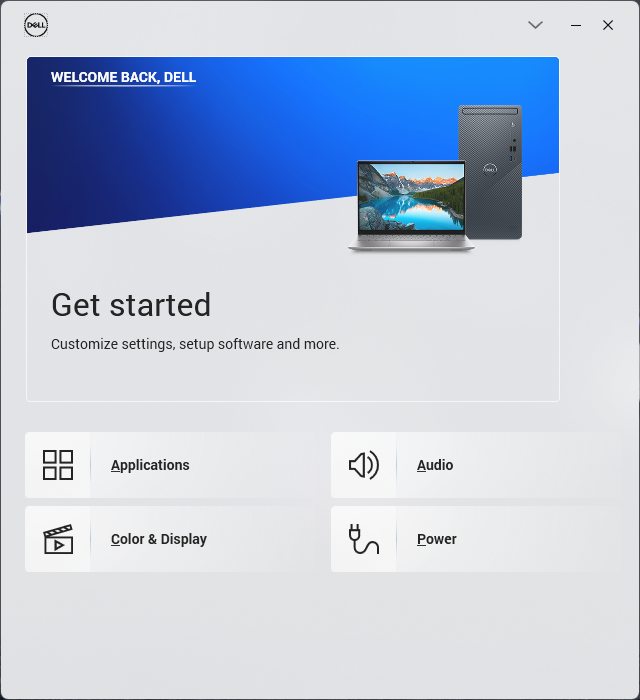
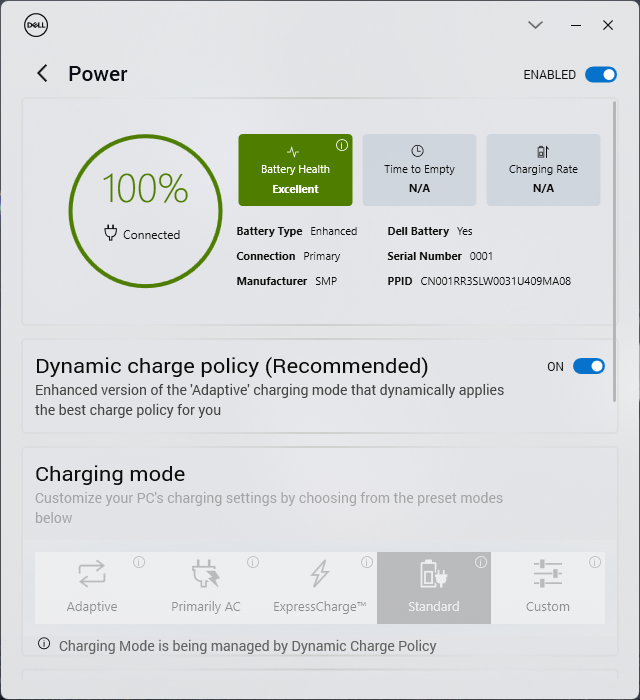
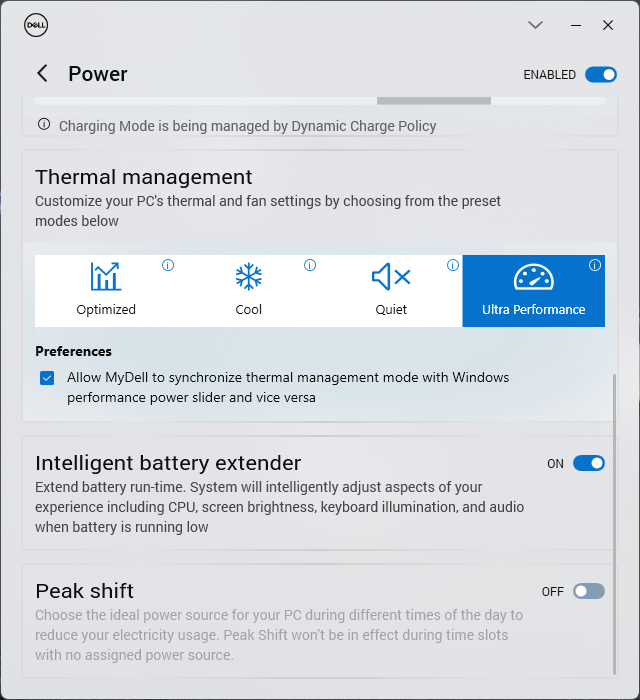
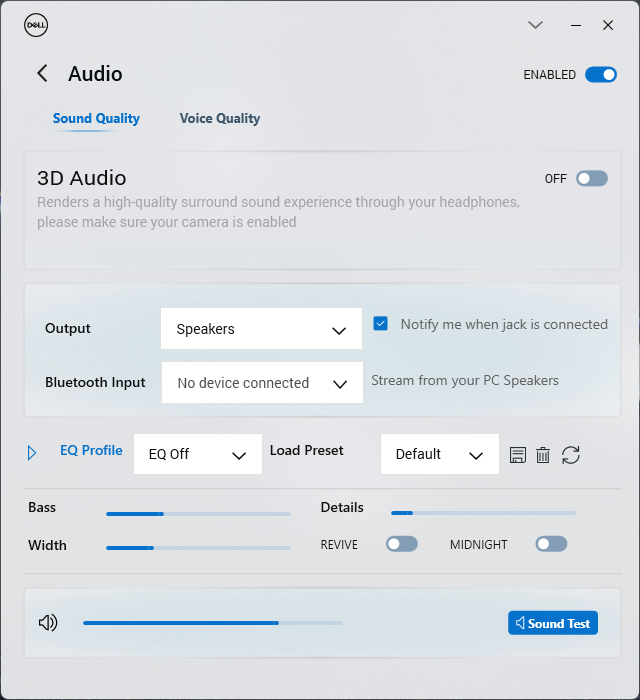
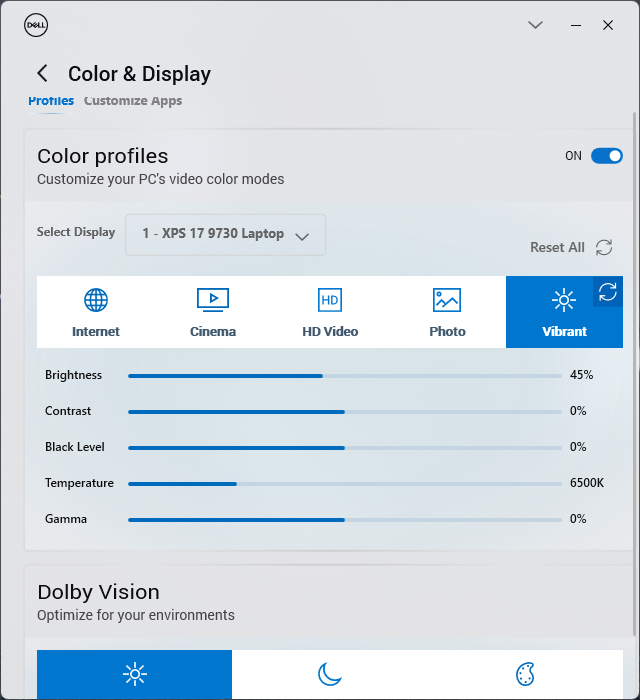
Nous avons réglé notre appareil en mode Performance via le logiciel MyDell avant d'effectuer les tests ci-dessous. Les paramètres du profil d'alimentation Dell sont commodément synchronisés avec les paramètres du profil d'alimentation Windows, contrairement à la plupart des autres ordinateurs portables.
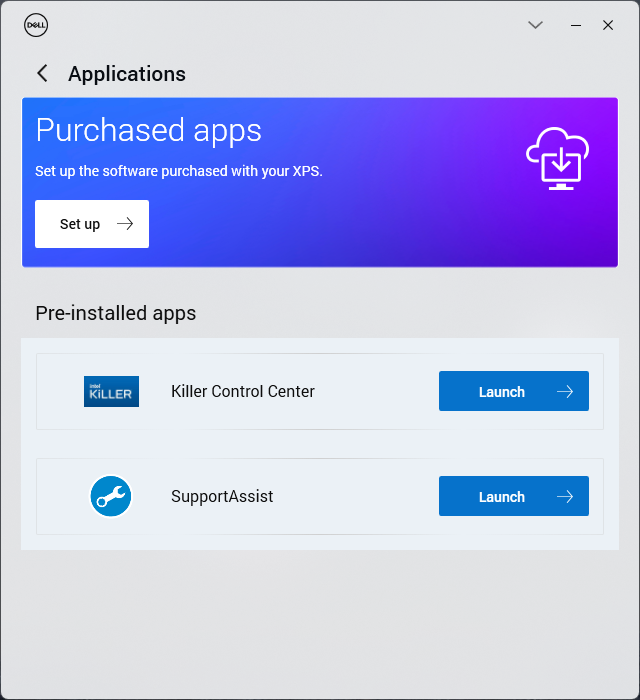
Il est recommandé aux utilisateurs de se familiariser avec MyDell, car il s'agit de l'outil central pour régler l'audio, les couleurs, l'alimentation et d'autres applications Dell préinstallées telles que SupportAssist. Dell a une nouvelle fois redessiné l'interface utilisateur de MyDell pour la rapprocher du logiciel Dell Optimizer fourni avec de nombreux ordinateurs portables professionnels du même fabricant. La fenêtre de l'application est très petite et ne peut pas être maximisée.
Optimus est livré en standard avec une commutation automatique entre l'iGPU et le dGPU. Il n'y a pas de support pour Advanced Optimus ou MUX.
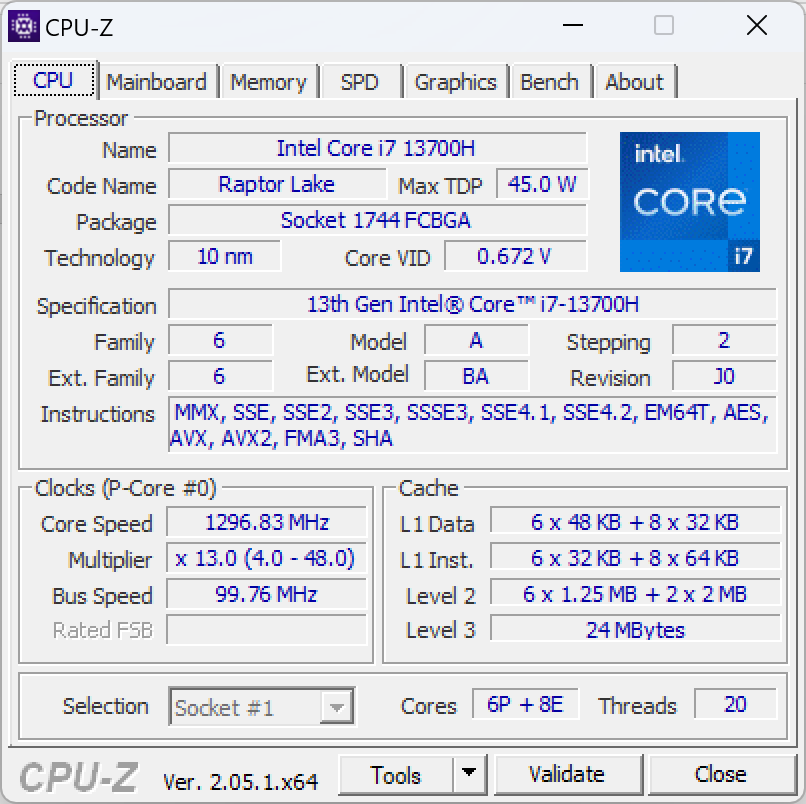
Processeur
Le Core i7-13700H du XPS 17 se comporte très bien avec des résultats de benchmark légèrement supérieurs à ceux de la plupart des autres ordinateurs portables de notre base de données équipés du même processeur, y compris le récent XPS 15 9530. Le Turbo Boost en particulier est impressionnant, avec un avantage de 25 % sur le Core i7-12700H du XPS 17 9720 de l'année dernière.
Il y a cependant un problème à garder à l'esprit. Le CPU Turbo Boost n'est pas illimité, comme le montre notre graphique ci-dessous lorsque nous exécutons CineBench R15 xT en boucle. Les performances chutent d'environ 25 % après 9 ou 10 exécutions, ce qui est plus élevé que sur la plupart des autres ordinateurs portables équipés de processeurs de la série H. Si l'on tient compte de ce ralentissement, les performances du Core i7-13700H sont pratiquement identiques à celles du Core i7-12700H. Ainsi, le Core i7-13700H est le plus performant lorsque des performances élevées sont nécessaires sur de courtes durées, par exemple lors du lancement de programmes, de la retouche d'images ou de l'encodage de courtes vidéos. Sinon, il n'offre que des avantages mineurs en termes de performances par rapport au Core i7-12700H de l'année dernière.
La mise à niveau vers le Core i9-13900H devrait améliorer les performances multithread d'environ 10 à 20 %, d'après notre expérience avec l'ordinateurMSI Stealth 17 Studio. En revanche, les performances monothématiques resteraient à peu près les mêmes, voire légèrement inférieures, avec le Core i9.
Cinebench R15 Multi Loop
Cinebench R23: Multi Core | Single Core
Cinebench R20: CPU (Multi Core) | CPU (Single Core)
Cinebench R15: CPU Multi 64Bit | CPU Single 64Bit
Blender: v2.79 BMW27 CPU
7-Zip 18.03: 7z b 4 | 7z b 4 -mmt1
Geekbench 5.5: Multi-Core | Single-Core
HWBOT x265 Benchmark v2.2: 4k Preset
LibreOffice : 20 Documents To PDF
R Benchmark 2.5: Overall mean
* ... Moindre est la valeur, meilleures sont les performances
AIDA64: FP32 Ray-Trace | FPU Julia | CPU SHA3 | CPU Queen | FPU SinJulia | FPU Mandel | CPU AES | CPU ZLib | FP64 Ray-Trace | CPU PhotoWorxx
| Performance rating | |
| Dell XPS 17 9730 RTX 4070 | |
| Moyenne Intel Core i7-13700H | |
| MSI Creator Z17 A12UGST-054 | |
| Dell XPS 17 9720 RTX 3060 | |
| LG Gram 17 (2023) | |
| HP Envy 17-cr0079ng | |
| AIDA64 / FP32 Ray-Trace | |
| Dell XPS 17 9730 RTX 4070 | |
| Moyenne Intel Core i7-13700H (4986 - 18908, n=29) | |
| LG Gram 17 (2023) | |
| MSI Creator Z17 A12UGST-054 | |
| HP Envy 17-cr0079ng | |
| Dell XPS 17 9720 RTX 3060 | |
| AIDA64 / FPU Julia | |
| Dell XPS 17 9730 RTX 4070 | |
| Moyenne Intel Core i7-13700H (25360 - 92359, n=29) | |
| HP Envy 17-cr0079ng | |
| LG Gram 17 (2023) | |
| MSI Creator Z17 A12UGST-054 | |
| Dell XPS 17 9720 RTX 3060 | |
| AIDA64 / CPU SHA3 | |
| Dell XPS 17 9730 RTX 4070 | |
| Moyenne Intel Core i7-13700H (1339 - 4224, n=29) | |
| MSI Creator Z17 A12UGST-054 | |
| Dell XPS 17 9720 RTX 3060 | |
| HP Envy 17-cr0079ng | |
| LG Gram 17 (2023) | |
| AIDA64 / CPU Queen | |
| MSI Creator Z17 A12UGST-054 | |
| Dell XPS 17 9720 RTX 3060 | |
| Dell XPS 17 9730 RTX 4070 | |
| Moyenne Intel Core i7-13700H (59324 - 107159, n=29) | |
| LG Gram 17 (2023) | |
| HP Envy 17-cr0079ng | |
| AIDA64 / FPU SinJulia | |
| Dell XPS 17 9730 RTX 4070 | |
| MSI Creator Z17 A12UGST-054 | |
| Dell XPS 17 9720 RTX 3060 | |
| Moyenne Intel Core i7-13700H (4800 - 11050, n=29) | |
| LG Gram 17 (2023) | |
| HP Envy 17-cr0079ng | |
| AIDA64 / FPU Mandel | |
| Dell XPS 17 9730 RTX 4070 | |
| Moyenne Intel Core i7-13700H (12321 - 45118, n=29) | |
| MSI Creator Z17 A12UGST-054 | |
| LG Gram 17 (2023) | |
| Dell XPS 17 9720 RTX 3060 | |
| HP Envy 17-cr0079ng | |
| AIDA64 / CPU AES | |
| MSI Creator Z17 A12UGST-054 | |
| Dell XPS 17 9720 RTX 3060 | |
| Moyenne Intel Core i7-13700H (28769 - 151254, n=29) | |
| Dell XPS 17 9730 RTX 4070 | |
| LG Gram 17 (2023) | |
| HP Envy 17-cr0079ng | |
| AIDA64 / CPU ZLib | |
| Dell XPS 17 9730 RTX 4070 | |
| MSI Creator Z17 A12UGST-054 | |
| Moyenne Intel Core i7-13700H (389 - 1215, n=29) | |
| Dell XPS 17 9720 RTX 3060 | |
| HP Envy 17-cr0079ng | |
| LG Gram 17 (2023) | |
| AIDA64 / FP64 Ray-Trace | |
| Dell XPS 17 9730 RTX 4070 | |
| Moyenne Intel Core i7-13700H (2540 - 10135, n=29) | |
| LG Gram 17 (2023) | |
| MSI Creator Z17 A12UGST-054 | |
| Dell XPS 17 9720 RTX 3060 | |
| HP Envy 17-cr0079ng | |
| AIDA64 / CPU PhotoWorxx | |
| LG Gram 17 (2023) | |
| Dell XPS 17 9730 RTX 4070 | |
| Dell XPS 17 9720 RTX 3060 | |
| Moyenne Intel Core i7-13700H (12872 - 52727, n=29) | |
| MSI Creator Z17 A12UGST-054 | |
| HP Envy 17-cr0079ng | |
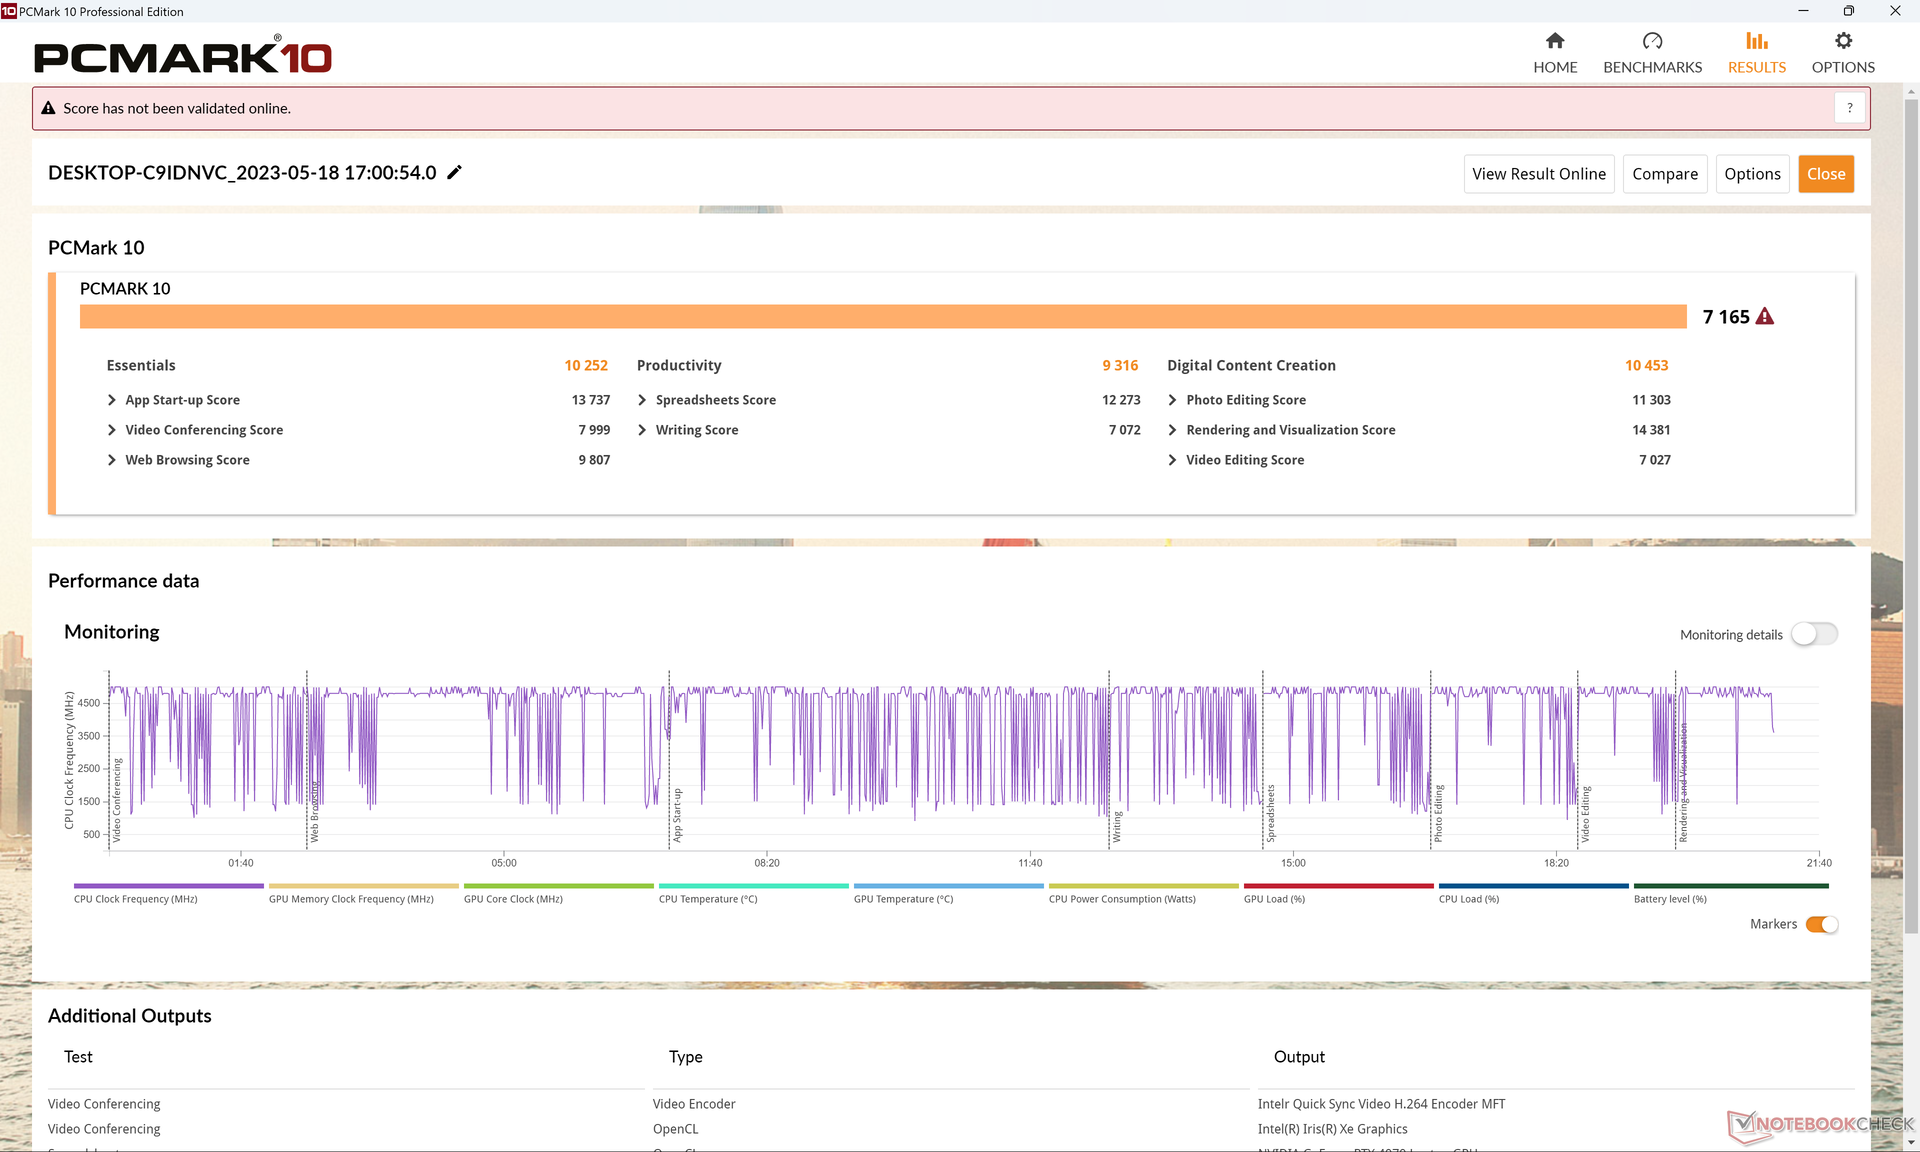
Performance du système
Les scores PCMark sont presque identiques à ceux du XPS 17 9720 de l'année dernière, malgré l'amélioration des performances d'une année sur l'autre. Cela suggère que les charges de travail quotidiennes et les activités bureautiques légères ne sont pas sensiblement plus rapides sur le dernier modèle. Si vos charges de travail consistent principalement en navigation web, feuilles de calcul et traitement de texte, alors une configuration XPS 17 inférieure avec la RTX 4050 peut être plus appropriée que notre configuration RTX 4070.
CrossMark: Overall | Productivity | Creativity | Responsiveness
| PCMark 10 / Score | |
| Moyenne Intel Core i7-13700H, NVIDIA GeForce RTX 4070 Laptop GPU (7158 - 7956, n=8) | |
| Dell XPS 17 9720 RTX 3060 | |
| Dell XPS 17 9730 RTX 4070 | |
| MSI Creator Z17 A12UGST-054 | |
| HP Envy 17-cr0079ng | |
| LG Gram 17 (2023) | |
| PCMark 10 / Essentials | |
| LG Gram 17 (2023) | |
| Dell XPS 17 9720 RTX 3060 | |
| Moyenne Intel Core i7-13700H, NVIDIA GeForce RTX 4070 Laptop GPU (10252 - 11449, n=8) | |
| HP Envy 17-cr0079ng | |
| MSI Creator Z17 A12UGST-054 | |
| Dell XPS 17 9730 RTX 4070 | |
| PCMark 10 / Productivity | |
| Moyenne Intel Core i7-13700H, NVIDIA GeForce RTX 4070 Laptop GPU (8501 - 10769, n=8) | |
| MSI Creator Z17 A12UGST-054 | |
| Dell XPS 17 9720 RTX 3060 | |
| Dell XPS 17 9730 RTX 4070 | |
| HP Envy 17-cr0079ng | |
| LG Gram 17 (2023) | |
| PCMark 10 / Digital Content Creation | |
| Moyenne Intel Core i7-13700H, NVIDIA GeForce RTX 4070 Laptop GPU (10358 - 12908, n=8) | |
| Dell XPS 17 9730 RTX 4070 | |
| Dell XPS 17 9720 RTX 3060 | |
| MSI Creator Z17 A12UGST-054 | |
| HP Envy 17-cr0079ng | |
| LG Gram 17 (2023) | |
| CrossMark / Overall | |
| MSI Creator Z17 A12UGST-054 | |
| Apple MacBook Pro 16 2023 M2 Max | |
| Moyenne Intel Core i7-13700H, NVIDIA GeForce RTX 4070 Laptop GPU (1768 - 2073, n=6) | |
| Dell XPS 17 9720 RTX 3060 | |
| Dell XPS 17 9730 RTX 4070 | |
| LG Gram 17 (2023) | |
| HP Envy 17-cr0079ng | |
| CrossMark / Productivity | |
| MSI Creator Z17 A12UGST-054 | |
| Moyenne Intel Core i7-13700H, NVIDIA GeForce RTX 4070 Laptop GPU (1645 - 2006, n=6) | |
| Dell XPS 17 9720 RTX 3060 | |
| Dell XPS 17 9730 RTX 4070 | |
| Apple MacBook Pro 16 2023 M2 Max | |
| LG Gram 17 (2023) | |
| HP Envy 17-cr0079ng | |
| CrossMark / Creativity | |
| Apple MacBook Pro 16 2023 M2 Max | |
| MSI Creator Z17 A12UGST-054 | |
| Dell XPS 17 9720 RTX 3060 | |
| Moyenne Intel Core i7-13700H, NVIDIA GeForce RTX 4070 Laptop GPU (1936 - 2137, n=6) | |
| Dell XPS 17 9730 RTX 4070 | |
| LG Gram 17 (2023) | |
| HP Envy 17-cr0079ng | |
| CrossMark / Responsiveness | |
| MSI Creator Z17 A12UGST-054 | |
| Moyenne Intel Core i7-13700H, NVIDIA GeForce RTX 4070 Laptop GPU (1451 - 2202, n=6) | |
| Dell XPS 17 9720 RTX 3060 | |
| Dell XPS 17 9730 RTX 4070 | |
| LG Gram 17 (2023) | |
| Apple MacBook Pro 16 2023 M2 Max | |
| HP Envy 17-cr0079ng | |
| PCMark 10 Score | 7165 points | |
Aide | ||
| AIDA64 / Memory Copy | |
| LG Gram 17 (2023) | |
| Dell XPS 17 9730 RTX 4070 | |
| Dell XPS 17 9720 RTX 3060 | |
| MSI Creator Z17 A12UGST-054 | |
| Moyenne Intel Core i7-13700H (24334 - 78081, n=29) | |
| HP Envy 17-cr0079ng | |
| AIDA64 / Memory Read | |
| Dell XPS 17 9730 RTX 4070 | |
| Dell XPS 17 9720 RTX 3060 | |
| MSI Creator Z17 A12UGST-054 | |
| Moyenne Intel Core i7-13700H (23681 - 79656, n=29) | |
| LG Gram 17 (2023) | |
| HP Envy 17-cr0079ng | |
| AIDA64 / Memory Write | |
| LG Gram 17 (2023) | |
| Dell XPS 17 9730 RTX 4070 | |
| Moyenne Intel Core i7-13700H (22986 - 99898, n=29) | |
| MSI Creator Z17 A12UGST-054 | |
| Dell XPS 17 9720 RTX 3060 | |
| HP Envy 17-cr0079ng | |
| AIDA64 / Memory Latency | |
| LG Gram 17 (2023) | |
| MSI Creator Z17 A12UGST-054 | |
| Dell XPS 17 9730 RTX 4070 | |
| Moyenne Intel Core i7-13700H (82.4 - 136.8, n=29) | |
| Dell XPS 17 9720 RTX 3060 | |
| HP Envy 17-cr0079ng | |
* ... Moindre est la valeur, meilleures sont les performances
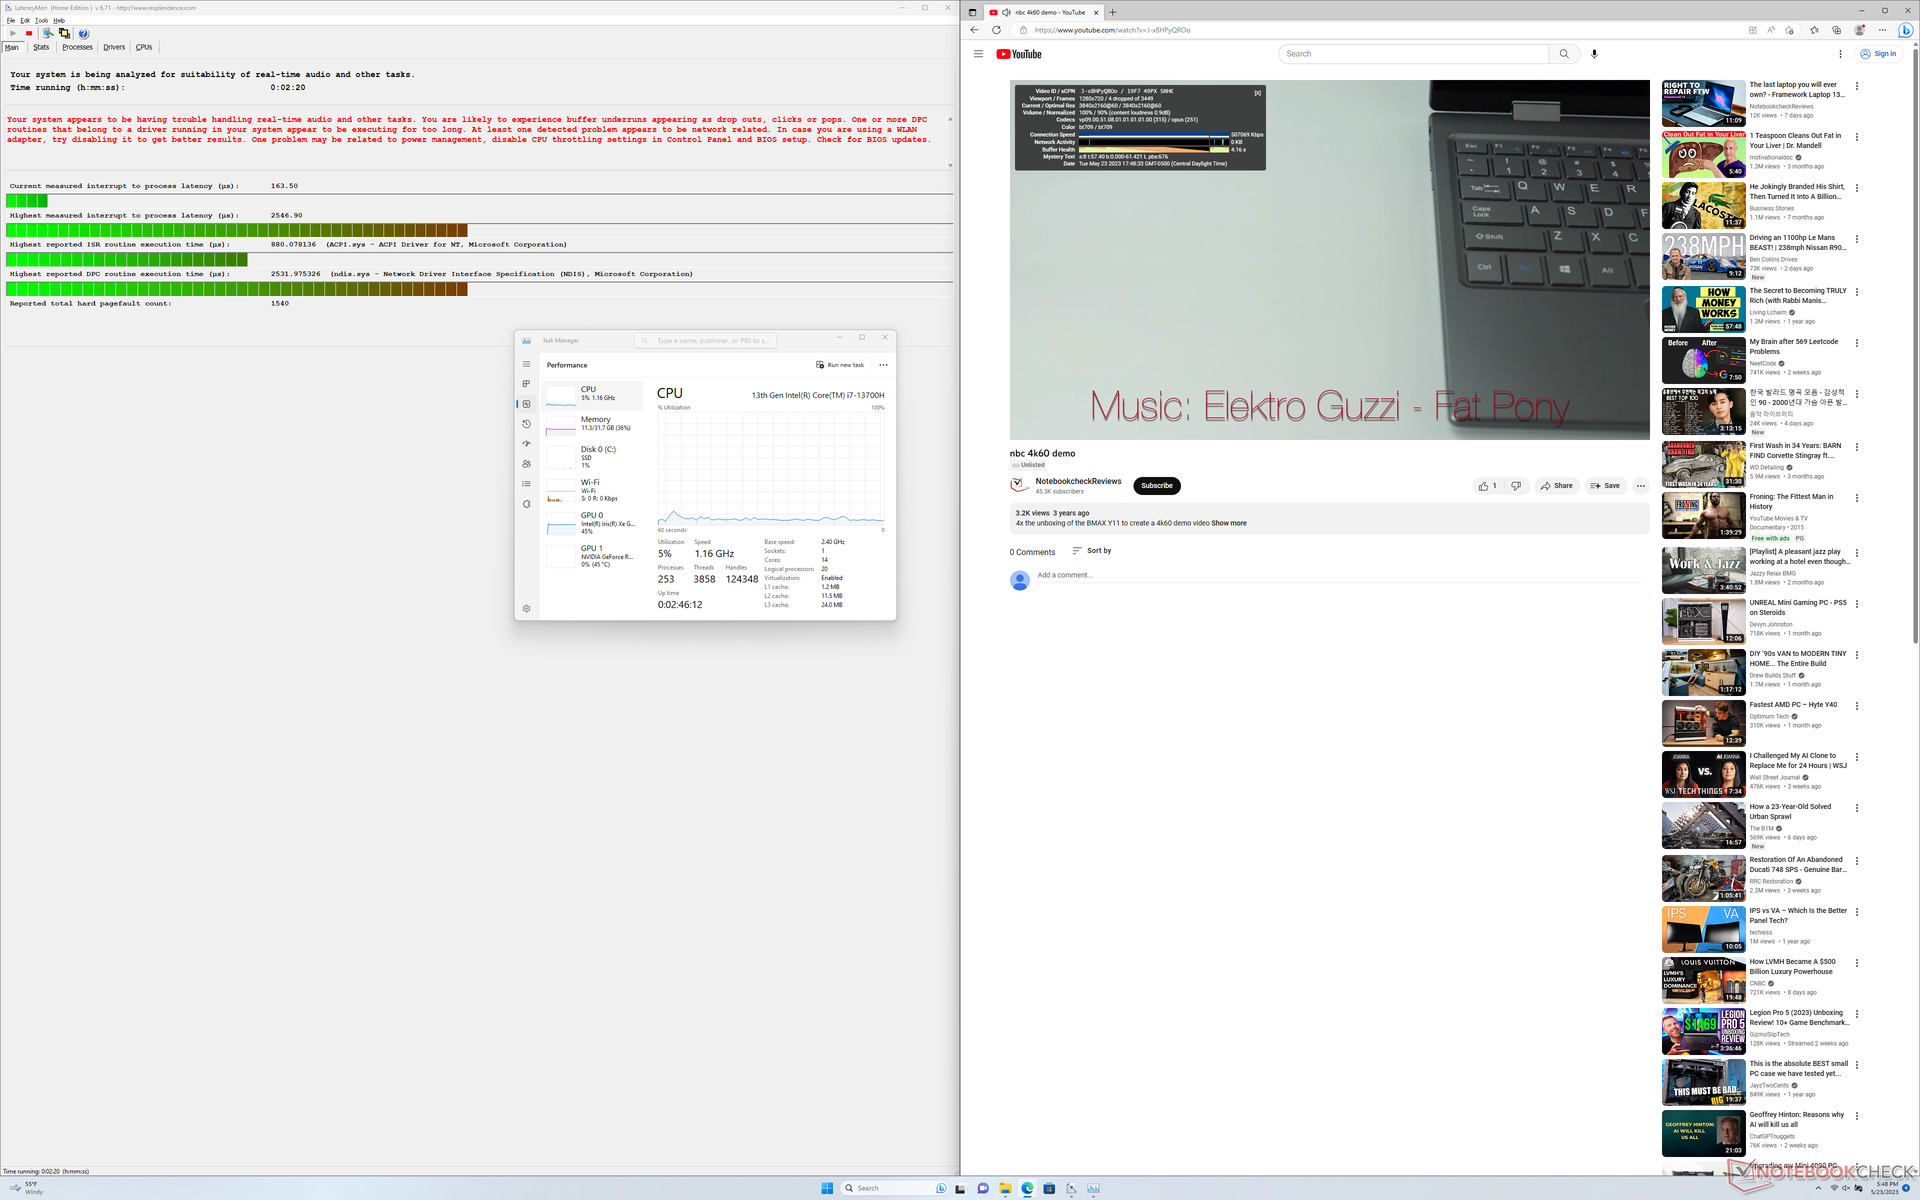
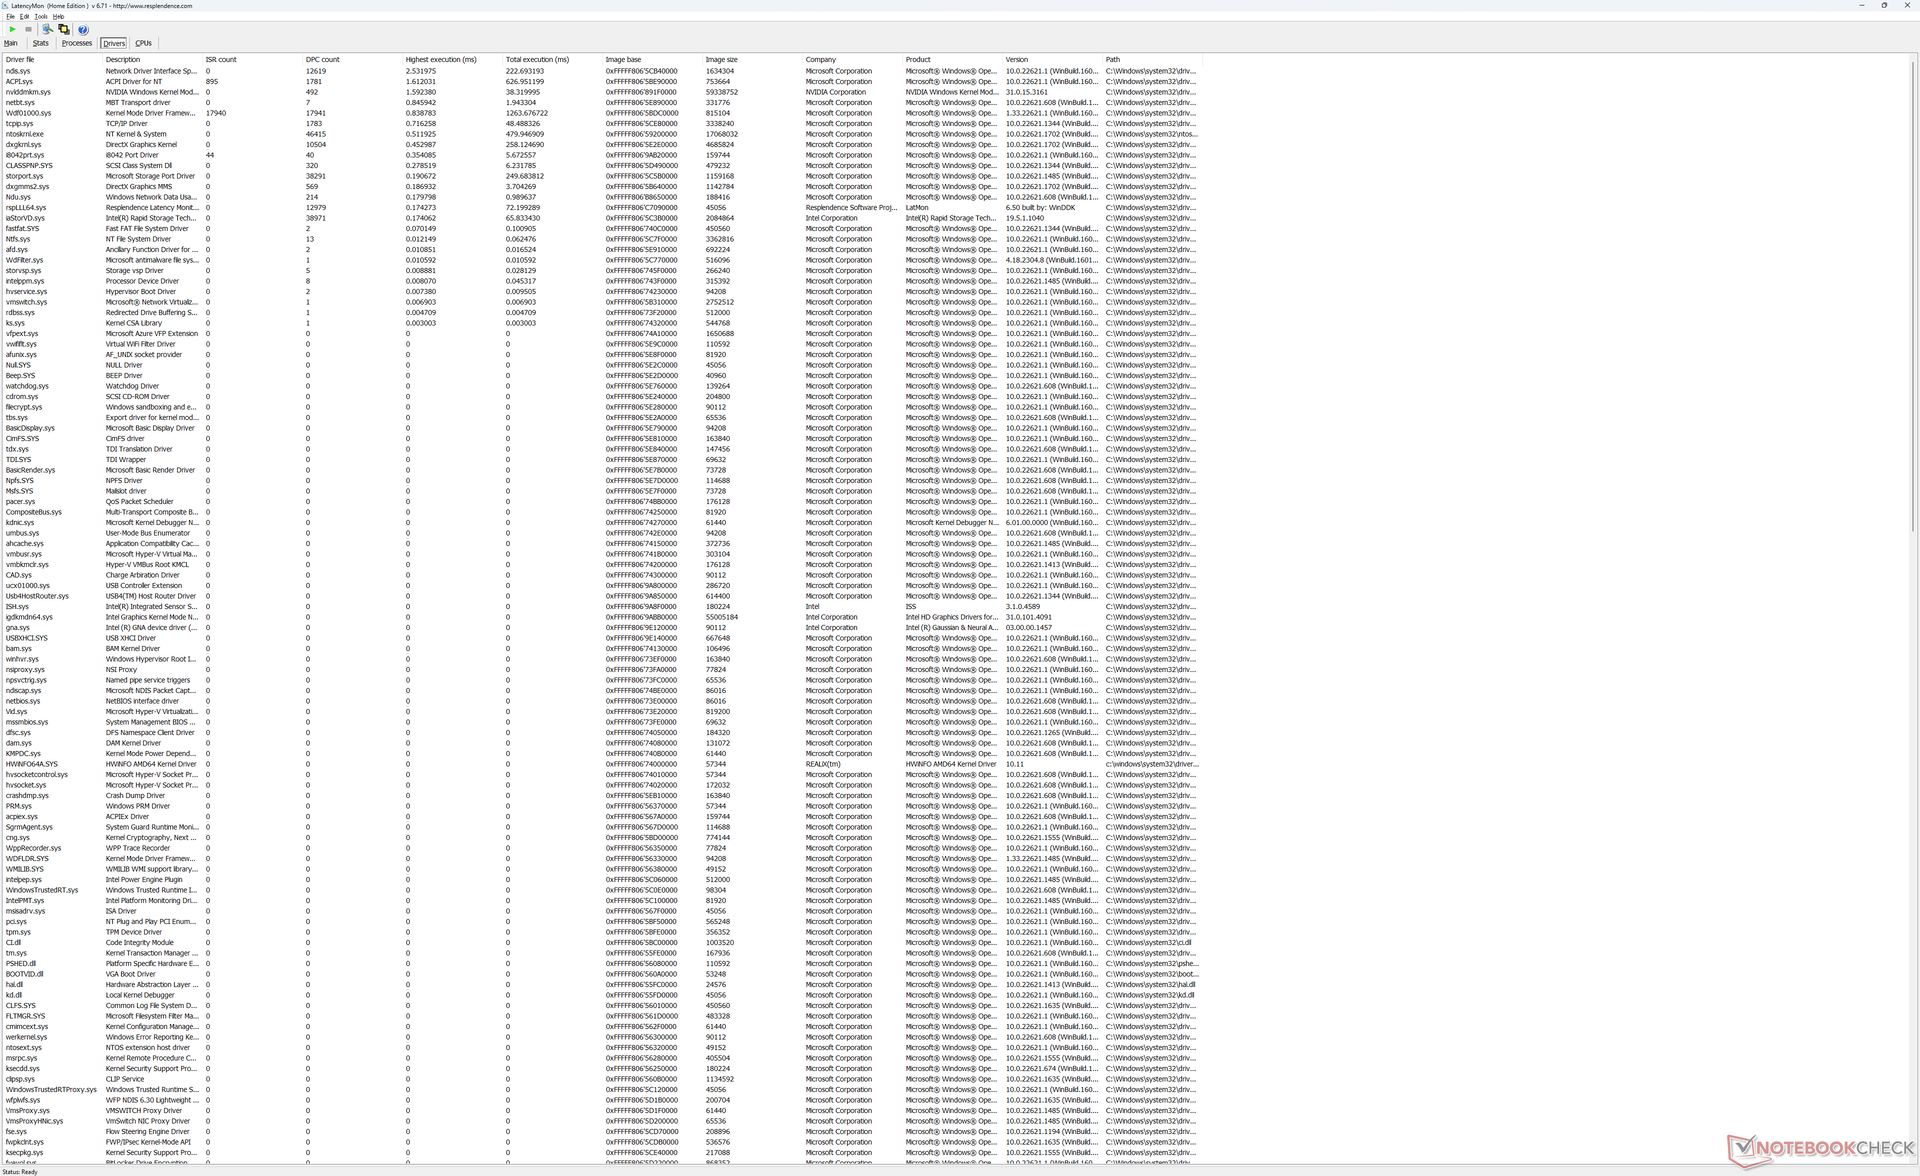
Latence DPC
LatencyMon révèle des problèmes de DPC lors de l'ouverture de plusieurs onglets de notre page d'accueil, même après plusieurs tentatives. Les résultats sont décevants si l'on considère que nous n'avons rencontré aucun problème avec le récent XPS 15 9530 ou sur le XPS 17 9720 de l'année dernière.
la lecture de vidéos 4K à 60 FPS est parfaite, sauf au début où elle perd toujours 4 images. Il est intéressant de noter que ce même problème apparaissait également sur le XPS 15 9530.
| DPC Latencies / LatencyMon - interrupt to process latency (max), Web, Youtube, Prime95 | |
| HP Envy 17-cr0079ng | |
| Dell XPS 17 9730 RTX 4070 | |
| LG Gram 17 (2023) | |
| MSI Creator Z17 A12UGST-054 | |
| Dell XPS 15 9530 RTX 4070 | |
| Dell XPS 17 9720 RTX 3060 | |
* ... Moindre est la valeur, meilleures sont les performances
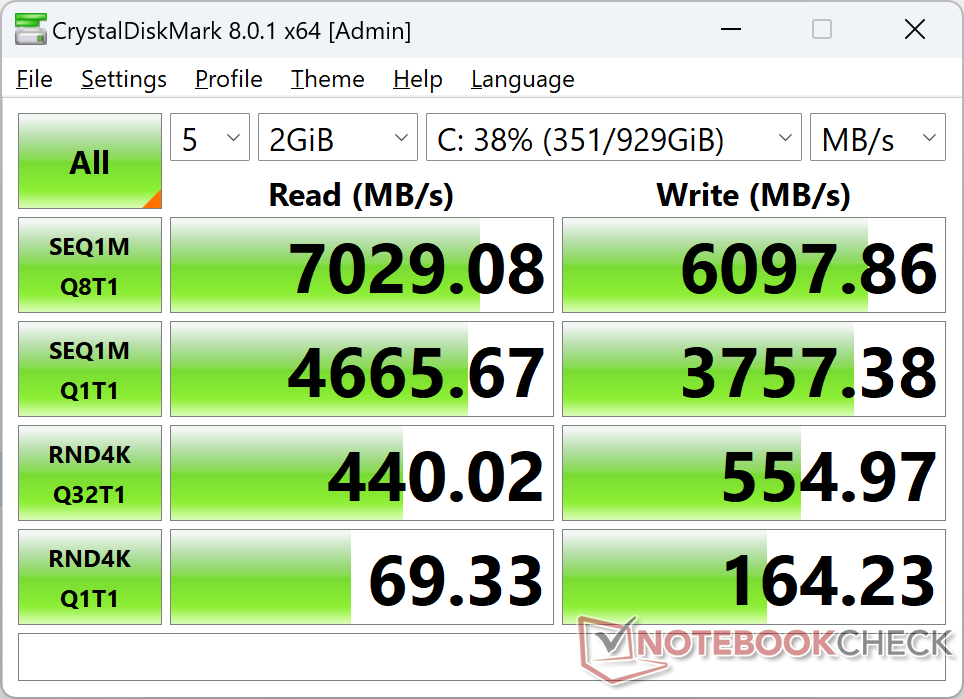
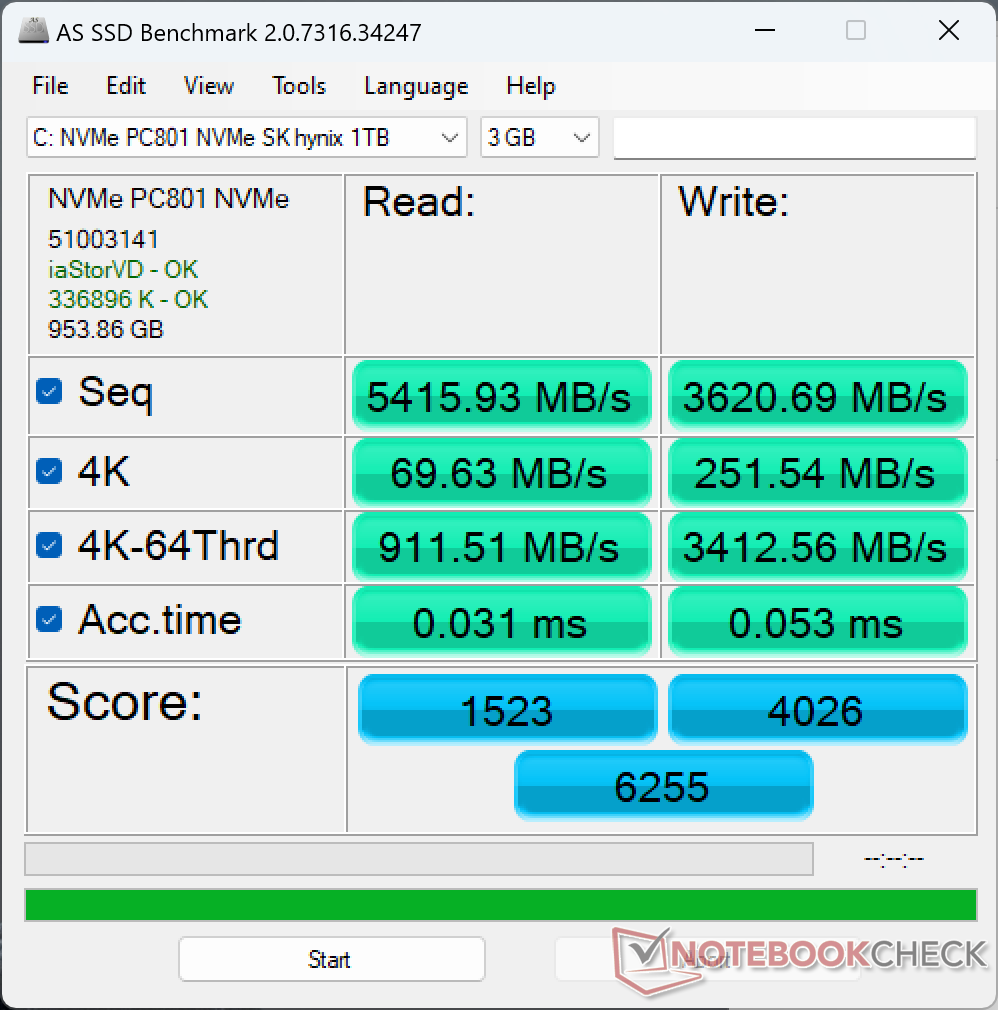
Dispositifs de stockage
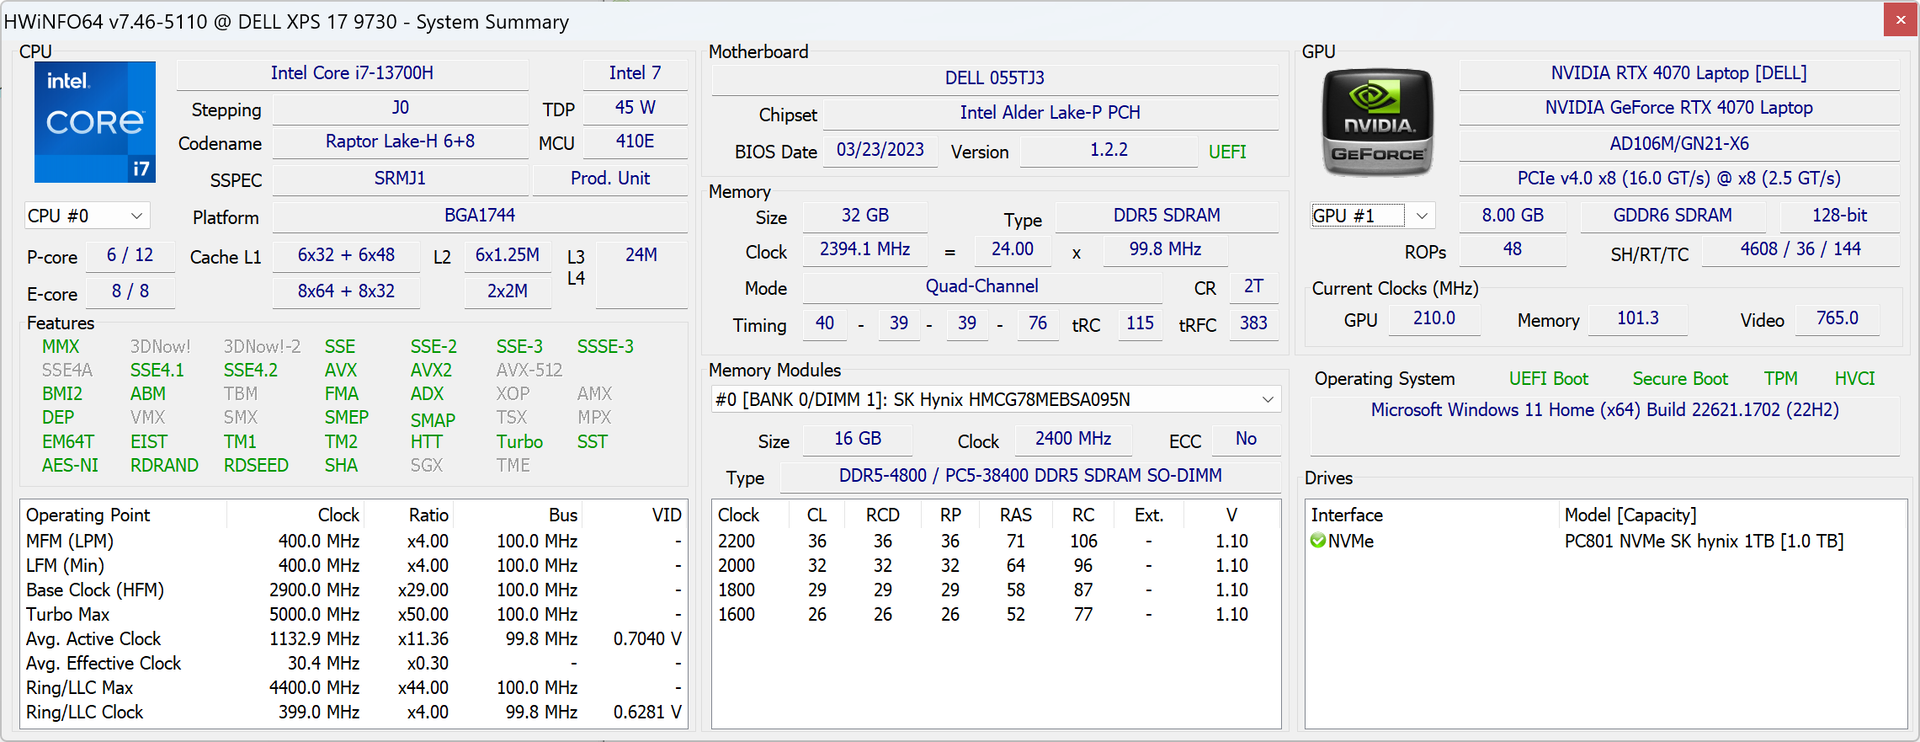
Les XPS peuvent être livrés avec des disques SSD de Samsung, Micron, Western Digital ou SK Hynix. Dans notre cas particulier, notre unité de test est livrée avec le disque SSD SK Hynix PC801 PCIe4 x4 NVMe SSD. Les performances sont excellentes et comparables à celles du Samsung PM9A1, sans aucune baisse des taux de transfert lorsqu'il est sollicité.
Un second SSD M.2 peut être installé si nécessaire. Chacun des deux emplacements M.2 est équipé d'un répartiteur de chaleur pour faciliter le refroidissement des disques.

| Drive Performance rating - Percent | |
| LG Gram 17 (2023) | |
| MSI Creator Z17 A12UGST-054 | |
| Dell XPS 17 9730 RTX 4070 | |
| Dell XPS 17 9720 RTX 3060 | |
| HP Envy 17-cr0079ng | |
* ... Moindre est la valeur, meilleures sont les performances
Disk Throttling: DiskSpd Read Loop, Queue Depth 8
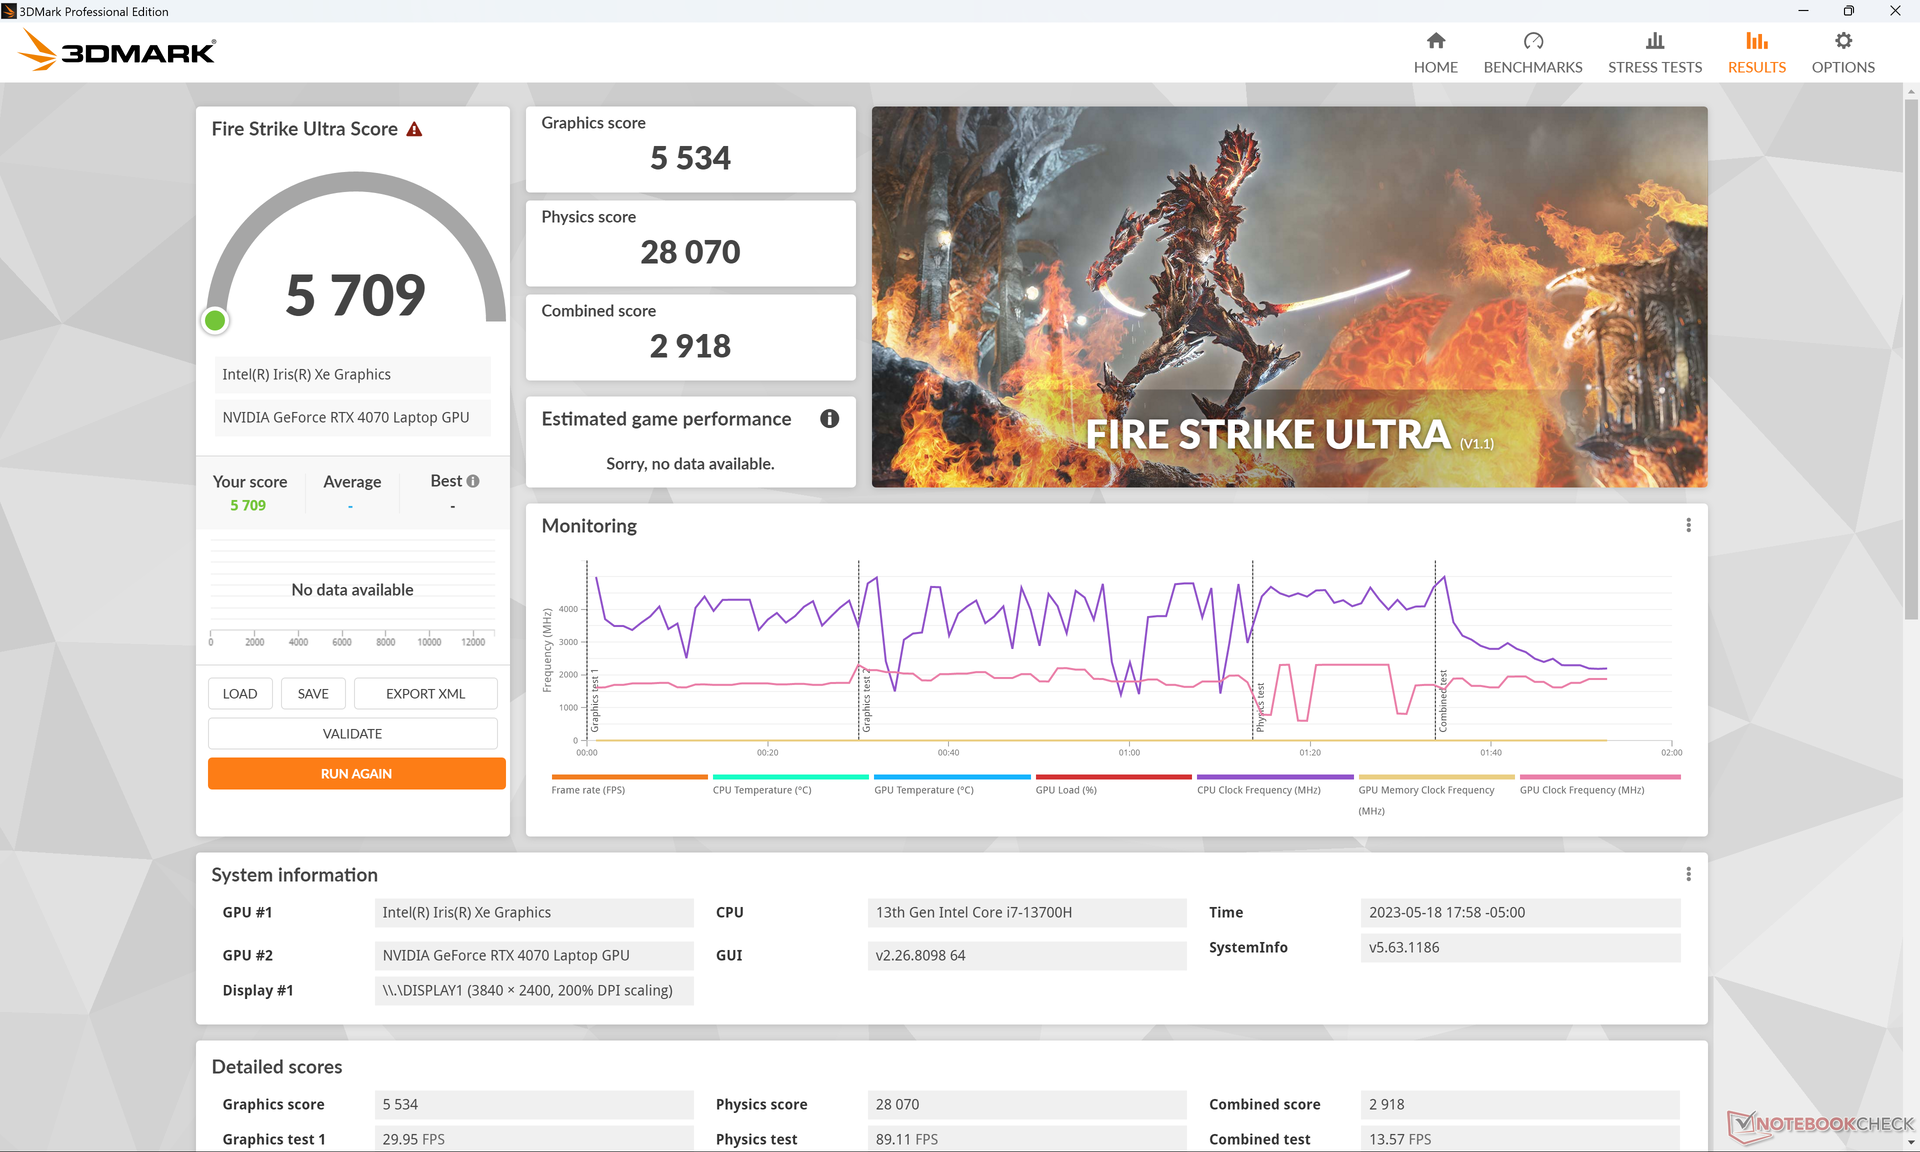
Performances du GPU - Beaucoup plus rapide que le XPS 15 9530
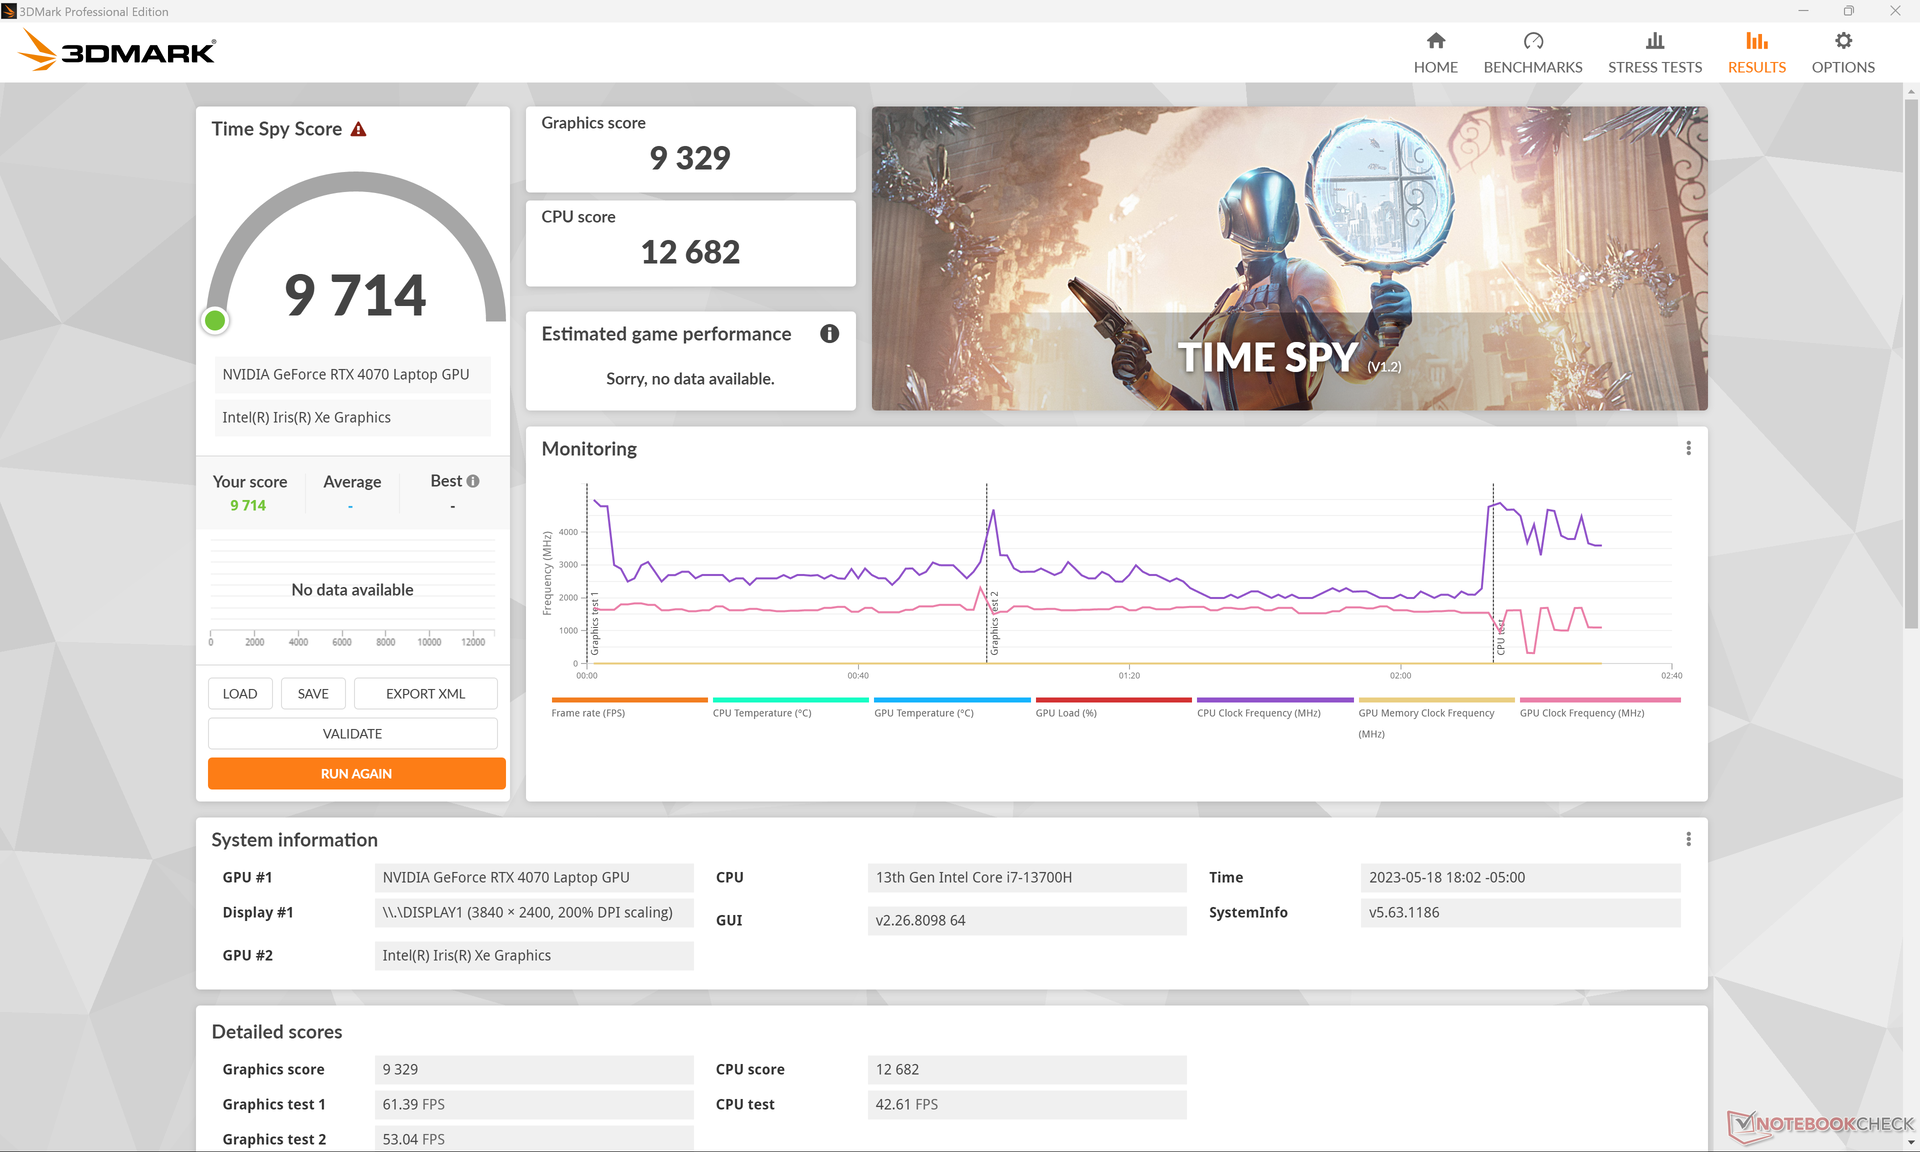
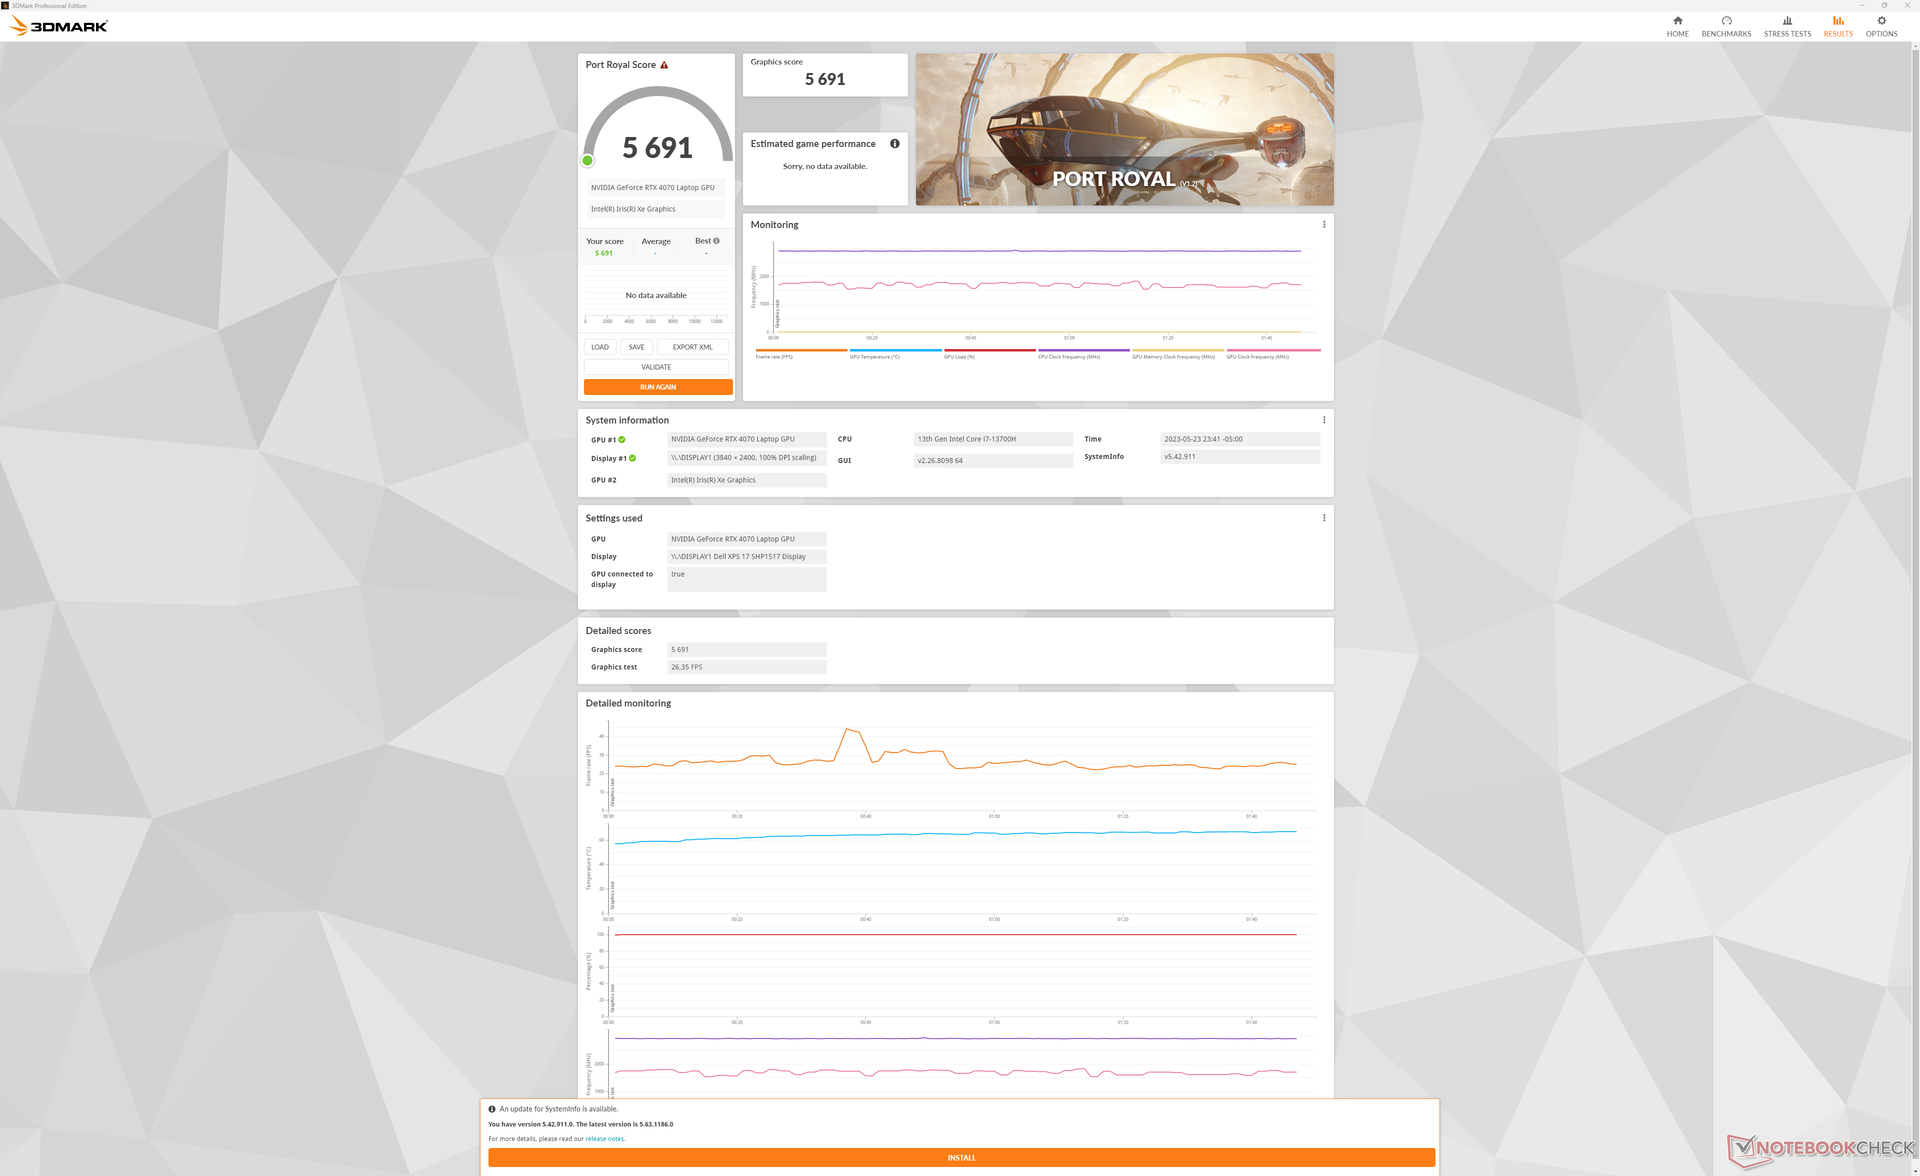
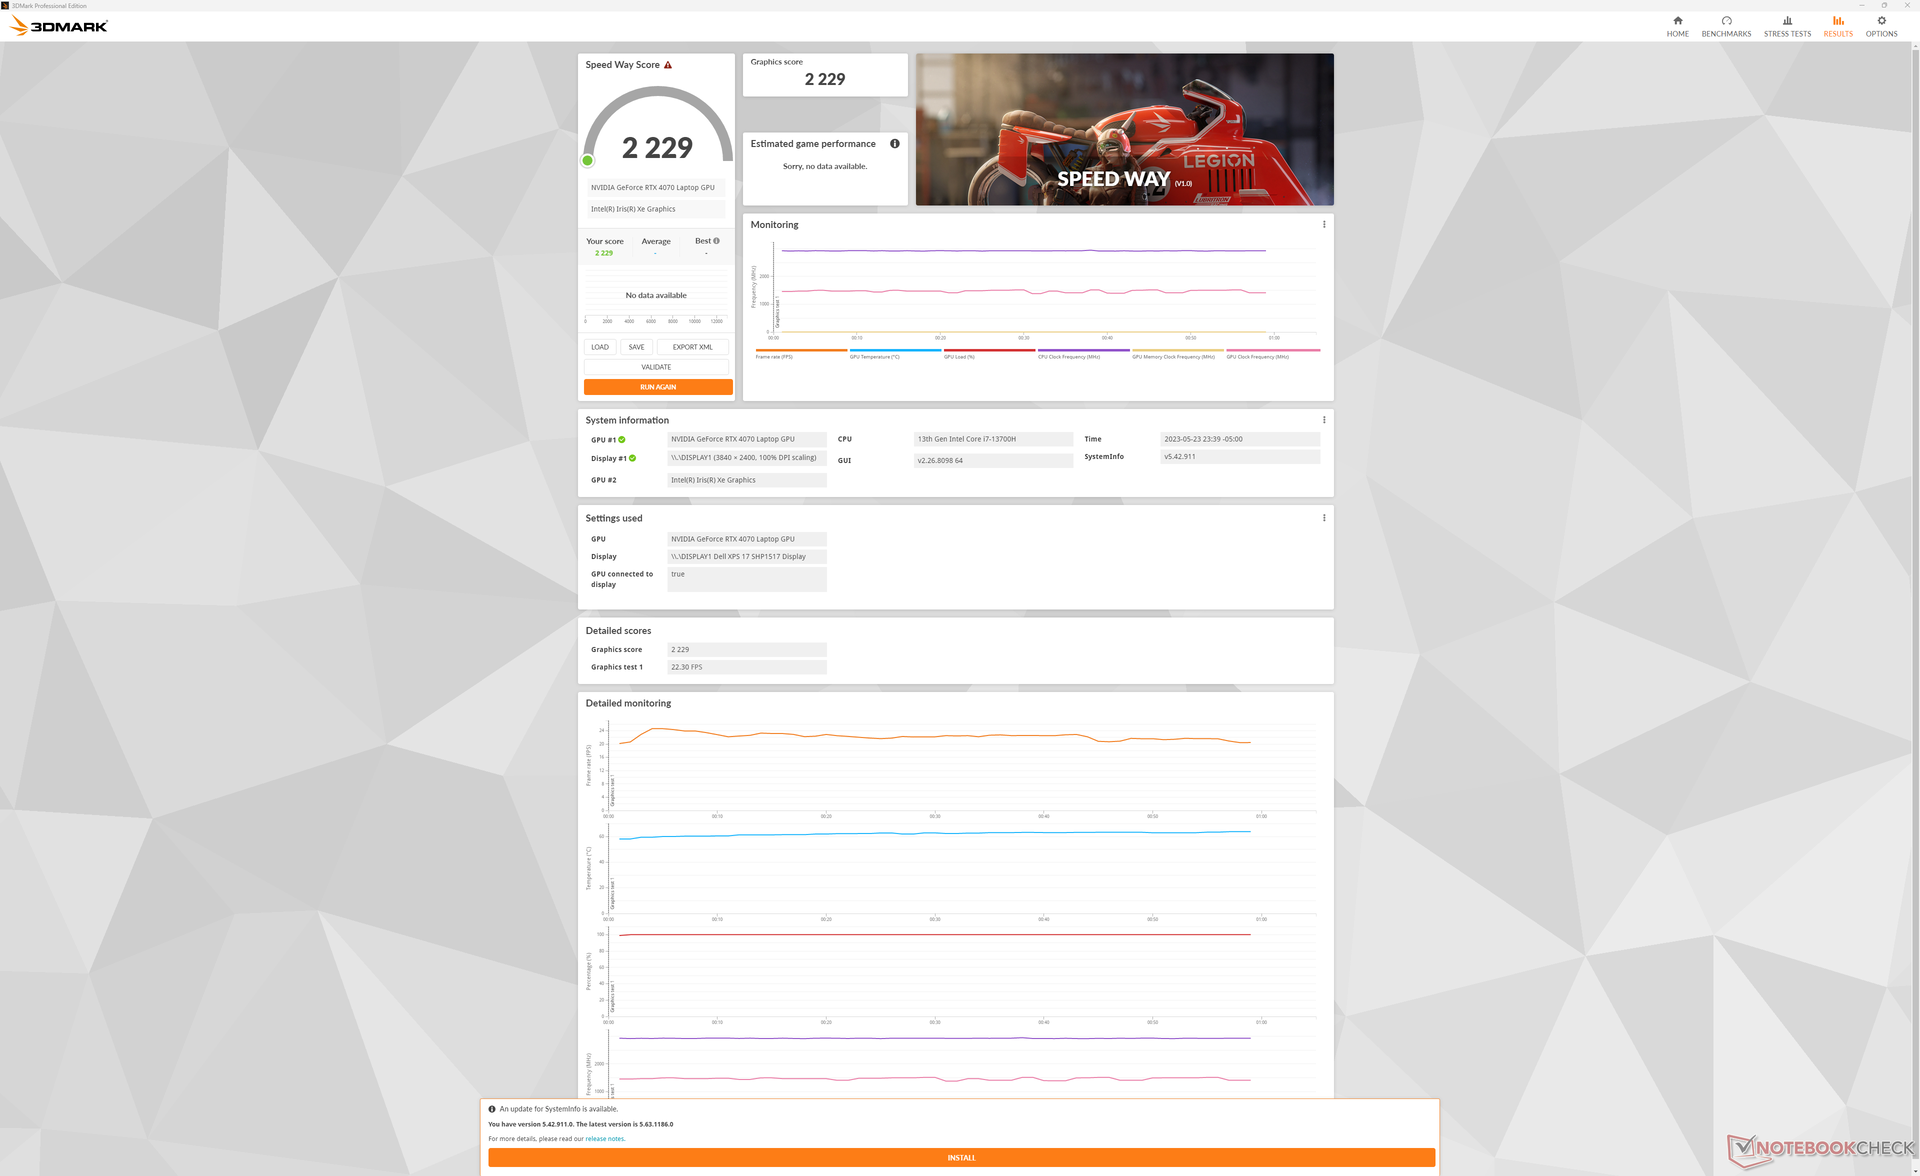
Le mobile GeForce RTX 4070 du XPS 17 vise un TGP de 60 W à 70 W alors que le même GPU dans le plus petit XPS 15 vise 40 W. Ce changement apparemment minime fait un monde de différence puisque les scores 3DMark pour les benchmarks DirectX et ray tracing sont 50 à 60 % plus rapides sur le XPS 17 9730 par rapport au XPS 15. L'augmentation des performances est si importante que la RTX 4070 du XPS 17 n'est qu'à 10 ou 15 % de la moyenne des ordinateurs portables de jeu équipés du même GPU. Il s'agit de la plage de performances que nous espérions voir dans le XPS 15 9530.
L'accélération du GPU Blender est également améliorée par rapport au même GPU dans le XPS 15. Il s'agit d'une petite augmentation de 20 % des performances qui permet au XPS 17 de s'aligner sur la plupart des autres ordinateurs portables RTX 4070.
Dell propose une option RTX 4080 encore plus élevée pour le XPS 17, mais nous nous attendons à ce qu'elle soit moins performante que la plupart des autres ordinateurs portables RTX 4080 en raison de l'alimentation USB-C limitée à 130 W. LeMSI Stealth 17 Studiopar exemple, propose la RTX 4080 mais avec un adaptateur secteur de 240 W bien plus performant.
L'option GPU la plus élevée pour la série XPS 17 avant le XPS 17 9730 était la RTX 3060. Par rapport à cette configuration, notre RTX 4070 peut offrir une création de contenu et des performances graphiques 20 % et 30 % plus rapides, respectivement.
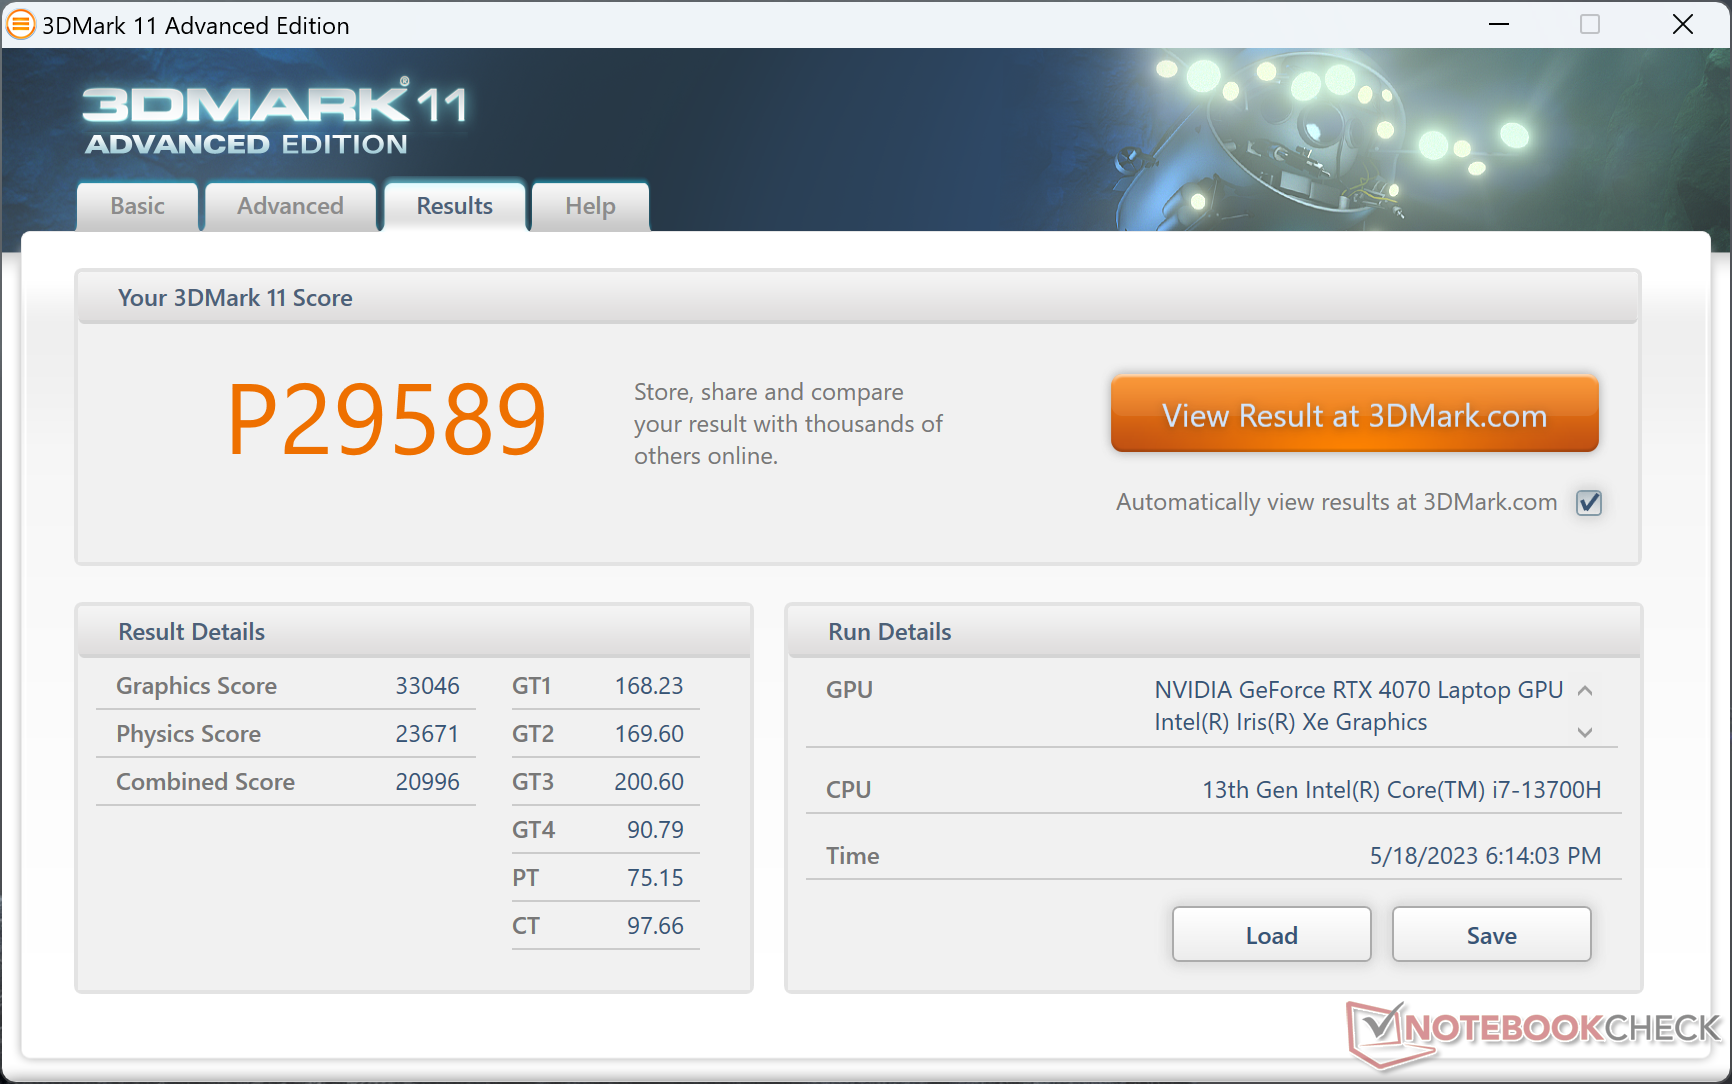
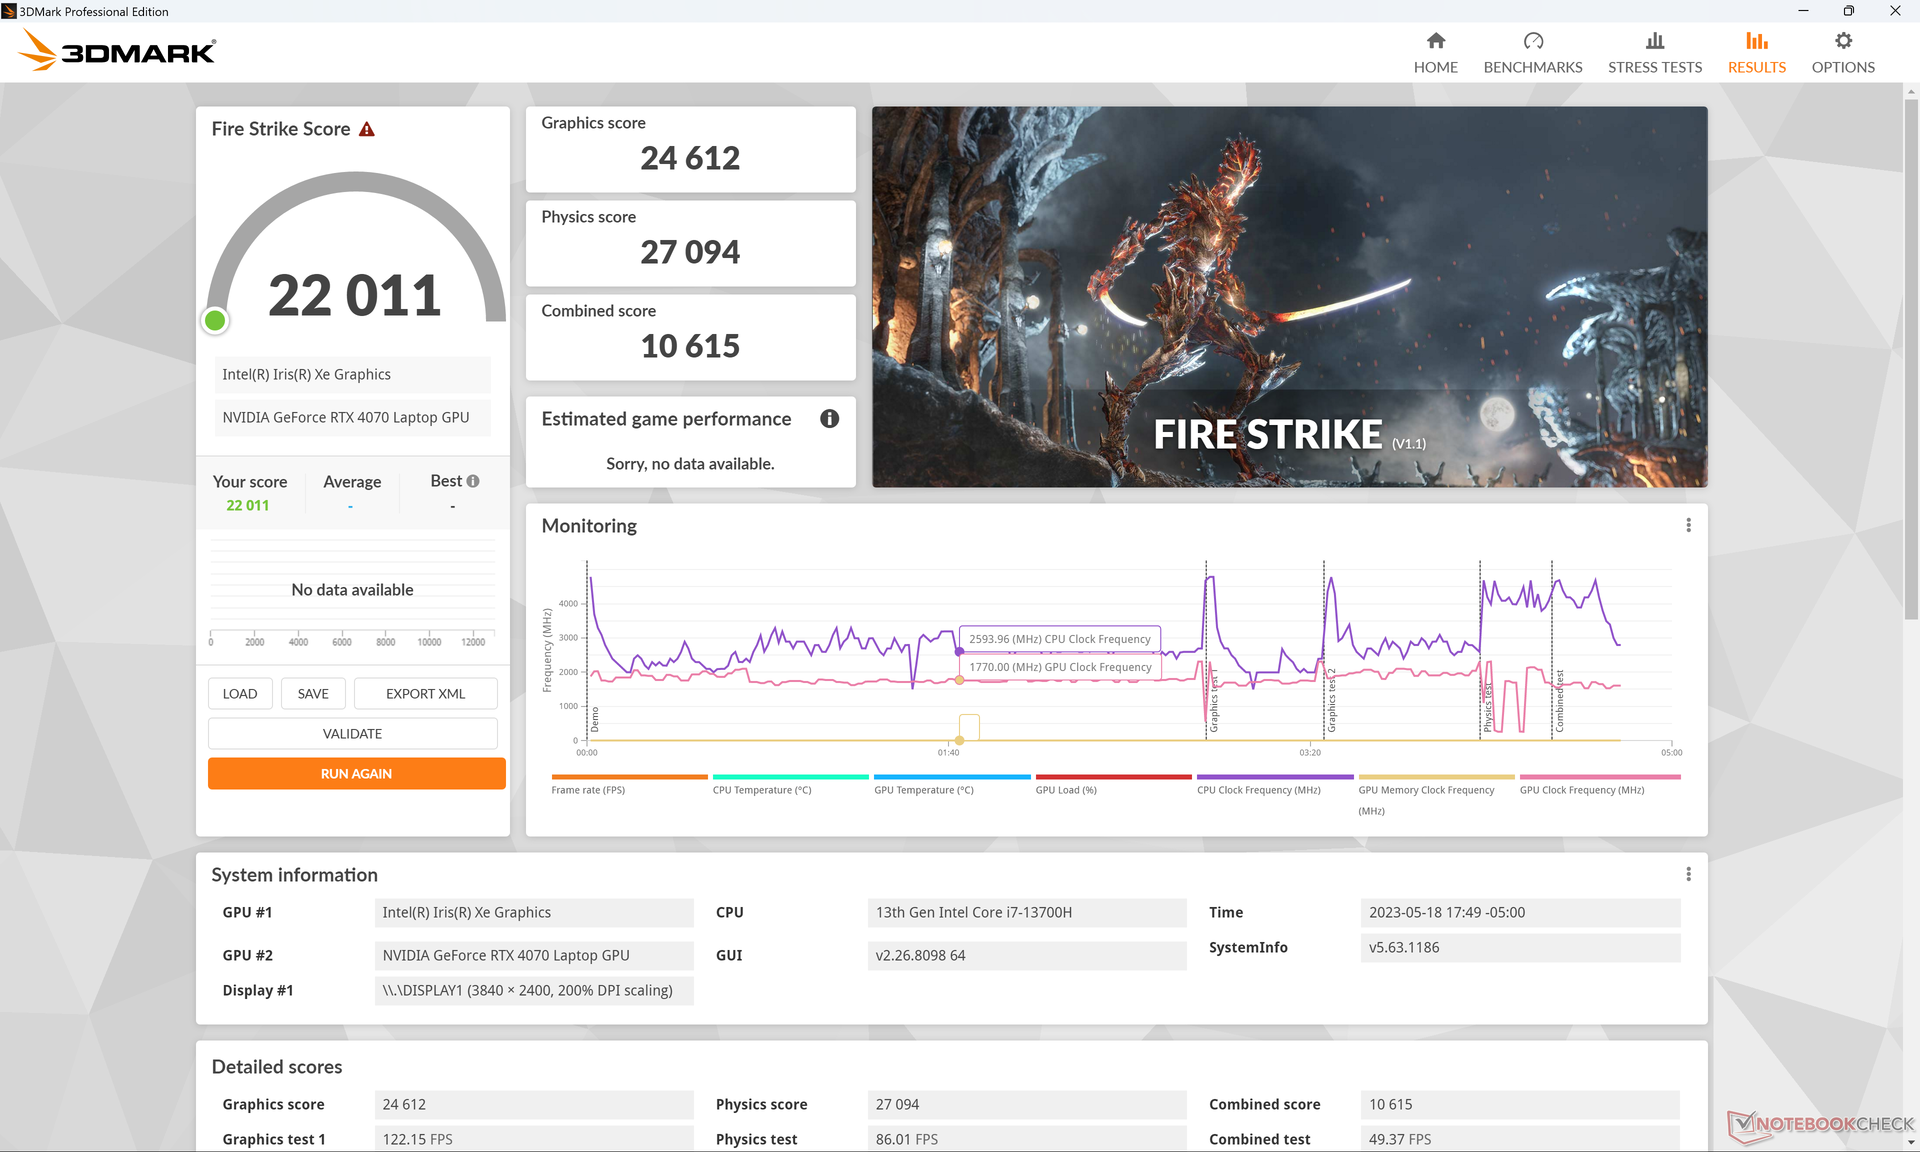
| 3DMark 11 Performance | 29589 points | |
| 3DMark Fire Strike Score | 22011 points | |
| 3DMark Time Spy Score | 9714 points | |
Aide | ||
* ... Moindre est la valeur, meilleures sont les performances
Performance des jeux
Le système fonctionne bien en tant que machine de jeu secondaire. La RTX 4070 de 70 W n'étant pas aussi peu puissante que la version de 40 W du XPS 15, le XPS 17 est capable de faire tourner les jeux les plus récents en résolution QHD et à 60 FPS avec des réglages moyens à moyens-hauts. la résolution 4K UHD est encore hors de portée pour la plupart, mais le GPU se marierait bien avec des moniteurs externes FHD ou QHD pour les jeux.
Les deux facteurs qui empêchent le XPS 17 d'être un véritable ordinateur portable de jeu sont ses temps de réponse relativement lents et l'absence de support G-Sync pour l'écran interne. Les images perdues, les déchirures d'écran et les images fantômes sont donc plus fréquentes lorsque l'on joue sur le XPS 17. Bien sûr, la plupart de ces problèmes peuvent être évités en jouant sur un moniteur externe.
| Returnal | |
| 1280x720 Low Preset | |
| Aorus 17X AZF | |
| Moyenne NVIDIA GeForce RTX 4070 Laptop GPU (126 - 150, n=5) | |
| 1920x1080 Low Preset | |
| Aorus 17X AZF | |
| Moyenne NVIDIA GeForce RTX 4070 Laptop GPU (65 - 119, n=11) | |
| Dell XPS 17 9730 RTX 4070 | |
| 1920x1080 Medium Preset | |
| Aorus 17X AZF | |
| Moyenne NVIDIA GeForce RTX 4070 Laptop GPU (69 - 117, n=12) | |
| Dell XPS 17 9730 RTX 4070 | |
| 1920x1080 High Preset | |
| Aorus 17X AZF | |
| Moyenne NVIDIA GeForce RTX 4070 Laptop GPU (64 - 106, n=12) | |
| Dell XPS 17 9730 RTX 4070 | |
| 1920x1080 Epic Preset | |
| Aorus 17X AZF | |
| Moyenne NVIDIA GeForce RTX 4070 Laptop GPU (54 - 90, n=12) | |
| Dell XPS 17 9730 RTX 4070 | |
| 2560x1440 Epic Preset | |
| Aorus 17X AZF | |
| Moyenne NVIDIA GeForce RTX 4070 Laptop GPU (39 - 66, n=12) | |
| Dell XPS 17 9730 RTX 4070 | |
| 3840x2160 Epic Preset | |
| Aorus 17X AZF | |
| Moyenne NVIDIA GeForce RTX 4070 Laptop GPU (21 - 39, n=8) | |
| Dell XPS 17 9730 RTX 4070 | |
| Tiny Tina's Wonderlands | |
| 1920x1080 Low Preset (DX12) | |
| Aorus 17X AZF | |
| Moyenne NVIDIA GeForce RTX 4070 Laptop GPU (98.1 - 283, n=15) | |
| Dell XPS 17 9730 RTX 4070 | |
| 1920x1080 Medium Preset (DX12) | |
| Aorus 17X AZF | |
| Moyenne NVIDIA GeForce RTX 4070 Laptop GPU (92.5 - 231, n=15) | |
| Dell XPS 17 9730 RTX 4070 | |
| 1920x1080 High Preset (DX12) | |
| Aorus 17X AZF | |
| Moyenne NVIDIA GeForce RTX 4070 Laptop GPU (74.3 - 151.4, n=15) | |
| Dell XPS 17 9730 RTX 4070 | |
| 1920x1080 Badass Preset (DX12) | |
| Aorus 17X AZF | |
| Moyenne NVIDIA GeForce RTX 4070 Laptop GPU (58.6 - 115.9, n=18) | |
| Dell XPS 17 9730 RTX 4070 | |
| 2560x1440 Badass Preset (DX12) | |
| Aorus 17X AZF | |
| Moyenne NVIDIA GeForce RTX 4070 Laptop GPU (49.8 - 79.5, n=17) | |
| Dell XPS 17 9730 RTX 4070 | |
| 3840x2160 Badass Preset (DX12) | |
| Aorus 17X AZF | |
| Moyenne NVIDIA GeForce RTX 4070 Laptop GPU (28.3 - 39.7, n=13) | |
| Dell XPS 17 9730 RTX 4070 | |
Witcher 3 FPS Chart
| Bas | Moyen | Élevé | Ultra | QHD | 4K | |
|---|---|---|---|---|---|---|
| GTA V (2015) | 186.6 | 182.5 | 167.9 | 102.7 | 75.5 | 76.9 |
| The Witcher 3 (2015) | 415.2 | 297.6 | 181.4 | 96.2 | 59 | |
| Dota 2 Reborn (2015) | 193.5 | 174.5 | 165.9 | 156.9 | 108 | |
| Final Fantasy XV Benchmark (2018) | 174.8 | 128.3 | 94.7 | 69.9 | 38.2 | |
| X-Plane 11.11 (2018) | 154.6 | 133.1 | 106.4 | 90 | ||
| Strange Brigade (2018) | 431 | 238 | 192 | 165.4 | 113.6 | 61.7 |
| Cyberpunk 2077 1.6 (2022) | 102.1 | 99.4 | 85.6 | 71 | 43 | 18.7 |
| Tiny Tina's Wonderlands (2022) | 183.5 | 153.3 | 104.9 | 82.4 | 55.7 | 28.3 |
| F1 22 (2022) | 206 | 196.4 | 158.2 | 60.7 | 39.4 | 18.8 |
| Returnal (2023) | 72 | 71 | 67 | 59 | 41 | 21 |
Émissions
Bruit du système - bruyant seulement quand il le faut
Le bruit du ventilateur n'a pas changé radicalement malgré les améliorations des performances. Le XPS 17 oscille autour de 25,6 dB(A) à peine audible sur un fond silencieux de 22,7 dB(A) lorsque l'on navigue sur le web ou que l'on regarde des vidéos en streaming. En revanche, en cas d'utilisation très exigeante comme les jeux, le bruit du ventilateur commence à se rapprocher du niveau de certains ordinateurs portables de jeu, jusqu'à 50 dB(A). Le modèle XPS offre des spécifications de niveau jeu, après tout.
Degré de la nuisance sonore
| Au repos |
| 22.8 / 22.8 / 22.8 dB(A) |
| Fortement sollicité |
| 38.9 / 50.2 dB(A) |
 | ||
30 dB silencieux 40 dB(A) audible 50 dB(A) bruyant |
||
min: | ||
| Dell XPS 17 9730 RTX 4070 GeForce RTX 4070 Laptop GPU, i7-13700H, SK hynix PC801 HFS001TEJ9X101N | Dell XPS 17 9720 RTX 3060 GeForce RTX 3060 Laptop GPU, i7-12700H, Samsung PM9A1 MZVL21T0HCLR | LG Gram 17 (2023) Iris Xe G7 96EUs, i7-1360P, Samsung PM9A1 MZVL21T0HCLR | HP Envy 17-cr0079ng GeForce RTX 2050 Mobile, i7-1255U, Samsung PM991a MZVLQ1T0HBLB | MSI Creator Z17 A12UGST-054 GeForce RTX 3070 Ti Laptop GPU, i9-12900H, Micron 3400 1TB MTFDKBA1T0TFH | Apple MacBook Pro 16 2023 M2 Max M2 Max 38-Core GPU, M2 Max, Apple SSD AP2048Z | |
|---|---|---|---|---|---|---|
| Noise | -4% | -11% | -16% | -28% | 4% | |
| arrêt / environnement * (dB) | 22.7 | 23.8 -5% | 25.2 -11% | 26.5 -17% | 26 -15% | 23.9 -5% |
| Idle Minimum * (dB) | 22.8 | 24.1 -6% | 25.2 -11% | 28.5 -25% | 31.8 -39% | 23.9 -5% |
| Idle Average * (dB) | 22.8 | 24.1 -6% | 25.7 -13% | 28.5 -25% | 31.8 -39% | 23.9 -5% |
| Idle Maximum * (dB) | 22.8 | 24.1 -6% | 29.3 -29% | 29.7 -30% | 31.8 -39% | 23.9 -5% |
| Load Average * (dB) | 38.9 | 43.2 -11% | 44.4 -14% | 39.5 -2% | 53.9 -39% | 36.6 6% |
| Witcher 3 ultra * (dB) | 47.4 | 48 -1% | 53.9 -14% | 35.1 26% | ||
| Load Maximum * (dB) | 50.2 | 48 4% | 45.2 10% | 48 4% | 54.9 -9% | 43.2 14% |
* ... Moindre est la valeur, meilleures sont les performances
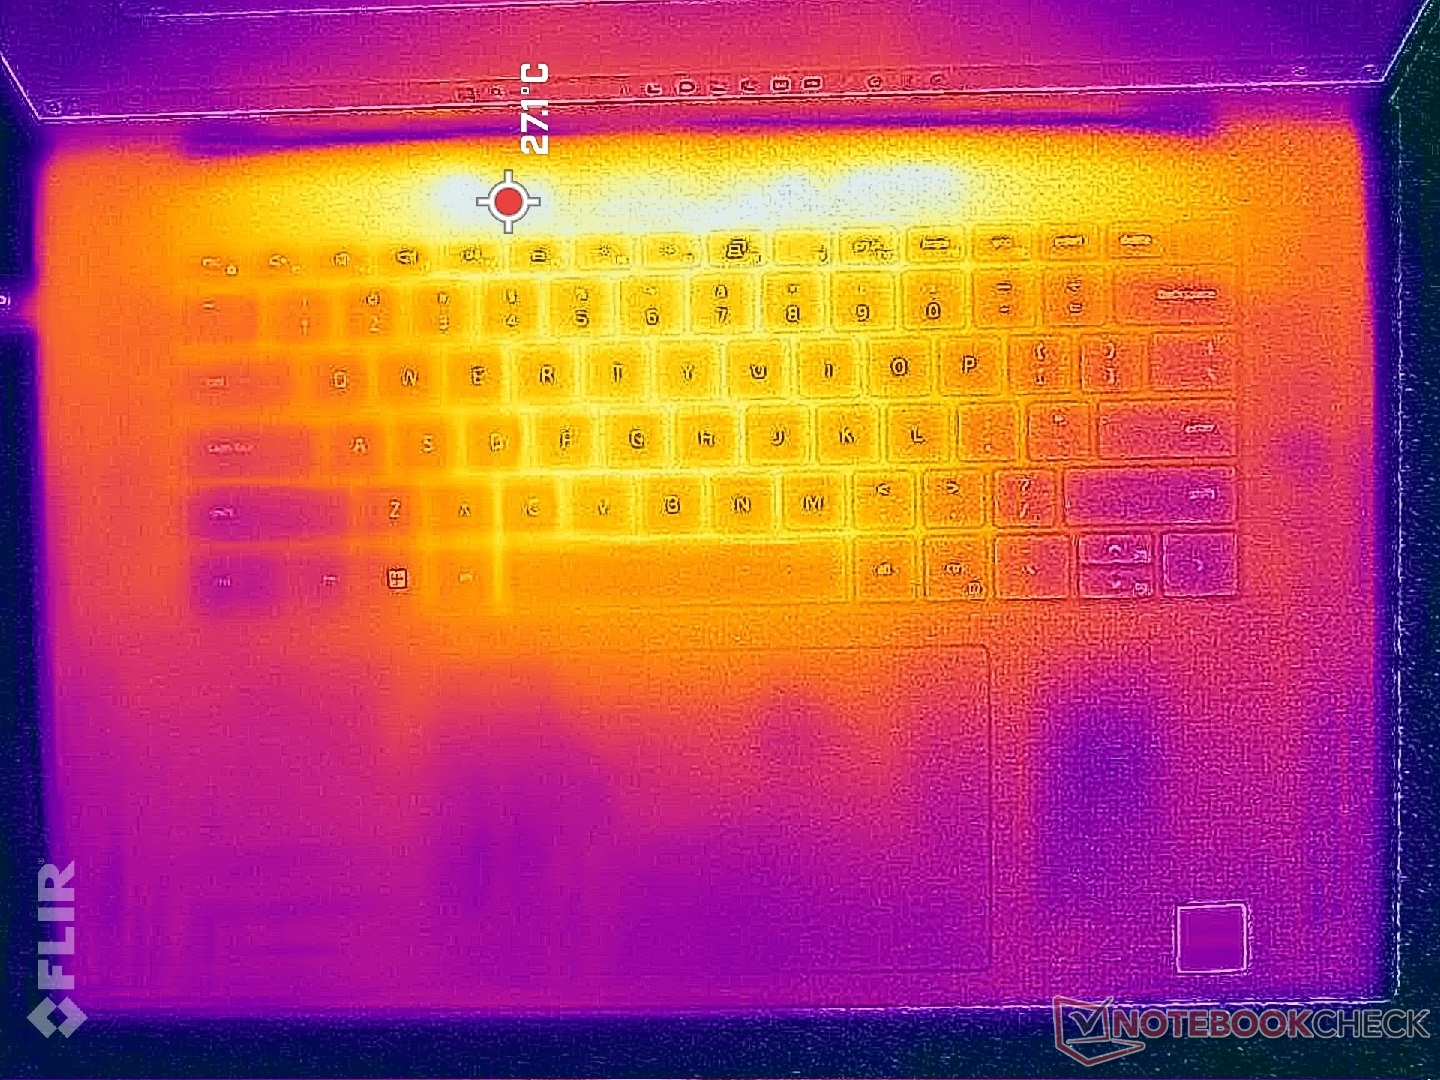
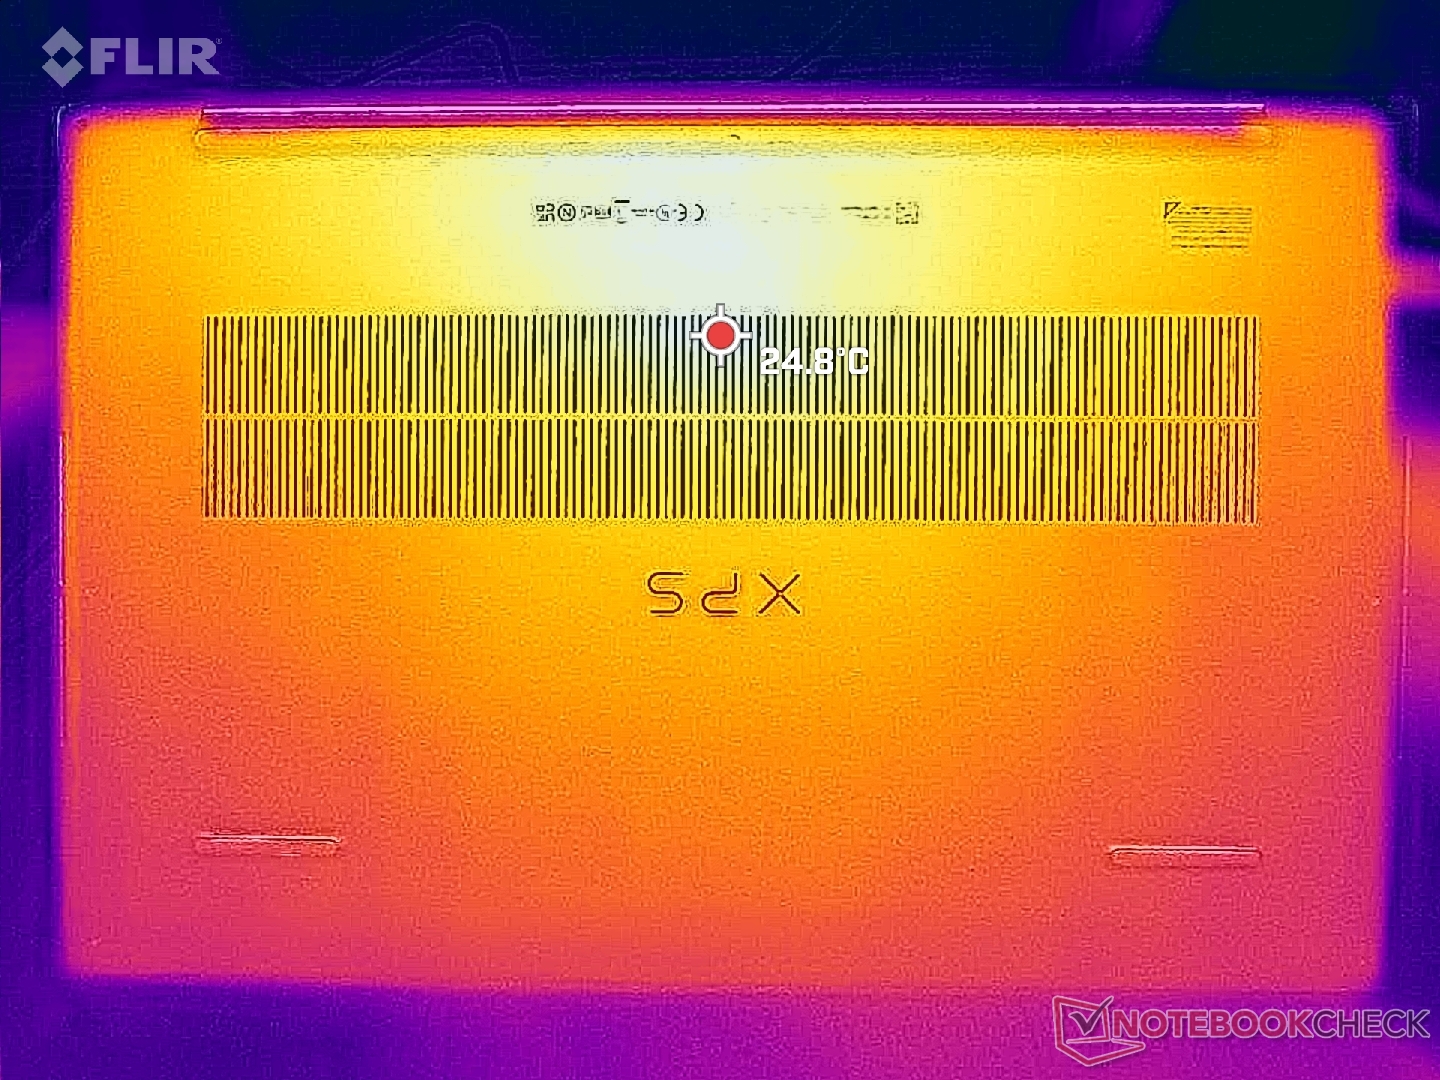
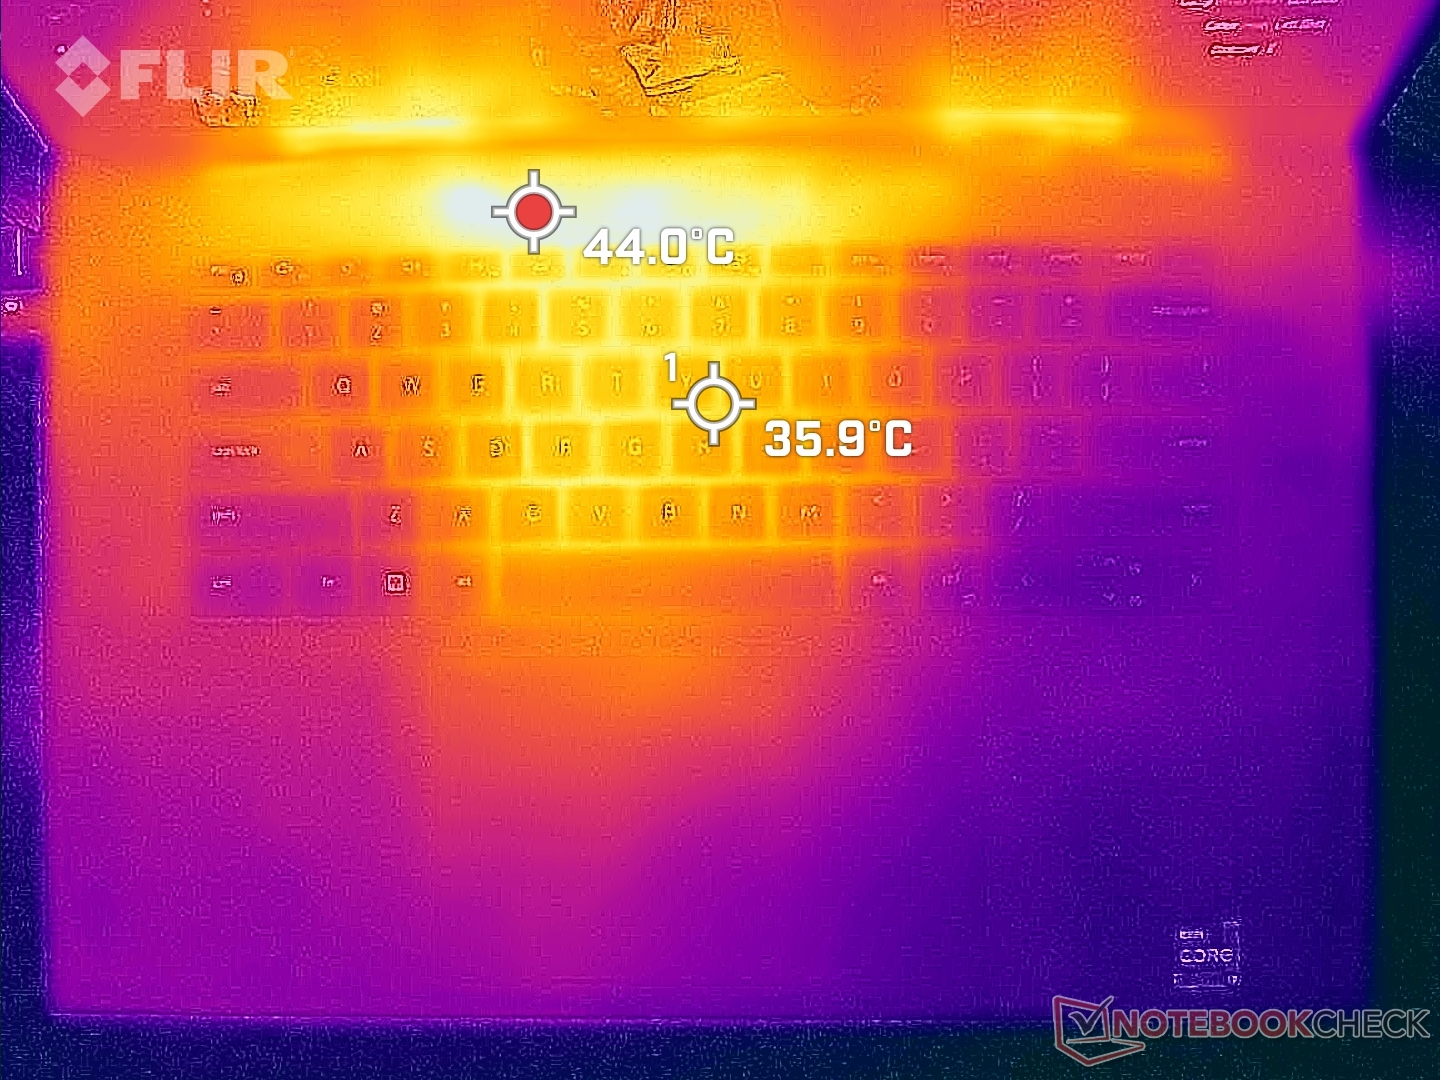
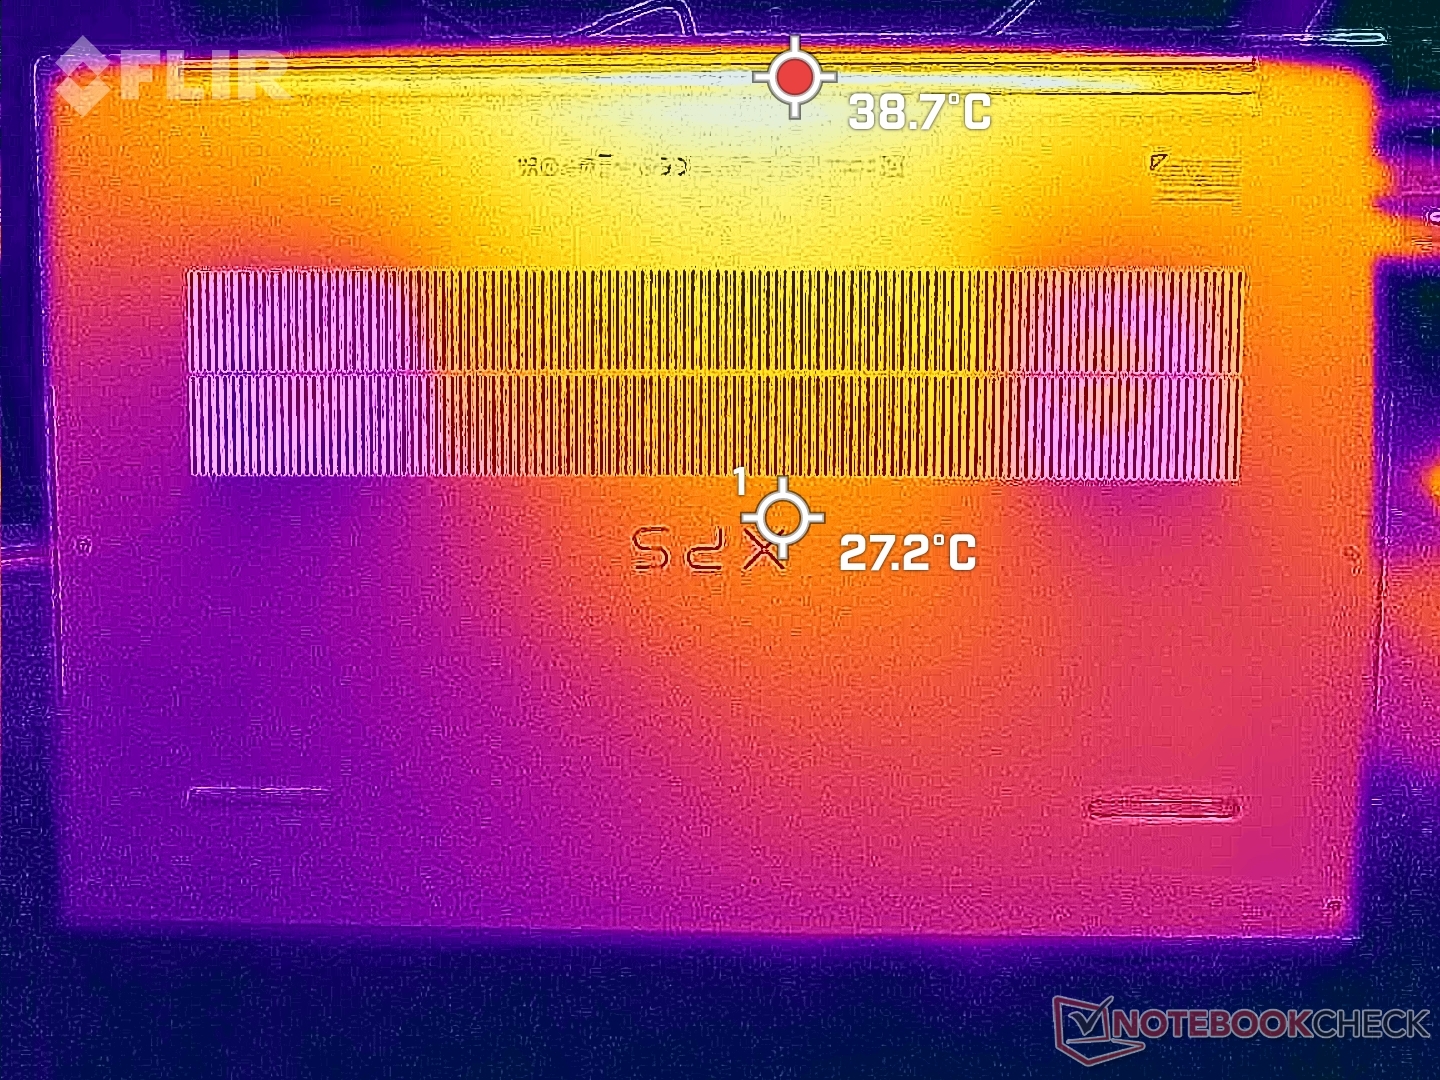
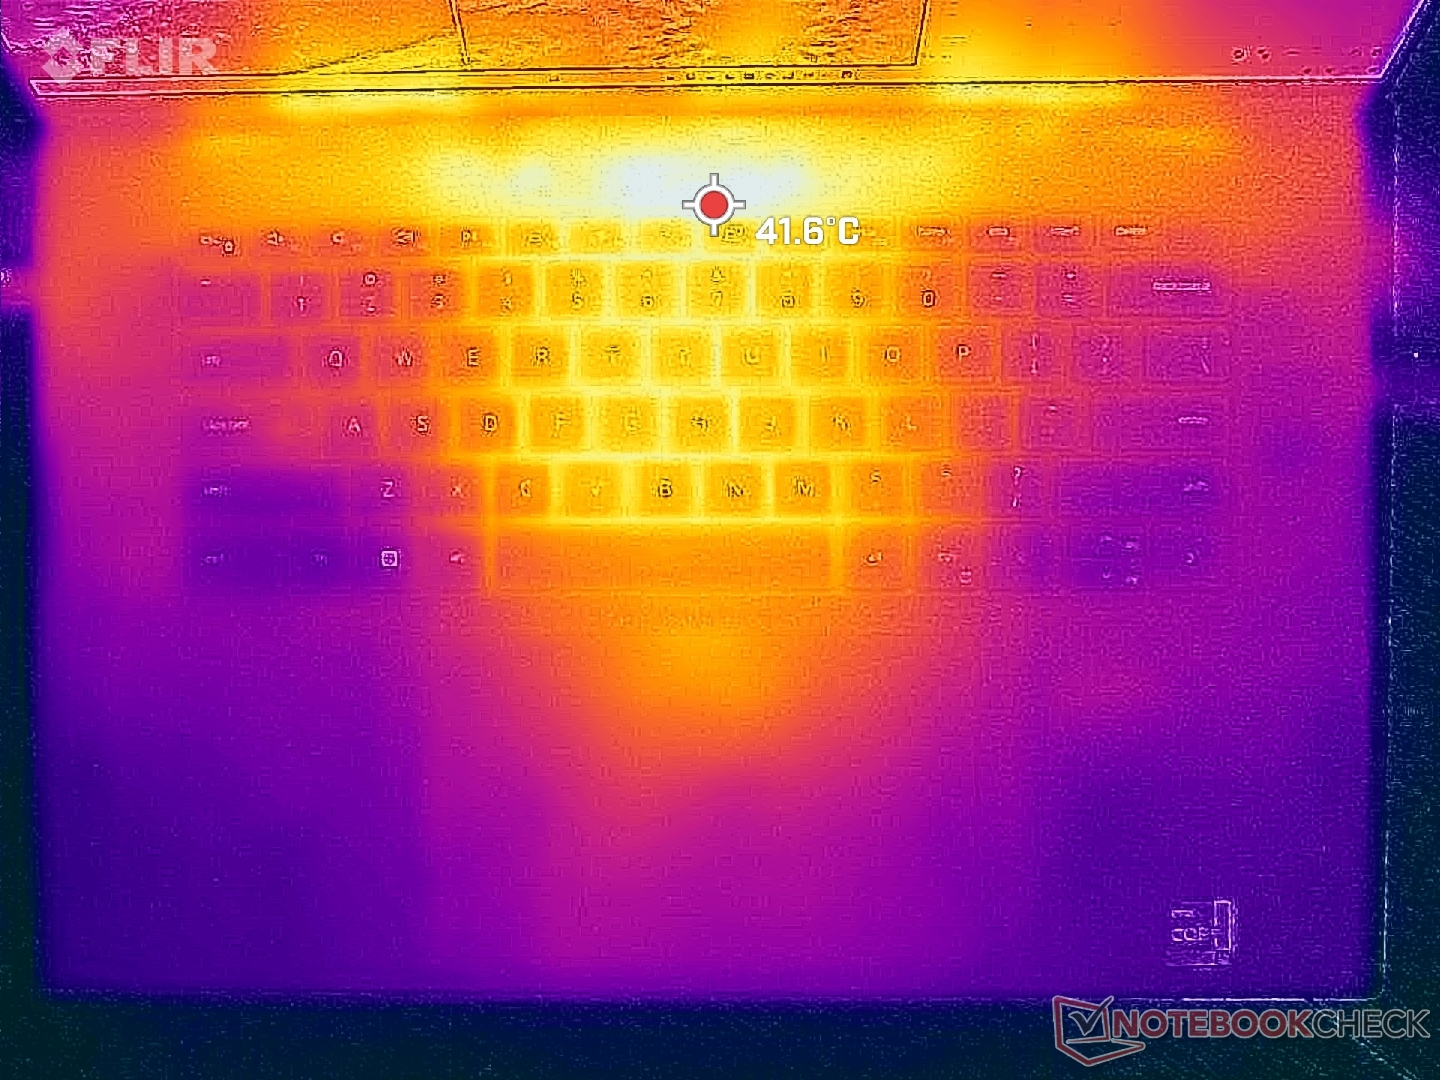
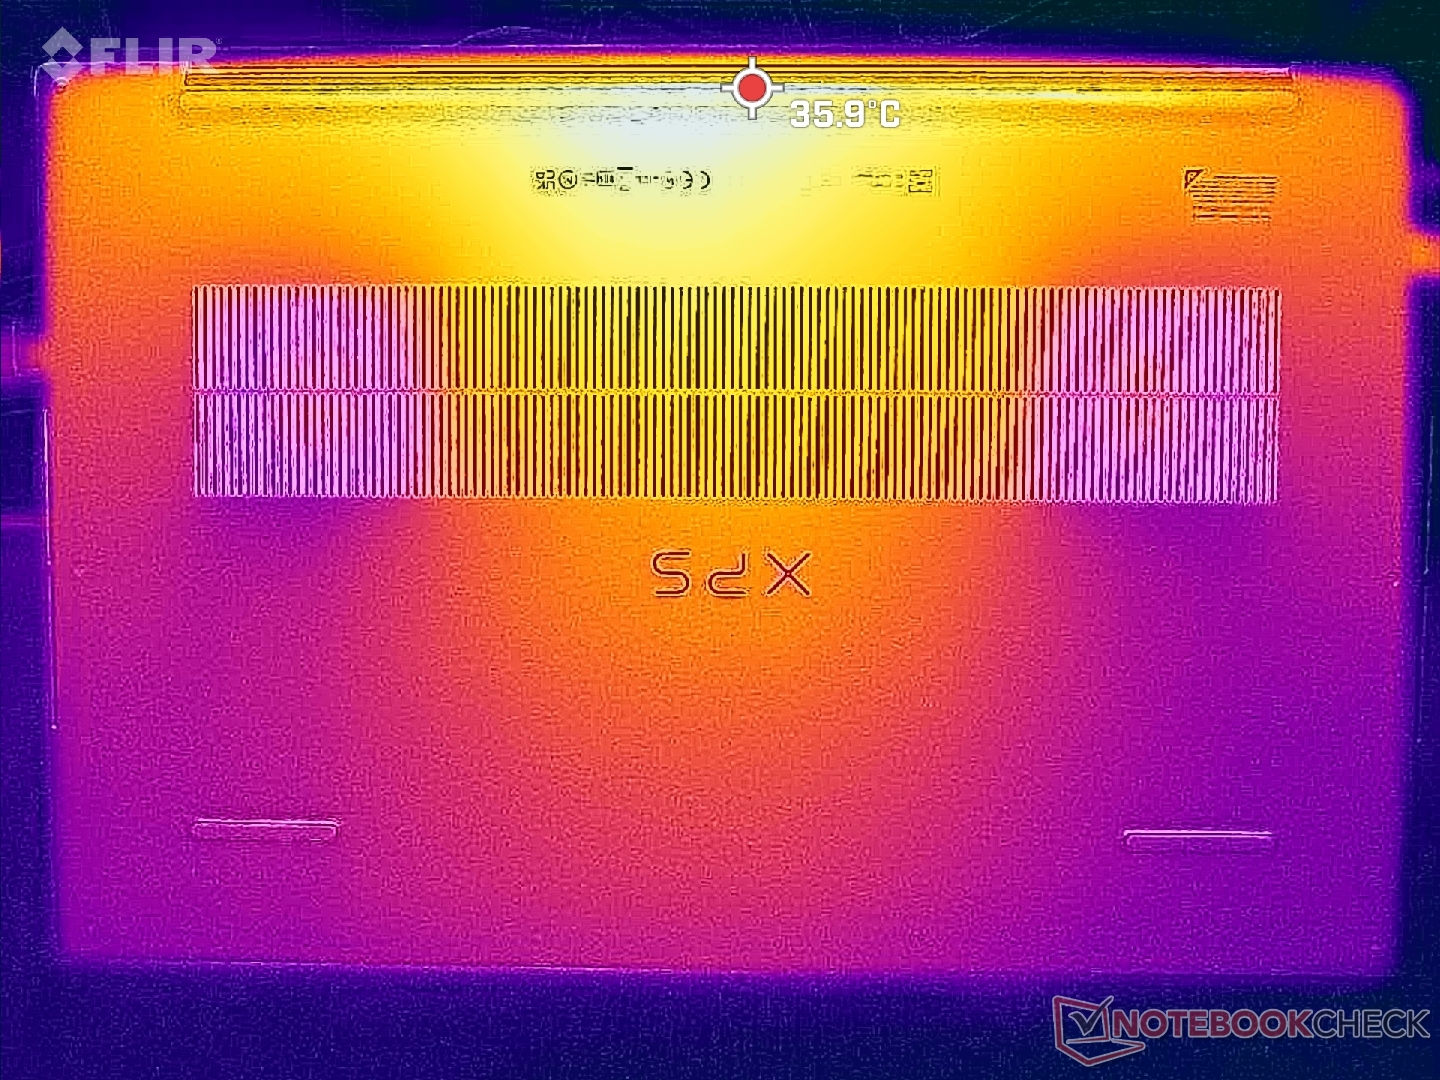
Température
Les températures de surface sont plus basses que prévu par rapport à d'autres ordinateurs portables équipés de CPU Core H-series et de GPU RTX GeForce similaires. Les ordinateurs concurrentsMSI Creator Z17par exemple, aurait des points chauds de plus de 60°C alors que notre Dell n'atteindrait que 43°C avec des charges lourdes similaires. Les températures de surface plus basses sur le Dell peuvent être attribuées au refroidisseur à chambre à vapeur, à l'isolation thermique GORE et à l'enveloppe de puissance généralement plus faible.
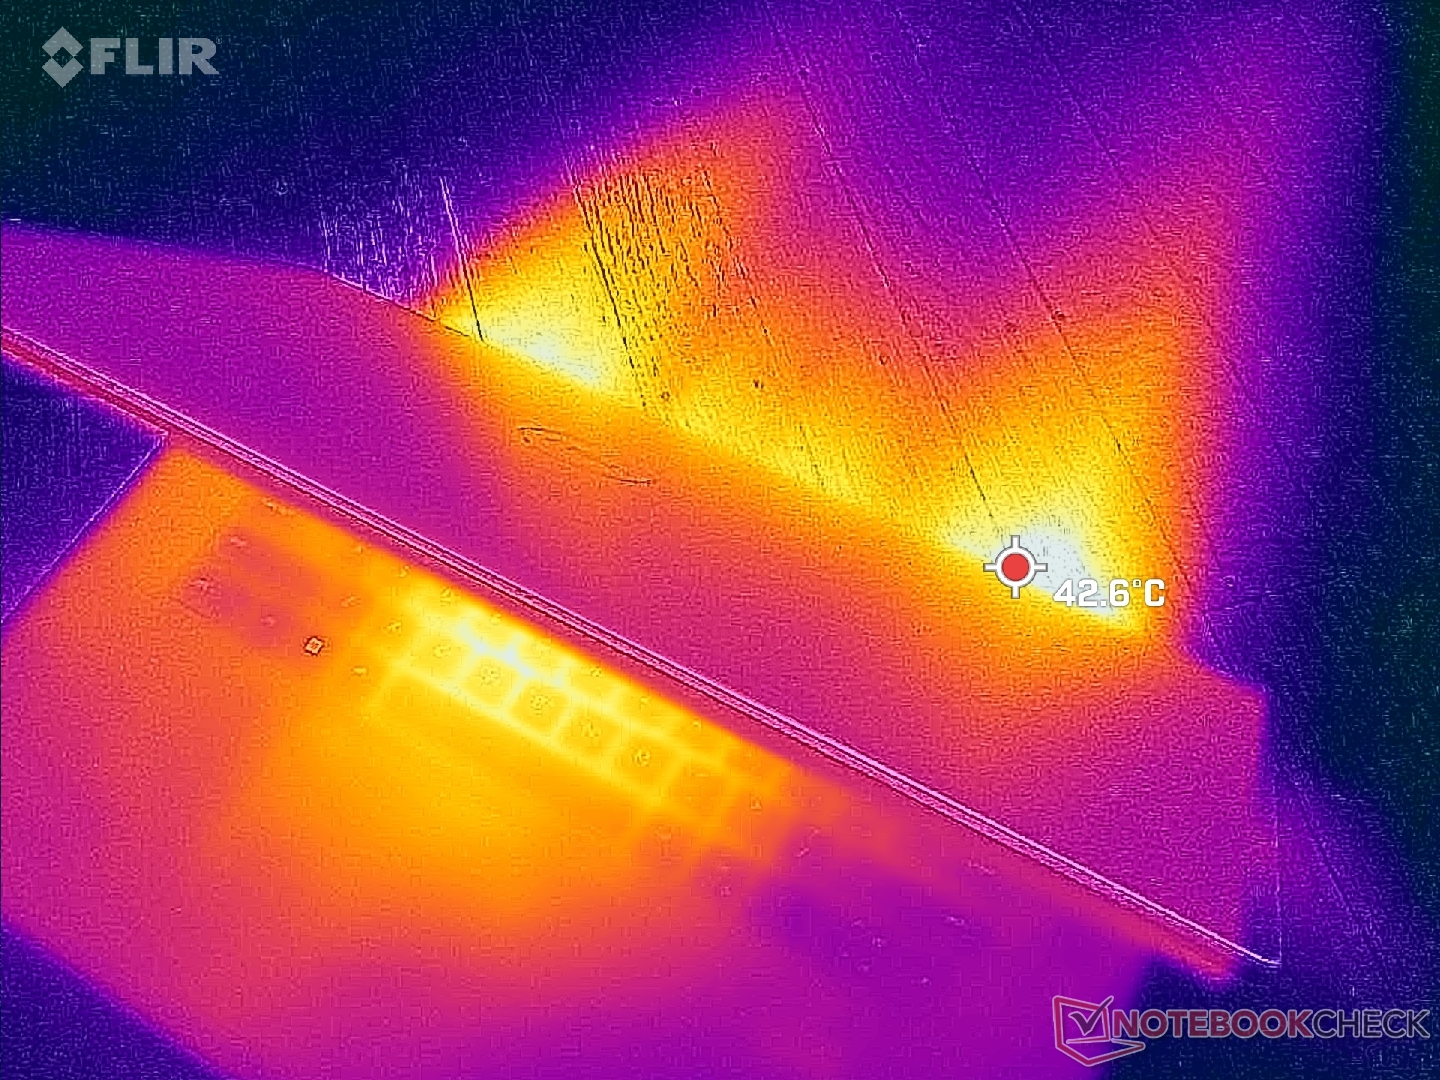
(±) La température maximale du côté supérieur est de 43.2 °C / 110 F, par rapport à la moyenne de 36.8 °C / 98 F, allant de 21 à 71 °C pour la classe Multimedia.
(+) Le fond chauffe jusqu'à un maximum de 31.8 °C / 89 F, contre une moyenne de 39.1 °C / 102 F
(+) En utilisation inactive, la température moyenne du côté supérieur est de 28.2 °C / 83 F, par rapport à la moyenne du dispositif de 31.3 °C / 88 F.
(±) En jouant à The Witcher 3, la température moyenne du côté supérieur est de 33.7 °C / 93 F, alors que la moyenne de l'appareil est de 31.3 °C / 88 F.
(+) Les repose-poignets et le pavé tactile sont plus froids que la température de la peau avec un maximum de 31 °C / 87.8 F et sont donc froids au toucher.
(-) La température moyenne de la zone de l'appui-paume de dispositifs similaires était de 28.7 °C / 83.7 F (-2.3 °C / #-4.1 F).
| Dell XPS 17 9730 RTX 4070 Intel Core i7-13700H, NVIDIA GeForce RTX 4070 Laptop GPU | Dell XPS 17 9720 RTX 3060 Intel Core i7-12700H, NVIDIA GeForce RTX 3060 Laptop GPU | LG Gram 17 (2023) Intel Core i7-1360P, Intel Iris Xe Graphics G7 96EUs | HP Envy 17-cr0079ng Intel Core i7-1255U, NVIDIA GeForce RTX 2050 Mobile | MSI Creator Z17 A12UGST-054 Intel Core i9-12900H, NVIDIA GeForce RTX 3070 Ti Laptop GPU | Apple MacBook Pro 16 2023 M2 Max Apple M2 Max, Apple M2 Max 38-Core GPU | |
|---|---|---|---|---|---|---|
| Heat | -19% | -7% | -3% | -37% | 5% | |
| Maximum Upper Side * (°C) | 43.2 | 51.8 -20% | 43.9 -2% | 47.1 -9% | 63.9 -48% | 44.2 -2% |
| Maximum Bottom * (°C) | 31.8 | 44.2 -39% | 45.5 -43% | 43.8 -38% | 68 -114% | 42.9 -35% |
| Idle Upper Side * (°C) | 32.8 | 34.8 -6% | 28.4 13% | 25.2 23% | 28.3 14% | 22.4 32% |
| Idle Bottom * (°C) | 29.8 | 33.2 -11% | 28.2 5% | 25.9 13% | 30.2 -1% | 22.3 25% |
* ... Moindre est la valeur, meilleures sont les performances
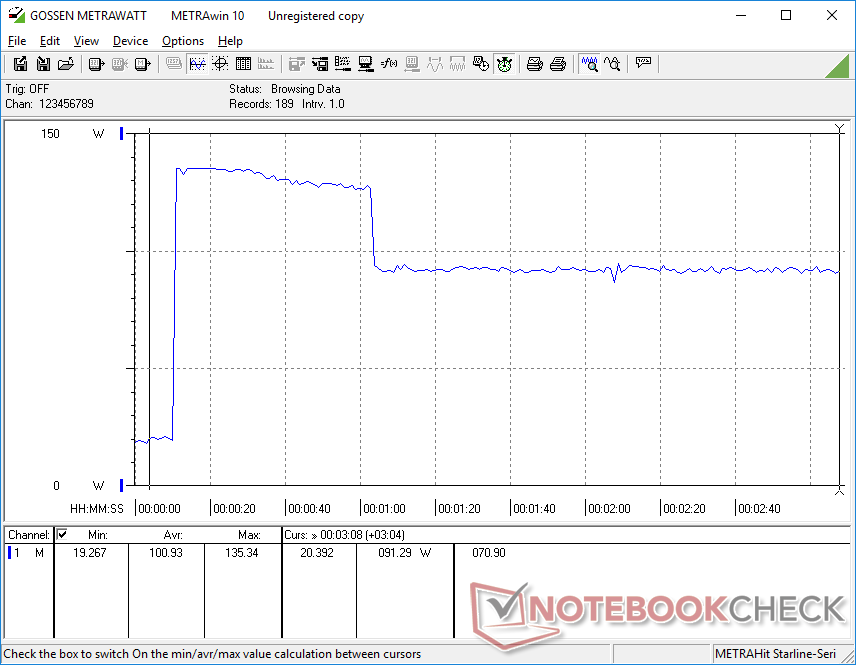
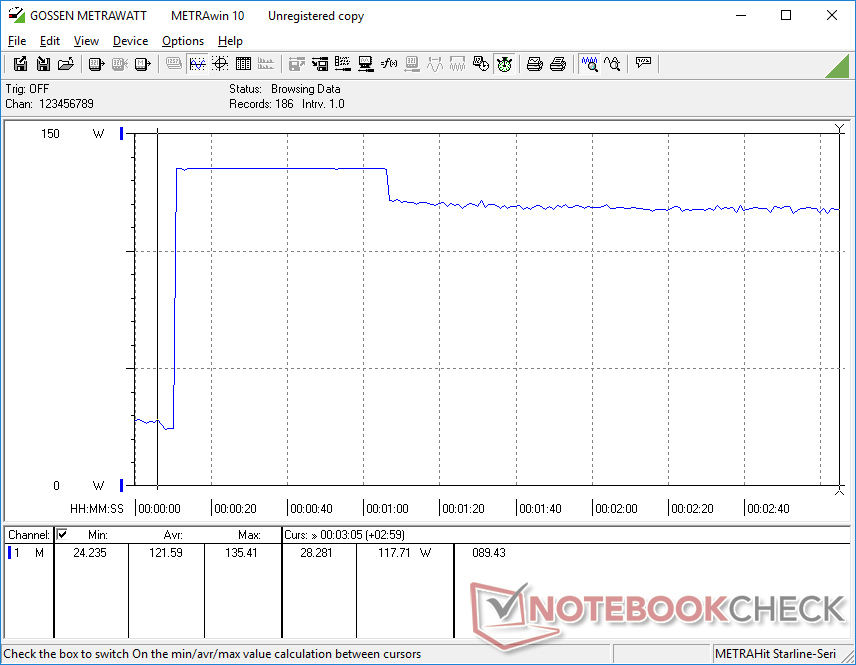
Test de stress
Lors de l'exécution de Prime95 pour solliciter le processeur, les fréquences d'horloge et la puissance de l'ensemble ont atteint 4,1 GHz et 122 W, respectivement, pendant quelques secondes seulement. Le processeur descend ensuite régulièrement à 3,4 GHz et 80 W, puis à 2,6 GHz et 55 W quelques minutes plus tard. La consommation finale stable de 55 W correspond à ce que nous avions observé sur le XPS 19 9720 de l'année dernière, ce qui expliquerait les performances similaires du processeur après avoir pris en compte l'étranglement mentionné ci-dessus. La température du cœur est très élevée (95°C à 100°C) pendant les premières minutes du test, lorsque Turbo Boost est le plus actif, avant de redescendre et de se stabiliser à 74°C.
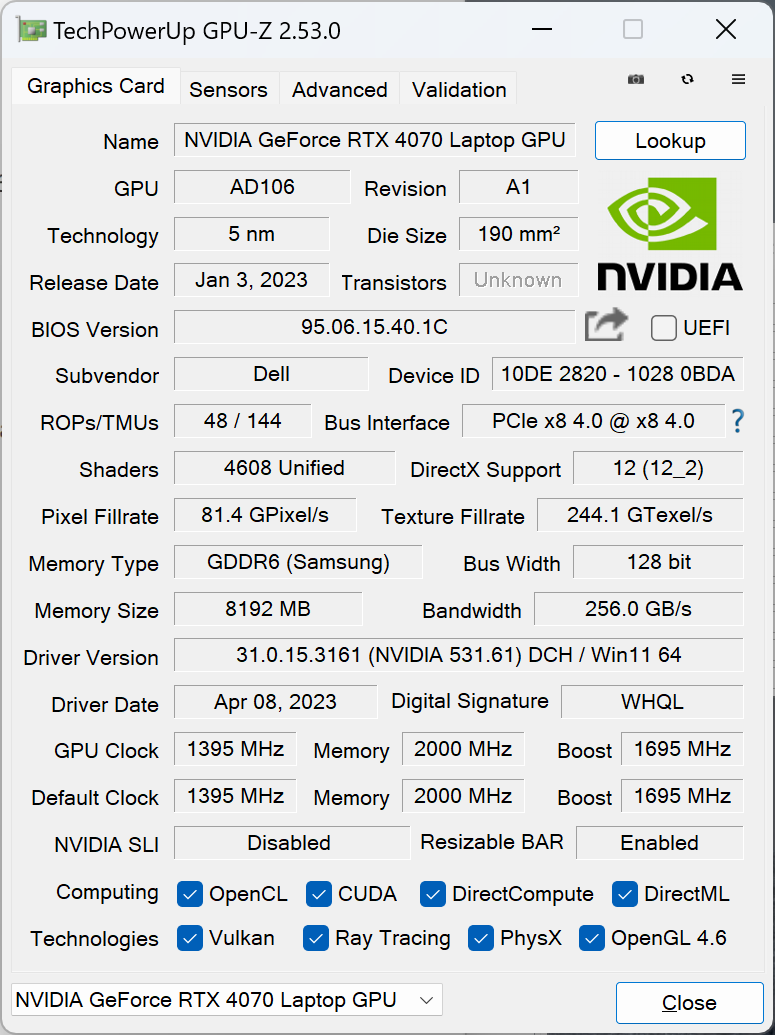
La fréquence d'horloge et la température du GPU en fonctionnement Witcher 3 se stabilisent à 2115 MHz et 67 C, respectivement, ce qui correspond à ce que nous avons observé sur le XPS 17 9720 équipé de la RTX 3060 de l'année dernière. Il est intéressant de noter que GPU-Z indique une consommation d'énergie inférieure de 52 W, tandis que HWiNFO indique 70 W, comme le montre la capture d'écran ci-dessous. Les deux valeurs semblent néanmoins stables.
L'utilisation de la batterie limite les performances. Un test Fire Strike sur batterie donne des scores en physique et en graphique de 24847 et 21172 points, respectivement, contre 27094 et 24612 points sur secteur.
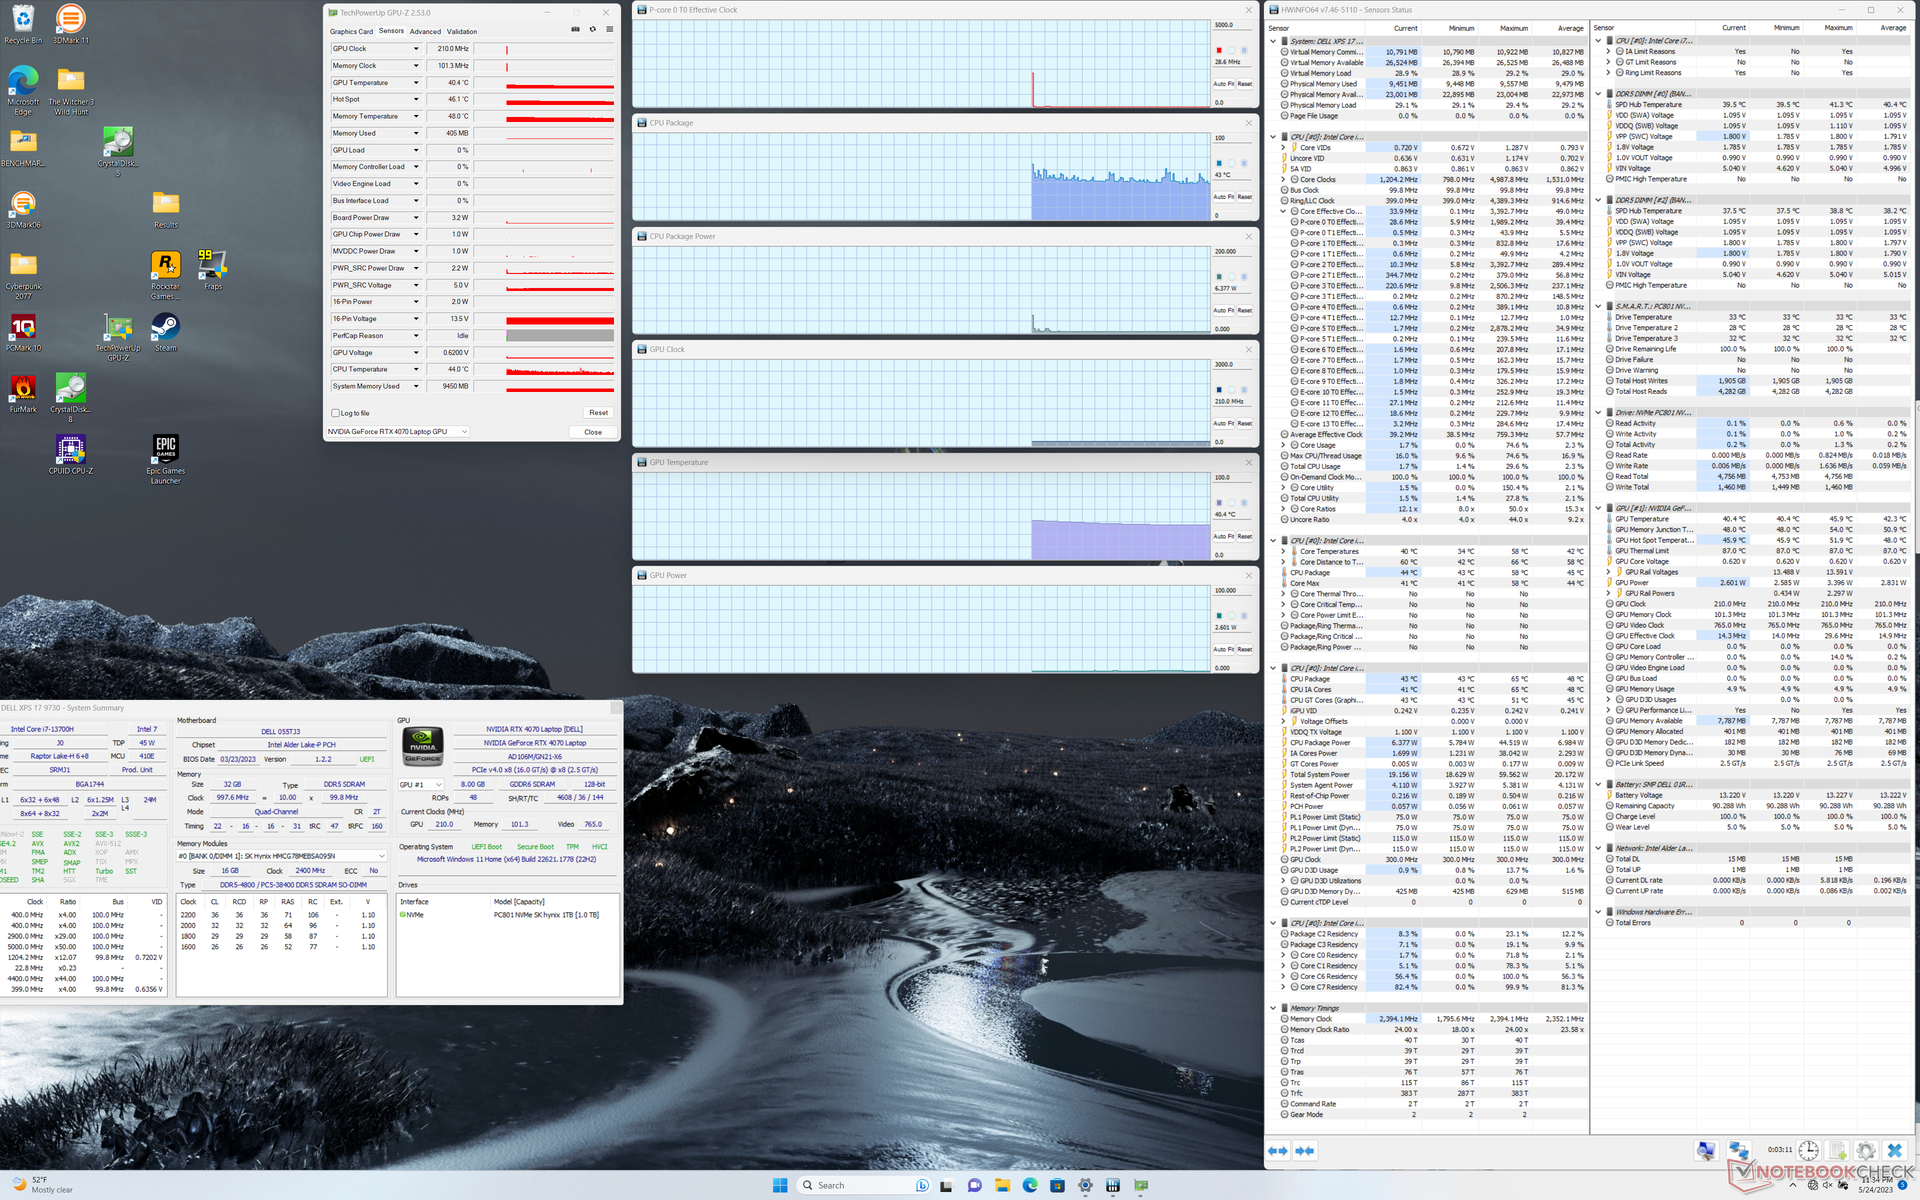
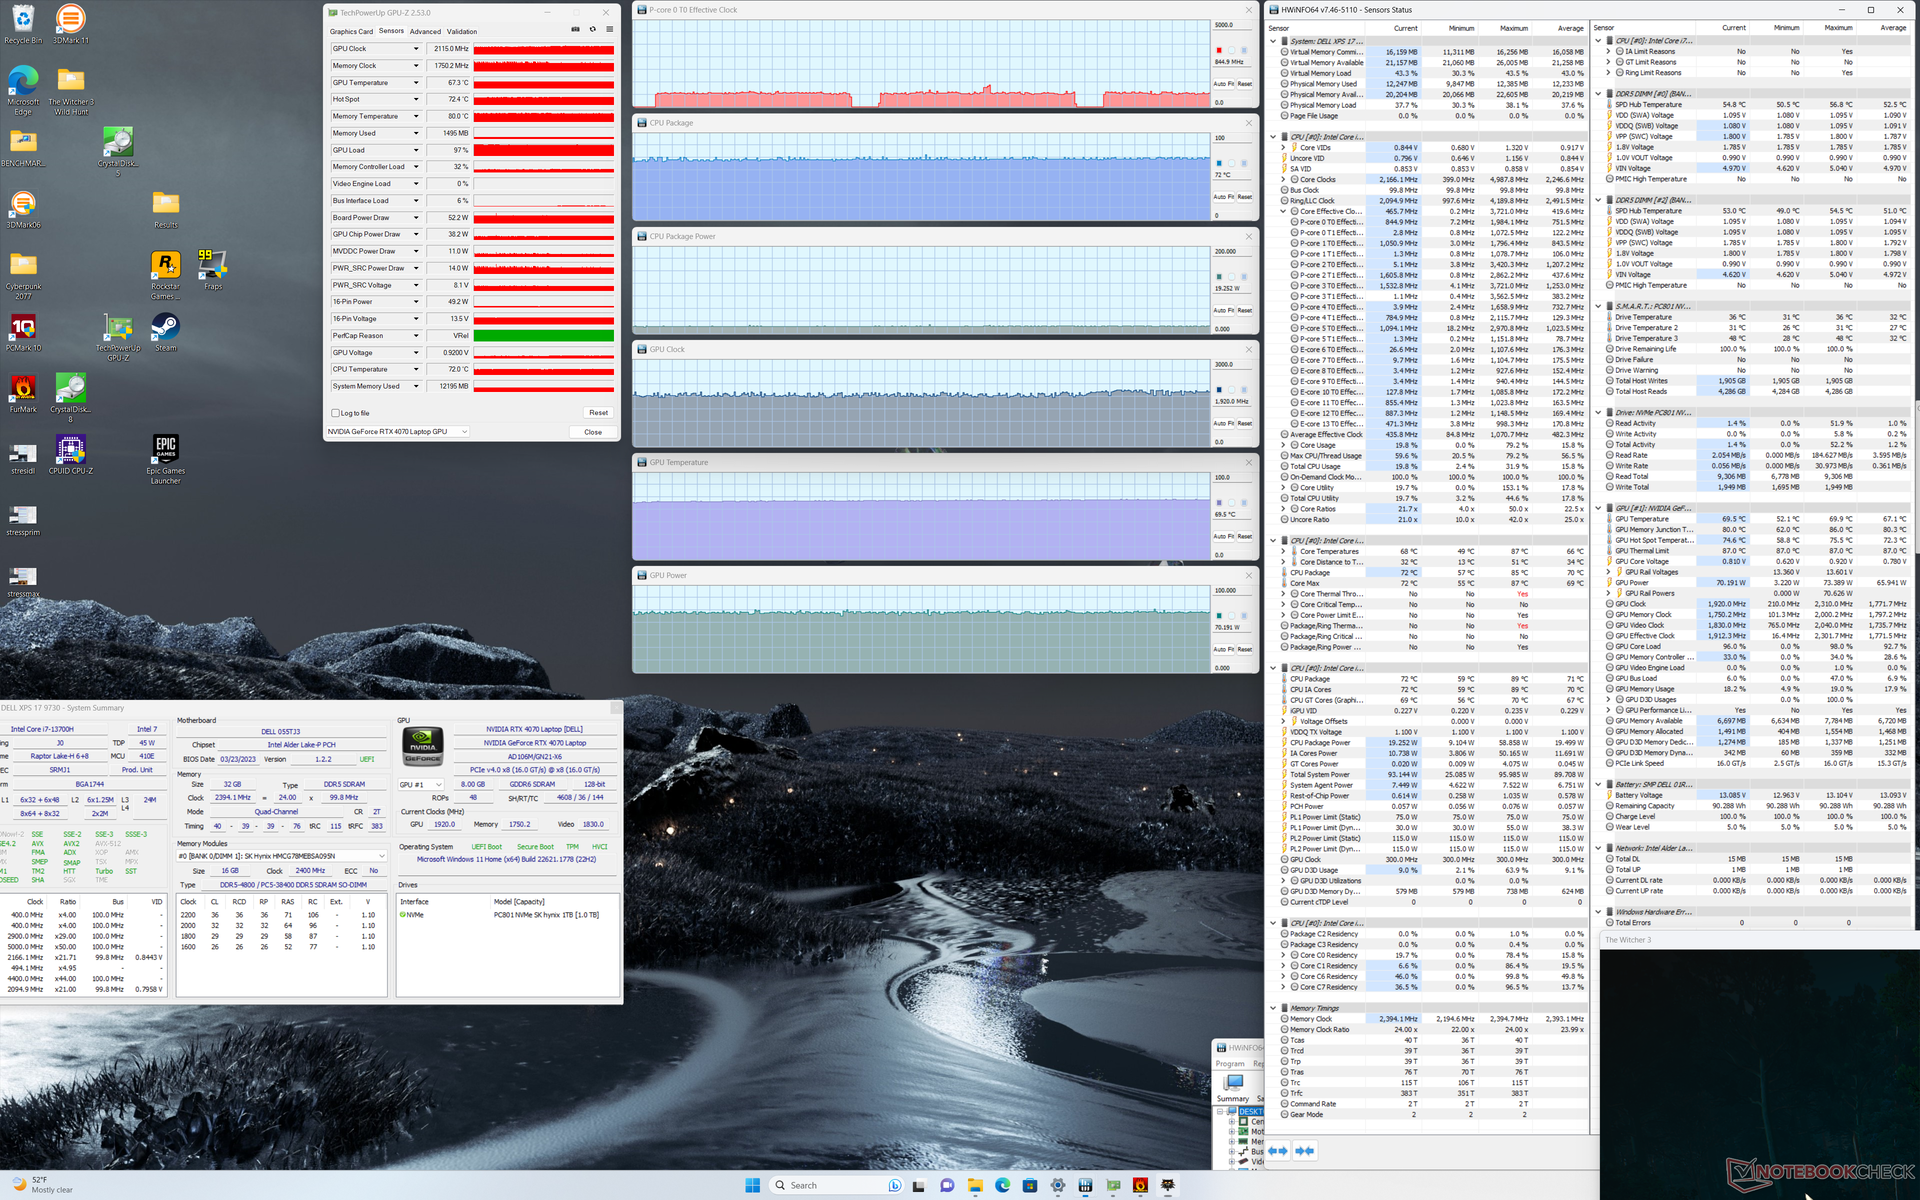
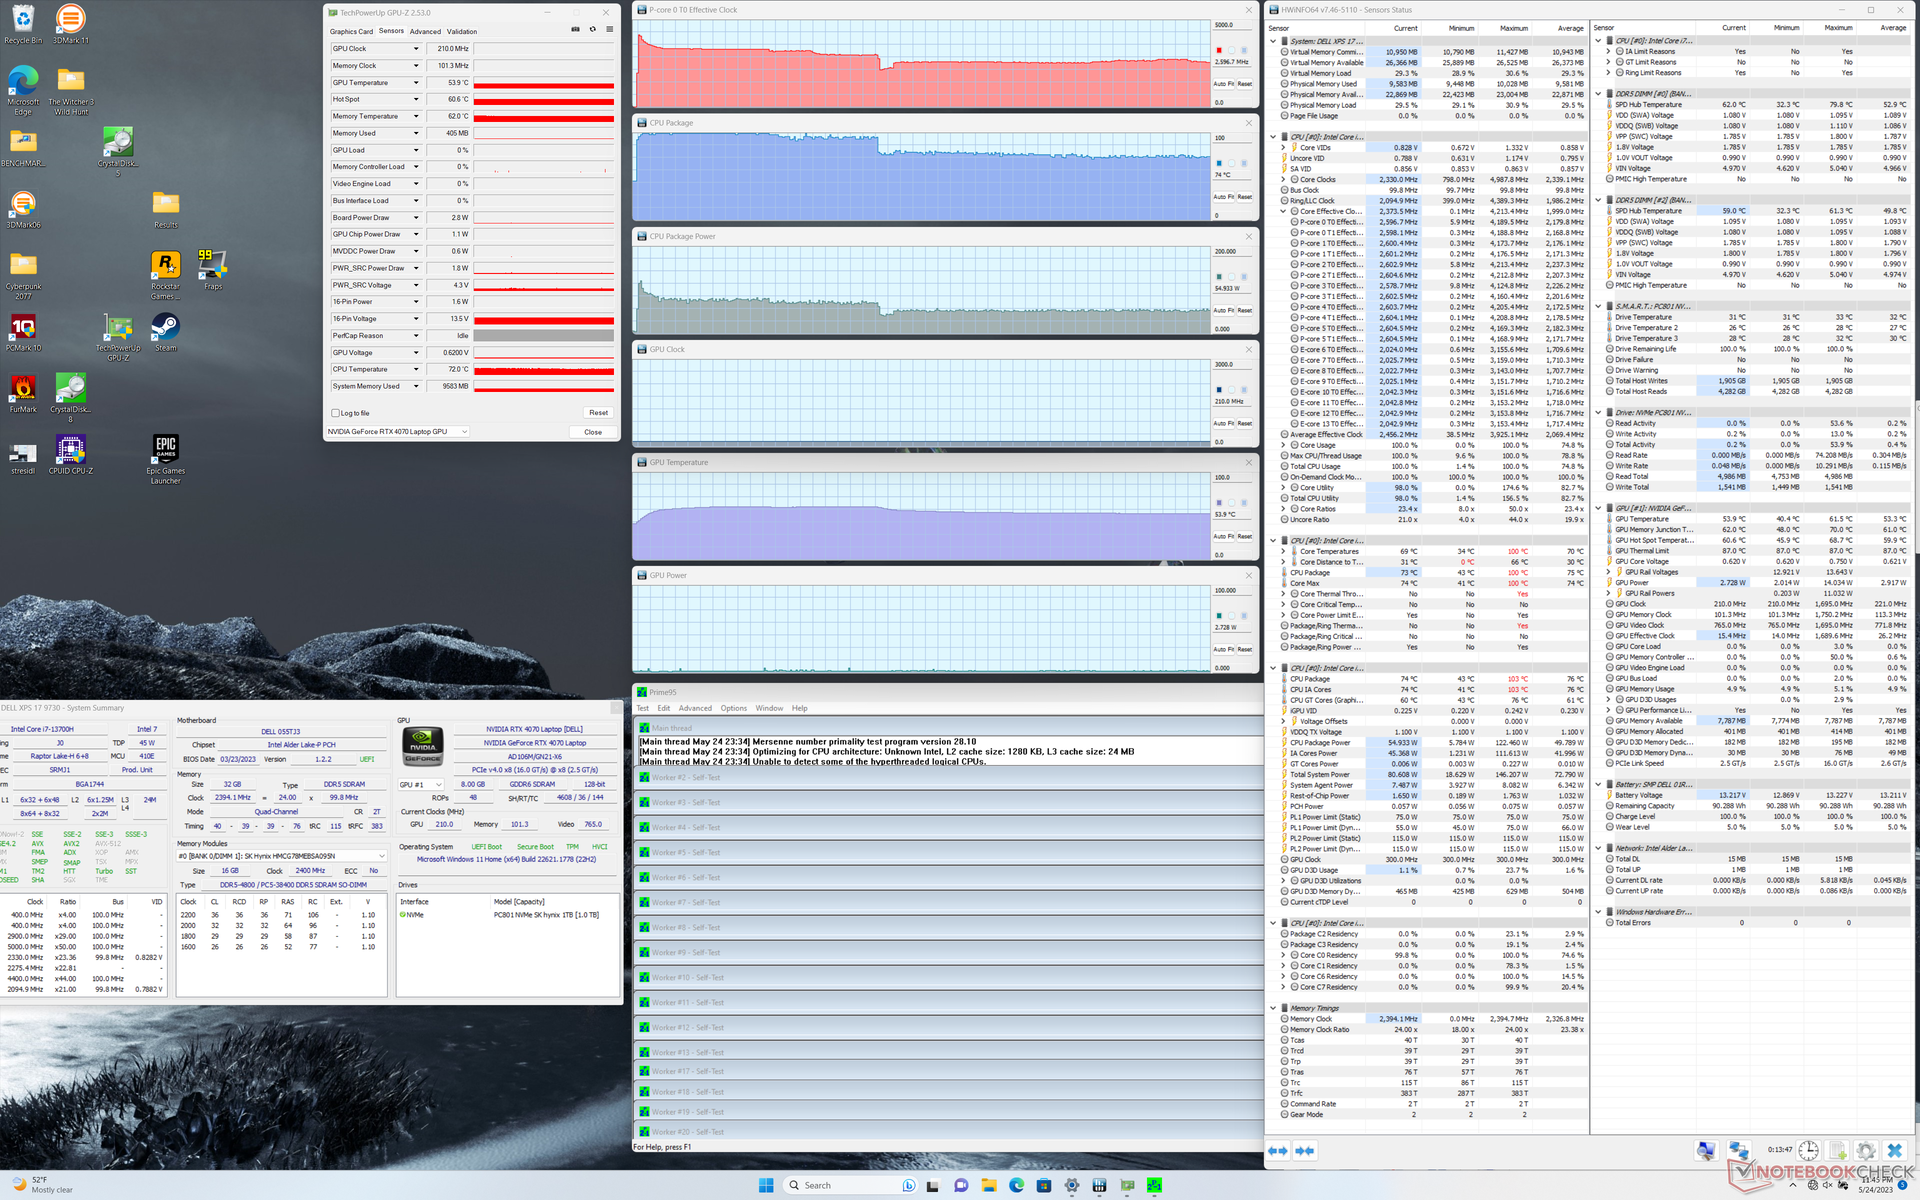
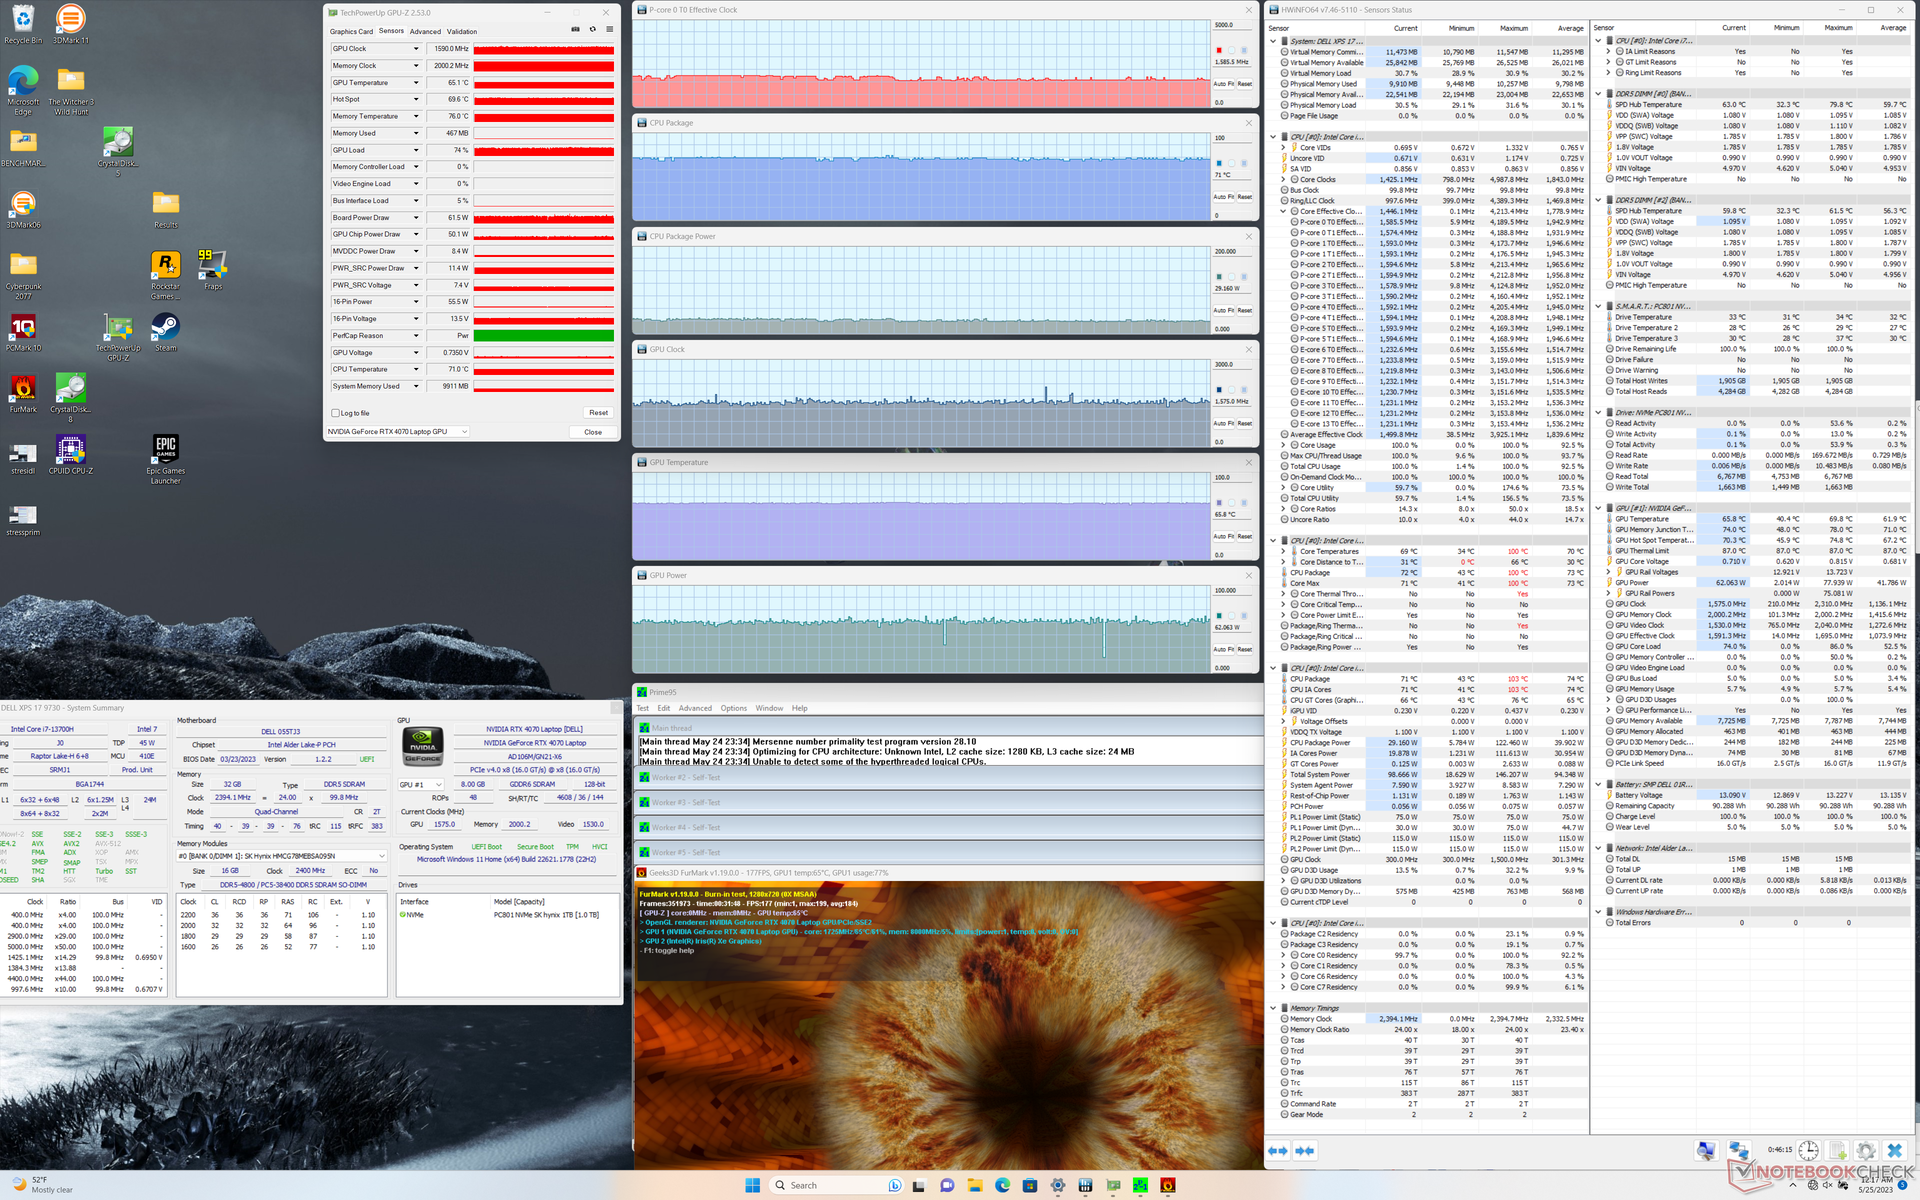
| Horloge du CPU (GHz) | Horloge du GPU (MHz) | Température moyenne du CPU (°C) | Température moyenne du GPU (°C) | |
| Système au repos | -- | -- | 43 | 40 |
| Prime95 Stress | 2.6 | -- | 74 | 54 |
| Prime95 + FurMark Stress | 1.6 | 1590 | 71 | 65 |
| Witcher 3 Stress | 0,8 | 2115 | 72 | 67 |
Intervenants
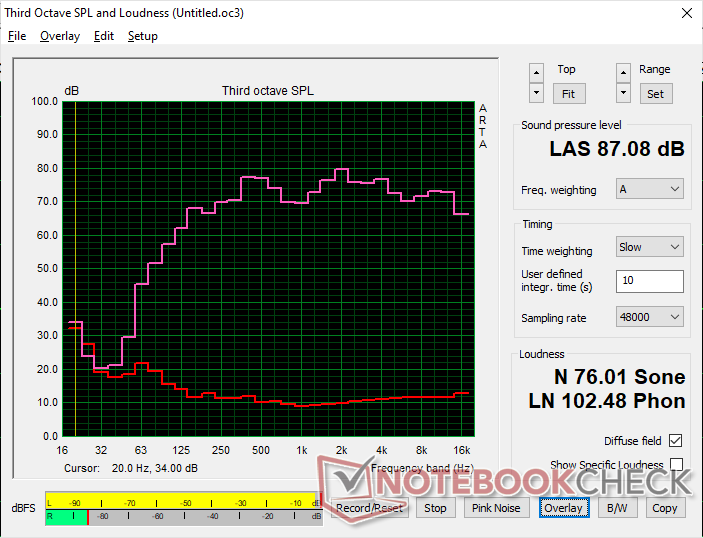
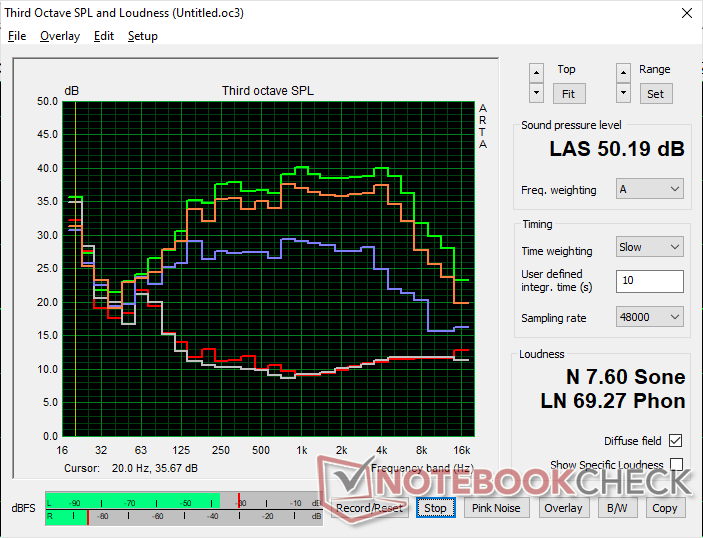
Dell XPS 17 9730 RTX 4070 analyse audio
(+) | les haut-parleurs peuvent jouer relativement fort (87.1# dB)
Basses 100 - 315 Hz
(±) | basse réduite - en moyenne 7.2% inférieure à la médiane
(+) | les basses sont linéaires (5.9% delta à la fréquence précédente)
Médiums 400 - 2000 Hz
(+) | médiane équilibrée - seulement 3.3% de la médiane
(+) | les médiums sont linéaires (5.1% delta à la fréquence précédente)
Aiguës 2 - 16 kHz
(+) | des sommets équilibrés - à seulement 1.9% de la médiane
(+) | les aigus sont linéaires (3.4% delta à la fréquence précédente)
Globalement 100 - 16 000 Hz
(+) | le son global est linéaire (7% différence à la médiane)
Par rapport à la même classe
» 5% de tous les appareils testés de cette catégorie étaient meilleurs, 1% similaires, 94% pires
» Le meilleur avait un delta de 5%, la moyenne était de 17%, le pire était de 45%.
Par rapport à tous les appareils testés
» 1% de tous les appareils testés étaient meilleurs, 0% similaires, 99% pires
» Le meilleur avait un delta de 4%, la moyenne était de 23%, le pire était de 134%.
Apple MacBook Pro 16 2021 M1 Pro analyse audio
(+) | les haut-parleurs peuvent jouer relativement fort (84.7# dB)
Basses 100 - 315 Hz
(+) | bonne basse - seulement 3.8% loin de la médiane
(+) | les basses sont linéaires (5.2% delta à la fréquence précédente)
Médiums 400 - 2000 Hz
(+) | médiane équilibrée - seulement 1.3% de la médiane
(+) | les médiums sont linéaires (2.1% delta à la fréquence précédente)
Aiguës 2 - 16 kHz
(+) | des sommets équilibrés - à seulement 1.9% de la médiane
(+) | les aigus sont linéaires (2.7% delta à la fréquence précédente)
Globalement 100 - 16 000 Hz
(+) | le son global est linéaire (4.6% différence à la médiane)
Par rapport à la même classe
» 0% de tous les appareils testés de cette catégorie étaient meilleurs, 0% similaires, 100% pires
» Le meilleur avait un delta de 5%, la moyenne était de 17%, le pire était de 45%.
Par rapport à tous les appareils testés
» 0% de tous les appareils testés étaient meilleurs, 0% similaires, 100% pires
» Le meilleur avait un delta de 4%, la moyenne était de 23%, le pire était de 134%.
Gestion de l'énergie - L'USB-C en action
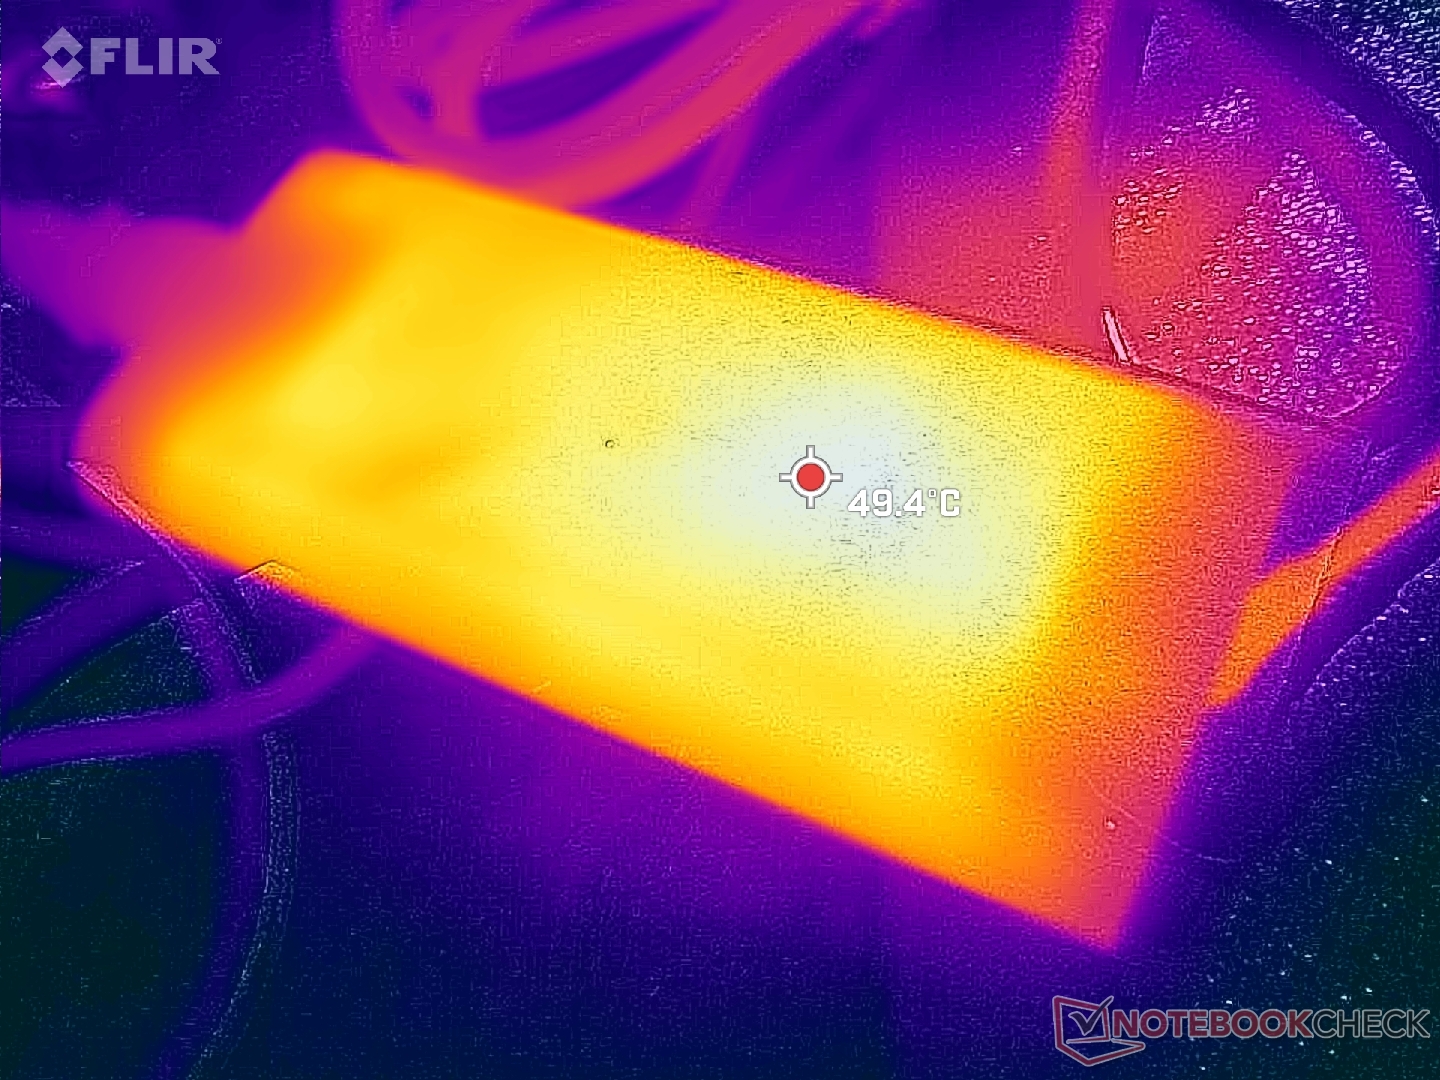
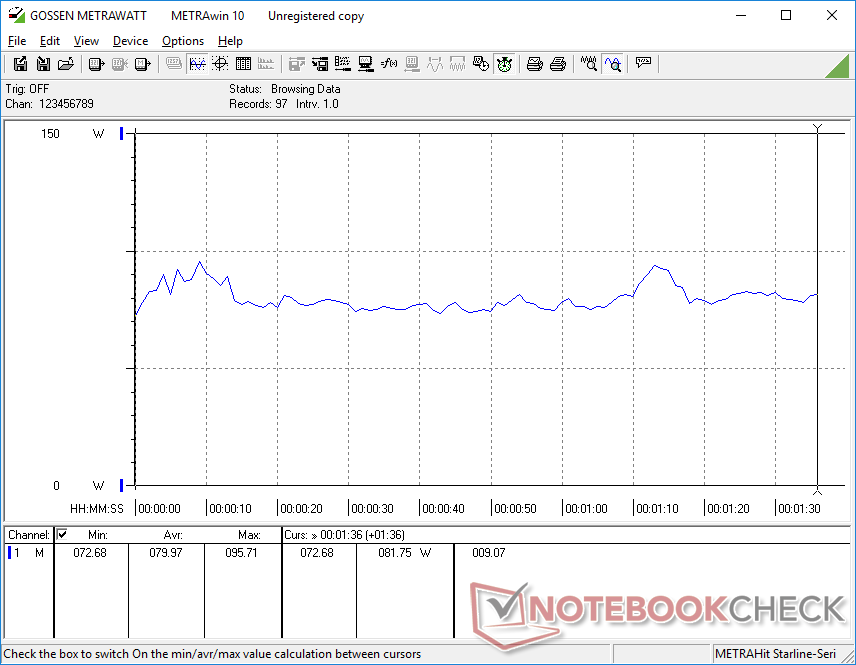
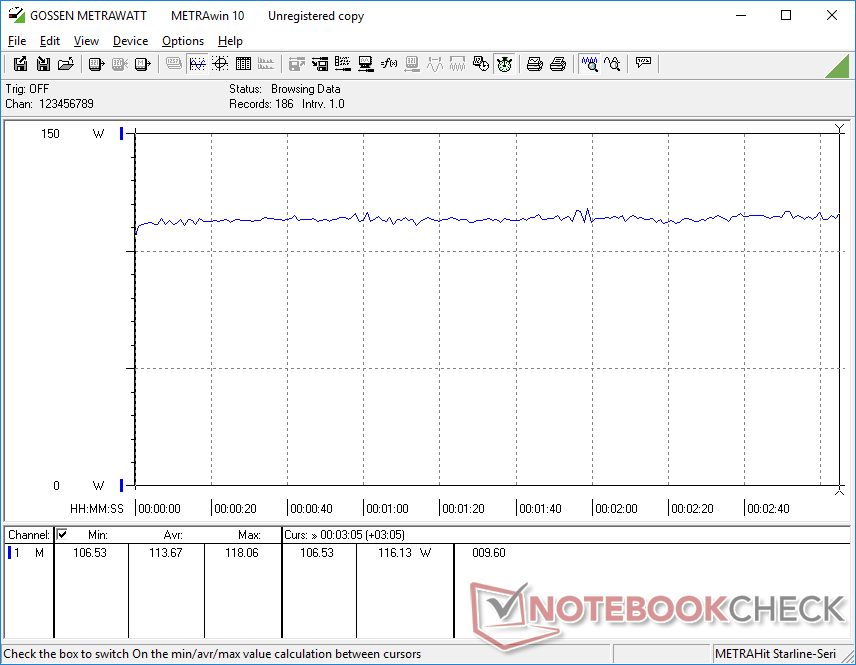
Consommation électrique - 130 W suffisent-ils ?
La consommation d'énergie n'a pas changé radicalement par rapport à l'ancien XPS 17 9720 puisque tous les modèles XPS 17 sont jusqu'à présent livrés avec le même adaptateur secteur USB-C de 130 W. Comparé à d'autres ordinateurs portables équipés de processeurs de série H et de GPU RTX GeForce, l'adaptateur Dell de 130 W est l'un des plus petits en termes de taille et de puissance. Ce petit adaptateur renonce à des performances plus élevées et à une charge plus rapide au profit de la portabilité.
Malgré cela, les performances par watt plus élevées d'Ada Lovelace par rapport à celles d'Ampère permettent au XPS 17 9730 d'être plus performant que le modèle de l'année dernière dans la même enveloppe d'alimentation. La course à pied Witcher 3par exemple, consomme environ 114 W sur les XPS 17 9720 et 9730, bien que ce dernier offre des performances graphiques 30 % plus élevées. La consommation du processeur devrait également être plus stable grâce à la durabilité plus longue du Turbo Boost par rapport au Core i7-12700H, comme mentionné ci-dessus. Dell a certainement optimisé le CPU et le GPU au mieux pour s'adapter au budget d'énergie contraignant.
| Éteint/en veille | |
| Au repos | |
| Fortement sollicité |
|
Légende:
min: | |
| Dell XPS 17 9730 RTX 4070 i7-13700H, GeForce RTX 4070 Laptop GPU, SK hynix PC801 HFS001TEJ9X101N, Sharp LQ170R1, 3840x2400, 17" | Dell XPS 17 9720 RTX 3060 i7-12700H, GeForce RTX 3060 Laptop GPU, Samsung PM9A1 MZVL21T0HCLR, IPS, 3840x2400, 17" | LG Gram 17 (2023) i7-1360P, Iris Xe G7 96EUs, Samsung PM9A1 MZVL21T0HCLR, IPS, 2560x1600, 17" | HP Envy 17-cr0079ng i7-1255U, GeForce RTX 2050 Mobile, Samsung PM991a MZVLQ1T0HBLB, IPS, 3840x2160, 17.3" | MSI Creator Z17 A12UGST-054 i9-12900H, GeForce RTX 3070 Ti Laptop GPU, Micron 3400 1TB MTFDKBA1T0TFH, IPS, 2560x1600, 17" | Apple MacBook Pro 16 2023 M2 Max M2 Max, M2 Max 38-Core GPU, Apple SSD AP2048Z, Mini-LED, 3456x2234, 16.2" | |
|---|---|---|---|---|---|---|
| Power Consumption | 6% | 59% | 34% | -79% | 16% | |
| Idle Minimum * (Watt) | 15 | 5.9 61% | 2.2 85% | 5.8 61% | 34.6 -131% | 5.2 65% |
| Idle Average * (Watt) | 23.6 | 15.8 33% | 8.9 62% | 14.3 39% | 43 -82% | 16.5 30% |
| Idle Maximum * (Watt) | 24.3 | 26.7 -10% | 11 55% | 18.4 24% | 44.9 -85% | 16.8 31% |
| Load Average * (Watt) | 80 | 117.4 -47% | 53 34% | 70 12% | 145 -81% | 113 -41% |
| Witcher 3 ultra * (Watt) | 113.7 | 114.8 -1% | 42.5 63% | 69.4 39% | 152.4 -34% | 92 19% |
| Load Maximum * (Watt) | 135.4 | 136.6 -1% | 64 53% | 93 31% | 220 -62% | 145 -7% |
* ... Moindre est la valeur, meilleures sont les performances
Power Consumption Witcher 3 / Stresstest
Power Consumption external Monitor
Autonomie de la batterie - Longue durée, charge lente
L'autonomie du WLAN est supérieure d'environ une heure à celle du XPS 17 9720 de l'année dernière, pour un total de 10 heures de navigation dans le monde réel. Il est bon de voir que l'autonomie de la batterie n'a pas été affectée malgré les augmentations annuelles des performances globales.
La charge de la batterie est lente, de 2 à 2,5 heures, contre 1,5 heure pour la plupart des autres ordinateurs portables. Gardez à l'esprit que la charge sera encore plus lente si vous utilisez des charges exigeantes comme des jeux, en raison de l'adaptateur secteur limité à 130 W.
Il convient de noter que la batterie ne se vide pas lentement lorsqu'elle est branchée sur le secteur et que l'on exécute des jeux ou d'autres tâches exigeantes. Ce problème était spécifique au XPS 9700 original et il a été résolu à partir du XPS 17 9710.
| Dell XPS 17 9730 RTX 4070 i7-13700H, GeForce RTX 4070 Laptop GPU, 97 Wh | Dell XPS 17 9720 RTX 3060 i7-12700H, GeForce RTX 3060 Laptop GPU, 97 Wh | LG Gram 17 (2023) i7-1360P, Iris Xe G7 96EUs, 80 Wh | HP Envy 17-cr0079ng i7-1255U, GeForce RTX 2050 Mobile, 55 Wh | MSI Creator Z17 A12UGST-054 i9-12900H, GeForce RTX 3070 Ti Laptop GPU, 90 Wh | Apple MacBook Pro 16 2023 M2 Max M2 Max, M2 Max 38-Core GPU, 99.6 Wh | |
|---|---|---|---|---|---|---|
| Autonomie de la batterie | -11% | 63% | -4% | 28% | 24% | |
| Reader / Idle (h) | 19.1 | 25.7 35% | ||||
| WiFi v1.3 (h) | 10 | 8.7 -13% | 12.8 28% | 4.7 -53% | 5.5 -45% | 14.8 48% |
| Load (h) | 1.1 | 1 -9% | 2.5 127% | 1.6 45% | 2.2 100% | 1.1 0% |
| H.264 (h) | 14.5 | 5.5 | 5.5 | 18.7 |
Points positifs
Points négatifs
Verdict - Équilibré et optimisé
On dit qu'il ne faut pas se lancer dans la conception d'un produit ou d'un concept de première génération, en raison des problèmes potentiels ou des imperfections qui doivent être résolus. Le xPS 17 9700par exemple, présentait des problèmes d'épuisement de la batterie, de stabilité de la fréquence d'images et de faibles performances du CPU Turbo Boost. Après trois années complètes d'optimisations constantes, le dernier XPS 17 9730 a directement remédié à tous ces défauts pour être beaucoup plus facile à recommander. La consommation d'énergie n'est plus un problème, les taux de rafraîchissement sont stables et le Turbo Boost dure plus longtemps et est plus constant.
Le XPS 17 9730 concilie des performances élevées avec un budget d'alimentation limité à 130 W, bien mieux que le XPS 15 9530. Lorsqu'il est équipé du même processeur Core i7 et du même GPU GeForce RTX 4070, notre XPS 17 surpasse son petit frère de 10 à 15 % et de 50 à 60 %, respectivement. L'amélioration du GPU en particulier est énorme, simplement en raison de l'objectif TGP plus élevé du XPS 17. Si vous hésitez entre le XPS 15 et le XPS 17 et que les performances graphiques sont d'une importance capitale, le XPS 17 l'emporte haut la main.
Le XPS 17 9730 possède les performances, la portabilité, l'affichage et le potentiel de jeu nécessaires pour satisfaire la plupart des utilisateurs à domicile et au bureau. Néanmoins, certains aspects de ce modèle vieux de trois ans commencent à être dépassés.
Les inconvénients du modèle ne peuvent être ignorés. Pour un ordinateur portable de plus de 3000 $, la webcam de 1 MP sans obturateur de confidentialité et l'absence de prise en charge du Wi-Fi 6E sont embarrassantes dans cette gamme de prix. L'écran IPS 60 Hz devient également obsolète alors que les écrans OLED et les écrans à taux de rafraîchissement plus élevé sont désormais monnaie courante. L'adaptateur secteur de 130 W ressemble davantage à un mur de briques empêchant la série XPS 17 d'atteindre des taux de charge plus rapides et des objectifs TGP plus élevés. Il y a beaucoup de choses qui peuvent être améliorées sans aucun doute, mais au moins les performances sont à un niveau confortable compte tenu de la finesse du design.
Prix et disponibilité
Le XPS 17 9730 n'est pas encore largement disponible auprès des revendeurs. Pour bénéficier des options les plus configurables et d'une livraison immédiate, nous vous recommandons de l'acheter directement auprès de Dell. Les prix commencent à 2450 USD pour le modèle le plus bas de gamme et atteignent 4300 à 5100 USD s'il est entièrement configuré.
Dell XPS 17 9730 RTX 4070
- 05/27/2023 v7 (old)
Allen Ngo
Transparency
La sélection des appareils à examiner est effectuée par notre équipe éditoriale. L'échantillon de test a été prêté à l'auteur par le fabricant ou le détaillant pour les besoins de cet examen. Le prêteur n'a pas eu d'influence sur cette évaluation et le fabricant n'a pas reçu de copie de cette évaluation avant sa publication. Il n'y avait aucune obligation de publier cet article. En tant que média indépendant, Notebookcheck n'est pas soumis à l'autorité des fabricants, des détaillants ou des éditeurs.
Voici comment Notebookcheck teste
Chaque année, Notebookcheck examine de manière indépendante des centaines d'ordinateurs portables et de smartphones en utilisant des procédures standardisées afin de garantir que tous les résultats sont comparables. Nous avons continuellement développé nos méthodes de test depuis environ 20 ans et avons établi des normes industrielles dans le processus. Dans nos laboratoires de test, des équipements de mesure de haute qualité sont utilisés par des techniciens et des rédacteurs expérimentés. Ces tests impliquent un processus de validation en plusieurs étapes. Notre système d'évaluation complexe repose sur des centaines de mesures et de points de référence bien fondés, ce qui garantit l'objectivité.Price comparison

