Test de l'Acer Aspire 5 A514 (i5-10210U, UHD 620, FHD) : Intel Comet Lake en berne
Note | Date | Modèle | Poids | Épaisseur | Taille | Résolution | Prix |
|---|---|---|---|---|---|---|---|
| 79.2 % v7 (old) | 02/20 | Acer Aspire 5 A514-52 i5-10210U, UHD Graphics 620 | 1.7 kg | 17.95 mm | 14.00" | 1920x1080 | |
| 83.7 % v7 (old) | 09/19 | Asus VivoBook 14 X403FA i5-8265U, UHD Graphics 620 | 1.3 kg | 16.5 mm | 14.00" | 1920x1080 | |
| 80.9 % v7 (old) | 02/20 | MSI Modern 14 A10RB-459US i5-10210U, GeForce MX250 | 1.2 kg | 16 mm | 14.00" | 1920x1080 | |
| 74.5 % v7 (old) | 01/20 | Dell Inspiron 14 3493-4KWCF i7-1065G7, GeForce MX230 | 1.8 kg | 21 mm | 14.00" | 1920x1080 | |
| 77.7 % v7 (old) | 11/19 | Walmart Motile M142 R5 3500U, Vega 8 | 1.1 kg | 18 mm | 14.00" | 1920x1080 |
| |||||||||||||||||||||||||
Homogénéité de la luminosité: 82 %
Valeur mesurée au centre, sur batterie: 237.8 cd/m²
Contraste: 743:1 (Valeurs des noirs: 0.32 cd/m²)
ΔE ColorChecker Calman: 3.41 | ∀{0.5-29.43 Ø4.72}
calibrated: 3.12
ΔE Greyscale Calman: 1.2 | ∀{0.09-98 Ø4.97}
62.2% sRGB (Argyll 1.6.3 3D)
39.5% AdobeRGB 1998 (Argyll 1.6.3 3D)
42.78% AdobeRGB 1998 (Argyll 3D)
62.2% sRGB (Argyll 3D)
41.39% Display P3 (Argyll 3D)
Gamma: 2.05
CCT: 6395 K
| Acer Aspire 5 A514-52 Chi Mei N140HCA-EAC, IPS, 14", 1920x1080 | Asus VivoBook 14 X403FA Chi Mei N140HCA-EAC, IPS, 14", 1920x1080 | MSI Modern 14 A10RB-459US Chi Mei N140HCE-EN2, IPS, 14", 1920x1080 | Dell Inspiron 14 3493-4KWCF Chi Mei 140HCA, IPS, 14", 1920x1080 | Walmart Motile M142 Chi Mei N140HCA-EAC, IPS, 14", 1920x1080 | Lenovo Ideapad C340-14API 81N6004UGE BOE CQ NV140FHM-N48, IPS, 14", 1920x1080 | |
|---|---|---|---|---|---|---|
| Display | -1% | 53% | 1% | 1% | -5% | |
| Display P3 Coverage (%) | 41.39 | 40.85 -1% | 64.2 55% | 41.84 1% | 41.95 1% | 39.63 -4% |
| sRGB Coverage (%) | 62.2 | 61.1 -2% | 94.8 52% | 62.3 0% | 62.5 0% | 58.6 -6% |
| AdobeRGB 1998 Coverage (%) | 42.78 | 42.25 -1% | 65.4 53% | 43.33 1% | 43.43 2% | 40.94 -4% |
| Response Times | 14% | 0% | 7% | 23% | 4% | |
| Response Time Grey 50% / Grey 80% * (ms) | 55.6 ? | 40.8 ? 27% | 39.2 ? 29% | 41 ? 26% | 35.2 ? 37% | 43 ? 23% |
| Response Time Black / White * (ms) | 27.6 ? | 27.2 ? 1% | 35.6 ? -29% | 31 ? -12% | 25.2 ? 9% | 32 ? -16% |
| PWM Frequency (Hz) | 24510 ? | 24510 ? | 25000 ? | 2500 ? | 25000 ? | 208 ? |
| Screen | -16% | 37% | -17% | -13% | -30% | |
| Brightness middle (cd/m²) | 237.8 | 250 5% | 324.1 36% | 226 -5% | 240.3 1% | 285 20% |
| Brightness (cd/m²) | 231 | 236 2% | 301 30% | 214 -7% | 233 1% | 273 18% |
| Brightness Distribution (%) | 82 | 78 -5% | 87 6% | 92 12% | 82 0% | 87 6% |
| Black Level * (cd/m²) | 0.32 | 0.27 16% | 0.22 31% | 0.17 47% | 0.27 16% | 0.4 -25% |
| Contrast (:1) | 743 | 926 25% | 1473 98% | 1329 79% | 890 20% | 713 -4% |
| Colorchecker dE 2000 * | 3.41 | 5 -47% | 1.63 52% | 5.21 -53% | 4.22 -24% | 5.62 -65% |
| Colorchecker dE 2000 max. * | 15.73 | 20.7 -32% | 4.25 73% | 22.15 -41% | 23.32 -48% | 17.22 -9% |
| Colorchecker dE 2000 calibrated * | 3.12 | 4.3 -38% | 1.42 54% | 4.43 -42% | 3.76 -21% | |
| Greyscale dE 2000 * | 1.2 | 2.4 -100% | 2.2 -83% | 3.27 -173% | 2.3 -92% | 3.97 -231% |
| Gamma | 2.05 107% | 2.05 107% | 2.26 97% | 2.36 93% | 2.39 92% | 2.28 96% |
| CCT | 6395 102% | 6697 97% | 6887 94% | 6538 99% | 6585 99% | 6848 95% |
| Color Space (Percent of AdobeRGB 1998) (%) | 39.5 | 38.9 -2% | 60.2 52% | 40 1% | 39.9 1% | 38 -4% |
| Color Space (Percent of sRGB) (%) | 62.2 | 61 -2% | 95 53% | 62 0% | 62.1 0% | 58 -7% |
| Moyenne finale (programmes/paramètres) | -1% /
-10% | 30% /
35% | -3% /
-10% | 4% /
-6% | -10% /
-21% |
* ... Moindre est la valeur, meilleures sont les performances
Temps de réponse de l'écran
| ↔ Temps de réponse noir à blanc | ||
|---|---|---|
| 27.6 ms ... hausse ↗ et chute ↘ combinées | ↗ 17.2 ms hausse | 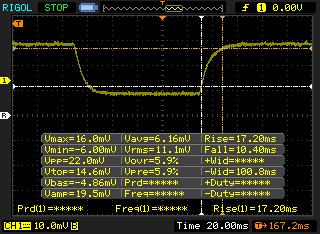 |
| ↘ 10.4 ms chute | ||
| L'écran souffre de latences relativement élevées, insuffisant pour le jeu. En comparaison, tous les appareils testés affichent entre 0.1 (minimum) et 240 (maximum) ms. » 70 % des appareils testés affichent de meilleures performances. Cela signifie que les latences relevées sont moins bonnes que la moyenne (19.8 ms) de tous les appareils testés. | ||
| ↔ Temps de réponse gris 50% à gris 80% | ||
| 55.6 ms ... hausse ↗ et chute ↘ combinées | ↗ 24.4 ms hausse | 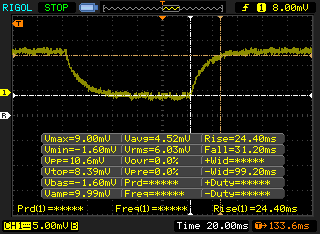 |
| ↘ 31.2 ms chute | ||
| L'écran souffre de latences très élevées, à éviter pour le jeu. En comparaison, tous les appareils testés affichent entre 0.165 (minimum) et 636 (maximum) ms. » 92 % des appareils testés affichent de meilleures performances. Cela signifie que les latences relevées sont moins bonnes que la moyenne (31 ms) de tous les appareils testés. | ||
Scintillement / MLI (Modulation de largeur d'impulsion)
| Scintillement / MLI (Modulation de largeur d'impulsion) décelé | 24510 Hz | ≤ 19 Niveau de luminosité | 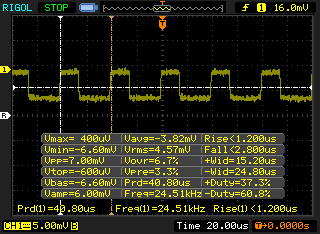 |
Le rétroéclairage de l'écran scintille à la fréquence de 24510 Hz (certainement du fait de l'utilisation d'une MDI - Modulation de largeur d'impulsion) à un niveau de luminosité inférieur ou égal à 19 % . Aucun scintillement ne devrait être perceptible au-dessus de cette valeur. La fréquence de rafraîchissement de 24510 Hz est élevée, la grande majorité des utilisateurs ne devrait pas percevoir de scintillements et être sujette à une fatigue oculaire accrue. En comparaison, 52 % des appareils testés n'emploient pas MDI pour assombrir leur écran. Nous avons relevé une moyenne à 7763 (minimum : 5 - maximum : 343500) Hz dans le cas où une MDI était active. | |||
| Cinebench R11.5 | |
| CPU Single 64Bit | |
| Moyenne Intel Core i5-10210U (1.71 - 1.91, n=4) | |
| Dell Inspiron 15 5000 5585 | |
| CPU Multi 64Bit | |
| Dell Inspiron 15 5000 5585 | |
| Moyenne Intel Core i5-10210U (5.69 - 8.66, n=4) | |
| Cinebench R10 | |
| Rendering Multiple CPUs 32Bit | |
| Lenovo Ideapad C340-15IWL-81N5004QGE | |
| Moyenne Intel Core i5-10210U (15037 - 22164, n=3) | |
| Dynabook Portege A30-E-174 | |
| Rendering Single 32Bit | |
| Moyenne Intel Core i5-10210U (6410 - 6613, n=3) | |
| Dynabook Portege A30-E-174 | |
| Lenovo Ideapad C340-15IWL-81N5004QGE | |
| PCMark 8 Home Score Accelerated v2 | 3182 points | |
| PCMark 8 Work Score Accelerated v2 | 4642 points | |
| PCMark 10 Score | 3752 points | |
Aide | ||
| Acer Aspire 5 A514-52 WDC PC SN520 SDAPNUW-512G | Dell XPS 15 7590 i5 iGPU FHD Toshiba XG6 KXG60ZNV512G | Asus VivoBook S15 S532F WDC PC SN520 SDAPNUW-256G | HP Envy x360 15-bq102ng Samsung PM961 MZVLW256HEHP | Lenovo Ideapad S540-15IML Samsung SSD PM981a MZVLB512HBJQ | |
|---|---|---|---|---|---|
| AS SSD | 23% | -14% | -19% | 66% | |
| Seq Read (MB/s) | 1244 | 2357 89% | 1147 -8% | 2465 98% | 2642 112% |
| Seq Write (MB/s) | 1393 | 1235 -11% | 752 -46% | 1318 -5% | 2433 75% |
| 4K Read (MB/s) | 46.86 | 43.29 -8% | 41.52 -11% | 42.97 -8% | 58 24% |
| 4K Write (MB/s) | 135.1 | 99.7 -26% | 149.7 11% | 81.9 -39% | 145.3 8% |
| 4K-64 Read (MB/s) | 650 | 1020 57% | 605 -7% | 1025 58% | 1431 120% |
| 4K-64 Write (MB/s) | 789 | 1502 90% | 453.2 -43% | 338.6 -57% | 1753 122% |
| Access Time Read * (ms) | 0.045 | 0.07 -56% | 0.073 -62% | 0.077 -71% | 0.072 -60% |
| Access Time Write * (ms) | 0.027 | 0.039 -44% | 0.025 7% | 0.046 -70% | 0.027 -0% |
| Score Read (Points) | 821 | 1299 58% | 761 -7% | 1314 60% | 1753 114% |
| Score Write (Points) | 1064 | 1726 62% | 678 -36% | 552 -48% | 2142 101% |
| Score Total (Points) | 2326 | 3640 56% | 1821 -22% | 2488 7% | 4790 106% |
| Copy ISO MB/s (MB/s) | 1637 | 2145 31% | 1093 -33% | 700 -57% | |
| Copy Program MB/s (MB/s) | 496.6 | 565 14% | 775 56% | 167.2 -66% | |
| Copy Game MB/s (MB/s) | 1161 | 1320 14% | 1196 3% | 370.4 -68% | |
| CrystalDiskMark 5.2 / 6 | 17% | -16% | -4% | 23% | |
| Write 4K (MB/s) | 166.6 | 93.6 -44% | 149.9 -10% | 116 -30% | 170.7 2% |
| Read 4K (MB/s) | 46.72 | 41.87 -10% | 46.13 -1% | 42.73 -9% | 49.51 6% |
| Write Seq (MB/s) | 1458 | 1698 16% | 970 -33% | 1222 -16% | 1156 -21% |
| Read Seq (MB/s) | 1387 | 1978 43% | 1085 -22% | 1608 16% | 1136 -18% |
| Write 4K Q32T1 (MB/s) | 419.5 | 383.1 -9% | 460.8 10% | 280.1 -33% | 420.5 0% |
| Read 4K Q32T1 (MB/s) | 487.8 | 326.9 -33% | 410.3 -16% | 333.6 -32% | 527 8% |
| Write Seq Q32T1 (MB/s) | 1456 | 2778 91% | 662 -55% | 1291 -11% | 2984 105% |
| Read Seq Q32T1 (MB/s) | 1733 | 3119 80% | 1728 0% | 3183 84% | 3550 105% |
| Moyenne finale (programmes/paramètres) | 20% /
21% | -15% /
-15% | -12% /
-14% | 45% /
48% |
* ... Moindre est la valeur, meilleures sont les performances

| 3DMark 11 Performance | 2023 points | |
| 3DMark Cloud Gate Standard Score | 8289 points | |
| 3DMark Fire Strike Score | 1136 points | |
| 3DMark Time Spy Score | 442 points | |
Aide | ||
| The Witcher 3 | |
| 1024x768 Low Graphics & Postprocessing | |
| MSI Modern 14 A10RB-459US | |
| Moyenne Intel UHD Graphics 620 (8.8 - 50.9, n=64) | |
| 1366x768 Medium Graphics & Postprocessing | |
| MSI Modern 14 A10RB-459US | |
| Moyenne Intel UHD Graphics 620 (8 - 27.9, n=29) | |
| 1920x1080 High Graphics & Postprocessing (Nvidia HairWorks Off) | |
| MSI Modern 14 A10RB-459US | |
| Moyenne Intel UHD Graphics 620 (4.2 - 13.5, n=17) | |
| Bas | Moyen | Élevé | Ultra | |
|---|---|---|---|---|
| BioShock Infinite (2013) | 67 | 35.2 | 30.1 | 9.6 |
| Rocket League (2017) | 20.1 |
| Acer Aspire 5 A514-52 UHD Graphics 620, i5-10210U, WDC PC SN520 SDAPNUW-512G | Dell XPS 15 7590 i5 iGPU FHD UHD Graphics 630, i5-9300H, Toshiba XG6 KXG60ZNV512G | Asus VivoBook S15 S532F GeForce MX250, i7-8565U, WDC PC SN520 SDAPNUW-256G | HP Envy x360 15-bq102ng Vega 8, R5 2500U, Samsung PM961 MZVLW256HEHP | Lenovo Ideapad S540-15IML GeForce MX250, i5-10210U, Samsung SSD PM981a MZVLB512HBJQ | MSI Modern 15 A10RB GeForce MX250, i7-10510U, WDC PC SN730 SDBPNTY-512G | |
|---|---|---|---|---|---|---|
| Noise | -1% | -5% | -7% | -14% | -12% | |
| arrêt / environnement * (dB) | 29.1 | 29.3 -1% | 28 4% | 30.13 -4% | 30 -3% | 28.3 3% |
| Idle Minimum * (dB) | 29.1 | 29.3 -1% | 28 4% | 30.13 -4% | 30 -3% | 32 -10% |
| Idle Average * (dB) | 29.1 | 29.3 -1% | 28 4% | 30.13 -4% | 32 -10% | 32 -10% |
| Idle Maximum * (dB) | 29.1 | 29.8 -2% | 30 -3% | 30.13 -4% | 37 -27% | 32 -10% |
| Load Average * (dB) | 33.5 | 32.4 3% | 41.4 -24% | 38.8 -16% | 41 -22% | 34.5 -3% |
| Load Maximum * (dB) | 36.1 | 37.2 -3% | 41.5 -15% | 38.8 -7% | 42 -16% | 50.9 -41% |
| Witcher 3 ultra * (dB) | 41.5 | 39 | 39.5 |
* ... Moindre est la valeur, meilleures sont les performances
Degré de la nuisance sonore
| Au repos |
| 29.1 / 29.1 / 29.1 dB(A) |
| Fortement sollicité |
| 33.5 / 36.1 dB(A) |
 | ||
30 dB silencieux 40 dB(A) audible 50 dB(A) bruyant |
||
min: | ||
(+) La température maximale du côté supérieur est de 39.2 °C / 103 F, par rapport à la moyenne de 36.8 °C / 98 F, allant de 21 à 71 °C pour la classe Multimedia.
(-) Le fond chauffe jusqu'à un maximum de 46 °C / 115 F, contre une moyenne de 39.1 °C / 102 F
(+) En utilisation inactive, la température moyenne du côté supérieur est de 21.1 °C / 70 F, par rapport à la moyenne du dispositif de 31.3 °C / 88 F.
(+) Les repose-poignets et le pavé tactile sont plus froids que la température de la peau avec un maximum de 27.2 °C / 81 F et sont donc froids au toucher.
(±) La température moyenne de la zone de l'appui-paume de dispositifs similaires était de 28.7 °C / 83.7 F (+1.5 °C / #2.7 F).
Acer Aspire 5 A514-52 analyse audio
(±) | le niveau sonore du haut-parleur est moyen mais bon (78.1# dB)
Basses 100 - 315 Hz
(-) | presque aucune basse - en moyenne 16.5% plus bas que la médiane
(-) | les basses ne sont pas linéaires (15.3% delta à la fréquence précédente)
Médiums 400 - 2000 Hz
(+) | médiane équilibrée - seulement 2.6% de la médiane
(±) | la linéarité des médiums est moyenne (9.3% delta à la fréquence précédente)
Aiguës 2 - 16 kHz
(+) | des sommets équilibrés - à seulement 2.8% de la médiane
(±) | la linéarité des aigus est moyenne (8.8% delta à la fréquence précédente)
Globalement 100 - 16 000 Hz
(±) | la linéarité du son global est moyenne (20.1% de différence avec la médiane)
Par rapport à la même classe
» 67% de tous les appareils testés de cette catégorie étaient meilleurs, 8% similaires, 25% pires
» Le meilleur avait un delta de 5%, la moyenne était de 17%, le pire était de 45%.
Par rapport à tous les appareils testés
» 52% de tous les appareils testés étaient meilleurs, 8% similaires, 40% pires
» Le meilleur avait un delta de 4%, la moyenne était de 24%, le pire était de 134%.
Apple MacBook 12 (Early 2016) 1.1 GHz analyse audio
(+) | les haut-parleurs peuvent jouer relativement fort (83.6# dB)
Basses 100 - 315 Hz
(±) | basse réduite - en moyenne 11.3% inférieure à la médiane
(±) | la linéarité des basses est moyenne (14.2% delta à la fréquence précédente)
Médiums 400 - 2000 Hz
(+) | médiane équilibrée - seulement 2.4% de la médiane
(+) | les médiums sont linéaires (5.5% delta à la fréquence précédente)
Aiguës 2 - 16 kHz
(+) | des sommets équilibrés - à seulement 2% de la médiane
(+) | les aigus sont linéaires (4.5% delta à la fréquence précédente)
Globalement 100 - 16 000 Hz
(+) | le son global est linéaire (10.2% différence à la médiane)
Par rapport à la même classe
» 7% de tous les appareils testés de cette catégorie étaient meilleurs, 2% similaires, 91% pires
» Le meilleur avait un delta de 5%, la moyenne était de 18%, le pire était de 53%.
Par rapport à tous les appareils testés
» 5% de tous les appareils testés étaient meilleurs, 1% similaires, 94% pires
» Le meilleur avait un delta de 4%, la moyenne était de 24%, le pire était de 134%.
| Éteint/en veille | |
| Au repos | |
| Fortement sollicité |
|
Légende:
min: | |
| Acer Aspire 5 A514-52 i5-10210U, UHD Graphics 620, WDC PC SN520 SDAPNUW-512G, IPS, 1920x1080, 14" | Asus VivoBook 14 X403FA i5-8265U, UHD Graphics 620, Intel SSD 660p SSDPEKNW512G8, IPS, 1920x1080, 14" | MSI Modern 14 A10RB-459US i5-10210U, GeForce MX250, Kingston RBUSNS8154P3512GJ, IPS, 1920x1080, 14" | Dell Inspiron 14 3493-4KWCF i7-1065G7, GeForce MX230, Toshiba KBG40ZNS512G NVMe, IPS, 1920x1080, 14" | Walmart Motile M142 R5 3500U, Vega 8, BIWIN SSD 256 GB, IPS, 1920x1080, 14" | Lenovo Ideapad C340-14API 81N6004UGE R5 3500U, Vega 8, Samsung SSD PM981 MZVLB256HAHQ, IPS, 1920x1080, 14" | |
|---|---|---|---|---|---|---|
| Power Consumption | -18% | -75% | -69% | -115% | -77% | |
| Idle Minimum * (Watt) | 2.7 | 2.7 -0% | 4.2 -56% | 4.7 -74% | 5.3 -96% | 5.1 -89% |
| Idle Average * (Watt) | 3 | 4.6 -53% | 5.9 -97% | 6.6 -120% | 8.6 -187% | 7.2 -140% |
| Idle Maximum * (Watt) | 4.6 | 5.2 -13% | 7.2 -57% | 5.9 -28% | 13.1 -185% | 9.7 -111% |
| Load Average * (Watt) | 29.3 | 35.9 -23% | 63.4 -116% | 56 -91% | 50.6 -73% | 40 -37% |
| Load Maximum * (Watt) | 45.4 | 46 -1% | 67.4 -48% | 60.2 -33% | 61.6 -36% | 49 -8% |
| Witcher 3 ultra * (Watt) | 53.5 |
* ... Moindre est la valeur, meilleures sont les performances
| Acer Aspire 5 A514-52 i5-10210U, UHD Graphics 620, 51 Wh | Asus VivoBook 14 X403FA i5-8265U, UHD Graphics 620, 72 Wh | MSI Modern 14 A10RB-459US i5-10210U, GeForce MX250, 50 Wh | Dell Inspiron 14 3493-4KWCF i7-1065G7, GeForce MX230, 42 Wh | Walmart Motile M142 R5 3500U, Vega 8, 47 Wh | Lenovo Ideapad C340-14API 81N6004UGE R5 3500U, Vega 8, 45 Wh | |
|---|---|---|---|---|---|---|
| Autonomie de la batterie | 41% | -16% | -30% | -18% | -20% | |
| Reader / Idle (h) | 22.7 | 35.7 57% | 16.4 -28% | 13.8 -39% | ||
| WiFi v1.3 (h) | 9.4 | 12.7 35% | 8.6 -9% | 6.5 -31% | 7.7 -18% | 7.5 -20% |
| Load (h) | 2 | 2.6 30% | 1.8 -10% | 1.6 -20% |
Points positifs
Points négatifs
L’Acer Aspire 5 A514 n’excelle dans aucun domaine particulier, ce qui est normal puisqu’il est censé être un portable abordable. Mais cela ne signifie pas qu’il doit être à la traîne dans des domaines importants. Ceux qui choisissent un portable de 14 pouces et non un de 15,6 pouces cherchent certainement la compacité supérieure d’une machine plus petite. Mais les bordures d’écran étroites et le poids plus élevé de l’Acer le rendent moins intéressant que des alternatives comme l’Asus VivoBook ou le Walmart Motile. Cet embonpoint de l’Acer aurait été acceptable si cela avait permis à l’appareil d’avoir des points forts comme une rigidité supérieure ou des fonctionnalités supplémentaires, mais ce n’est pas le cas…
Le CPU rencontre des problèmes de performances, ce qui est un autre défaut. Cela n’impactera sans doute pas un usage classique au quotidien, l’Aspire 5 ne visant pas les utilisateurs avec des exigences élevées, mais cela reste gênant. Et même en ne prenant pas en compte ce bug, les performances brutes du CPU sont moins bonnes que sur la plupart des autres portables équipés du même Core i5-10210U.
Il y a quelques points forts à mentionner. L’écran est bien calibré en sortie d’usine, et il y a deux emplacements de stockage. Le ventilateur est presque toujours silencieux en cas de sollicitations faibles ou moyennes, et l’autonomie est correcte pour la catégorie. Même ainsi, l’Aspire 5 A514 est en retrait par rapport aux ultraportables plus récents et au prix similaire des fabricants concurrents.
L’écran peut être bon pour le prix, mais tout le reste chez l’Aspire 5 A514 semble daté. Il serait temps pour Acer de revoir le châssis de sa machine, afin d’être plus compétitif sur le marché des portables de 14 pouces.
L’intégralité de cette critique est disponible en anglais en suivant ce lien.
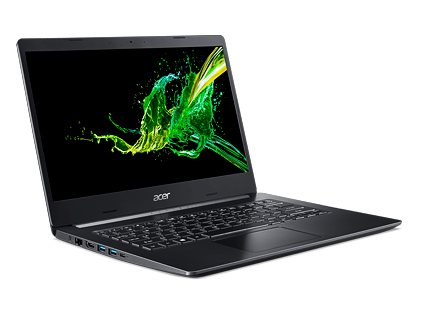
Acer Aspire 5 A514-52
- 02/14/2020 v7 (old)
Allen Ngo
Price comparison
