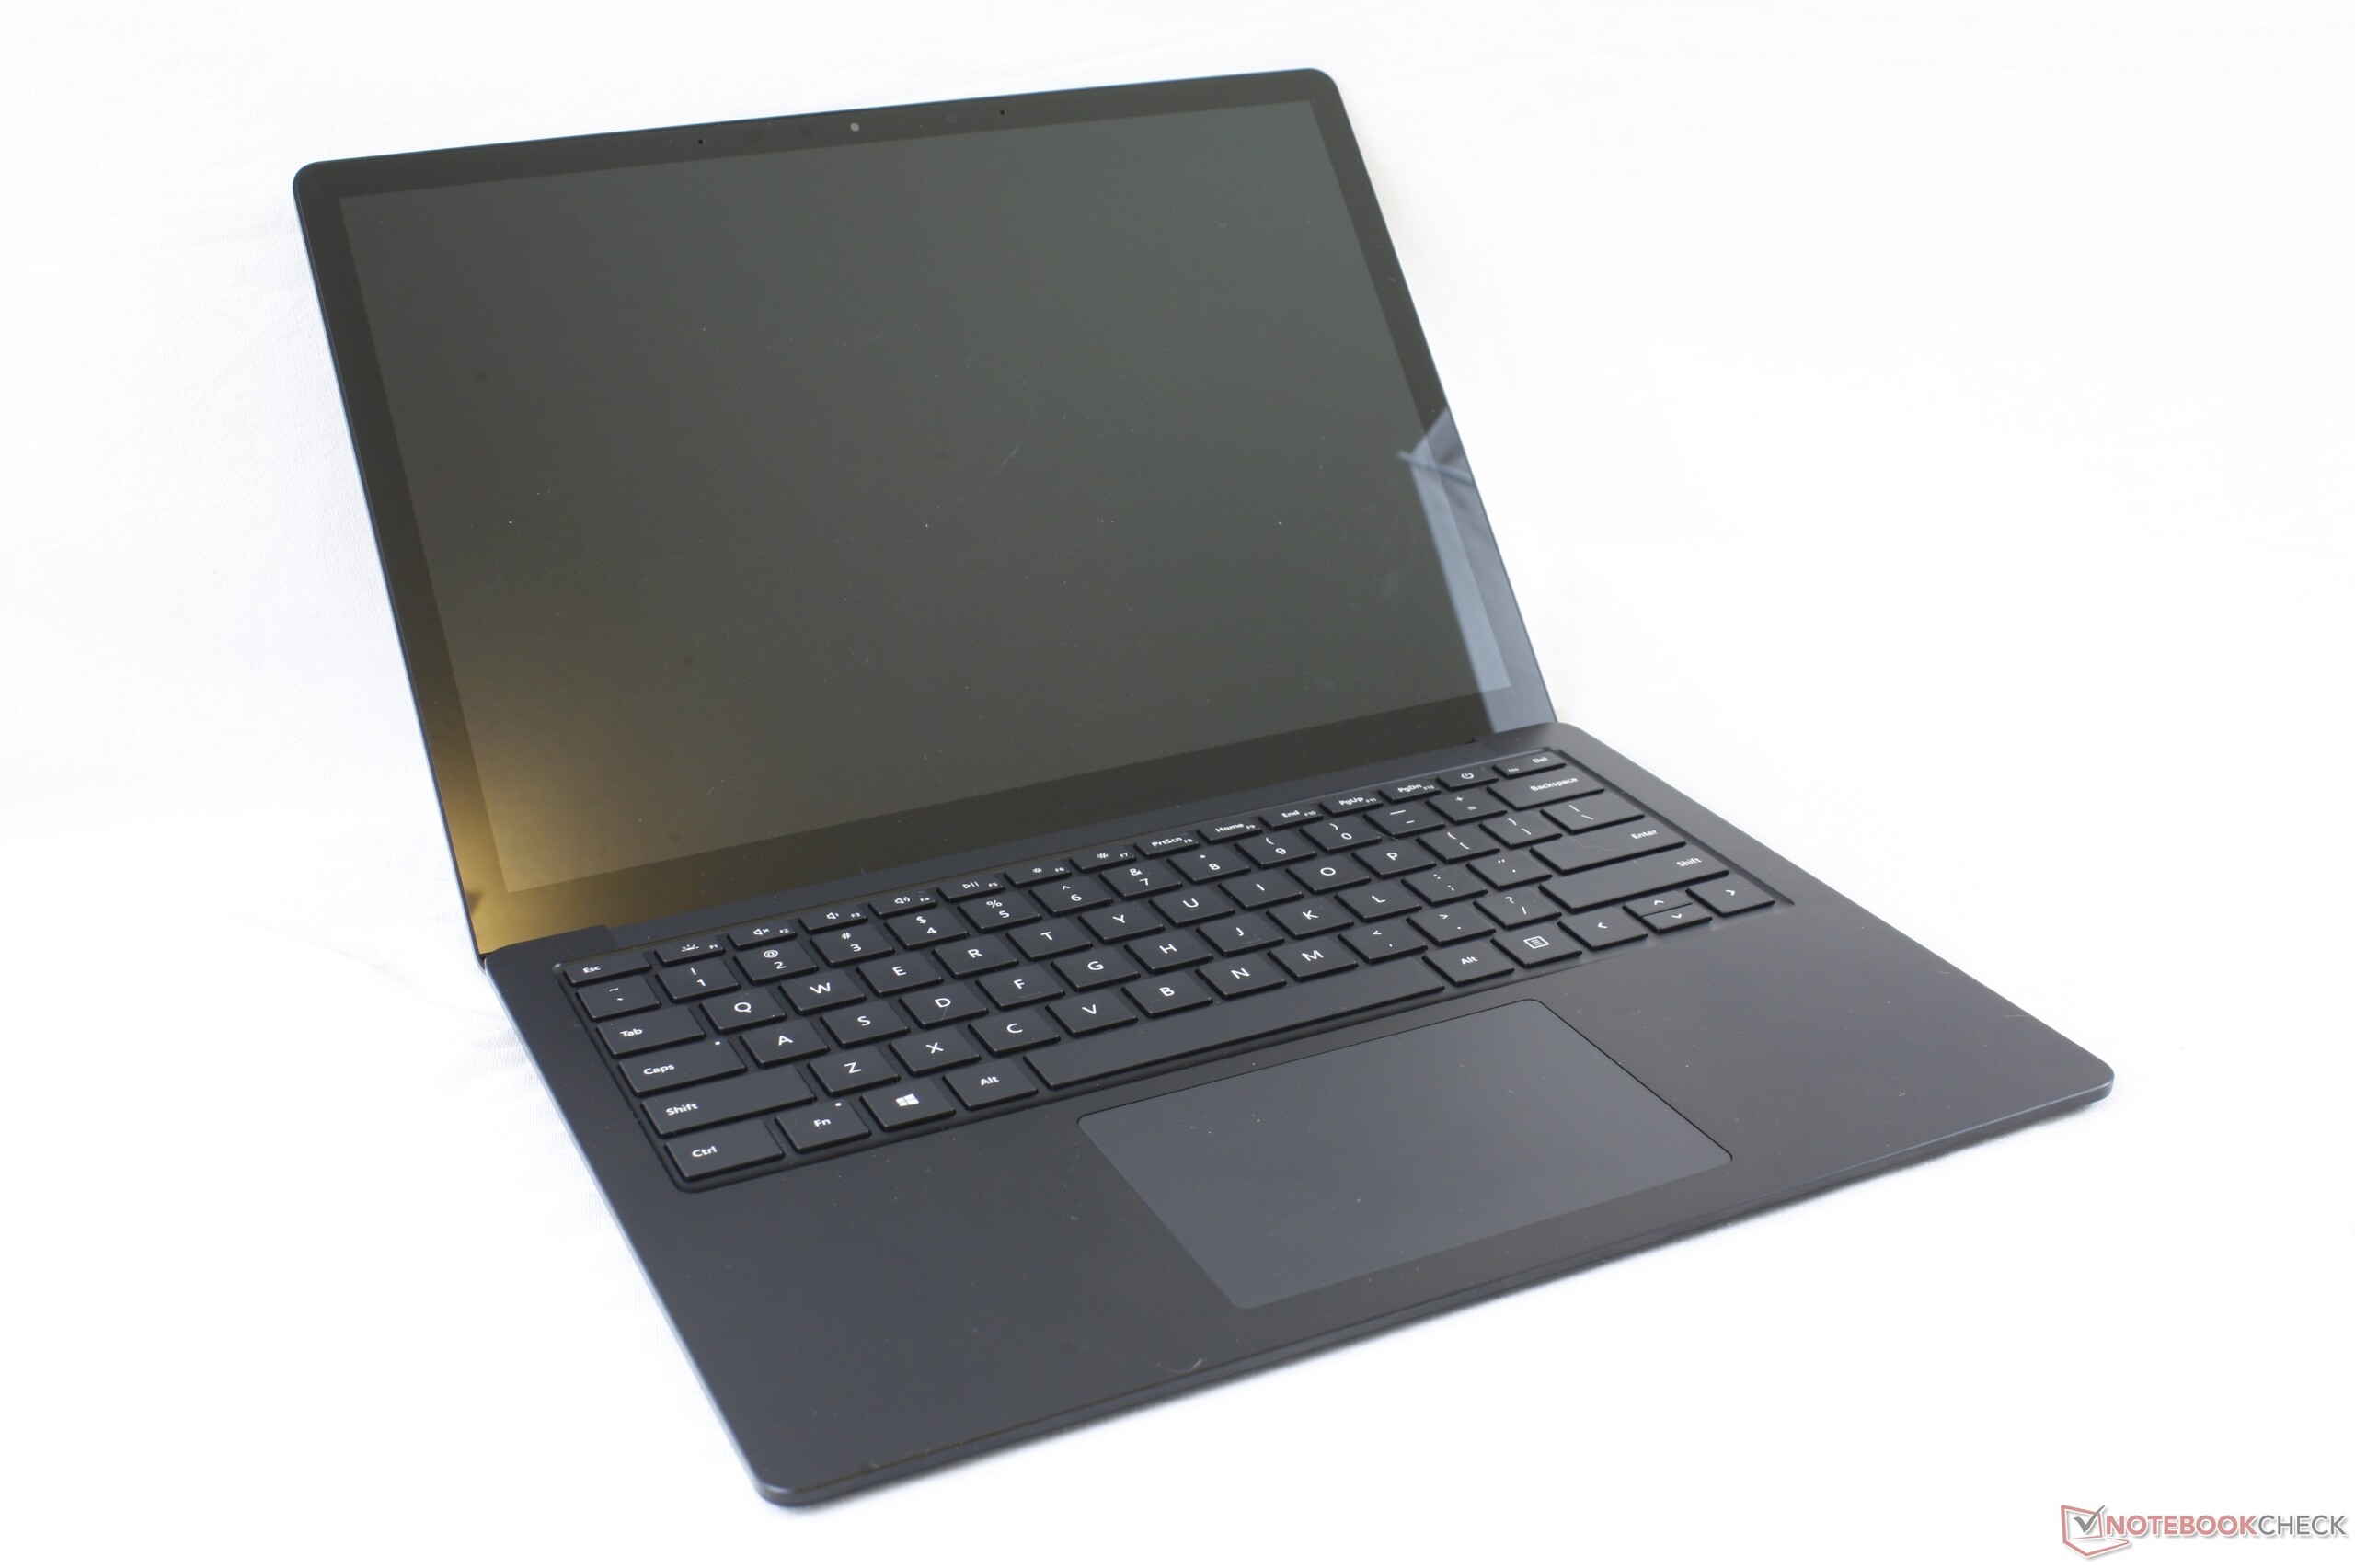
Test du Microsoft Surface Laptop 3 (i5-1035G7, Iris Plus G7, 13,5 pouces FHD+) : good-bye, Alcantara
Note | Date | Modèle | Poids | Épaisseur | Taille | Résolution | Prix |
|---|---|---|---|---|---|---|---|
| 84 % v7 (old) | 03/20 | Microsoft Surface Laptop 3 13 Core i5-1035G7 i5-1035G7, Iris Plus Graphics G7 (Ice Lake 64 EU) | 1.3 kg | 14.5 mm | 13.50" | 2256x1504 | |
| 90.6 % v7 (old) | 02/20 | Apple MacBook Pro 13 2019 2TB3 i5-8257U, Iris Plus Graphics 645 | 1.4 kg | 14.9 mm | 13.30" | 2560x1600 | |
| 86.3 % v7 (old) | 10/19 | Dell XPS 13 7390 2-in-1 Core i7 i7-1065G7, Iris Plus Graphics G7 (Ice Lake 64 EU) | 1.3 kg | 13 mm | 13.40" | 1920x1200 | |
| 90.1 % v7 (old) | 04/20 | Lenovo ThinkPad X1 Carbon 2019-20QE000VGE i7-8665U, UHD Graphics 620 | 1.1 kg | 14.9 mm | 14.00" | 2560x1440 | |
| 83.9 % v7 (old) | 01/20 | Microsoft Surface Laptop 3 15 i7-1065G7 i7-1065G7, Iris Plus Graphics G7 (Ice Lake 64 EU) | 1.5 kg | 14.7 mm | 15.00" | 2496x1664 |

| |||||||||||||||||||||||||
Homogénéité de la luminosité: 89 %
Valeur mesurée au centre, sur batterie: 403.4 cd/m²
Contraste: 1186:1 (Valeurs des noirs: 0.34 cd/m²)
ΔE ColorChecker Calman: 0.94 | ∀{0.5-29.43 Ø4.73}
calibrated: 0.99
ΔE Greyscale Calman: 0.9 | ∀{0.09-98 Ø4.97}
98.7% sRGB (Argyll 1.6.3 3D)
62.3% AdobeRGB 1998 (Argyll 1.6.3 3D)
67.8% AdobeRGB 1998 (Argyll 3D)
98.6% sRGB (Argyll 3D)
65.7% Display P3 (Argyll 3D)
Gamma: 2.13
CCT: 6620 K
| Microsoft Surface Laptop 3 13 Core i5-1035G7 Sharp LQ135P1JX51, IPS, 13.5", 2256x1504 | Apple MacBook Pro 13 2019 2TB3 APPA03D, IPS, 13.3", 2560x1600 | Huawei Matebook X Pro i5 Tianma XM, IPS, 13.9", 3000x2000 | Microsoft Surface Laptop 2-LQN-00004 VVX14T092N00, IPS, 13.5", 2256x1504 | Dell XPS 13 7390 2-in-1 Core i7 Sharp LQ134N1, IPS, 13.4", 1920x1200 | Lenovo ThinkPad X1 Carbon 2019-20QE000VGE LP140QH2-SPD1, IPS, 14", 2560x1440 | |
|---|---|---|---|---|---|---|
| Display | 24% | -1% | 1% | 4% | 6% | |
| Display P3 Coverage (%) | 65.7 | 96.1 46% | 65.9 0% | 68 4% | 69.9 6% | 72.5 10% |
| sRGB Coverage (%) | 98.6 | 99.4 1% | 95.2 -3% | 94.7 -4% | 99.2 1% | 97.8 -1% |
| AdobeRGB 1998 Coverage (%) | 67.8 | 85.6 26% | 67.6 0% | 69.2 2% | 71.5 5% | 73.8 9% |
| Response Times | 15% | 35% | -15% | 25% | 43% | |
| Response Time Grey 50% / Grey 80% * (ms) | 59.2 ? | 50.4 ? 15% | 40.4 ? 32% | 69.2 ? -17% | 47.6 ? 20% | 33.6 ? 43% |
| Response Time Black / White * (ms) | 41.6 ? | 35.2 ? 15% | 25.6 ? 38% | 46.4 ? -12% | 29.2 ? 30% | 24 ? 42% |
| PWM Frequency (Hz) | 21740 ? | 116300 ? | 2500 ? | |||
| Screen | -3% | -113% | -67% | -28% | -113% | |
| Brightness middle (cd/m²) | 403.4 | 603 49% | 442.7 10% | 392 -3% | 549.8 36% | 338 -16% |
| Brightness (cd/m²) | 397 | 577 45% | 428 8% | 390 -2% | 520 31% | 315 -21% |
| Brightness Distribution (%) | 89 | 92 3% | 84 -6% | 89 0% | 86 -3% | 88 -1% |
| Black Level * (cd/m²) | 0.34 | 0.35 -3% | 0.31 9% | 0.24 29% | 0.39 -15% | 0.43 -26% |
| Contrast (:1) | 1186 | 1723 45% | 1428 20% | 1633 38% | 1410 19% | 786 -34% |
| Colorchecker dE 2000 * | 0.94 | 1.7 -81% | 2.24 -138% | 3.2 -240% | 2.12 -126% | 4 -326% |
| Colorchecker dE 2000 max. * | 2.92 | 3.1 -6% | 7.19 -146% | 6.3 -116% | 3.66 -25% | 7.9 -171% |
| Colorchecker dE 2000 calibrated * | 0.99 | 0.7 29% | 1.11 -12% | 1.4 -41% | 1.37 -38% | 1.7 -72% |
| Greyscale dE 2000 * | 0.9 | 2.1 -133% | 9.7 -978% | 4.5 -400% | 2.6 -189% | 6.2 -589% |
| Gamma | 2.13 103% | 2.18 101% | 1.42 155% | 2.2 100% | 2.3 96% | 2.13 103% |
| CCT | 6620 98% | 6843 95% | 6227 104% | 7556 86% | 6884 94% | 6787 96% |
| Color Space (Percent of AdobeRGB 1998) (%) | 62.3 | 76.7 23% | 61.6 -1% | 63.9 3% | 65.4 5% | 68.1 9% |
| Color Space (Percent of sRGB) (%) | 98.7 | 99.4 1% | 95 -4% | 95 -4% | 99.7 1% | 97.8 -1% |
| Moyenne finale (programmes/paramètres) | 12% /
5% | -26% /
-73% | -27% /
-48% | 0% /
-15% | -21% /
-72% |
* ... Moindre est la valeur, meilleures sont les performances
Temps de réponse de l'écran
| ↔ Temps de réponse noir à blanc | ||
|---|---|---|
| 41.6 ms ... hausse ↗ et chute ↘ combinées | ↗ 23.6 ms hausse | 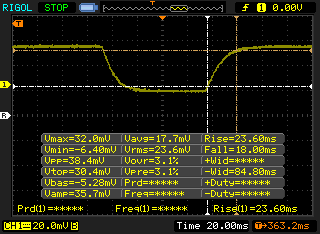 |
| ↘ 18 ms chute | ||
| L'écran souffre de latences très élevées, à éviter pour le jeu. En comparaison, tous les appareils testés affichent entre 0.1 (minimum) et 240 (maximum) ms. » 98 % des appareils testés affichent de meilleures performances. Cela signifie que les latences relevées sont moins bonnes que la moyenne (19.9 ms) de tous les appareils testés. | ||
| ↔ Temps de réponse gris 50% à gris 80% | ||
| 59.2 ms ... hausse ↗ et chute ↘ combinées | ↗ 28.4 ms hausse | 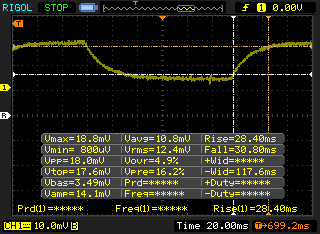 |
| ↘ 30.8 ms chute | ||
| L'écran souffre de latences très élevées, à éviter pour le jeu. En comparaison, tous les appareils testés affichent entre 0.165 (minimum) et 636 (maximum) ms. » 95 % des appareils testés affichent de meilleures performances. Cela signifie que les latences relevées sont moins bonnes que la moyenne (31.1 ms) de tous les appareils testés. | ||
Scintillement / MLI (Modulation de largeur d'impulsion)
| Scintillement / MLI (Modulation de largeur d'impulsion) décelé | 21740 Hz | ≤ 51 Niveau de luminosité | 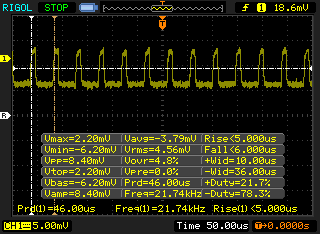 |
Le rétroéclairage de l'écran scintille à la fréquence de 21740 Hz (certainement du fait de l'utilisation d'une MDI - Modulation de largeur d'impulsion) à un niveau de luminosité inférieur ou égal à 51 % . Aucun scintillement ne devrait être perceptible au-dessus de cette valeur. La fréquence de rafraîchissement de 21740 Hz est élevée, la grande majorité des utilisateurs ne devrait pas percevoir de scintillements et être sujette à une fatigue oculaire accrue. En comparaison, 52 % des appareils testés n'emploient pas MDI pour assombrir leur écran. Nous avons relevé une moyenne à 7798 (minimum : 5 - maximum : 343500) Hz dans le cas où une MDI était active. | |||
* ... Moindre est la valeur, meilleures sont les performances
| PCMark 8 Home Score Accelerated v2 | 3725 points | |
| PCMark 8 Work Score Accelerated v2 | 4755 points | |
| PCMark 10 Score | 4421 points | |
Aide | ||
| Microsoft Surface Laptop 3 13 Core i5-1035G7 SK hynix BC501 HFM256GDGTNG | Apple MacBook Pro 13 2019 2TB3 Apple SSD AP0256 | Huawei Matebook X Pro i5 Samsung PM961 MZVLW256HEHP | Microsoft Surface Laptop 2-LQN-00004 SK Hynix BC501 NVMe 256 GB | Dell XPS 13 7390 2-in-1 Core i7 Toshiba BG4 KBG40ZPZ512G | |
|---|---|---|---|---|---|
| AS SSD | -33% | 44% | 3% | 8% | |
| Seq Read (MB/s) | 1387 | 974 -30% | 2416 74% | 826 -40% | 1801 30% |
| Seq Write (MB/s) | 504 | 1340 166% | 1170 132% | 555 10% | 1125 123% |
| 4K Read (MB/s) | 42.35 | 11.35 -73% | 48.33 14% | 33.39 -21% | 39.7 -6% |
| 4K Write (MB/s) | 120 | 15.95 -87% | 103.1 -14% | 95.3 -21% | 67 -44% |
| 4K-64 Read (MB/s) | 497.4 | 643 29% | 1039 109% | 447 -10% | 1253 152% |
| 4K-64 Write (MB/s) | 354.9 | 163 -54% | 399.6 13% | 370.4 4% | 209 -41% |
| Access Time Read * (ms) | 0.055 | 0.316 -475% | 0.058 -5% | 0.048 13% | 0.069 -25% |
| Access Time Write * (ms) | 0.093 | 0.258 -177% | 0.036 61% | 0.048 48% | 0.625 -572% |
| Score Read (Points) | 678 | 752 11% | 1329 96% | 563 -17% | 1472 117% |
| Score Write (Points) | 525 | 313 -40% | 620 18% | 521 -1% | 388 -26% |
| Score Total (Points) | 1520 | 1465 -4% | 2575 69% | 1369 -10% | 2583 70% |
| Copy ISO MB/s (MB/s) | 764 | 1404 84% | 739 -3% | 755 -1% | 1293 69% |
| Copy Program MB/s (MB/s) | 256.1 | 406.9 59% | 312.3 22% | 325.1 27% | 560 119% |
| Copy Game MB/s (MB/s) | 368.4 | 850 131% | 486.3 32% | 577 57% | 927 152% |
| CrystalDiskMark 5.2 / 6 | 16% | -11% | 36% | ||
| Write 4K (MB/s) | 112.3 | 116.5 4% | 87.3 -22% | 106.7 -5% | |
| Read 4K (MB/s) | 42.13 | 42.18 0% | 36.52 -13% | 49.94 19% | |
| Write Seq (MB/s) | 630 | 1079 71% | 716 14% | 1223 94% | |
| Read Seq (MB/s) | 1023 | 1030 1% | 1009 -1% | 1801 76% | |
| Write 4K Q32T1 (MB/s) | 336.6 | 225.7 -33% | 324.1 -4% | 325.3 -3% | |
| Read 4K Q32T1 (MB/s) | 399.6 | 302.9 -24% | 249 -38% | 551 38% | |
| Write Seq Q32T1 (MB/s) | 821 | 1174 43% | 811 -1% | 1224 49% | |
| Read Seq Q32T1 (MB/s) | 2030 | 3394 67% | 1631 -20% | 2350 16% | |
| Moyenne finale (programmes/paramètres) | -33% /
-33% | 30% /
34% | -4% /
-2% | 22% /
18% |
* ... Moindre est la valeur, meilleures sont les performances

| 3DMark 06 Standard Score | 15227 points | |
| 3DMark Vantage P Result | 14442 points | |
| 3DMark 11 Performance | 4514 points | |
| 3DMark Ice Storm Standard Score | 66232 points | |
| 3DMark Cloud Gate Standard Score | 13409 points | |
| 3DMark Fire Strike Score | 2532 points | |
| 3DMark Time Spy Score | 899 points | |
Aide | ||
| The Witcher 3 | |
| 1024x768 Low Graphics & Postprocessing | |
| Huawei MateBook 13 i7 | |
| MSI Modern 15 A10RB | |
| Microsoft Surface Laptop 3 15 i7-1065G7 | |
| Dell Inspiron 15 5000 5585 | |
| Microsoft Surface Laptop 3 13 Core i5-1035G7 | |
| Acer Swift 3 SF314-41G-R491 | |
| Moyenne Intel Iris Plus Graphics G7 (Ice Lake 64 EU) (28.2 - 58, n=20) | |
| Microsoft Surface Laptop 3 15 Ryzen 5 3580U | |
| Acer Swift 5 SF514-54T-501U | |
| 1366x768 Medium Graphics & Postprocessing | |
| MSI Modern 15 A10RB | |
| Huawei MateBook 13 i7 | |
| Microsoft Surface Laptop 3 15 i7-1065G7 | |
| Moyenne Intel Iris Plus Graphics G7 (Ice Lake 64 EU) (20.8 - 36.8, n=18) | |
| Microsoft Surface Laptop 3 13 Core i5-1035G7 | |
| Acer Swift 3 SF314-41G-R491 | |
| Acer Swift 5 SF514-54T-501U | |
| Shadow of the Tomb Raider - 1280x720 Lowest Preset | |
| MSI Modern 15 A10RB | |
| Acer Swift 3 SF314-41G-R491 | |
| Dell Inspiron 15 5000 5585 | |
| Microsoft Surface Pro 7 | |
| Microsoft Surface Laptop 3 15 i7-1065G7 | |
| Microsoft Surface Laptop 3 15 Ryzen 5 3580U | |
| Moyenne Intel Iris Plus Graphics G7 (Ice Lake 64 EU) (15.6 - 33, n=13) | |
| Microsoft Surface Laptop 3 13 Core i5-1035G7 | |
| Overwatch | |
| 1280x720 Low (Render Scale 100 %) AA:FX AF:1x | |
| Acer Swift 3 SF314-41G-R491 | |
| Microsoft Surface Laptop 3 15 Ryzen 5 3580U | |
| Microsoft Surface Laptop 3 15 i7-1065G7 | |
| HP Envy x360 15-bq102ng | |
| Moyenne Intel Iris Plus Graphics G7 (Ice Lake 64 EU) (62.6 - 92.7, n=6) | |
| Microsoft Surface Laptop 3 13 Core i5-1035G7 | |
| 1920x1080 High (Render Scale 100 %) AA:SM AF:4x | |
| Acer Swift 3 SF314-41G-R491 | |
| Microsoft Surface Laptop 3 15 Ryzen 5 3580U | |
| Microsoft Surface Laptop 3 15 i7-1065G7 | |
| HP Envy x360 15-bq102ng | |
| Moyenne Intel Iris Plus Graphics G7 (Ice Lake 64 EU) (29.7 - 32.9, n=4) | |
| Microsoft Surface Laptop 3 13 Core i5-1035G7 | |
| Bas | Moyen | Élevé | Ultra | |
|---|---|---|---|---|
| BioShock Infinite (2013) | 89.8 | 60.4 | 50.4 | 19.2 |
| The Witcher 3 (2015) | 49 | 31 | 17 | 8.8 |
| Overwatch (2016) | 62.6 | 44.1 | 30.5 | 19 |
| Rocket League (2017) | 79 | 45.6 | 31.4 | |
| Shadow of the Tomb Raider (2018) | 26 | |||
| Borderlands 3 (2019) | 30.1 |
| Microsoft Surface Laptop 3 13 Core i5-1035G7 Iris Plus Graphics G7 (Ice Lake 64 EU), i5-1035G7, SK hynix BC501 HFM256GDGTNG | Apple MacBook Pro 13 2019 2TB3 Iris Plus Graphics 645, i5-8257U, Apple SSD AP0256 | Huawei Matebook X Pro i5 GeForce MX150, i5-8250U, Samsung PM961 MZVLW256HEHP | Microsoft Surface Laptop 2-LQN-00004 UHD Graphics 620, i5-8250U, SK Hynix BC501 NVMe 256 GB | Dell XPS 13 7390 2-in-1 Core i7 Iris Plus Graphics G7 (Ice Lake 64 EU), i7-1065G7, Toshiba BG4 KBG40ZPZ512G | Lenovo ThinkPad X1 Carbon 2019-20QE000VGE UHD Graphics 620, i7-8665U, WDC PC SN720 SDAQNTW-512G | |
|---|---|---|---|---|---|---|
| Noise | -4% | -6% | 2% | -3% | 1% | |
| arrêt / environnement * (dB) | 28.5 | 29.5 -4% | 27.9 2% | 28.7 -1% | 28.1 1% | 28.4 -0% |
| Idle Minimum * (dB) | 28.5 | 29.5 -4% | 27.9 2% | 28.7 -1% | 28.1 1% | 28.4 -0% |
| Idle Average * (dB) | 28.5 | 29.5 -4% | 27.9 2% | 28.7 -1% | 28.1 1% | 28.4 -0% |
| Idle Maximum * (dB) | 28.5 | 29.5 -4% | 27.9 2% | 28.7 -1% | 28.1 1% | 28.6 -0% |
| Load Average * (dB) | 28.5 | 31.1 -9% | 36.2 -27% | 30 -5% | 31.7 -11% | 31.5 -11% |
| Witcher 3 ultra * (dB) | 40.4 | 45 -11% | 43.4 -7% | |||
| Load Maximum * (dB) | 40.4 | 39.3 3% | 45.2 -12% | 32.9 19% | 43.4 -7% | 33.1 18% |
* ... Moindre est la valeur, meilleures sont les performances
Degré de la nuisance sonore
| Au repos |
| 28.5 / 28.5 / 28.5 dB(A) |
| Fortement sollicité |
| 28.5 / 40.4 dB(A) |
 | ||
30 dB silencieux 40 dB(A) audible 50 dB(A) bruyant |
||
min: | ||
(±) La température maximale du côté supérieur est de 42.6 °C / 109 F, par rapport à la moyenne de 34.3 °C / 94 F, allant de 21.2 à 62.5 °C pour la classe Office.
(-) Le fond chauffe jusqu'à un maximum de 45.4 °C / 114 F, contre une moyenne de 36.8 °C / 98 F
(+) En utilisation inactive, la température moyenne du côté supérieur est de 25.5 °C / 78 F, par rapport à la moyenne du dispositif de 29.5 °C / 85 F.
(±) En jouant à The Witcher 3, la température moyenne du côté supérieur est de 34.8 °C / 95 F, alors que la moyenne de l'appareil est de 29.5 °C / 85 F.
(+) Les repose-poignets et le pavé tactile atteignent la température maximale de la peau (35.2 °C / 95.4 F) et ne sont donc pas chauds.
(-) La température moyenne de la zone de l'appui-paume de dispositifs similaires était de 27.5 °C / 81.5 F (-7.7 °C / #-13.9 F).
Microsoft Surface Laptop 3 13 Core i5-1035G7 analyse audio
(±) | le niveau sonore du haut-parleur est moyen mais bon (79# dB)
Basses 100 - 315 Hz
(+) | bonne basse - seulement 4.2% loin de la médiane
(±) | la linéarité des basses est moyenne (10.5% delta à la fréquence précédente)
Médiums 400 - 2000 Hz
(+) | médiane équilibrée - seulement 3.6% de la médiane
(±) | la linéarité des médiums est moyenne (7.1% delta à la fréquence précédente)
Aiguës 2 - 16 kHz
(+) | des sommets équilibrés - à seulement 1.8% de la médiane
(+) | les aigus sont linéaires (6.5% delta à la fréquence précédente)
Globalement 100 - 16 000 Hz
(+) | le son global est linéaire (11.4% différence à la médiane)
Par rapport à la même classe
» 3% de tous les appareils testés de cette catégorie étaient meilleurs, 2% similaires, 95% pires
» Le meilleur avait un delta de 7%, la moyenne était de 21%, le pire était de 53%.
Par rapport à tous les appareils testés
» 7% de tous les appareils testés étaient meilleurs, 2% similaires, 91% pires
» Le meilleur avait un delta de 4%, la moyenne était de 24%, le pire était de 134%.
Apple MacBook 12 (Early 2016) 1.1 GHz analyse audio
(+) | les haut-parleurs peuvent jouer relativement fort (83.6# dB)
Basses 100 - 315 Hz
(±) | basse réduite - en moyenne 11.3% inférieure à la médiane
(±) | la linéarité des basses est moyenne (14.2% delta à la fréquence précédente)
Médiums 400 - 2000 Hz
(+) | médiane équilibrée - seulement 2.4% de la médiane
(+) | les médiums sont linéaires (5.5% delta à la fréquence précédente)
Aiguës 2 - 16 kHz
(+) | des sommets équilibrés - à seulement 2% de la médiane
(+) | les aigus sont linéaires (4.5% delta à la fréquence précédente)
Globalement 100 - 16 000 Hz
(+) | le son global est linéaire (10.2% différence à la médiane)
Par rapport à la même classe
» 7% de tous les appareils testés de cette catégorie étaient meilleurs, 2% similaires, 91% pires
» Le meilleur avait un delta de 5%, la moyenne était de 18%, le pire était de 53%.
Par rapport à tous les appareils testés
» 5% de tous les appareils testés étaient meilleurs, 1% similaires, 94% pires
» Le meilleur avait un delta de 4%, la moyenne était de 24%, le pire était de 134%.
| Éteint/en veille | |
| Au repos | |
| Fortement sollicité |
|
Légende:
min: | |
| Microsoft Surface Laptop 3 13 Core i5-1035G7 i5-1035G7, Iris Plus Graphics G7 (Ice Lake 64 EU), SK hynix BC501 HFM256GDGTNG, IPS, 2256x1504, 13.5" | Apple MacBook Pro 13 2019 2TB3 i5-8257U, Iris Plus Graphics 645, Apple SSD AP0256, IPS, 2560x1600, 13.3" | Huawei Matebook X Pro i5 i5-8250U, GeForce MX150, Samsung PM961 MZVLW256HEHP, IPS, 3000x2000, 13.9" | Microsoft Surface Laptop 2-LQN-00004 i5-8250U, UHD Graphics 620, SK Hynix BC501 NVMe 256 GB, IPS, 2256x1504, 13.5" | Dell XPS 13 7390 2-in-1 Core i7 i7-1065G7, Iris Plus Graphics G7 (Ice Lake 64 EU), Toshiba BG4 KBG40ZPZ512G, IPS, 1920x1200, 13.4" | Lenovo ThinkPad X1 Carbon 2019-20QE000VGE i7-8665U, UHD Graphics 620, WDC PC SN720 SDAQNTW-512G, IPS, 2560x1440, 14" | |
|---|---|---|---|---|---|---|
| Power Consumption | 12% | -12% | 16% | 16% | 6% | |
| Idle Minimum * (Watt) | 4.4 | 2.1 52% | 3.5 20% | 3 32% | 2.6 41% | 3 32% |
| Idle Average * (Watt) | 7.5 | 6.9 8% | 8.9 -19% | 6.8 9% | 5.3 29% | 6.3 16% |
| Idle Maximum * (Watt) | 7.8 | 7.8 -0% | 12.3 -58% | 8.76 -12% | 7 10% | 8.9 -14% |
| Load Average * (Watt) | 41.9 | 42 -0% | 54.2 -29% | 35.1 16% | 43.1 -3% | 40.8 3% |
| Witcher 3 ultra * (Watt) | 40.8 | 42.4 -4% | 43.1 -6% | |||
| Load Maximum * (Watt) | 63.9 | 64.5 -1% | 52.1 18% | 42.6 33% | 49 23% | 67.5 -6% |
* ... Moindre est la valeur, meilleures sont les performances
| Microsoft Surface Laptop 3 13 Core i5-1035G7 i5-1035G7, Iris Plus Graphics G7 (Ice Lake 64 EU), 45 Wh | Apple MacBook Pro 13 2019 2TB3 i5-8257U, Iris Plus Graphics 645, 58.2 Wh | Huawei Matebook X Pro i5 i5-8250U, GeForce MX150, 57.4 Wh | Microsoft Surface Laptop 2-LQN-00004 i5-8250U, UHD Graphics 620, 45 Wh | Dell XPS 13 7390 2-in-1 Core i7 i7-1065G7, Iris Plus Graphics G7 (Ice Lake 64 EU), 51 Wh | Lenovo ThinkPad X1 Carbon 2019-20QE000VGE i7-8665U, UHD Graphics 620, 51 Wh | |
|---|---|---|---|---|---|---|
| Autonomie de la batterie | 57% | -4% | -15% | 8% | -14% | |
| Reader / Idle (h) | 34.4 | 20.7 -40% | 20.8 -40% | |||
| WiFi v1.3 (h) | 8.3 | 13 57% | 9.3 12% | 9.1 10% | 9 8% | 8.2 -1% |
| Load (h) | 1.9 | 2.2 16% | 1.6 -16% | 1.4 -26% |
Points positifs
Points négatifs
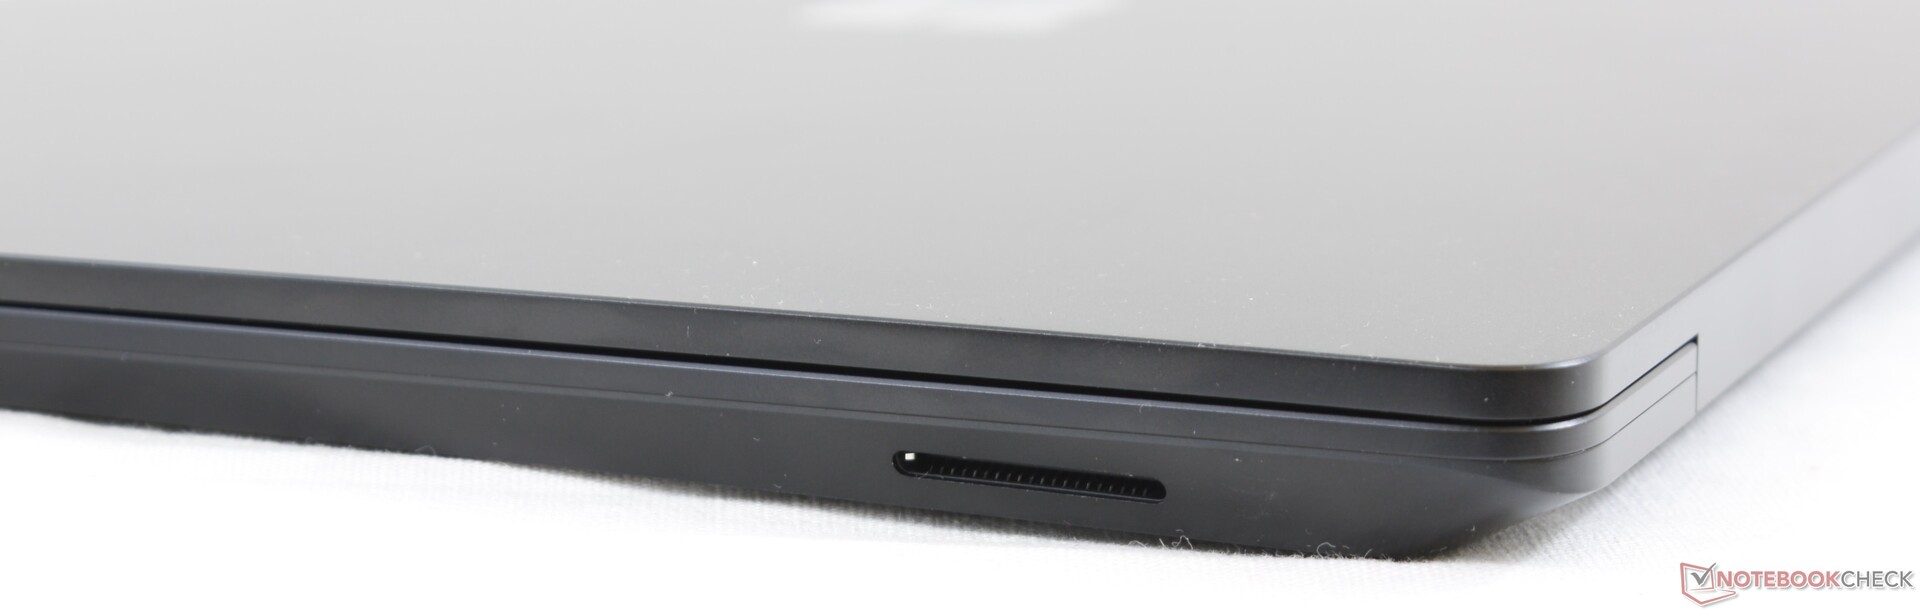
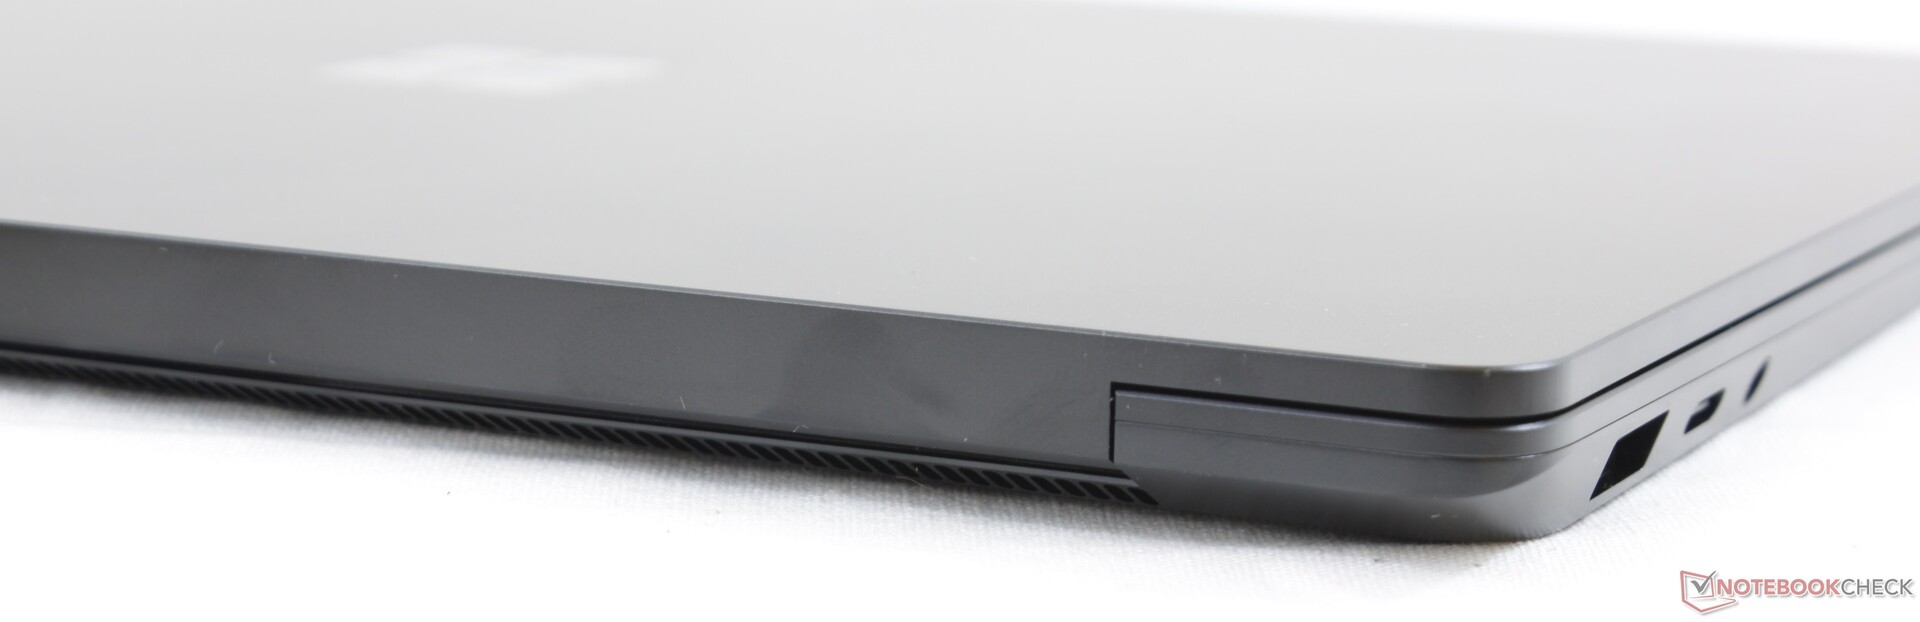
Le Surface Laptop 3 est à l’équilibre entre l’ultrabook grand public et le portable professionnel, sans exceller dans aucune des deux catégories. Des ultrabooks plus connus comme le Dell XPS 13 2-en-1, le HP Spectre 13 ou le Huawei MateBook X Pro ont des écrans plus lumineux ou des GPU dédiés, tandis que les "vrais" portables professionnels comme le Lenovo X1 Carbon ou le HP EliteBook x360 1040 sont plus faciles à démonter et ont plus de ports. Le système paraît quelque peu terne, et même daté, malgré la présence de CPU Intel de 10 e génération.
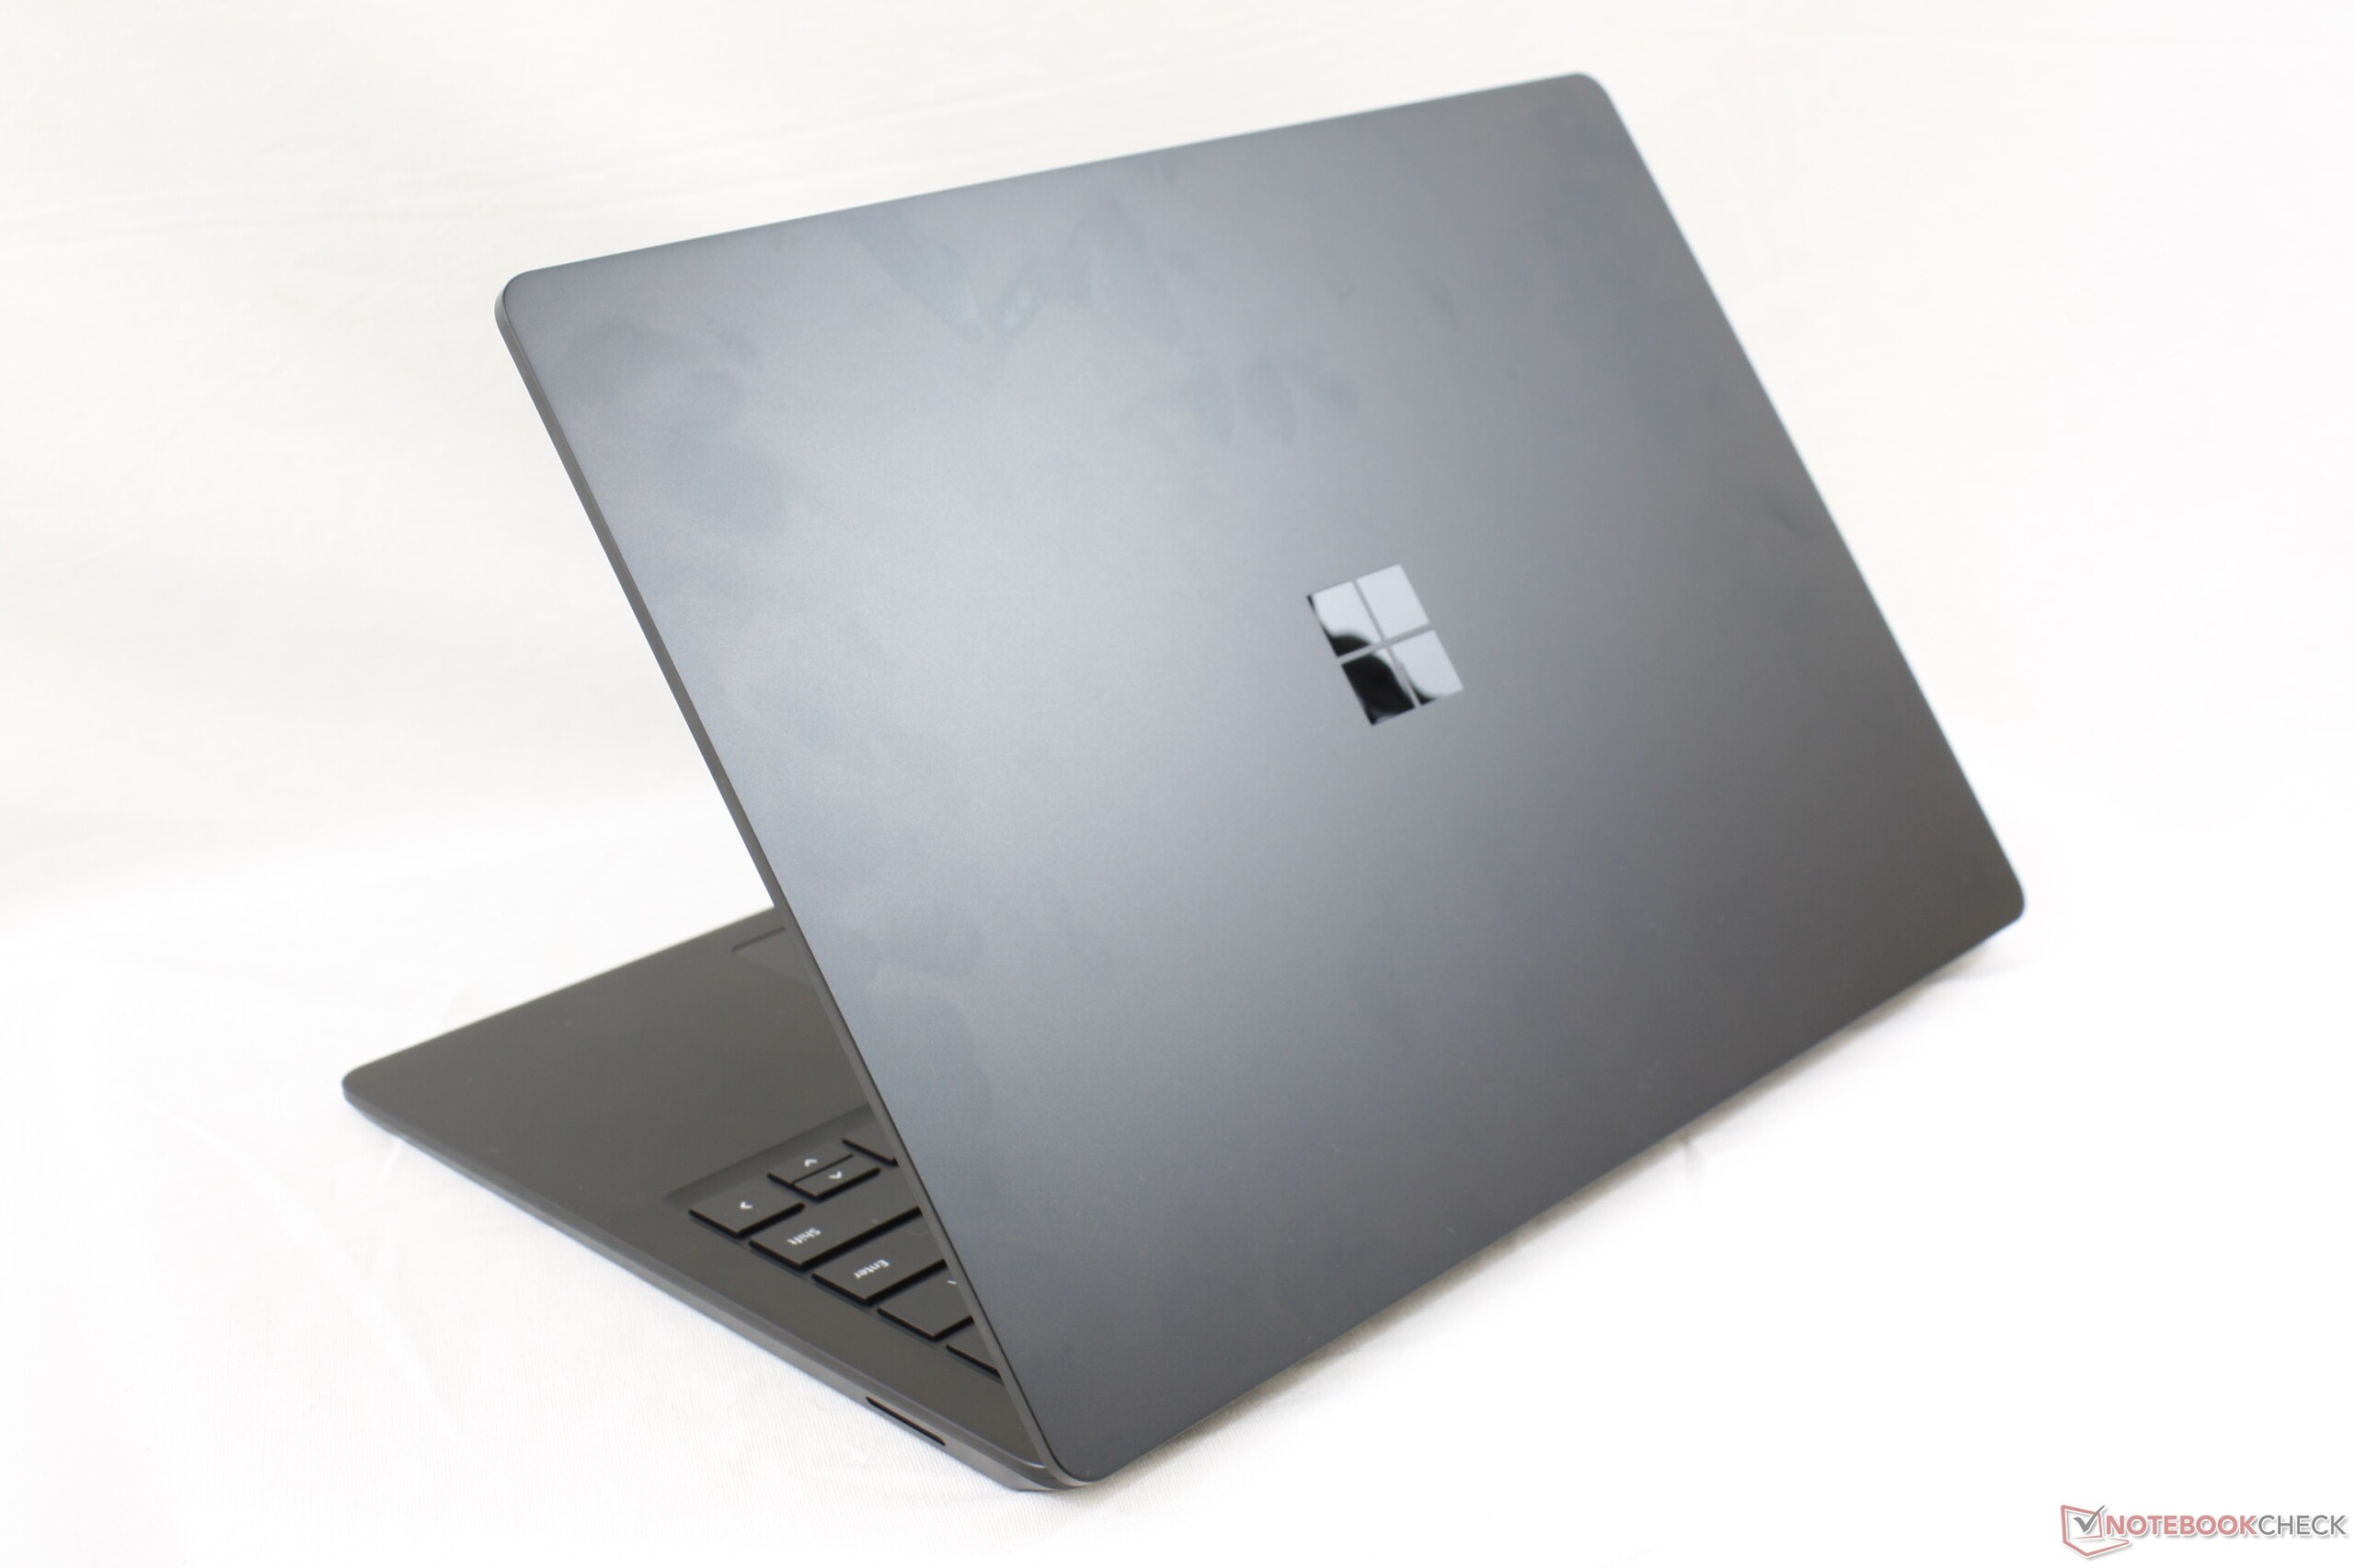
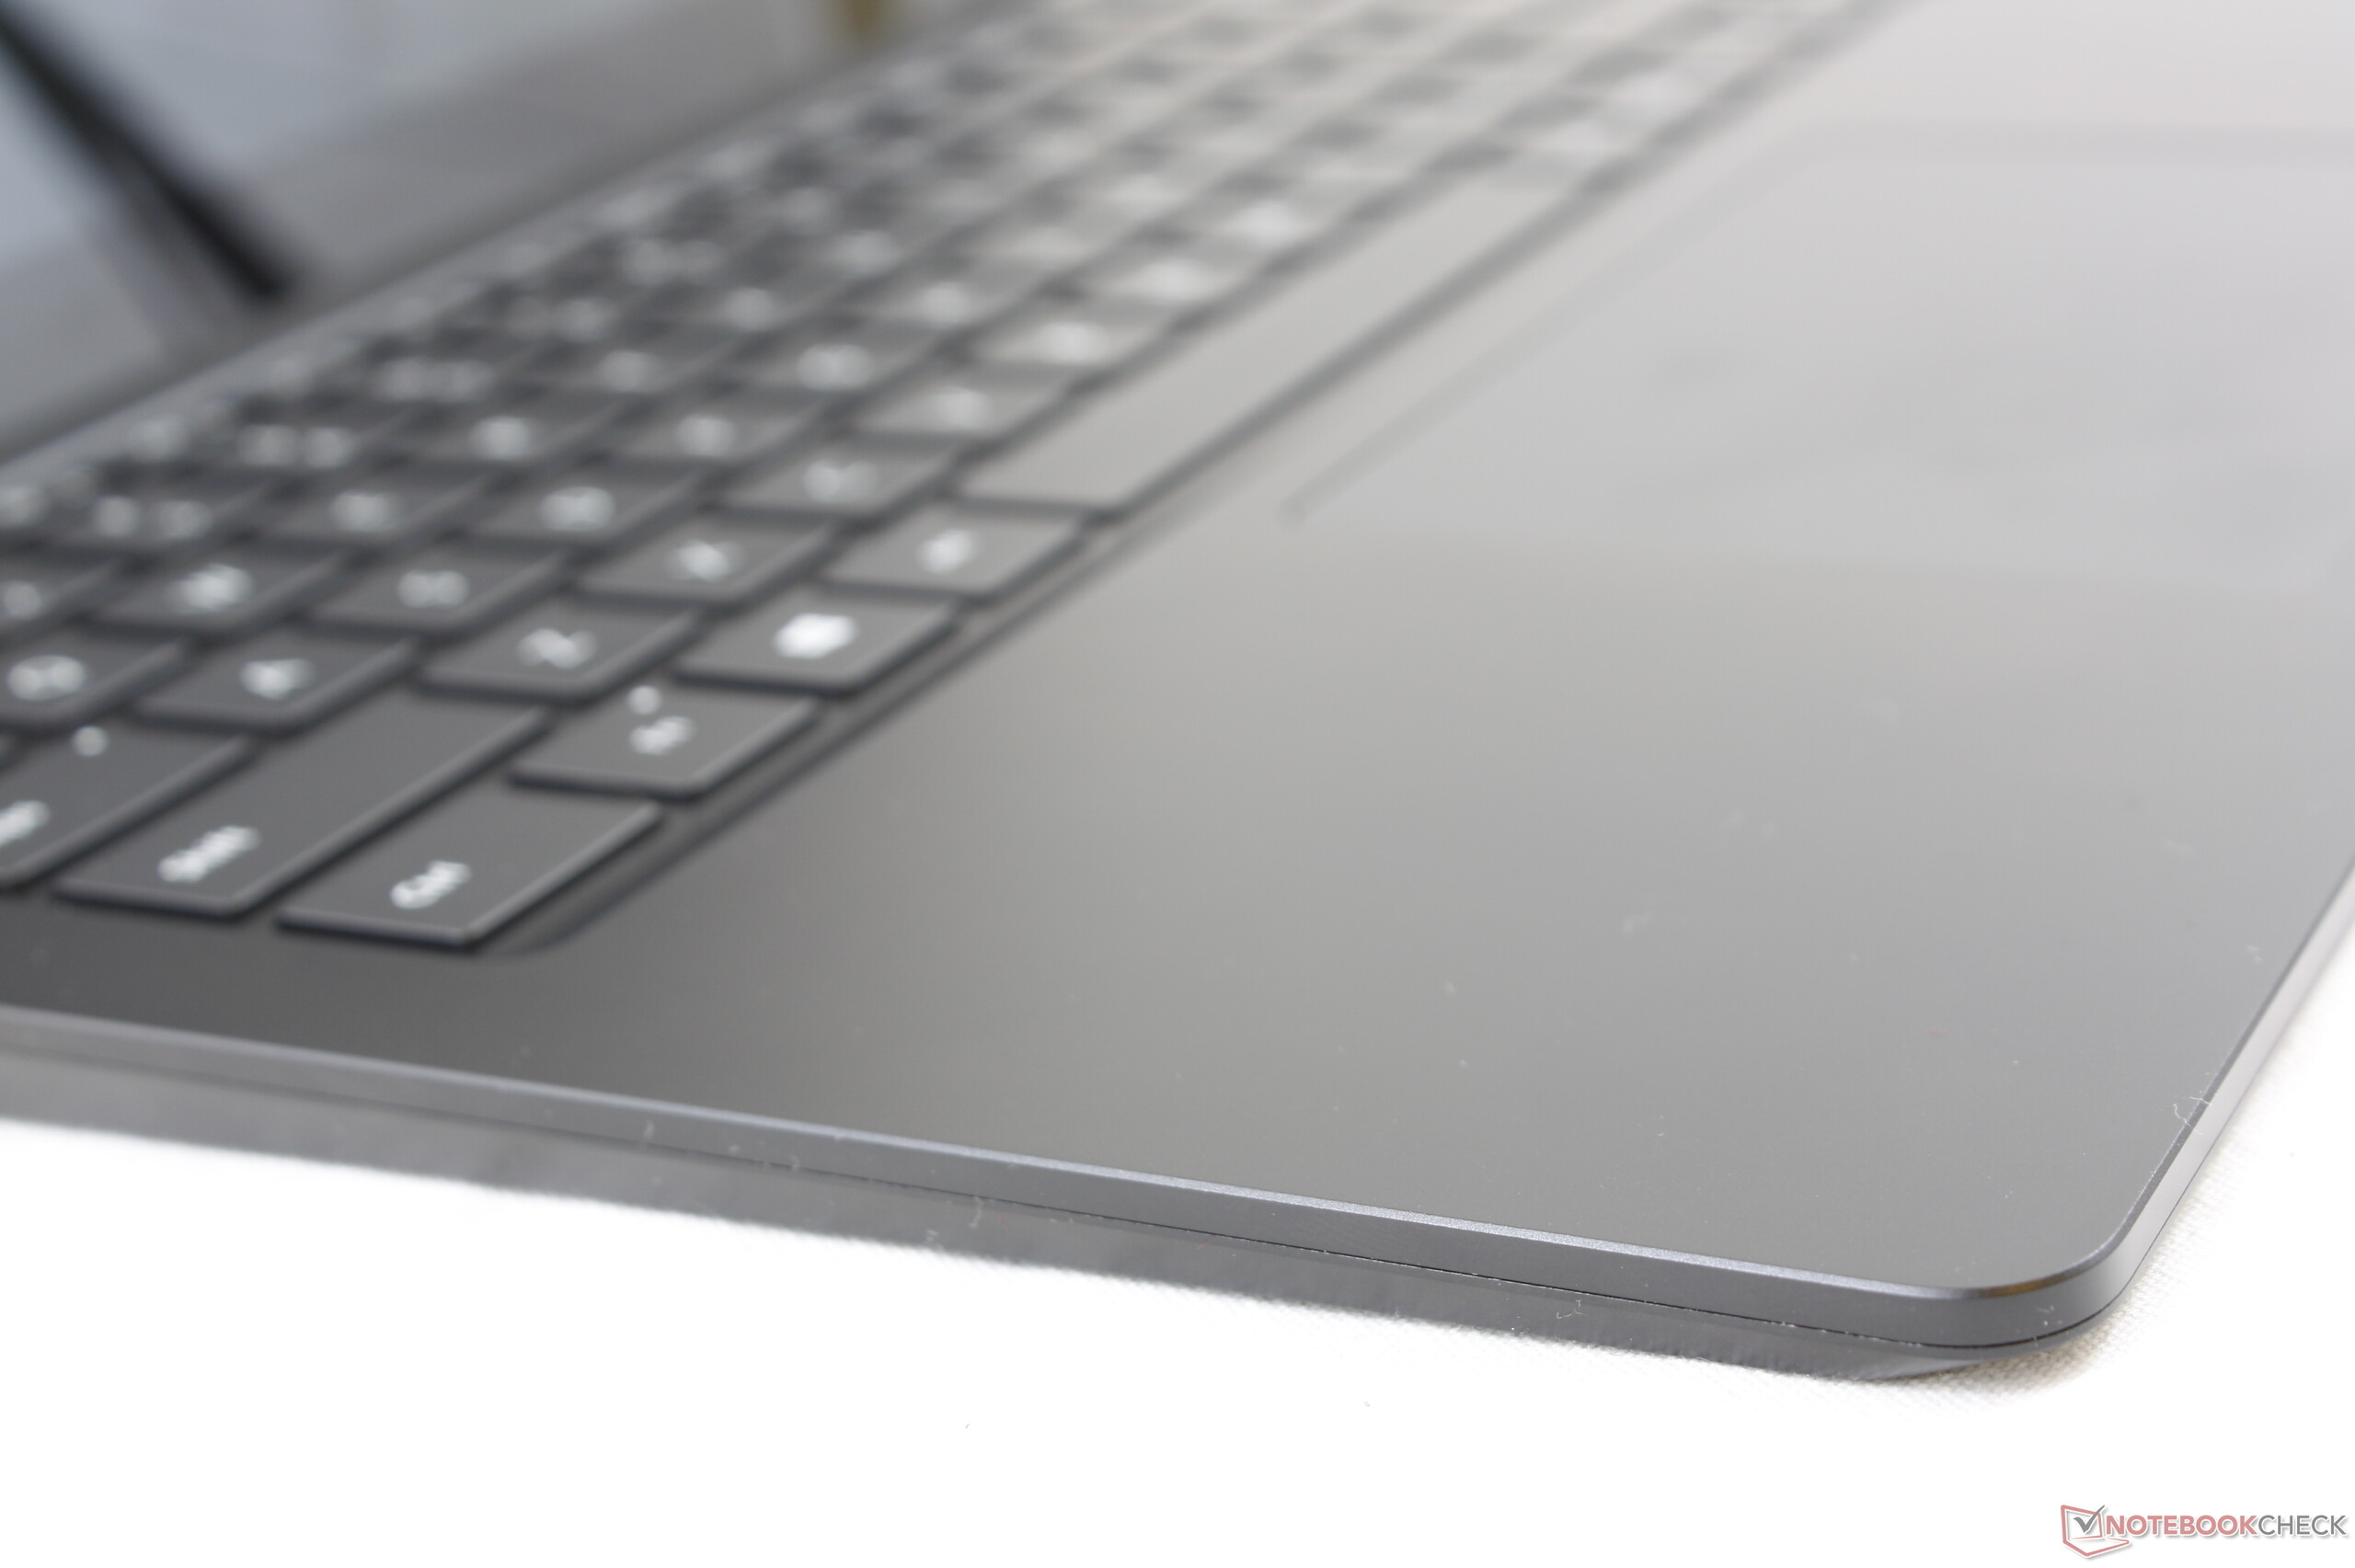
Mais d’un autre côté, la machine est néanmoins excellente quand on prend en compte son prix de 1 000 $. Le châssis en métal est plus costaud que celui en Alcantara, l’écran brillant est bien calibré, la qualité audio est bonne pour la taille, et le niveau sonore est la plupart du temps au minimum. Ceux qui ne sont pas des inconditionnels des fonctionnalités généralement présentes sur les ultrabooks Windows apprécieront le Surface Laptop 3.
Peut-être est-il temps pour Windows de revoir complètement le châssis de trois ans du Surface Laptop, et d’intégrer des fonctionnalités plus séduisantes. Le Huawei MateBook X Pro est une excellente alternative au Surface Laptop 3 de 13,5 pouces, avec une maintenance plus aisée, un plus grand écran 3:2, une GeForce MX, et une connectique Thunderbolt 3, le tout dans un châssis plus compact.
L’intégralité de cette critique est disponible en anglais en suivant ce lien.
Microsoft Surface Laptop 3 13 Core i5-1035G7
- 02/23/2020 v7 (old)
Allen Ngo
Price comparison
