Test du HP Omen Transcend 14 : l'alternative au Razer Blade mérite d'être considérée
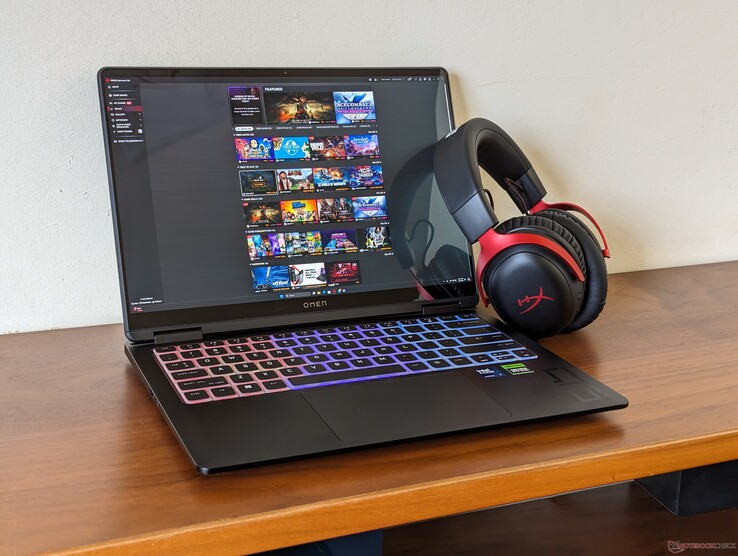
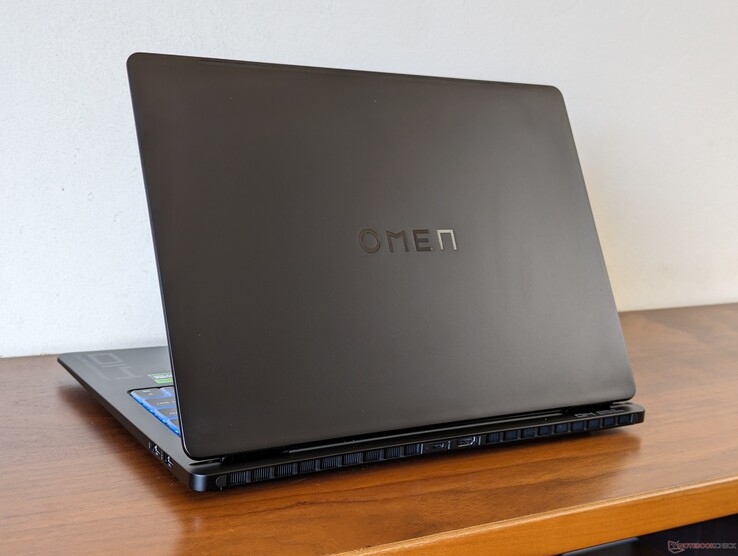
Dévoilé au CES 2024l'Omen Transcend 14 a été conçu pour les étudiants ou les joueurs qui veulent jouer, faire et créer n'importe où, en mettant l'accent sur la portabilité. C'est donc l'un des ordinateurs portables les plus petits et les plus légers de la famille Omen, avec un écran de seulement 14 pouces.
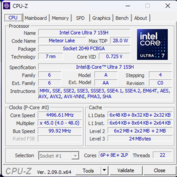
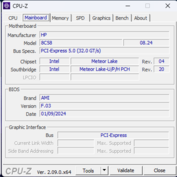
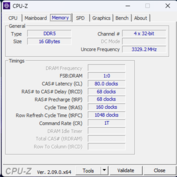
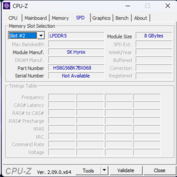
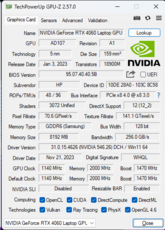
L'unité que nous avons examinée est une configuration de milieu de gamme avec un processeur Core Ultra 7 155H, 16 Go de RAM LPDDR5x et un GPU RTX 4060 de 50 W GeForce, pour un prix d'environ 1700 $. D'autres configurations sont disponibles avec la RTX 4050, plus lente, la RTX 4070, plus rapide, ou le Core Ultra 9 185H, entre 1500 et 2100 dollars, mais toutes les options sont livrées avec le même écran OLED 2880 x 1800 120 Hz.
Parmi les alternatives à l'Omen Transcend 14, on trouve d'autres ordinateurs portables de 14 pouces très performants dotés d'une carte graphique RTX GeForce, comme le Razer Blade 14, Asus Zephyrus G14ou le Lenovo Legion Slim 5 14.
Plus de commentaires sur HP :
Comparaison avec les concurrents potentiels
Note | Date | Modèle | Poids | Épaisseur | Taille | Résolution | Prix |
|---|---|---|---|---|---|---|---|
| 88.5 % v7 (old) | 03/24 | HP Omen Transcend 14-fb0014 Ultra 7 155H, GeForce RTX 4060 Laptop GPU | 1.6 kg | 18 mm | 14.00" | 2880x1800 | |
| 93 % v7 (old) | 02/24 | Asus ROG Zephyrus G14 2024 GA403U R9 8945HS, GeForce RTX 4070 Laptop GPU | 1.5 kg | 16.3 mm | 14.00" | 2880x1800 | |
| 89.7 % v7 (old) | 02/24 | Razer Blade 14 RZ09-0508 R9 8945HS, GeForce RTX 4070 Laptop GPU | 1.9 kg | 17.99 mm | 14.00" | 2560x1600 | |
| 87.7 % v7 (old) | 09/23 | Lenovo Legion Slim 5 14APH8 R7 7840HS, GeForce RTX 4060 Laptop GPU | 1.7 kg | 20.79 mm | 14.50" | 2880x1600 | |
| 93.2 % v7 (old) | 12/23 | Apple MacBook Pro 14 2023 M3 Pro Apple M3 Pro 11-Core, M3 Pro 14-Core GPU | 1.6 kg | 15.5 mm | 14.20" | 3024x1964 | |
| 85.5 % v7 (old) | 10/23 | Microsoft Surface Laptop Studio 2 RTX 4060 i7-13700H, GeForce RTX 4060 Laptop GPU | 2 kg | 22 mm | 14.40" | 2400x1600 |
Top 10
» Le Top 10 des PC portables multimédia
» Le Top 10 des PC portables de jeu
» Le Top 10 des PC portables de jeu légers
» Le Top 10 des ordinateurs portables bureautiques
» Le Top 10 des PC portables bureautiques premium/professionnels
» Le Top 10 des Stations de travail mobiles
» Le Top 10 des Ultraportables
» Le Top 10 des Ultrabooks
» Le Top 10 des Convertibles
» Le Top 10 des Tablettes
» Le Top 10 des Tablettes Windows
» Le Top 10 des Smartphones
» Le Top 10 des PC Portables á moins de 300 euros
» Le Top 10 des PC Portables á moins de 500 euros
» Le Top 25 des meilleurs écrans d'ordinateurs
Affaire - Le plus mince des présages
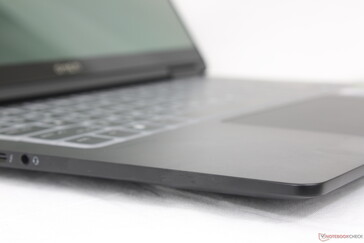
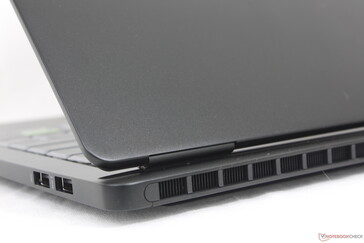
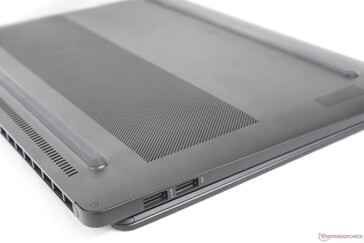
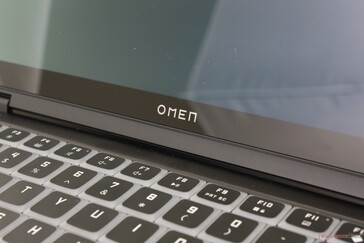
Le châssis s'inspire du modèle plus grand Omen Transcend 16 notamment l'arrière légèrement saillant, la couleur unicolore, les surfaces planes et lisses avec des bords et des coins arrondis, et des accents minimaux. C'est un look propre et discret qui peut s'adapter à la plupart des environnements, contrairement au design du Zephyrus G14, très axé sur les joueurs.
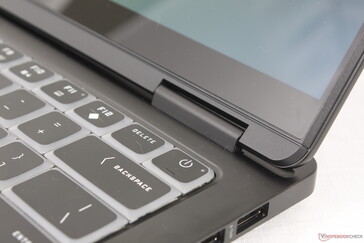
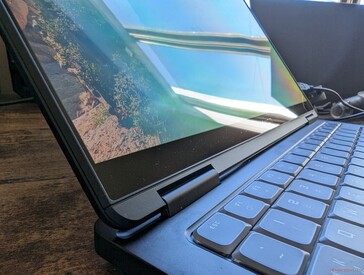
Malheureusement, la rigidité est nettement plus faible que sur le Blade 14 ou le Zephyrus G14. Le couvercle du HP en particulier est plus susceptible de se plier, de se tordre et de basculer. L'incorporation de charnières plus solides aurait permis d'améliorer la longévité et l'impression générale du châssis.
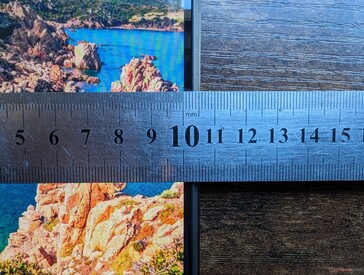
Le modèle n'est que 1 à 2 mm plus épais que la Blade 14 ou 2024 Zephyrus G14, tout en étant légèrement plus grand en termes d'encombrement. Les petites différences de taille sont si négligeables dans la pratique que notre HP se sent tout aussi portable que n'importe lequel de ses plus proches concurrents de 14,0 pouces. Le Legion Slim 5 14 de Lenovo est sensiblement plus grand, mais il offre en contrepartie un écran de 14,5 pouces légèrement plus grand.
Connectivité - Similaire à la lame 14
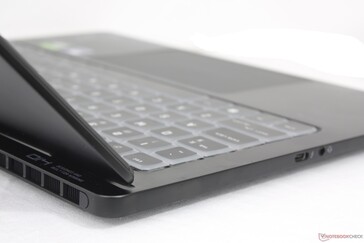
Les options de port sont identiques à celles du Razer Blade 14, bien que réorganisées. Gardez à l'esprit que si le système peut être chargé via l'un des deux ports USB-C, seul le port USB-C arrière prend en charge une charge de 140 W. L'adaptateur secteur doit donc être connecté au port USB-C arrière pour que les performances du système soient optimales. L'adaptateur secteur doit donc être connecté au port USB-C arrière pour que le système soit pleinement performant, sinon une fenêtre contextuelle informera l'utilisateur d'une réduction des performances si l'adaptateur secteur est connecté au "mauvais" port USB-C.
Communication
Les SKU peuvent être livrés avec des modules WLAN Wi-Fi 6E ou Wi-Fi 7. L'appareil que nous avons testé est équipé du module Intel BE200 pour la connectivité Wi-Fi 7. Bien que nous n'ayons pas encore fait l'acquisition d'un routeur de test Wi-Fi 7, nous avons constaté des performances stables et aucun problème lorsque nous l'avons couplé à notre réseau Asus AXE11000 Wi-Fi 6E.
| Networking | |
| iperf3 transmit AXE11000 | |
| Asus ROG Zephyrus G14 2024 GA403U | |
| Razer Blade 14 RZ09-0508 | |
| Lenovo Legion Slim 5 14APH8 | |
| Microsoft Surface Laptop Studio 2 RTX 4060 | |
| HP Omen Transcend 14-fb0014 | |
| iperf3 receive AXE11000 | |
| Asus ROG Zephyrus G14 2024 GA403U | |
| Microsoft Surface Laptop Studio 2 RTX 4060 | |
| Razer Blade 14 RZ09-0508 | |
| Lenovo Legion Slim 5 14APH8 | |
| HP Omen Transcend 14-fb0014 | |
| iperf3 transmit AXE11000 6GHz | |
| Lenovo Legion Slim 5 14APH8 | |
| Razer Blade 14 RZ09-0508 | |
| HP Omen Transcend 14-fb0014 | |
| iperf3 receive AXE11000 6GHz | |
| Razer Blade 14 RZ09-0508 | |
| HP Omen Transcend 14-fb0014 | |
| Lenovo Legion Slim 5 14APH8 | |
Webcam
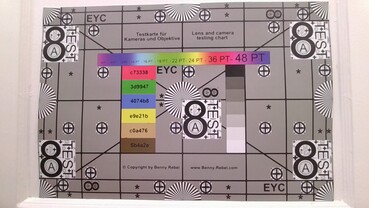
La webcam de 2 mégapixels est dotée d'un système infrarouge, mais pas d'un obturateur de confidentialité. La qualité de l'image est étrangement plus chaude que prévu par rapport aux webcams de la plupart des autres ordinateurs portables.
Maintenance
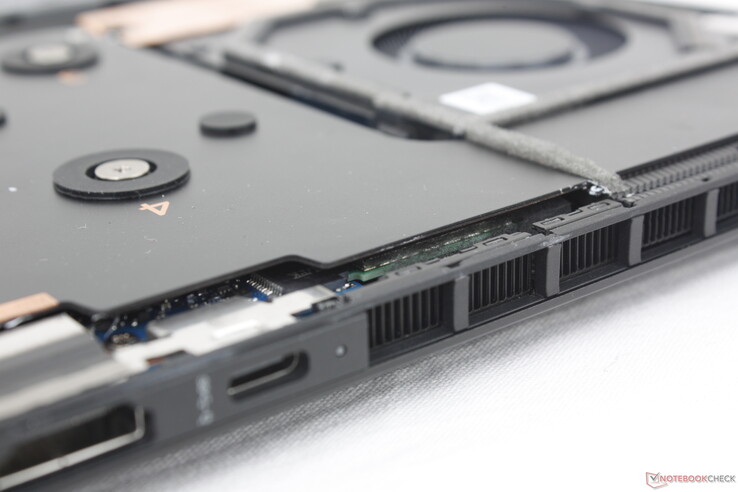
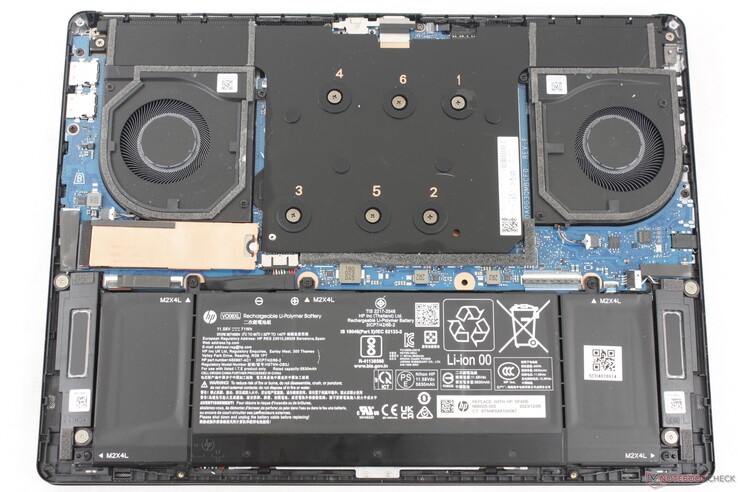
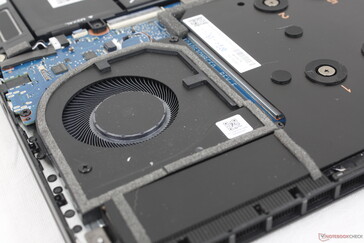
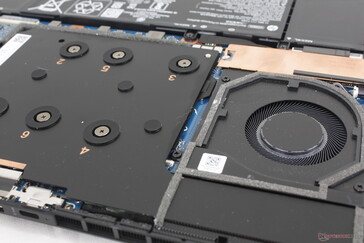
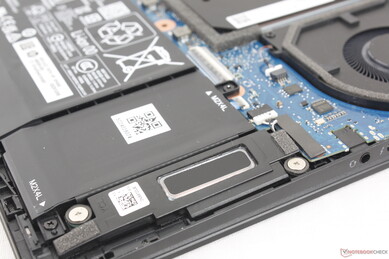
Le panneau inférieur est fixé par seulement quatre petites vis Phillips pour un entretien relativement facile. Cependant, le panneau est à la fois solidement fixé et tranchant sur les bords. Nous vous recommandons donc d'utiliser un bord en plastique, comme une carte de crédit, pour retirer le panneau inférieur.
Accessoires et garantie
Certaines configurations incluent un casque sans fil HyperX Cloud III. Sinon, les acheteurs peuvent s'attendre à la documentation habituelle et à l'adaptateur secteur.
La garantie limitée standard d'un an du fabricant s'applique si vous l'achetez aux États-Unis.
Périphériques d'entrée - Grands et colorés
Clavier
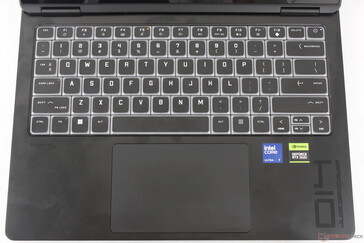
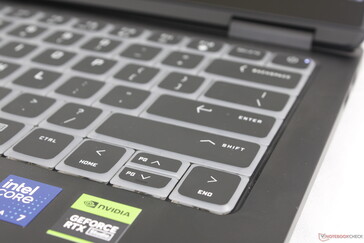
Le modèle utilise un clavier sans treillis, contrairement aux claviers chiclet de la plupart des autres ordinateurs portables. Cette approche permet d'avoir des touches plus grandes et plus translucides sur le pourtour afin de maximiser l'effet RVB lorsque le rétroéclairage est actif. C'est un changement visuellement satisfaisant qui aide à distinguer l'Omen Transcend 14 de ses concurrents et même des autres ordinateurs portables de jeu Omen.
La frappe est plus nette et moins spongieuse que sur le Blade 14, mais les bruits de frappe sont un peu plus vifs et bruyants. La course des touches reste très faible, ce qui est une conséquence de la finesse du châssis.
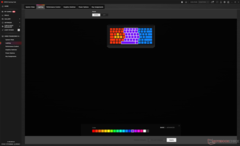
Notez que le rétroéclairage du clavier est limité à quatre zones distinctes car l'éclairage RVB par touche n'est pas pris en charge.
Pavé tactile
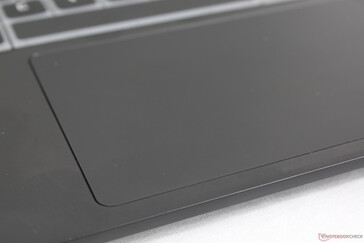
Le pavé tactile est plus petit que celui du Blade 14 (12,5 x 8 cm contre 15 x 8,5 cm) mais reste spacieux pour un écran de 14 pouces. La glisse est fluide à des vitesses moyennes à élevées, avec une certaine adhérence à des vitesses plus faibles pour des clics ou des actions plus précis.
Cependant, la course lors de l'appui sur le pavé tactile est assez faible, comme on peut s'y attendre. Le retour d'information est suffisant et ne sort pas de l'ordinaire de votre Ultrabook typique.
Affichage - Similaire à Zephyrus G14
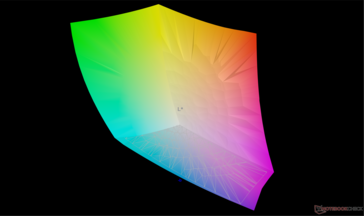
Notre HP utilise un panneau OLED Samsung similaire à celui que l'on trouve sur le 2024 Zephyrus G14. Tous deux supportent le HDR500, un taux de rafraîchissement natif de 120 Hz, des couleurs P3, et la même résolution native de 1800p. L'expérience visuelle entre les deux modèles est donc essentiellement la même, malgré le prix de départ beaucoup plus élevé de l'Asus. Il est intéressant de noter que le Blade 14 est le seul modèle des trois à ne pas avoir de configuration OLED ou HDR.
La luminosité maximale de 500 nits ne peut être atteinte que lorsque le HDR est activé et que le contenu prend en charge le HDR. Dans le cas contraire, le contenu SDR normal est limité à un peu moins de 400 nits.
L'écran OLED est l'un des rares à prendre en charge le taux de rafraîchissement dynamique de Windows entre 60 Hz et 120 Hz. Malheureusement, le VRR dans les jeux (G-Sync ou FreeSync) n'est pas pris en charge.
| |||||||||||||||||||||||||
Homogénéité de la luminosité: 98 %
Valeur mesurée au centre, sur batterie: 386.3 cd/m²
Contraste: ∞:1 (Valeurs des noirs: 0 cd/m²)
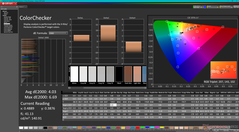
ΔE ColorChecker Calman: 4.03 | ∀{0.5-29.43 Ø4.76}
calibrated: 1.07
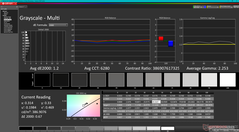
ΔE Greyscale Calman: 1.2 | ∀{0.09-98 Ø5}
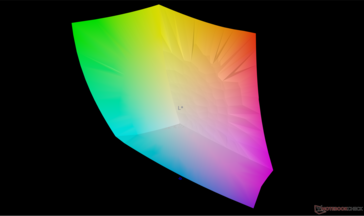
96.1% AdobeRGB 1998 (Argyll 3D)
100% sRGB (Argyll 3D)
99.6% Display P3 (Argyll 3D)
Gamma: 2.25
CCT: 6280 K
| HP Omen Transcend 14-fb0014 Samsung SDC4197, OLED, 2880x1800, 14" | Asus ROG Zephyrus G14 2024 GA403U ATNA40CU05-0, OLED, 2880x1800, 14" | Razer Blade 14 RZ09-0508 TL140ADXP04-0, IPS, 2560x1600, 14" | Lenovo Legion Slim 5 14APH8 Samsung SDC ATNA45AF02-2, OLED, 2880x1600, 14.5" | Apple MacBook Pro 14 2023 M3 Max Mini-LED, 3024x1964, 14.2" | Microsoft Surface Laptop Studio 2 RTX 4060 LQ144P1JX01, IPS, 2400x1600, 14.4" | |
|---|---|---|---|---|---|---|
| Display | -2% | -5% | 0% | 0% | -21% | |
| Display P3 Coverage (%) | 99.6 | 99.6 0% | 96.9 -3% | 99.9 0% | 99.2 0% | 66.7 -33% |
| sRGB Coverage (%) | 100 | 100 0% | 99.8 0% | 100 0% | 99 -1% | |
| AdobeRGB 1998 Coverage (%) | 96.1 | 89.9 -6% | 85 -12% | 96.5 0% | 68.9 -28% | |
| Response Times | 30% | -668% | 3% | -8578% | -6144% | |
| Response Time Grey 50% / Grey 80% * (ms) | 0.86 ? | 0.62 ? 28% | 6 ? -598% | 0.79 ? 8% | 80.8 ? -9295% | 77.6 ? -8923% |
| Response Time Black / White * (ms) | 0.99 ? | 0.68 ? 31% | 8.3 ? -738% | 1.01 ? -2% | 78.8 ? -7860% | 34.3 ? -3365% |
| PWM Frequency (Hz) | 479 ? | 960 ? | 240.5 ? | 14878 ? | 17600 ? | |
| Screen | 35% | 16% | 1% | 27% | 43% | |
| Brightness middle (cd/m²) | 386.3 | 423 10% | 484.1 25% | 377.5 -2% | 610 58% | 511 32% |
| Brightness (cd/m²) | 389 | 424 9% | 466 20% | 381 -2% | 600 54% | 503 29% |
| Brightness Distribution (%) | 98 | 98 0% | 89 -9% | 97 -1% | 96 -2% | 89 -9% |
| Black Level * (cd/m²) | 0.01 | 0.38 | 0.26 | |||
| Colorchecker dE 2000 * | 4.03 | 0.7 83% | 2.23 45% | 4.19 -4% | 1.7 58% | 0.5 88% |
| Colorchecker dE 2000 max. * | 6.69 | 1.8 73% | 4.57 32% | 7.02 -5% | 2.3 66% | 1.1 84% |
| Colorchecker dE 2000 calibrated * | 1.07 | 0.74 31% | 0.81 24% | |||
| Greyscale dE 2000 * | 1.2 | 0.8 33% | 1.6 -33% | 1.2 -0% | 2.1 -75% | 0.8 33% |
| Gamma | 2.25 98% | 2.18 101% | 2.24 98% | 2.22 99% | 2.22 99% | 2.19 100% |
| CCT | 6280 104% | 6505 100% | 6816 95% | 6296 103% | 6874 95% | 6650 98% |
| Contrast (:1) | 42300 | 1274 | 1965 | |||
| Moyenne finale (programmes/paramètres) | 21% /
24% | -219% /
-103% | 1% /
1% | -2850% /
-1888% | -2041% /
-1099% |
* ... Moindre est la valeur, meilleures sont les performances
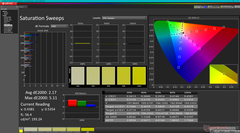
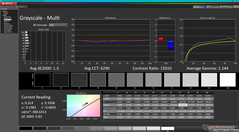
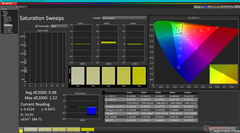
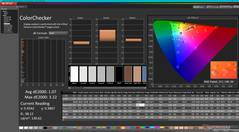
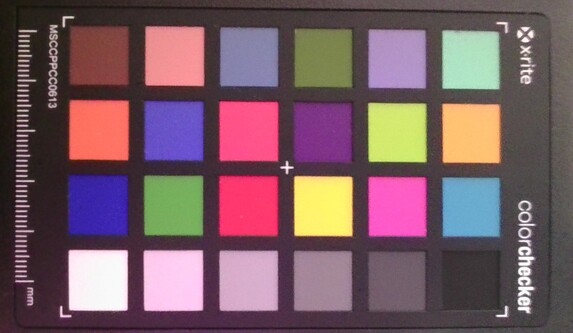
L'écran est pré-calibré par rapport à la norme P3 avec une excellente valeur moyenne de deltaE en niveaux de gris de seulement 1,2, tandis que le deltaE moyen en couleur est légèrement plus élevé, à 4,03. Notre colorimètre X-Rite nous permet d'abaisser la moyenne des couleurs à 1,07 et notre profil ICM calibré peut être téléchargé gratuitement ci-dessus. Un étalonnage par l'utilisateur final n'est cependant pas nécessaire pour la grande majorité des utilisateurs.
Temps de réponse de l'écran
| ↔ Temps de réponse noir à blanc | ||
|---|---|---|
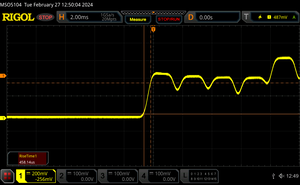
| 0.99 ms ... hausse ↗ et chute ↘ combinées | ↗ 0.46 ms hausse | |
| ↘ 0.53 ms chute | ||
| L'écran montre de très faibles temps de réponse, parfait pour le jeu. En comparaison, tous les appareils testés affichent entre 0.1 (minimum) et 240 (maximum) ms. » 3 % des appareils testés affichent de meilleures performances. Cela signifie que les latences relevées sont meilleures que la moyenne (20.1 ms) de tous les appareils testés. | ||
| ↔ Temps de réponse gris 50% à gris 80% | ||
| 0.86 ms ... hausse ↗ et chute ↘ combinées | ↗ 0.45 ms hausse | |
| ↘ 0.41 ms chute | ||
| L'écran montre de très faibles temps de réponse, parfait pour le jeu. En comparaison, tous les appareils testés affichent entre 0.165 (minimum) et 636 (maximum) ms. » 3 % des appareils testés affichent de meilleures performances. Cela signifie que les latences relevées sont meilleures que la moyenne (31.5 ms) de tous les appareils testés. | ||
Scintillement / MLI (Modulation de largeur d'impulsion)
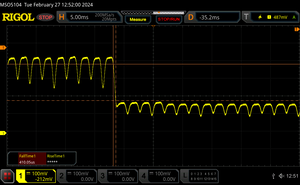
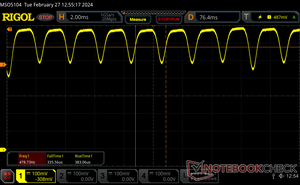
| Scintillement / MLI (Modulation de largeur d'impulsion) décelé | 479 Hz | ≤ 100 Niveau de luminosité | |
Le rétroéclairage de l'écran scintille à la fréquence de 479 Hz (certainement du fait de l'utilisation d'une MDI - Modulation de largeur d'impulsion) à un niveau de luminosité inférieur ou égal à 100 % . Aucun scintillement ne devrait être perceptible au-dessus de cette valeur. La fréquence de rafraîchissement de 479 Hz est relativement élevée, la grande majorité des utilisateurs ne devrait pas percevLa fréquence de rafraîchissement de 479 Hz est relativement élevée, la grande majorité des utilisateurs ne devrait pas percevoir de scintillements et être sujette à une fatigue oculaire accrue.oir de scintillements et être sujette à une fatigue oculaire accrue. Néanmoins certaines personnes pourront toujours percevoir un scintillement. En comparaison, 53 % des appareils testés n'emploient pas MDI pour assombrir leur écran. Nous avons relevé une moyenne à 8036 (minimum : 5 - maximum : 343500) Hz dans le cas où une MDI était active. | |||
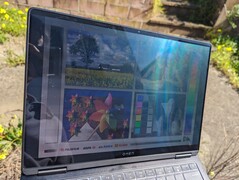
La visibilité en extérieur est à peu près comparable à celle du Zephyrus G14, mais moins bonne que celle du Blade 14, car ce dernier utilise un panneau mat et un écran plus lumineux pour réduire les reflets. Le système est certes compact et facile à manipuler en extérieur, mais l'écran réfléchissant n'a pas été conçu pour un éclairage ambiant aussi intense.
Angles de vue : décrivez les angles de vue dans la pratique (important pour l'utilisation mobile, utilisation sur les genoux ?!,...) Ajoutez une composition de photos pour la comparaison (image de référence NBC, luminosité maximale de l'écran, pièce sombre, même ouverture et même vitesse d'obturation pour toutes les photos, pas de 45° dans toutes les directions)
Performance - Meteor Lake + Ada Lovelace
Conditions d'essai
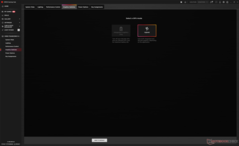
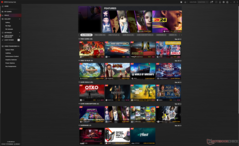
Nous avons réglé Windows et Omen Gaming Hub en mode Performance avec le mode Max Fan actif avant de lancer les benchmarks ci-dessous. Nous recommandons aux propriétaires de se familiariser avec Omen Gaming Hub, car c'est là que se trouvent les principaux paramètres, notamment les données vitales du système en temps réel, l'éclairage, les profils d'alimentation et de ventilation, ainsi que le sélecteur graphique. Le logiciel intègre également une boutique numérique avec les jeux, ce qui peut rendre l'expérience compliquée si tout ce que vous voulez faire est de basculer un simple paramètre. Par exemple, les importants profils d'alimentation et de ventilation sont enfouis dans des sous-menus nécessitant trois clics de souris distincts. L'écran d'accueil du logiciel n'est pas très personnalisable et les publicités sont toujours au centre de l'écran.
Le MUX n'est pas pris en charge ; le système ne peut basculer qu'entre le mode iGPU et le mode hybride (Optimus), sans option dGPU. Un redémarrage est nécessaire pour passer d'un mode à l'autre. HP indique qu'un commutateur MUX a été envisagé, mais que le gain de performance serait très minime par rapport à l'augmentation de la consommation d'énergie. DirectX Cross Adapter Scan-Out (CASO) permet d'augmenter les performances en mode Optimus afin de se rapprocher du mode MUX.
Processeur
Les performances brutes du processeur sont essentiellement identiques à celles du Core i7-13700H que notre Core Ultra 7 155H remplace. Le Core i7-13700H n'est pas lent, loin de là, puisqu'on le trouve sur des ordinateurs portables de jeu de plus grande taille comme le Victus 16mais il peut néanmoins être considéré comme un pas de côté pour les chasseurs de performances.
Le principal attrait de ce nouveau processeur est son NPU intégré qui permet d'accélérer les tâches d'intelligence artificielle telles que Microsoft Copilot ou les fonctions liées à la webcam pour les vidéoconférences. La dernière application à tirer parti du NPU est OpenVINO, qui sera bientôt en mesure de décharger les tâches de streaming vidéo du CPU ou du GPU vers le NPU et d'améliorer ainsi les taux de rafraîchissement moyens de 25 à 35 %. Malgré cela, les applications NPU actuelles sont extrêmement limitées et ne s'appliquent pas à la grande majorité des utilisateurs. Copilot, par exemple, est encore entièrement basé sur le cloud à l'heure où nous écrivons ces lignes, et les fonctions OpenVINO ne sont d'aucune utilité si vous n'êtes pas un streamer. On s'attend à ce que davantage d'applications exploitent le NPU à l'horizon 2025 et au-delà.
La durabilité des performances est excellente, avec des résultats très proches de ceux de la Ryzen 9 8945HS ou du Ryzen 7 7840HS dans le Legion Slim 5 14 ou Blade 14, respectivement.
Cinebench R15 Multi Loop
Cinebench R23: Multi Core | Single Core
Cinebench R20: CPU (Multi Core) | CPU (Single Core)
Cinebench R15: CPU Multi 64Bit | CPU Single 64Bit
Blender: v2.79 BMW27 CPU
7-Zip 18.03: 7z b 4 | 7z b 4 -mmt1
Geekbench 6.5: Multi-Core | Single-Core
Geekbench 5.5: Multi-Core | Single-Core
HWBOT x265 Benchmark v2.2: 4k Preset
LibreOffice : 20 Documents To PDF
R Benchmark 2.5: Overall mean
* ... Moindre est la valeur, meilleures sont les performances
AIDA64: FP32 Ray-Trace | FPU Julia | CPU SHA3 | CPU Queen | FPU SinJulia | FPU Mandel | CPU AES | CPU ZLib | FP64 Ray-Trace | CPU PhotoWorxx
| Performance rating | |
| Razer Blade 14 RZ09-0508 | |
| Asus ROG Zephyrus G14 2024 GA403U | |
| Lenovo Legion Slim 5 14APH8 | |
| HP Omen Transcend 14-fb0014 | |
| Moyenne Intel Core Ultra 7 155H | |
| Microsoft Surface Laptop Studio 2 RTX 4060 | |
| AIDA64 / FP32 Ray-Trace | |
| Lenovo Legion Slim 5 14APH8 | |
| Razer Blade 14 RZ09-0508 | |
| Asus ROG Zephyrus G14 2024 GA403U | |
| HP Omen Transcend 14-fb0014 | |
| Moyenne Intel Core Ultra 7 155H (6670 - 18470, n=50) | |
| Microsoft Surface Laptop Studio 2 RTX 4060 | |
| AIDA64 / FPU Julia | |
| Lenovo Legion Slim 5 14APH8 | |
| Razer Blade 14 RZ09-0508 | |
| Asus ROG Zephyrus G14 2024 GA403U | |
| HP Omen Transcend 14-fb0014 | |
| Microsoft Surface Laptop Studio 2 RTX 4060 | |
| Moyenne Intel Core Ultra 7 155H (40905 - 93181, n=50) | |
| AIDA64 / CPU SHA3 | |
| Razer Blade 14 RZ09-0508 | |
| Lenovo Legion Slim 5 14APH8 | |
| Asus ROG Zephyrus G14 2024 GA403U | |
| HP Omen Transcend 14-fb0014 | |
| Moyenne Intel Core Ultra 7 155H (1940 - 4436, n=50) | |
| Microsoft Surface Laptop Studio 2 RTX 4060 | |
| AIDA64 / CPU Queen | |
| Razer Blade 14 RZ09-0508 | |
| Lenovo Legion Slim 5 14APH8 | |
| Asus ROG Zephyrus G14 2024 GA403U | |
| Microsoft Surface Laptop Studio 2 RTX 4060 | |
| HP Omen Transcend 14-fb0014 | |
| Moyenne Intel Core Ultra 7 155H (64698 - 94181, n=50) | |
| AIDA64 / FPU SinJulia | |
| Razer Blade 14 RZ09-0508 | |
| Asus ROG Zephyrus G14 2024 GA403U | |
| Lenovo Legion Slim 5 14APH8 | |
| HP Omen Transcend 14-fb0014 | |
| Moyenne Intel Core Ultra 7 155H (5639 - 10647, n=50) | |
| Microsoft Surface Laptop Studio 2 RTX 4060 | |
| AIDA64 / FPU Mandel | |
| Razer Blade 14 RZ09-0508 | |
| Lenovo Legion Slim 5 14APH8 | |
| Asus ROG Zephyrus G14 2024 GA403U | |
| HP Omen Transcend 14-fb0014 | |
| Moyenne Intel Core Ultra 7 155H (18236 - 47685, n=50) | |
| Microsoft Surface Laptop Studio 2 RTX 4060 | |
| AIDA64 / CPU AES | |
| Razer Blade 14 RZ09-0508 | |
| Asus ROG Zephyrus G14 2024 GA403U | |
| Moyenne Intel Core Ultra 7 155H (45713 - 152179, n=50) | |
| HP Omen Transcend 14-fb0014 | |
| Lenovo Legion Slim 5 14APH8 | |
| Microsoft Surface Laptop Studio 2 RTX 4060 | |
| AIDA64 / CPU ZLib | |
| Razer Blade 14 RZ09-0508 | |
| Lenovo Legion Slim 5 14APH8 | |
| Asus ROG Zephyrus G14 2024 GA403U | |
| HP Omen Transcend 14-fb0014 | |
| Moyenne Intel Core Ultra 7 155H (557 - 1250, n=50) | |
| Microsoft Surface Laptop Studio 2 RTX 4060 | |
| AIDA64 / FP64 Ray-Trace | |
| Razer Blade 14 RZ09-0508 | |
| Lenovo Legion Slim 5 14APH8 | |
| Asus ROG Zephyrus G14 2024 GA403U | |
| HP Omen Transcend 14-fb0014 | |
| Microsoft Surface Laptop Studio 2 RTX 4060 | |
| Moyenne Intel Core Ultra 7 155H (3569 - 9802, n=50) | |
| AIDA64 / CPU PhotoWorxx | |
| HP Omen Transcend 14-fb0014 | |
| Moyenne Intel Core Ultra 7 155H (32719 - 54223, n=50) | |
| Microsoft Surface Laptop Studio 2 RTX 4060 | |
| Razer Blade 14 RZ09-0508 | |
| Asus ROG Zephyrus G14 2024 GA403U | |
| Lenovo Legion Slim 5 14APH8 | |
Test de stress
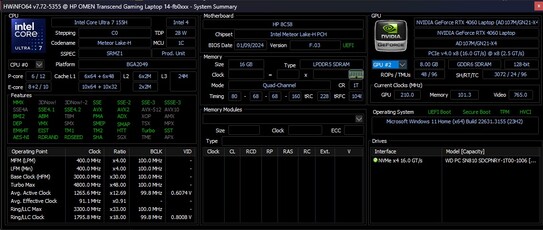
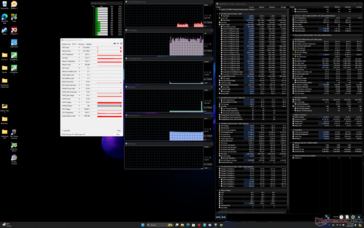
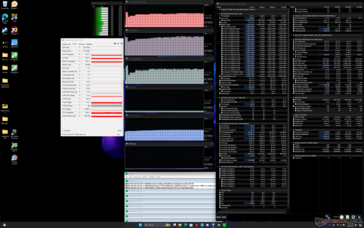
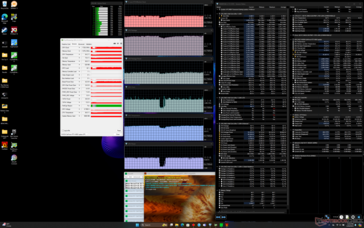
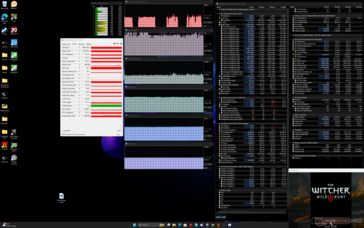
Lors de l'initialisation du stress Prime95, le CPU a atteint 3,3 GHz, 83 W et 98 C pendant les premières secondes avant de retomber et de se stabiliser à 3,0 GHz, 65 W et 71 C. HWiNFO rapporte des différences de température importantes et erratiques entre les capteurs DTS et Enhanced, mais les deux sont tout de même fournis dans les captures d'écran ci-dessous. Quoi qu'il en soit, le processeur peut maintenir des vitesses Turbo Boost décentes malgré sa petite taille et son poids léger pour rivaliser avec le Ryzen 9 8945HS.
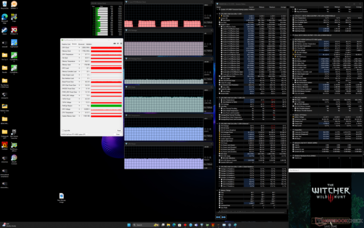
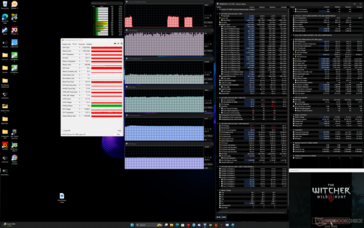
Fonctionnement Witcher 3 en mode Performance avec Max Fan activé et Max Fan désactivé ne montre pas de différences majeures entre eux puisque même leurs valeurs TGP restent essentiellement les mêmes. Il n'est donc pas nécessaire d'activer le ventilateur Max pour obtenir les meilleures performances du système dans les jeux. Ces résultats s'alignent sur ceux de notre site Fire Strike dans la section Performances du GPU ci-dessous. Le passage en mode équilibré a toutefois un léger impact sur les performances, le TGP passant de 50 W à 46 W.
Bien que HP annonce un TGP de 50 W avec un boost dynamique supplémentaire de 15 W, la puissance du GPU plafonne toujours à 50 W selon HWiNFO, quel que soit le jeu. En comparaison, le même GPU RTX 4060 dans le Legion Slim 5 14 atteindrait 98 W.
| Horloge du CPU (GHz) | Horloge du GPU (MHz) | Température moyenne du CPU (°C) | Température moyenne du GPU (°C) | |
| Système en veille | -- | -- | 46 | 39 |
| Stress Prime95 | 2.9 - 3.0 | -- | 84 | 48 |
| Prime95 + FurMark Stress | 2.4 - 2.5 | 570 - 1680 | 86 | 52 - 65 |
| Witcher 3 Stress (Performance mode w/ Max Fan off) | ~2.0 | 2100 | 77+ | 63 |
| Witcher 3 Stress (mode performance avec ventilateur maximal activé) | ~2.0 | 1995 | ~97 | 61 |
Performance du système
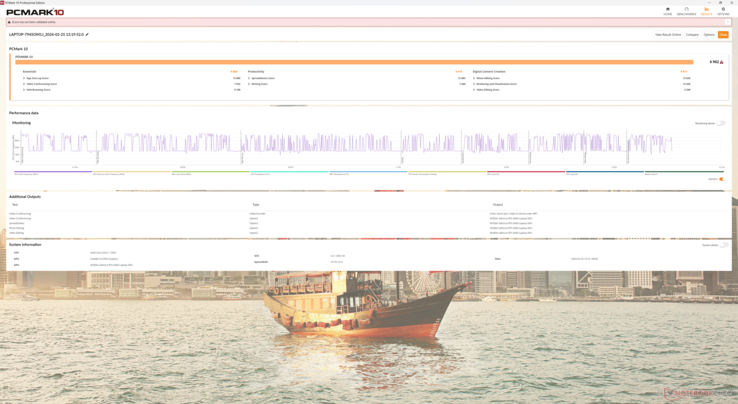
Les scores PCMark 10 sont légèrement inférieurs à ceux de concurrents comme le Surface Laptop Studio 2 ou Lenovo Legion Slim 5 14, en partie à cause des objectifs TGP plus bas de notre Omen Transcend 14. Cependant, il faut noter que le modèle HP intègre une RAM LPDDR5x très rapide de 7467 MHz alors que la RAM sur la plupart des autres ordinateurs portables fonctionne à 6400 MHz ou plus lentement. Les résultats des tests de mémoire AIDA sont donc nettement plus rapides que ceux des systèmes concurrents de 14 pouces.
CrossMark: Overall | Productivity | Creativity | Responsiveness
WebXPRT 3: Overall
WebXPRT 4: Overall
Mozilla Kraken 1.1: Total
| PCMark 10 / Score | |
| Razer Blade 14 RZ09-0508 | |
| Lenovo Legion Slim 5 14APH8 | |
| Asus ROG Zephyrus G14 2024 GA403U | |
| Microsoft Surface Laptop Studio 2 RTX 4060 | |
| Moyenne Intel Core Ultra 7 155H, NVIDIA GeForce RTX 4060 Laptop GPU (6751 - 7370, n=5) | |
| HP Omen Transcend 14-fb0014 | |
| PCMark 10 / Essentials | |
| Razer Blade 14 RZ09-0508 | |
| Lenovo Legion Slim 5 14APH8 | |
| Microsoft Surface Laptop Studio 2 RTX 4060 | |
| Moyenne Intel Core Ultra 7 155H, NVIDIA GeForce RTX 4060 Laptop GPU (9476 - 10446, n=5) | |
| Asus ROG Zephyrus G14 2024 GA403U | |
| HP Omen Transcend 14-fb0014 | |
| PCMark 10 / Productivity | |
| Razer Blade 14 RZ09-0508 | |
| Lenovo Legion Slim 5 14APH8 | |
| Asus ROG Zephyrus G14 2024 GA403U | |
| HP Omen Transcend 14-fb0014 | |
| Microsoft Surface Laptop Studio 2 RTX 4060 | |
| Moyenne Intel Core Ultra 7 155H, NVIDIA GeForce RTX 4060 Laptop GPU (8079 - 9477, n=5) | |
| PCMark 10 / Digital Content Creation | |
| Razer Blade 14 RZ09-0508 | |
| Lenovo Legion Slim 5 14APH8 | |
| Asus ROG Zephyrus G14 2024 GA403U | |
| Microsoft Surface Laptop Studio 2 RTX 4060 | |
| Moyenne Intel Core Ultra 7 155H, NVIDIA GeForce RTX 4060 Laptop GPU (9811 - 11620, n=5) | |
| HP Omen Transcend 14-fb0014 | |
| CrossMark / Overall | |
| Apple MacBook Pro 14 2023 M3 Pro | |
| Lenovo Legion Slim 5 14APH8 | |
| Razer Blade 14 RZ09-0508 | |
| Asus ROG Zephyrus G14 2024 GA403U | |
| Microsoft Surface Laptop Studio 2 RTX 4060 | |
| Moyenne Intel Core Ultra 7 155H, NVIDIA GeForce RTX 4060 Laptop GPU (1540 - 1746, n=5) | |
| HP Omen Transcend 14-fb0014 | |
| CrossMark / Productivity | |
| Lenovo Legion Slim 5 14APH8 | |
| Apple MacBook Pro 14 2023 M3 Pro | |
| Razer Blade 14 RZ09-0508 | |
| Asus ROG Zephyrus G14 2024 GA403U | |
| Microsoft Surface Laptop Studio 2 RTX 4060 | |
| Moyenne Intel Core Ultra 7 155H, NVIDIA GeForce RTX 4060 Laptop GPU (1436 - 1684, n=5) | |
| HP Omen Transcend 14-fb0014 | |
| CrossMark / Creativity | |
| Apple MacBook Pro 14 2023 M3 Pro | |
| Microsoft Surface Laptop Studio 2 RTX 4060 | |
| Asus ROG Zephyrus G14 2024 GA403U | |
| Lenovo Legion Slim 5 14APH8 | |
| Razer Blade 14 RZ09-0508 | |
| Moyenne Intel Core Ultra 7 155H, NVIDIA GeForce RTX 4060 Laptop GPU (1811 - 1929, n=5) | |
| HP Omen Transcend 14-fb0014 | |
| CrossMark / Responsiveness | |
| Lenovo Legion Slim 5 14APH8 | |
| Razer Blade 14 RZ09-0508 | |
| Asus ROG Zephyrus G14 2024 GA403U | |
| Apple MacBook Pro 14 2023 M3 Pro | |
| Moyenne Intel Core Ultra 7 155H, NVIDIA GeForce RTX 4060 Laptop GPU (1165 - 1631, n=5) | |
| Microsoft Surface Laptop Studio 2 RTX 4060 | |
| HP Omen Transcend 14-fb0014 | |
| WebXPRT 3 / Overall | |
| Apple MacBook Pro 14 2023 M3 Pro | |
| Razer Blade 14 RZ09-0508 | |
| Lenovo Legion Slim 5 14APH8 | |
| Microsoft Surface Laptop Studio 2 RTX 4060 | |
| Asus ROG Zephyrus G14 2024 GA403U | |
| Moyenne Intel Core Ultra 7 155H, NVIDIA GeForce RTX 4060 Laptop GPU (274 - 290, n=5) | |
| HP Omen Transcend 14-fb0014 | |
| WebXPRT 4 / Overall | |
| Microsoft Surface Laptop Studio 2 RTX 4060 | |
| Razer Blade 14 RZ09-0508 | |
| Lenovo Legion Slim 5 14APH8 | |
| Moyenne Intel Core Ultra 7 155H, NVIDIA GeForce RTX 4060 Laptop GPU (236 - 262, n=5) | |
| Asus ROG Zephyrus G14 2024 GA403U | |
| HP Omen Transcend 14-fb0014 | |
| Mozilla Kraken 1.1 / Total | |
| HP Omen Transcend 14-fb0014 | |
| Moyenne Intel Core Ultra 7 155H, NVIDIA GeForce RTX 4060 Laptop GPU (519 - 585, n=5) | |
| Asus ROG Zephyrus G14 2024 GA403U | |
| Lenovo Legion Slim 5 14APH8 | |
| Microsoft Surface Laptop Studio 2 RTX 4060 | |
| Razer Blade 14 RZ09-0508 | |
| Apple MacBook Pro 14 2023 M3 Pro | |
* ... Moindre est la valeur, meilleures sont les performances
| PCMark 10 Score | 6962 points | |
Aide | ||
| AIDA64 / Memory Copy | |
| HP Omen Transcend 14-fb0014 | |
| Moyenne Intel Core Ultra 7 155H (62397 - 96791, n=50) | |
| Lenovo Legion Slim 5 14APH8 | |
| Asus ROG Zephyrus G14 2024 GA403U | |
| Razer Blade 14 RZ09-0508 | |
| Microsoft Surface Laptop Studio 2 RTX 4060 | |
| AIDA64 / Memory Read | |
| HP Omen Transcend 14-fb0014 | |
| Moyenne Intel Core Ultra 7 155H (60544 - 90647, n=50) | |
| Microsoft Surface Laptop Studio 2 RTX 4060 | |
| Razer Blade 14 RZ09-0508 | |
| Lenovo Legion Slim 5 14APH8 | |
| Asus ROG Zephyrus G14 2024 GA403U | |
| AIDA64 / Memory Write | |
| Asus ROG Zephyrus G14 2024 GA403U | |
| Lenovo Legion Slim 5 14APH8 | |
| Razer Blade 14 RZ09-0508 | |
| HP Omen Transcend 14-fb0014 | |
| Microsoft Surface Laptop Studio 2 RTX 4060 | |
| Moyenne Intel Core Ultra 7 155H (58692 - 93451, n=50) | |
| AIDA64 / Memory Latency | |
| HP Omen Transcend 14-fb0014 | |
| Moyenne Intel Core Ultra 7 155H (116.2 - 233, n=50) | |
| Lenovo Legion Slim 5 14APH8 | |
| Asus ROG Zephyrus G14 2024 GA403U | |
| Razer Blade 14 RZ09-0508 | |
| Microsoft Surface Laptop Studio 2 RTX 4060 | |
* ... Moindre est la valeur, meilleures sont les performances
Latence DPC
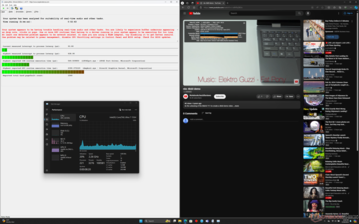
LatencyMon révèle de légers problèmes de DPC lors de l'ouverture de plusieurs onglets de notre page d'accueil. la lecture de vidéos 4K à 60 FPS est par ailleurs parfaite, avec seulement deux images perdues enregistrées à la fin de la vidéo lors du lancement de l'outil Microsoft Snippet.
| DPC Latencies / LatencyMon - interrupt to process latency (max), Web, Youtube, Prime95 | |
| Microsoft Surface Laptop Studio 2 RTX 4060 | |
| Lenovo Legion Slim 5 14APH8 | |
| Razer Blade 14 RZ09-0508 | |
| HP Omen Transcend 14-fb0014 | |
| Asus ROG Zephyrus G14 2024 GA403U | |
* ... Moindre est la valeur, meilleures sont les performances
Dispositifs de stockage
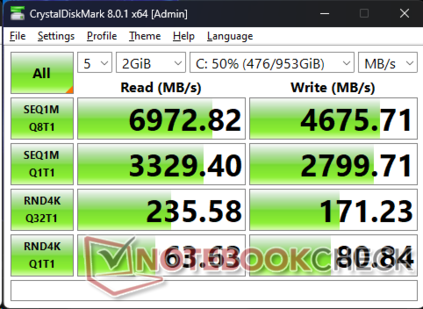
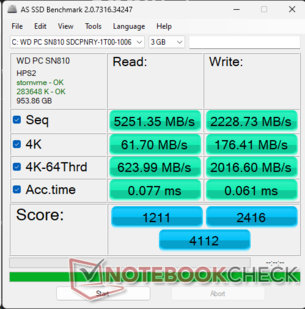
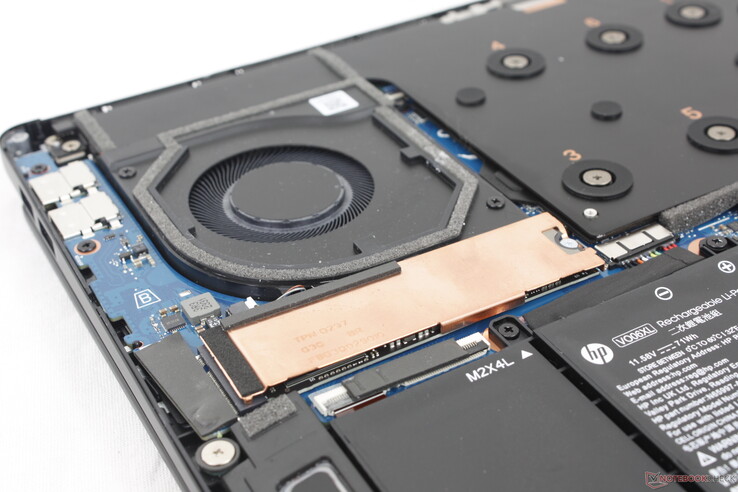
Notre unité est livrée avec un disque dur de 1 TB WDC PC SN810 PCIe4 x4 NVMe SSD sans espace pour une option secondaire. Les taux de transfert maximum sont stables à ~7000 Mo/s lorsque DiskSpd est exécuté en boucle, ce qui suggère qu'il n'y a pas de problèmes majeurs d'étranglement.
| Drive Performance rating - Percent | |
| Lenovo Legion Slim 5 14APH8 | |
| Razer Blade 14 RZ09-0508 | |
| Microsoft Surface Laptop Studio 2 RTX 4060 | |
| HP Omen Transcend 14-fb0014 | |
| Asus ROG Zephyrus G14 2024 GA403U | |
* ... Moindre est la valeur, meilleures sont les performances
Disk Throttling: DiskSpd Read Loop, Queue Depth 8
Performance GPU - 50 W GeForce RTX Graphics
L'Omen Transcend 14 est l'un des rares ordinateurs portables fonctionnant avec un TGP de 50 W. Il est équipé d'une carte mémoire de type RTX GeForce RTX 4060 avec un Dynamic Boost supplémentaire de 15 W (50 W + 15 W). Ainsi, même si notre modèle dispose des mêmes options de GPU que le Blade 14, le Legion Slim 5 14 ou le 2024 Zephyrus G14, ces alternatives les font tourner à des TGP beaucoup plus élevés pour plus de performance. Par exemple, le système Lenovo offre des performances graphiques de 30 à 35 % supérieures à celles de notre HP parce que sa RTX 4060 vise un TGP de 105 W. Même le Yoga Pro 9 avec la RTX 4050 peut rivaliser avec notre RTX 4060 à bien des égards.
L'accélération CUDA pour le rendu sur Blender est seulement 10% plus lente que la moyenne des ordinateurs portables RTX 4060 dans notre base de données, ce qui est un delta beaucoup plus petit que les différences 3DMark mentionnées ci-dessus. Ainsi, le système HP peut être une meilleure machine d'édition et de création de contenu plutôt qu'une machine de jeu pure.
En passant à la RTX 4070 devrait augmenter les performances de 10 à 15 % seulement, tandis que le passage à la RTX 4050 devrait les diminuer de 15 à 20 %.
| Profil de puissance | Score graphique | Score physique | Score combiné |
| Mode performance avec ventilateur maximal activé | 20867 | 26559 | 9624 |
| Mode performance avec ventilateur maximal désactivé | 20566 (-1%) | 26455 (-0%) | 9526 (-1%) |
| Mode équilibré | 19100 (-9%) | 25431 (-4%) | 7277 (-24%) |
| Alimentation par batterie | 18522 (-11%) | 24240 (-9%) | 7508 (-22%) |
Notez que le mode Max Fan n'a que peu ou pas d'impact sur les performances globales, comme le montre notre tableau de résultats Fire Strike ci-dessus. En revanche, le passage en mode équilibré ou en mode batterie peut avoir un impact plus important sur les performances.
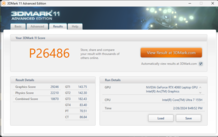
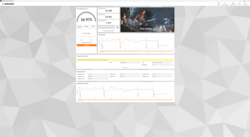
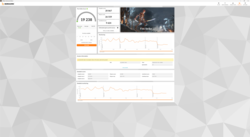
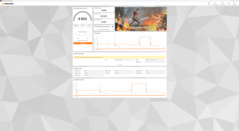
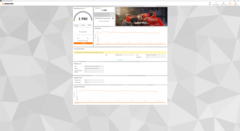
| 3DMark 11 Performance | 26486 points | |
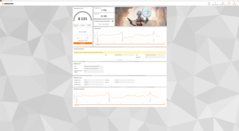
| 3DMark Fire Strike Score | 19238 points | |
| 3DMark Time Spy Score | 8131 points | |
Aide | ||
* ... Moindre est la valeur, meilleures sont les performances
Performances des jeux
Tous les jeux fonctionnent bien sur l'écran 1800p, y compris les titres les plus exigeants comme Cyberpunk 2077 ou Baldur's Gate 3 , malgré les performances plus lentes que d'habitude de la RTX 4060. Cependant, nous vous recommandons de baisser les paramètres à un niveau bas-moyen et d'activer DLSS lorsqu'il est disponible afin d'atteindre un objectif de 60 FPS.
| The Witcher 3 - 1920x1080 Ultra Graphics & Postprocessing (HBAO+) | |
| Razer Blade 14 RZ09-0508 | |
| Lenovo Legion Slim 5 14APH8 | |
| Asus ROG Zephyrus G14 2024 GA403U | |
| Microsoft Surface Laptop Studio 2 RTX 4060 | |
| HP Omen Transcend 14-fb0014 | |
| Apple MacBook Pro 14 2023 M3 Pro | |
| GTA V - 1920x1080 Highest AA:4xMSAA + FX AF:16x | |
| Razer Blade 14 RZ09-0508 | |
| Lenovo Legion Slim 5 14APH8 | |
| HP Omen Transcend 14-fb0014 | |
| Asus ROG Zephyrus G14 2024 GA403U | |
| Microsoft Surface Laptop Studio 2 RTX 4060 | |
| Apple MacBook Pro 14 2023 M3 Pro | |
| Final Fantasy XV Benchmark - 1920x1080 High Quality | |
| Razer Blade 14 RZ09-0508 | |
| Lenovo Legion Slim 5 14APH8 | |
| Asus ROG Zephyrus G14 2024 GA403U | |
| Microsoft Surface Laptop Studio 2 RTX 4060 | |
| HP Omen Transcend 14-fb0014 | |
| Strange Brigade - 1920x1080 ultra AA:ultra AF:16 | |
| Lenovo Legion Slim 5 14APH8 | |
| Asus ROG Zephyrus G14 2024 GA403U | |
| Microsoft Surface Laptop Studio 2 RTX 4060 | |
| HP Omen Transcend 14-fb0014 | |
| Dota 2 Reborn - 1920x1080 ultra (3/3) best looking | |
| Razer Blade 14 RZ09-0508 | |
| Microsoft Surface Laptop Studio 2 RTX 4060 | |
| Lenovo Legion Slim 5 14APH8 | |
| HP Omen Transcend 14-fb0014 | |
| Asus ROG Zephyrus G14 2024 GA403U | |
| X-Plane 11.11 - 1920x1080 high (fps_test=3) | |
| Microsoft Surface Laptop Studio 2 RTX 4060 | |
| Lenovo Legion Slim 5 14APH8 | |
| Asus ROG Zephyrus G14 2024 GA403U | |
| HP Omen Transcend 14-fb0014 | |
| Razer Blade 14 RZ09-0508 | |
Witcher 3 FPS Chart
| Bas | Moyen | Élevé | Ultra | QHD | 4K | |
|---|---|---|---|---|---|---|
| GTA V (2015) | 170.2 | 165.2 | 155.2 | 96.7 | 74 | 68.8 |
| The Witcher 3 (2015) | 340.1 | 261.8 | 149.9 | 80.2 | 50.6 | |
| Dota 2 Reborn (2015) | 149.8 | 134.9 | 129.5 | 121.1 | 106.2 | |
| Final Fantasy XV Benchmark (2018) | 165 | 116 | 83.2 | 60.1 | 32.6 | |
| X-Plane 11.11 (2018) | 116.5 | 102.2 | 79.5 | 68.4 | ||
| Far Cry 5 (2018) | 145 | 121 | 114 | 107 | 80 | 39 |
| Strange Brigade (2018) | 367 | 220 | 173.2 | 151.1 | 102 | 54.5 |
| Tiny Tina's Wonderlands (2022) | 164.4 | 131.5 | 86.6 | 67.5 | 45.3 | 21.9 |
| F1 22 (2022) | 197.8 | 194.8 | 146.4 | 49 | 31 | 14.8 |
| Baldur's Gate 3 (2023) | 104.2 | 85.2 | 76.6 | 73.2 | 48.9 | 24.8 |
| Cyberpunk 2077 (2023) | 103.5 | 77.7 | 65.2 | 56.7 | 32.9 | 13.8 |
Émissions
Bruit du système
Le comportement et le bruit des ventilateurs sont directement liés aux profils d'alimentation du logiciel Omen Gaming Hub. En mode iGPU et avec le profil Balanced, les ventilateurs font un excellent travail en restant silencieux pendant de longues périodes, même pendant la première scène de benchmarks de 3DMark 06. En revanche, en mode dGPU et Performance, le bruit des ventilateurs a tendance à osciller entre 29 et 31 dB(A), quelle que soit la charge à l'écran. Vous devrez vous en tenir au mode iGPU si le silence des ventilateurs est une priorité.
Le bruit du ventilateur pendant les jeux s'établit à 47 dB(A) lorsque le ventilateur maximal est désactivé ou à 52 dB(A) lorsque le ventilateur maximal est activé. Cette plage est comparable à ce que nous avons enregistré sur le Blade 14 ou le Zephyrus G14, ce qui signifie que l'Omen Transcend 14 n'est pas sensiblement plus silencieux lors des jeux, malgré son objectif TGP inférieur.
Degré de la nuisance sonore
| Au repos |
| 24.7 / 24.7 / 24.7 dB(A) |
| Fortement sollicité |
| 25.2 / 52 dB(A) |
 | ||
30 dB silencieux 40 dB(A) audible 50 dB(A) bruyant |
||
min: | ||
| HP Omen Transcend 14-fb0014 GeForce RTX 4060 Laptop GPU, Ultra 7 155H, WDC PC SN810 1TB | Asus ROG Zephyrus G14 2024 GA403U GeForce RTX 4070 Laptop GPU, R9 8945HS, WD PC SN560 SDDPNQE-1T00 | Razer Blade 14 RZ09-0508 GeForce RTX 4070 Laptop GPU, R9 8945HS, Samsung PM9A1 MZVL21T0HCLR | Lenovo Legion Slim 5 14APH8 GeForce RTX 4060 Laptop GPU, R7 7840HS, SK Hynix HFS001TEJ9X115N | Apple MacBook Pro 14 2023 M3 Pro M3 Pro 14-Core GPU, Apple M3 Pro 11-Core, Apple SSD AP0512Z | Microsoft Surface Laptop Studio 2 RTX 4060 GeForce RTX 4060 Laptop GPU, i7-13700H, Kioxia XG8 KXG80ZNV1T02 | |
|---|---|---|---|---|---|---|
| Noise | -8% | -5% | -14% | 9% | -15% | |
| arrêt / environnement * (dB) | 24.5 | 23.9 2% | 24.3 1% | 22.8 7% | 24.1 2% | 23.9 2% |
| Idle Minimum * (dB) | 24.7 | 23.9 3% | 25 -1% | 22.8 8% | 24.1 2% | 23.9 3% |
| Idle Average * (dB) | 24.7 | 23.9 3% | 25 -1% | 27.3 -11% | 24.1 2% | 24.4 1% |
| Idle Maximum * (dB) | 24.7 | 23.9 3% | 25 -1% | 30.7 -24% | 24.1 2% | 26.9 -9% |
| Load Average * (dB) | 25.2 | 46.2 -83% | 33 -31% | 41.6 -65% | 25.1 -0% | 48.5 -92% |
| Witcher 3 ultra * (dB) | 47 | 46.2 2% | 49.5 -5% | 52.8 -12% | 25.1 47% | 51.8 -10% |
| Load Maximum * (dB) | 52 | 46.2 11% | 51.9 -0% | 52.6 -1% | 49.4 5% | 51.8 -0% |
* ... Moindre est la valeur, meilleures sont les performances
Température
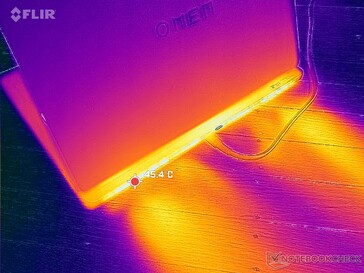
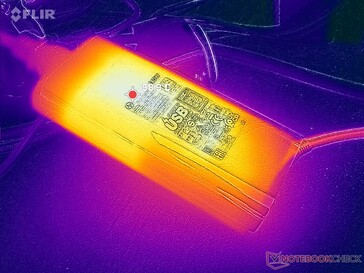
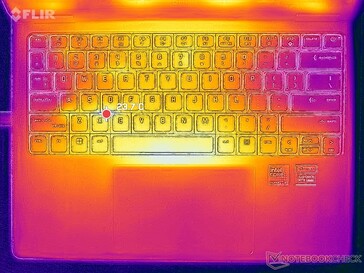
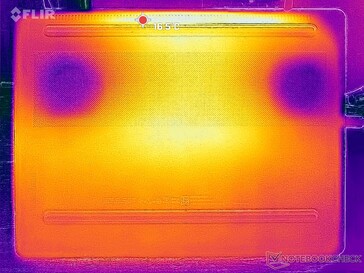
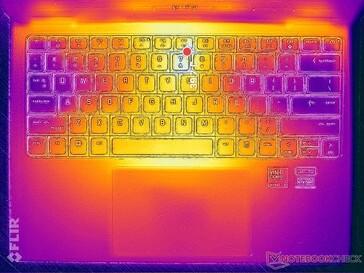
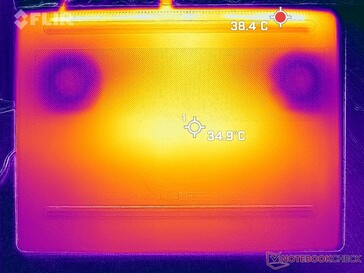
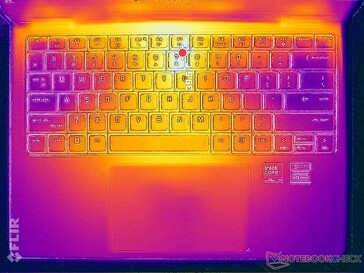
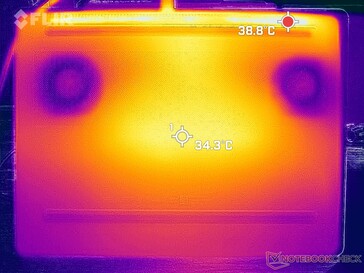
Les températures de surface sont les plus élevées vers le centre du clavier, où les points chauds peuvent atteindre 40°C ou 35°C sur le dessus et le dessous, respectivement. Les températures maximales sont plus basses que ce à quoi nous nous attendions pour un châssis aussi petit que les alternatives comme le Razer Blade 14 ou l'Asus Zephyrus G14 peuvent être plus chauds dans la gamme des 40°C des deux côtés. Les repose-paumes ne sont jamais inconfortablement chauds lorsque vous jouez.
(±) La température maximale du côté supérieur est de 41.2 °C / 106 F, par rapport à la moyenne de 40.4 °C / 105 F, allant de 21.2 à 68.8 °C pour la classe Gaming.
(+) Le fond chauffe jusqu'à un maximum de 39 °C / 102 F, contre une moyenne de 43.3 °C / 110 F
(+) En utilisation inactive, la température moyenne du côté supérieur est de 24.4 °C / 76 F, par rapport à la moyenne du dispositif de 33.9 °C / 93 F.
(±) En jouant à The Witcher 3, la température moyenne du côté supérieur est de 34.8 °C / 95 F, alors que la moyenne de l'appareil est de 33.9 °C / 93 F.
(+) Les repose-poignets et le pavé tactile atteignent la température maximale de la peau (33 °C / 91.4 F) et ne sont donc pas chauds.
(-) La température moyenne de la zone de l'appui-paume de dispositifs similaires était de 28.8 °C / 83.8 F (-4.2 °C / #-7.6 F).
| HP Omen Transcend 14-fb0014 Intel Core Ultra 7 155H, NVIDIA GeForce RTX 4060 Laptop GPU | Asus ROG Zephyrus G14 2024 GA403U AMD Ryzen 9 8945HS, NVIDIA GeForce RTX 4070 Laptop GPU | Razer Blade 14 RZ09-0508 AMD Ryzen 9 8945HS, NVIDIA GeForce RTX 4070 Laptop GPU | Lenovo Legion Slim 5 14APH8 AMD Ryzen 7 7840HS, NVIDIA GeForce RTX 4060 Laptop GPU | Apple MacBook Pro 14 2023 M3 Pro Apple M3 Pro 11-Core, Apple M3 Pro 14-Core GPU | Microsoft Surface Laptop Studio 2 RTX 4060 Intel Core i7-13700H, NVIDIA GeForce RTX 4060 Laptop GPU | |
|---|---|---|---|---|---|---|
| Heat | -12% | -22% | -13% | 6% | -4% | |
| Maximum Upper Side * (°C) | 41.2 | 46.6 -13% | 41.8 -1% | 40.4 2% | 42 -2% | 40.4 2% |
| Maximum Bottom * (°C) | 39 | 47.8 -23% | 42.2 -8% | 49.4 -27% | 38.3 2% | 42.2 -8% |
| Idle Upper Side * (°C) | 26.2 | 26.7 -2% | 34.8 -33% | 28.2 -8% | 23 12% | 26.6 -2% |
| Idle Bottom * (°C) | 25.4 | 27.8 -9% | 37.4 -47% | 29.8 -17% | 22.8 10% | 27 -6% |
* ... Moindre est la valeur, meilleures sont les performances
Intervenants
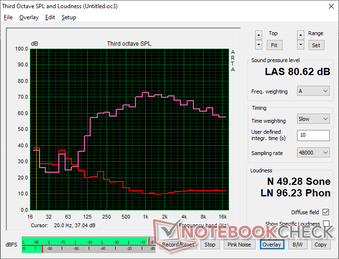
HP Omen Transcend 14-fb0014 analyse audio
(±) | le niveau sonore du haut-parleur est moyen mais bon (80.6# dB)
Basses 100 - 315 Hz
(±) | basse réduite - en moyenne 10.3% inférieure à la médiane
(±) | la linéarité des basses est moyenne (11.8% delta à la fréquence précédente)
Médiums 400 - 2000 Hz
(±) | médiane supérieure - en moyenne 5.1% supérieure à la médiane
(+) | les médiums sont linéaires (5.3% delta à la fréquence précédente)
Aiguës 2 - 16 kHz
(+) | des sommets équilibrés - à seulement 2.9% de la médiane
(+) | les aigus sont linéaires (4.9% delta à la fréquence précédente)
Globalement 100 - 16 000 Hz
(+) | le son global est linéaire (12.8% différence à la médiane)
Par rapport à la même classe
» 16% de tous les appareils testés de cette catégorie étaient meilleurs, 4% similaires, 80% pires
» Le meilleur avait un delta de 6%, la moyenne était de 18%, le pire était de 132%.
Par rapport à tous les appareils testés
» 11% de tous les appareils testés étaient meilleurs, 3% similaires, 86% pires
» Le meilleur avait un delta de 4%, la moyenne était de 24%, le pire était de 134%.
Apple MacBook Pro 16 2021 M1 Pro analyse audio
(+) | les haut-parleurs peuvent jouer relativement fort (84.7# dB)
Basses 100 - 315 Hz
(+) | bonne basse - seulement 3.8% loin de la médiane
(+) | les basses sont linéaires (5.2% delta à la fréquence précédente)
Médiums 400 - 2000 Hz
(+) | médiane équilibrée - seulement 1.3% de la médiane
(+) | les médiums sont linéaires (2.1% delta à la fréquence précédente)
Aiguës 2 - 16 kHz
(+) | des sommets équilibrés - à seulement 1.9% de la médiane
(+) | les aigus sont linéaires (2.7% delta à la fréquence précédente)
Globalement 100 - 16 000 Hz
(+) | le son global est linéaire (4.6% différence à la médiane)
Par rapport à la même classe
» 0% de tous les appareils testés de cette catégorie étaient meilleurs, 0% similaires, 100% pires
» Le meilleur avait un delta de 5%, la moyenne était de 17%, le pire était de 45%.
Par rapport à tous les appareils testés
» 0% de tous les appareils testés étaient meilleurs, 0% similaires, 100% pires
» Le meilleur avait un delta de 4%, la moyenne était de 24%, le pire était de 134%.
Gestion de l'énergie - Aucun adaptateur CA spécial n'est nécessaire
Consommation électrique
La course à pied Witcher 3 consomme environ 118 W, ce qui est comparable à la Zephyrus G14 mais bien moins que le Blade 14. La différence de consommation entre notre Omen Transcend 14 et le Blade 14 est d'environ 60 W, dont une grande partie est attribuée à l'objectif TGP plus élevé du système Razer plus lourd.
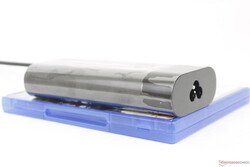
Une différence importante entre les modèles HP, Razer et Asus est que le HP utilise un adaptateur secteur USB-C universel (~13,8 x 6,5 x 2,8 cm) de 140 W alors que les modèles Razer et Asus ont leurs propres solutions propriétaires de 240 W et 180 W, respectivement. Cela signifie que l'adaptateur secteur du HP peut être remplacé facilement et à moindre coût si jamais vous avez besoin d'un second, mais sa puissance de sortie inférieure limite les performances du GPU par rapport aux concurrents.
(Note de l'éditeur: cette section sera mise à jour lorsque les réparations de notre multimètre Metrahit Energy seront terminées. Nous vous prions de nous excuser pour la gêne occasionnée)
| Éteint/en veille | |
| Au repos | |
| Fortement sollicité |
|
Légende:
min: | |
| HP Omen Transcend 14-fb0014 Ultra 7 155H, GeForce RTX 4060 Laptop GPU, WDC PC SN810 1TB, OLED, 2880x1800, 14" | Asus ROG Zephyrus G14 2024 GA403U R9 8945HS, GeForce RTX 4070 Laptop GPU, WD PC SN560 SDDPNQE-1T00, OLED, 2880x1800, 14" | Razer Blade 14 RZ09-0508 R9 8945HS, GeForce RTX 4070 Laptop GPU, Samsung PM9A1 MZVL21T0HCLR, IPS, 2560x1600, 14" | Lenovo Legion Slim 5 14APH8 R7 7840HS, GeForce RTX 4060 Laptop GPU, SK Hynix HFS001TEJ9X115N, OLED, 2880x1600, 14.5" | Apple MacBook Pro 14 2023 M3 Pro Apple M3 Pro 11-Core, M3 Pro 14-Core GPU, Apple SSD AP0512Z, Mini-LED, 3024x1964, 14.2" | Microsoft Surface Laptop Studio 2 RTX 4060 i7-13700H, GeForce RTX 4060 Laptop GPU, Kioxia XG8 KXG80ZNV1T02, IPS, 2400x1600, 14.4" | |
|---|---|---|---|---|---|---|
| Power Consumption | 16% | -64% | 2% | 43% | 30% | |
| Idle Minimum * (Watt) | 9.1 | 6.9 24% | 20.9 -130% | 7.3 20% | 2.3 75% | 3 67% |
| Idle Average * (Watt) | 12.6 | 8.6 32% | 25.6 -103% | 9.6 24% | 13.1 -4% | 7.1 44% |
| Idle Maximum * (Watt) | 27.4 | 9 67% | 32.1 -17% | 17.3 37% | 13.3 51% | 7.6 72% |
| Load Average * (Watt) | 63.5 | 75.2 -18% | 72.7 -14% | 76.6 -21% | 47.4 25% | 73.1 -15% |
| Witcher 3 ultra * (Watt) | 118.9 | 109.7 8% | 182.1 -53% | 152 -28% | 42.8 64% | 113.9 4% |
| Load Maximum * (Watt) | 135.3 | 161.6 -19% | 228.4 -69% | 160.9 -19% | 73.6 46% | 128.5 5% |
* ... Moindre est la valeur, meilleures sont les performances
Power Consumption Witcher 3 / Stresstest
Power Consumption external Monitor
Autonomie de la batterie
HP recommande d'activer Direct X Cross Adapter Scan-Out (CASO) via le BIOS pour augmenter l'autonomie de la batterie. Nous avons pu enregistrer une durée d'exécution WLAN de 423 minutes et 517 minutes avec la fonction désactivée et activée, respectivement, ce qui suggère que l'activation de CASO peut avoir une différence notable dans les durées d'exécution. HP indique qu'une mise à jour logicielle sera bientôt disponible pour les utilisateurs et qu'elle activera la fonction CASO par défaut. Il est néanmoins conseillé d'utiliser le mode iGPU et d'activer le taux de rafraîchissement dynamique pour prolonger la durée de vie de la batterie.
Le chargement d'une batterie vide à une batterie pleine avec l'adaptateur secteur fourni prend environ 90 minutes.
| HP Omen Transcend 14-fb0014 Ultra 7 155H, GeForce RTX 4060 Laptop GPU, 71 Wh | Asus ROG Zephyrus G14 2024 GA403U R9 8945HS, GeForce RTX 4070 Laptop GPU, 73 Wh | Razer Blade 14 RZ09-0508 R9 8945HS, GeForce RTX 4070 Laptop GPU, 68 Wh | Lenovo Legion Slim 5 14APH8 R7 7840HS, GeForce RTX 4060 Laptop GPU, 73.6 Wh | Apple MacBook Pro 14 2023 M3 Pro Apple M3 Pro 11-Core, M3 Pro 14-Core GPU, 72.6 Wh | Microsoft Surface Laptop Studio 2 RTX 4060 i7-13700H, GeForce RTX 4060 Laptop GPU, 58 Wh | |
|---|---|---|---|---|---|---|
| Autonomie de la batterie | 4% | -10% | 2% | 54% | 49% | |
| Reader / Idle (h) | 10.4 | 8 -23% | 10.5 1% | |||
| WiFi v1.3 (h) | 8.6 | 9.3 8% | 7.1 -17% | 7.5 -13% | 16.3 90% | 8.3 -3% |
| Load (h) | 1.1 | 1.1 0% | 1.2 9% | 1.3 18% | 1.3 18% | 2.2 100% |
| H.264 (h) | 12.1 | 20.2 | 11.3 |
Points positifs
Points négatifs
Verdict - Un excellent équilibre entre les performances et le prix
Les utilisateurs à la recherche d'un ordinateur portable de jeu de 14 pouces compareront inévitablement le HP Omen Transcend 14 aux deux principaux acteurs de la catégorie : le Razer Blade 14 et le Asus Zephyrus G14. L'avantage le plus important et le plus remarquable pour le HP est peut-être son prix de départ beaucoup plus bas que les deux alternatives, tout en offrant des options RTX 4060 et 4070 similaires sur GeForce, ainsi qu'un écran OLED DCI-P3 de haute qualité à 120 Hz. Les spécifications et les dimensions ne sont pas sacrifiées malgré le fait que le système coûte des centaines d'euros de moins.
L'astérisque qui pèse sur le HP est son objectif TGP inférieur de seulement 50 à 65 W comparé à 90 W et 140 W sur les Asus et Razer susmentionnés, respectivement. Ainsi, si vous configurez les trois systèmes avec le même GPU GeForce RTX 4060, le GPU du HP sera un peu moins performant et ressemblera davantage à une RTX 4050. Cela ne veut pas dire que le système est lent, mais les chasseurs de performances seront probablement dissuadés par le HP.
Le premier ordinateur portable Omen de 14 pouces a beaucoup de points positifs en ce qui concerne l'apparence, les spécifications et le prix. Il est nettement moins cher que la concurrence, mais les performances sont un peu plus lentes.
Autre point d'achoppement, les charnières du HP pourraient certainement être rendues plus rigides. Le Blade 14 et le Zephyrus G14 semblent mieux construits de ce point de vue.
Malgré ces quelques défauts, l'Omen Transcend 14 est plus abordable que la concurrence. Vous obtenez toujours des graphiques RTX sur GeForce, un écran de qualité et une taille adaptée au voyage, comme avec le Razer ou l'Asus. Nous vous recommandons toutefois d'être prudent avec les charnières.
Prix et disponibilité
Best Buy propose l'Omen Transcend 14 tel qu'il est configuré dans cette revue au prix de 1700$ alors que la configuration Core Ultra 9 185H et RTX 4070 est vendue au prix de 2000$.
HP Omen Transcend 14-fb0014
- 03/05/2024 v7 (old)
Allen Ngo
Transparency
La sélection des appareils à examiner est effectuée par notre équipe éditoriale. L'échantillon de test a été prêté à l'auteur par le fabricant ou le détaillant pour les besoins de cet examen. Le prêteur n'a pas eu d'influence sur cette évaluation et le fabricant n'a pas reçu de copie de cette évaluation avant sa publication. Il n'y avait aucune obligation de publier cet article. En tant que média indépendant, Notebookcheck n'est pas soumis à l'autorité des fabricants, des détaillants ou des éditeurs.
Voici comment Notebookcheck teste
Chaque année, Notebookcheck examine de manière indépendante des centaines d'ordinateurs portables et de smartphones en utilisant des procédures standardisées afin de garantir que tous les résultats sont comparables. Nous avons continuellement développé nos méthodes de test depuis environ 20 ans et avons établi des normes industrielles dans le processus. Dans nos laboratoires de test, des équipements de mesure de haute qualité sont utilisés par des techniciens et des rédacteurs expérimentés. Ces tests impliquent un processus de validation en plusieurs étapes. Notre système d'évaluation complexe repose sur des centaines de mesures et de points de référence bien fondés, ce qui garantit l'objectivité.

