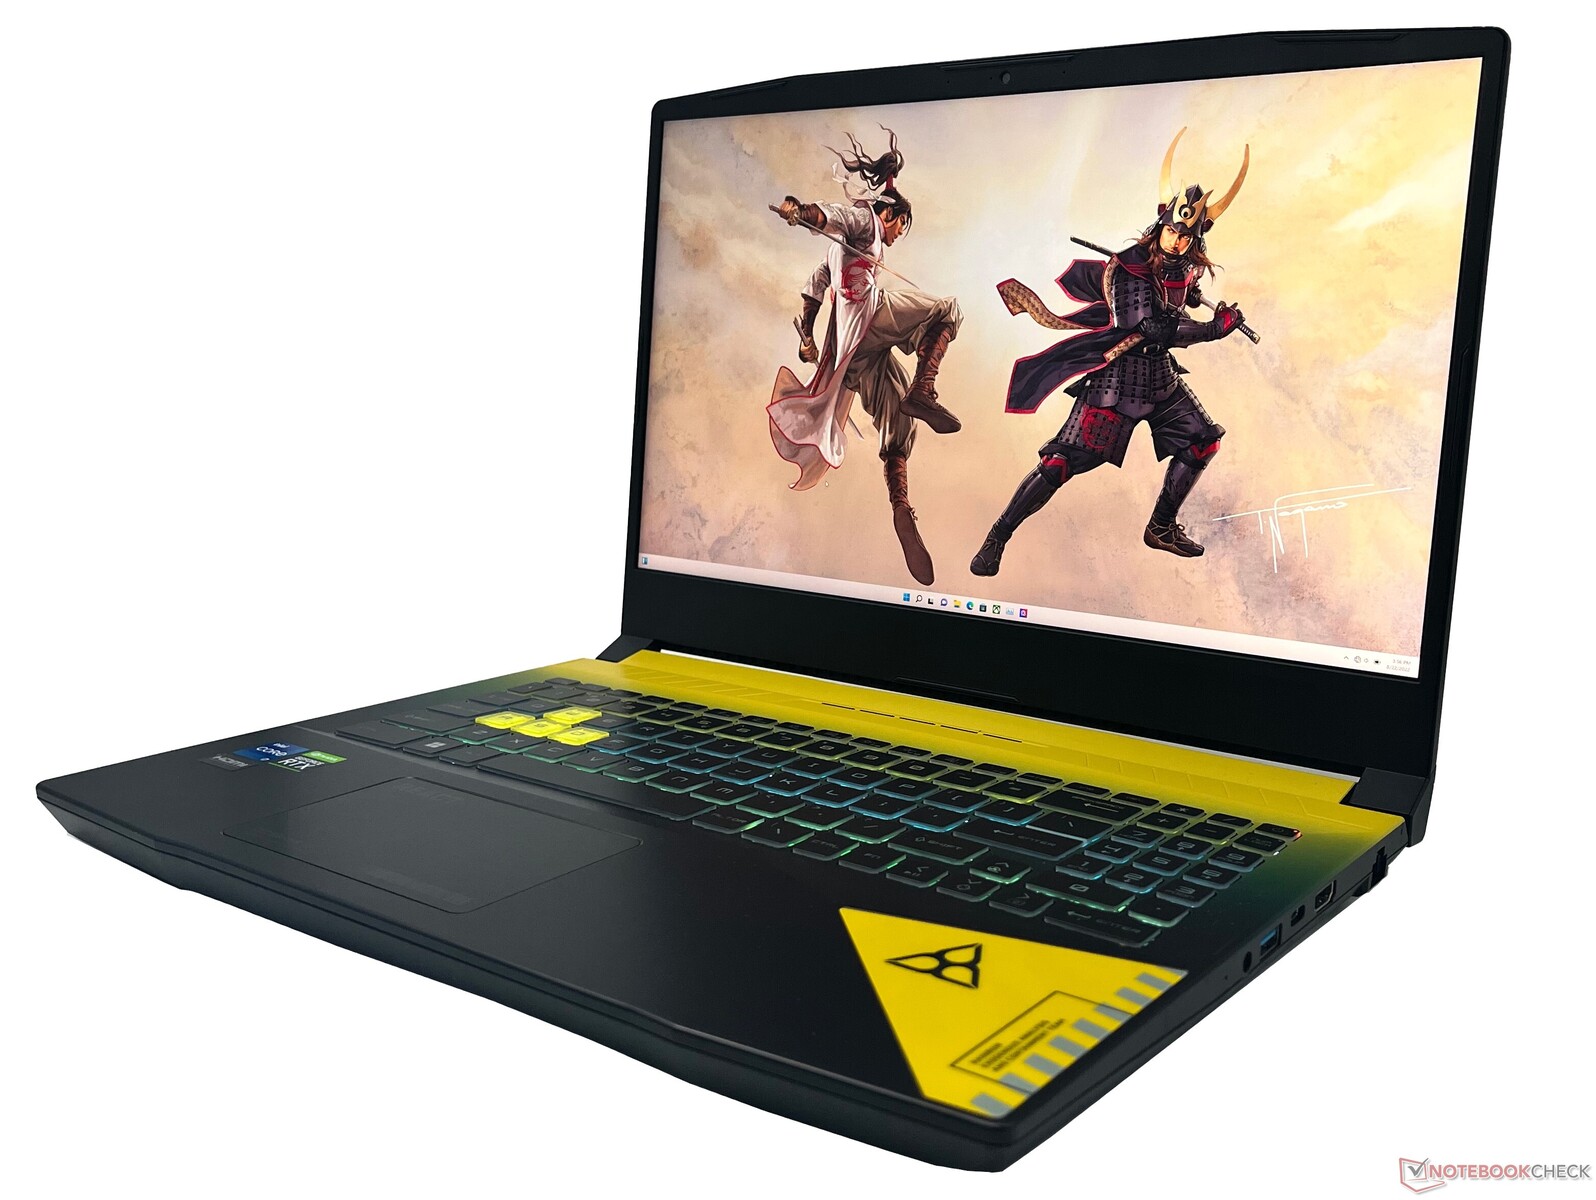
Test du MSI Crosshair 15 Rainbow Six Extraction : milieu de gamme QHD 165 Hz performant

Les ordinateurs portables dédiés aux jeux sont difficiles à trouver de nos jours. Alienware a célébré le lancement de Cyberpunk 2077 avec un ordinateur portable à thème m17 R3 à l'époque, mais il s'agissait plutôt d'un habillage pour embellir le design. Avec le Crosshair 15, MSI a conçu l'ordinateur portable depuis le début afin d'imprégner les vibrations de Rainbow Six d'Ubisoft : Extraction d'Ubisoft dans tous les aspects de sa conception.
Le problème avec les ordinateurs portables sur le thème du jeu, c'est qu'ils n'attirent qu'un public de niche investi dans le jeu en question. Rainbow Six : Extraction a reçu des critiques mitigées les critiques et les fans n'ont pas tous été unanimes à ce sujet. Un ordinateur portable sur le thème de ce jeu ne suscitera donc pas forcément l'intérêt de tout le monde au premier abord.
Cependant, au-delà de ce thème, nous constatons que MSI a beaucoup à offrir dans cet ensemble. Notre MSI Crosshair 15 Rainbow Six : Extraction Edition (R6E) était équipée d'un processeur Intel Core i7-12700H et d'un processeur Intel Core i7-12700H, Nvidia GeForce RTX 3070 GPU pour ordinateur portable16 Go de RAM DDR4-3200, un SSD NVMe de 1 To et un écran QHD de 165 Hz
La combinaison d'un CPU Alder Lake-H et d'un GPU RTX 3070 pour ordinateur portable n'est pas fréquente étant donné que Nvidia a remplacé ce GPU par le RTX 3070 Ti Laptop GPU. Néanmoins, cette configuration Crosshair 15 vous coûtera ₹1,90,990 (2,312 US$) en Inde.
Dans cet article, nous évaluons le MSI Crosshair 15 Rainbow Six : Extraction Edition et nous verrons comment il se positionne par rapport à la concurrence en tant qu'ordinateur portable de jeu de milieu de gamme.
Comparaison avec les concurrents potentiels
Note | Date | Modèle | Poids | Épaisseur | Taille | Résolution | Prix |
|---|---|---|---|---|---|---|---|
| 85.8 % v7 (old) | 12/22 | MSI Crosshair 15 R6E B12UGZ-050 i7-12700H, GeForce RTX 3070 Laptop GPU | 2.5 kg | 26.9 mm | 15.60" | 2560x1440 | |
| 84.5 % v7 (old) | 02/22 | MSI Stealth GS66 12UGS i7-12700H, GeForce RTX 3070 Ti Laptop GPU | 2.2 kg | 19.8 mm | 15.60" | 2560x1440 | |
| 88 % v7 (old) | 03/22 | Lenovo Legion 5 Pro 16 G7 i7 RTX 3070Ti i7-12700H, GeForce RTX 3070 Ti Laptop GPU | 2.6 kg | 26.6 mm | 16.00" | 2560x1600 | |
| 80.3 % v7 (old) | 06/22 | MSI Katana GF66 12UGS i7-12700H, GeForce RTX 3070 Ti Laptop GPU | 2.3 kg | 27.5 mm | 15.60" | 1920x1080 | |
| 80.7 % v7 (old) | 04/22 | MSI Pulse GL66 12UEK i9-12900H, GeForce RTX 3060 Laptop GPU | 2.3 kg | 25 mm | 15.60" | 1920x1080 | |
| 84 % v7 (old) | 06/22 | Acer Nitro 5 AN515-58-72QR i7-12700H, GeForce RTX 3070 Ti Laptop GPU | 2.5 kg | 26.8 mm | 15.60" | 2560x1440 | |
| 85.5 % v7 (old) | 12/22 | Aorus 15 XE5 i7-12700H, GeForce RTX 3070 Ti Laptop GPU | 2.3 kg | 24 mm | 15.60" | 2560x1440 | |
| 88.4 % v7 (old) | 07/22 | Schenker XMG Neo 15 (i7-12700H, RTX 3080 Ti) i7-12700H, GeForce RTX 3080 Ti Laptop GPU | 2.3 kg | 26.6 mm | 15.60" | 2560x1440 | |
| 85.8 % v7 (old) | 07/22 | Asus TUF Dash F15 FX517ZR i7-12650H, GeForce RTX 3070 Laptop GPU | 2 kg | 20.7 mm | 15.60" | 2560x1440 | |
| 88 % v7 (old) | 11/22 | Schenker XMG Neo 15 (Ryzen 9 6900HX, RTX 3070 Ti) R9 6900HX, GeForce RTX 3070 Ti Laptop GPU | 2.3 kg | 26.6 mm | 15.60" | 2560x1440 |
Cas : Pulse GL66 peint aux couleurs de Rainbow Six : Extraction
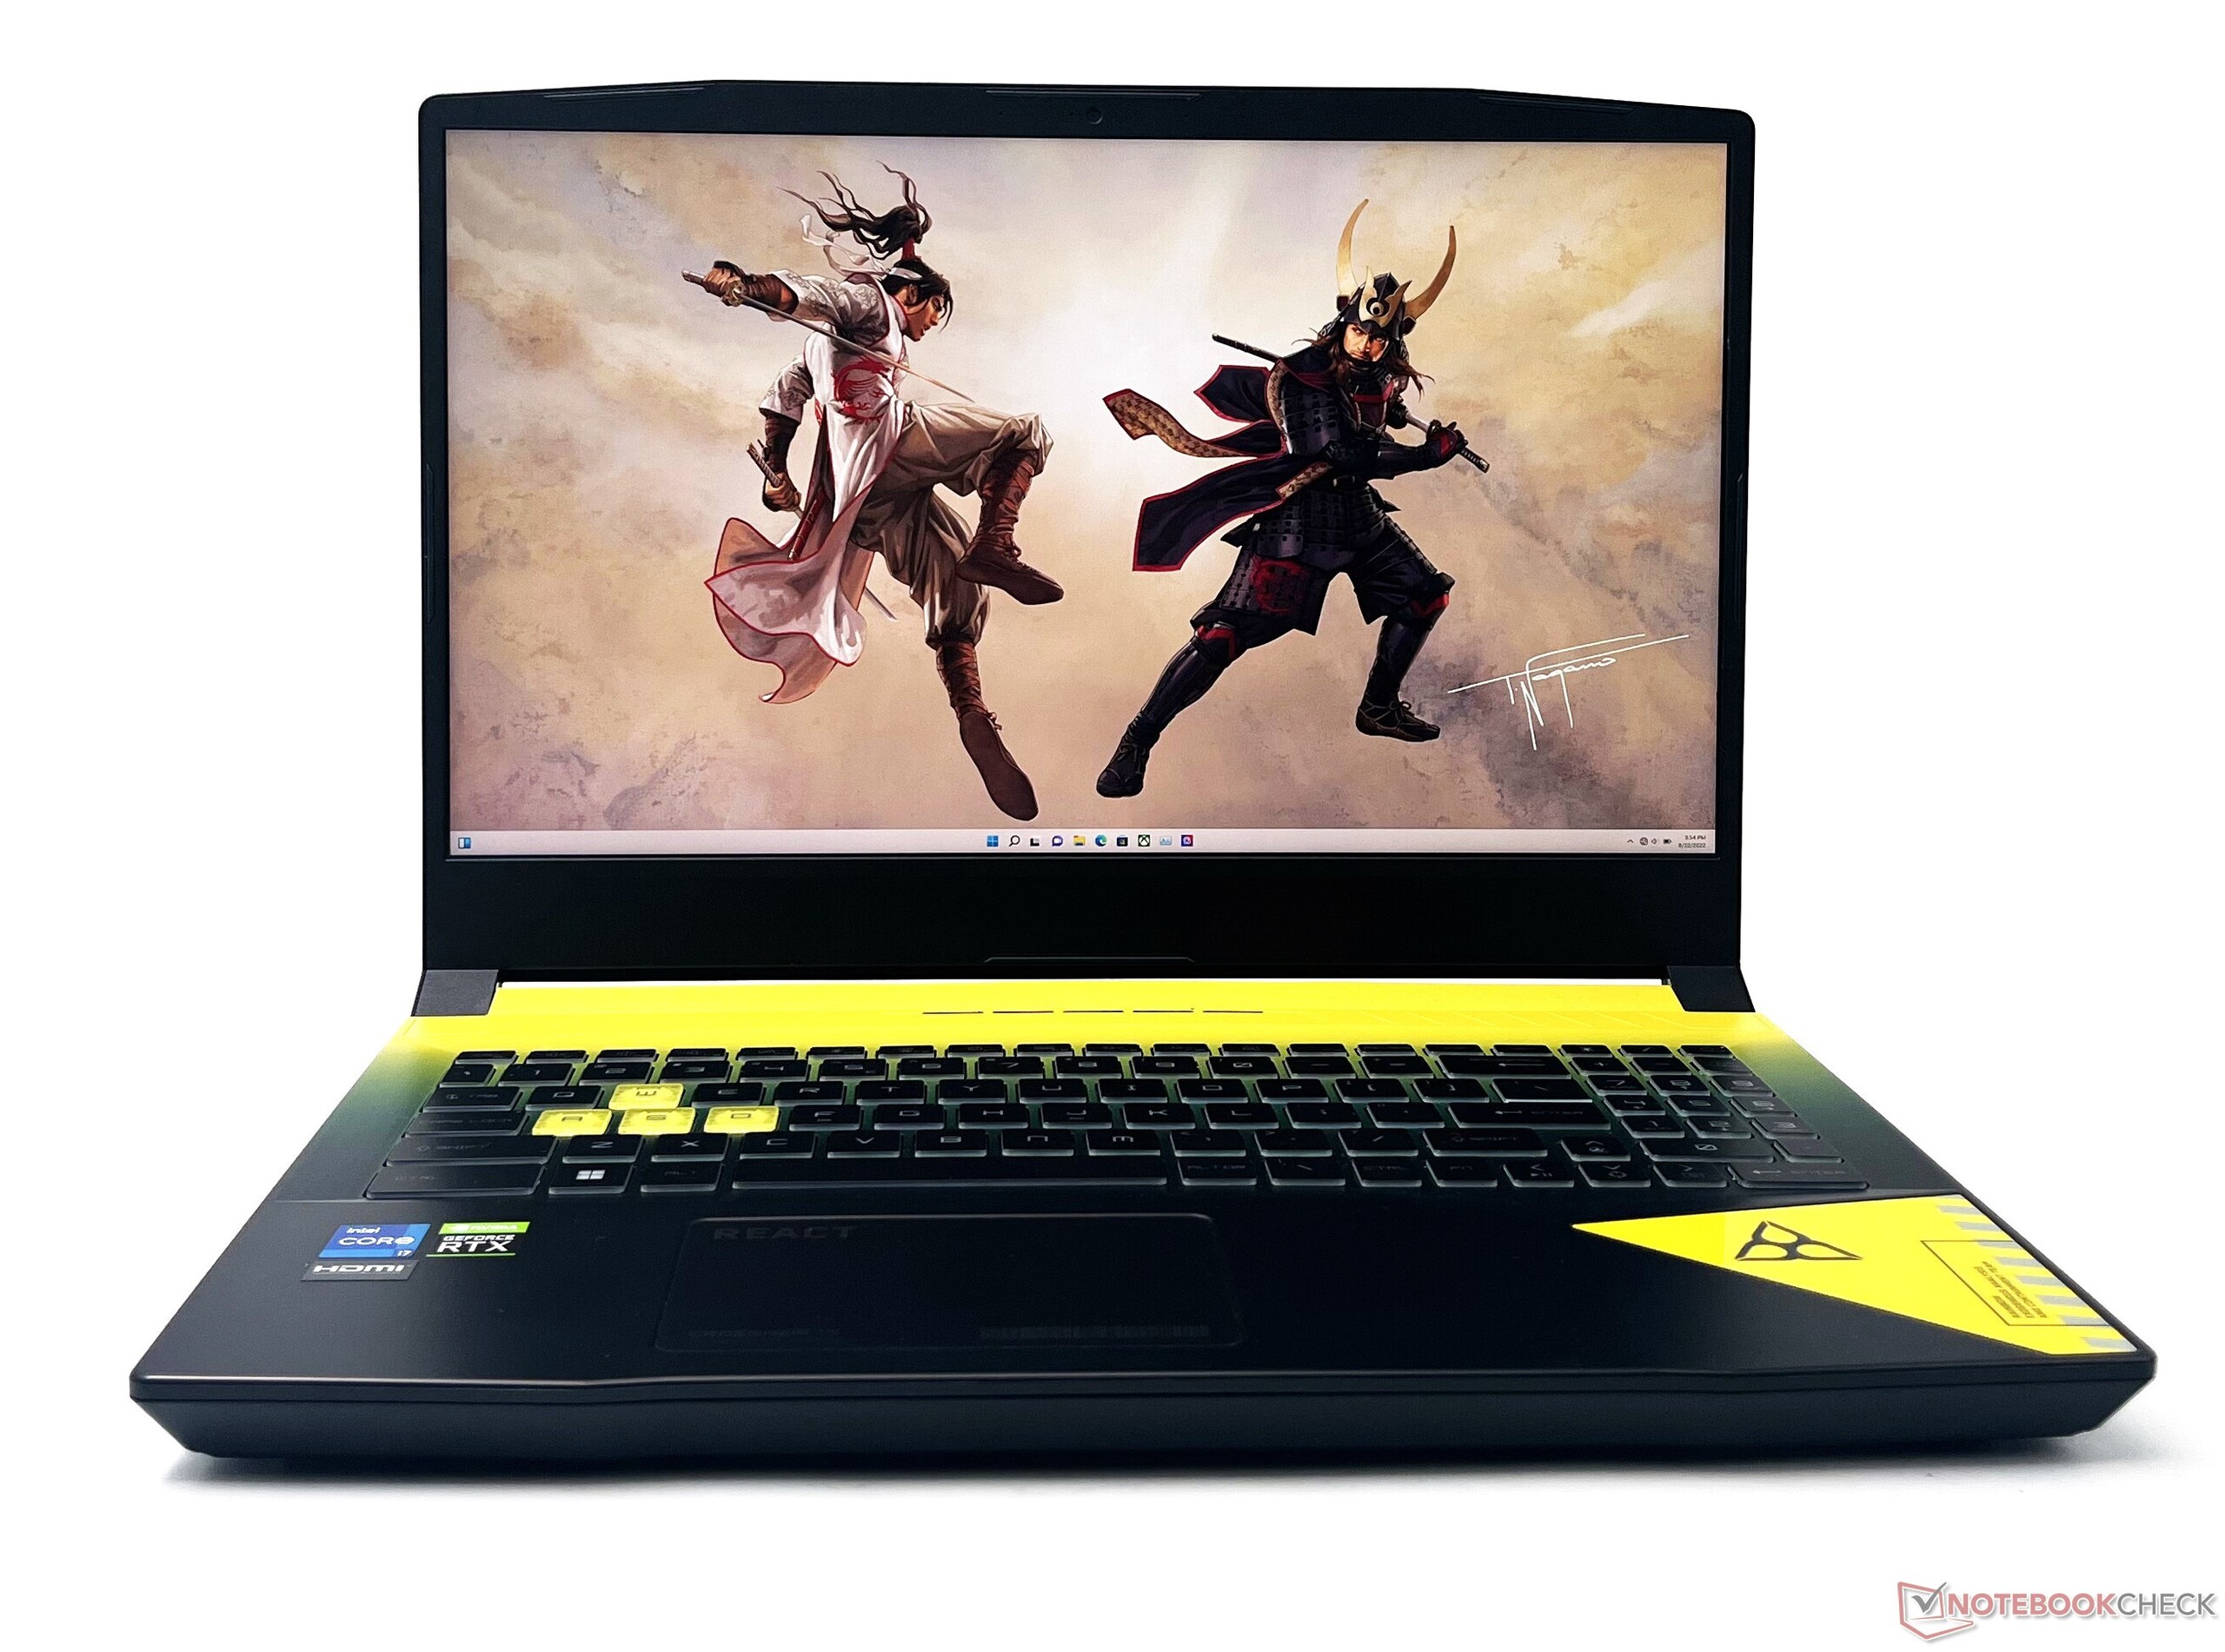
Le châssis du MSI Crosshair 15 R6E est principalement fait de plastique. La construction ne dégage pas vraiment d'ambiance haut de gamme, mais elle est suffisamment solide pour une utilisation quotidienne. Il y a une certaine flexibilité dans le clavier, mais cela n'a pas empêché une utilisation régulière.
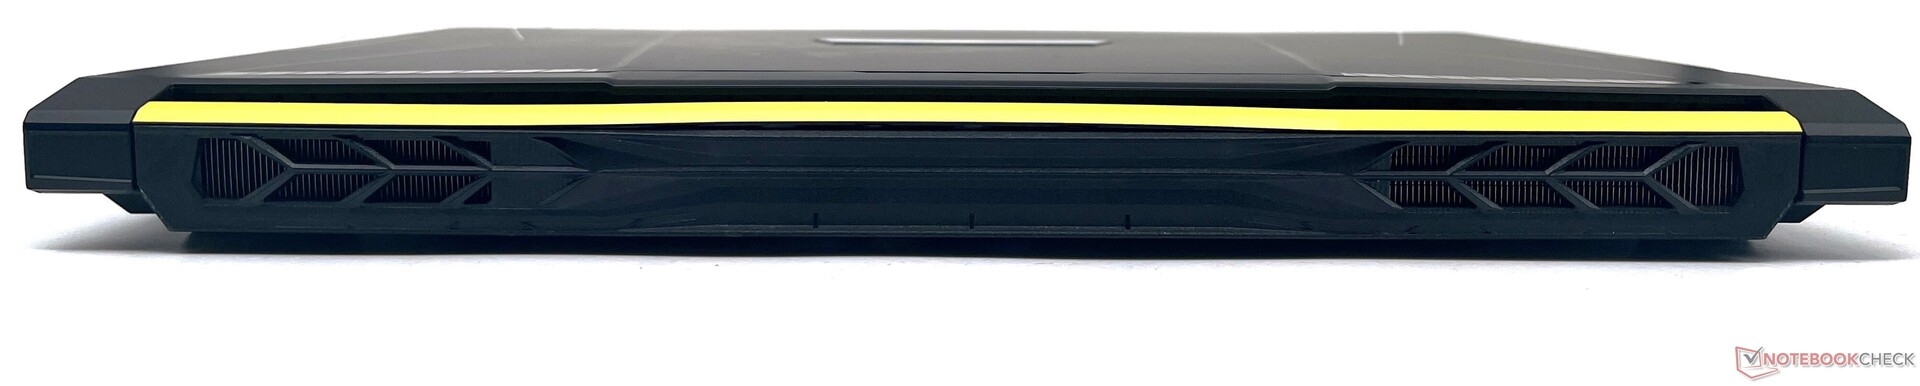
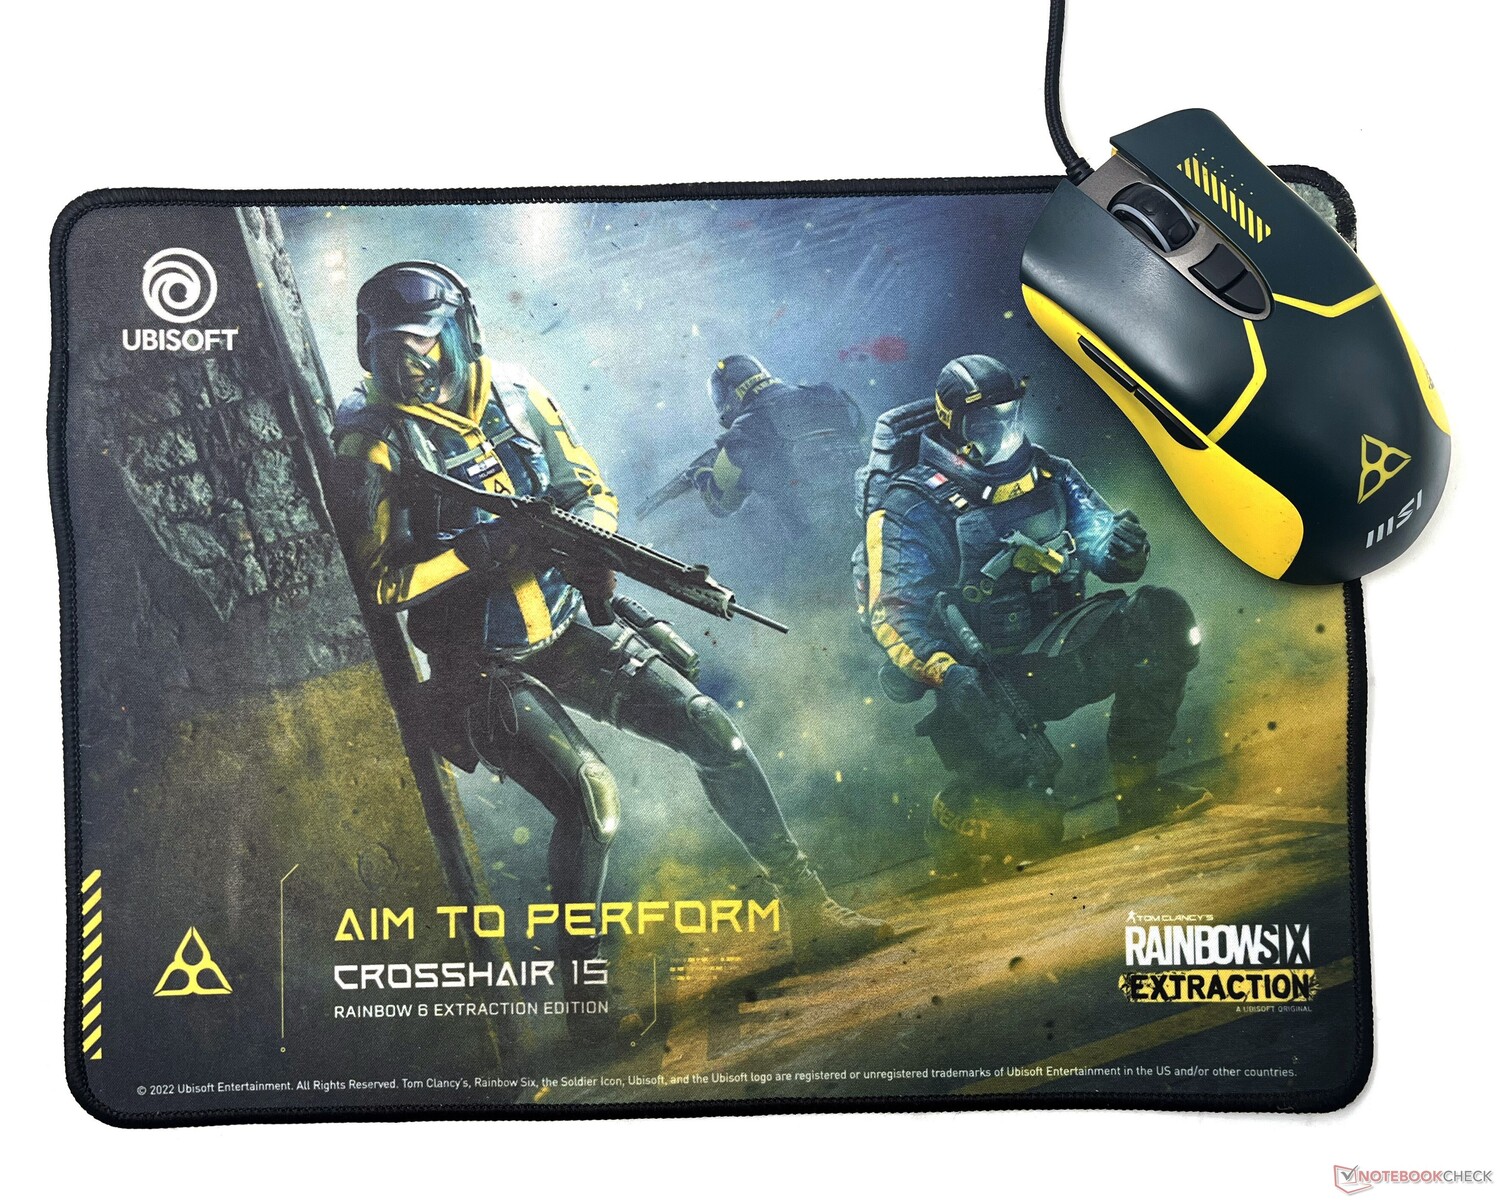
Le Crosshair 15 R6E fait un usage intensif de la combinaison de couleurs jaune-noir et des éléments de design REACT du jeu, de l'emballage au châssis, proclamant ainsi son appartenance à Rainbow Six : Extraction.
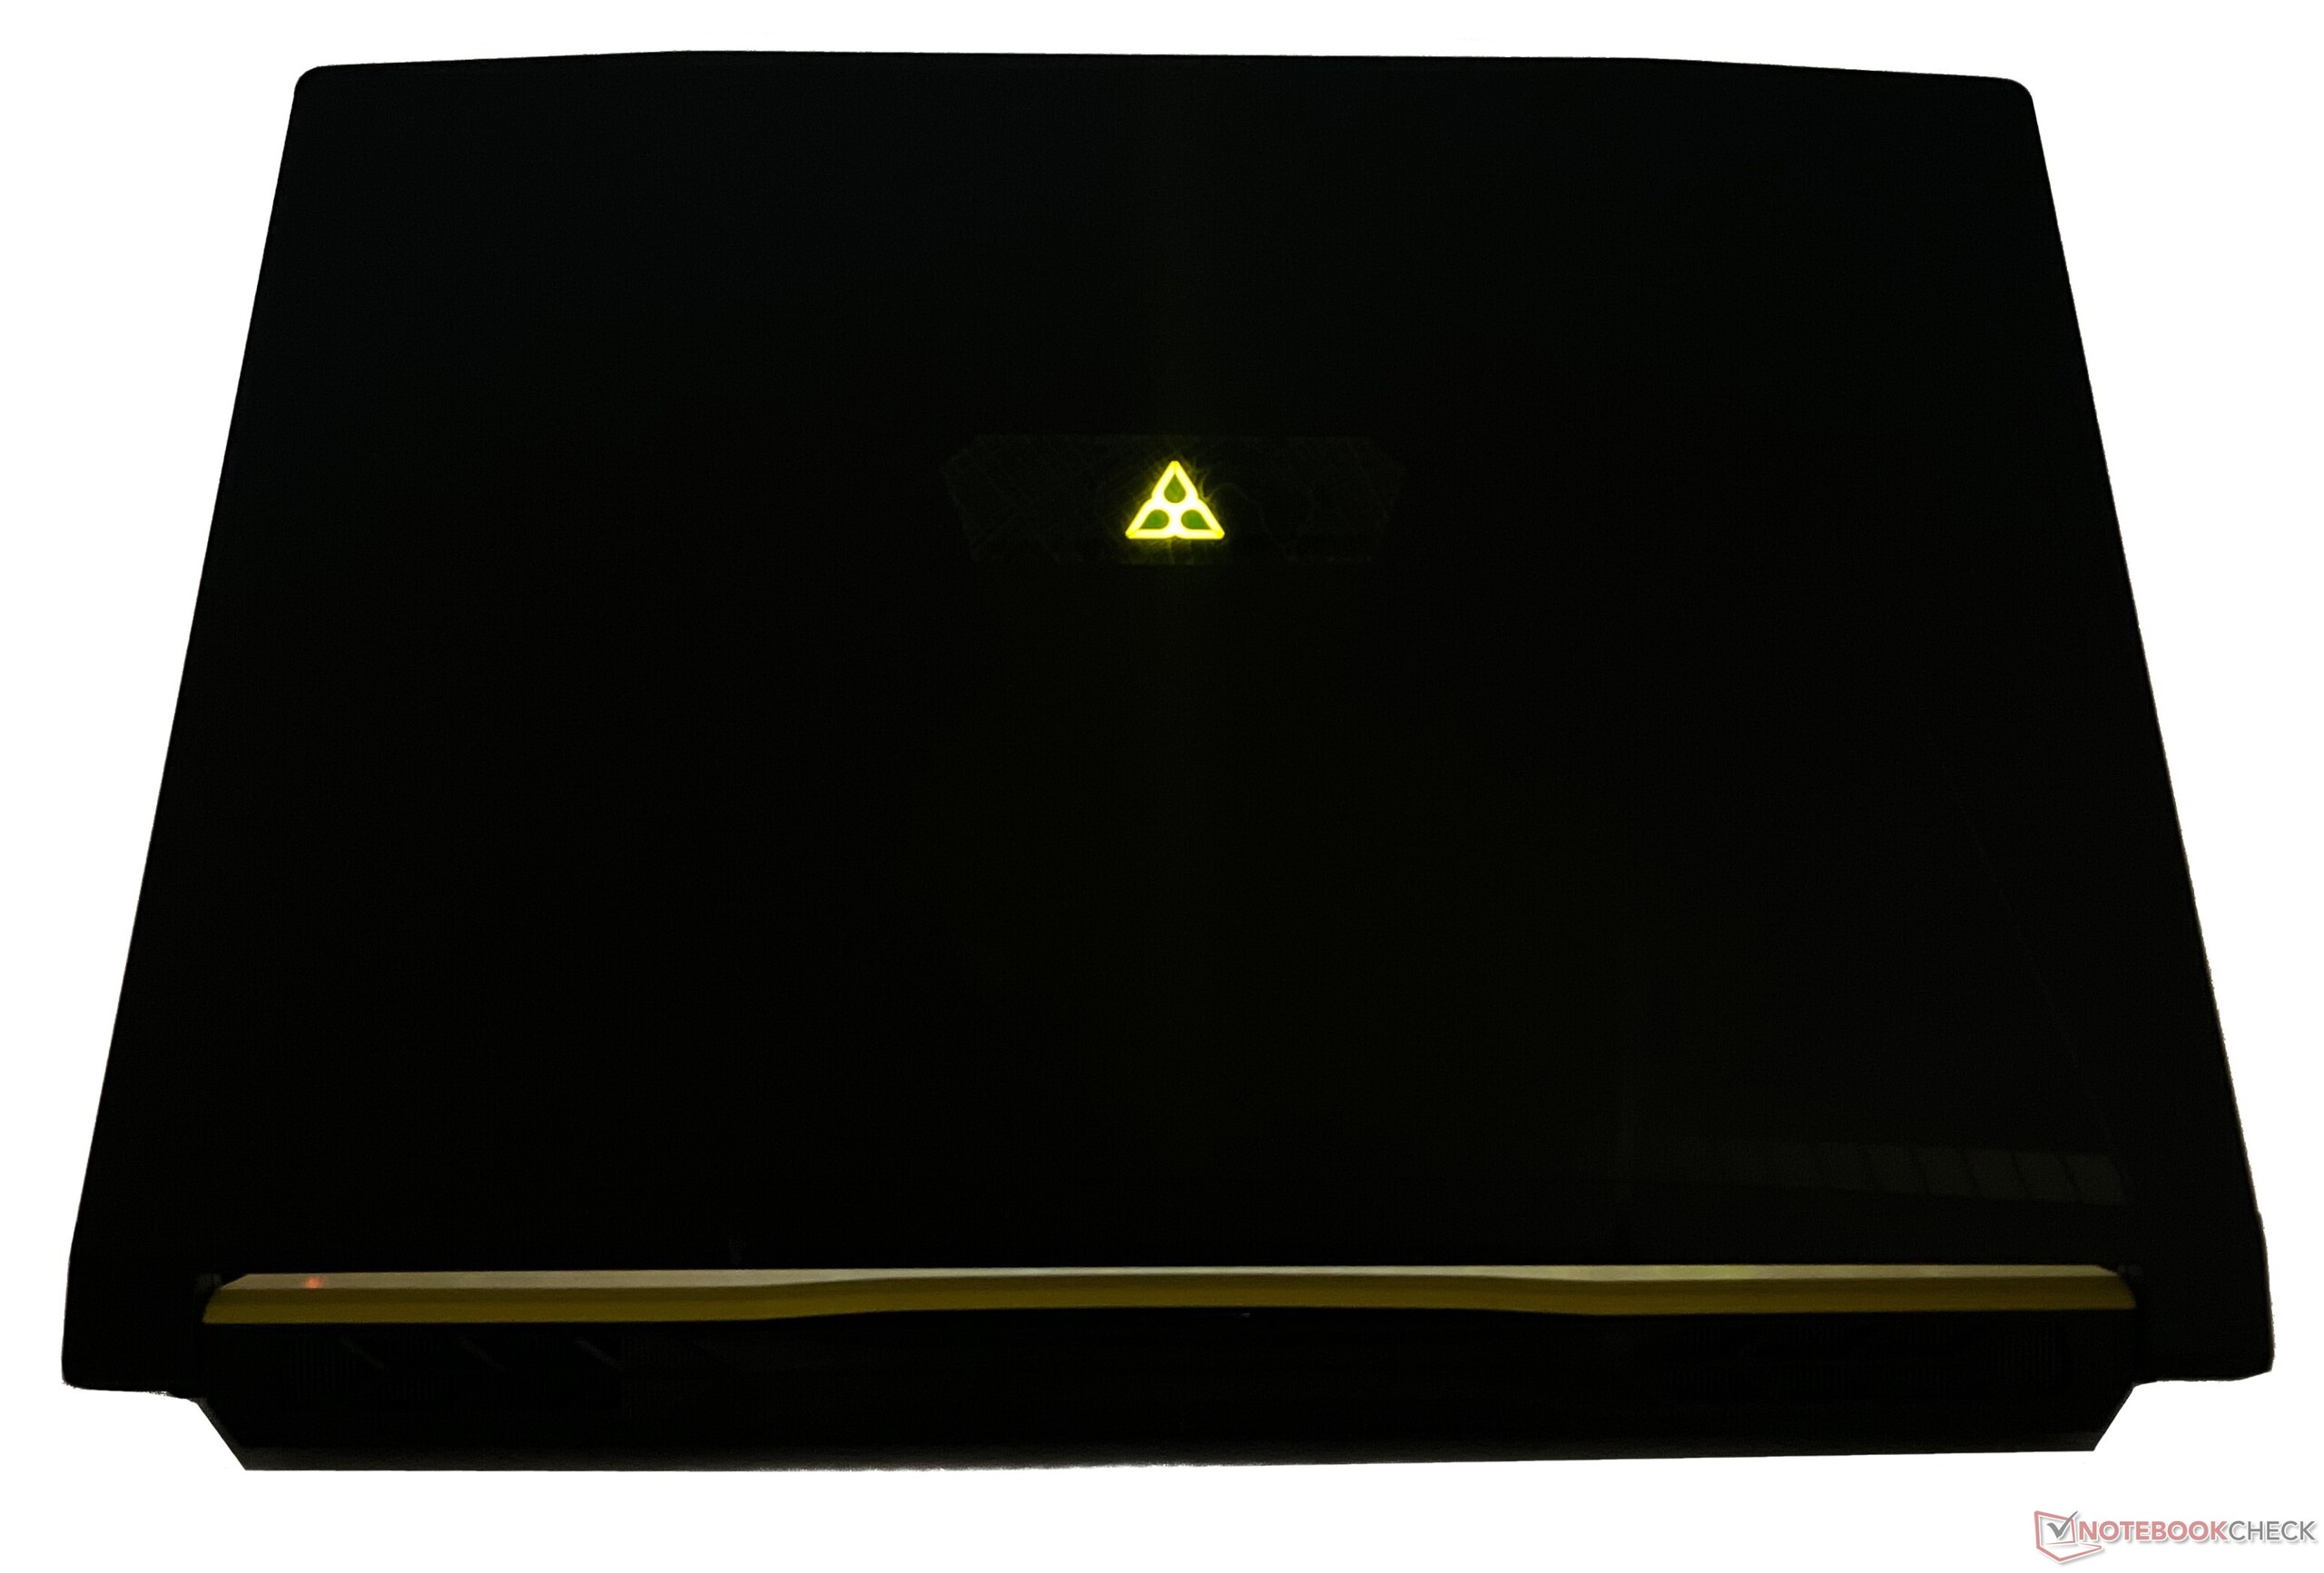
En conséquence, MSI a même remplacé son logo par celui du jeu à l'arrière de l'écran. Le logo de Rainbow Six : Extraction n'est pas trop grand mais il est suffisamment visible et brille en jaune vif. Il n'y a pas de motifs d'éclairage RVB, vous devrez donc vous contenter du jeu de couleurs proposé.
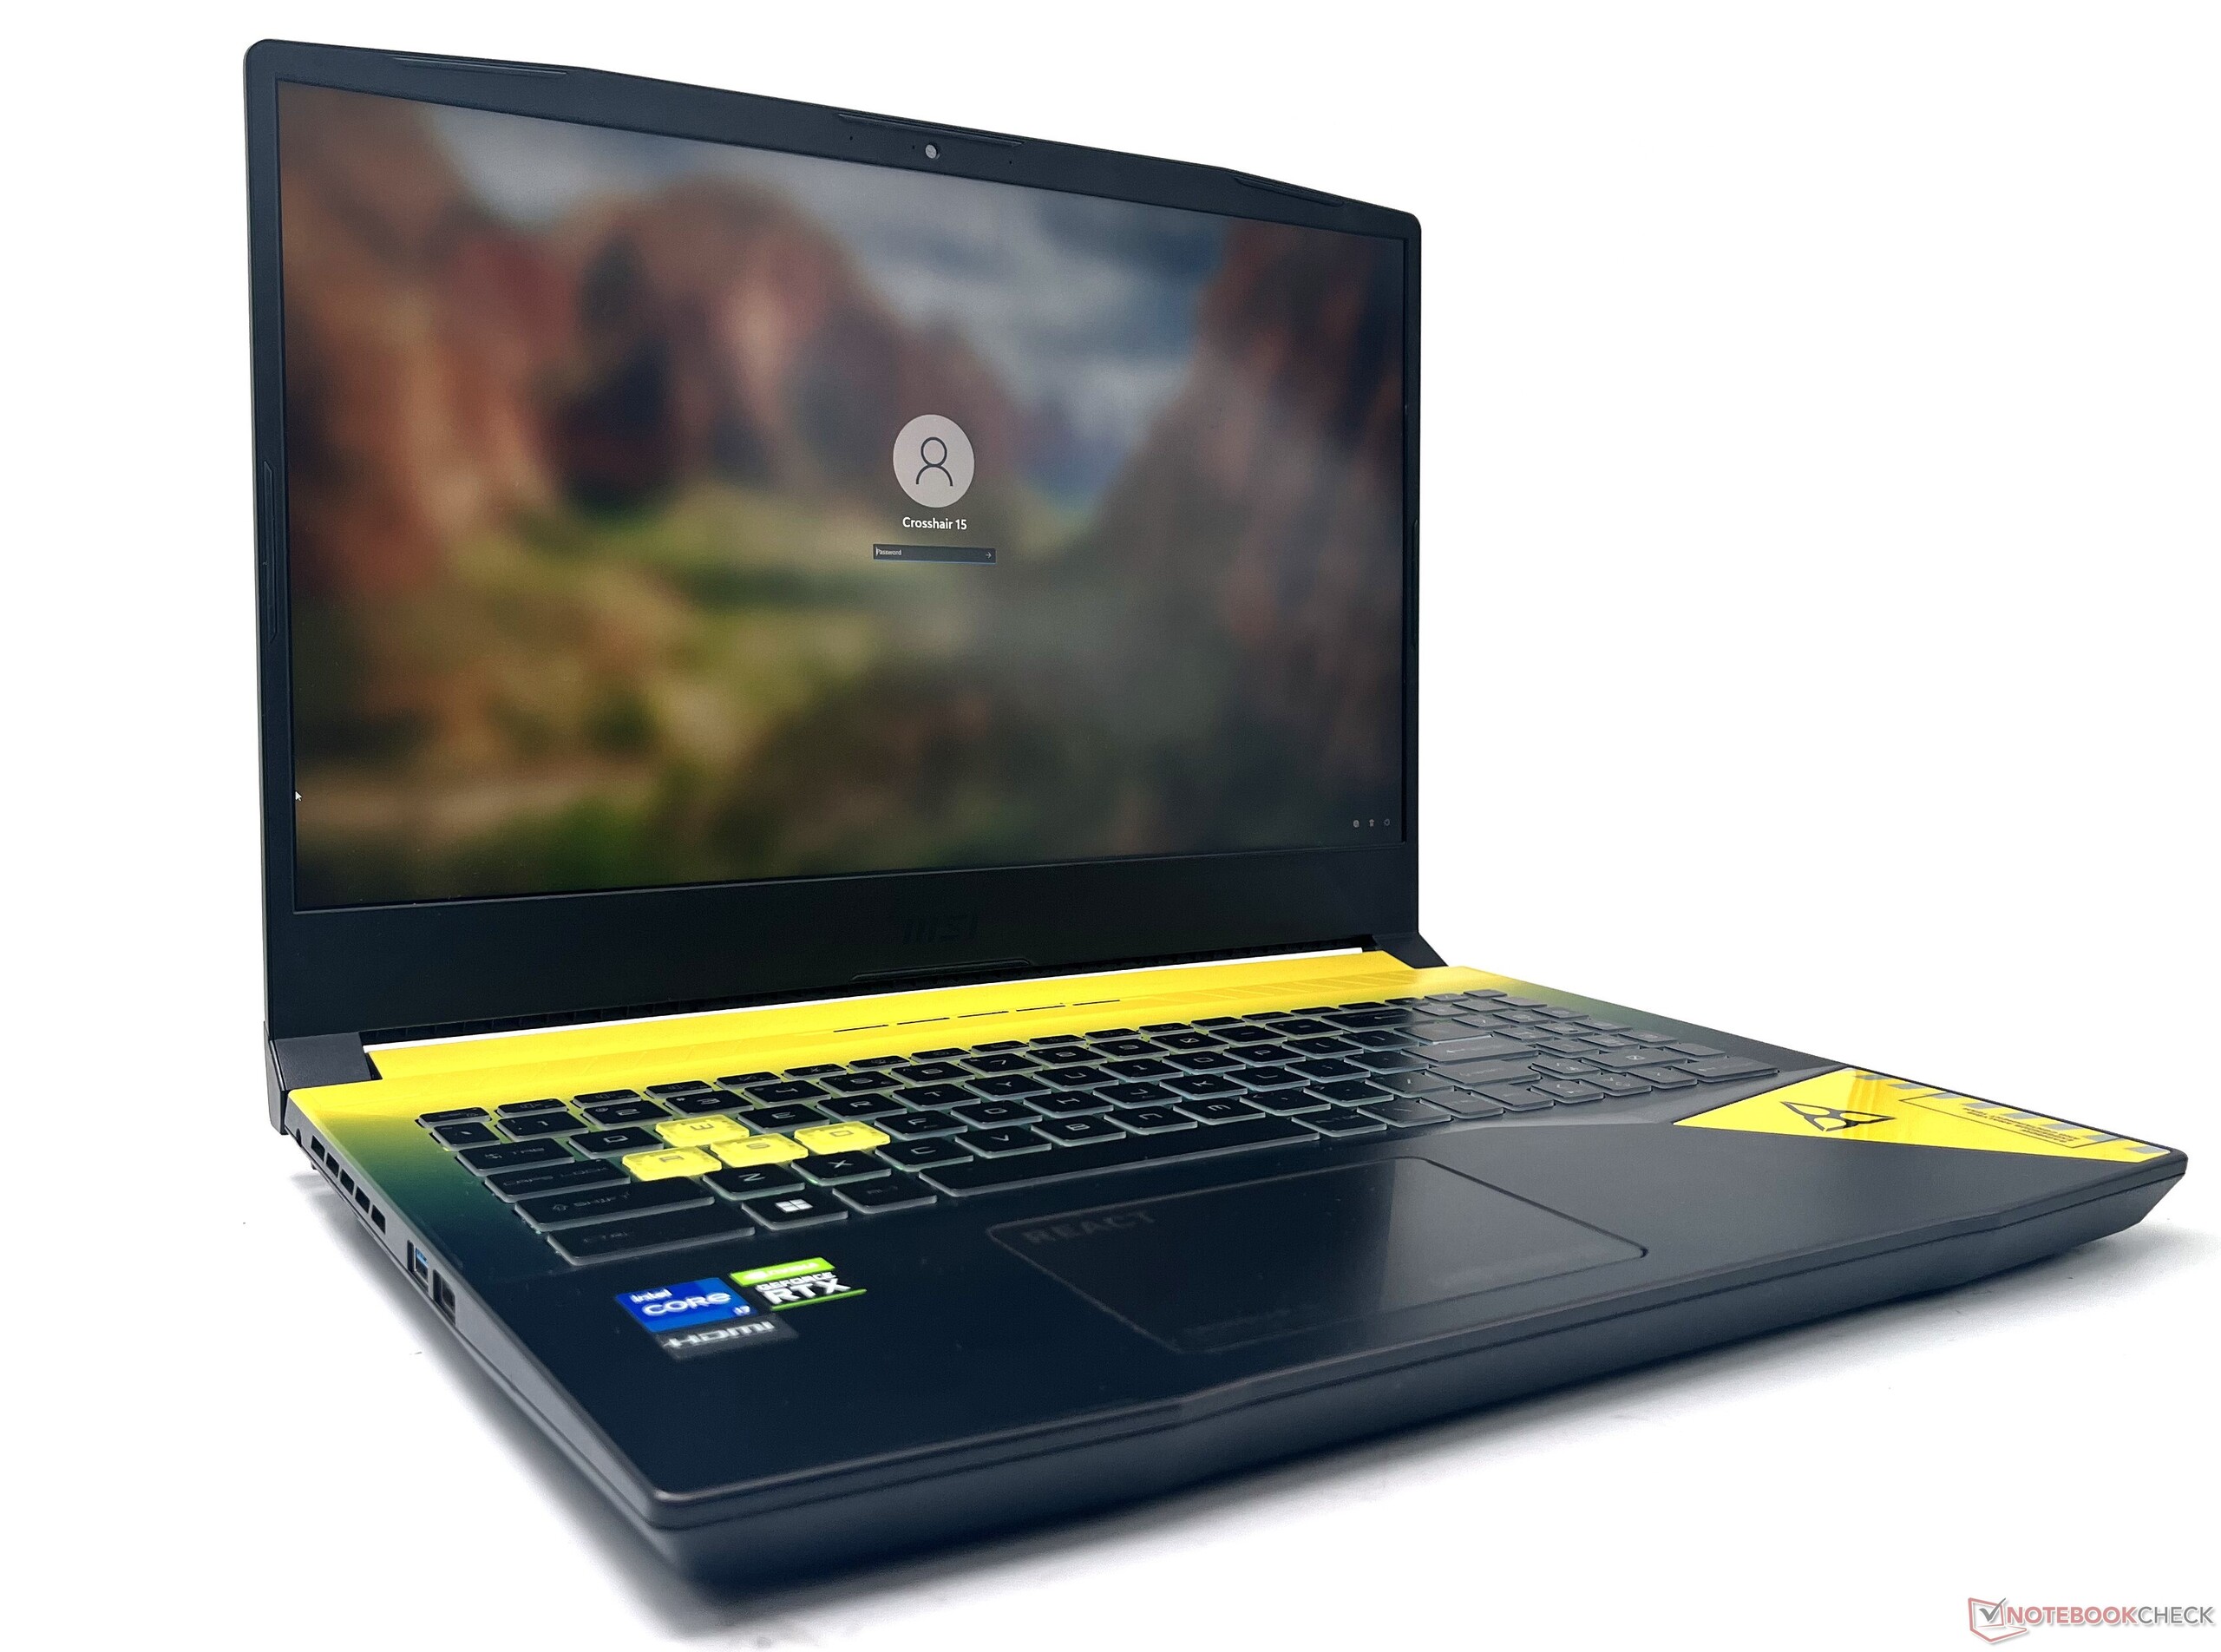
Avec une épaisseur de 26,9 mm, ce n'est pas l'ordinateur portable le plus fin de sa catégorie - ce mérite revient au MSI Stealth GS66 et au Razer Blade 15. Néanmoins, il est suffisamment portable pour se glisser dans un sac à dos et son poids de 2,5 kg ne semble pas trop lourd non plus.
Dans l'ensemble, le châssis du MSI Crosshair 15 Rainbow Six : Extraction Edition de MSI est construit de manière décente pour le prix et se présente essentiellement comme un remaniement du châssis du Rainbow Six : Extraction Edition Pulse GL66et à bien des égards le Katana GF66avec une nouvelle couche de peinture.

Connectivité : Couvre juste l'essentiel
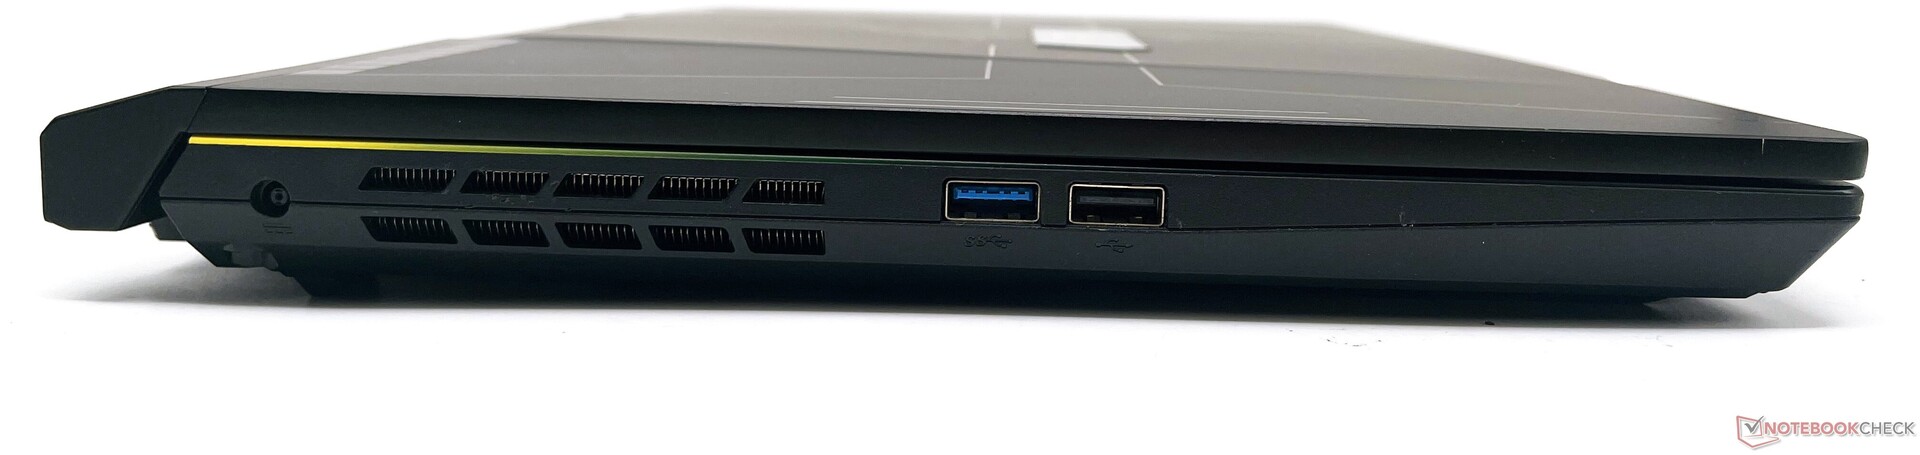
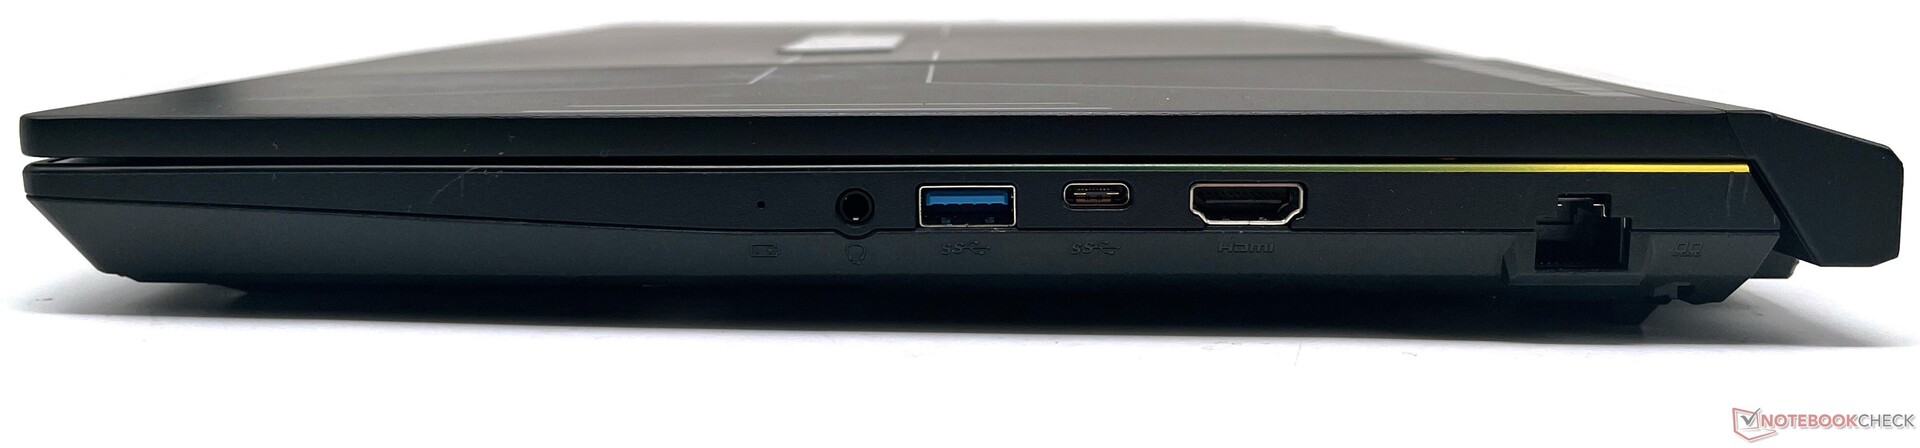
La Crosshair 15 R6E n'offre pas une sélection de ports étendue, mais l'essentiel est couvert. Vers la gauche, nous avons des ports USB 3.2 Gen1 Type-A et USB 2.0 Type-A. Sur la droite, nous avons une prise audio combo de 3,5 mm, un autre port USB 3.2 Gen1 Type-A, un port USB 3.2 Gen1 Type-C, une sortie HDMI et un port Gigabit Ethernet
Le port HDMI ne prend en charge que la sortie 4K 60 Hz. Il n'y a pas de lecteur de carte, de Thunderbolt 4 ou de fente de verrouillage Kensington.
L'emplacement des ports n'est pas vraiment idéal, puisqu'une majorité d'entre eux sont situés vers le côté droit de l'appareil. Les ports sur la gauche pourraient bénéficier d'un espace supplémentaire, étant donné qu'une bonne partie de l'espace reste inutilisée. Ceci étant dit, il n'y a aucun obstacle à la connexion de plusieurs périphériques.
Communication
Le Crosshair 15 R6E est équipé d'un module WLAN Intel Wi-Fi 6 AX201 avec Bluetooth 5.2. L'ordinateur portable se classe en bas de notre classement Wi-Fi avec le routeur de référence Asus ROG Rapture GT-AXE11000.
Cela dit, son débit est tout de même meilleur que celui du Pulse GL66. Les vitesses de réception sont assez stables, mais nous avons remarqué des baisses pendant la transmission.
| Networking / iperf3 transmit AXE11000 | |
| Schenker XMG Neo 15 (i7-12700H, RTX 3080 Ti) | |
| Acer Nitro 5 AN515-58-72QR | |
| Schenker XMG Neo 15 (Ryzen 9 6900HX, RTX 3070 Ti) | |
| MSI Katana GF66 12UGS | |
| Asus TUF Dash F15 FX517ZR | |
| Moyenne Intel Wi-Fi 6 AX201 (438 - 1715, n=74) | |
| Moyenne de la classe Gaming (560 - 1862, n=88, 2 dernières années) | |
| MSI Crosshair 15 R6E B12UGZ-050 | |
| Networking / iperf3 receive AXE11000 | |
| Acer Nitro 5 AN515-58-72QR | |
| MSI Katana GF66 12UGS | |
| Schenker XMG Neo 15 (i7-12700H, RTX 3080 Ti) | |
| Asus TUF Dash F15 FX517ZR | |
| MSI Stealth GS66 12UGS | |
| Schenker XMG Neo 15 (Ryzen 9 6900HX, RTX 3070 Ti) | |
| Moyenne de la classe Gaming (680 - 1745, n=88, 2 dernières années) | |
| Moyenne Intel Wi-Fi 6 AX201 (390 - 1734, n=79) | |
| MSI Crosshair 15 R6E B12UGZ-050 | |
| Networking / iperf3 transmit AX12 | |
| Lenovo Legion 5 Pro 16 G7 i7 RTX 3070Ti | |
| Moyenne Intel Wi-Fi 6 AX201 (49.8 - 1775, n=324) | |
| MSI Pulse GL66 12UEK | |
| Networking / iperf3 receive AX12 | |
| Lenovo Legion 5 Pro 16 G7 i7 RTX 3070Ti | |
| Moyenne Intel Wi-Fi 6 AX201 (136 - 1743, n=324) | |
| MSI Pulse GL66 12UEK | |
Webcam
La webcam 720p est tout juste utilisable pour un ou deux appels vidéo occasionnels. Comme nous l'avons remarqué dans notre ColorChecker Passport et dans les captures de mires ci-dessous, la webcam de la Crosshair 15 présente beaucoup de bruit et un manque général de netteté.
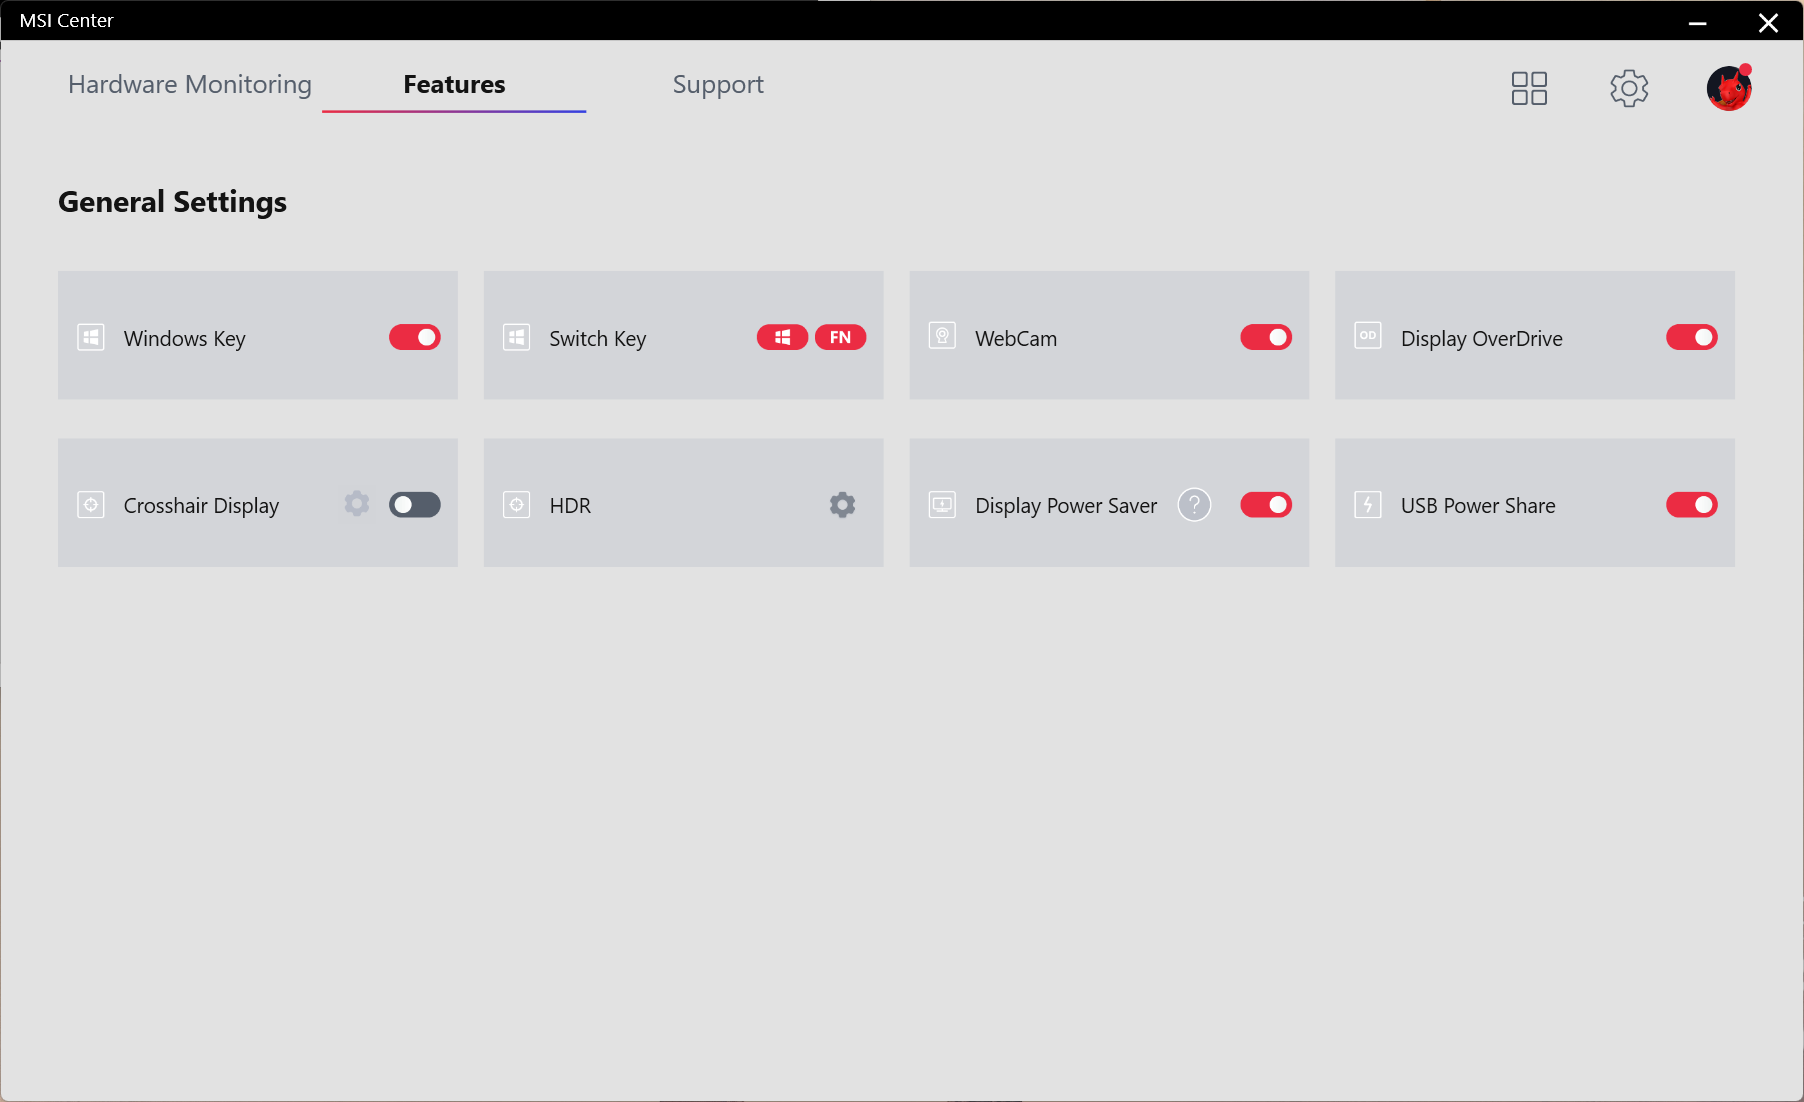
Il n'y a pas d'obturateur de confidentialité physique disponible, mais il est possible d'activer ou de désactiver la webcam en utilisant le raccourci de la touche de fonction F6 ou via le Centre MSI.


Sécurité
Il n'y a pas de connexion biométrique disponible sur le Crosshair 15 R6E. Le seul composant de sécurité majeur embarqué est le module TPM 2.0.
Accessoires
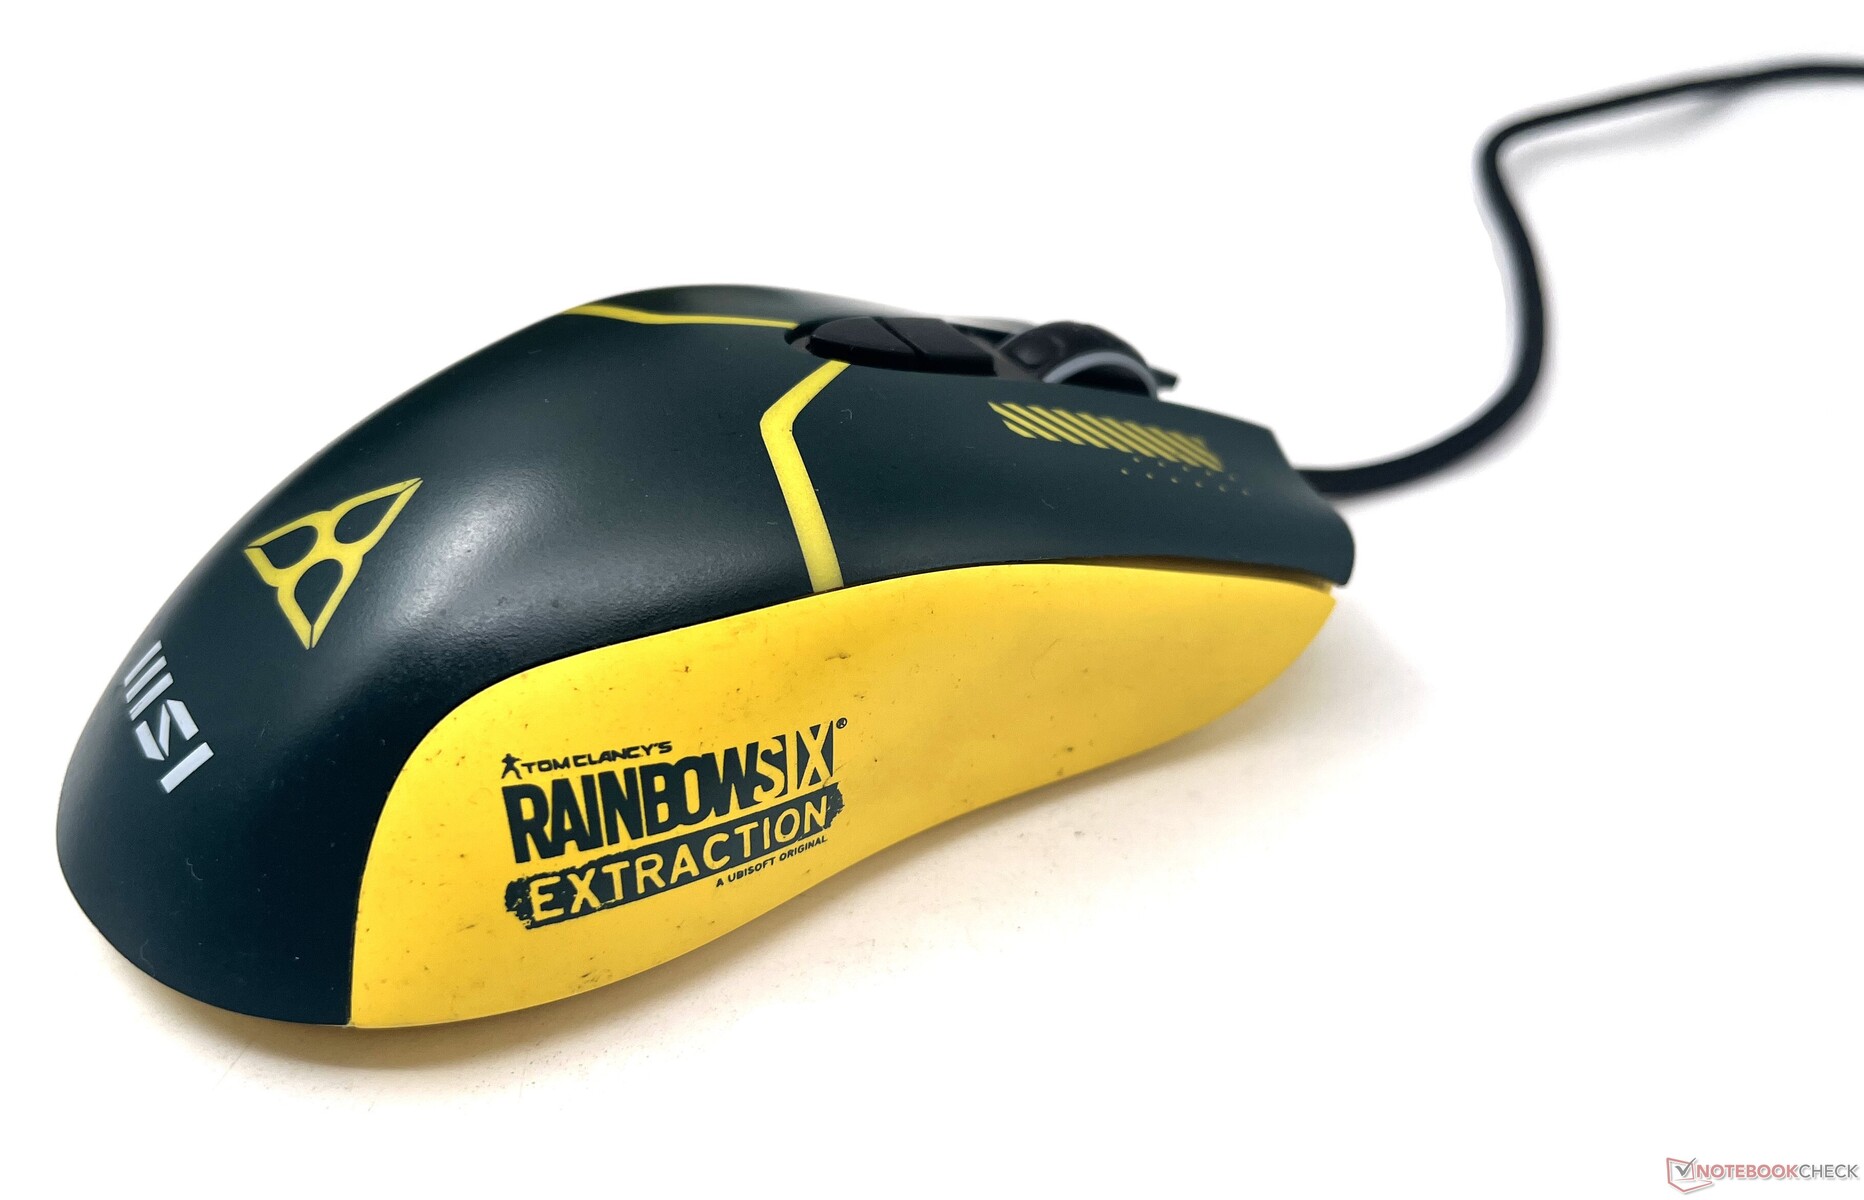
MSI essaie de vous faire entrer encore plus dans l'univers de Rainbow Six : Extraction avec quelques accessoires supplémentaires. Un tapis de souris et une souris de jeu sur le thème du jeu sont inclus dans l'emballage. Les acheteurs peuvent également bénéficier d'une copie gratuite de Rainbow Six : Extraction Deluxe Edition via Ubisoft.
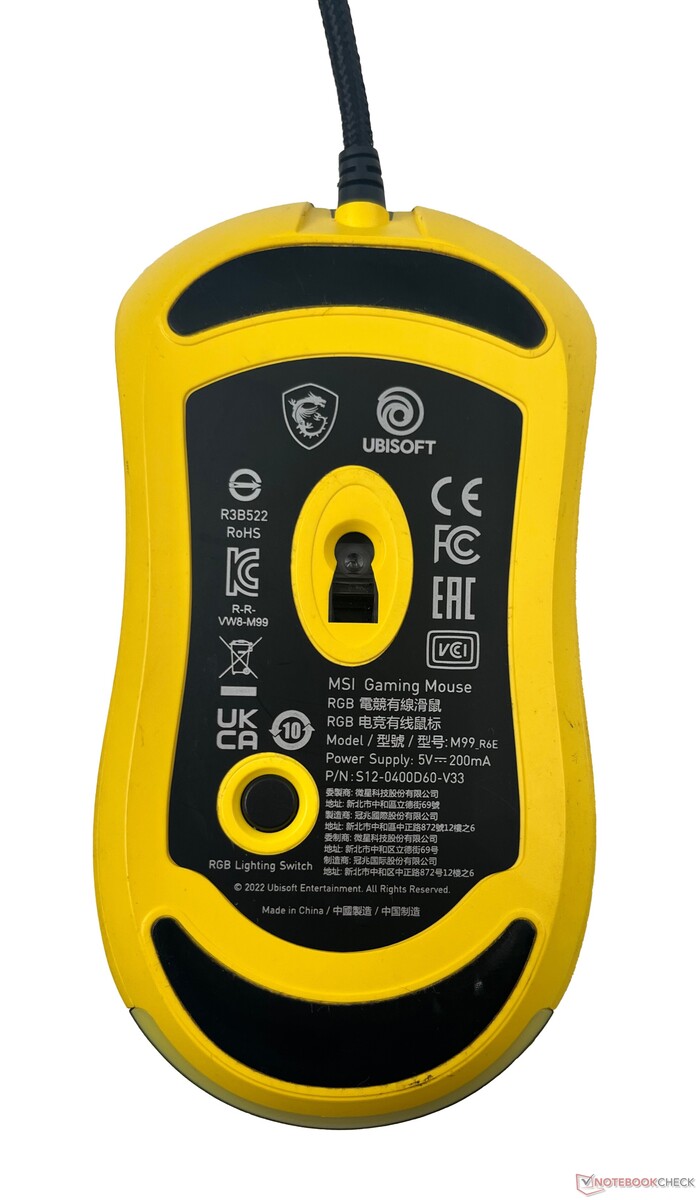
La souris est une version personnalisée de la MSI M99. Elle utilise un capteur Avago 3050 avec une résolution de 4 000 DPI et une fréquence d'interrogation de 500 Hz. Elle n'est évidemment pas dans la ligue d'un Corsair IronClaw RGB ou même de la Mad Catz R.A.T. Airmais c'est tout de même une offre gratuite décente.
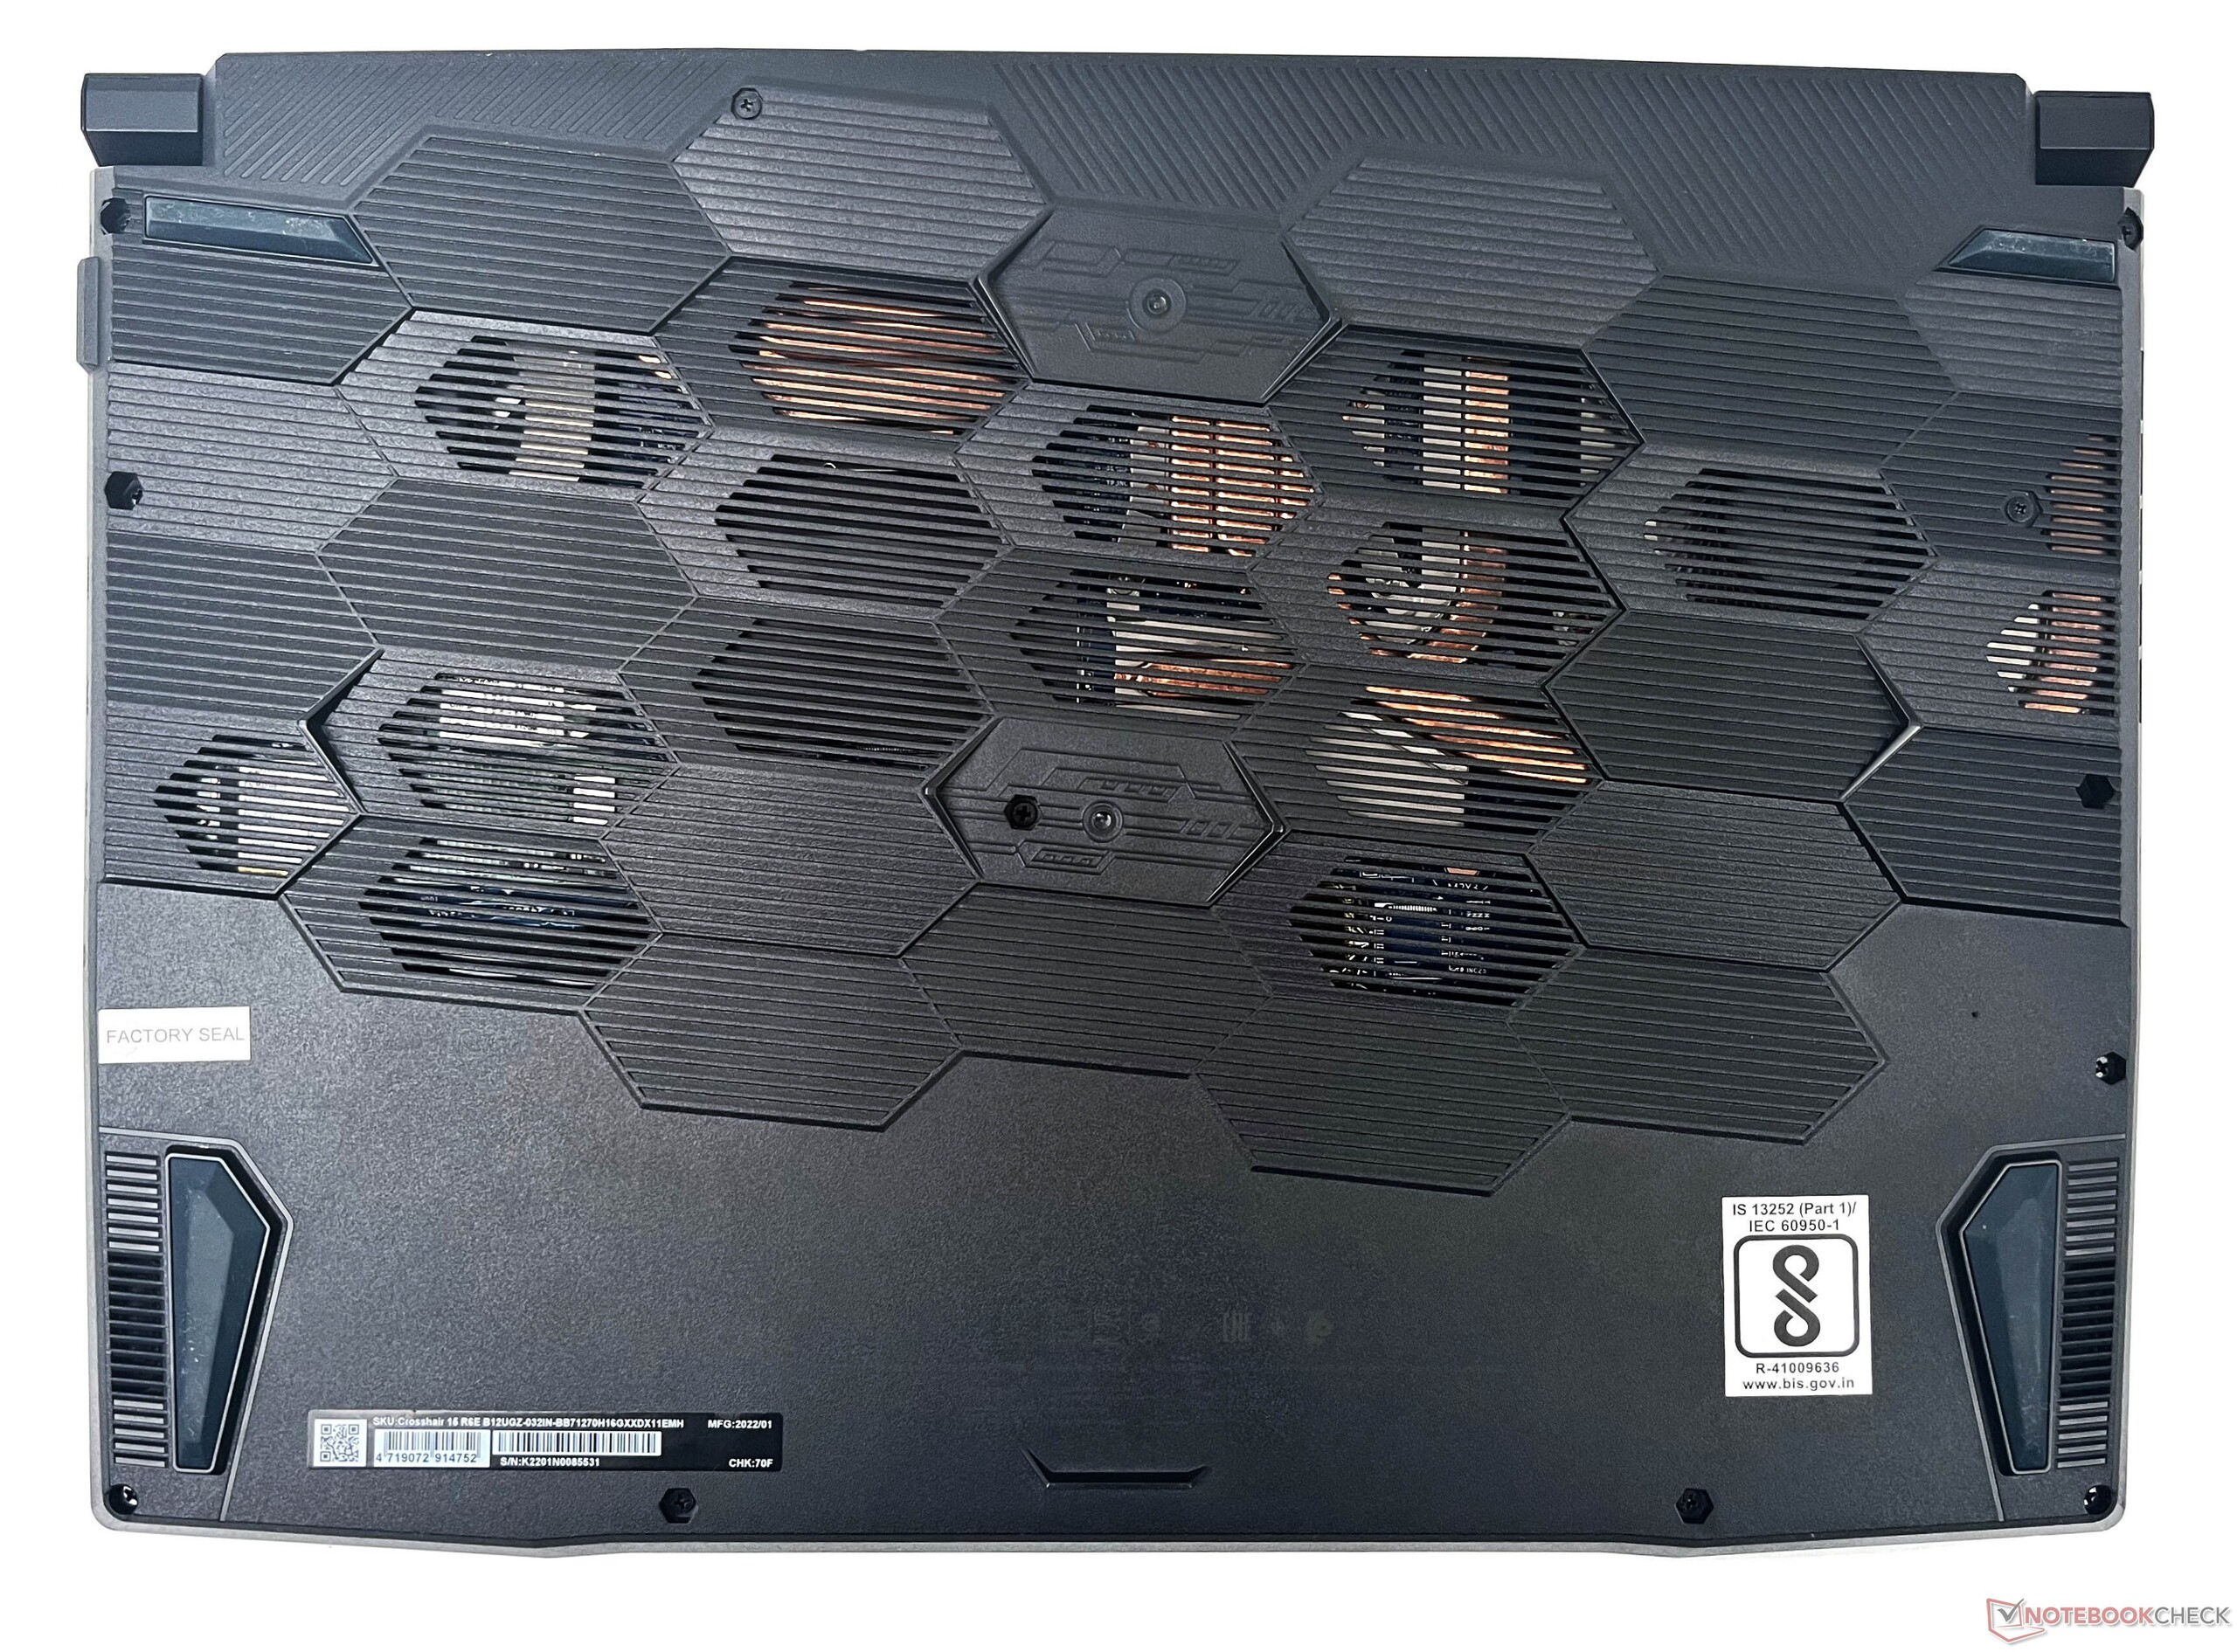
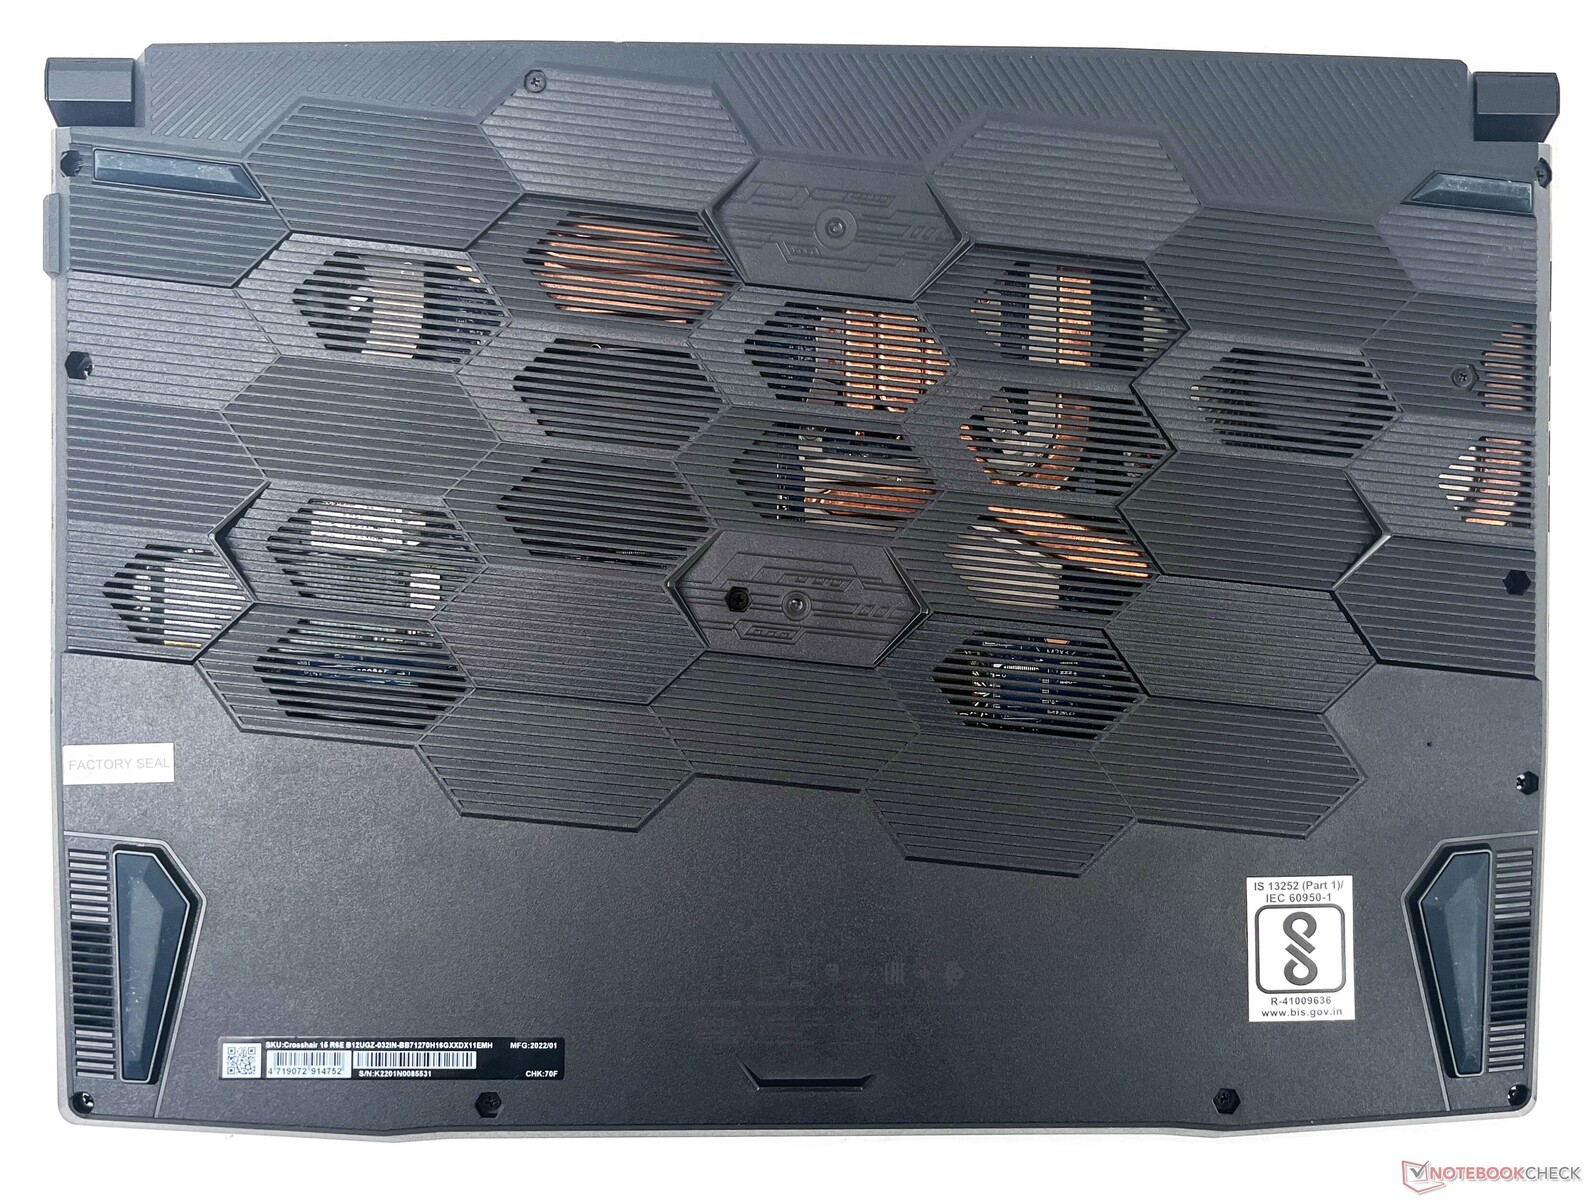
Maintenance
Comme c'est la norme avec les échantillons MSI, nous n'avons pas pu retirer l'autocollant Factory Seal qui cache l'une des vis. Ceci étant dit, l'ouverture du panneau arrière est assez simple et les utilisateurs devraient être en mesure d'effectuer des mises à niveau sans problèmes.
Garantie
MSI offre une garantie de deux ans pour le Crosshair 15 R6E qui comprend également un an d'assurance voyage dans les centres de service agréés MSI.
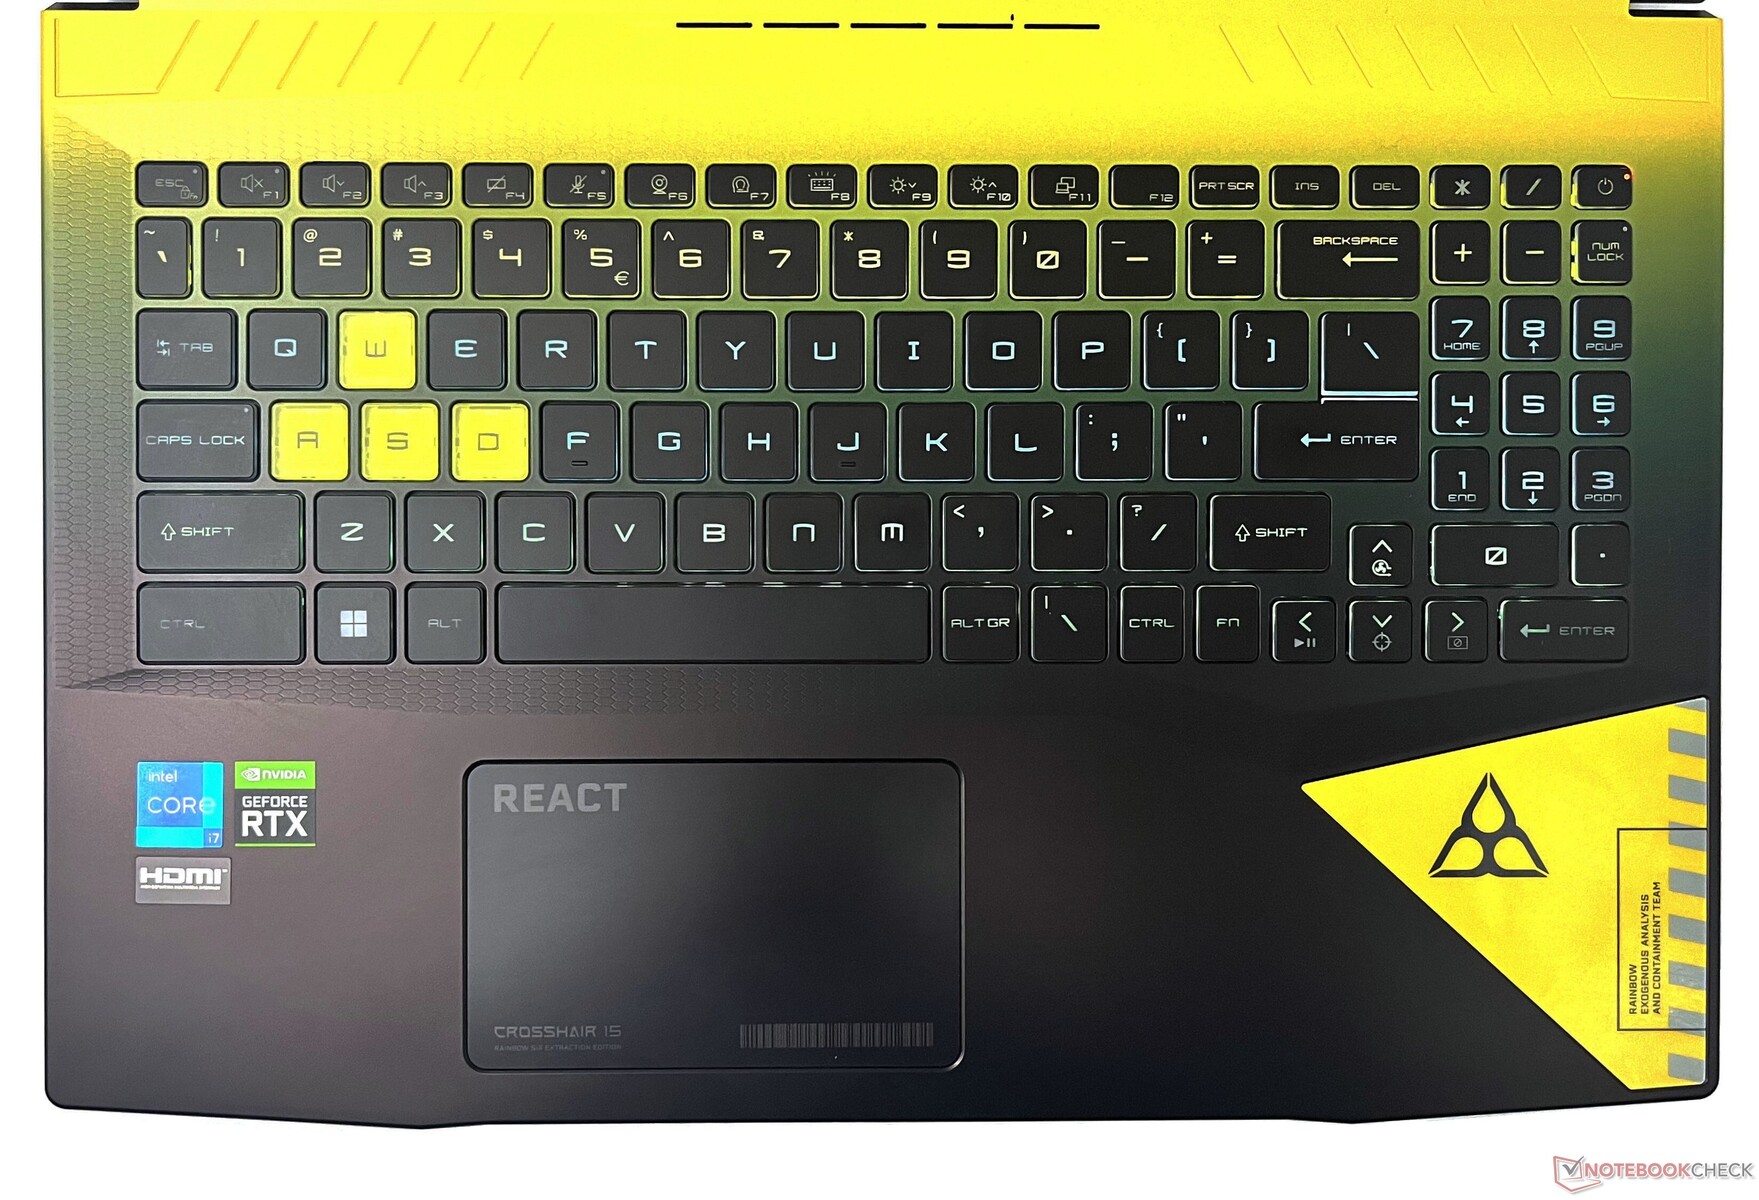
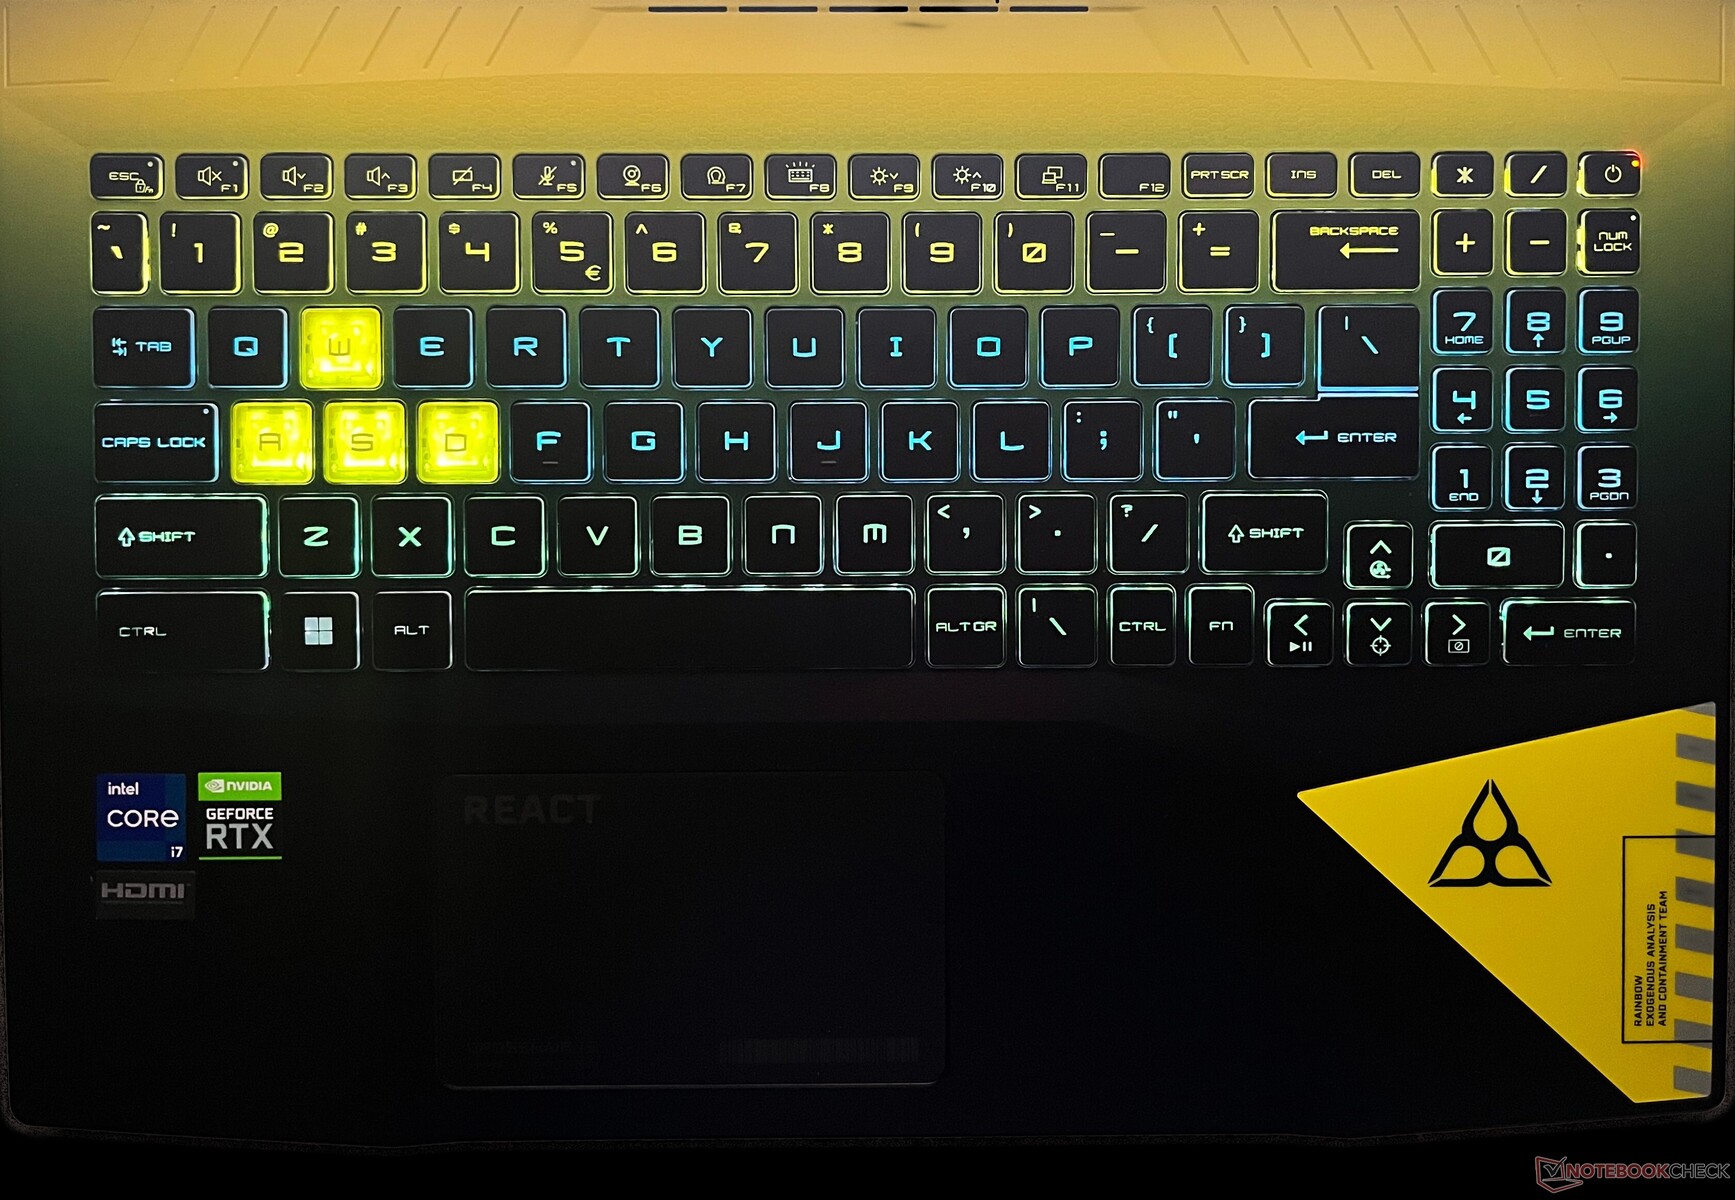
Périphériques d'entrée : Correction des couleurs du rétroéclairage thématique
Clavier
Le clavier du Crosshair 15 R6E n'est pas doté de la technologie RGB ou de l'une des fonctions sophistiquées de SteelSeries, mais MSI a intégré ce qu'il appelle un clavier Spectrum Backlight. Essentiellement, les lumières du clavier sont inspirées par - vous l'avez deviné - le jeu Rainbow Six : Extraction avec des couleurs jaunes et bleues
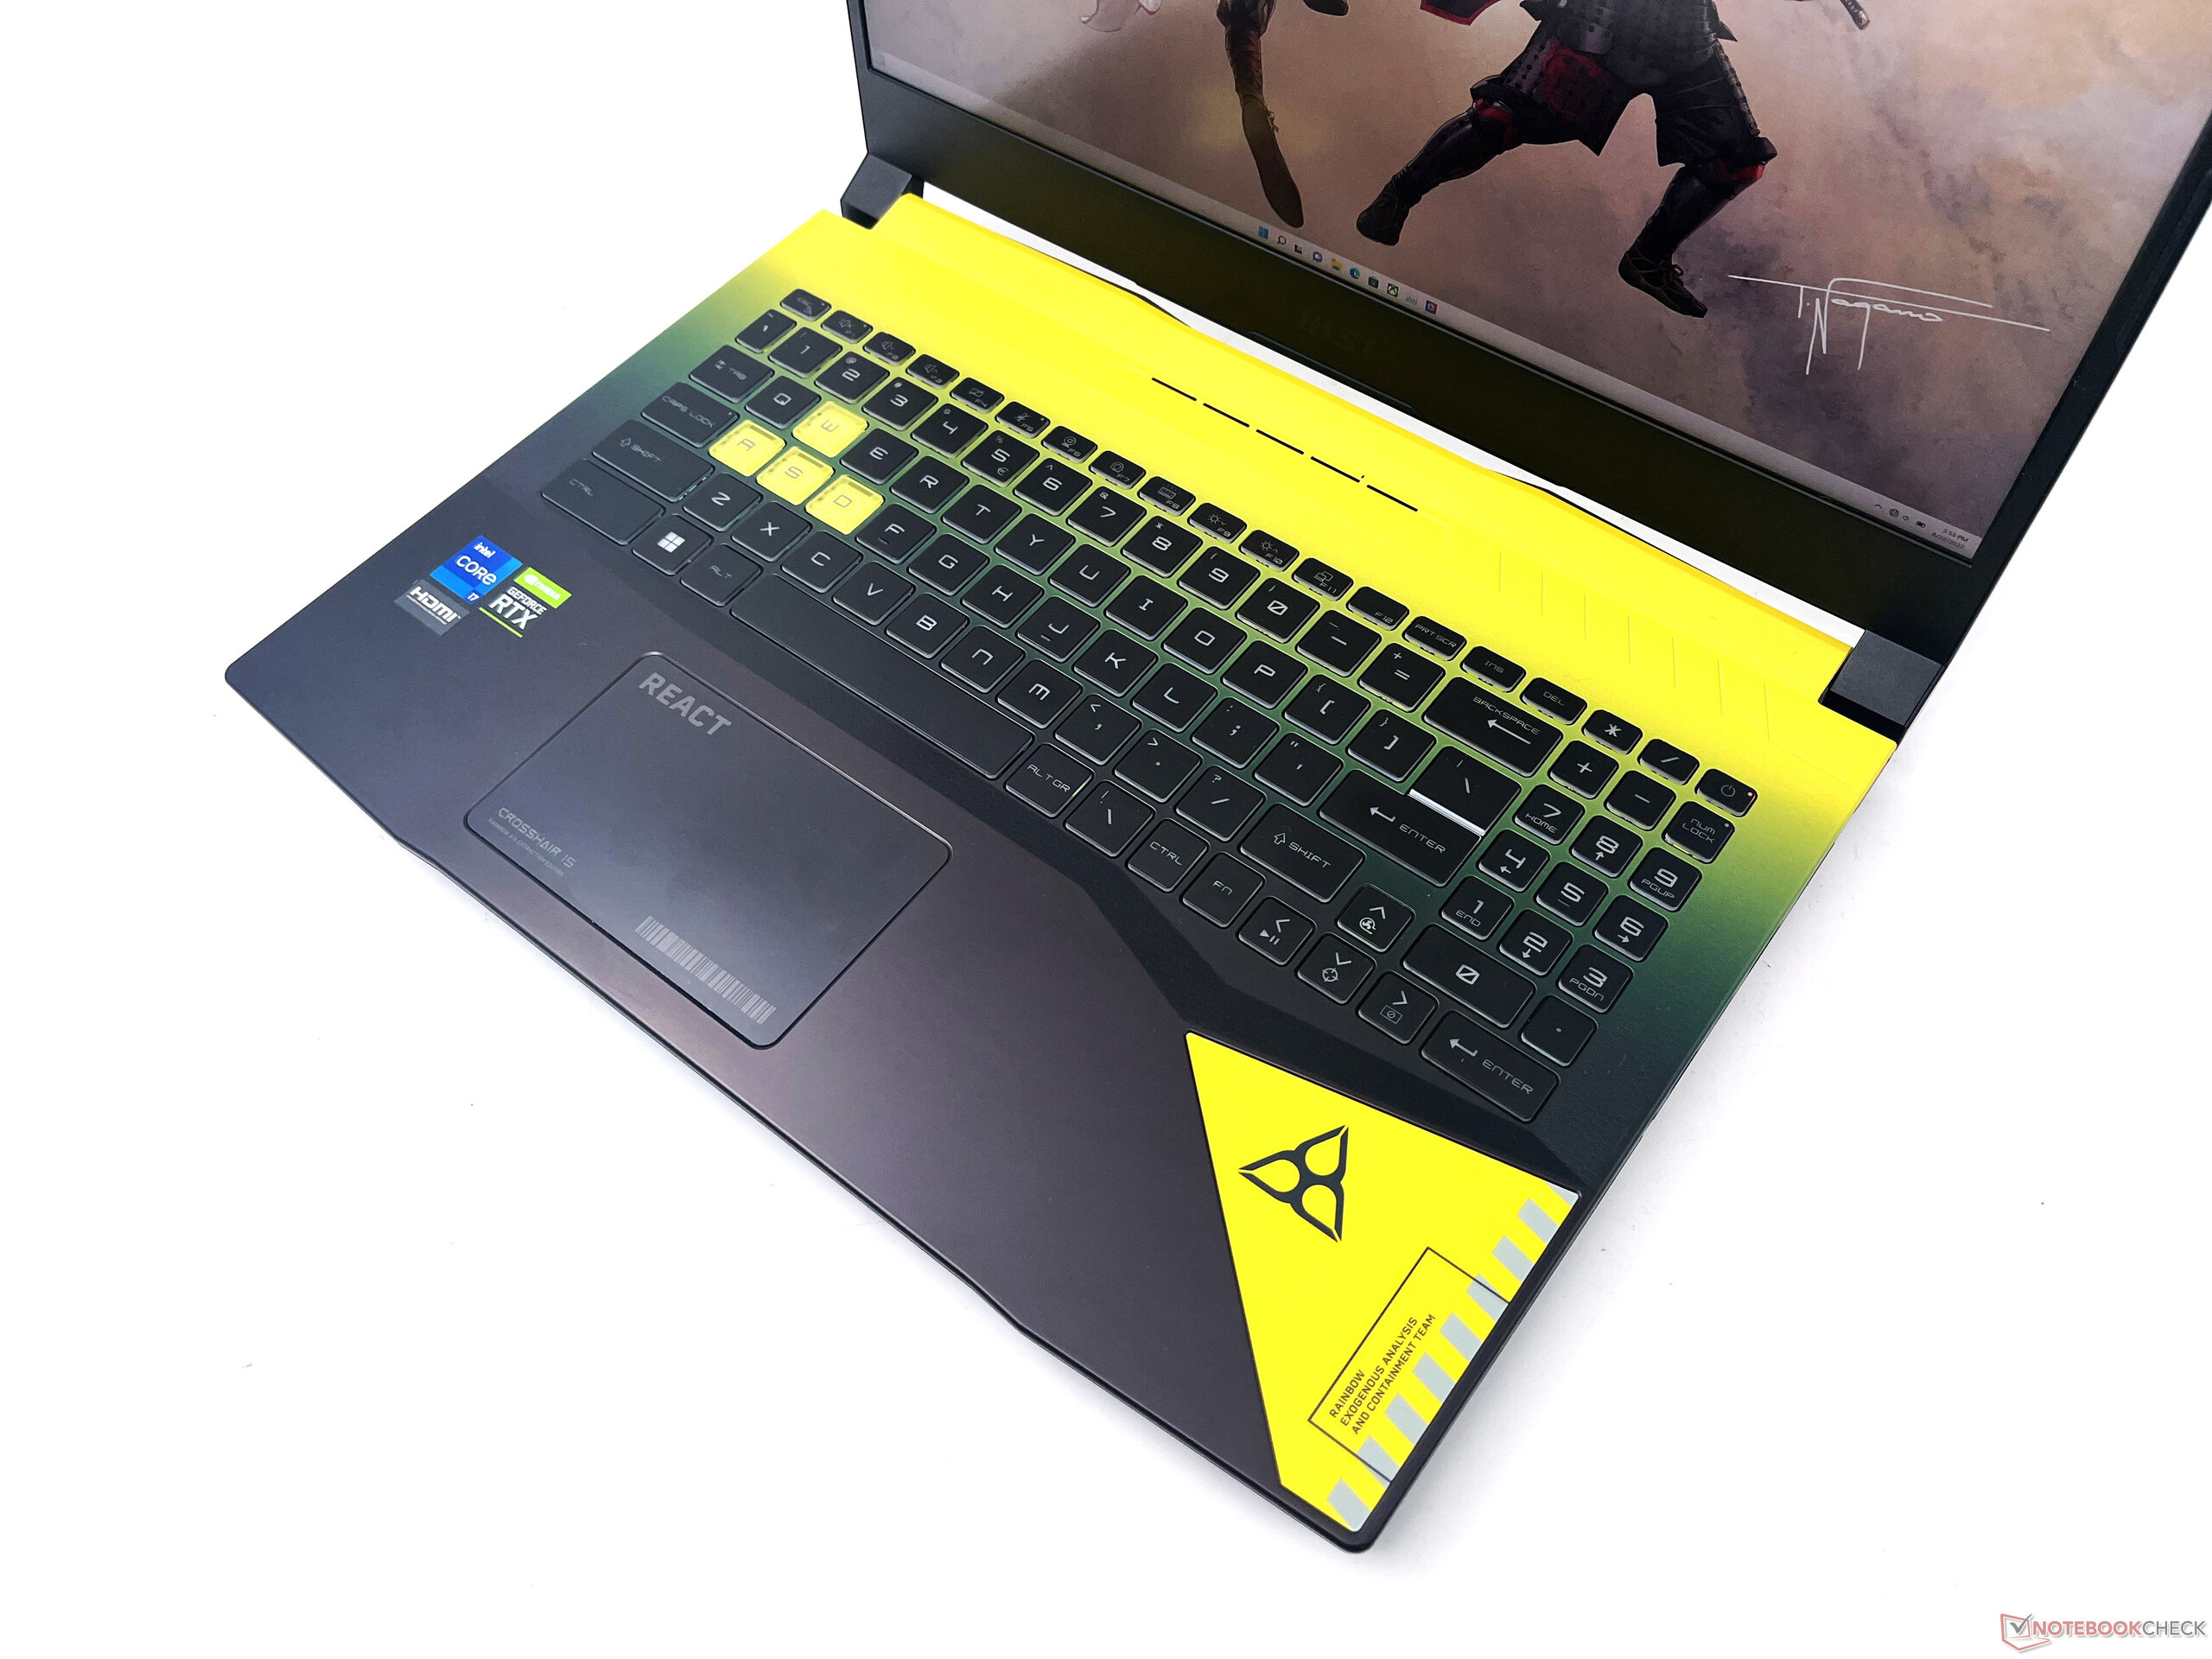
Chaque touche a un éclairage fixe qui ne peut pas être personnalisé, bien que l'intensité du rétroéclairage global lui-même puisse être ajustée via un raccourci clavier. Les touches ont une bonne course de 1,7 mm et un retour tactile décent
L'inclusion du pavé numérique est bienvenue, et les touches fléchées ne sont pas écrasées. Les fonctions secondaires sont heureusement éclairées, ce qui les rend faciles à reconnaître dans l'obscurité.
Si vous n'êtes pas habitué aux ordinateurs portables MSI, vous devez noter que la touche Fn est placée à droite au lieu de sa position habituelle.
Pavé tactile
Le pavé tactile de 10,5 cm x 6,5 cm porte le logo REACT du jeu et le label Crosshair 15. En termes de fonctionnalité, il s'apparente aux pavés tactiles que nous avons vus sur ses cousins Pulse et Katana.
La réponse du pavé tactile est bonne et les gestes fonctionnent bien grâce aux pilotes de Windows Precision. Les boutons gauche et droit de la souris sont alignés avec le pavé tactile et cliquent sans effort, bien qu'avec un certain bruit.
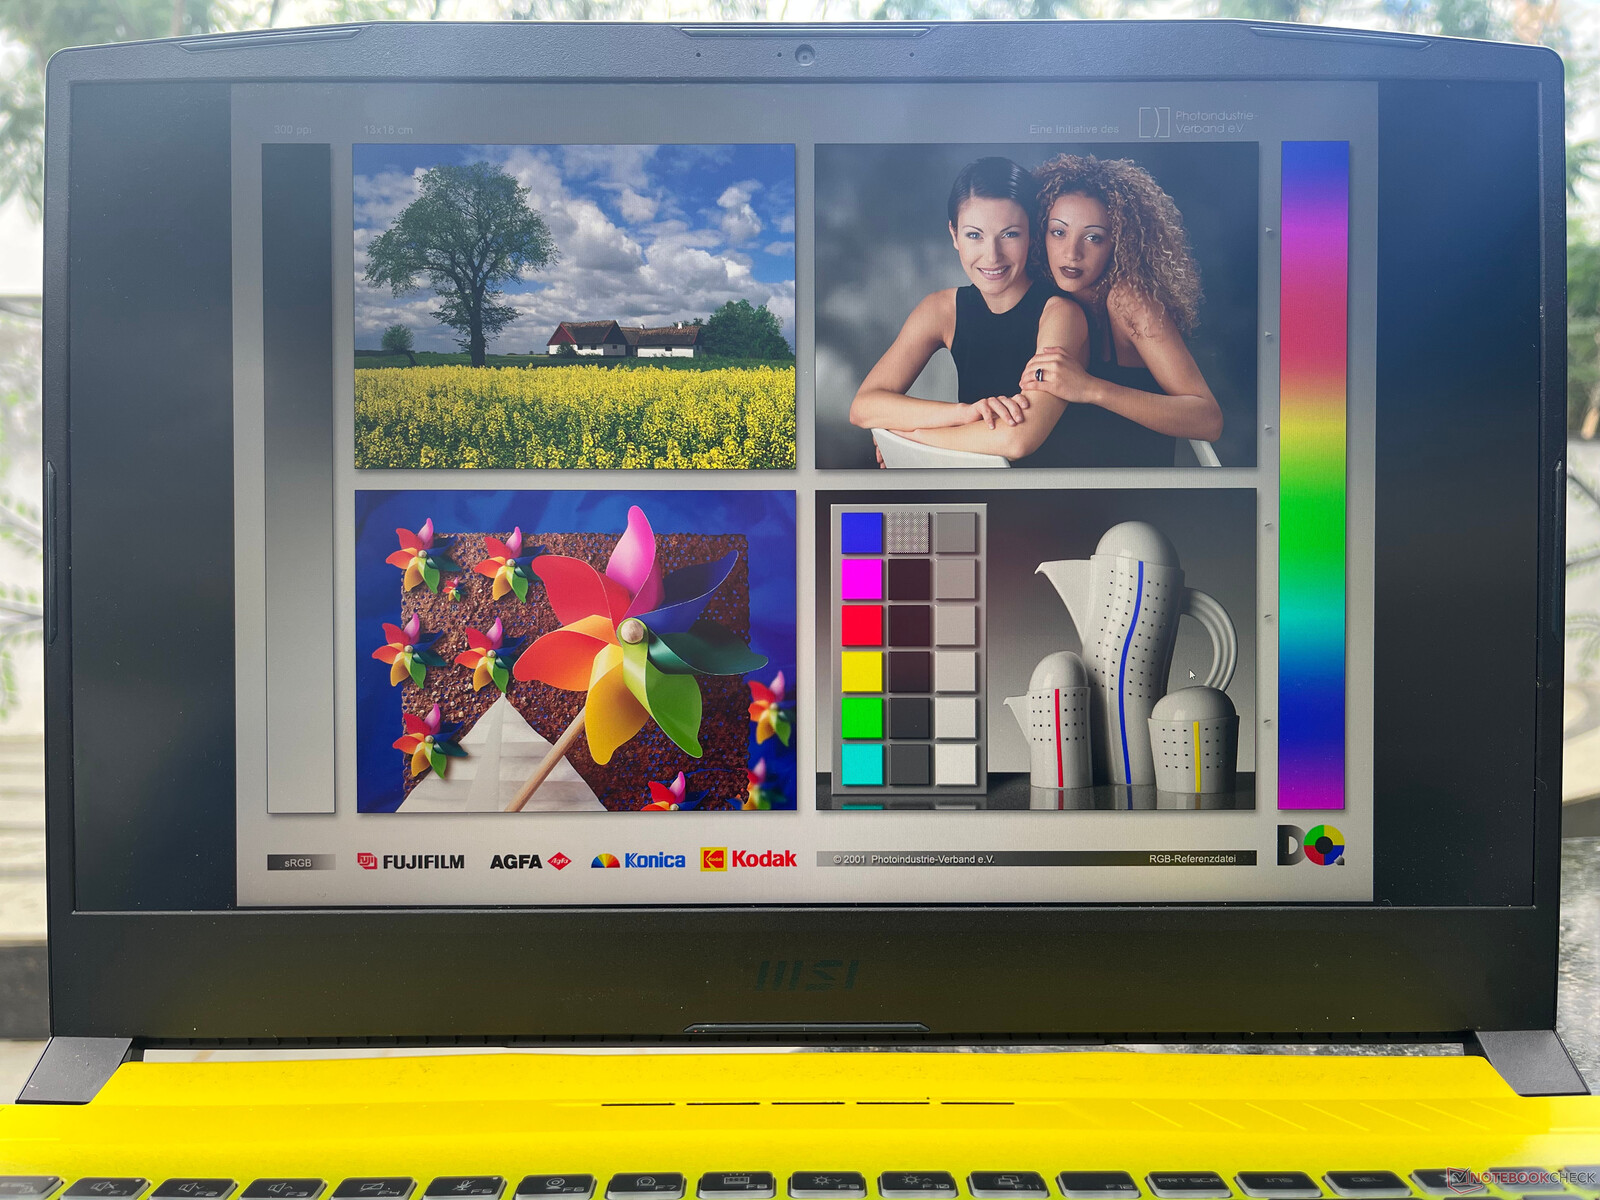
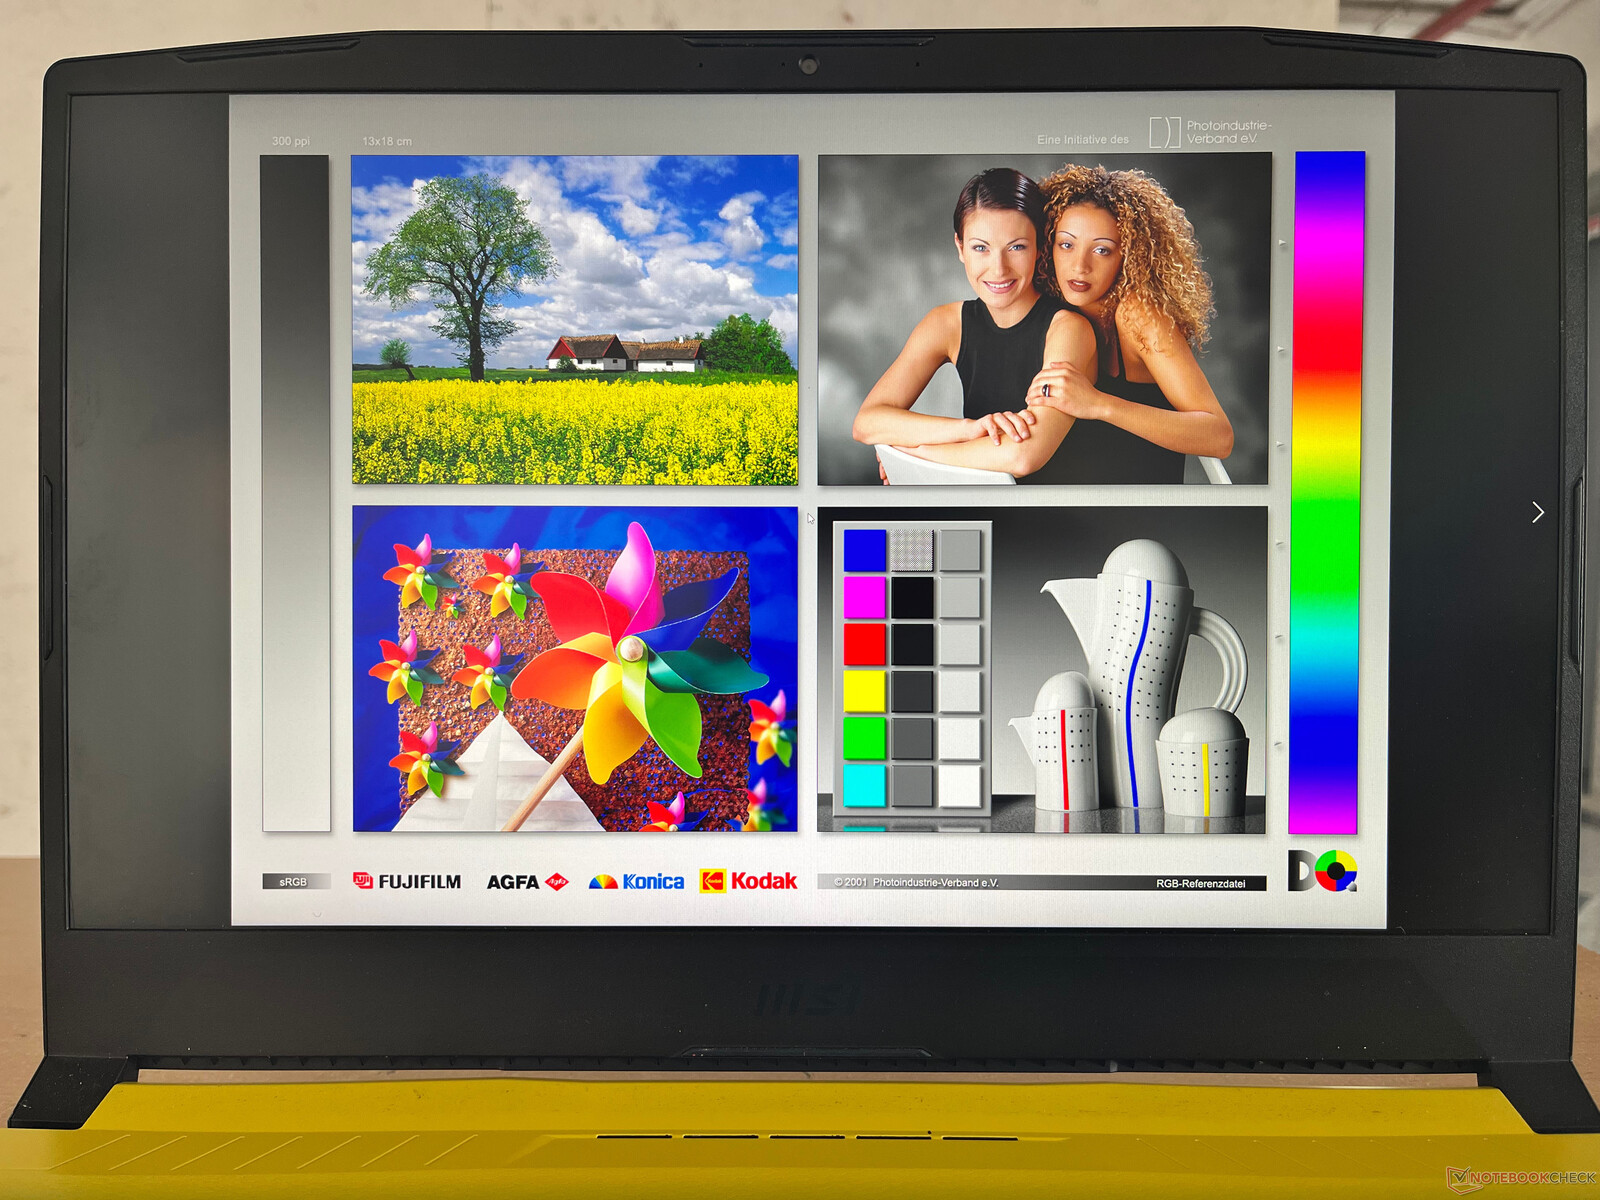
Affichage : Panneau QHD 165 Hz avec couverture étendue des couleurs et sans PWM
MSI propose une dalle IPS QHD de 15,6 pouces avec un taux de rafraîchissement de 165 Hz dans les deux UGS Crosshair 15 R6E. Il n'y a pas de support HDR10 ou Dolby Vision. Nous avons enregistré une luminosité maximale de 342 nits, ce qui devrait convenir à une utilisation en intérieur.
Une distribution de la luminosité de 89% et un rapport de contraste mesuré de 1069:1 offrent une expérience visuelle décente. Cela est similaire à ce que nous avions observé précédemment avec le Asus ROG Zephyrus G15 et le Acer Nitro 5qui utilisent la même dalle.
Cependant, nous constatons un important saignement du rétroéclairage près des coins inférieurs de l'écran.


| |||||||||||||||||||||||||
Homogénéité de la luminosité: 89 %
Valeur mesurée au centre, sur batterie: 341 cd/m²
Contraste: 1069:1 (Valeurs des noirs: 0.32 cd/m²)
ΔE ColorChecker Calman: 3.71 | ∀{0.5-29.43 Ø4.71}
calibrated: 2.59
ΔE Greyscale Calman: 3 | ∀{0.09-98 Ø4.96}
84.7% AdobeRGB 1998 (Argyll 3D)
99.8% sRGB (Argyll 3D)
94.8% Display P3 (Argyll 3D)
Gamma: 2.07
CCT: 6621 K
| MSI Crosshair 15 R6E B12UGZ-050 CMN N156KME-GNA, IPS-Level, 2560x1440, 15.6" | MSI Stealth GS66 12UGS Sharp LQ156T1JW04 (SHP153C), IPS-Level, 2560x1440, 15.6" | Lenovo Legion 5 Pro 16 G7 i7 RTX 3070Ti NE160QDM-NY1, IPS, 2560x1600, 16" | Acer Nitro 5 AN515-58-72QR Chi Mei N156KME-GNA, IPS, 2560x1440, 15.6" | Schenker XMG Neo 15 (Ryzen 9 6900HX, RTX 3070 Ti) BOE0A67, IPS, 2560x1440, 15.6" | |
|---|---|---|---|---|---|
| Display | 1% | -15% | 1% | -15% | |
| Display P3 Coverage (%) | 94.8 | 96.4 2% | 68.7 -28% | 95.6 1% | 68.9 -27% |
| sRGB Coverage (%) | 99.8 | 99.7 0% | 97.6 -2% | 99.8 0% | 97.7 -2% |
| AdobeRGB 1998 Coverage (%) | 84.7 | 85.6 1% | 70.9 -16% | 85.2 1% | 70.4 -17% |
| Response Times | -8% | -112% | -110% | -70% | |
| Response Time Grey 50% / Grey 80% * (ms) | 5.36 ? | 6 ? -12% | 17.6 ? -228% | 15.7 ? -193% | 12.4 ? -131% |
| Response Time Black / White * (ms) | 8.04 ? | 8.4 ? -4% | 7.6 ? 5% | 10.2 ? -27% | 8.8 ? -9% |
| PWM Frequency (Hz) | |||||
| Screen | -13% | 25% | -1% | 14% | |
| Brightness middle (cd/m²) | 342 | 272 -20% | 502 47% | 332 -3% | 370 8% |
| Brightness (cd/m²) | 326 | 253 -22% | 491 51% | 303 -7% | 343 5% |
| Brightness Distribution (%) | 89 | 87 -2% | 91 2% | 86 -3% | 82 -8% |
| Black Level * (cd/m²) | 0.32 | 0.25 22% | 0.37 -16% | 0.29 9% | 0.28 12% |
| Contrast (:1) | 1069 | 1088 2% | 1357 27% | 1145 7% | 1321 24% |
| Colorchecker dE 2000 * | 3.71 | 3.73 -1% | 2.7 27% | 3.61 3% | 2.31 38% |
| Colorchecker dE 2000 max. * | 6.51 | 9.43 -45% | 4.5 31% | 7.71 -18% | 4.03 38% |
| Colorchecker dE 2000 calibrated * | 2.59 | 0.98 62% | 1.4 46% | 0.59 77% | |
| Greyscale dE 2000 * | 3 | 6.5 -117% | 2.7 10% | 5.2 -73% | 3.28 -9% |
| Gamma | 2.07 106% | 2.172 101% | 2.44 90% | 2.155 102% | 2.47 89% |
| CCT | 6621 98% | 6485 100% | 6326 103% | 6724 97% | 6206 105% |
| Moyenne finale (programmes/paramètres) | -7% /
-10% | -34% /
-3% | -37% /
-16% | -24% /
-6% |
* ... Moindre est la valeur, meilleures sont les performances
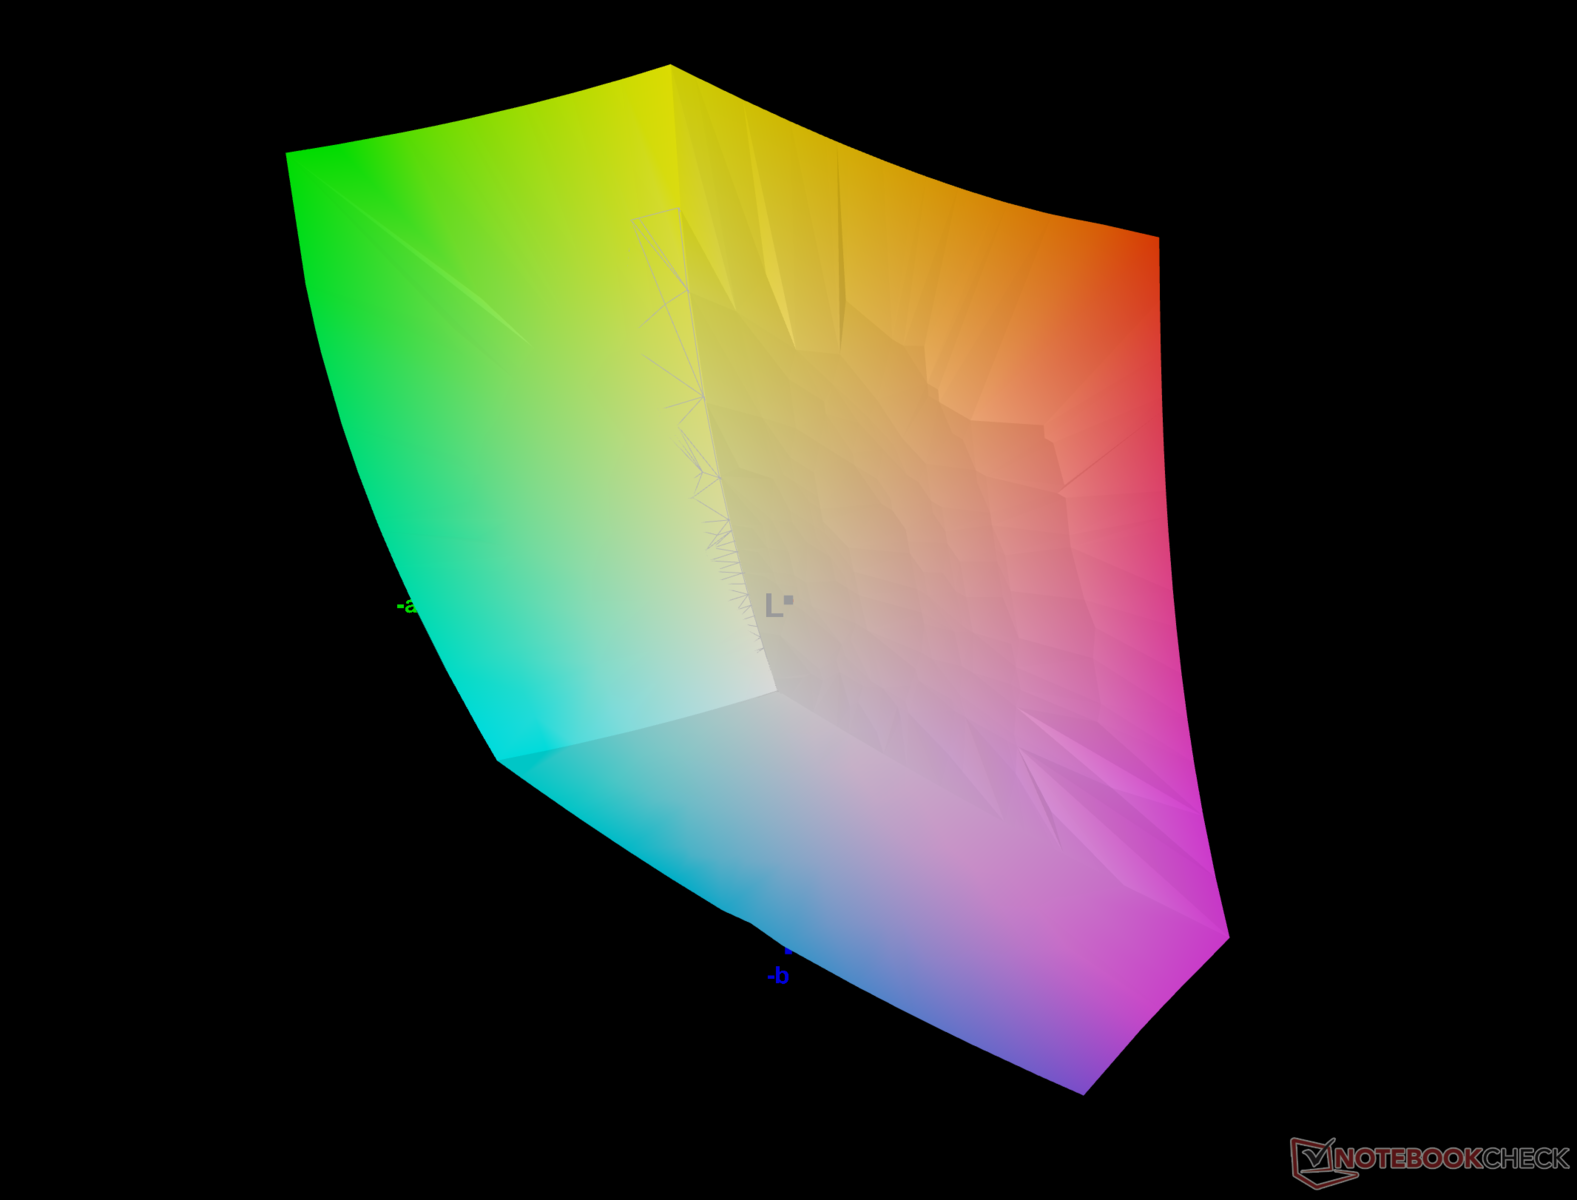
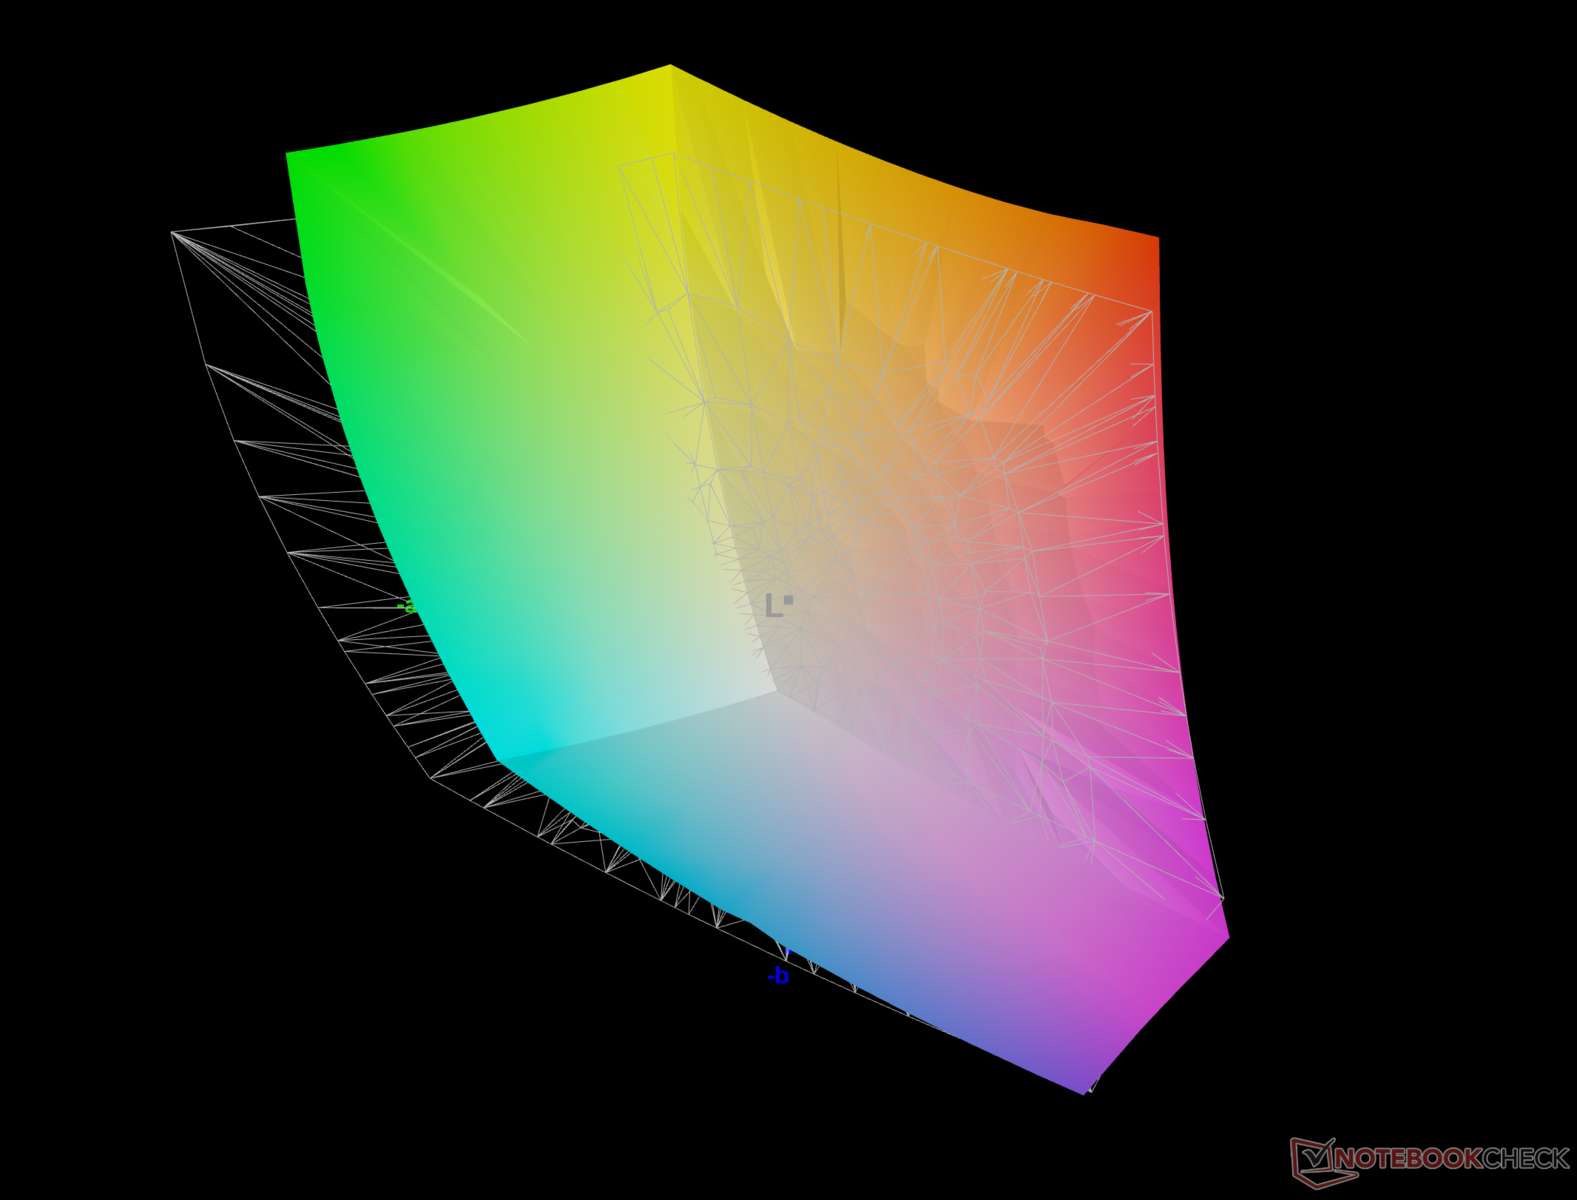
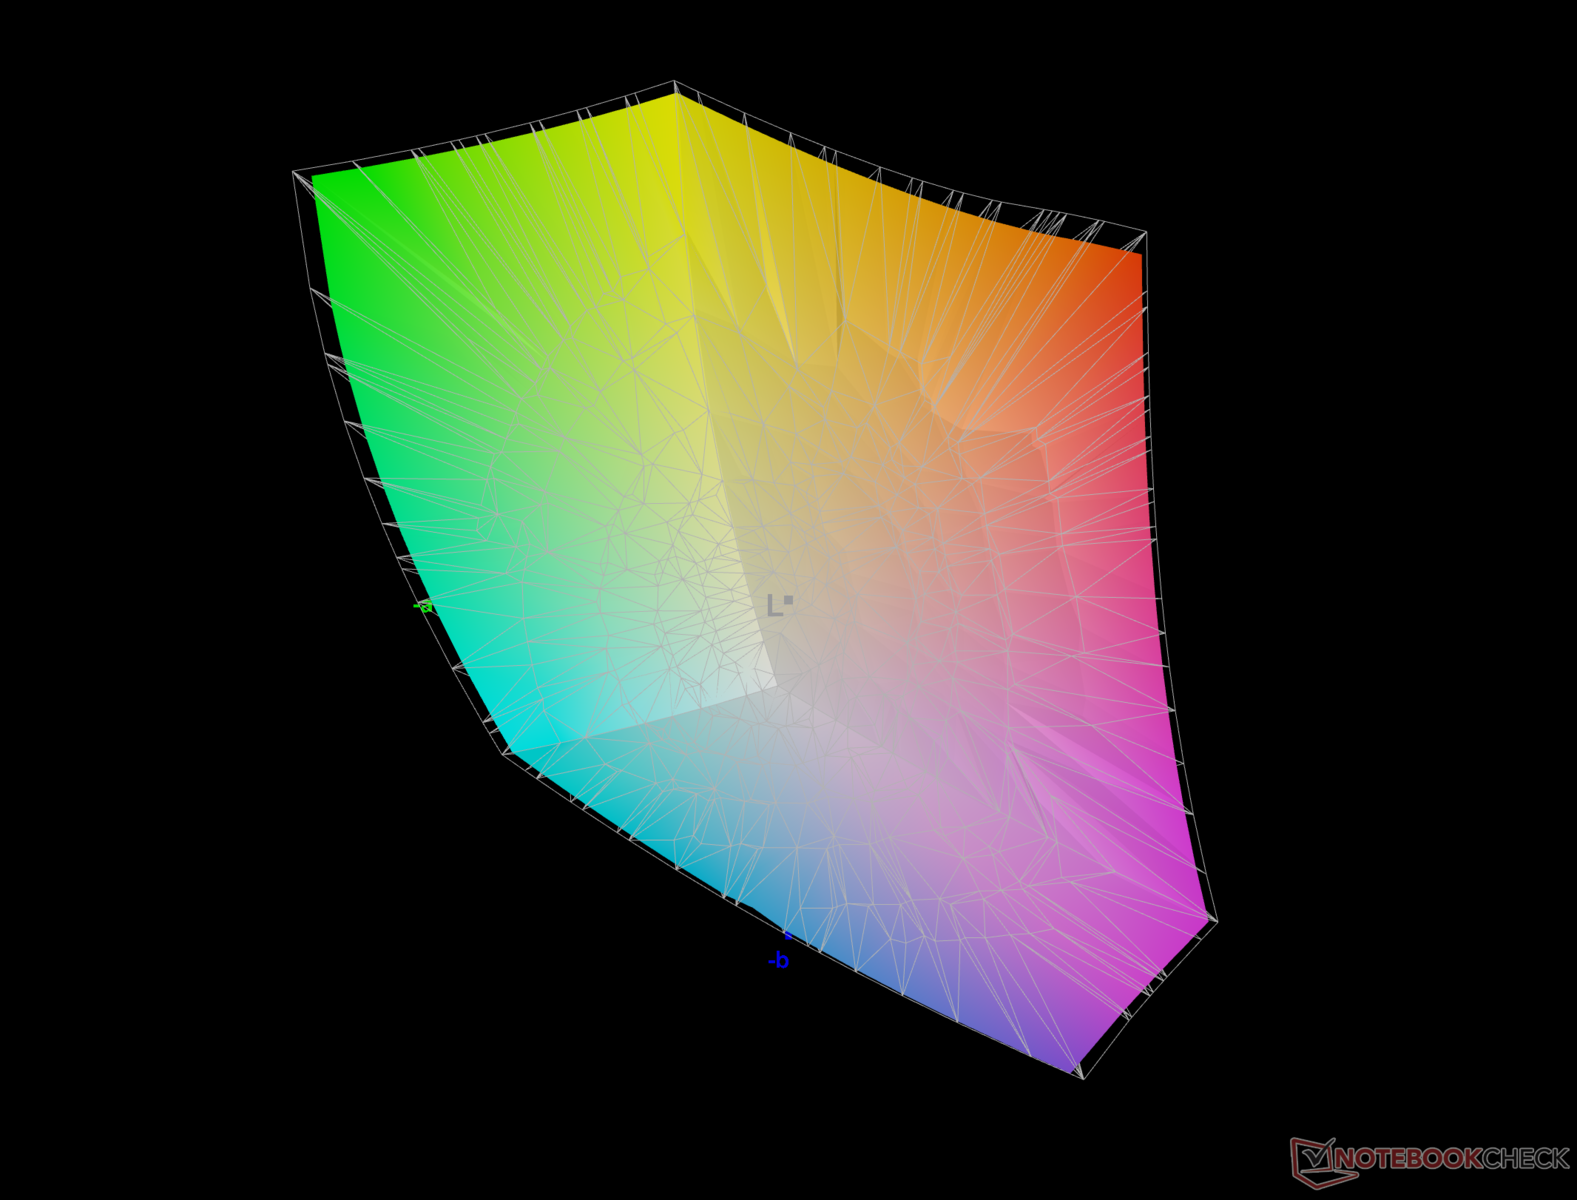
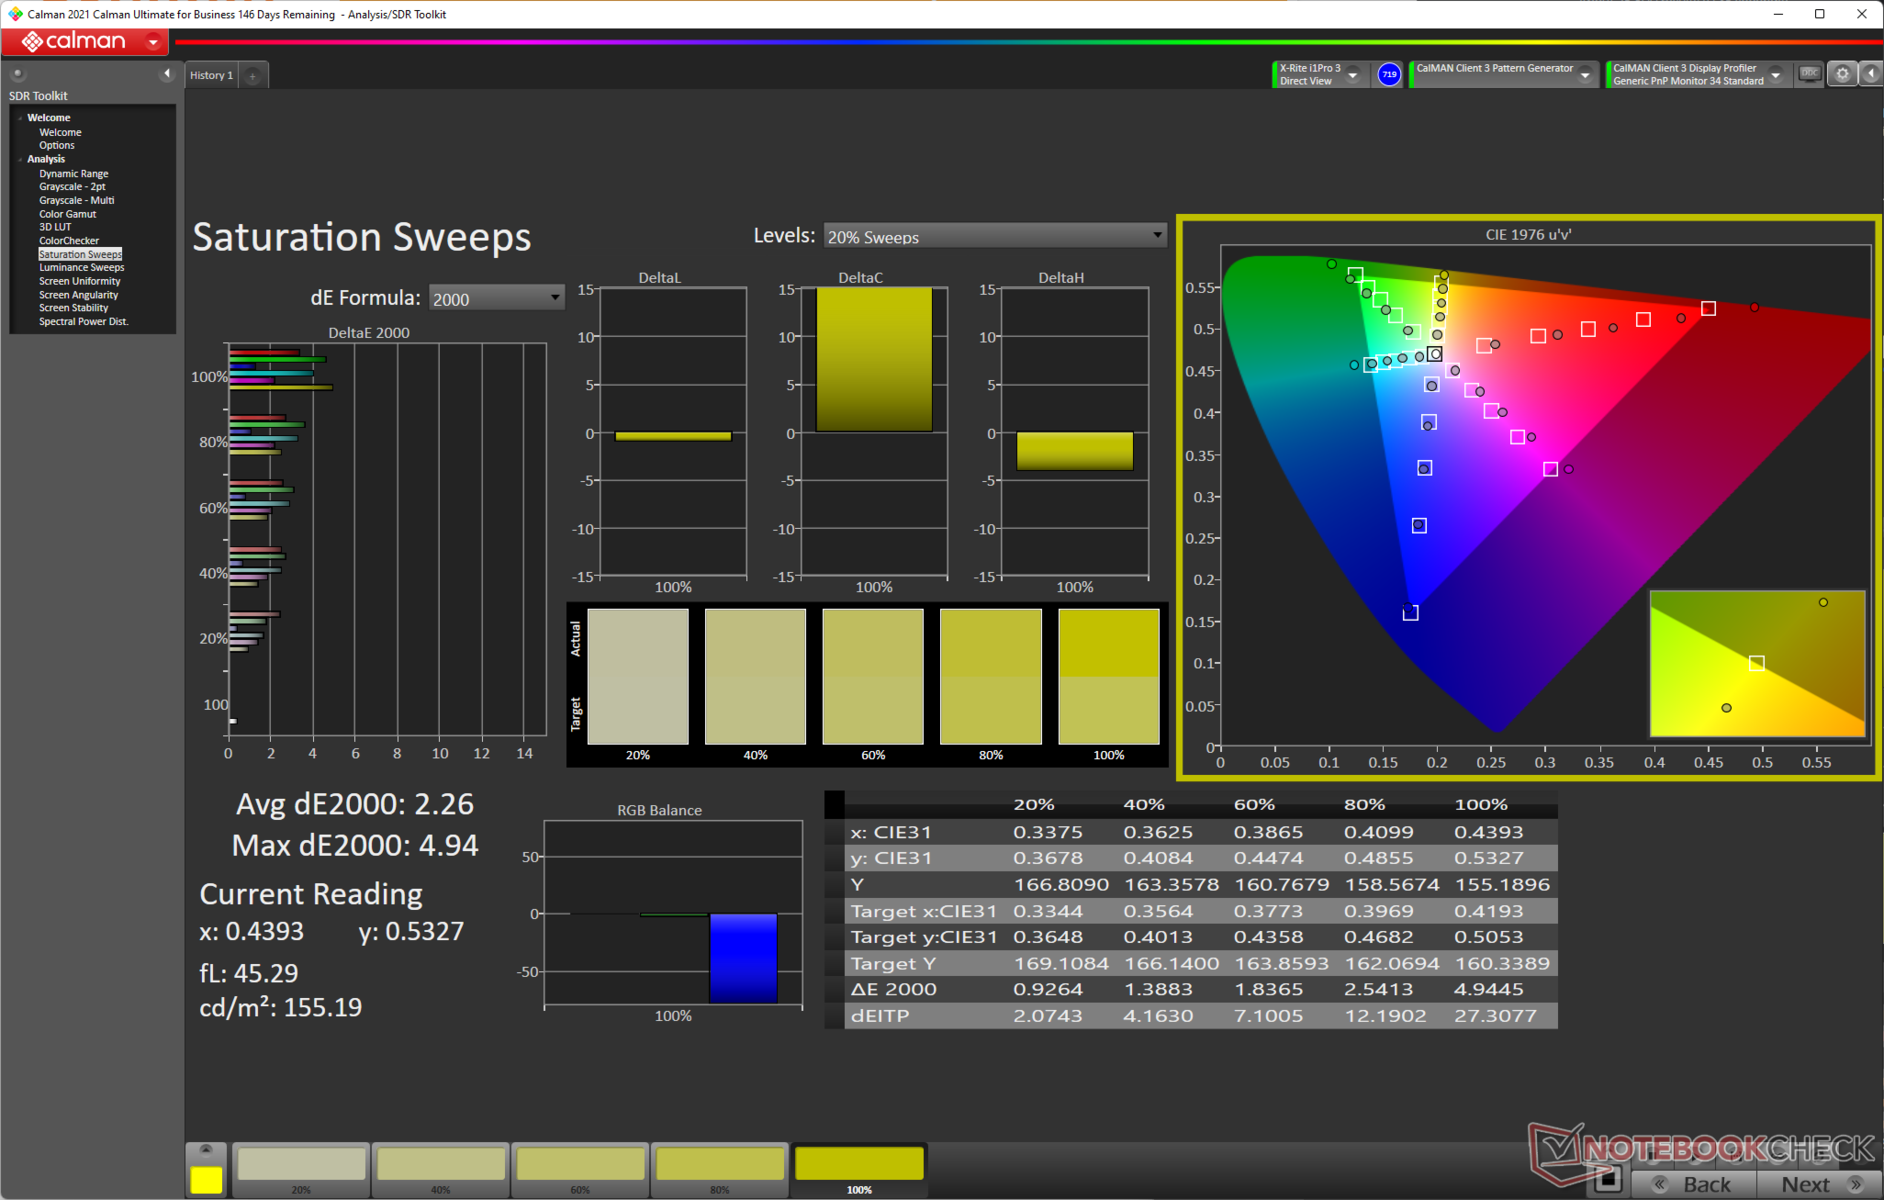
MSI affirme que la dalle de la Crosshair 15 peut couvrir 100% de l'espace couleur DCI-P3. Dans nos tests, nous avons constaté qu'il peut faire près de 95% de Display P3, ce qui devrait piquer l'intérêt des créateurs de contenu. L'écran couvre la gamme complète des couleurs sRGB. La couverture de l'espace Adobe RGB est également très bonne, avec près de 85 %.
Nous observons que la couverture de la gamme de couleurs est comparable à celle de l'Acer Nitro 5 et de l'Aorus 15 XE5 Aorus 15 XE5qui utilisent également la même dalle Chi Mei N156KME-GNA. Il est bon de voir que les fabricants envisagent enfin de bonnes performances en matière de couleurs à ces prix.
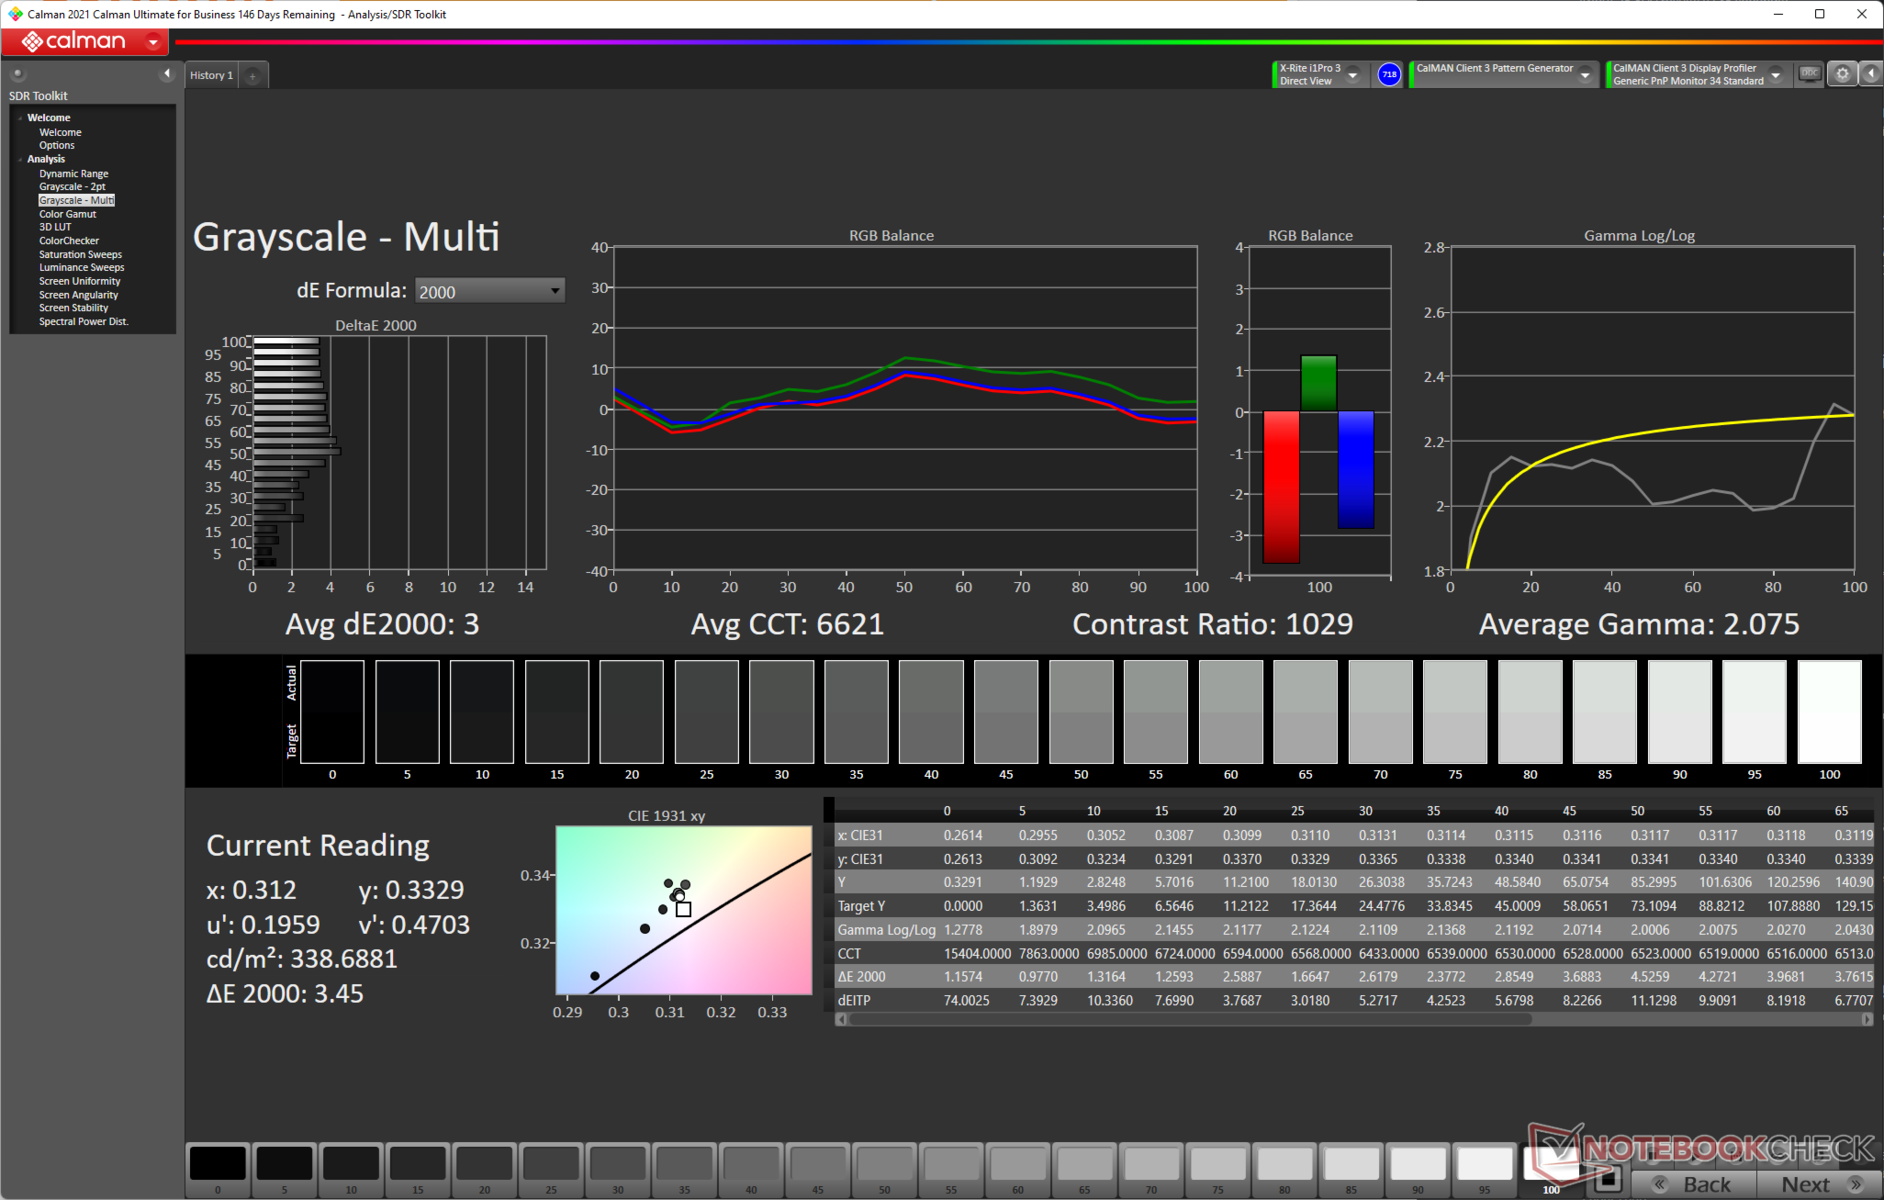
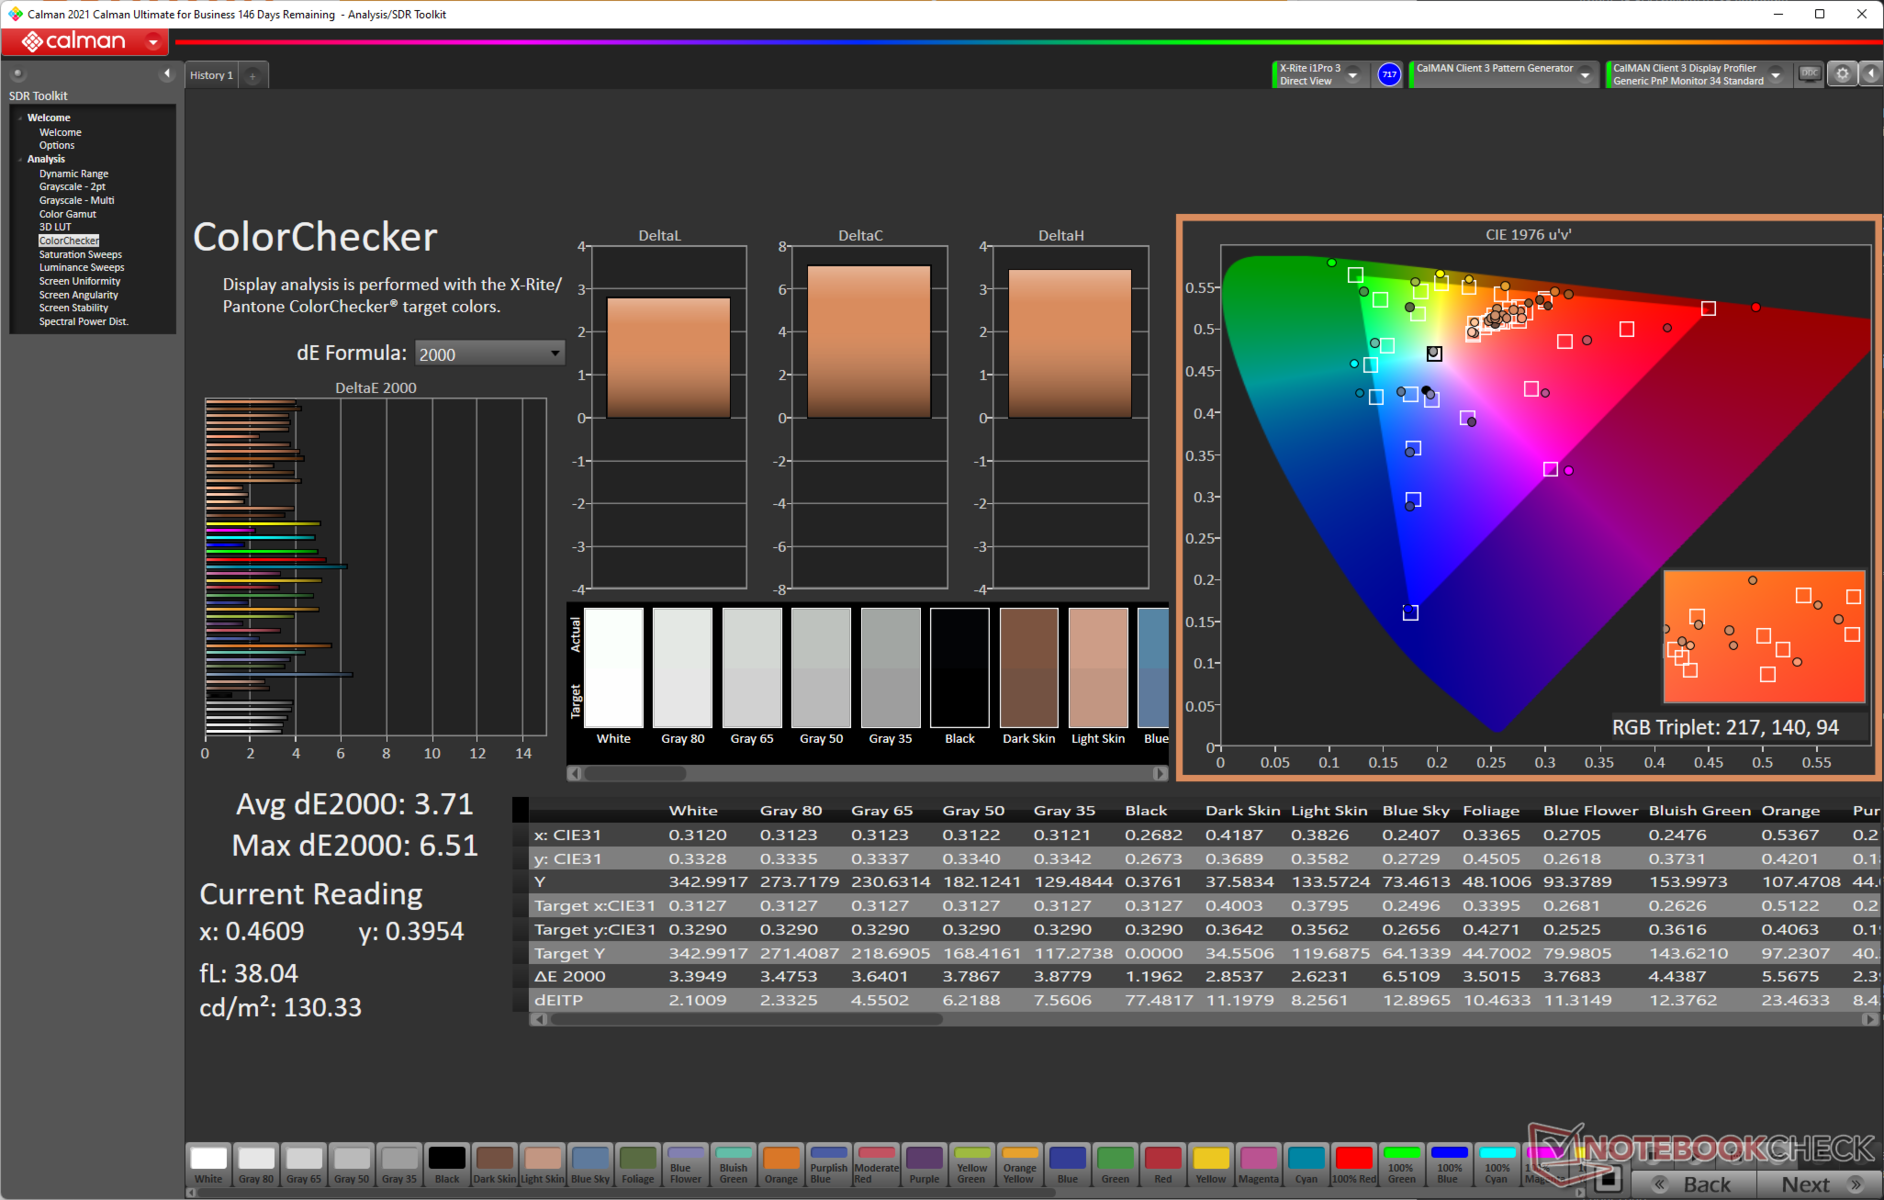
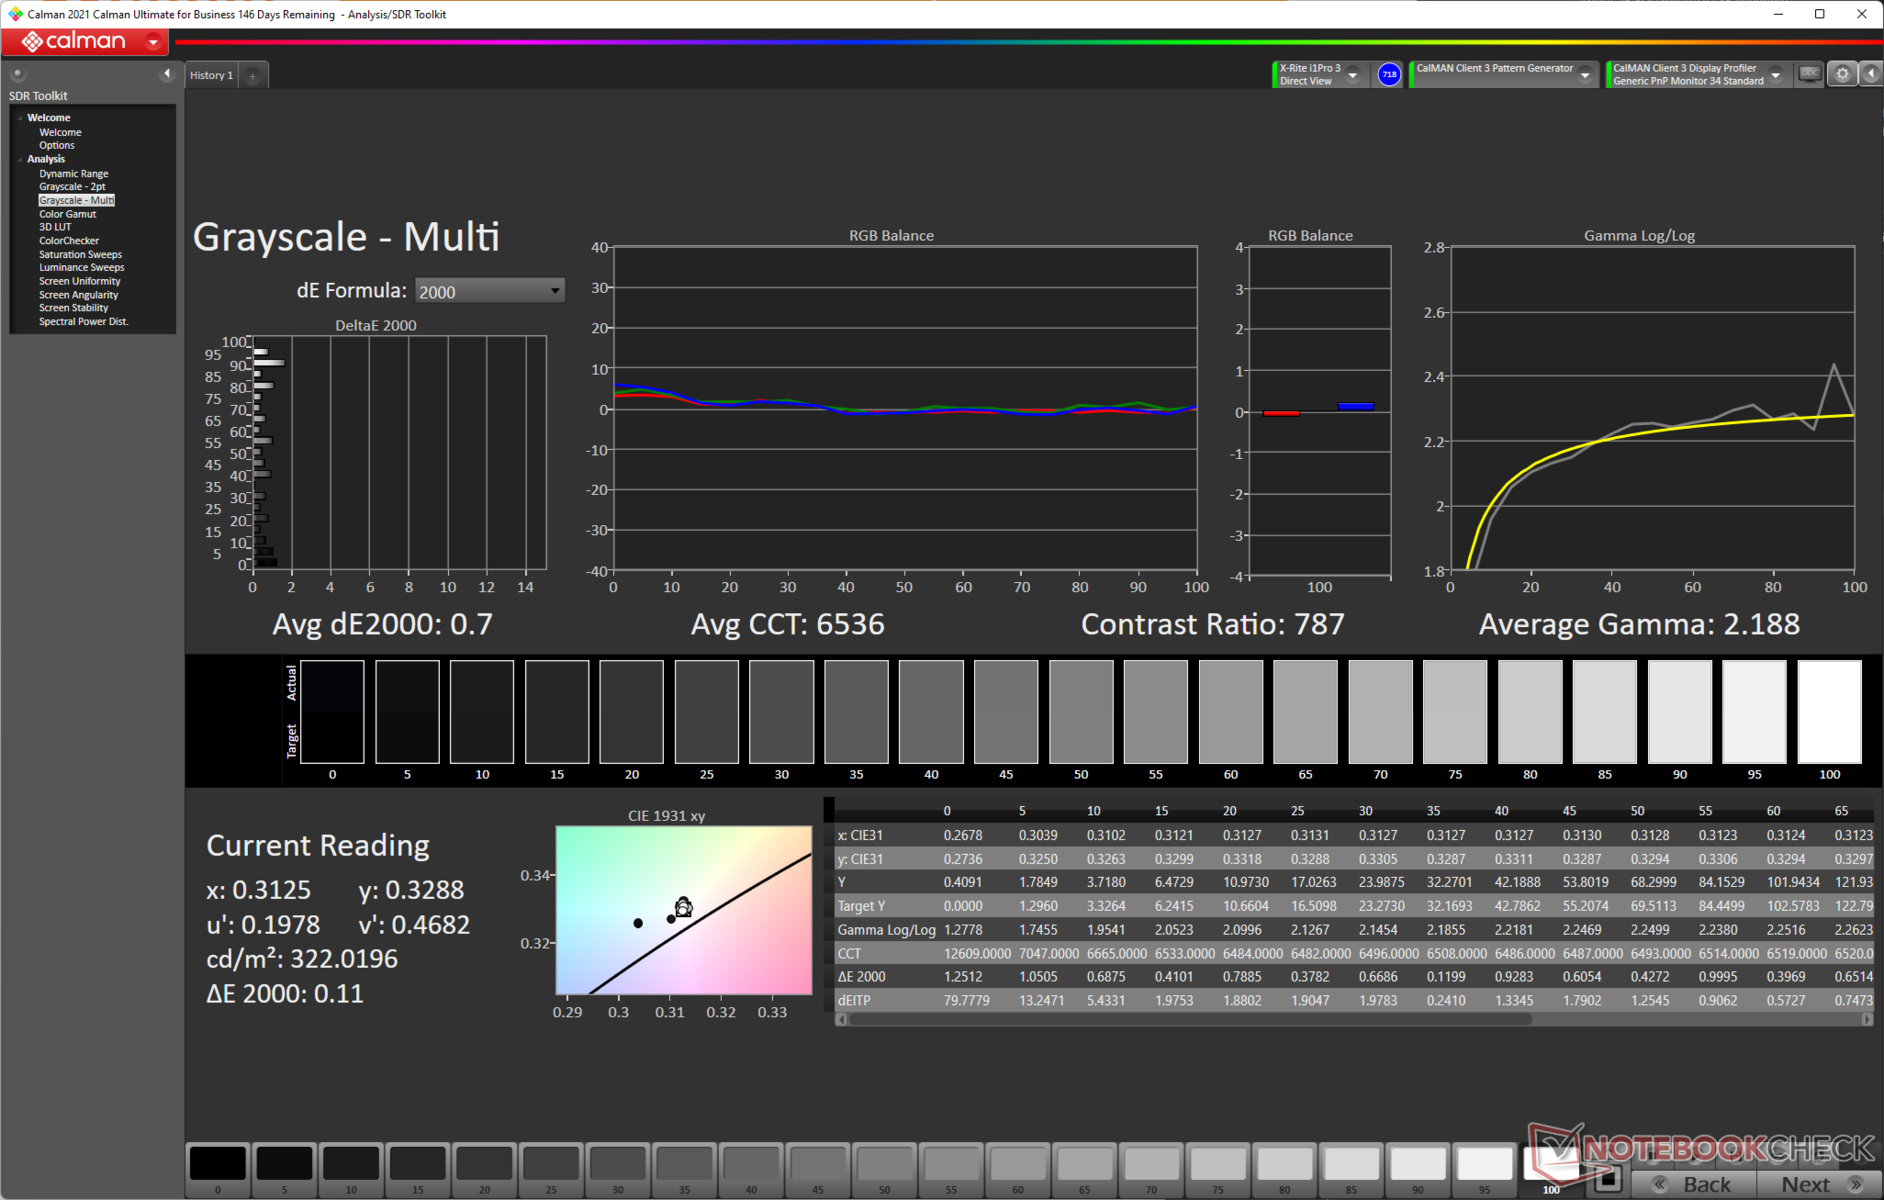
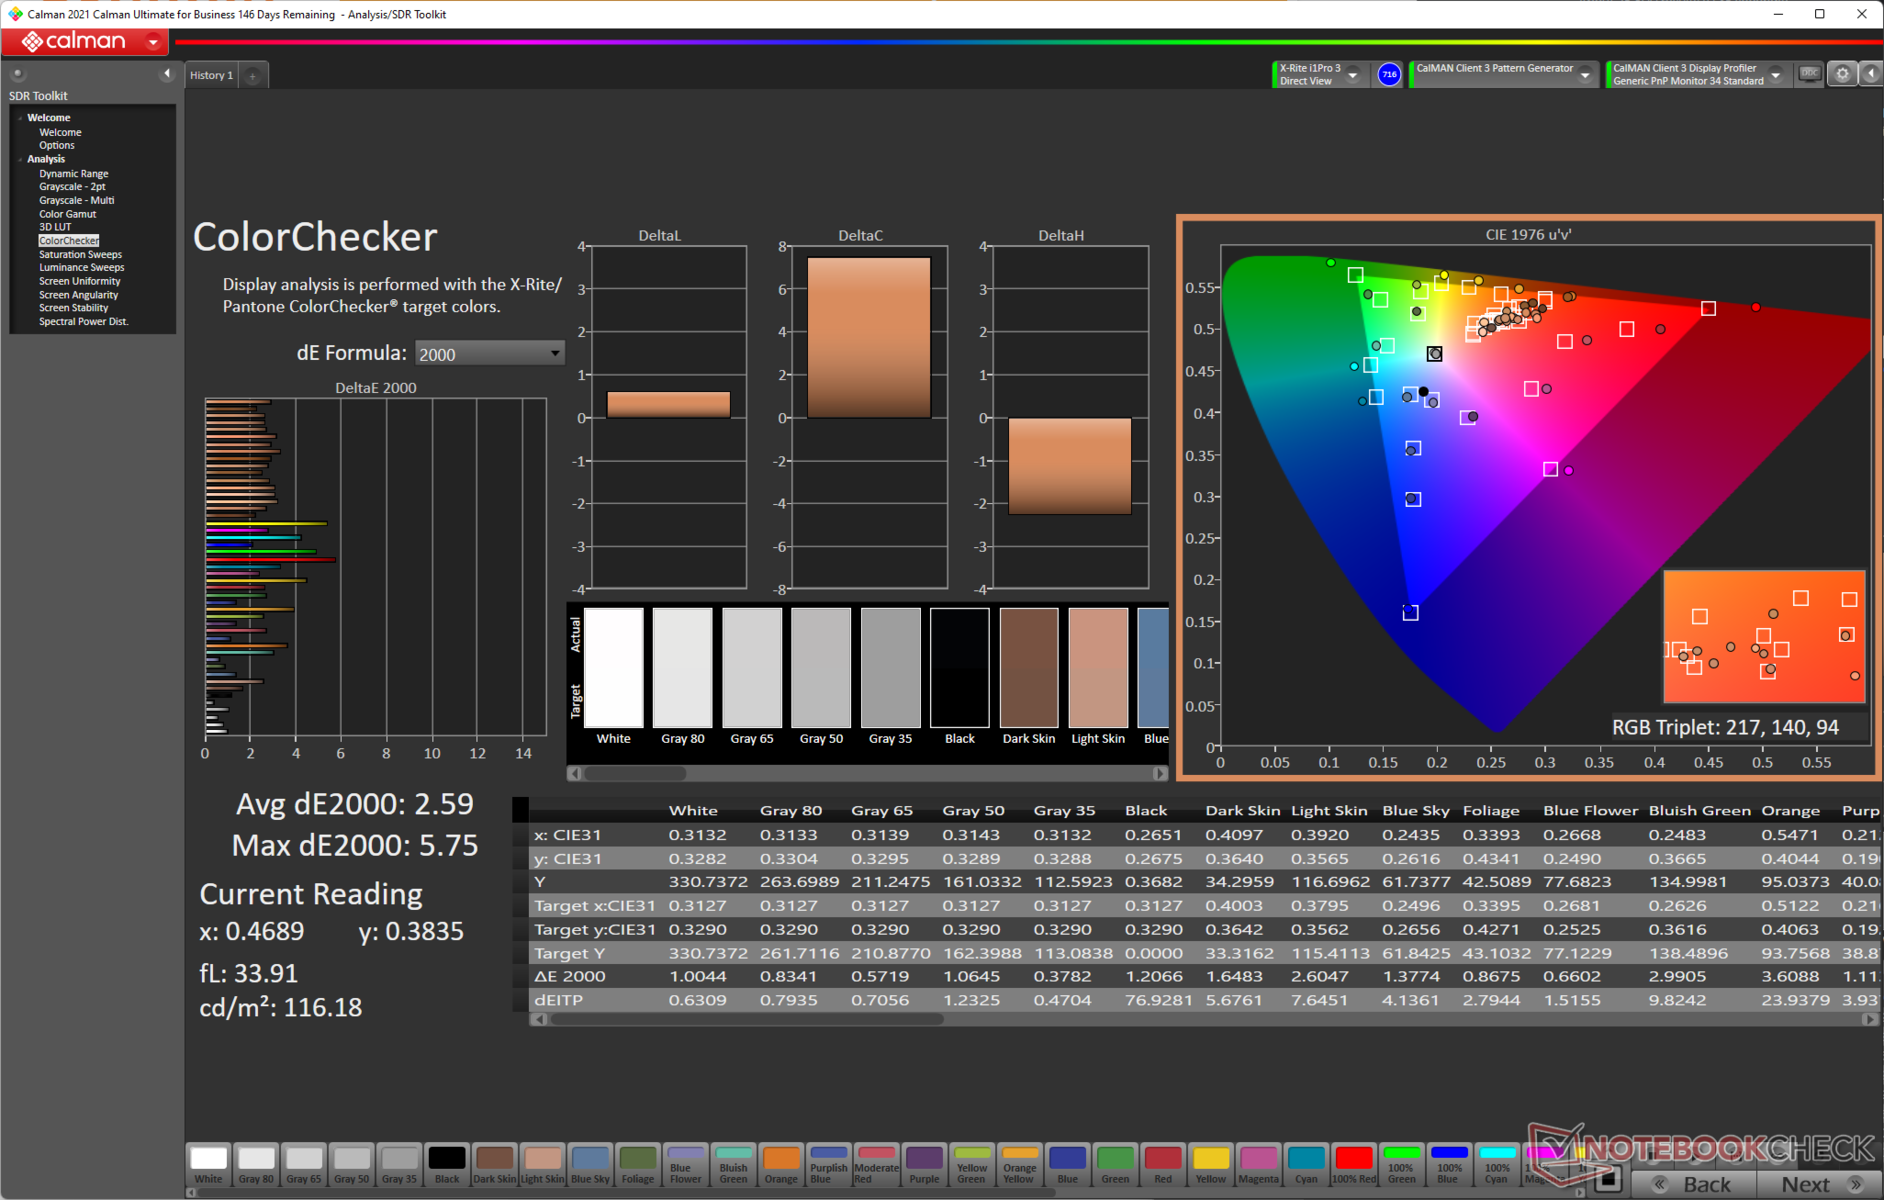
La précision des couleurs est tout à fait acceptable, avec un Delta E de 3 en niveaux de gris et un Delta E moyen de 3,71 pour ColorChecker
Notre routine d'étalonnage avec le spectrophotomètre X-rite i1Basic Pro 3 et le logiciel d'étalonnage des couleurs Calman Ultimate de Portrait Displays se traduit par une réduction significative du Delta E en échelle de gris de 0,7 et une amélioration perceptible du Delta E moyen à 2,59 dans ColorChecker. Des écarts plus importants sont observés avec la couleur rouge.
Le fichier ICC calibré peut être téléchargé à partir du lien ci-dessus.
Temps de réponse de l'écran
| ↔ Temps de réponse noir à blanc | ||
|---|---|---|
| 8.04 ms ... hausse ↗ et chute ↘ combinées | ↗ 4.72 ms hausse | 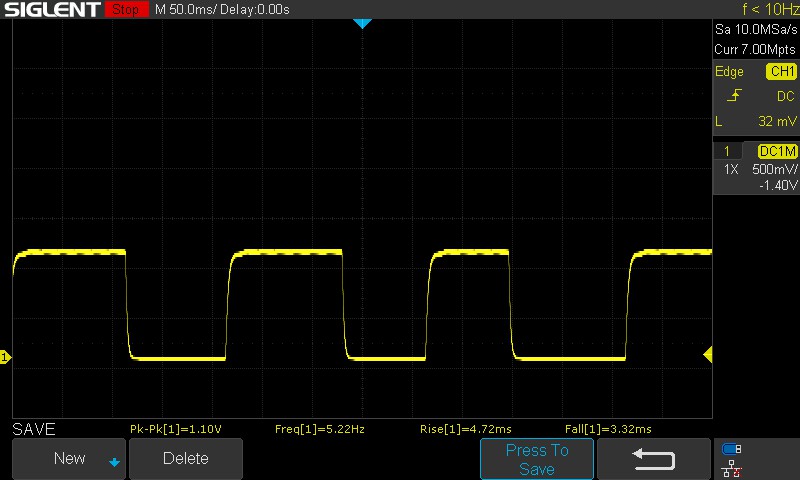 |
| ↘ 3.32 ms chute | ||
| L'écran montre de faibles temps de réponse, un bon écran pour jouer. En comparaison, tous les appareils testés affichent entre 0.1 (minimum) et 240 (maximum) ms. » 24 % des appareils testés affichent de meilleures performances. Cela signifie que les latences relevées sont meilleures que la moyenne (19.8 ms) de tous les appareils testés. | ||
| ↔ Temps de réponse gris 50% à gris 80% | ||
| 5.36 ms ... hausse ↗ et chute ↘ combinées | ↗ 2.71 ms hausse | 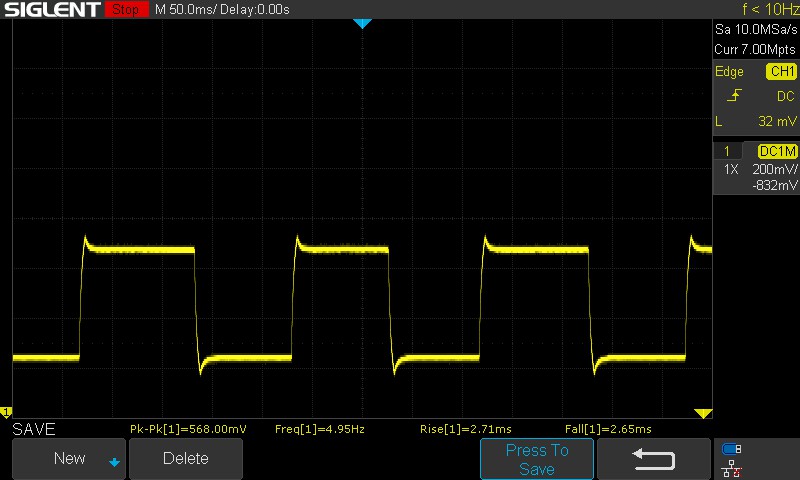 |
| ↘ 2.65 ms chute | ||
| L'écran montre de très faibles temps de réponse, parfait pour le jeu. En comparaison, tous les appareils testés affichent entre 0.165 (minimum) et 636 (maximum) ms. » 18 % des appareils testés affichent de meilleures performances. Cela signifie que les latences relevées sont meilleures que la moyenne (31 ms) de tous les appareils testés. | ||
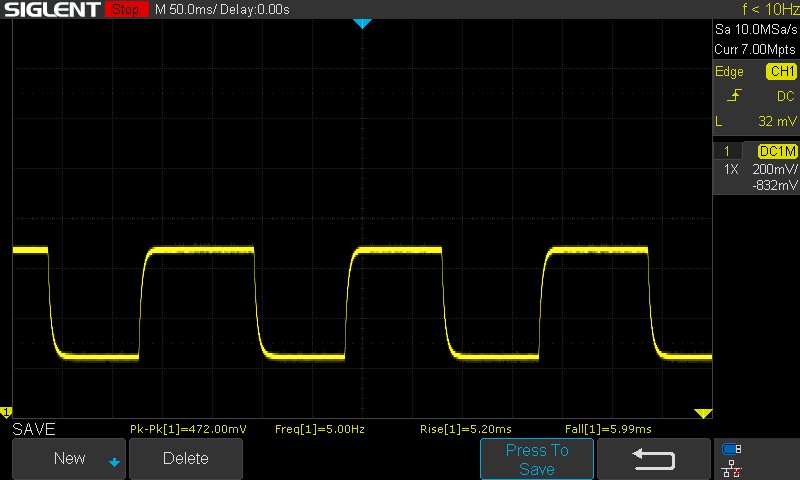
Les temps de réponse sont corrects, bien que nous aurions aimé voir des valeurs plus basses pour la transition 100% noir à 100% blanc
Le panneau utilise l'overdrive par défaut, ce qui se traduit par une "corne" dans le motif de l'oscilloscope de 50% de gris à 80% de gris.
Sans overdrive activé, cette valeur peut augmenter jusqu'à 11,19 ms.
Scintillement / MLI (Modulation de largeur d'impulsion)
| Scintillement / MLI (Modulation de largeur d'impulsion) non décelé | ≤ 100 Niveau de luminosité | 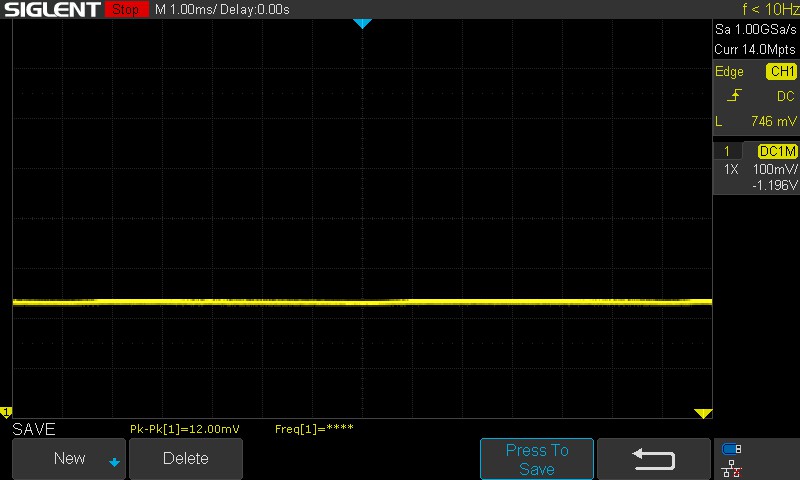 | |
En comparaison, 52 % des appareils testés n'emploient pas MDI pour assombrir leur écran. Nous avons relevé une moyenne à 7754 (minimum : 5 - maximum : 343500) Hz dans le cas où une MDI était active. | |||
Nous n'avons pas observé de scintillement PWM à tous les niveaux de luminosité testés, c'est donc une chose de moins à craindre pendant les longues heures de travail ou les sessions de jeu.
Consultez notre article sur "Pourquoi la modulation de largeur d'impulsion (PWM) est-elle un tel casse-tête ?"ainsi que notre Tableau de classement PWM pour des comparaisons entre tous les appareils examinés.
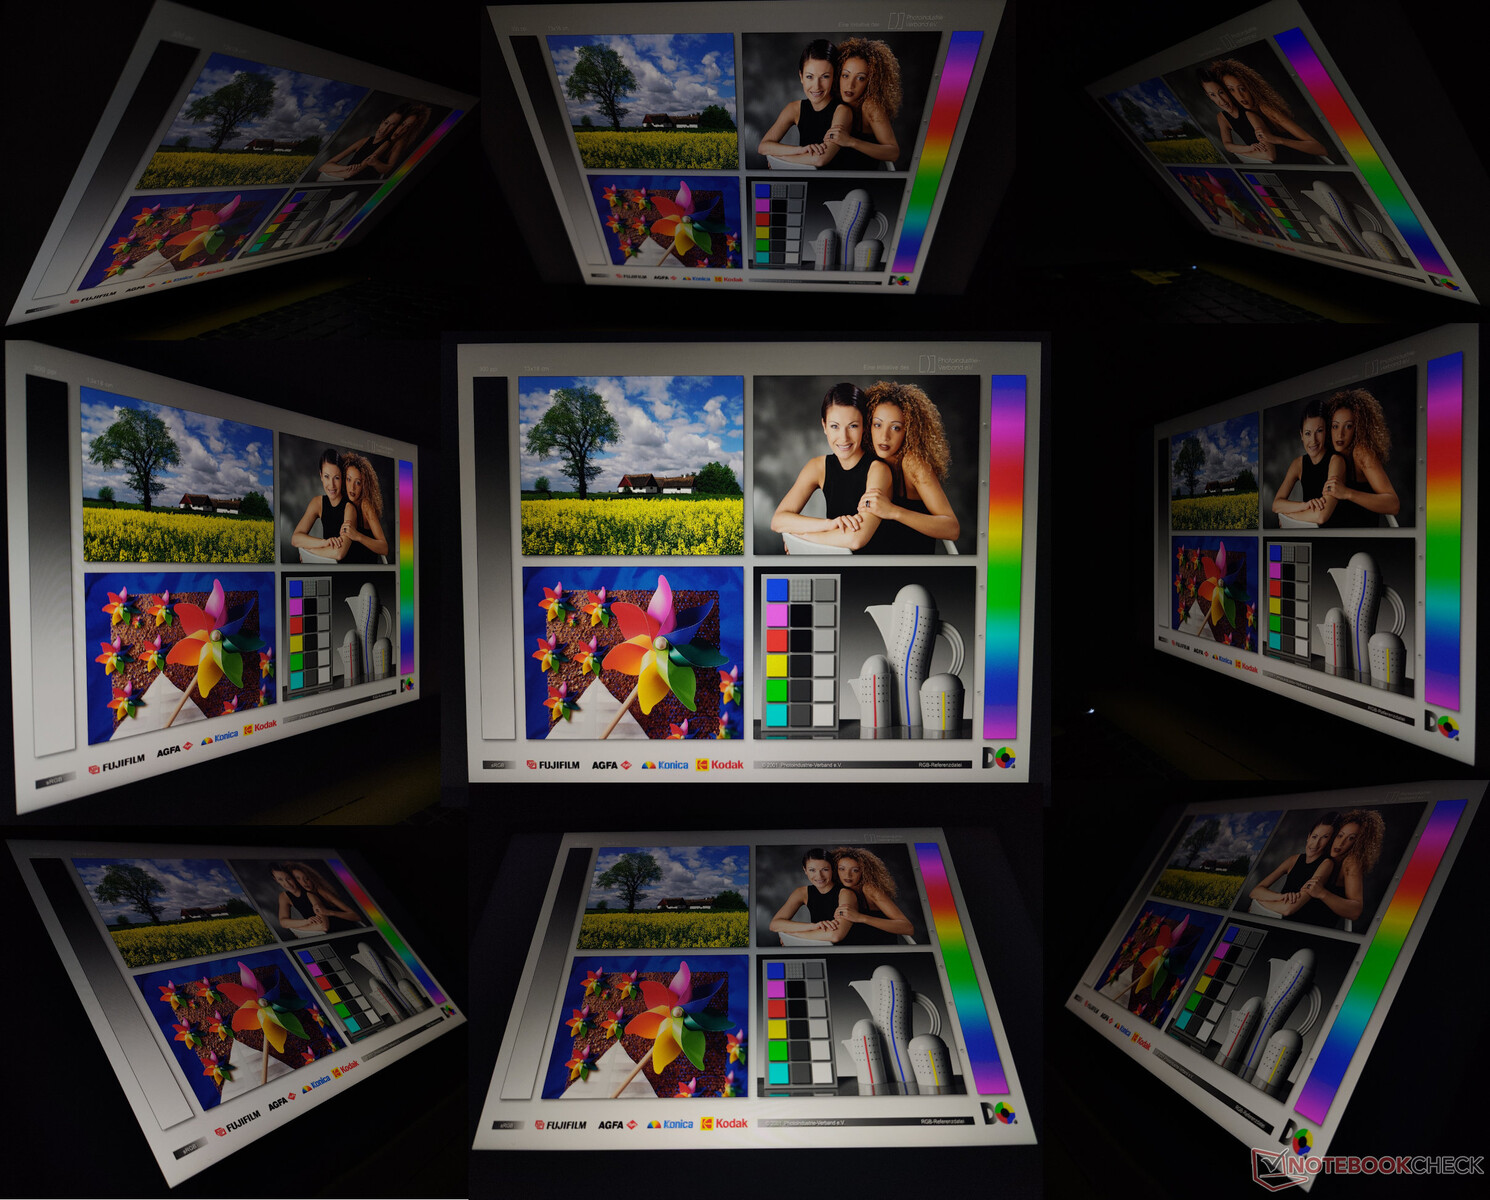
L'affichage en extérieur est lisible tant que l'écran n'est pas directement exposé aux rayons du soleil. Les angles de vision ne sont pas particulièrement impressionnants, cependant. Nous avons observé une perte de luminosité et de couleurs aux angles de vision extrêmes.
Performances : Pas le Core i7-12700H le plus rapide que nous ayons vu
Notre unité Crosshair 15 R6E est alimentée par un Intel Core i7-12700H et d'un GPU Nvidia RTX 3070 de 140 W Nvidia GeForce RTX 3070 GPU pour ordinateur portable. Les acheteurs ont également la possibilité de configurer l'ordinateur portable avec un GPU portable GPU RTX 3060 pour ordinateur portable ou des options de CPU allant jusqu'au Core i9 Alder Lake.
Conditions d'essai
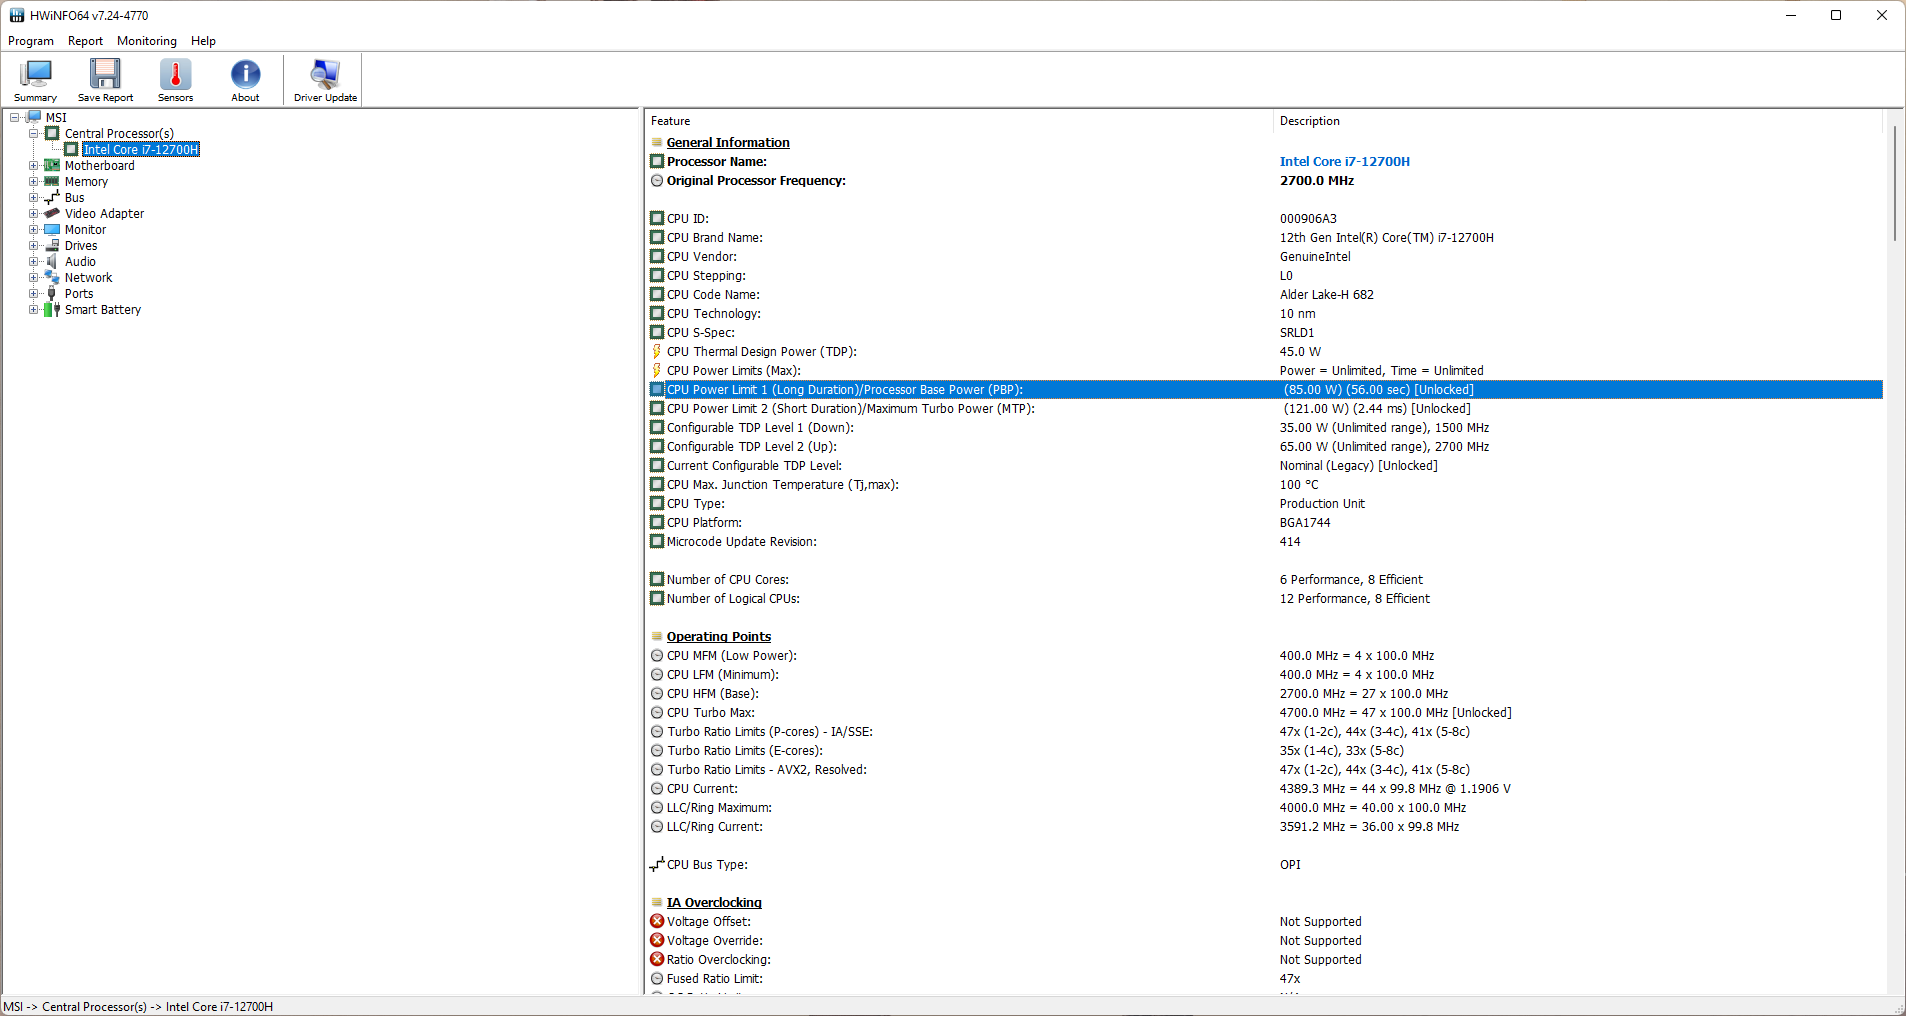
Le Centre MSI offre un guichet unique pour régler les différents paramètres de performance de la Crosshair 15 R6E. Nous avons utilisé le préréglage Extreme Performance pour laisser le Core i7-12700H déployer pleinement ses muscles. Cela permet au processeur de fonctionner à un PL1 soutenu de 85 W et à un PL2 court terme de 121 W. Il n'y a pas d'option de commutation MUX disponible pour le dGPU.
Tous les tests ont été effectués dans le profil Performance extrême, sauf indication contraire.
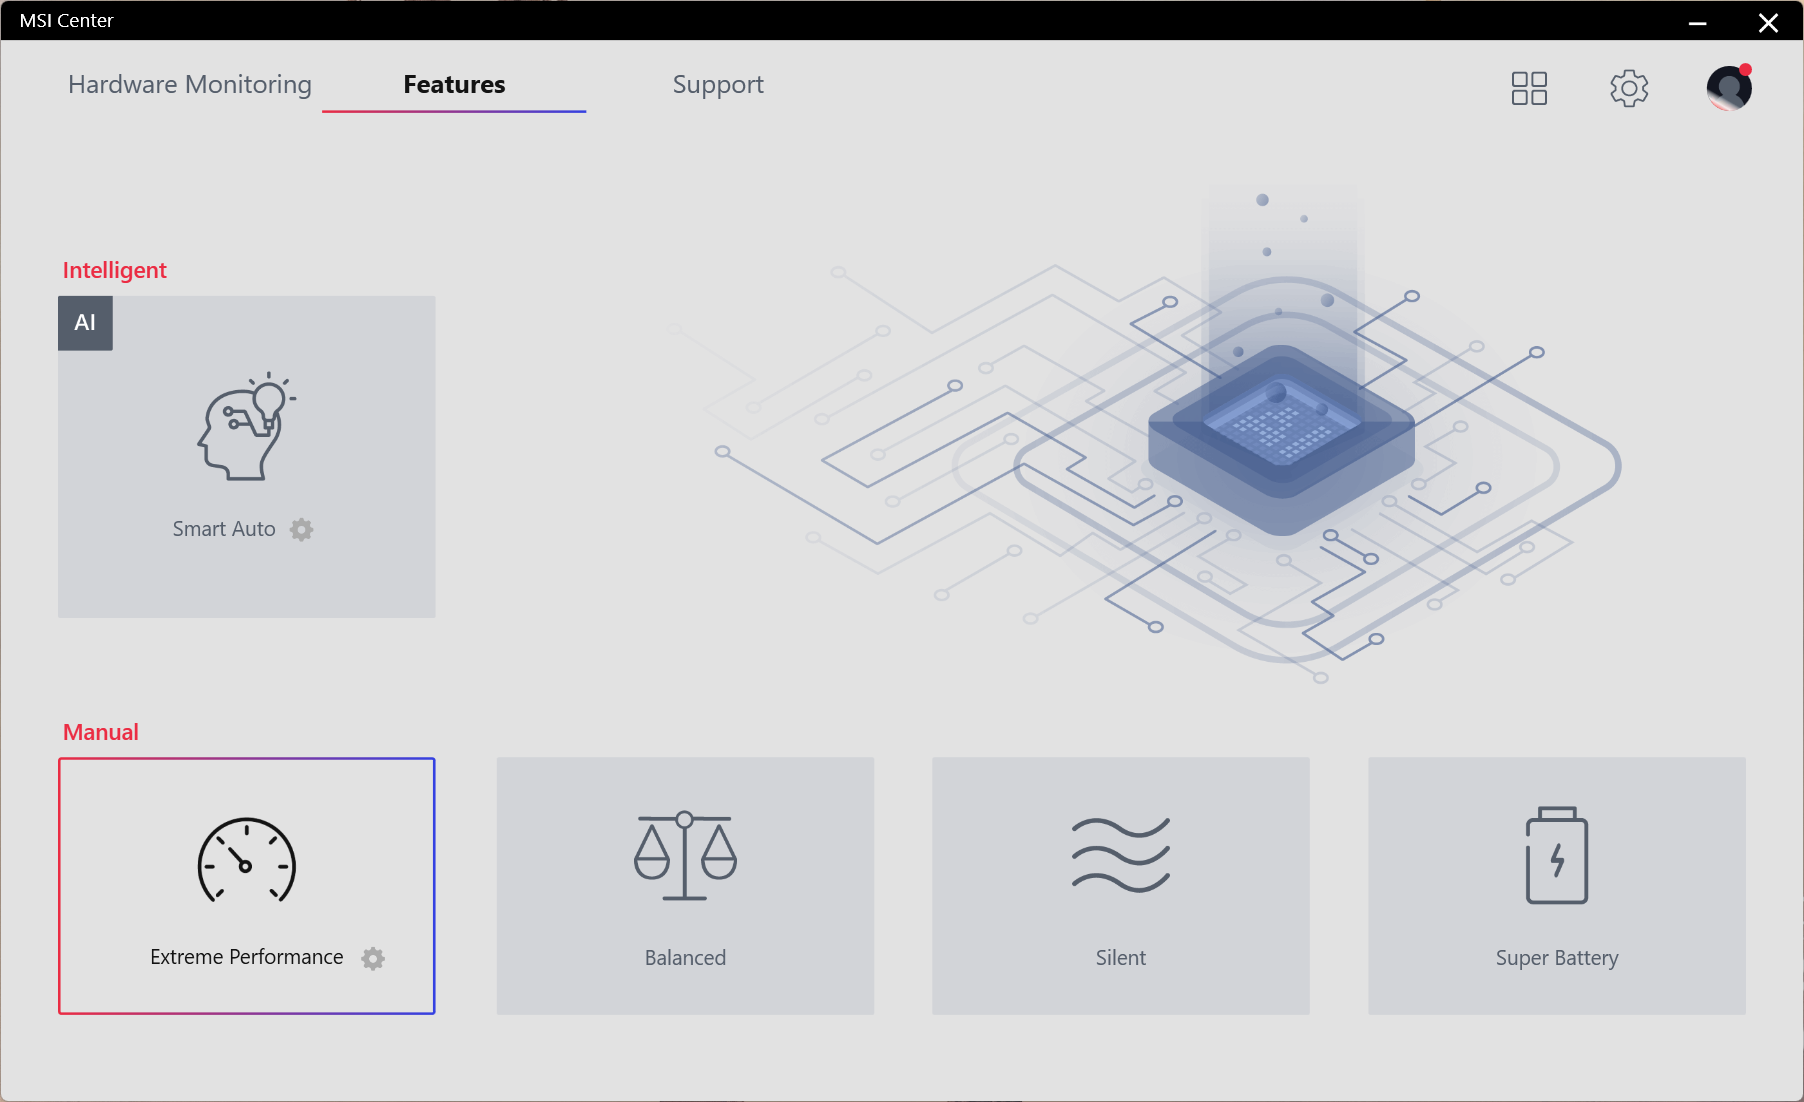
Le tableau ci-dessous montre comment la puissance de base du processeur (PBP, PL1) et la puissance turbo maximale (MTP, PL2) changent avec chaque mode de performance. Le profil Équilibré devrait répondre à la plupart des besoins. Ceux qui souhaitent tirer le maximum de performances du Core i7-12700H peuvent opter pour le mode Performance extrême.
| Mode Performance | PL1 (PBP) / Tau | PL2 (MTP) / Tau |
|---|---|---|
| Super Battery | 13 W / 56 s | 121 W / 2,44 ms |
| Silencieux | 23 W / 56 s | 121 W / 2,44 ms |
| Équilibré | 38 W / 56 s | 121 W / 2,44 ms |
| Performance extrême | 85 W / 56 s | 121 W / 2,44 ms |
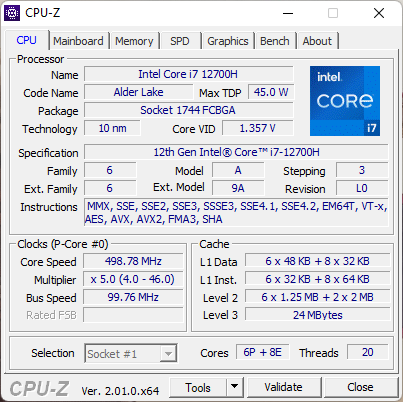
Processeur
Le Core i7-12700H est un processeur Alder Lake-H avec six P-cores et huit E-cores. La Crosshair 15 R6E est capable de permettre une performance soutenue décente pour ce processeur dans notre test de boucle multi-core Cinebench R15, égalant celui du AMD Ryzen 9 6900HX dans le Schenker XMG Neo 15.
Ce n'est pas le Core i7-12700H le plus rapide que nous ayons vu, cependant. L'implémentation de ce processeur dans les MSI Stealth GS66 et Lenovo Legion 5i Pro 16 G7 obtient de meilleurs scores grâce à des valeurs PL1 et PL2 plus élevées.
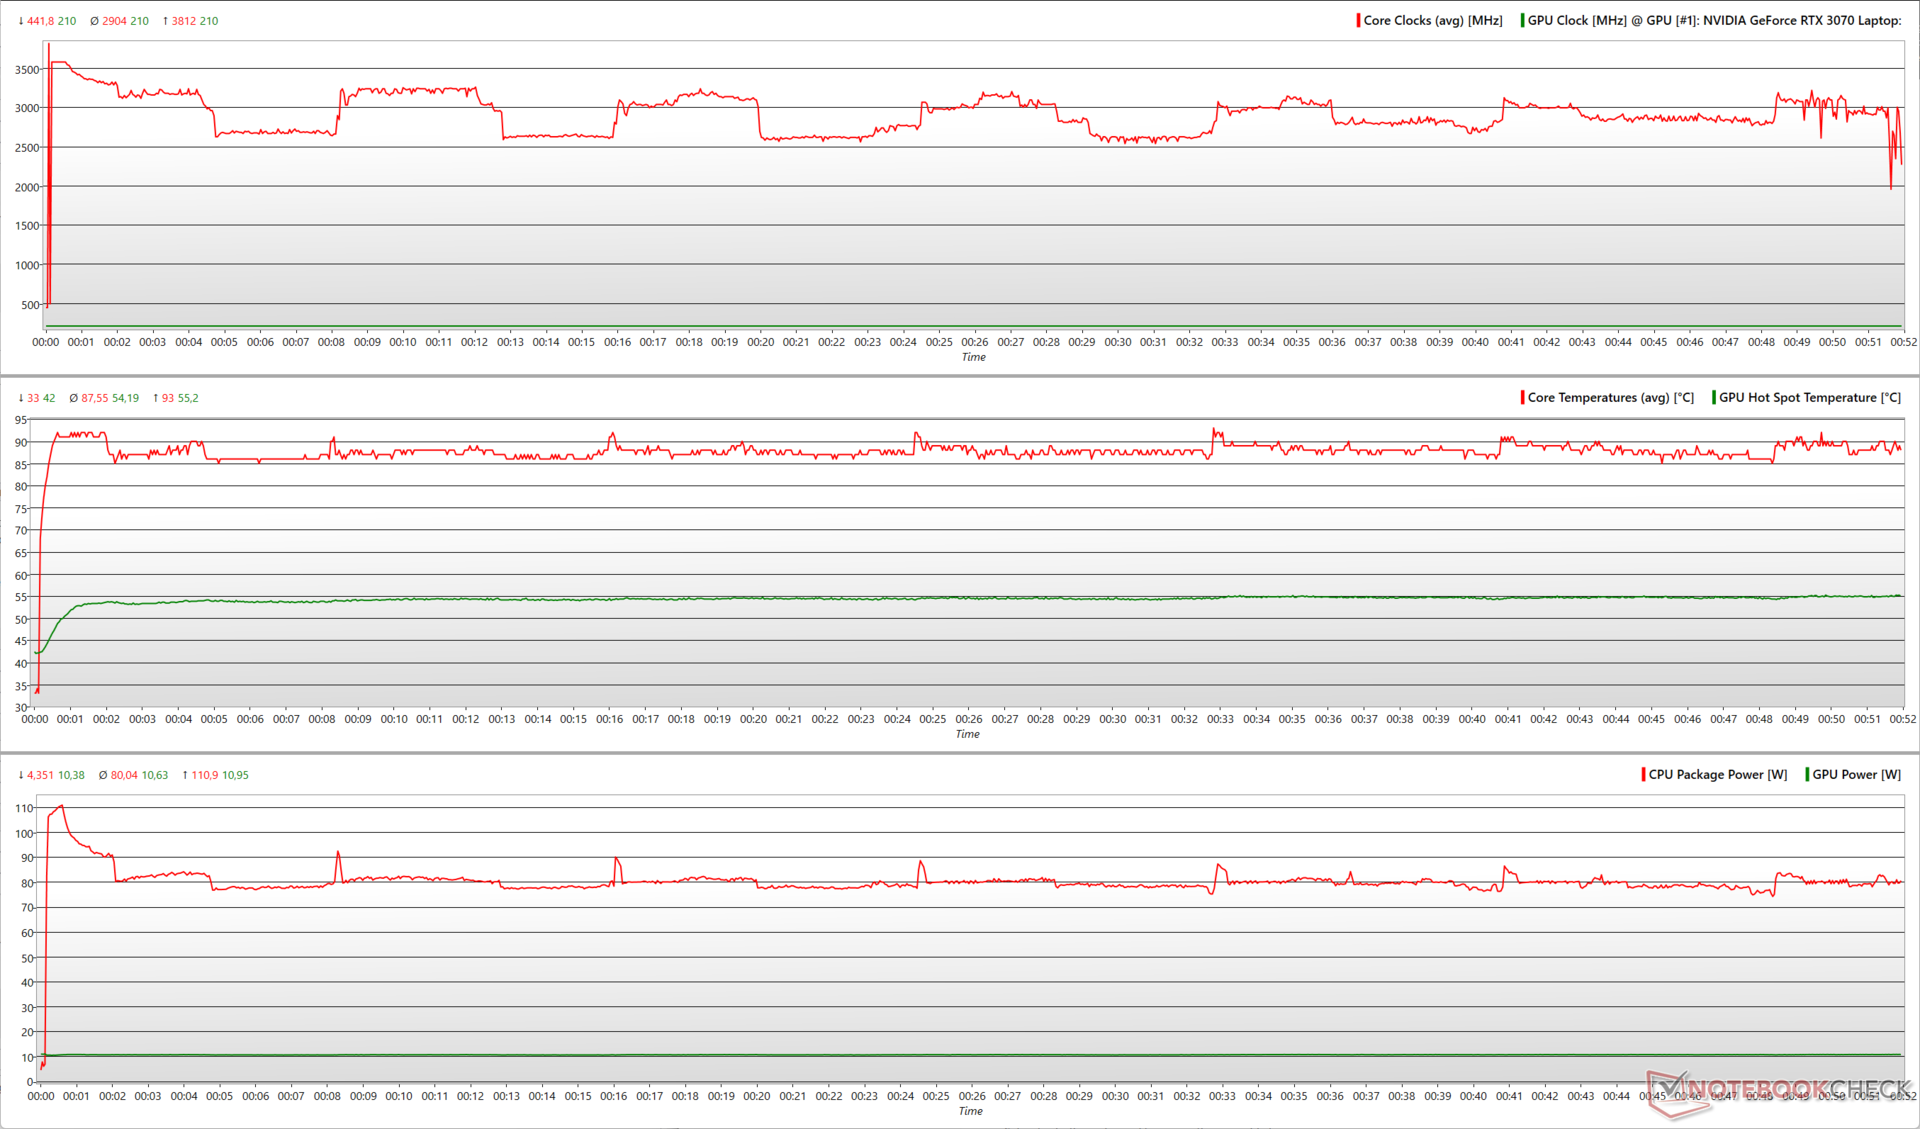
Cinebench R15 Multi Loop
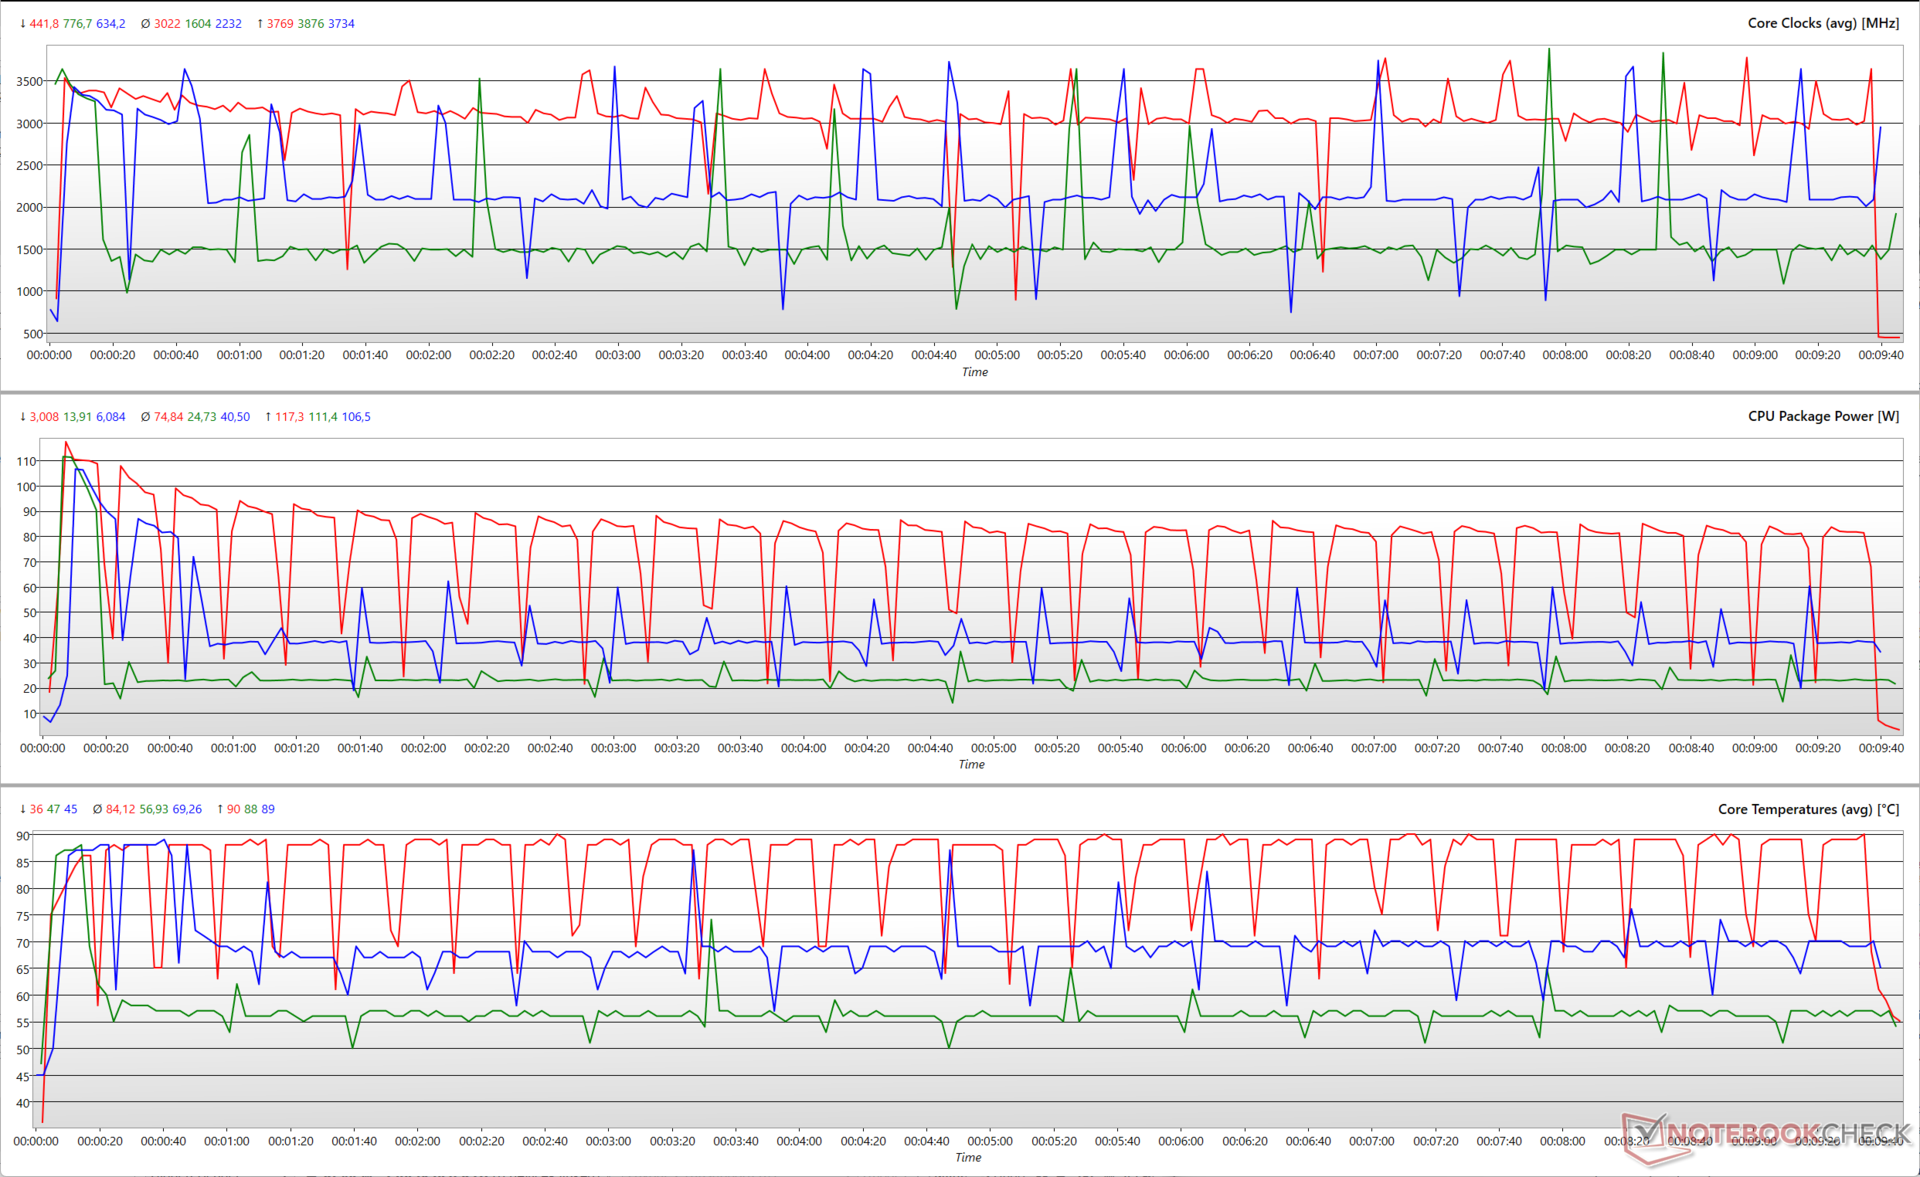
Le graphique suivant illustre la façon dont les paramètres du processeur varient au cours d'un test en boucle multicœur Cinebench R15. Comme le PL2 de 121 W reste inchangé dans les trois modes de performance, le Core i7-12700H est capable de booster jusqu'à près de 3,8 GHz en tenant compte des cœurs P et E. Les cœurs P et les cœurs E peuvent respectivement atteindre 4,6 GHz et 3,5 GHz. Les cœurs P et E peuvent atteindre individuellement 4,6 GHz et 3,5 GHz, respectivement.
Alors que la puissance maximale du boîtier et les températures des cœurs sont plus ou moins similaires dans tous les modes de performance testés, les valeurs moyennes présentent des différences marquées. La puissance moyenne du boîtier pendant l'exécution est proche de 75 W dans le mode Extreme Performance avec des températures autour de 84 °C. Le mode Équilibré présente des températures moyennes autour de 69 °C pour une puissance moyenne du boîtier de 40,5 W
Le mode silencieux est celui qui produit le moins d'émissions, avec une puissance moyenne de près de 25 W et des températures moyennes proches de 57 °C.
Bien que les performances multicœurs subissent une baisse de 15 % par rapport au Core i7-12700H du Lenovo Legion 5i Pro 16 G7, le Crosshair 15 R6E n'accuse qu'un retard d'environ 8 % dans les performances globales du CPU.
Le Crosshair 15 R6E est 13% plus rapide que le XMG Neo 15 équipé du Ryzen 9 6900HX, mais ce dernier obtient une performance supérieure de 32% dans les tests AIDA64.
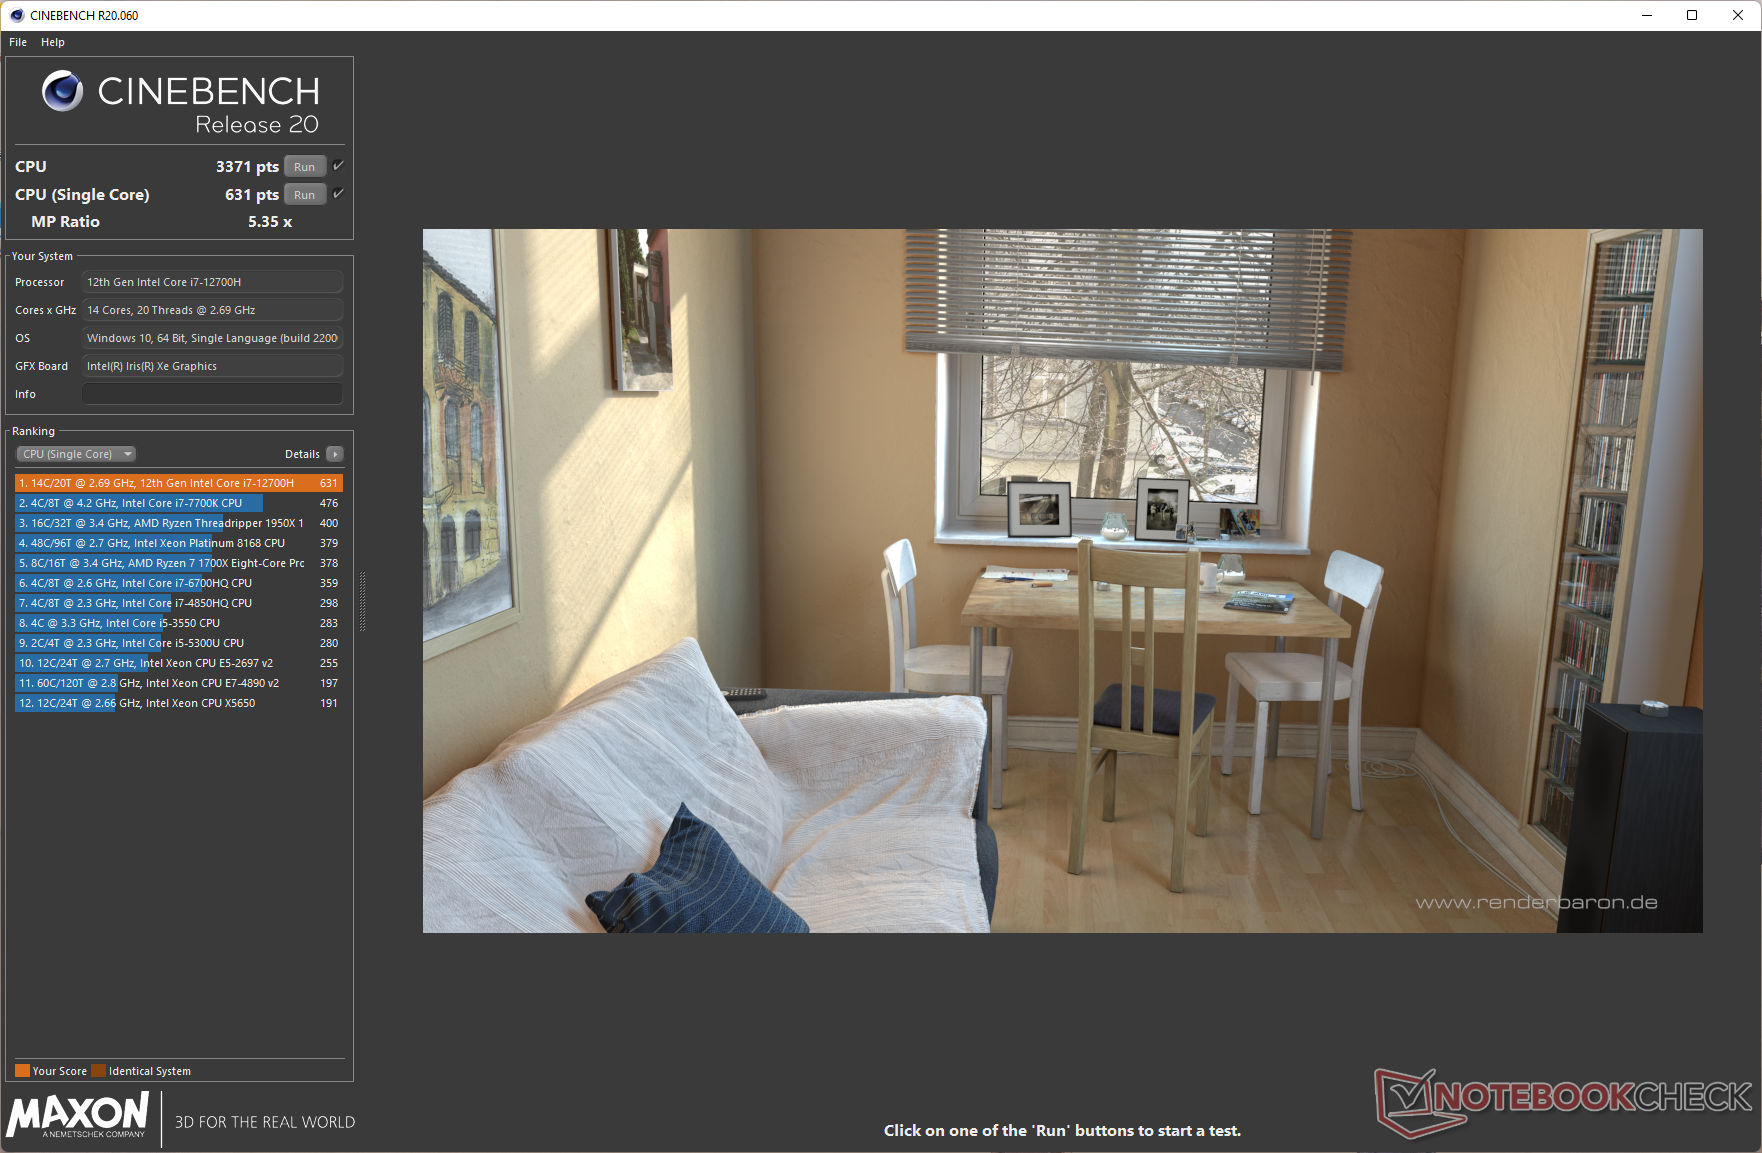
Les performances multi-core de Cinebench R20 chutent de 45% sur batterie, bien que les scores mono-core ne soient réduits que de 10%.
Cinebench R23: Multi Core | Single Core
Cinebench R20: CPU (Multi Core) | CPU (Single Core)
Cinebench R15: CPU Multi 64Bit | CPU Single 64Bit
Blender: v2.79 BMW27 CPU
7-Zip 18.03: 7z b 4 | 7z b 4 -mmt1
Geekbench 5.5: Multi-Core | Single-Core
HWBOT x265 Benchmark v2.2: 4k Preset
LibreOffice : 20 Documents To PDF
R Benchmark 2.5: Overall mean
| CPU Performance rating | |
| Moyenne de la classe Gaming | |
| Lenovo Legion 5 Pro 16 G7 i7 RTX 3070Ti | |
| MSI Pulse GL66 12UEK | |
| MSI Stealth GS66 12UGS | |
| Schenker XMG Neo 15 (i7-12700H, RTX 3080 Ti) | |
| MSI Crosshair 15 R6E B12UGZ-050 | |
| Acer Nitro 5 AN515-58-72QR | |
| Aorus 15 XE5 | |
| MSI Katana GF66 12UGS | |
| Moyenne Intel Core i7-12700H | |
| Asus TUF Dash F15 FX517ZR | |
| Schenker XMG Neo 15 (Ryzen 9 6900HX, RTX 3070 Ti) | |
| Cinebench R23 / Multi Core | |
| Moyenne de la classe Gaming (10488 - 42661, n=107, 2 dernières années) | |
| Lenovo Legion 5 Pro 16 G7 i7 RTX 3070Ti | |
| MSI Stealth GS66 12UGS | |
| MSI Pulse GL66 12UEK | |
| Schenker XMG Neo 15 (i7-12700H, RTX 3080 Ti) | |
| MSI Katana GF66 12UGS | |
| Acer Nitro 5 AN515-58-72QR | |
| MSI Crosshair 15 R6E B12UGZ-050 | |
| Aorus 15 XE5 | |
| Moyenne Intel Core i7-12700H (4032 - 19330, n=64) | |
| Schenker XMG Neo 15 (Ryzen 9 6900HX, RTX 3070 Ti) | |
| Asus TUF Dash F15 FX517ZR | |
| Cinebench R23 / Single Core | |
| Moyenne de la classe Gaming (1166 - 2415, n=107, 2 dernières années) | |
| MSI Pulse GL66 12UEK | |
| MSI Katana GF66 12UGS | |
| Lenovo Legion 5 Pro 16 G7 i7 RTX 3070Ti | |
| Acer Nitro 5 AN515-58-72QR | |
| Schenker XMG Neo 15 (i7-12700H, RTX 3080 Ti) | |
| Asus TUF Dash F15 FX517ZR | |
| MSI Stealth GS66 12UGS | |
| MSI Crosshair 15 R6E B12UGZ-050 | |
| Aorus 15 XE5 | |
| Moyenne Intel Core i7-12700H (778 - 1826, n=63) | |
| Schenker XMG Neo 15 (Ryzen 9 6900HX, RTX 3070 Ti) | |
| Cinebench R20 / CPU (Multi Core) | |
| Moyenne de la classe Gaming (4029 - 16433, n=106, 2 dernières années) | |
| Lenovo Legion 5 Pro 16 G7 i7 RTX 3070Ti | |
| Schenker XMG Neo 15 (i7-12700H, RTX 3080 Ti) | |
| MSI Pulse GL66 12UEK | |
| MSI Stealth GS66 12UGS | |
| Acer Nitro 5 AN515-58-72QR | |
| MSI Katana GF66 12UGS | |
| MSI Crosshair 15 R6E B12UGZ-050 | |
| Aorus 15 XE5 | |
| Moyenne Intel Core i7-12700H (1576 - 7407, n=64) | |
| Schenker XMG Neo 15 (Ryzen 9 6900HX, RTX 3070 Ti) | |
| Asus TUF Dash F15 FX517ZR | |
| Cinebench R20 / CPU (Single Core) | |
| Moyenne de la classe Gaming (442 - 913, n=106, 2 dernières années) | |
| MSI Pulse GL66 12UEK | |
| MSI Katana GF66 12UGS | |
| Lenovo Legion 5 Pro 16 G7 i7 RTX 3070Ti | |
| Asus TUF Dash F15 FX517ZR | |
| MSI Crosshair 15 R6E B12UGZ-050 | |
| Acer Nitro 5 AN515-58-72QR | |
| MSI Stealth GS66 12UGS | |
| Schenker XMG Neo 15 (i7-12700H, RTX 3080 Ti) | |
| Aorus 15 XE5 | |
| Moyenne Intel Core i7-12700H (300 - 704, n=64) | |
| Schenker XMG Neo 15 (Ryzen 9 6900HX, RTX 3070 Ti) | |
| Cinebench R15 / CPU Multi 64Bit | |
| Moyenne de la classe Gaming (1578 - 6330, n=105, 2 dernières années) | |
| Lenovo Legion 5 Pro 16 G7 i7 RTX 3070Ti | |
| MSI Stealth GS66 12UGS | |
| Acer Nitro 5 AN515-58-72QR | |
| MSI Pulse GL66 12UEK | |
| MSI Katana GF66 12UGS | |
| MSI Katana GF66 12UGS | |
| Schenker XMG Neo 15 (i7-12700H, RTX 3080 Ti) | |
| Aorus 15 XE5 | |
| MSI Crosshair 15 R6E B12UGZ-050 | |
| Moyenne Intel Core i7-12700H (1379 - 2916, n=70) | |
| Schenker XMG Neo 15 (Ryzen 9 6900HX, RTX 3070 Ti) | |
| Asus TUF Dash F15 FX517ZR | |
| Cinebench R15 / CPU Single 64Bit | |
| Moyenne de la classe Gaming (188.8 - 350, n=106, 2 dernières années) | |
| MSI Pulse GL66 12UEK | |
| Lenovo Legion 5 Pro 16 G7 i7 RTX 3070Ti | |
| MSI Katana GF66 12UGS | |
| MSI Katana GF66 12UGS | |
| Acer Nitro 5 AN515-58-72QR | |
| Schenker XMG Neo 15 (i7-12700H, RTX 3080 Ti) | |
| MSI Crosshair 15 R6E B12UGZ-050 | |
| Asus TUF Dash F15 FX517ZR | |
| MSI Stealth GS66 12UGS | |
| Aorus 15 XE5 | |
| Moyenne Intel Core i7-12700H (113 - 263, n=65) | |
| Schenker XMG Neo 15 (Ryzen 9 6900HX, RTX 3070 Ti) | |
| Blender / v2.79 BMW27 CPU | |
| MSI Katana GF66 12UGS | |
| Aorus 15 XE5 | |
| Asus TUF Dash F15 FX517ZR | |
| Moyenne Intel Core i7-12700H (168 - 732, n=63) | |
| Schenker XMG Neo 15 (Ryzen 9 6900HX, RTX 3070 Ti) | |
| Acer Nitro 5 AN515-58-72QR | |
| MSI Crosshair 15 R6E B12UGZ-050 | |
| MSI Stealth GS66 12UGS | |
| MSI Pulse GL66 12UEK | |
| Schenker XMG Neo 15 (i7-12700H, RTX 3080 Ti) | |
| Lenovo Legion 5 Pro 16 G7 i7 RTX 3070Ti | |
| Moyenne de la classe Gaming (79 - 330, n=104, 2 dernières années) | |
| 7-Zip 18.03 / 7z b 4 -mmt1 | |
| Moyenne de la classe Gaming (4199 - 7436, n=105, 2 dernières années) | |
| MSI Pulse GL66 12UEK | |
| Schenker XMG Neo 15 (i7-12700H, RTX 3080 Ti) | |
| MSI Katana GF66 12UGS | |
| Lenovo Legion 5 Pro 16 G7 i7 RTX 3070Ti | |
| Schenker XMG Neo 15 (Ryzen 9 6900HX, RTX 3070 Ti) | |
| Acer Nitro 5 AN515-58-72QR | |
| MSI Stealth GS66 12UGS | |
| Asus TUF Dash F15 FX517ZR | |
| MSI Crosshair 15 R6E B12UGZ-050 | |
| Aorus 15 XE5 | |
| Moyenne Intel Core i7-12700H (2743 - 5972, n=63) | |
| Geekbench 5.5 / Multi-Core | |
| Moyenne de la classe Gaming (6460 - 28263, n=105, 2 dernières années) | |
| Schenker XMG Neo 15 (i7-12700H, RTX 3080 Ti) | |
| MSI Stealth GS66 12UGS | |
| Lenovo Legion 5 Pro 16 G7 i7 RTX 3070Ti | |
| Aorus 15 XE5 | |
| MSI Pulse GL66 12UEK | |
| MSI Katana GF66 12UGS | |
| Moyenne Intel Core i7-12700H (5144 - 13745, n=64) | |
| MSI Crosshair 15 R6E B12UGZ-050 | |
| Asus TUF Dash F15 FX517ZR | |
| Schenker XMG Neo 15 (Ryzen 9 6900HX, RTX 3070 Ti) | |
| Acer Nitro 5 AN515-58-72QR | |
| Geekbench 5.5 / Single-Core | |
| Moyenne de la classe Gaming (986 - 2474, n=105, 2 dernières années) | |
| MSI Pulse GL66 12UEK | |
| MSI Crosshair 15 R6E B12UGZ-050 | |
| Asus TUF Dash F15 FX517ZR | |
| Acer Nitro 5 AN515-58-72QR | |
| MSI Katana GF66 12UGS | |
| Schenker XMG Neo 15 (i7-12700H, RTX 3080 Ti) | |
| Lenovo Legion 5 Pro 16 G7 i7 RTX 3070Ti | |
| Moyenne Intel Core i7-12700H (803 - 1851, n=64) | |
| Aorus 15 XE5 | |
| MSI Stealth GS66 12UGS | |
| Schenker XMG Neo 15 (Ryzen 9 6900HX, RTX 3070 Ti) | |
| HWBOT x265 Benchmark v2.2 / 4k Preset | |
| Moyenne de la classe Gaming (11.5 - 44.4, n=105, 2 dernières années) | |
| Lenovo Legion 5 Pro 16 G7 i7 RTX 3070Ti | |
| Schenker XMG Neo 15 (i7-12700H, RTX 3080 Ti) | |
| MSI Stealth GS66 12UGS | |
| MSI Pulse GL66 12UEK | |
| Acer Nitro 5 AN515-58-72QR | |
| MSI Crosshair 15 R6E B12UGZ-050 | |
| Schenker XMG Neo 15 (Ryzen 9 6900HX, RTX 3070 Ti) | |
| Asus TUF Dash F15 FX517ZR | |
| Moyenne Intel Core i7-12700H (4.67 - 21.8, n=64) | |
| Aorus 15 XE5 | |
| MSI Katana GF66 12UGS | |
| LibreOffice / 20 Documents To PDF | |
| Schenker XMG Neo 15 (Ryzen 9 6900HX, RTX 3070 Ti) | |
| Moyenne de la classe Gaming (33.2 - 88.8, n=105, 2 dernières années) | |
| Schenker XMG Neo 15 (i7-12700H, RTX 3080 Ti) | |
| Moyenne Intel Core i7-12700H (34.2 - 95.3, n=63) | |
| MSI Crosshair 15 R6E B12UGZ-050 | |
| Lenovo Legion 5 Pro 16 G7 i7 RTX 3070Ti | |
| MSI Pulse GL66 12UEK | |
| Acer Nitro 5 AN515-58-72QR | |
| MSI Stealth GS66 12UGS | |
| Asus TUF Dash F15 FX517ZR | |
| Aorus 15 XE5 | |
| MSI Katana GF66 12UGS | |
| R Benchmark 2.5 / Overall mean | |
| Schenker XMG Neo 15 (Ryzen 9 6900HX, RTX 3070 Ti) | |
| Moyenne Intel Core i7-12700H (0.4441 - 1.052, n=63) | |
| Aorus 15 XE5 | |
| Asus TUF Dash F15 FX517ZR | |
| Schenker XMG Neo 15 (i7-12700H, RTX 3080 Ti) | |
| Acer Nitro 5 AN515-58-72QR | |
| MSI Katana GF66 12UGS | |
| Lenovo Legion 5 Pro 16 G7 i7 RTX 3070Ti | |
| MSI Stealth GS66 12UGS | |
| MSI Crosshair 15 R6E B12UGZ-050 | |
| Moyenne de la classe Gaming (0.3439 - 0.759, n=106, 2 dernières années) | |
| MSI Pulse GL66 12UEK | |
* ... Moindre est la valeur, meilleures sont les performances
AIDA64: FP32 Ray-Trace | FPU Julia | CPU SHA3 | CPU Queen | FPU SinJulia | FPU Mandel | CPU AES | CPU ZLib | FP64 Ray-Trace | CPU PhotoWorxx
| Performance rating | |
| Moyenne de la classe Gaming | |
| Schenker XMG Neo 15 (Ryzen 9 6900HX, RTX 3070 Ti) | |
| Aorus 15 XE5 | |
| Lenovo Legion 5 Pro 16 G7 i7 RTX 3070Ti | |
| MSI Stealth GS66 12UGS | |
| Asus TUF Dash F15 FX517ZR | |
| Moyenne Intel Core i7-12700H | |
| MSI Pulse GL66 12UEK | |
| Schenker XMG Neo 15 (i7-12700H, RTX 3080 Ti) | |
| MSI Katana GF66 12UGS | |
| MSI Crosshair 15 R6E B12UGZ-050 | |
| Acer Nitro 5 AN515-58-72QR | |
Consultez notre site dédié Intel Core i7-12700H pour plus d'informations et des comparaisons de performances.
Performance du système
Les appareils concurrents sont capables de devancer la Crosshair 15 R6E dans les scores PCMark 10, mais pas de beaucoup. Dans CrossMark, le Crosshair 15 R6E affiche des performances bien meilleures
Les tests AIDA64 montrent que le Crosshair 15 R6E est à la traîne derrière d'autres ordinateurs portables équipés de Core i7-12700H. Nous n'avons pas rencontré de problèmes de performances particuliers dans les tâches de productivité quotidiennes ou la navigation sur Internet
CrossMark: Overall | Productivity | Creativity | Responsiveness
| PCMark 10 / Score | |
| Moyenne de la classe Gaming (5828 - 12414, n=93, 2 dernières années) | |
| Aorus 15 XE5 | |
| MSI Stealth GS66 12UGS | |
| Schenker XMG Neo 15 (i7-12700H, RTX 3080 Ti) | |
| Lenovo Legion 5 Pro 16 G7 i7 RTX 3070Ti | |
| MSI Katana GF66 12UGS | |
| Moyenne Intel Core i7-12700H, NVIDIA GeForce RTX 3070 Laptop GPU (7082 - 7647, n=2) | |
| Schenker XMG Neo 15 (Ryzen 9 6900HX, RTX 3070 Ti) | |
| MSI Pulse GL66 12UEK | |
| MSI Crosshair 15 R6E B12UGZ-050 | |
| Acer Nitro 5 AN515-58-72QR | |
| Asus TUF Dash F15 FX517ZR | |
| PCMark 10 / Essentials | |
| MSI Stealth GS66 12UGS | |
| Aorus 15 XE5 | |
| Moyenne de la classe Gaming (8810 - 11935, n=97, 2 dernières années) | |
| Schenker XMG Neo 15 (i7-12700H, RTX 3080 Ti) | |
| Moyenne Intel Core i7-12700H, NVIDIA GeForce RTX 3070 Laptop GPU (10076 - 10926, n=2) | |
| Schenker XMG Neo 15 (Ryzen 9 6900HX, RTX 3070 Ti) | |
| MSI Pulse GL66 12UEK | |
| MSI Katana GF66 12UGS | |
| MSI Crosshair 15 R6E B12UGZ-050 | |
| Asus TUF Dash F15 FX517ZR | |
| Lenovo Legion 5 Pro 16 G7 i7 RTX 3070Ti | |
| Acer Nitro 5 AN515-58-72QR | |
| PCMark 10 / Productivity | |
| Moyenne de la classe Gaming (6845 - 25323, n=95, 2 dernières années) | |
| Aorus 15 XE5 | |
| MSI Katana GF66 12UGS | |
| Lenovo Legion 5 Pro 16 G7 i7 RTX 3070Ti | |
| MSI Pulse GL66 12UEK | |
| Moyenne Intel Core i7-12700H, NVIDIA GeForce RTX 3070 Laptop GPU (9460 - 9877, n=2) | |
| Schenker XMG Neo 15 (Ryzen 9 6900HX, RTX 3070 Ti) | |
| Asus TUF Dash F15 FX517ZR | |
| MSI Stealth GS66 12UGS | |
| MSI Crosshair 15 R6E B12UGZ-050 | |
| Schenker XMG Neo 15 (i7-12700H, RTX 3080 Ti) | |
| Acer Nitro 5 AN515-58-72QR | |
| PCMark 10 / Digital Content Creation | |
| Moyenne de la classe Gaming (7602 - 19954, n=95, 2 dernières années) | |
| Schenker XMG Neo 15 (i7-12700H, RTX 3080 Ti) | |
| Lenovo Legion 5 Pro 16 G7 i7 RTX 3070Ti | |
| MSI Stealth GS66 12UGS | |
| Aorus 15 XE5 | |
| MSI Katana GF66 12UGS | |
| Moyenne Intel Core i7-12700H, NVIDIA GeForce RTX 3070 Laptop GPU (10113 - 11245, n=2) | |
| Acer Nitro 5 AN515-58-72QR | |
| MSI Crosshair 15 R6E B12UGZ-050 | |
| Schenker XMG Neo 15 (Ryzen 9 6900HX, RTX 3070 Ti) | |
| MSI Pulse GL66 12UEK | |
| Asus TUF Dash F15 FX517ZR | |
| CrossMark / Overall | |
| MSI Pulse GL66 12UEK | |
| MSI Crosshair 15 R6E B12UGZ-050 | |
| Moyenne de la classe Gaming (1366 - 2409, n=94, 2 dernières années) | |
| Lenovo Legion 5 Pro 16 G7 i7 RTX 3070Ti | |
| Aorus 15 XE5 | |
| MSI Katana GF66 12UGS | |
| Moyenne Intel Core i7-12700H, NVIDIA GeForce RTX 3070 Laptop GPU (1844 - 2003, n=2) | |
| Asus TUF Dash F15 FX517ZR | |
| Schenker XMG Neo 15 (i7-12700H, RTX 3080 Ti) | |
| Acer Nitro 5 AN515-58-72QR | |
| Schenker XMG Neo 15 (Ryzen 9 6900HX, RTX 3070 Ti) | |
| CrossMark / Productivity | |
| MSI Pulse GL66 12UEK | |
| MSI Crosshair 15 R6E B12UGZ-050 | |
| MSI Katana GF66 12UGS | |
| Aorus 15 XE5 | |
| Moyenne Intel Core i7-12700H, NVIDIA GeForce RTX 3070 Laptop GPU (1785 - 1971, n=2) | |
| Lenovo Legion 5 Pro 16 G7 i7 RTX 3070Ti | |
| Moyenne de la classe Gaming (1386 - 2254, n=94, 2 dernières années) | |
| Acer Nitro 5 AN515-58-72QR | |
| Asus TUF Dash F15 FX517ZR | |
| Schenker XMG Neo 15 (i7-12700H, RTX 3080 Ti) | |
| Schenker XMG Neo 15 (Ryzen 9 6900HX, RTX 3070 Ti) | |
| CrossMark / Creativity | |
| Moyenne de la classe Gaming (1343 - 2786, n=94, 2 dernières années) | |
| MSI Pulse GL66 12UEK | |
| Lenovo Legion 5 Pro 16 G7 i7 RTX 3070Ti | |
| Schenker XMG Neo 15 (i7-12700H, RTX 3080 Ti) | |
| Asus TUF Dash F15 FX517ZR | |
| Aorus 15 XE5 | |
| MSI Crosshair 15 R6E B12UGZ-050 | |
| Moyenne Intel Core i7-12700H, NVIDIA GeForce RTX 3070 Laptop GPU (1912 - 1979, n=2) | |
| MSI Katana GF66 12UGS | |
| Acer Nitro 5 AN515-58-72QR | |
| Schenker XMG Neo 15 (Ryzen 9 6900HX, RTX 3070 Ti) | |
| CrossMark / Responsiveness | |
| MSI Pulse GL66 12UEK | |
| MSI Crosshair 15 R6E B12UGZ-050 | |
| MSI Katana GF66 12UGS | |
| Aorus 15 XE5 | |
| Moyenne Intel Core i7-12700H, NVIDIA GeForce RTX 3070 Laptop GPU (1824 - 2182, n=2) | |
| Lenovo Legion 5 Pro 16 G7 i7 RTX 3070Ti | |
| Moyenne de la classe Gaming (1226 - 2334, n=94, 2 dernières années) | |
| Acer Nitro 5 AN515-58-72QR | |
| Asus TUF Dash F15 FX517ZR | |
| Schenker XMG Neo 15 (i7-12700H, RTX 3080 Ti) | |
| Schenker XMG Neo 15 (Ryzen 9 6900HX, RTX 3070 Ti) | |
| PCMark 8 Home Score Accelerated v2 | 6083 points | |
| PCMark 8 Creative Score Accelerated v2 | 9960 points | |
| PCMark 8 Work Score Accelerated v2 | 6346 points | |
| PCMark 10 Score | 7082 points | |
Aide | ||
| AIDA64 / Memory Latency | |
| Moyenne de la classe Gaming (75.3 - 259, n=105, 2 dernières années) | |
| Lenovo Legion 5 Pro 16 G7 i7 RTX 3070Ti | |
| MSI Katana GF66 12UGS | |
| Asus TUF Dash F15 FX517ZR | |
| Aorus 15 XE5 | |
| MSI Stealth GS66 12UGS | |
| MSI Crosshair 15 R6E B12UGZ-050 | |
| MSI Pulse GL66 12UEK | |
| Schenker XMG Neo 15 (Ryzen 9 6900HX, RTX 3070 Ti) | |
| Moyenne Intel Core i7-12700H (76.2 - 133.9, n=62) | |
| Acer Nitro 5 AN515-58-72QR | |
| Acer Nitro 5 AN515-58-72QR | |
* ... Moindre est la valeur, meilleures sont les performances
Latence DPC
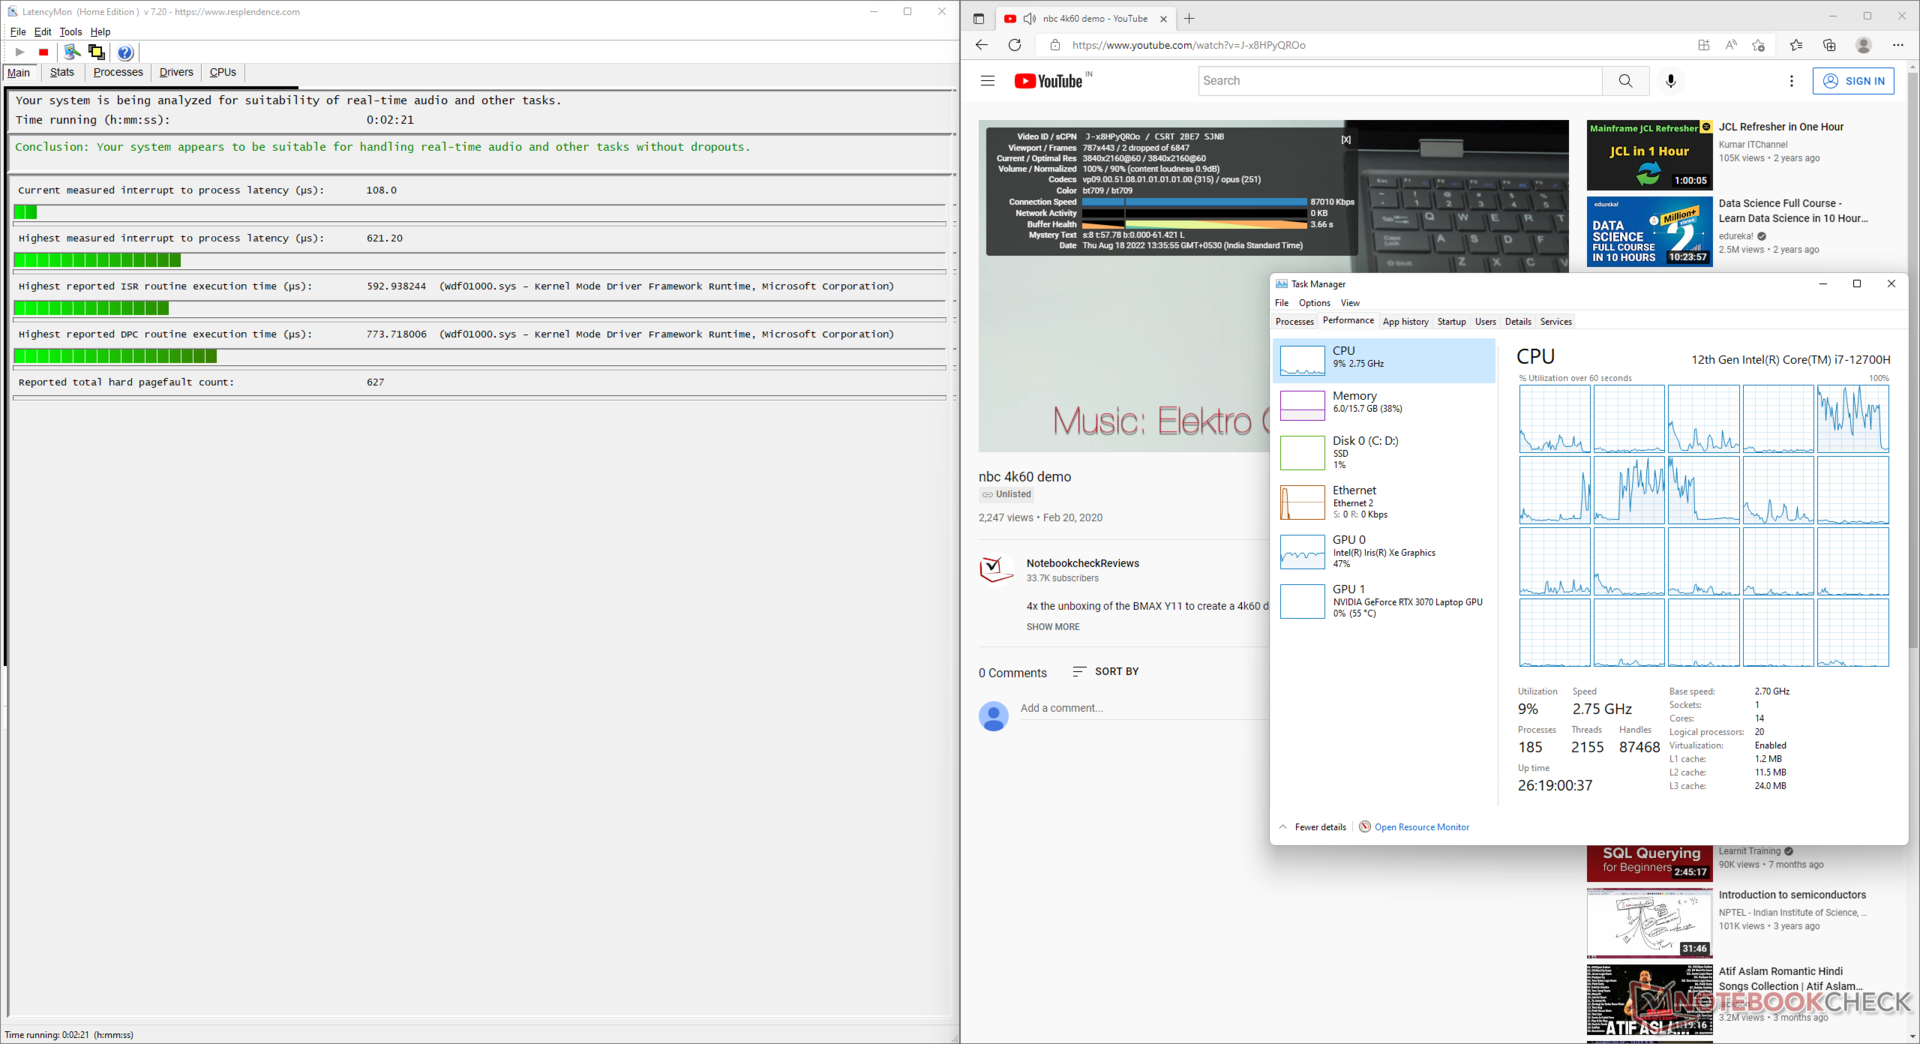
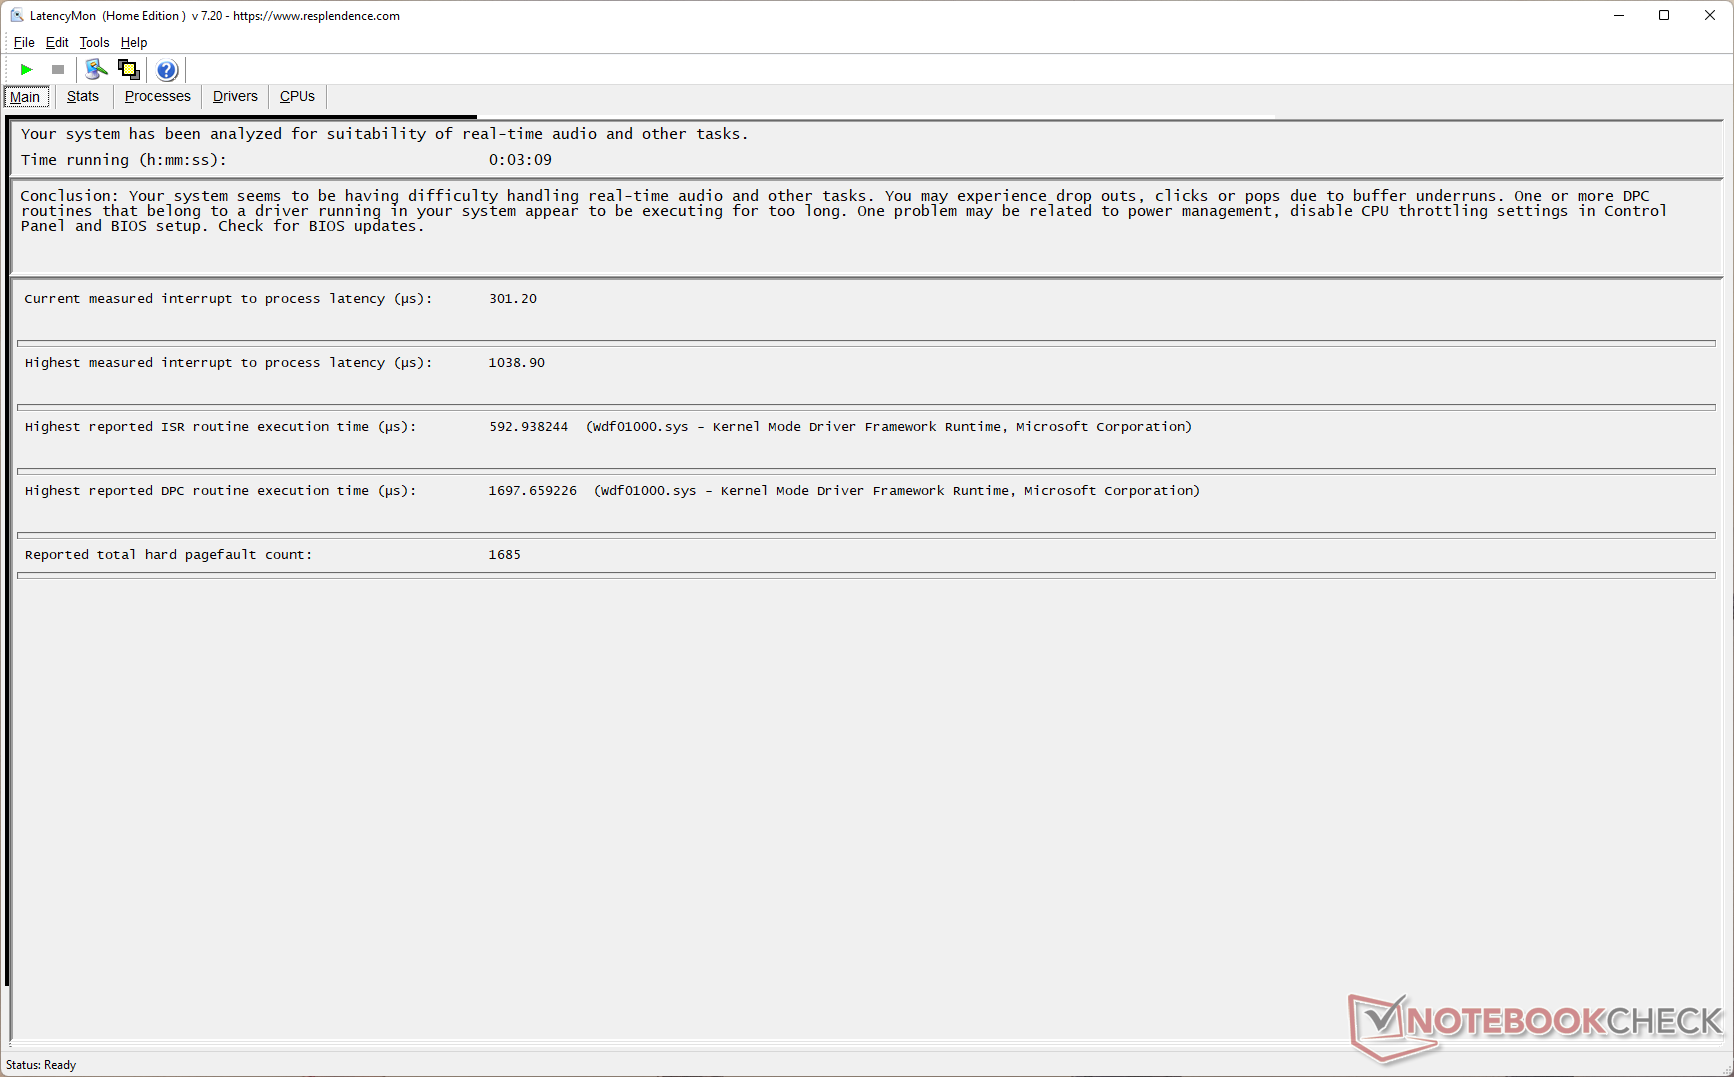
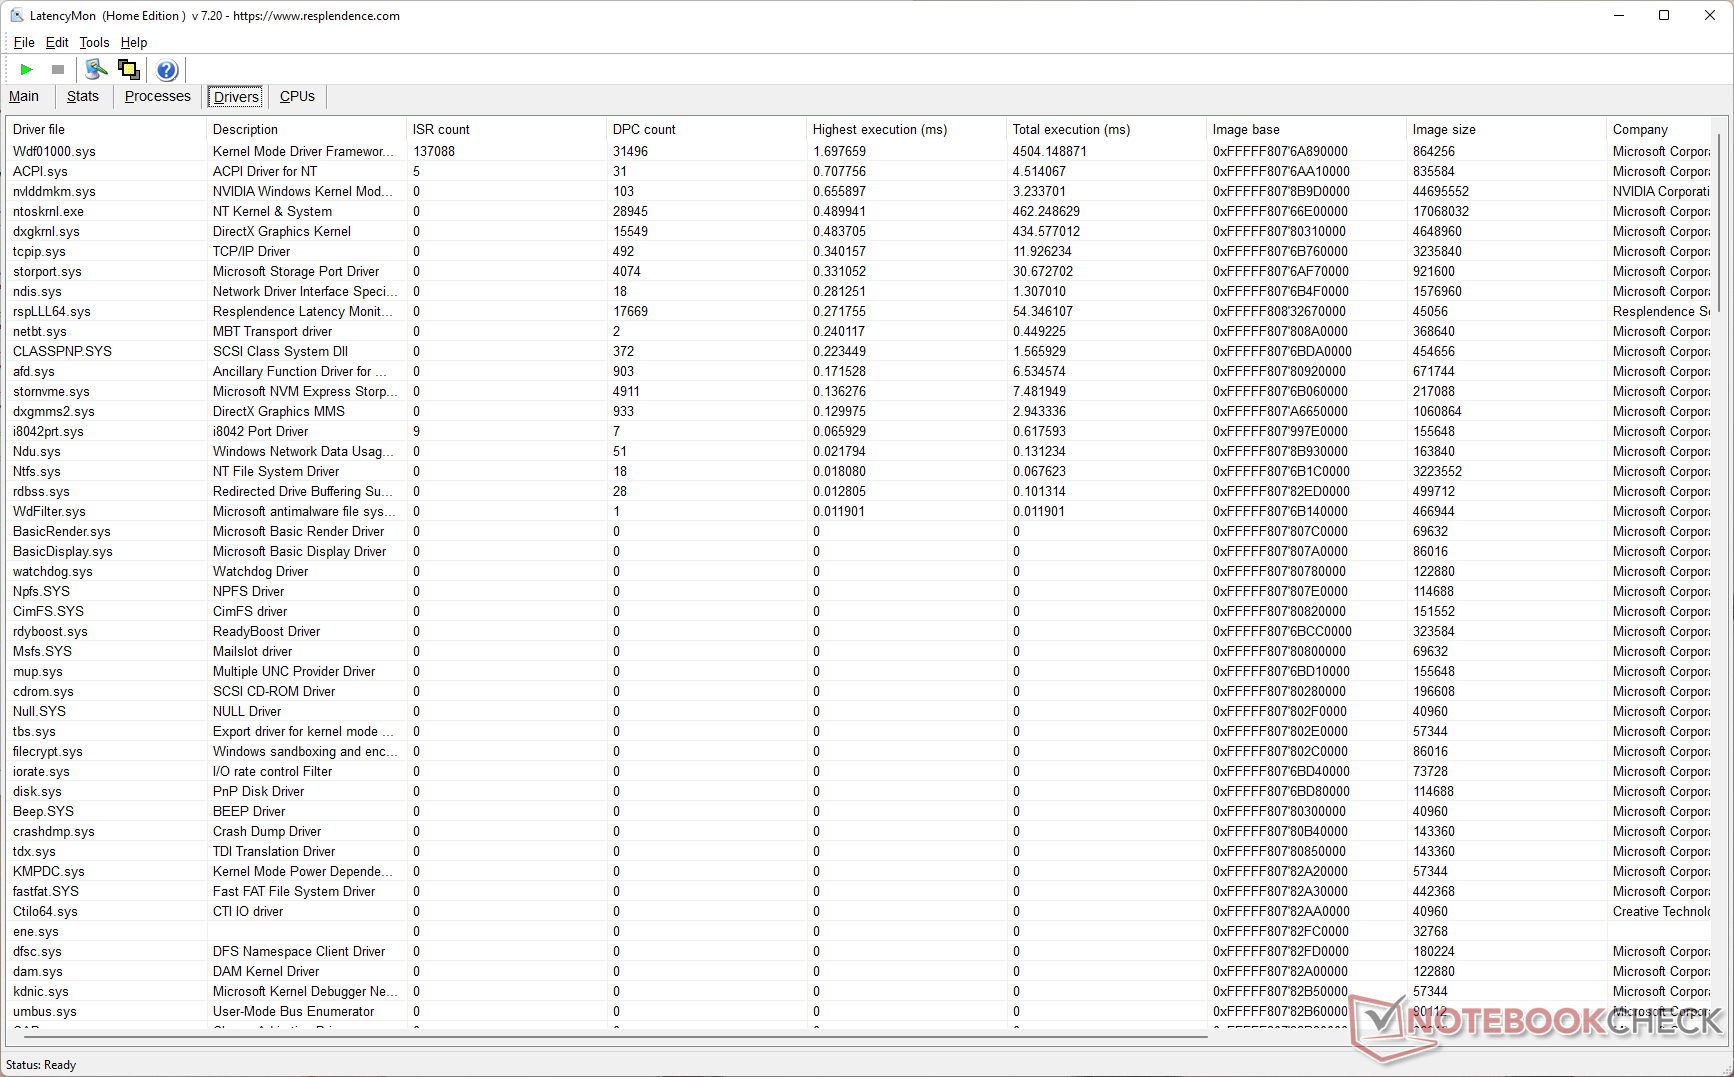
Notre test standardisé LatencyMon montre que la Crosshair 15 R6E a une latence DPC un peu plus élevée que les autres ordinateurs portables équipés d'un Core i7-12700H. Nous avons observé une augmentation de la latence après avoir exécuté le test Prime95 in-place large FFTs après notre benchmark YouTube
Le Windows Kernel Mode Driver Framework semble être la raison de l'augmentation des valeurs de latence.
| DPC Latencies / LatencyMon - interrupt to process latency (max), Web, Youtube, Prime95 | |
| Schenker XMG Neo 15 (i7-12700H, RTX 3080 Ti) | |
| MSI Stealth GS66 12UGS | |
| Schenker XMG Neo 15 (Ryzen 9 6900HX, RTX 3070 Ti) | |
| Aorus 15 XE5 | |
| MSI Crosshair 15 R6E B12UGZ-050 | |
| MSI Pulse GL66 12UEK | |
| Acer Nitro 5 AN515-58-72QR | |
| Lenovo Legion 5 Pro 16 G7 i7 RTX 3070Ti | |
| MSI Katana GF66 12UGS | |
| Asus TUF Dash F15 FX517ZR | |
* ... Moindre est la valeur, meilleures sont les performances
Vous pouvez trouver d'autres comparaisons de latence entre les appareils examinés dans notre Classement de latence DPC page.
Périphériques de stockage
Le SSD PCIe NVMe Micron 2450 de 1 To ne bat aucun record de vitesse. Les deux emplacements NVMe M.2 de la Crosshair 15 R6E et le disque Micron lui-même prennent en charge PCIe Gen 4, mais les performances sont plus proches des vitesses PCIe Gen 3. Ceci étant dit, le disque est capable de se rapprocher de ses spécifications d'E/S nominales pour la plupart.
Le disque ne présente aucun étranglement dans notre test de boucle de lecture DiskSpd avec une profondeur de file d'attente de 8. Il n'est pas possible d'ajouter une extension de stockage SATA 2,5 pouces.

* ... Moindre est la valeur, meilleures sont les performances
Disk Throttling: DiskSpd Read Loop, Queue Depth 8
Performances du GPU
Notre unité de test Crosshair 15 R6E utilise un GPU RTX 3070 140 W pour ordinateur portable avec 8 GB GDDR6 VRAM. MSI ne précise pas le Dynamic Boost exact de ce GPU.
les performances 3DMark sont en retard sur certaines RTX 3070 Ti-mais pas de beaucoup. Le Crosshair 15 R6E est derrière la RTX 3080 Ti-de 11% et 13% dans les tests 3DMark Fire Strike Graphics et Time Spy Graphics, respectivement.
Le test Asus TUF Dash F15 avec le même GPU est 19% plus lent que celui de la Crosshair 15 R6E en raison d'un TGP de 105 W inférieur.
| 3DMark 11 Performance | 30240 points | |
| 3DMark Ice Storm Standard Score | 158460 points | |
| 3DMark Cloud Gate Standard Score | 56797 points | |
| 3DMark Fire Strike Score | 24233 points | |
| 3DMark Fire Strike Extreme Score | 12959 points | |
| 3DMark Time Spy Score | 10496 points | |
Aide | ||
La Crosshair 15 R6E prend 42% et 33% de temps en moins dans Blender Classroom Optix et Classroom CUDA, respectivement, par rapport aux temps moyens enregistrés pour le GPU RTX 3070 Laptop.
| Blender / v3.3 Classroom OPTIX/RTX | |
| Asus TUF Dash F15 FX517ZR | |
| Moyenne NVIDIA GeForce RTX 3070 Laptop GPU (26 - 30, n=8) | |
| MSI Crosshair 15 R6E B12UGZ-050 | |
| Aorus 15 XE5 | |
| Schenker XMG Neo 15 (Ryzen 9 6900HX, RTX 3070 Ti) | |
| Moyenne de la classe Gaming (9 - 32, n=106, 2 dernières années) | |
| Blender / v3.3 Classroom CUDA | |
| Asus TUF Dash F15 FX517ZR | |
| Moyenne NVIDIA GeForce RTX 3070 Laptop GPU (43 - 51, n=9) | |
| MSI Crosshair 15 R6E B12UGZ-050 | |
| Aorus 15 XE5 | |
| Schenker XMG Neo 15 (Ryzen 9 6900HX, RTX 3070 Ti) | |
| Moyenne de la classe Gaming (15 - 228, n=106, 2 dernières années) | |
| Blender / v3.3 Classroom CPU | |
| Moyenne NVIDIA GeForce RTX 3070 Laptop GPU (329 - 698, n=12) | |
| Asus TUF Dash F15 FX517ZR | |
| Aorus 15 XE5 | |
| MSI Crosshair 15 R6E B12UGZ-050 | |
| Schenker XMG Neo 15 (Ryzen 9 6900HX, RTX 3070 Ti) | |
| Moyenne de la classe Gaming (122 - 565, n=102, 2 dernières années) | |
* ... Moindre est la valeur, meilleures sont les performances
Performances en matière de jeux
Les performances de jeu dans les jeux testés en configuration 1080p Ultra ne sont inférieures que d'environ 8 % à celles du XMG Neo 15 équipé d'une RTX 3080 Ti. Le Lenovo Legion 5i Pro 16 G7 équipé d'une RTX 3070 Ti montre une avance perceptible sur le Crosshair 15 R6E dans la plupart des jeux, particulièrement en QHD Ultra.
Le XMG Neo 15 équipé d'une RTX 3080 Ti peut être jusqu'à 17% dans Far Cry 5 QHD Ultra, mais ce delta augmente à 45% en Le Witcher 3 à 1080p High. Dans Rainbow Six : Extraction, le Crosshair 15 R6E montre de bonnes avances dans les paramètres 1080p et QHD Ultra par rapport au Stealth GS66 avec un GPU RTX 3070 Ti pour ordinateur portable.
| F1 2021 | |
| 1920x1080 High Preset AA:T AF:16x | |
| Lenovo Legion 5 Pro 16 G7 i7 RTX 3070Ti | |
| MSI Stealth GS66 12UGS | |
| MSI Crosshair 15 R6E B12UGZ-050 | |
| Moyenne NVIDIA GeForce RTX 3070 Laptop GPU (66.1 - 256, n=16) | |
| Asus TUF Dash F15 FX517ZR | |
| Acer Nitro 5 AN515-58-72QR | |
| 1920x1080 Ultra High Preset + Raytracing AA:T AF:16x | |
| Lenovo Legion 5 Pro 16 G7 i7 RTX 3070Ti | |
| MSI Crosshair 15 R6E B12UGZ-050 | |
| MSI Stealth GS66 12UGS | |
| Acer Nitro 5 AN515-58-72QR | |
| Moyenne NVIDIA GeForce RTX 3070 Laptop GPU (33.1 - 123.1, n=23) | |
| Asus TUF Dash F15 FX517ZR | |
| 2560x1440 Ultra High Preset + Raytracing AA:T AF:16x | |
| Lenovo Legion 5 Pro 16 G7 i7 RTX 3070Ti | |
| MSI Crosshair 15 R6E B12UGZ-050 | |
| Moyenne NVIDIA GeForce RTX 3070 Laptop GPU (67.1 - 90.2, n=11) | |
| Acer Nitro 5 AN515-58-72QR | |
| MSI Stealth GS66 12UGS | |
| Asus TUF Dash F15 FX517ZR | |
| Rainbow Six Extraction | |
| 1920x1080 High Preset (with Fixed Resolution Quality) | |
| Moyenne NVIDIA GeForce RTX 3070 Laptop GPU (171 - 202, n=4) | |
| MSI Stealth GS66 12UGS | |
| MSI Crosshair 15 R6E B12UGZ-050 | |
| 1920x1080 Ultra Preset (with Fixed Resolution Quality) | |
| MSI Crosshair 15 R6E B12UGZ-050 | |
| Moyenne NVIDIA GeForce RTX 3070 Laptop GPU (149 - 157, n=4) | |
| MSI Stealth GS66 12UGS | |
| 2560x1440 Ultra Preset (with Fixed Resolution Quality) | |
| MSI Crosshair 15 R6E B12UGZ-050 | |
| Moyenne NVIDIA GeForce RTX 3070 Laptop GPU (97 - 103, n=3) | |
| MSI Stealth GS66 12UGS | |
Le tableau des FPS de Witcher 3
Le GPU RTX 3070 pour ordinateur portable affiche de bonnes performances soutenues dans The Witcher 3 à 1080p Ultra, le personnage restant immobile pendant toute la durée du test. Nous constatons des fluctuations du taux de rafraîchissement, mais elles ne sont pas très marquées.
| Bas | Moyen | Élevé | Ultra | QHD | 4K | |
|---|---|---|---|---|---|---|
| GTA V (2015) | 184.2 | 182 | 173.8 | 113.7 | 97.1 | |
| The Witcher 3 (2015) | 368 | 294 | 168 | 105.7 | ||
| Dota 2 Reborn (2015) | 177.7 | 161.4 | 150.4 | 142.7 | 127.2 | |
| Final Fantasy XV Benchmark (2018) | 166.6 | 127.5 | 98 | 79 | 46.9 | |
| X-Plane 11.11 (2018) | 150.1 | 133.1 | 106.3 | 98.7 | ||
| Far Cry 5 (2018) | 137 | 125 | 122 | 118 | 99 | |
| Strange Brigade (2018) | 444 | 251 | 211 | 185.5 | 140.5 | |
| F1 2021 (2021) | 319 | 228 | 192.6 | 115.4 | 86.3 | |
| Rainbow Six Extraction (2022) | 225 | 189 | 171 | 155 | 103 | |
| Cyberpunk 2077 1.6 (2022) | 123 | 111.6 | 90.8 | 76.9 | 49.5 |
Consultez notre site dédié GPU pour ordinateur portable Nvidia GeForce RTX 3070 pour plus d'informations et des comparaisons de performances.
Émissions : Niveaux de bruit tolérables dans le profil Équilibré
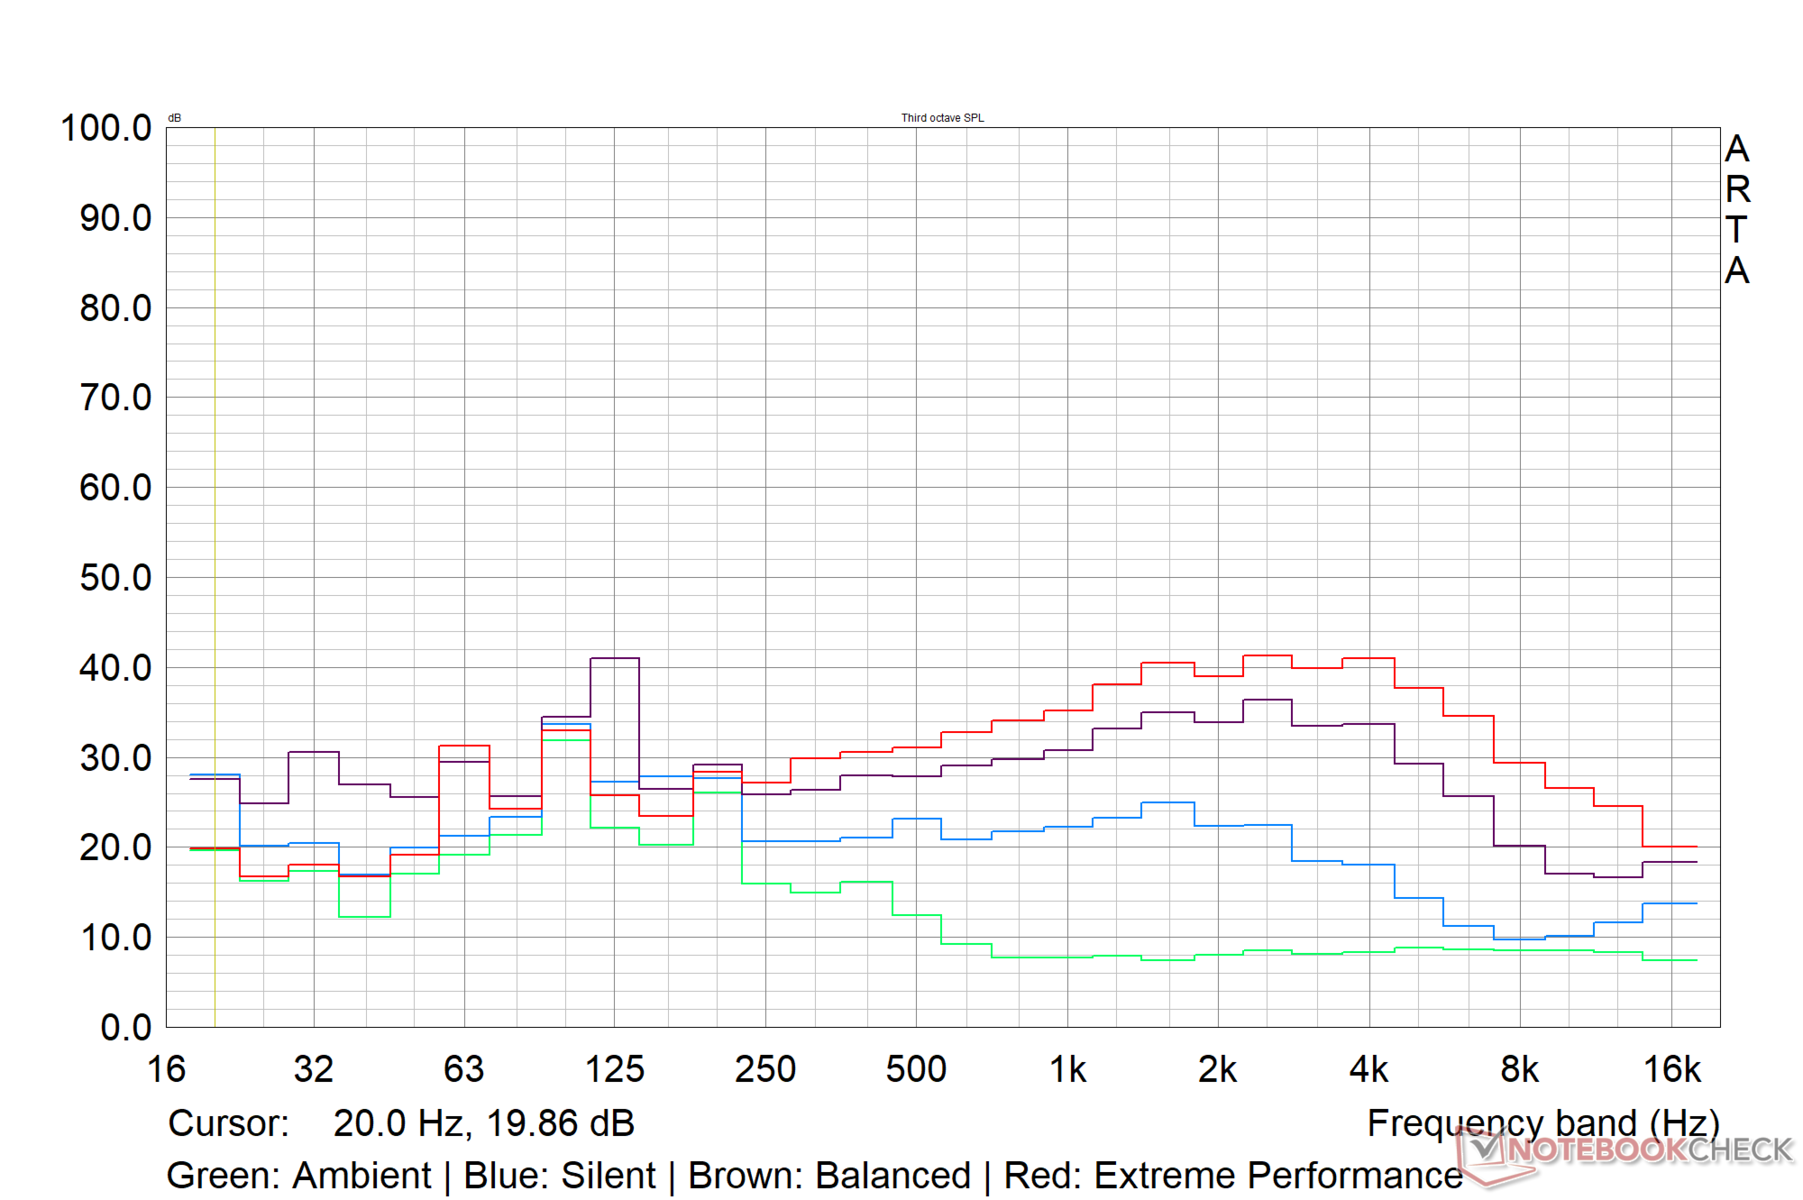
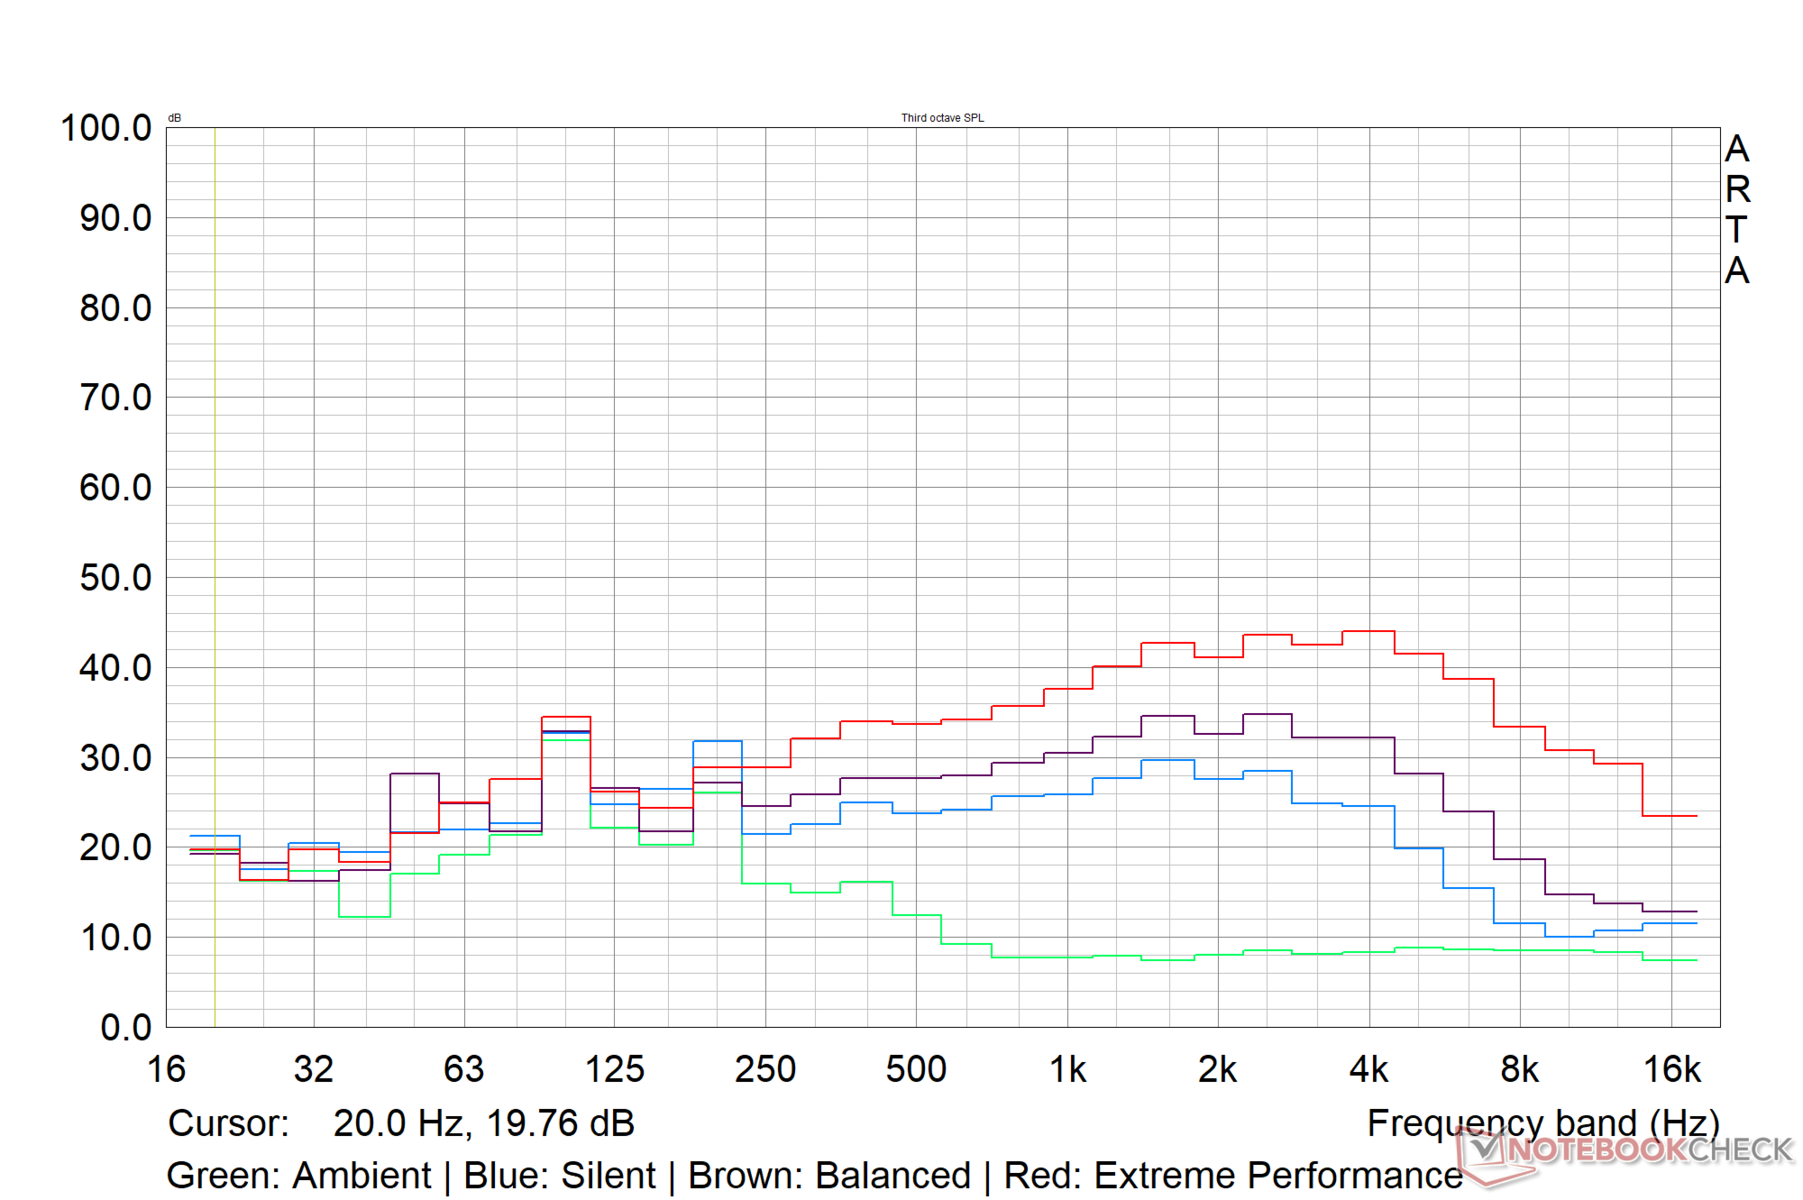
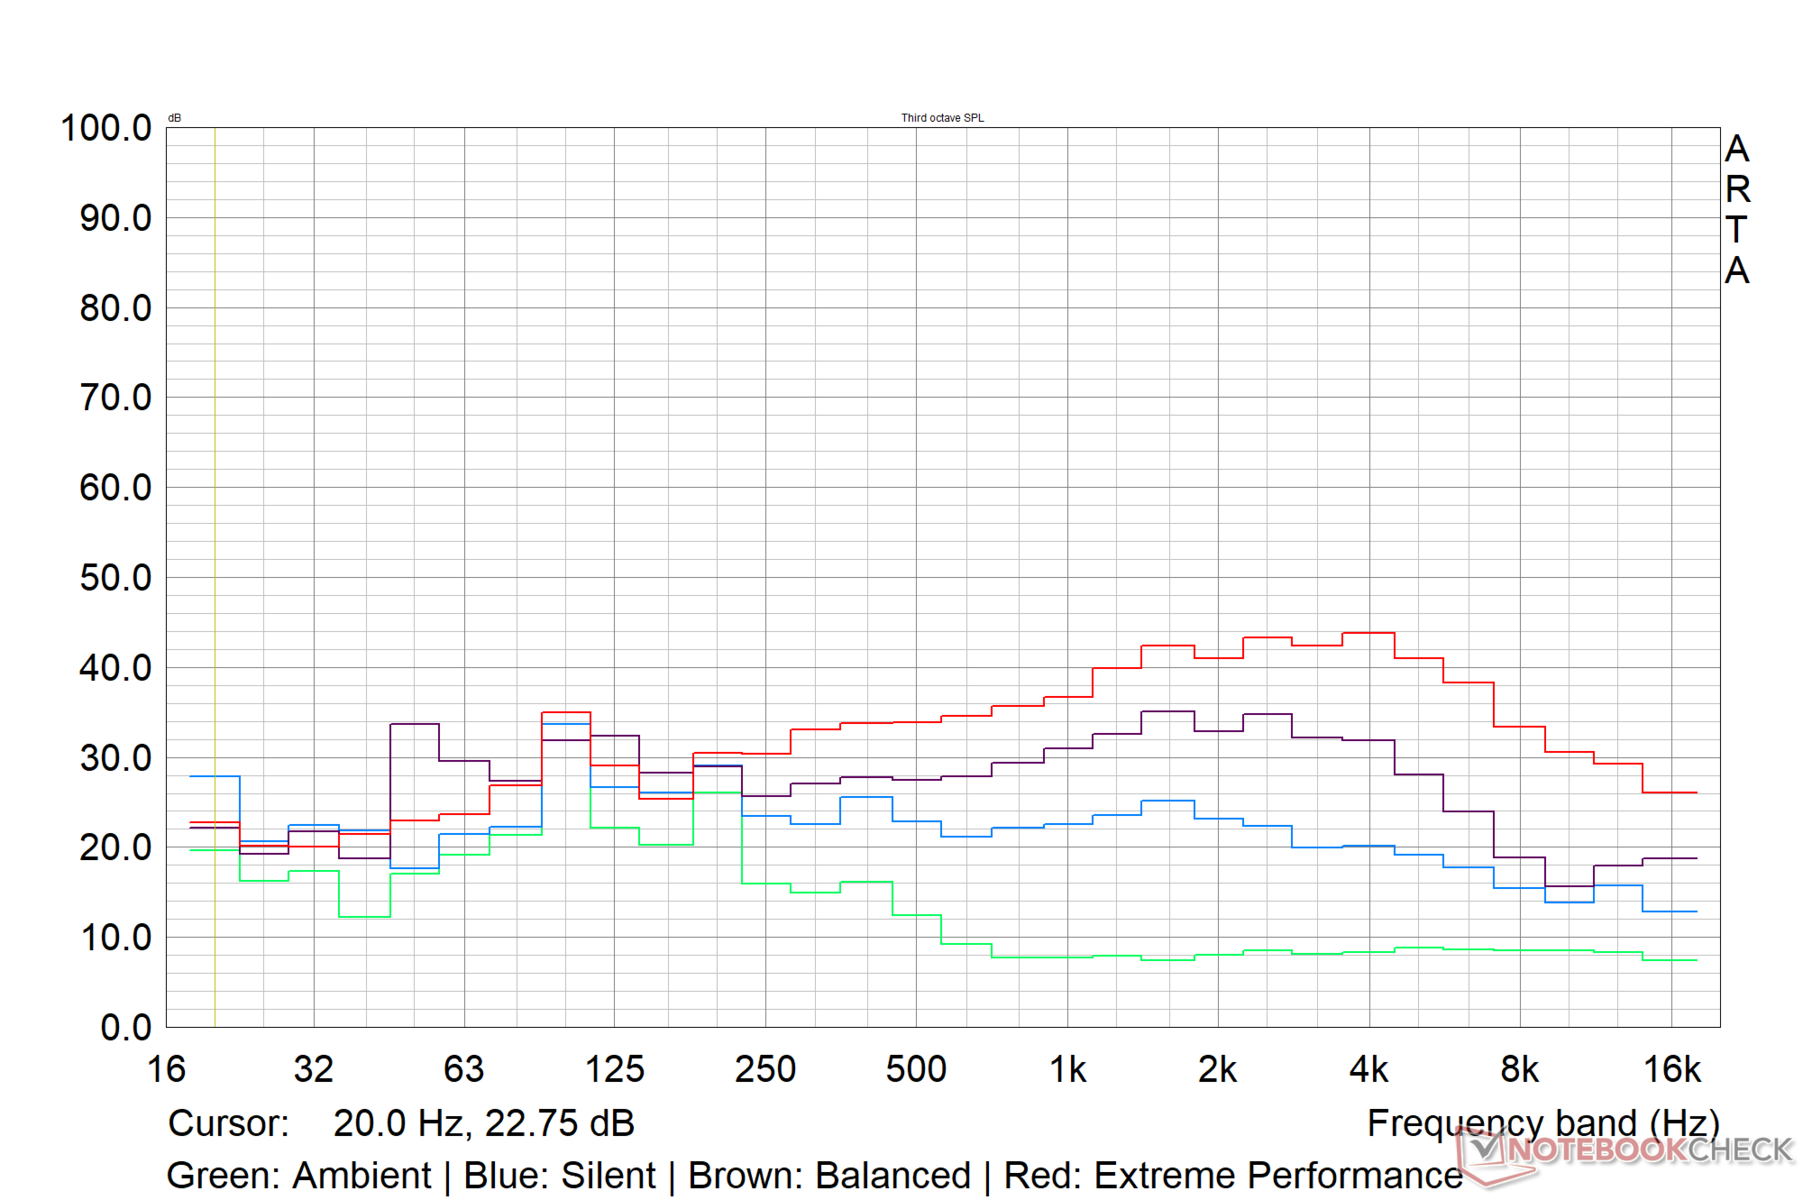
Bruit du système
Le bruit du ventilateur dans le réglage par défaut Balanced est tout à fait tolérable, même en charge. MSI semble avoir plafonné le bruit maximum du ventilateur du Crosshair 15 R6E à environ 45 db(A) dans ce mode.
Le paramètre de performance extrême voit le niveau de pression acoustique (SPL) augmenter jusqu'à 52 dB(A). Le SPL est limité à moins de 40 dB(A) dans le profil Silencieux.
| Performance Réglage | Idle dB(A) | Load Average dB(A) | Load Maximum dB(A) | The Witcher 3 dB(A) |
|---|---|---|---|---|
| Silencieux | 25.98 | 33.09 | 37.69 | 34 |
| Équilibré | 26.14 | 44.33 | 43.20 | 43.34 |
| Performance extrême | 26.14 | 50.07 | 52.66 | 52.43 |
Degré de la nuisance sonore
| Au repos |
| 26.14 / 26.14 / 26.14 dB(A) |
| Fortement sollicité |
| 44.33 / 43.2 dB(A) |
 | ||
30 dB silencieux 40 dB(A) audible 50 dB(A) bruyant |
||
min: | ||
| MSI Crosshair 15 R6E B12UGZ-050 Intel Core i7-12700H, NVIDIA GeForce RTX 3070 Laptop GPU | MSI Stealth GS66 12UGS Intel Core i7-12700H, NVIDIA GeForce RTX 3070 Ti Laptop GPU | Lenovo Legion 5 Pro 16 G7 i7 RTX 3070Ti Intel Core i7-12700H, NVIDIA GeForce RTX 3070 Ti Laptop GPU | Asus TUF Dash F15 FX517ZR Intel Core i7-12650H, NVIDIA GeForce RTX 3070 Laptop GPU | Schenker XMG Neo 15 (Ryzen 9 6900HX, RTX 3070 Ti) AMD Ryzen 9 6900HX, NVIDIA GeForce RTX 3070 Ti Laptop GPU | |
|---|---|---|---|---|---|
| Noise | -14% | -12% | -13% | -7% | |
| arrêt / environnement * (dB) | 22.82 | 24 -5% | 24.6 -8% | 26 -14% | 23 -1% |
| Idle Minimum * (dB) | 26.14 | 31 -19% | 28.4 -9% | 26 1% | 23 12% |
| Idle Average * (dB) | 26.14 | 32 -22% | 28.4 -9% | 32 -22% | 25.82 1% |
| Idle Maximum * (dB) | 26.14 | 35 -34% | 28.4 -9% | 33 -26% | 27.3 -4% |
| Load Average * (dB) | 44.33 | 48 -8% | 49.4 -11% | 48 -8% | 42.7 4% |
| Witcher 3 ultra * (dB) | 43.3 | 43 1% | 49.4 -14% | 47 -9% | 56 -29% |
| Load Maximum * (dB) | 43.2 | 48 -11% | 54.7 -27% | 49 -13% | 56 -30% |
* ... Moindre est la valeur, meilleures sont les performances
Température
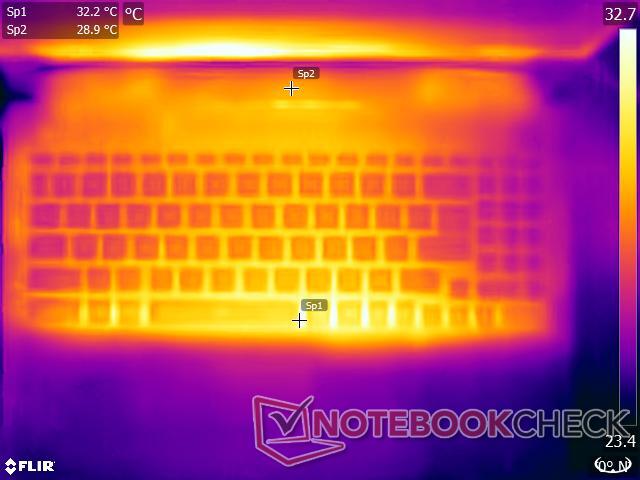
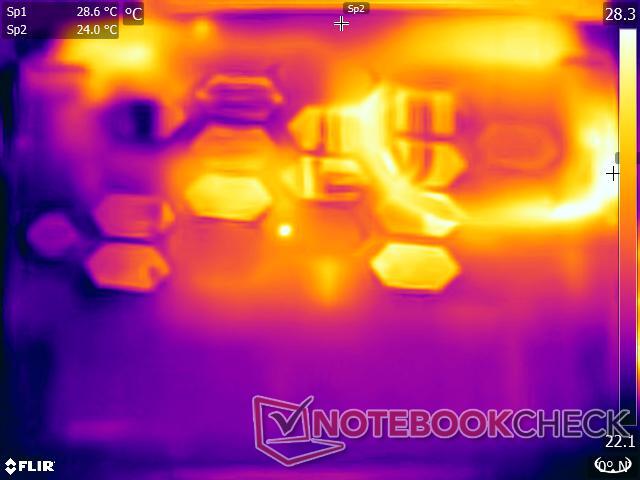
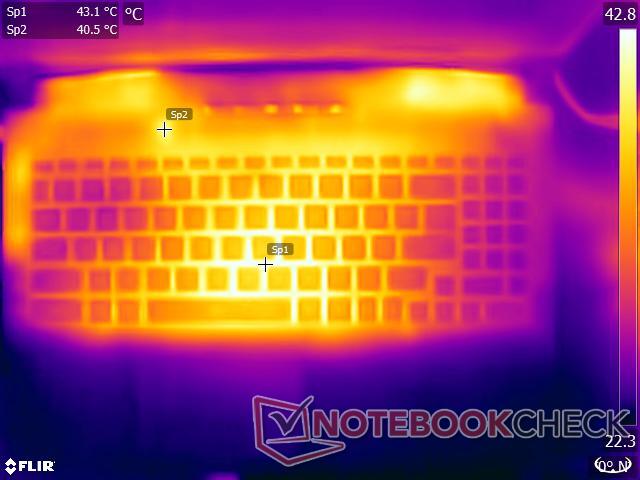
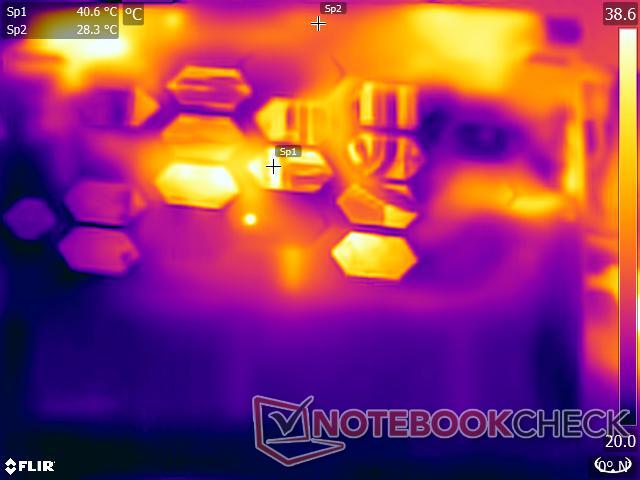
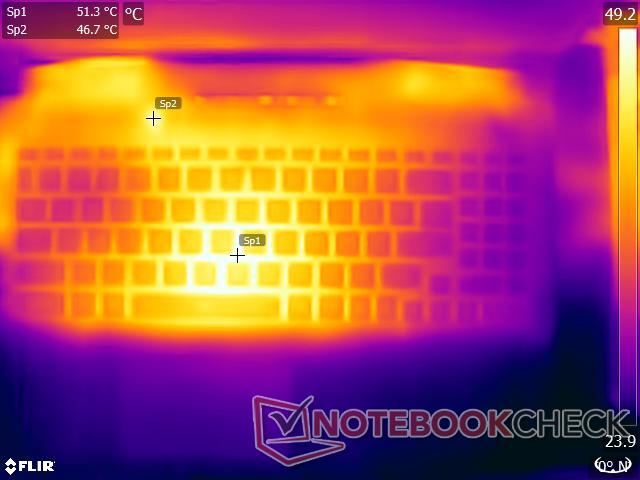
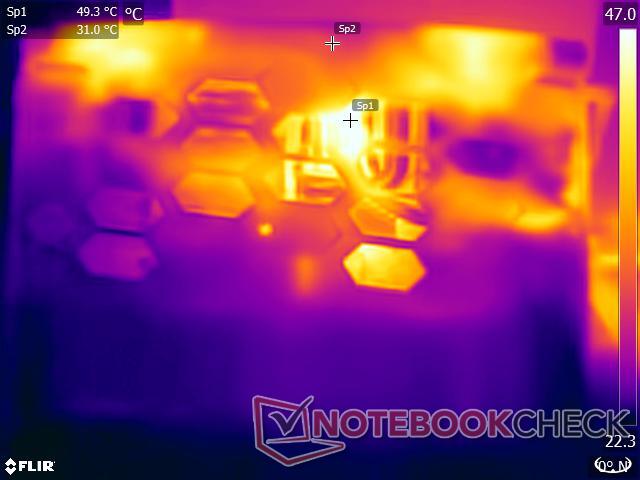
Les températures de surface sont tolérables pendant la plupart des tâches de productivité qui ne poussent pas le CPU et le GPU à leurs limites. Sous une charge combinée Prime95 et FurMark, nous avons enregistré des températures de surface allant jusqu'à 48 °C des deux côtés de l'appareil. Cette température atteint presque 55 °C lorsque nous utilisons The Witcher 3 à 1080p Ultra
Le pavé tactile et le repose-paume restent relativement froids tout au long du test.
(-) La température maximale du côté supérieur est de 48.4 °C / 119 F, par rapport à la moyenne de 40.4 °C / 105 F, allant de 21.2 à 68.8 °C pour la classe Gaming.
(-) Le fond chauffe jusqu'à un maximum de 48.2 °C / 119 F, contre une moyenne de 43.2 °C / 110 F
(+) En utilisation inactive, la température moyenne du côté supérieur est de 30.6 °C / 87 F, par rapport à la moyenne du dispositif de 33.9 °C / 93 F.
(-) En jouant à The Witcher 3, la température moyenne du côté supérieur est de 43.5 °C / 110 F, alors que la moyenne de l'appareil est de 33.9 °C / 93 F.
(+) Les repose-poignets et le pavé tactile atteignent la température maximale de la peau (32.8 °C / 91 F) et ne sont donc pas chauds.
(-) La température moyenne de la zone de l'appui-paume de dispositifs similaires était de 28.8 °C / 83.8 F (-4 °C / #-7.2 F).
Bien que nos tests de résistance représentent des scénarios extrêmes, nous vous recommandons d'opter pour les modes de performance Silencieux ou Équilibré si vous souhaitez utiliser l'appareil sur vos genoux.
| MSI Crosshair 15 R6E B12UGZ-050 Intel Core i7-12700H, NVIDIA GeForce RTX 3070 Laptop GPU | MSI Stealth GS66 12UGS Intel Core i7-12700H, NVIDIA GeForce RTX 3070 Ti Laptop GPU | Lenovo Legion 5 Pro 16 G7 i7 RTX 3070Ti Intel Core i7-12700H, NVIDIA GeForce RTX 3070 Ti Laptop GPU | Asus TUF Dash F15 FX517ZR Intel Core i7-12650H, NVIDIA GeForce RTX 3070 Laptop GPU | Schenker XMG Neo 15 (Ryzen 9 6900HX, RTX 3070 Ti) AMD Ryzen 9 6900HX, NVIDIA GeForce RTX 3070 Ti Laptop GPU | |
|---|---|---|---|---|---|
| Heat | 2% | -1% | -6% | 6% | |
| Maximum Upper Side * (°C) | 48.4 | 54 -12% | 45.3 6% | 52 -7% | 41 15% |
| Maximum Bottom * (°C) | 48.2 | 59 -22% | 61.2 -27% | 52 -8% | 57 -18% |
| Idle Upper Side * (°C) | 34 | 26 24% | 28.6 16% | 33 3% | 28 18% |
| Idle Bottom * (°C) | 32.4 | 27 17% | 31.4 3% | 36 -11% | 30 7% |
* ... Moindre est la valeur, meilleures sont les performances
Test de stress
Pendant le stress Prime95, nous voyons que le Core i7-12700H est capable de monter jusqu'à 3,8 GHz tout en consommant 111 W. Cependant, les horloges moyennes du cœur sont plus dans la gamme des 2,9 GHz avec une puissance moyenne du boîtier autour de 80 W. Le processeur peut atteindre jusqu'à 93 °C pendant ce stress.
Avec le FurMark, la Crosshair 15 R6E transfère une partie de la consommation totale à la RTX 3070. Il en résulte une réduction de l'horloge moyenne du CPU à 1,9 GHz et une baisse de la puissance moyenne du boîtier à 47,4 W. La RTX 3070 est capable d'atteindre son horloge maximale à 1,9 GHz et de la maintenir à 1,54 GHz. Ce faisant, le GPU consomme près de 195 W en pic et une moyenne d'environ 101 W. Les températures moyennes du CPU et du GPU tournent autour de 85,6 °C et 79 °C, respectivement.
Le stress Witcher 3 à 1080p Ultra voit une distribution plus équitable de la puissance, avec le Core i7-12700H pouvant maintenant travailler à des vitesses moyennes de 2,2 GHz et la RTX 3070 boostant aussi légèrement plus haut à 1,6 GHz. L'augmentation de l'horloge moyenne du GPU se fait au détriment de la consommation d'énergie moyenne, qui s'élève à 138,5 W
Il est intéressant de noter que le Core i7-12700H est capable d'atteindre une horloge plus élevée avec un peu moins de 20 W de puissance moyenne. Les températures moyennes pendant le stress de The Witcher 3 tournent autour de 71,4 °C et 88 °C pour le CPU et le GPU, respectivement.
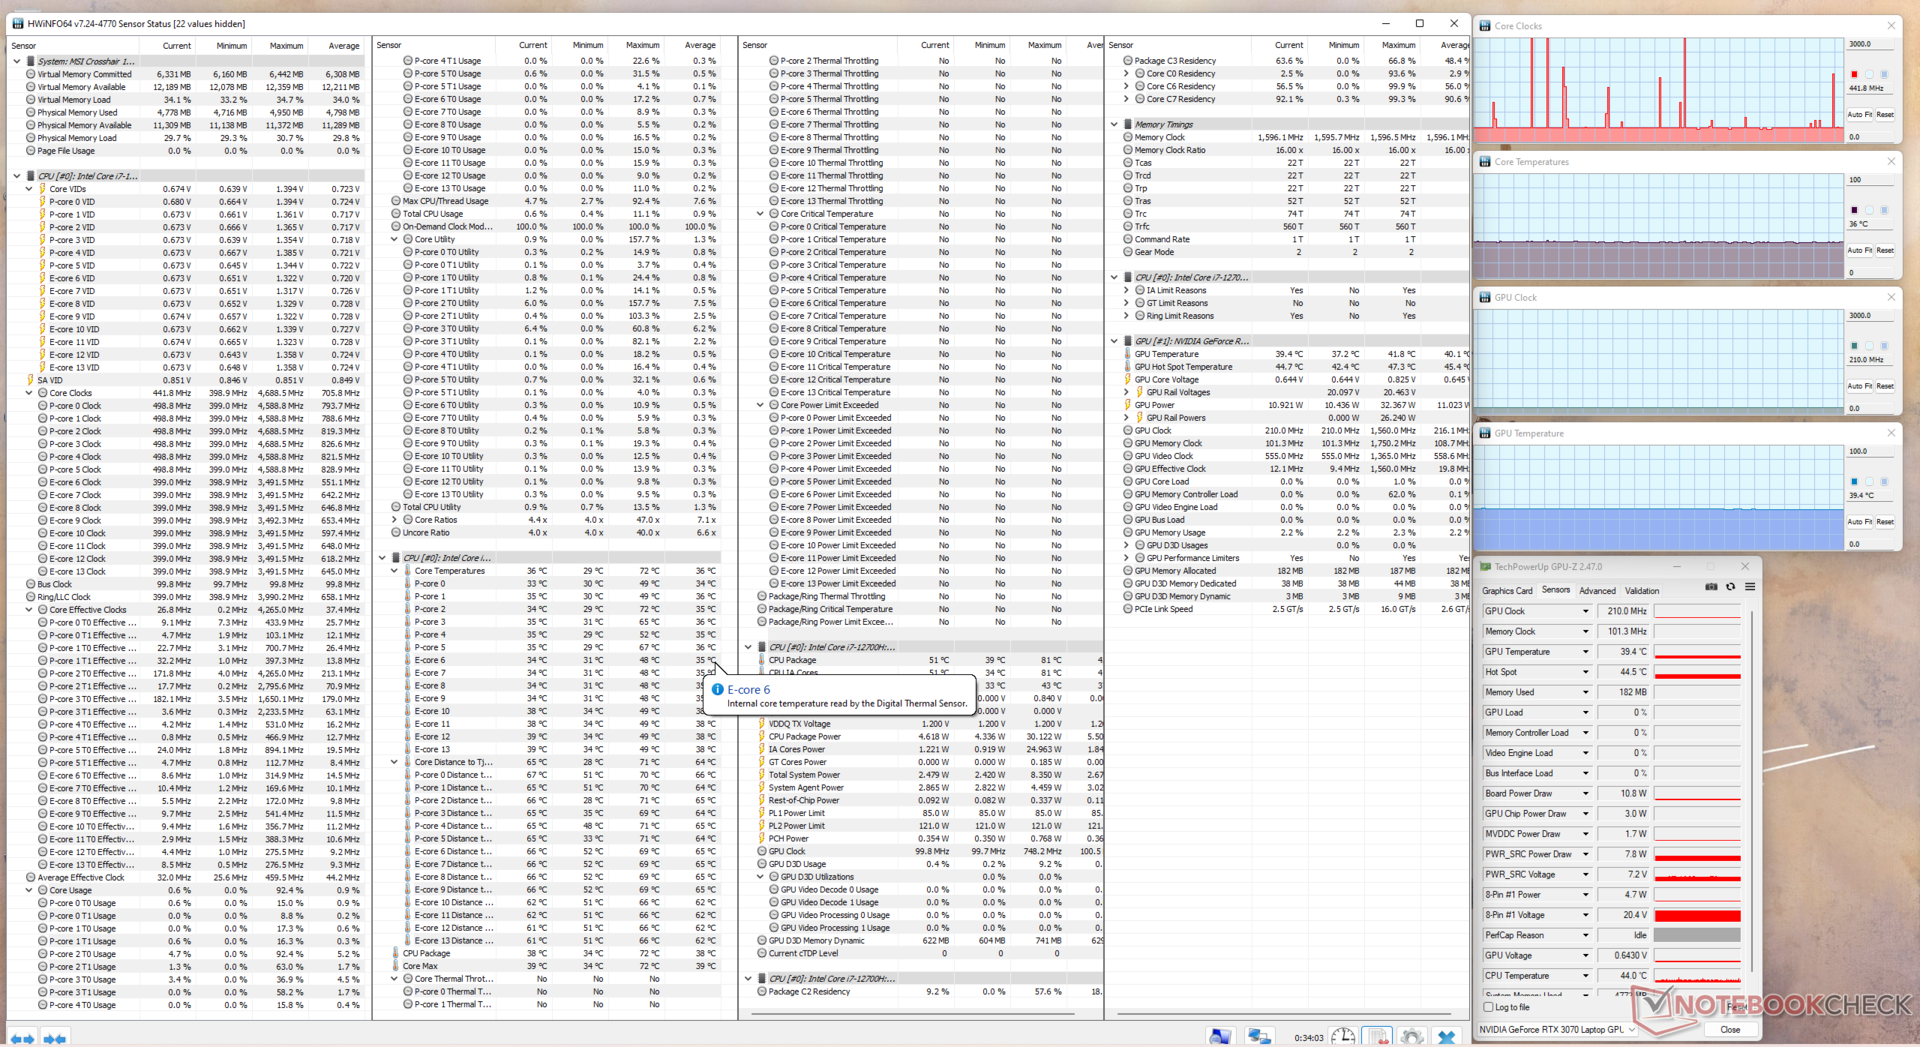
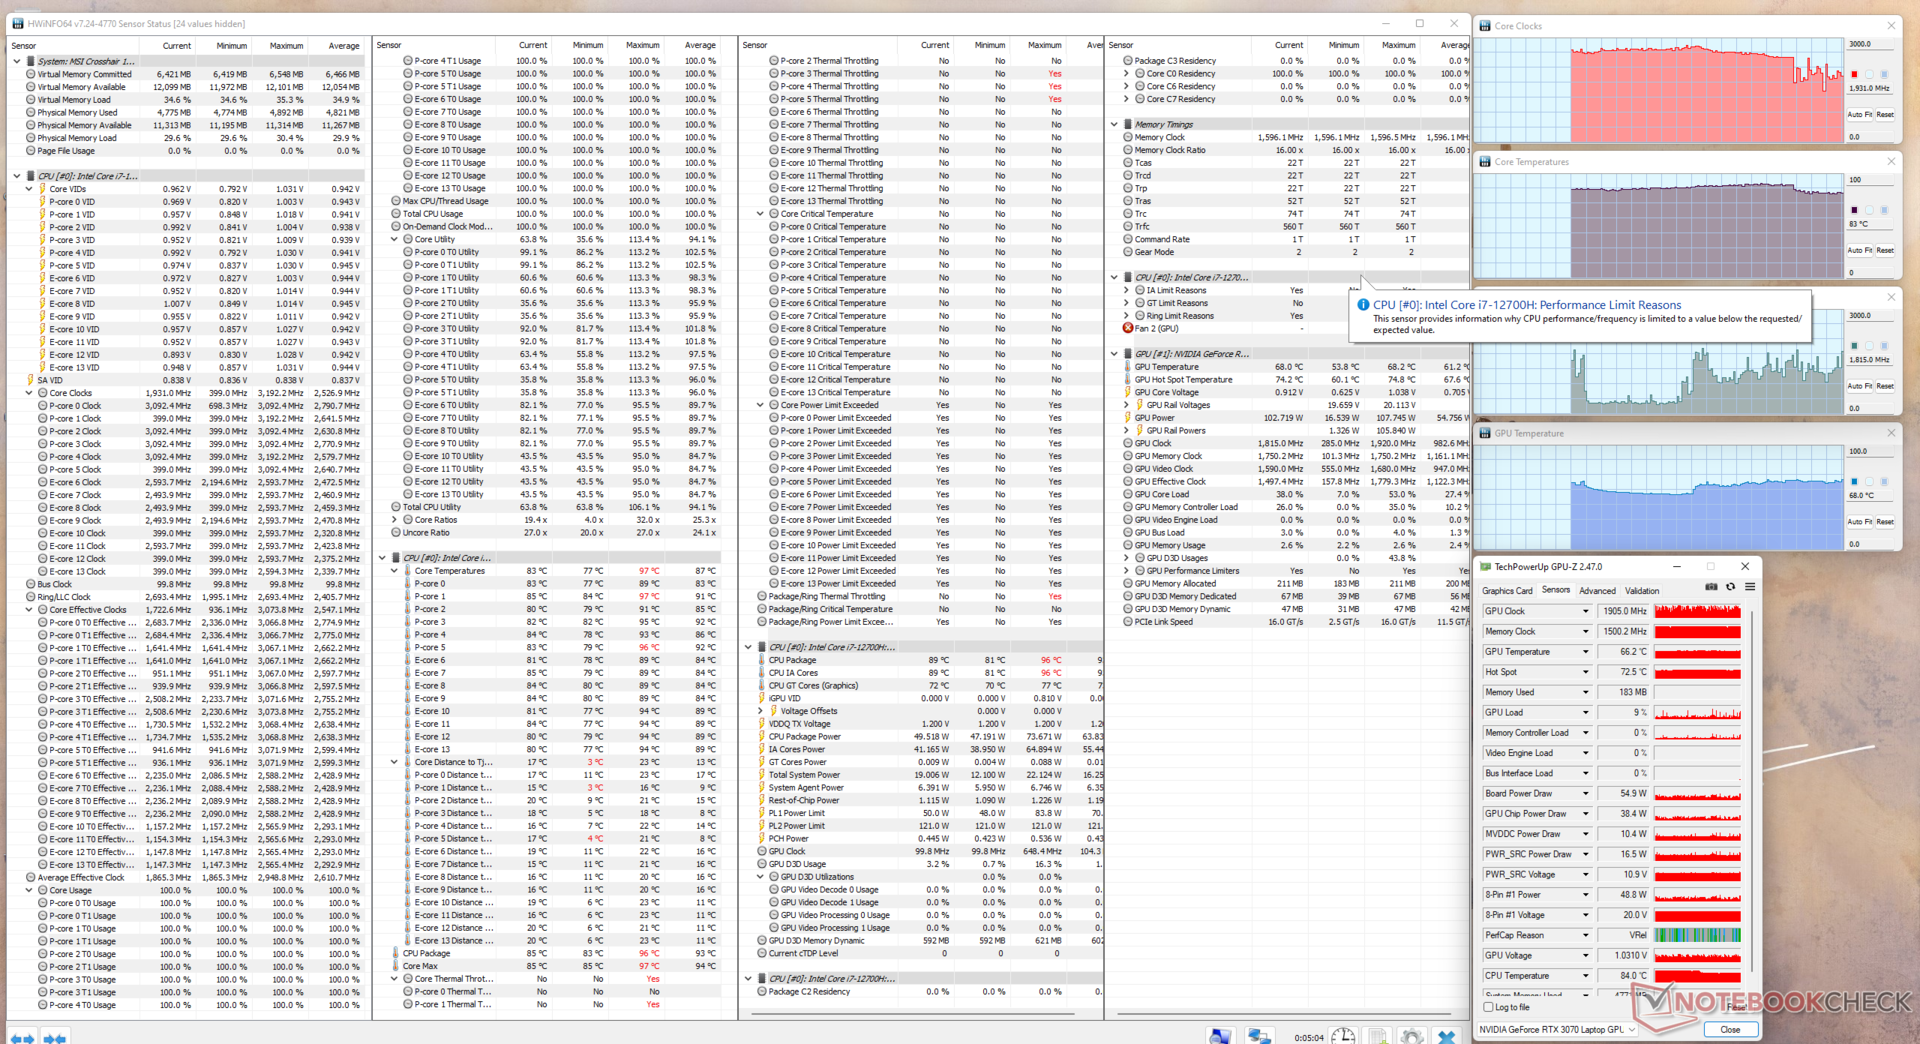
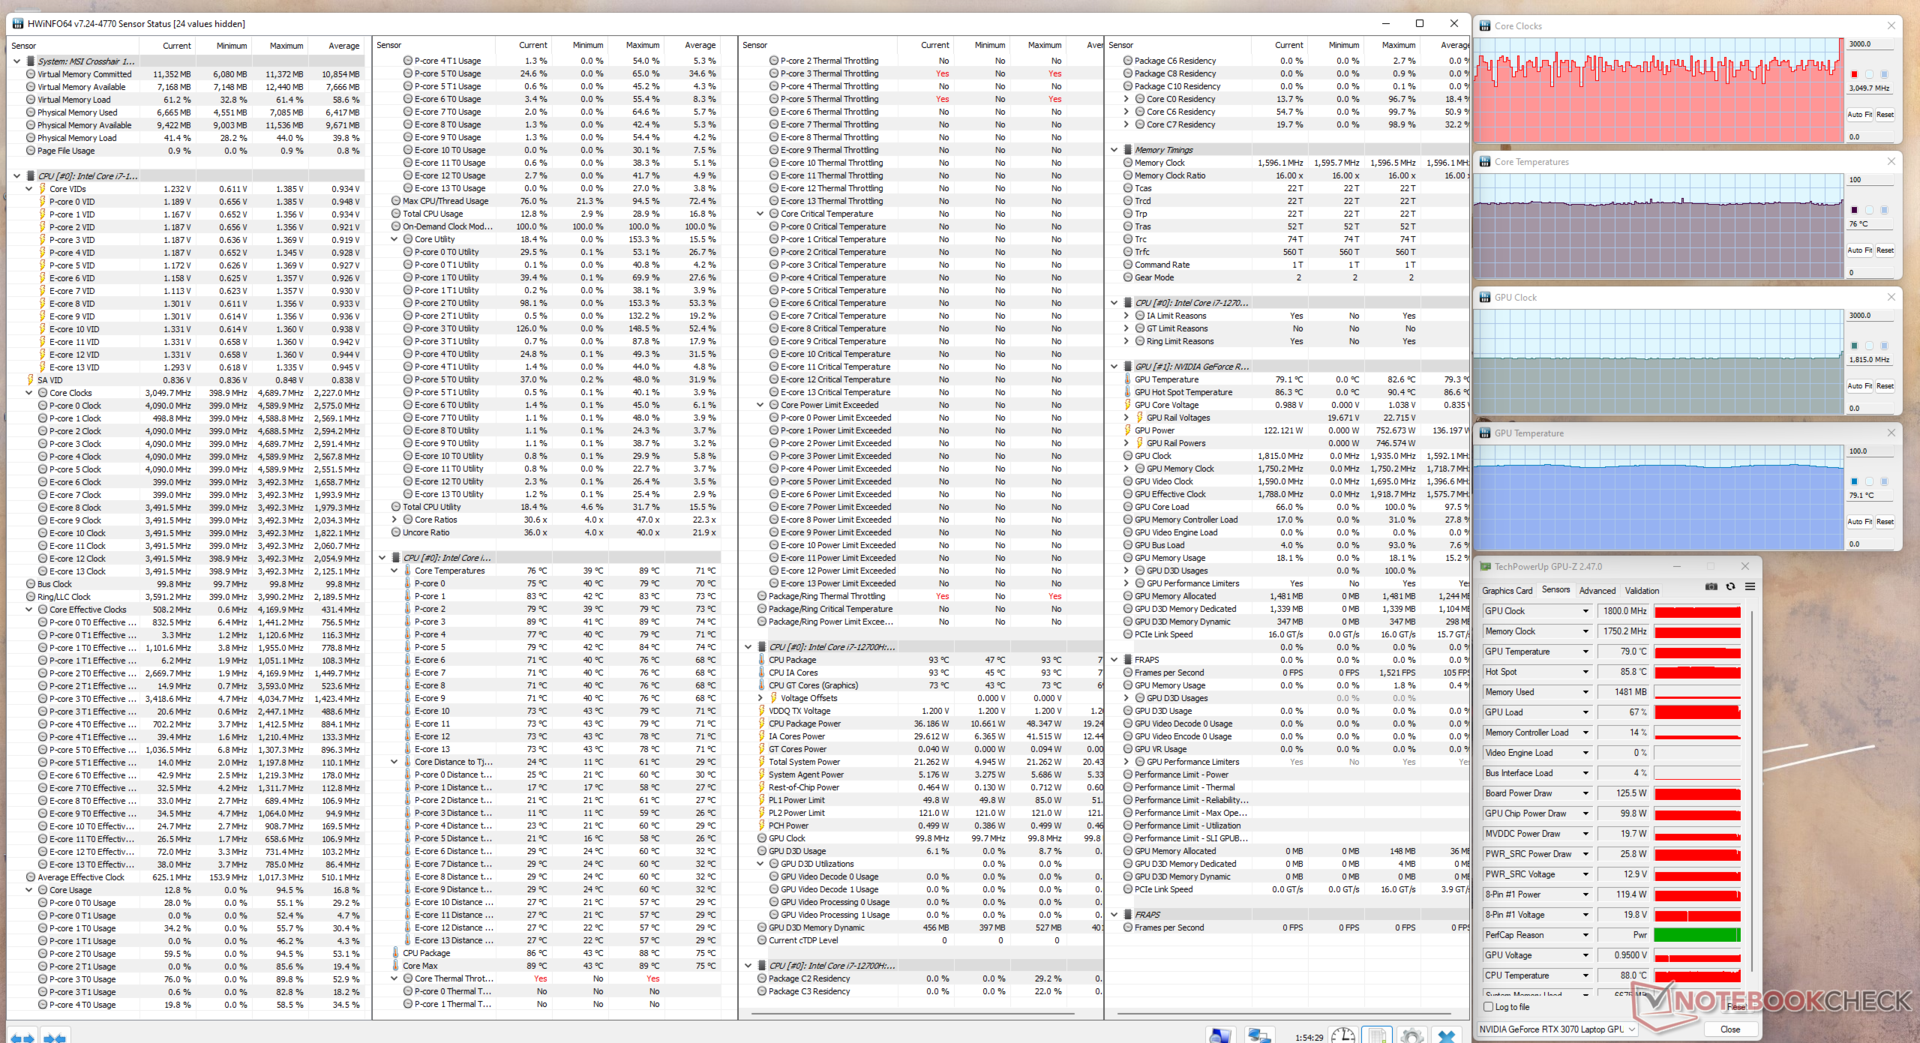
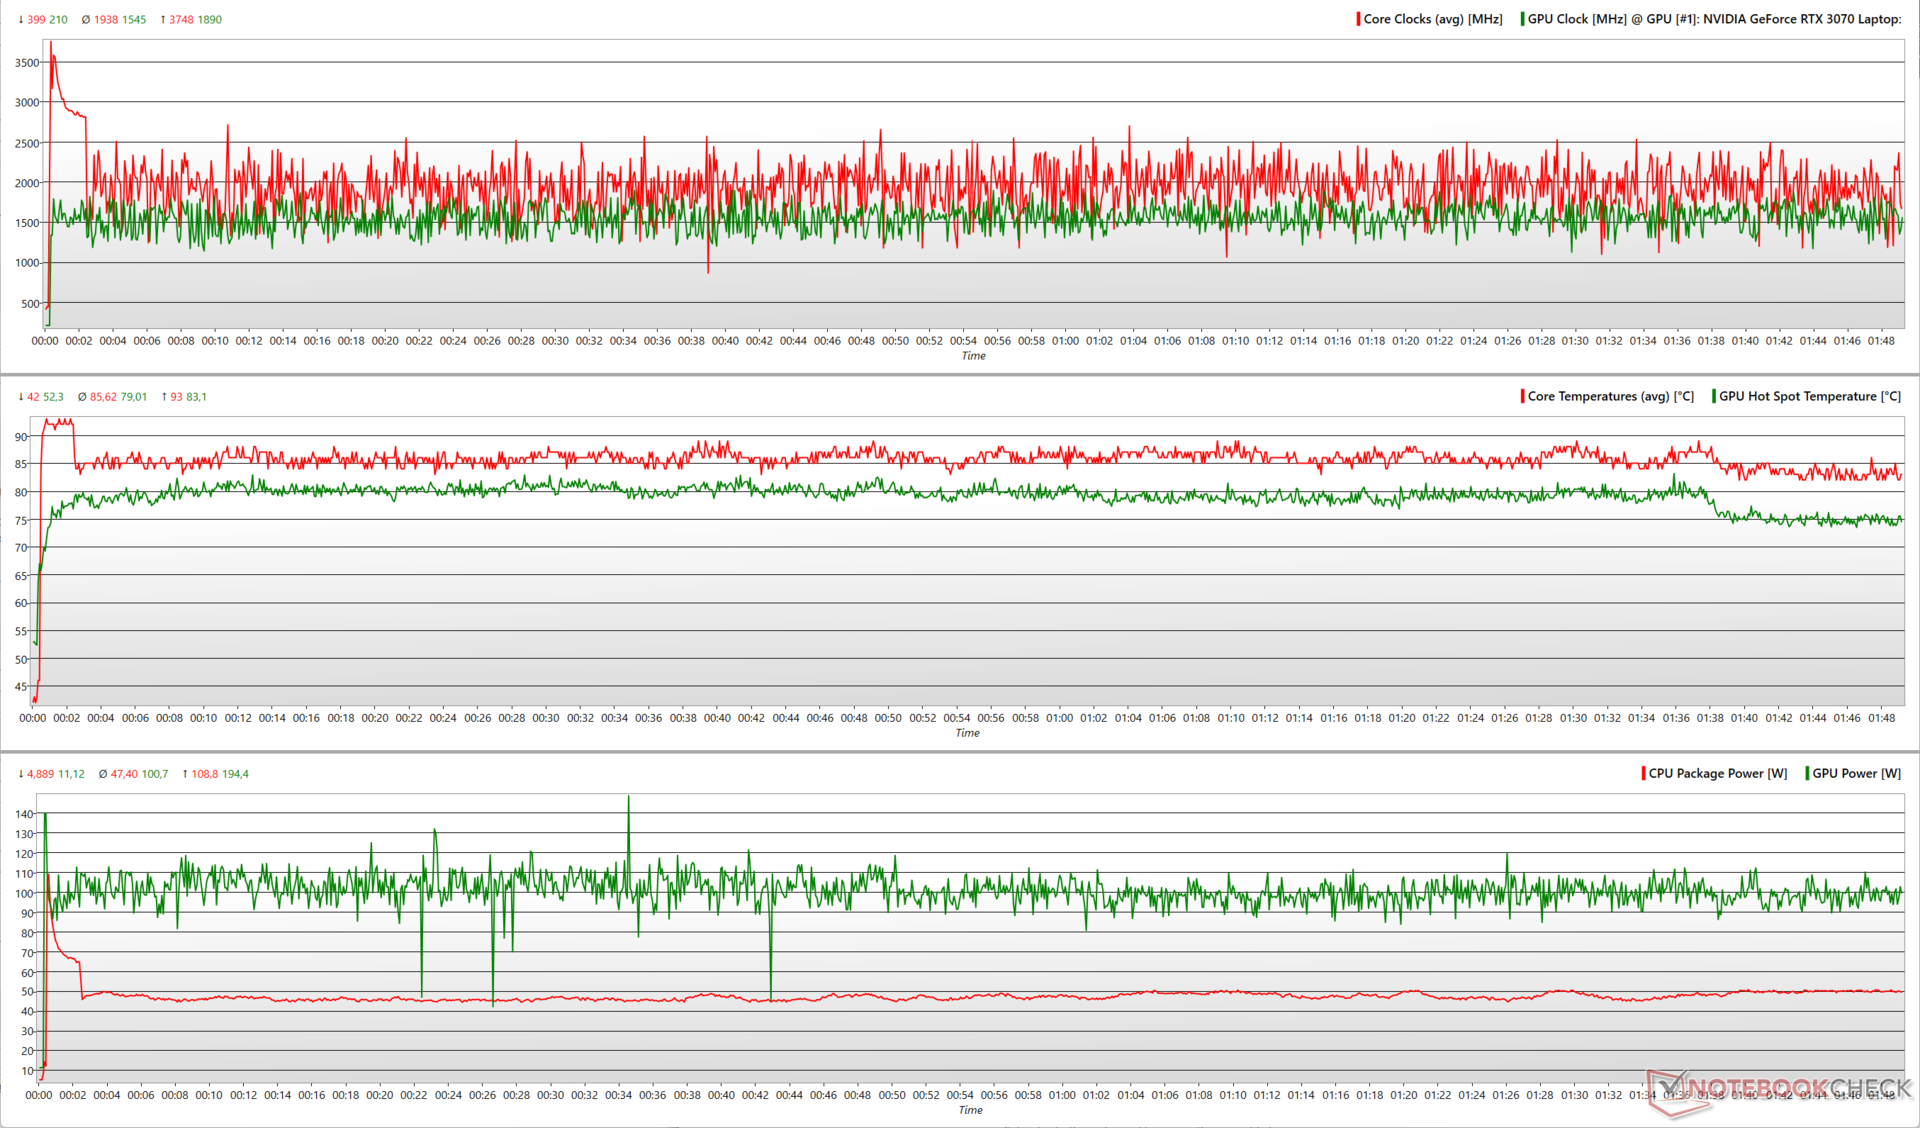
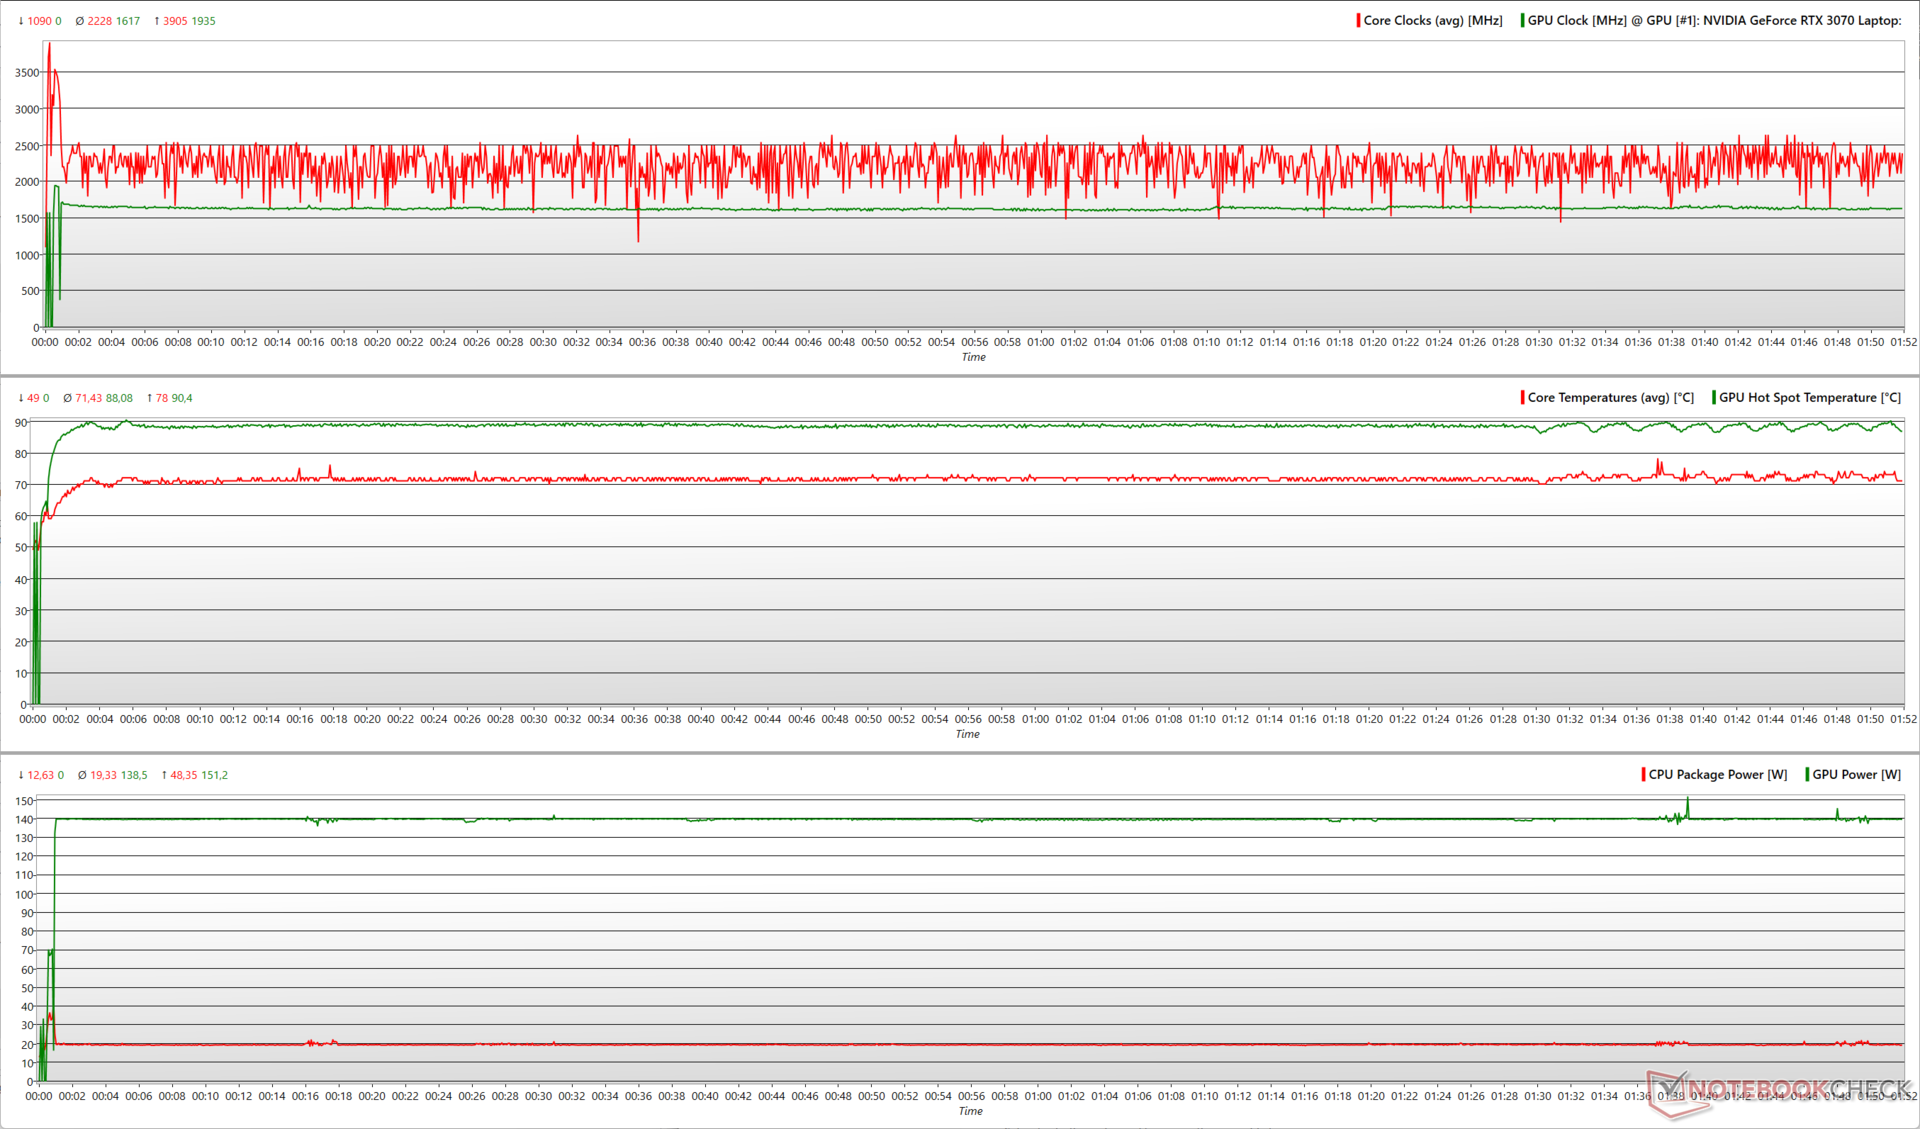
| Test de stress | Fréquence du CPU (GHz) | Fréquence du GPU (MHz) | Température moyenne du CPU (°C) | Température moyenne du GPU (°C) |
| Système en veille | 0,4 | 210 | 36 | 40,1 |
| Prime95 | 2,53 | 210 | 51 | 41,3 |
| Prime95 + FurMark | 1.93 | 1.81 | 87 | 61.2 |
| The Witcher 3 | 3,04 | 1,81 | 71 | 79,3 |
Haut-parleurs
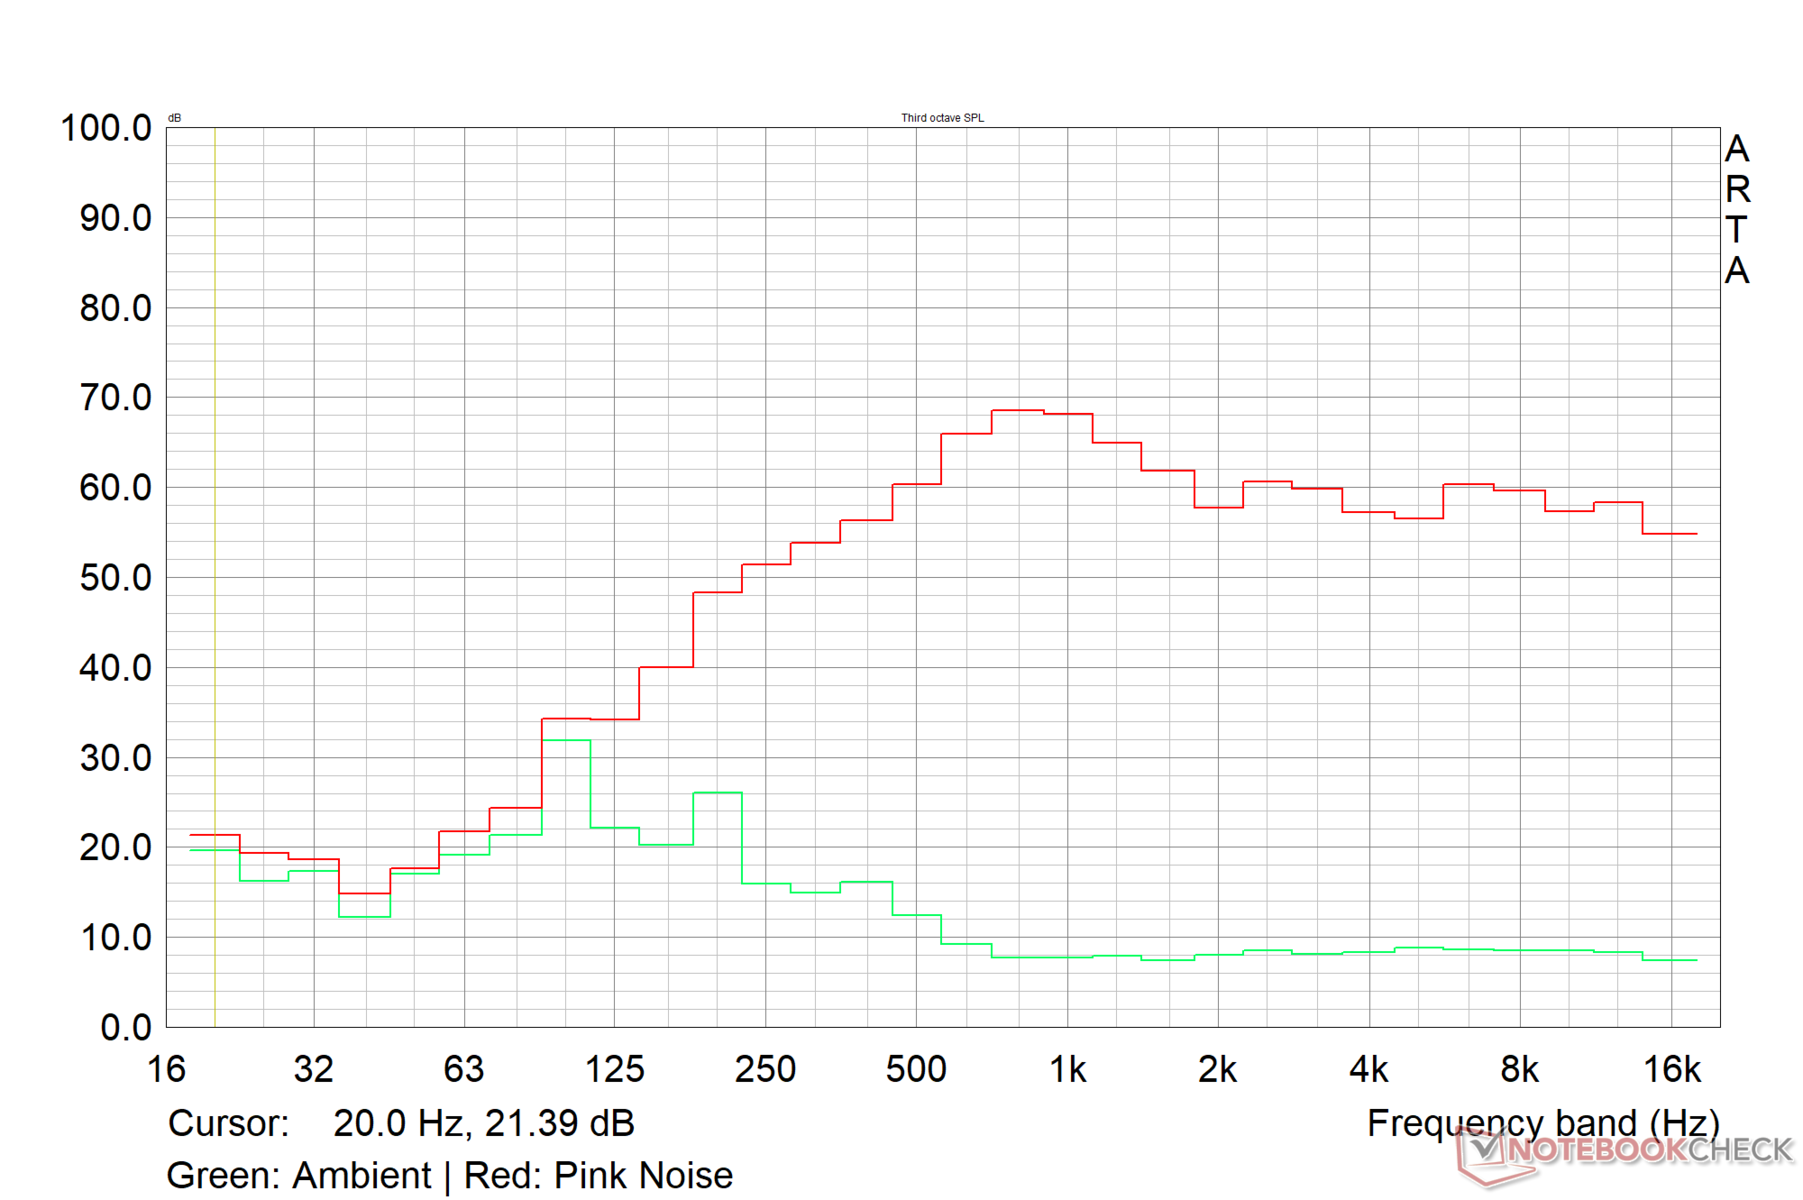
Le Crosshair 15 R6E est équipé de haut-parleurs 2x 2W qui produisent une intensité sonore de 74,6 dB(A). La réponse des basses est passable, mais les médiums et les aigus sont clairement discernables sans distorsion. La qualité sonore est tout à fait acceptable pour une consommation multimédia de base dans une pièce de taille moyenne.
Il est possible de connecter un système audio externe via Bluetooth 5.2 ou la prise audio combo de 3,5 mm.
MSI Crosshair 15 R6E B12UGZ-050 analyse audio
(±) | le niveau sonore du haut-parleur est moyen mais bon (74.6# dB)
Basses 100 - 315 Hz
(±) | basse réduite - en moyenne 14.1% inférieure à la médiane
(±) | la linéarité des basses est moyenne (10% delta à la fréquence précédente)
Médiums 400 - 2000 Hz
(±) | médiane supérieure - en moyenne 5.6% supérieure à la médiane
(+) | les médiums sont linéaires (6.5% delta à la fréquence précédente)
Aiguës 2 - 16 kHz
(+) | des sommets équilibrés - à seulement 1.7% de la médiane
(+) | les aigus sont linéaires (4% delta à la fréquence précédente)
Globalement 100 - 16 000 Hz
(±) | la linéarité du son global est moyenne (15.1% de différence avec la médiane)
Par rapport à la même classe
» 32% de tous les appareils testés de cette catégorie étaient meilleurs, 6% similaires, 62% pires
» Le meilleur avait un delta de 6%, la moyenne était de 18%, le pire était de 132%.
Par rapport à tous les appareils testés
» 21% de tous les appareils testés étaient meilleurs, 4% similaires, 75% pires
» Le meilleur avait un delta de 4%, la moyenne était de 23%, le pire était de 134%.
Apple MacBook Pro 16 2021 M1 Pro analyse audio
(+) | les haut-parleurs peuvent jouer relativement fort (84.7# dB)
Basses 100 - 315 Hz
(+) | bonne basse - seulement 3.8% loin de la médiane
(+) | les basses sont linéaires (5.2% delta à la fréquence précédente)
Médiums 400 - 2000 Hz
(+) | médiane équilibrée - seulement 1.3% de la médiane
(+) | les médiums sont linéaires (2.1% delta à la fréquence précédente)
Aiguës 2 - 16 kHz
(+) | des sommets équilibrés - à seulement 1.9% de la médiane
(+) | les aigus sont linéaires (2.7% delta à la fréquence précédente)
Globalement 100 - 16 000 Hz
(+) | le son global est linéaire (4.6% différence à la médiane)
Par rapport à la même classe
» 0% de tous les appareils testés de cette catégorie étaient meilleurs, 0% similaires, 100% pires
» Le meilleur avait un delta de 5%, la moyenne était de 17%, le pire était de 45%.
Par rapport à tous les appareils testés
» 0% de tous les appareils testés étaient meilleurs, 0% similaires, 100% pires
» Le meilleur avait un delta de 4%, la moyenne était de 23%, le pire était de 134%.
Gestion de l'énergie : Consommation d'énergie élevée à charge maximale
Consommation d'énergie
Même dans le profil Performance Extrême, la consommation d'énergie semble relativement économique pour le matériel proposé. L'Asus TUF Dash F15 est 30% plus économique que le Crosshair 15 R6E dans les tests de charge max. et The Witcher 3 grâce à son CPU et GPU de plus faible puissance
L'alimentation est évaluée à 240 W, mais nous avons observé des consommations allant jusqu'à 290 W lors d'une charge combinée Prime95 et FurMark. La fluctuation de la consommation d'énergie pendant ce test correspond à la fluctuation des horloges du CPU et du GPU que nous avions observée pendant le test de stress ci-dessus.
| Éteint/en veille | |
| Au repos | |
| Fortement sollicité |
|
Légende:
min: | |
| MSI Crosshair 15 R6E B12UGZ-050 i7-12700H, GeForce RTX 3070 Laptop GPU, IPS-Level, 2560x1440, 15.6" | MSI Stealth GS66 12UGS i7-12700H, GeForce RTX 3070 Ti Laptop GPU, IPS-Level, 2560x1440, 15.6" | Lenovo Legion 5 Pro 16 G7 i7 RTX 3070Ti i7-12700H, GeForce RTX 3070 Ti Laptop GPU, IPS, 2560x1600, 16" | Asus TUF Dash F15 FX517ZR i7-12650H, GeForce RTX 3070 Laptop GPU, IPS, 2560x1440, 15.6" | Schenker XMG Neo 15 (Ryzen 9 6900HX, RTX 3070 Ti) R9 6900HX, GeForce RTX 3070 Ti Laptop GPU, IPS, 2560x1440, 15.6" | Moyenne NVIDIA GeForce RTX 3070 Laptop GPU | Moyenne de la classe Gaming | |
|---|---|---|---|---|---|---|---|
| Power Consumption | -7% | -10% | 2% | -11% | -36% | -25% | |
| Idle Minimum * (Watt) | 9.6 | 11 -15% | 8.6 10% | 10 -4% | 13 -35% | 15.6 ? -63% | 13 ? -35% |
| Idle Average * (Watt) | 14.1 | 16 -13% | 17.6 -25% | 14 1% | 17 -21% | 20.1 ? -43% | 19 ? -35% |
| Idle Maximum * (Watt) | 14.96 | 23 -54% | 18.5 -24% | 20 -34% | 20 -34% | 29.4 ? -97% | 24.6 ? -64% |
| Load Average * (Watt) | 107.3 | 110 -3% | 110 -3% | 122 -14% | 89 17% | 110.8 ? -3% | 110.7 ? -3% |
| Witcher 3 ultra * (Watt) | 197 | 151 23% | 227 -15% | 138.6 30% | 200 -2% | ||
| Load Maximum * (Watt) | 289.93 | 230 21% | 294.6 -2% | 189 35% | 260 10% | 214 ? 26% | 259 ? 11% |
* ... Moindre est la valeur, meilleures sont les performances
Power Consumption - The Witcher 3 / Stress test
Power Consumption - External monitor
Autonomie de la batterie
Les tests de batterie ont été effectués dans le profil équilibré avec le taux de rafraîchissement de l'écran réglé sur 60 Hz. Notre Crosshair 15 R6E B12UGZ était équipé d'une batterie 4 cellules de 90 WHr qui offre une autonomie décente dans notre test de navigation Wi-Fi standardisé à 150 nits. La sauvegarde de la lecture vidéo est juste en dessous de la marque de 9 heures à 150 nits avec toutes les radios désactivées.
MSI propose également la variante Crosshair R6E B12UEZ, équipée d'une batterie 3 cellules de 56,5 WHr.
| MSI Crosshair 15 R6E B12UGZ-050 i7-12700H, GeForce RTX 3070 Laptop GPU, 90 Wh | MSI Stealth GS66 12UGS i7-12700H, GeForce RTX 3070 Ti Laptop GPU, 99.9 Wh | Lenovo Legion 5 Pro 16 G7 i7 RTX 3070Ti i7-12700H, GeForce RTX 3070 Ti Laptop GPU, 80 Wh | Asus TUF Dash F15 FX517ZR i7-12650H, GeForce RTX 3070 Laptop GPU, 76 Wh | Schenker XMG Neo 15 (Ryzen 9 6900HX, RTX 3070 Ti) R9 6900HX, GeForce RTX 3070 Ti Laptop GPU, 93 Wh | Moyenne de la classe Gaming | |
|---|---|---|---|---|---|---|
| Autonomie de la batterie | 4% | -35% | 18% | 34% | 5% | |
| H.264 (h) | 8.9 | 6.3 -29% | 5.8 -35% | 10.7 20% | 8.32 ? -7% | |
| WiFi v1.3 (h) | 7.3 | 5.4 -26% | 5.4 -26% | 7 -4% | 10.9 49% | 7.11 ? -3% |
| Witcher 3 ultra (h) | 1.6 | |||||
| Load (h) | 1.2 | 1.6 33% | 0.6 -50% | 2.3 92% | 1.6 33% | 1.502 ? 25% |
| Reader / Idle (h) | 7.8 | 10.8 | 8.27 ? |
Points positifs
Points négatifs
Verdict : Un reskin de Pulse GL66 qui réussit beaucoup de choses
Les ordinateurs portables ayant pour thème des jeux spécifiques ont généralement un attrait limité au-delà des fans dudit jeu. Le MSI Crosshair 15 Rainbow Six : Extraction Edition, qui porte le nom éponyme de la célèbre franchise de FPS en coopération d'Ubisoft, est le seul Crosshair 15 proposé cette année
Le châssis est essentiellement une reprise du Pulse GL66 avec des éléments de conception fortement empruntés au jeu. MSI est même allé jusqu'à remplacer son propre logo sur le couvercle de l'écran par celui de Rainbow Six : Extraction. La boîte contient également quelques cadeaux, dont une souris, un tapis de souris et une copie Deluxe du jeu lui-même
En tant que tel, le Crosshair 15 R6E hérite de certains défauts de conception du Pulse GL66, comme la flexion du clavier et une distribution non idéale des ports. Cependant, l'ordinateur portable est équipé d'un écran QHD 165 Hz très fonctionnel qui devrait être de bon augure pour les jeux et la création de contenu.
Le design du MSI Crosshair 15 Rainbow Six : Extraction de MSI peut avoir un attrait limité, mais sous la peau, vous obtenez un milieu de gamme très performant avec de bonnes caractéristiques d'affichage et des émissions tolérables."
La mise en œuvre du Core i7-12700H du Crosshair 15 R6E n'est pas la plus rapide que nous ayons vue. Le site MSI Stealth GS66 et le Lenovo Legion 5i Pro 16 G7 équipés du même processeur obtiennent de meilleurs résultats dans les tests multi-cœurs. Les performances globales de la Crosshair 15 R6E en matière de jeu peuvent être supérieures ou égales à celles de certains ordinateurs portables équipés de la RTX 3070 Ti, comme le Schenker XMG Neo 15, Acer Nitro 5et le MSI Katana GF66
Les émissions thermiques et sonores sont largement tolérables tant que vous êtes en accord avec le profil de performance équilibré. Cependant, la consommation d'énergie est un peu plus élevée, surtout en cas de charge maximale et de jeu
Même si vous n'êtes pas un fan du jeu, le MSI Crosshair 15 Rainbow Six : Extraction Edition de MSI mérite d'être pris en considération, compte tenu des performances offertes et de son prix par rapport à la concurrence.
Prix et disponibilité
Le MSI Crosshair 15 Rainbow Six : Extraction Edition est disponible sur Amazon US au prix de 2 149 USD. En Inde, l'ordinateur portable se vend aux alentours de ₹1,90,990 mais est actuellement en rupture de stock sur Amazon India et Flipkart.
MSI Crosshair 15 R6E B12UGZ-050
- 12/19/2022 v7 (old)
Vaidyanathan Subramaniam
Price comparison

