Test du Schenker XMG Neo 15 : Ryzen 6000 avec ports de refroidissement liquide
Le Neo 15 à base d'Intel que nous avons examiné en juillet dernierétait un ordinateur portable inhabituel, doté d'une connexion pour le système de refroidissement OASIS en option (vendu séparément pour environ 199 euros, soit 198 dollars), que nous avons également testé au même moment.
XMG a maintenant lancé un nouveau modèle Neo 15 équipé du dernier processeur AMD Ryzen. Le passage à un processeur AMD a également entraîné d'autres changements dans la sélection des ports et autres.
Alors, quelles sont les performances du Neo basé sur AMD par rapport au modèle basé sur Intel ? Dans cet article, nous allons tester une variante équipée de la RTX 3070 Ti, légèrement plus abordable (qui coûte tout de même 2 850 euros, soit 2 826 dollars), et examiner ce que les changements matériels signifient pour les performances et les émissions de l'ordinateur portable.
En plus de comparer les Neo 15 basés sur AMD et Intel, nous allons opposer le modèle testé à d'autres ordinateurs portables de jeu avec une RTX 3070 Ti, comme le MSI Raider GE67, Asus ROG Strix Scar 15, Acer Nitro 5 et MSI Stealth GS66.
Comparaison avec les concurrents potentiels
Note | Date | Modèle | Poids | Épaisseur | Taille | Résolution | Prix |
|---|---|---|---|---|---|---|---|
| 88 % v7 (old) | 11/22 | Schenker XMG Neo 15 (Ryzen 9 6900HX, RTX 3070 Ti) R9 6900HX, GeForce RTX 3070 Ti Laptop GPU | 2.3 kg | 26.6 mm | 15.60" | 2560x1440 | |
| 88.4 % v7 (old) | 07/22 | Schenker XMG Neo 15 (i7-12700H, RTX 3080 Ti) i7-12700H, GeForce RTX 3080 Ti Laptop GPU | 2.3 kg | 26.6 mm | 15.60" | 2560x1440 | |
| 87.7 % v7 (old) | 07/22 | MSI GE67 HX 12UGS i7-12800HX, GeForce RTX 3070 Ti Laptop GPU | 2.5 kg | 23.4 mm | 15.60" | 1920x1080 | |
| 86.3 % v7 (old) | 06/22 | Asus ROG Strix Scar 15 G533ZW-LN106WS i9-12900H, GeForce RTX 3070 Ti Laptop GPU | 2.3 kg | 27.2 mm | 15.60" | 2560x1440 | |
| 84 % v7 (old) | 06/22 | Acer Nitro 5 AN515-58-72QR i7-12700H, GeForce RTX 3070 Ti Laptop GPU | 2.5 kg | 26.8 mm | 15.60" | 2560x1440 | |
| 84.5 % v7 (old) | 02/22 | MSI Stealth GS66 12UGS i7-12700H, GeForce RTX 3070 Ti Laptop GPU | 2.2 kg | 19.8 mm | 15.60" | 2560x1440 |
Étui - clavier robuste, bas de caisse (trop) souple
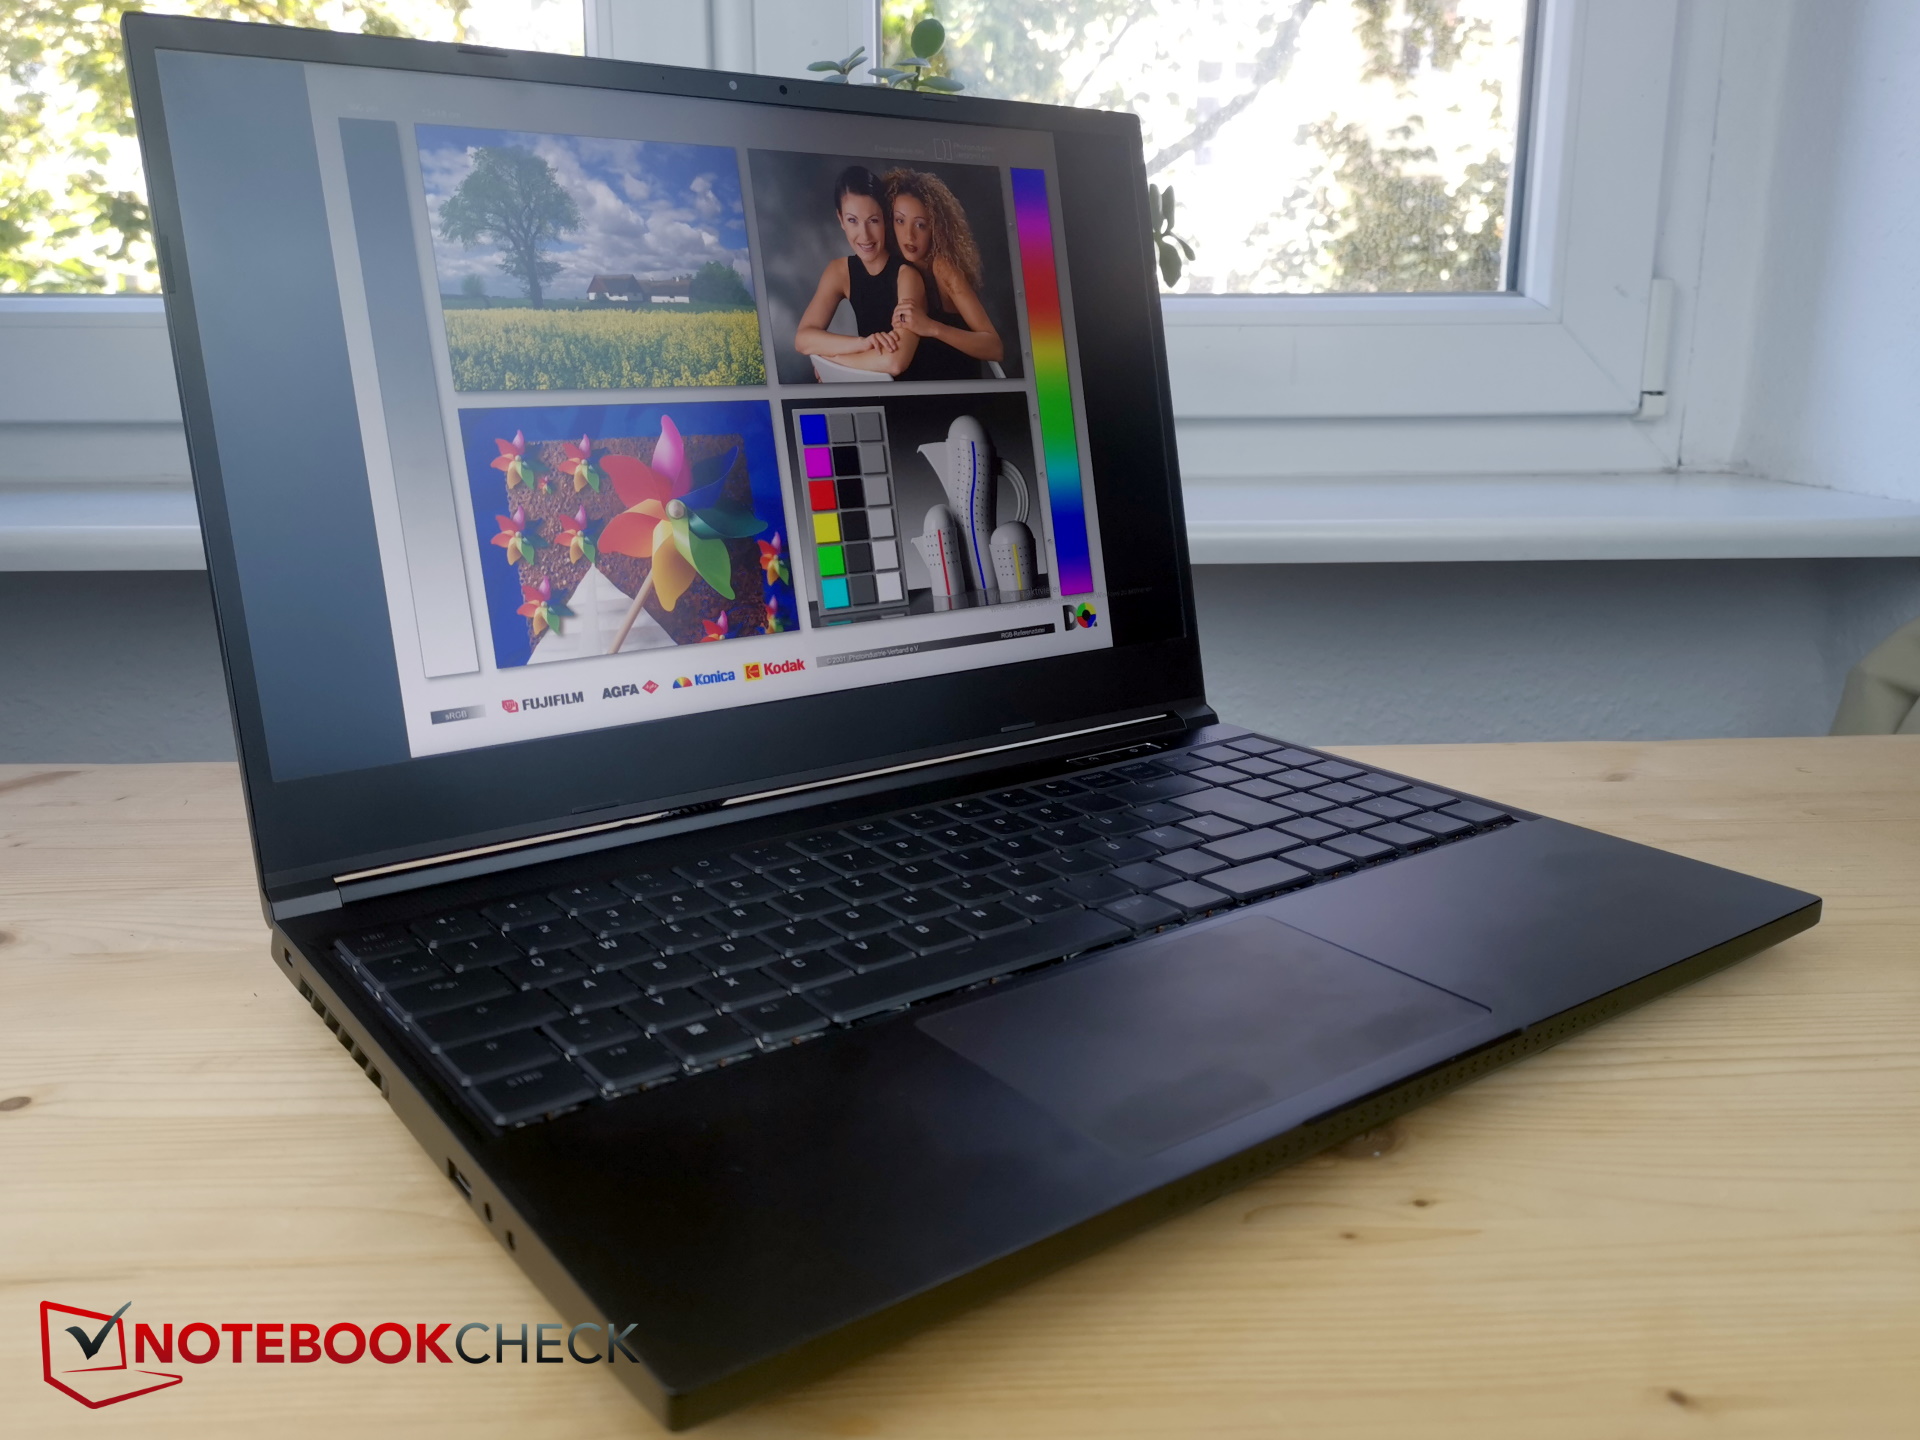
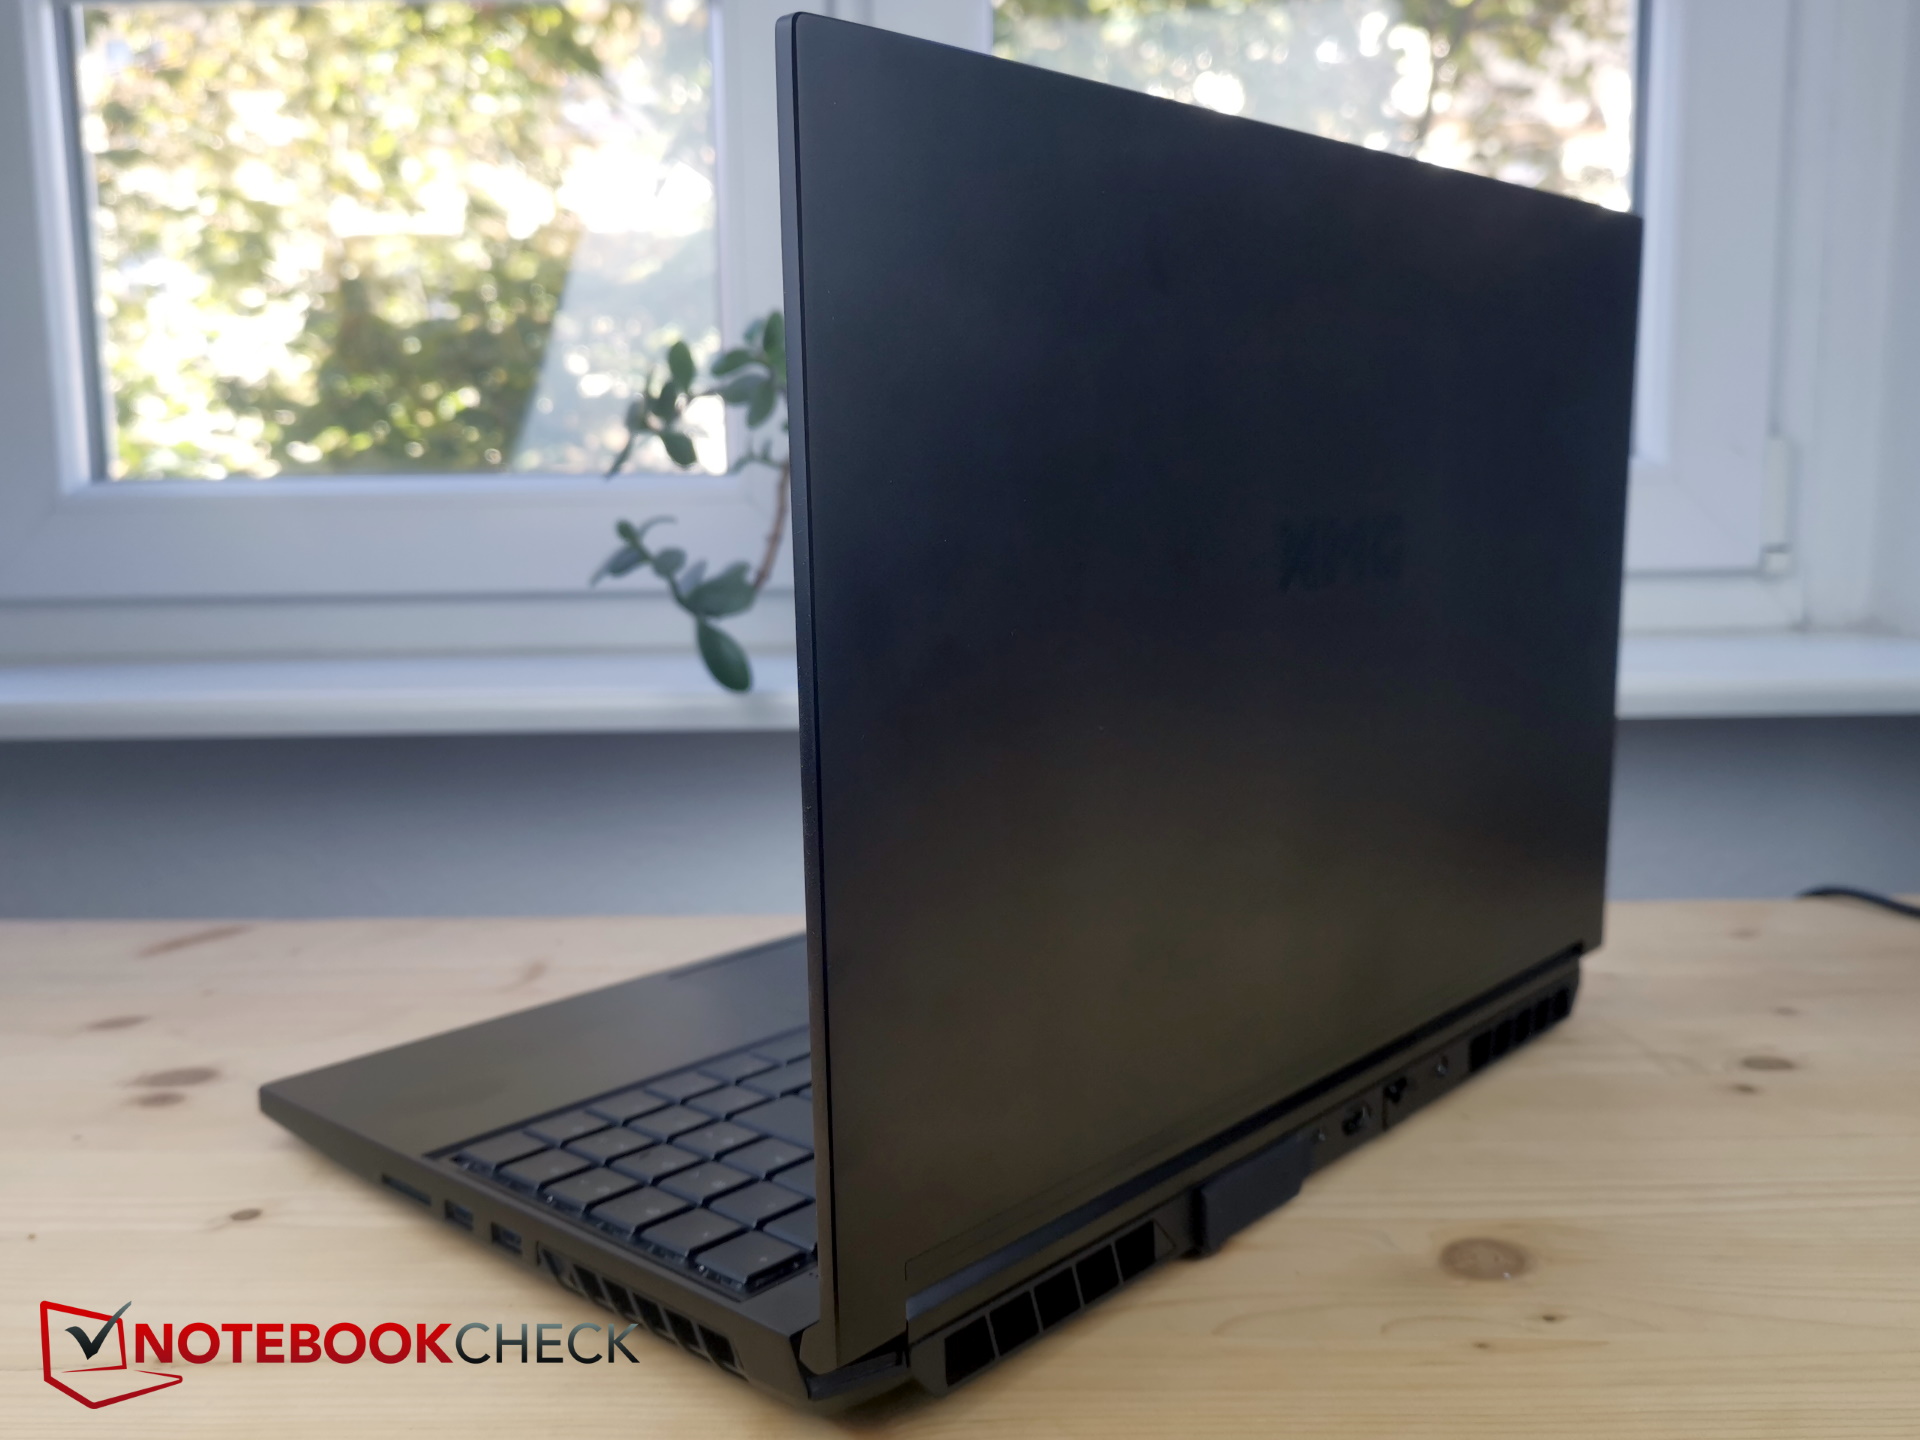
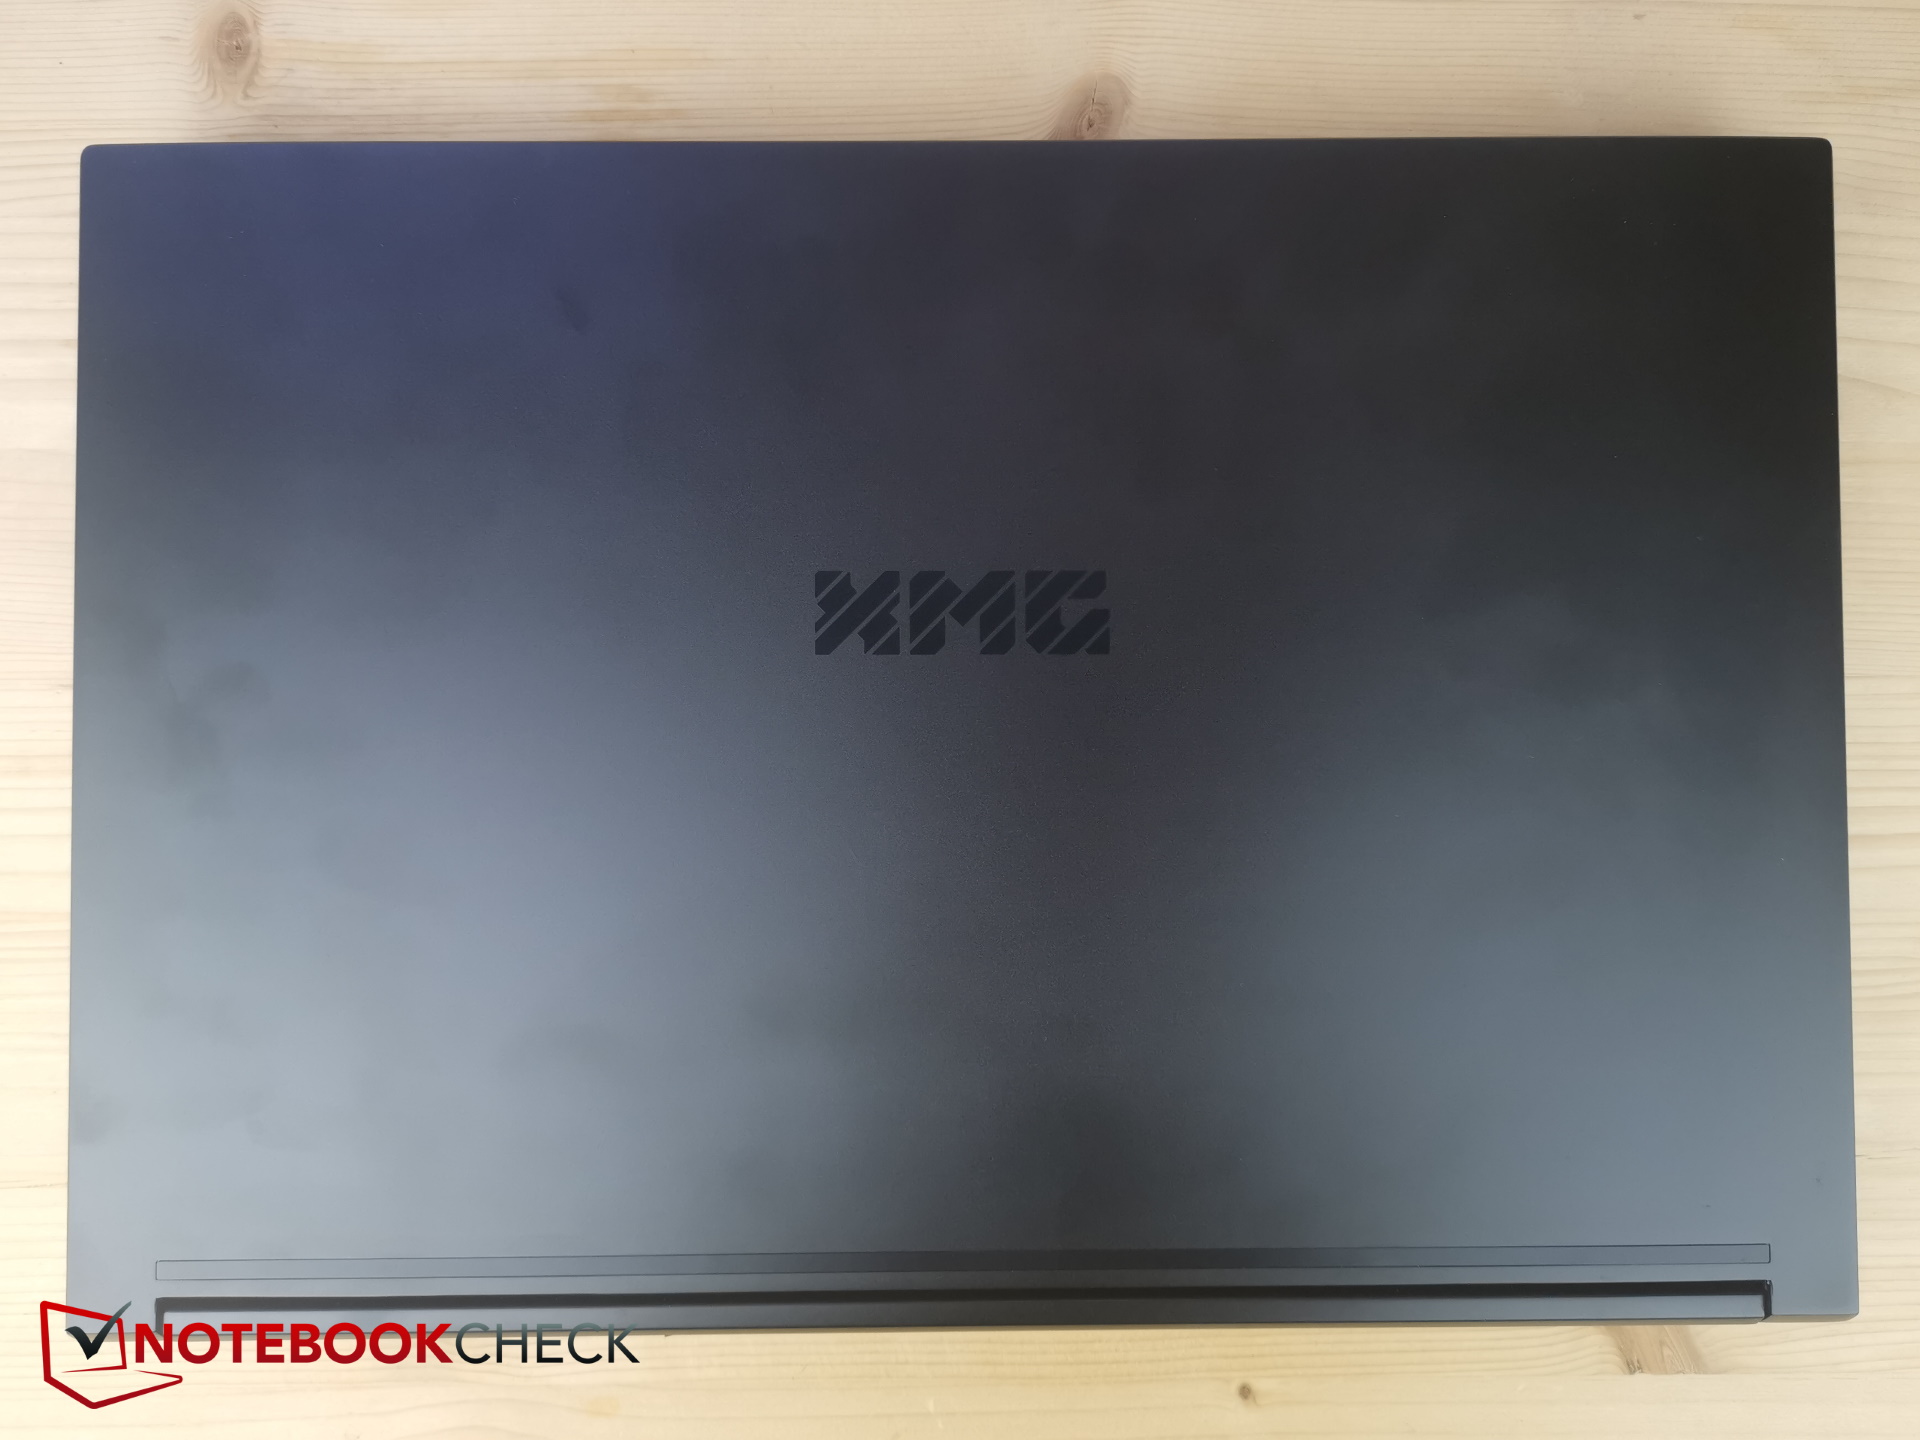
Pour un ordinateur portable de jeu, le Neo 15 n'a pas un design trop tape-à-l'œil. Pour l'essentiel, sa palette de couleurs va du gris foncé au noir. Le couvercle de l'écran et la section de base sont en métal, tandis que le fond et la lunette sont en plastique souple. Le logo XMG se trouve au centre du couvercle. La barre de LED en pointillé sur la face avant confère à l'appareil une certaine esthétique de jeu.
Grâce à l'utilisation du métal, le Neo 15 est très solide, notamment au niveau de la base. L'ordinateur portable ne présente pratiquement aucune flexion et n'émet aucun bruit de craquement lorsqu'on le tord ou le plie. Naturellement, le couvercle sera un peu moins rigide. Cela dit, l'écran peut supporter quelques torsions sans être affecté. Un inconvénient, cependant, est que les empreintes digitales peuvent s'accumuler sur la surface mate.
Malheureusement, le boîtier inférieur en plastique est si mou que cela peut arriver : si vous tenez l'appareil au "mauvais" endroit (c'est-à-dire la zone autour de la bouche d'aération en bas à droite) d'une seule main, cet endroit peut être poussé si loin qu'il touche les ventilateurs en rotation.
À part cela, le Neo 15 a une excellente finition, il est très compact et robuste, et il est équipé de charnières suffisamment fermes mais pas trop rigides.
Avec ses 26,6 mm d'épaisseur, le Neo n'essaie pas de rivaliser avec le très fin Razer Blade 15. Mais il semble légèrement plus fin qu'il ne l'est réellement grâce à son design compact. La plupart des concurrents ont à peu près la même épaisseur ; seul le MSI Stealth est considérablement plus fin.
La compacité de l'ordinateur portable se reflète également dans ses dimensions : aucun des autres ordinateurs portables n'est aussi peu encombrant que le Neo 15. En termes de poids, le Neo se situe carrément au milieu du groupe de comparaison. Seul le Stealth est environ 100 g plus léger, tandis que le Nitro et le MSI GE67 pèsent environ 200 g de plus.
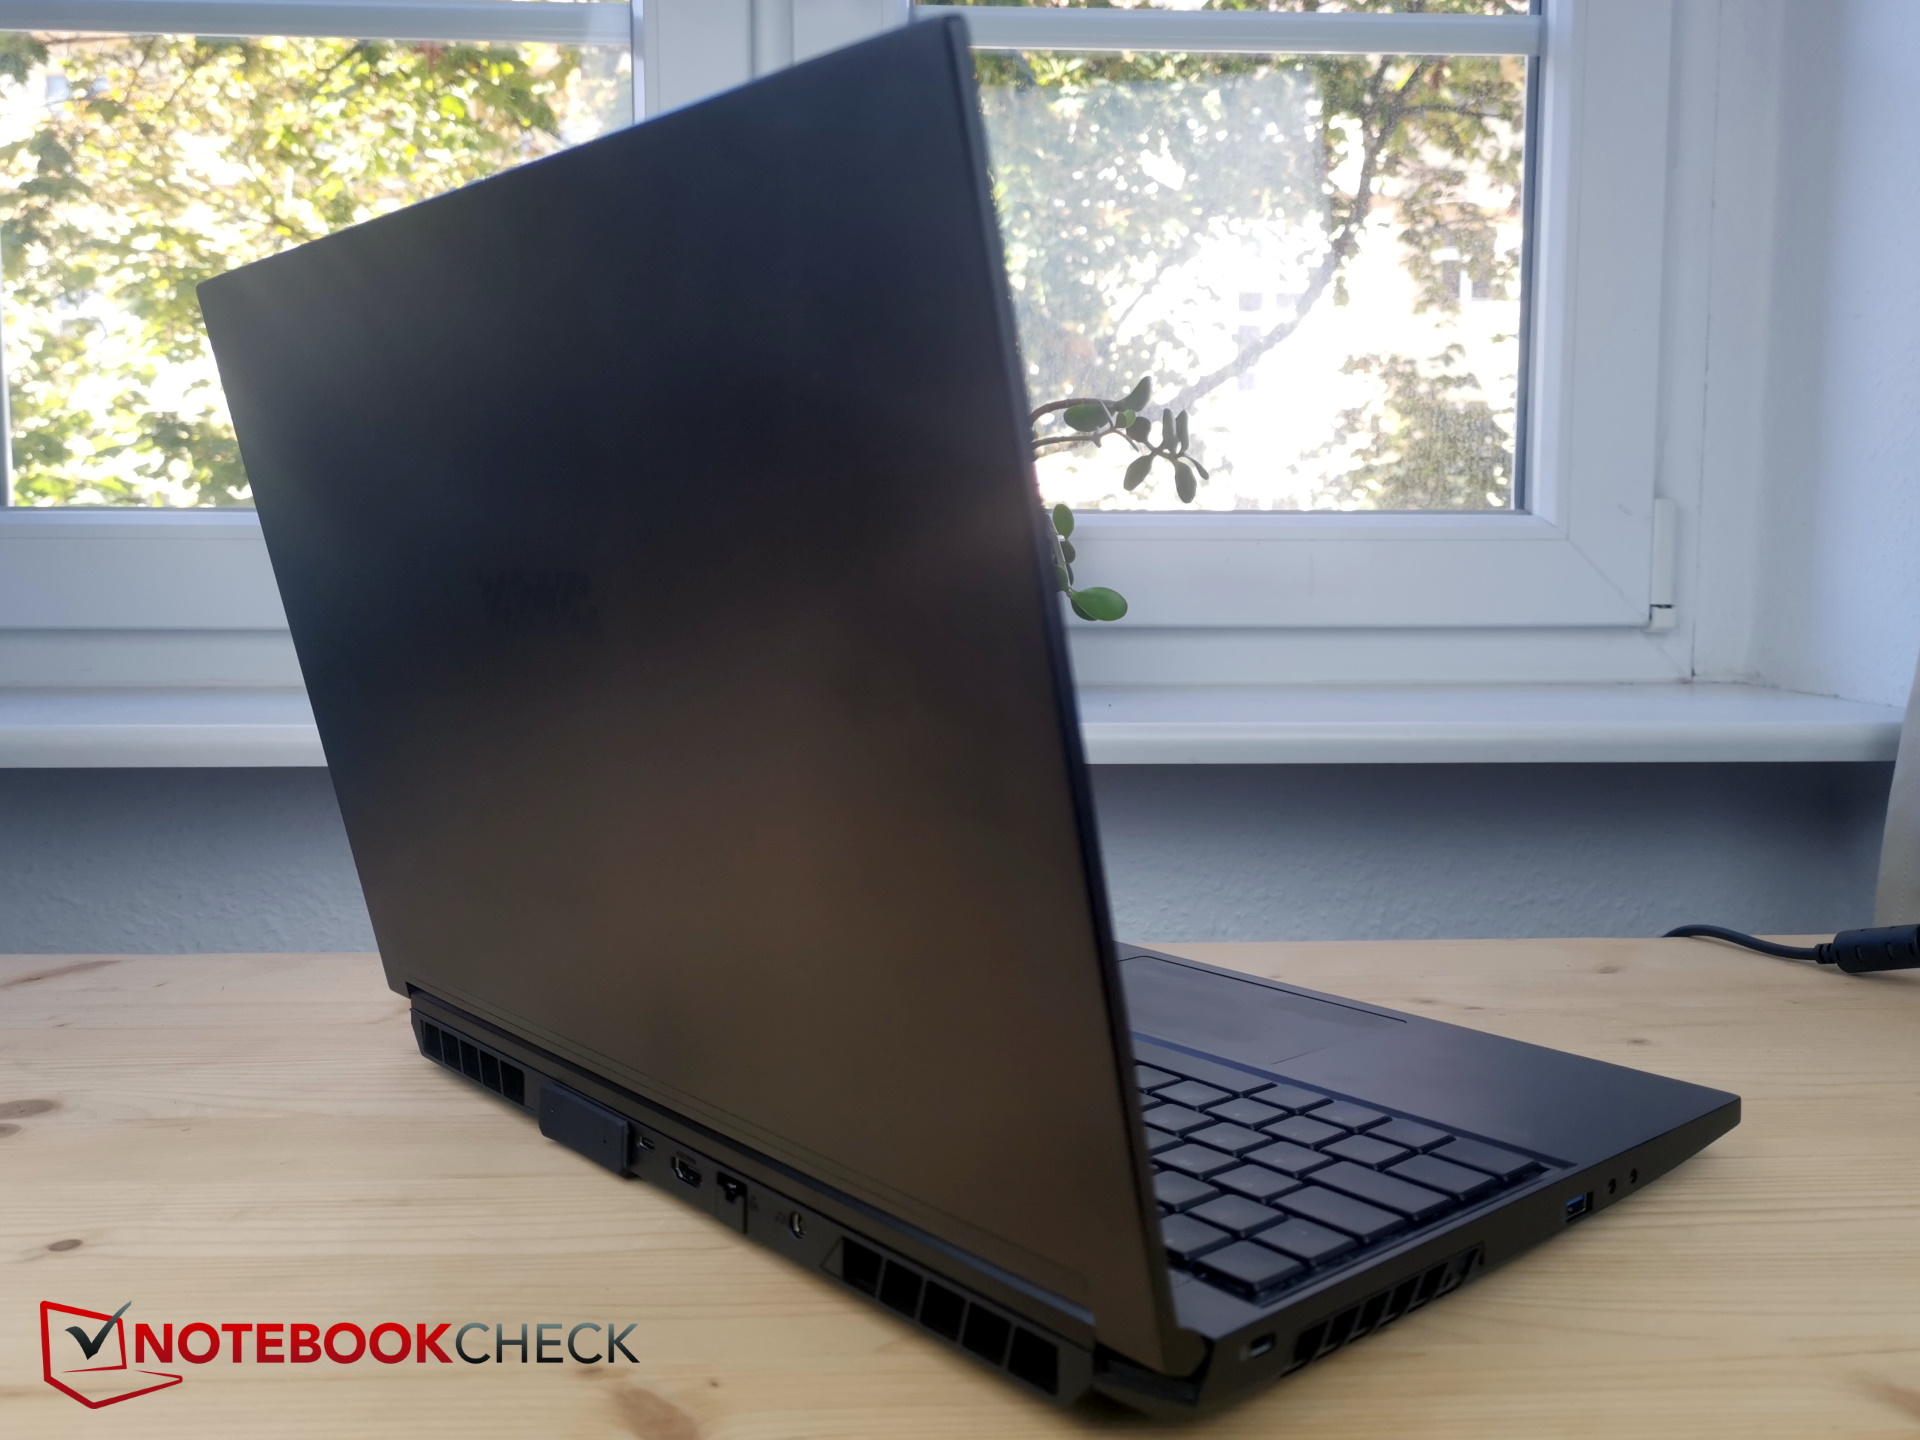
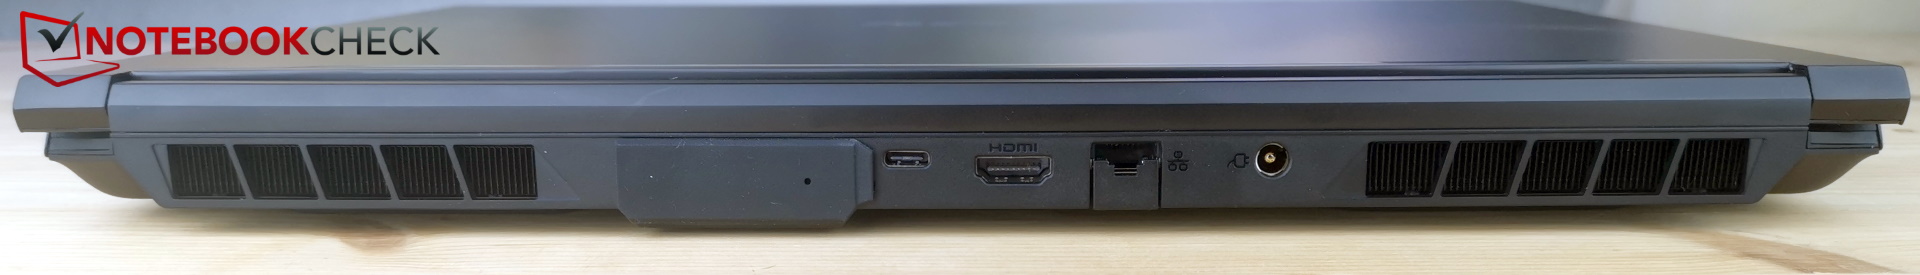
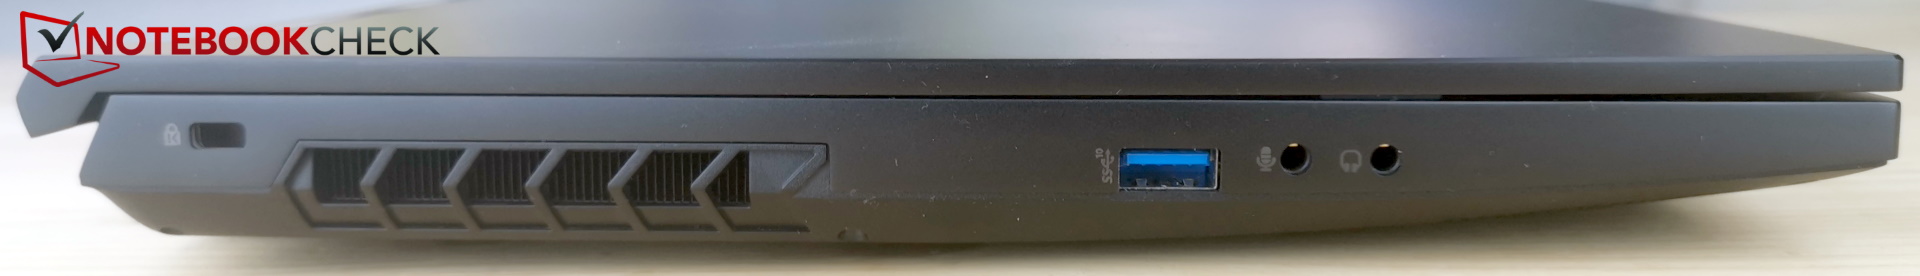
Spécifications - Pas de Thunderbolt, port USB-C lent
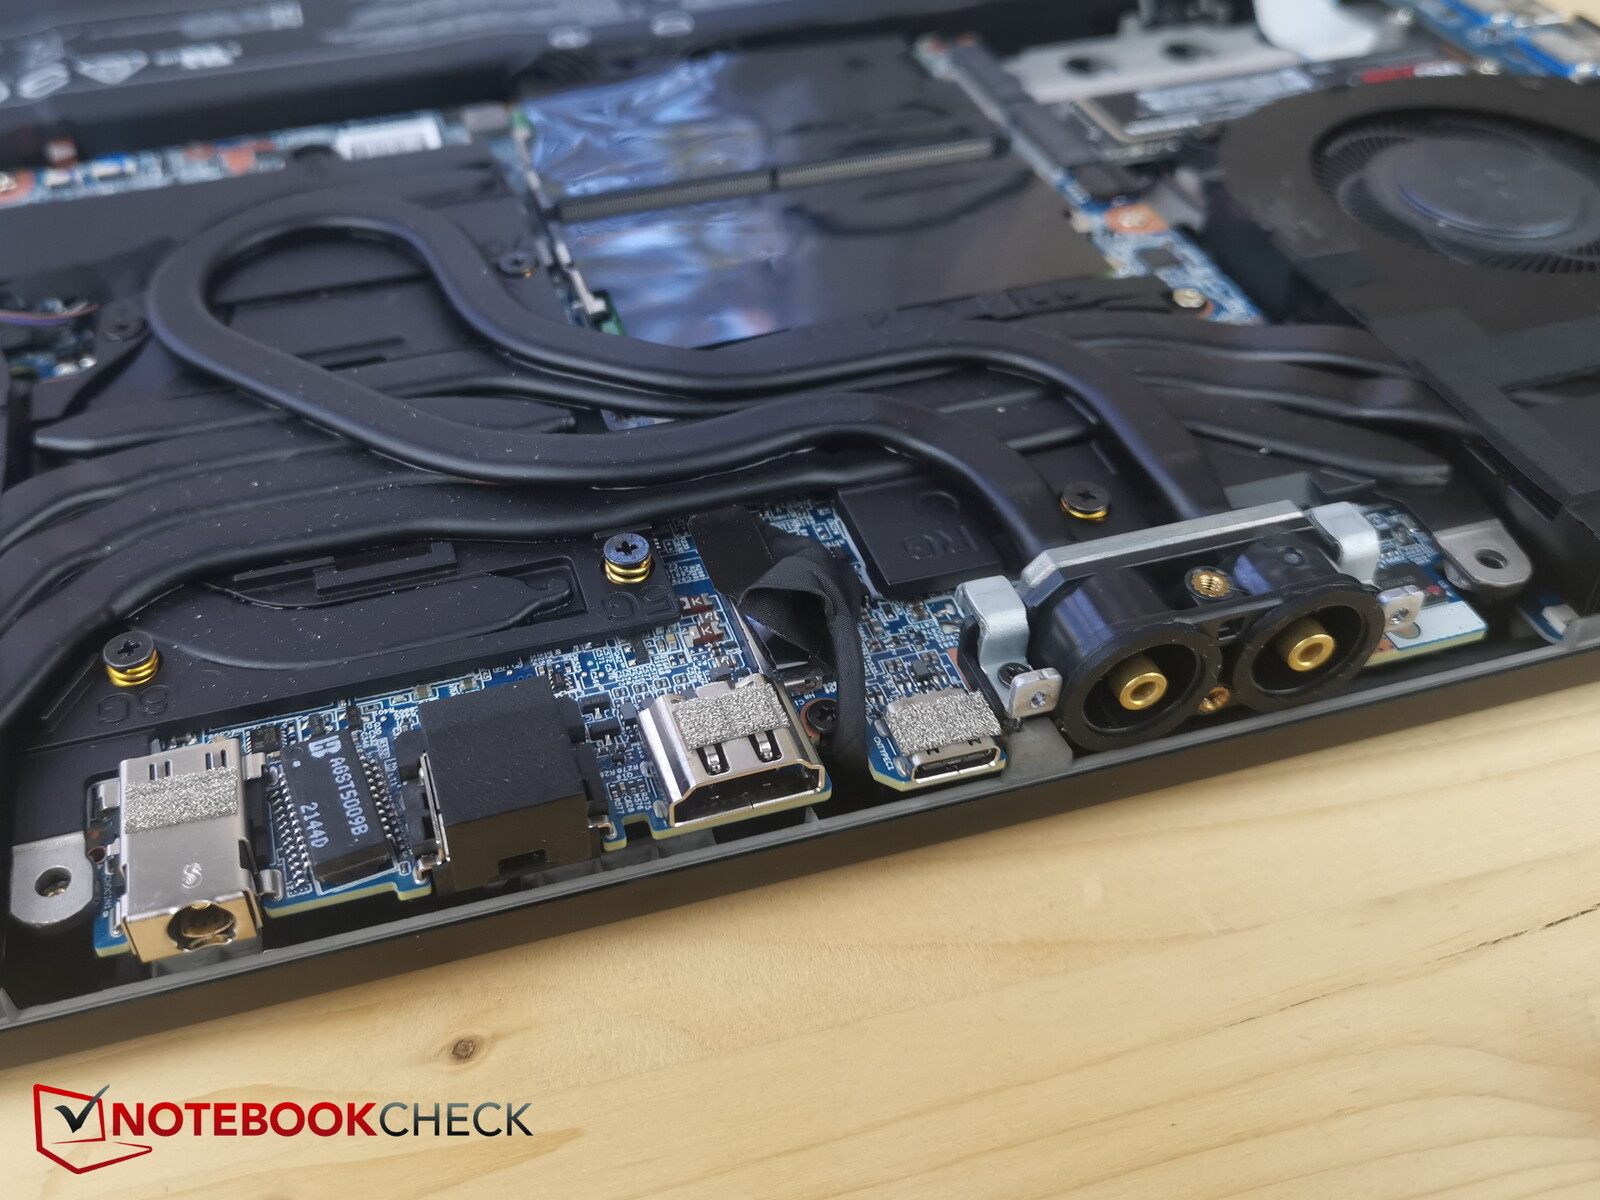
Malheureusement, le port USB-C du Neo 15 basé sur AMD est différent de celui du modèle Intel. Sur la version AMD, non seulement vous n'avez pas de Thunderbolt, mais le port USB-C est seulement de type 3.2 Gen2x1 au lieu de Gen2x2. Power Delivery n'est pas non plus pris en charge.
Sur une note positive, l'ordinateur portable dispose de deux prises audio séparées (microphone + casque), et les ports sont bien disposés à gauche, à droite et à l'arrière. La connexion d'eau pour le XMG OASIS est également situé à l'arrière.
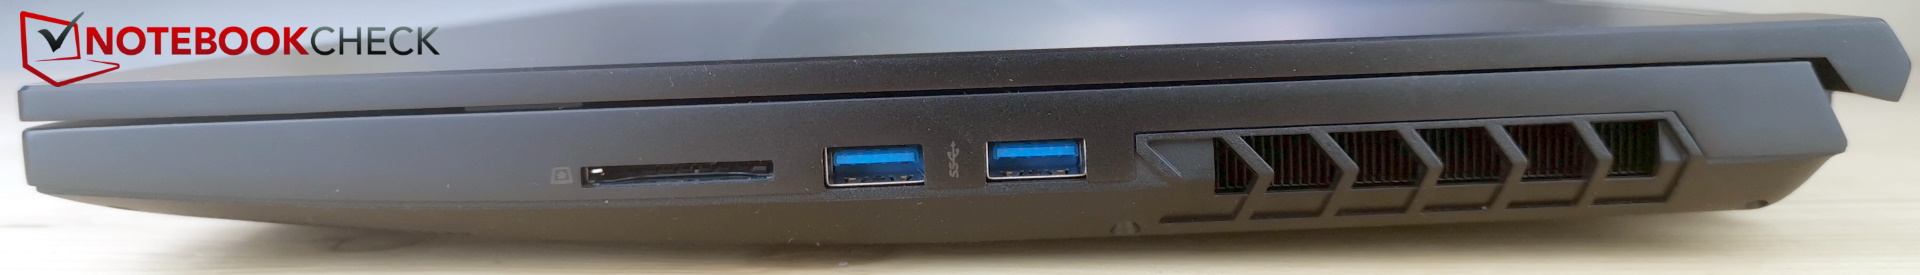
Lecteur de carte SD
Le lecteur de cartes accepte les cartes SD ordinaires. Lorsque vous insérez une carte SD, environ la moitié de la carte sort de la fente car elle n'a pas de mécanisme de verrouillage.
Les vitesses de transfert du lecteur de cartes se situent plus ou moins dans la partie inférieure du spectre.
| SD Card Reader | |
| average JPG Copy Test (av. of 3 runs) | |
| Moyenne de la classe Gaming (20.9 - 210, n=54, 2 dernières années) | |
| Schenker XMG Neo 15 (i7-12700H, RTX 3080 Ti) | |
| MSI GE67 HX 12UGS (Toshiba Exceria Pro SDXC 64 GB UHS-II) | |
| Schenker XMG Neo 15 (Ryzen 9 6900HX, RTX 3070 Ti) | |
| maximum AS SSD Seq Read Test (1GB) | |
| Moyenne de la classe Gaming (25.5 - 261, n=51, 2 dernières années) | |
| Schenker XMG Neo 15 (Ryzen 9 6900HX, RTX 3070 Ti) | |
| Schenker XMG Neo 15 (i7-12700H, RTX 3080 Ti) | |
| MSI GE67 HX 12UGS (Toshiba Exceria Pro SDXC 64 GB UHS-II) | |
Connectivité
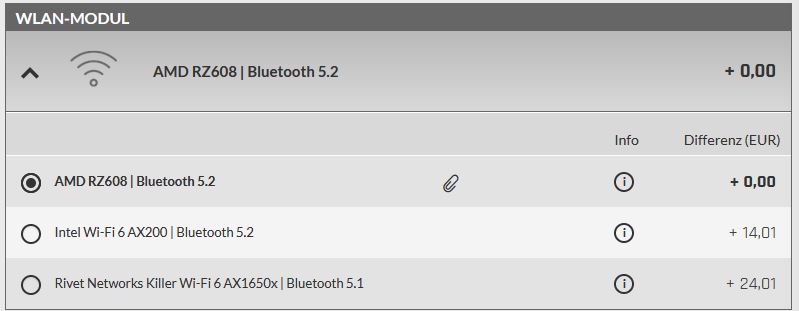
Le Neo est livré avec un module sans fil Intel AX200. Bien que cette carte sans fil prenne en charge le Wi-Fi 6, elle ne fonctionne toujours pas avec la bande de fréquence de 6 GHz. Elle offre des taux de transfert bons et stables, mais les autres modules Wi-Fi du comparatif sont légèrement plus rapides.
Webcam
Le bon côté : le Neo 15 est équipé d'une webcam Full HD. Le moins bon : la qualité d'image est moins bonne que celle de certains modèles 720p (voir photo ci-dessous).


 GeForce RTX 3070 Ti Laptop GPU, R9 6900HX, Samsung SSD 980 Pro 1TB MZ-V8P1T0BW")
 GeForce RTX 3070 Ti Laptop GPU, R9 6900HX, Samsung SSD 980 Pro 1TB MZ-V8P1T0BW")
Sécurité
Il n'y a pas de capteur d'empreintes digitales sur le Neo 15, mais le TPM 2.0 et une fente Kensington sont à bord.
Accessoires et garantie
Contrairement à de nombreux autres fabricants, Schenker est connu pour ne pas lésiner sur les accessoires. Par exemple, un grand tapis de souris et un lecteur flash USB contenant les pilotes sont inclus dans la boîte.
La société offre une garantie de 24 mois qui comprend un service d'enlèvement et de retour ainsi qu'une réparation rapide dans les six premiers mois suivant l'achat.
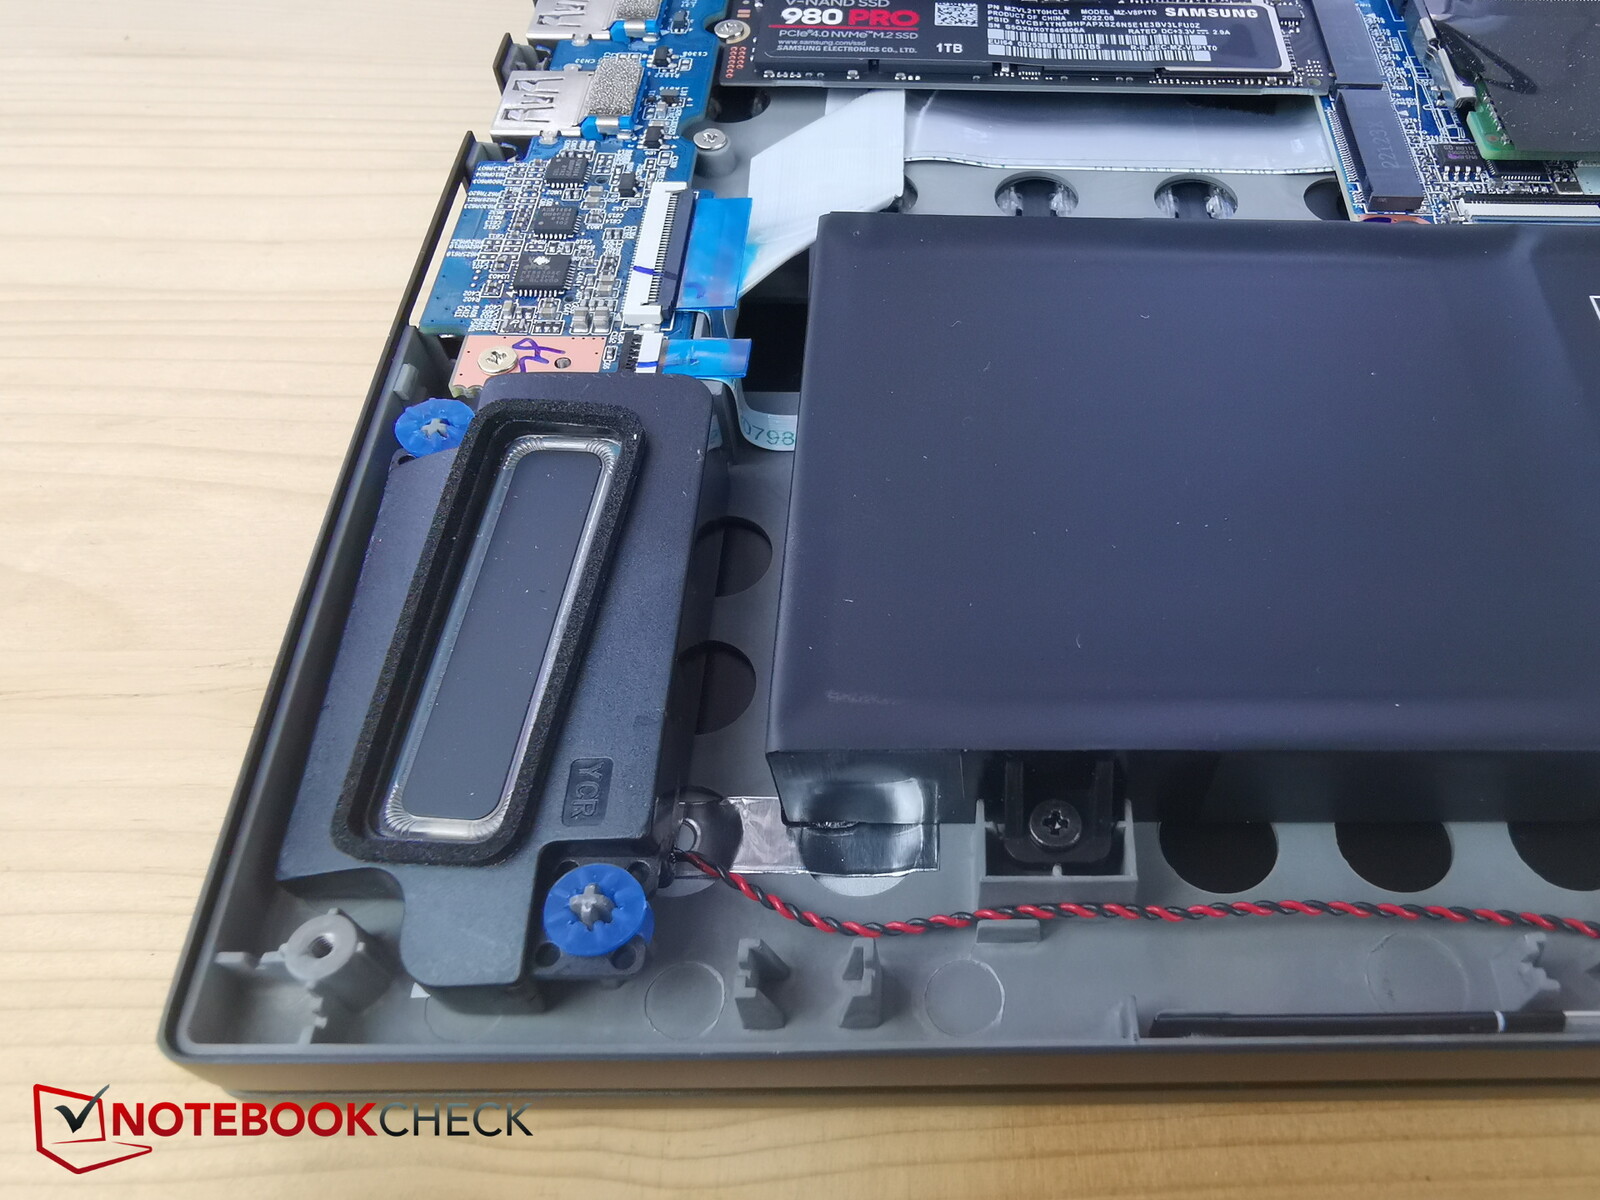
Maintenance
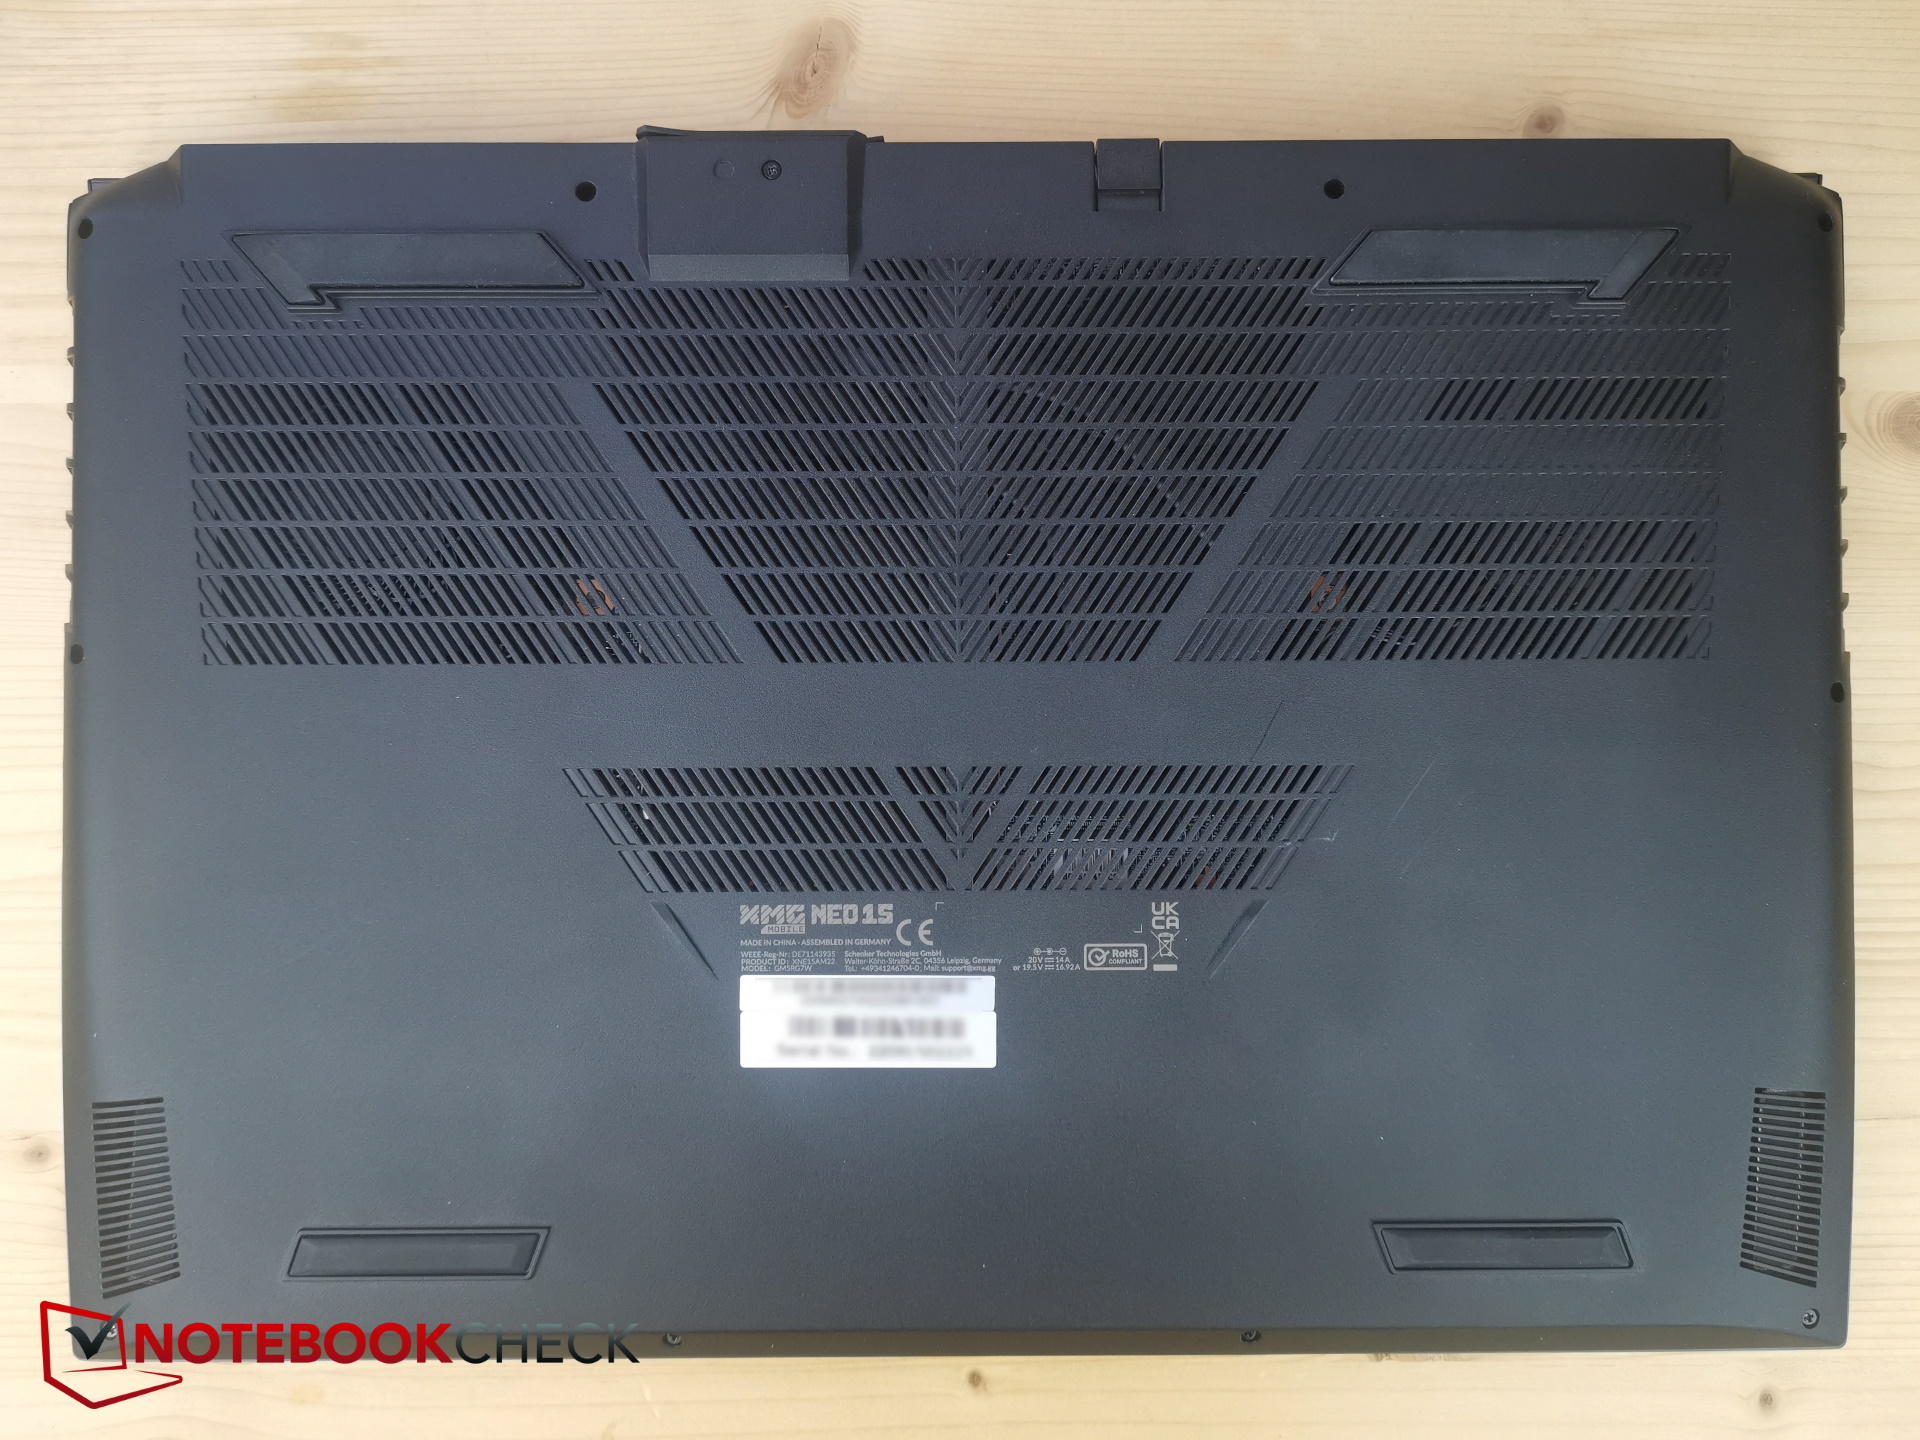
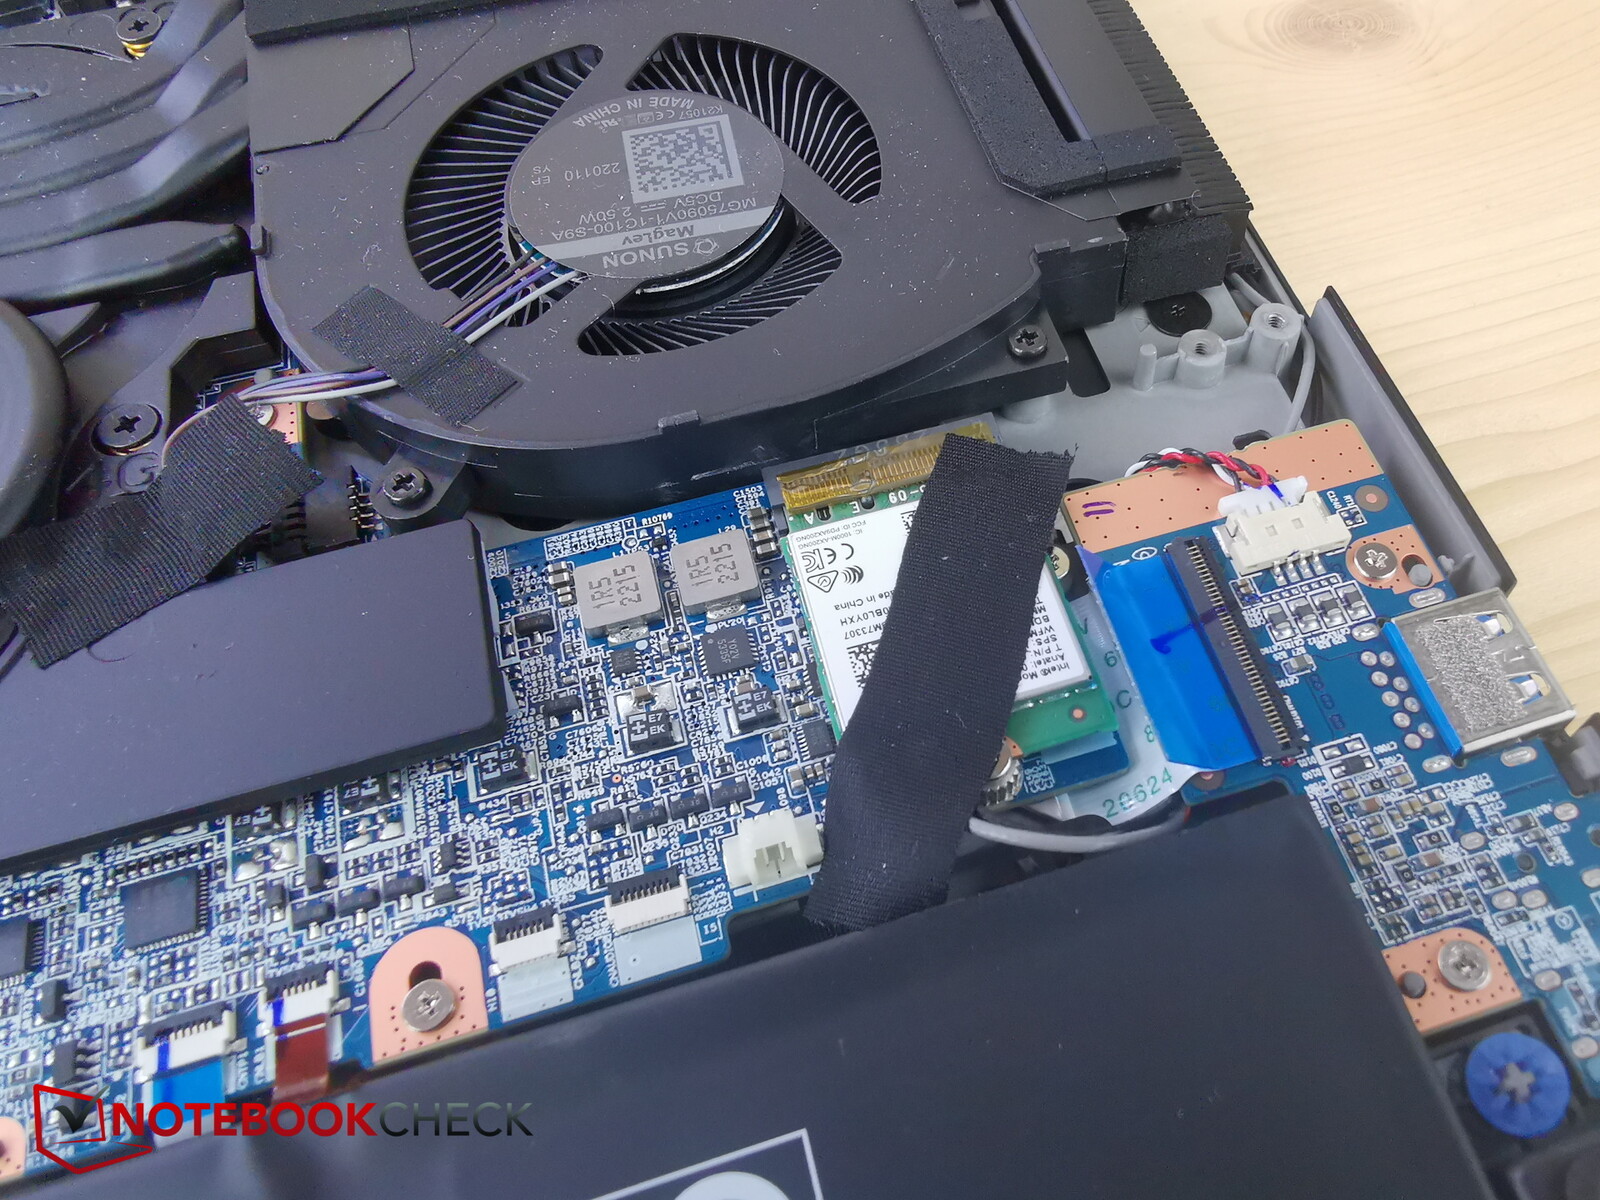
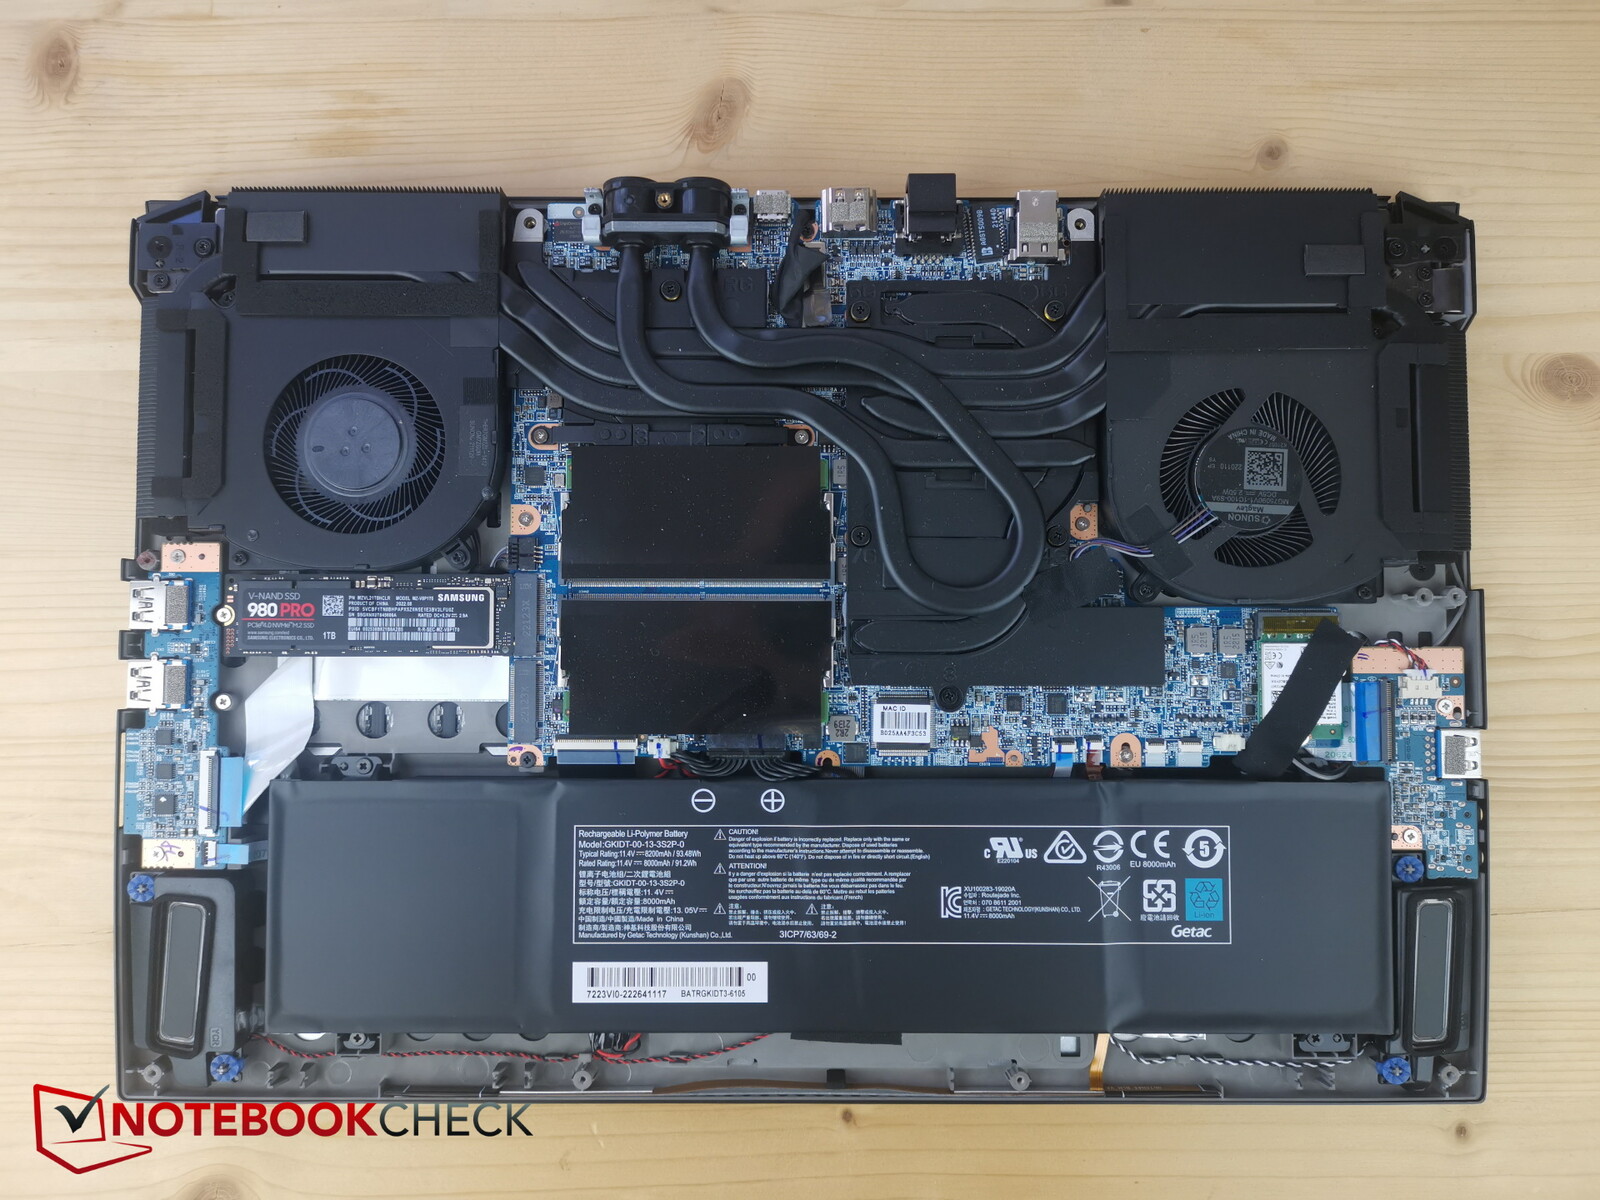
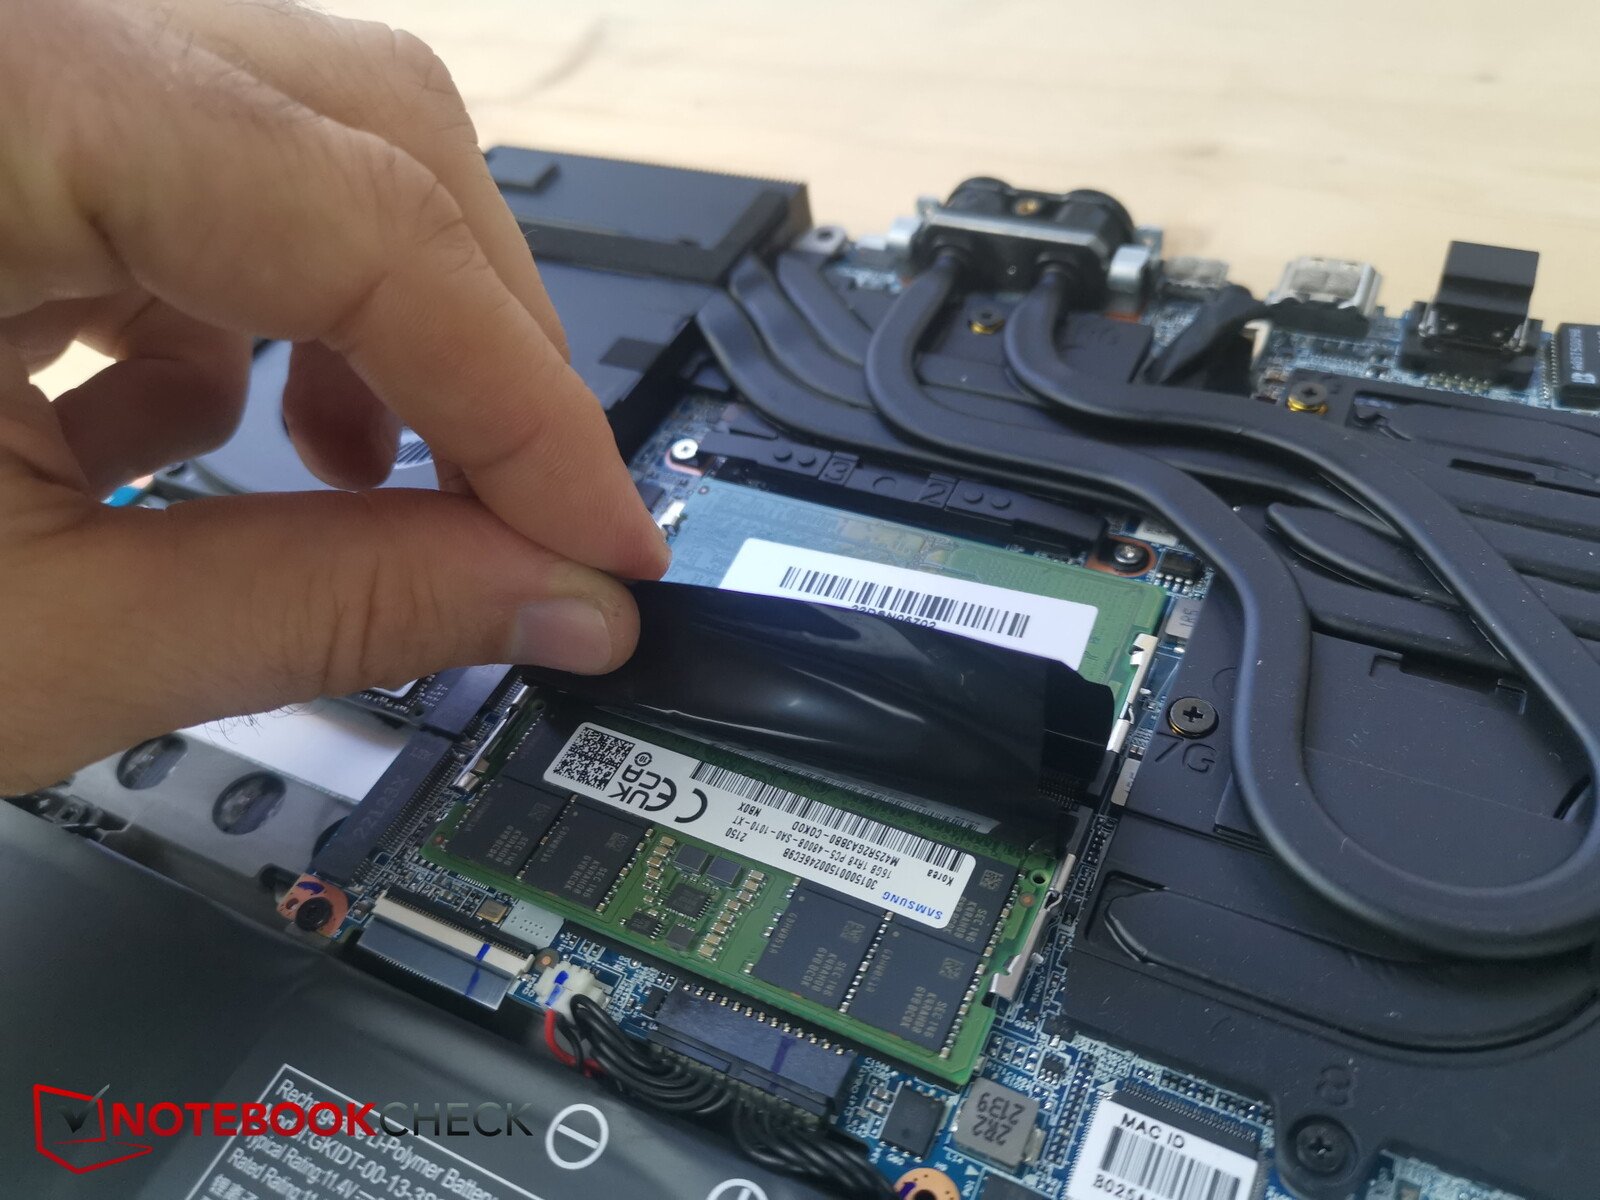
Le fond en plastique est fixé en place par un total de 14 vis à tête Phillips, dont quatre sur les ports de refroidissement liquide. Il est très facile de soulever le panneau inférieur lorsque vous commencez par l'arrière. Une fois le châssis de l'ordinateur portable ouvert, vous aurez accès aux deux emplacements SSD M.2, aux ventilateurs, à la batterie, au module Wi-Fi et aux deux emplacements de RAM.
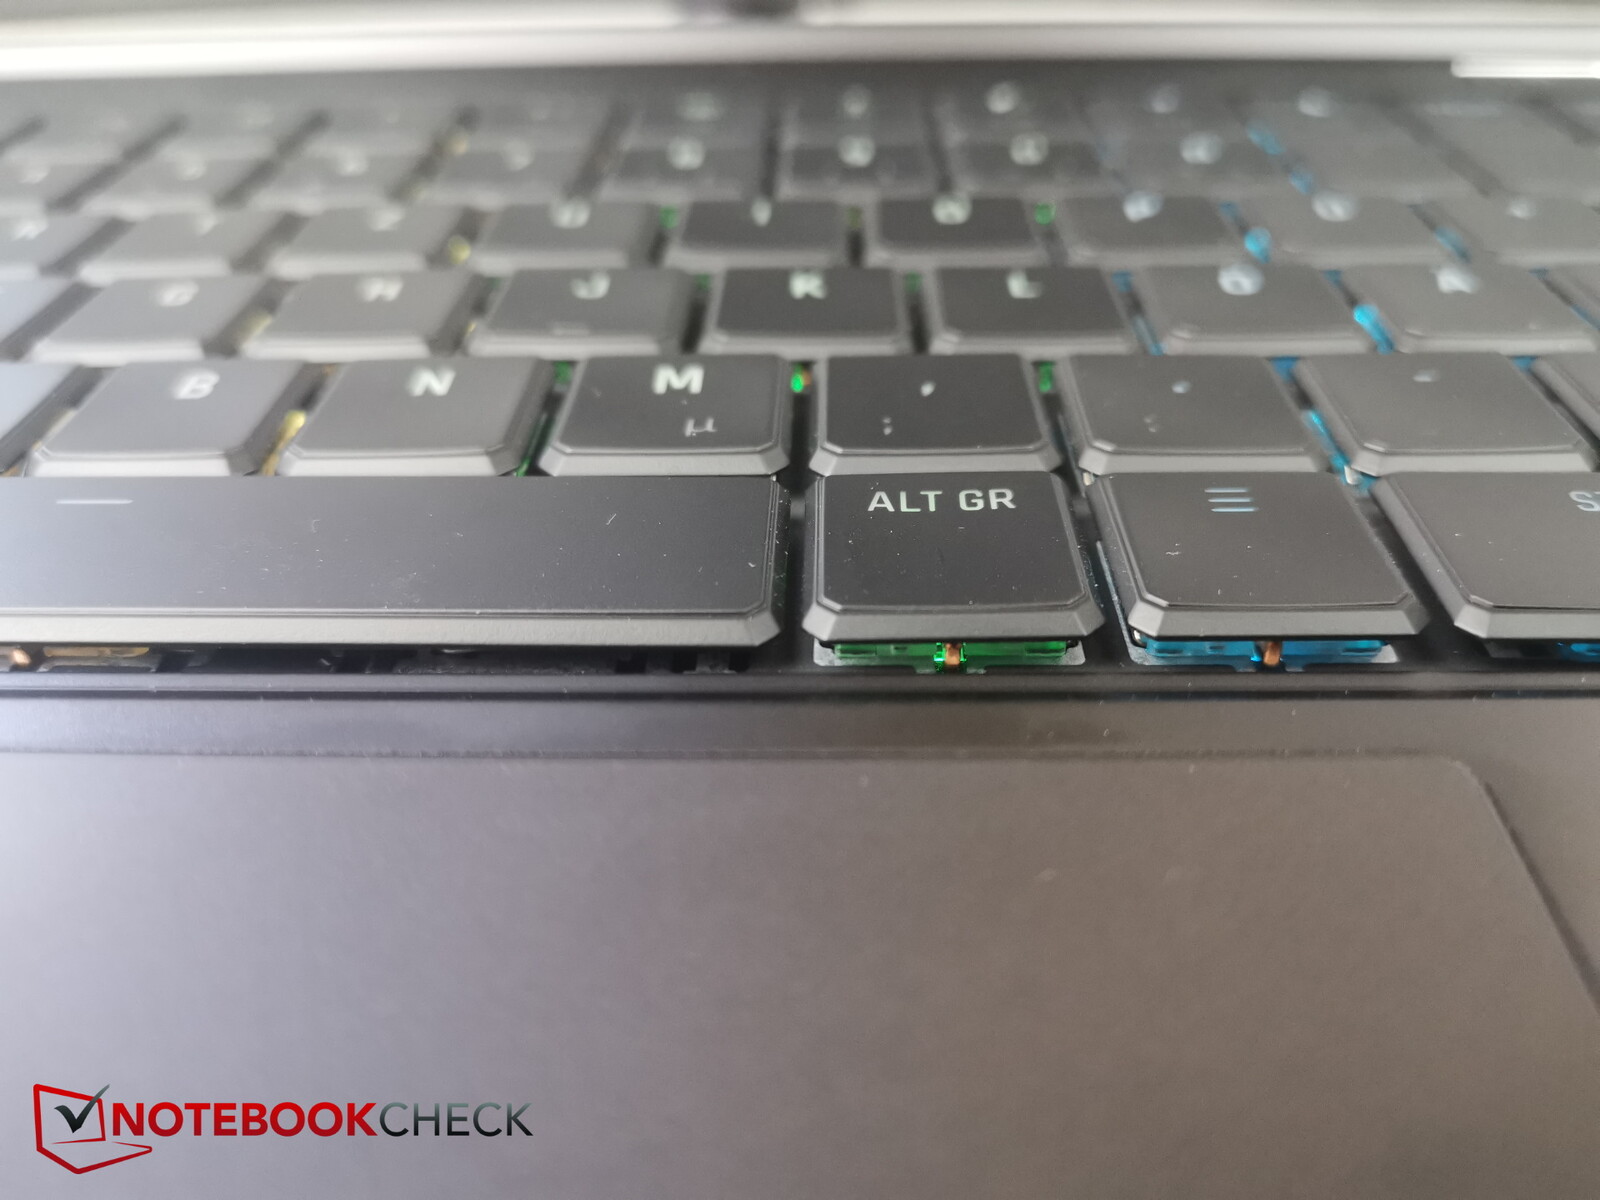
Dispositifs d'entrée - Interrupteurs opto-mécaniques
Clavier
Le clavier opto-mécanique occupe presque toute la largeur de l'ordinateur portable de 15 pouces. Il est suffisamment grand pour accueillir des touches de taille normale et même un pavé numérique de la même taille à côté d'elles. Il n'y a pas beaucoup d'espace entre les touches, mais ce n'est pas un problème compte tenu de leur taille.
La disposition du clavier est très soignée : tout tient à l'intérieur d'un rectangle sans encoches ou autres. D'une part, cela signifie qu'aucune touche ne ressort ou n'est isolée des autres, et que l'utilisateur doit uniquement se fier aux légendes et à sa propre expérience pour naviguer sur le clavier. D'autre part, tout est à sa place.
Le clavier du Neo est également assez confortable pour taper grâce à la course modérée des touches et à la clarté du retour d'information, ce qui permet de taper rapidement. Le son de la frappe est un peu "claquant", mais ce n'est pas trop grave. L'ordinateur portable dispose également d'un éclairage RVB par touche pour une utilisation dans des environnements sombres.
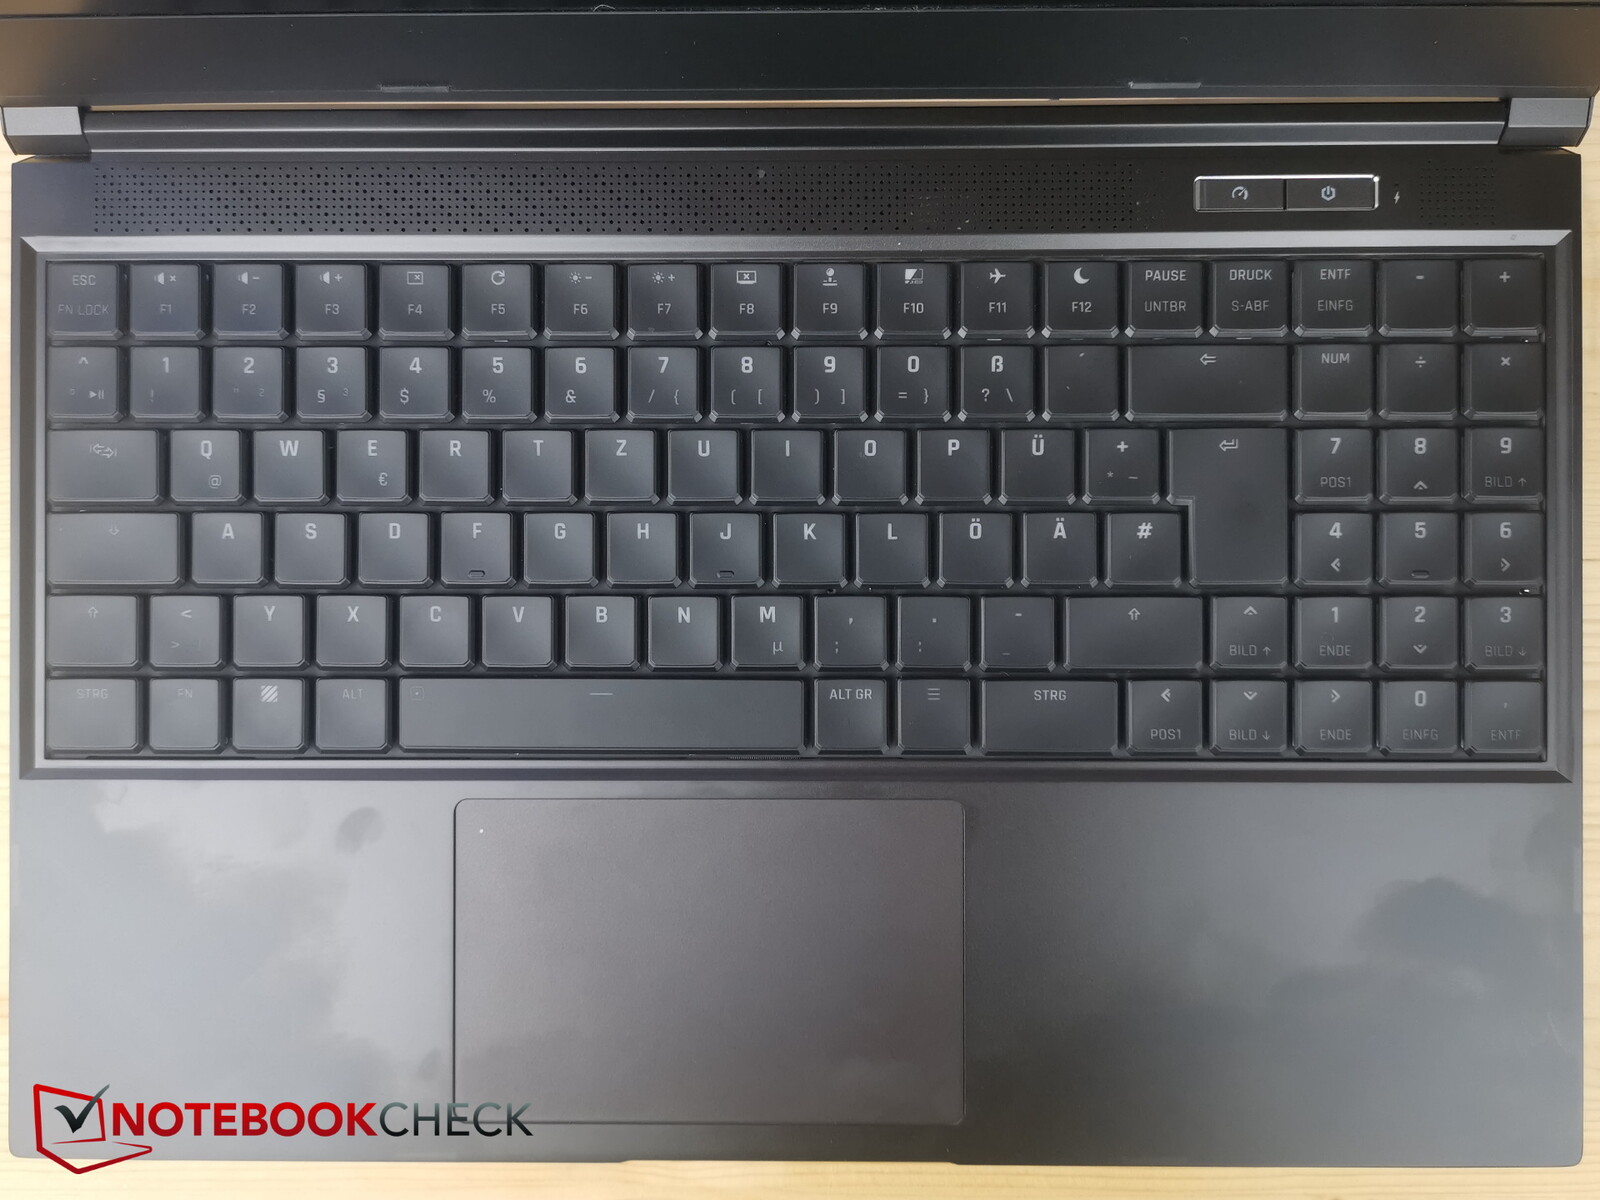
Pavé tactile
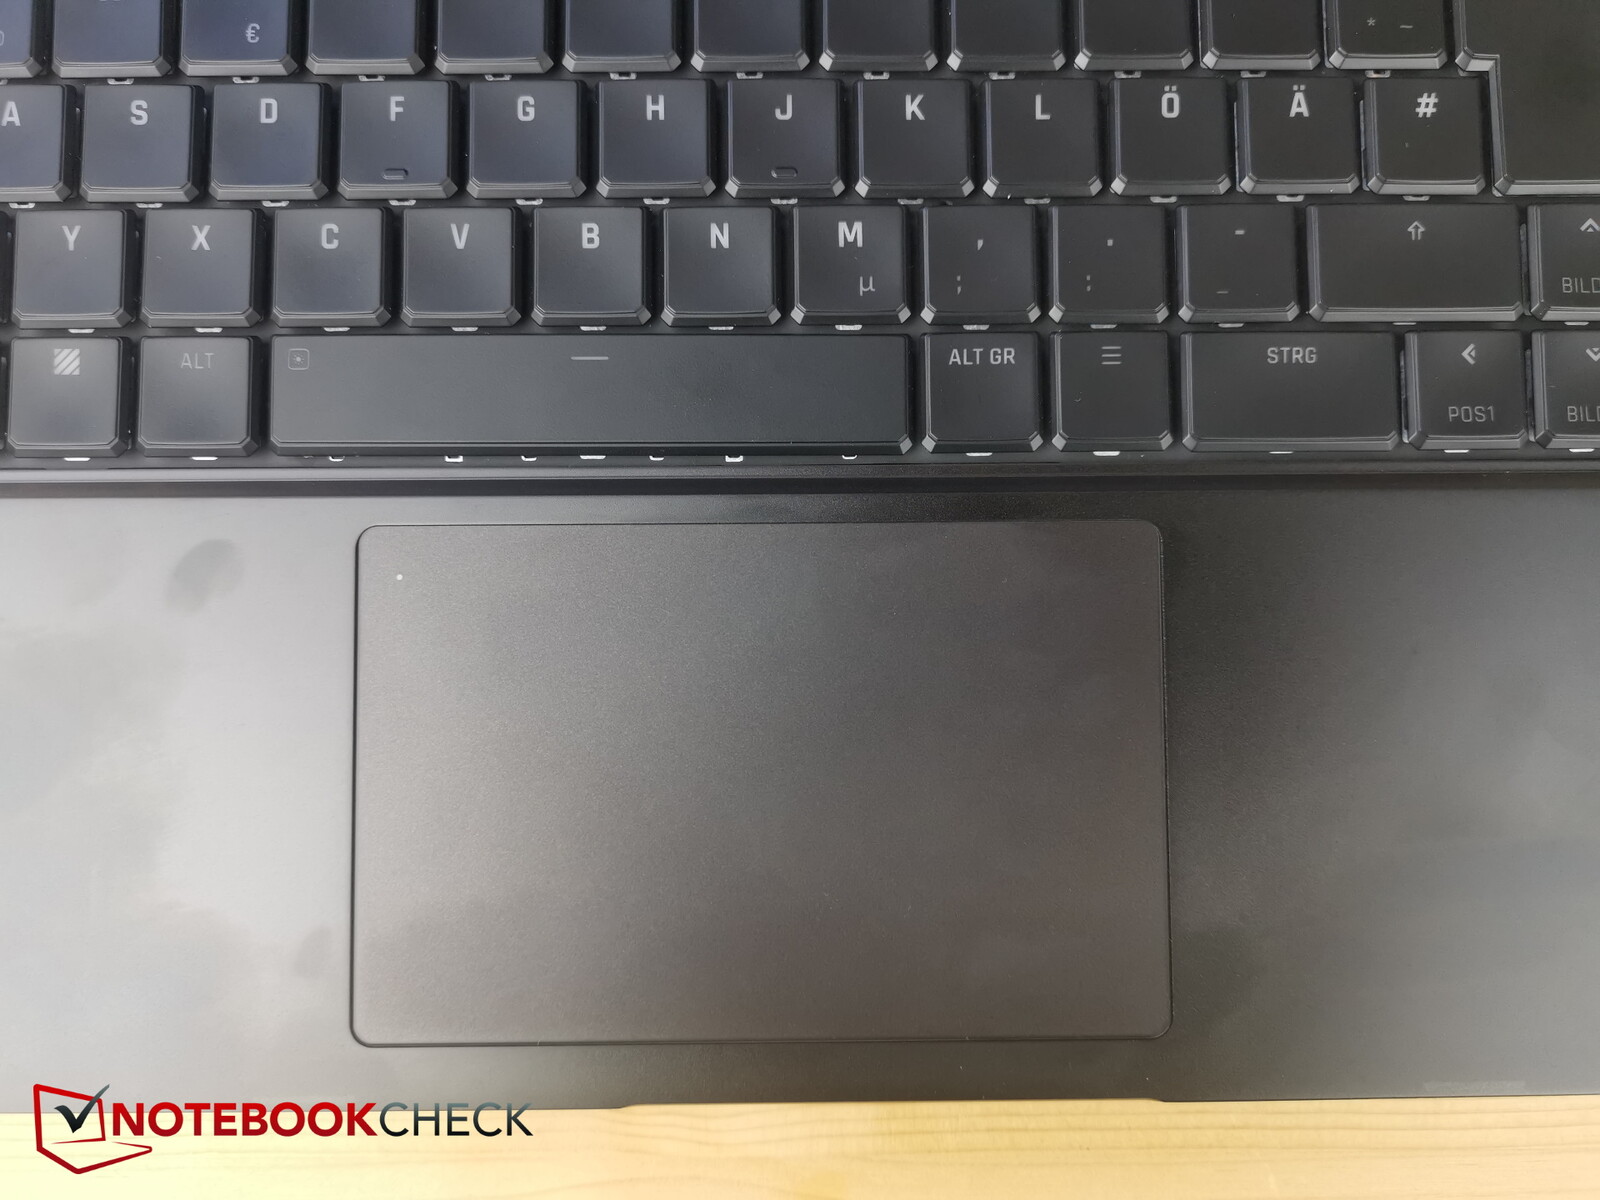
Le pavé tactile est de bonne taille (environ 11,6 x 7,4 cm, ou 4,6 x 2,9") et sa surface est lisse, ce qui signifie que vous n'aurez pas de bégaiement même si vous faites glisser votre doigt lentement sur le pavé tactile. Une petite LED située dans le coin supérieur gauche indique si le pavé tactile est activé ou non.
Les boutons intégrés sont légèrement plus rigides que ce que nous trouvons confortable, mais ils fournissent un retour d'information distinct et un son de clic clair.
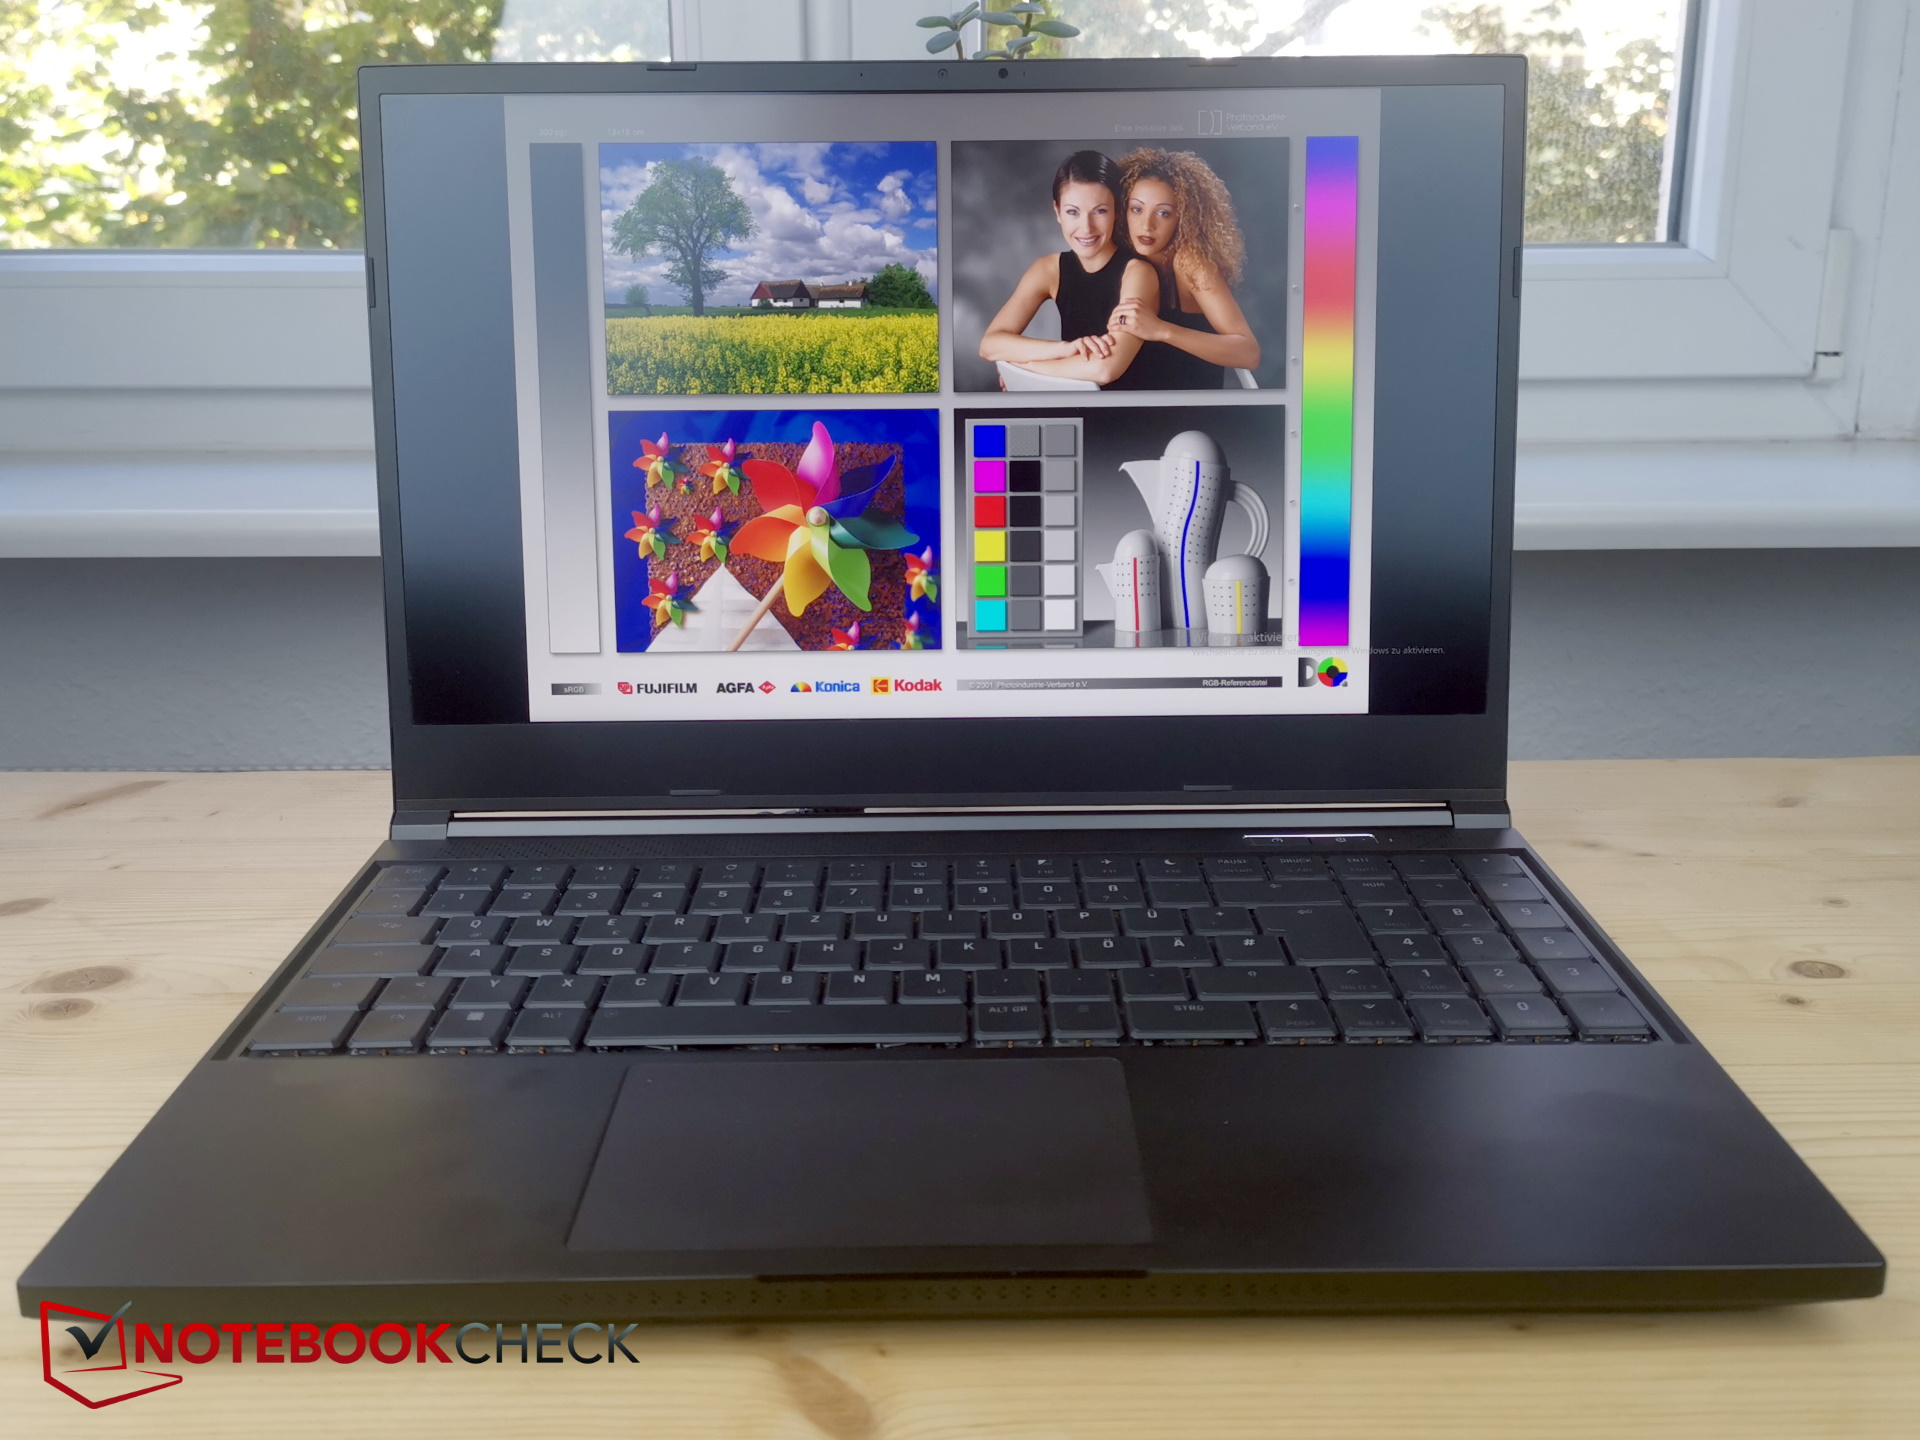
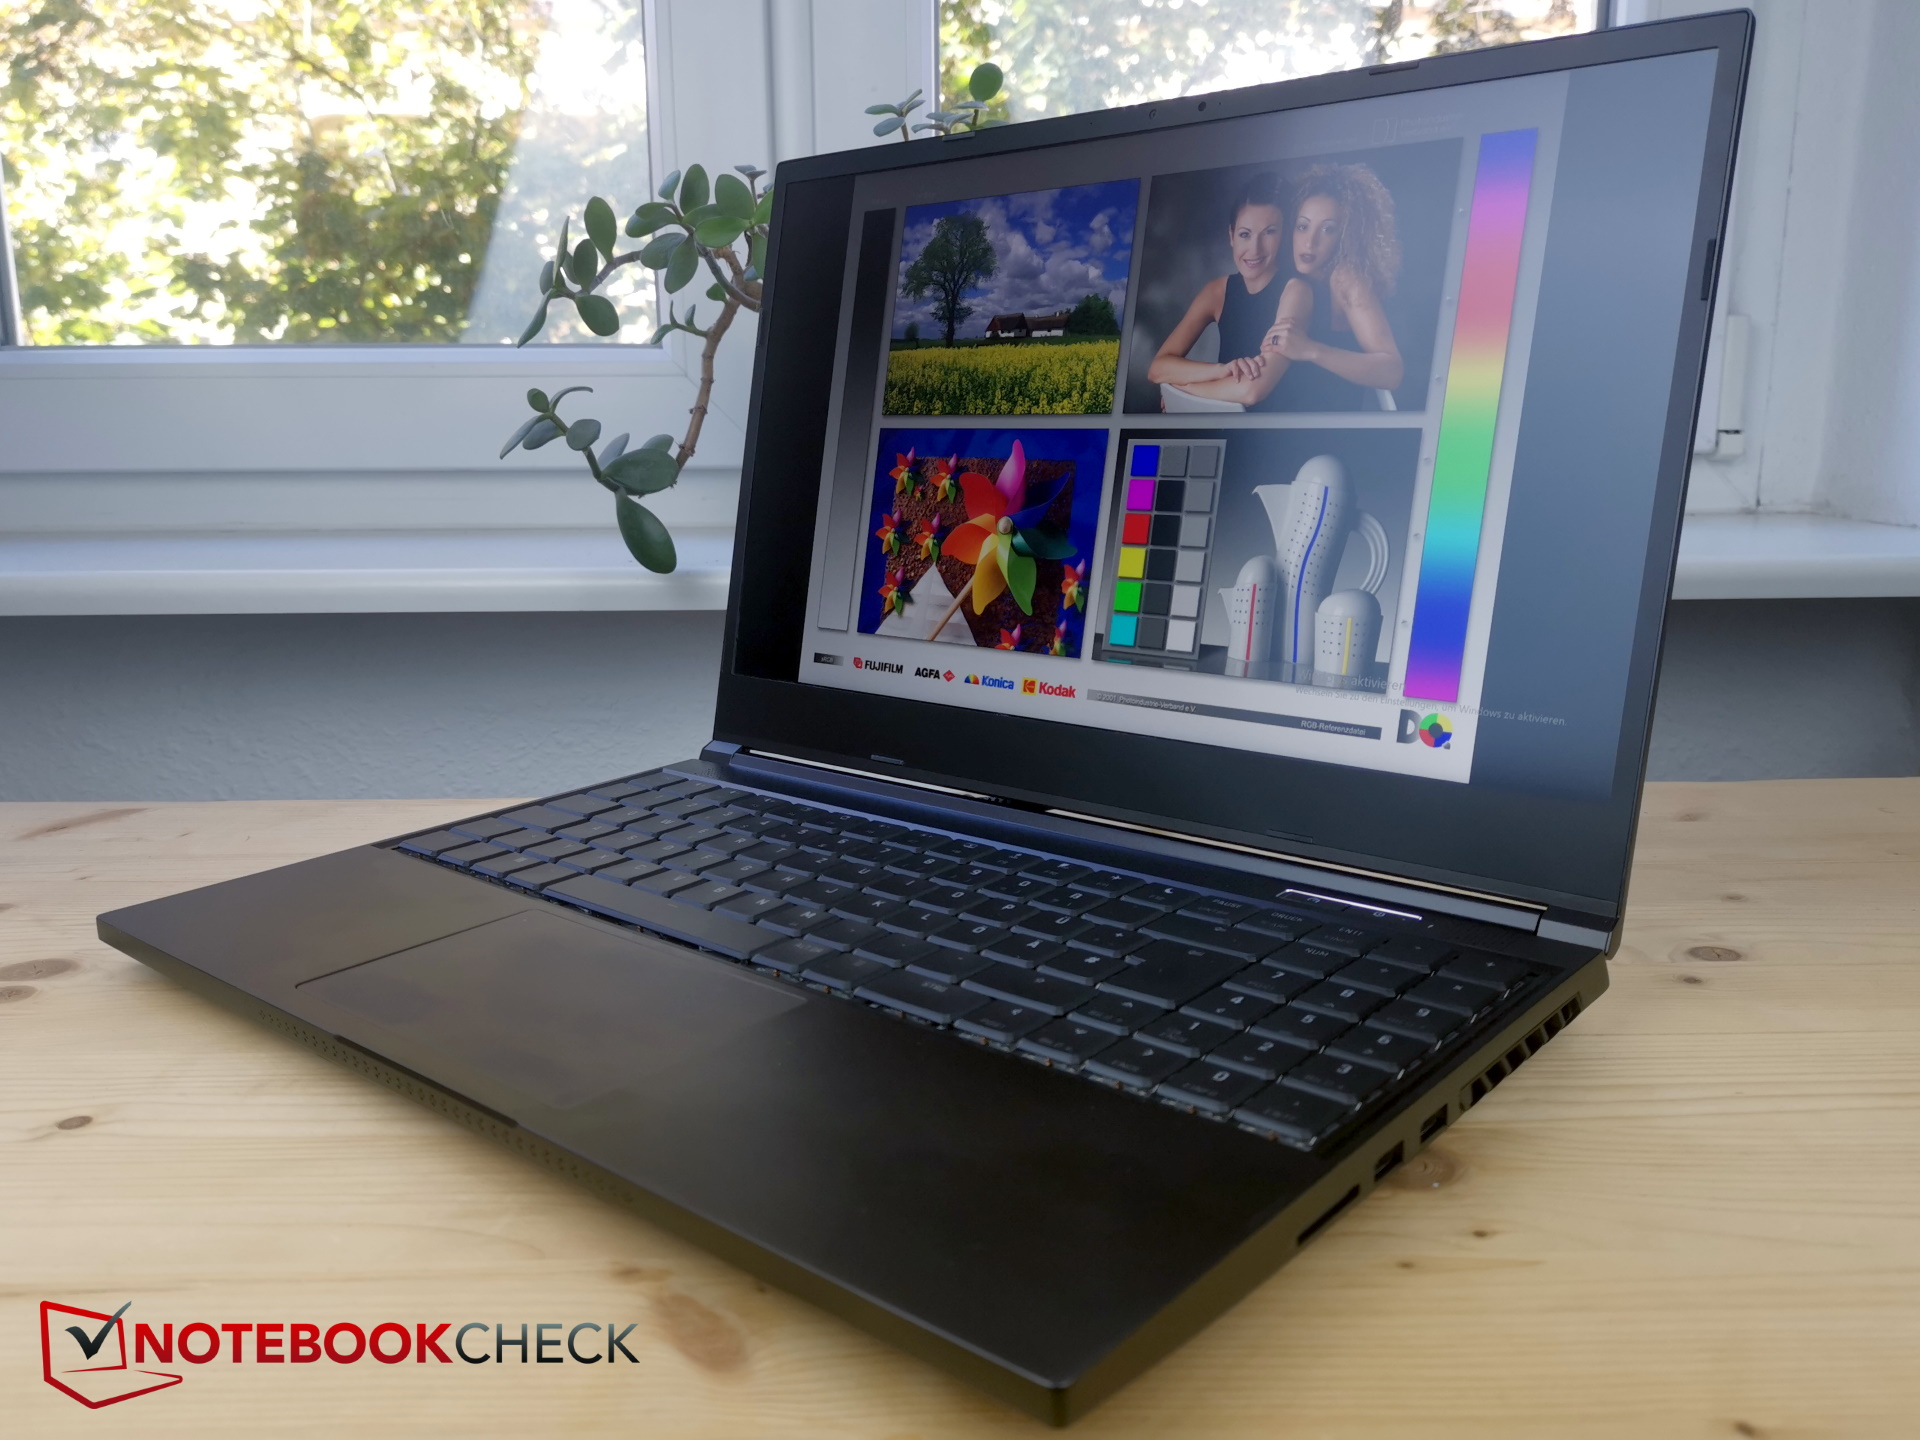
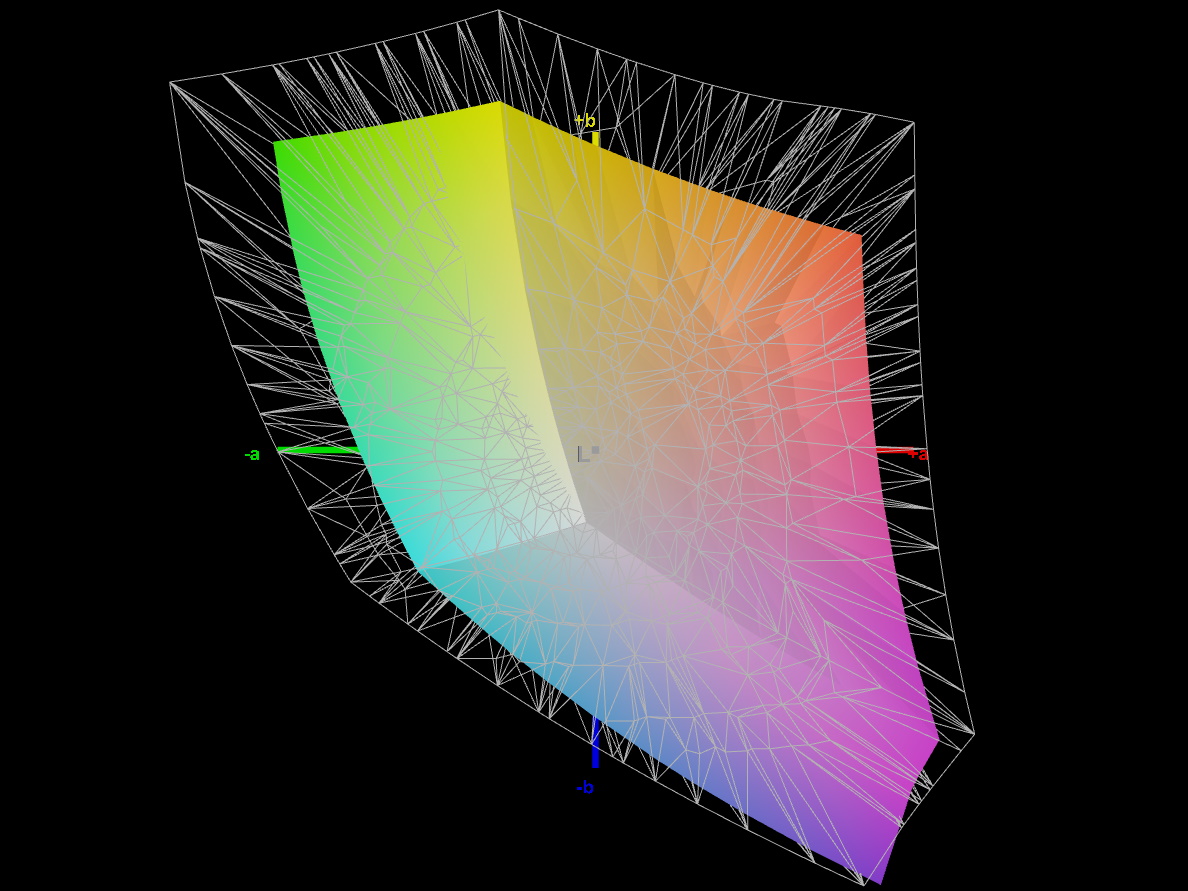
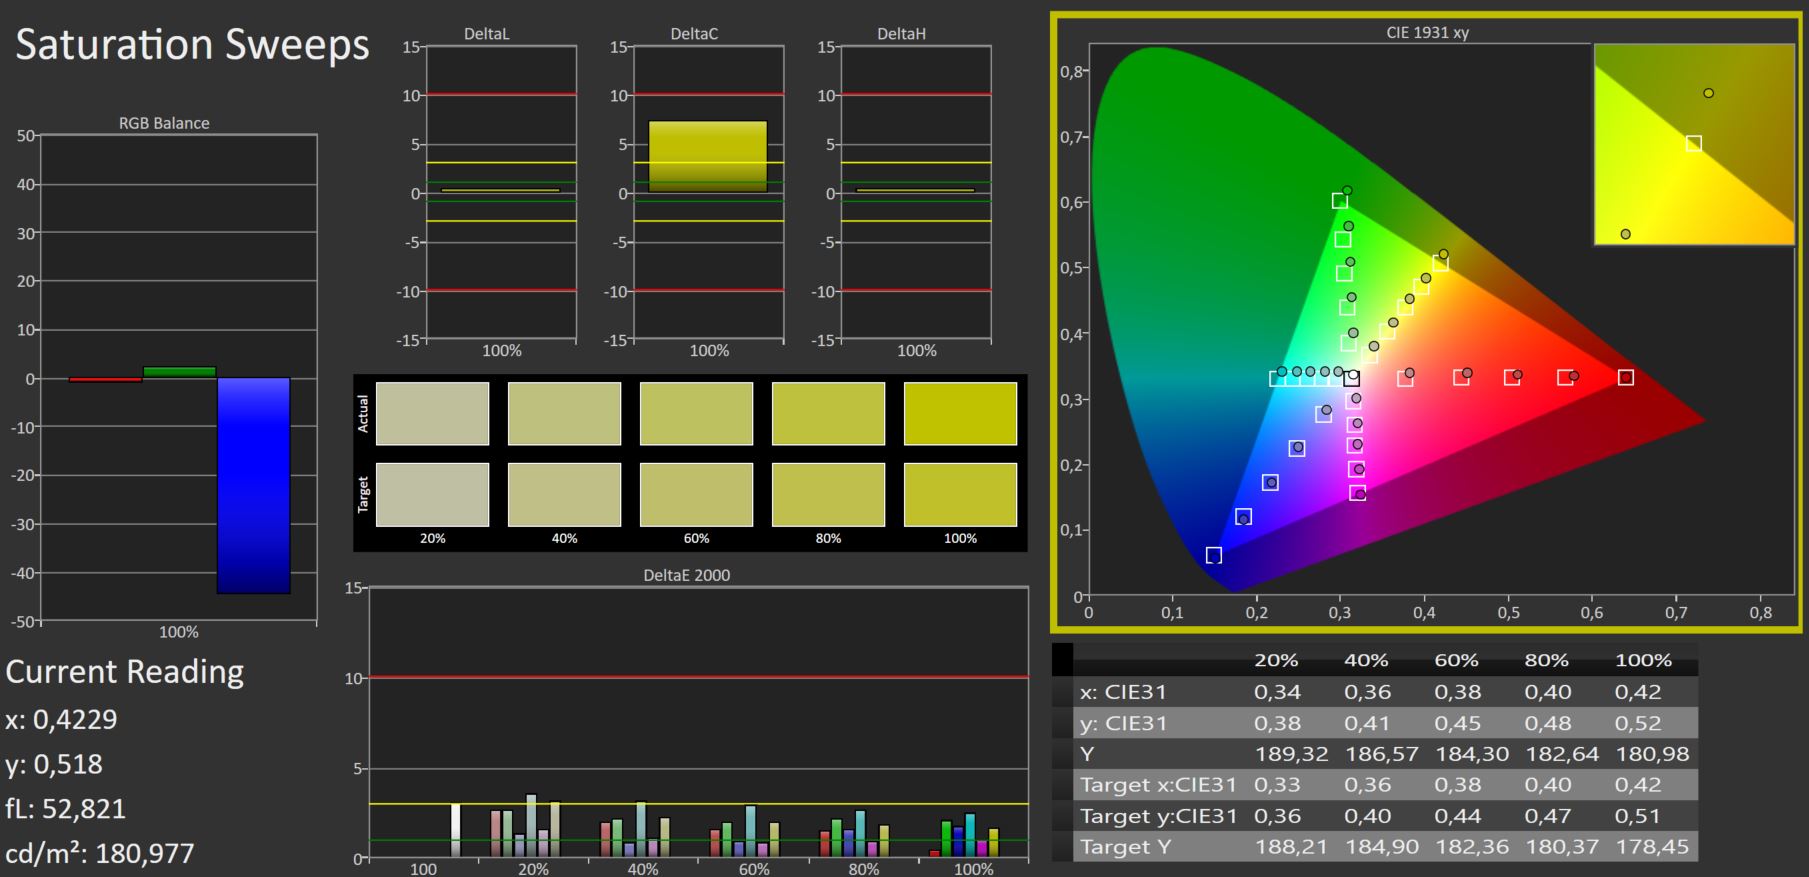
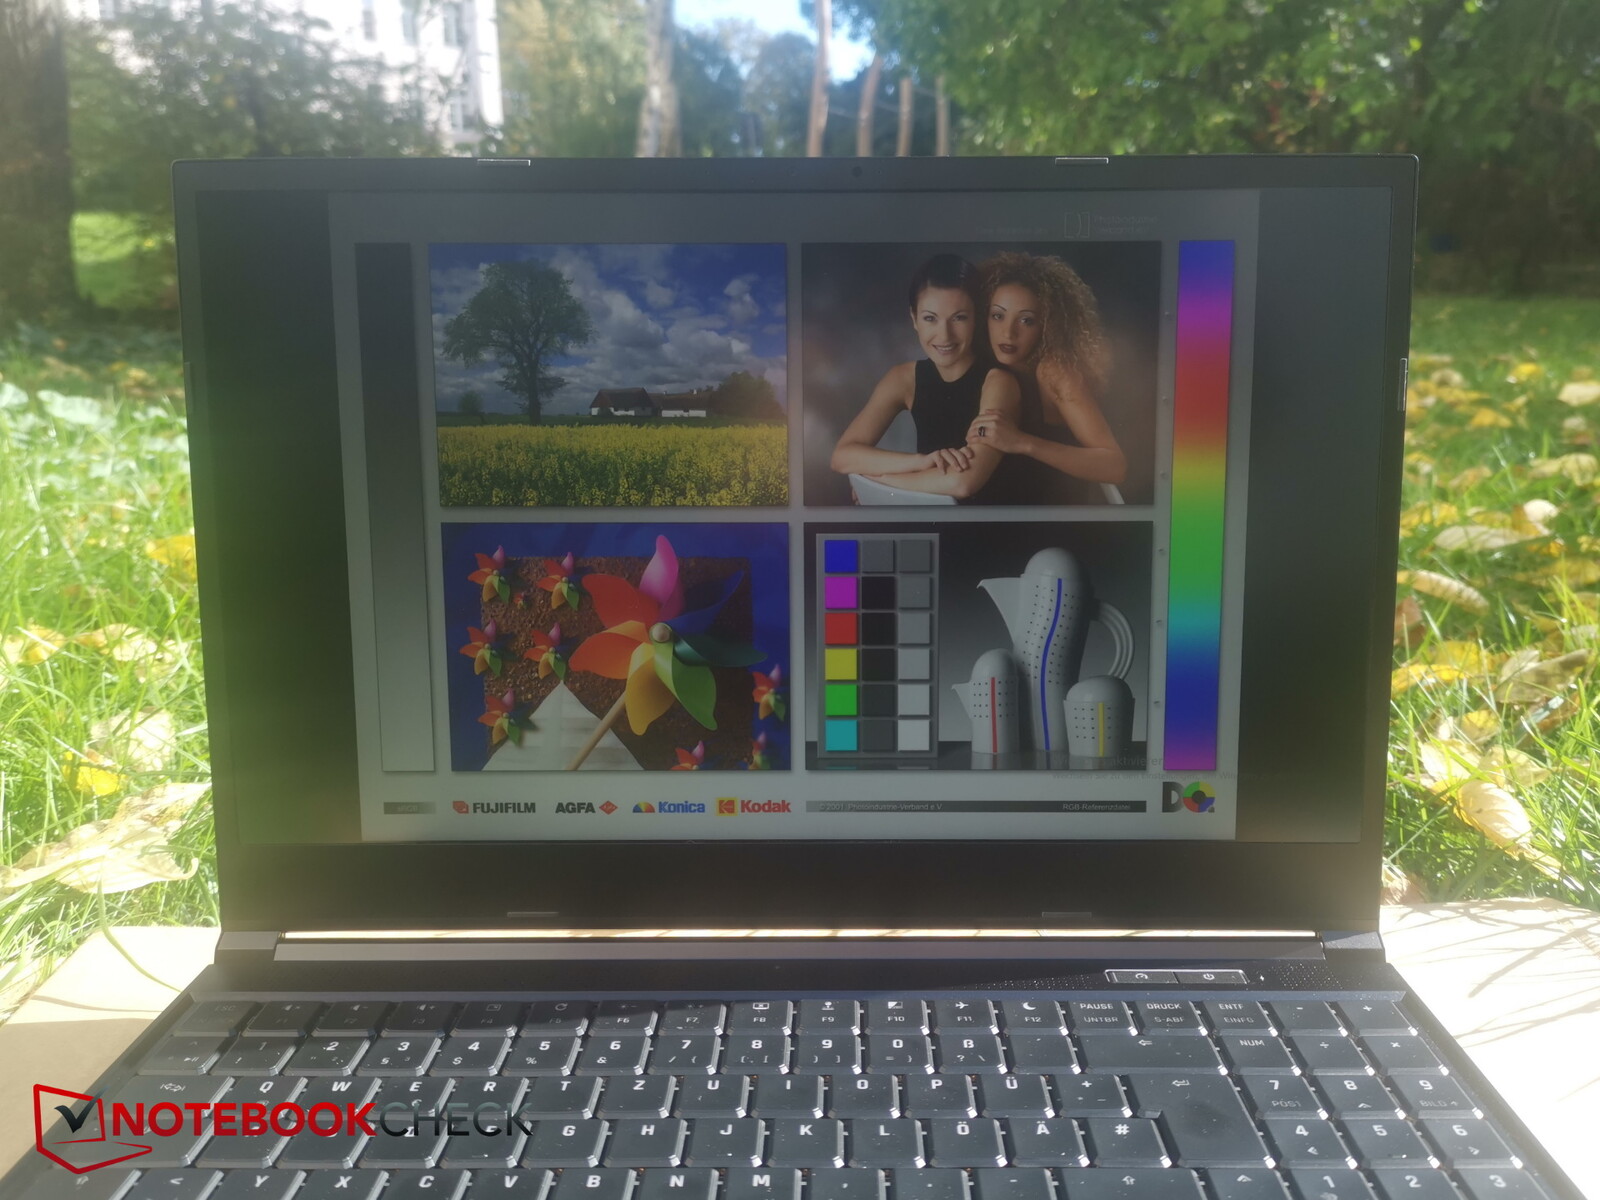
Affichage - écran QHD 240 Hz avec couverture sRGB complète
Schenker utilise la même dalle IPS QHD 16:9 avec une résolution de 2 560 x 1 440 sur tous les modèles. La luminosité maximale de l'écran est de 350 nits, un niveau relativement bon qui place le Neo 15 devant le MSI Stealth et l'Acer Nitro.
Toutefois, sa répartition de la luminosité de seulement 82 % est quelque peu inférieure à la moyenne. En particulier, la luminosité de l'écran est nettement plus faible en bas de l'écran.
Le niveau de noir et le contraste sont tous deux excellents pour un ordinateur portable de cette catégorie. L'écran a également un bon temps de réponse et n'utilise pas de PWM.
| |||||||||||||||||||||||||
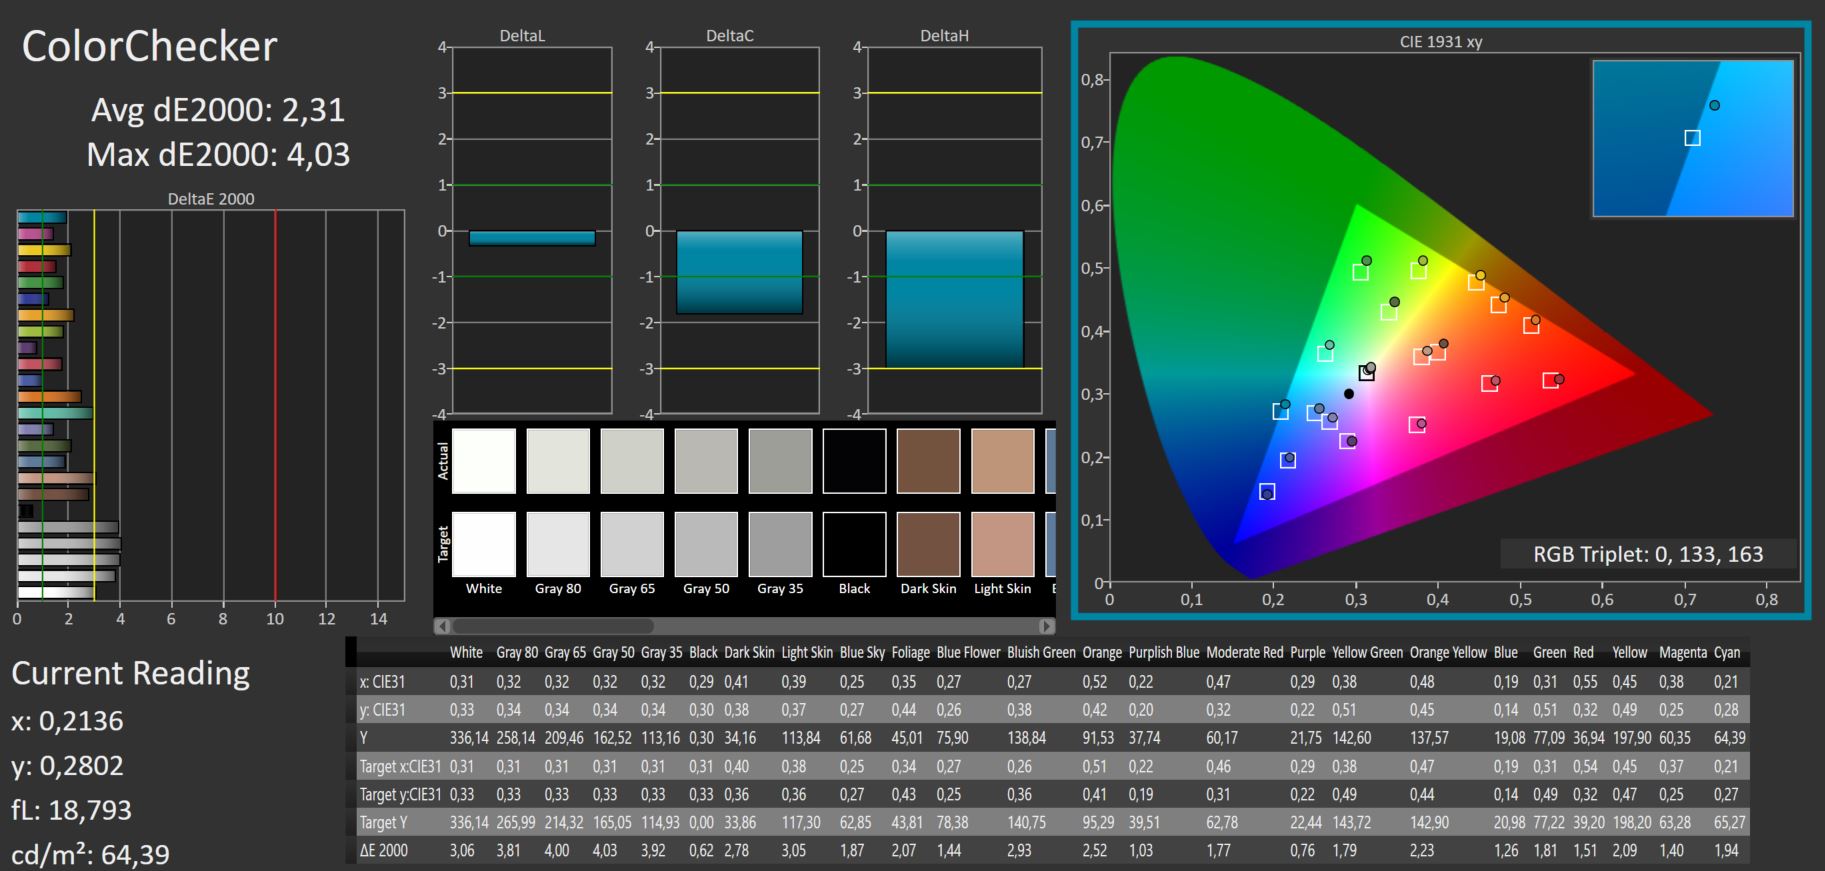
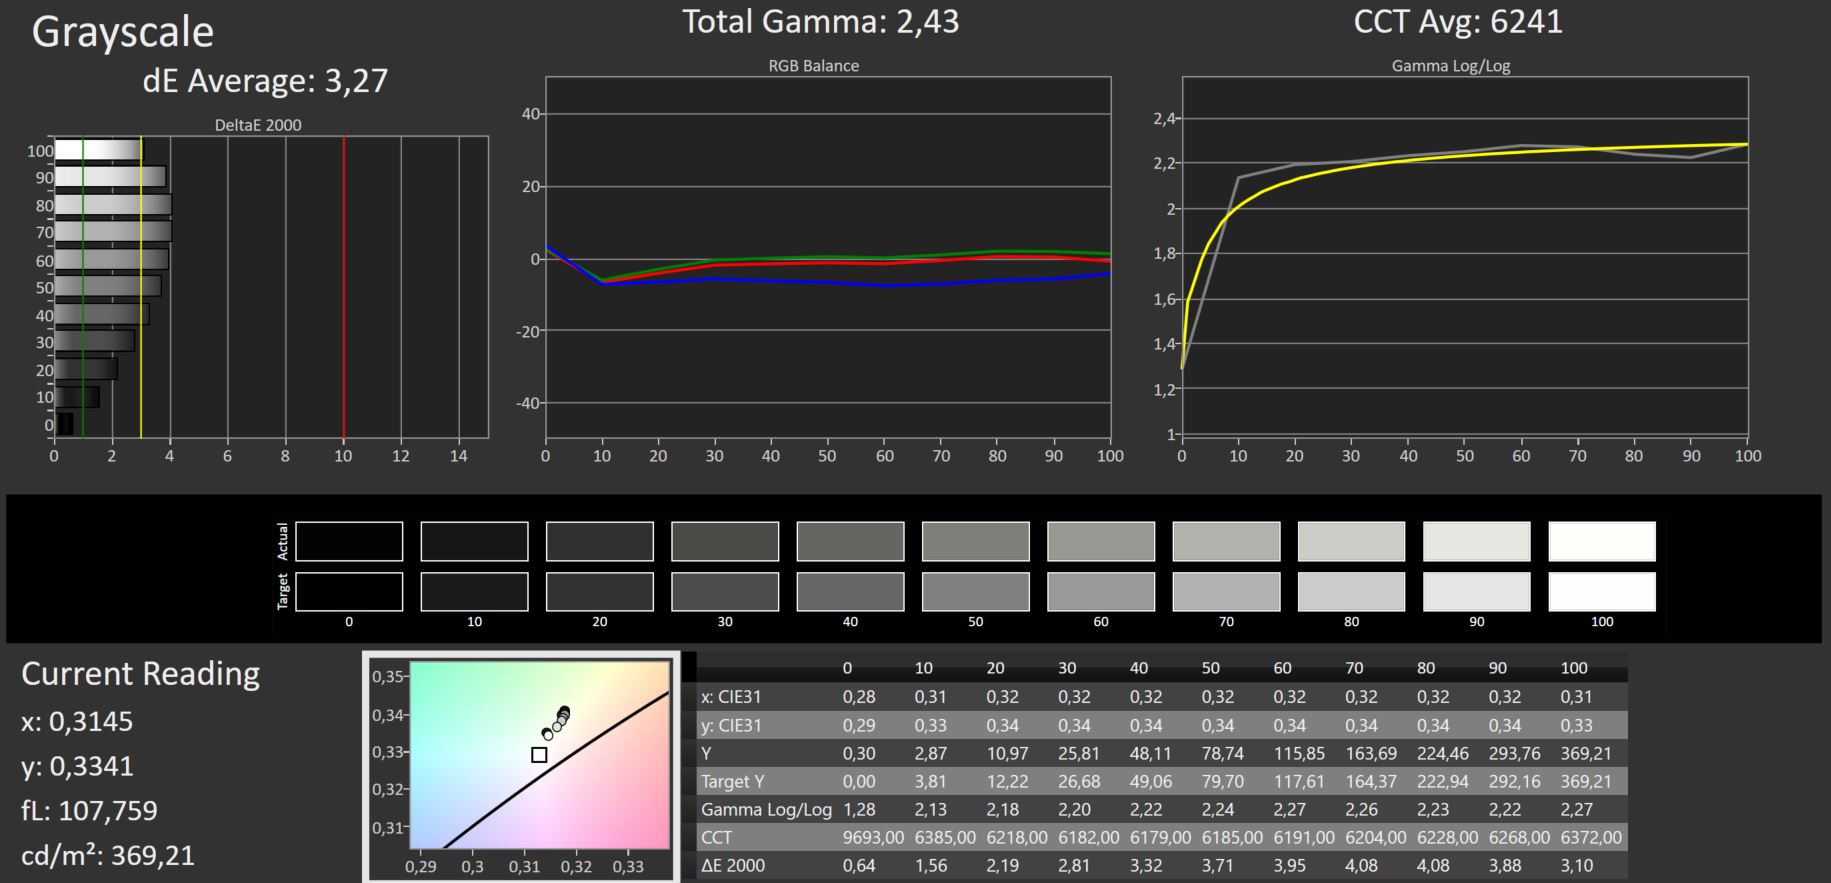
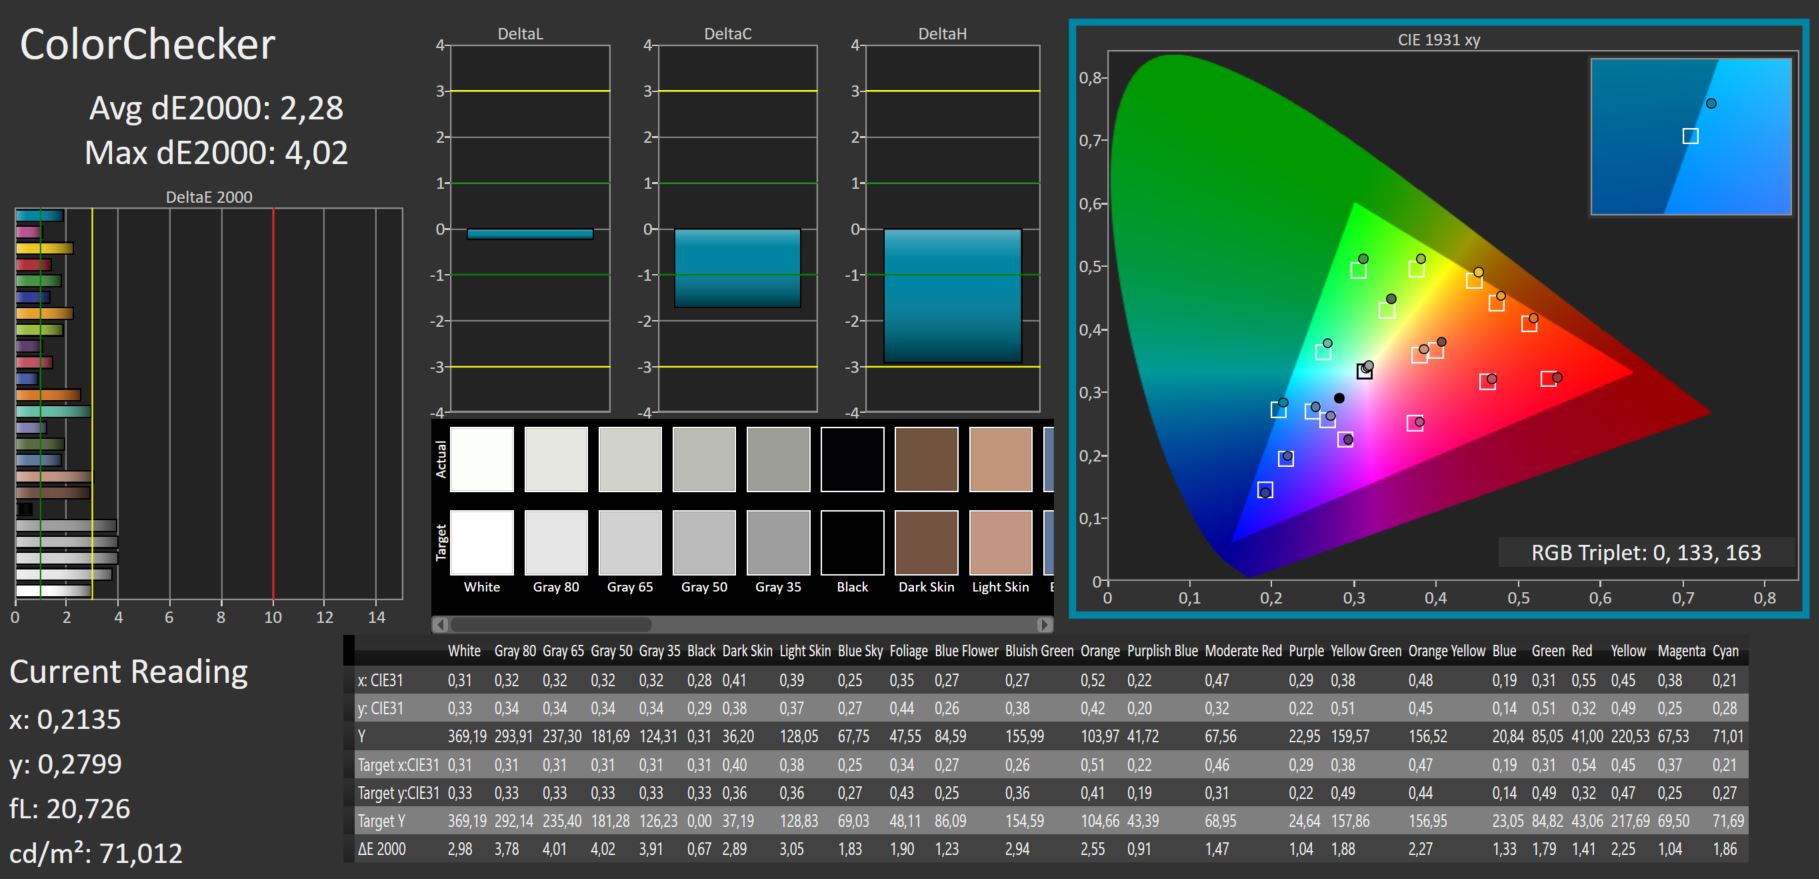
Homogénéité de la luminosité: 82 %
Valeur mesurée au centre, sur batterie: 367 cd/m²
Contraste: 1321:1 (Valeurs des noirs: 0.28 cd/m²)
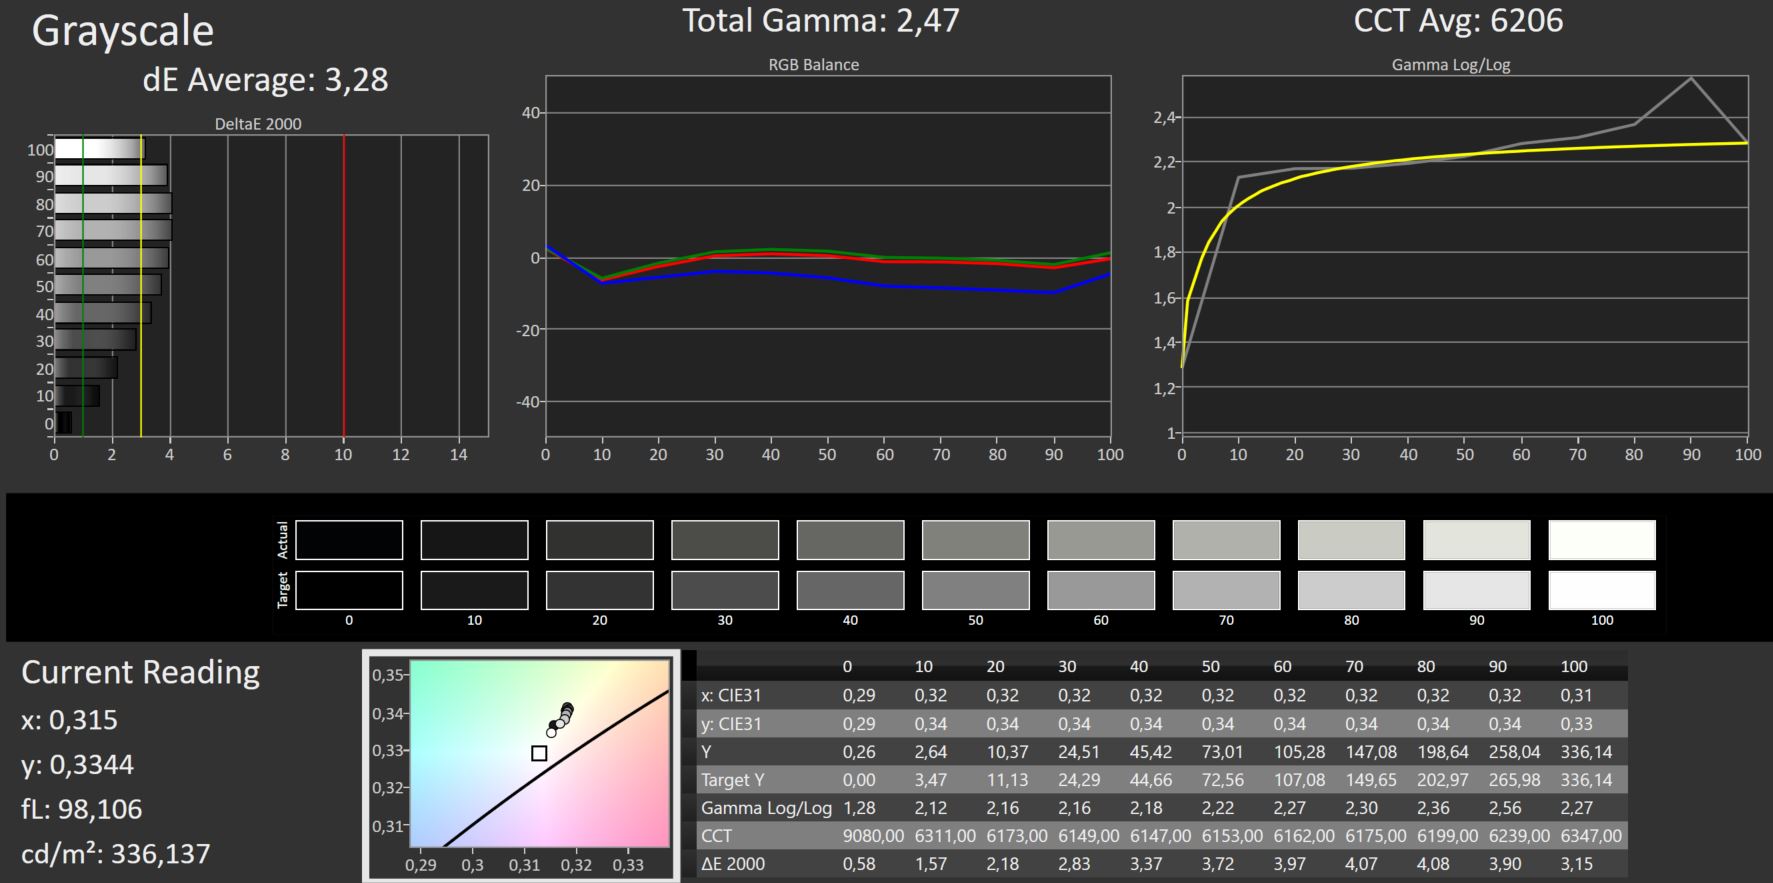
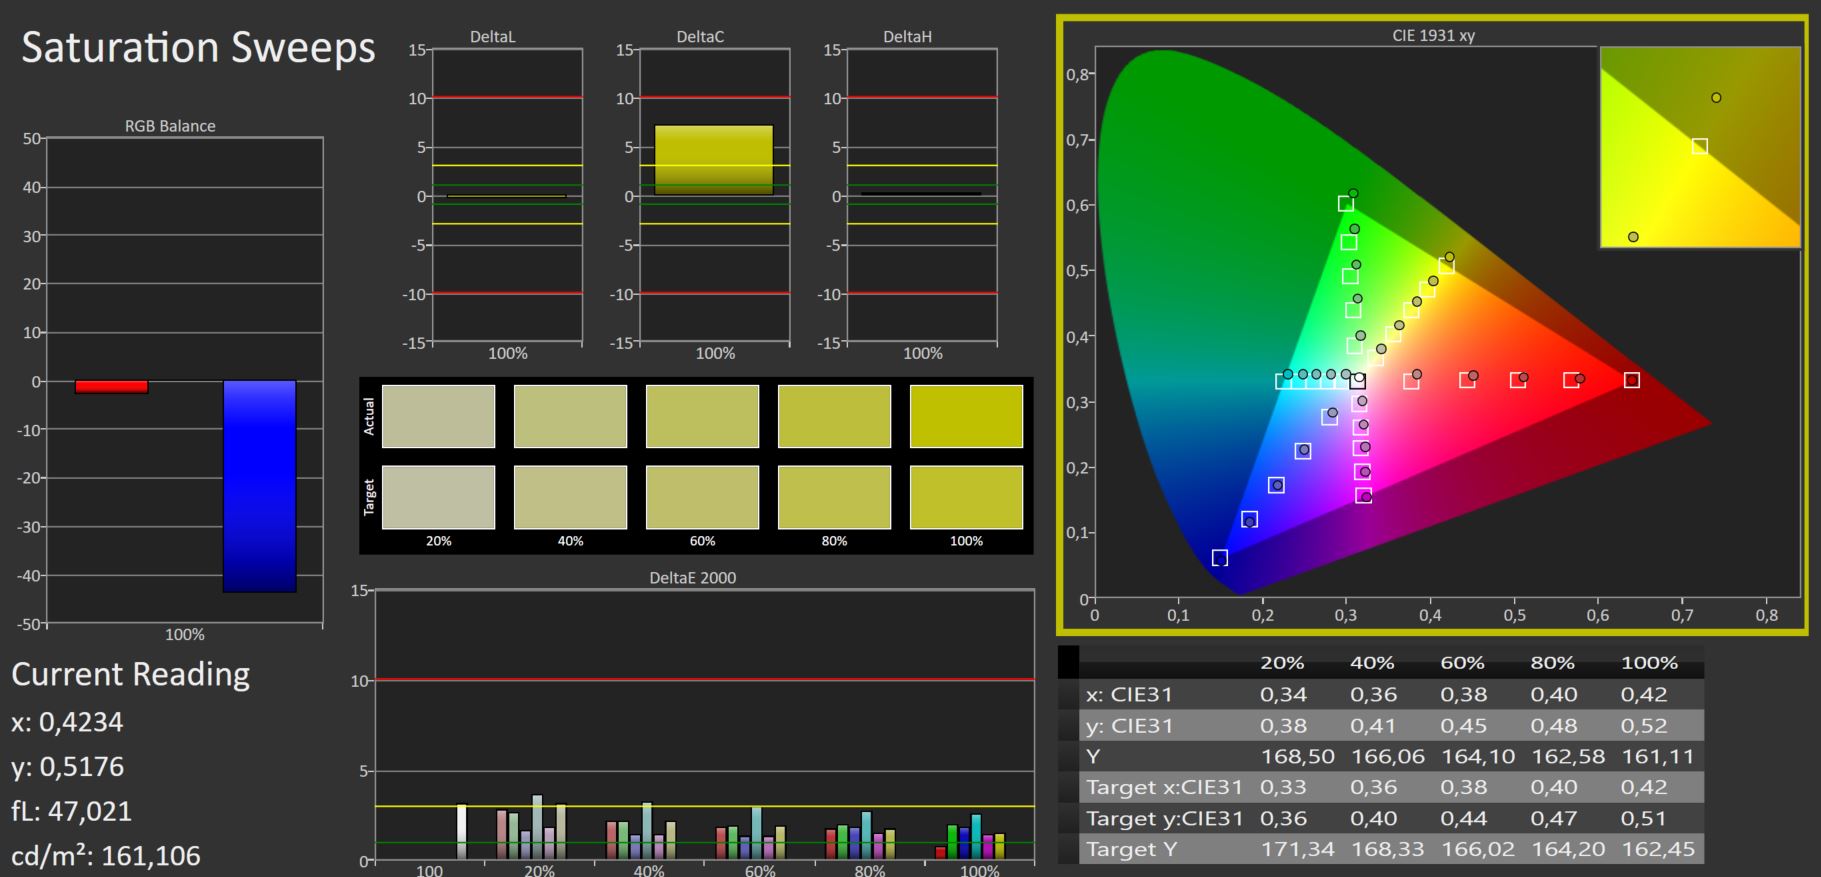
ΔE ColorChecker Calman: 2.31 | ∀{0.5-29.43 Ø4.72}
ΔE Greyscale Calman: 3.28 | ∀{0.09-98 Ø4.97}
70.4% AdobeRGB 1998 (Argyll 3D)
97.7% sRGB (Argyll 3D)
68.9% Display P3 (Argyll 3D)
Gamma: 2.47
CCT: 6206 K
| Schenker XMG Neo 15 (Ryzen 9 6900HX, RTX 3070 Ti) BOE0A67, IPS, 2560x1440, 15.6" | Schenker XMG Neo 15 (i7-12700H, RTX 3080 Ti) BOE0A67, IPS, 2560x1440, 15.6" | MSI GE67 HX 12UGS Samsung ATNA562P02-0, OLED, 1920x1080, 15.6" | Asus ROG Strix Scar 15 G533ZW-LN106WS BOE CQ NE156QHM-NZ2, IPS-level, 2560x1440, 15.6" | Acer Nitro 5 AN515-58-72QR Chi Mei N156KME-GNA, IPS, 2560x1440, 15.6" | MSI Stealth GS66 12UGS Sharp LQ156T1JW04 (SHP153C), IPS-Level, 2560x1440, 15.6" | |
|---|---|---|---|---|---|---|
| Display | -1% | 1% | 21% | 21% | 21% | |
| Display P3 Coverage (%) | 68.9 | 68.2 -1% | 71.7 4% | 96.2 40% | 95.6 39% | 96.4 40% |
| sRGB Coverage (%) | 97.7 | 97.2 -1% | 89.7 -8% | 99.9 2% | 99.8 2% | 99.7 2% |
| AdobeRGB 1998 Coverage (%) | 70.4 | 69.4 -1% | 75.2 7% | 84.5 20% | 85.2 21% | 85.6 22% |
| Response Times | 0% | 97% | 39% | -22% | 29% | |
| Response Time Grey 50% / Grey 80% * (ms) | 12.4 ? | 12.4 ? -0% | 0.25 ? 98% | 7.86 ? 37% 4.21 ? 66% | 15.7 ? -27% | 6 ? 52% |
| Response Time Black / White * (ms) | 8.8 ? | 8.8 ? -0% | 0.4 ? 95% | 7.5 ? 15% | 10.2 ? -16% | 8.4 ? 5% |
| PWM Frequency (Hz) | 480.4 ? | |||||
| Screen | 15% | -30% | -35% | -30% | -43% | |
| Brightness middle (cd/m²) | 370 | 365 -1% | 356.1 -4% | 346 -6% | 332 -10% | 272 -26% |
| Brightness (cd/m²) | 343 | 335 -2% | 358 4% | 329 -4% | 303 -12% | 253 -26% |
| Brightness Distribution (%) | 82 | 81 -1% | 99 21% | 91 11% | 86 5% | 87 6% |
| Black Level * (cd/m²) | 0.28 | 0.32 -14% | 0.59 -111% | 0.29 -4% | 0.25 11% | |
| Contrast (:1) | 1321 | 1141 -14% | 586 -56% | 1145 -13% | 1088 -18% | |
| Colorchecker dE 2000 * | 2.31 | 1.38 40% | 4.83 -109% | 3.06 -32% | 3.61 -56% | 3.73 -61% |
| Colorchecker dE 2000 max. * | 4.03 | 2.01 50% | 7.94 -97% | 5.81 -44% | 7.71 -91% | 9.43 -134% |
| Greyscale dE 2000 * | 3.28 | 1.36 59% | 3.1 5% | 5.2 -59% | 6.5 -98% | |
| Gamma | 2.47 89% | 2.48 89% | 2.2 100% | 2.12 104% | 2.155 102% | 2.172 101% |
| CCT | 6206 105% | 6412 101% | 5938 109% | 7021 93% | 6724 97% | 6485 100% |
| Colorchecker dE 2000 calibrated * | 1.22 | 2.57 | 0.59 | 0.98 | ||
| Moyenne finale (programmes/paramètres) | 5% /
9% | 23% /
1% | 8% /
-5% | -10% /
-17% | 2% /
-17% |
* ... Moindre est la valeur, meilleures sont les performances
L'écran ne convient pas vraiment à l'édition professionnelle de photos et de vidéos. Bien que l'écran ait une couverture sRGB complète, il ne parvient à couvrir qu'environ 70 % de l'espace couleur AdobeRGB et DisplayP3.
L'écran est déjà assez bien calibré dès sa sortie de la boîte. Bien que les valeurs Delta E ne soient pas particulièrement basses, il n'y a pas eu d'amélioration même après avoir calibré manuellement l'écran nous-mêmes.
Temps de réponse de l'écran
| ↔ Temps de réponse noir à blanc | ||
|---|---|---|
| 8.8 ms ... hausse ↗ et chute ↘ combinées | ↗ 4.6 ms hausse | 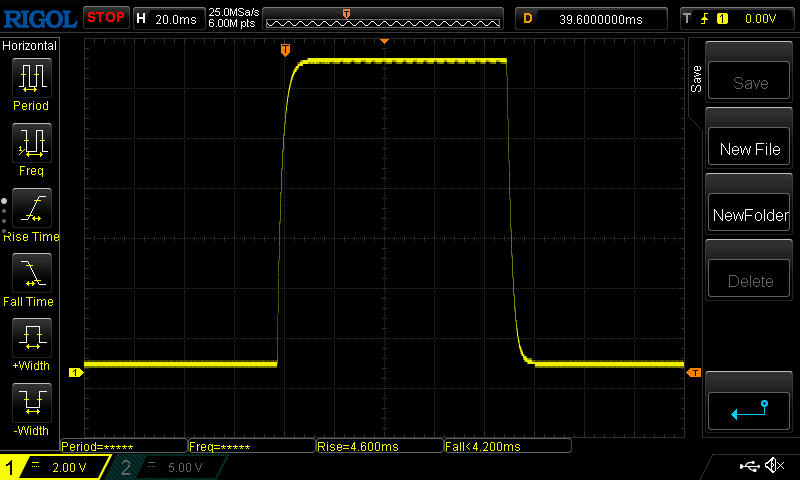 |
| ↘ 4.2 ms chute | ||
| L'écran montre de faibles temps de réponse, un bon écran pour jouer. En comparaison, tous les appareils testés affichent entre 0.1 (minimum) et 240 (maximum) ms. » 24 % des appareils testés affichent de meilleures performances. Cela signifie que les latences relevées sont meilleures que la moyenne (19.8 ms) de tous les appareils testés. | ||
| ↔ Temps de réponse gris 50% à gris 80% | ||
| 12.4 ms ... hausse ↗ et chute ↘ combinées | ↗ 5.8 ms hausse | 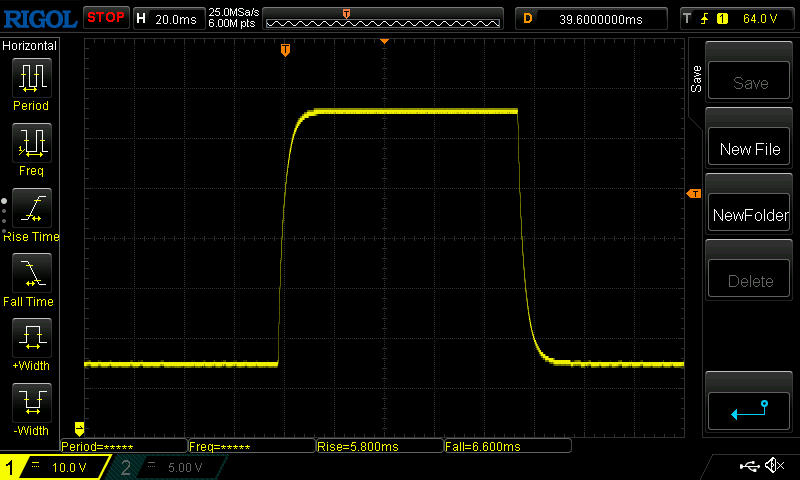 |
| ↘ 6.6 ms chute | ||
| L'écran montre de bons temps de réponse, mais insuffisant pour du jeu compétitif. En comparaison, tous les appareils testés affichent entre 0.165 (minimum) et 636 (maximum) ms. » 26 % des appareils testés affichent de meilleures performances. Cela signifie que les latences relevées sont meilleures que la moyenne (31 ms) de tous les appareils testés. | ||
Scintillement / MLI (Modulation de largeur d'impulsion)
| Scintillement / MLI (Modulation de largeur d'impulsion) non décelé | 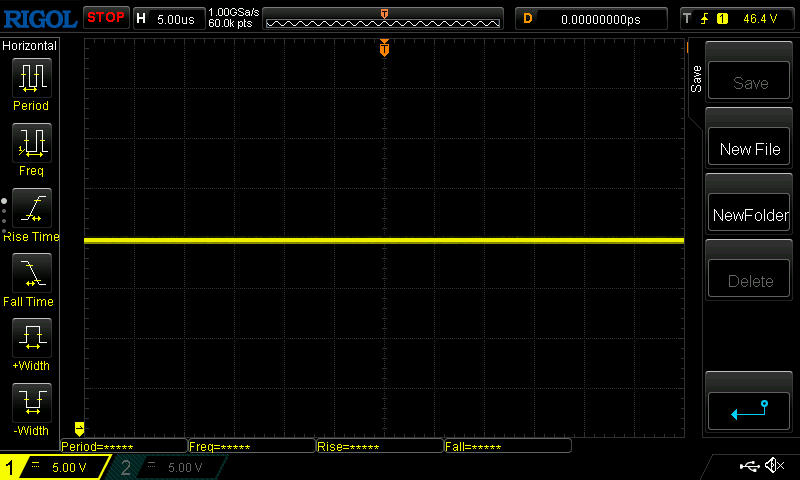 | ||
En comparaison, 52 % des appareils testés n'emploient pas MDI pour assombrir leur écran. Nous avons relevé une moyenne à 7781 (minimum : 5 - maximum : 343500) Hz dans le cas où une MDI était active. | |||
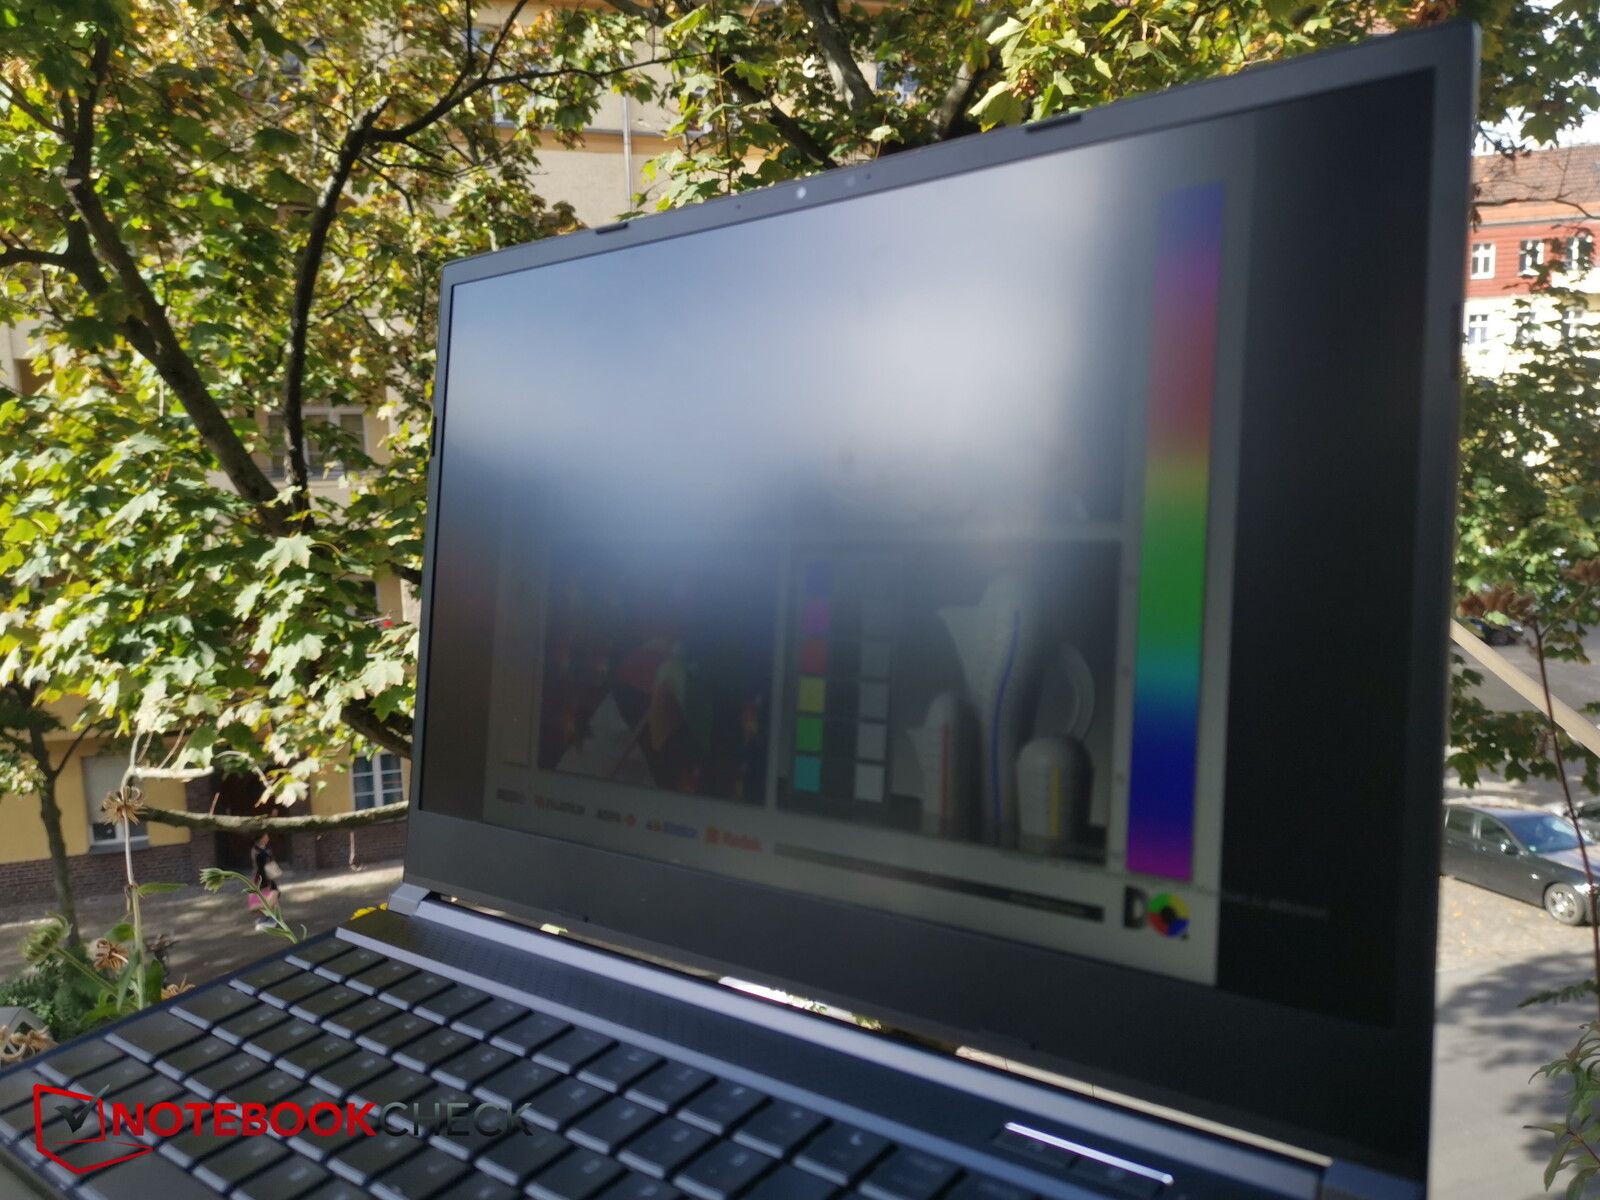
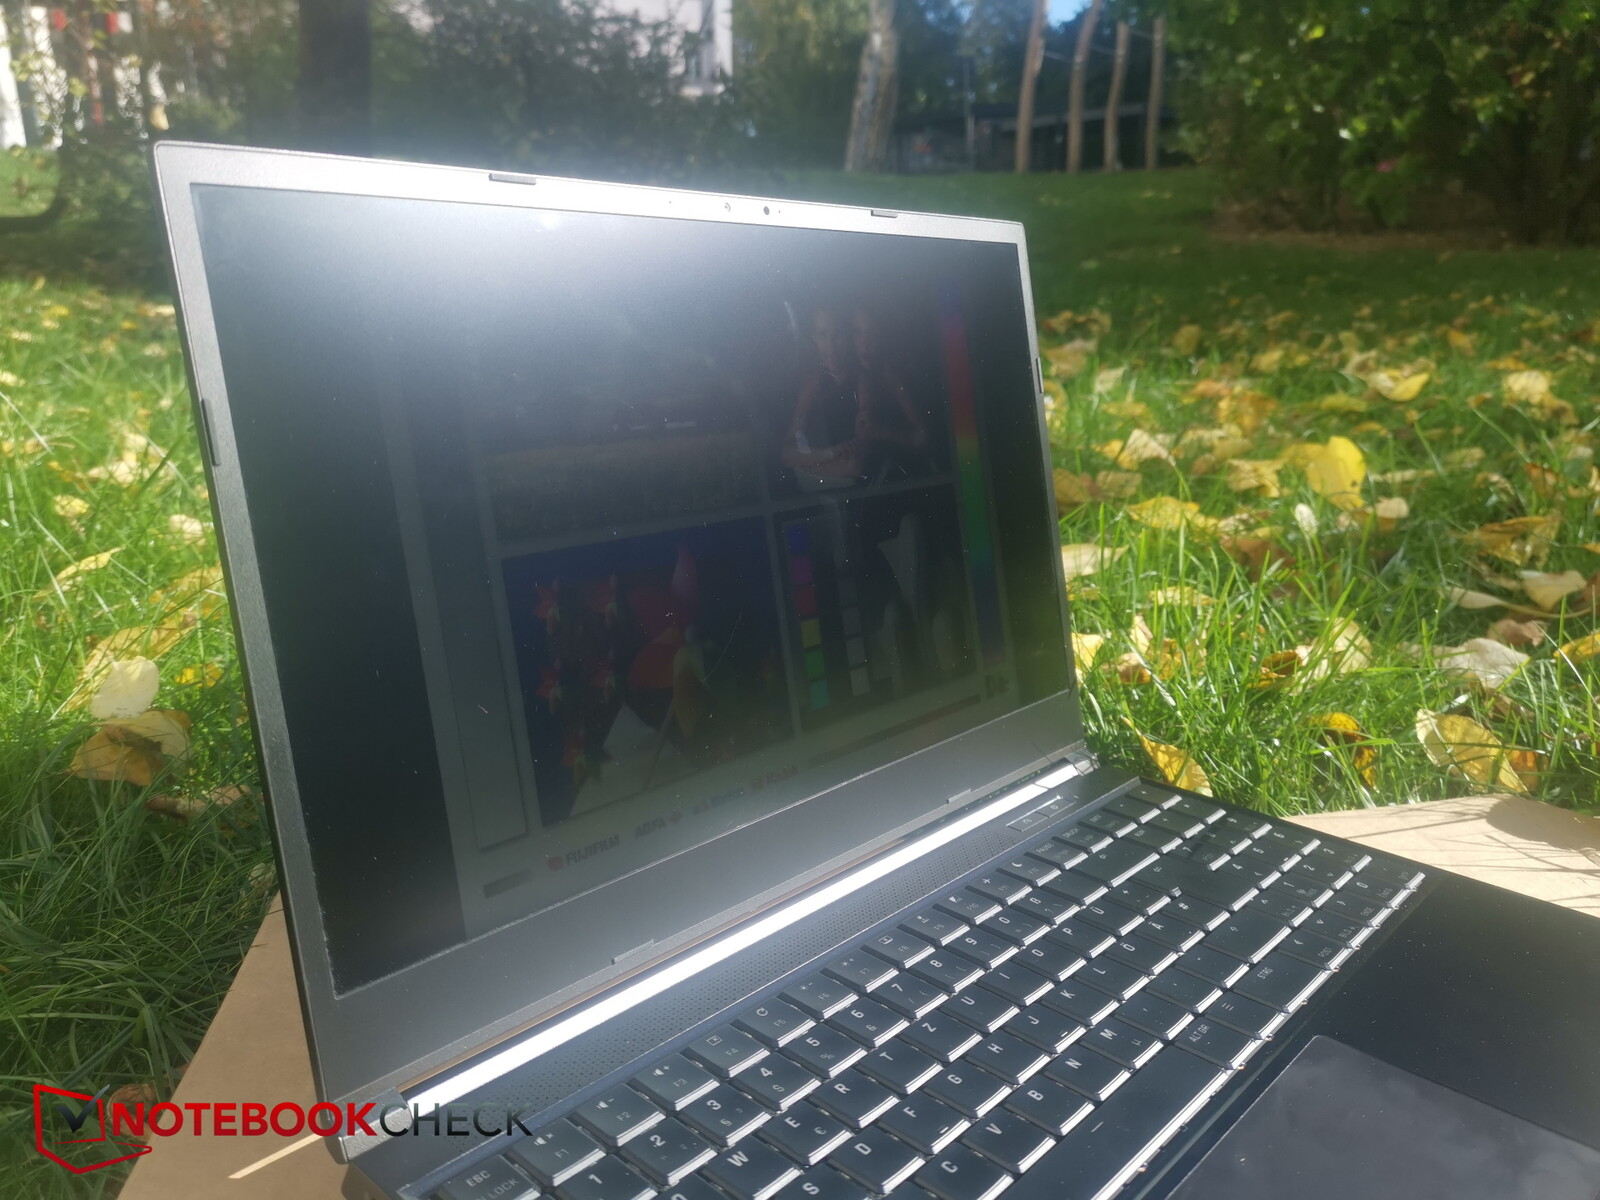
Lorsque vous utilisez l'appareil à l'extérieur, recherchez un endroit ombragé et veillez à regarder l'écran de face. En effet, le contenu de l'écran est très difficile à lire lorsqu'il est vu de biais ou en plein soleil.


Performances - AMD et Intel presque au même niveau
Vous trouverez de nombreuses façons différentes de configurer le Neo 15 M22 sur le site Web de Bestware. Mais il est toujours livré avec le même panneau et le même processeur AMD. Ceux qui veulent plutôt un processeur Intel peuvent se tourner vers le Neo 15 E22.
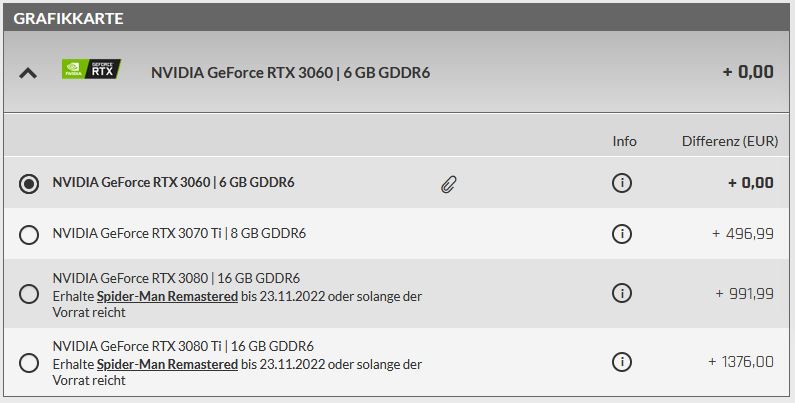
Le site RTX 3070 Ti dans notre unité de test ajoute environ 497 euros (494 $ US) au prix d'achat par rapport à l'option GPU la plus bas de gamme (RTX 3060). Il vous faudra débourser 1 376 euros (1 368 $ US) pour passer d'un RTX 3060 à un RTX 3080 Ti RTX 3080 Ti.
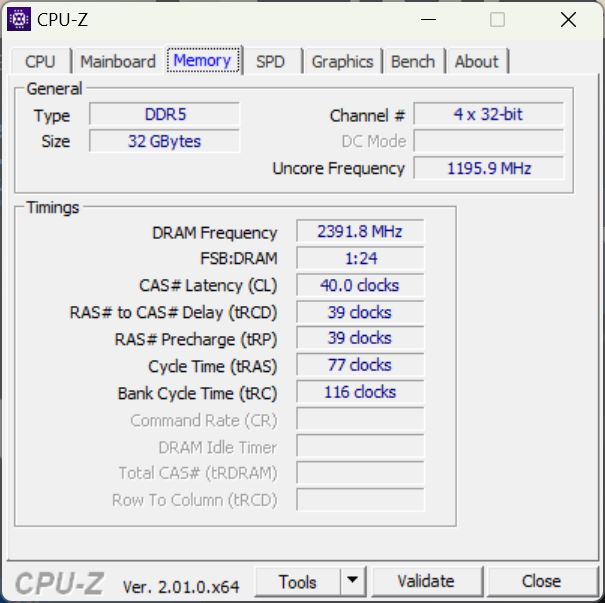
De nombreux autres composants, tels que le SSD, la RAM DDR5 et le module Wi-Fi, peuvent également être mis à niveau.
Conditions d'essai
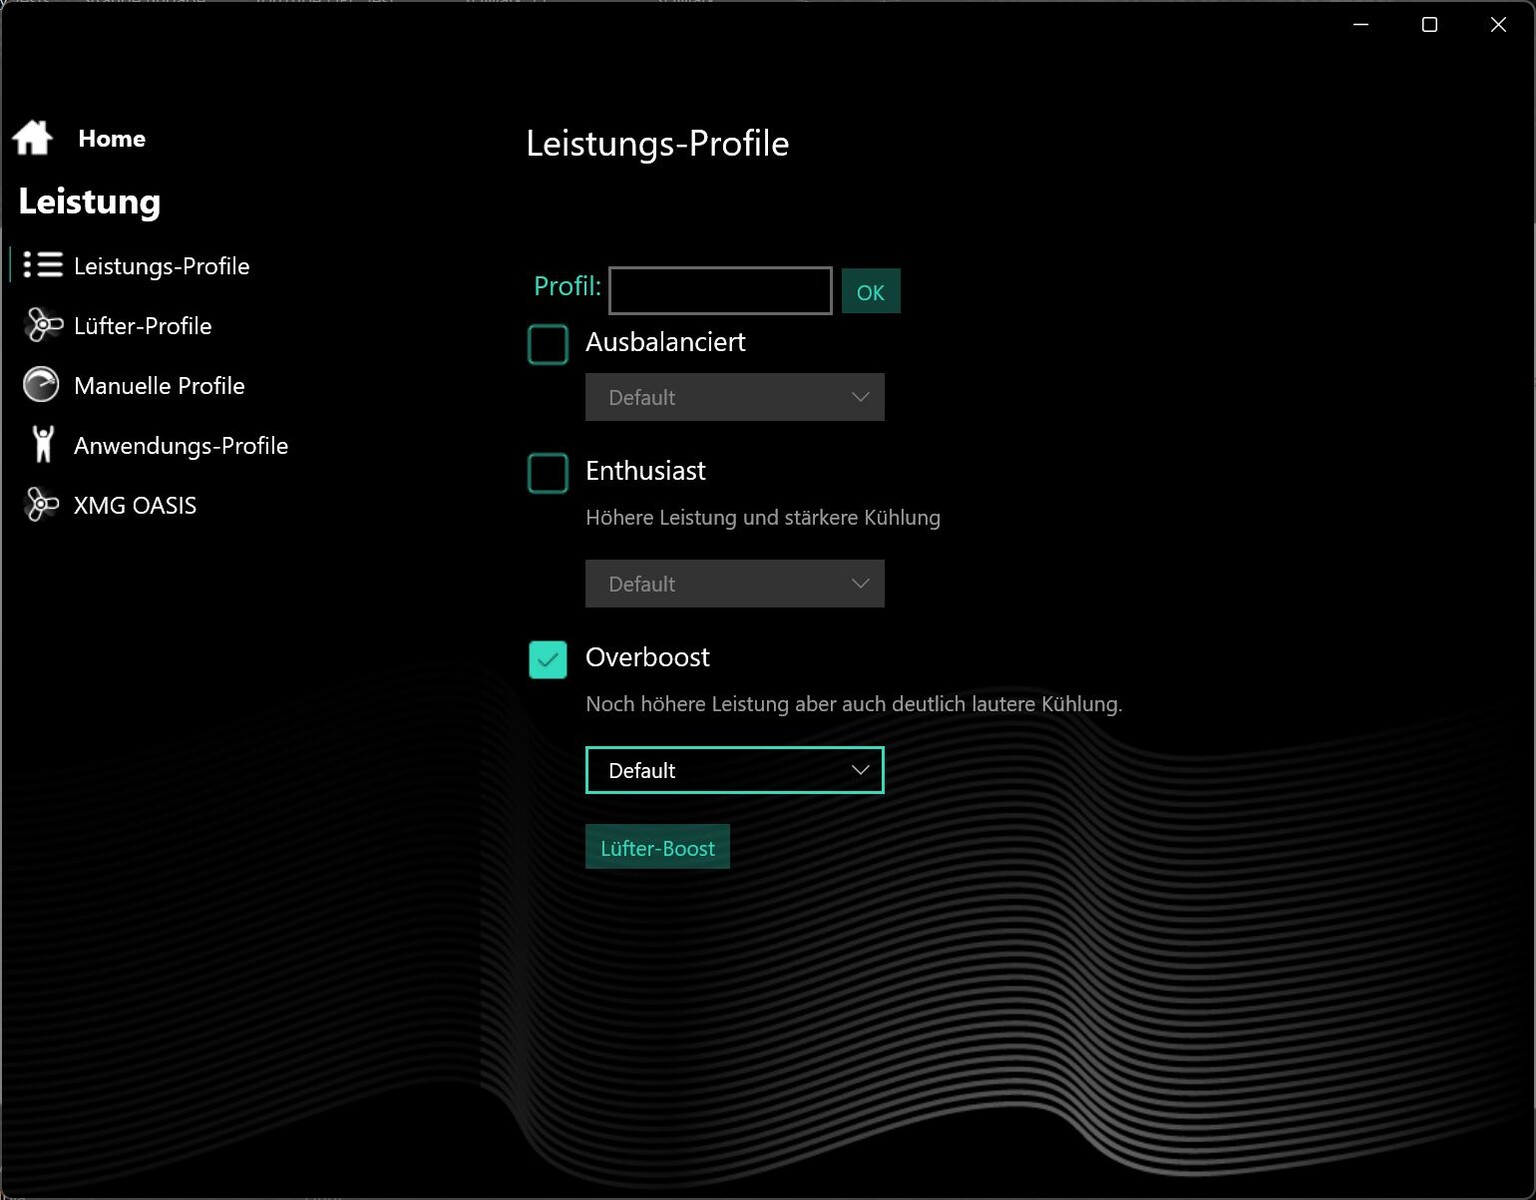
Le logiciel Control Center propose quelques profils de performance (Balanced, Enthusiast et Overboost). Nous avons sélectionné le mode le plus puissant (Overboost) pour obtenir les meilleurs résultats de référence, bien que Schenker recommande l'option intermédiaire, qui est conçue pour être le meilleur compromis entre les performances et les niveaux de bruit.
En outre, le logiciel permet aux utilisateurs de régler manuellement divers paramètres (par exemple Dynamic Boost) ainsi que les valeurs de compensation. Nous souhaiterions néanmoins qu'un mode silencieux soit ajouté aux options.
Processeur

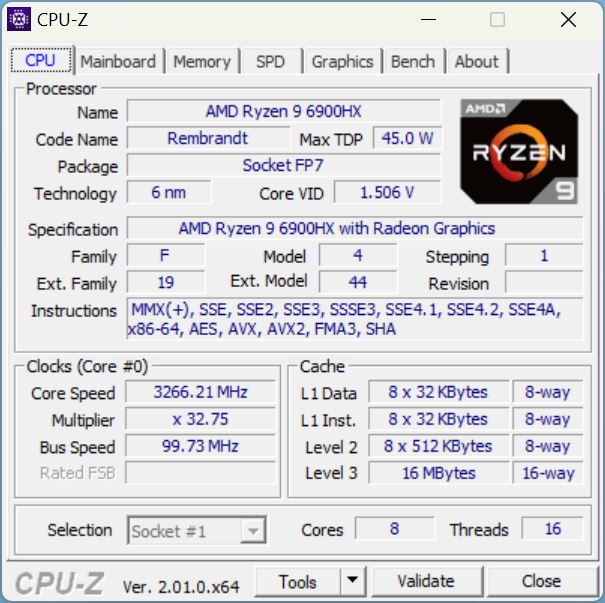
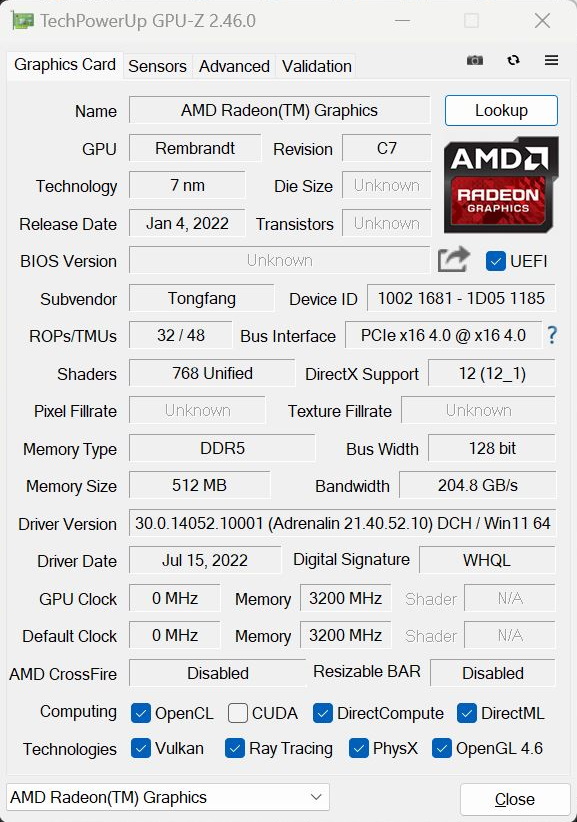
Contrairement au Neo 15 E22, qui dispose d'un processeur Core i7-12700Hle Neo M22 est équipé d'un processeur AMD Ryzen 9 6900HX. Le processeur Zen 3+ possède huit cœurs qui peuvent fonctionner jusqu'à 4,9 GHz et exécuter 16 threads simultanément. Le processeur abrite également une Radeon 680M intégré.
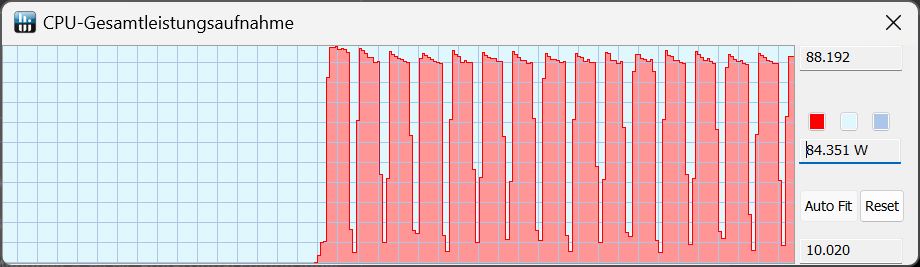
Lors de l'exécution continue de Cinebench en boucle, le CPU Ryzen a fourni ses performances habituelles et constantes, sans aucune baisse après les premières exécutions. Cependant, le Core i7-12700H du Neo 15 basé sur Intel est légèrement plus rapide. Et c'est naturellement aussi vrai pour le Core i9-12900H du ROG Strix ou même du Core i7-12800HX dans le MSI GE67.
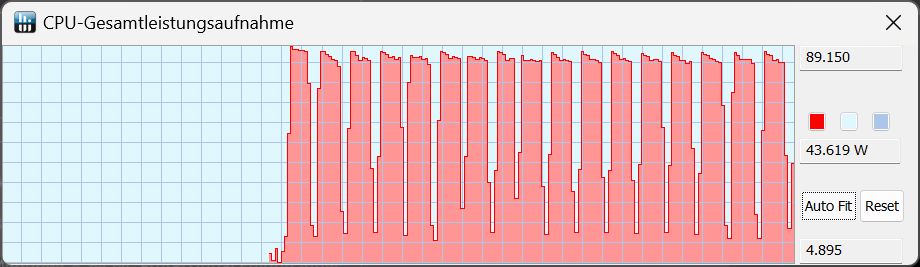
Le TDP est toujours resté inférieur à 90 watts. En mode Enthusiast, la consommation d'énergie a légèrement diminué pour atteindre environ 85 watts.
En revanche, les performances ont baissé lorsque l'ordinateur portable était alimenté par la batterie, le TDP étant réduit à "seulement" 50 watts.
Cinebench R15 Multi Sustained Load
Cinebench R23: Multi Core | Single Core
Cinebench R20: CPU (Multi Core) | CPU (Single Core)
Cinebench R15: CPU Multi 64Bit | CPU Single 64Bit
Blender: v2.79 BMW27 CPU
7-Zip 18.03: 7z b 4 | 7z b 4 -mmt1
Geekbench 5.5: Multi-Core | Single-Core
HWBOT x265 Benchmark v2.2: 4k Preset
LibreOffice : 20 Documents To PDF
R Benchmark 2.5: Overall mean
| CPU Performance rating | |
| Moyenne de la classe Gaming | |
| MSI GE67 HX 12UGS | |
| Asus ROG Strix Scar 15 G533ZW-LN106WS | |
| Schenker XMG Neo 15 (i7-12700H, RTX 3080 Ti) | |
| MSI Stealth GS66 12UGS | |
| Acer Nitro 5 AN515-58-72QR | |
| Schenker XMG Neo 15 (Ryzen 9 6900HX, RTX 3070 Ti) | |
| Moyenne AMD Ryzen 9 6900HX | |
| Cinebench R23 / Multi Core | |
| Moyenne de la classe Gaming (10488 - 40970, n=110, 2 dernières années) | |
| MSI GE67 HX 12UGS | |
| Asus ROG Strix Scar 15 G533ZW-LN106WS | |
| MSI Stealth GS66 12UGS | |
| Schenker XMG Neo 15 (i7-12700H, RTX 3080 Ti) | |
| Acer Nitro 5 AN515-58-72QR | |
| Schenker XMG Neo 15 (Ryzen 9 6900HX, RTX 3070 Ti) | |
| Moyenne AMD Ryzen 9 6900HX (9709 - 15100, n=19) | |
| Cinebench R23 / Single Core | |
| Moyenne de la classe Gaming (1166 - 2356, n=110, 2 dernières années) | |
| Asus ROG Strix Scar 15 G533ZW-LN106WS | |
| Acer Nitro 5 AN515-58-72QR | |
| MSI GE67 HX 12UGS | |
| Schenker XMG Neo 15 (i7-12700H, RTX 3080 Ti) | |
| MSI Stealth GS66 12UGS | |
| Schenker XMG Neo 15 (Ryzen 9 6900HX, RTX 3070 Ti) | |
| Moyenne AMD Ryzen 9 6900HX (1516 - 1616, n=19) | |
| Cinebench R20 / CPU (Multi Core) | |
| Moyenne de la classe Gaming (4029 - 16108, n=109, 2 dernières années) | |
| MSI GE67 HX 12UGS | |
| Asus ROG Strix Scar 15 G533ZW-LN106WS | |
| Schenker XMG Neo 15 (i7-12700H, RTX 3080 Ti) | |
| MSI Stealth GS66 12UGS | |
| Acer Nitro 5 AN515-58-72QR | |
| Schenker XMG Neo 15 (Ryzen 9 6900HX, RTX 3070 Ti) | |
| Moyenne AMD Ryzen 9 6900HX (3742 - 5813, n=19) | |
| Cinebench R20 / CPU (Single Core) | |
| Moyenne de la classe Gaming (442 - 895, n=109, 2 dernières années) | |
| Asus ROG Strix Scar 15 G533ZW-LN106WS | |
| Acer Nitro 5 AN515-58-72QR | |
| MSI Stealth GS66 12UGS | |
| Schenker XMG Neo 15 (i7-12700H, RTX 3080 Ti) | |
| MSI GE67 HX 12UGS | |
| Schenker XMG Neo 15 (Ryzen 9 6900HX, RTX 3070 Ti) | |
| Moyenne AMD Ryzen 9 6900HX (595 - 631, n=19) | |
| Cinebench R15 / CPU Multi 64Bit | |
| Moyenne de la classe Gaming (1578 - 6271, n=109, 2 dernières années) | |
| MSI GE67 HX 12UGS | |
| Asus ROG Strix Scar 15 G533ZW-LN106WS | |
| MSI Stealth GS66 12UGS | |
| Acer Nitro 5 AN515-58-72QR | |
| Schenker XMG Neo 15 (i7-12700H, RTX 3080 Ti) | |
| Schenker XMG Neo 15 (Ryzen 9 6900HX, RTX 3070 Ti) | |
| Moyenne AMD Ryzen 9 6900HX (1588 - 2411, n=19) | |
| Cinebench R15 / CPU Single 64Bit | |
| Moyenne de la classe Gaming (188.8 - 343, n=109, 2 dernières années) | |
| Asus ROG Strix Scar 15 G533ZW-LN106WS | |
| Acer Nitro 5 AN515-58-72QR | |
| Schenker XMG Neo 15 (i7-12700H, RTX 3080 Ti) | |
| MSI Stealth GS66 12UGS | |
| MSI GE67 HX 12UGS | |
| Schenker XMG Neo 15 (Ryzen 9 6900HX, RTX 3070 Ti) | |
| Moyenne AMD Ryzen 9 6900HX (241 - 261, n=19) | |
| Blender / v2.79 BMW27 CPU | |
| Moyenne AMD Ryzen 9 6900HX (212 - 357, n=21) | |
| Schenker XMG Neo 15 (Ryzen 9 6900HX, RTX 3070 Ti) | |
| Acer Nitro 5 AN515-58-72QR | |
| MSI Stealth GS66 12UGS | |
| Schenker XMG Neo 15 (i7-12700H, RTX 3080 Ti) | |
| Asus ROG Strix Scar 15 G533ZW-LN106WS | |
| MSI GE67 HX 12UGS | |
| Moyenne de la classe Gaming (80 - 330, n=107, 2 dernières années) | |
| 7-Zip 18.03 / 7z b 4 | |
| Moyenne de la classe Gaming (33491 - 148086, n=108, 2 dernières années) | |
| MSI GE67 HX 12UGS | |
| Schenker XMG Neo 15 (i7-12700H, RTX 3080 Ti) | |
| MSI Stealth GS66 12UGS | |
| Asus ROG Strix Scar 15 G533ZW-LN106WS | |
| Schenker XMG Neo 15 (Ryzen 9 6900HX, RTX 3070 Ti) | |
| Moyenne AMD Ryzen 9 6900HX (49526 - 65336, n=20) | |
| Acer Nitro 5 AN515-58-72QR | |
| 7-Zip 18.03 / 7z b 4 -mmt1 | |
| Moyenne de la classe Gaming (4199 - 7436, n=108, 2 dernières années) | |
| Asus ROG Strix Scar 15 G533ZW-LN106WS | |
| Schenker XMG Neo 15 (i7-12700H, RTX 3080 Ti) | |
| Schenker XMG Neo 15 (Ryzen 9 6900HX, RTX 3070 Ti) | |
| Acer Nitro 5 AN515-58-72QR | |
| MSI Stealth GS66 12UGS | |
| Moyenne AMD Ryzen 9 6900HX (5090 - 6070, n=20) | |
| MSI GE67 HX 12UGS | |
| Geekbench 5.5 / Multi-Core | |
| Moyenne de la classe Gaming (6460 - 27010, n=108, 2 dernières années) | |
| MSI GE67 HX 12UGS | |
| Asus ROG Strix Scar 15 G533ZW-LN106WS | |
| Schenker XMG Neo 15 (i7-12700H, RTX 3080 Ti) | |
| MSI Stealth GS66 12UGS | |
| Schenker XMG Neo 15 (Ryzen 9 6900HX, RTX 3070 Ti) | |
| Acer Nitro 5 AN515-58-72QR | |
| Moyenne AMD Ryzen 9 6900HX (8313 - 10490, n=21) | |
| Geekbench 5.5 / Single-Core | |
| Moyenne de la classe Gaming (986 - 2474, n=108, 2 dernières années) | |
| Asus ROG Strix Scar 15 G533ZW-LN106WS | |
| Acer Nitro 5 AN515-58-72QR | |
| MSI GE67 HX 12UGS | |
| Schenker XMG Neo 15 (i7-12700H, RTX 3080 Ti) | |
| MSI Stealth GS66 12UGS | |
| Schenker XMG Neo 15 (Ryzen 9 6900HX, RTX 3070 Ti) | |
| Moyenne AMD Ryzen 9 6900HX (1523 - 1652, n=21) | |
| HWBOT x265 Benchmark v2.2 / 4k Preset | |
| Moyenne de la classe Gaming (11.5 - 44.3, n=108, 2 dernières années) | |
| MSI GE67 HX 12UGS | |
| Asus ROG Strix Scar 15 G533ZW-LN106WS | |
| Schenker XMG Neo 15 (i7-12700H, RTX 3080 Ti) | |
| MSI Stealth GS66 12UGS | |
| Acer Nitro 5 AN515-58-72QR | |
| Schenker XMG Neo 15 (Ryzen 9 6900HX, RTX 3070 Ti) | |
| Moyenne AMD Ryzen 9 6900HX (12.6 - 18.7, n=20) | |
| LibreOffice / 20 Documents To PDF | |
| Schenker XMG Neo 15 (Ryzen 9 6900HX, RTX 3070 Ti) | |
| Moyenne AMD Ryzen 9 6900HX (44.8 - 81.7, n=20) | |
| Moyenne de la classe Gaming (19 - 88.8, n=108, 2 dernières années) | |
| Schenker XMG Neo 15 (i7-12700H, RTX 3080 Ti) | |
| MSI GE67 HX 12UGS | |
| Acer Nitro 5 AN515-58-72QR | |
| MSI Stealth GS66 12UGS | |
| Asus ROG Strix Scar 15 G533ZW-LN106WS | |
| R Benchmark 2.5 / Overall mean | |
| Schenker XMG Neo 15 (Ryzen 9 6900HX, RTX 3070 Ti) | |
| Moyenne AMD Ryzen 9 6900HX (0.4627 - 0.4974, n=20) | |
| MSI GE67 HX 12UGS | |
| Schenker XMG Neo 15 (i7-12700H, RTX 3080 Ti) | |
| Acer Nitro 5 AN515-58-72QR | |
| MSI Stealth GS66 12UGS | |
| Asus ROG Strix Scar 15 G533ZW-LN106WS | |
| Moyenne de la classe Gaming (0.3439 - 0.759, n=109, 2 dernières années) | |
* ... Moindre est la valeur, meilleures sont les performances
AIDA64: FP32 Ray-Trace | FPU Julia | CPU SHA3 | CPU Queen | FPU SinJulia | FPU Mandel | CPU AES | CPU ZLib | FP64 Ray-Trace | CPU PhotoWorxx
| Performance rating | |
| Moyenne de la classe Gaming | |
| Moyenne AMD Ryzen 9 6900HX | |
| Schenker XMG Neo 15 (Ryzen 9 6900HX, RTX 3070 Ti) | |
| MSI GE67 HX 12UGS | |
| Asus ROG Strix Scar 15 G533ZW-LN106WS | |
| MSI Stealth GS66 12UGS | |
| Schenker XMG Neo 15 (i7-12700H, RTX 3080 Ti) | |
| Acer Nitro 5 AN515-58-72QR | |
| AIDA64 / FP32 Ray-Trace | |
| Moyenne de la classe Gaming (10227 - 85542, n=107, 2 dernières années) | |
| Schenker XMG Neo 15 (Ryzen 9 6900HX, RTX 3070 Ti) | |
| Moyenne AMD Ryzen 9 6900HX (10950 - 17963, n=20) | |
| MSI GE67 HX 12UGS | |
| Asus ROG Strix Scar 15 G533ZW-LN106WS | |
| Schenker XMG Neo 15 (i7-12700H, RTX 3080 Ti) | |
| MSI Stealth GS66 12UGS | |
| Acer Nitro 5 AN515-58-72QR | |
| AIDA64 / FPU Julia | |
| Moyenne de la classe Gaming (51376 - 238426, n=107, 2 dernières années) | |
| Schenker XMG Neo 15 (Ryzen 9 6900HX, RTX 3070 Ti) | |
| Moyenne AMD Ryzen 9 6900HX (71414 - 110797, n=20) | |
| MSI GE67 HX 12UGS | |
| Asus ROG Strix Scar 15 G533ZW-LN106WS | |
| Schenker XMG Neo 15 (i7-12700H, RTX 3080 Ti) | |
| MSI Stealth GS66 12UGS | |
| Acer Nitro 5 AN515-58-72QR | |
| AIDA64 / CPU SHA3 | |
| Moyenne de la classe Gaming (2180 - 9817, n=107, 2 dernières années) | |
| MSI GE67 HX 12UGS | |
| Schenker XMG Neo 15 (Ryzen 9 6900HX, RTX 3070 Ti) | |
| Asus ROG Strix Scar 15 G533ZW-LN106WS | |
| Moyenne AMD Ryzen 9 6900HX (2471 - 3804, n=20) | |
| Schenker XMG Neo 15 (i7-12700H, RTX 3080 Ti) | |
| MSI Stealth GS66 12UGS | |
| Acer Nitro 5 AN515-58-72QR | |
| AIDA64 / CPU Queen | |
| Moyenne de la classe Gaming (49785 - 173351, n=98, 2 dernières années) | |
| Schenker XMG Neo 15 (Ryzen 9 6900HX, RTX 3070 Ti) | |
| Asus ROG Strix Scar 15 G533ZW-LN106WS | |
| Moyenne AMD Ryzen 9 6900HX (84185 - 107544, n=20) | |
| Acer Nitro 5 AN515-58-72QR | |
| Schenker XMG Neo 15 (i7-12700H, RTX 3080 Ti) | |
| MSI Stealth GS66 12UGS | |
| MSI GE67 HX 12UGS | |
| AIDA64 / FPU SinJulia | |
| Moyenne de la classe Gaming (4424 - 33636, n=107, 2 dernières années) | |
| Schenker XMG Neo 15 (Ryzen 9 6900HX, RTX 3070 Ti) | |
| Moyenne AMD Ryzen 9 6900HX (10970 - 13205, n=20) | |
| MSI GE67 HX 12UGS | |
| Asus ROG Strix Scar 15 G533ZW-LN106WS | |
| Schenker XMG Neo 15 (i7-12700H, RTX 3080 Ti) | |
| Acer Nitro 5 AN515-58-72QR | |
| MSI Stealth GS66 12UGS | |
| AIDA64 / FPU Mandel | |
| Moyenne de la classe Gaming (25115 - 128721, n=107, 2 dernières années) | |
| Schenker XMG Neo 15 (Ryzen 9 6900HX, RTX 3070 Ti) | |
| Moyenne AMD Ryzen 9 6900HX (39164 - 61370, n=20) | |
| MSI GE67 HX 12UGS | |
| Asus ROG Strix Scar 15 G533ZW-LN106WS | |
| Schenker XMG Neo 15 (i7-12700H, RTX 3080 Ti) | |
| MSI Stealth GS66 12UGS | |
| Acer Nitro 5 AN515-58-72QR | |
| AIDA64 / CPU AES | |
| MSI GE67 HX 12UGS | |
| Moyenne AMD Ryzen 9 6900HX (54613 - 142360, n=20) | |
| Moyenne de la classe Gaming (39258 - 247074, n=107, 2 dernières années) | |
| Asus ROG Strix Scar 15 G533ZW-LN106WS | |
| MSI Stealth GS66 12UGS | |
| Schenker XMG Neo 15 (Ryzen 9 6900HX, RTX 3070 Ti) | |
| Schenker XMG Neo 15 (i7-12700H, RTX 3080 Ti) | |
| Acer Nitro 5 AN515-58-72QR | |
| AIDA64 / CPU ZLib | |
| Moyenne de la classe Gaming (574 - 2531, n=107, 2 dernières années) | |
| MSI GE67 HX 12UGS | |
| Asus ROG Strix Scar 15 G533ZW-LN106WS | |
| Schenker XMG Neo 15 (i7-12700H, RTX 3080 Ti) | |
| Acer Nitro 5 AN515-58-72QR | |
| MSI Stealth GS66 12UGS | |
| Moyenne AMD Ryzen 9 6900HX (578 - 911, n=20) | |
| Schenker XMG Neo 15 (Ryzen 9 6900HX, RTX 3070 Ti) | |
| AIDA64 / FP64 Ray-Trace | |
| Moyenne de la classe Gaming (5509 - 45446, n=107, 2 dernières années) | |
| Schenker XMG Neo 15 (Ryzen 9 6900HX, RTX 3070 Ti) | |
| Moyenne AMD Ryzen 9 6900HX (5798 - 9540, n=20) | |
| MSI GE67 HX 12UGS | |
| Asus ROG Strix Scar 15 G533ZW-LN106WS | |
| Schenker XMG Neo 15 (i7-12700H, RTX 3080 Ti) | |
| MSI Stealth GS66 12UGS | |
| Acer Nitro 5 AN515-58-72QR | |
| AIDA64 / CPU PhotoWorxx | |
| Moyenne de la classe Gaming (12271 - 89891, n=107, 2 dernières années) | |
| Schenker XMG Neo 15 (i7-12700H, RTX 3080 Ti) | |
| MSI Stealth GS66 12UGS | |
| Asus ROG Strix Scar 15 G533ZW-LN106WS | |
| MSI GE67 HX 12UGS | |
| Schenker XMG Neo 15 (Ryzen 9 6900HX, RTX 3070 Ti) | |
| Moyenne AMD Ryzen 9 6900HX (26873 - 30604, n=20) | |
| Acer Nitro 5 AN515-58-72QR | |
Performance du système
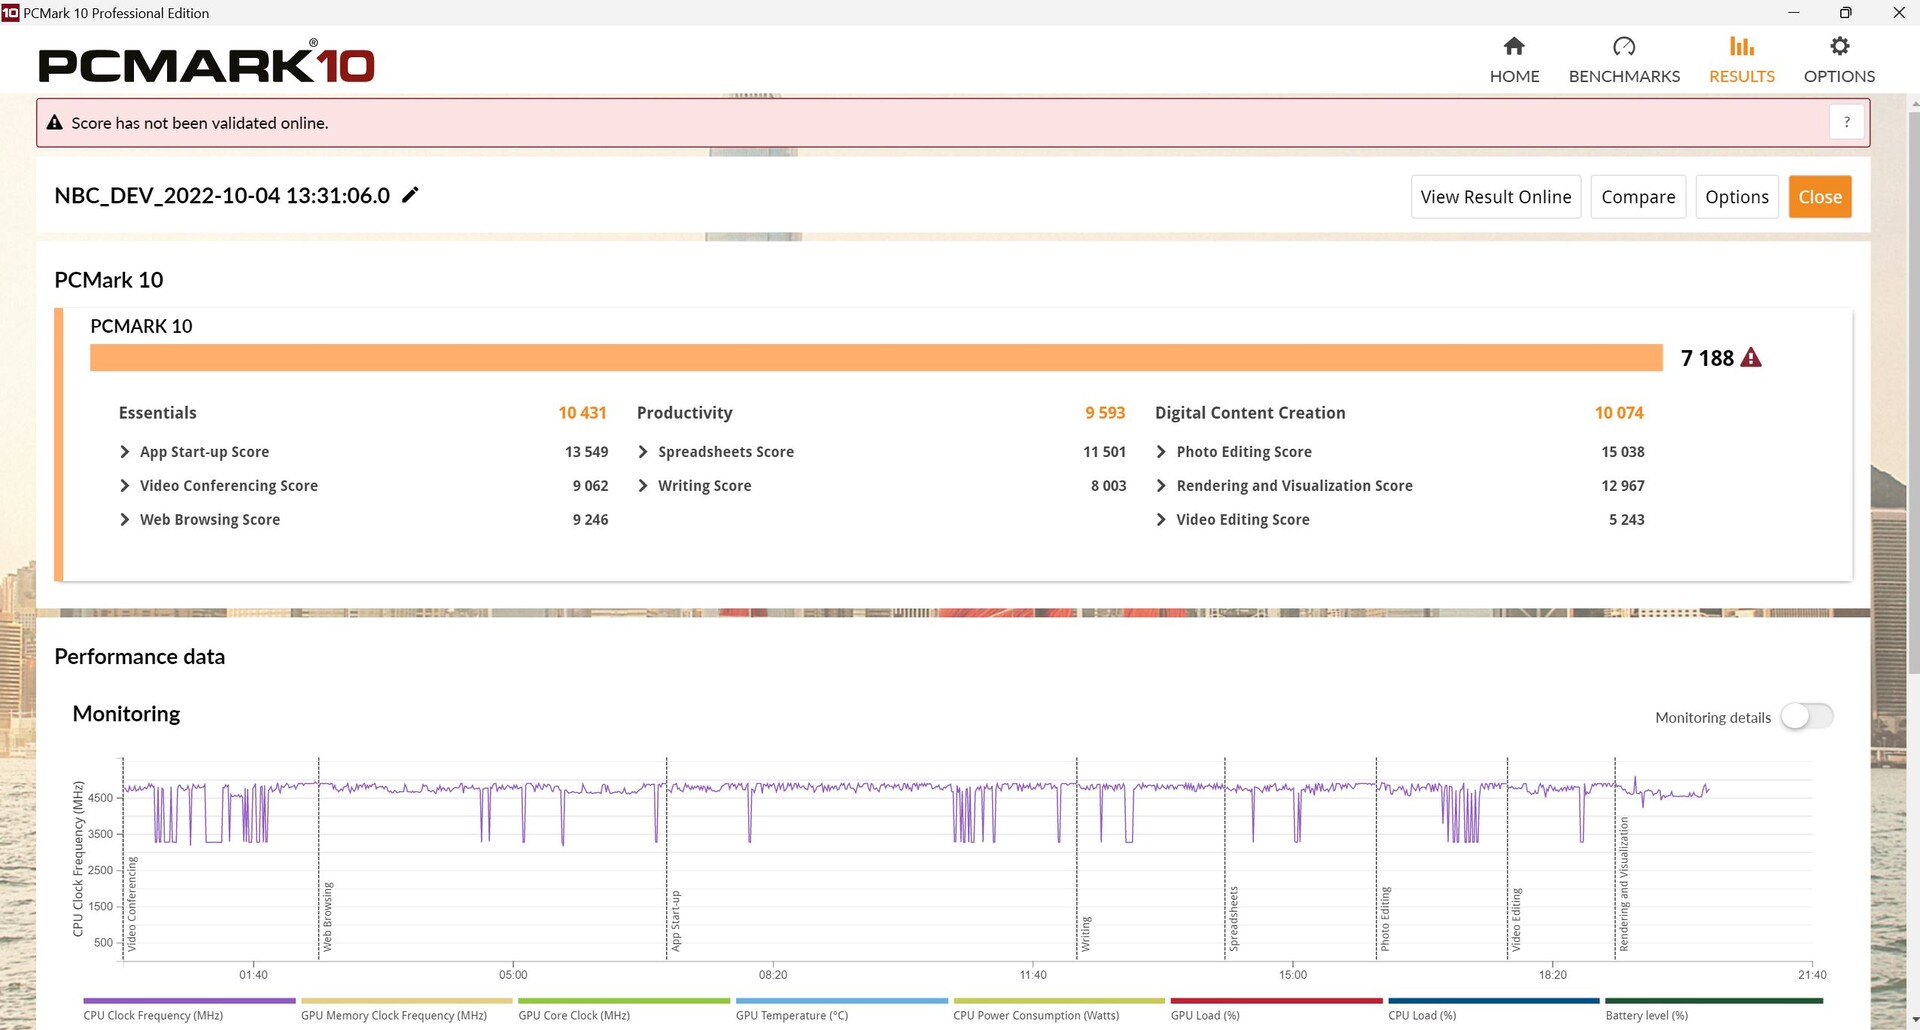
Dans PCMark 10, le Neo 15 a obtenu des résultats plus ou moins conformes à nos attentes. Cependant, à l'exception de l'Acer Nitro 5, tous les autres concurrents étaient plus rapides, en particulier le MSI Raider GE67 et Asus ROG Strix.
CrossMark: Overall | Productivity | Creativity | Responsiveness
| PCMark 10 / Score | |
| Moyenne de la classe Gaming (5828 - 11574, n=95, 2 dernières années) | |
| MSI GE67 HX 12UGS | |
| Asus ROG Strix Scar 15 G533ZW-LN106WS | |
| MSI Stealth GS66 12UGS | |
| Schenker XMG Neo 15 (i7-12700H, RTX 3080 Ti) | |
| Moyenne AMD Ryzen 9 6900HX, NVIDIA GeForce RTX 3070 Ti Laptop GPU (7161 - 7332, n=3) | |
| Schenker XMG Neo 15 (Ryzen 9 6900HX, RTX 3070 Ti) | |
| Acer Nitro 5 AN515-58-72QR | |
| PCMark 10 / Essentials | |
| MSI GE67 HX 12UGS | |
| MSI Stealth GS66 12UGS | |
| Asus ROG Strix Scar 15 G533ZW-LN106WS | |
| Moyenne AMD Ryzen 9 6900HX, NVIDIA GeForce RTX 3070 Ti Laptop GPU (10431 - 10934, n=3) | |
| Moyenne de la classe Gaming (8810 - 12600, n=99, 2 dernières années) | |
| Schenker XMG Neo 15 (i7-12700H, RTX 3080 Ti) | |
| Schenker XMG Neo 15 (Ryzen 9 6900HX, RTX 3070 Ti) | |
| Acer Nitro 5 AN515-58-72QR | |
| PCMark 10 / Productivity | |
| Moyenne de la classe Gaming (6845 - 18766, n=97, 2 dernières années) | |
| Asus ROG Strix Scar 15 G533ZW-LN106WS | |
| MSI GE67 HX 12UGS | |
| Schenker XMG Neo 15 (Ryzen 9 6900HX, RTX 3070 Ti) | |
| Moyenne AMD Ryzen 9 6900HX, NVIDIA GeForce RTX 3070 Ti Laptop GPU (9043 - 9960, n=3) | |
| MSI Stealth GS66 12UGS | |
| Schenker XMG Neo 15 (i7-12700H, RTX 3080 Ti) | |
| Acer Nitro 5 AN515-58-72QR | |
| PCMark 10 / Digital Content Creation | |
| Moyenne de la classe Gaming (7602 - 19657, n=97, 2 dernières années) | |
| MSI GE67 HX 12UGS | |
| Schenker XMG Neo 15 (i7-12700H, RTX 3080 Ti) | |
| Asus ROG Strix Scar 15 G533ZW-LN106WS | |
| MSI Stealth GS66 12UGS | |
| Acer Nitro 5 AN515-58-72QR | |
| Moyenne AMD Ryzen 9 6900HX, NVIDIA GeForce RTX 3070 Ti Laptop GPU (9351 - 10817, n=3) | |
| Schenker XMG Neo 15 (Ryzen 9 6900HX, RTX 3070 Ti) | |
| CrossMark / Overall | |
| Asus ROG Strix Scar 15 G533ZW-LN106WS | |
| Moyenne de la classe Gaming (1366 - 2409, n=96, 2 dernières années) | |
| MSI GE67 HX 12UGS | |
| Schenker XMG Neo 15 (i7-12700H, RTX 3080 Ti) | |
| Acer Nitro 5 AN515-58-72QR | |
| Moyenne AMD Ryzen 9 6900HX, NVIDIA GeForce RTX 3070 Ti Laptop GPU (1624 - 1743, n=2) | |
| Schenker XMG Neo 15 (Ryzen 9 6900HX, RTX 3070 Ti) | |
| CrossMark / Productivity | |
| Asus ROG Strix Scar 15 G533ZW-LN106WS | |
| MSI GE67 HX 12UGS | |
| Moyenne de la classe Gaming (1386 - 2254, n=96, 2 dernières années) | |
| Acer Nitro 5 AN515-58-72QR | |
| Schenker XMG Neo 15 (i7-12700H, RTX 3080 Ti) | |
| Moyenne AMD Ryzen 9 6900HX, NVIDIA GeForce RTX 3070 Ti Laptop GPU (1591 - 1722, n=2) | |
| Schenker XMG Neo 15 (Ryzen 9 6900HX, RTX 3070 Ti) | |
| CrossMark / Creativity | |
| Moyenne de la classe Gaming (1343 - 2729, n=96, 2 dernières années) | |
| Asus ROG Strix Scar 15 G533ZW-LN106WS | |
| MSI GE67 HX 12UGS | |
| Schenker XMG Neo 15 (i7-12700H, RTX 3080 Ti) | |
| Acer Nitro 5 AN515-58-72QR | |
| Moyenne AMD Ryzen 9 6900HX, NVIDIA GeForce RTX 3070 Ti Laptop GPU (1749 - 1809, n=2) | |
| Schenker XMG Neo 15 (Ryzen 9 6900HX, RTX 3070 Ti) | |
| CrossMark / Responsiveness | |
| Asus ROG Strix Scar 15 G533ZW-LN106WS | |
| MSI GE67 HX 12UGS | |
| Moyenne de la classe Gaming (1226 - 2334, n=96, 2 dernières années) | |
| Acer Nitro 5 AN515-58-72QR | |
| Schenker XMG Neo 15 (i7-12700H, RTX 3080 Ti) | |
| Moyenne AMD Ryzen 9 6900HX, NVIDIA GeForce RTX 3070 Ti Laptop GPU (1382 - 1615, n=2) | |
| Schenker XMG Neo 15 (Ryzen 9 6900HX, RTX 3070 Ti) | |
| PCMark 10 Score | 7188 points | |
Aide | ||
| AIDA64 / Memory Copy | |
| Moyenne de la classe Gaming (21750 - 129946, n=107, 2 dernières années) | |
| Schenker XMG Neo 15 (i7-12700H, RTX 3080 Ti) | |
| MSI Stealth GS66 12UGS | |
| Asus ROG Strix Scar 15 G533ZW-LN106WS | |
| Moyenne AMD Ryzen 9 6900HX (47938 - 53345, n=20) | |
| Schenker XMG Neo 15 (Ryzen 9 6900HX, RTX 3070 Ti) | |
| MSI GE67 HX 12UGS | |
| Acer Nitro 5 AN515-58-72QR | |
| AIDA64 / Memory Read | |
| Moyenne de la classe Gaming (22956 - 118858, n=107, 2 dernières années) | |
| Schenker XMG Neo 15 (i7-12700H, RTX 3080 Ti) | |
| MSI Stealth GS66 12UGS | |
| Asus ROG Strix Scar 15 G533ZW-LN106WS | |
| MSI GE67 HX 12UGS | |
| Schenker XMG Neo 15 (Ryzen 9 6900HX, RTX 3070 Ti) | |
| Moyenne AMD Ryzen 9 6900HX (43892 - 53321, n=20) | |
| Acer Nitro 5 AN515-58-72QR | |
| AIDA64 / Memory Write | |
| Moyenne de la classe Gaming (22297 - 135096, n=107, 2 dernières années) | |
| MSI Stealth GS66 12UGS | |
| Schenker XMG Neo 15 (i7-12700H, RTX 3080 Ti) | |
| Asus ROG Strix Scar 15 G533ZW-LN106WS | |
| MSI GE67 HX 12UGS | |
| Schenker XMG Neo 15 (Ryzen 9 6900HX, RTX 3070 Ti) | |
| Moyenne AMD Ryzen 9 6900HX (51085 - 57202, n=20) | |
| Acer Nitro 5 AN515-58-72QR | |
| AIDA64 / Memory Latency | |
| Moyenne de la classe Gaming (75.3 - 259, n=107, 2 dernières années) | |
| Asus ROG Strix Scar 15 G533ZW-LN106WS | |
| MSI GE67 HX 12UGS | |
| MSI Stealth GS66 12UGS | |
| Schenker XMG Neo 15 (Ryzen 9 6900HX, RTX 3070 Ti) | |
| Moyenne AMD Ryzen 9 6900HX (80.7 - 120.6, n=20) | |
| Acer Nitro 5 AN515-58-72QR | |
| Acer Nitro 5 AN515-58-72QR | |
* ... Moindre est la valeur, meilleures sont les performances
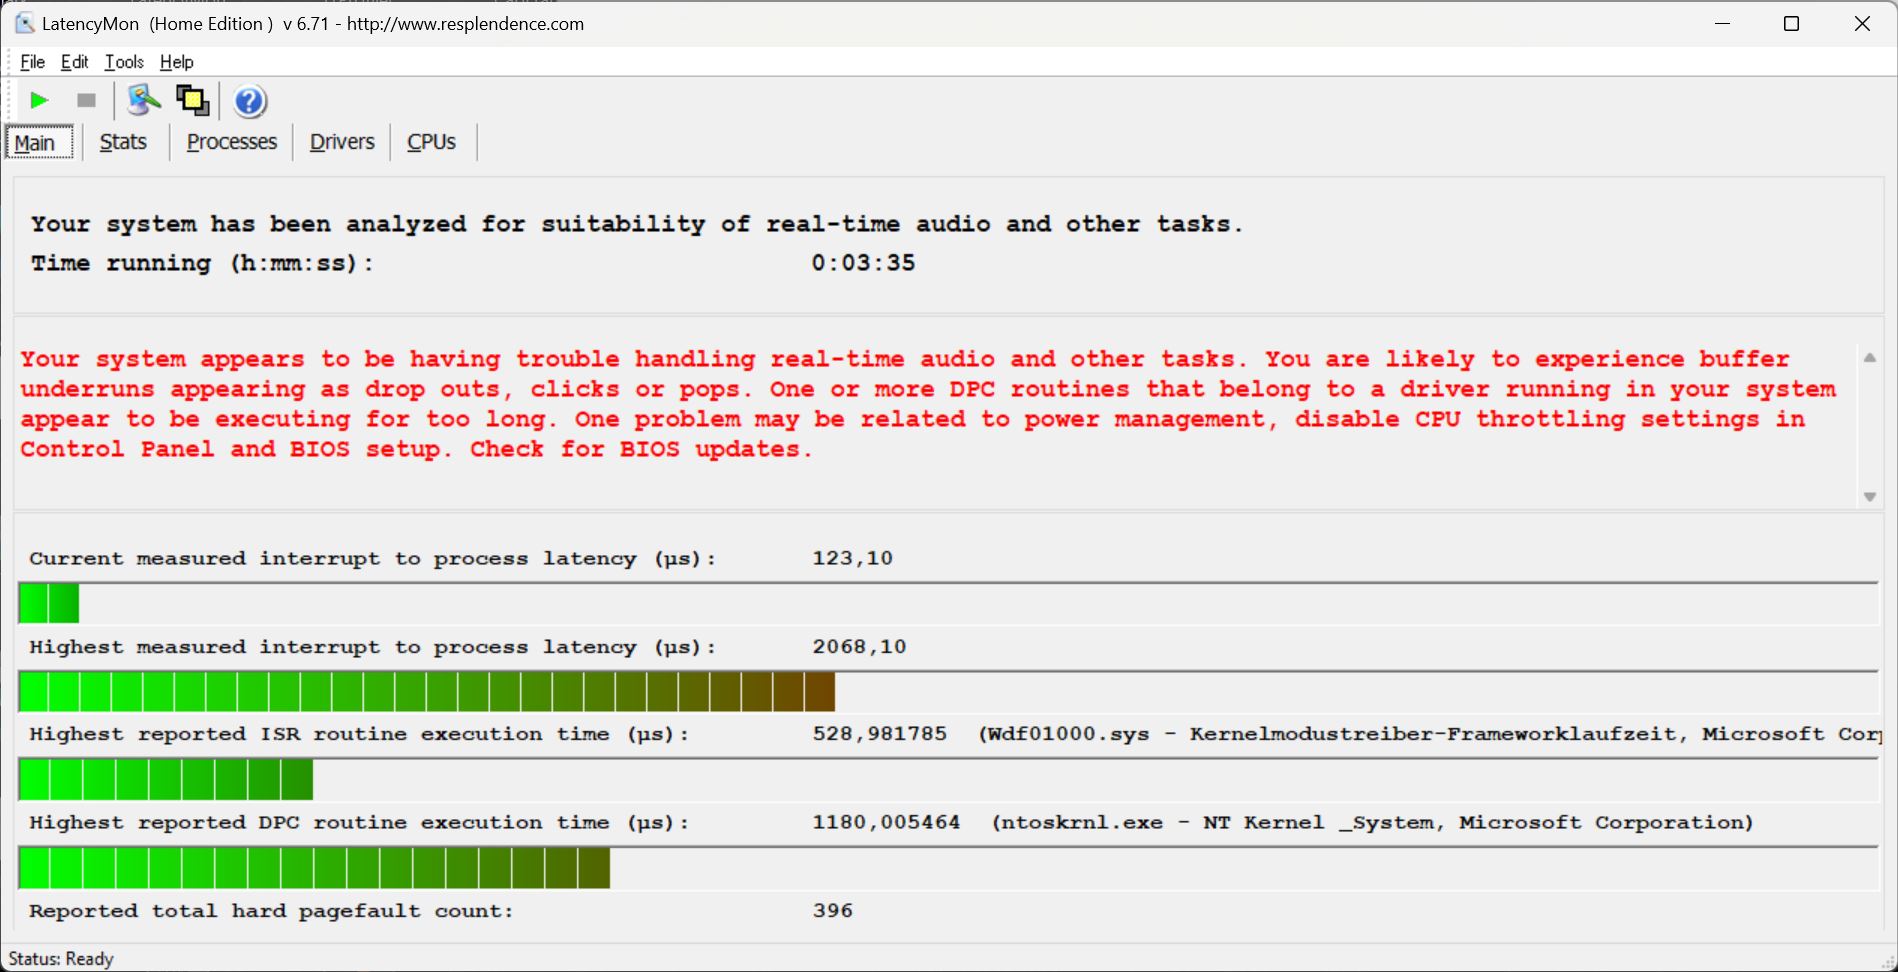
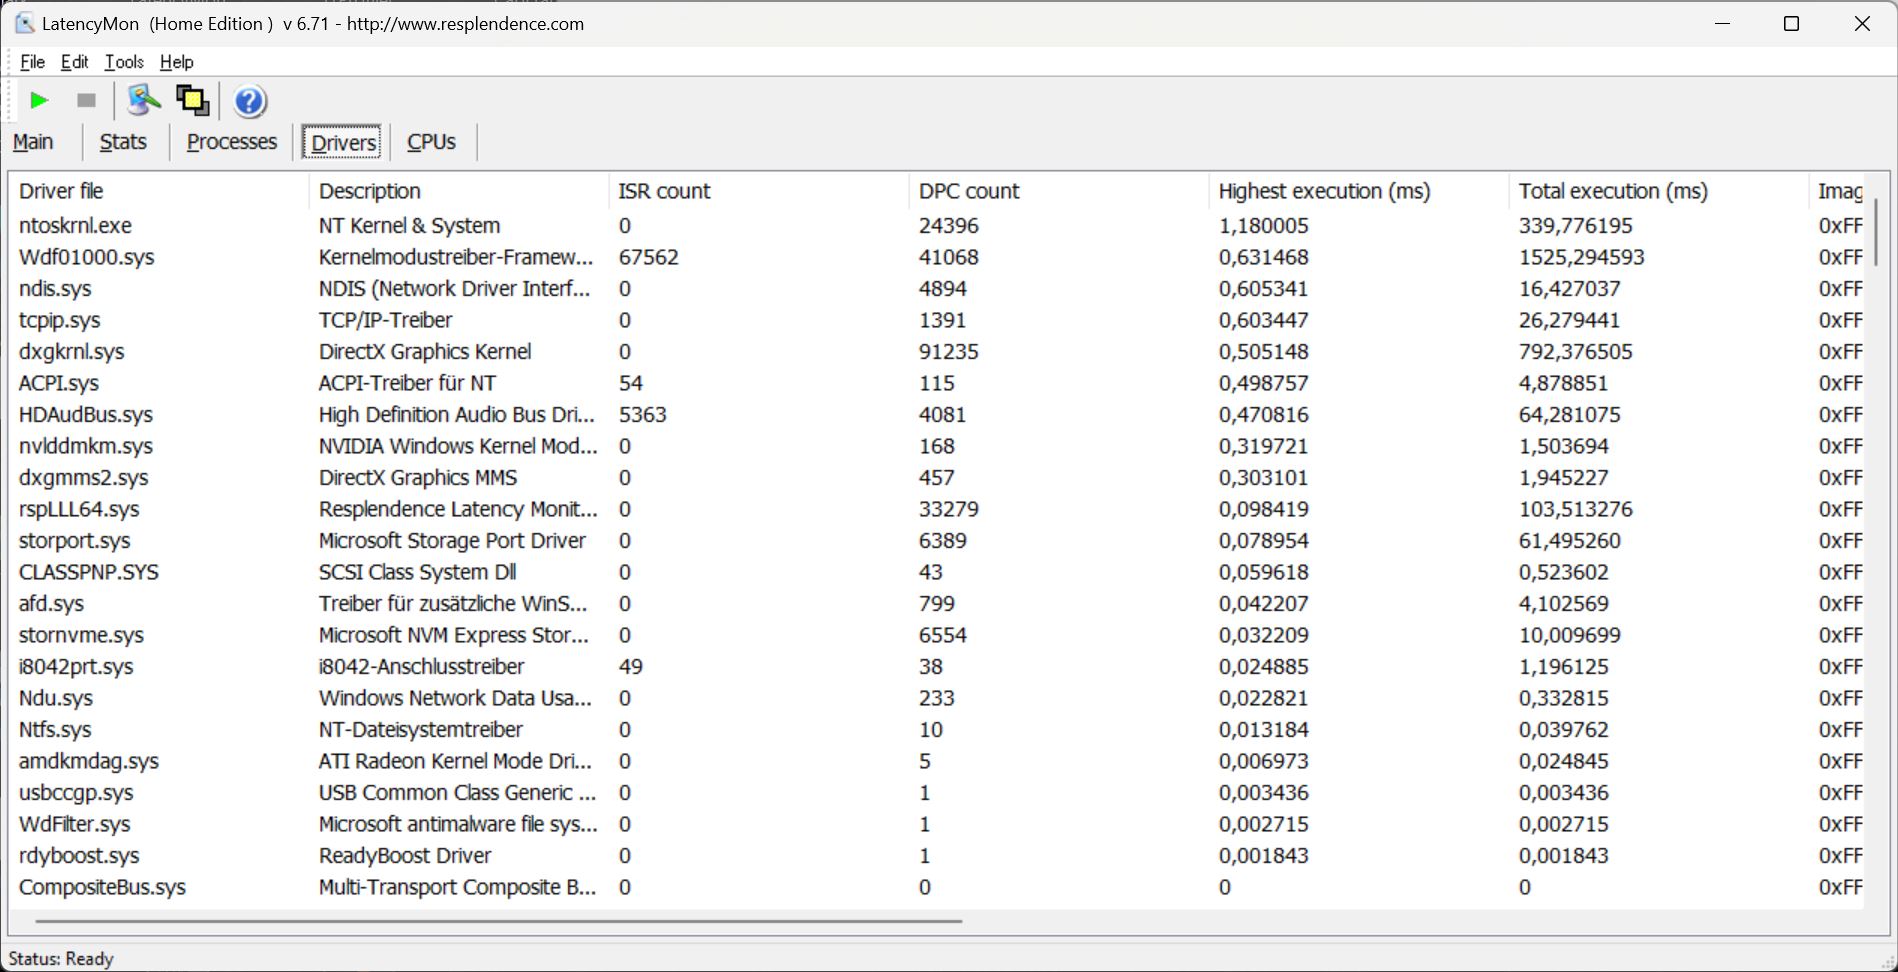
Latence DPC
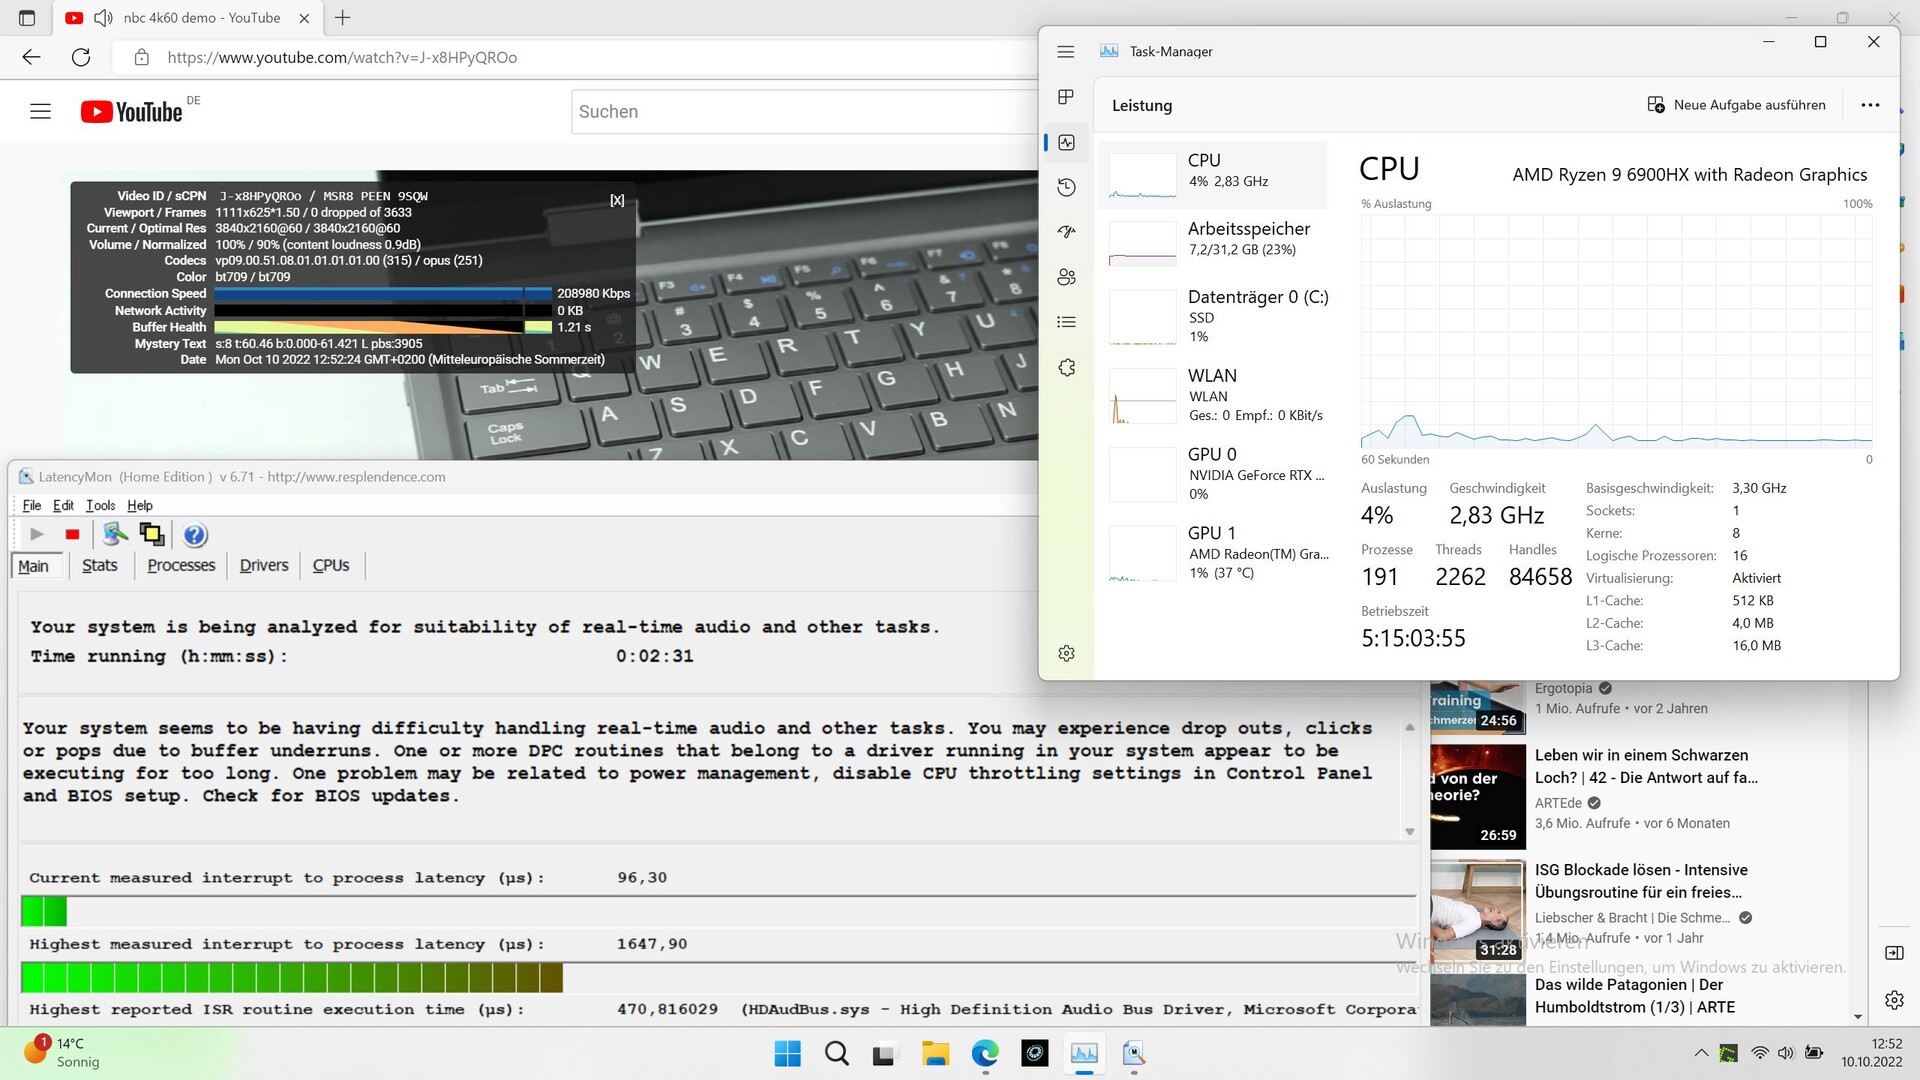
Nous avons rencontré les premiers problèmes de CPD après avoir ouvert plusieurs onglets de navigateur sur notre page d'accueil. La latence a augmenté pendant la lecture de nos vidéos YouTube 4K à 60 FPS. Les pilotes du noyau sont soupçonnés d'être la cause principale de ce problème.
Mais au moins, il n'y a pas eu d'images perdues et l'utilisation du CPU/GPU est très faible pendant la lecture de la vidéo de test.
| DPC Latencies / LatencyMon - interrupt to process latency (max), Web, Youtube, Prime95 | |
| Schenker XMG Neo 15 (i7-12700H, RTX 3080 Ti) | |
| MSI Stealth GS66 12UGS | |
| Schenker XMG Neo 15 (Ryzen 9 6900HX, RTX 3070 Ti) | |
| MSI GE67 HX 12UGS | |
| Asus ROG Strix Scar 15 G533ZW-LN106WS | |
| Acer Nitro 5 AN515-58-72QR | |
* ... Moindre est la valeur, meilleures sont les performances
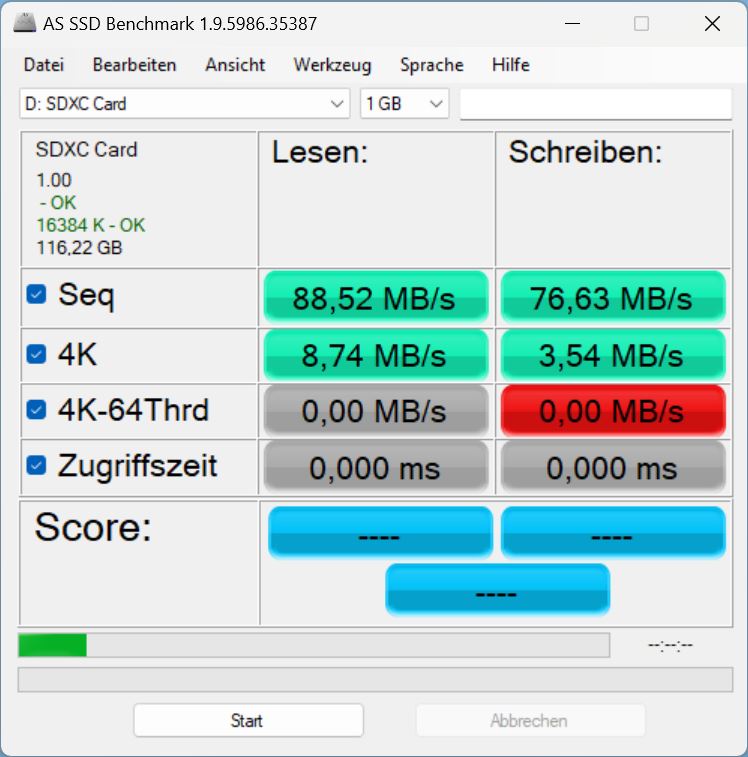
Mémoire de masse
Le Neo 15 peut être configuré avec d'innombrables options de SSD. Notre unité de test est équipée d'un SSD Samsung 980 Pro de 1 To, qui est actuellement classé 12e sur notre liste de référence SSD/HDD https://www.notebookcheck.net/Laptop-harddisks-HDD-SSD-benchmarks.22089.0.html. Le disque est capable de maintenir ses excellentes performances même sur une période prolongée.

* ... Moindre est la valeur, meilleures sont les performances
Sustained Load Read: DiskSpd Read Loop, Queue Depth 8
Carte graphique

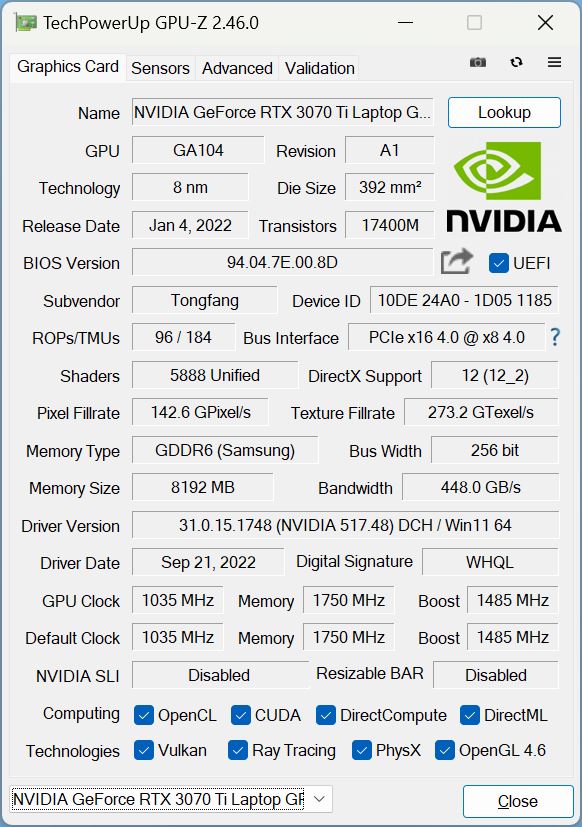
Notre unité de test est équipée d'une GeForce RTX 3070 Ti avec une cible TGP de 150 watts, Dynamic Boost inclus. Ces valeurs peuvent être ajustées manuellement dans le centre de contrôle. Sinon, vous pouvez obtenir le Neo 15 avec différents GPU allant d'une RTX 3060 à RTX 3080 Ti.
Comme nous l'avions prévu, le GPU de l'unité de test a obtenu un score de 5 à 10 % supérieur à celui d'une RTX 3070 Ti moyenne. Le site MSI GE67 est le seul appareil de la comparaison qui est nettement plus rapide. Bien que le Strix Scar a souvent obtenu de meilleurs résultats que le Neo, les écarts de performances sont le plus souvent négligeables, de l'ordre de 2 % seulement.
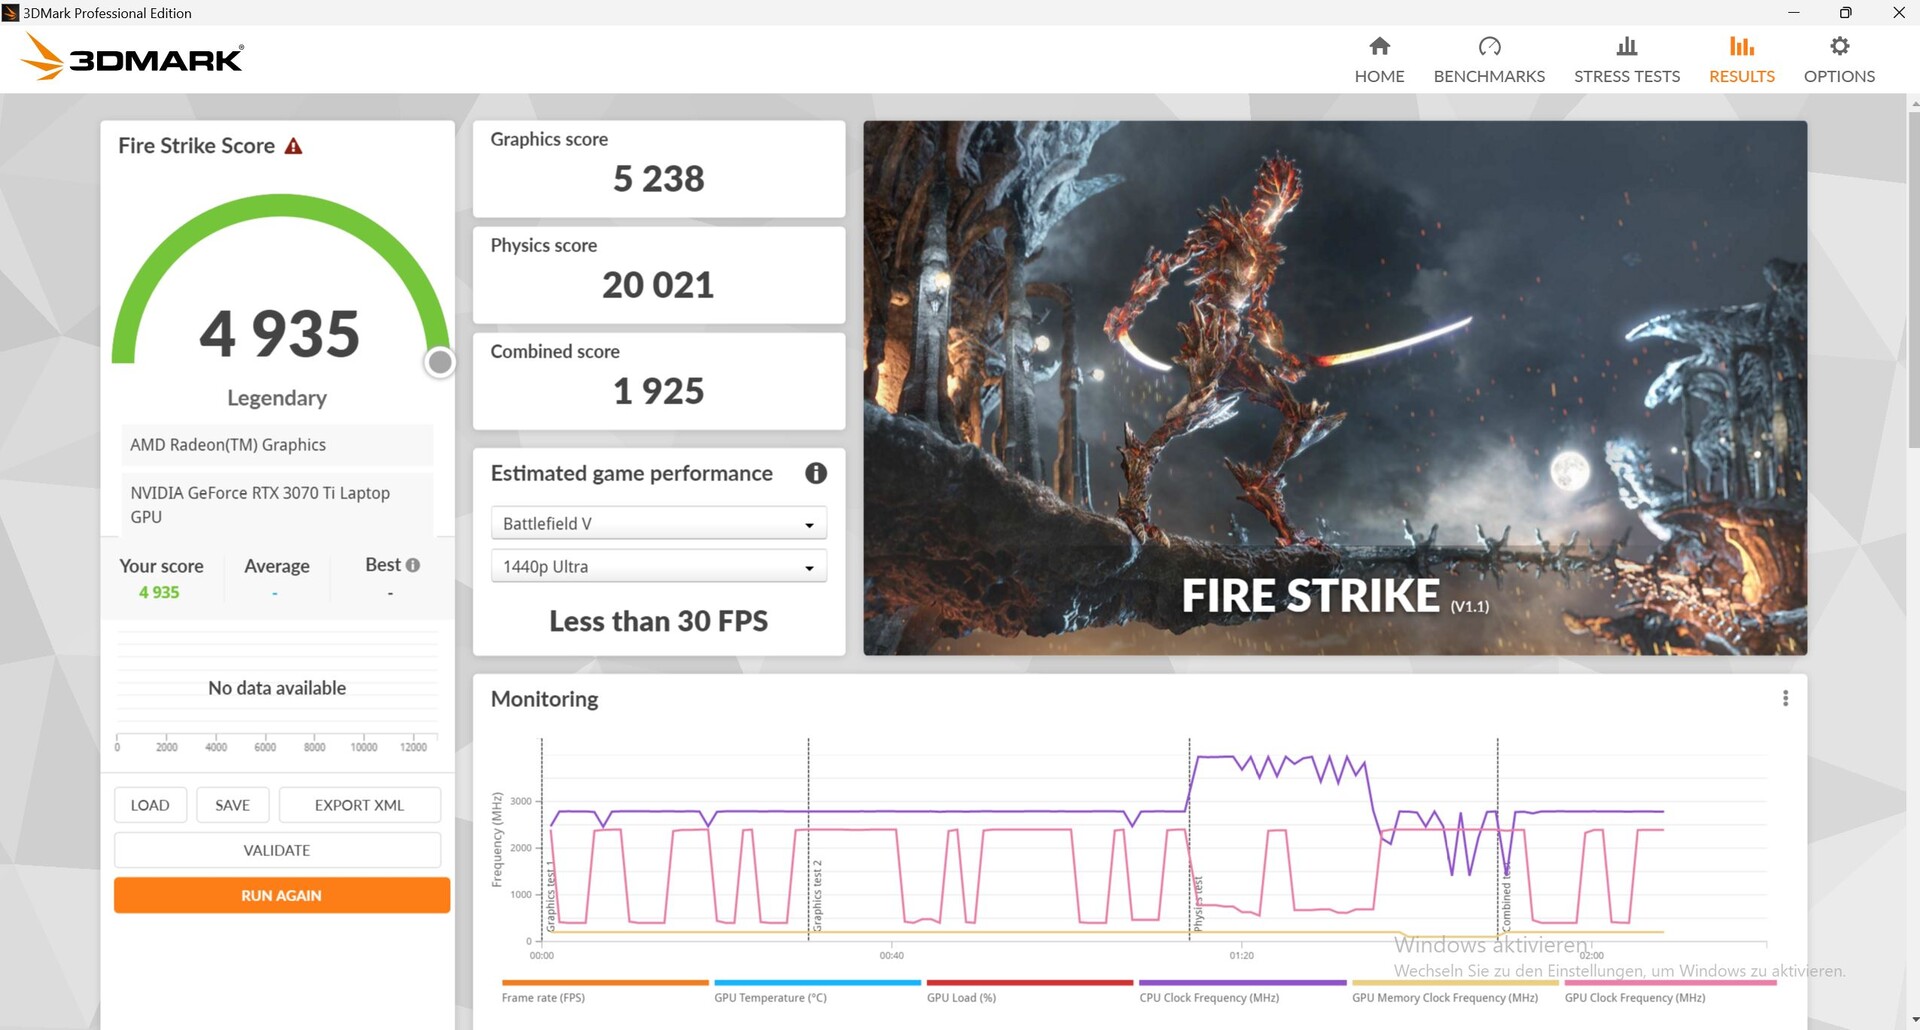
Le Neo 15 perd énormément de performances 3D lorsqu'il fonctionne sur batterie. Par exemple, lorsque nous avons débranché l'ordinateur portable et relancé Fire Strike, le score physique et graphique n'était que de 20 021 et 5 238 respectivement, au lieu des 26 338 et 28 105 obtenus lorsque le Neo était connecté au secteur.
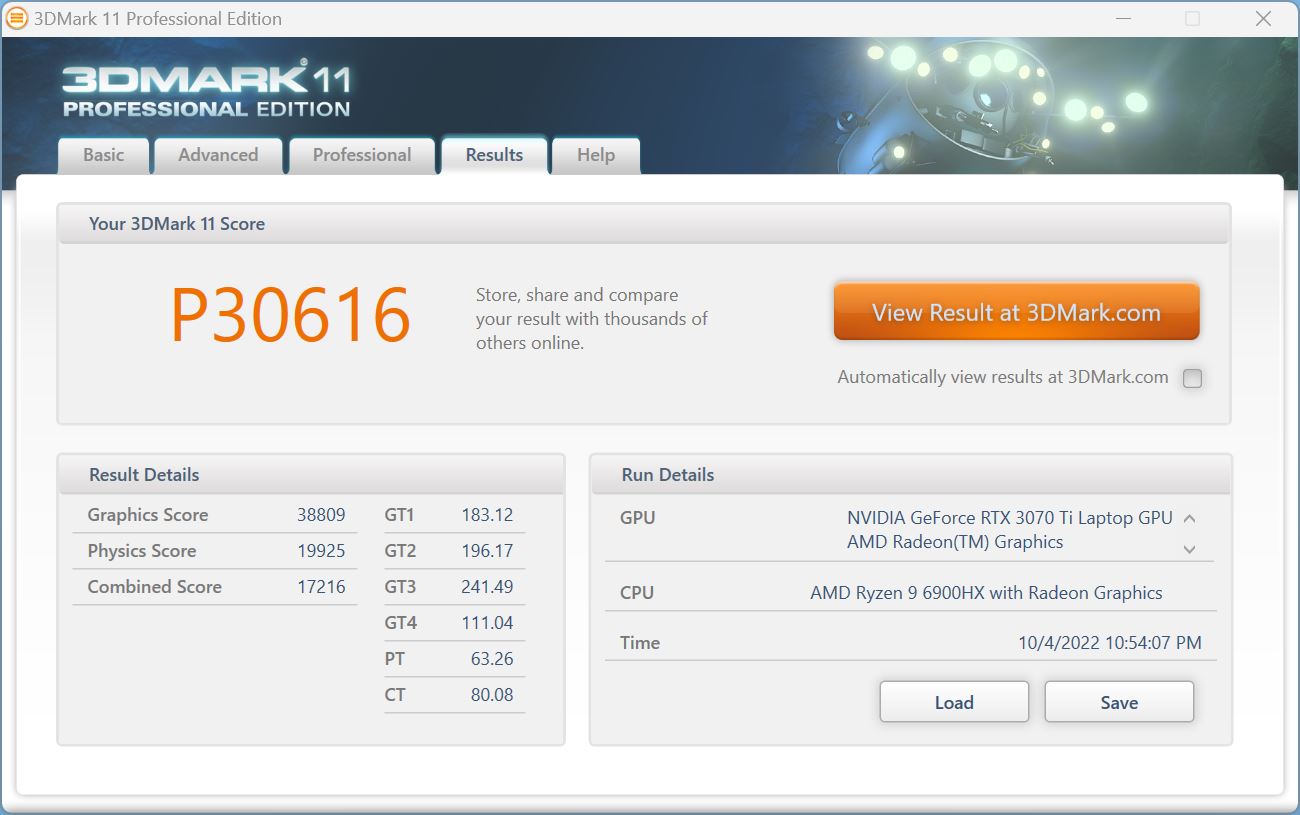

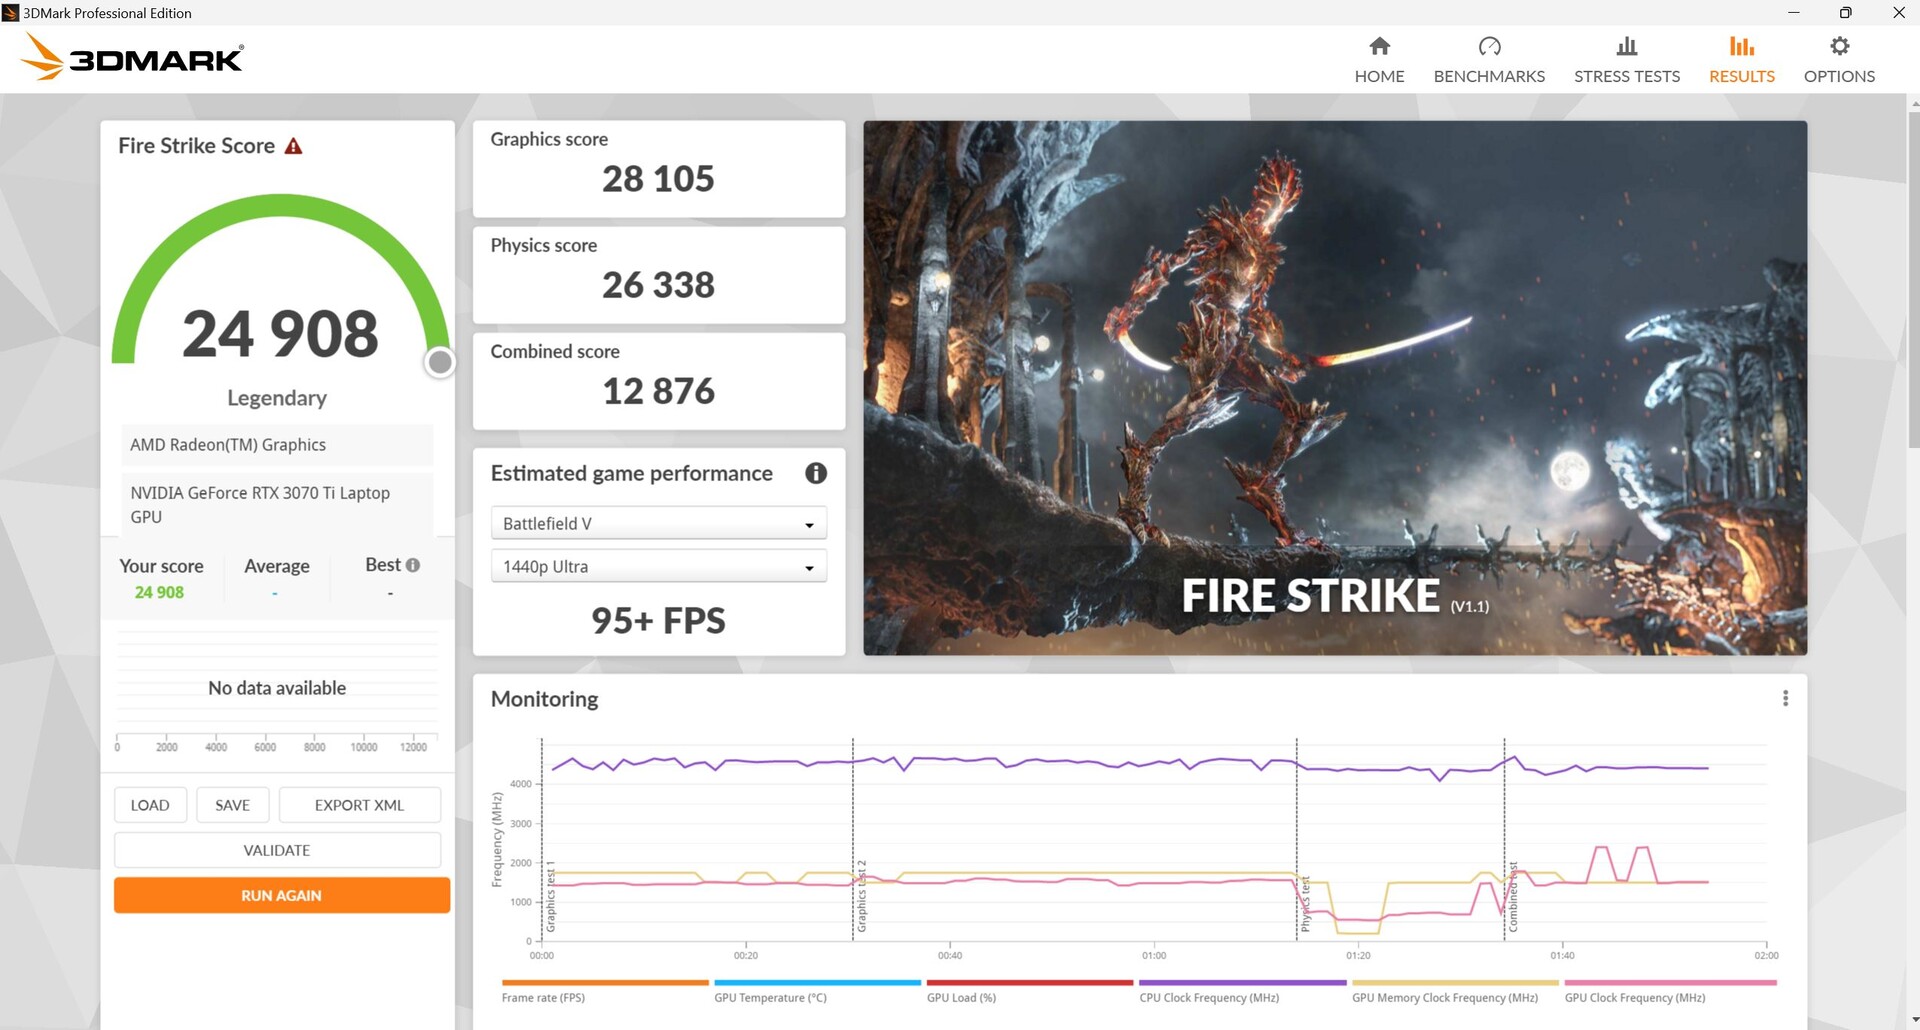
| 3DMark 11 Performance | 30616 points | |
| 3DMark Cloud Gate Standard Score | 57616 points | |
| 3DMark Fire Strike Score | 24908 points | |
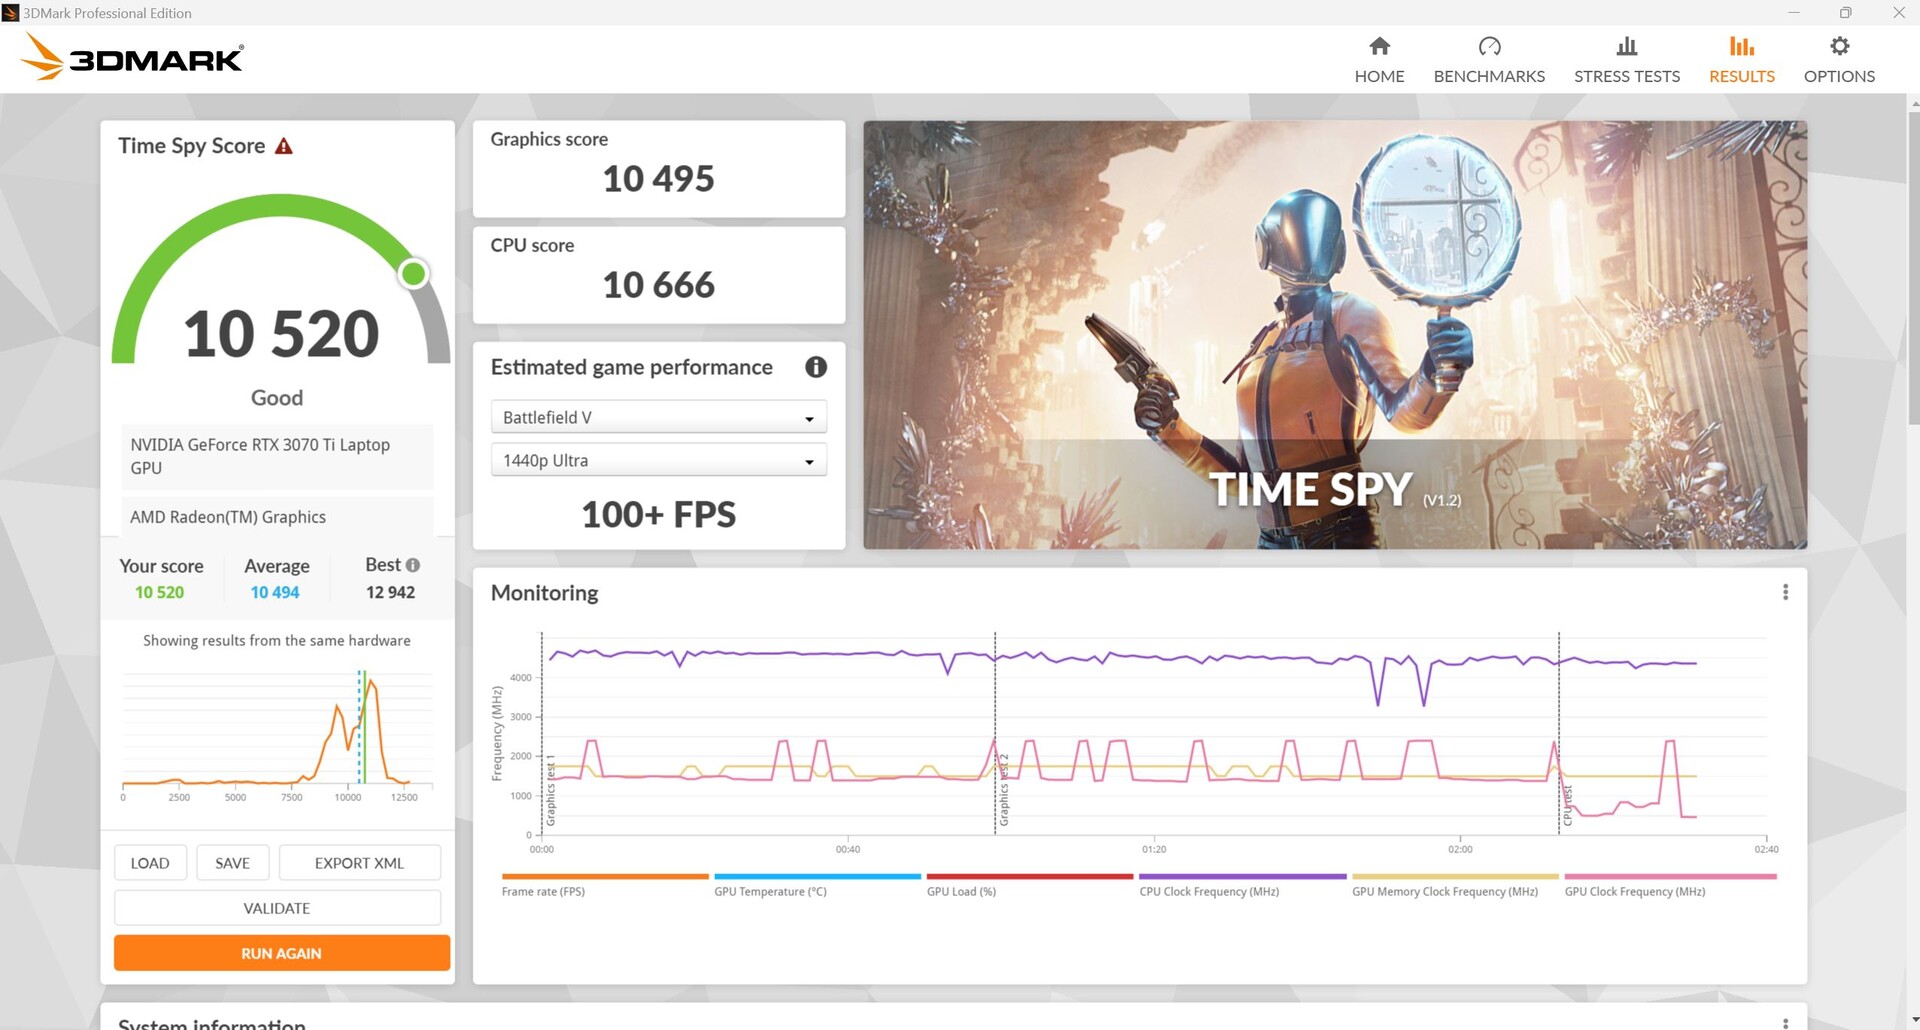
| 3DMark Time Spy Score | 10520 points | |
Aide | ||
* ... Moindre est la valeur, meilleures sont les performances
Performances de jeu
Le Neo 15 est essentiellement capable de faire tourner tous les jeux testés sans problème, même avec une résolution QHD et des paramètres maximaux. L'ordinateur portable ne commence à avoir des difficultés que lorsque les paramètres de ray tracing sont réglés sur une valeur élevée dans des jeux tels que Dying Light 2 (35 FPS).
Dans la comparaison, les résultats des tests de jeu dressent un tableau similaire à ceux de 3DMark : le GPU du Neo a largement (mais pas toujours) obtenu de meilleurs résultats qu'une RTX 3070 Ti moyenne. Cela dit, l'Asus ROG Strix Scar et surtout le MSI GE67 étaient plus rapides que le Neo.
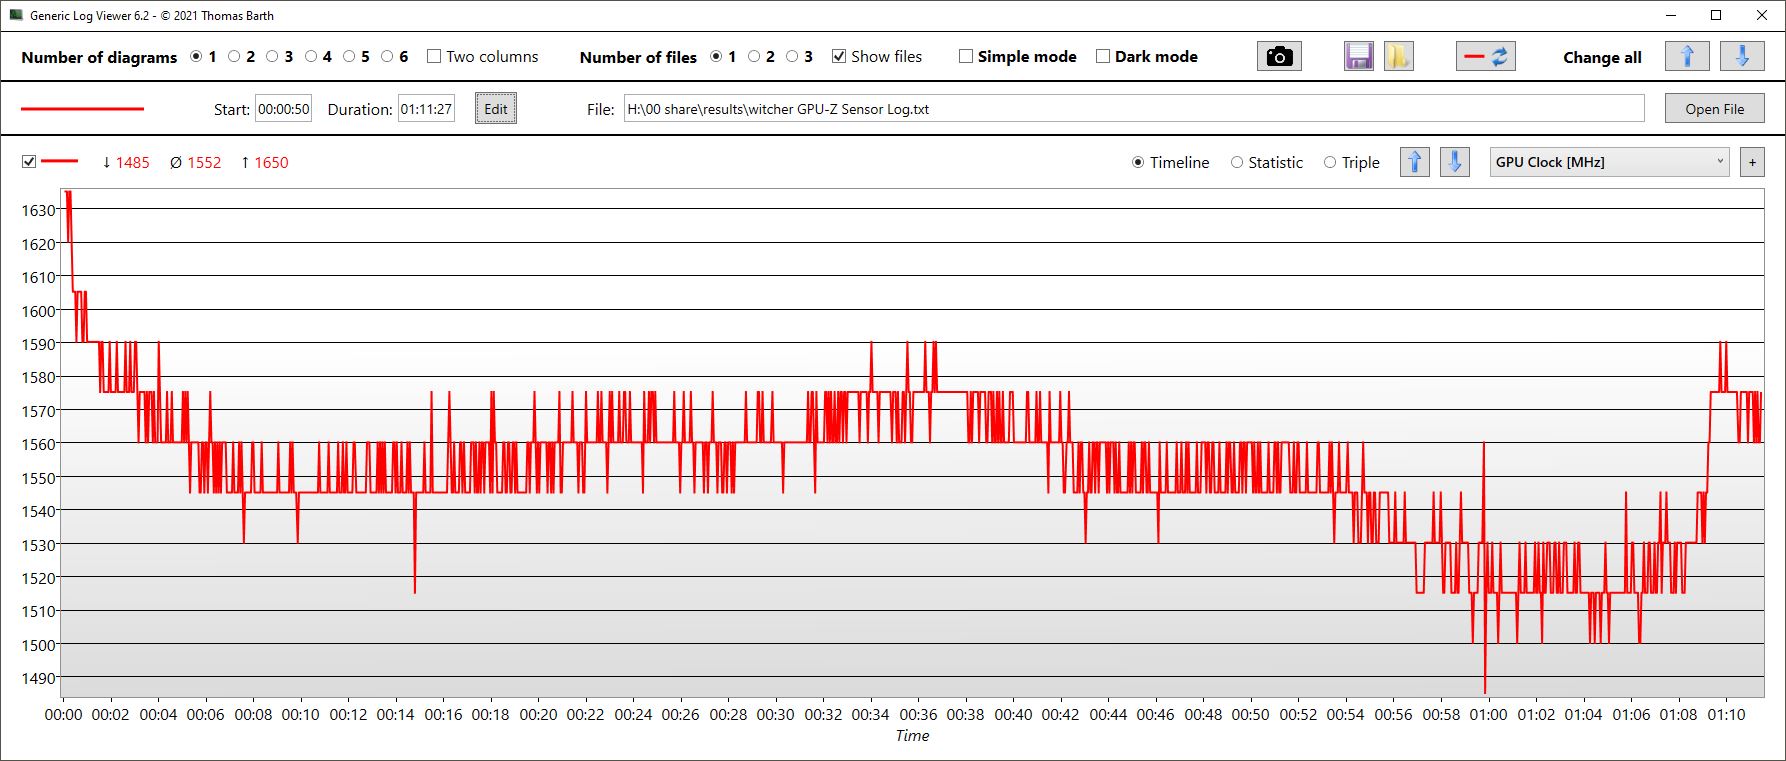
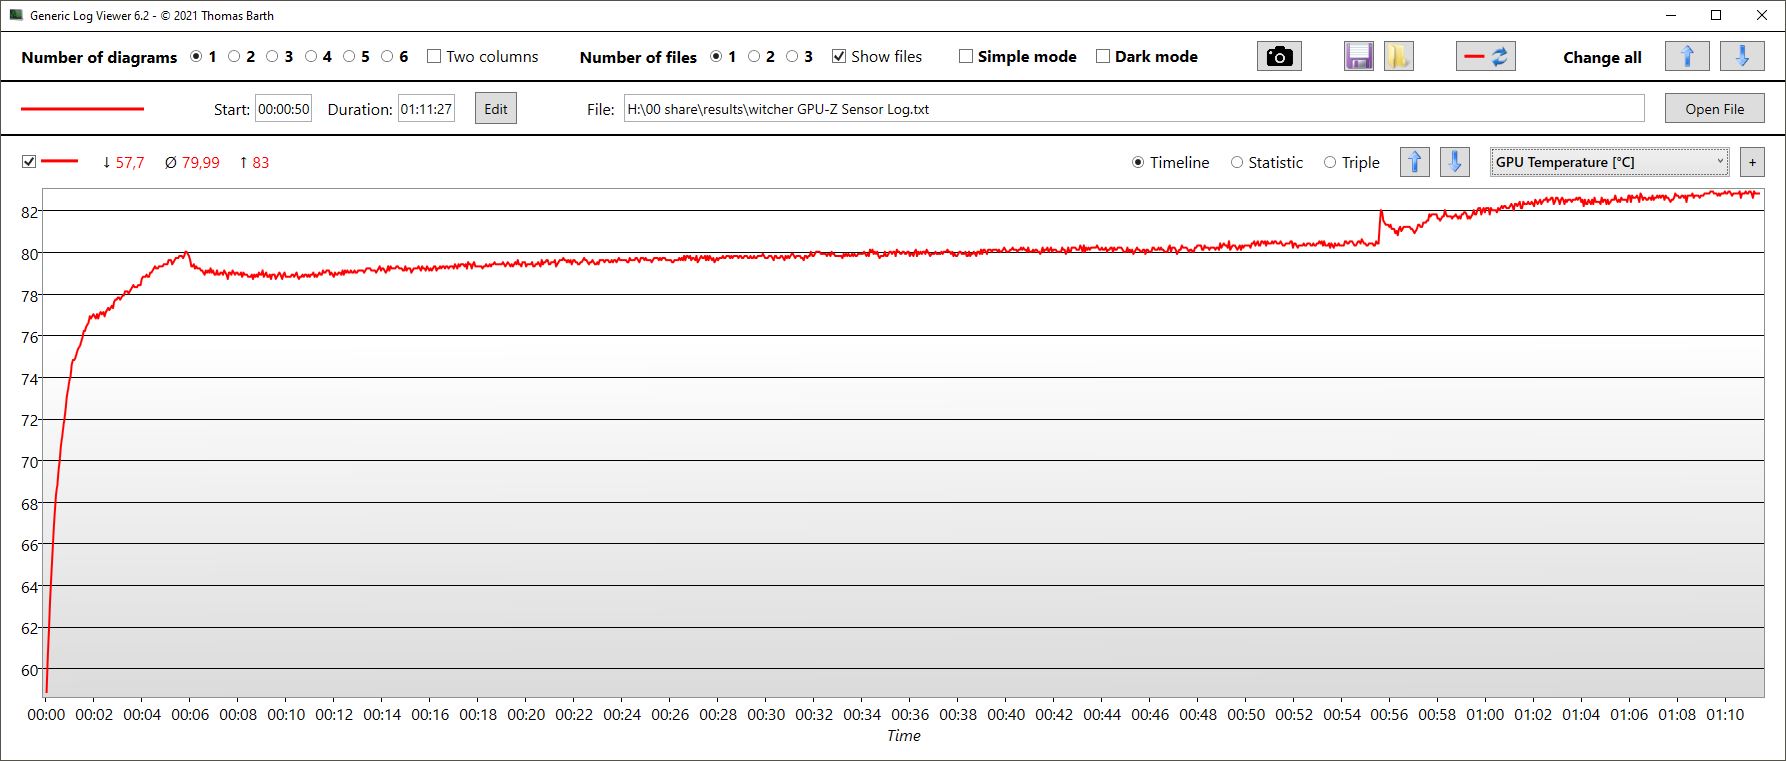
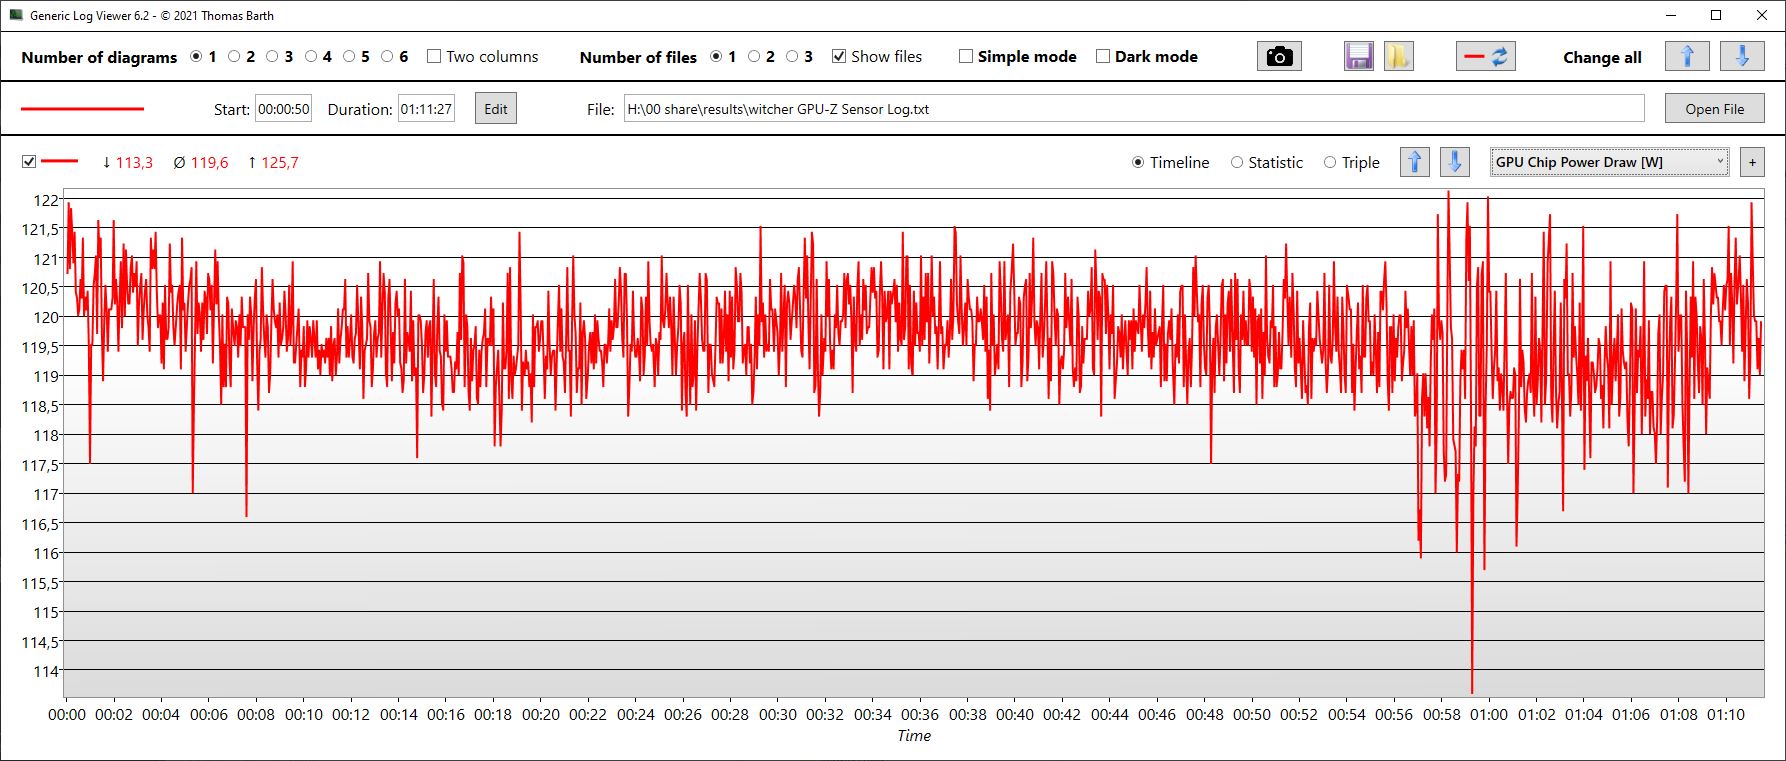
Sur le site Witcher 3, les taux de rafraîchissement étaient généralement stables. Mais nous avons remarqué que la température du GPU (enregistrée en parallèle) a continué à augmenter pendant toute la durée du test et ne s'est pas vraiment stabilisée. Cela indique que le GPU peut commencer à subir un étranglement thermique après avoir exécuté des jeux exigeants pendant une longue période, bien que cela ne se soit pas produit pendant le test d'une heure. La consommation d'énergie du GPU était de 120 watts en moyenne.
Dans la comparaison, même le Neo basé sur Intel avec une RTX 3080 Ti n'était pas sensiblement plus rapide avec les mêmes paramètres. D'une manière générale, le GPU extrêmement coûteux du Neo basé sur Intel ne justifie guère son prix élevé par les gains de performance qu'il procure. Selon le jeu et les paramètres, il n'avait qu'une avance d'environ 1 à 25 %.
Witcher 3 FPS chart
| Bas | Moyen | Élevé | Ultra | QHD | |
|---|---|---|---|---|---|
| GTA V (2015) | 176.6 | 170.3 | 156.2 | 97.6 | 93 |
| The Witcher 3 (2015) | 195 | 110 | |||
| Dota 2 Reborn (2015) | 135.9 | 123.1 | 116.3 | 114.1 | |
| X-Plane 11.11 (2018) | 109.5 | 94.9 | 77.6 | ||
| Far Cry 5 (2018) | 119 | 110 | 102 | ||
| Strange Brigade (2018) | 305 | 224 | 206 | 189 | 143 |
| Dying Light 2 (2022) | 82.5 | 59 |
Émissions - Plus froid que l'Intel Neo au ralenti
Émissions sonores
Bien que l'ordinateur portable ne dispose pas d'un mode silencieux, les ventilateurs ne tournent souvent pas au ralenti. Il est intéressant de noter que, malgré un GPU plus faible, le Neo basé sur AMD n'est pas aussi silencieux en charge que son homologue basé sur Intel. Parmi les concurrents, seul le Nitro 5 d'Acer est légèrement plus silencieux. Mais là encore, il est aussi moins performant que le Neo.
Lorsque les ventilateurs sont inactifs, le châssis émet un bip doux mais aigu. Bien que ce bruit ne soit pas audible lorsque les ventilateurs fonctionnent, il reste gênant dans un environnement calme.
Degré de la nuisance sonore
| Au repos |
| 23 / 25.82 / 27.3 dB(A) |
| Fortement sollicité |
| 42.7 / 56 dB(A) |
 | ||
30 dB silencieux 40 dB(A) audible 50 dB(A) bruyant |
||
min: | ||
| Schenker XMG Neo 15 (Ryzen 9 6900HX, RTX 3070 Ti) GeForce RTX 3070 Ti Laptop GPU, R9 6900HX, Samsung SSD 980 Pro 1TB MZ-V8P1T0BW | Schenker XMG Neo 15 (i7-12700H, RTX 3080 Ti) GeForce RTX 3080 Ti Laptop GPU, i7-12700H, Samsung SSD 980 Pro 1TB MZ-V8P1T0BW | MSI GE67 HX 12UGS GeForce RTX 3070 Ti Laptop GPU, i7-12800HX, Samsung PM9A1 MZVL21T0HCLR | Asus ROG Strix Scar 15 G533ZW-LN106WS GeForce RTX 3070 Ti Laptop GPU, i9-12900H, Samsung PM9A1 MZVL22T0HBLB | Acer Nitro 5 AN515-58-72QR GeForce RTX 3070 Ti Laptop GPU, i7-12700H, Samsung PM9A1 MZVL21T0HCLR | MSI Stealth GS66 12UGS GeForce RTX 3070 Ti Laptop GPU, i7-12700H, WDC PC SN810 1TB | |
|---|---|---|---|---|---|---|
| Noise | -1% | 3% | -30% | -8% | -9% | |
| arrêt / environnement * (dB) | 23 | 23 -0% | 22.7 1% | 26.86 -17% | 26 -13% | 24 -4% |
| Idle Minimum * (dB) | 23 | 23 -0% | 22.9 -0% | 39.07 -70% | 26 -13% | 31 -35% |
| Idle Average * (dB) | 25.82 | 26.39 -2% | 22.9 11% | 39.07 -51% | 29 -12% | 32 -24% |
| Idle Maximum * (dB) | 27.3 | 26.39 3% | 22.9 16% | 39.07 -43% | 33 -21% | 35 -28% |
| Load Average * (dB) | 42.7 | 45.52 -7% | 44.4 -4% | 53.34 -25% | 47 -10% | 48 -12% |
| Witcher 3 ultra * (dB) | 56 | 55.89 -0% | 55.7 1% | 56.6 -1% | 53 5% | 43 23% |
| Load Maximum * (dB) | 56 | 55.89 -0% | 57.4 -2% | 56.6 -1% | 53 5% | 48 14% |
* ... Moindre est la valeur, meilleures sont les performances
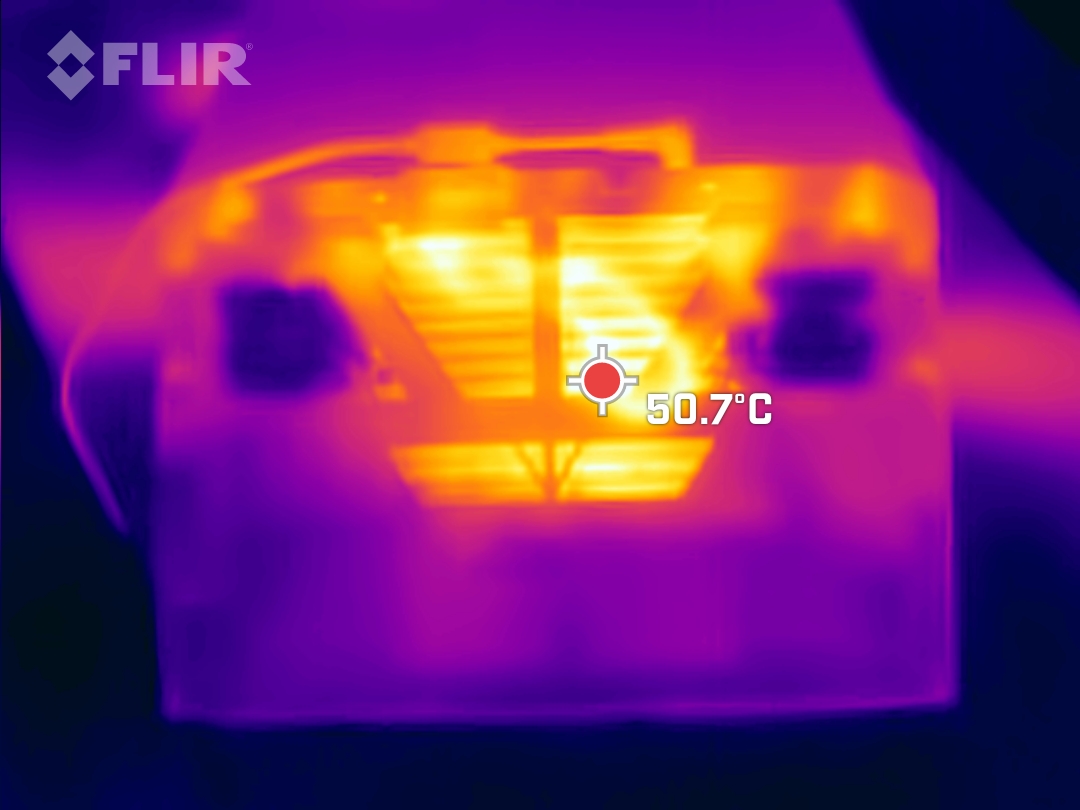
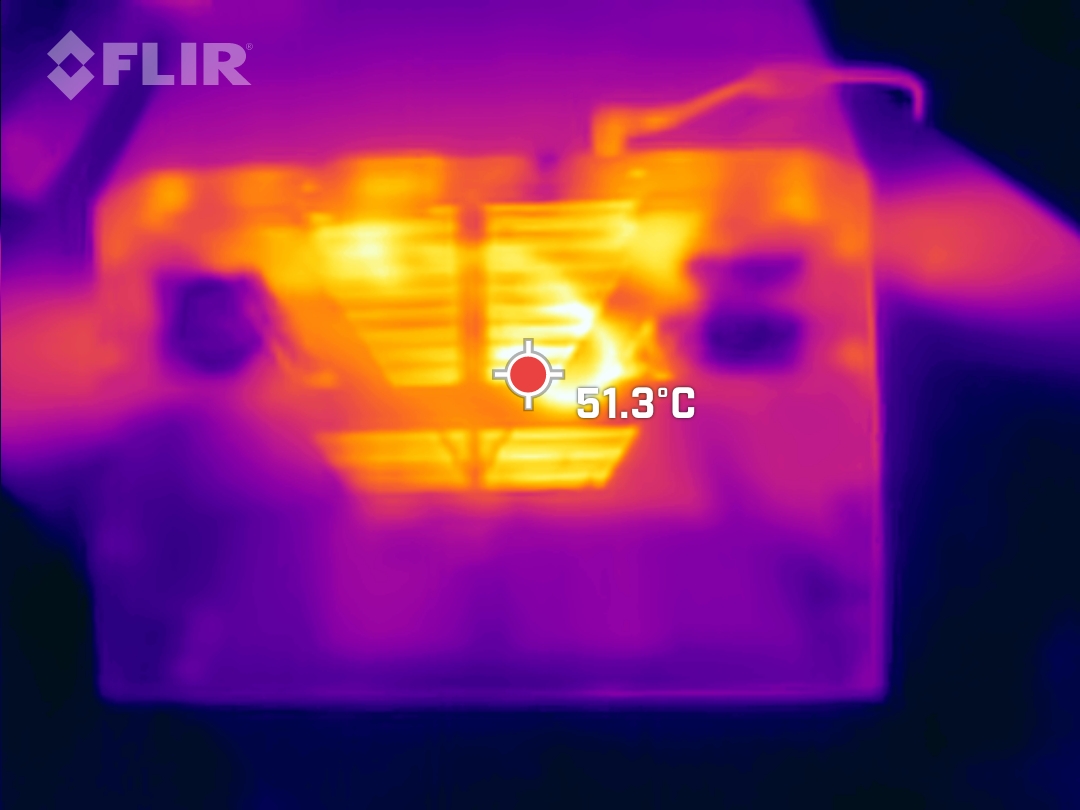
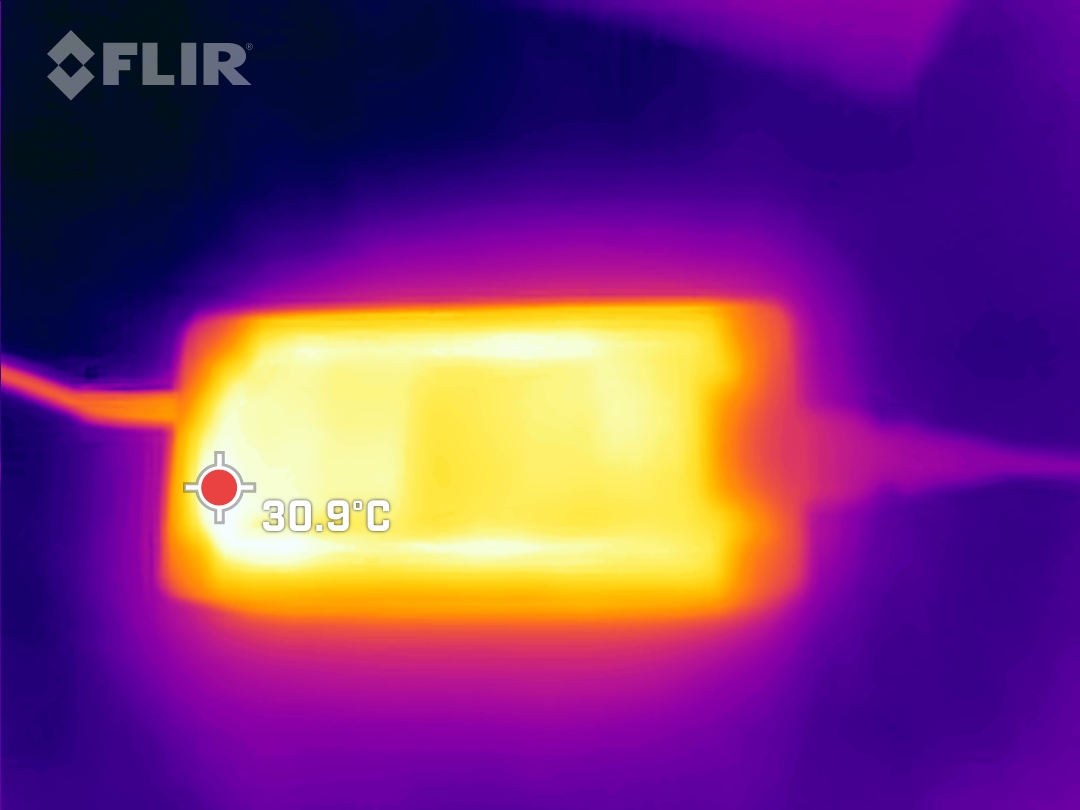
Température
Au ralenti, les températures du boîtier restent plus confortables que sur le Neo basé sur Intel avec RTX 3080 Ti. Cependant, cet avantage disparaît pratiquement sous charge. Les autres appareils du groupe de comparaison peuvent devenir à peu près aussi chauds que le Neo. Mais c'est surtout le MSI GE67, très performant mais légèrement plus encombrant, qui est plus frais que les autres ordinateurs portables de jeu.
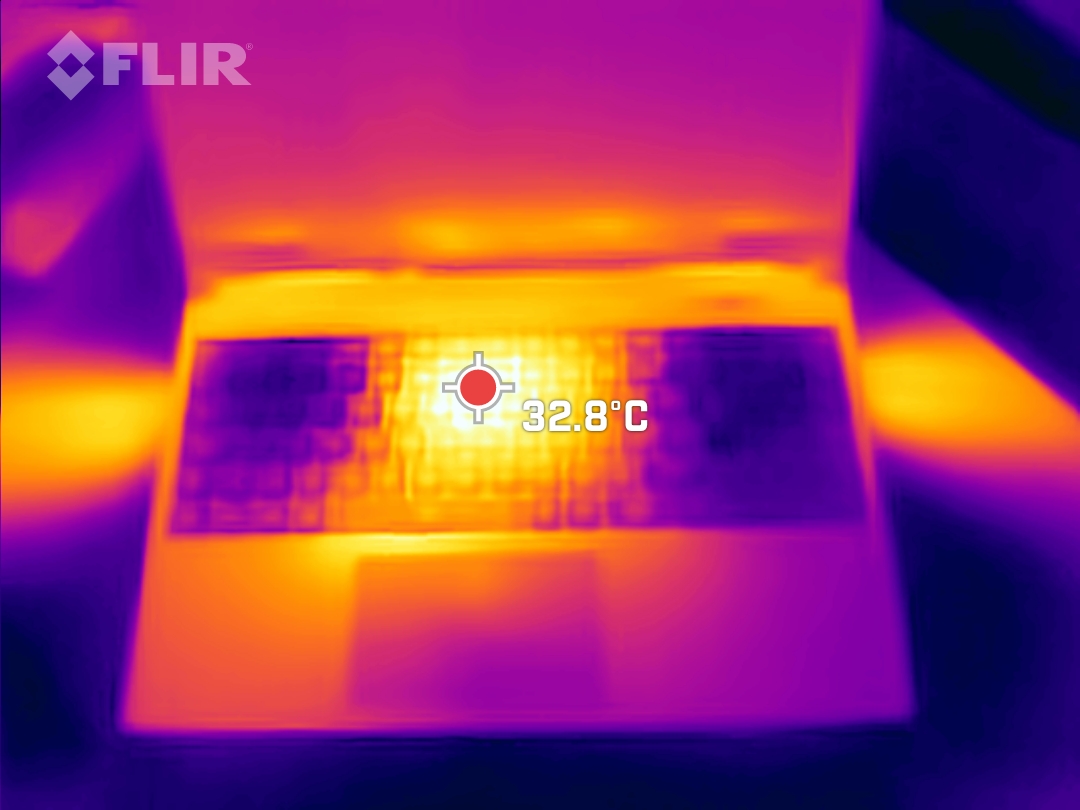
Les repose-poignets ne deviennent jamais désagréablement chauds, et il en va de même pour les touches WASD. La chaleur est surtout concentrée au milieu et dans la zone proche de l'écran. Le panneau inférieur fin et en plastique comporte de nombreux orifices d'aération, ce qui le rend nettement plus chaud que le clavier.
(±) La température maximale du côté supérieur est de 41 °C / 106 F, par rapport à la moyenne de 40.4 °C / 105 F, allant de 21.2 à 68.8 °C pour la classe Gaming.
(-) Le fond chauffe jusqu'à un maximum de 57 °C / 135 F, contre une moyenne de 43.2 °C / 110 F
(+) En utilisation inactive, la température moyenne du côté supérieur est de 27.1 °C / 81 F, par rapport à la moyenne du dispositif de 33.9 °C / 93 F.
(±) En jouant à The Witcher 3, la température moyenne du côté supérieur est de 33.3 °C / 92 F, alors que la moyenne de l'appareil est de 33.9 °C / 93 F.
(+) Les repose-poignets et le pavé tactile sont plus froids que la température de la peau avec un maximum de 31 °C / 87.8 F et sont donc froids au toucher.
(-) La température moyenne de la zone de l'appui-paume de dispositifs similaires était de 28.8 °C / 83.8 F (-2.2 °C / #-4 F).
| Schenker XMG Neo 15 (Ryzen 9 6900HX, RTX 3070 Ti) AMD Ryzen 9 6900HX, NVIDIA GeForce RTX 3070 Ti Laptop GPU | Schenker XMG Neo 15 (i7-12700H, RTX 3080 Ti) Intel Core i7-12700H, NVIDIA GeForce RTX 3080 Ti Laptop GPU | MSI GE67 HX 12UGS Intel Core i7-12800HX, NVIDIA GeForce RTX 3070 Ti Laptop GPU | Asus ROG Strix Scar 15 G533ZW-LN106WS Intel Core i9-12900H, NVIDIA GeForce RTX 3070 Ti Laptop GPU | Acer Nitro 5 AN515-58-72QR Intel Core i7-12700H, NVIDIA GeForce RTX 3070 Ti Laptop GPU | MSI Stealth GS66 12UGS Intel Core i7-12700H, NVIDIA GeForce RTX 3070 Ti Laptop GPU | |
|---|---|---|---|---|---|---|
| Heat | -20% | 11% | -14% | -9% | -5% | |
| Maximum Upper Side * (°C) | 41 | 44 -7% | 34.4 16% | 42.6 -4% | 48 -17% | 54 -32% |
| Maximum Bottom * (°C) | 57 | 56 2% | 42 26% | 50.2 12% | 51 11% | 59 -4% |
| Idle Upper Side * (°C) | 28 | 38 -36% | 24 14% | 36.2 -29% | 34 -21% | 26 7% |
| Idle Bottom * (°C) | 30 | 41 -37% | 33.2 -11% | 40.2 -34% | 33 -10% | 27 10% |
* ... Moindre est la valeur, meilleures sont les performances
Test de stress
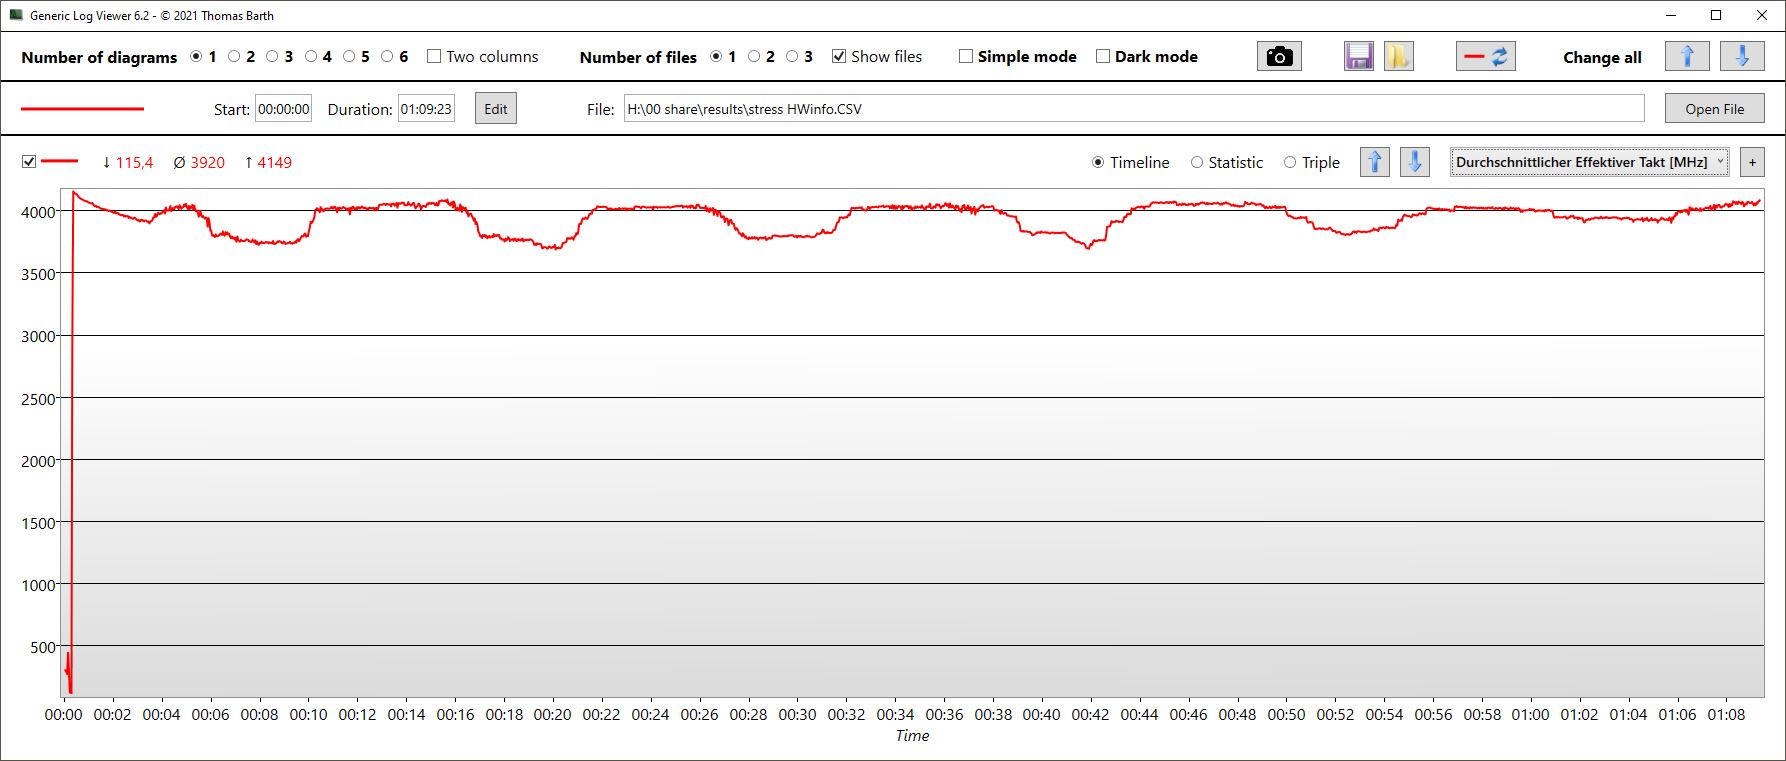
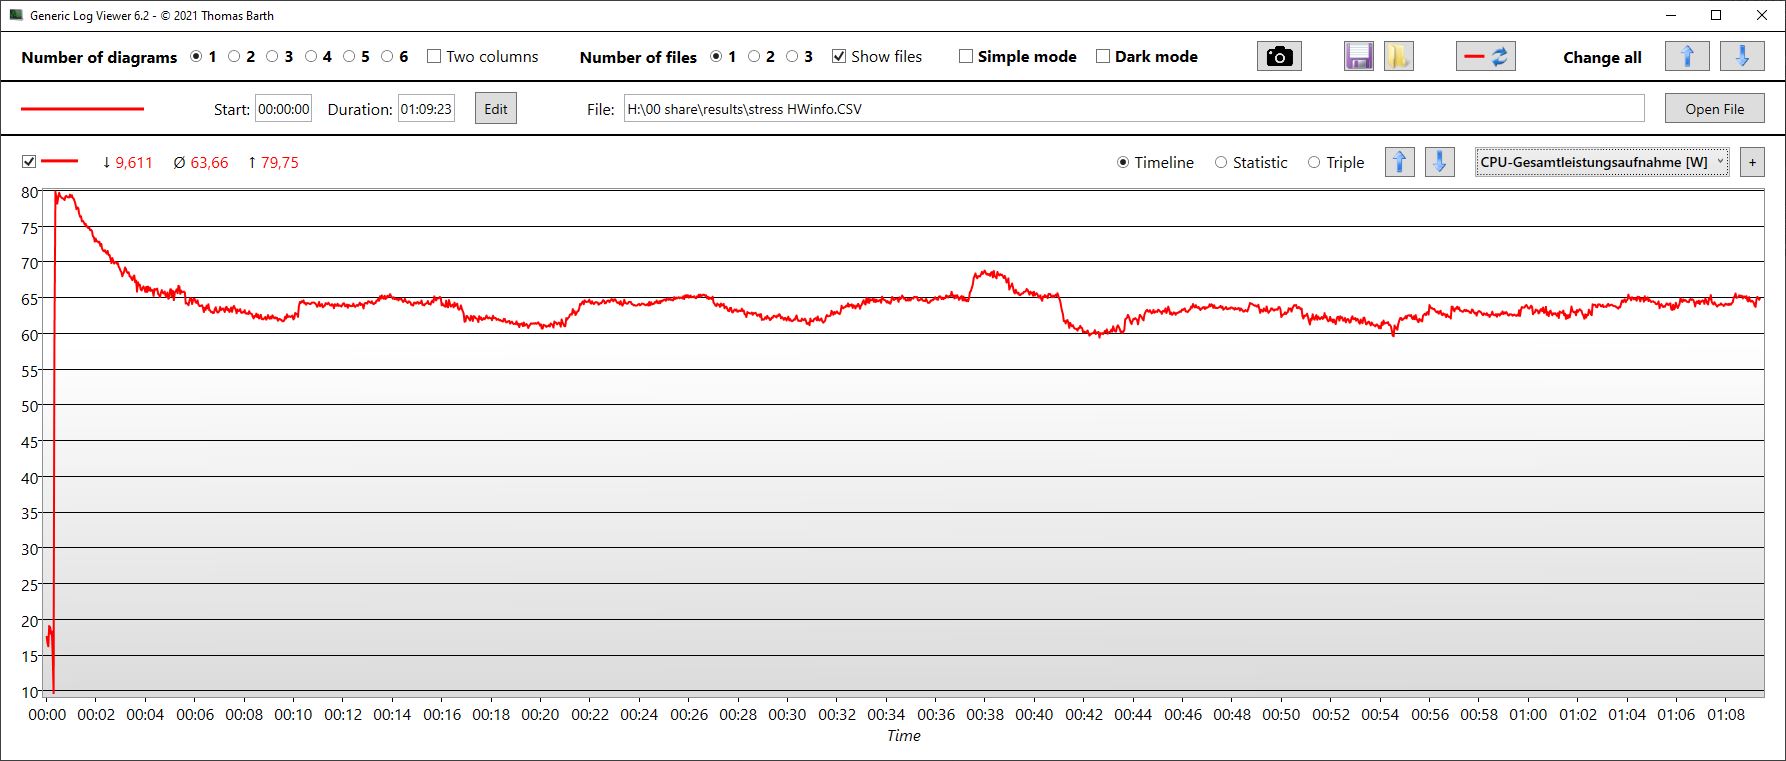
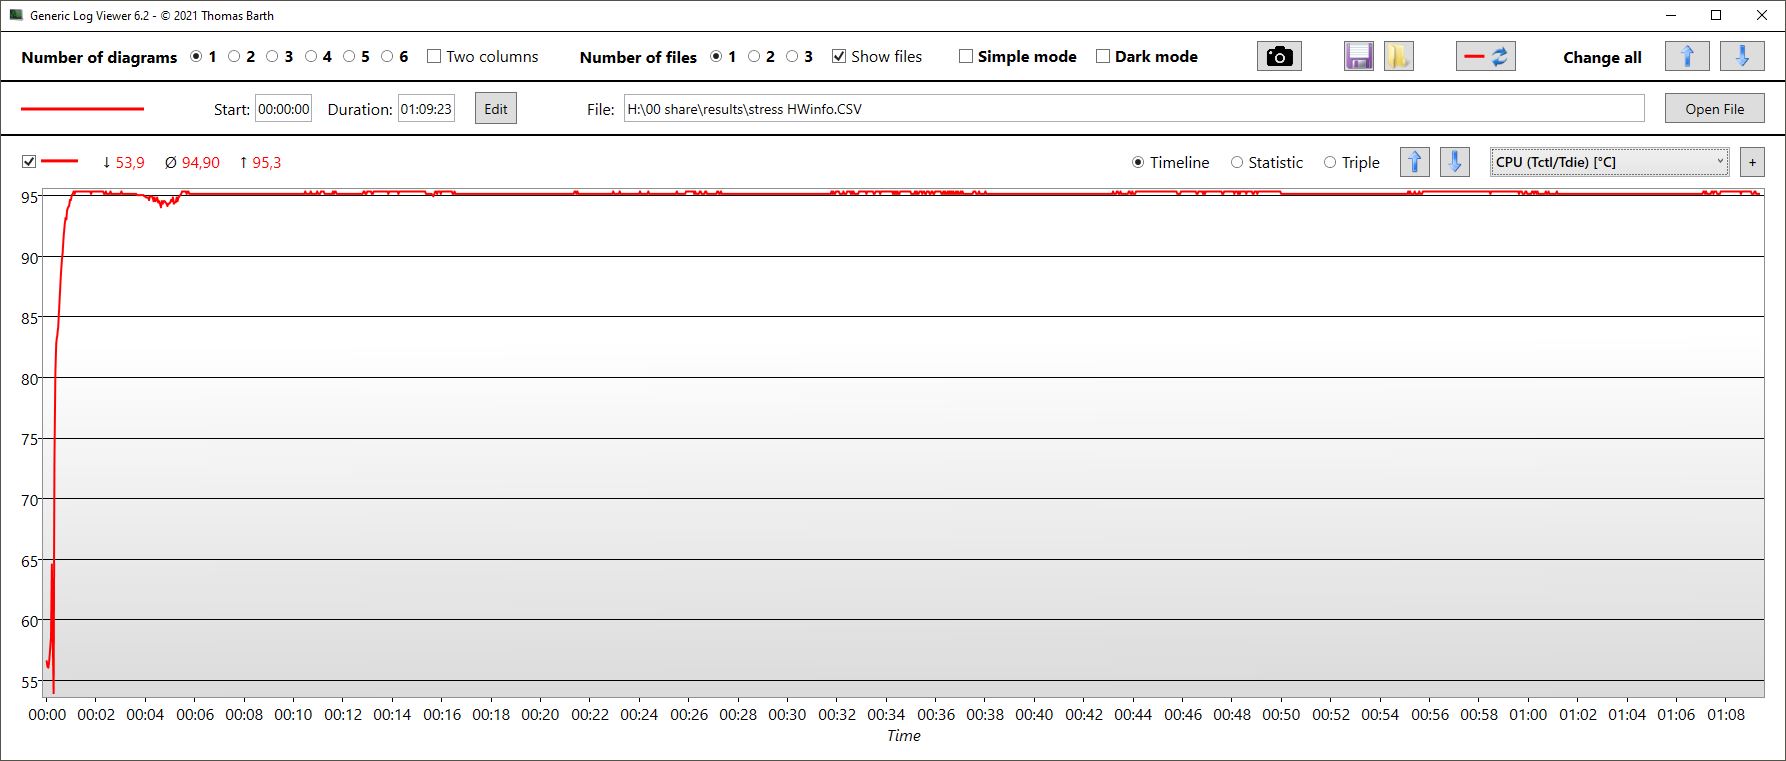
Contrairement à de nombreux systèmes basés sur Intel, la vitesse d'horloge du CPU du Neo a réussi à rester relativement stable pendant notre test de stress d'une heure. Les cœurs ont commencé le test à 4,1 GHz et ne sont pas descendus en dessous de 3,9 GHz. Ils ont également réussi à s'approcher occasionnellement de la valeur initiale. La température des cœurs est restée constante à 95°C (203°F), et la consommation électrique était de 64 watts en moyenne.
Les valeurs du GPU ont fluctué davantage en comparaison. Après avoir fonctionné initialement à 1,7 GHz, le GPU est parfois descendu à 1 GHz avant de revenir à la vitesse d'horloge initiale. La vitesse de la VRAM est restée constante pendant le test. La température du GPU s'est stabilisée autour de 78°C (172°F), tandis que la consommation électrique a rarement atteint l'objectif de 150 watts, avec une moyenne d'environ 114 watts.
| Fréquence CPU (GHz) | Fréquence GPU (MHz) | Température CPU moyenne (°C) | Température GPU moyenne (°C) | |
| Système au repos | -- | -- | 55 | 44 |
| Prime95 + FurMark Stress | 3.9 | 1,522 | 95 | 77 |
| Witcher 3 Stress | 3.1 | 1,550 | 67 | 83 |
Haut-parleurs
Schenker XMG Neo 15 (Ryzen 9 6900HX, RTX 3070 Ti) analyse audio
(±) | le niveau sonore du haut-parleur est moyen mais bon (78.26# dB)
Basses 100 - 315 Hz
(-) | presque aucune basse - en moyenne 19.2% plus bas que la médiane
(±) | la linéarité des basses est moyenne (8.2% delta à la fréquence précédente)
Médiums 400 - 2000 Hz
(±) | médiane supérieure - en moyenne 6.6% supérieure à la médiane
(±) | la linéarité des médiums est moyenne (9.9% delta à la fréquence précédente)
Aiguës 2 - 16 kHz
(+) | des sommets équilibrés - à seulement 2.8% de la médiane
(+) | les aigus sont linéaires (6% delta à la fréquence précédente)
Globalement 100 - 16 000 Hz
(±) | la linéarité du son global est moyenne (19.1% de différence avec la médiane)
Par rapport à la même classe
» 64% de tous les appareils testés de cette catégorie étaient meilleurs, 7% similaires, 28% pires
» Le meilleur avait un delta de 6%, la moyenne était de 18%, le pire était de 132%.
Par rapport à tous les appareils testés
» 46% de tous les appareils testés étaient meilleurs, 7% similaires, 47% pires
» Le meilleur avait un delta de 4%, la moyenne était de 24%, le pire était de 134%.
Asus ROG Strix Scar 15 G533ZW-LN106WS analyse audio
(±) | le niveau sonore du haut-parleur est moyen mais bon (80.5# dB)
Basses 100 - 315 Hz
(+) | bonne basse - seulement 3.7% loin de la médiane
(+) | les basses sont linéaires (5.5% delta à la fréquence précédente)
Médiums 400 - 2000 Hz
(±) | médiane supérieure - en moyenne 7.1% supérieure à la médiane
(+) | les médiums sont linéaires (3.1% delta à la fréquence précédente)
Aiguës 2 - 16 kHz
(+) | des sommets équilibrés - à seulement 3.3% de la médiane
(+) | les aigus sont linéaires (5.9% delta à la fréquence précédente)
Globalement 100 - 16 000 Hz
(+) | le son global est linéaire (12.2% différence à la médiane)
Par rapport à la même classe
» 13% de tous les appareils testés de cette catégorie étaient meilleurs, 4% similaires, 83% pires
» Le meilleur avait un delta de 6%, la moyenne était de 18%, le pire était de 132%.
Par rapport à tous les appareils testés
» 10% de tous les appareils testés étaient meilleurs, 2% similaires, 88% pires
» Le meilleur avait un delta de 4%, la moyenne était de 24%, le pire était de 134%.
Gestion de l'alimentation - le XMG Neo 15 a une excellente autonomie de batterie
Consommation électrique
L'ordinateur portable consomme entre 13 et 20 watts en mode veille, en fonction du profil de performance sélectionné et de la luminosité de l'écran. Il s'agit au mieux d'un résultat moyen dans notre comparaison.
Sur le site Witcher 3, le système consomme environ 200 watts, soit un peu plus que l'Asus ROG Strix, légèrement plus rapide.
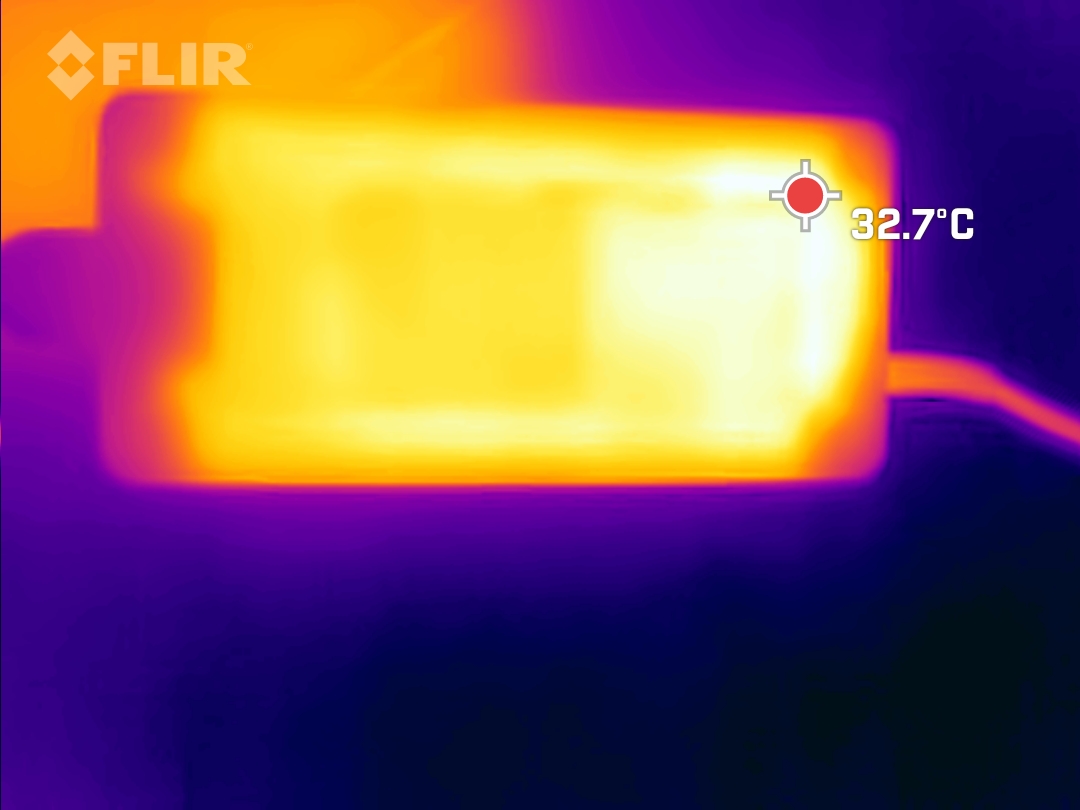
Pendant le test de stress, nous avons mesuré une consommation de pointe temporaire de 260 watts. Le gros chargeur de 280 watts peut facilement gérer les besoins en énergie de l'ordinateur portable, surtout si l'on considère que la consommation s'est stabilisée à 210 watts au cours du test de stress.
| Éteint/en veille | |
| Au repos | |
| Fortement sollicité |
|
Légende:
min: | |
| Schenker XMG Neo 15 (Ryzen 9 6900HX, RTX 3070 Ti) R9 6900HX, GeForce RTX 3070 Ti Laptop GPU, Samsung SSD 980 Pro 1TB MZ-V8P1T0BW, IPS, 2560x1440, 15.6" | Schenker XMG Neo 15 (i7-12700H, RTX 3080 Ti) i7-12700H, GeForce RTX 3080 Ti Laptop GPU, Samsung SSD 980 Pro 1TB MZ-V8P1T0BW, IPS, 2560x1440, 15.6" | MSI GE67 HX 12UGS i7-12800HX, GeForce RTX 3070 Ti Laptop GPU, Samsung PM9A1 MZVL21T0HCLR, OLED, 1920x1080, 15.6" | Asus ROG Strix Scar 15 G533ZW-LN106WS i9-12900H, GeForce RTX 3070 Ti Laptop GPU, Samsung PM9A1 MZVL22T0HBLB, IPS-level, 2560x1440, 15.6" | Acer Nitro 5 AN515-58-72QR i7-12700H, GeForce RTX 3070 Ti Laptop GPU, Samsung PM9A1 MZVL21T0HCLR, IPS, 2560x1440, 15.6" | MSI Stealth GS66 12UGS i7-12700H, GeForce RTX 3070 Ti Laptop GPU, WDC PC SN810 1TB, IPS-Level, 2560x1440, 15.6" | Moyenne NVIDIA GeForce RTX 3070 Ti Laptop GPU | Moyenne de la classe Gaming | |
|---|---|---|---|---|---|---|---|---|
| Power Consumption | -14% | -20% | 5% | 3% | 3% | -19% | -11% | |
| Idle Minimum * (Watt) | 13 | 15 -15% | 16.1 -24% | 7.56 42% | 7 46% | 11 15% | 14.2 ? -9% | 13.2 ? -2% |
| Idle Average * (Watt) | 17 | 18 -6% | 17.1 -1% | 13.5 21% | 15 12% | 16 6% | 19.9 ? -17% | 18.9 ? -11% |
| Idle Maximum * (Watt) | 20 | 18 10% | 26.6 -33% | 16.87 16% | 24 -20% | 23 -15% | 26.2 ? -31% | 24.3 ? -22% |
| Load Average * (Watt) | 89 | 123 -38% | 116.3 -31% | 128.9 -45% | 124 -39% | 110 -24% | 125.8 ? -41% | 108.3 ? -22% |
| Witcher 3 ultra * (Watt) | 200 | 234 -17% | 237 -19% | 196.2 2% | 195.1 2% | 151 24% | ||
| Load Maximum * (Watt) | 260 | 301 -16% | 291.1 -12% | 274.86 -6% | 220 15% | 230 12% | 248 ? 5% | 254 ? 2% |
* ... Moindre est la valeur, meilleures sont les performances
Power Consumption Witcher 3 / Stress test
Power Consumption with External Monitor
Durée de vie de la batterie
Schenker a doté l'ordinateur portable d'une batterie de 96Wh. À l'exception de l'Acer Nitro, tous les appareils de la comparaison ont des batteries de taille similaire.
Le XMG Neo 15 offre une excellente autonomie par rapport à la concurrence. Il semble que Schenker ait fait un bon travail de réglage des modes d'alimentation.
En tout cas, avec une luminosité d'écran réduite, l'ordinateur portable nous a fourni près de 11 heures de navigation sur le Web et de lecture de vidéos. Même avec la luminosité maximale de l'écran, nous avons réussi à surfer sur Internet pendant 8,5 heures en Wi-Fi.
| Schenker XMG Neo 15 (Ryzen 9 6900HX, RTX 3070 Ti) R9 6900HX, GeForce RTX 3070 Ti Laptop GPU, 93 Wh | Schenker XMG Neo 15 (i7-12700H, RTX 3080 Ti) i7-12700H, GeForce RTX 3080 Ti Laptop GPU, 93 Wh | MSI GE67 HX 12UGS i7-12800HX, GeForce RTX 3070 Ti Laptop GPU, 99.9 Wh | Asus ROG Strix Scar 15 G533ZW-LN106WS i9-12900H, GeForce RTX 3070 Ti Laptop GPU, 90 Wh | Acer Nitro 5 AN515-58-72QR i7-12700H, GeForce RTX 3070 Ti Laptop GPU, 57.5 Wh | MSI Stealth GS66 12UGS i7-12700H, GeForce RTX 3070 Ti Laptop GPU, 99.9 Wh | Moyenne de la classe Gaming | |
|---|---|---|---|---|---|---|---|
| Autonomie de la batterie | -23% | -9% | -29% | -48% | -25% | -22% | |
| H.264 (h) | 10.7 | 7.1 -34% | 8.5 -21% | 4.7 -56% | 8.26 ? -23% | ||
| WiFi v1.3 (h) | 10.9 | 7.7 -29% | 5.6 -49% | 8.4 -23% | 3.9 -64% | 5.4 -50% | 7.04 ? -35% |
| Load (h) | 1.6 | 1.5 -6% | 2.1 31% | 0.9 -44% | 1.2 -25% | 1.6 0% | 1.47 ? -8% |
| Reader / Idle (h) | 8.4 | 5.7 | 7.8 | 8.71 ? | |||
| Witcher 3 ultra (h) | 1.2 |
Points positifs
Points négatifs
Verdict - Intel ou AMD ? C'est une question de préférence.
Le Neo 15 est un excellent ordinateur portable de jeu, même avec un processeur AMD. En mode veille, le Neo basé sur AMD est beaucoup plus froid et a une meilleure autonomie que son homologue basé sur Intel. En revanche, les performances de son processeur sont légèrement inférieures et il n'est pas compatible avec Thunderbolt. Les consommateurs doivent décider ce qui est le plus important pour eux
Les performances de jeu de l'ordinateur portable se situent dans la moyenne supérieure, mais peuvent être encore améliorées en utilisant la large gamme de paramètres manuels disponibles.
Nous sommes impressionnés par la superbe autonomie de la batterie, mais nous sommes légèrement tiraillés sur certains aspects. Nous aimons les matériaux métalliques robustes utilisés sur l'écran et sur le clavier, mais le boîtier inférieur est trop souple à notre goût. L'appareil est doté d'une webcam Full HD, mais elle offre une qualité d'image tellement médiocre que de nombreux modèles 720p sont tout simplement capables de faire mieux. Il y a encore un peu de place pour l'amélioration ici. Cela dit, il s'agit d'une critique relativement mineure.
Le XMG Neo 15 avec AMD Ryzen est un ordinateur portable de jeu performant, sans inconvénients majeurs, qui dispose d'une connexion pour un refroidissement externe par eau en option. Néanmoins, certaines des nombreuses bonnes idées de l'ordinateur portable peuvent encore être affinées.
Si vous cherchez des alternatives, nous vous recommandons particulièrement le MSI GE6 HX 12UGSqui est en avance dans presque tous les tests de performance et qui n'est pas plus mauvais en termes d'émissions. Vous pouvez également consulter le Asus ROG Strix Scarun ordinateur portable qui est au coude à coude avec le Neo 15.
Prix et disponibilité
Le Neo 15 peut être configuré de nombreuses façons sur la boutique en ligne de XMG (bestware.com). Le modèle que nous avons testé, , coûte 2 877 euros (2 850 dollars) sur le site Web. Vous pouvez économiser près de 500 euros (495 dollars) en optant pour une RTX 3060 au lieu d'une RTX 3070 Ti ! Si vous faites le tour des sites de comparaison, vous pourrez parfois trouver l'ordinateur portable à un prix légèrement inférieur.
Schenker XMG Neo 15 (Ryzen 9 6900HX, RTX 3070 Ti)
- 10/26/2022 v7 (old)
Christian Hintze
Price comparison

