Intel Core i5-11320H
L'Intel Core i5-11320H est un SoC de milieu de gamme destiné aux ordinateurs portables de jeu légers et aux stations de travail mobiles. Il est basé sur la génération de rafraîchissement Tiger Lake H35 et sera annoncé au troisième trimestre 2021. Il intègre quatre cœurs de processeur Willow Cove (8 threads grâce à l'HyperThreading). La vitesse d'horloge de base dépend du réglage du TDP et peut varier de 2,5 (28 W TDP) à 3,2 GHz (35 W). Le boost d'un seul et de deux cœurs sous charge peut atteindre jusqu'à 4,5 GHz. Les quatre cœurs peuvent atteindre jusqu'à 4,3 GHz. Le cache L3 est réduit à 8 Mo, contre 12 Mo pour les modèles i7 haut de gamme.
Grâce à l'amélioration des fréquences d'horloge, l'écart de performance avec le i7-11370H, plus rapide, devrait être assez faible. Le i7 offre toujours des vitesses turbo plus élevées pour les cœurs simples et doubles et plus de cache L3.
Le SoC comprend également la carte graphique Xe améliorée avec 96 CU cadencées jusqu'à 1350 MHz.
En outre, les SoC Tiger Lake ajoutent la prise en charge de PCIe 4 (quatre voies), l'accélération matérielle AI et l'intégration partielle de Thunderbolt 4/USB 4 et Wi-Fi 6 dans la puce.
La puce est produite dans le processus amélioré de 10 nm (appelé 10 nm SuperFin) chez Intel, qui devrait être comparable au processus de 7 nm chez TSMC (par exemple, la série Ryzen 4000).
Gamme Intel Tiger Lake Nom de code Tiger Lake H35 Refresh Gamme: Tiger Lake Tiger Lake H35 Refresh Fréquence 3200 - 4500 MHz Cache de Niveau 1 (L1) 320 KB Cache de Niveau 2 (L2) 5 MB Cache de Niveau 3 (L3) 8 MB Nombres de cœurs/threads simultanés supportés 4 / 8 Consommation énergétique maximale (TDP) 35 Watt(s) Lithographie (procédé de fabrication) 10 nm Température maximale 100 °C Socket BGA1499 Fonctionnalités DL Boost, GNA, Wi-Fi 6/6e, Thunderbolt 4, DDR4-3200 / LPDDR4x-4266 Carte graphique Intel Iris Xe Graphics G7 96EUs (400 - 1350 MHz)64 Bit Prend en charge les instructions 64 Bit Architecture x86 Date de présentation 09/01/2021 Lien redirigeant vers une page externe du produit Intel Tiger Lake i5-11320H
Benchmarks Performance Rating - CB R15 + R20 + 7-Zip + X265 + Blender + 3DM11 CPU
41.3 pt (46%)
...
Intel Core i5-1230U
Intel Core i7-9750H
Intel Core i3-1215U
...
AMD Ryzen 9 7945HX
Cinebench R23 - Cinebench R23 Multi Core
min: 5720 moyenne: 5869 médian: 5852 (10%) maximum: 6051 Points
...
Intel Core i3-1215U
Intel Core i5-1230U
...
AMD Ryzen 9 7945HX
Cinebench R23 - Cinebench R23 Single Core
min: 1341 moyenne: 1432 médian: 1460.5 (64%) maximum: 1467 Points
...
AMD Ryzen 7 7730U
Intel Core i5-1230U
AMD Ryzen 5 7530U
...
Intel Core i9-13980HX
Cinebench R20 - Cinebench R20 CPU (Single Core)
min: 557 moyenne: 561 médian: 560.5 (64%) maximum: 567 Points
...
AMD Ryzen 7 7730U
AMD Ryzen 5 7530U
...
Intel Core i9-13980HX
Cinebench R20 - Cinebench R20 CPU (Multi Core)
min: 2208 moyenne: 2273 médian: 2267.5 (10%) maximum: 2349 Points
...
Apple M1
Intel Core i3-1215U
Intel Core i5-1230U
Apple M2
Intel Core i7-9750H
...
Intel Core i9-13980HX
Cinebench R15 - Cinebench R15 CPU Multi 64 Bit
min: 857 moyenne: 922 médian: 905.5 (9%) maximum: 1019 Points
...
Intel Core i5-1230U
Apple M1
Intel Xeon E-2176M
...
AMD Ryzen 9 7945HX
0 55 110 165 220 275 330 385 440 495 550 605 660 715 770 825 880 935 990 Tooltip Beelink SEi11 Pro: Ø851 (845.25-856.84)
Trigkey Speed S: Ø854 (839.91-860.88)
Minisforum EliteMini TH50: Ø896 (837.78-960.71)
Acer Swift X SFX16-51G-5388: Ø922 (904.81-1019.24)
Cinebench R15 - Cinebench R15 CPU Single 64 Bit
min: 212 moyenne: 213.8 médian: 214 (65%) maximum: 215 Points
...
Apple M1
Intel Core i7-1260U
Apple M2
...
Intel Core i9-13980HX
Cinebench R11.5 - Cinebench R11.5 CPU Multi 64 Bit
10.8 Points (15%)
...
Intel Core i5-9400H
Intel Core i3-1215U
Intel Xeon E-2176M
...
AMD Ryzen 9 7945HX
Cinebench R11.5 - Cinebench R11.5 CPU Single 64 Bit
2.5 Points (8%)
...
...
Cinebench R10 - Cinebench R10 Rend. Single (32bit)
8767 points (72%)
...
Intel Core i5-1245U
AMD Ryzen 9 7945HX
Intel Core i7-1265U
Intel Core i5-13500HX
Intel Core i9-12900HX
...
Intel Core i9-13980HX
Cinebench R10 - Cinebench R10 Rend. Multi (32bit)
32576 points (35%)
...
AMD Ryzen 7 7730U
Intel Core i7-9750H
...
Intel Core i9-13980HX
Cinebench R10 - Cinebench R10 Rend. Multi (64bit)
42350 Points (30%)
...
Intel Core i7-9750H
Intel Core i3-1215U
AMD Ryzen 7 7730U
Intel Core i7-1265U
...
Intel Core i9-13980HX
Cinebench R10 - Cinebench R10 Rend. Single (64bit)
11457 Points (62%)
...
AMD Ryzen 7 7730U
...
Intel Core i9-13980HX
wPrime 2.10 - wPrime 2.0 1024m *
191.4 s (2%)
...
AMD Ryzen 9 7945HX
Intel Xeon E-2176M
Intel Core i9-13980HX
...
VIA C3-M C3-M-1200
wPrime 2.10 - wPrime 2.0 32m *
5.9 s (1%)
...
AMD Ryzen 9 7945HX
Intel Core i7-9750H
Intel Core i7-1265U
Intel Xeon E-2176M
Intel Core i5-1245U
...
5481 points (32%)
...
AMD Ryzen 7 7730U
...
7-Zip 18.03 - 7-Zip 18.03 Multli Thread 4 runs
min: 24718 moyenne: 25274 médian: 24760 (15%) maximum: 26858 MIPS
...
Intel Core i3-1215U
Intel Core i5-1230U
...
AMD Ryzen 9 7945HX
7-Zip 18.03 - 7-Zip 18.03 Single Thread 4 runs
min: 4813 moyenne: 4996 médian: 5025 (60%) maximum: 5119 MIPS
...
Intel Core i7-1250U
Intel Core i7-9750H
Intel Core i3-1215U
Intel Core i5-1245U
...
AMD Ryzen 9 7945HX
HWBOT x265 Benchmark v2.2 - HWBOT x265 4k Preset
min: 7.25 moyenne: 7.6 médian: 7.6 (16%) maximum: 7.91 fps
...
Intel Core i5-1230U
...
AMD Ryzen 9 7945HX
0 1 2 3 4 5 6 7 8 9 10 11 12 13 14 15 16 17 Tooltip Trigkey Speed S: Ø7.67 (0.93-13.9)
Beelink SEi11 Pro: Ø7.66 (0.94-13.8)
Minisforum EliteMini TH50: Ø8.56 (1.09-16.3)
Acer Swift X SFX16-51G-5388: Ø8.74 (1.1-17.2)
TrueCrypt - TrueCrypt Serpent
0.5 GB/s (0%)
...
...
AMD Ryzen 9 7945HX
TrueCrypt - TrueCrypt Twofish
0.9 GB/s (0%)
...
...
Intel Core i9-13980HX
TrueCrypt - TrueCrypt AES
6.1 GB/s (0%)
...
Intel Xeon E-2176M
...
AMD Ryzen 9 7945HX
Blender - Blender 3.3 Classroom CPU *
min: 937 moyenne: 981 médian: 995 (13%) maximum: 1010 Seconds
...
Intel Core i7-1260U
Intel Core i7-1250U
Intel Core i7-1265U
Apple M1
Intel Core i5-1230U
Intel Core i3-1215U
...
Blender - Blender 2.79 BMW27 CPU *
min: 507 moyenne: 527 médian: 528.5 (4%) maximum: 543 Seconds
...
Intel Core i7-1265U
Intel Core i5-1230U
Intel Xeon E-2176M
Apple M1
...
R Benchmark 2.5 - R Benchmark 2.5 *
min: 0.581 moyenne: 0.6 médian: 0.6 (13%) maximum: 0.622 sec
...
...
3DMark 06 - CPU - 3DMark 06 - CPU
10886 Points (23%)
...
Intel Core i7-9750H
...
Intel Core i9-13980HX
Super Pi mod 1.5 XS 1M - Super Pi mod 1.5 XS 1M *
7.5 s (2%)
...
Intel Core i9-12900HX
Intel Core i3-1215U
Intel Core i9-13980HX
Intel Core i5-13500HX
...
VIA C3-M C3-M-1200
Super Pi mod 1.5 XS 2M - Super Pi mod 1.5 XS 2M *
16.8 s (1%)
...
Intel Core i3-1215U
Intel Core i9-12900HX
Intel Core i5-13500HX
...
Super Pi Mod 1.5 XS 32M - Super Pi mod 1.5 XS 32M *
389.7 s (2%)
...
Intel Core i7-13650HX
Intel Core i3-1215U
Intel Core i7-1360P
Intel Core i9-12900HX
Intel Core i7-13620H
Intel Core i5-13500HX
...
VIA C3-M C3-M-1200
3DMark Vantage - 3DM Vant. Perf. CPU no Physx
33603 Points (31%)
...
Intel Core i7-1265U
Intel Xeon E-2176M
...
AMD Ryzen 9 7945HX
3DMark 11 - 3DM11 Performance Physics
min: 10666 moyenne: 11334 médian: 11312 (31%) maximum: 12324 Points
...
Intel Core i5-1230U
Intel Xeon E-2176M
...
Intel Core i7-13700HX
3DMark - 3DMark Ice Storm Physics
min: 66612 moyenne: 66703 médian: 66702.5 (43%) maximum: 66793 Points
...
Intel Core i7-1265U
Intel Core i5-1245U
...
3DMark - 3DMark Ice Storm Extreme Physics
min: 66629 moyenne: 67222 médian: 67221.5 (56%) maximum: 67814 Points
...
Intel Core i7-1265U
Intel Core i5-1245U
AMD Ryzen 9 5980HS
...
Intel Core i9-12900HX
3DMark - 3DMark Ice Storm Unlimited Physics
min: 70639 moyenne: 70683 médian: 70683 (60%) maximum: 70727 Points
...
Intel Core i7-1265U
Intel Core i5-1245U
Intel Core i9-13950HX
...
Intel Core i9-12900HX
3DMark - 3DMark Cloud Gate Physics
min: 8860 moyenne: 9380 médian: 9363 (24%) maximum: 10187 Points
...
Intel Core i5-1230U
Intel Core i7-1265U
...
AMD Ryzen 9 7945HX
3DMark - 3DMark Fire Strike Standard Physics
min: 13123 moyenne: 13891 médian: 13763 (25%) maximum: 14950 Points
...
Intel Xeon E-2176M
Intel Core i7-1250U
Intel Core i3-1215U
Intel Core i5-1230U
Intel Core i7-1265U
...
Intel Core i7-13700HX
3DMark - 3DMark Time Spy CPU
min: 4803 moyenne: 5132 médian: 5199 (26%) maximum: 5637 Points
...
Intel Core i7-1265U
...
Intel Core i7-13700HX
Geekbench 5.4 - Geekbench 5.1 - 5.4 64 Bit Single-Core
min: 1453 moyenne: 1497 médian: 1505 (65%) maximum: 1523 points
...
AMD Ryzen 7 7730U
AMD Ryzen 7 7736U
AMD Ryzen 9 5980HS
...
AMD Ryzen 9 7945HX
Geekbench 5.4 - Geekbench 5.1 - 5.4 64 Bit Multi-Core
min: 4927 moyenne: 5375 médian: 5308 (18%) maximum: 5955 points
...
Intel Core i7-9750H
...
Intel Core i9-13900HX
Geekbench 5.0 - Geekbench 5.0 64 Bit Single-Core
min: 1453 moyenne: 1488 médian: 1493.5 (6%) maximum: 1510 points
...
Intel Core i3-1215U
AMD Ryzen 9 5980HS
...
Intel Core i9-13900HX
Geekbench 5.0 - Geekbench 5.0 64 Bit Multi-Core
min: 4864 moyenne: 5318 médian: 5259 (17%) maximum: 5890 points
...
Intel Core i7-9750H
...
Intel Core i9-13900HX
Geekbench 4.1 - 4.4 - Geekbench 4.1 - 4.4 64 Bit Single-Core
6238 points (64%)
...
AMD Ryzen 7 7730U
AMD Ryzen 9 5980HS
...
Intel Core i9-13900HX
Geekbench 4.1 - 4.4 - Geekbench 4.1 - 4.4 64 Bit Multi-Core
22045 points (25%)
...
Intel Xeon E-2176M
Intel Core i7-9750H
Intel Core i3-1215U
...
Intel Core i9-13900HX
Mozilla Kraken 1.1 - Kraken 1.1 Total Score *
min: 662 moyenne: 669 médian: 666.5 (1%) maximum: 680 ms
...
AMD Ryzen 7 7730U
...
Octane V2 - Octane V2 Total Score
67714 Points (65%)
...
AMD Ryzen 9 5980HS
AMD Ryzen 7 7730U
...
Intel Core i9-13900HX
WebXPRT 4 - WebXPRT 4 Score
min: 202 moyenne: 204.7 médian: 206 (61%) maximum: 206 Points
...
AMD Ryzen 7 7736U
Intel Core i7-1260U
Intel Core i3-1215U
...
Intel Core i9-13980HX
WebXPRT 3 - WebXPRT 3 Score
min: 243 moyenne: 258.3 médian: 260.5 (64%) maximum: 269 Points
...
AMD Ryzen 7 7736U
Intel Core i3-1215U
Intel Core i5-1340P
Apple M1
...
Apple M2 Max
CrossMark - CrossMark Overall
min: 1300 moyenne: 1331 médian: 1326 (51%) maximum: 1371 Points
...
Apple M1
AMD Ryzen 7 7730U
Intel Core i3-1215U
Intel Core i5-1230U
...
Intel Core i9-12900HX
Power Consumption - Prime95 Power Consumption - external Monitor *
min: 52.5 moyenne: 54.2 médian: 52.8 (9%) maximum: 58.6 Watt
...
Intel Core i7-1360P
Intel Core i5-1245U
AMD Ryzen 7 7736U
...
Intel Core i7-12800HX
0 5 10 15 20 25 30 35 40 45 50 55 60 65 70 Tooltip Acer Swift X SFX16-51G-5388: Ø52.5 (47.9-73.5)
Minisforum EliteMini TH50: Ø52.7 (45.8-72.1)
Trigkey Speed S: Ø52.9 (50.9-54.1)
Beelink SEi11 Pro: Ø58.6 (57.2-59.1)
Power Consumption - Cinebench R15 Multi Power Consumption - external Monitor *
min: 47.3 moyenne: 53.5 médian: 51 (11%) maximum: 64.5 Watt
...
Intel Core i7-1265U
Intel Core i5-1340P
...
Intel Core i7-12800HX
0 5 10 15 20 25 30 35 40 45 50 55 60 65 70 75 Tooltip Trigkey Speed S: Ø47.3 (46.4-48)
Minisforum EliteMini TH50: Ø49.6 (47.4-62.4)
Beelink SEi11 Pro: Ø52.4 (49.2-53.2)
Acer Swift X SFX16-51G-5388: Ø64.5 (53.2-77.5)
Power Consumption - Idle Power Consumption - external Monitor *
min: 8.12 moyenne: 8.1 médian: 8.1 (8%) maximum: 8.16 Watt
...
Intel Core i7-1265U
Intel Atom x7-Z8750
Intel Processor N95
Intel Core i7-1250U
Intel Core i7-1360P
...
0 1 2 3 4 5 6 7 8 9 10 11 12 13 14 Tooltip Trigkey Speed S: Ø8.12 (7.76-10.1)
Minisforum EliteMini TH50: Ø8.16 (7.66-14)
Power Consumption - Idle Power Consumption 150cd 1min *
6.4 Watt (8%)
...
Intel Core i5-1340P
...
0 1 2 3 4 5 6 7 8 9 10 Tooltip Acer Swift X SFX16-51G-5388: Ø6.37 (3.11-10)
Power Consumption - Cinebench R15 Multi Power Efficiency - external Monitor
min: 15.8 moyenne: 17.4 médian: 17.3 (20%) maximum: 19.2 Points per Watt
...
Intel Core i7-12800HX
Intel Core i3-1215U
Intel Core i7-13700HX
Intel Core i9-13900H
...
- Amplitude des valeurs obtenues dans le benchmark avec cette carte graphique
- Valeur moyenne obtenue dans le benchmark avec cette carte graphique
* Plus les chiffres sont petits, plus les performances sont élevées
v1.22
log 27. 01:21:03
#0 no ids found in url (should be separated by "_") +0s ... 0s
#1 not redirecting to Ajax server +0s ... 0s
#2 did not recreate cache, as it is less than 5 days old! Created at Sat, 25 Mar 2023 14:08:33 +0100 +0.002s ... 0.002s
#3 no comparison url found in template nbc.compare_page_2 needed +0.009s ... 0.01s
#4 composed specs +0s ... 0.011s
#5 did output specs +0s ... 0.011s
#6 getting avg benchmarks for device 13169 +0.014s ... 0.024s
#7 got single benchmarks 13169 +0.024s ... 0.049s
#8 got avg benchmarks for devices +0s ... 0.049s
#9 min, max, avg, median took s +0.687s ... 0.735s
#10 no comparison url found in template nbc.compare_page_2 needed +0s ... 0.735s
#11 return log +0s ... 0.735s
Critiques du Intel Core i5-11320H processeur
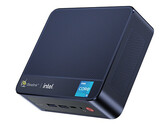
Test du mini PC Beelink SEi11 : Moins cher qu'un Intel NUC 11 mais tout aussi rapide Les alternatives NUC peuvent être un sac mitigé la plupart du temps, mais le Beelink SEi11 se rapproche terriblement d'un NUC à part entière tout en coûtant des...
Intel Core i5-11320H | Intel Iris Xe Graphics G7 96EUs | | 440 g
Test de l'Acer Swift X 16 : la RTX 3050 brille dans un PC portable multimédia L'Acer Swift X 16 compact est adapté aux jeux mobiles en Full HD grâce à la RTX 3050 de Nvidia et à sa dalle de 16 pouces. Notre examen révélera si le 16:9 peut...
Intel Core i5-11320H | NVIDIA GeForce RTX 3050 4GB Laptop GPU | 16.10" | 1.8 kg
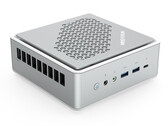
Test du Minisforum EliteMini TH50 : PC de bureau compact à utiliser au quotidien au bureau Avec le EliteMini TH50, le fabricant Minisforum propose un PC de travail à base d'Intel solide comme le roc. Grâce à Thunderbolt, la gamme d'applications a été ...
Intel Core i5-11320H | Intel Iris Xe Graphics G7 96EUs | | 763 g
Lenovo IdeaPad Gaming 3 15IHU6-82K1019DSP : NVIDIA GeForce GTX 1650 Mobile, 15.60", 2.3 kg
Autres tests » Lenovo IdeaPad Gaming 3 15IHU6-82K1019DSP
Dell Inspiron 15 5518-NP37P : NVIDIA GeForce MX450, 15.60", 1.8 kg
Autres tests » Dell Inspiron 15 5518-NP37P
realme Book Prime : Intel Iris Xe Graphics G7 96EUs, 14.00", 1.4 kg
Autres tests » realme Book Prime
Dell Vostro 14 5410, i5 : Intel Iris Xe Graphics G7 96EUs, 14.00", 1.4 kg
Autres tests » Dell Vostro 14 5410, i5
Xiaomi RedmiBook Pro 15, i5-11320H iGPU : Intel Iris Xe Graphics G7 96EUs, 15.60", 1.7 kg
Autres tests » Xiaomi RedmiBook Pro 15, i5-11320H iGPU
Honor MagicBook View 14, i5-11320H : Intel Iris Xe Graphics G7 96EUs, 14.20", 1.5 kg
Autres tests » Honor MagicBook View 14, i5-11320H
Please share our article, every link counts!
.170
Les autres processeurs de la gamme Tiger Lake » Intel Celeron 6205 2x
Processeurs similaires + Intel Core i5-1334U 10x 0.9 GHz - 4.6 GHz
- Intel Core i5-1240U 10x 0.8 GHz - 4.4 GHz
- Intel Core i5-1230U 10x 0.7 GHz - 4.4 GHz
- Intel Core i3-1315U 6x 0.9 GHz - 4.5 GHz
- Intel Core i3-1215U 6x 0.9 GHz - 4.4 GHz
Klaus Hinum (Update: 2022-04- 2)