 Deutsch
 English
 Español
 Français
 Italiano
 Nederlands
 Polski
 Português
 Русский
 Türkçe
 Svenska
 Chinese
 Magyar
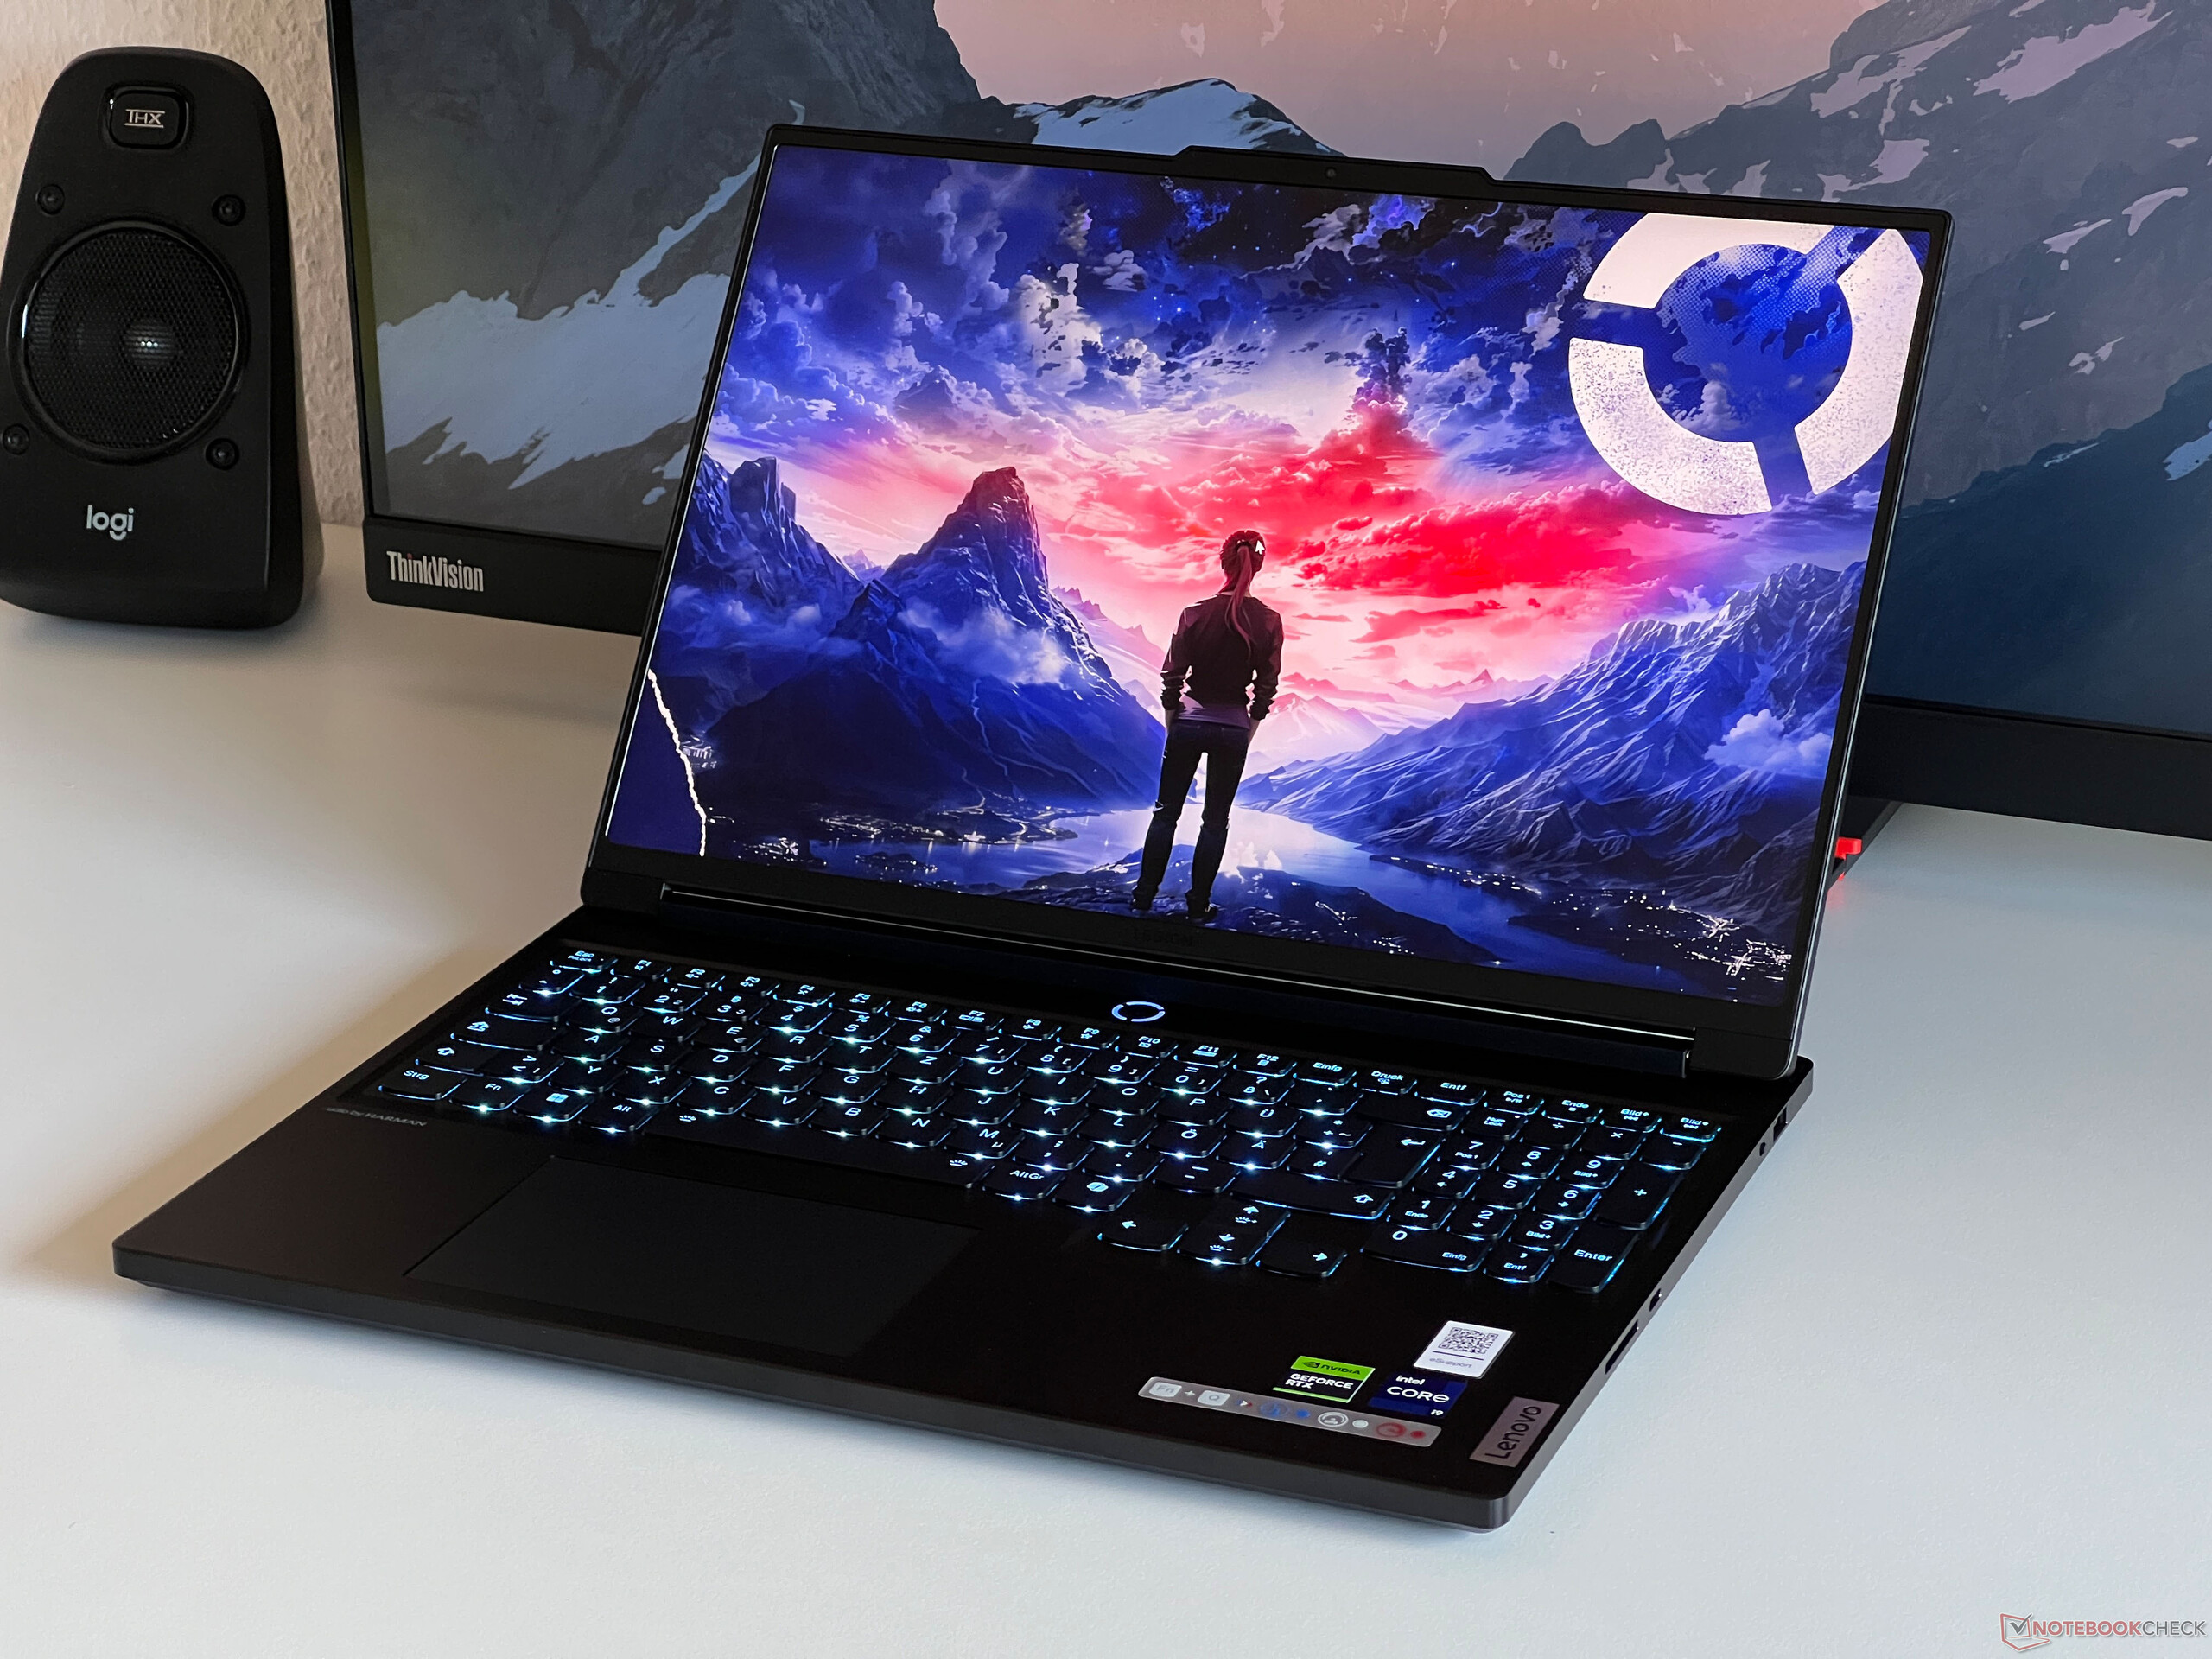
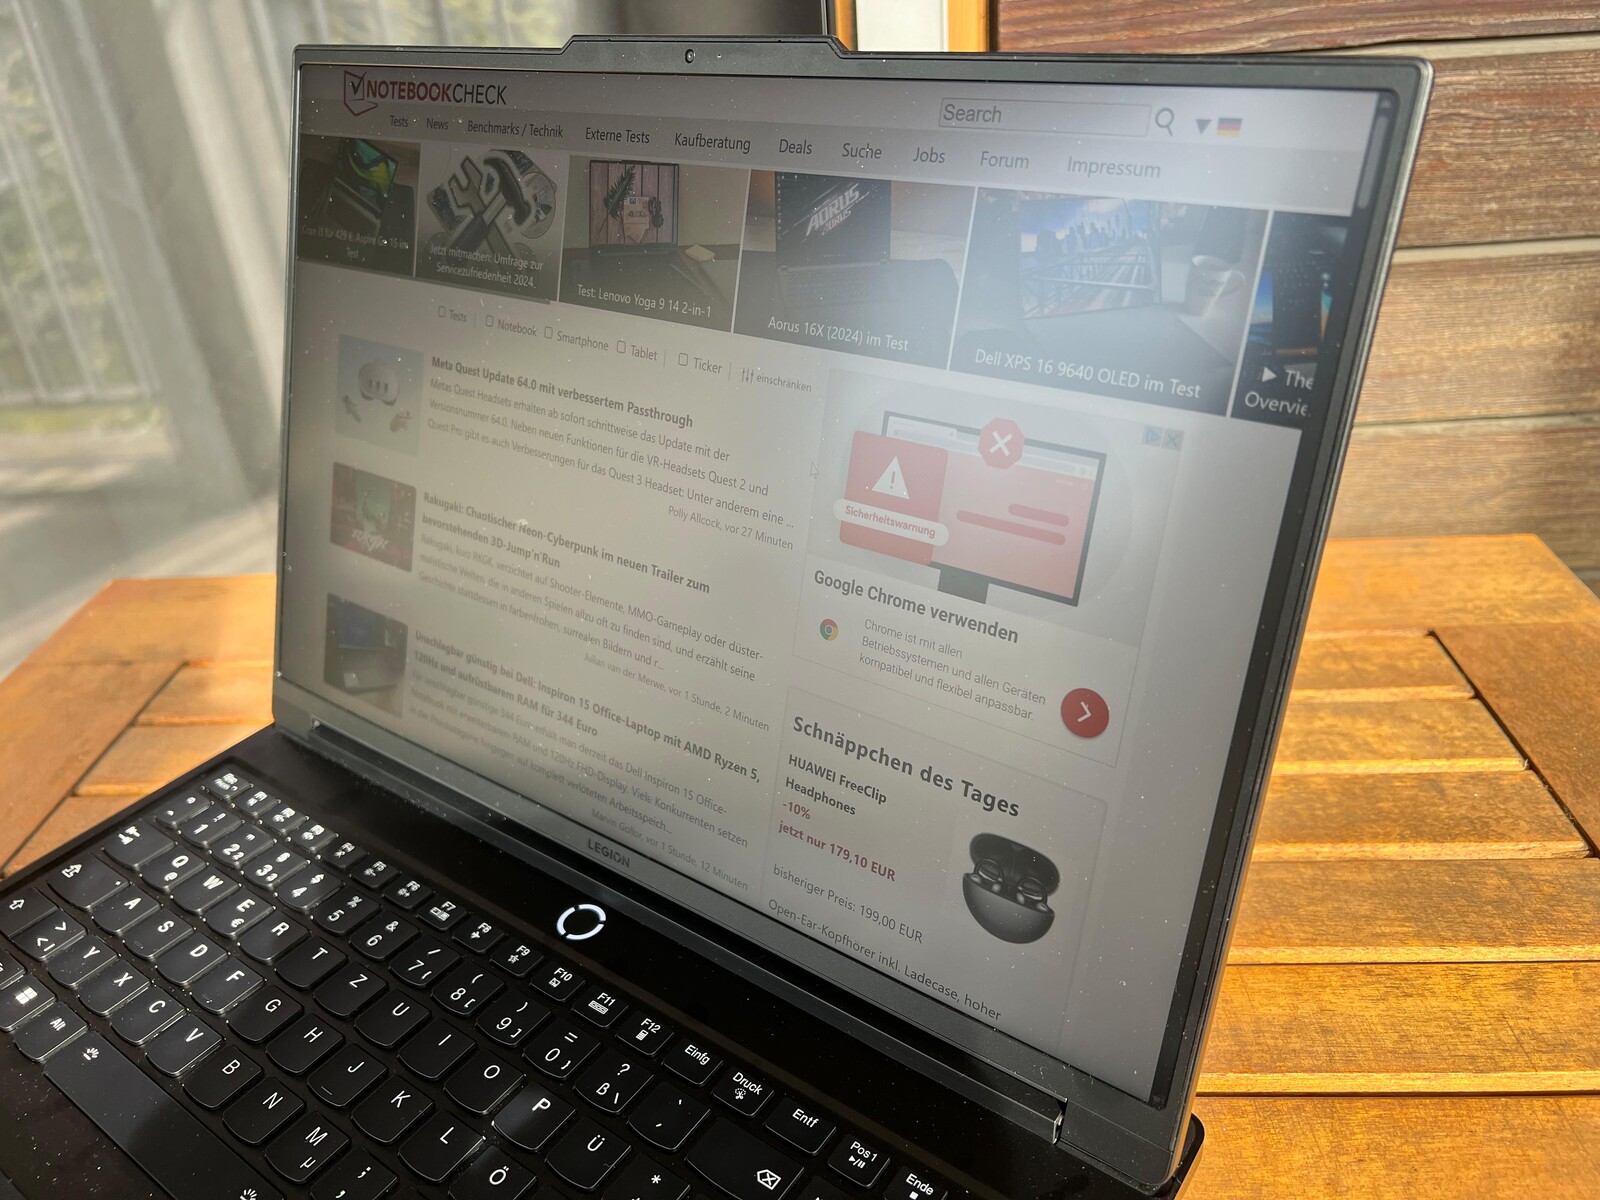
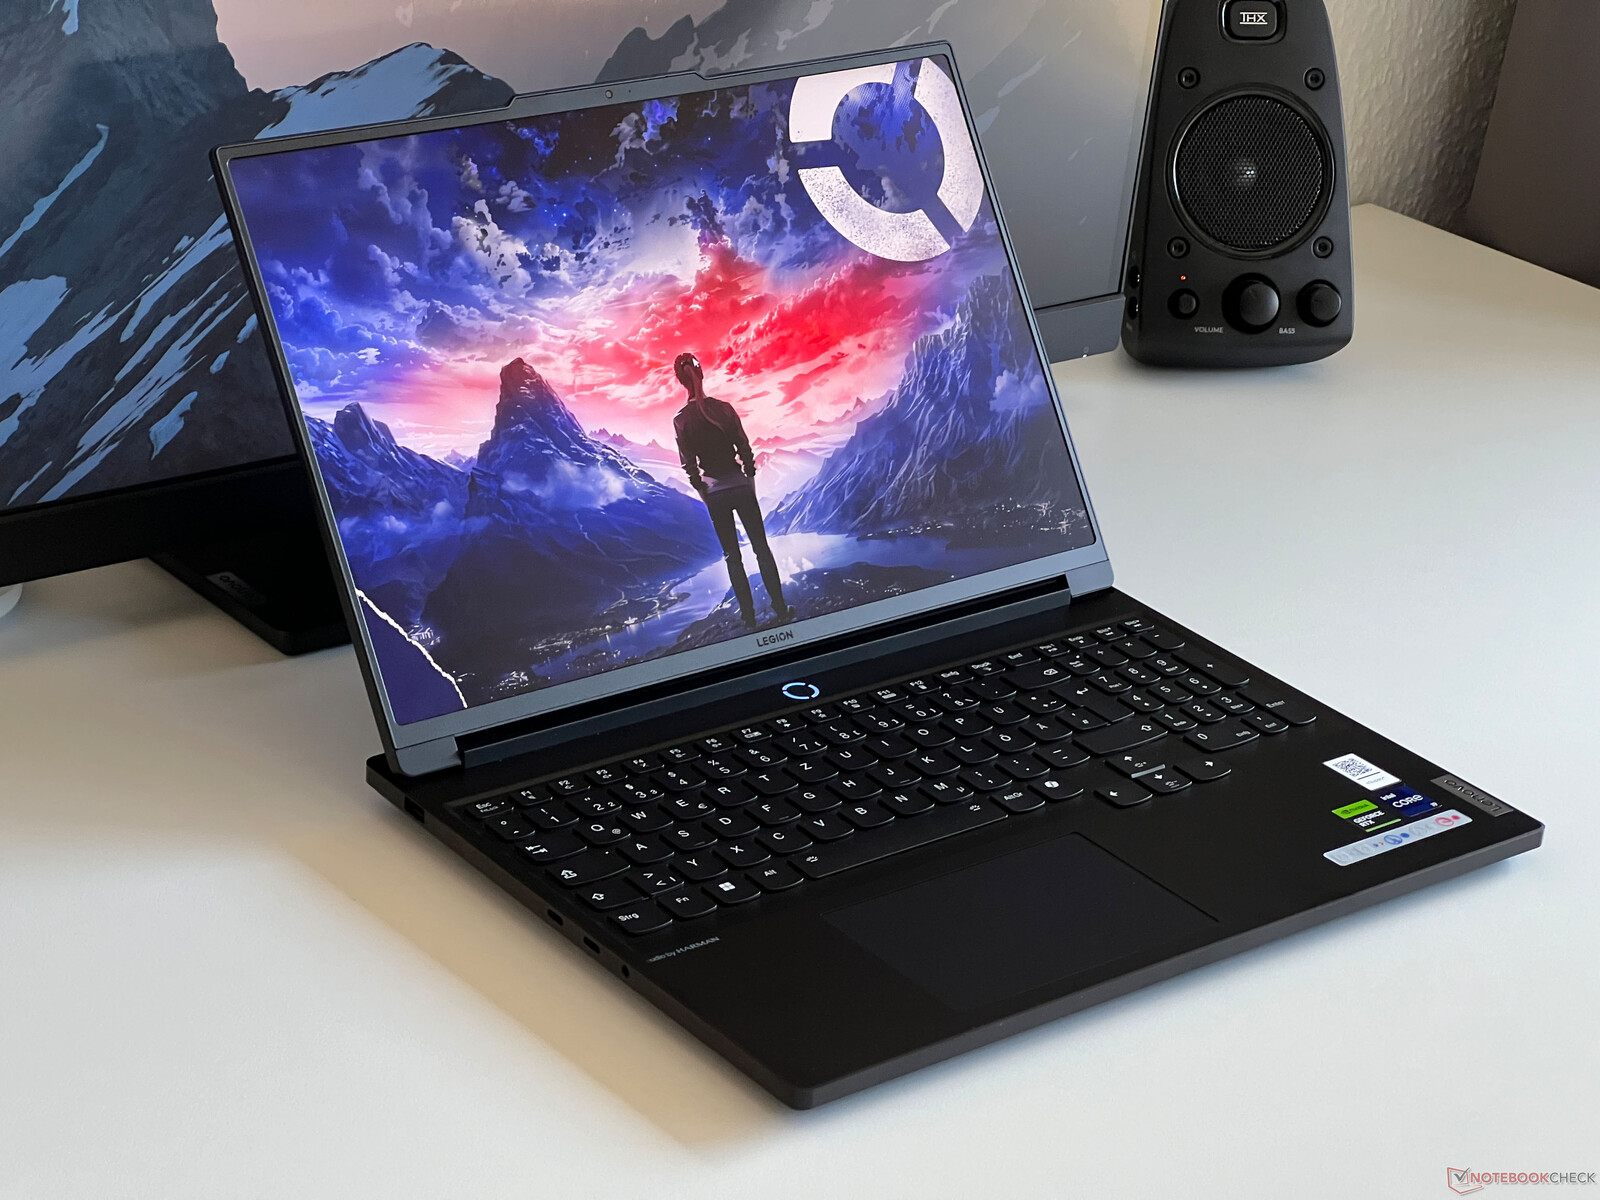
Test du Lenovo Legion 7 16 G9 : du jeu avec écran 3,2K, processeur HX et RTX 4070 overclockée
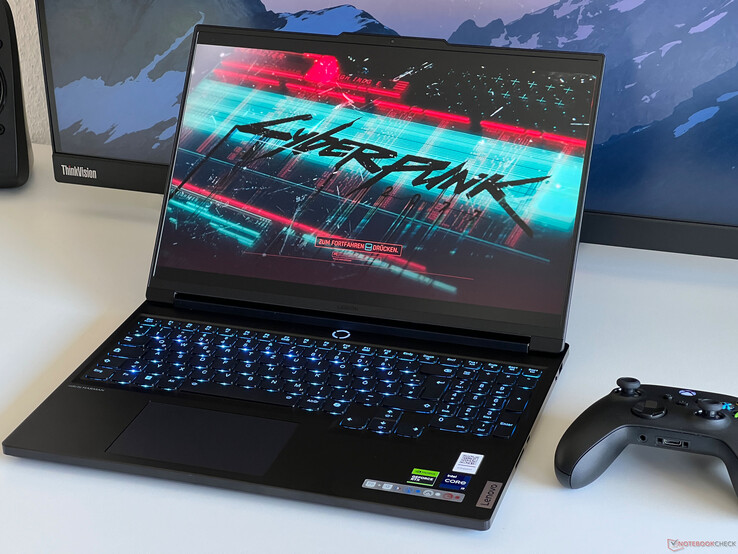
Le Legion 7 16 est le Legion Pro 7 16 moins cher et plus fin, que nous avons récemment testé. Il y a des différences, surtout en ce qui concerne les cartes graphiques, le GPU maximum disponible du Legion 7 normal étant la RTX 4070 pour ordinateur portable. Cependant, en termes de processeur, les mêmes puces Intel HX sont utilisées et, en plus des panneaux WQHD, il y a un panneau IPS 3.2K haute résolution 165 Hz en option.
L'appareil que nous avons examiné est la variante Campus à 2 249 $, équipée d'un processeur Core i9-14900HXGeForce RTX 4070, 32 Go de RAM, un disque dur de 1 To et un écran 3.2K. Actuellement, il n'y a pas encore de variantes correspondantes pour les clients ordinaires, mais le prix devrait être supérieur d'environ 250 à 300 dollars.
Comparaison avec les concurrents potentiels
Note | Date | Modèle | Poids | Épaisseur | Taille | Résolution | Meilleur prix |
|---|---|---|---|---|---|---|---|
| 90.8 % | 04/24 | Lenovo Legion 7 16 IRX G9 i9-14900HX, NVIDIA GeForce RTX 4070 Laptop GPU | 2.3 kg | 19.8 mm | 16.00" | 3200x2000 | |
| 89.3 % | 04/24 | Lenovo Legion Pro 5 16IRX9 i9-14900HX, NVIDIA GeForce RTX 4070 Laptop GPU | 2.5 kg | 26.95 mm | 16.00" | 2560x1600 | |
| 87.4 % | 04/24 | Aorus 16X 2024 i9-14900HX, NVIDIA GeForce RTX 4070 Laptop GPU | 2.3 kg | 20 mm | 16.00" | 2560x1600 | |
| 88.4 % | 02/24 | HP Omen Transcend 16-u1095ng i9-14900HX, NVIDIA GeForce RTX 4070 Laptop GPU | 2.3 kg | 20 mm | 16.00" | 2560x1600 | |
| 90.2 % | 03/24 | Alienware m16 R2 Ultra 7 155H, NVIDIA GeForce RTX 4070 Laptop GPU | 2.5 kg | 23.5 mm | 16.00" | 2560x1600 | |
| 89.2 % | 10/23 | SCHENKER XMG CORE 16 (L23) R7 7840HS, NVIDIA GeForce RTX 4070 Laptop GPU | 2.4 kg | 26.1 mm | 16.00" | 2560x1600 | |
| 89.5 % | 03/24 | Lenovo Legion Pro 7 16IRX9H i9-14900HX, NVIDIA GeForce RTX 4080 Laptop GPU | 2.7 kg | 21.95 mm | 16.00" | 2560x1600 |
Boîtier - Un aimant à empreintes digitales en aluminium noir
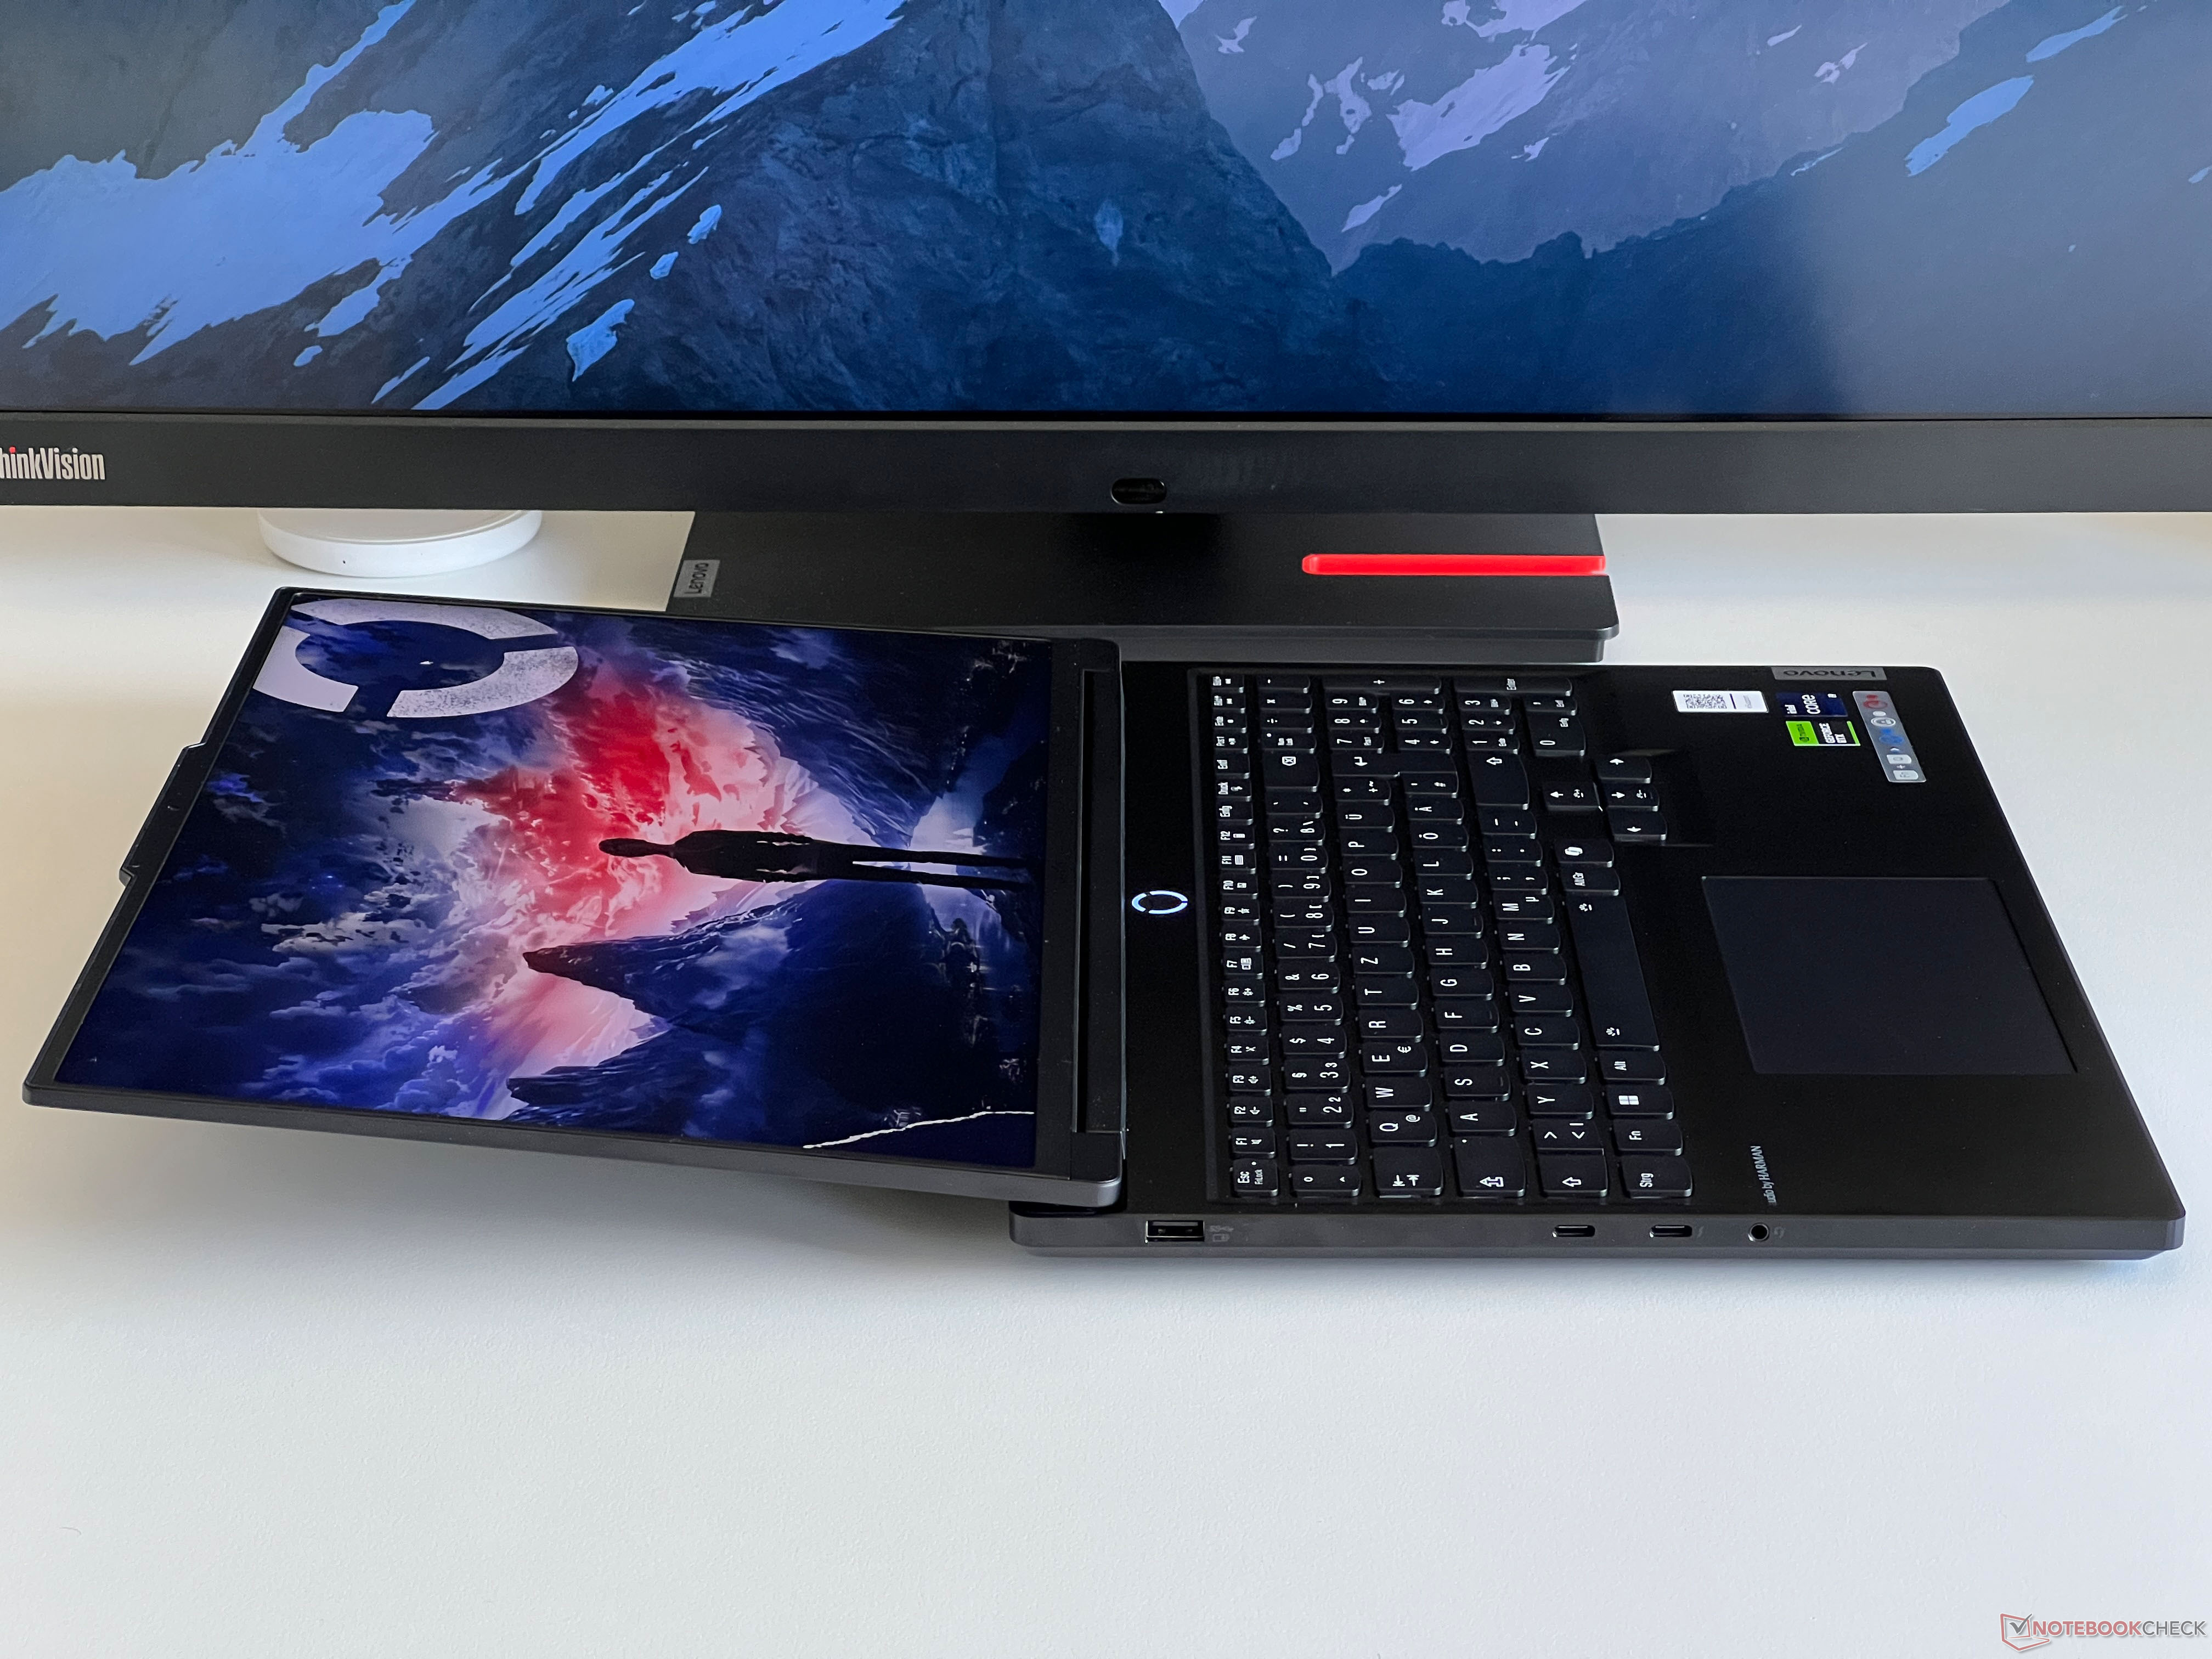
Le Legion 7 16 est un ordinateur portable de jeu comparativement mince qui est également très discret grâce à son boîtier en aluminium noir. Contrairement au Legion Pro 7, il n'y a pas d'éléments de refroidissement saillants sur les côtés de l'appareil. Visuellement, le boîtier est très beau, mais seulement pour une courte durée, car les surfaces lisses attirent comme par magie les empreintes digitales. C'est pourquoi vous devez toujours avoir un chiffon à portée de main pour nettoyer l'étui. Les bords de l'écran sont très fins et seule la bosse de l'appareil photo gâche l'aspect, bien que cela facilite l'ouverture de l'étui.
La stabilité et la qualité de construction de l'étui sont très bonnes et nous n'avons pas pu provoquer de craquements. De plus, il est pratiquement impossible de faire fléchir le clavier sous l'effet de la pression. Le fin couvercle de l'écran est un peu plus souple, mais c'est aussi un endroit où nous n'avons pas pu provoquer de distorsion de l'image. A notre goût, les charnières pourraient être un peu plus fermes car il y a un mouvement de bascule visible lorsque l'on ajuste l'angle d'ouverture (maximum ~170 degrés).
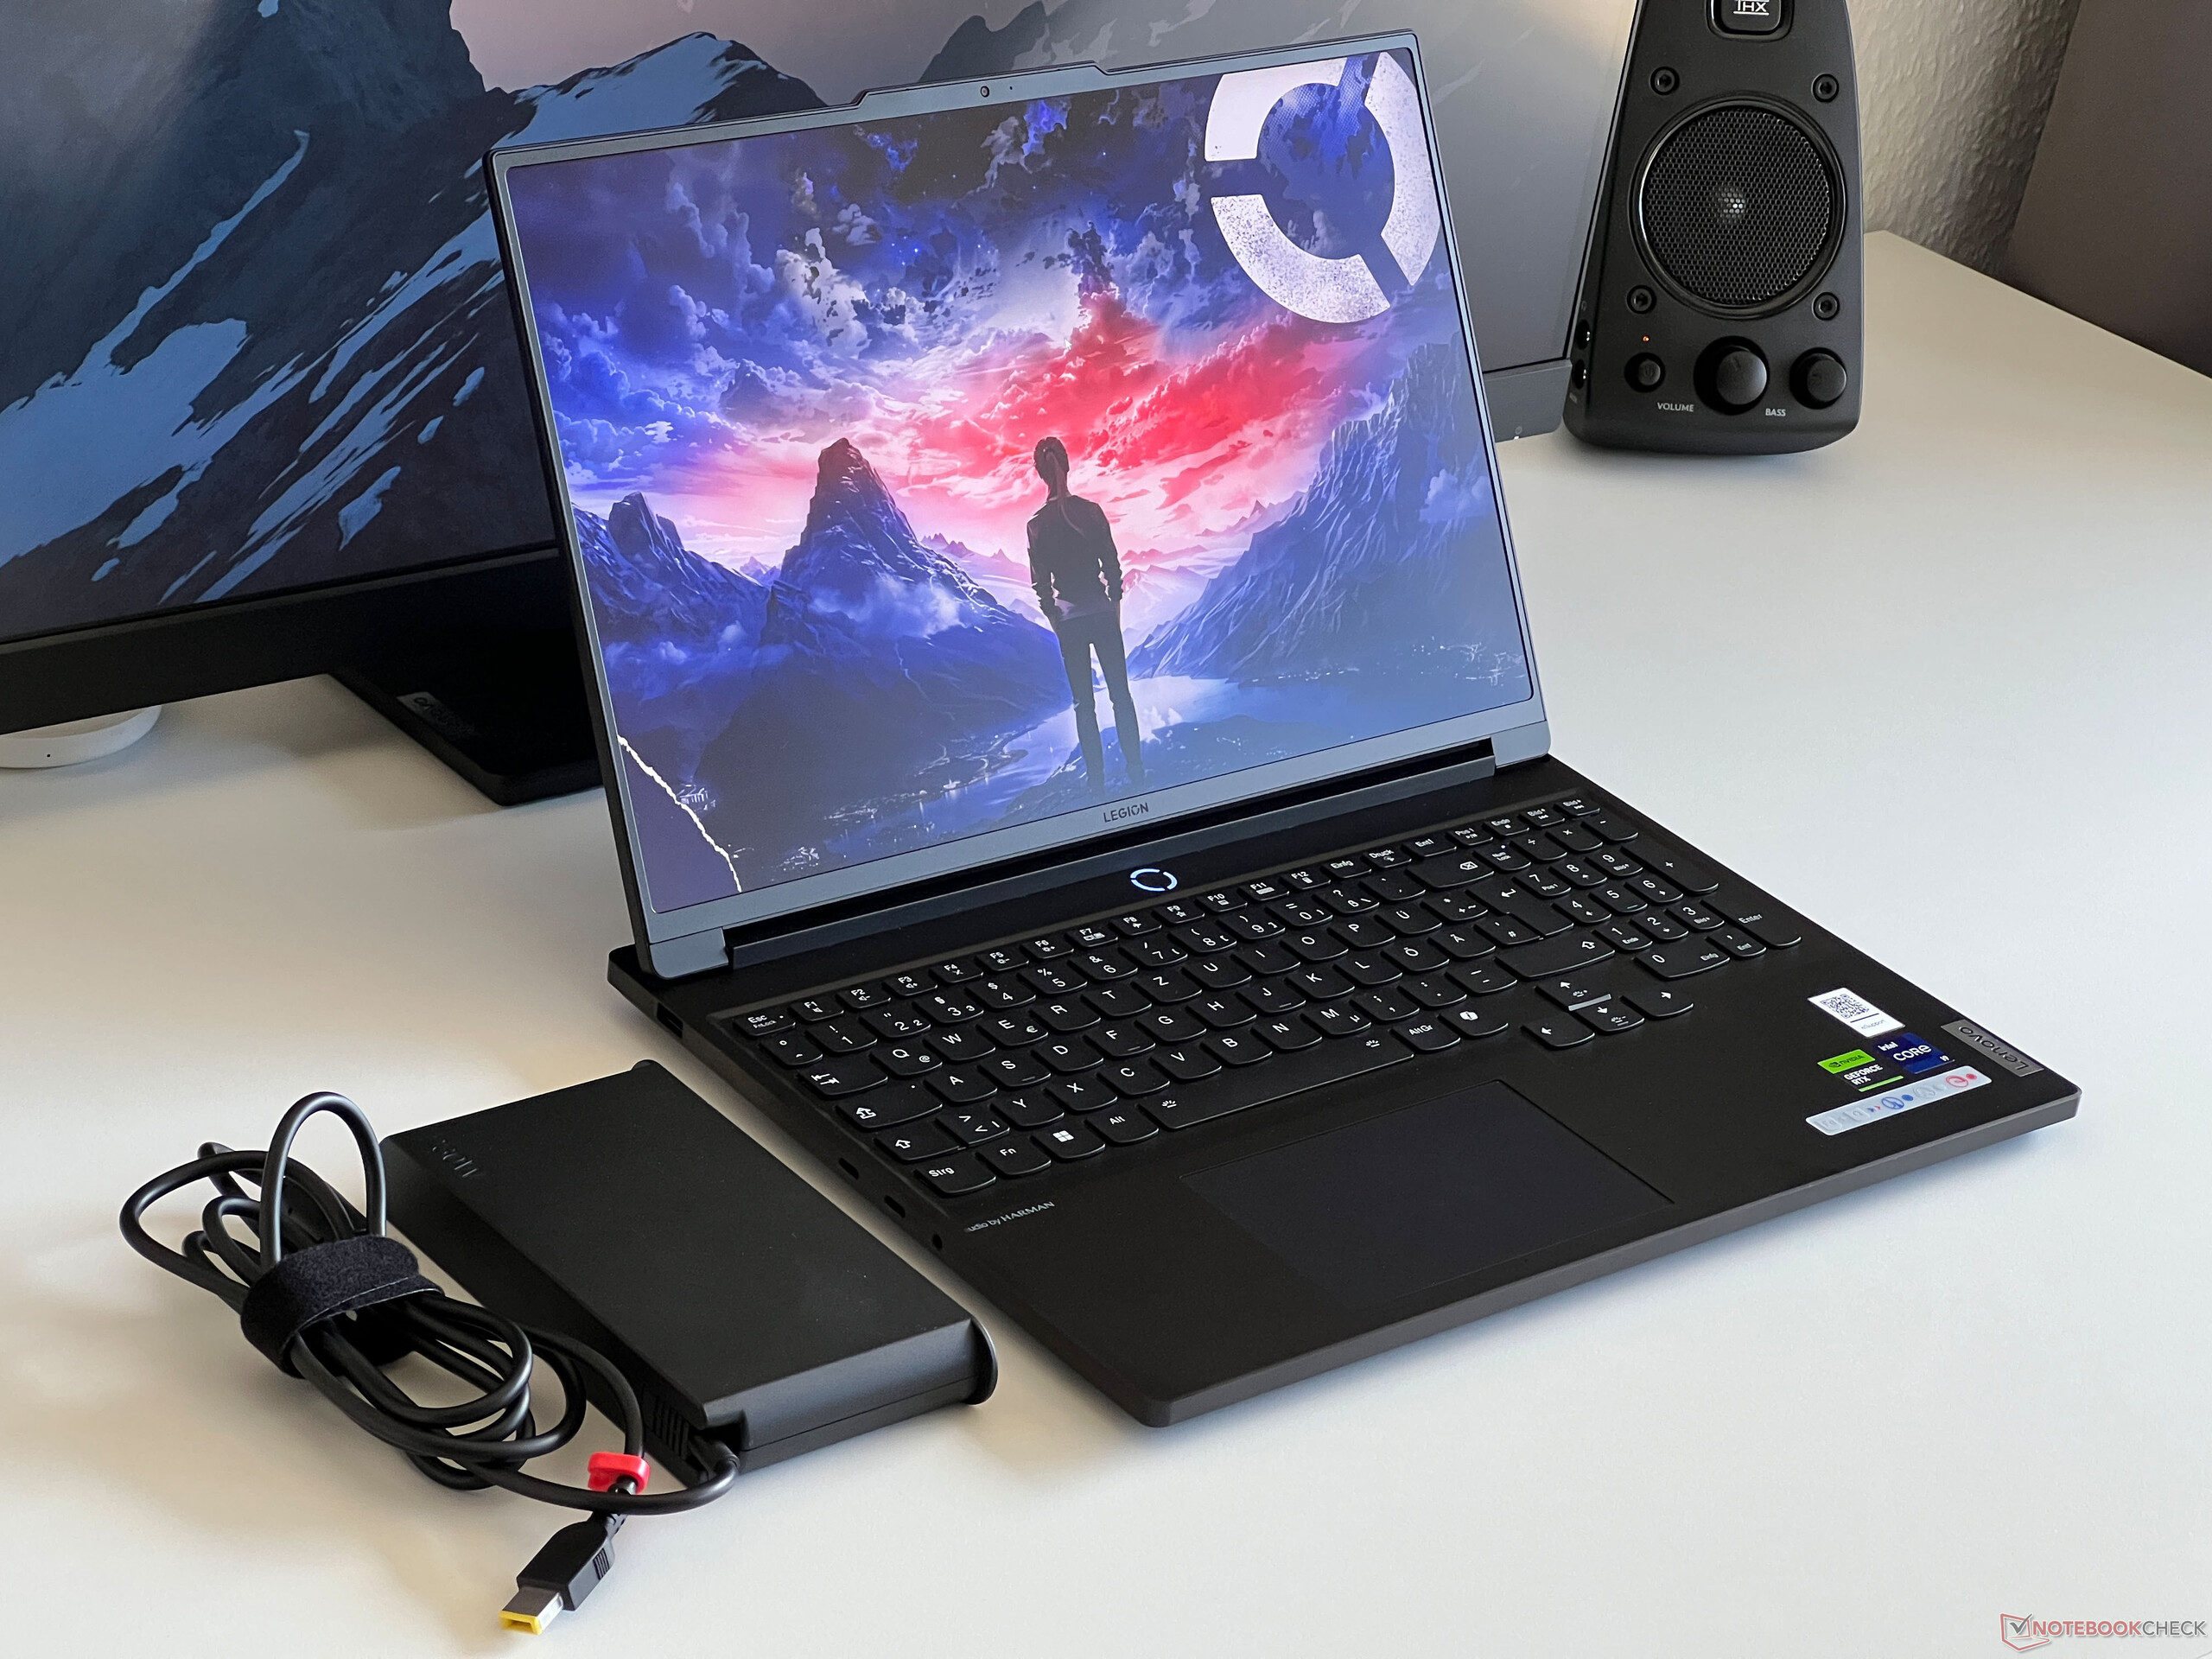
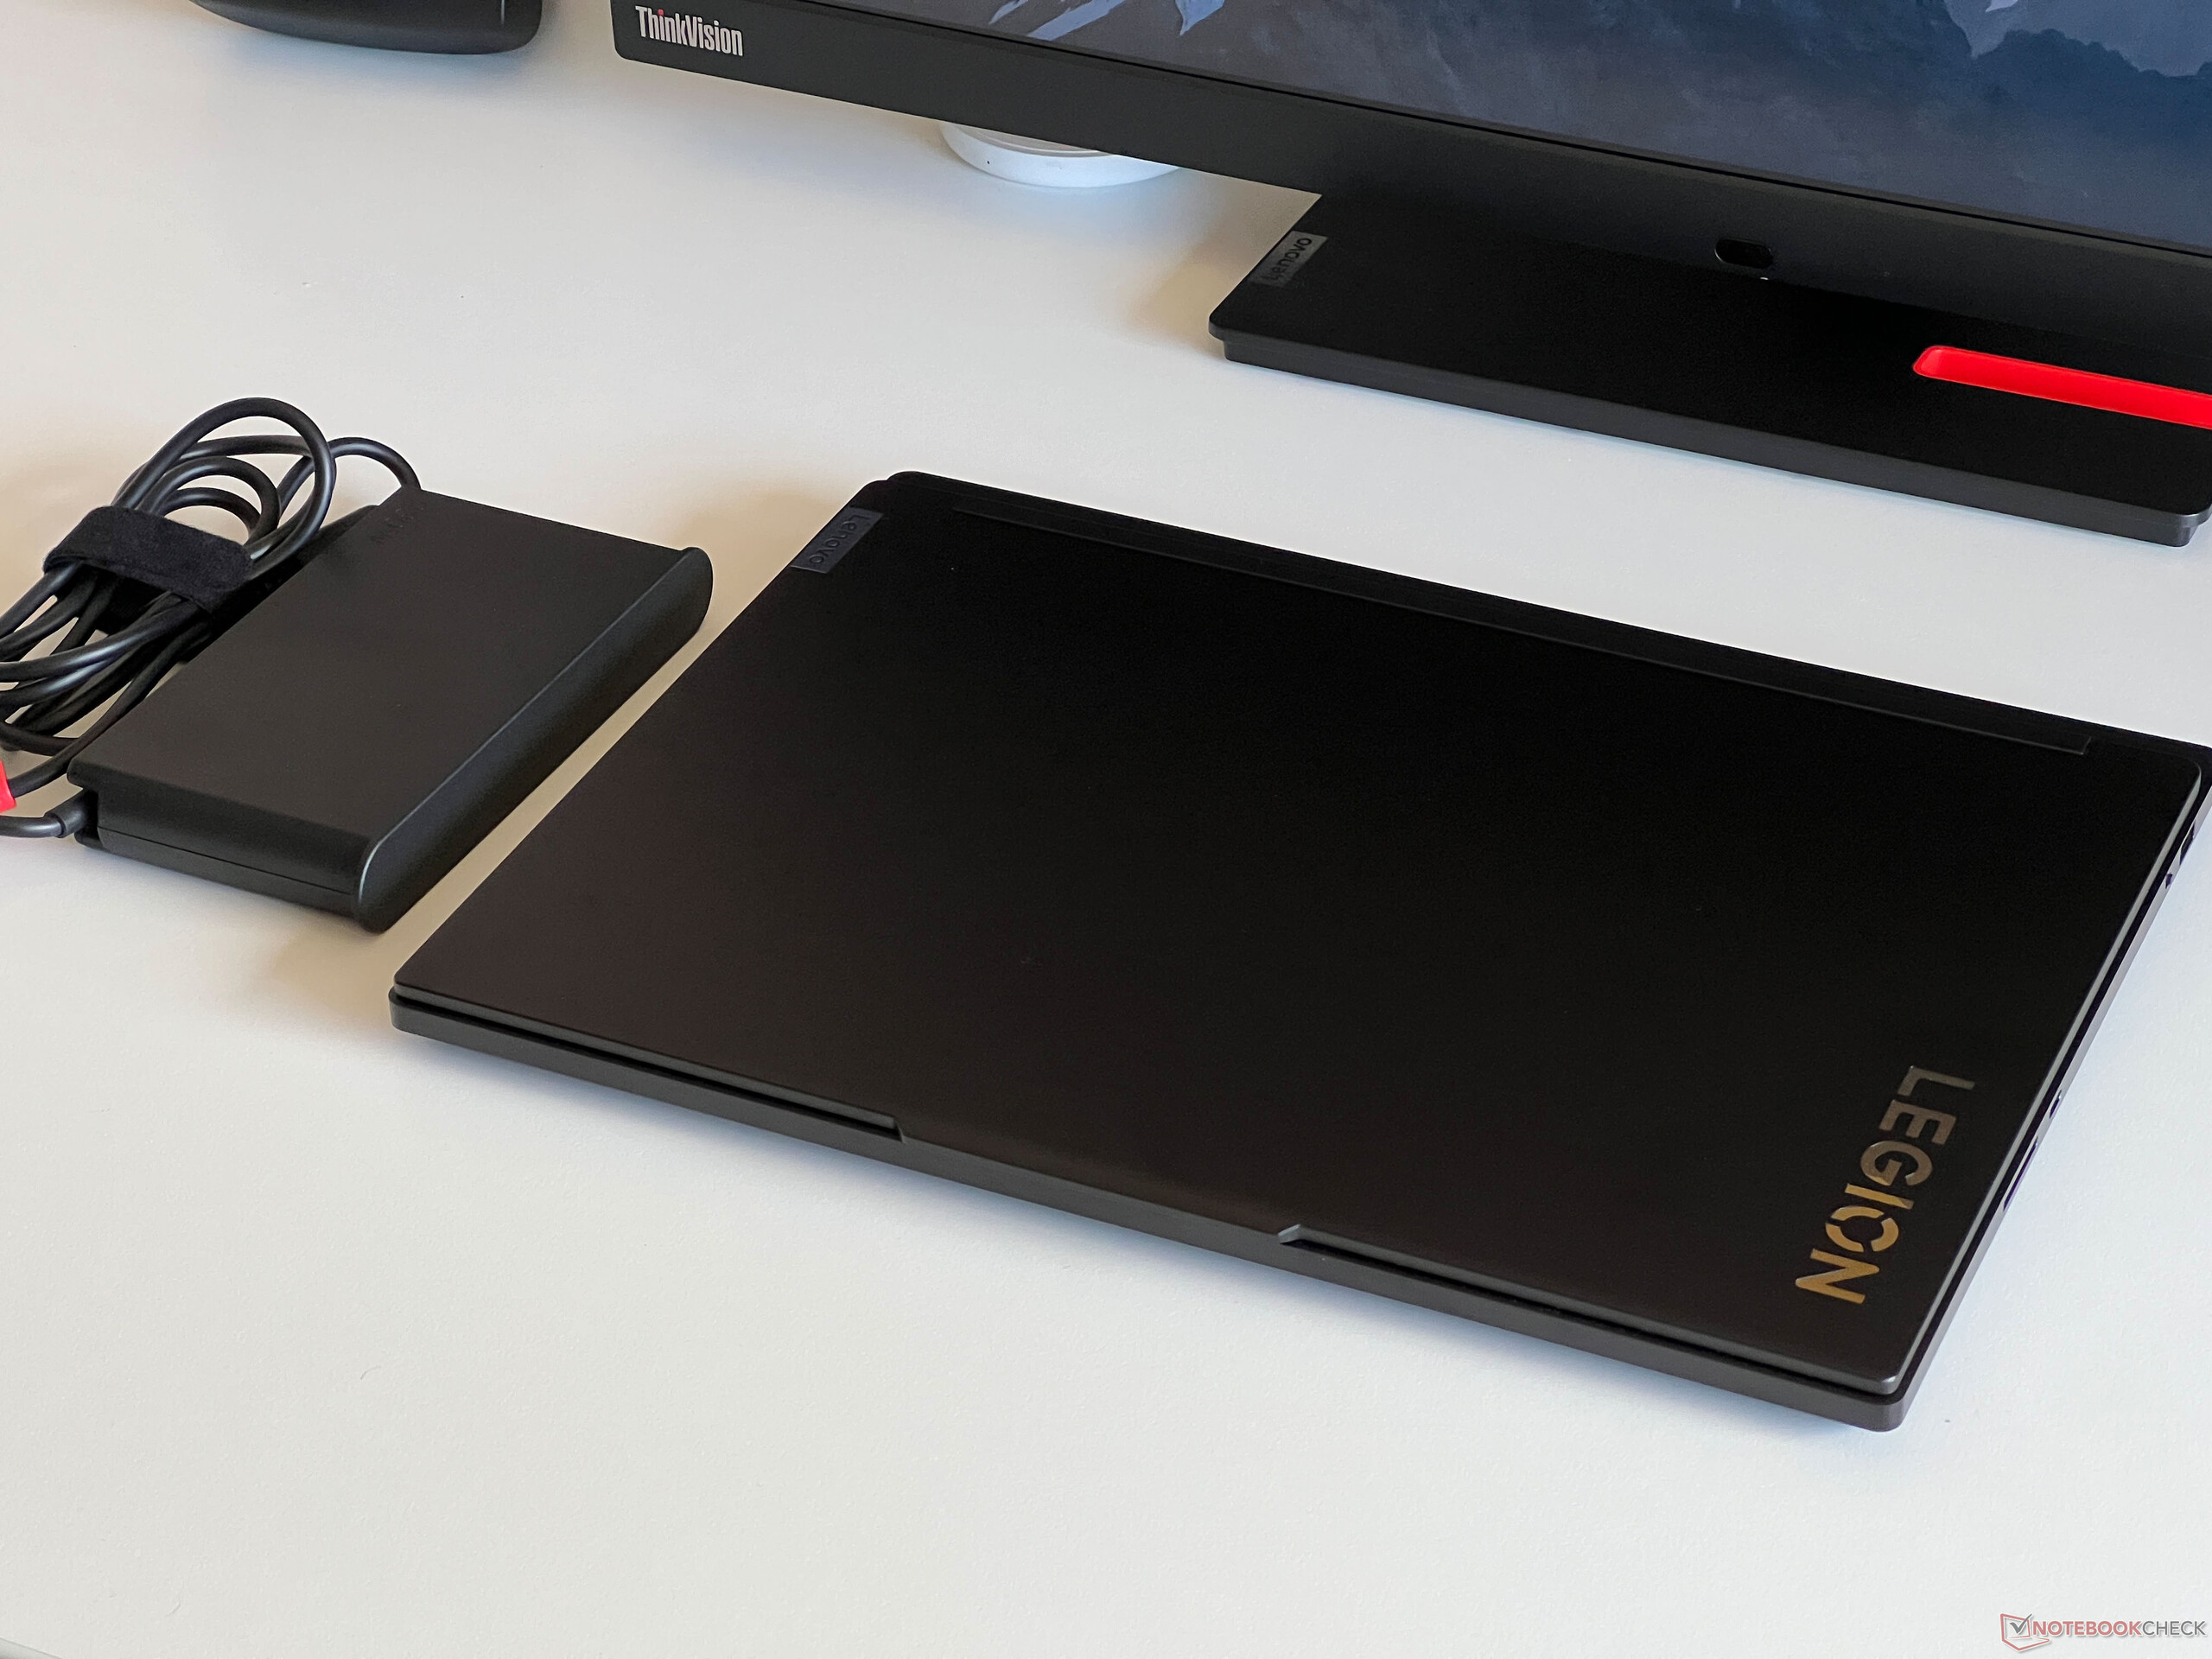
Le Legion 7 16 est l'un des appareils les plus minces de notre groupe de comparaison, mais en termes de poids et d'encombrement, il n'y a pas d'énormes différences. Le bloc d'alimentation de 230 watts pèse 948 grammes.
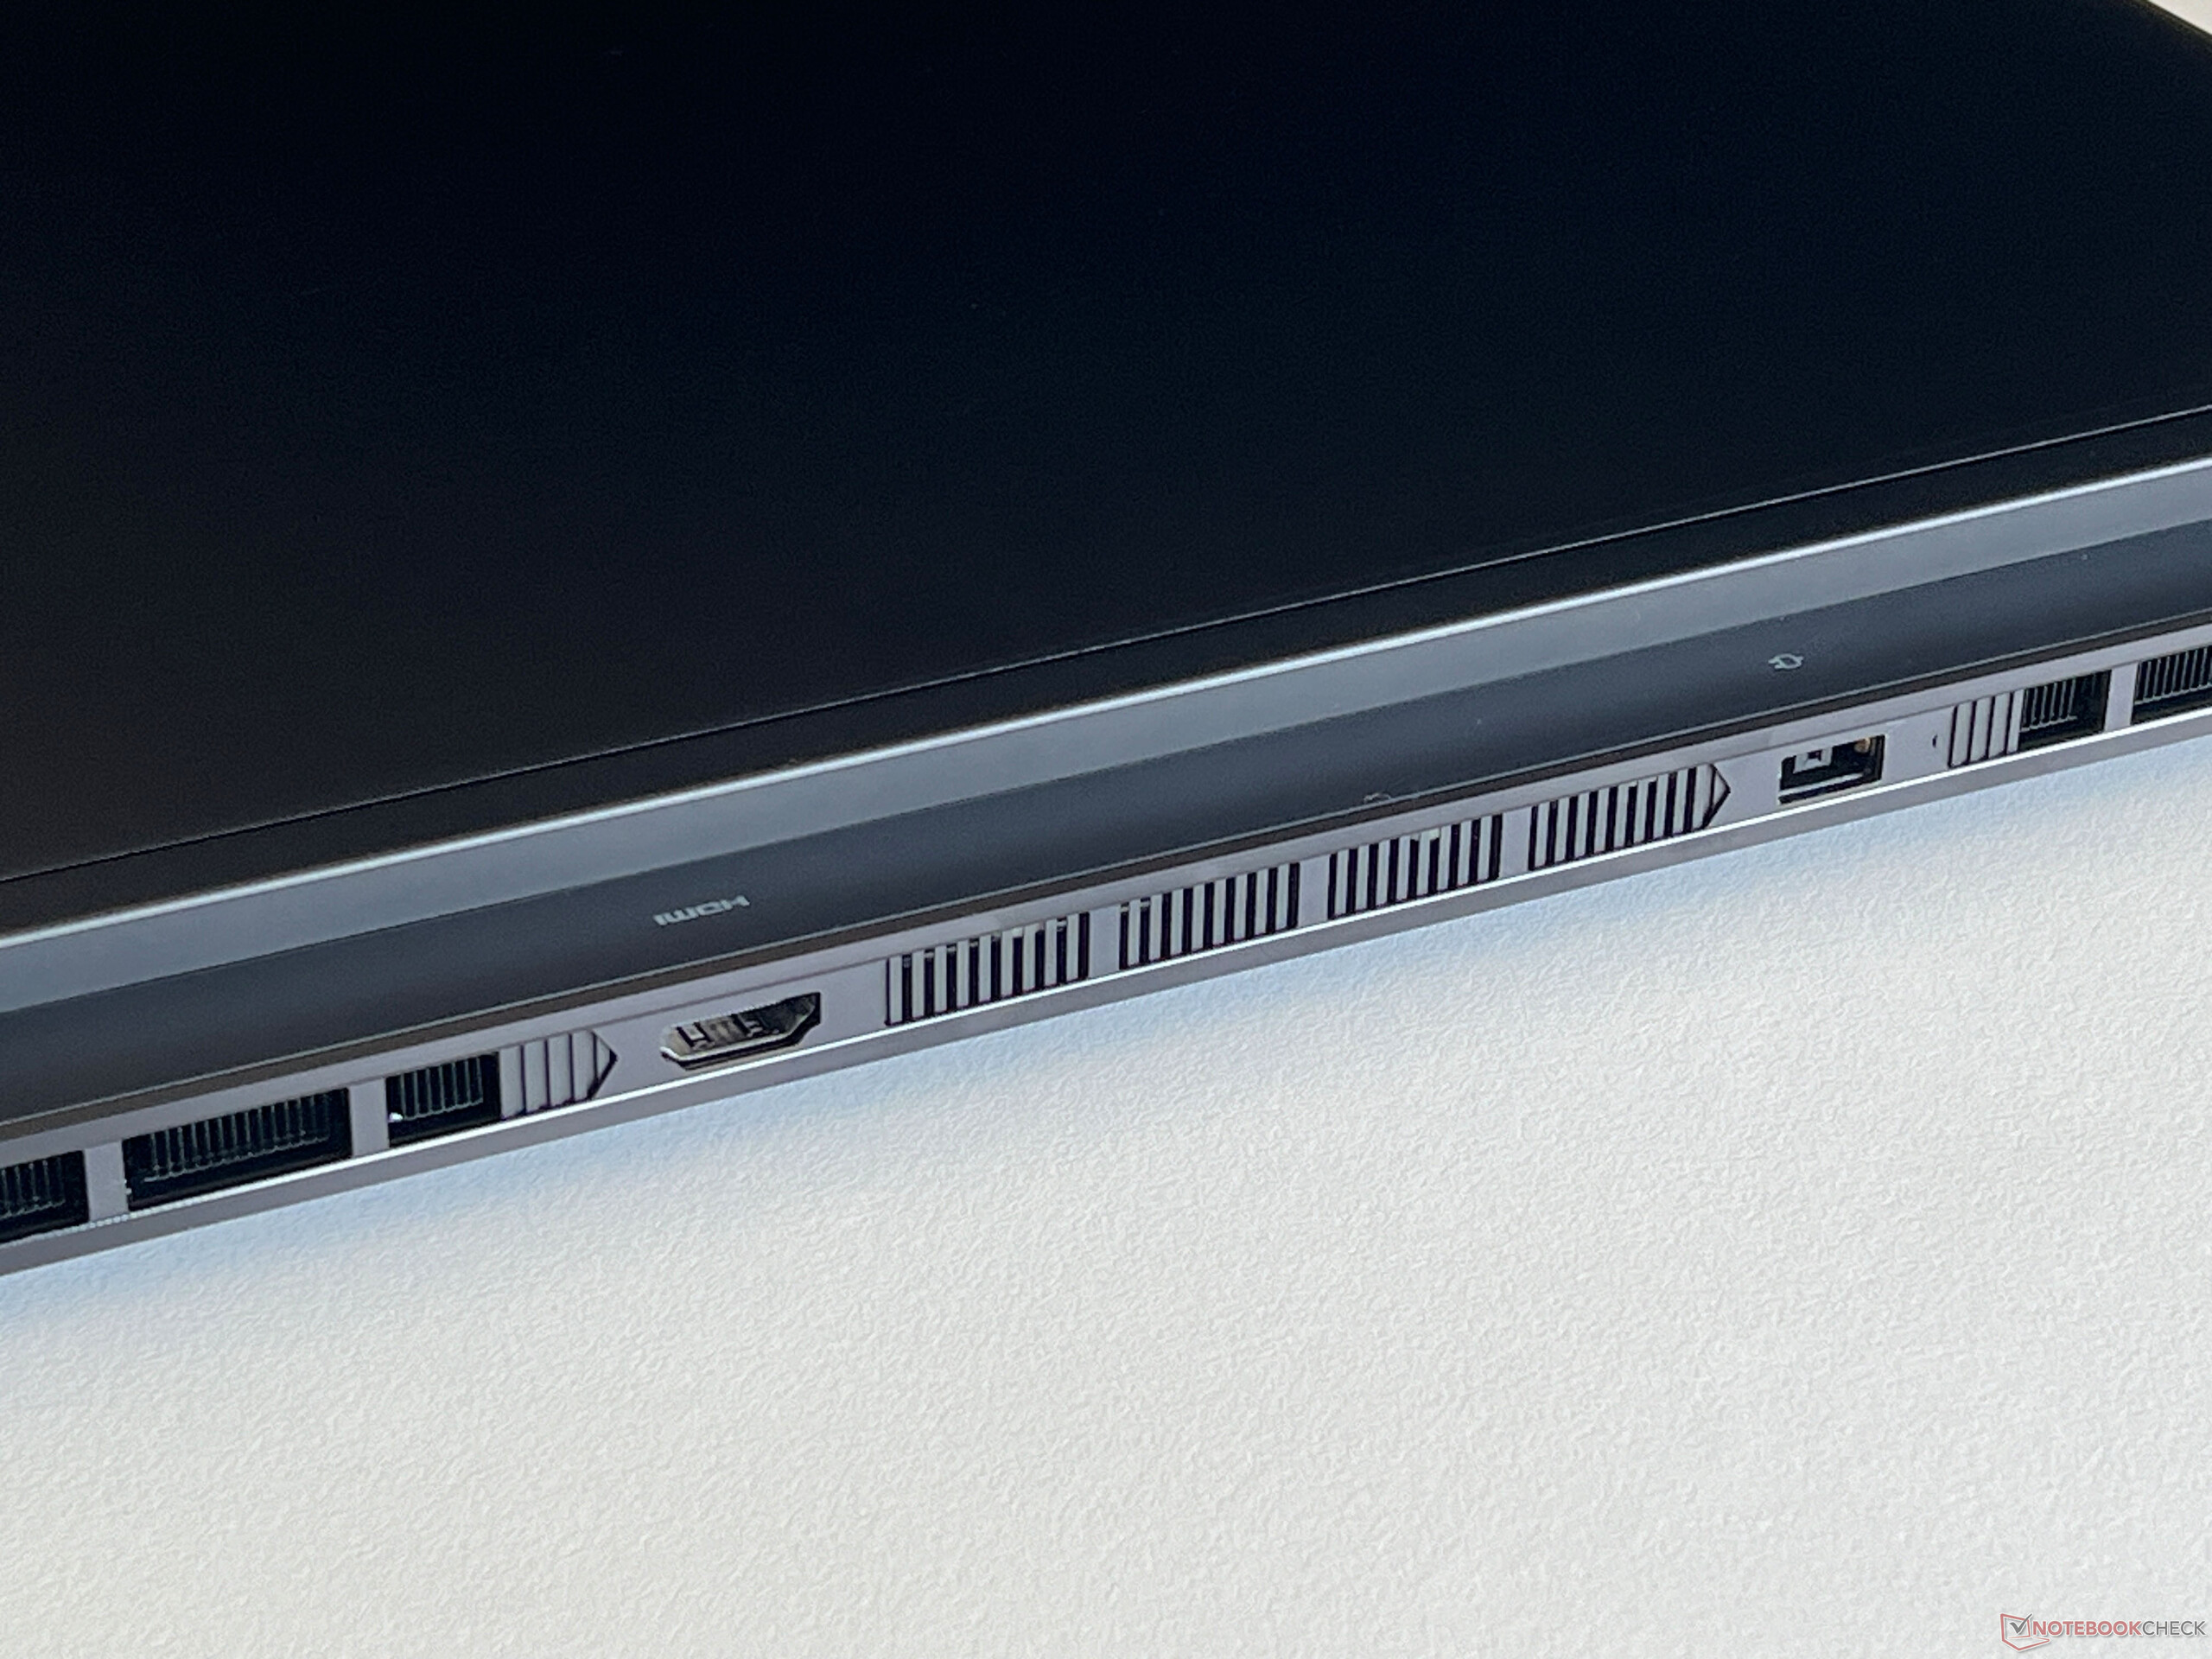
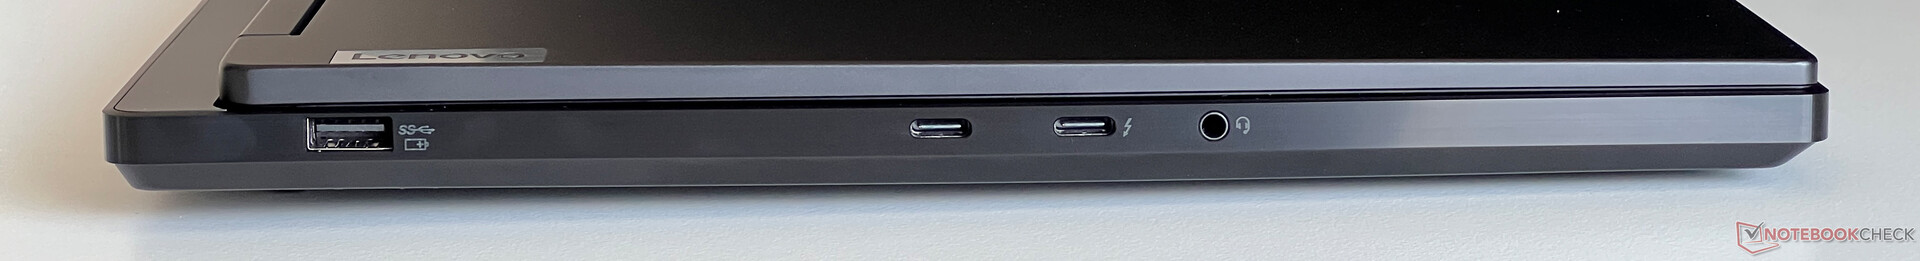
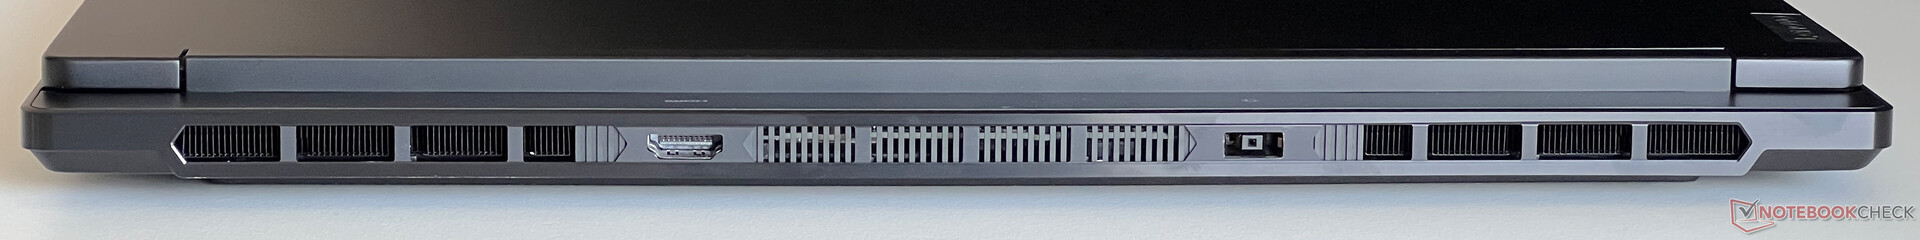
Caractéristiques - Thunderbolt mais pas d'Ethernet
Les ports sont répartis sur les côtés et à l'arrière de l'ordinateur portable. Dans ce domaine, le Legion 7 normal fait un peu mieux que le Legion Pro 7, plus cher, car les évents de refroidissement ne se trouvent qu'à l'arrière. Toutes les normes importantes sont présentes, à l'exception d'un port Ethernet, qui n'est pas idéal pour les joueurs. Le port Thunderbolt est connecté via l'iGPU, ce qui signifie que lorsque vous connectez un écran externe, le GPU Nvidia ne doit pas toujours être actif. Toutes les autres sorties vidéo passent directement par le dGPU.
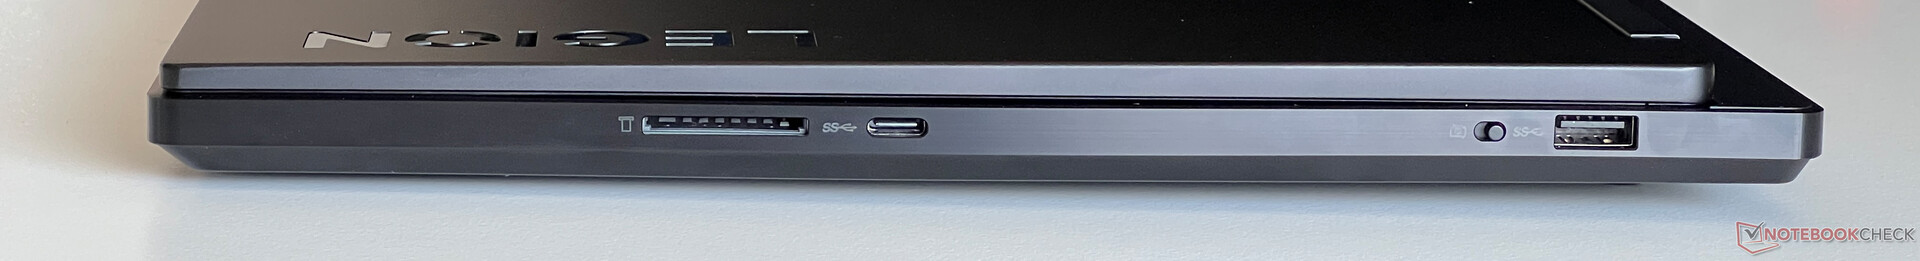
Lecteur de carte SD
Associé à notre carte de référence (Angelbird AV Pro V60), le lecteur de cartes situé à droite permet d'atteindre des vitesses de transfert moyennes de 75-90 Mo/s. Cependant, les cartes insérées dépassent clairement du boîtier.
| SD Card Reader | |
| average JPG Copy Test (av. of 3 runs) | |
| Aorus 16X 2024 (AV PRO microSD 128 GB V60) | |
| Moyenne de la classe Gaming (19 - 202, n=100, 2 dernières années) | |
| Lenovo Legion 7 16 IRX G9 (Angelbird AV Pro V60) | |
| Alienware m16 R2 (AV PRO microSD 128 GB V60) | |
| SCHENKER XMG CORE 16 (L23) | |
| maximum AS SSD Seq Read Test (1GB) | |
| Alienware m16 R2 (AV PRO microSD 128 GB V60) | |
| Aorus 16X 2024 (AV PRO microSD 128 GB V60) | |
| Moyenne de la classe Gaming (25.8 - 269, n=94, 2 dernières années) | |
| Lenovo Legion 7 16 IRX G9 (Angelbird AV Pro V60) | |
| SCHENKER XMG CORE 16 (L23) | |
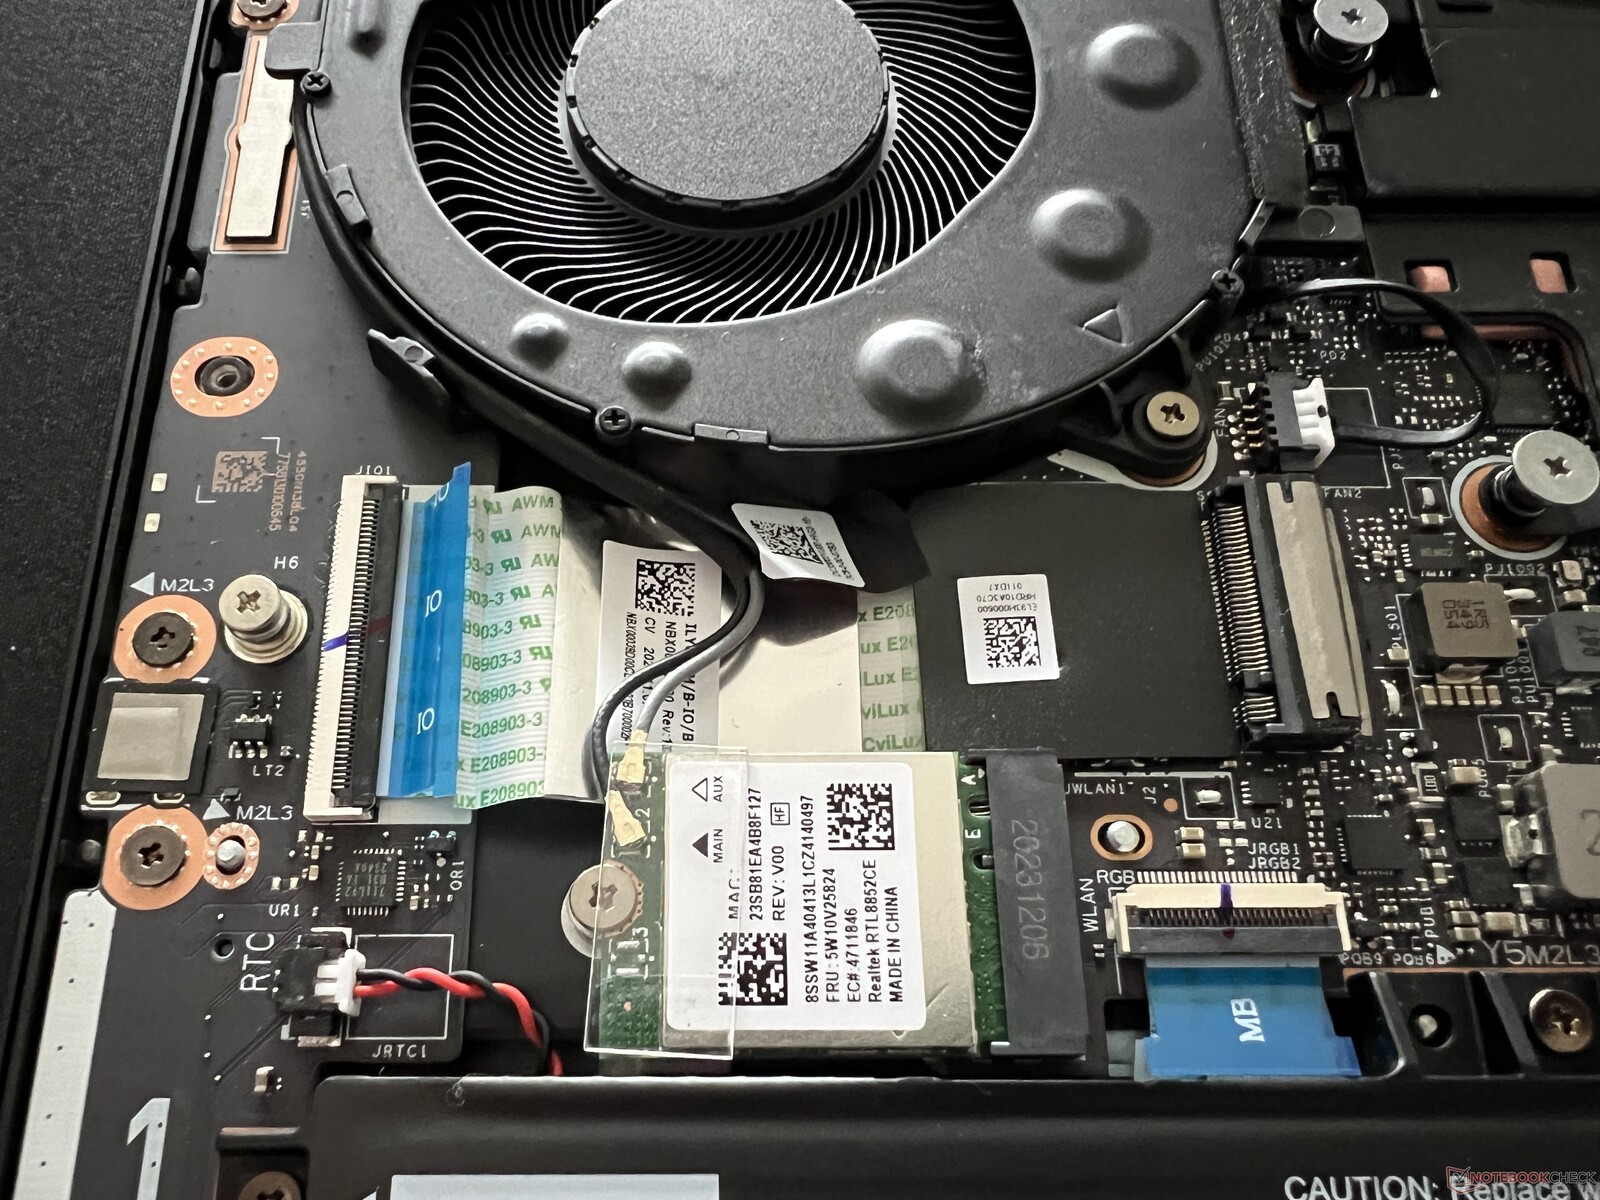
Communication
Un module Realtek Wi-Fi 6E est installé à l'intérieur de l'ordinateur Legion. Il fonctionne bien et, combiné à notre routeur de référence Asus, il a permis d'atteindre des vitesses de transfert élevées et stables. Le Bluetooth 5.1 est pris en charge, mais l'ordinateur portable n'offre pas de port Ethernet.
| Networking | |
| Lenovo Legion 7 16 IRX G9 | |
| iperf3 transmit AXE11000 |
|
| iperf3 receive AXE11000 |
|
| Lenovo Legion Pro 5 16IRX9 | |
| iperf3 transmit AXE11000 |
|
| iperf3 receive AXE11000 |
|
| iperf3 transmit AXE11000 6GHz |
|
| iperf3 receive AXE11000 6GHz |
|
| Aorus 16X 2024 | |
| iperf3 transmit AXE11000 |
|
| iperf3 receive AXE11000 |
|
| HP Omen Transcend 16-u1095ng | |
| iperf3 transmit AXE11000 |
|
| iperf3 receive AXE11000 |
|
| Alienware m16 R2 | |
| iperf3 transmit AXE11000 |
|
| iperf3 receive AXE11000 |
|
| iperf3 transmit AXE11000 6GHz |
|
| iperf3 receive AXE11000 6GHz |
|
| SCHENKER XMG CORE 16 (L23) | |
| iperf3 transmit AXE11000 |
|
| iperf3 receive AXE11000 |
|
| Lenovo Legion Pro 7 16IRX9H | |
| iperf3 transmit AXE11000 |
|
| iperf3 receive AXE11000 |
|
Webcam
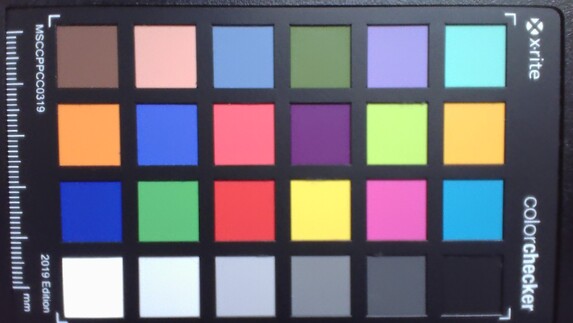
La webcam 1080p est logée dans le cadre supérieur de l'écran et dispose d'un obturateur électronique (l'interrupteur se trouve sur le côté droit) mais, même dans de bonnes conditions d'éclairage, elle ne capture que des images moyennes. La webcam ne prend pas en charge Windows Studio Effects, contrairement aux appareils Meteor Lake actuels.


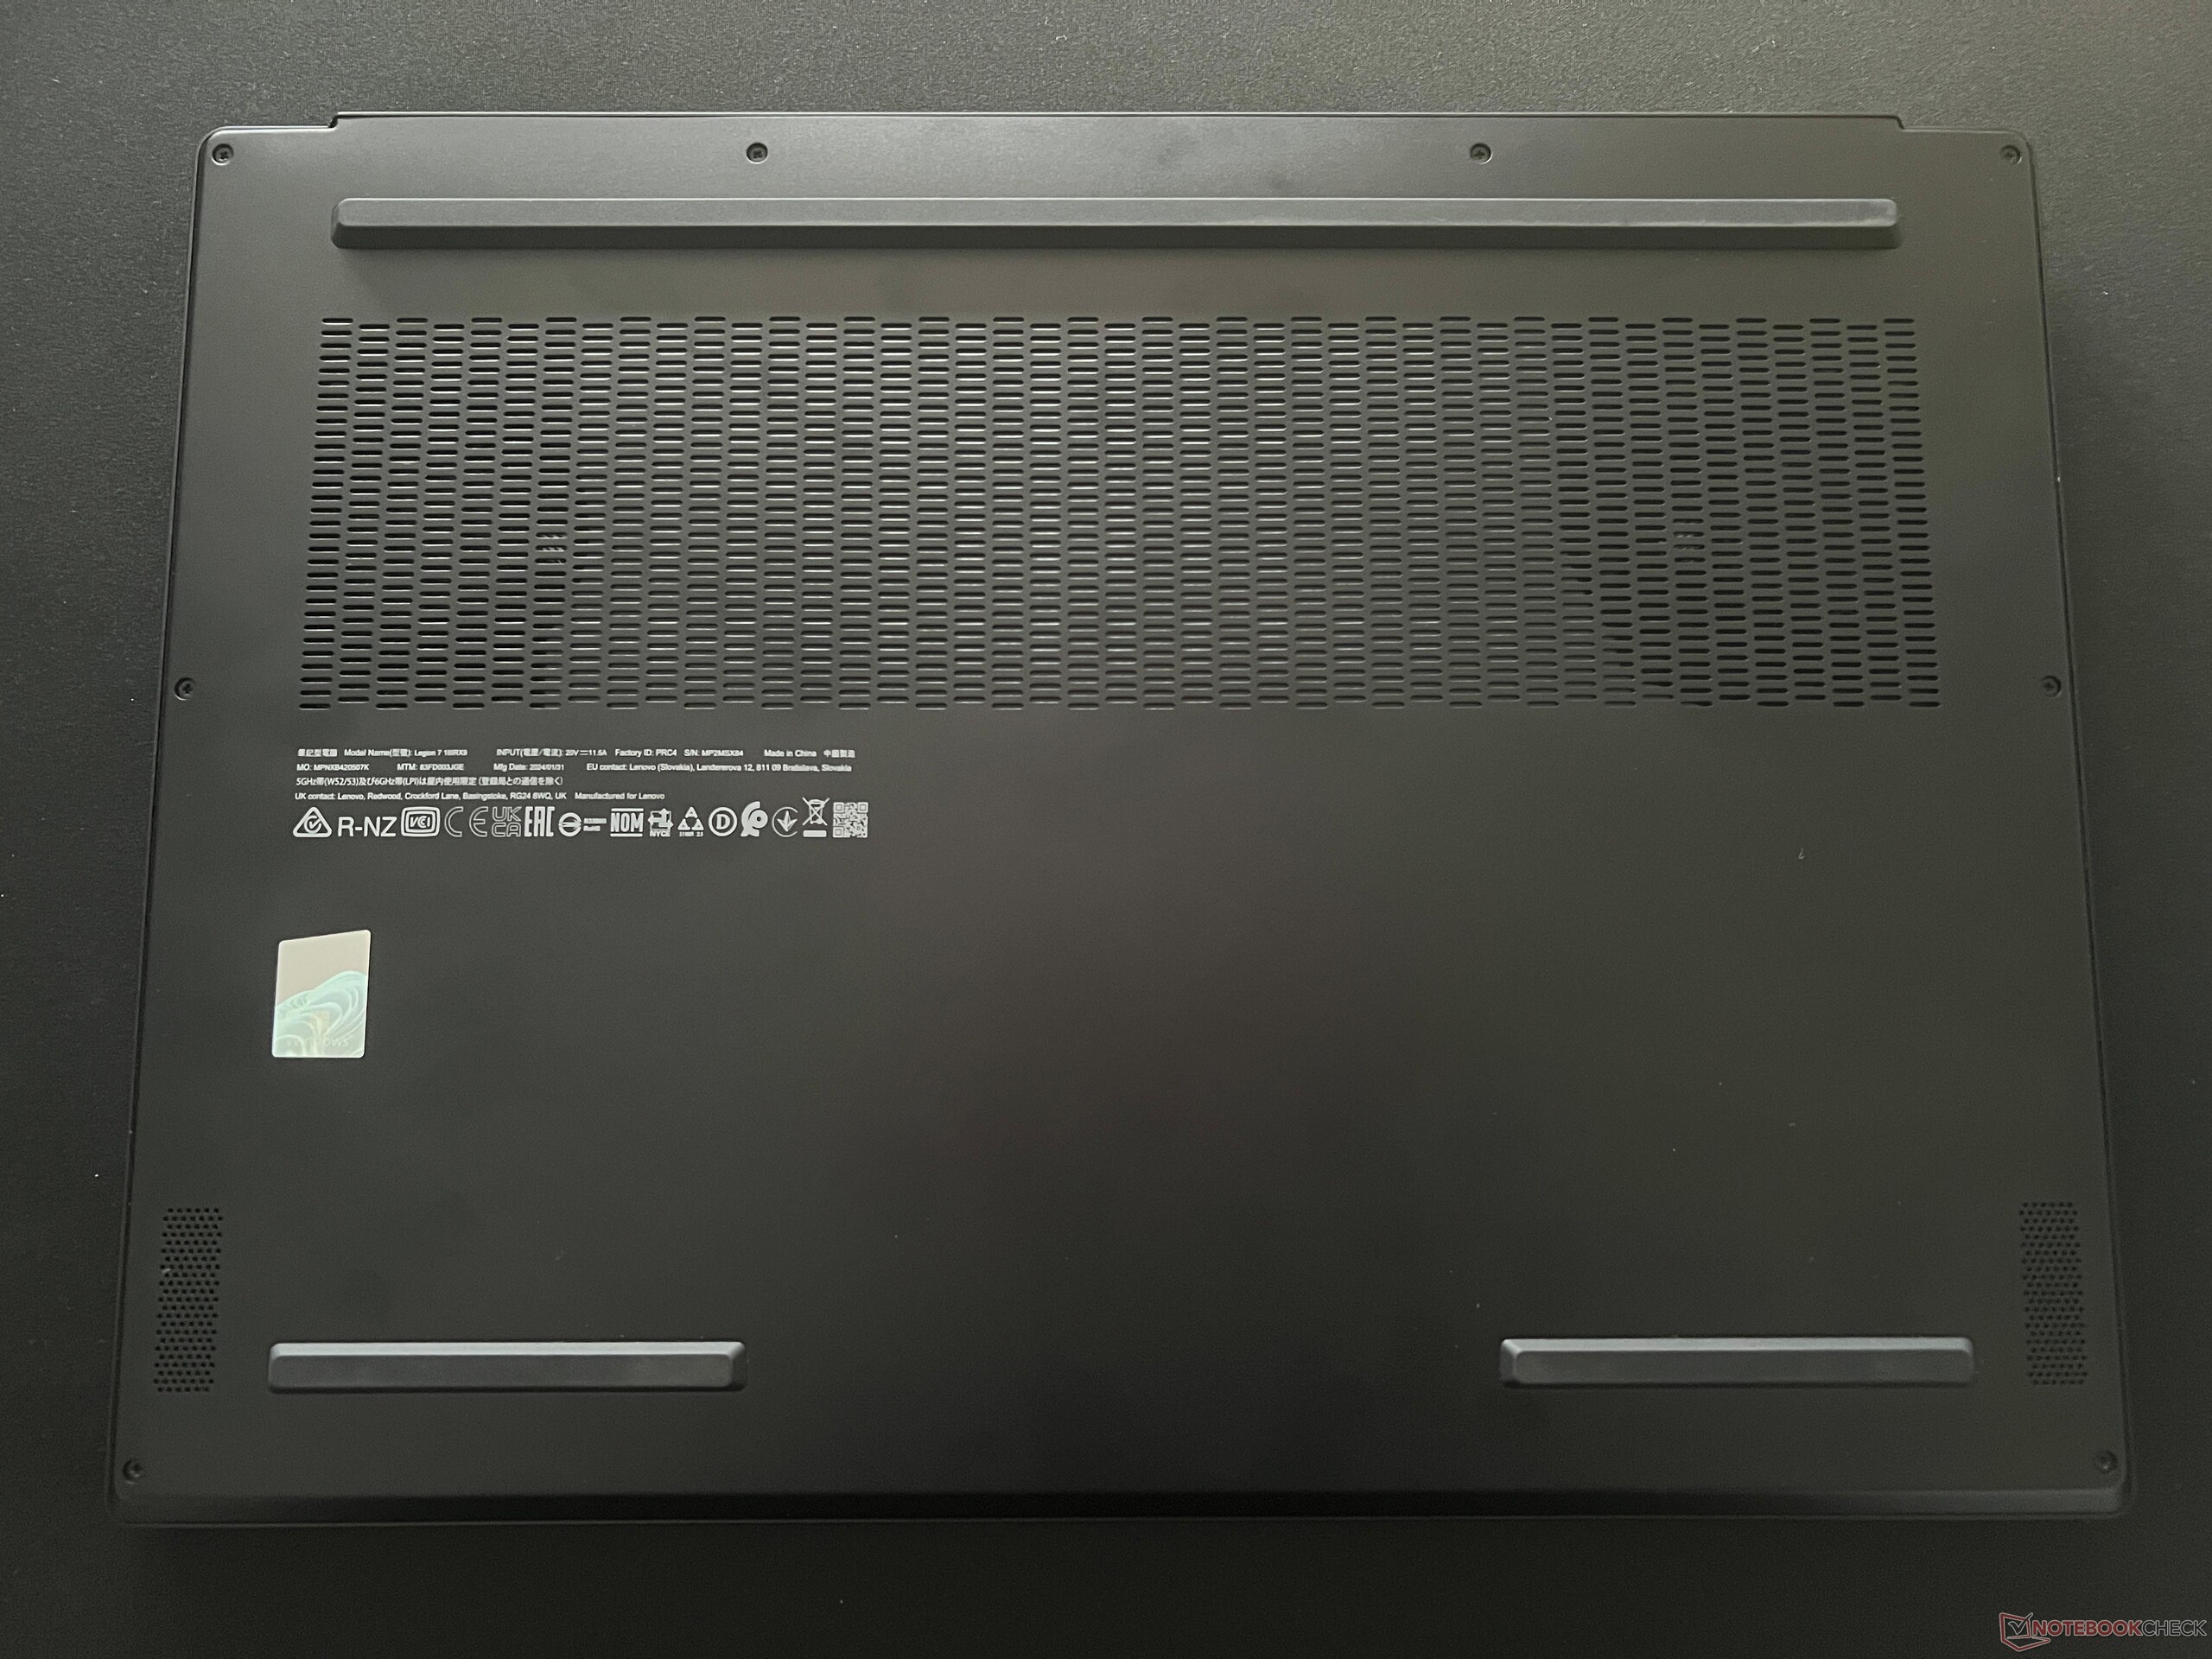
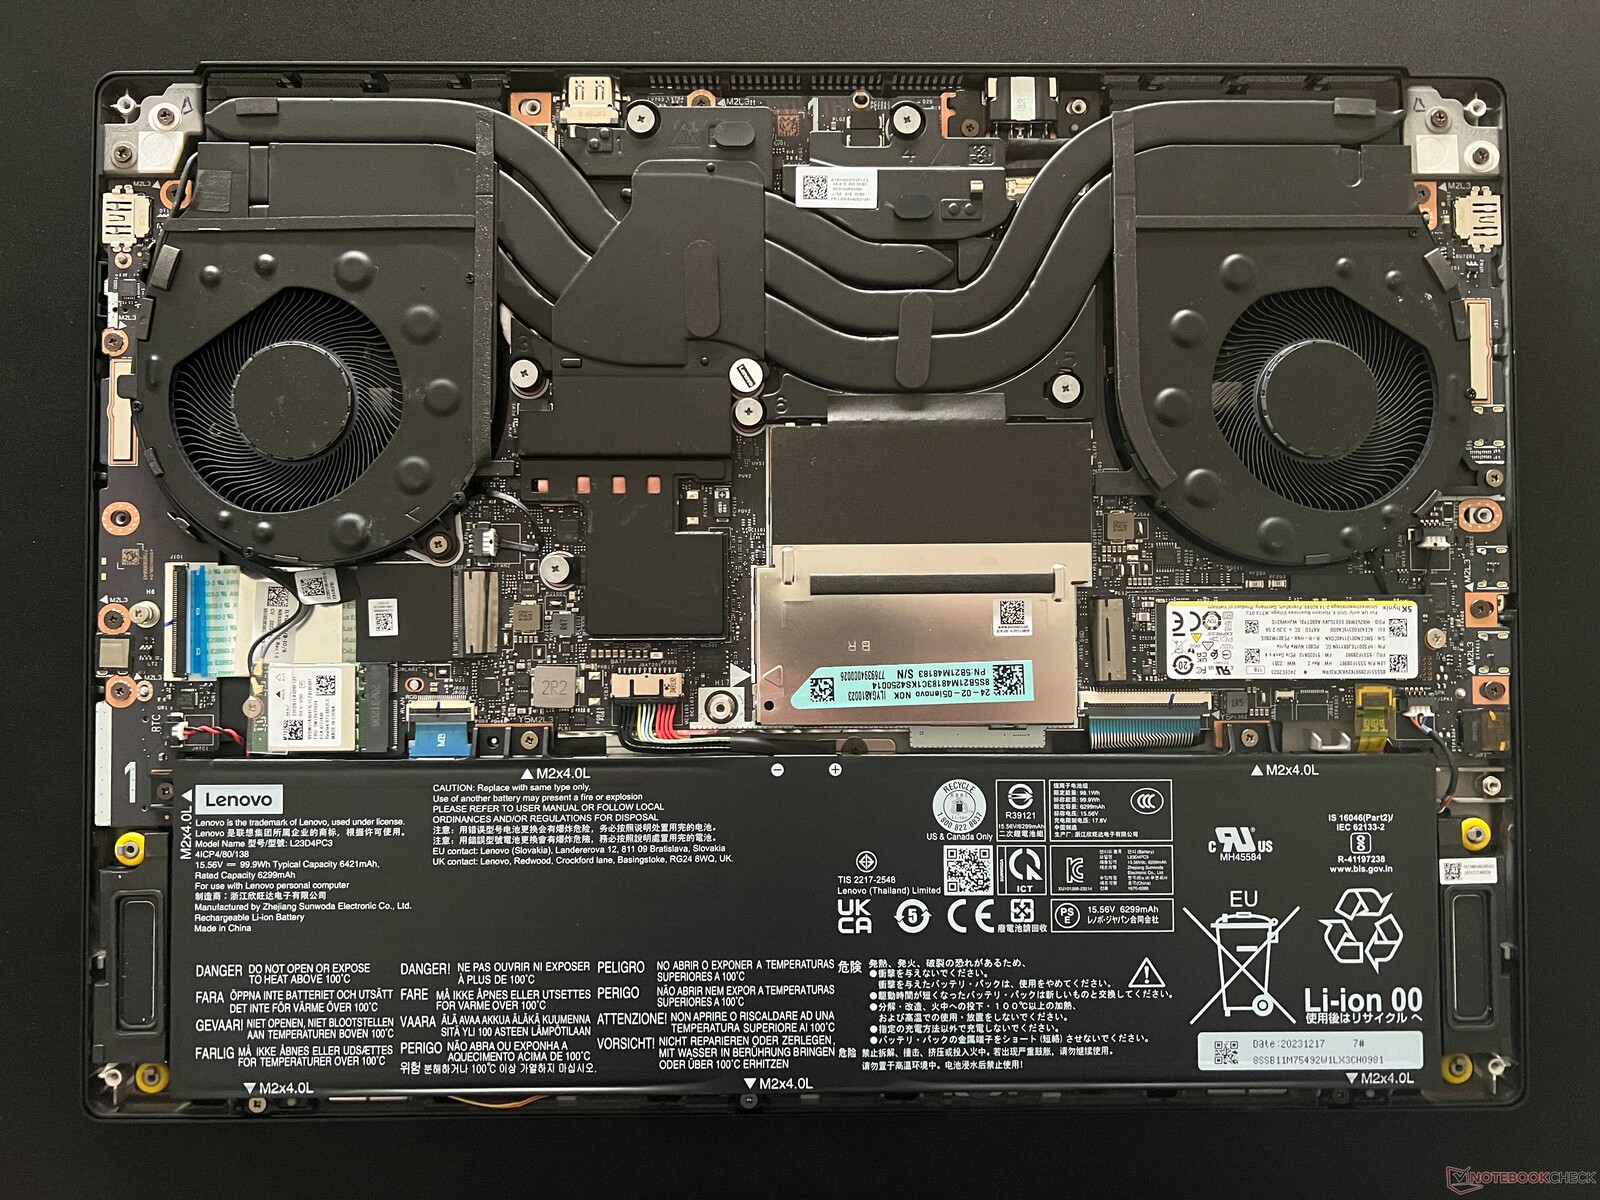
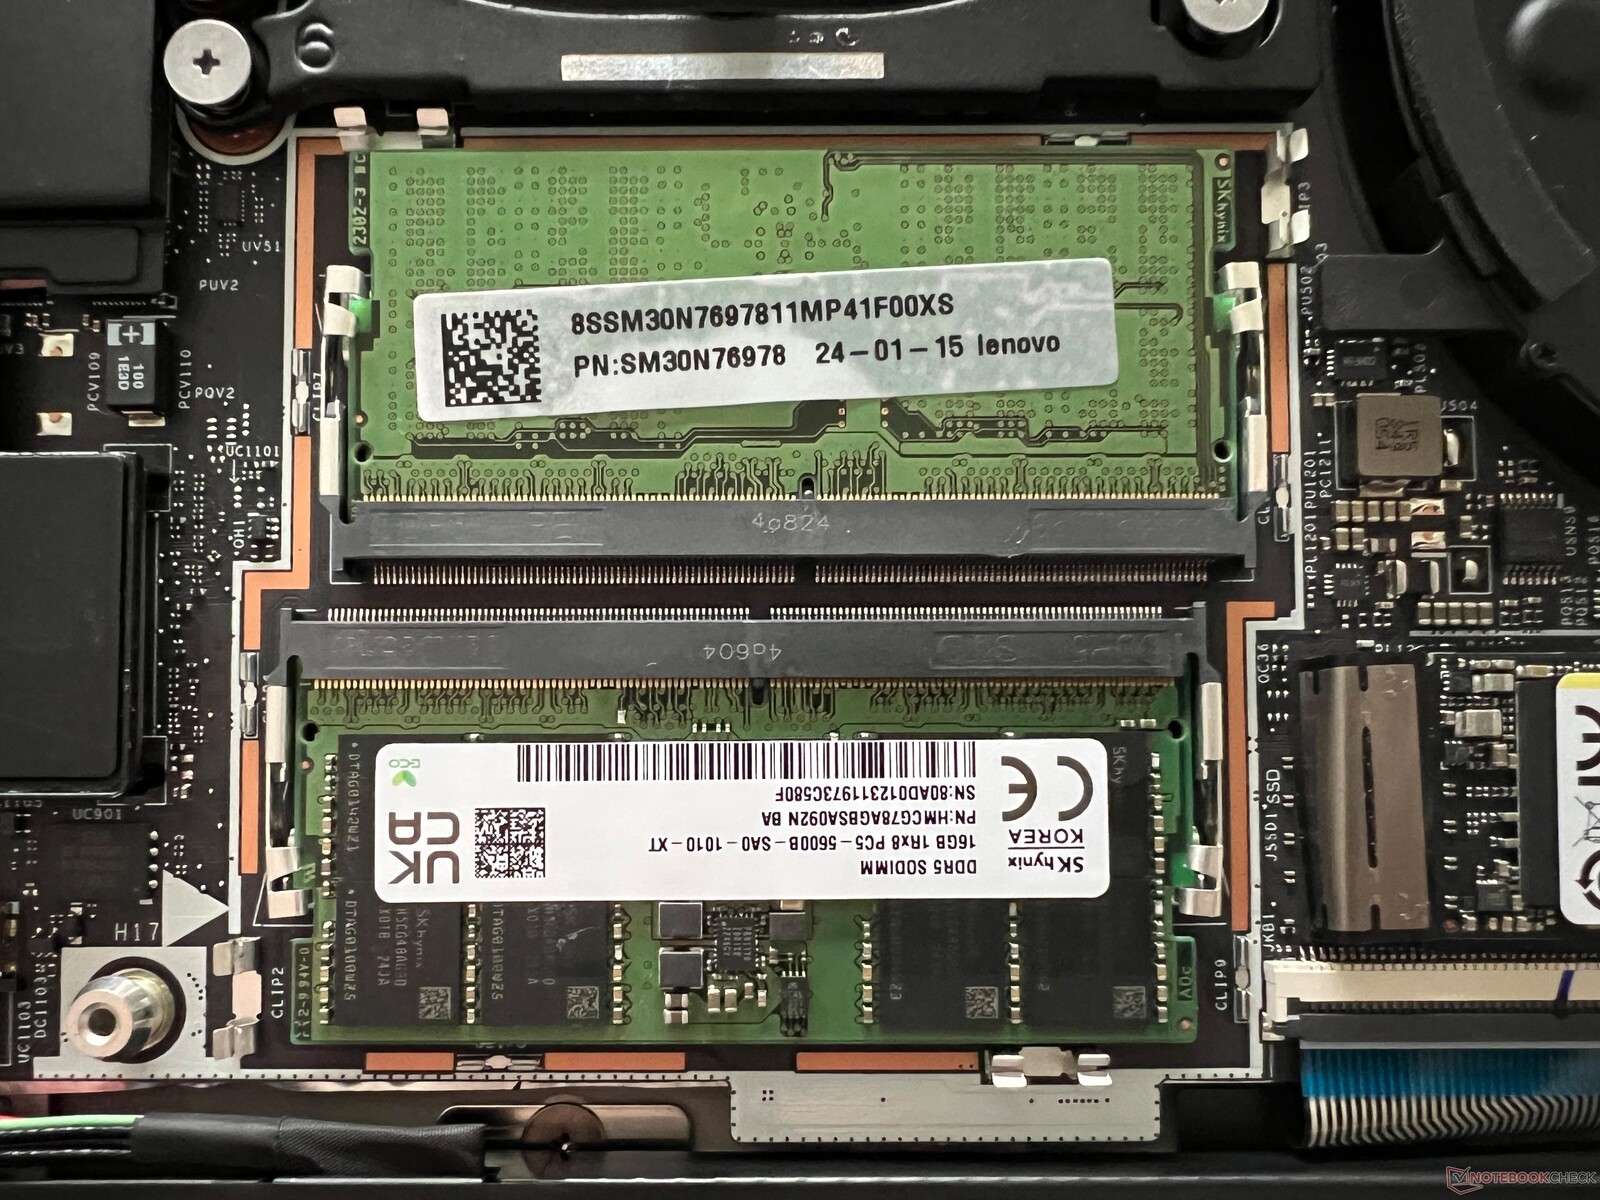
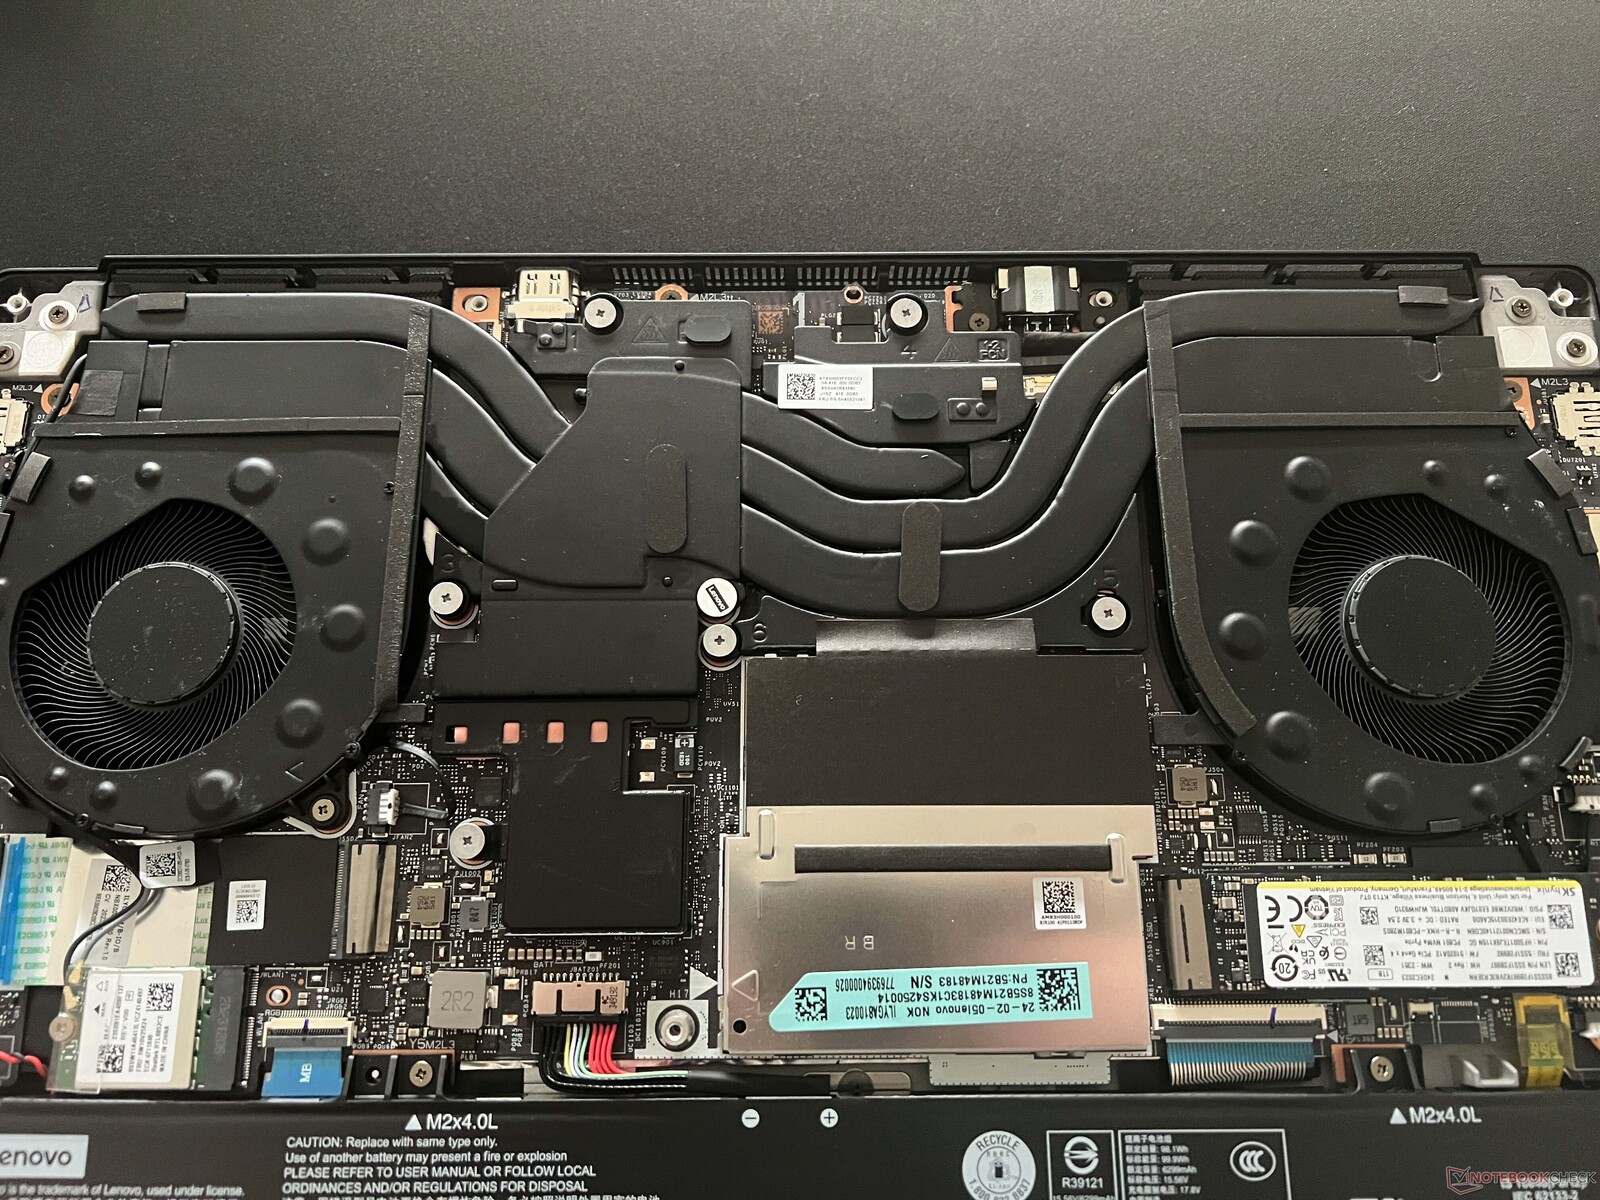
Maintenance
Le couvercle de la base est fixé par des vis à tête cruciforme normales et s'enlève très facilement. Outre les deux modules de RAM, il y a également deux emplacements M.2 2280, bien que l'accès au deuxième emplacement soit quelque peu entravé par le câble Wi-Fi. De même, le module Wi-Fi et la batterie peuvent être remplacés.
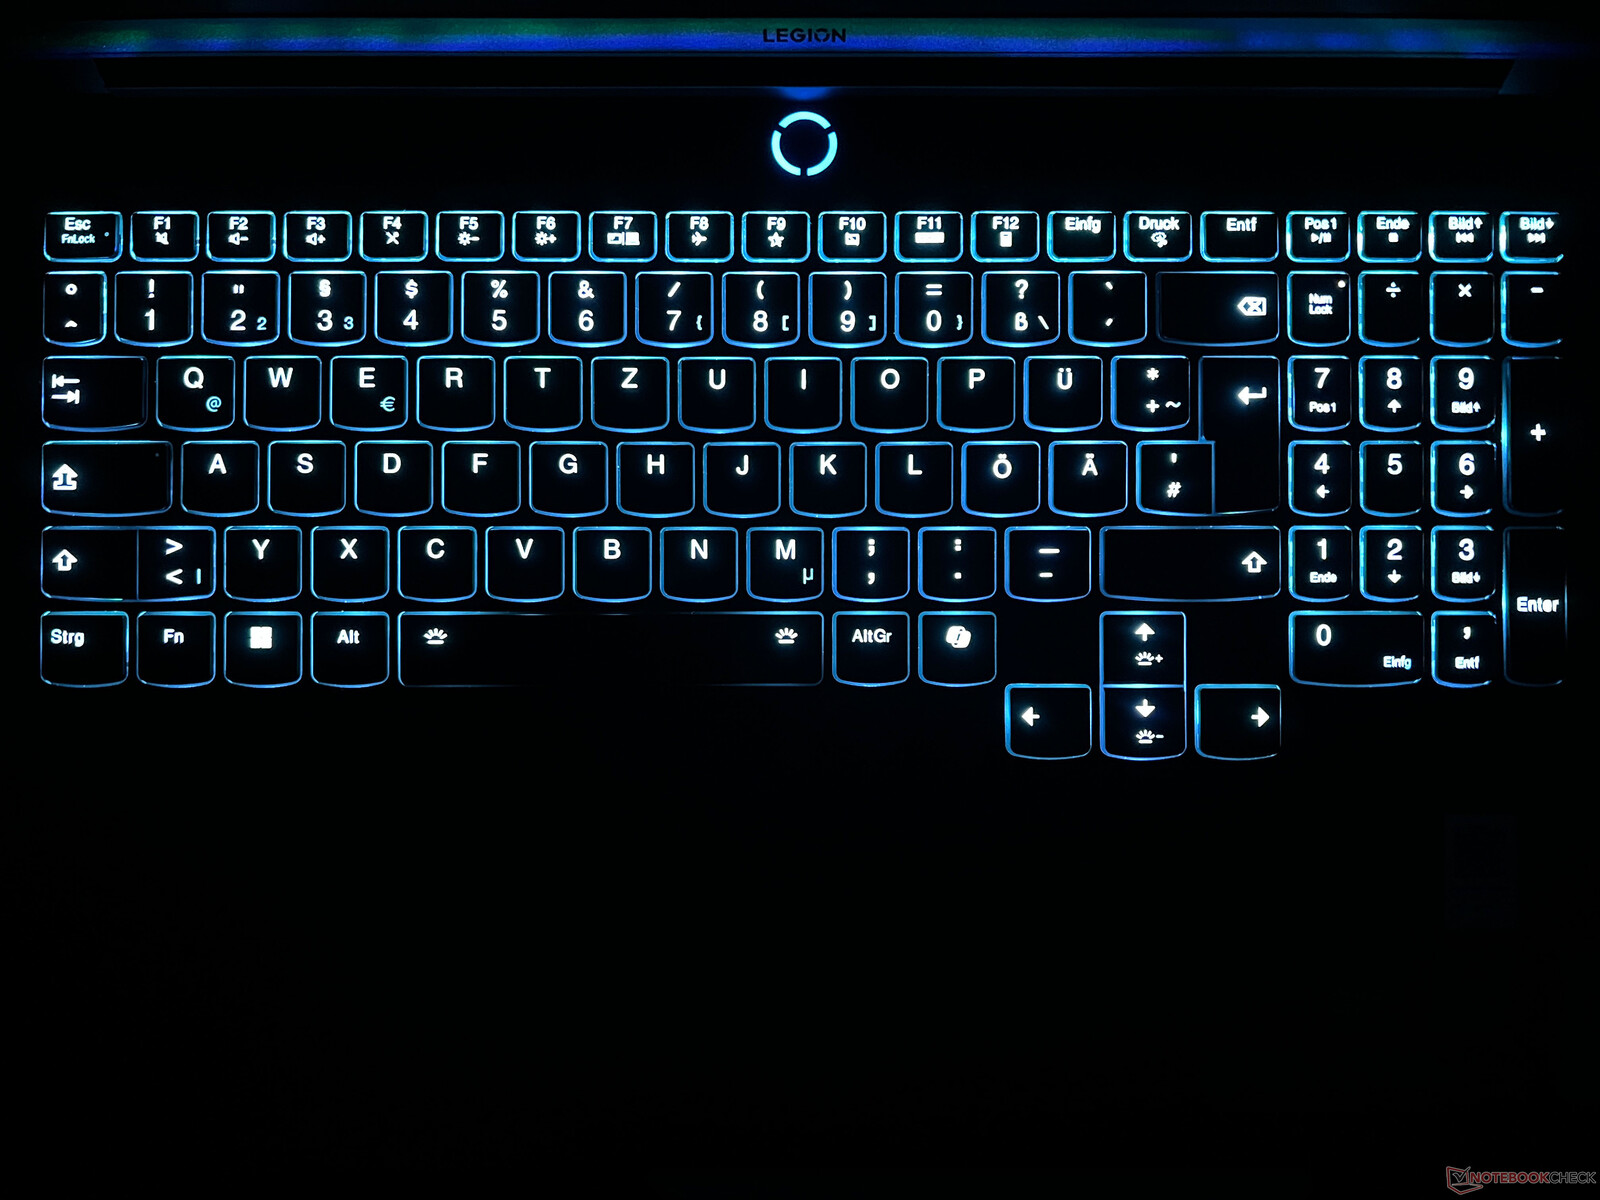
Dispositifs de saisie - Pavé numérique et éclairage individuel des touches
Lenovo a doté le Legion 7 16 d'un clavier à membrane très confortable, doté d'un pavé numérique dédié et d'un éclairage individuel des touches. Dans l'ensemble, la frappe précise et agréablement silencieuse des touches ne donne aucune raison de se plaindre. Même les textes longs peuvent être tapés sans effort. Les touches du pavé numérique sont un peu plus étroites, mais cela ne pose aucun problème en situation réelle. Les touches fléchées sont agréablement grandes et un lecteur d'empreintes digitales est intégré au bouton d'alimentation.
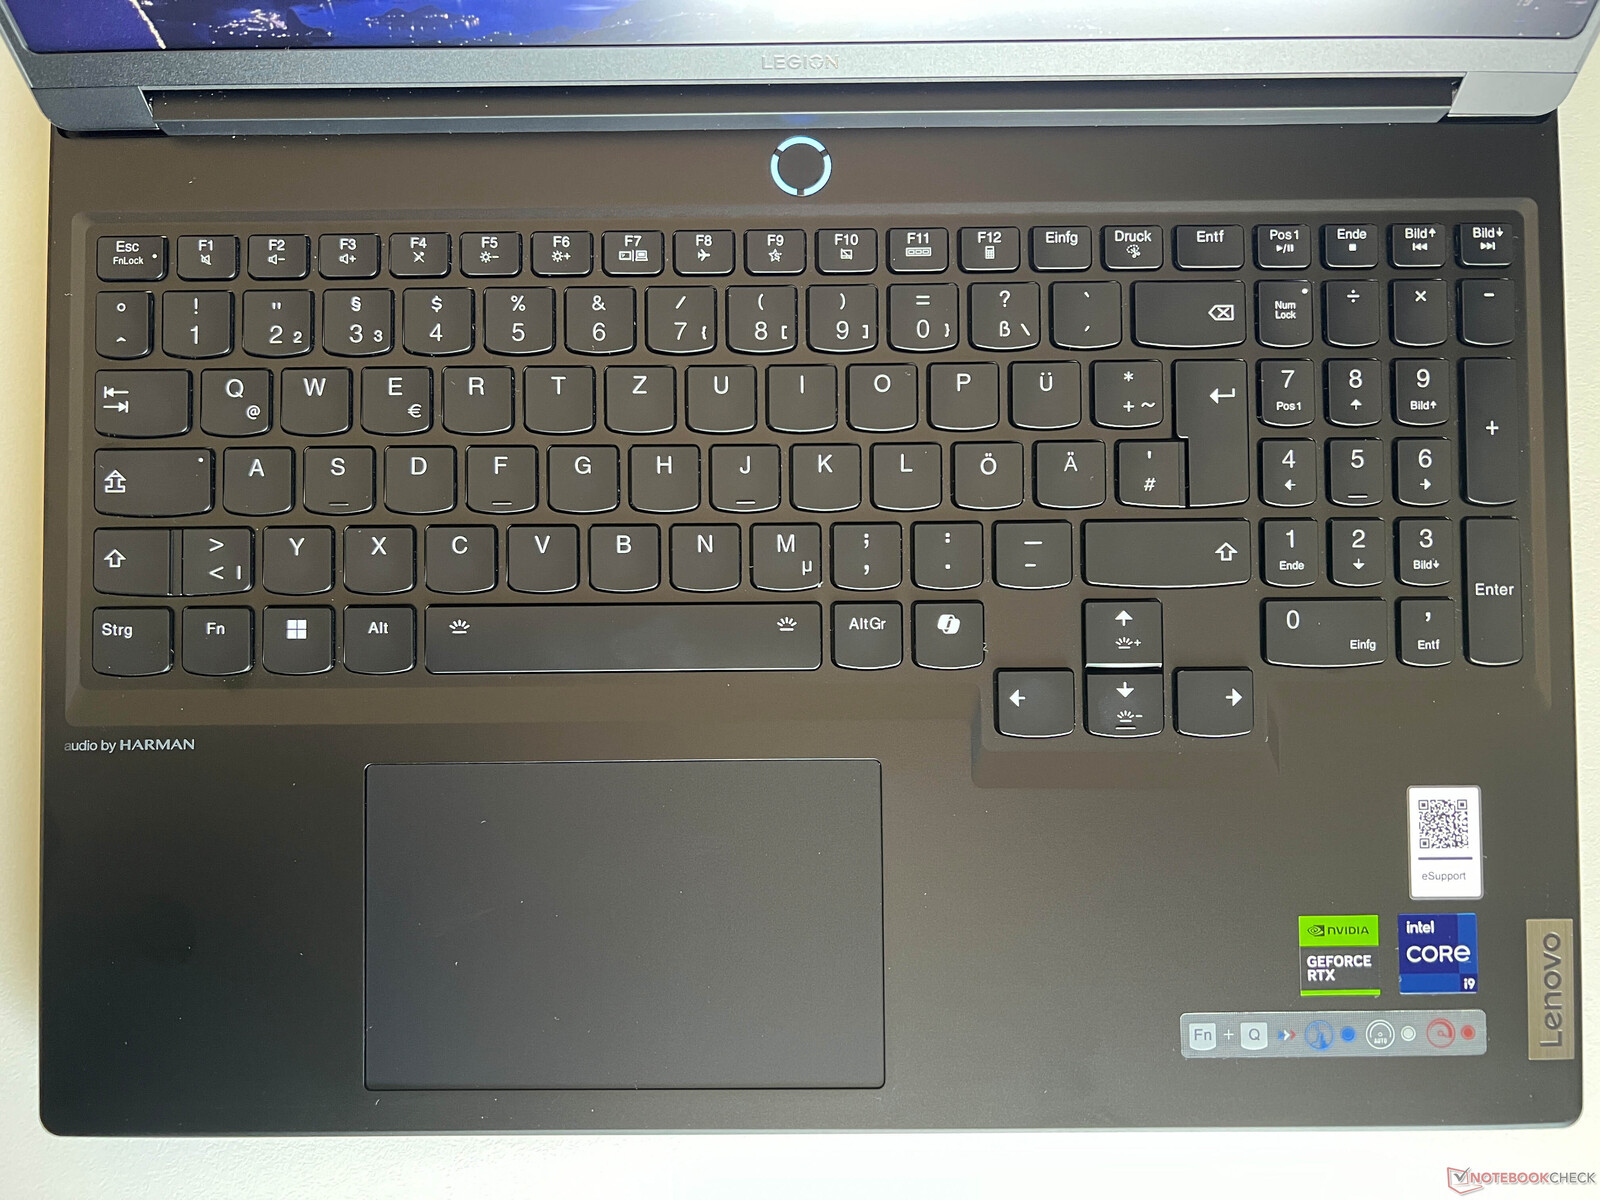
Le pavé tactile est positionné légèrement à gauche du centre et, avec ses 12 x 7,5 cm, il est bien proportionné. Les actions de balayage sont très bien traduites et la zone inférieure du pavé peut être cliquée, bien qu'assez bruyamment. C'est pourquoi vous ne devez toucher le pad que légèrement. La souris Legion Speed Mouse Mad M est également incluse.
Écran - Panneau IPS 3,2K, 165 Hz et G-Sync
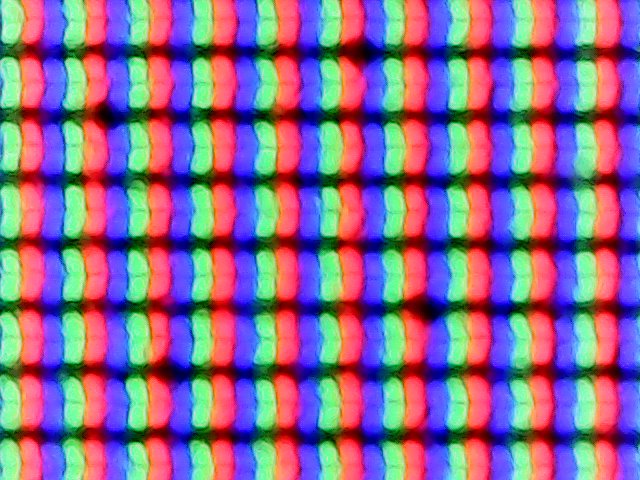
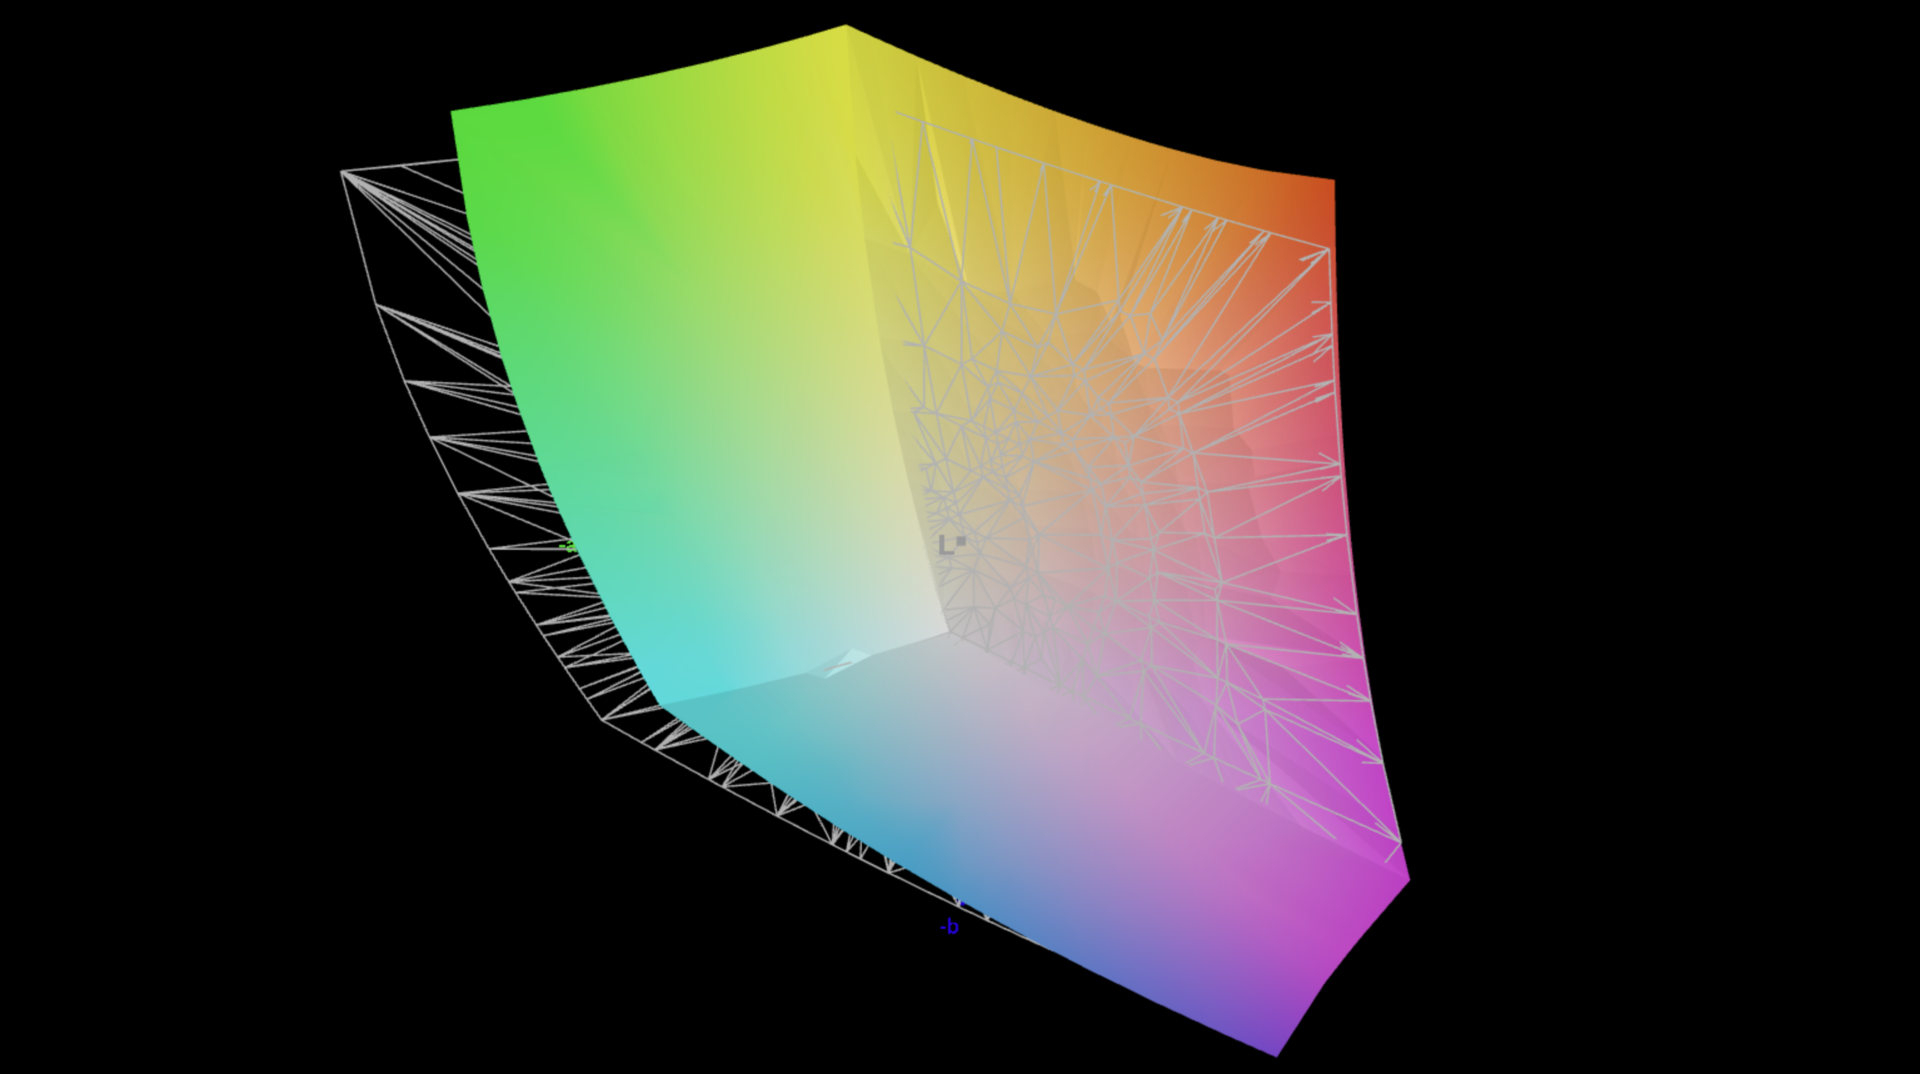
Notre Legion 7 16 est équipé d'un écran IPS haute résolution au format 16:10 (3 200 x 2 000 pixels). La qualité subjective de l'image est bonne, le contenu apparaissant très net grâce à la haute résolution de l'écran. De même, les couleurs sont éclatantes, mais les écrans OLED actuels offrent des images plus vives. Lorsqu'il s'agit de contenus plus clairs, les surfaces apparaissent légèrement granuleuses, mais Lenovo parvient à éviter ce problème en utilisant le mode sombre de Windows en standard. Les mouvements sont très fluides grâce au taux de rafraîchissement de 165 Hz et les temps de réponse sont rapides. Le scintillement PWM n'est pas utilisé.
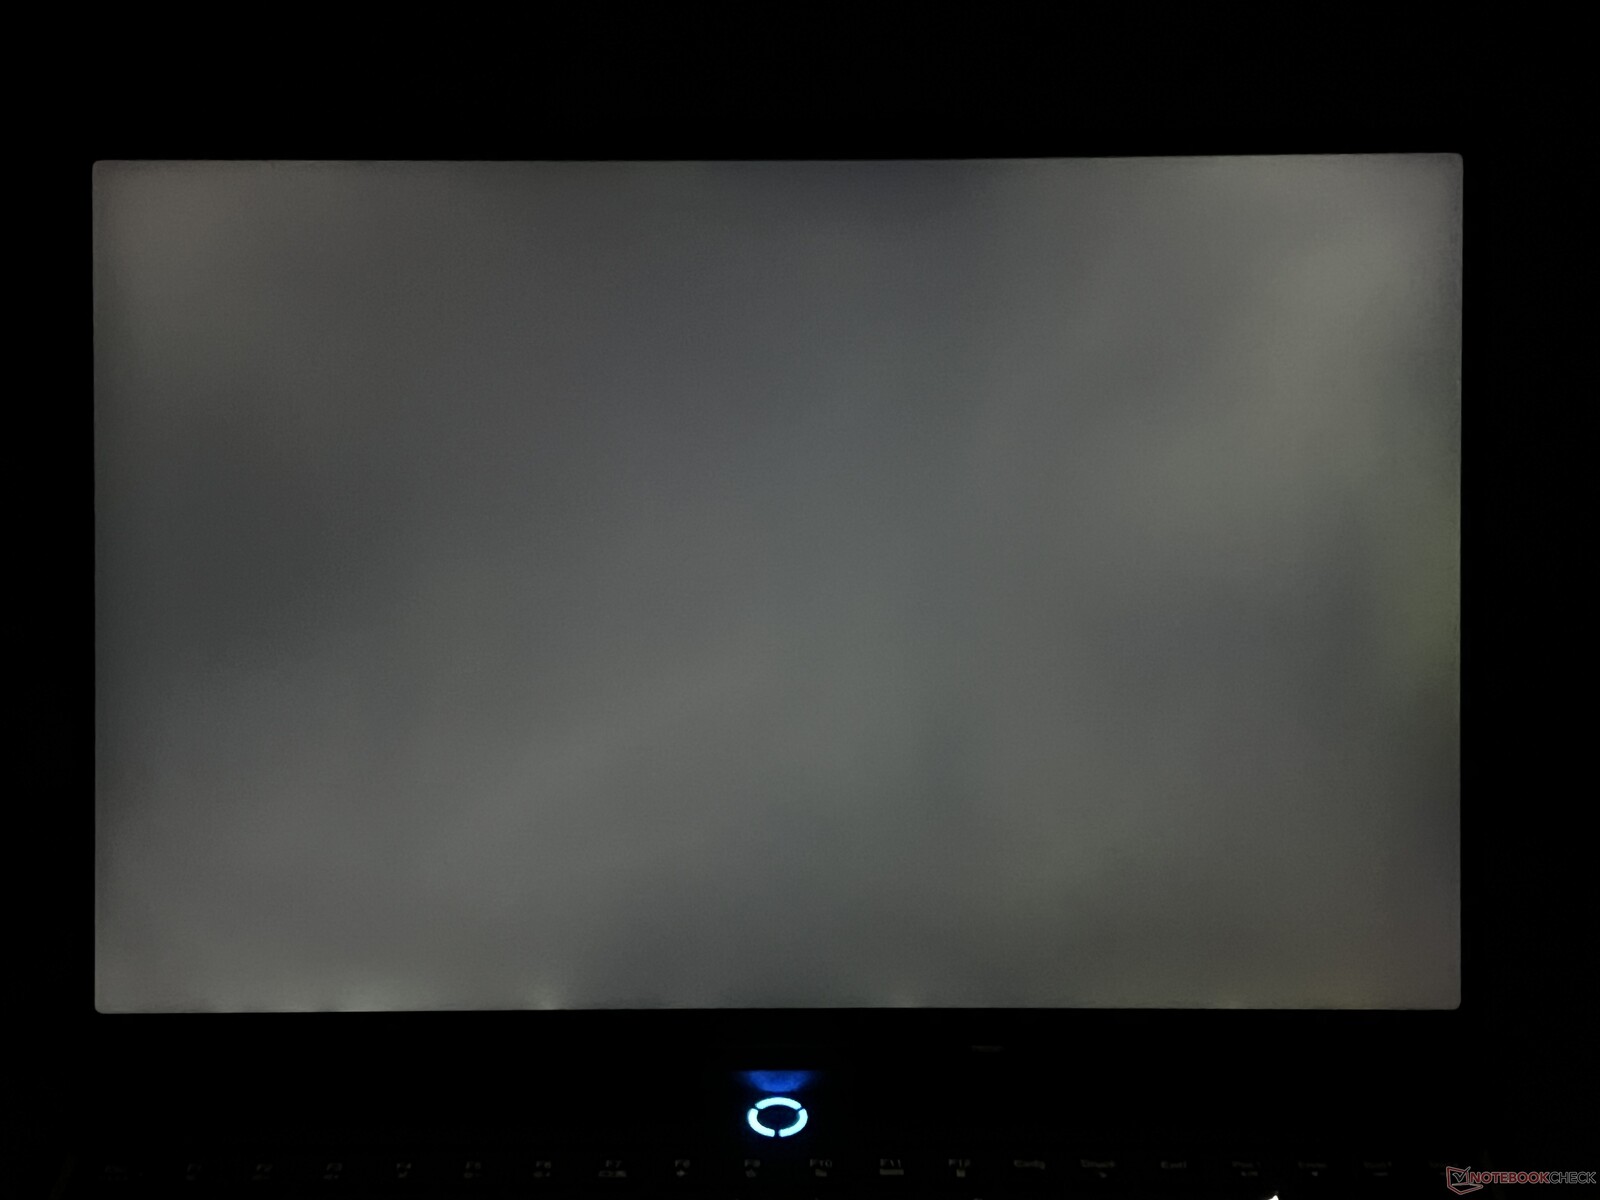
La luminosité moyenne se situe autour de 400 cd/m², mais avec 0,43 cd/m², la valeur du noir est assez élevée et explique pourquoi le rapport de contraste maximal est à peine inférieur à 1.000:1. De plus, à pleine luminosité et avec des contenus sombres, il y a des saignements de lumière visibles.
| |||||||||||||||||||||||||
Homogénéité de la luminosité: 89 %
Valeur mesurée au centre, sur batterie: 412 cd/m²
Contraste: 958:1 (Valeurs des noirs: 0.43 cd/m²)
ΔE Color 0.9 | 0.5-29.43 Ø5, calibrated: 0.6
ΔE Greyscale 1.4 | 0.57-98 Ø5.3
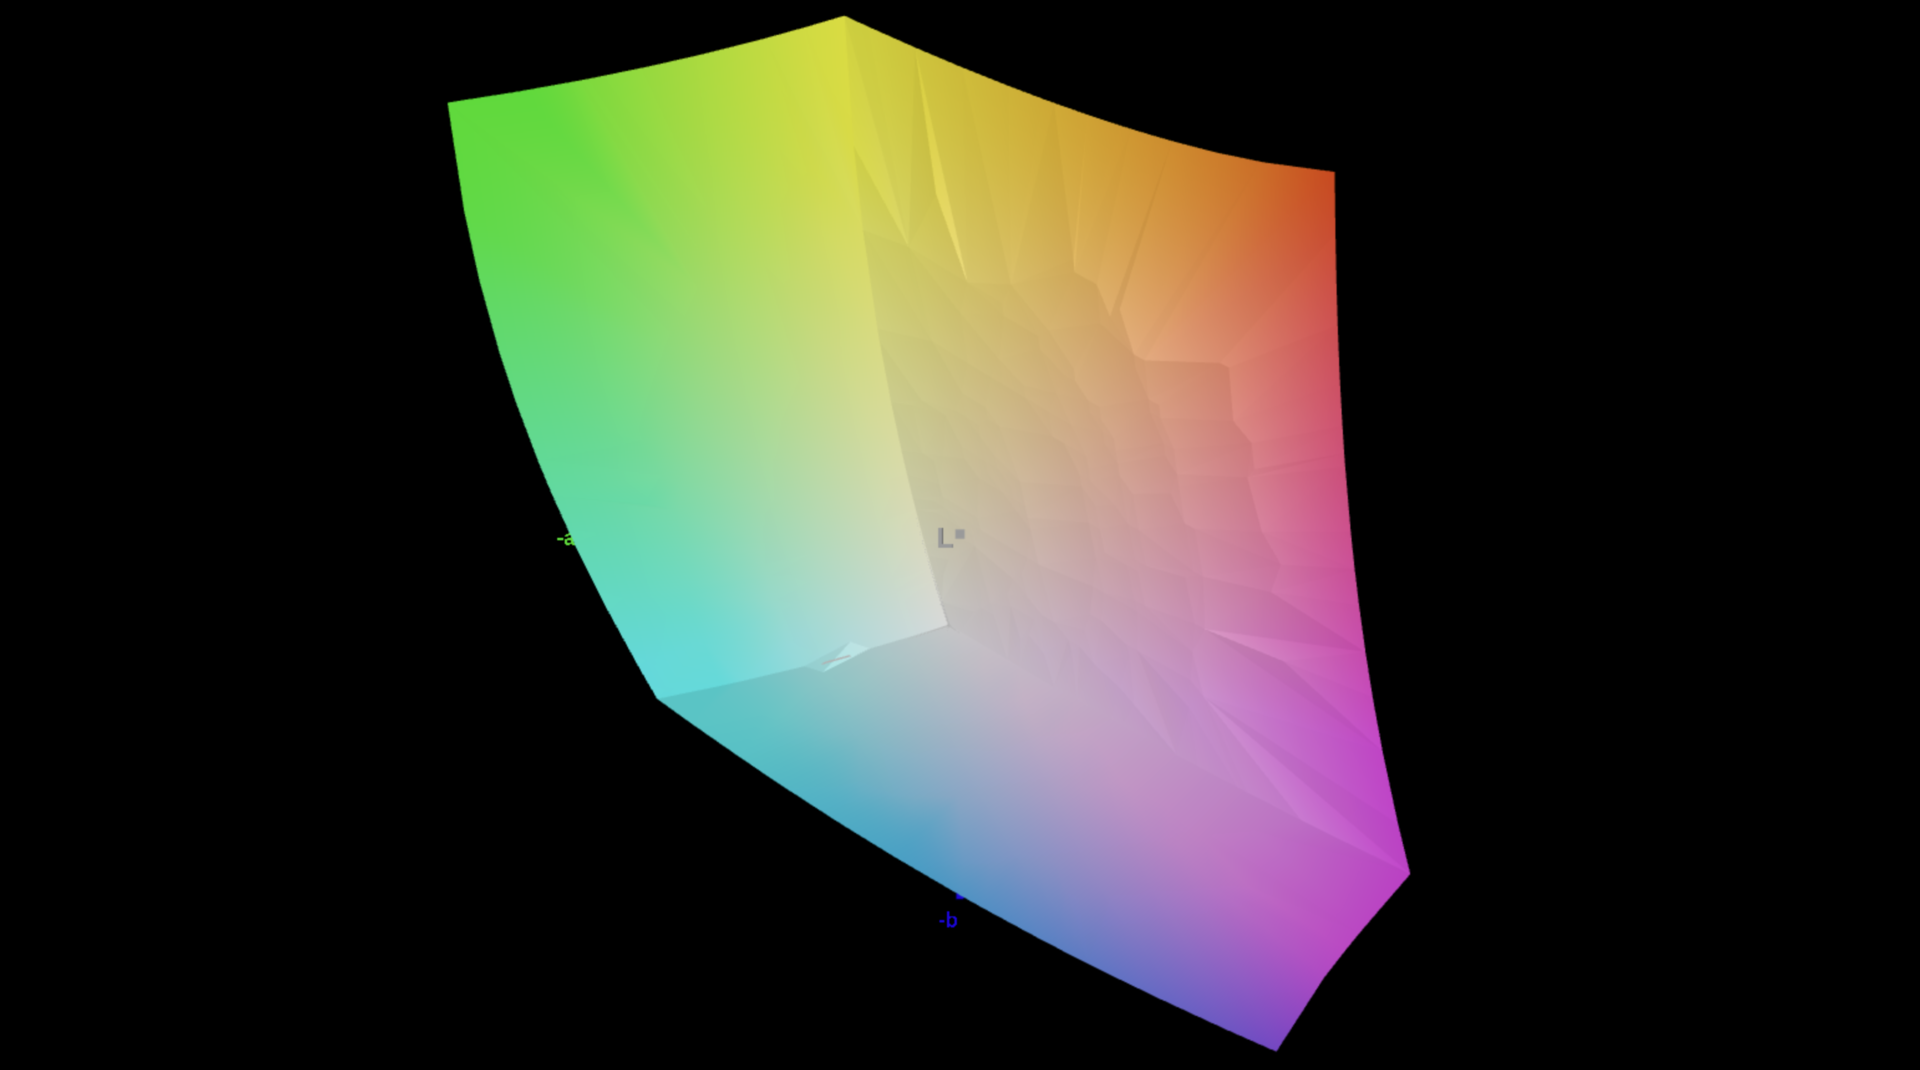
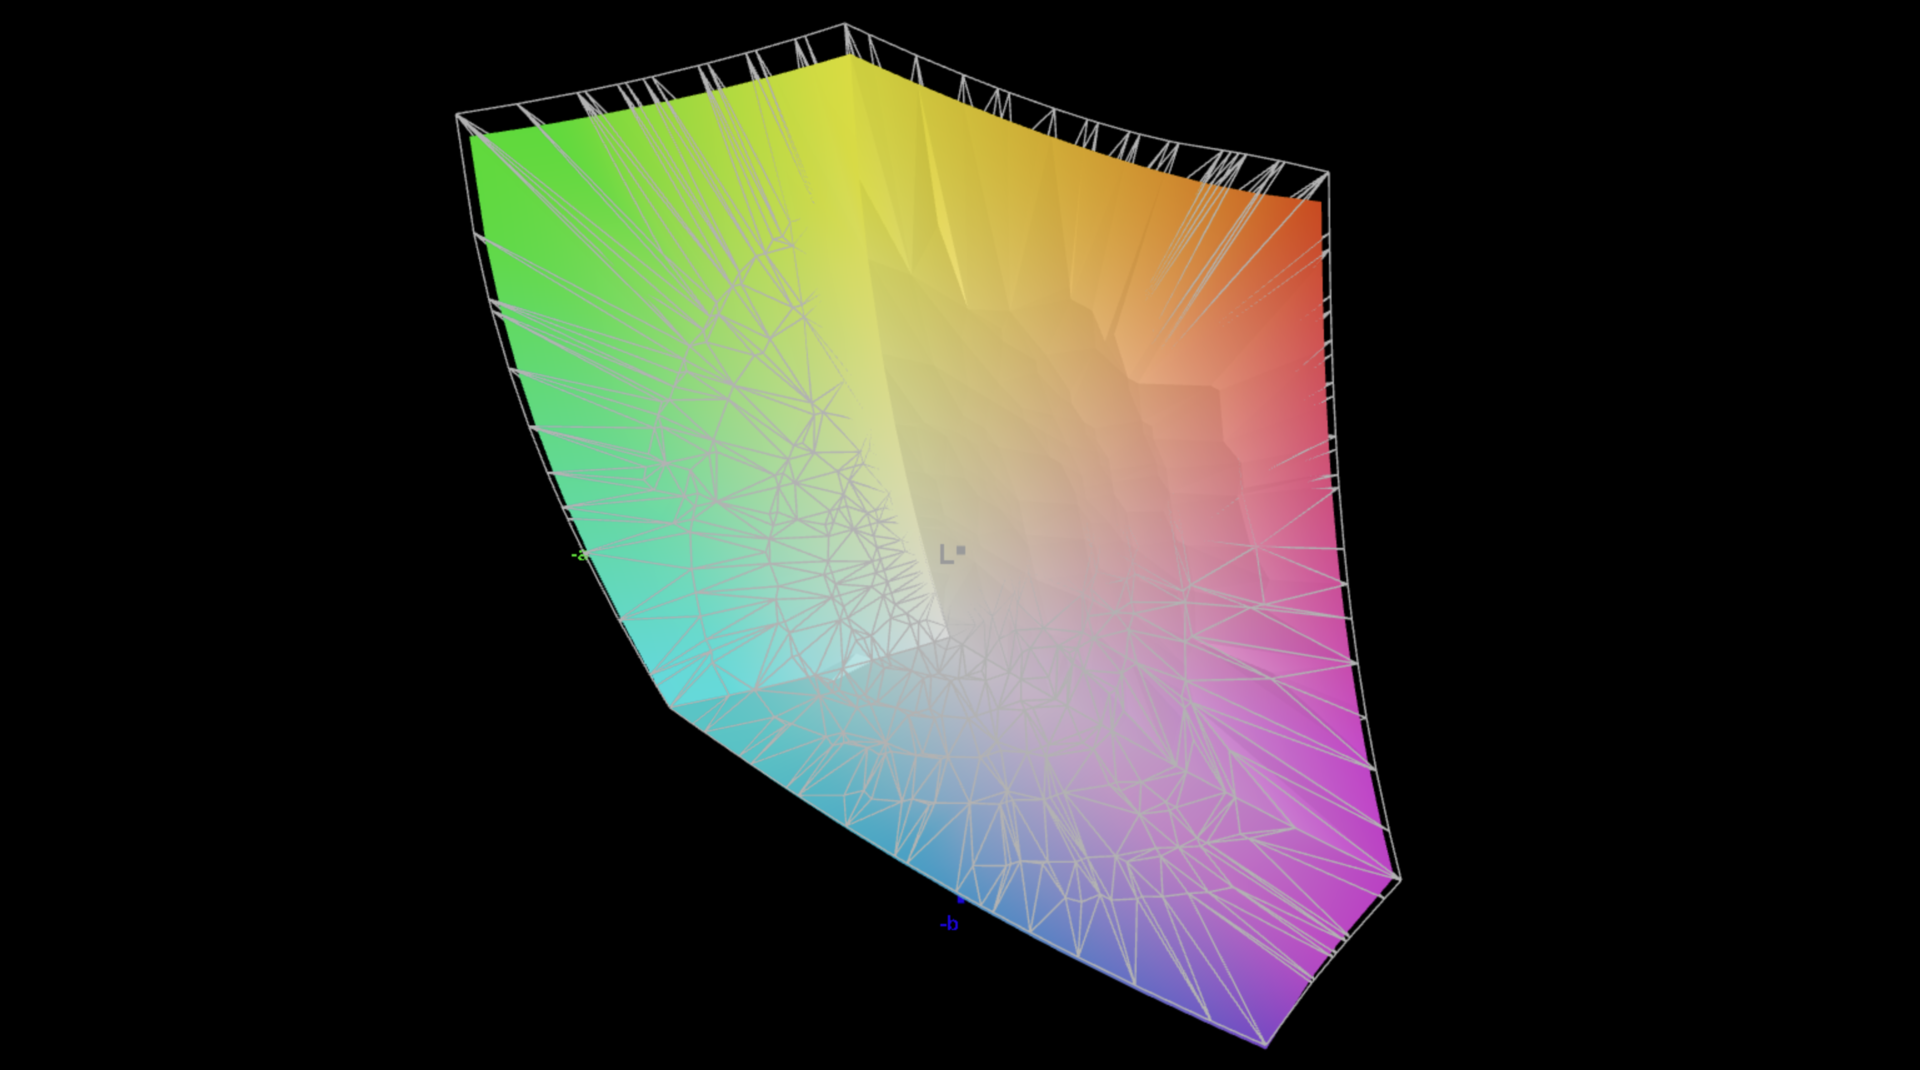
87.2% AdobeRGB 1998 (Argyll 2.2.0 3D)
100% sRGB (Argyll 2.2.0 3D)
95% Display P3 (Argyll 2.2.0 3D)
Gamma: 2.23
| Lenovo Legion 7 16 IRX G9 MNG007ZA1-2, IPS, 3200x2000, 16.00 | Lenovo Legion Pro 7 16IRX9H BOE CQ NE16QDM-NZB, IPS, 2560x1600, 16.00 | Lenovo Legion Pro 5 16IRX9 BOE NE160QDM-NYC, IPS, 2560x1600, 16.00 | Aorus 16X 2024 BOE CQ NE160QDM-NY1, IPS, 2560x1600, 16.00 | HP Omen Transcend 16-u1095ng ATNA60DL02-0 (SDC41A4), OLED, 2560x1600, 16.00 | Alienware m16 R2 BOE NE16NYH, IPS, 2560x1600, 16.00 | SCHENKER XMG CORE 16 (L23) BOE0AF0 (), IPS, 2560x1600, 16.00 | |
|---|---|---|---|---|---|---|---|
| Display | 1% | -16% | -18% | 5% | -14% | -16% | |
| Display P3 Coverage | 95 | 98.5 4% | 69.3 -27% | 67.2 -29% | 99.8 5% | 71 -25% | 68.3 -28% |
| sRGB Coverage | 100 | 99.9 0% | 99.4 -1% | 96.7 -3% | 100 0% | 100 0% | 98.6 -1% |
| AdobeRGB 1998 Coverage | 87.2 | 86.7 -1% | 70.1 -20% | 69.3 -21% | 97 11% | 71.4 -18% | 69.6 -20% |
| Response Times | 16% | -4% | 37% | 98% | 20% | 8% | |
| Response Time Grey 50% / Grey 80% * | 14.4 ? | 12.6 ? 12% | 11.9 ? 17% | 7.5 ? 48% | 0.2 ? 99% | 5.7 ? 60% | 13.2 ? 8% |
| Response Time Black / White * | 7.2 ? | 5.8 ? 19% | 8.9 ? -24% | 5.4 ? 25% | 0.2 ? 97% | 8.7 ? -21% | 6.6 ? 8% |
| PWM Frequency | 120 ? | ||||||
| Screen | 3% | -11% | -58% | 133% | -26% | -69% | |
| Brightness middle | 412 | 487 18% | 384 -7% | 542 32% | 390 -5% | 345.8 -16% | 376 -9% |
| Brightness | 396 | 460 16% | 366 -8% | 504 27% | 392 -1% | 337 -15% | 358 -10% |
| Brightness Distribution | 89 | 88 -1% | 91 2% | 86 -3% | 98 10% | 87 -2% | 88 -1% |
| Black Level * | 0.43 | 0.42 2% | 0.35 19% | 0.45 -5% | 0.02 95% | 0.3 30% | 0.33 23% |
| Contrast | 958 | 1160 21% | 1097 15% | 1204 26% | 19500 1935% | 1153 20% | 1139 19% |
| Colorchecker dE 2000 * | 0.9 | 1.12 -24% | 0.97 -8% | 2.73 -203% | 1.94 -116% | 1.99 -121% | 2.74 -204% |
| Colorchecker dE 2000 max. * | 2 | 2.26 -13% | 3.57 -79% | 5.29 -165% | 4.26 -113% | 3.52 -76% | 6.78 -239% |
| Colorchecker dE 2000 calibrated * | 0.6 | 0.54 10% | 0.77 -28% | 1.32 -120% | 4.21 -602% | 0.62 -3% | 0.88 -47% |
| Greyscale dE 2000 * | 1.4 | 1.4 -0% | 1.5 -7% | 2.9 -107% | 1.5 -7% | 2.1 -50% | 3.57 -155% |
| Gamma | 2.23 99% | 2.242 98% | 2.24 98% | 2.192 100% | 2.221 99% | 2.32 95% | 2.4 92% |
| CCT | 6731 97% | 6809 95% | 6709 97% | 6173 105% | 6395 102% | 6369 102% | 7246 90% |
| Moyenne finale (programmes/paramètres) | 7% /
5% | -10% /
-11% | -13% /
-36% | 79% /
101% | -7% /
-17% | -26% /
-47% |
* ... Moindre est la valeur, meilleures sont les performances


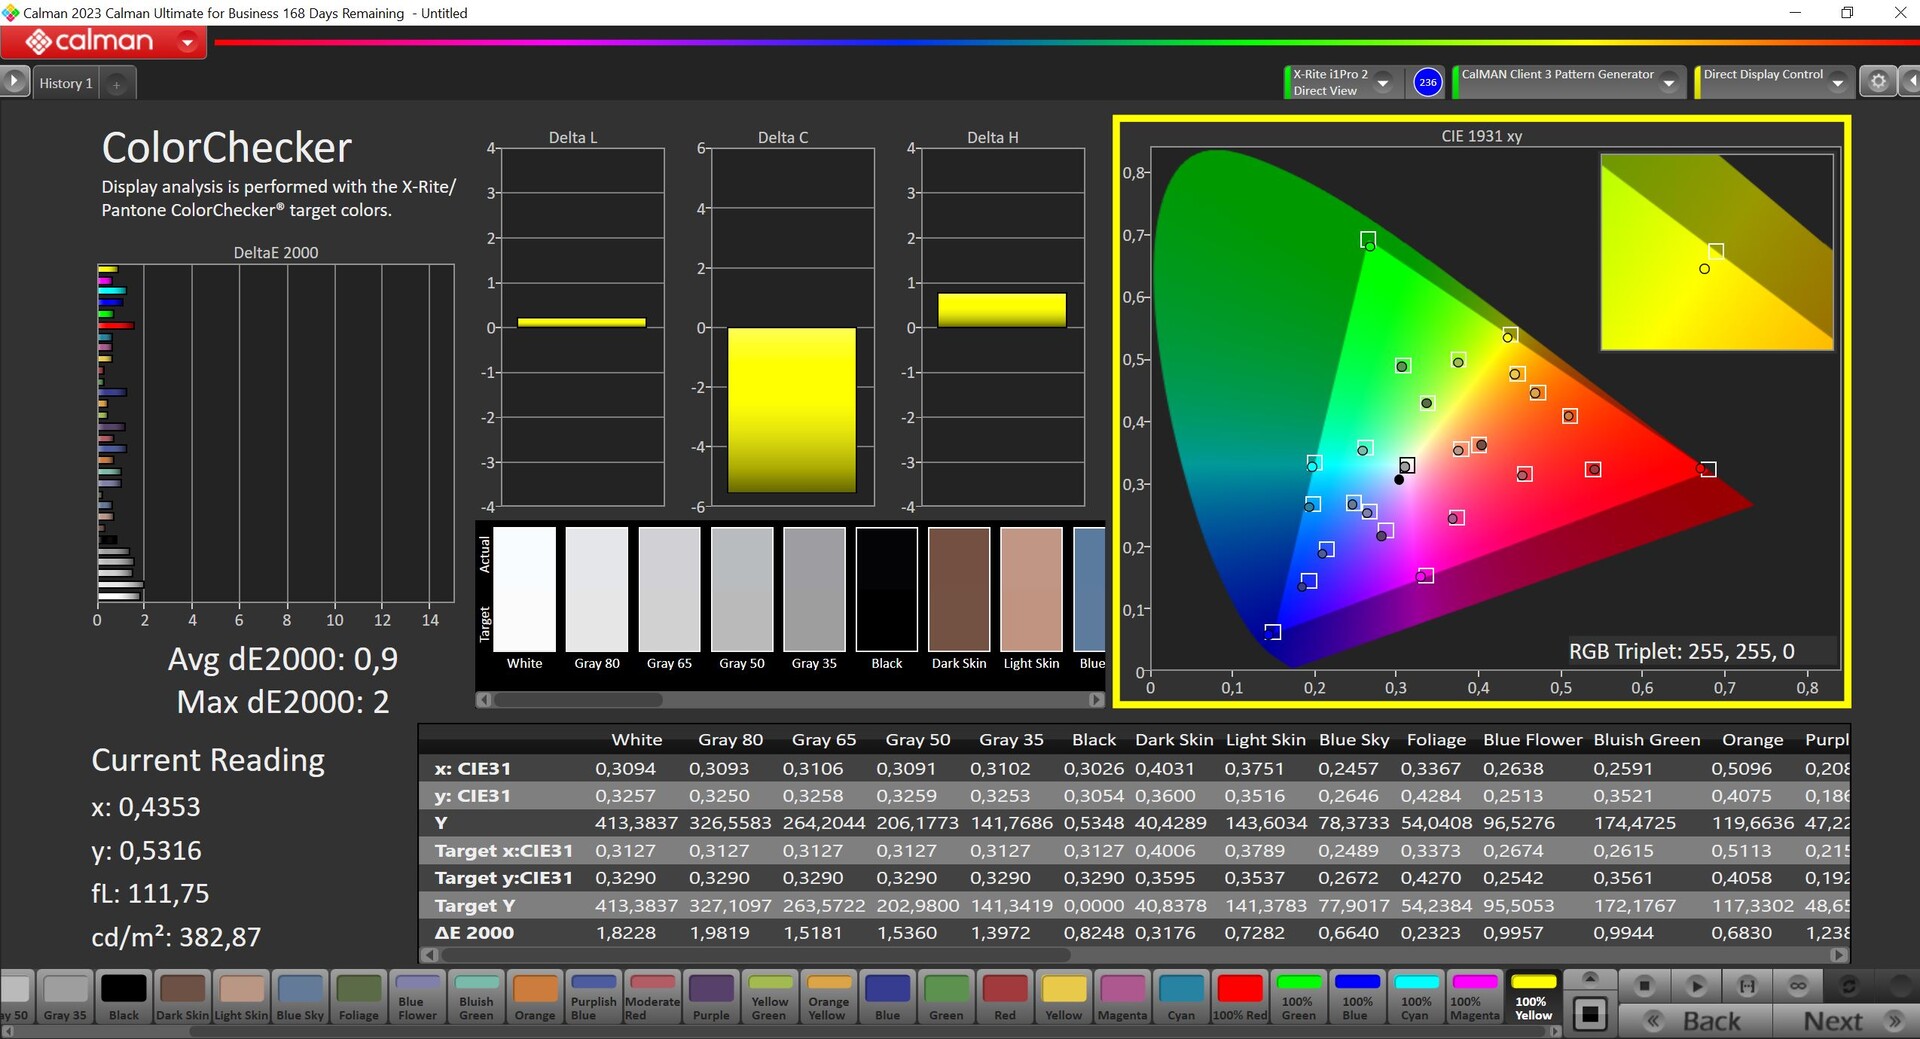
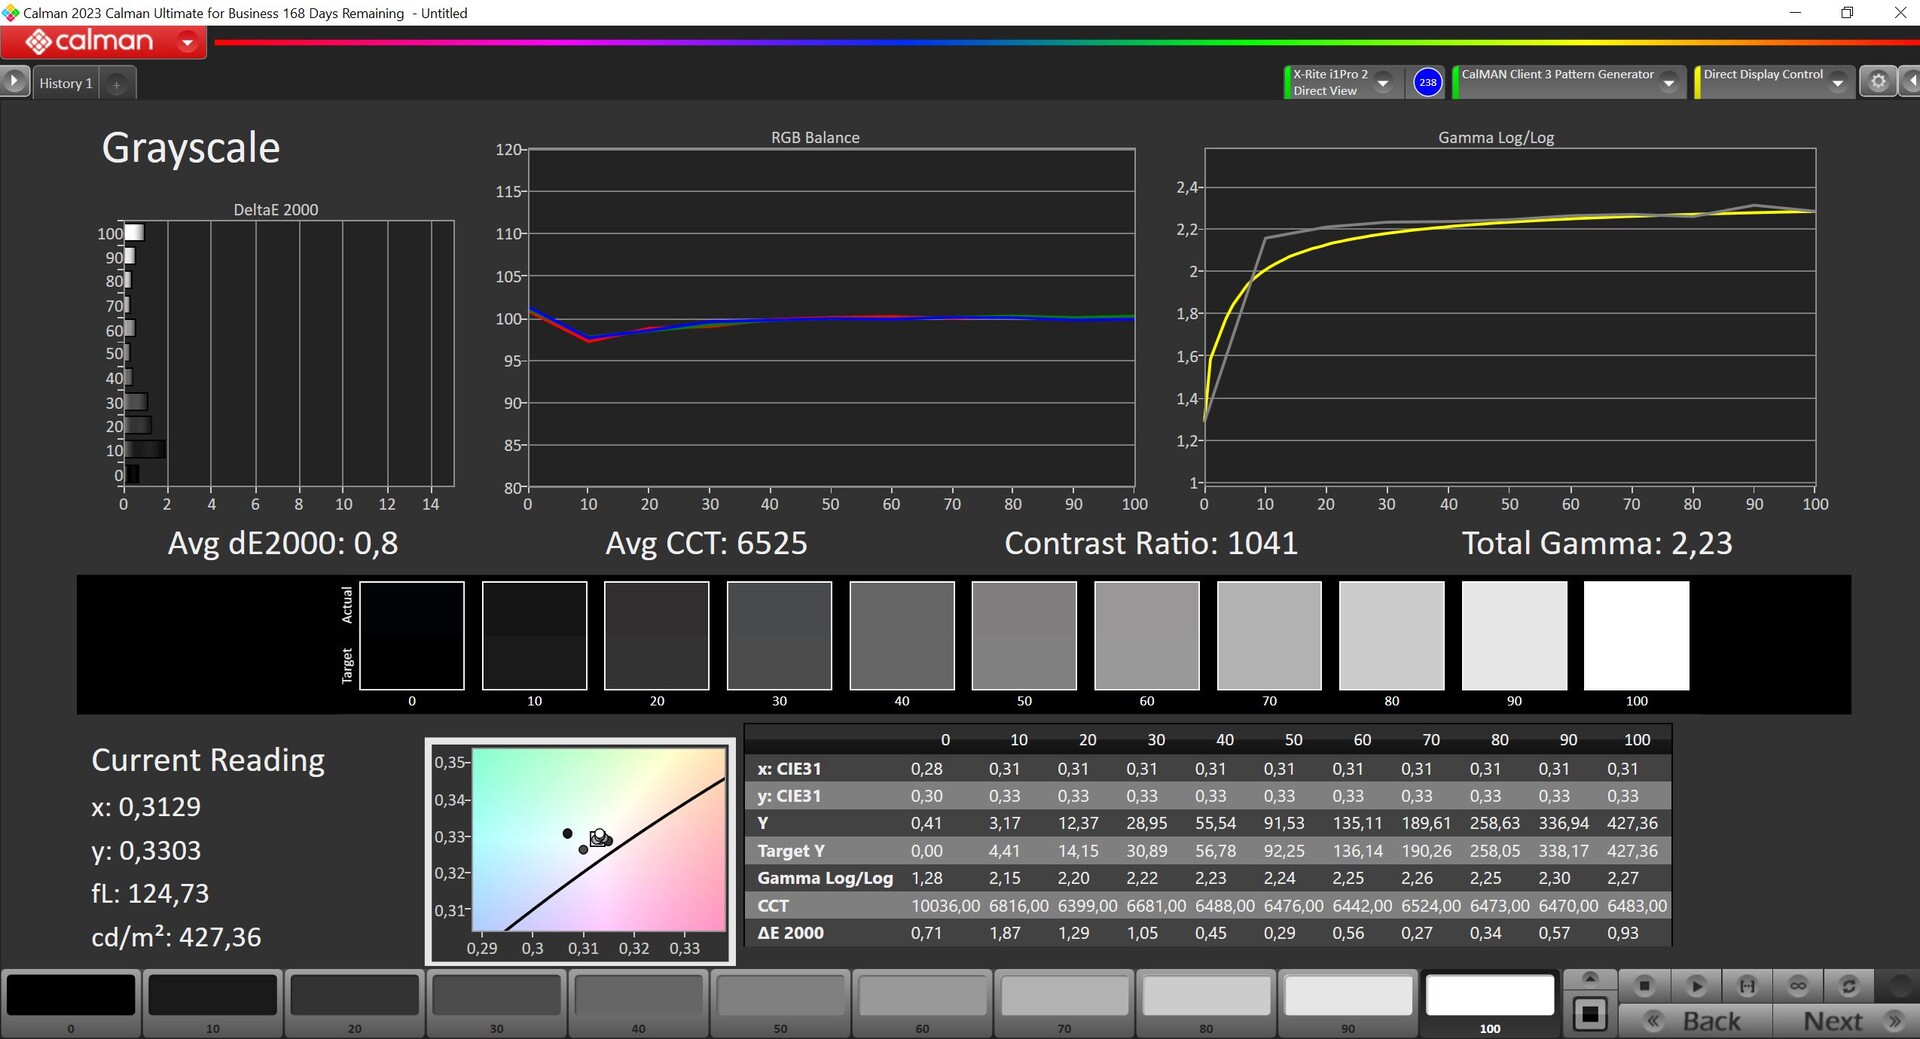
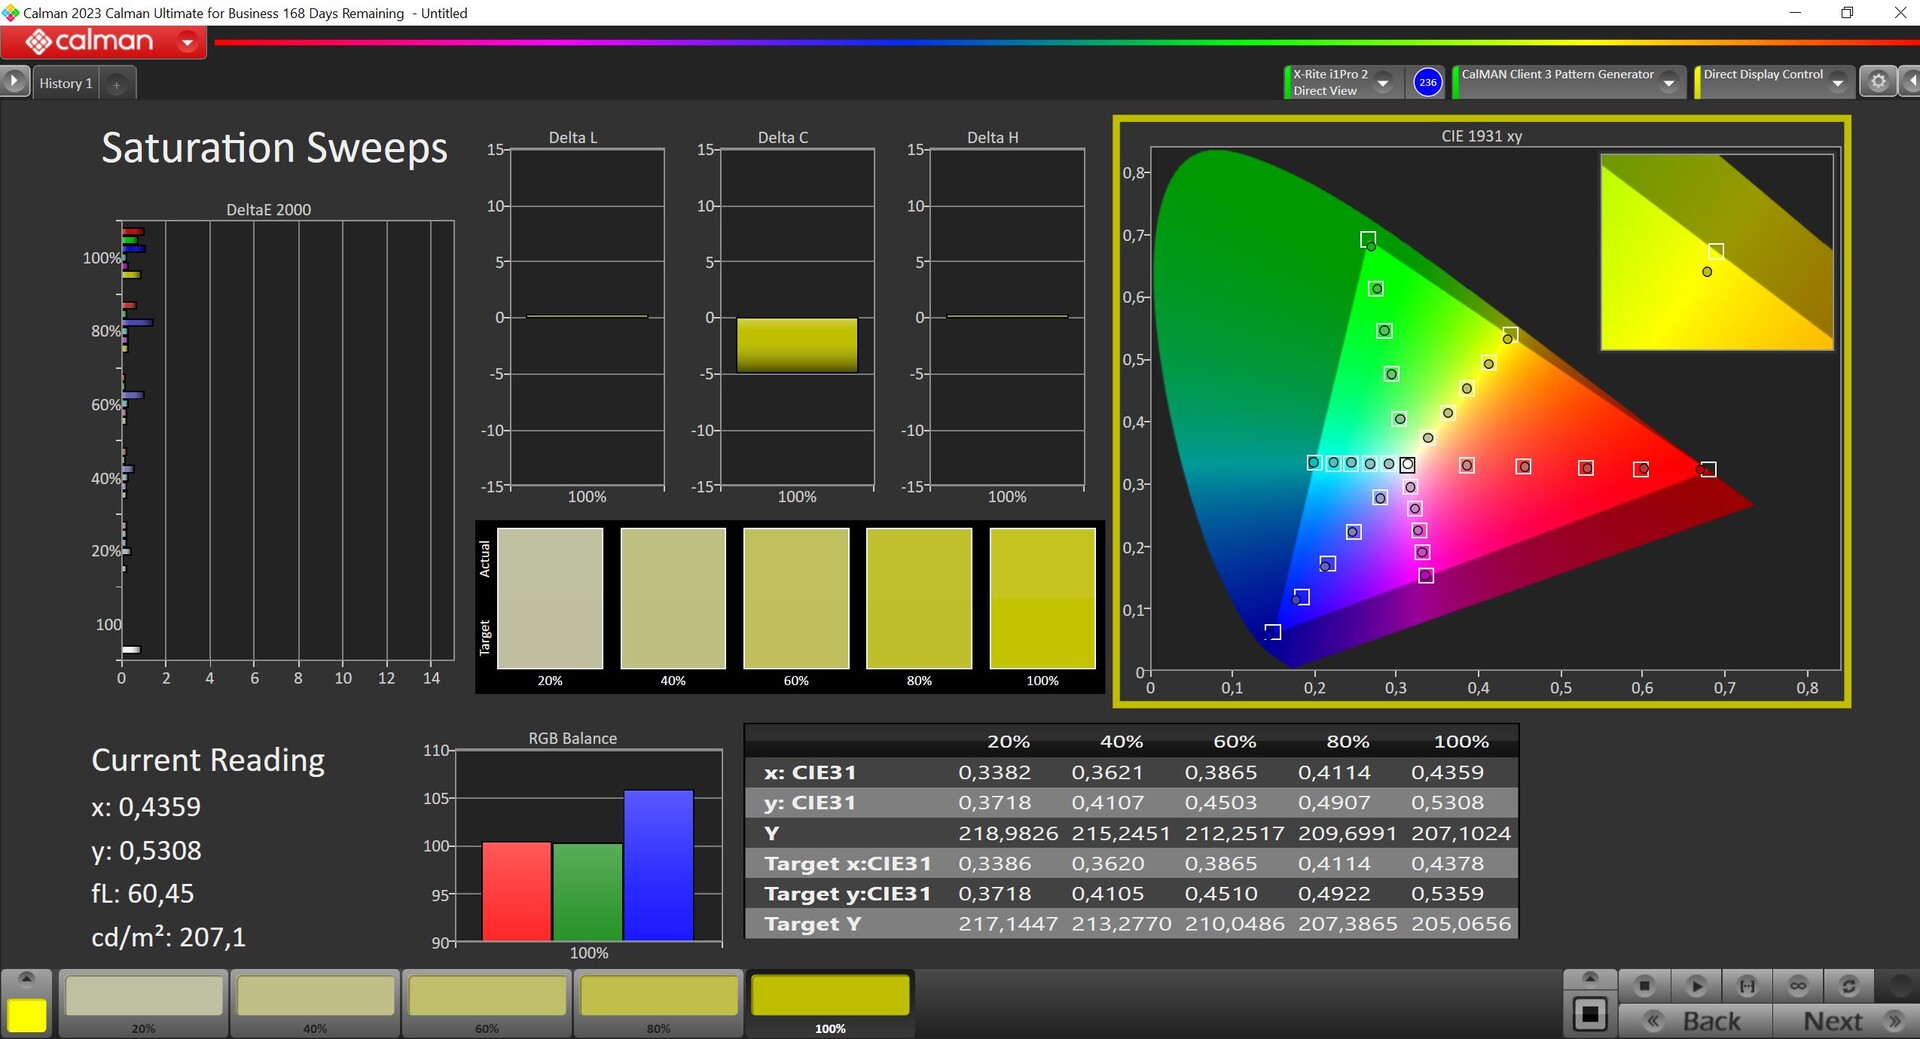
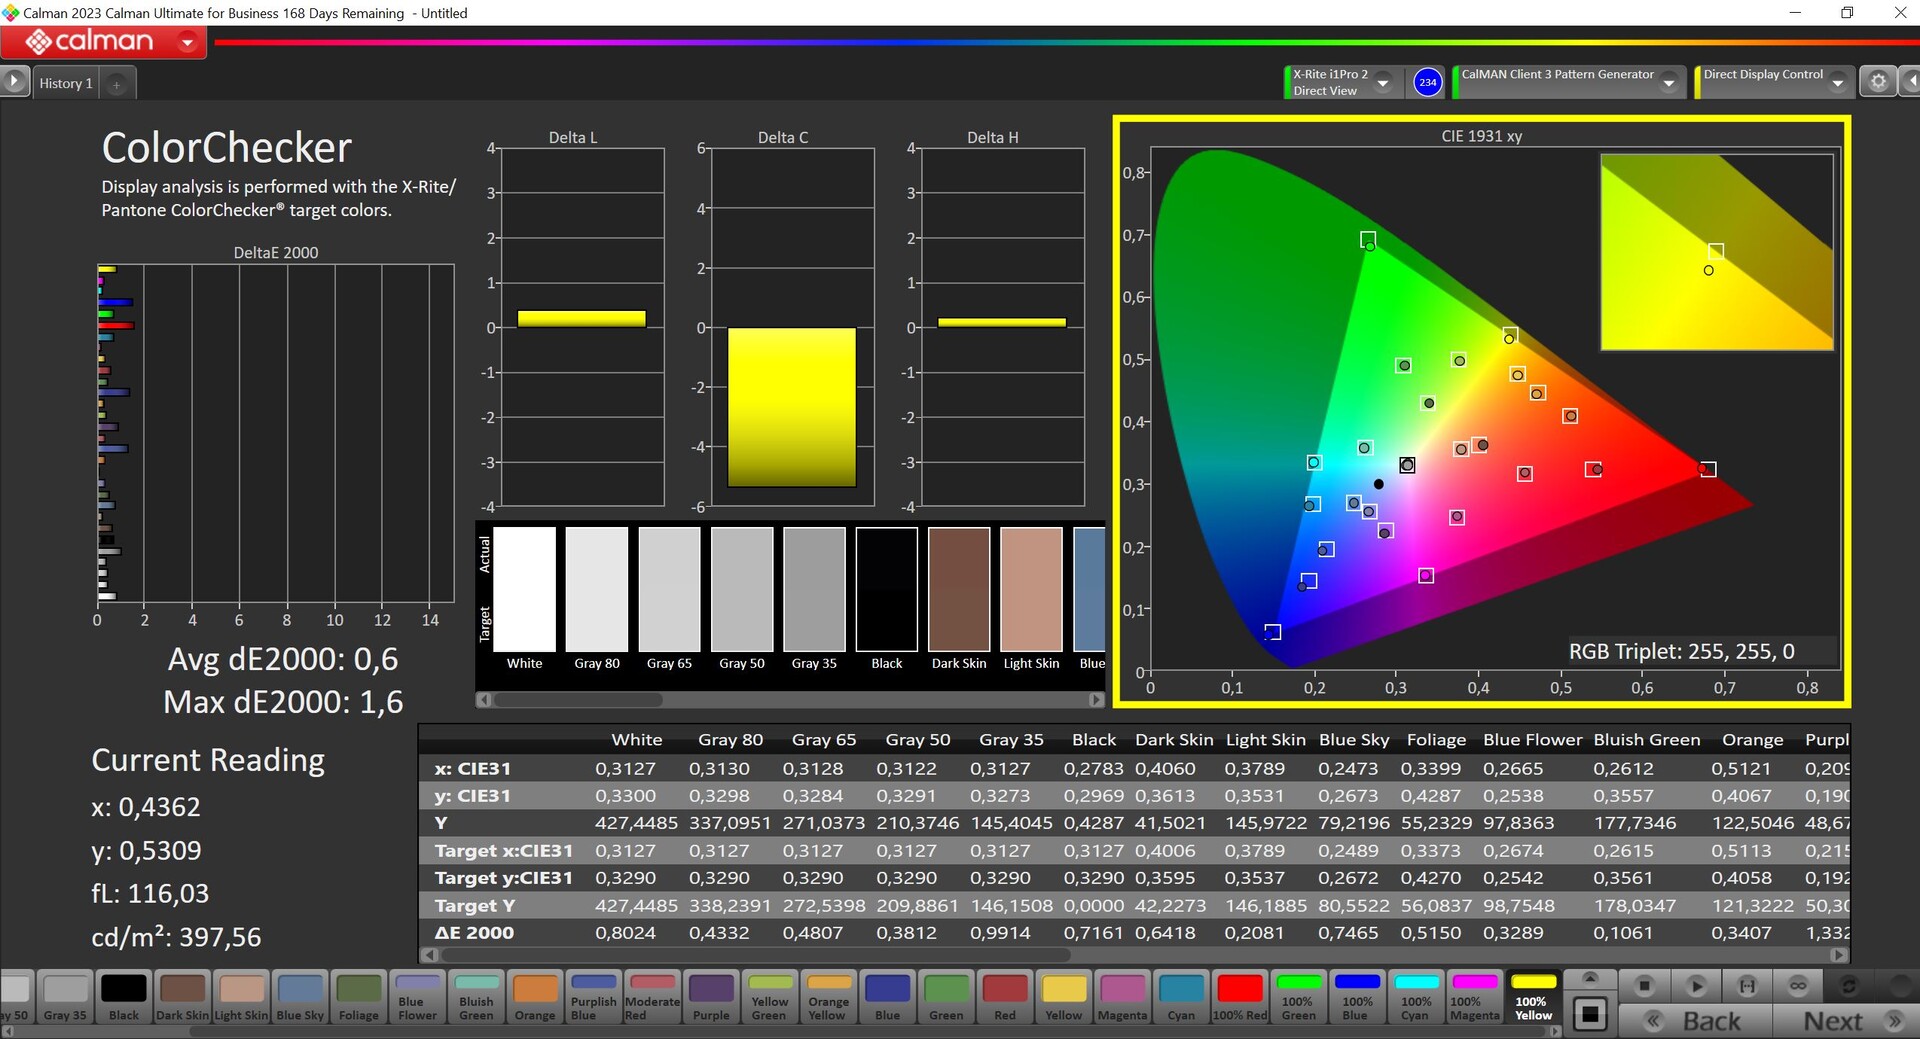
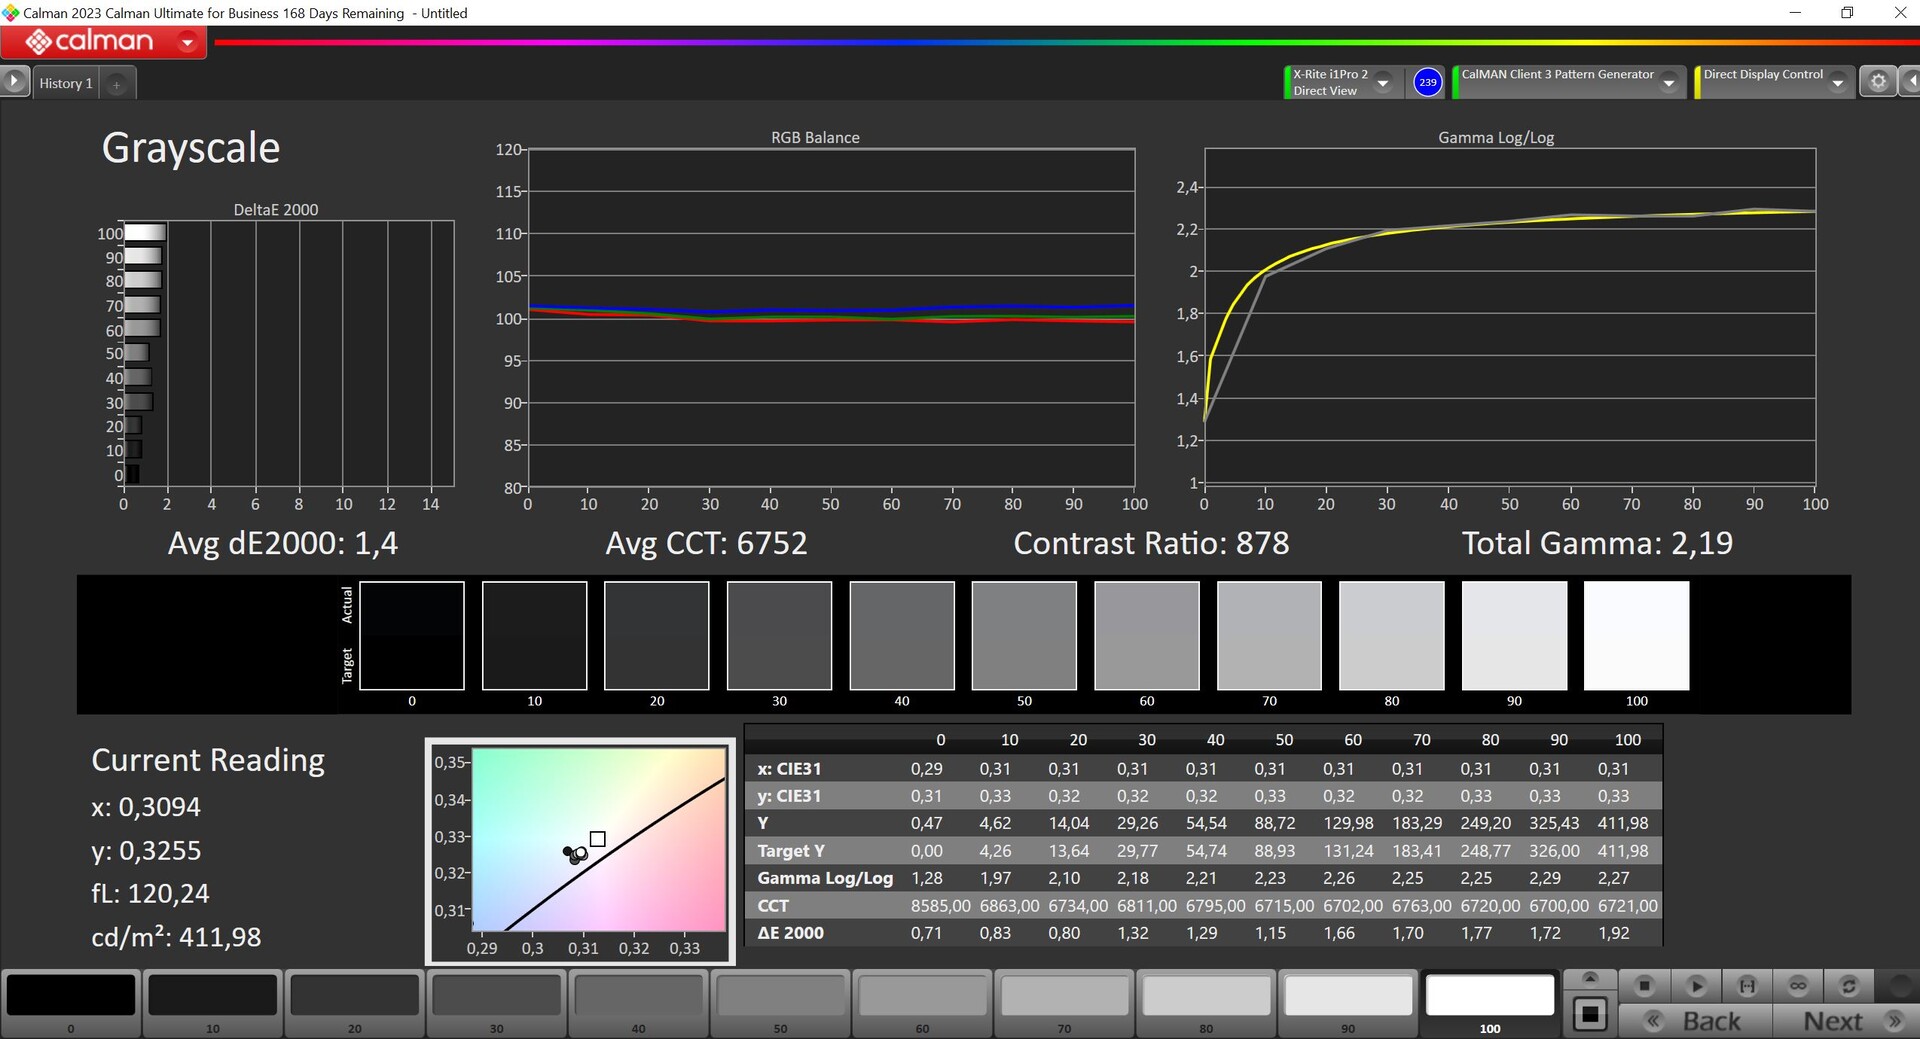
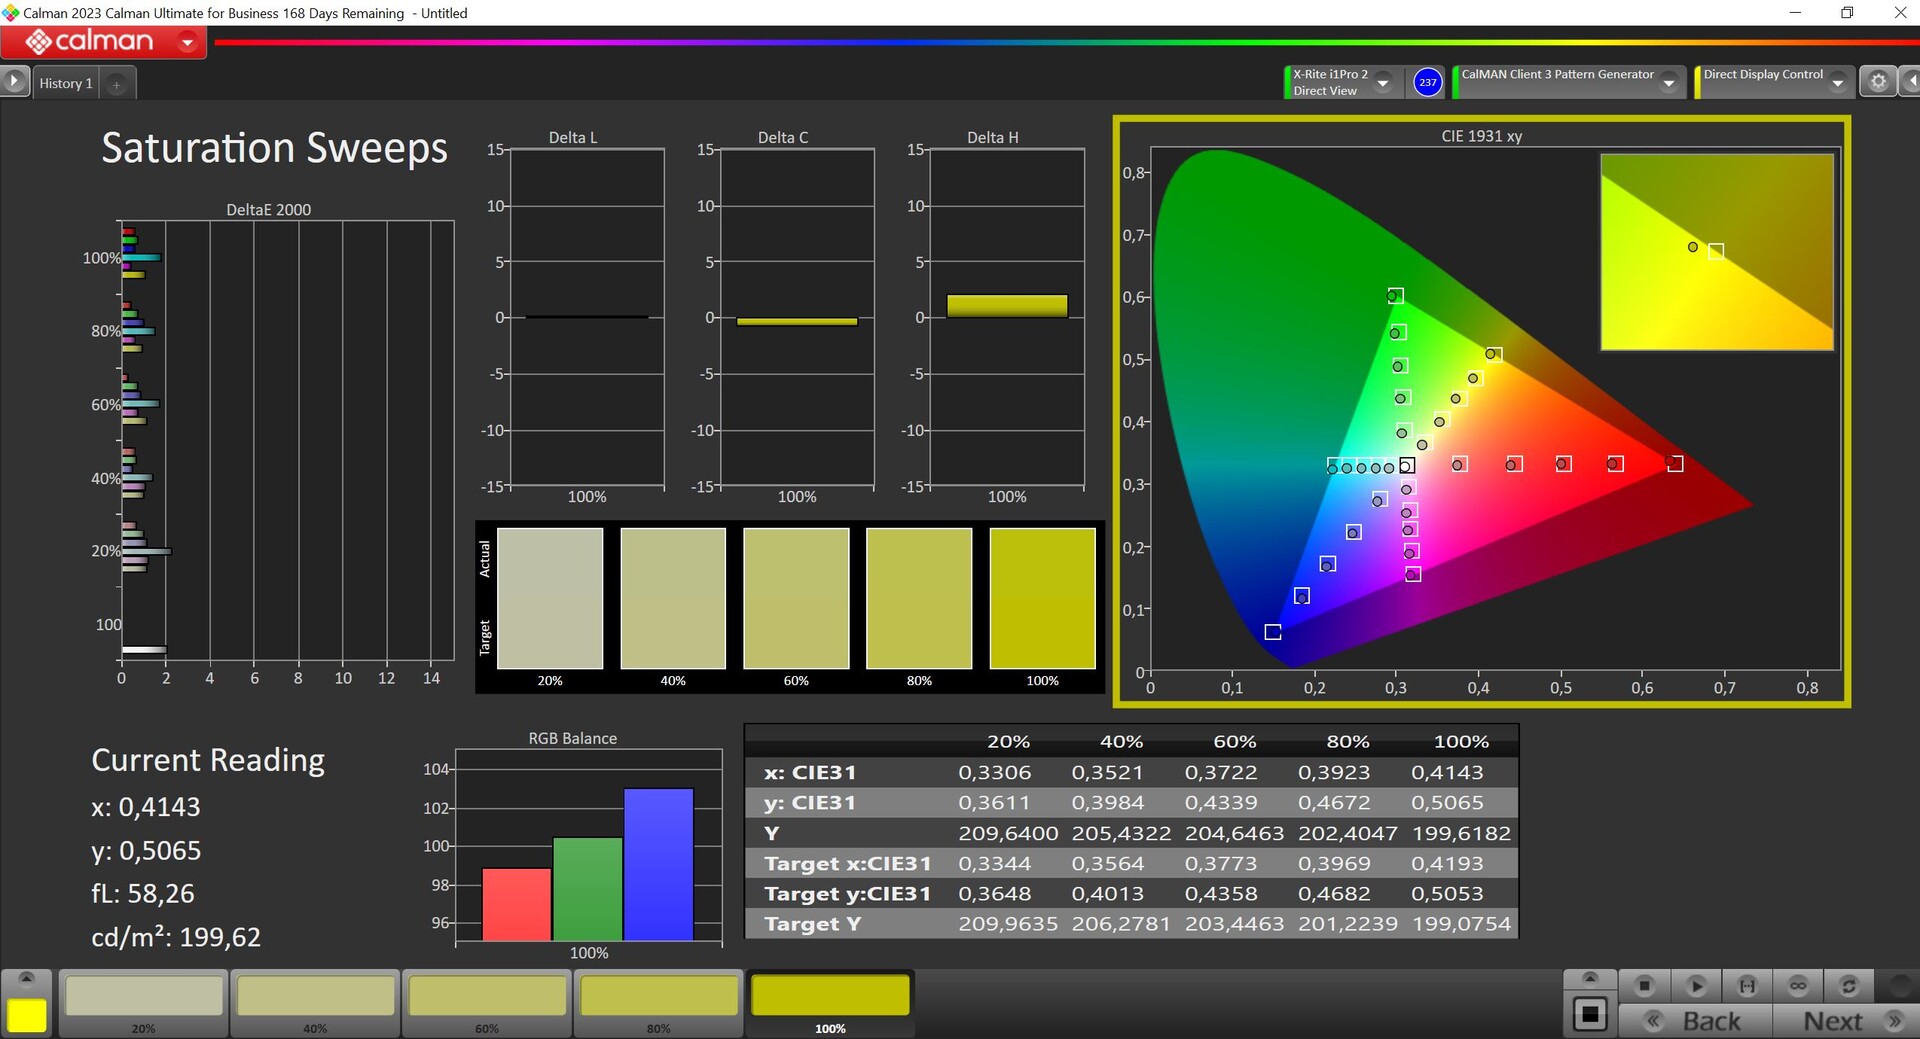
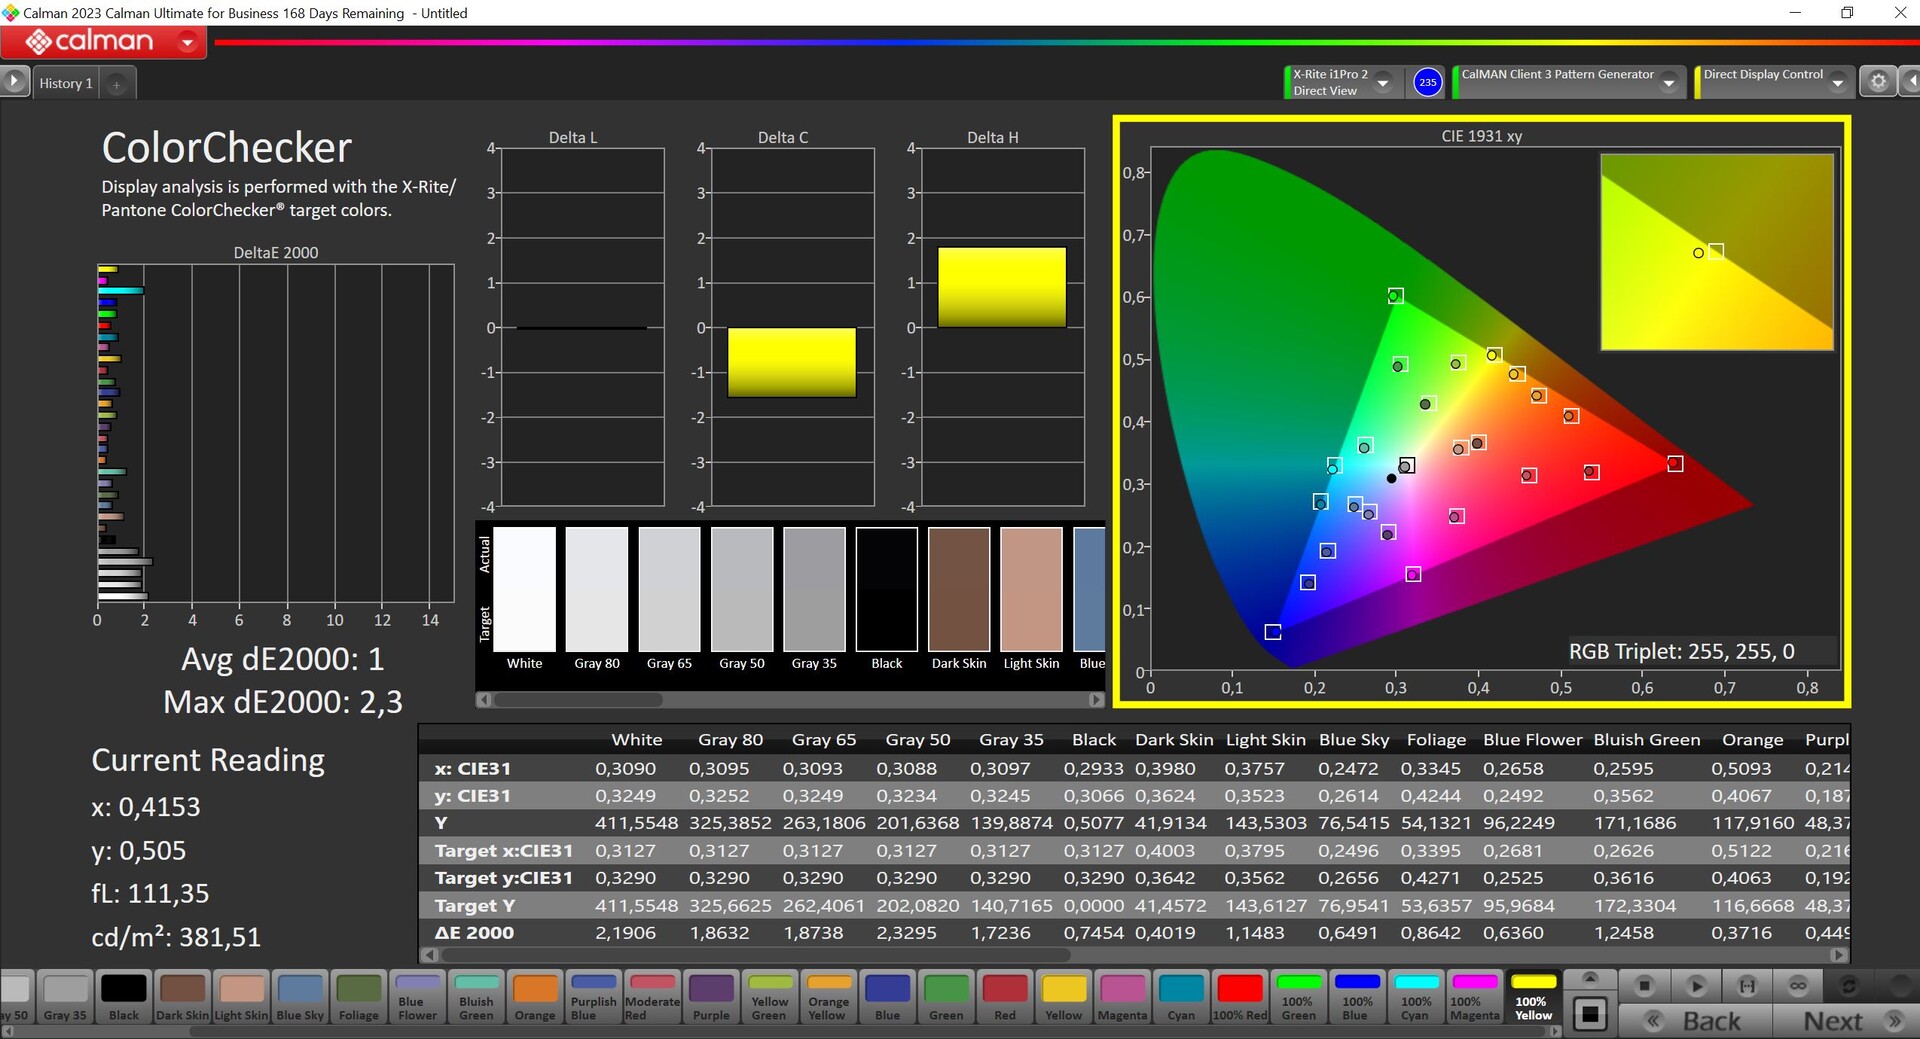
Nous avons analysé le panneau à l'aide du logiciel professionnel CalMAN (X-Rite i1 Pro 2). Lenovo propose différents profils et le profil par défaut offre des images précises. En option, il y a aussi un profil natif avec une luminosité maximale plus élevée (~455 cd/m²) mais aussi une température de couleur qui est beaucoup trop chaude et qui a aussi des écarts de couleur plus élevés. Avec notre calibration, nous avons pu améliorer les images et un téléchargement gratuit du profil correspondant est disponible ci-dessus. De même, Lenovo propose un mode sRGB très précis, ce qui est particulièrement important pour l'édition d'images. L'espace colorimétrique sRGB est entièrement couvert, de P3 à 95 %.
Temps de réponse de l'écran
| ↔ Temps de réponse noir à blanc | ||
|---|---|---|
| 7.2 ms ... hausse ↗ et chute ↘ combinées | ↗ 2.9 ms hausse | 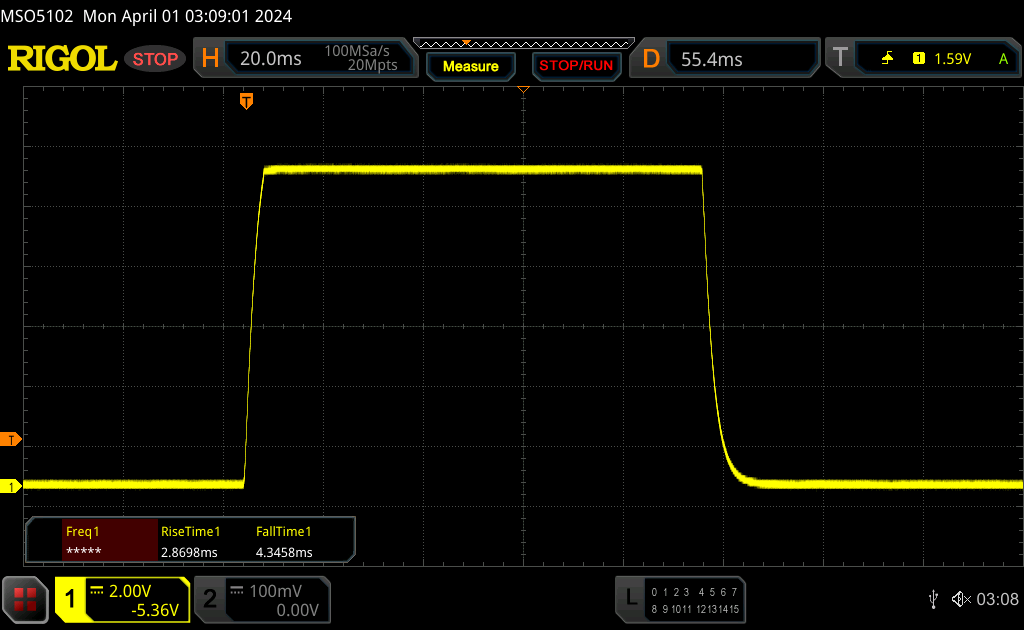 |
| ↘ 4.3 ms chute | ||
| L'écran montre de très faibles temps de réponse, parfait pour le jeu. En comparaison, tous les appareils testés affichent entre 0.1 (minimum) et 240 (maximum) ms. » 16 % des appareils testés affichent de meilleures performances. Cela signifie que les latences relevées sont meilleures que la moyenne (21.5 ms) de tous les appareils testés. | ||
| ↔ Temps de réponse gris 50% à gris 80% | ||
| 14.4 ms ... hausse ↗ et chute ↘ combinées | ↗ 6.9 ms hausse | 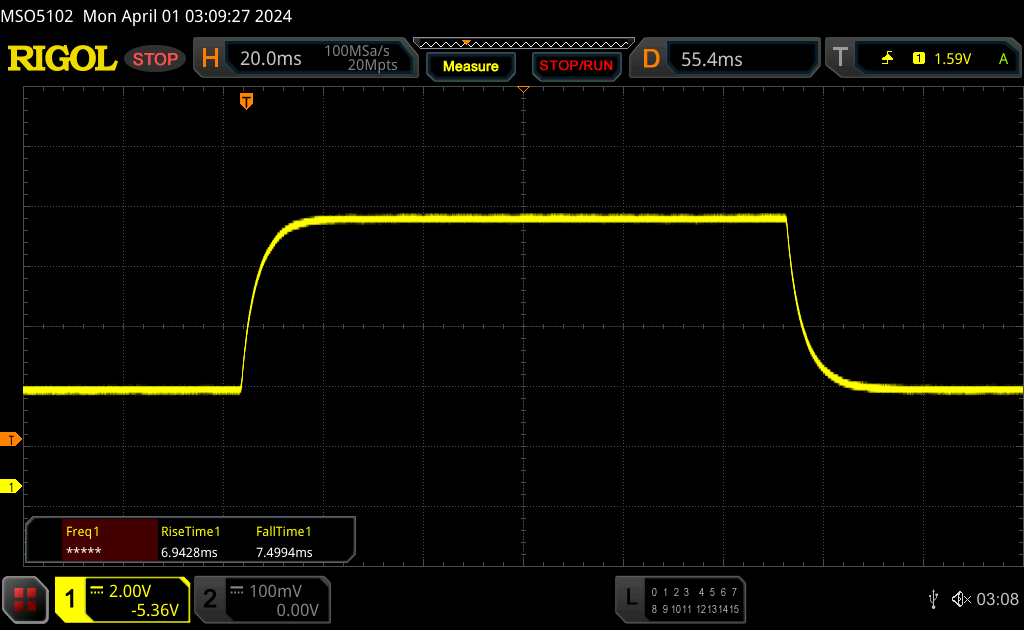 |
| ↘ 7.5 ms chute | ||
| L'écran montre de bons temps de réponse, mais insuffisant pour du jeu compétitif. En comparaison, tous les appareils testés affichent entre 0.2 (minimum) et 636 (maximum) ms. » 23 % des appareils testés affichent de meilleures performances. Cela signifie que les latences relevées sont meilleures que la moyenne (33.7 ms) de tous les appareils testés. | ||
Scintillement / MLI (Modulation de largeur d'impulsion)
| Scintillement / MLI (Modulation de largeur d'impulsion) non décelé | 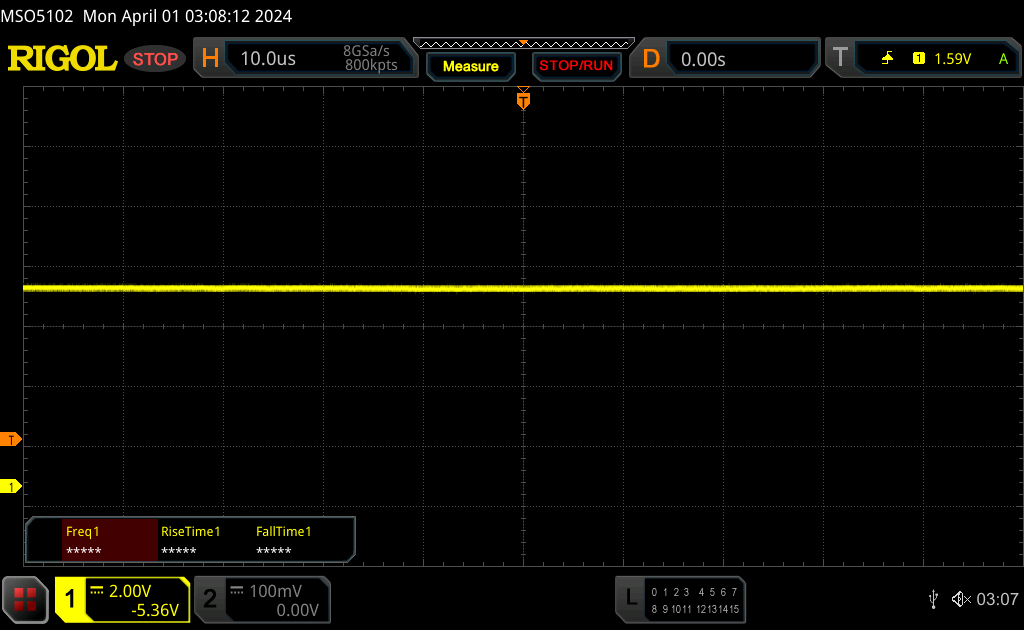 | ||
En comparaison, 53 % des appareils testés n'emploient pas MDI pour assombrir leur écran. Nous avons relevé une moyenne à 17903 (minimum : 5 - maximum : 3846000) Hz dans le cas où une MDI était active. | |||


Grâce à l'écran mat, la dalle peut également être utilisée à l'extérieur mais, par temps clair, la luminosité pourrait être encore plus élevée. La stabilité de l'angle de vision de l'écran IPS est très bonne.

Performance - Raptor Lake HX et un ordinateur portable RTX 4070 overclocké
Conditions d'essai
Comme d'habitude, Lenovo propose différents profils énergétiques et nous avons compilé une liste résumée des données de performance dans le tableau suivant. Le profil actuel est également affiché via la LED du bouton d'alimentation. Nous avons effectué les tests et les mesures en mode performance dans lequel le GPU est automatiquement légèrement overclocké (+100 MHz pour le cœur, +200 MHz pour la VRAM). Le mode performance n'est pas disponible en mode batterie.
| Profil énergétique | Charge CPU | CB R23 Multi | Charge GPU | Time Spy Graphique | Cyberpunk 2077 QHD Ultra |
Volume faan max |
|---|---|---|---|---|---|---|
| Mode silencieux | 65 -> 54 watts | 20 203 points | 65 watts | 8 239 points | 35 FPS | 38,4 dB(A) |
| Mode équilibré | 120 -> 85 watts | 24 142 points | 95 watts | 9 853 points | 41,5 FPS | 50,7 dB(A) |
| Mode performance | 154 -> 90 watts | 31,127 points | 115 watts | 12,174 points | 51.4 FPS | 54.1 dB(A) |
Note : Nous avons essayé, sans succès, de mettre à jour les pilotes Nvidia. Le pilote officiel a mis fin à l'installation en raison d'un problème de compatibilité. Jusqu'à présent, Lenovo n'a mis à disposition que le pilote 537.70 préinstallé et c'est celui que nous avons inévitablement utilisé.
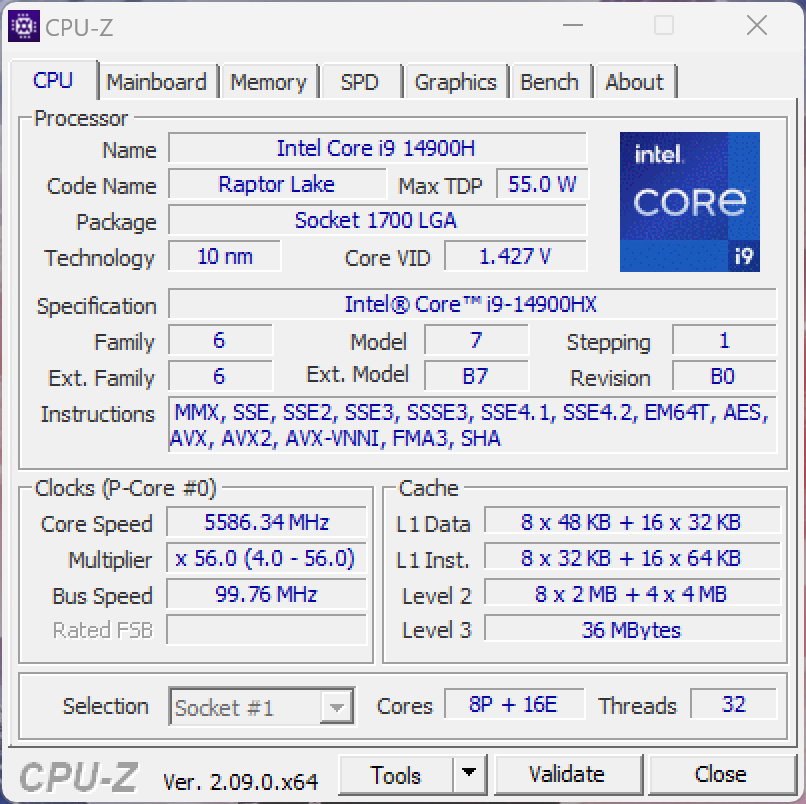
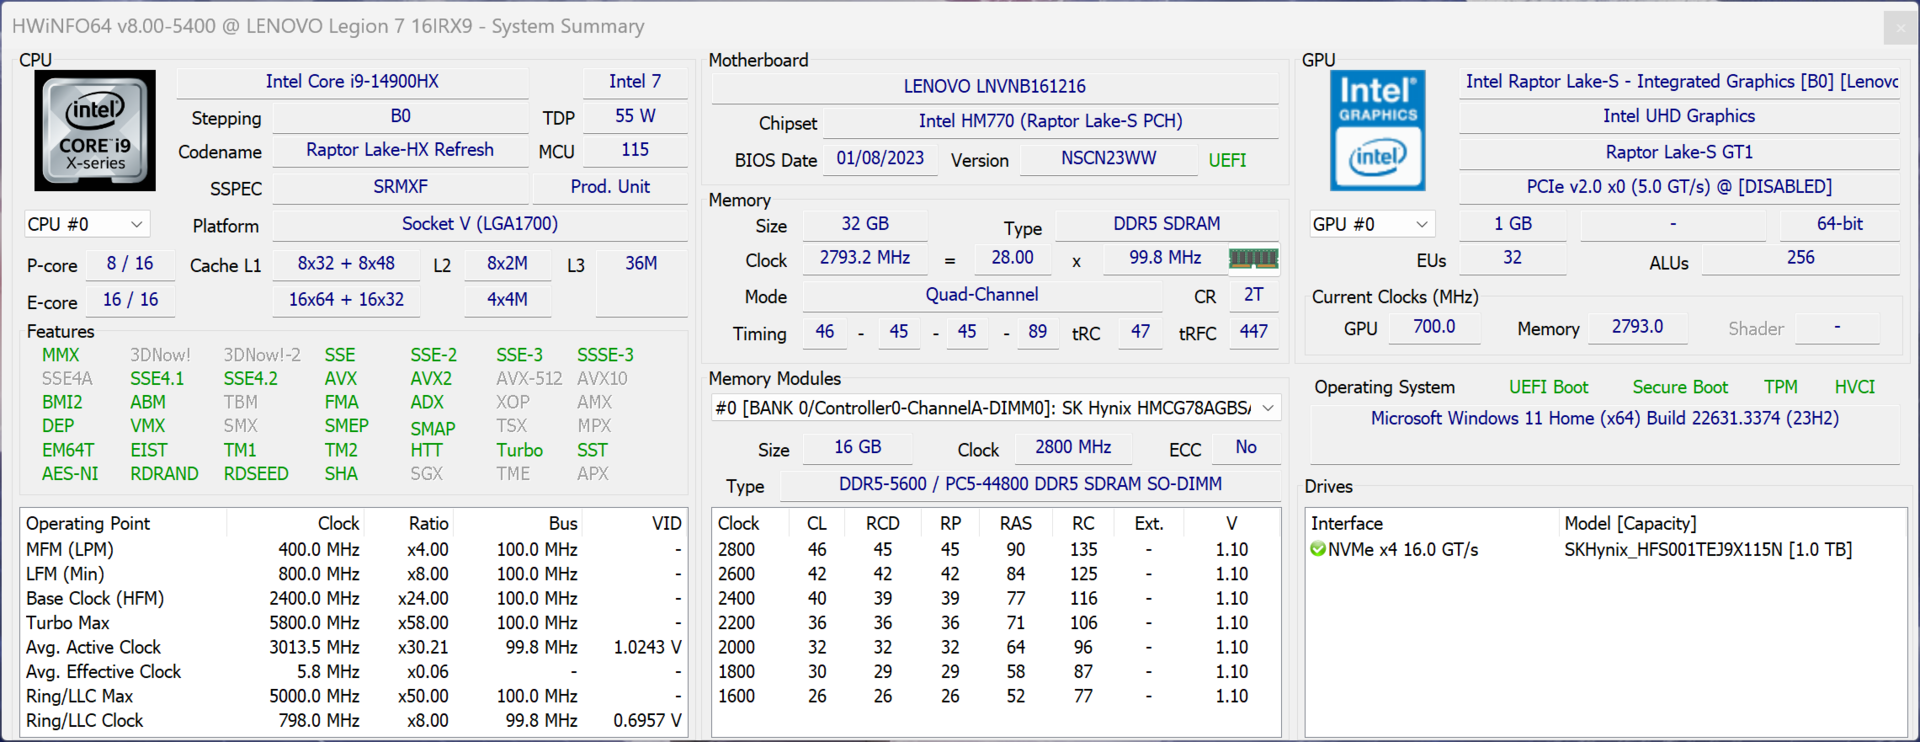
Processeur - Core i9-14900HX
Lenovo a également équipé le modèle normal Legion 7 16 avec le Core i9-14900HXle processeur mobile Raptor Lake le plus rapide, que l'on retrouve également dans le modèle plus cher, le Legion Pro 7. Par rapport aux deux modèles plus épais Legion Pro 7/5 16, le boîtier plus fin a un impact sur les limites de puissance, tombant à 90 watts après avoir brièvement atteint 154 watts. Dans l'ensemble, les performances ont été excellentes, tant dans les tests multicœurs que dans les tests monocœurs. En mode batterie, le processeur est autorisé à consommer un maximum de 60 watts, ce qui explique que les performances multicœurs soient inférieures d'environ 40 %. Vous trouverez d'autres tests de performance du processeur dans notre section technologie.
Cinebench R15 Multi Continuous Test
Cinebench R23: Multi Core | Single Core
Cinebench R20: CPU (Multi Core) | CPU (Single Core)
Cinebench R15: CPU Multi 64Bit | CPU Single 64Bit
Blender: v2.79 BMW27 CPU
7-Zip 18.03: 7z b 4 | 7z b 4 -mmt1
Geekbench 6.2: Multi-Core | Single-Core
Geekbench 5.5: Multi-Core | Single-Core
HWBOT x265 Benchmark v2.2: 4k Preset
LibreOffice : 20 Documents To PDF
R Benchmark 2.5: Overall mean
| CPU Performance Rating | |
| Lenovo Legion Pro 7 16IRX9H | |
| Lenovo Legion 7 16 IRX G9 | |
| Lenovo Legion Pro 5 16IRX9 | |
| Moyenne Intel Core i9-14900HX | |
| Aorus 16X 2024 | |
| HP Omen Transcend 16-u1095ng | |
| Moyenne de la classe Gaming | |
| Alienware m16 R2 -1! | |
| SCHENKER XMG CORE 16 (L23) | |
| Cinebench R23 / Multi Core | |
| Lenovo Legion Pro 7 16IRX9H | |
| Lenovo Legion 7 16 IRX G9 | |
| Lenovo Legion Pro 5 16IRX9 | |
| Moyenne Intel Core i9-14900HX (20702 - 32996, n=23) | |
| Aorus 16X 2024 | |
| HP Omen Transcend 16-u1095ng | |
| Moyenne de la classe Gaming (2435 - 34613, n=234, 2 dernières années) | |
| Alienware m16 R2 | |
| SCHENKER XMG CORE 16 (L23) | |
| Cinebench R23 / Single Core | |
| Lenovo Legion Pro 7 16IRX9H | |
| Lenovo Legion 7 16 IRX G9 | |
| Aorus 16X 2024 | |
| HP Omen Transcend 16-u1095ng | |
| Moyenne Intel Core i9-14900HX (2043 - 2235, n=23) | |
| Lenovo Legion Pro 5 16IRX9 | |
| Moyenne de la classe Gaming (527 - 2235, n=232, 2 dernières années) | |
| SCHENKER XMG CORE 16 (L23) | |
| Alienware m16 R2 | |
| Cinebench R20 / CPU (Multi Core) | |
| Lenovo Legion Pro 7 16IRX9H | |
| Lenovo Legion 7 16 IRX G9 | |
| Lenovo Legion Pro 5 16IRX9 | |
| Moyenne Intel Core i9-14900HX (8427 - 12419, n=23) | |
| Aorus 16X 2024 | |
| HP Omen Transcend 16-u1095ng | |
| Moyenne de la classe Gaming (930 - 13769, n=232, 2 dernières années) | |
| Alienware m16 R2 | |
| SCHENKER XMG CORE 16 (L23) | |
| Cinebench R20 / CPU (Single Core) | |
| Lenovo Legion 7 16 IRX G9 | |
| Aorus 16X 2024 | |
| HP Omen Transcend 16-u1095ng | |
| Moyenne Intel Core i9-14900HX (779 - 859, n=23) | |
| Lenovo Legion Pro 7 16IRX9H | |
| Lenovo Legion Pro 5 16IRX9 | |
| Moyenne de la classe Gaming (169 - 855, n=232, 2 dernières années) | |
| SCHENKER XMG CORE 16 (L23) | |
| Alienware m16 R2 | |
| Cinebench R15 / CPU Multi 64Bit | |
| Lenovo Legion Pro 7 16IRX9H | |
| Lenovo Legion 7 16 IRX G9 | |
| Lenovo Legion Pro 5 16IRX9 | |
| Moyenne Intel Core i9-14900HX (3263 - 4875, n=24) | |
| Aorus 16X 2024 | |
| HP Omen Transcend 16-u1095ng | |
| Moyenne de la classe Gaming (400 - 5663, n=237, 2 dernières années) | |
| Alienware m16 R2 | |
| SCHENKER XMG CORE 16 (L23) | |
| Cinebench R15 / CPU Single 64Bit | |
| Lenovo Legion Pro 7 16IRX9H | |
| Aorus 16X 2024 | |
| Lenovo Legion 7 16 IRX G9 | |
| Moyenne Intel Core i9-14900HX (287 - 320, n=24) | |
| Lenovo Legion Pro 5 16IRX9 | |
| HP Omen Transcend 16-u1095ng | |
| SCHENKER XMG CORE 16 (L23) | |
| Moyenne de la classe Gaming (79.2 - 318, n=236, 2 dernières années) | |
| Alienware m16 R2 | |
| Blender / v2.79 BMW27 CPU | |
| Moyenne de la classe Gaming (87 - 1259, n=230, 2 dernières années) | |
| SCHENKER XMG CORE 16 (L23) | |
| HP Omen Transcend 16-u1095ng | |
| Aorus 16X 2024 | |
| Lenovo Legion 7 16 IRX G9 | |
| Moyenne Intel Core i9-14900HX (102 - 164, n=23) | |
| Lenovo Legion Pro 5 16IRX9 | |
| Lenovo Legion Pro 7 16IRX9H | |
| 7-Zip 18.03 / 7z b 4 | |
| Lenovo Legion Pro 7 16IRX9H | |
| Lenovo Legion Pro 5 16IRX9 | |
| Moyenne Intel Core i9-14900HX (87555 - 127108, n=23) | |
| Lenovo Legion 7 16 IRX G9 | |
| Aorus 16X 2024 | |
| HP Omen Transcend 16-u1095ng | |
| Moyenne de la classe Gaming (11386 - 140932, n=231, 2 dernières années) | |
| SCHENKER XMG CORE 16 (L23) | |
| Alienware m16 R2 | |
| 7-Zip 18.03 / 7z b 4 -mmt1 | |
| Lenovo Legion Pro 7 16IRX9H | |
| Aorus 16X 2024 | |
| Lenovo Legion 7 16 IRX G9 | |
| HP Omen Transcend 16-u1095ng | |
| Moyenne Intel Core i9-14900HX (6206 - 7508, n=23) | |
| Lenovo Legion Pro 5 16IRX9 | |
| SCHENKER XMG CORE 16 (L23) | |
| Moyenne de la classe Gaming (2685 - 7581, n=231, 2 dernières années) | |
| Alienware m16 R2 | |
| Geekbench 6.2 / Multi-Core | |
| Lenovo Legion Pro 7 16IRX9H | |
| Lenovo Legion Pro 5 16IRX9 | |
| Lenovo Legion 7 16 IRX G9 | |
| Moyenne Intel Core i9-14900HX (15849 - 18643, n=23) | |
| Aorus 16X 2024 | |
| HP Omen Transcend 16-u1095ng | |
| Moyenne de la classe Gaming (5340 - 18590, n=76, 2 dernières années) | |
| SCHENKER XMG CORE 16 (L23) | |
| Alienware m16 R2 | |
| Geekbench 6.2 / Single-Core | |
| Aorus 16X 2024 | |
| Lenovo Legion Pro 7 16IRX9H | |
| Moyenne Intel Core i9-14900HX (2800 - 3095, n=23) | |
| Lenovo Legion 7 16 IRX G9 | |
| Lenovo Legion Pro 5 16IRX9 | |
| HP Omen Transcend 16-u1095ng | |
| SCHENKER XMG CORE 16 (L23) | |
| Moyenne de la classe Gaming (1599 - 3095, n=76, 2 dernières années) | |
| Alienware m16 R2 | |
| Geekbench 5.5 / Multi-Core | |
| Lenovo Legion Pro 5 16IRX9 | |
| Lenovo Legion Pro 7 16IRX9H | |
| Lenovo Legion 7 16 IRX G9 | |
| Aorus 16X 2024 | |
| Moyenne Intel Core i9-14900HX (8618 - 21606, n=23) | |
| HP Omen Transcend 16-u1095ng | |
| Moyenne de la classe Gaming (1946 - 22200, n=236, 2 dernières années) | |
| Alienware m16 R2 | |
| SCHENKER XMG CORE 16 (L23) | |
| Geekbench 5.5 / Single-Core | |
| Aorus 16X 2024 | |
| Lenovo Legion Pro 7 16IRX9H | |
| Moyenne Intel Core i9-14900HX (1669 - 2210, n=23) | |
| Lenovo Legion 7 16 IRX G9 | |
| HP Omen Transcend 16-u1095ng | |
| Lenovo Legion Pro 5 16IRX9 | |
| SCHENKER XMG CORE 16 (L23) | |
| Moyenne de la classe Gaming (158 - 2210, n=236, 2 dernières années) | |
| Alienware m16 R2 | |
| HWBOT x265 Benchmark v2.2 / 4k Preset | |
| Lenovo Legion Pro 7 16IRX9H | |
| Lenovo Legion Pro 5 16IRX9 | |
| Moyenne Intel Core i9-14900HX (22.7 - 34.4, n=23) | |
| Lenovo Legion 7 16 IRX G9 | |
| Aorus 16X 2024 | |
| HP Omen Transcend 16-u1095ng | |
| SCHENKER XMG CORE 16 (L23) | |
| Moyenne de la classe Gaming (3 - 37.6, n=234, 2 dernières années) | |
| Alienware m16 R2 | |
| LibreOffice / 20 Documents To PDF | |
| SCHENKER XMG CORE 16 (L23) | |
| HP Omen Transcend 16-u1095ng | |
| Alienware m16 R2 | |
| Moyenne de la classe Gaming (32.8 - 332, n=228, 2 dernières années) | |
| Lenovo Legion 7 16 IRX G9 | |
| Moyenne Intel Core i9-14900HX (33.9 - 85.1, n=23) | |
| Lenovo Legion Pro 5 16IRX9 | |
| Aorus 16X 2024 | |
| Lenovo Legion Pro 7 16IRX9H | |
| R Benchmark 2.5 / Overall mean | |
| Alienware m16 R2 | |
| Moyenne de la classe Gaming (0.3609 - 4.47, n=231, 2 dernières années) | |
| SCHENKER XMG CORE 16 (L23) | |
| HP Omen Transcend 16-u1095ng | |
| Lenovo Legion 7 16 IRX G9 | |
| Lenovo Legion Pro 5 16IRX9 | |
| Lenovo Legion Pro 7 16IRX9H | |
| Moyenne Intel Core i9-14900HX (0.3609 - 0.4225, n=23) | |
| Aorus 16X 2024 | |
* ... Moindre est la valeur, meilleures sont les performances
AIDA64: FP32 Ray-Trace | FPU Julia | CPU SHA3 | CPU Queen | FPU SinJulia | FPU Mandel | CPU AES | CPU ZLib | FP64 Ray-Trace | CPU PhotoWorxx
| Performance Rating | |
| Lenovo Legion Pro 7 16IRX9H | |
| Lenovo Legion Pro 5 16IRX9 | |
| Moyenne Intel Core i9-14900HX | |
| Aorus 16X 2024 | |
| Lenovo Legion 7 16 IRX G9 | |
| SCHENKER XMG CORE 16 (L23) | |
| Moyenne de la classe Gaming | |
| HP Omen Transcend 16-u1095ng | |
| Alienware m16 R2 | |
| AIDA64 / FP32 Ray-Trace | |
| Lenovo Legion Pro 7 16IRX9H | |
| SCHENKER XMG CORE 16 (L23) | |
| Lenovo Legion 7 16 IRX G9 | |
| Moyenne Intel Core i9-14900HX (17244 - 29351, n=22) | |
| Lenovo Legion Pro 5 16IRX9 | |
| Aorus 16X 2024 | |
| Moyenne de la classe Gaming (3069 - 60169, n=227, 2 dernières années) | |
| Alienware m16 R2 | |
| HP Omen Transcend 16-u1095ng | |
| AIDA64 / FPU Julia | |
| Lenovo Legion Pro 7 16IRX9H | |
| Lenovo Legion Pro 5 16IRX9 | |
| Moyenne Intel Core i9-14900HX (88537 - 148888, n=22) | |
| SCHENKER XMG CORE 16 (L23) | |
| Lenovo Legion 7 16 IRX G9 | |
| Aorus 16X 2024 | |
| Moyenne de la classe Gaming (18567 - 252486, n=227, 2 dernières années) | |
| Alienware m16 R2 | |
| HP Omen Transcend 16-u1095ng | |
| AIDA64 / CPU SHA3 | |
| Lenovo Legion Pro 7 16IRX9H | |
| Lenovo Legion Pro 5 16IRX9 | |
| Moyenne Intel Core i9-14900HX (4267 - 7229, n=22) | |
| Aorus 16X 2024 | |
| Lenovo Legion 7 16 IRX G9 | |
| SCHENKER XMG CORE 16 (L23) | |
| Moyenne de la classe Gaming (629 - 10389, n=227, 2 dernières années) | |
| HP Omen Transcend 16-u1095ng | |
| Alienware m16 R2 | |
| AIDA64 / CPU Queen | |
| Lenovo Legion Pro 7 16IRX9H | |
| Lenovo Legion Pro 5 16IRX9 | |
| Lenovo Legion 7 16 IRX G9 | |
| Aorus 16X 2024 | |
| Moyenne Intel Core i9-14900HX (118405 - 148773, n=22) | |
| HP Omen Transcend 16-u1095ng | |
| Moyenne de la classe Gaming (15371 - 200651, n=227, 2 dernières années) | |
| SCHENKER XMG CORE 16 (L23) | |
| Alienware m16 R2 | |
| AIDA64 / FPU SinJulia | |
| Lenovo Legion Pro 7 16IRX9H | |
| Lenovo Legion Pro 5 16IRX9 | |
| Moyenne Intel Core i9-14900HX (12217 - 18256, n=22) | |
| SCHENKER XMG CORE 16 (L23) | |
| Aorus 16X 2024 | |
| Lenovo Legion 7 16 IRX G9 | |
| Moyenne de la classe Gaming (2137 - 32988, n=227, 2 dernières années) | |
| HP Omen Transcend 16-u1095ng | |
| Alienware m16 R2 | |
| AIDA64 / FPU Mandel | |
| Lenovo Legion Pro 7 16IRX9H | |
| SCHENKER XMG CORE 16 (L23) | |
| Lenovo Legion Pro 5 16IRX9 | |
| Moyenne Intel Core i9-14900HX (43302 - 72594, n=22) | |
| Aorus 16X 2024 | |
| Moyenne de la classe Gaming (10291 - 134044, n=227, 2 dernières années) | |
| Alienware m16 R2 | |
| Lenovo Legion 7 16 IRX G9 | |
| HP Omen Transcend 16-u1095ng | |
| AIDA64 / CPU AES | |
| Moyenne Intel Core i9-14900HX (86964 - 241777, n=22) | |
| Lenovo Legion Pro 7 16IRX9H | |
| Lenovo Legion Pro 5 16IRX9 | |
| Aorus 16X 2024 | |
| Lenovo Legion 7 16 IRX G9 | |
| Moyenne de la classe Gaming (19065 - 328679, n=227, 2 dernières années) | |
| SCHENKER XMG CORE 16 (L23) | |
| HP Omen Transcend 16-u1095ng | |
| Alienware m16 R2 | |
| AIDA64 / CPU ZLib | |
| Lenovo Legion Pro 7 16IRX9H | |
| Lenovo Legion Pro 5 16IRX9 | |
| Moyenne Intel Core i9-14900HX (1265 - 2149, n=22) | |
| Aorus 16X 2024 | |
| Lenovo Legion 7 16 IRX G9 | |
| HP Omen Transcend 16-u1095ng | |
| Alienware m16 R2 | |
| Moyenne de la classe Gaming (150.9 - 2409, n=227, 2 dernières années) | |
| SCHENKER XMG CORE 16 (L23) | |
| AIDA64 / FP64 Ray-Trace | |
| Lenovo Legion Pro 7 16IRX9H | |
| SCHENKER XMG CORE 16 (L23) | |
| Lenovo Legion Pro 5 16IRX9 | |
| Moyenne Intel Core i9-14900HX (9170 - 16128, n=22) | |
| Lenovo Legion 7 16 IRX G9 | |
| Aorus 16X 2024 | |
| Moyenne de la classe Gaming (1518 - 31796, n=227, 2 dernières années) | |
| Alienware m16 R2 | |
| HP Omen Transcend 16-u1095ng | |
| AIDA64 / CPU PhotoWorxx | |
| Lenovo Legion Pro 5 16IRX9 | |
| HP Omen Transcend 16-u1095ng | |
| Aorus 16X 2024 | |
| Lenovo Legion 7 16 IRX G9 | |
| Moyenne Intel Core i9-14900HX (33960 - 51118, n=22) | |
| Lenovo Legion Pro 7 16IRX9H | |
| SCHENKER XMG CORE 16 (L23) | |
| Alienware m16 R2 | |
| Moyenne de la classe Gaming (10805 - 60161, n=228, 2 dernières années) | |
Performance du système
L'impression subjective de performance est excellente et les benchmarks n'ont pas non plus mis en évidence de problèmes. Il n'y a eu que quelques bégaiements occasionnels lors du passage d'un mode graphique à l'autre, par exemple au démarrage d'un jeu. C'est la norme pour les ordinateurs portables utilisant Advanced Optimus.
CrossMark: Overall | Productivity | Creativity | Responsiveness
WebXPRT 3: Overall
WebXPRT 4: Overall
Mozilla Kraken 1.1: Total
| PCMark 10 / Score | |
| Lenovo Legion Pro 7 16IRX9H | |
| Lenovo Legion Pro 5 16IRX9 | |
| Aorus 16X 2024 | |
| Moyenne Intel Core i9-14900HX, NVIDIA GeForce RTX 4070 Laptop GPU (7866 - 8550, n=5) | |
| SCHENKER XMG CORE 16 (L23) | |
| Lenovo Legion 7 16 IRX G9 | |
| HP Omen Transcend 16-u1095ng | |
| Alienware m16 R2 | |
| Moyenne de la classe Gaming (5235 - 9852, n=200, 2 dernières années) | |
| PCMark 10 / Essentials | |
| Lenovo Legion Pro 7 16IRX9H | |
| Lenovo Legion Pro 5 16IRX9 | |
| Moyenne Intel Core i9-14900HX, NVIDIA GeForce RTX 4070 Laptop GPU (10621 - 11815, n=5) | |
| Aorus 16X 2024 | |
| Lenovo Legion 7 16 IRX G9 | |
| SCHENKER XMG CORE 16 (L23) | |
| Moyenne de la classe Gaming (8300 - 12334, n=199, 2 dernières années) | |
| HP Omen Transcend 16-u1095ng | |
| Alienware m16 R2 | |
| PCMark 10 / Productivity | |
| Lenovo Legion Pro 7 16IRX9H | |
| Aorus 16X 2024 | |
| SCHENKER XMG CORE 16 (L23) | |
| Moyenne Intel Core i9-14900HX, NVIDIA GeForce RTX 4070 Laptop GPU (9701 - 11103, n=5) | |
| HP Omen Transcend 16-u1095ng | |
| Lenovo Legion Pro 5 16IRX9 | |
| Moyenne de la classe Gaming (6662 - 11833, n=199, 2 dernières années) | |
| Lenovo Legion 7 16 IRX G9 | |
| Alienware m16 R2 | |
| PCMark 10 / Digital Content Creation | |
| Lenovo Legion Pro 5 16IRX9 | |
| Lenovo Legion Pro 7 16IRX9H | |
| Moyenne Intel Core i9-14900HX, NVIDIA GeForce RTX 4070 Laptop GPU (12114 - 14827, n=5) | |
| Lenovo Legion 7 16 IRX G9 | |
| Aorus 16X 2024 | |
| Alienware m16 R2 | |
| SCHENKER XMG CORE 16 (L23) | |
| HP Omen Transcend 16-u1095ng | |
| Moyenne de la classe Gaming (6462 - 18475, n=199, 2 dernières années) | |
| CrossMark / Overall | |
| Lenovo Legion Pro 7 16IRX9H | |
| Aorus 16X 2024 | |
| Lenovo Legion 7 16 IRX G9 | |
| Moyenne Intel Core i9-14900HX, NVIDIA GeForce RTX 4070 Laptop GPU (2002 - 2312, n=4) | |
| Lenovo Legion Pro 5 16IRX9 | |
| Moyenne de la classe Gaming (1247 - 2334, n=170, 2 dernières années) | |
| Alienware m16 R2 | |
| SCHENKER XMG CORE 16 (L23) | |
| CrossMark / Productivity | |
| Lenovo Legion Pro 7 16IRX9H | |
| Aorus 16X 2024 | |
| Lenovo Legion 7 16 IRX G9 | |
| Moyenne Intel Core i9-14900HX, NVIDIA GeForce RTX 4070 Laptop GPU (1827 - 2191, n=4) | |
| Lenovo Legion Pro 5 16IRX9 | |
| Moyenne de la classe Gaming (1299 - 2204, n=170, 2 dernières années) | |
| Alienware m16 R2 | |
| SCHENKER XMG CORE 16 (L23) | |
| CrossMark / Creativity | |
| Lenovo Legion Pro 7 16IRX9H | |
| Aorus 16X 2024 | |
| Lenovo Legion 7 16 IRX G9 | |
| Moyenne Intel Core i9-14900HX, NVIDIA GeForce RTX 4070 Laptop GPU (2287 - 2458, n=4) | |
| Lenovo Legion Pro 5 16IRX9 | |
| Moyenne de la classe Gaming (1275 - 2514, n=170, 2 dernières années) | |
| Alienware m16 R2 | |
| SCHENKER XMG CORE 16 (L23) | |
| CrossMark / Responsiveness | |
| Lenovo Legion 7 16 IRX G9 | |
| Aorus 16X 2024 | |
| Lenovo Legion Pro 7 16IRX9H | |
| Moyenne Intel Core i9-14900HX, NVIDIA GeForce RTX 4070 Laptop GPU (1769 - 2330, n=4) | |
| Lenovo Legion Pro 5 16IRX9 | |
| Moyenne de la classe Gaming (1030 - 2330, n=170, 2 dernières années) | |
| Alienware m16 R2 | |
| SCHENKER XMG CORE 16 (L23) | |
| WebXPRT 3 / Overall | |
| Lenovo Legion Pro 7 16IRX9H | |
| HP Omen Transcend 16-u1095ng | |
| Lenovo Legion 7 16 IRX G9 | |
| Moyenne Intel Core i9-14900HX, NVIDIA GeForce RTX 4070 Laptop GPU (322 - 342, n=5) | |
| Aorus 16X 2024 | |
| Lenovo Legion Pro 5 16IRX9 | |
| Moyenne de la classe Gaming (215 - 480, n=196, 2 dernières années) | |
| Alienware m16 R2 | |
| SCHENKER XMG CORE 16 (L23) | |
| WebXPRT 4 / Overall | |
| Lenovo Legion Pro 7 16IRX9H | |
| Lenovo Legion 7 16 IRX G9 | |
| Moyenne Intel Core i9-14900HX, NVIDIA GeForce RTX 4070 Laptop GPU (291 - 301, n=3) | |
| Lenovo Legion Pro 5 16IRX9 | |
| Moyenne de la classe Gaming (157.9 - 328, n=163, 2 dernières années) | |
| Alienware m16 R2 | |
| Mozilla Kraken 1.1 / Total | |
| Alienware m16 R2 | |
| SCHENKER XMG CORE 16 (L23) | |
| Moyenne de la classe Gaming (421 - 824, n=211, 2 dernières années) | |
| Lenovo Legion Pro 5 16IRX9 | |
| Lenovo Legion 7 16 IRX G9 | |
| Lenovo Legion Pro 7 16IRX9H | |
| Moyenne Intel Core i9-14900HX, NVIDIA GeForce RTX 4070 Laptop GPU (431 - 449, n=5) | |
| HP Omen Transcend 16-u1095ng | |
| Aorus 16X 2024 | |
* ... Moindre est la valeur, meilleures sont les performances
| PCMark 10 Score | 8023 points | |
Aide | ||
| AIDA64 / Memory Copy | |
| Lenovo Legion Pro 5 16IRX9 | |
| Lenovo Legion 7 16 IRX G9 | |
| Aorus 16X 2024 | |
| Lenovo Legion Pro 7 16IRX9H | |
| HP Omen Transcend 16-u1095ng | |
| Moyenne Intel Core i9-14900HX (56992 - 83392, n=22) | |
| SCHENKER XMG CORE 16 (L23) | |
| Alienware m16 R2 | |
| Moyenne de la classe Gaming (21842 - 92565, n=227, 2 dernières années) | |
| AIDA64 / Memory Read | |
| Aorus 16X 2024 | |
| Lenovo Legion Pro 5 16IRX9 | |
| Lenovo Legion Pro 7 16IRX9H | |
| Lenovo Legion 7 16 IRX G9 | |
| HP Omen Transcend 16-u1095ng | |
| Moyenne Intel Core i9-14900HX (54443 - 87507, n=22) | |
| Alienware m16 R2 | |
| Moyenne de la classe Gaming (24879 - 90647, n=227, 2 dernières années) | |
| SCHENKER XMG CORE 16 (L23) | |
| AIDA64 / Memory Write | |
| SCHENKER XMG CORE 16 (L23) | |
| HP Omen Transcend 16-u1095ng | |
| Aorus 16X 2024 | |
| Lenovo Legion Pro 5 16IRX9 | |
| Moyenne Intel Core i9-14900HX (51387 - 78199, n=22) | |
| Lenovo Legion 7 16 IRX G9 | |
| Lenovo Legion Pro 7 16IRX9H | |
| Alienware m16 R2 | |
| Moyenne de la classe Gaming (21619 - 103259, n=227, 2 dernières années) | |
| AIDA64 / Memory Latency | |
| Alienware m16 R2 | |
| SCHENKER XMG CORE 16 (L23) | |
| Moyenne de la classe Gaming (59.5 - 152.5, n=224, 2 dernières années) | |
| HP Omen Transcend 16-u1095ng | |
| Moyenne Intel Core i9-14900HX (79.7 - 105, n=22) | |
| Lenovo Legion 7 16 IRX G9 | |
| Lenovo Legion Pro 5 16IRX9 | |
| Aorus 16X 2024 | |
| Lenovo Legion Pro 7 16IRX9H | |
* ... Moindre est la valeur, meilleures sont les performances
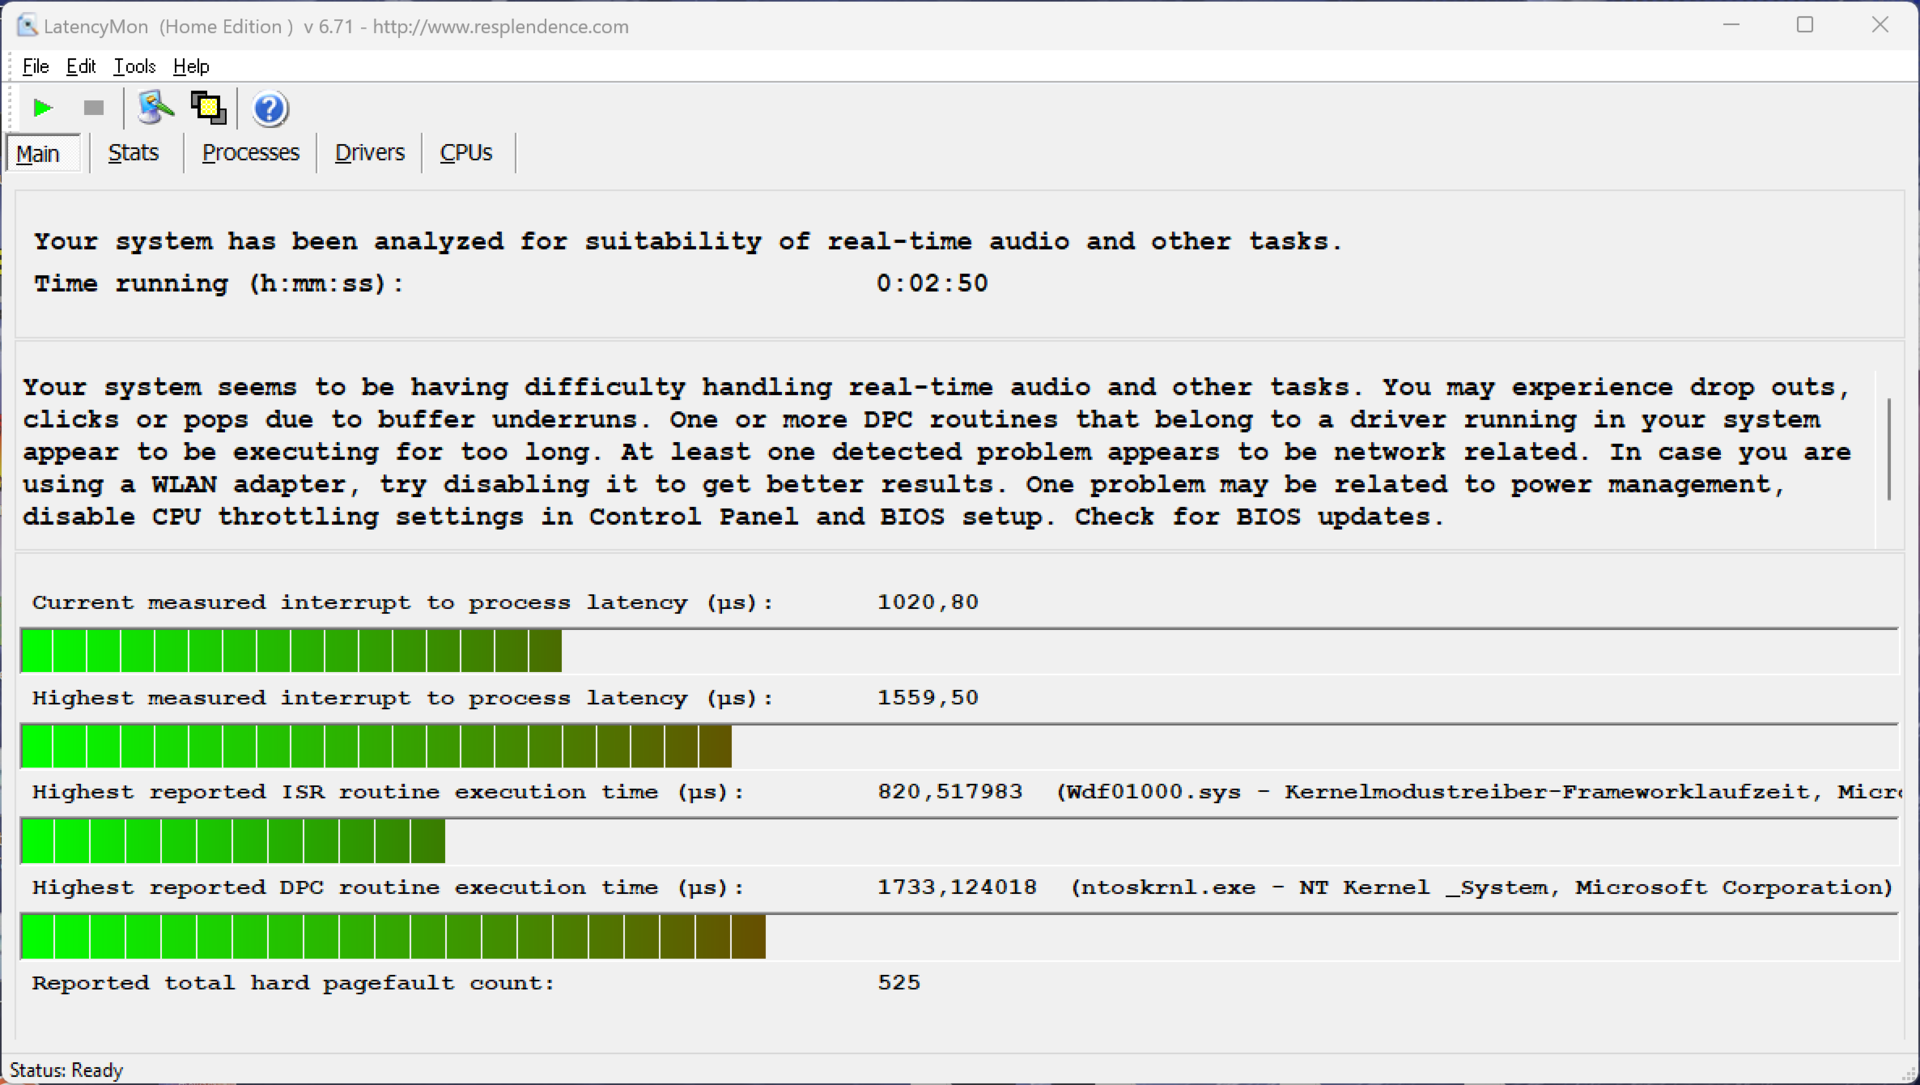
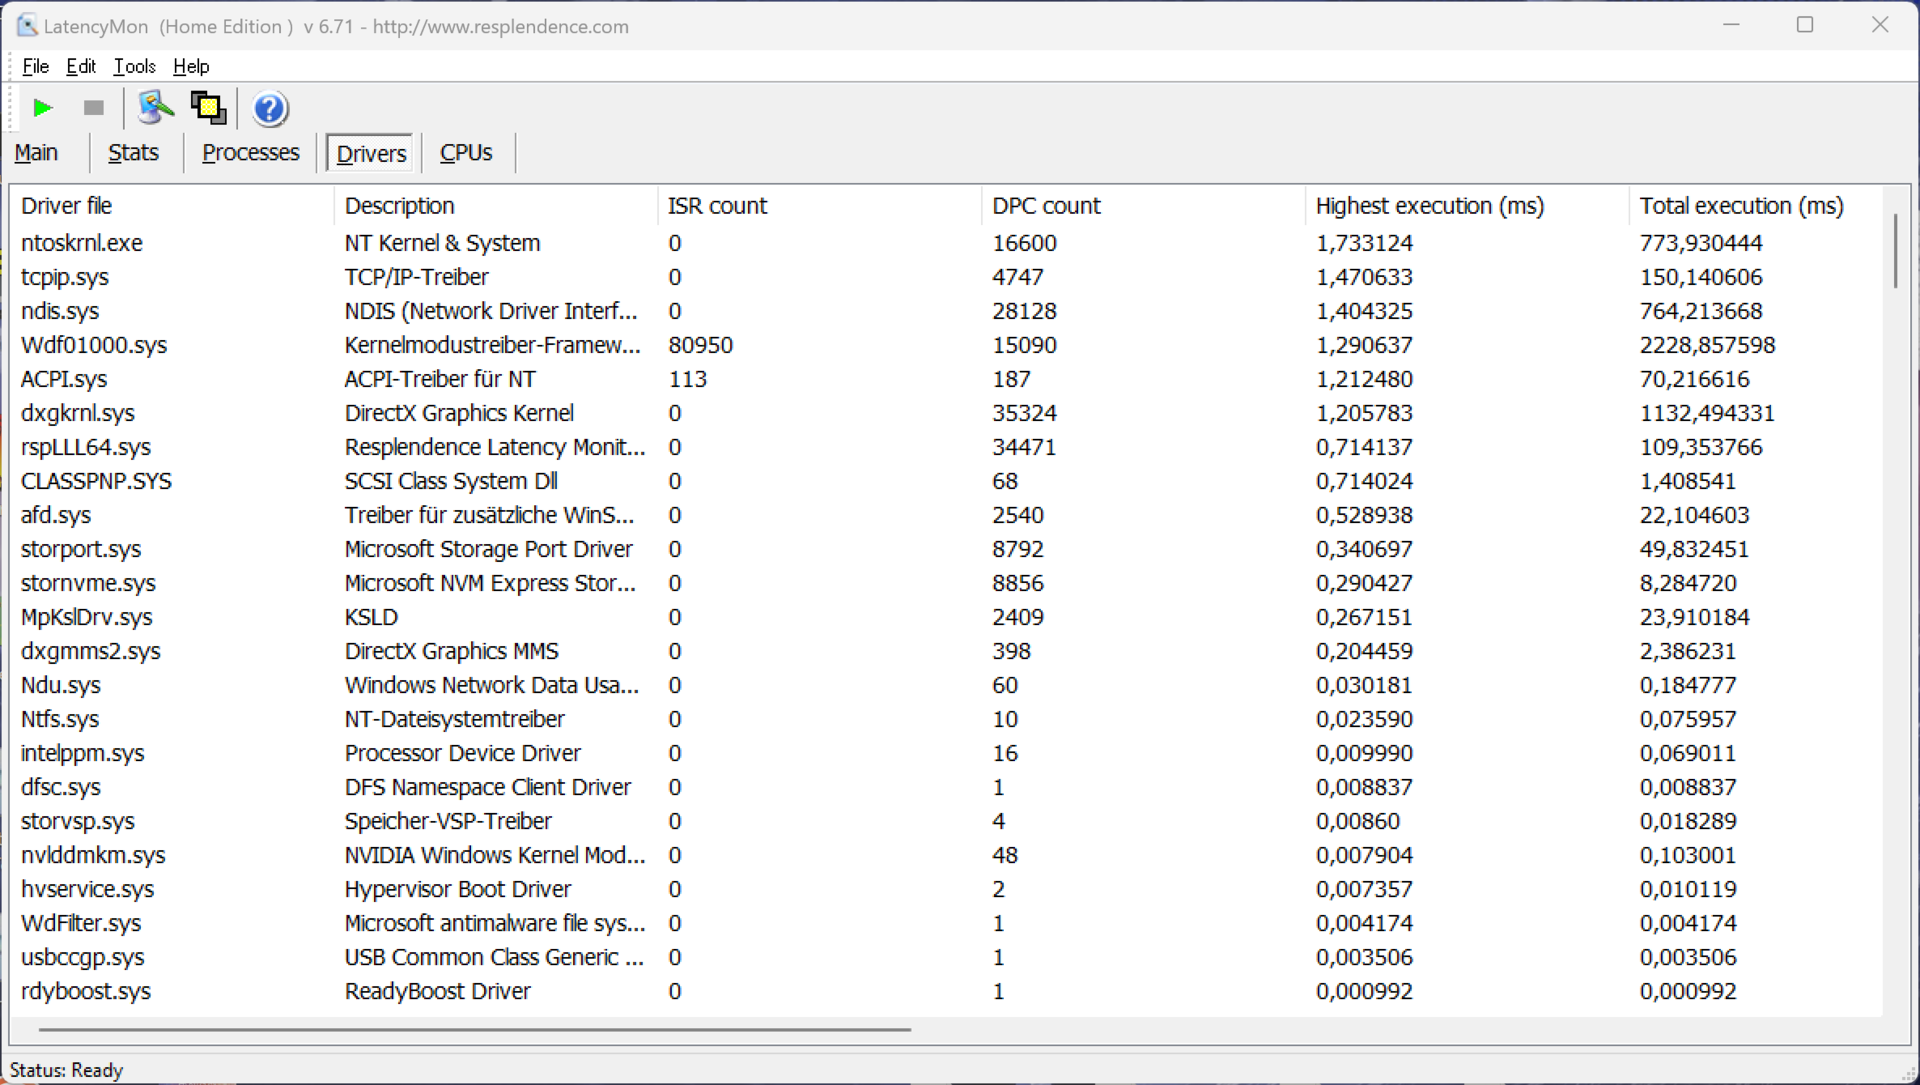
Latences DPC
Lors de notre test de latence standardisé (surf sur Internet, lecture YouTube en 4K, charge du processeur) avec la version actuelle du BIOS, l'appareil a montré quelques limites lorsqu'il s'agit d'utiliser des applications audio en temps réel.
| DPC Latencies / LatencyMon - interrupt to process latency (max), Web, Youtube, Prime95 | |
| Alienware m16 R2 | |
| HP Omen Transcend 16-u1095ng | |
| Lenovo Legion 7 16 IRX G9 | |
| Lenovo Legion Pro 7 16IRX9H | |
| Aorus 16X 2024 | |
| Lenovo Legion Pro 5 16IRX9 | |
| SCHENKER XMG CORE 16 (L23) | |
* ... Moindre est la valeur, meilleures sont les performances
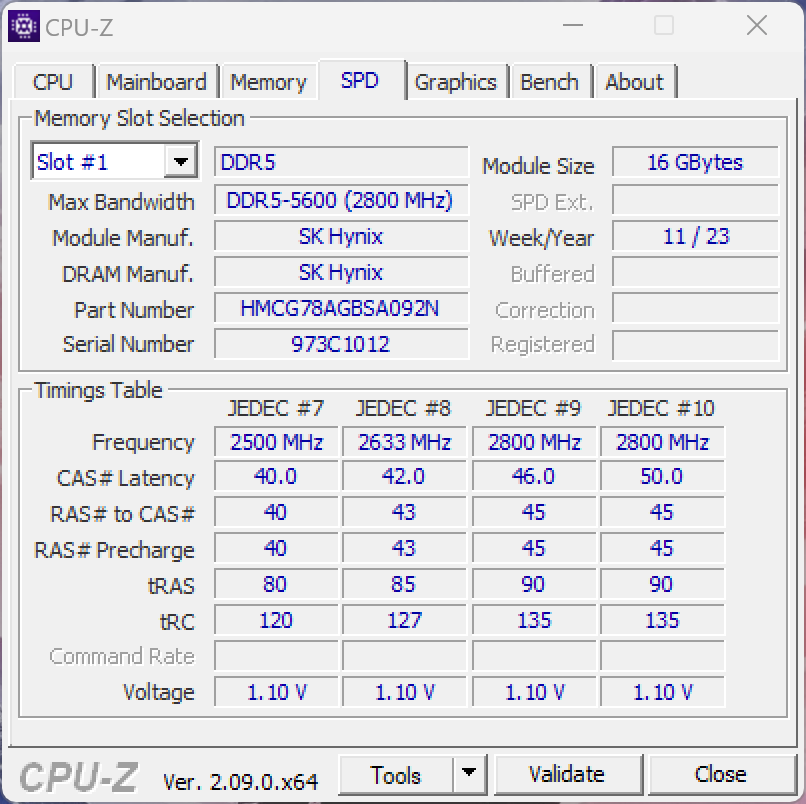
Mémoire de masse
Dans l'appareil examiné, Lenovo a installé un disque SSD SK Hynix PCIe 4.0 de 1 To, mais, après le premier démarrage, 877 Go sont disponibles pour l'utilisateur. Avec un débit de 7 Go/s, les vitesses de transfert sont très élevées et, dans l'ensemble, le SSD est un peu plus rapide que la concurrence. Cependant, bien que les performances ne restent pas toujours stables en cas de charge soutenue, ce n'est pas quelque chose que vous remarquerez dans les situations quotidiennes. Vous trouverez d'autres points de référence pour les disques SSD sont listés ici.

* ... Moindre est la valeur, meilleures sont les performances
Continuous Performance Read: DiskSpd Read Loop, Queue Depth 8
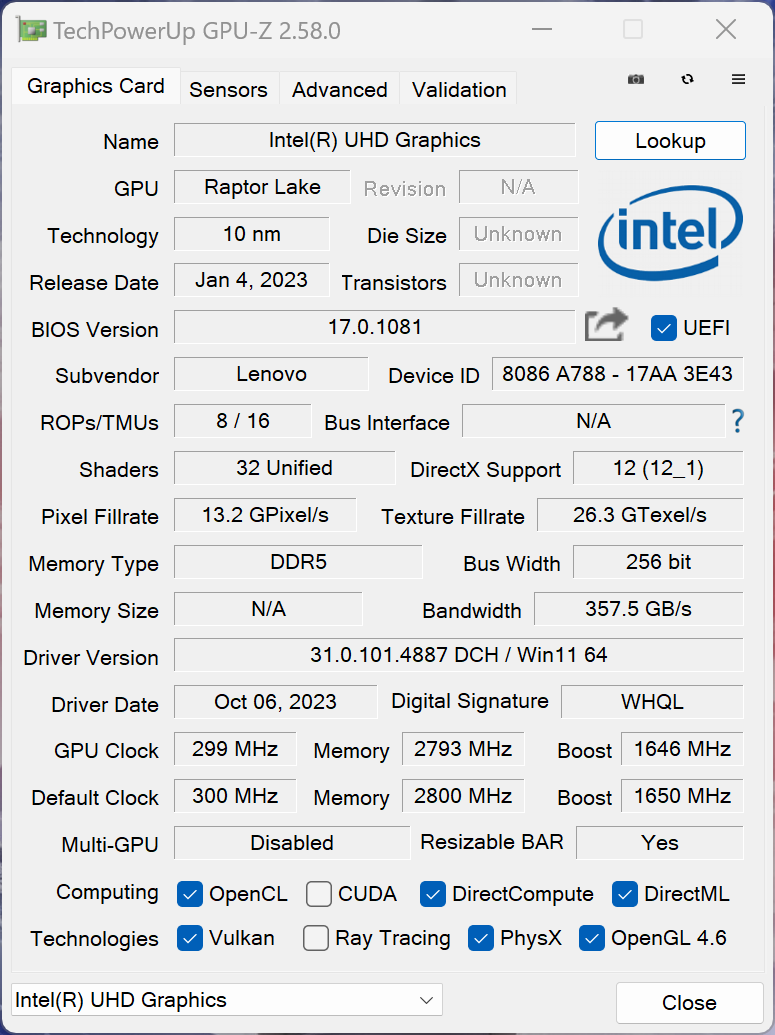
Carte graphique - GeForce RTX 4070 laptop
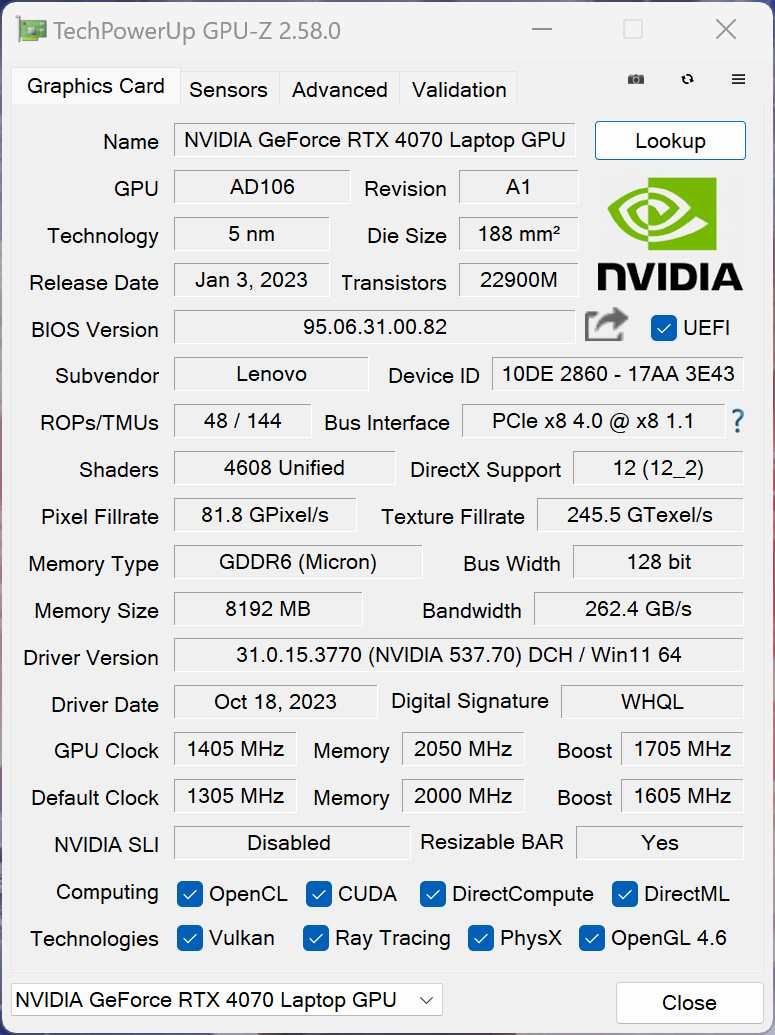
Notre appareil d'examen est équipé de l'ordinateur portable RTX 4070 bien que nous ayons affaire à la version 115 watts. De plus, en mode performance, le GPU est légèrement overclocké. Dans les benchmarks synthétiques, équipé de sa variante 140 watts, le Legion 7 16 est un peu à la traîne par rapport à la concurrence. Cependant, comme nous allons le voir, cela n'est pas pertinent pour les benchmarks de jeu puisque l'ordinateur portable RTX 4070 ne peut de toute façon pas consommer la totalité des 140 watts. Le Legion supporte le commutateur graphique Advanced Optimus.
En charge soutenue, le GPU reste totalement stable et, en mode batterie, la consommation d'énergie est limitée à 50 watts. C'est pourquoi les performances sont ici inférieures d'environ 35 %. Vous trouverez d'autres points de référence pour le GPU sont listés ici.
| 3DMark 11 Performance | 35070 points | |
| 3DMark Fire Strike Score | 25692 points | |
| 3DMark Time Spy Score | 12844 points | |
Aide | ||
| Blender / v3.3 Classroom OPTIX/RTX | |
| Moyenne de la classe Gaming (9 - 142, n=182, 2 dernières années) | |
| HP Omen Transcend 16-u1095ng | |
| Moyenne NVIDIA GeForce RTX 4070 Laptop GPU (18 - 28, n=48) | |
| SCHENKER XMG CORE 16 (L23) | |
| Alienware m16 R2 | |
| Aorus 16X 2024 | |
| Lenovo Legion 7 16 IRX G9 | |
| Lenovo Legion Pro 5 16IRX9 | |
| Lenovo Legion Pro 7 16IRX9H | |
| Blender / v3.3 Classroom CUDA | |
| Moyenne NVIDIA GeForce RTX 4070 Laptop GPU (32 - 172, n=52) | |
| Moyenne de la classe Gaming (16 - 175, n=189, 2 dernières années) | |
| HP Omen Transcend 16-u1095ng | |
| Alienware m16 R2 | |
| SCHENKER XMG CORE 16 (L23) | |
| Lenovo Legion Pro 5 16IRX9 | |
| Aorus 16X 2024 | |
| Lenovo Legion 7 16 IRX G9 | |
| Lenovo Legion Pro 7 16IRX9H | |
| Blender / v3.3 Classroom CPU | |
| Moyenne de la classe Gaming (138 - 962, n=201, 2 dernières années) | |
| SCHENKER XMG CORE 16 (L23) | |
| HP Omen Transcend 16-u1095ng | |
| Alienware m16 R2 | |
| Moyenne NVIDIA GeForce RTX 4070 Laptop GPU (158 - 428, n=48) | |
| Aorus 16X 2024 | |
| Lenovo Legion 7 16 IRX G9 | |
| Lenovo Legion Pro 5 16IRX9 | |
| Lenovo Legion Pro 7 16IRX9H | |
* ... Moindre est la valeur, meilleures sont les performances
Performances des jeux
Les performances de jeu du Legion 7 16 sont très bonnes et tous les titres modernes peuvent être joués sans problème en résolution QHD et avec un maximum de détails. Même en résolution native, les performances devraient être suffisantes et, si vous le souhaitez, l'upscaling DLSS peut être activé. Dans la comparaison des tests de jeu, l'appareil testé a obtenu un peu plus de points que dans les tests synthétiques et les performances sont restées totalement stables, même pendant les sessions de jeu les plus longues. Vous trouverez d'autres tests de référence pour les jeux ici.
| The Witcher 3 - 1920x1080 Ultra Graphics & Postprocessing (HBAO+) | |
| Lenovo Legion Pro 7 16IRX9H | |
| Lenovo Legion Pro 5 16IRX9 | |
| Aorus 16X 2024 | |
| Alienware m16 R2 | |
| SCHENKER XMG CORE 16 (L23) | |
| Moyenne de la classe Gaming (8.61 - 216, n=229, 2 dernières années) | |
| HP Omen Transcend 16-u1095ng | |
| Lenovo Legion 7 16 IRX G9 | |
| GTA V - 1920x1080 Highest Settings possible AA:4xMSAA + FX AF:16x | |
| Lenovo Legion Pro 7 16IRX9H | |
| Lenovo Legion Pro 5 16IRX9 | |
| Lenovo Legion 7 16 IRX G9 | |
| SCHENKER XMG CORE 16 (L23) | |
| HP Omen Transcend 16-u1095ng | |
| Moyenne de la classe Gaming (6.38 - 167.7, n=220, 2 dernières années) | |
| Aorus 16X 2024 | |
| Horizon Forbidden West | |
| 1920x1080 Very High Preset AA:T | |
| Lenovo Legion Pro 7 16IRX9H | |
| Moyenne de la classe Gaming (64.4 - 103.5, n=4, 2 dernières années) | |
| Aorus 16X 2024 | |
| Moyenne NVIDIA GeForce RTX 4070 Laptop GPU (53.2 - 76.7, n=6) | |
| Lenovo Legion 7 16 IRX G9 | |
| 2560x1440 Very High Preset AA:T | |
| Lenovo Legion Pro 7 16IRX9H | |
| Moyenne de la classe Gaming (49.9 - 83.7, n=4, 2 dernières années) | |
| Aorus 16X 2024 | |
| Moyenne NVIDIA GeForce RTX 4070 Laptop GPU (40.3 - 59.1, n=6) | |
| Lenovo Legion 7 16 IRX G9 | |
Witcher 3 FPS diagram
| Bas | Moyen | Élevé | Ultra | QHD | |
| GTA V (2015) | 182.4 | 124.1 | 94.2 | ||
| The Witcher 3 (2015) | 246 | 113.1 | 92 | ||
| Dota 2 Reborn (2015) | 230 | 205 | 193.4 | 179.5 | |
| Final Fantasy XV Benchmark (2018) | 223 | 166.8 | 119.8 | 89.1 | |
| X-Plane 11.11 (2018) | 198 | 180.6 | 138.2 | ||
| Far Cry 5 (2018) | 193 | 166 | 157 | 146 | 115 |
| Strange Brigade (2018) | 436 | 311 | 250 | 220 | 143 |
| F1 23 (2023) | 287 | 284 | 222 | 70.1 | 43.9 |
| Baldur's Gate 3 (2023) | 155.6 | 127.9 | 115.7 | 115 | 71.9 |
| Cyberpunk 2077 2.0 Phantom Liberty (2023) | 129.7 | 117.1 | 99.6 | 85.2 | 51.4 |
| Horizon Forbidden West (2024) | 107.1 | 103.4 | 73.2 | 64.4 | 49.9 |
Émissions - Refroidissement bruyant mais efficace
Émissions sonores
Lorsqu'il s'agit de tâches simples, le refroidissement du Legion 7 16 reste souvent désactivé, même en mode performance, et dans les situations quotidiennes, vous pouvez en toute confiance passer en mode silencieux pour minimiser le bruit du ventilateur. Avec un maximum de 38,4 dB(A) en mode silencieux, il est encore possible de jouer sans casque, mais dans les deux autres modes, 50 et 54 dB(A) sont trop forts. Malgré cela, le Legion Pro 5 et le Legion Pro 7 sont même un peu plus bruyants. Après une période de charge, les ventilateurs réduisent rapidement leur vitesse. Aucun autre bruit électronique n'était présent dans l'appareil examiné.
Degré de la nuisance sonore
| Au repos |
| 24.5 / 24.5 / 24.5 dB(A) |
| Fortement sollicité |
| 34.8 / 54.1 dB(A) |
 | ||
30 dB silencieux 40 dB(A) audible 50 dB(A) bruyant |
||
min: | ||
| Lenovo Legion 7 16 IRX G9 NVIDIA GeForce RTX 4070 Laptop GPU, i9-14900HX, SK Hynix HFS001TEJ9X115N | Lenovo Legion Pro 5 16IRX9 NVIDIA GeForce RTX 4070 Laptop GPU, i9-14900HX, Samsung PM9A1 MZVL21T0HCLR | Aorus 16X 2024 NVIDIA GeForce RTX 4070 Laptop GPU, i9-14900HX, Gigabyte AG450E1024-SI | HP Omen Transcend 16-u1095ng NVIDIA GeForce RTX 4070 Laptop GPU, i9-14900HX, Kioxia XG8 KXG80ZNV1T02 | Alienware m16 R2 NVIDIA GeForce RTX 4070 Laptop GPU, Ultra 7 155H, Samsung PM9A1 MZVL21T0HCLR | SCHENKER XMG CORE 16 (L23) NVIDIA GeForce RTX 4070 Laptop GPU, R7 7840HS, Samsung 990 Pro 1 TB | Lenovo Legion Pro 7 16IRX9H NVIDIA GeForce RTX 4080 Laptop GPU, i9-14900HX, SK Hynix HFS001TEJ9X115N | |
|---|---|---|---|---|---|---|---|
| Noise | -6% | -21% | -9% | -2% | -1% | -22% | |
| off / environment * | 24.5 | 23.9 2% | 26 -6% | 24 2% | 24.7 -1% | 23 6% | 24 2% |
| Idle Minimum * | 24.5 | 24.3 1% | 26 -6% | 29 -18% | 25.3 -3% | 23 6% | 25 -2% |
| Idle Average * | 24.5 | 24.3 1% | 32 -31% | 30 -22% | 25.3 -3% | 28.48 -16% | 30 -22% |
| Idle Maximum * | 24.5 | 28.9 -18% | 38 -55% | 31 -27% | 25.3 -3% | 28.48 -16% | 45 -84% |
| Load Average * | 34.8 | 45.8 -32% | 54 -55% | 45 -29% | 31.7 9% | 30 14% | 50 -44% |
| Witcher 3 ultra * | 54.1 | 51 6% | 50 8% | 44 19% | 53.8 1% | 54.12 -0% | 54 -0% |
| Load Maximum * | 54.1 | 56.6 -5% | 55 -2% | 47 13% | 62 -15% | 54.12 -0% | 56 -4% |
* ... Moindre est la valeur, meilleures sont les performances
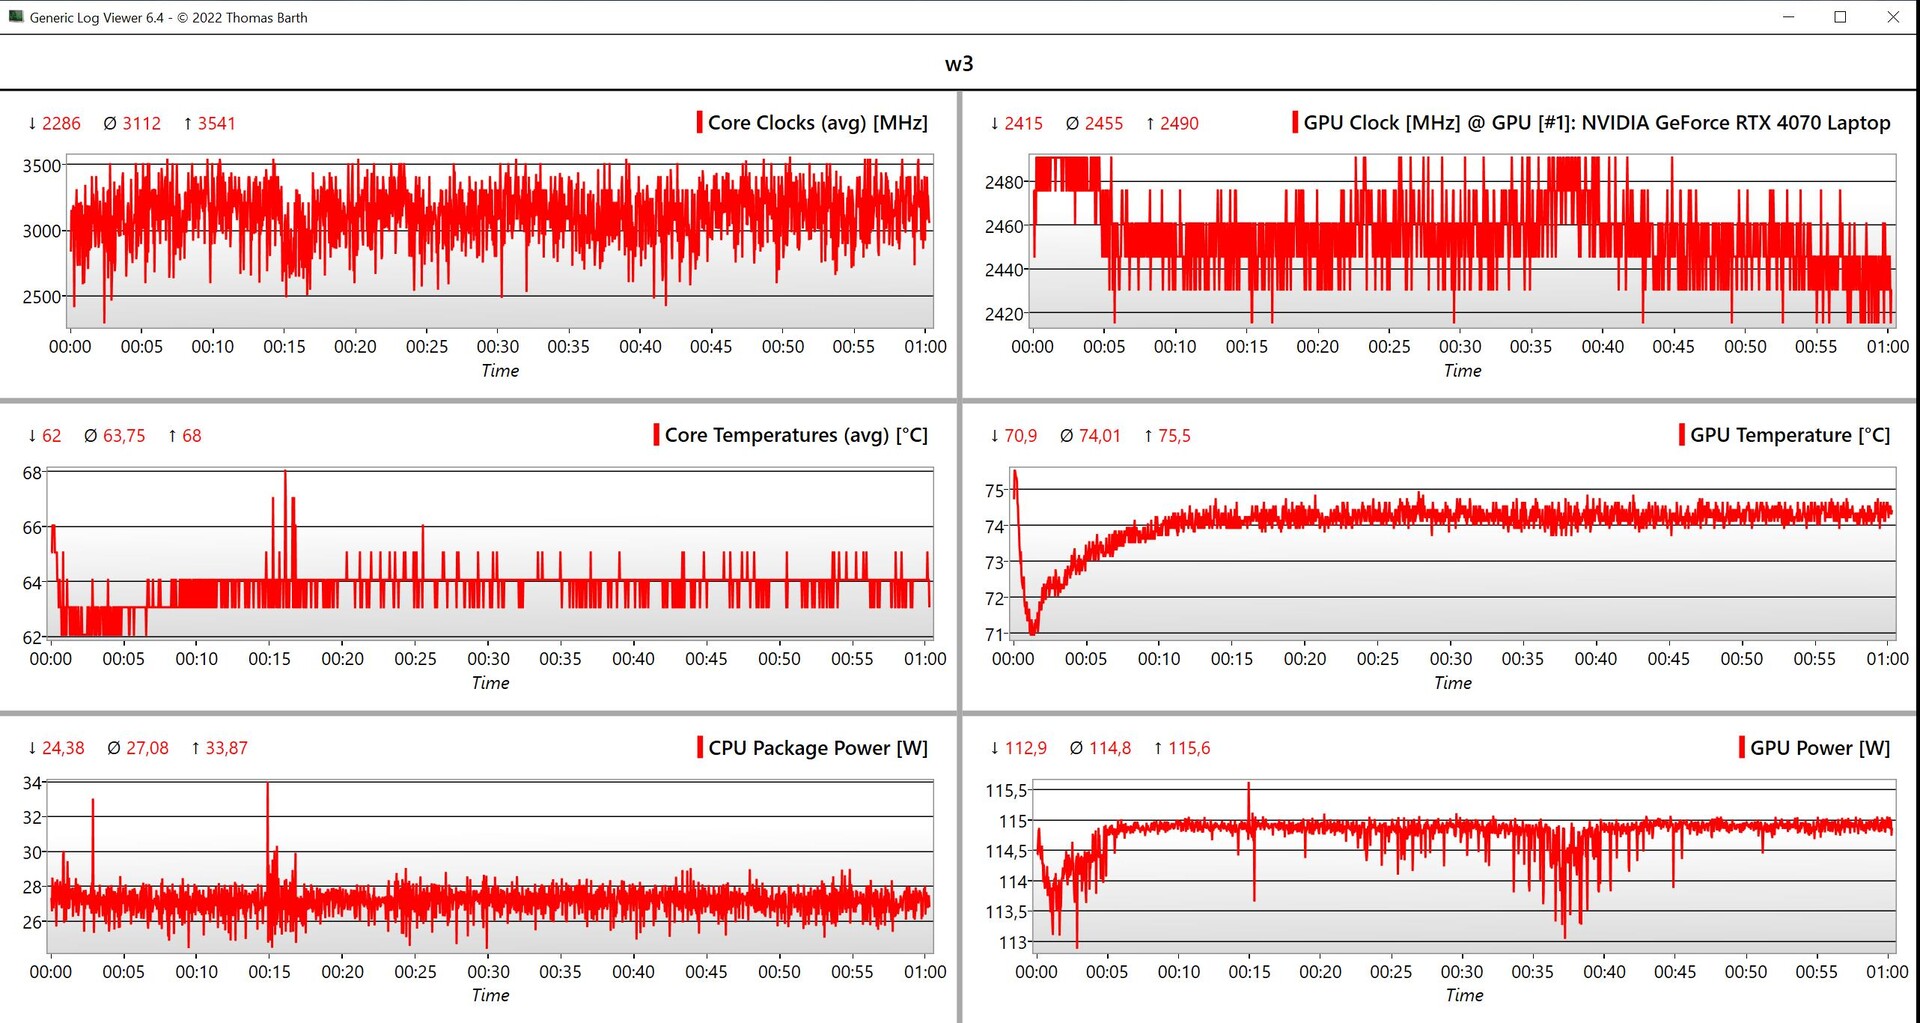
Température
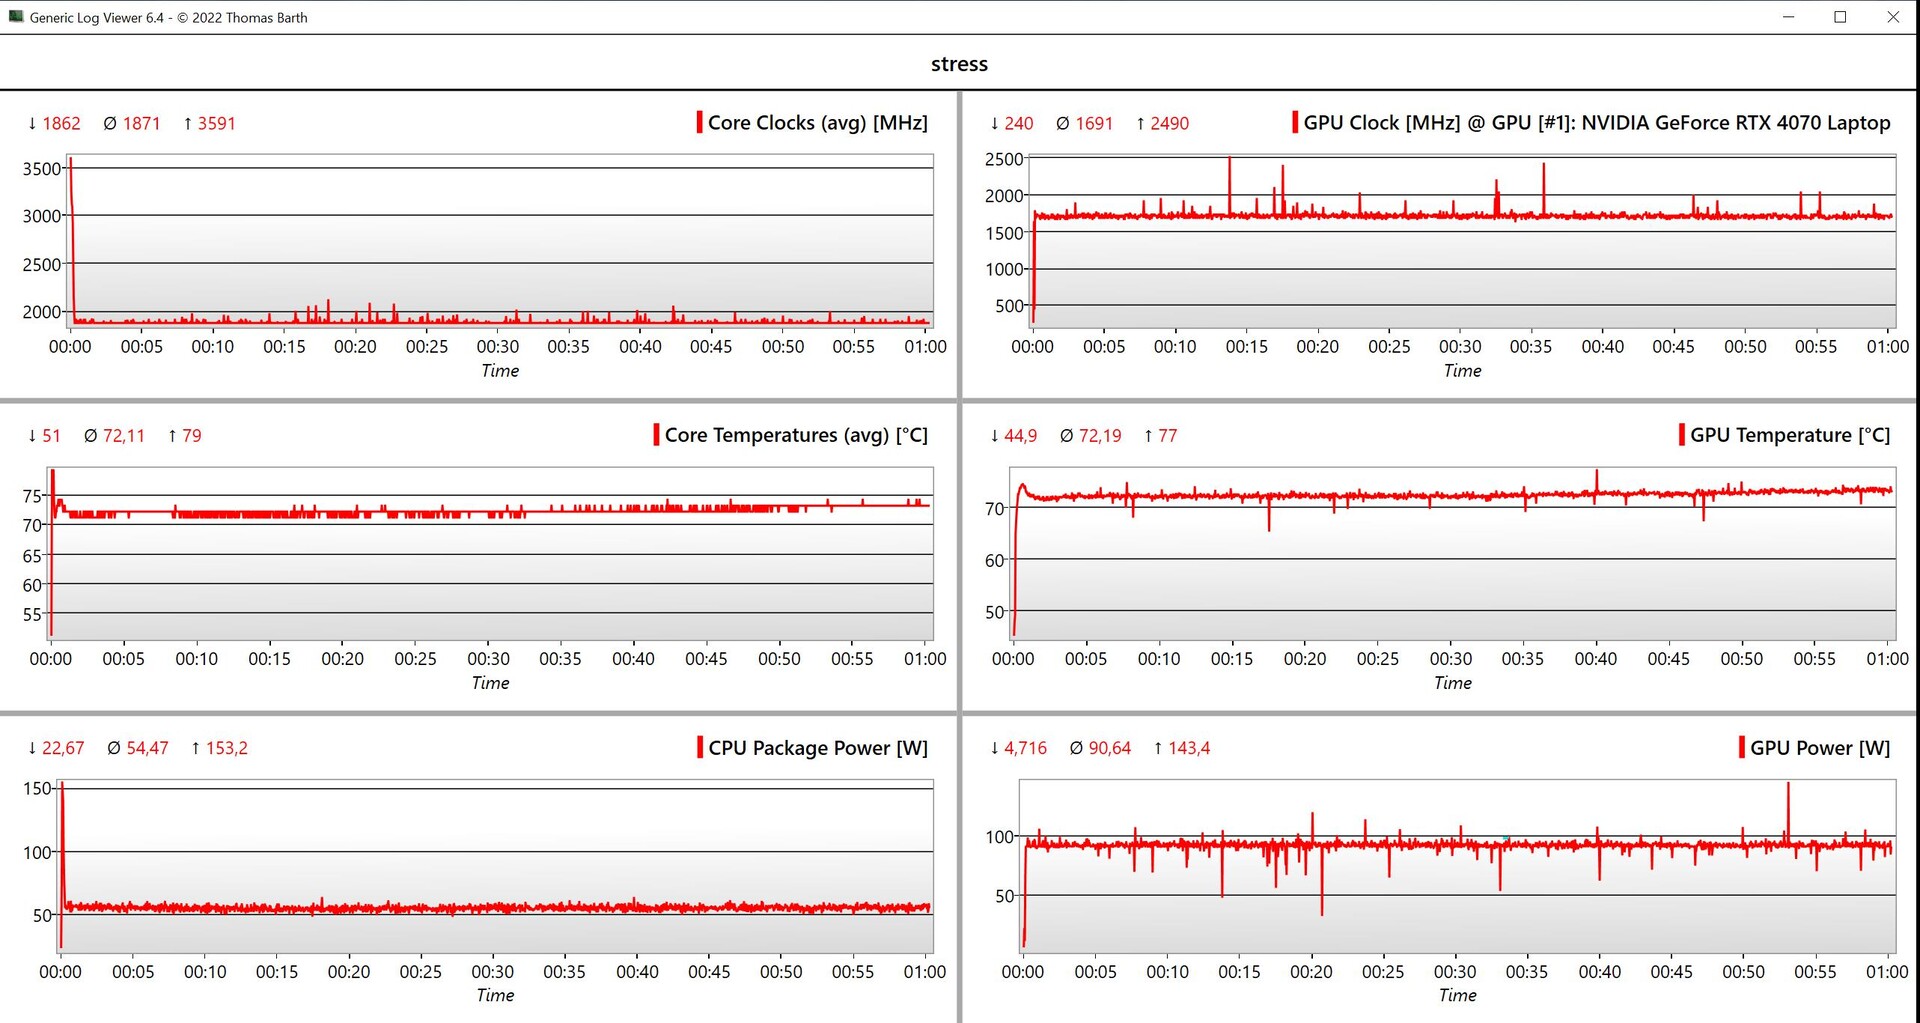
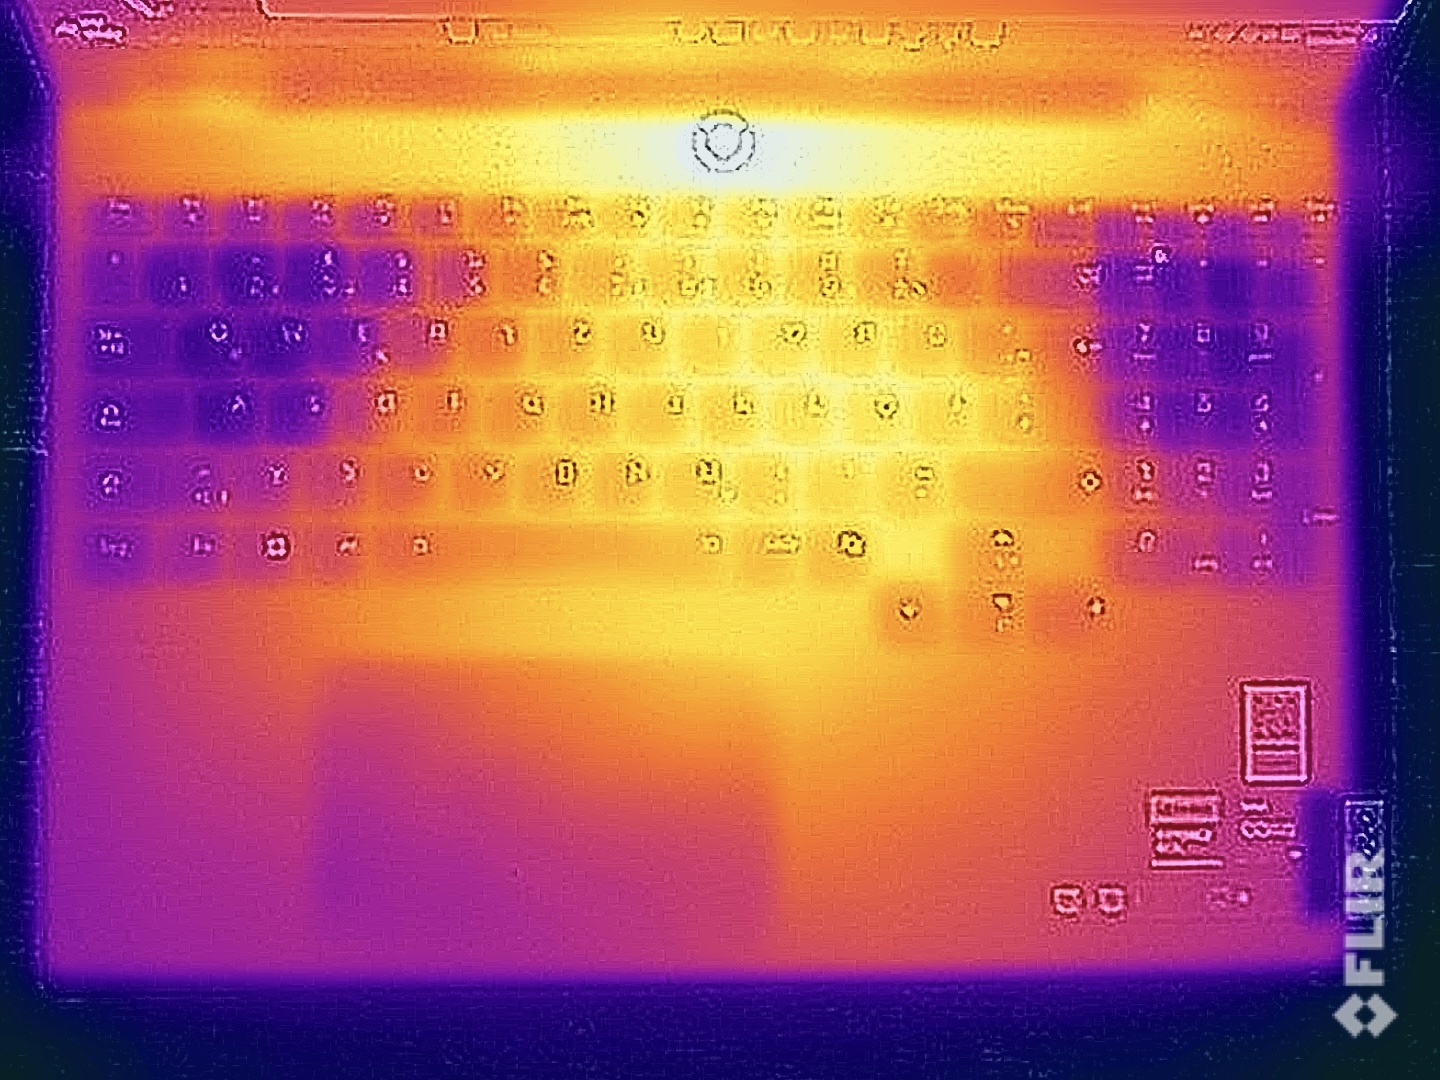
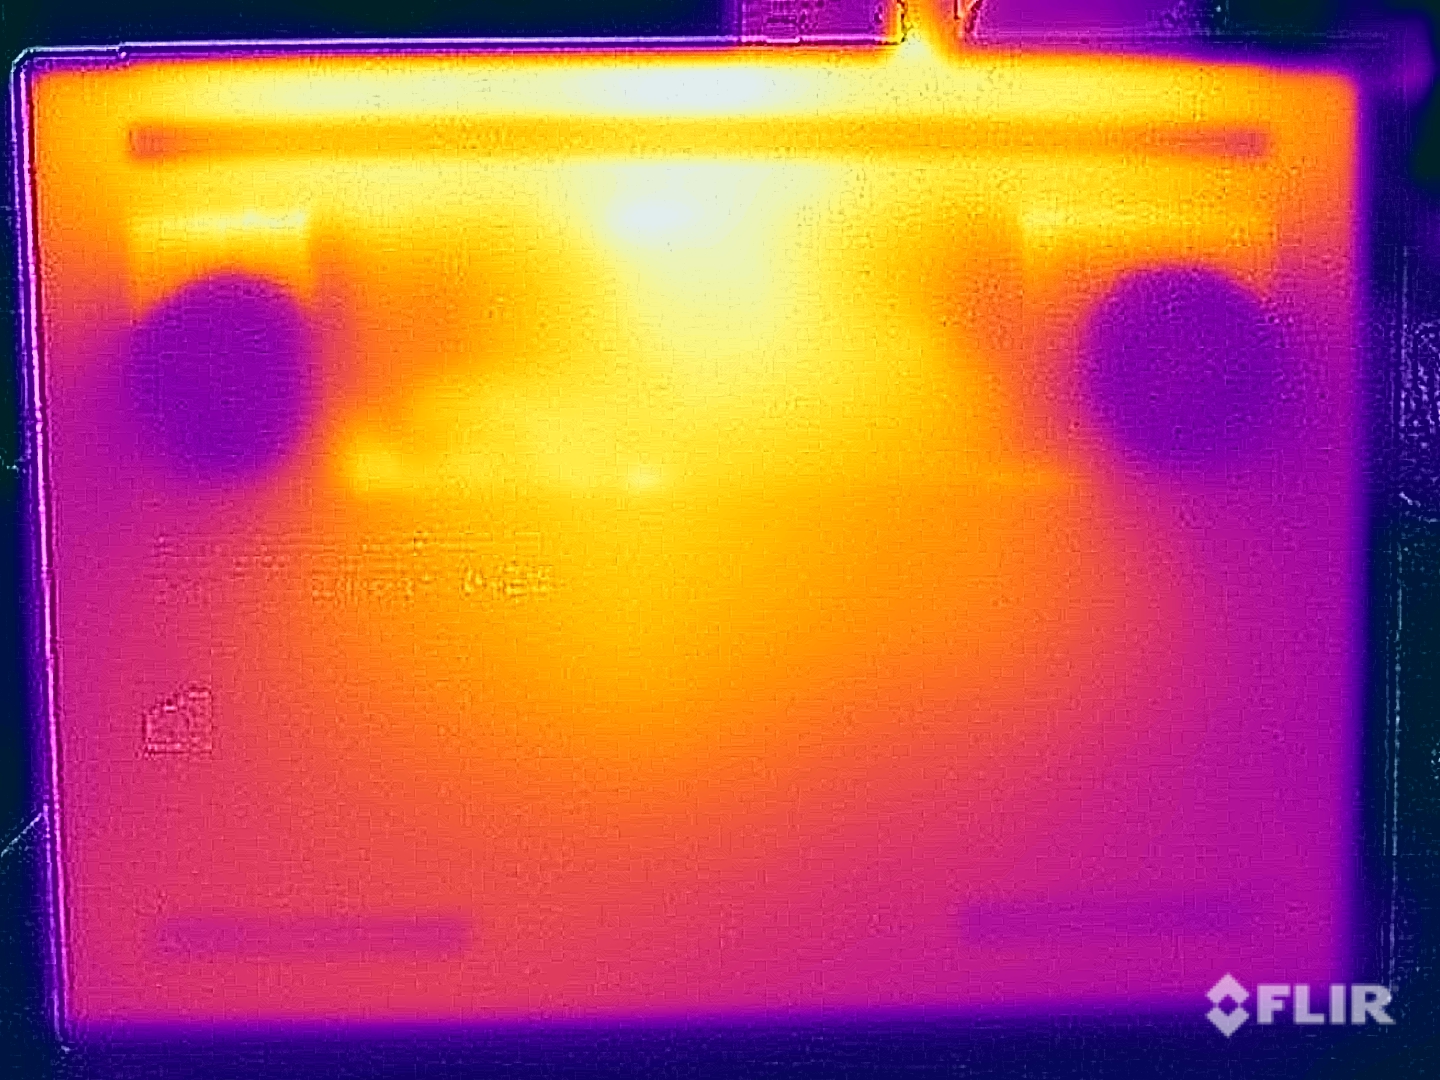
Au ralenti et sous faible charge, le boîtier en aluminium reste agréablement frais et même dans les jeux, il fait mieux que prévu. A certains endroits, nous avons mesuré des valeurs allant de 42 à 43 °C et bien que ce soit quelque chose que vous remarquez également lorsque vous utilisez le clavier, cela ne se traduit pas par une expérience utilisateur restreinte et, une fois de plus, le Legion 7 est plus performant que les deux modèles pro concurrents malgré son unité de base plus mince. Dans le test de stress avec une charge combinée CPU/GPU, le GPU fonctionne à 90 watts et le CPU à environ 54 watts.
(±) La température maximale du côté supérieur est de 43.7 °C / 111 F, par rapport à la moyenne de 40.4 °C / 105 F, allant de 21.2 à 68.8 °C pour la classe Gaming.
(±) Le fond chauffe jusqu'à un maximum de 42.9 °C / 109 F, contre une moyenne de 43.2 °C / 110 F
(+) En utilisation inactive, la température moyenne du côté supérieur est de 27 °C / 81 F, par rapport à la moyenne du dispositif de 33.8 °C / 93 F.
(±) En jouant à The Witcher 3, la température moyenne du côté supérieur est de 37.2 °C / 99 F, alors que la moyenne de l'appareil est de 33.8 °C / 93 F.
(±) Les repose-poignets et le pavé tactile peuvent devenir très chauds au toucher, avec un maximum de 38.7 °C / 101.7# F.
(-) La température moyenne de la zone de l'appui-paume de dispositifs similaires était de 28.9 °C / 84 F (-9.8 °C / #-17.7 F).
| Lenovo Legion 7 16 IRX G9 Intel Core i9-14900HX, NVIDIA GeForce RTX 4070 Laptop GPU | Lenovo Legion Pro 5 16IRX9 Intel Core i9-14900HX, NVIDIA GeForce RTX 4070 Laptop GPU | Aorus 16X 2024 Intel Core i9-14900HX, NVIDIA GeForce RTX 4070 Laptop GPU | HP Omen Transcend 16-u1095ng Intel Core i9-14900HX, NVIDIA GeForce RTX 4070 Laptop GPU | Alienware m16 R2 Intel Core Ultra 7 155H, NVIDIA GeForce RTX 4070 Laptop GPU | SCHENKER XMG CORE 16 (L23) AMD Ryzen 7 7840HS, NVIDIA GeForce RTX 4070 Laptop GPU | Lenovo Legion Pro 7 16IRX9H Intel Core i9-14900HX, NVIDIA GeForce RTX 4080 Laptop GPU | |
|---|---|---|---|---|---|---|---|
| Heat | -15% | -10% | -14% | -20% | -7% | -18% | |
| Maximum Upper Side * | 43.7 | 43.8 -0% | 41 6% | 49 -12% | 44.8 -3% | 46 -5% | 46 -5% |
| Maximum Bottom * | 42.9 | 55.4 -29% | 41 4% | 63 -47% | 48 -12% | 44 -3% | 49 -14% |
| Idle Upper Side * | 29.1 | 32.8 -13% | 37 -27% | 30 -3% | 37.2 -28% | 32 -10% | 38 -31% |
| Idle Bottom * | 30.6 | 36 -18% | 38 -24% | 29 5% | 42 -37% | 33 -8% | 37 -21% |
* ... Moindre est la valeur, meilleures sont les performances
Intervenants
Les deux enceintes stéréo font un travail décent, mais il y a une différence notable entre elles et les enceintes plus chères de la gamme Legion Pro 7 16. Cependant, les modules sont suffisamment bons pour des films/séries occasionnels ou de la musique de fond. Pour les jeux, nous vous recommandons d'utiliser un casque en raison des ventilateurs bruyants.
Lenovo Legion 7 16 IRX G9 analyse audio
(+) | les haut-parleurs peuvent jouer relativement fort (82.1# dB)
Bass 100 - 315 Hz
(±) | basse réduite - en moyenne 13.1% inférieure à la médiane
(±) | la linéarité des basses est moyenne (9.7% delta à la fréquence précédente)
Mids 400 - 2000 Hz
(+) | médiane équilibrée - seulement 2.8% de la médiane
(+) | les médiums sont linéaires (3.7% delta à la fréquence précédente)
Aiguës 2 - 16 kHz
(+) | des sommets équilibrés - à seulement 4.7% de la médiane
(±) | la linéarité des aigus est moyenne (7% delta à la fréquence précédente)
Overall 100 - 16.000 Hz
(+) | le son global est linéaire (12.6% différence à la médiane)
Par rapport à la même classe
» 14% de tous les appareils testés de cette catégorie étaient meilleurs, 3% similaires, 83% pires
» Le meilleur avait un delta de 6%, la moyenne était de 18%, le pire était de 132%.
Par rapport à tous les appareils testés
» 9% de tous les appareils testés étaient meilleurs, 2% similaires, 89% pires
» Le meilleur avait un delta de 4%, la moyenne était de 25%, le pire était de 134%.
Lenovo Legion Pro 7 16IRX9H analyse audio
(+) | les haut-parleurs peuvent jouer relativement fort (84# dB)
Bass 100 - 315 Hz
(±) | basse réduite - en moyenne 9% inférieure à la médiane
(±) | la linéarité des basses est moyenne (7.4% delta à la fréquence précédente)
Mids 400 - 2000 Hz
(+) | médiane équilibrée - seulement 2.8% de la médiane
(+) | les médiums sont linéaires (4% delta à la fréquence précédente)
Aiguës 2 - 16 kHz
(+) | des sommets équilibrés - à seulement 3% de la médiane
(+) | les aigus sont linéaires (5% delta à la fréquence précédente)
Overall 100 - 16.000 Hz
(+) | le son global est linéaire (8.4% différence à la médiane)
Par rapport à la même classe
» 1% de tous les appareils testés de cette catégorie étaient meilleurs, 1% similaires, 98% pires
» Le meilleur avait un delta de 6%, la moyenne était de 18%, le pire était de 132%.
Par rapport à tous les appareils testés
» 1% de tous les appareils testés étaient meilleurs, 0% similaires, 98% pires
» Le meilleur avait un delta de 4%, la moyenne était de 25%, le pire était de 134%.
Gestion de l'énergie - Autonomie moyenne de la batterie
Consommation électrique
Dans les mesures de consommation, l'appareil de test ne nous a pas surpris et, en mode veille, nous avons enregistré un maximum de près de 22 watts. En mode performance, le bloc d'alimentation de 230 watts est brièvement le facteur limitant, mais il s'est rapidement stabilisé et la consommation s'est rapidement établie à 200 watts. Dans l'ensemble, le bloc d'alimentation de 230 watts est bien dimensionné. Néanmoins, Lenovo pourrait améliorer la consommation en veille de plus de 1,1 watts.
| Éteint/en veille | |
| Au repos | |
| Fortement sollicité |
|
| Lenovo Legion 7 16 IRX G9 i9-14900HX, NVIDIA GeForce RTX 4070 Laptop GPU, SK Hynix HFS001TEJ9X115N, IPS, 3200x2000, 16.00 | Aorus 16X 2024 i9-14900HX, NVIDIA GeForce RTX 4070 Laptop GPU, Gigabyte AG450E1024-SI, IPS, 2560x1600, 16.00 | HP Omen Transcend 16-u1095ng i9-14900HX, NVIDIA GeForce RTX 4070 Laptop GPU, Kioxia XG8 KXG80ZNV1T02, OLED, 2560x1600, 16.00 | Alienware m16 R2 Ultra 7 155H, NVIDIA GeForce RTX 4070 Laptop GPU, Samsung PM9A1 MZVL21T0HCLR, IPS, 2560x1600, 16.00 | SCHENKER XMG CORE 16 (L23) R7 7840HS, NVIDIA GeForce RTX 4070 Laptop GPU, Samsung 990 Pro 1 TB, IPS, 2560x1600, 16.00 | Lenovo Legion Pro 7 16IRX9H i9-14900HX, NVIDIA GeForce RTX 4080 Laptop GPU, SK Hynix HFS001TEJ9X115N, IPS, 2560x1600, 16.00 | Moyenne NVIDIA GeForce RTX 4070 Laptop GPU | Moyenne de la classe Gaming | |
|---|---|---|---|---|---|---|---|---|
| Power Consumption | -4% | 4% | 6% | 20% | -27% | 12% | 1% | |
| Idle Minimum * | 15.4 | 13 16% | 10 35% | 8.1 47% | 11 29% | 16 -4% | 12.1 ? 21% | 13.8 ? 10% |
| Idle Average * | 21.2 | 18 15% | 18 15% | 13 39% | 15.2 28% | 21 1% | 16.9 ? 20% | 19.2 ? 9% |
| Idle Maximum * | 21.9 | 35 -60% | 32 -46% | 40.3 -84% | 16 27% | 36 -64% | 24.1 ? -10% | 27 ? -23% |
| Load Average * | 128.5 | 138 -7% | 128 -0% | 79 39% | 64 50% | 132 -3% | 99 ? 23% | 111.3 ? 13% |
| Witcher 3 ultra * | 188.4 | 172.6 8% | 148.4 21% | 188.1 -0% | 179 5% | 267 -42% | ||
| Load Maximum * | 239.1 | 222 7% | 242 -1% | 254.9 -7% | 280 -17% | 360 -51% | 220 ? 8% | 251 ? -5% |
* ... Moindre est la valeur, meilleures sont les performances
Power consumption Witcher 3 / stress test
Power consumption with an external monitor
Durée de vie de la batterie
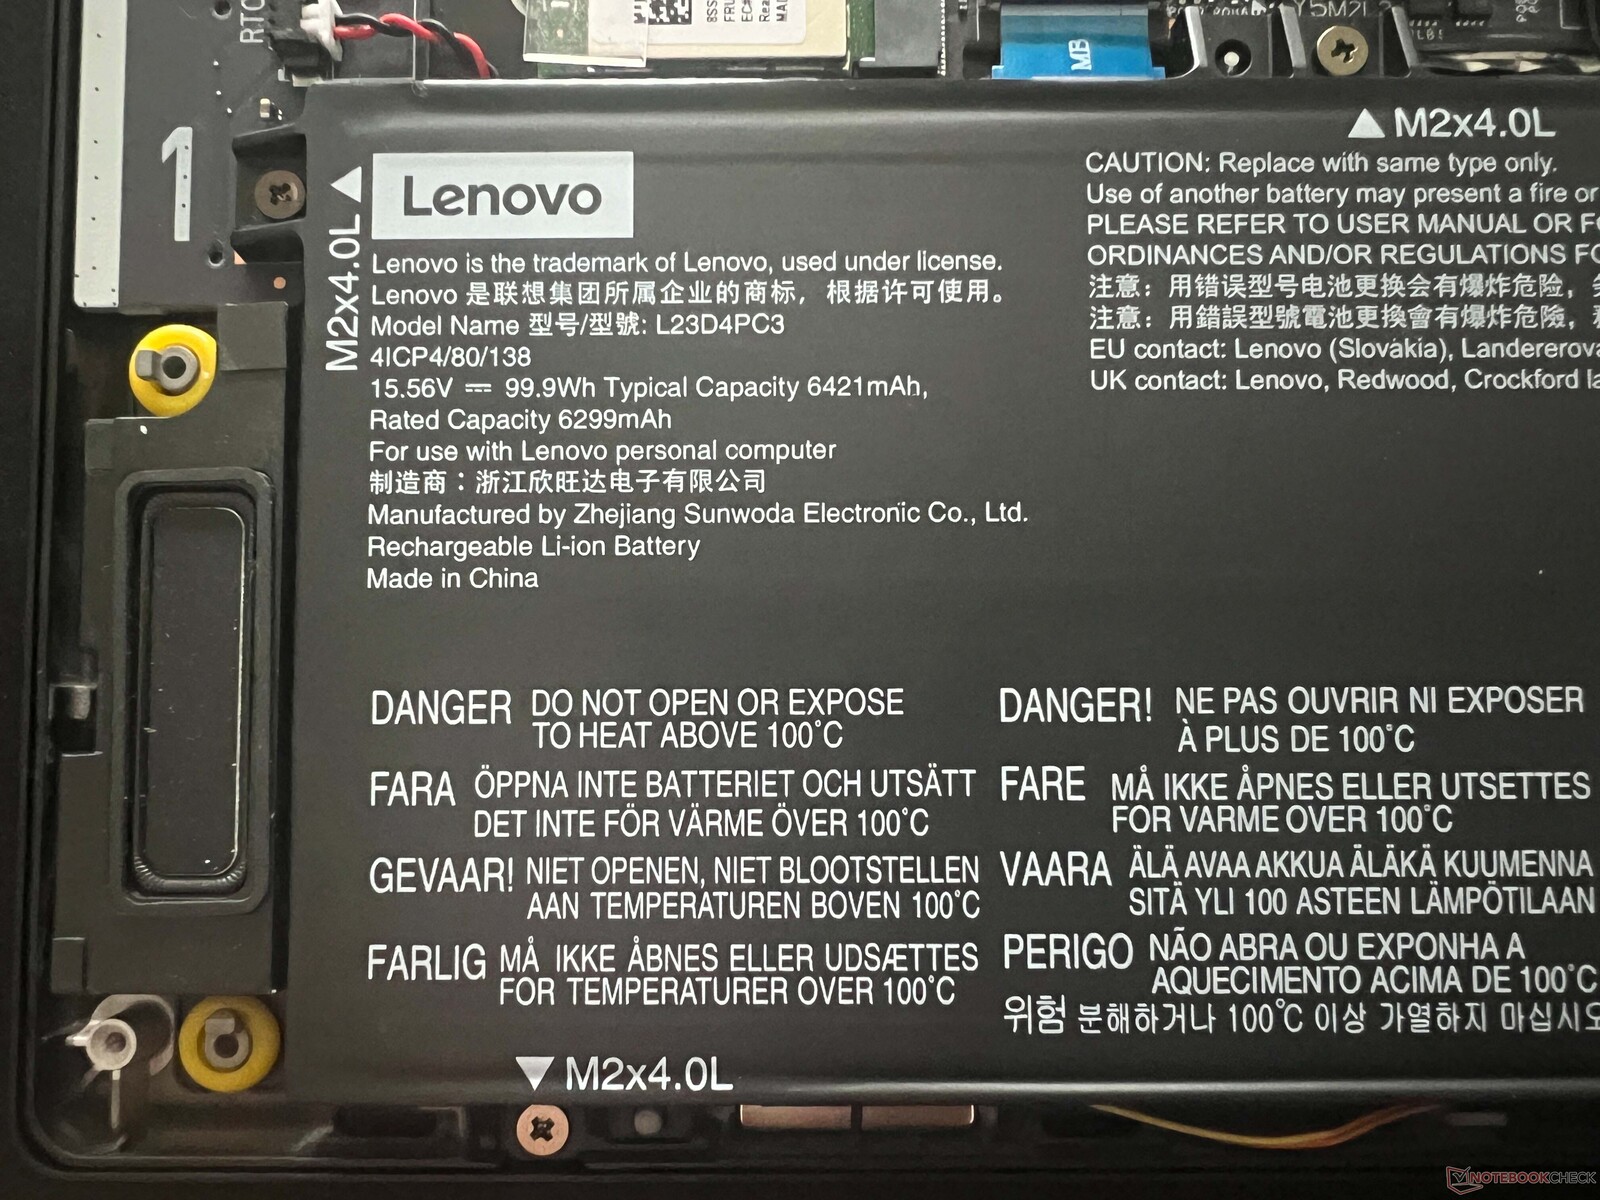
Lenovo a installé une batterie de 99,9 Wh dans son Legion 7 16 et, dans l'ensemble, les durées d'utilisation peuvent être considérées comme moyennes. À 150 cd/m² (représentant 63 % de la luminosité maximale de l'appareil) et 60 Hz, notre test Wi-Fi a duré plus de 7 heures (~6,5 heures à 165 Hz) et environ 5,5 heures à pleine luminosité et 60 Hz (~5 heures à 165 Hz). Dans le test vidéo à 150 cd/m², nous avons enregistré un peu plus de 10 heures, et sous charge, dans le pire des cas, les lumières s'éteignent après 50 minutes.
Le site Legion propose deux modes de charge : un cycle de charge complet dure 97 minutes (80 % après environ 64 minutes) en mode normal. En mode express, il faut 79 minutes (80 % après seulement 34 minutes).
| Lenovo Legion 7 16 IRX G9 i9-14900HX, NVIDIA GeForce RTX 4070 Laptop GPU, 99.9 Wh | Lenovo Legion Pro 5 16IRX9 i9-14900HX, NVIDIA GeForce RTX 4070 Laptop GPU, 80 Wh | Aorus 16X 2024 i9-14900HX, NVIDIA GeForce RTX 4070 Laptop GPU, 99 Wh | HP Omen Transcend 16-u1095ng i9-14900HX, NVIDIA GeForce RTX 4070 Laptop GPU, 97 Wh | Alienware m16 R2 Ultra 7 155H, NVIDIA GeForce RTX 4070 Laptop GPU, 90 Wh | SCHENKER XMG CORE 16 (L23) R7 7840HS, NVIDIA GeForce RTX 4070 Laptop GPU, 99 Wh | Lenovo Legion Pro 7 16IRX9H i9-14900HX, NVIDIA GeForce RTX 4080 Laptop GPU, 99.9 Wh | Moyenne de la classe Gaming | |
|---|---|---|---|---|---|---|---|---|
| Autonomie de la batterie | 0% | 34% | -33% | 17% | 69% | -14% | 8% | |
| H.264 | 620 | 541 -13% | 609 -2% | 400 ? -35% | ||||
| WiFi v1.3 | 433 | 290 -33% | 481 11% | 292 -33% | 483 12% | 501 16% | 373 -14% | 368 ? -15% |
| Load | 49 | 65 33% | 100 104% | 60 22% | 143 192% | 84.7 ? 73% | ||
| Reader / Idle | 403 | 753 | 758 | 546 ? |
Points positifs
Points négatifs
Verdict - Un ordinateur portable de jeu sobre et performant

Avec le nouveau Legion 7i 16 G9, Lenovo propose un ordinateur portable de jeu relativement fin qui n'a pas révélé de faiblesses flagrantes lors des tests. Par rapport à l'ordinateur plus cher Legion Pro 7lenovo propose un ordinateur portable de jeu relativement fin qui n'a pas montré de faiblesses flagrantes lors des tests. Comparé au Pro 7, plus cher, vous devez accepter des limitations lorsqu'il s'agit de longues périodes de performance du CPU ainsi que du GPU équipé (le Legion 7 plafonne à la RTX 4070) mais, comparé au Pro, le boîtier en aluminium reste plus frais et, dans l'ensemble, le refroidissement fait un très bon travail. Les ventilateurs sont toujours problématiques car vous aurez besoin d'un casque pour jouer, en utilisant l'un ou l'autre des modes d'énergie rapide. Cependant, cela s'applique également à la concurrence et, en utilisant le mode silencieux, il est possible d'avoir des niveaux sonores tolérables au détriment de certaines performances.
En outre, le boîtier plus fin est beaucoup moins remarquable que celui du Legion Pro. Ceux qui recherchent des options d'éclairage étendues seront déçus, mais d'un autre côté, cela rend le Legion 7 16 adapté à d'autres groupes cibles. Seules les surfaces sensibles aux empreintes digitales sont gênantes. Hormis le port Ethernet manquant, tous les connecteurs importants sont présents et les périphériques d'entrée ne posent aucun problème.
Le nouveau Lenovo Legion 7i 16 G9 est un ordinateur portable de jeu accrocheur, très performant et doté d'un bon ensemble de fonctionnalités. L'écran IPS haute résolution est également adapté à la visualisation et à l'édition d'images et aucun PWM n'est implémenté.
Dans l'ensemble, l'écran IPS optionnel et sa résolution de 3 200 x 2 000 pixels font du bon travail, même si l'impression subjective de l'image et les temps de réponse ne sont pas à la hauteur des panneaux OLED. L'avantage est l'absence de PWM et de reflets gênants. De même, l'autonomie de la batterie n'est que moyenne, la plateforme et son processeur HX nécessitant tout simplement trop d'énergie.
Le nouveau Legion 7 16 a également de bonnes performances lorsqu'il est comparé à ses pairs. En particulier, le Legion Pro 7 convient si vous voulez un GPU plus rapide que la RTX 4070. Avec une puissance comparable, le Legion Pro 5 est en revanche beaucoup plus encombrant et offre un écran de moins bonne qualité. Le HP Omen Transcend est équipé d'un écran OLED de 240 Hz, mais ses performances sont un peu moins bonnes et son prix est plus élevé.
Prix et disponibilité
Le Legion 7i 16 G9 peut être acheté directement auprès de Lenovo pour environ 2 099 $.
Lenovo Legion 7 16 IRX G9
-
04/13/2024 v7
Andreas Osthoff
Transparency
The present review sample was made available to the author as a loan by the manufacturer or a shop for the purposes of review. The lender had no influence on this review, nor did the manufacturer receive a copy of this review before publication. There was no obligation to publish this review.
Pricecompare

