Verdict
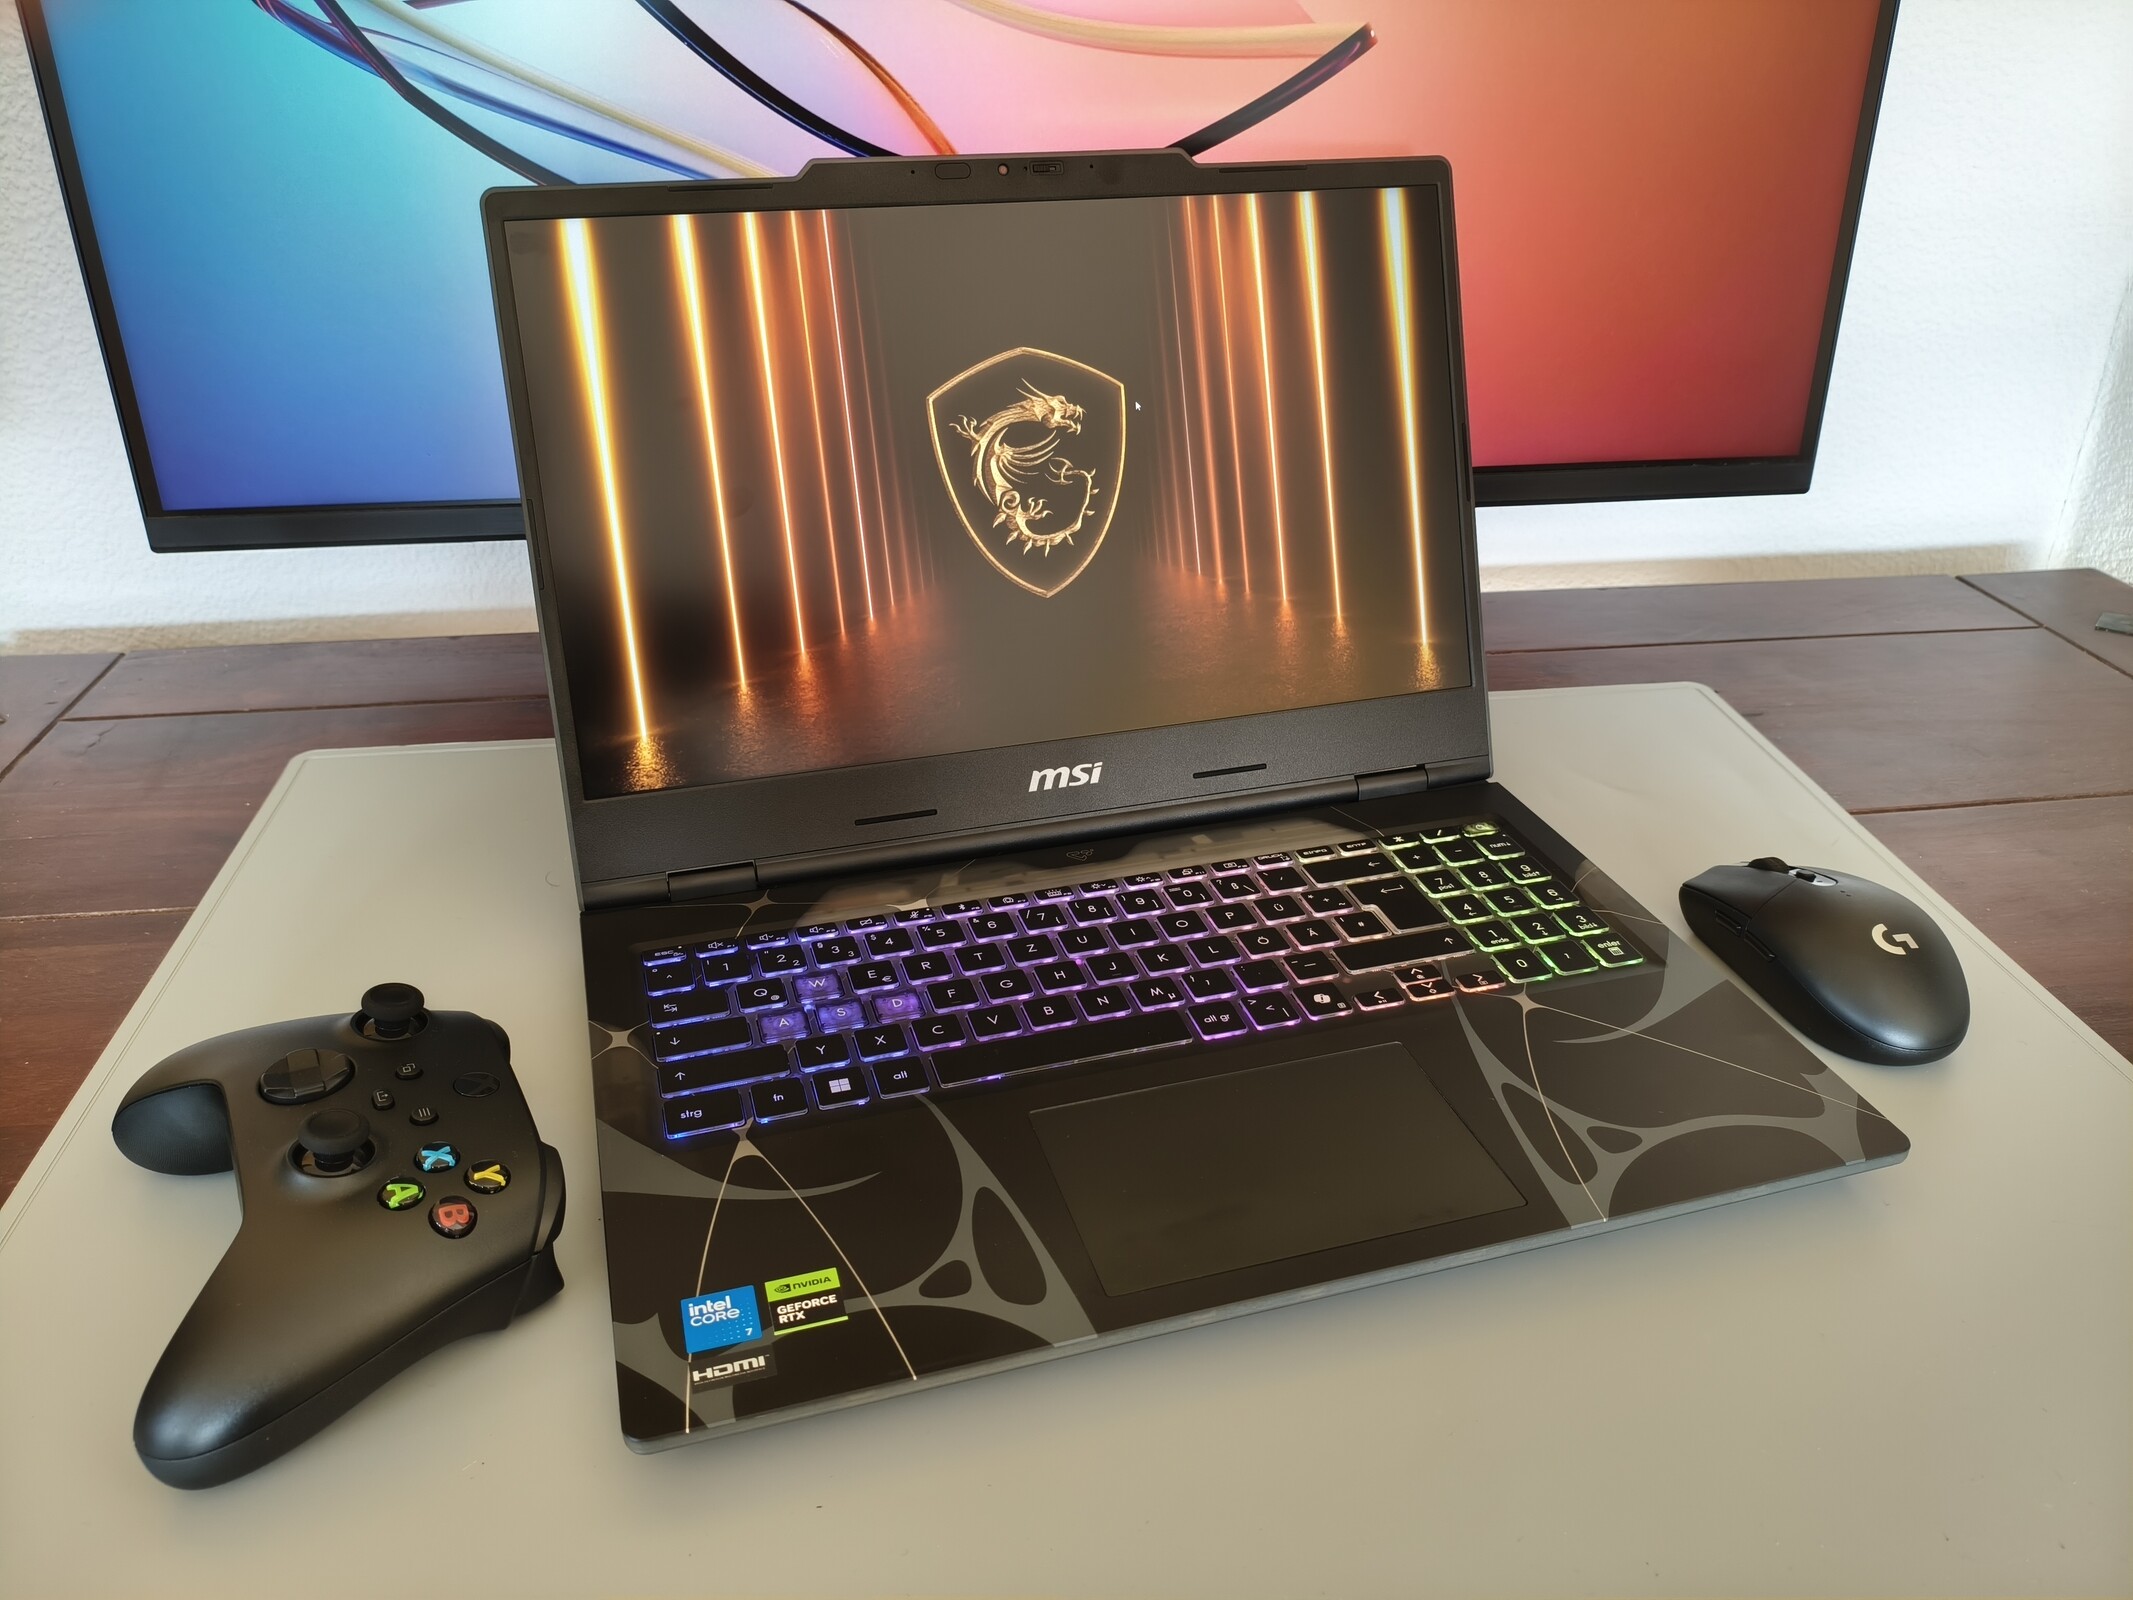
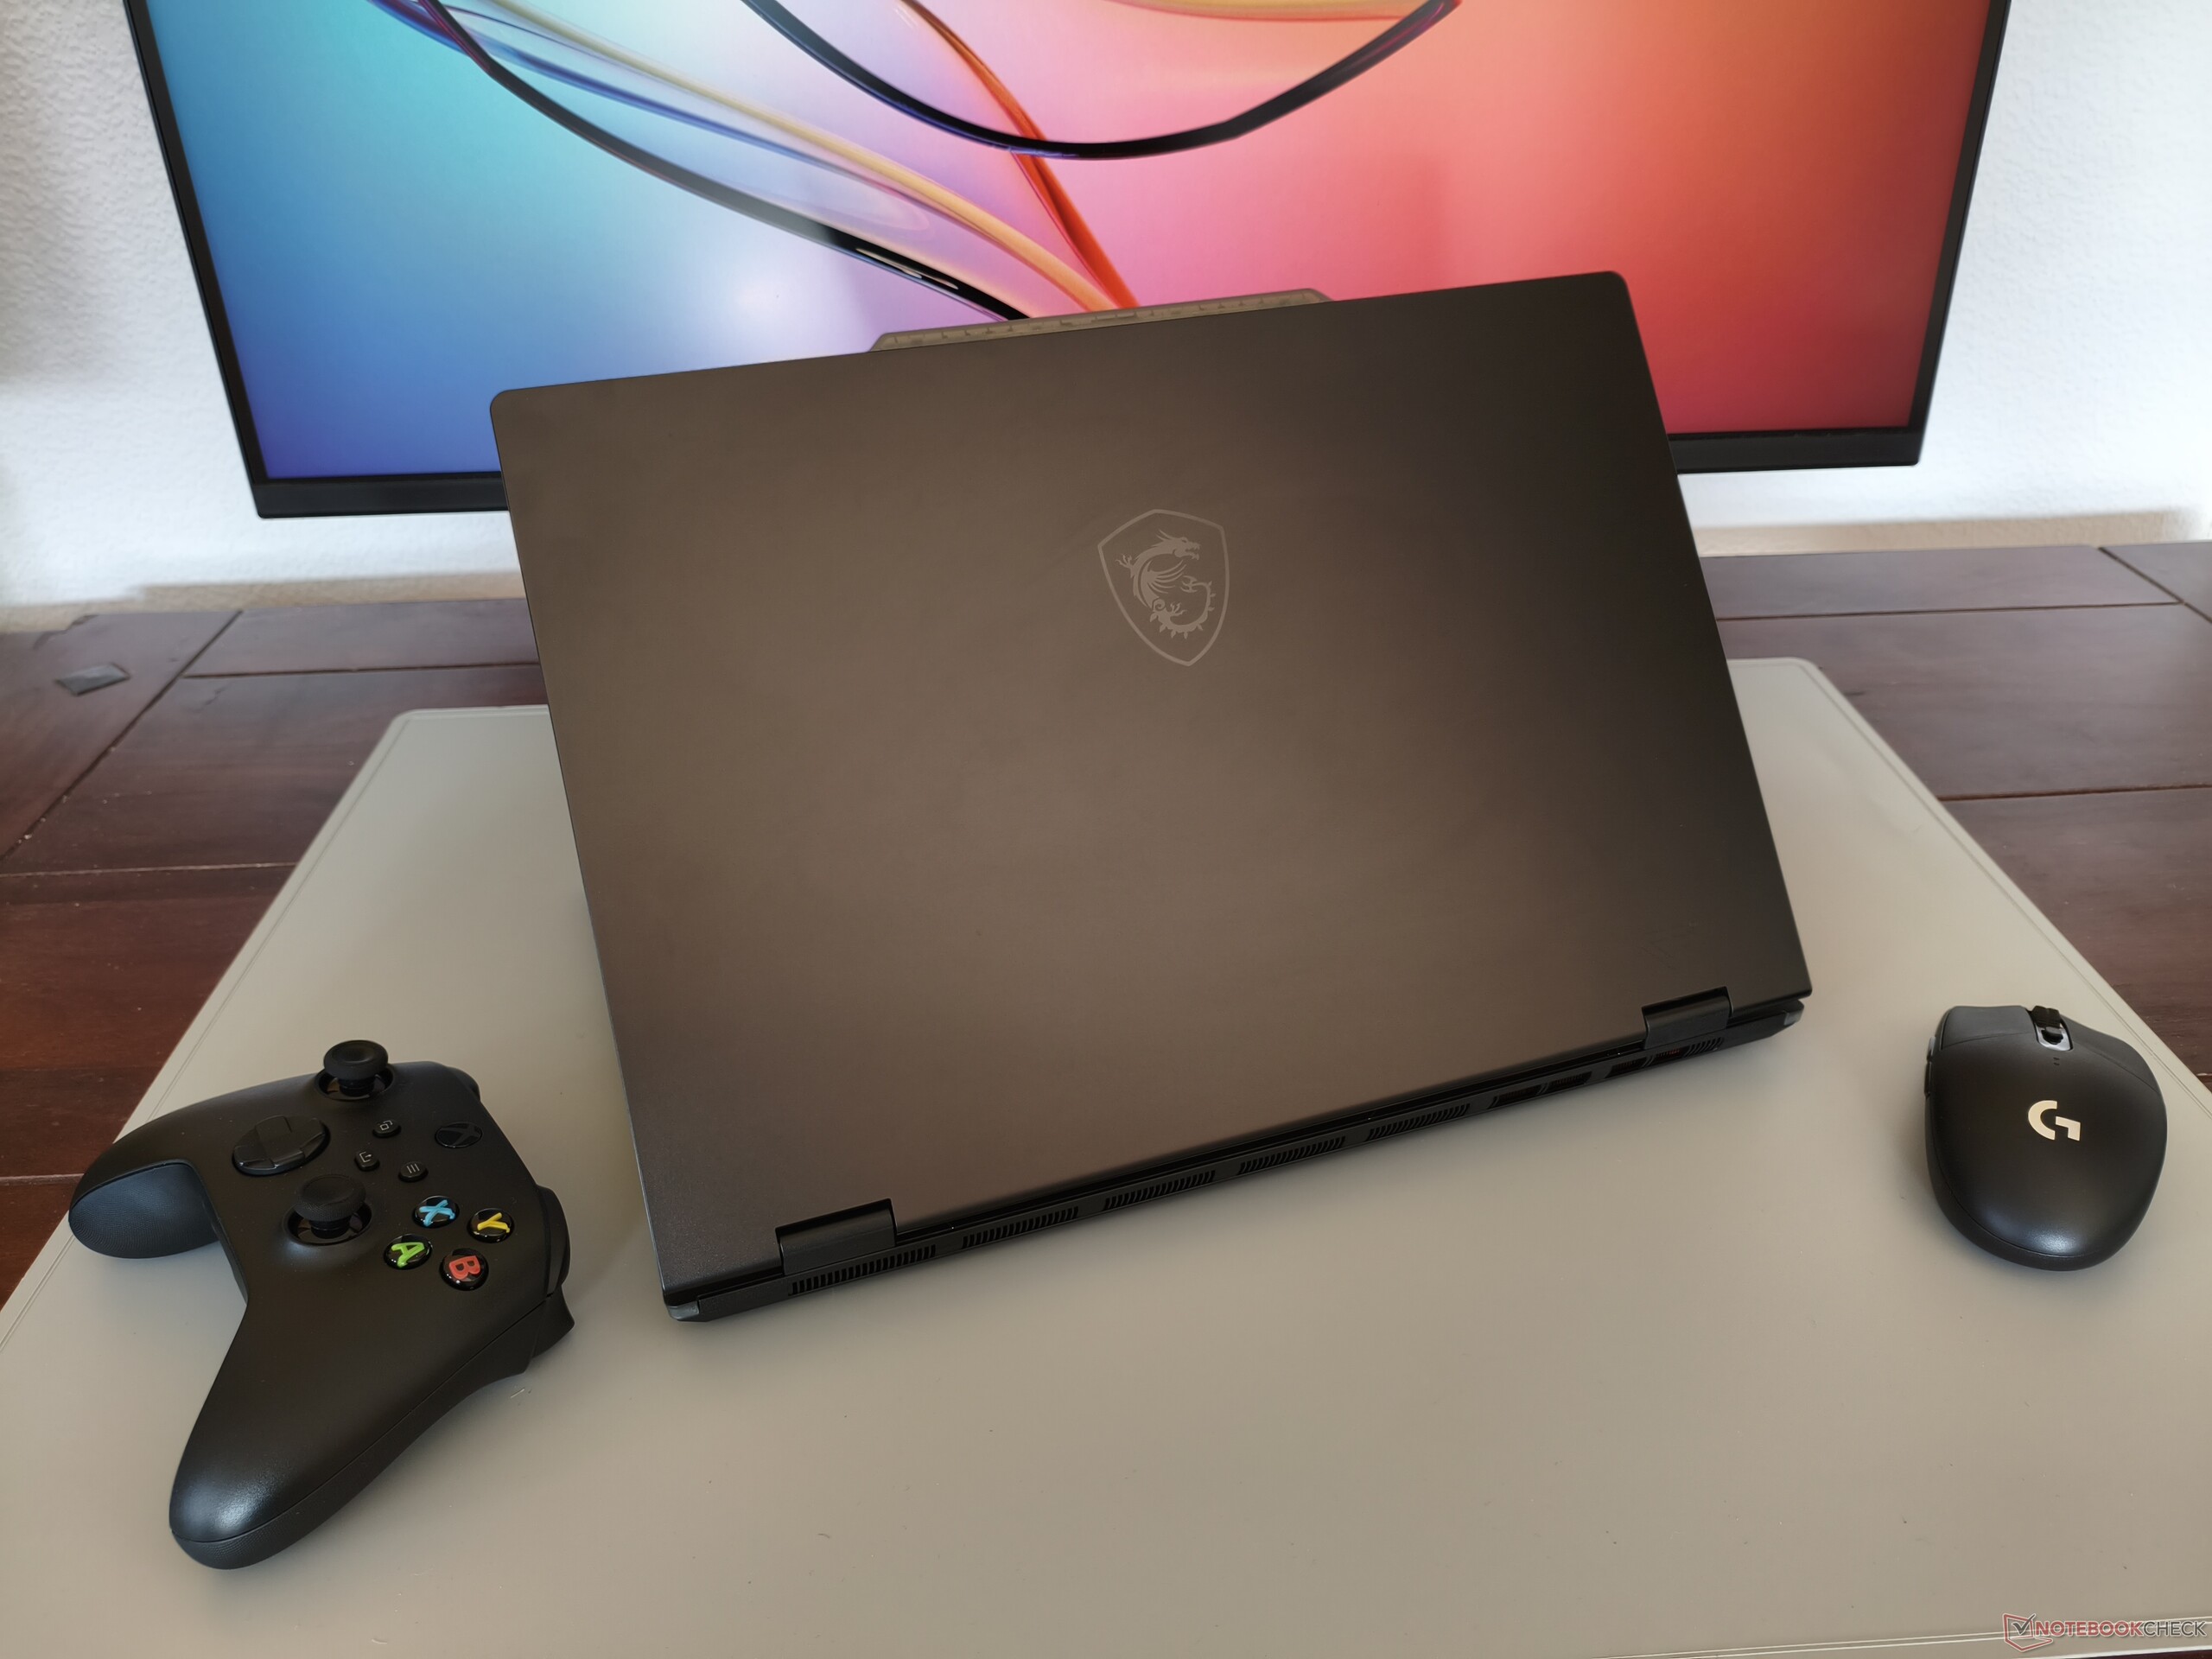
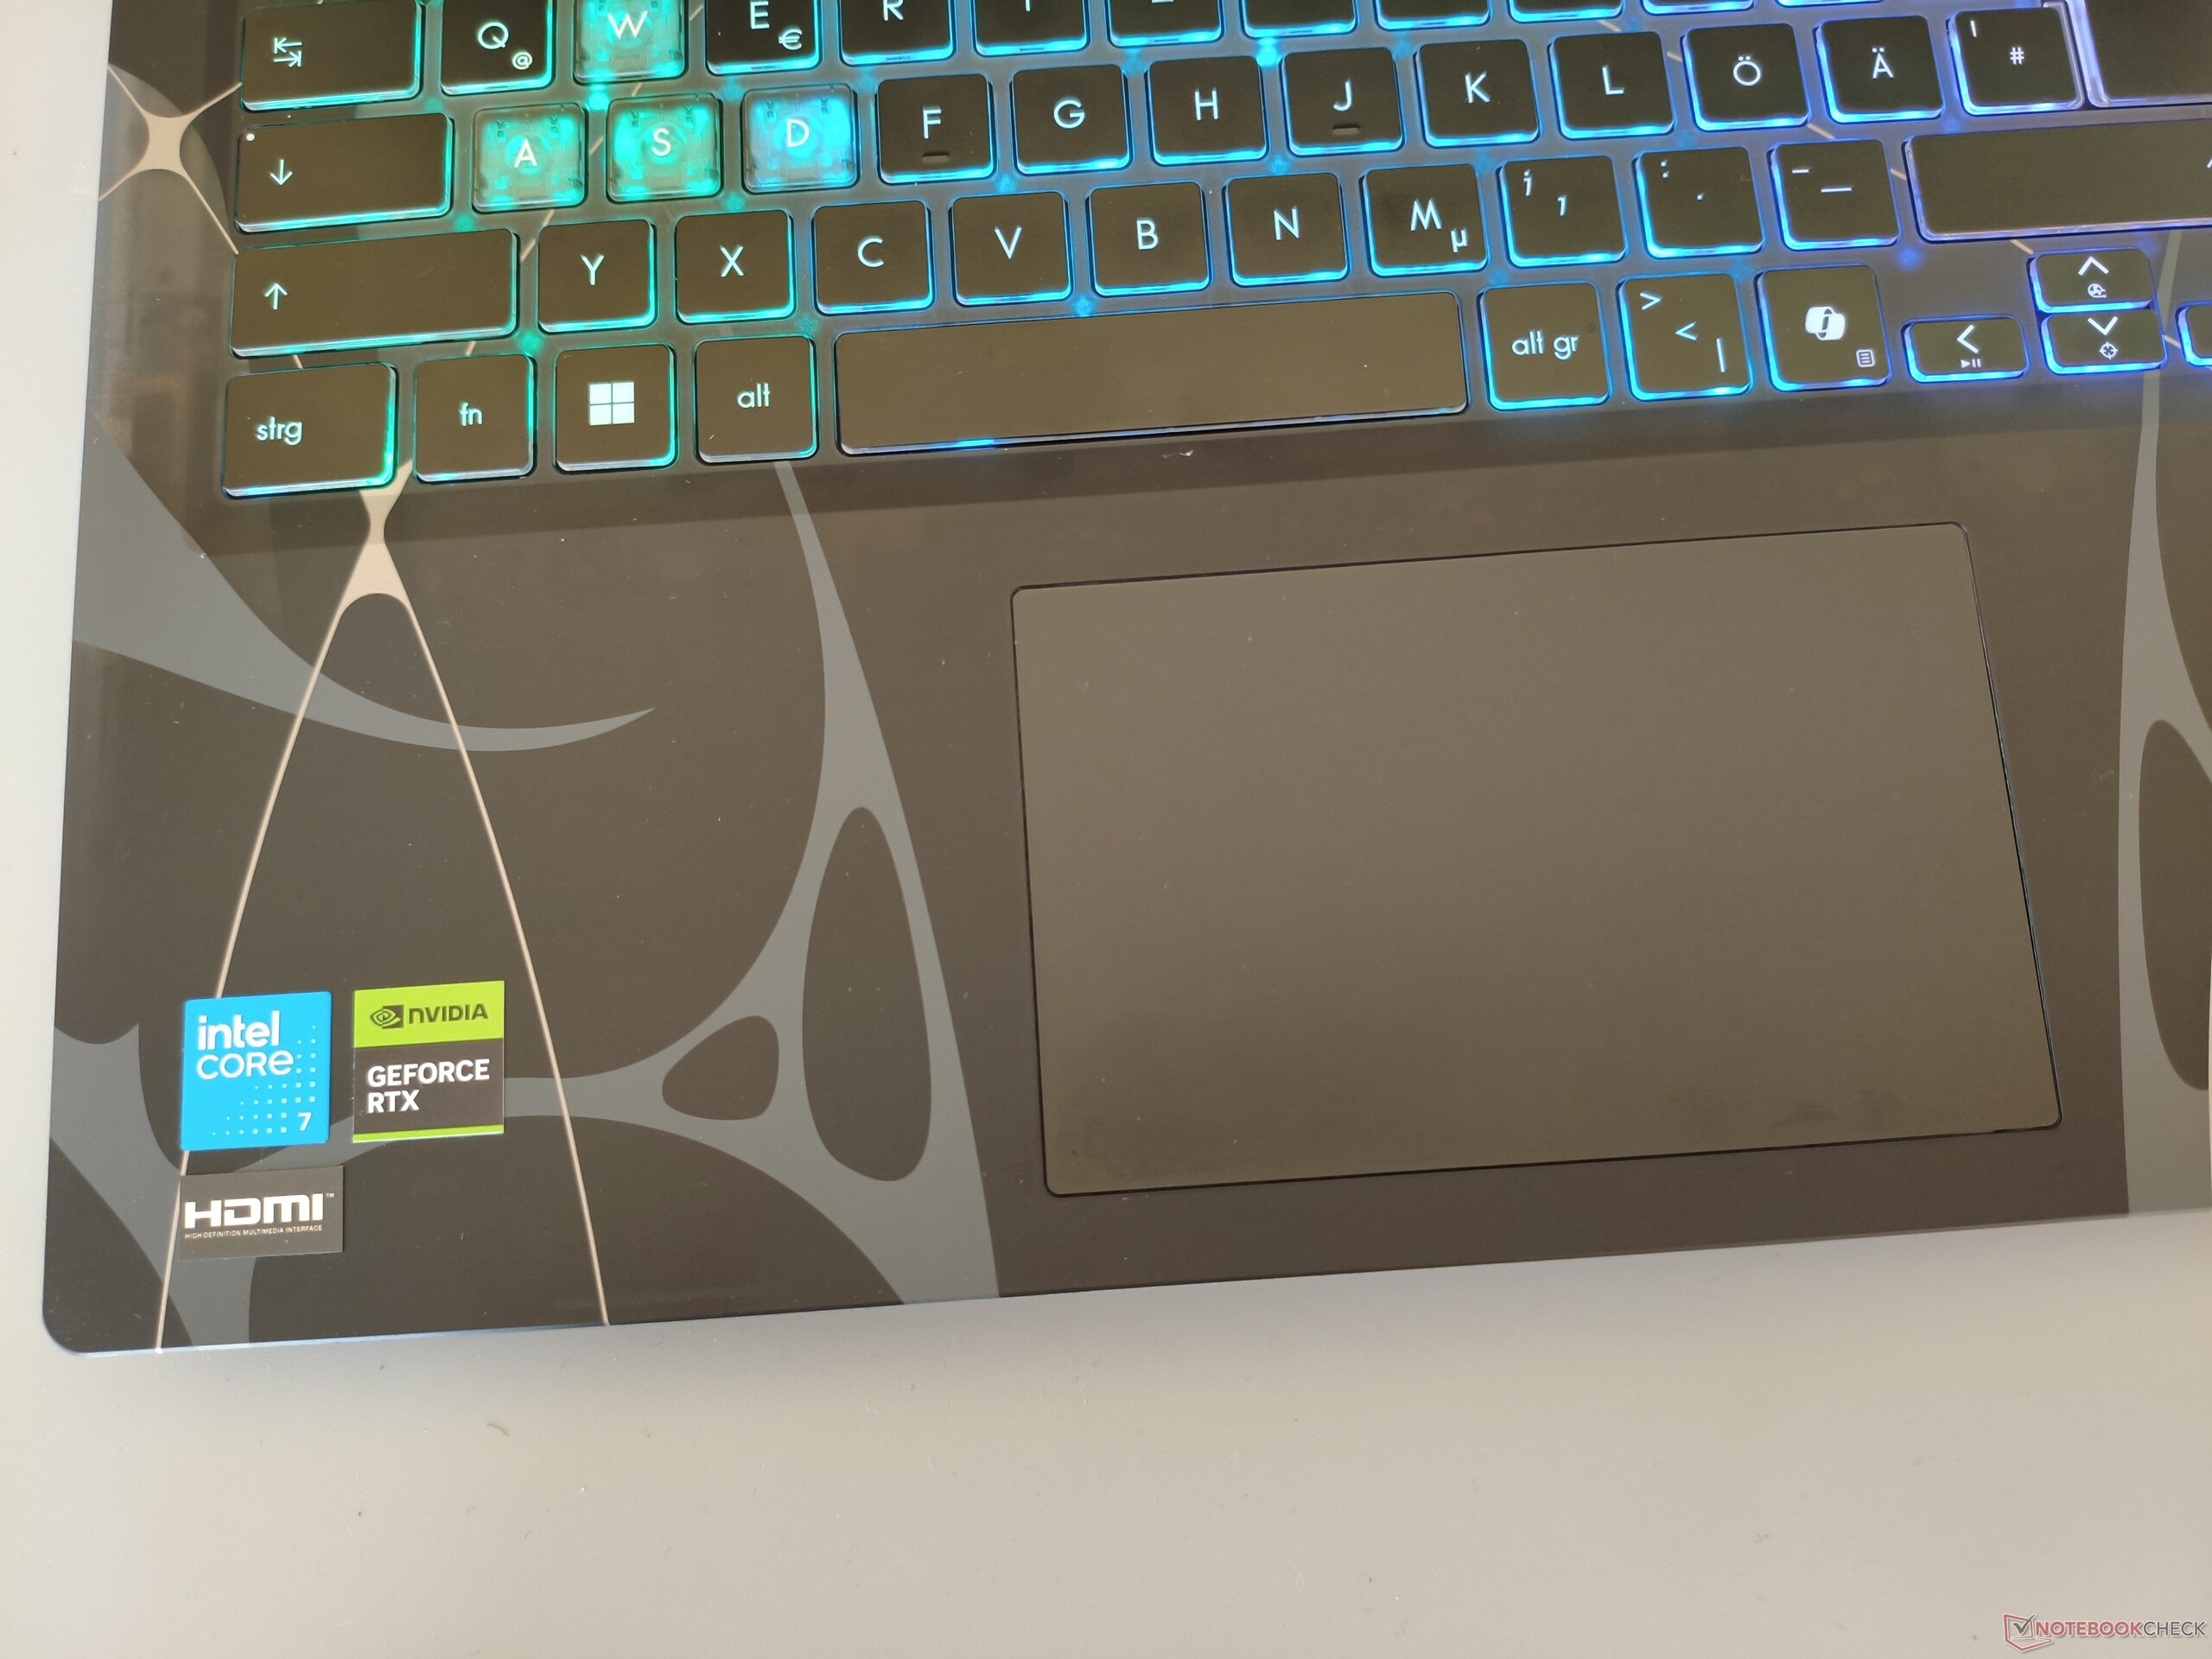
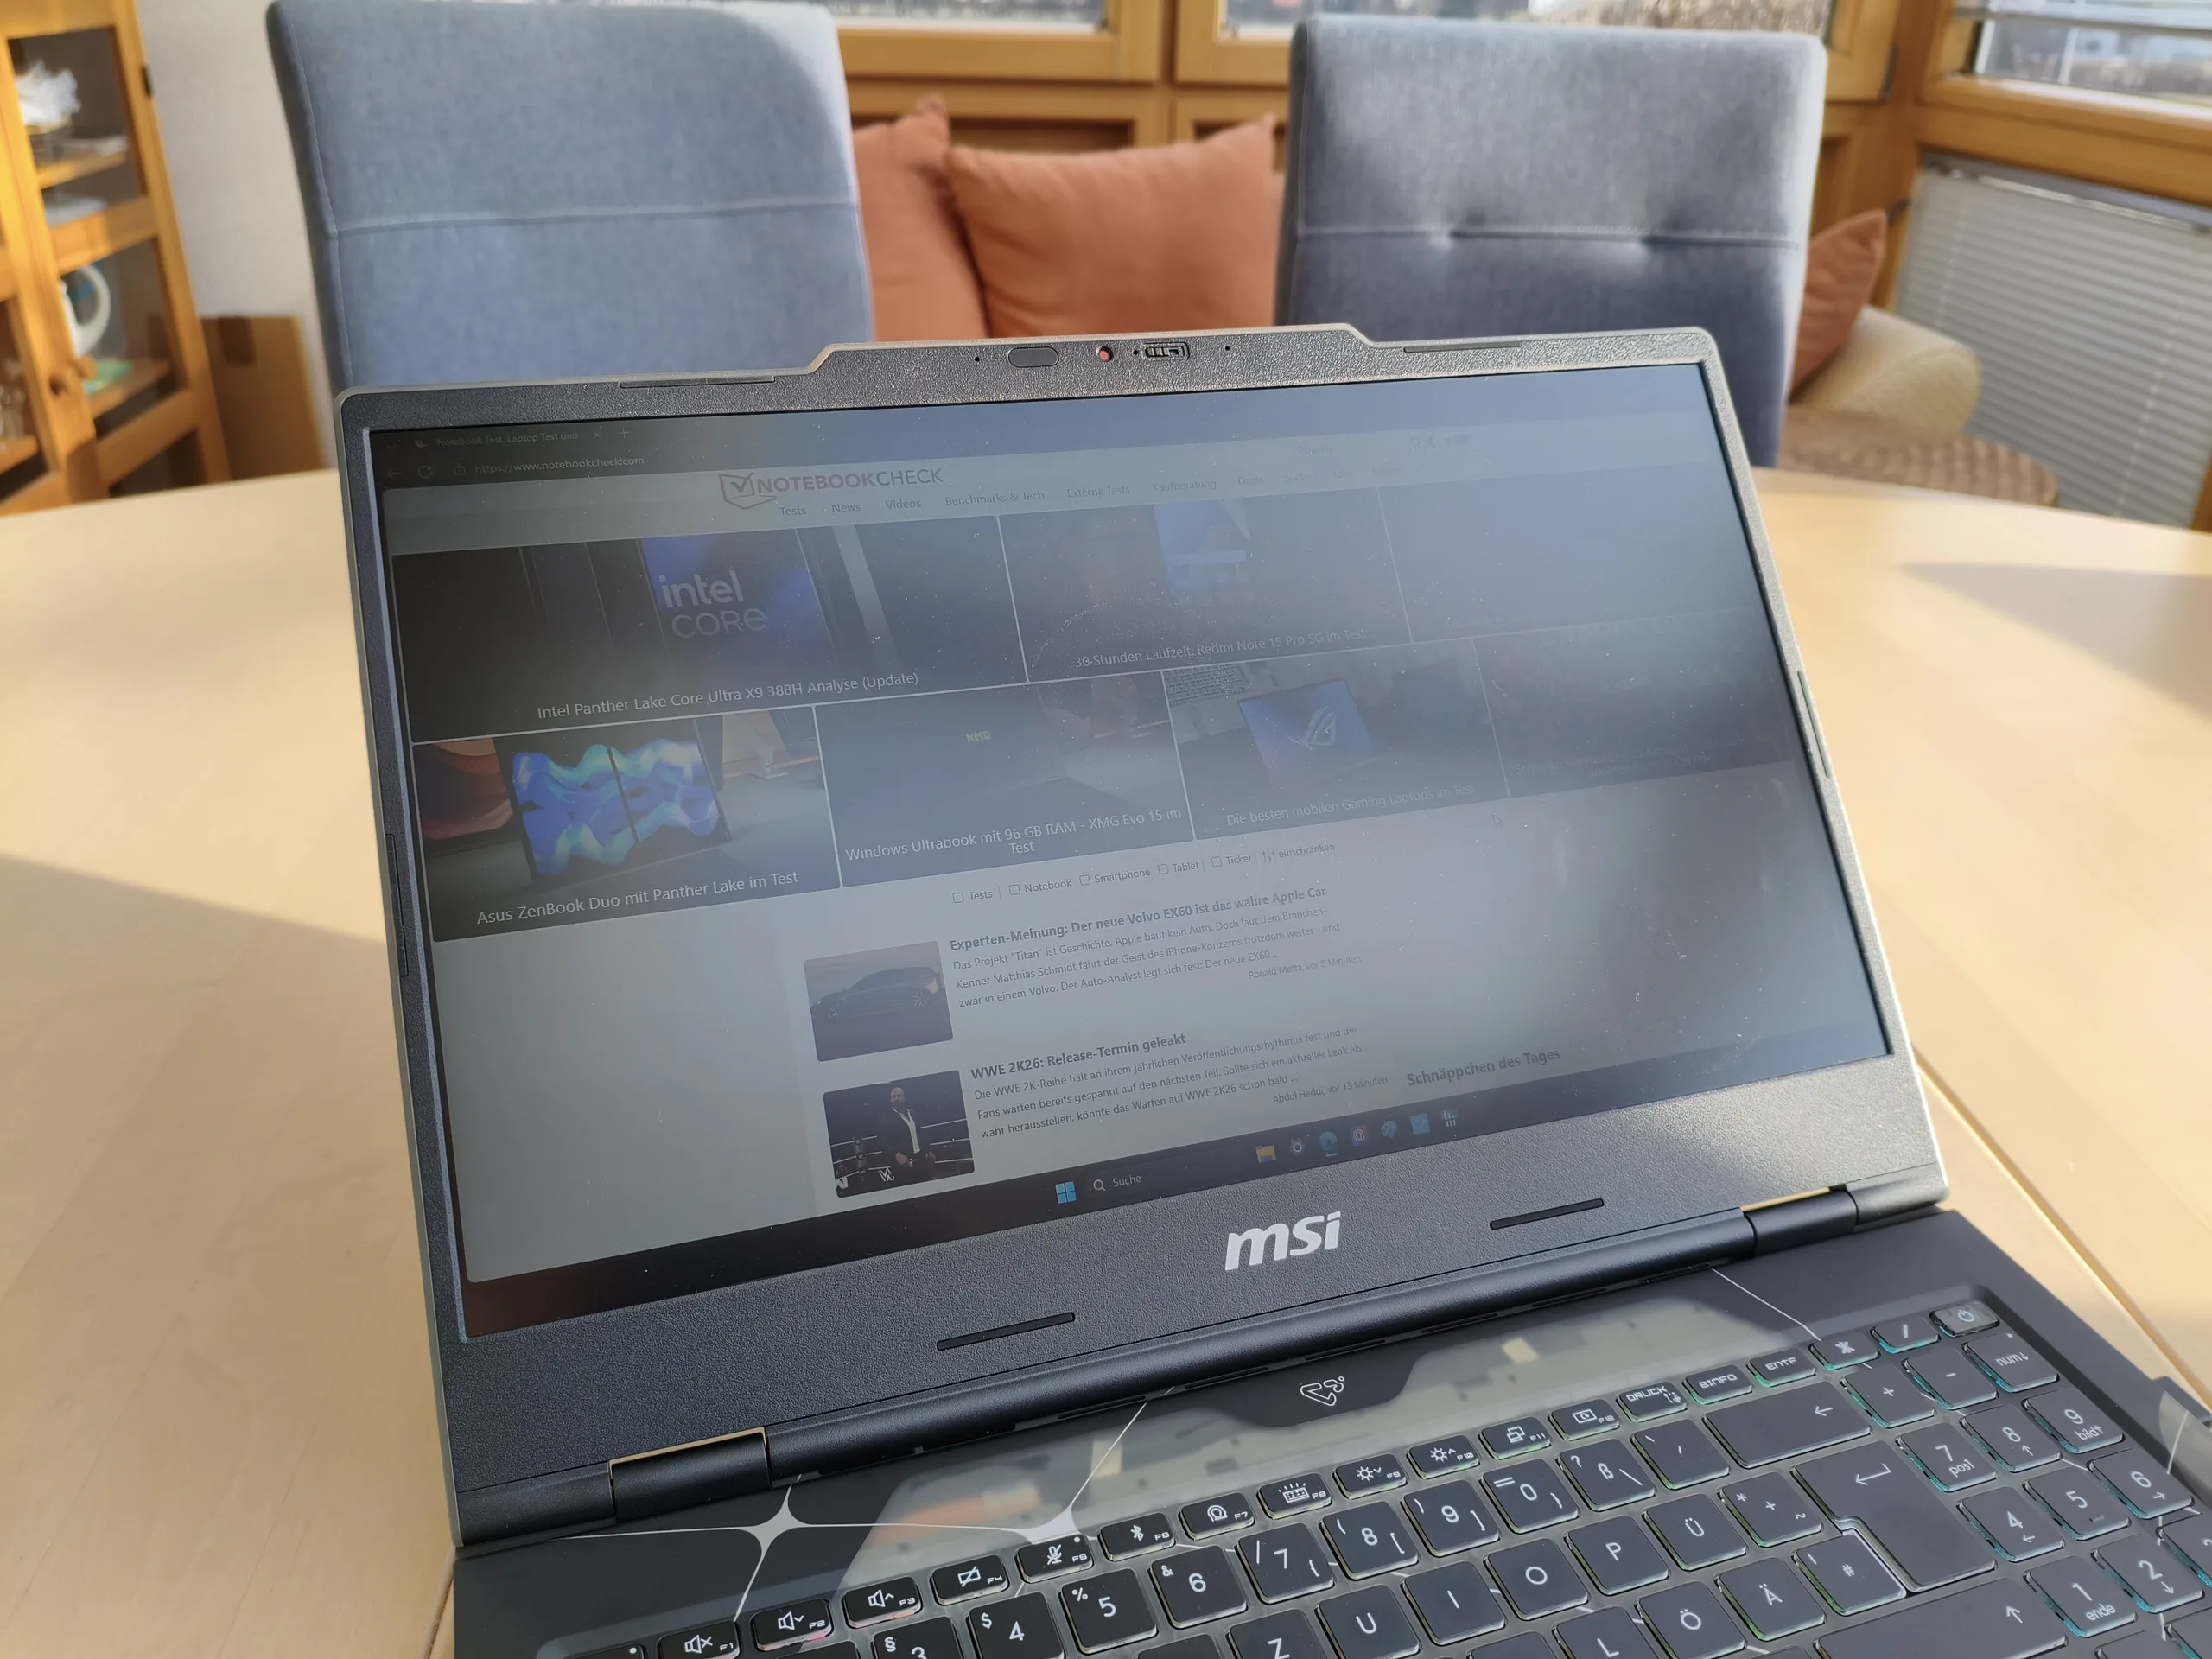
Si vous recherchez un ordinateur portable de jeu qui se démarque de la masse, le Cyborg 15 est le bon choix. Alors que le couvercle de l'écran est encore relativement peu spectaculaire, le dessus de l'unité de base est très frappant avec son motif et ses éléments transparents. À titre de comparaison : le 2023 testé testé avec RTX 4060 était plus discret. Malheureusement, l'écran n'a pratiquement pas changé. La nouvelle version doit se contenter d'un espace colorimétrique réduit, qui conviendrait mieux à un ordinateur portable de bureau d'une valeur de 400 euros (~472 $).
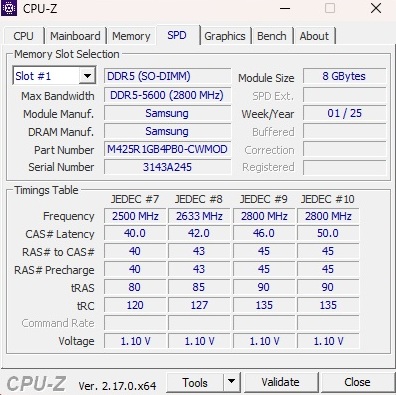
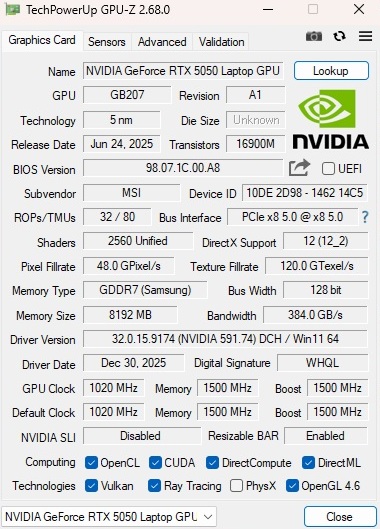
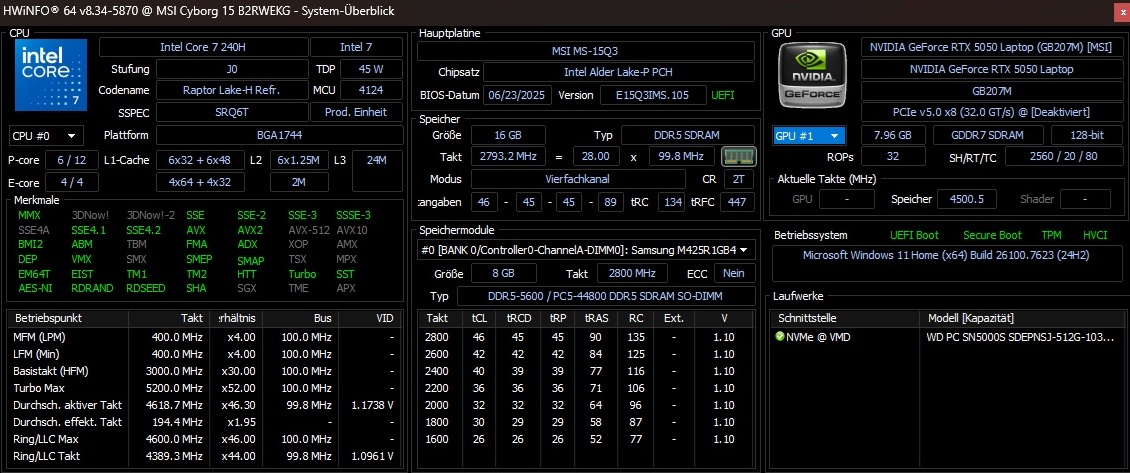
La puissance de la carte graphique mérite également d'être discutée : MSI n'accordant à la RTX 5050 qu'un maigre TGP de 45 watts, les performances du GPU ne sont pas à la hauteur de son potentiel, comme nous le montrerons au fil de l'article, bien que le développement du bruit soit limité. Le reste de l'équipement est solide, mais pas somptueux pour le prix, avec un Core 7 240H, 16 Go de RAM DDR5 (2x 8 Go) et un SSD de 512 Go. Le Cyborg 15 est également équipé d'une webcam avec volet de confidentialité, ce qui n'est pas une évidence pour les ordinateurs portables de jeu en particulier.
Les concurrents du Cyborg 15 comprennent d'autres ordinateurs portables RTX 5050 et RTX 5060 tels que le Acer Nitro V 15l'Acer Nitro V 15 HP Victus 15 et le Lenovo LOQ 15qui se situent tous dans des zones de classement similaires. Si vous êtes prêt à dépenser un peu plus d'argent, vous devriez lire le test du Lenovo Legion 5 15qui a presque reçu une très bonne note.
Points positifs
Points négatifs
Prix et disponibilité
Le MSI Cyborg 15 B2RWEKG testé est disponible à partir d'environ 1 100 euros (~1298 $) sur différents sites de vente en ligne (par exemple Galaxus).
- msi Cyborg 15 B2RWEKG-257US 15.6" Full HD 144Hz Gaming Laptop, Intel Core 7 240H 2.5GHz, 32GB RAM, 1TB SSD, NVIDIA GeForce RTX 5050 8GB, Windows 11 Home, Translucent Black
- msi Cyborg 15 B2RW Cyborg 15 B2RWFKG-421US 15.6" Gaming Notebook - Full HD - 144 Hz - Intel Core 7 240H - 32 GB - 1 TB SSD - Translucent Black
- MSI Cyborg 15 B2RWEKG-258US 15.6" Full HD 144Hz Gaming Laptop, Intel Core 5 210H 2.2GHz, 16GB RAM, 1TB SSD, NVIDIA GeForce RTX 5050 8GB, Windows 11 Home, Translucent Black
Spécifications
Logement
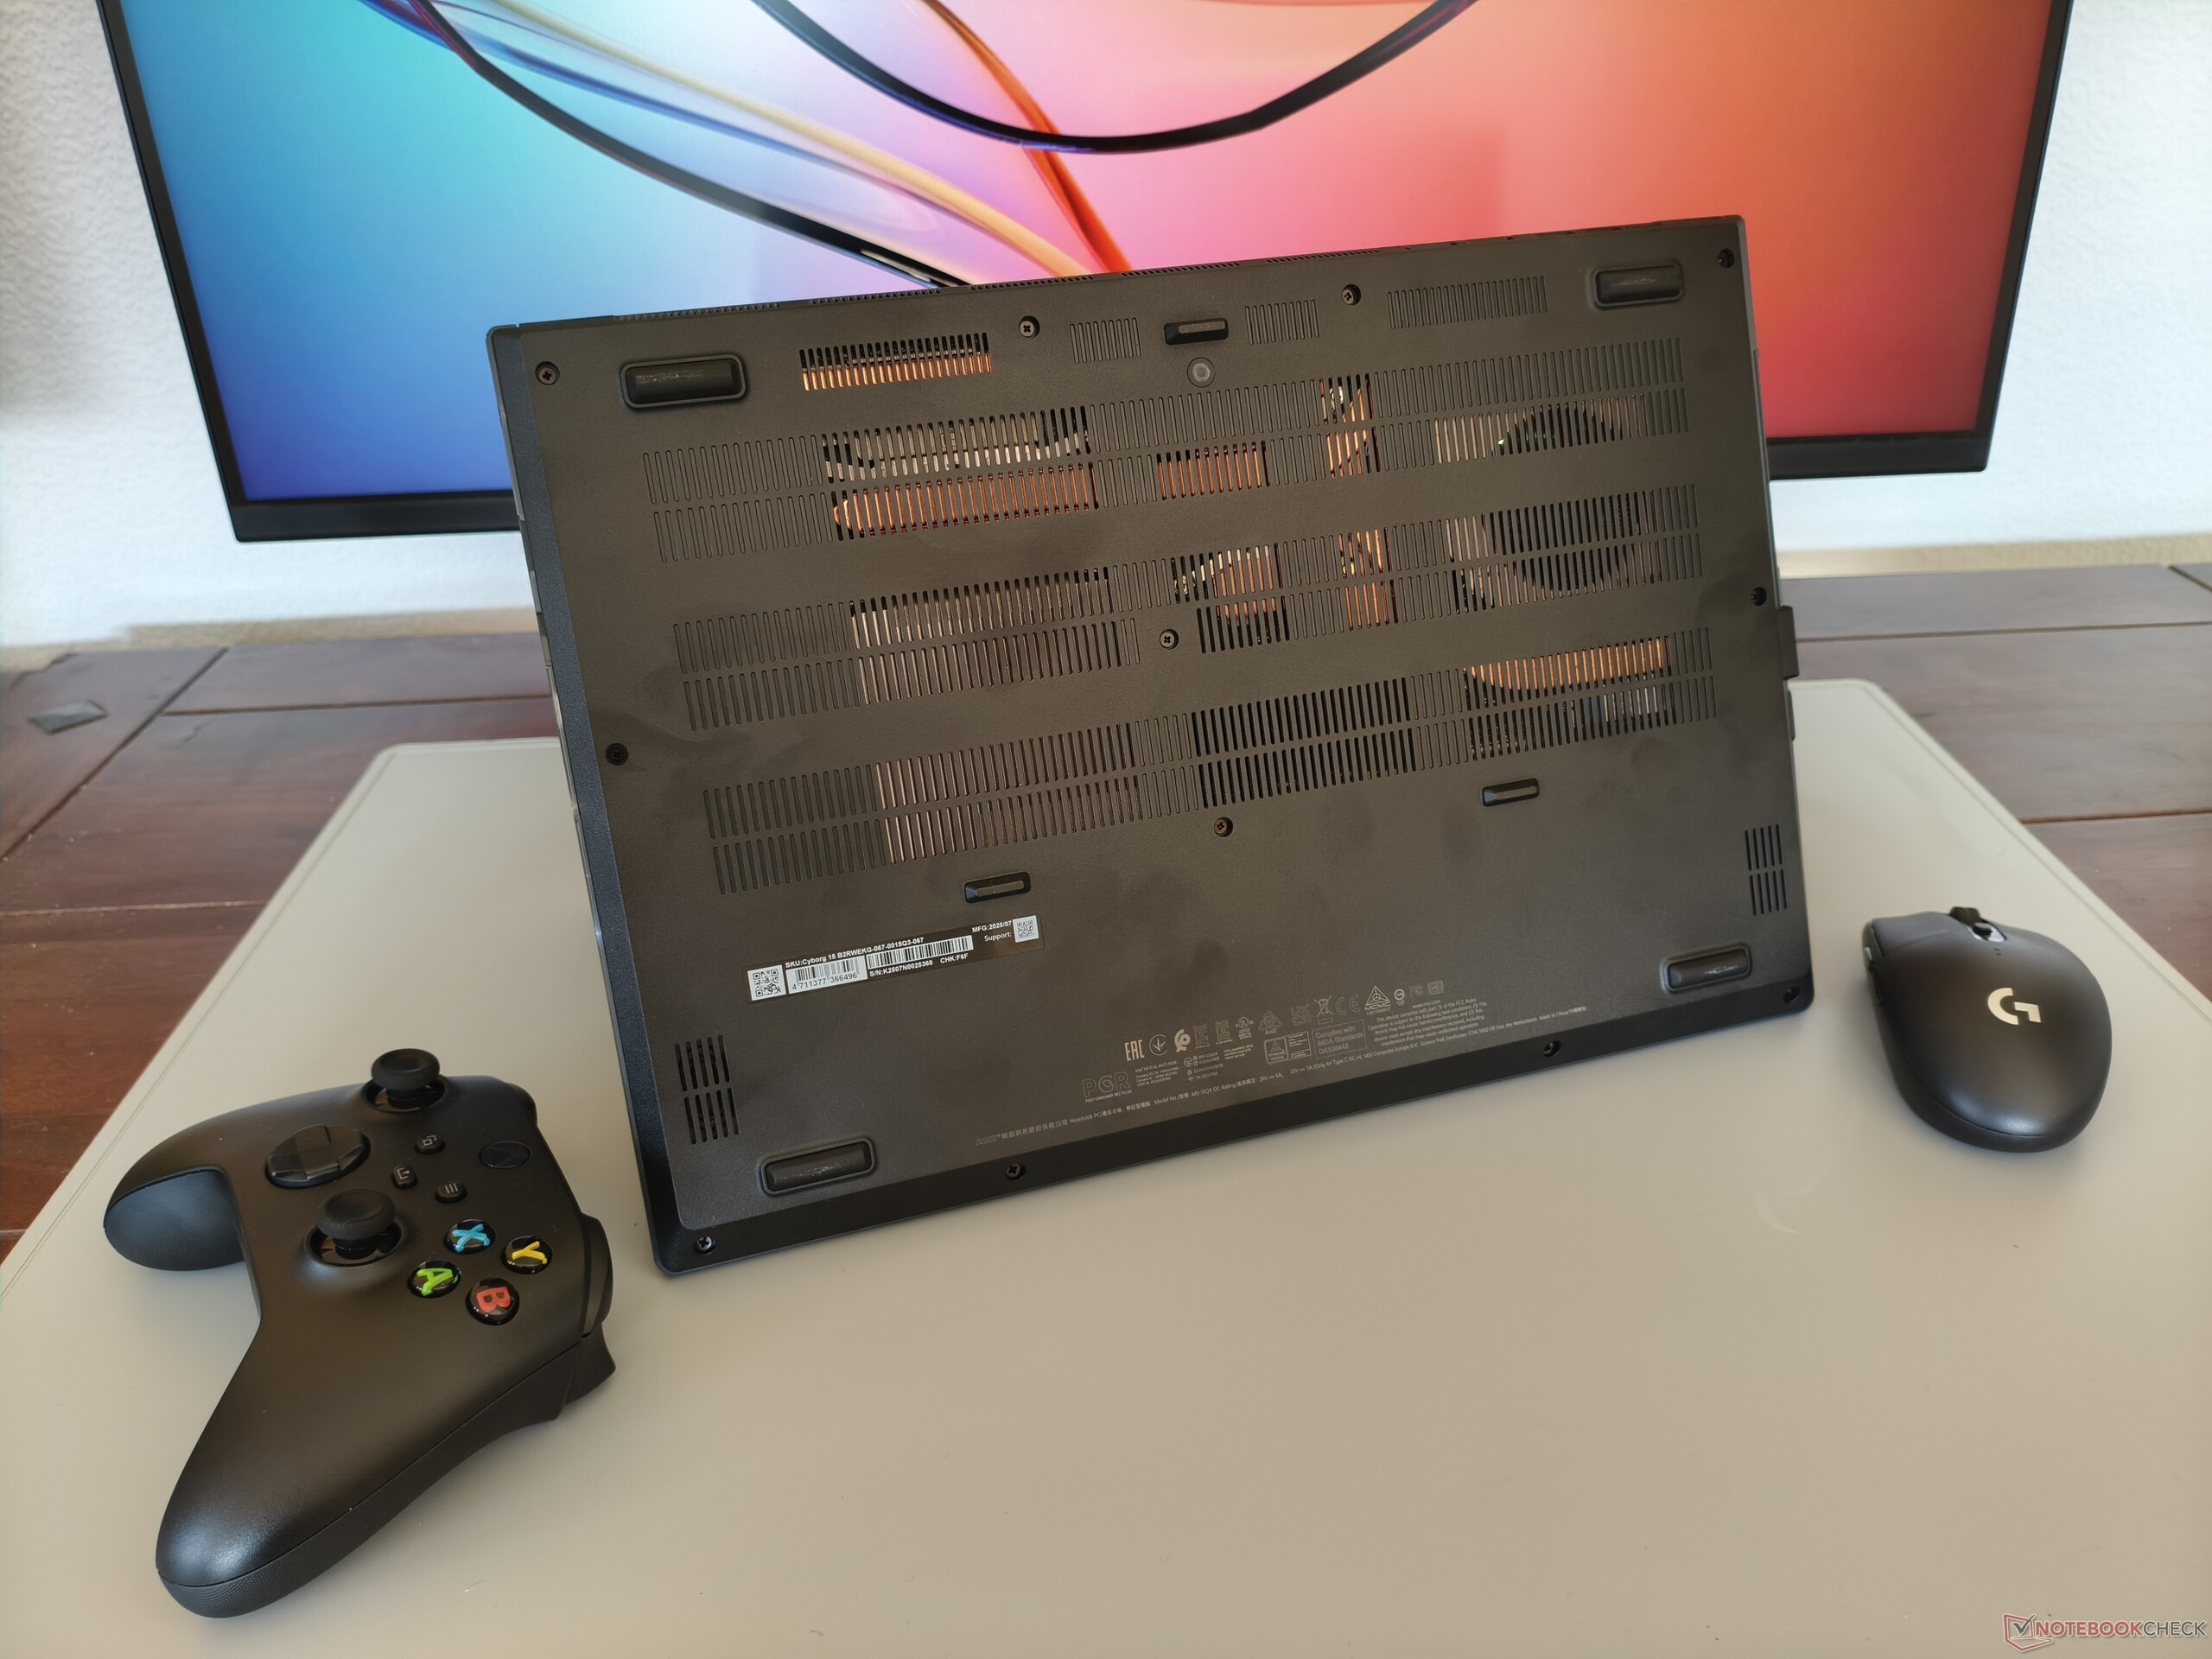
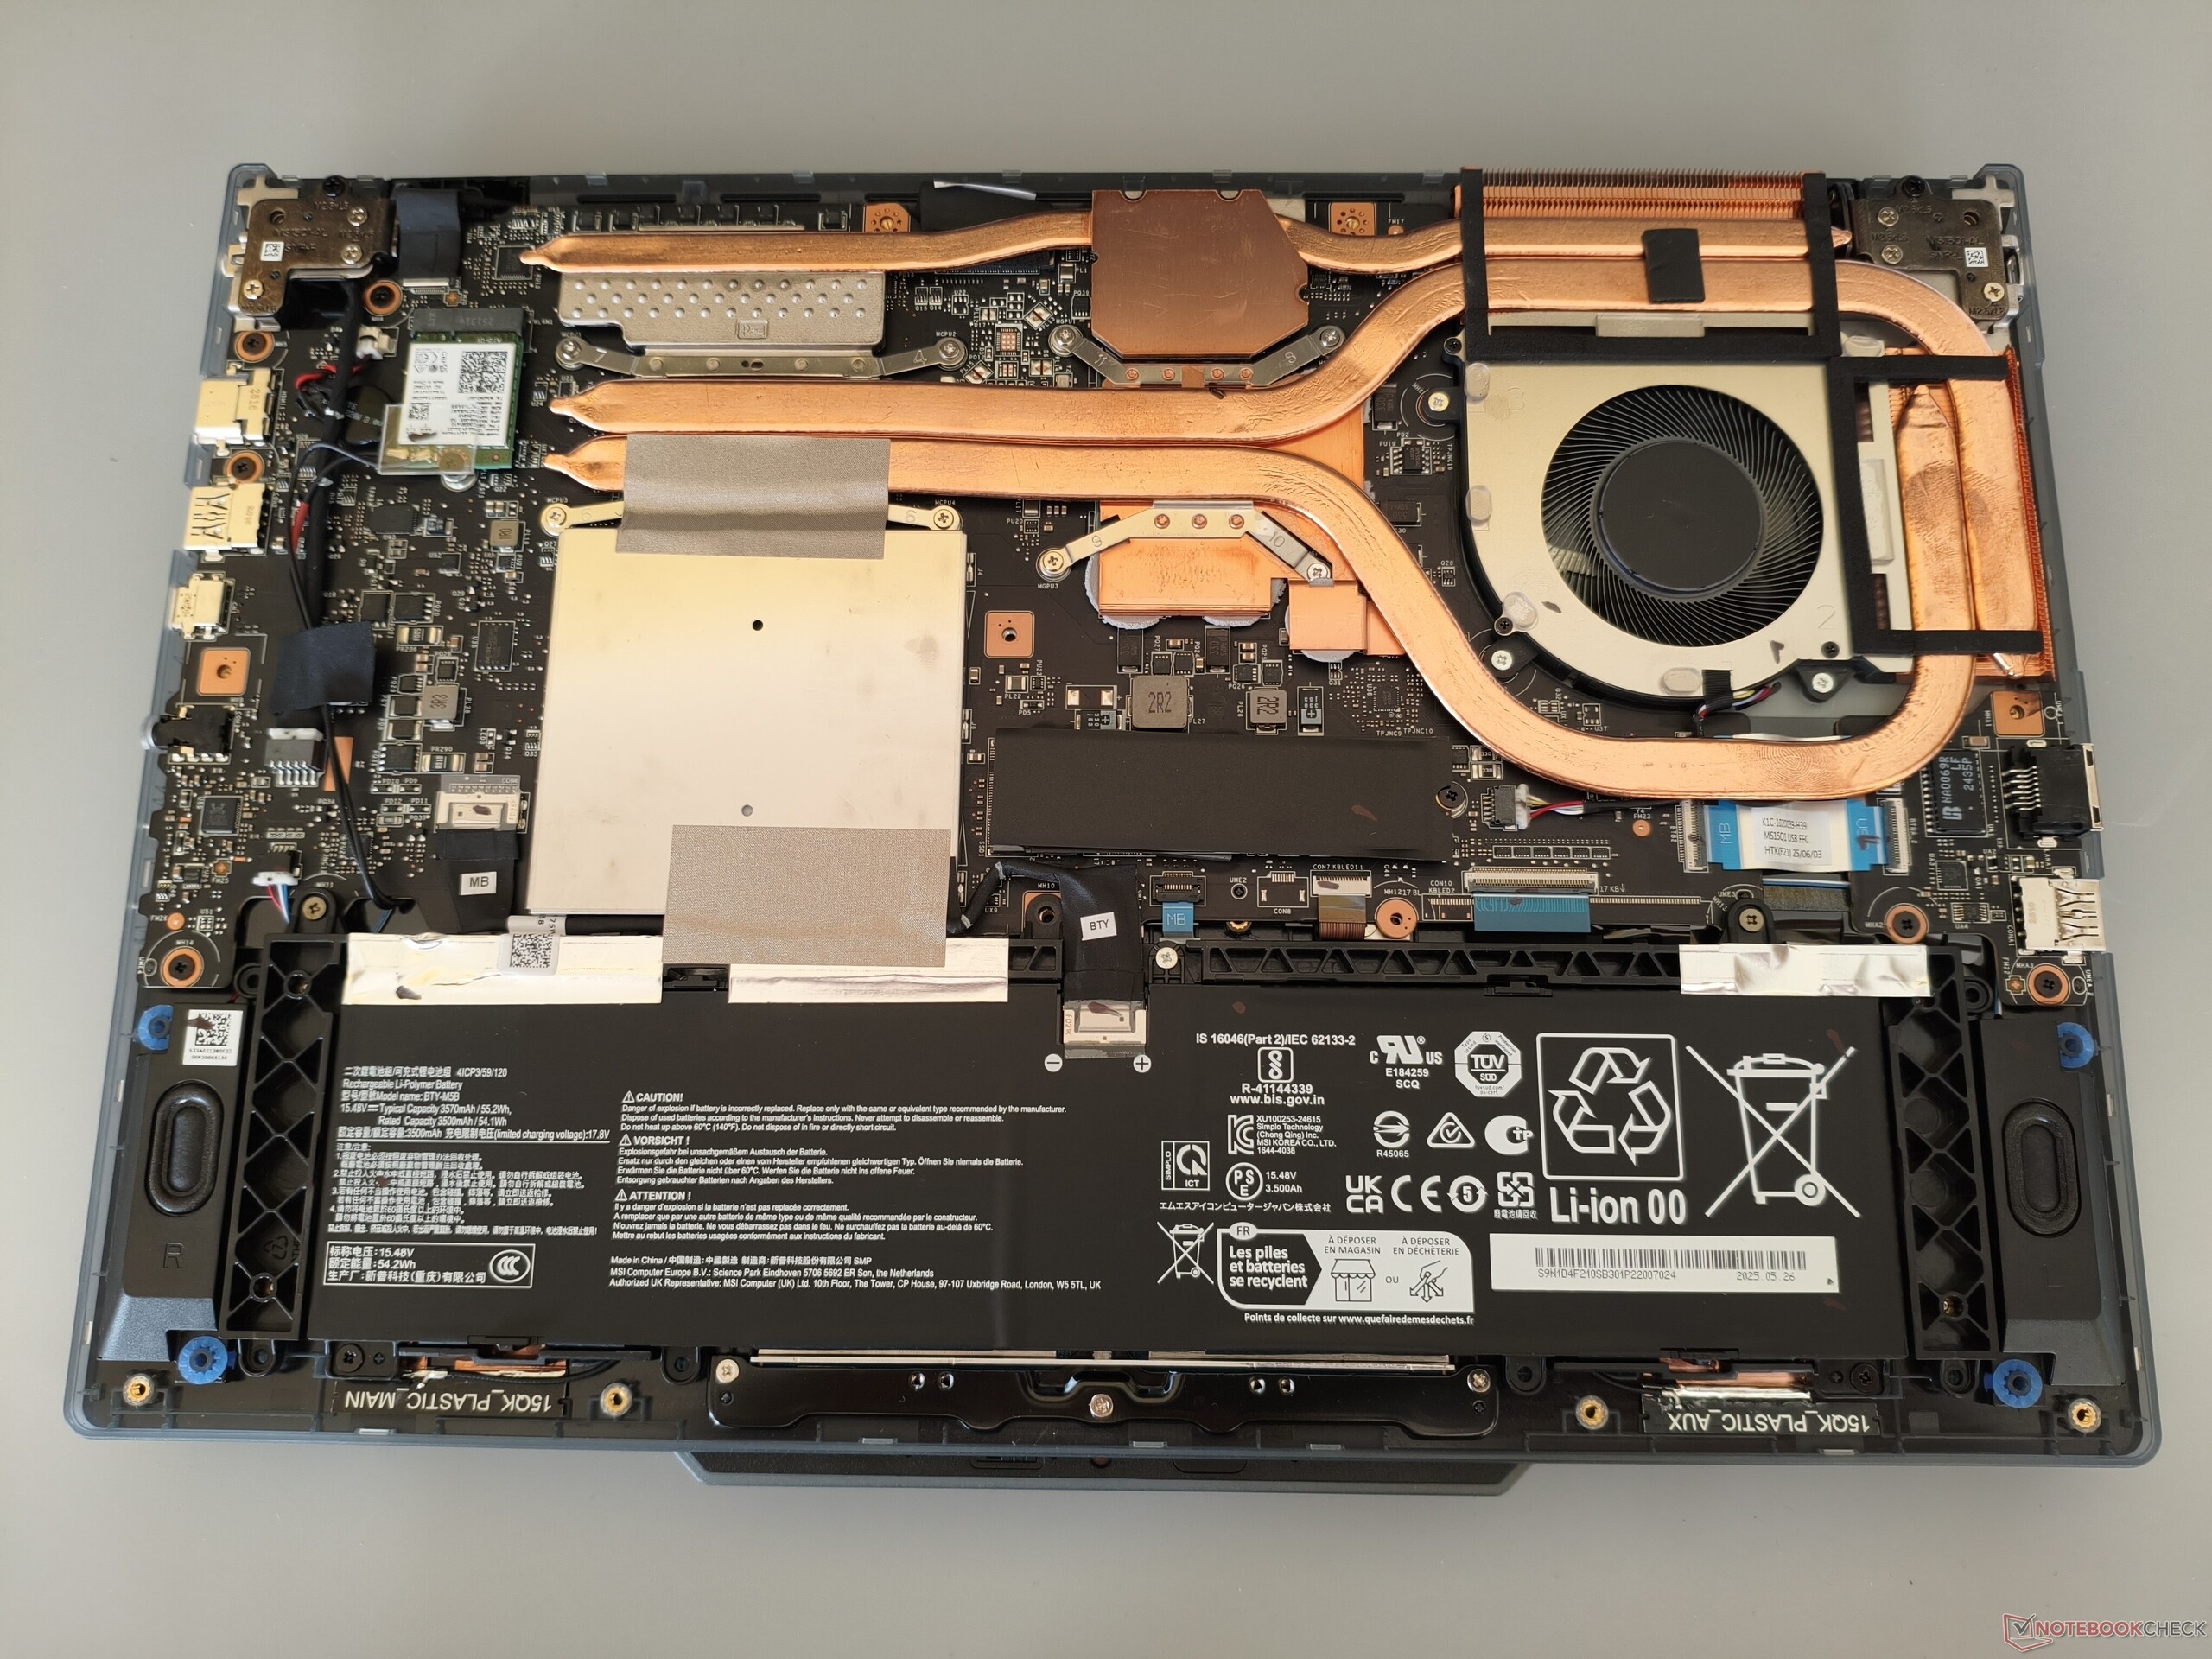
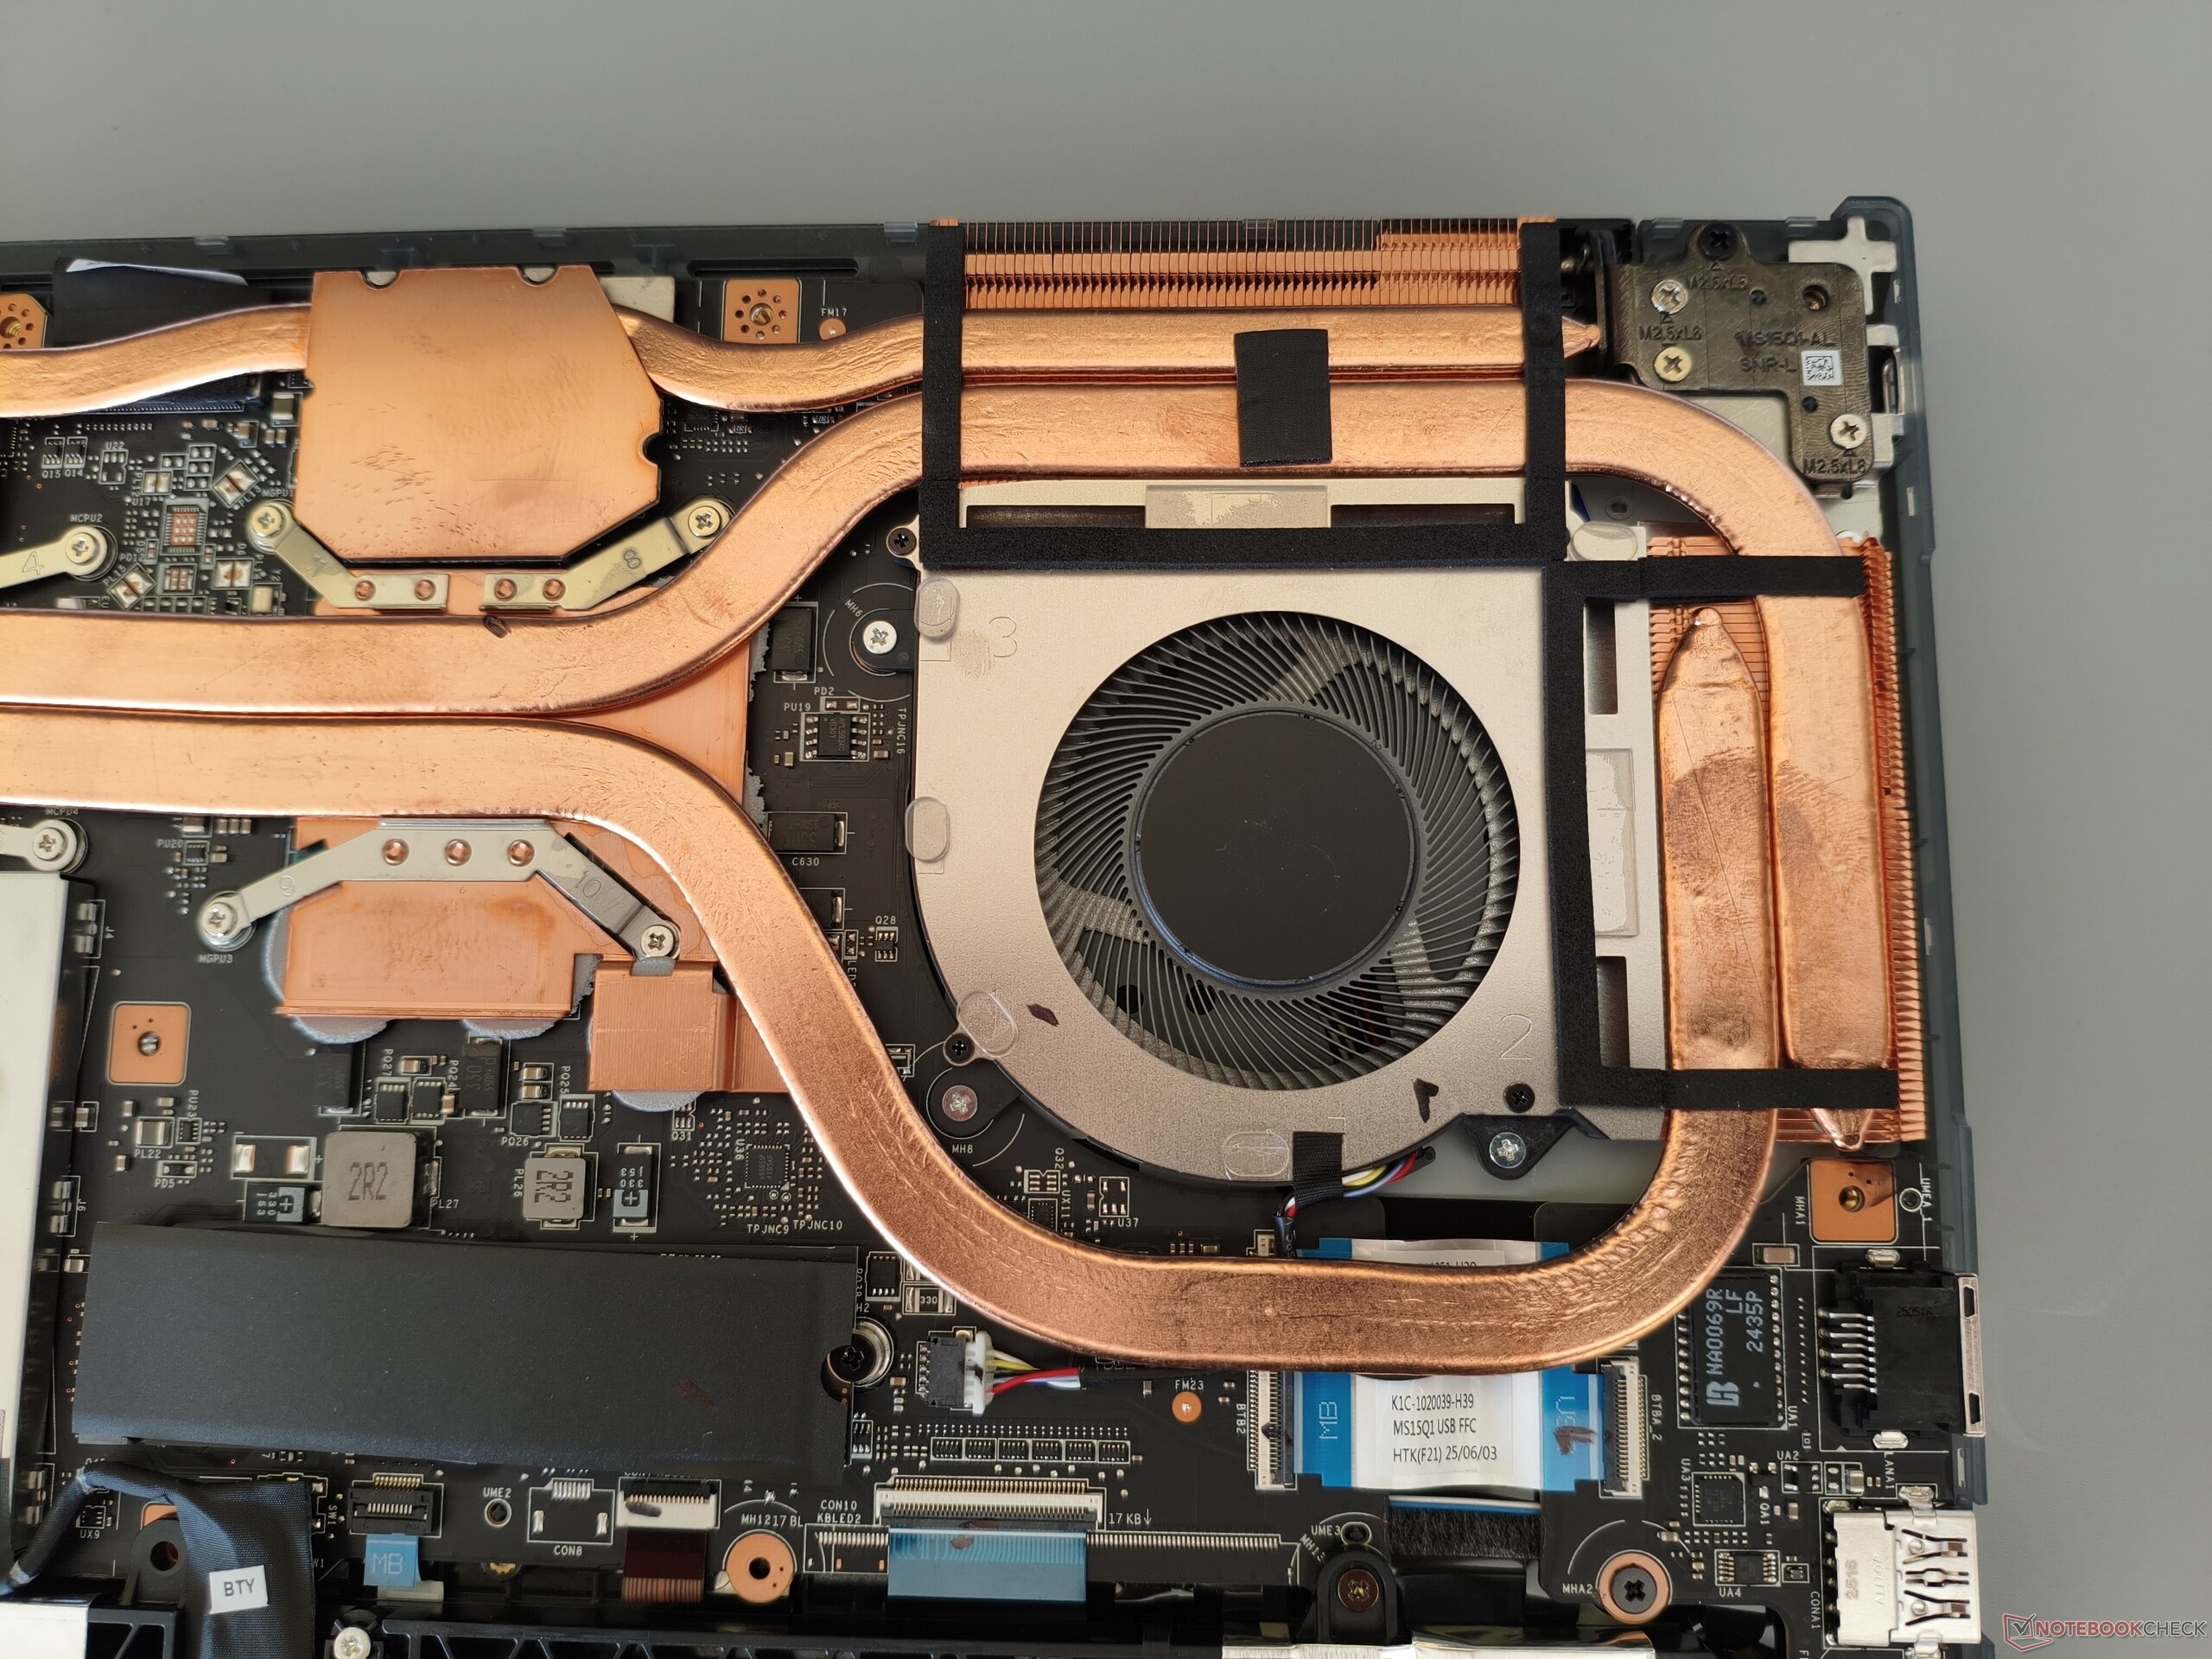
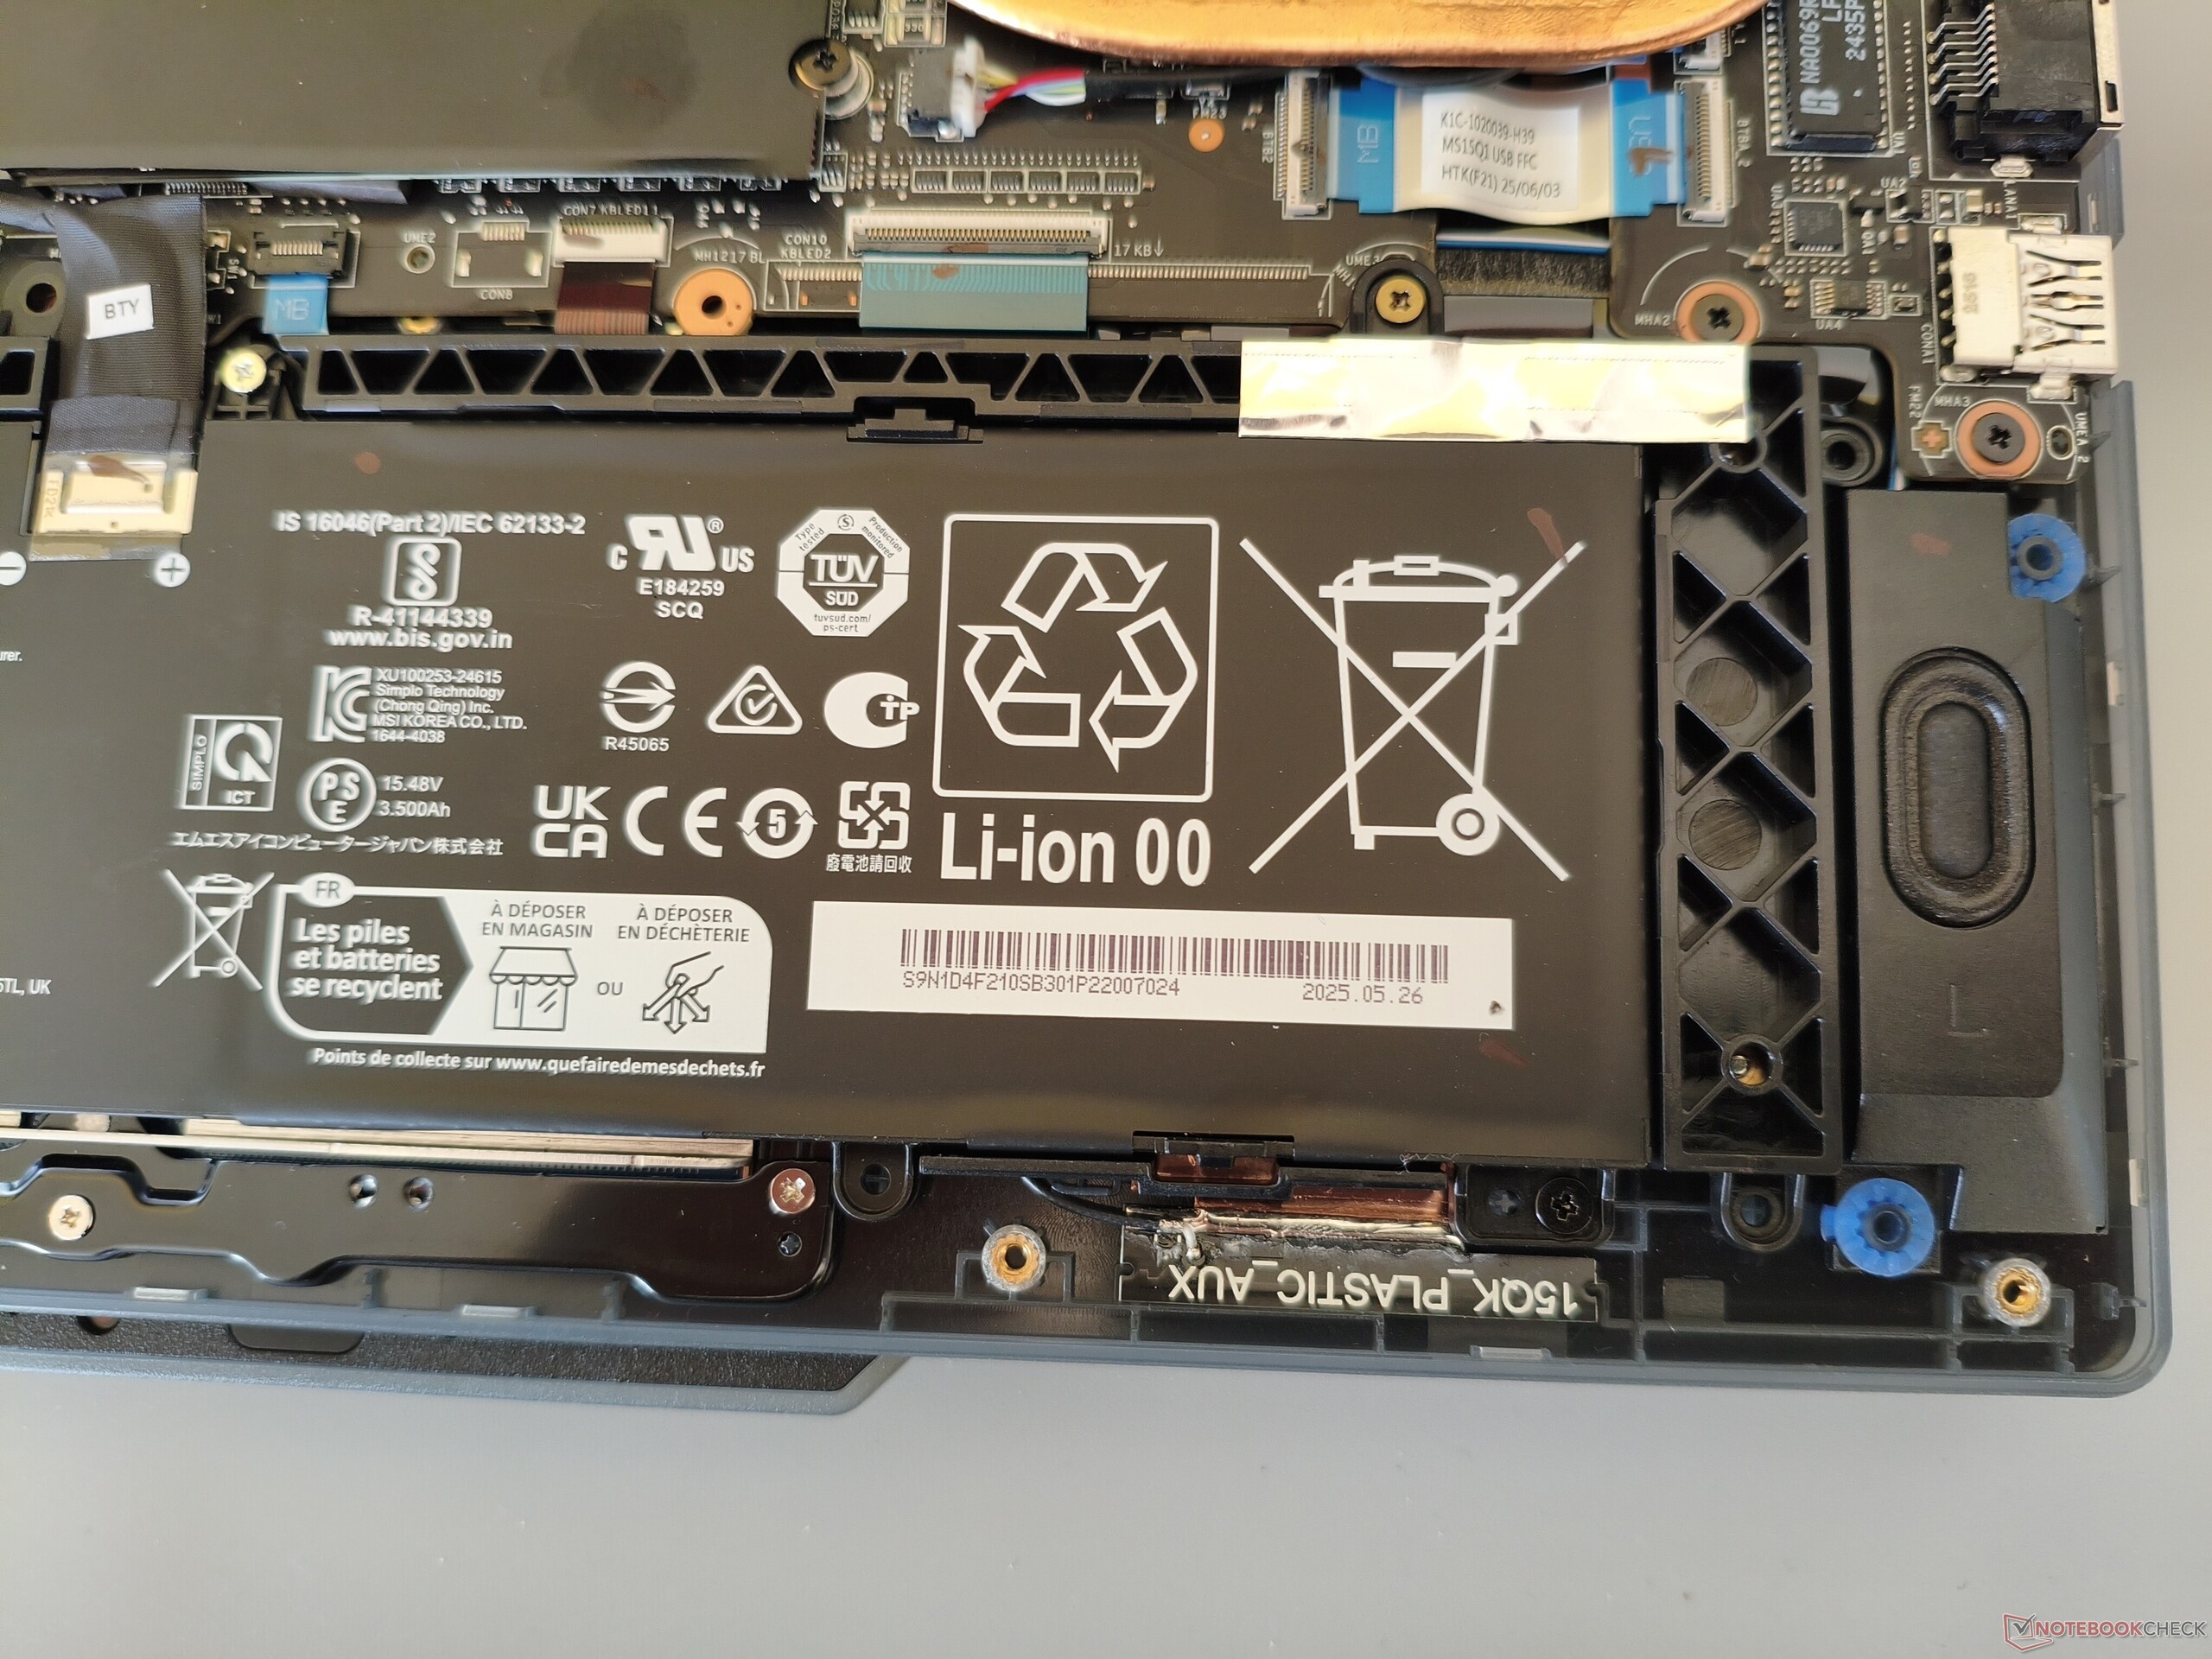
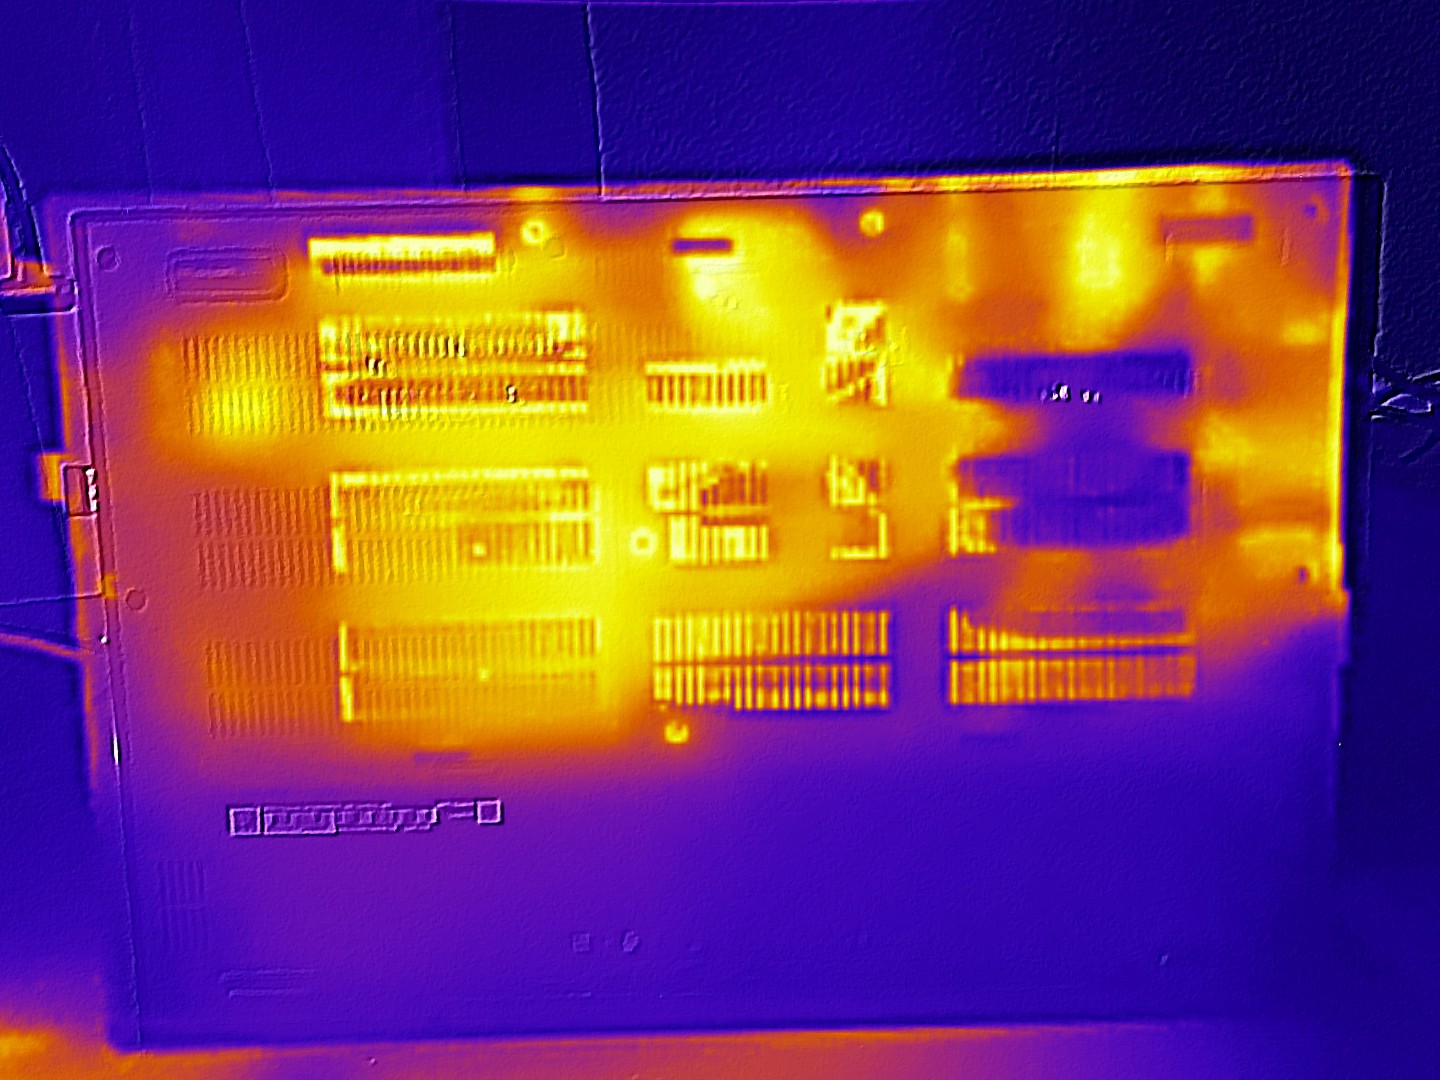
Le boîtier est constitué d'un mélange de métal (couvercle) et de plastique (unité de base). Pour l'essentiel, la qualité de fabrication et la stabilité ne donnent lieu à aucune critique. MSI mérite des éloges particuliers pour l'angle d'ouverture généreux de 180°. Avec un poids d'un peu moins de 2,2 kg, le Cyborg 15 se situe confortablement au milieu de la concurrence, qui pèse entre 1,9 et 2,4 kg. Pour ouvrir le boîtier, il faut retirer 12 vis Phillips. Vous pouvez voir ce qui se passe sous le capot dans les photos ci-dessous.
Equipement
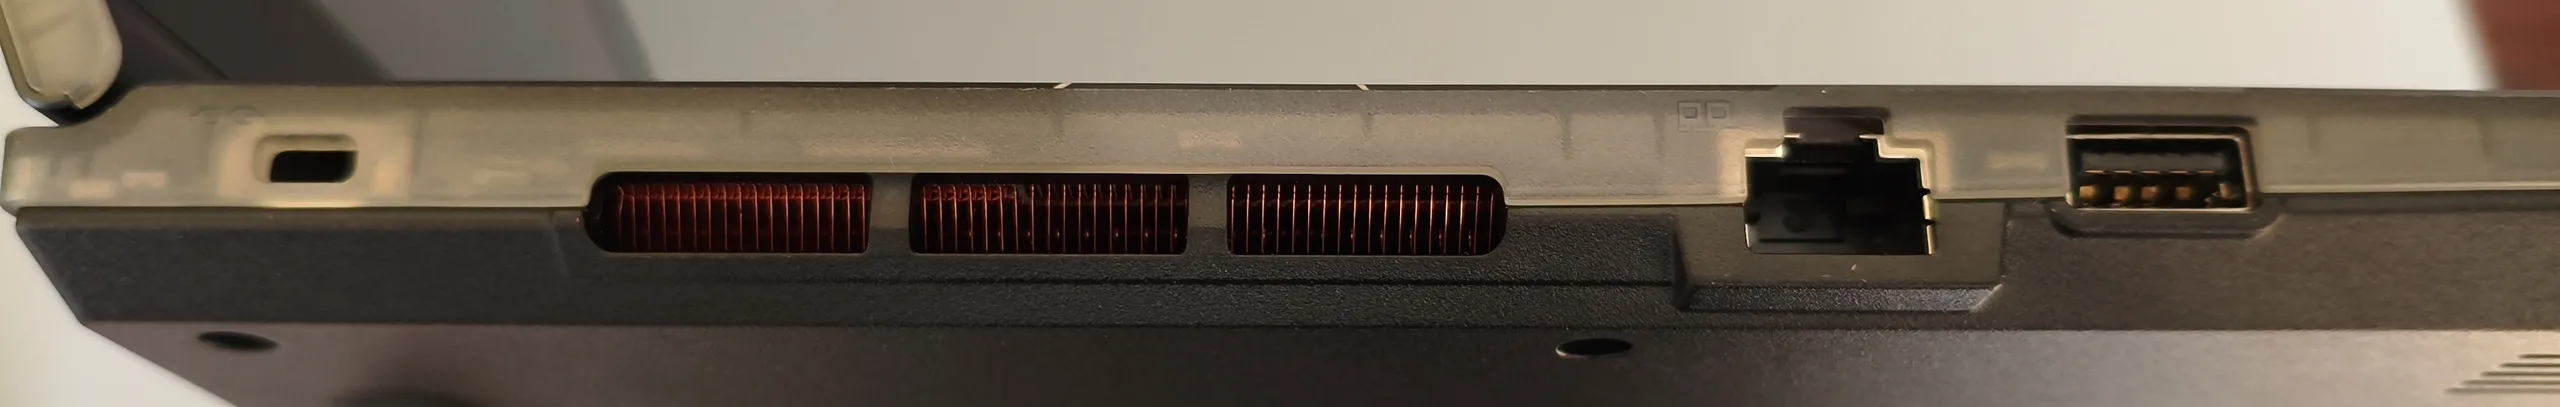
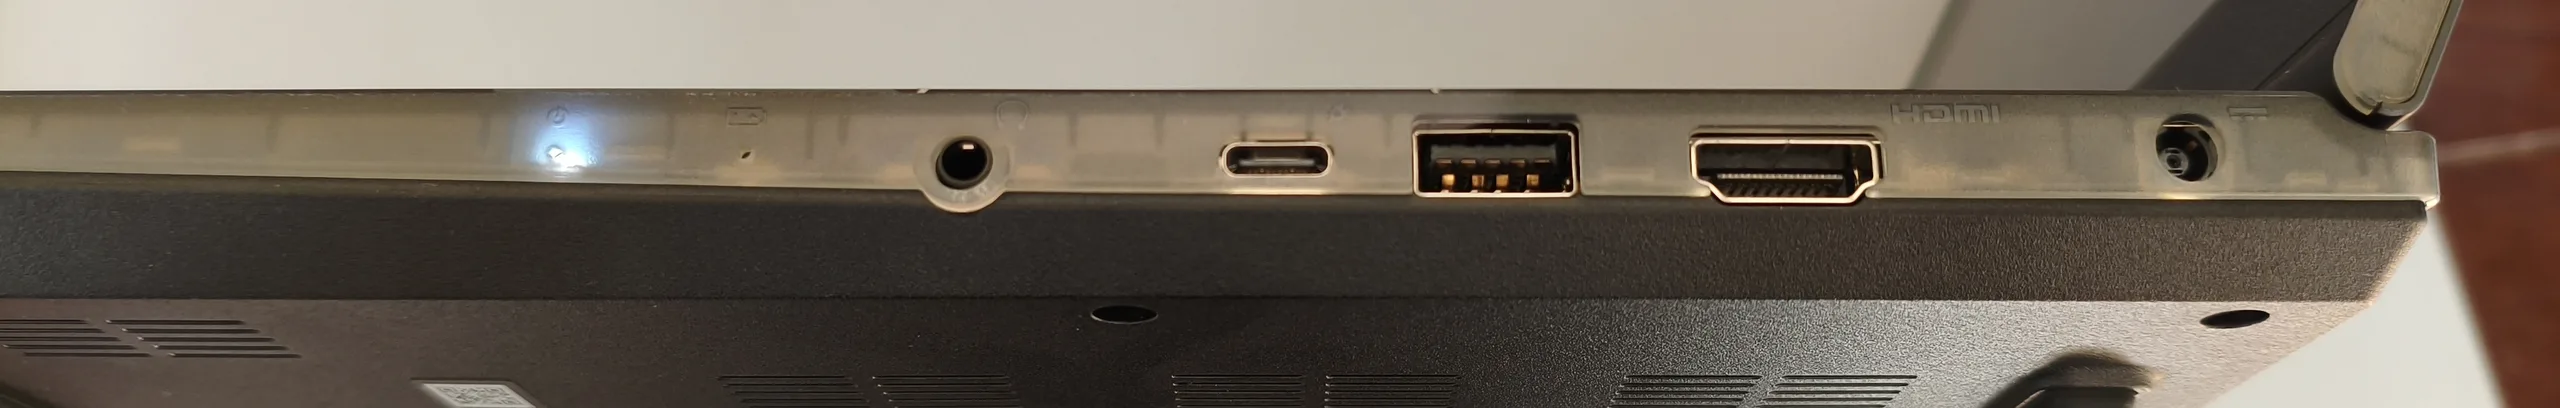
La connectivité s'avère plutôt maigre. Bien qu'il y ait un port LAN Gigabit, il n'y a pas de lecteur de cartes. Par ailleurs, nous aurions aimé que les ports USB soient dotés de normes plus modernes ; Thunderbolt, par exemple, n'est pas présent. Quoi qu'il en soit, le module sans fil d'Intel est agréablement rapide, surtout lorsqu'il s'agit de recevoir des données. Comme pour la plupart des ordinateurs portables, la webcam laisse à désirer, notamment en ce qui concerne la netteté de l'image.
Communication
| Networking | |
| iperf3 transmit AXE11000 | |
| Lenovo Legion 5 15AHP G10 | |
| MSI Cyborg 15 A12VF | |
| MSI Cyborg 15 B2RWEKG | |
| Moyenne Intel Wi-Fi 6E AX211 (64 - 1921, n=271) | |
| Moyenne de la classe Gaming (469 - 1862, n=114, 2 dernières années) | |
| Acer Nitro V 15 ANV15-52-50S2 | |
| Lenovo LOQ 15AHP10 | |
| HP Victus 15-fa2160ng | |
| iperf3 receive AXE11000 | |
| MSI Cyborg 15 B2RWEKG | |
| Lenovo Legion 5 15AHP G10 | |
| MSI Cyborg 15 A12VF | |
| Moyenne de la classe Gaming (680 - 1745, n=114, 2 dernières années) | |
| Moyenne Intel Wi-Fi 6E AX211 (582 - 1890, n=271) | |
| HP Victus 15-fa2160ng | |
| Acer Nitro V 15 ANV15-52-50S2 | |
| Lenovo LOQ 15AHP10 | |
Webcam


Maintenance


Dispositifs d'entrée
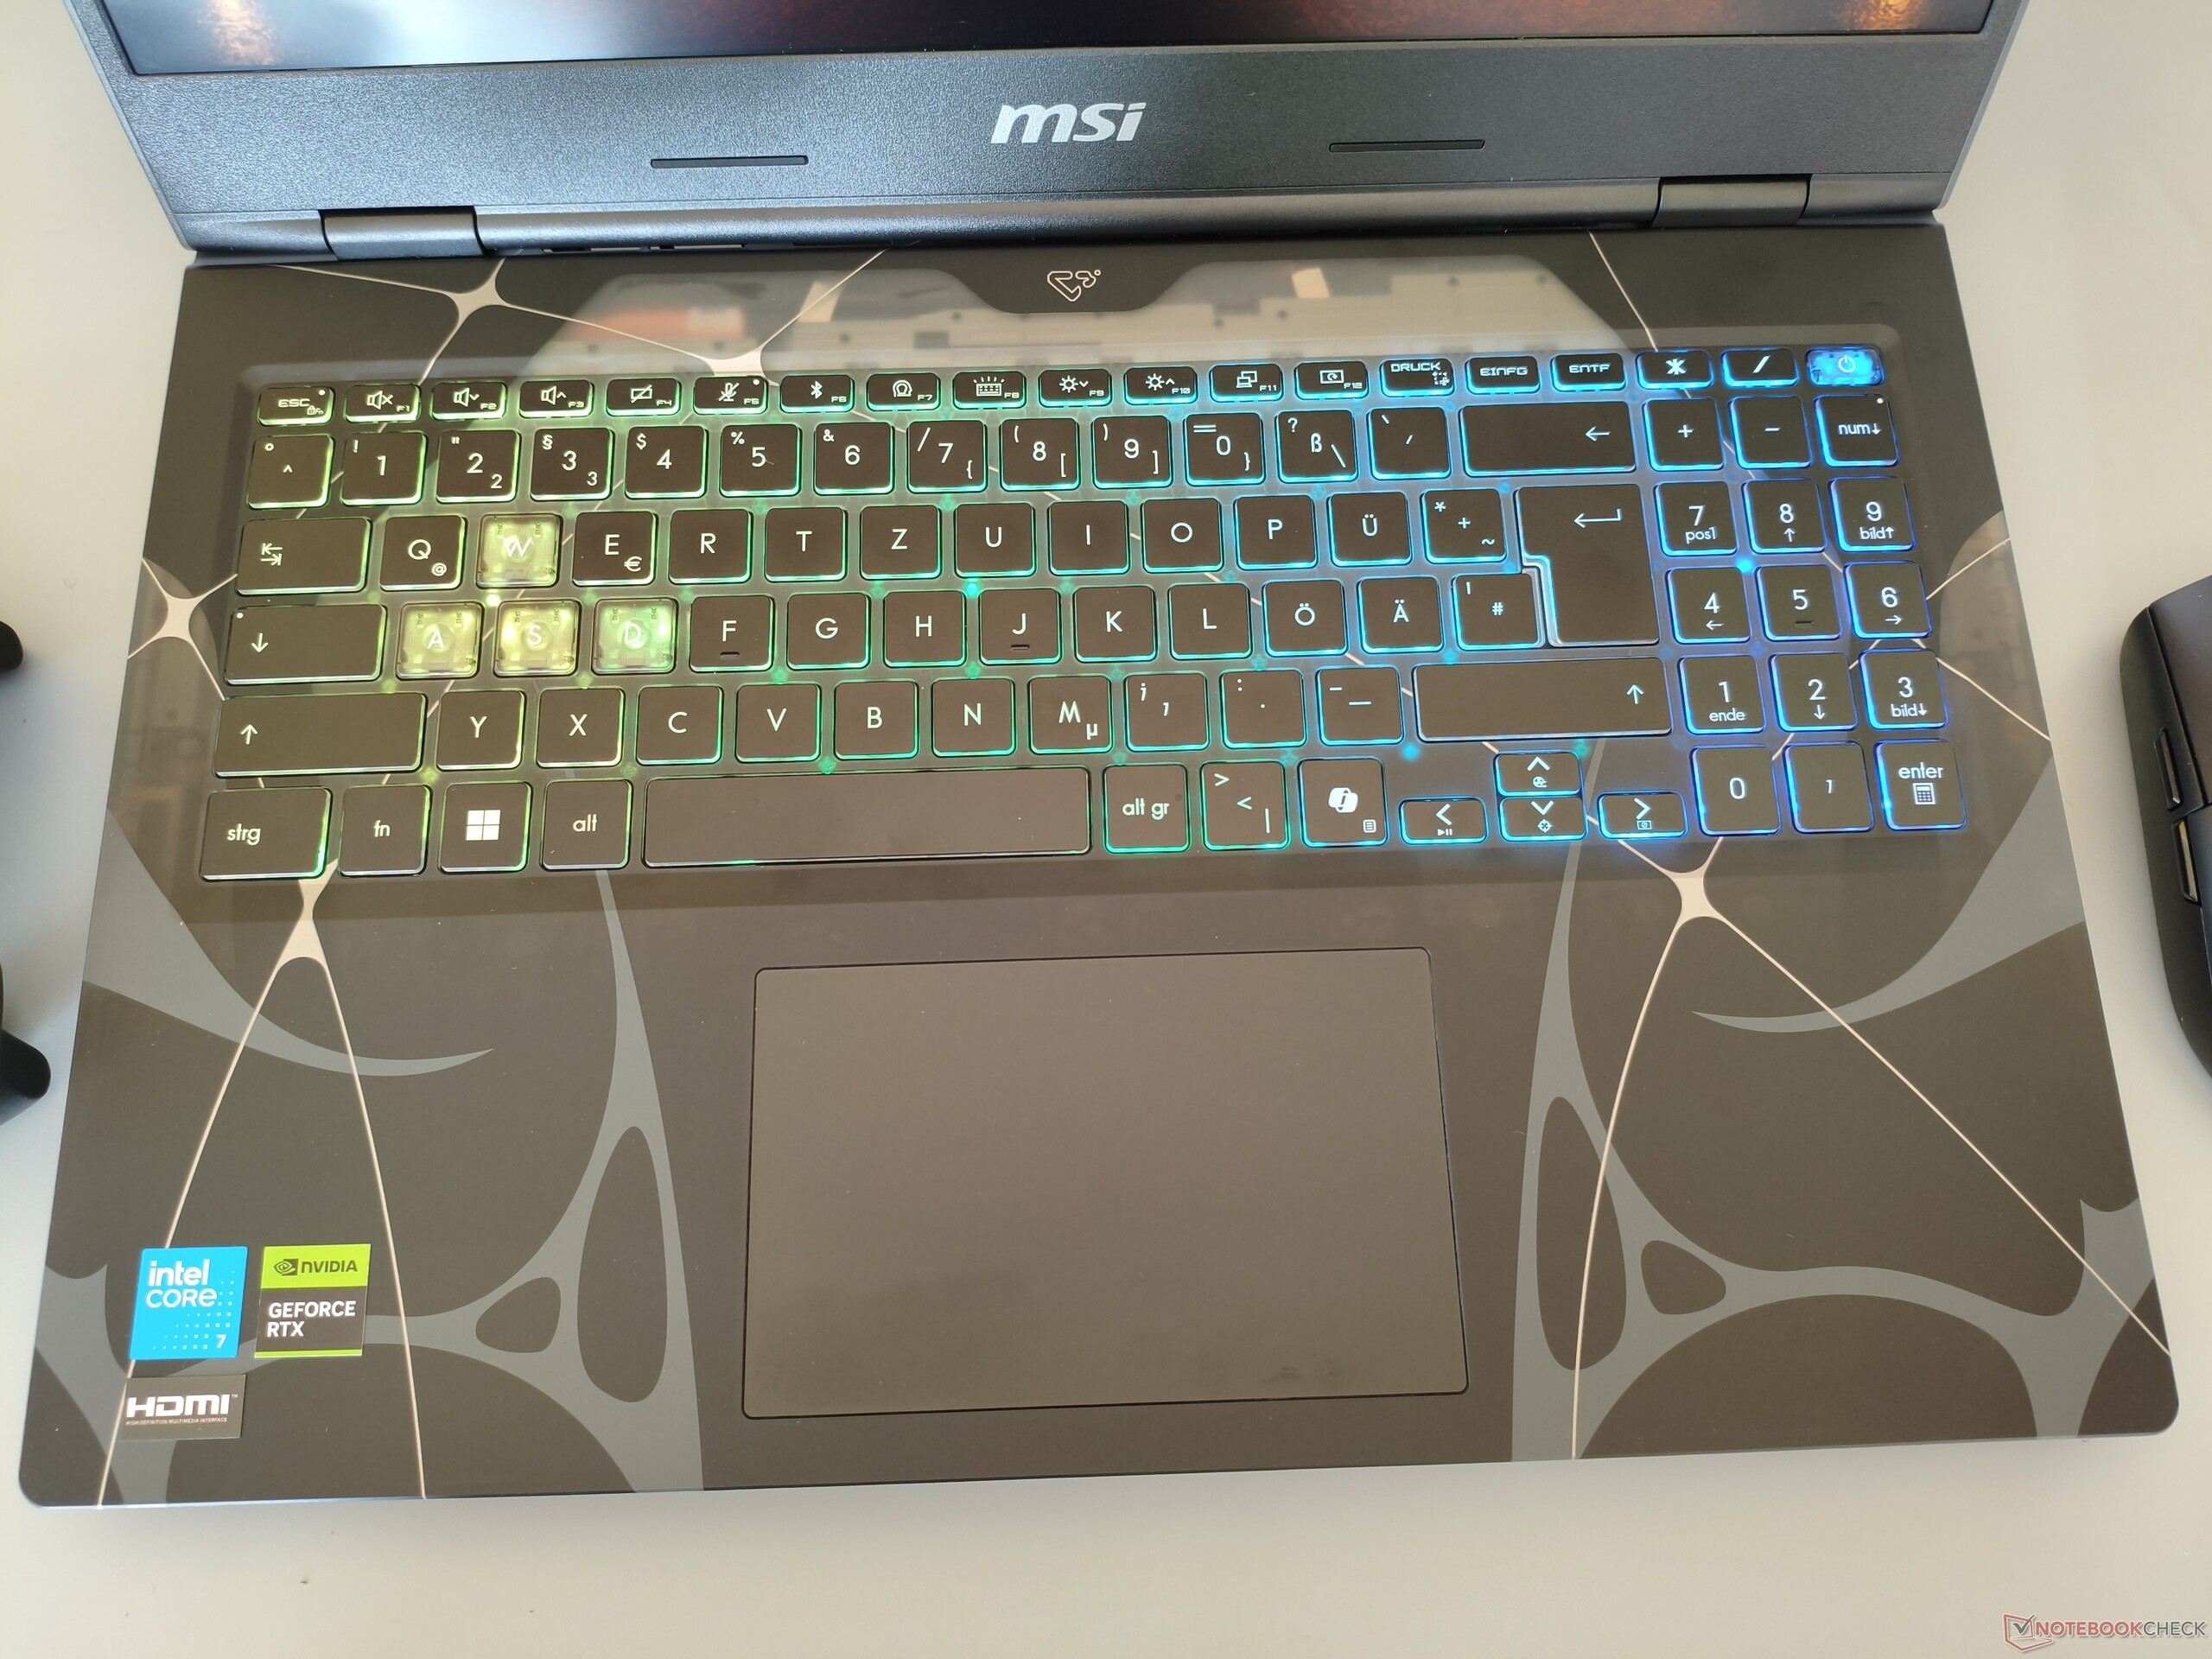
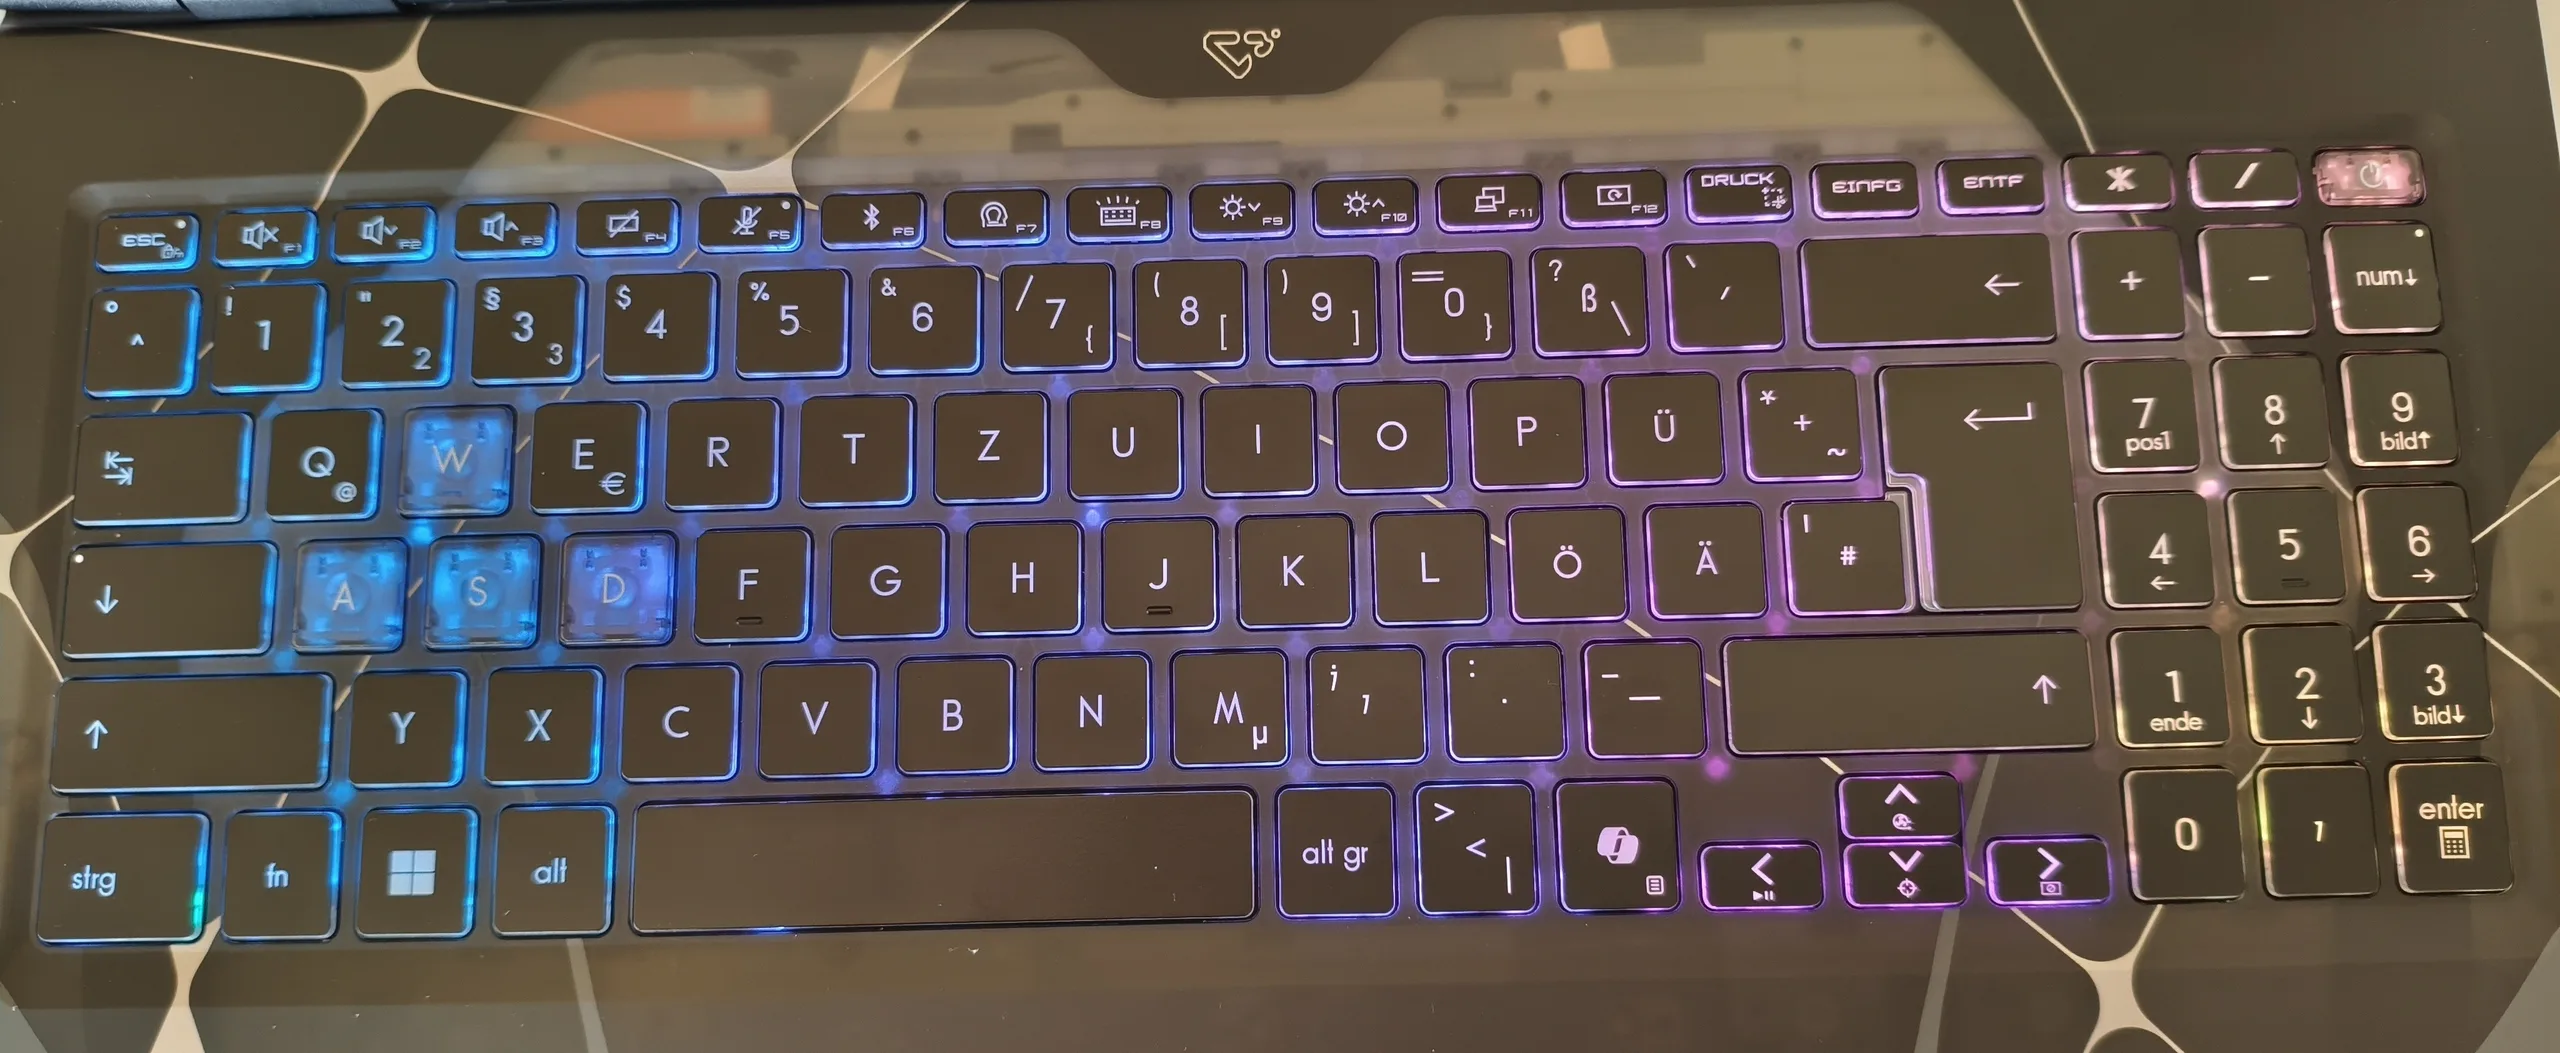
Le clavier nécessite une certaine familiarisation en raison de la disposition idiosyncrasique typique de MSI. Le fait que le pavé numérique ne comporte que trois colonnes au lieu de quatre demande également un certain temps d'adaptation. Nous décririons la sensation de frappe elle-même comme solide. Les joueurs peuvent également compter sur un éclairage RGB relativement puissant. Le pavé tactile mesure 12 x 7,6 cm, ce qui est plus que suffisant pour un appareil de 15 pouces. Le remplacement de la souris est satisfaisant en termes de précision, de propriétés de glisse et de gestes.
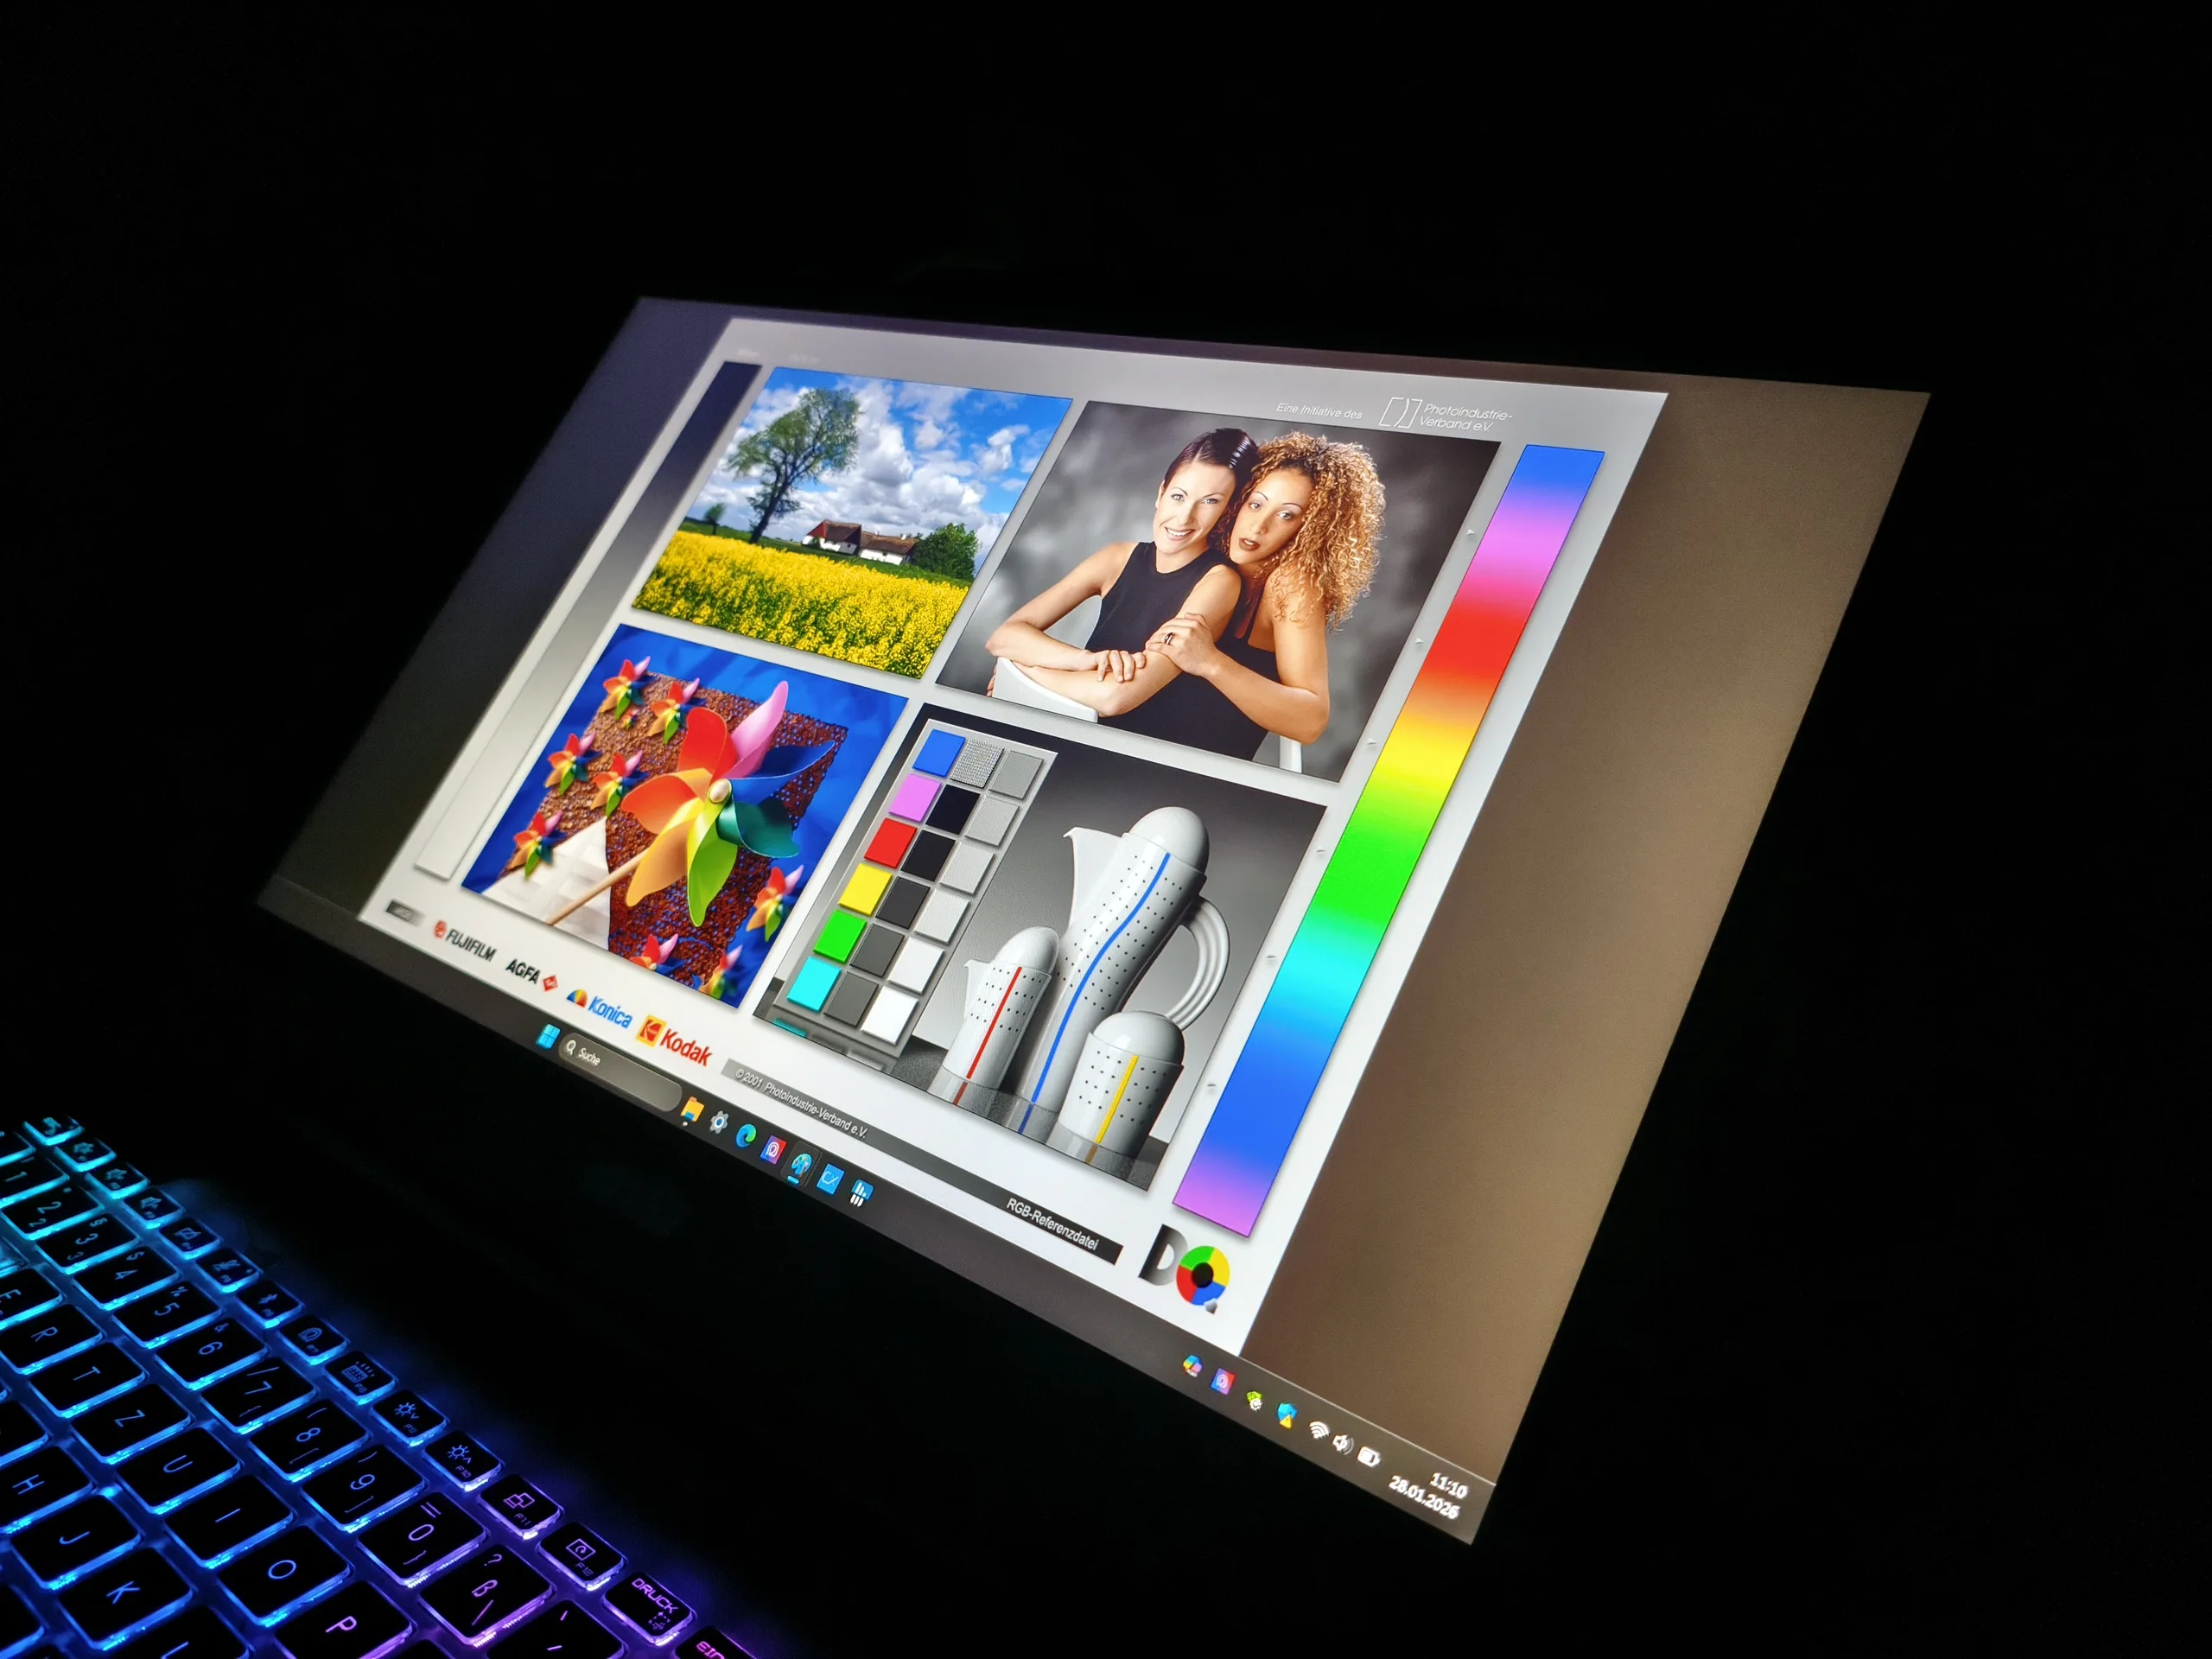
Affichage
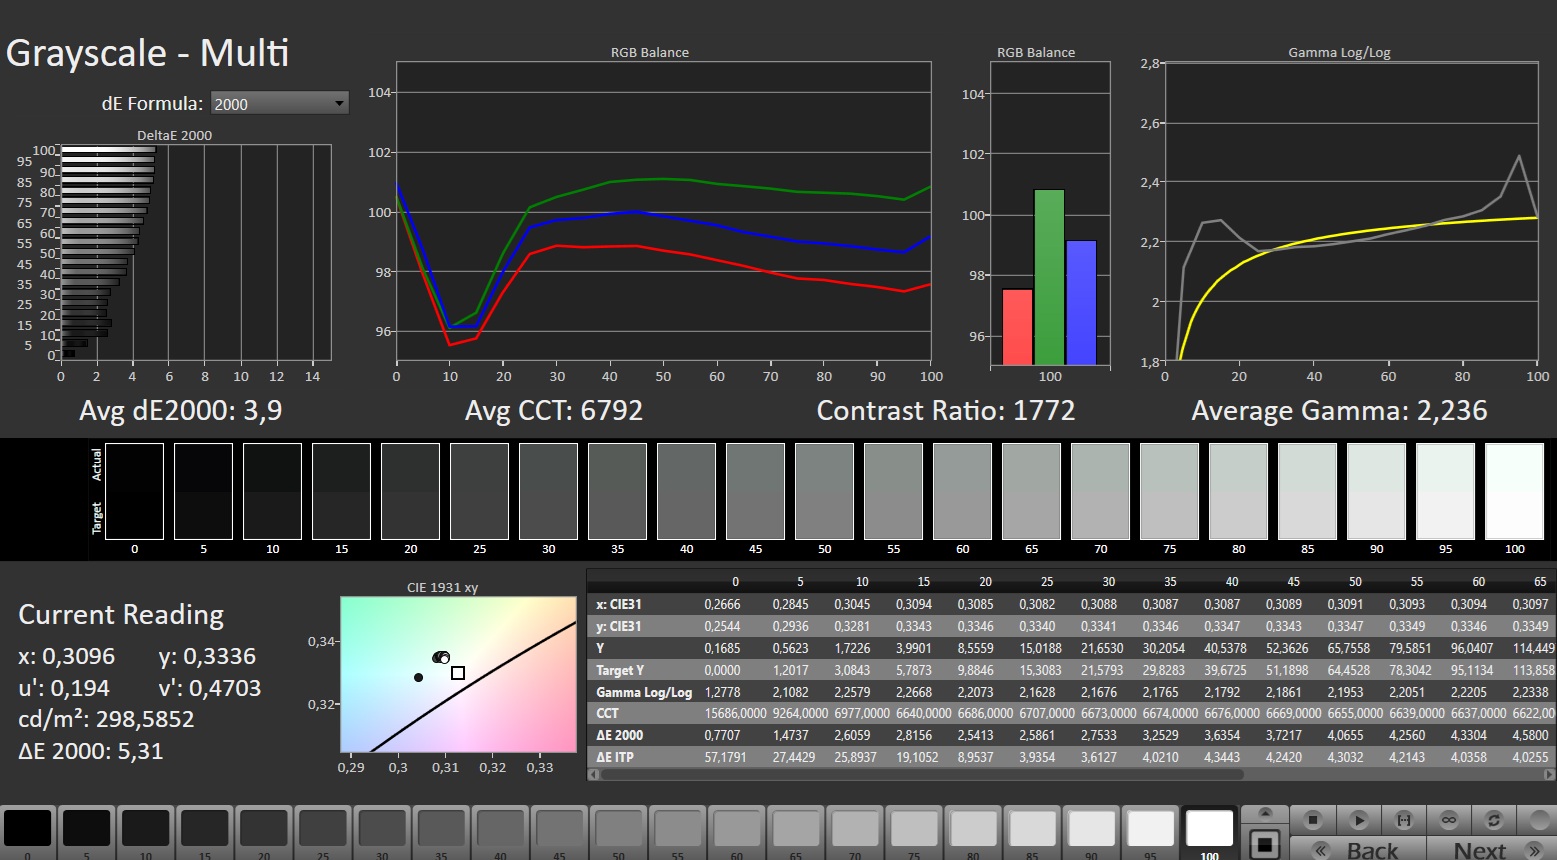
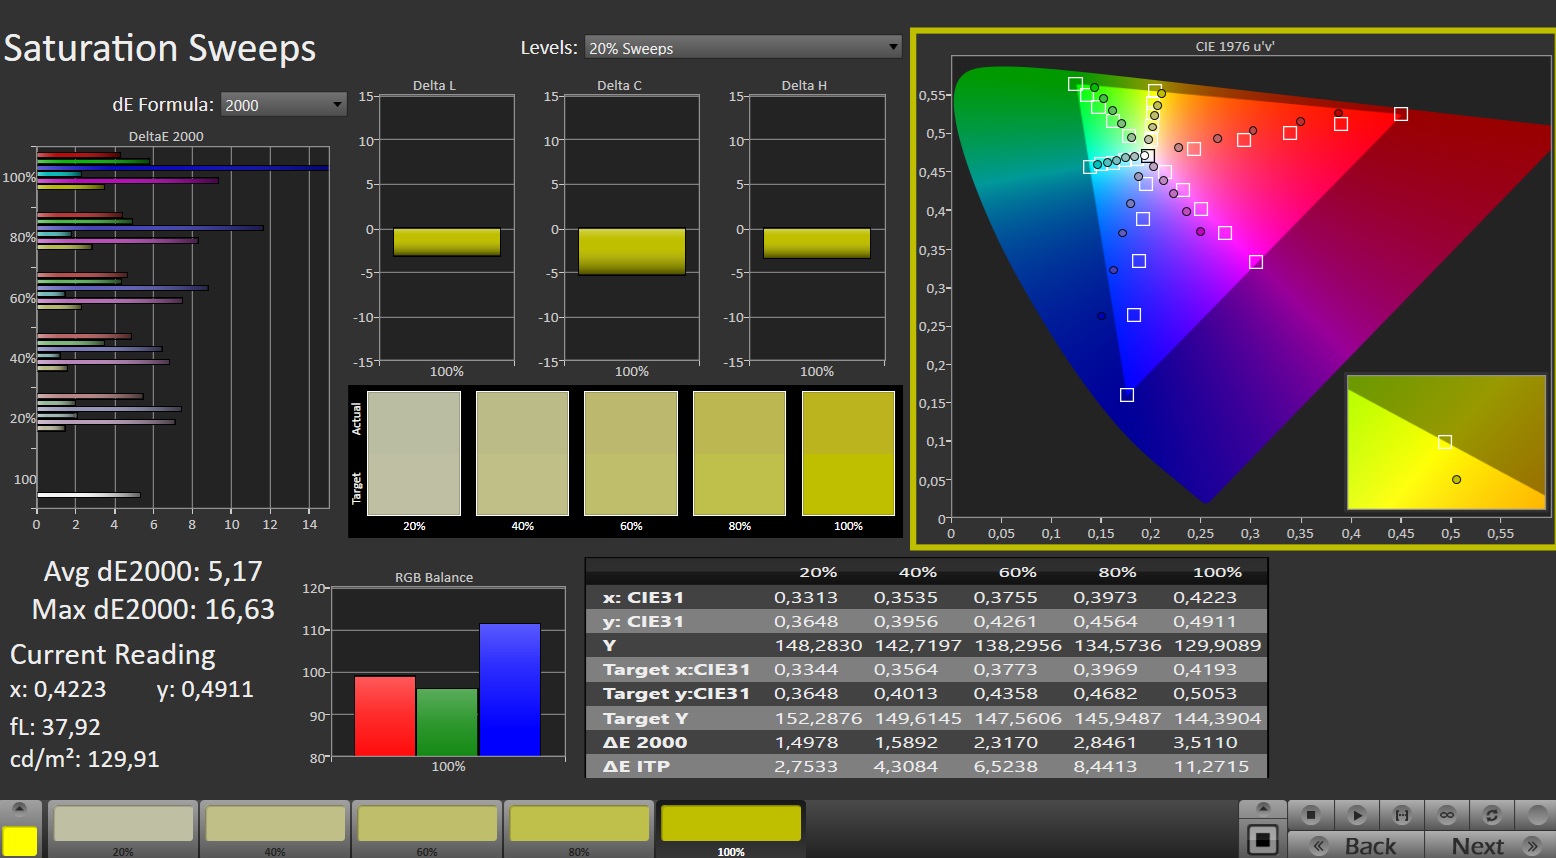
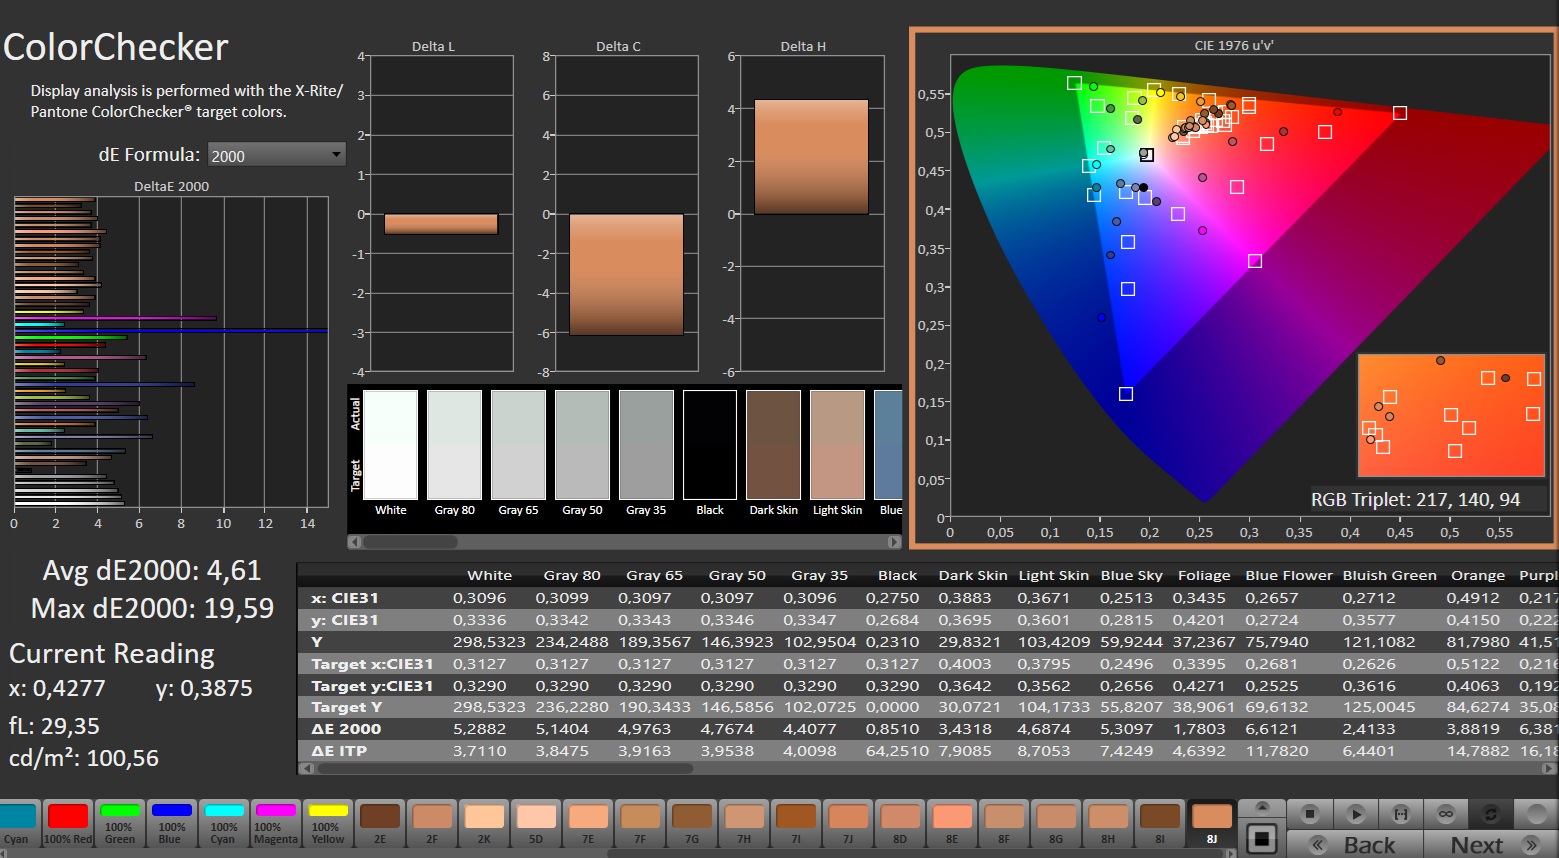
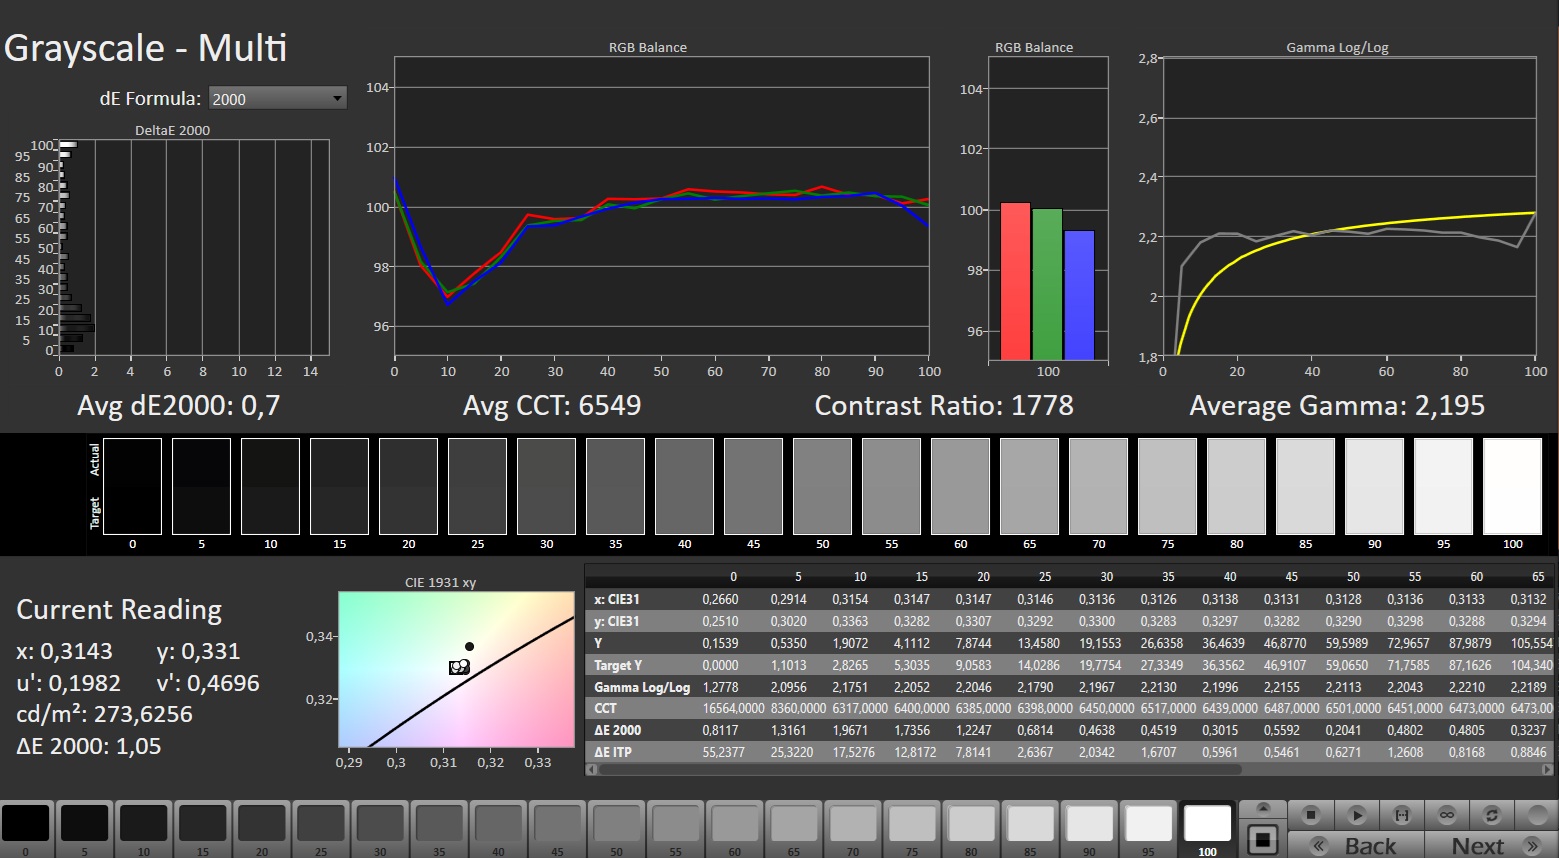
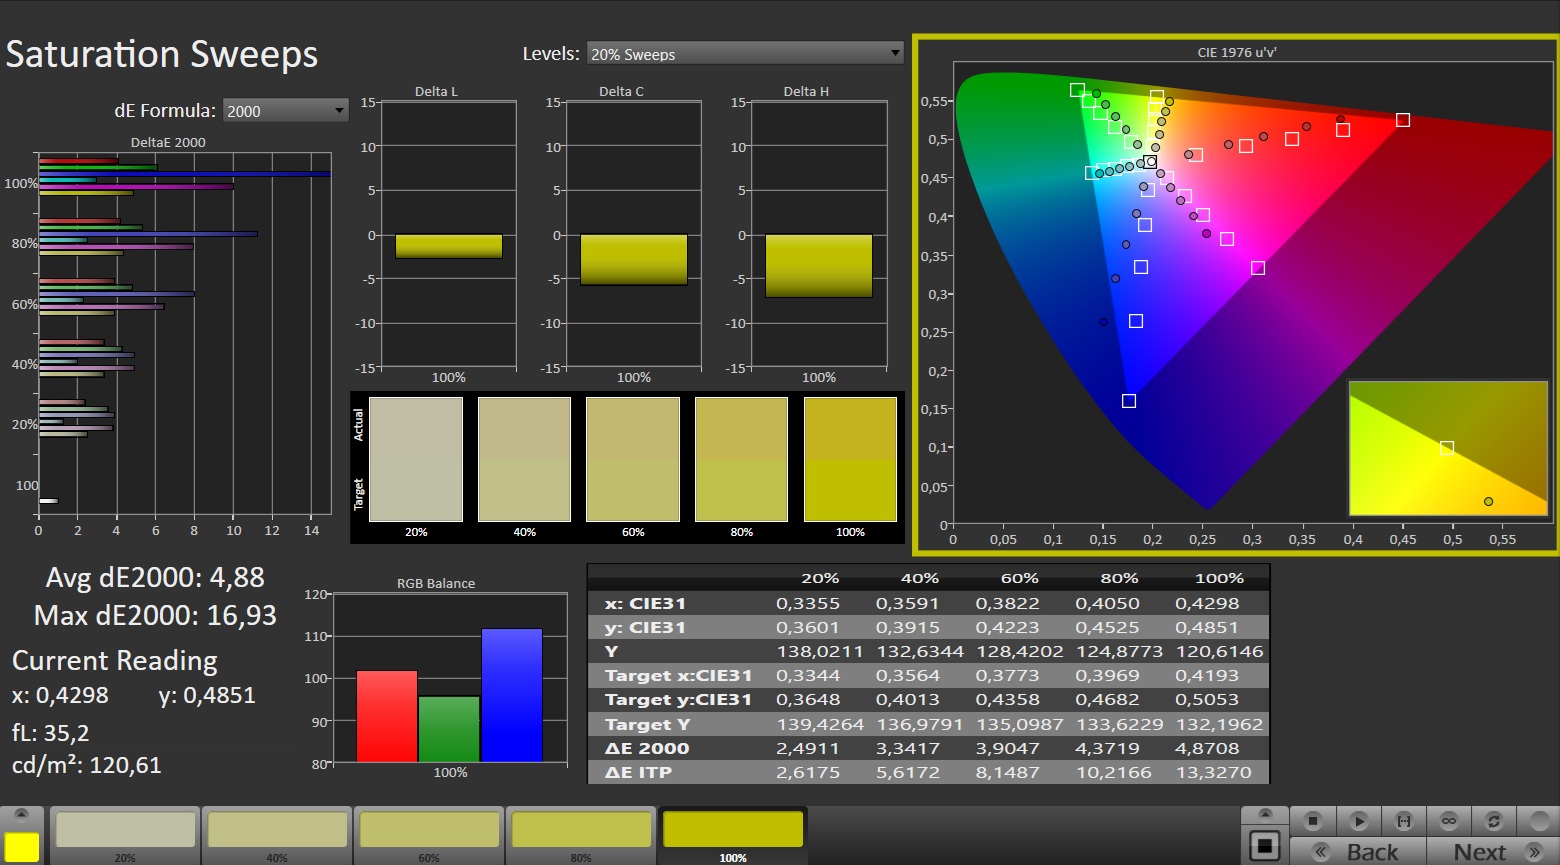
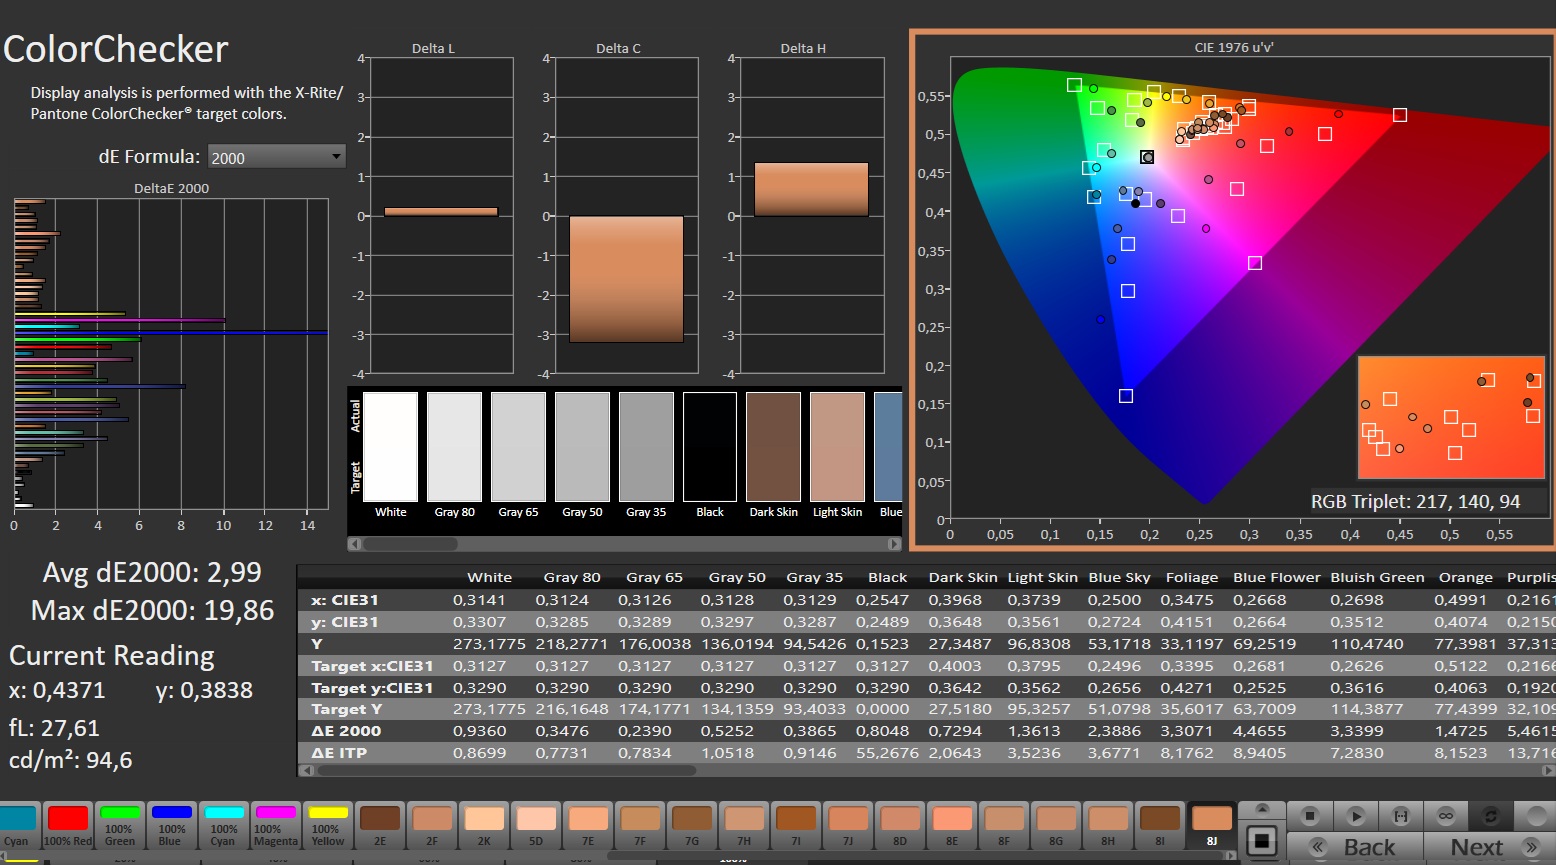
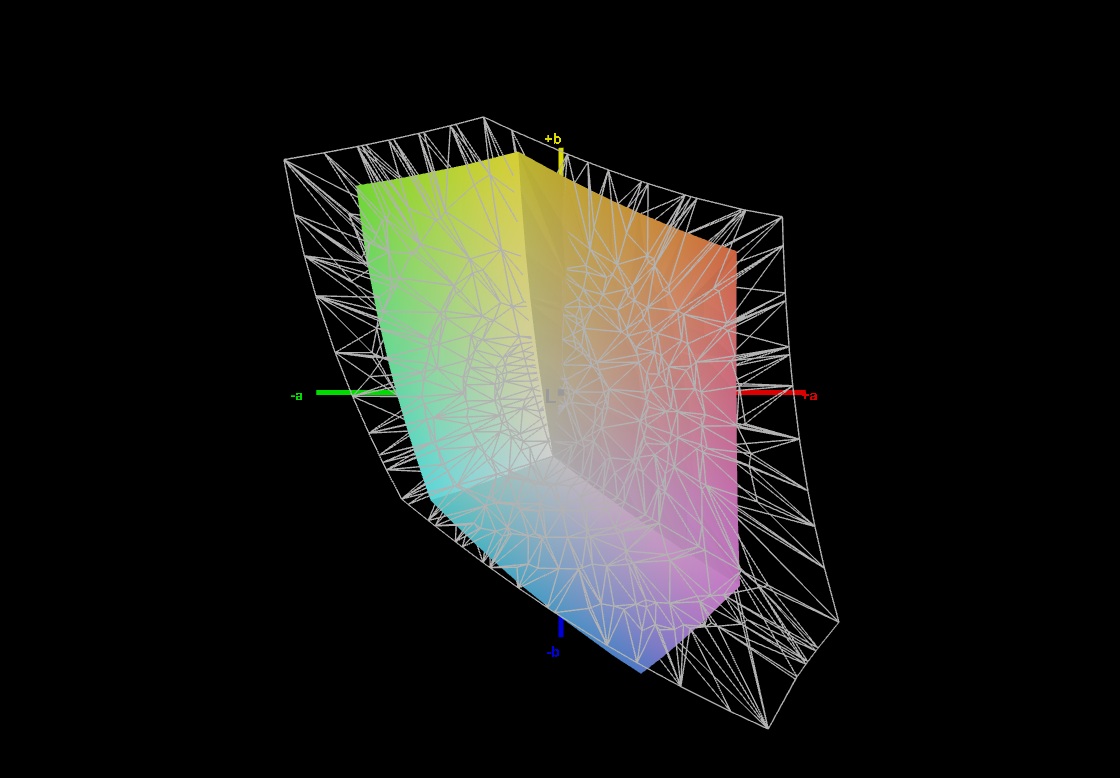
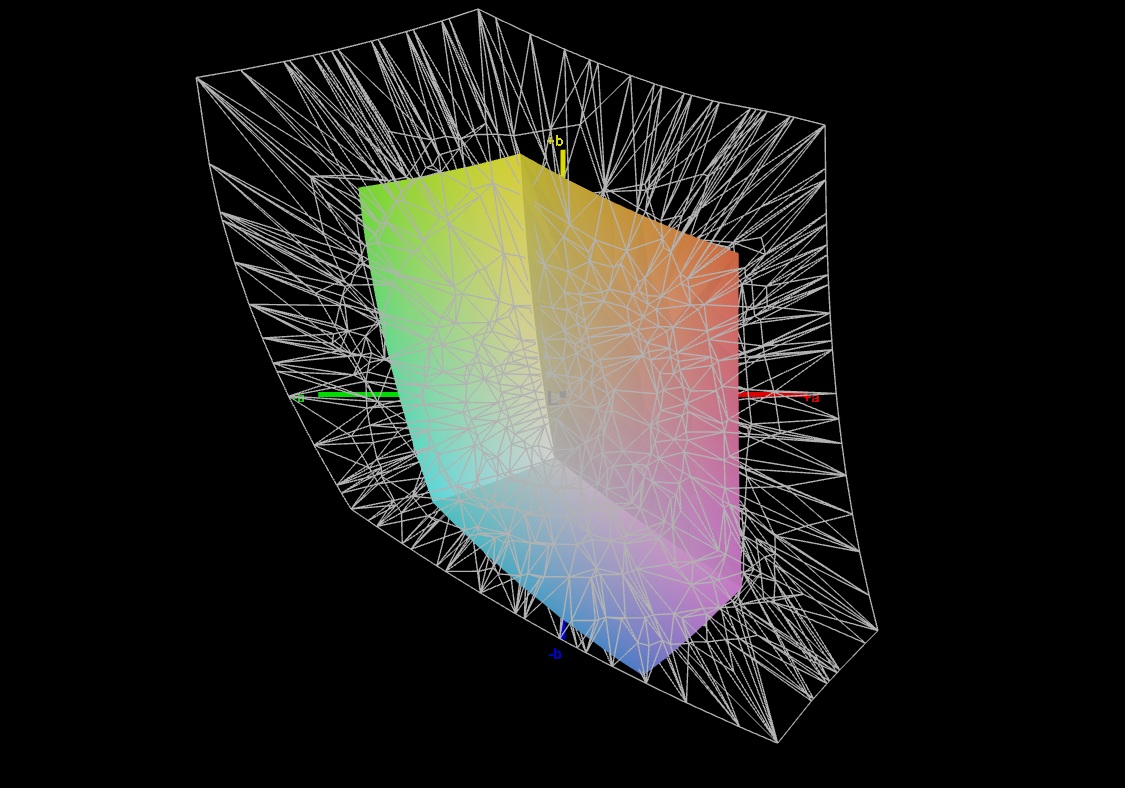
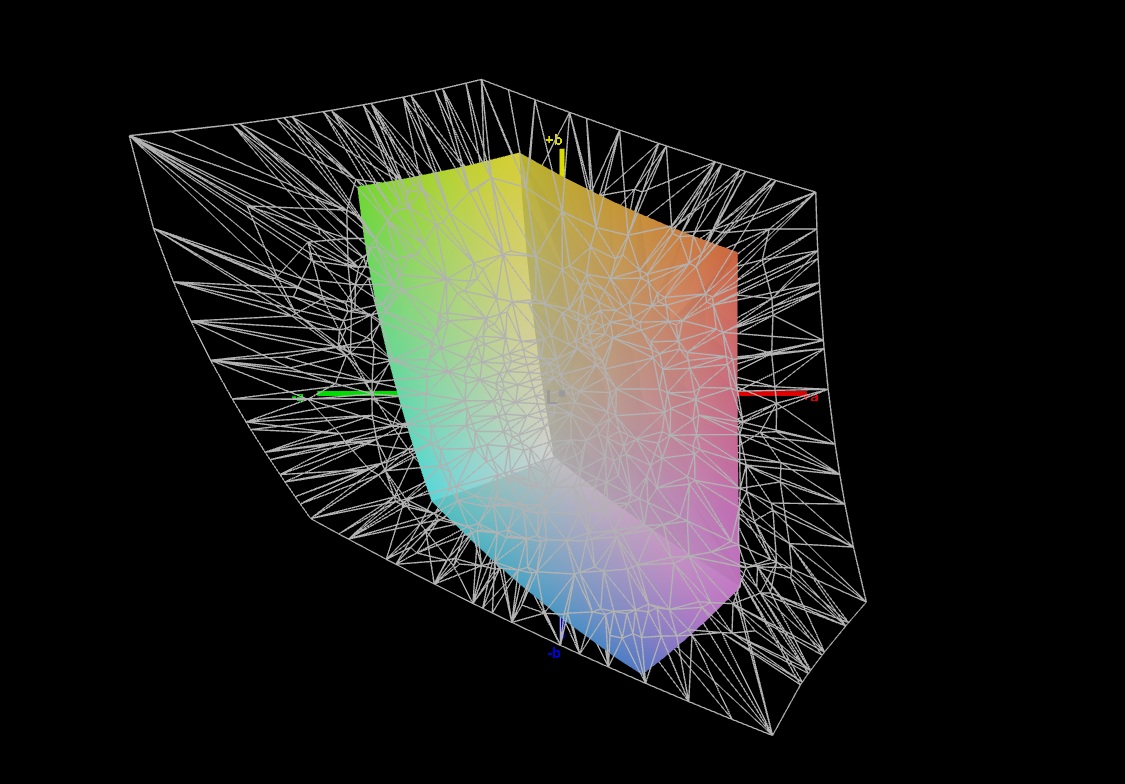
Comme mentionné au début, la qualité de l'écran Full HD (144 Hz) laisse à désirer. Bien que le contraste soit tout à fait respectable (près de 1 700:1) grâce à la faible valeur de noir de 0,17 cd/m², la luminosité d'environ 270 cd/m² n'est pas impressionnante. En raison de l'espace colorimétrique restreint (seulement 65% sRGB), les acheteurs doivent également vivre avec une impression d'image plutôt pâle. Le Lenovo LOQ 15 montre que les choses peuvent être améliorées dans cette gamme de prix, tandis que d'autres aspects tels que le temps de réponse et les angles de vision sont moyens.
| |||||||||||||||||||||||||
Homogénéité de la luminosité: 87 %
Valeur mesurée au centre, sur batterie: 286 cd/m²
Contraste: 1682:1 (Valeurs des noirs: 0.17 cd/m²)
ΔE ColorChecker Calman: 4.61 | ∀{0.5-29.43 Ø4.76}
calibrated: 2.99
ΔE Greyscale Calman: 3.9 | ∀{0.09-98 Ø5}
44.9% AdobeRGB 1998 (Argyll 3D)
64.8% sRGB (Argyll 3D)
43.4% Display P3 (Argyll 3D)
Gamma: 2.236
CCT: 6792 K
| MSI Cyborg 15 B2RWEKG CMN N156HRA-EA1, IPS, 1920x1080, 15.6", 144 Hz | MSI Cyborg 15 A12VF AU Optronics B156HAN15.1, IPS, 1920x1080, 15.6", 144 Hz | Acer Nitro V 15 ANV15-52-50S2 BOEhydis NE156FHM-NXA, IPS, 1920x1080, 15.6", 165 Hz | HP Victus 15-fa2160ng CMN1560, IPS, 1920x1080, 15.6", 144 Hz | Lenovo LOQ 15AHP10 CSOT MNF601BA1-4, IPS, 1920x1080, 15.6", 144 Hz | Lenovo Legion 5 15AHP G10 LEN151WQXGA, OLED, 2560x1600, 15.1", 165 Hz | |
|---|---|---|---|---|---|---|
| Display | -3% | -7% | -8% | 54% | 101% | |
| Display P3 Coverage (%) | 43.4 | 42.3 -3% | 40.3 -7% | 43 -1% | 67.3 55% | 99.9 130% |
| sRGB Coverage (%) | 64.8 | 62.6 -3% | 60.3 -7% | 64.3 -1% | 99.2 53% | 100 54% |
| AdobeRGB 1998 Coverage (%) | 44.9 | 43.7 -3% | 41.6 -7% | 34.7 -23% | 69.1 54% | 98.3 119% |
| Response Times | 25% | -23% | -2% | -15% | 98% | |
| Response Time Grey 50% / Grey 80% * (ms) | 27.6 ? | 22 ? 20% | 39 ? -41% | 28.6 ? -4% | 33.9 ? -23% | 0.42 ? 98% |
| Response Time Black / White * (ms) | 20 ? | 14 ? 30% | 20.8 ? -4% | 20 ? -0% | 21.2 ? -6% | 0.4 ? 98% |
| PWM Frequency (Hz) | 1152 ? | |||||
| PWM Amplitude * (%) | 11 | |||||
| Screen | -2% | -2% | -5% | 30% | 67% | |
| Brightness middle (cd/m²) | 286 | 247 -14% | 382 34% | 324 13% | 318 11% | 492 72% |
| Brightness (cd/m²) | 272 | 234 -14% | 347 28% | 303 11% | 300 10% | 495 82% |
| Brightness Distribution (%) | 87 | 89 2% | 86 -1% | 87 0% | 89 2% | 92 6% |
| Black Level * (cd/m²) | 0.17 | 0.25 -47% | 0.31 -82% | 0.26 -53% | 0.2 -18% | |
| Contrast (:1) | 1682 | 988 -41% | 1232 -27% | 1246 -26% | 1590 -5% | |
| Colorchecker dE 2000 * | 4.61 | 3.78 18% | 4.34 6% | 4.7 -2% | 1.33 71% | 0.9 80% |
| Colorchecker dE 2000 max. * | 19.59 | 6.42 67% | 19.19 2% | 18.19 7% | 4.42 77% | 1.8 91% |
| Colorchecker dE 2000 calibrated * | 2.99 | 3.94 -32% | 3.56 -19% | 2.93 2% | 0.94 69% | |
| Greyscale dE 2000 * | 3.9 | 2.16 45% | 2.4 38% | 3.9 -0% | 1.9 51% | 1.2 69% |
| Gamma | 2.236 98% | 2.33 94% | 2.165 102% | 2.21 100% | 2.187 101% | 2.16 102% |
| CCT | 6792 96% | 6906 94% | 7024 93% | 7541 86% | 6678 97% | 6291 103% |
| Moyenne finale (programmes/paramètres) | 7% /
2% | -11% /
-6% | -5% /
-6% | 23% /
29% | 89% /
82% |
* ... Moindre est la valeur, meilleures sont les performances
Temps de réponse de l'écran
| ↔ Temps de réponse noir à blanc | ||
|---|---|---|
| 20 ms ... hausse ↗ et chute ↘ combinées | ↗ 10.6 ms hausse | 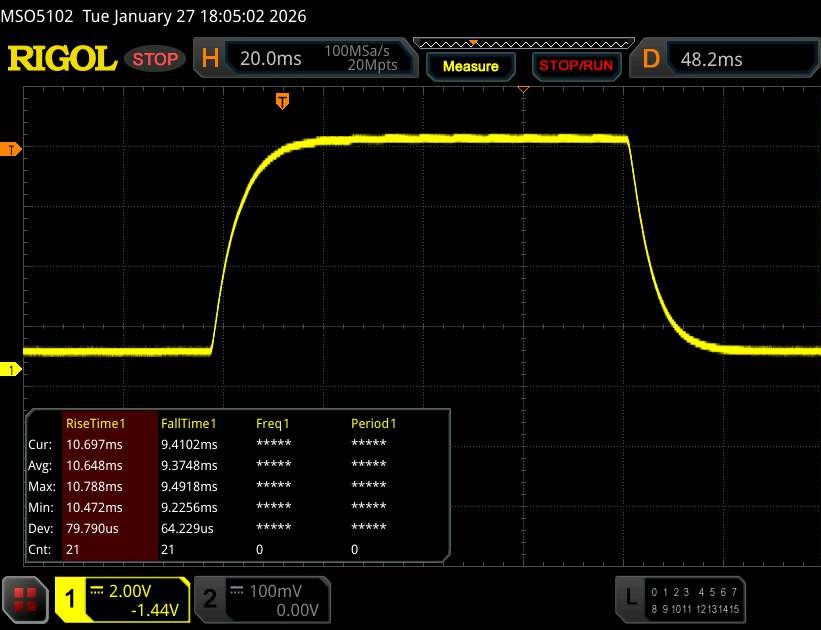 |
| ↘ 9.4 ms chute | ||
| L'écran montre de bons temps de réponse, mais insuffisant pour du jeu compétitif. En comparaison, tous les appareils testés affichent entre 0.1 (minimum) et 240 (maximum) ms. » 43 % des appareils testés affichent de meilleures performances. Cela signifie que les latences relevées sont similaires à la moyenne (20.1 ms) de tous les appareils testés. | ||
| ↔ Temps de réponse gris 50% à gris 80% | ||
| 27.6 ms ... hausse ↗ et chute ↘ combinées | ↗ 12.9 ms hausse | 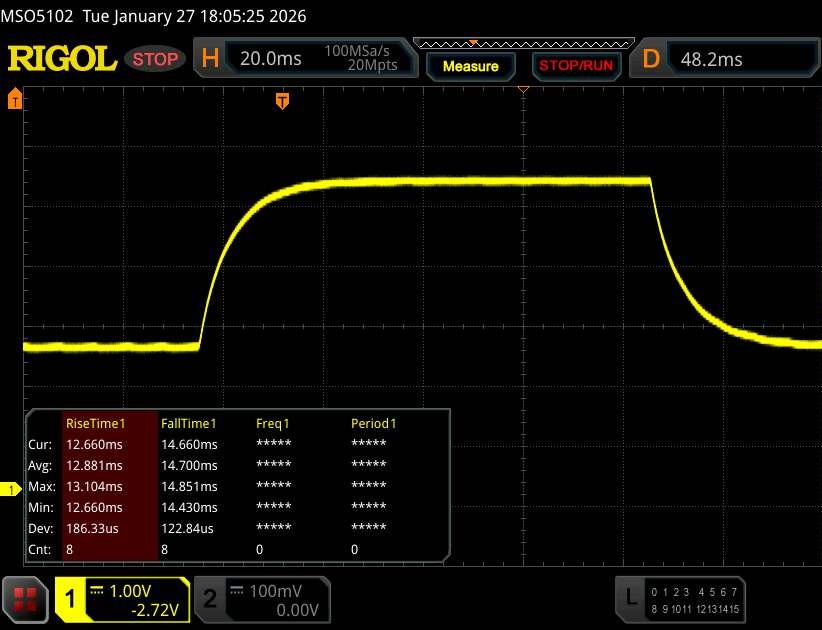 |
| ↘ 14.7 ms chute | ||
| L'écran souffre de latences relativement élevées, insuffisant pour le jeu. En comparaison, tous les appareils testés affichent entre 0.165 (minimum) et 636 (maximum) ms. » 36 % des appareils testés affichent de meilleures performances. Cela signifie que les latences relevées sont meilleures que la moyenne (31.5 ms) de tous les appareils testés. | ||
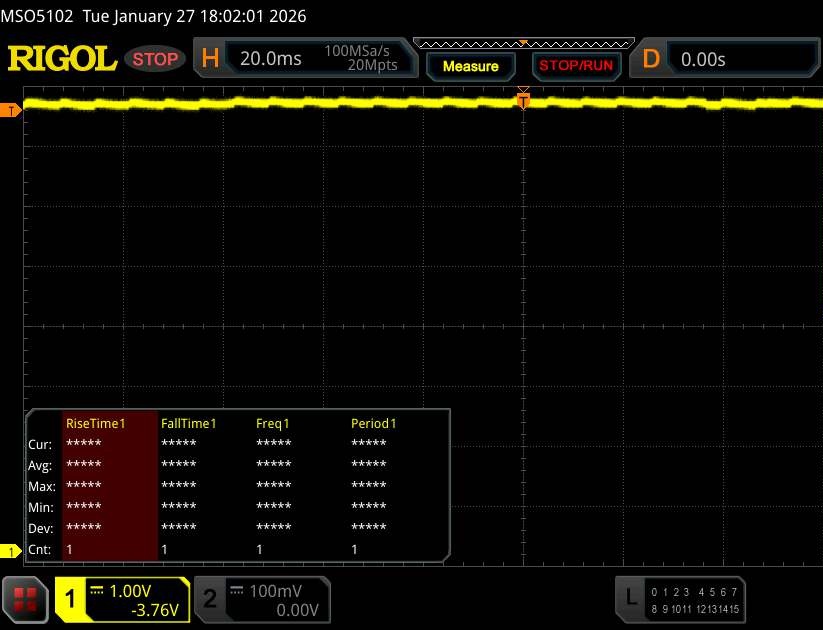
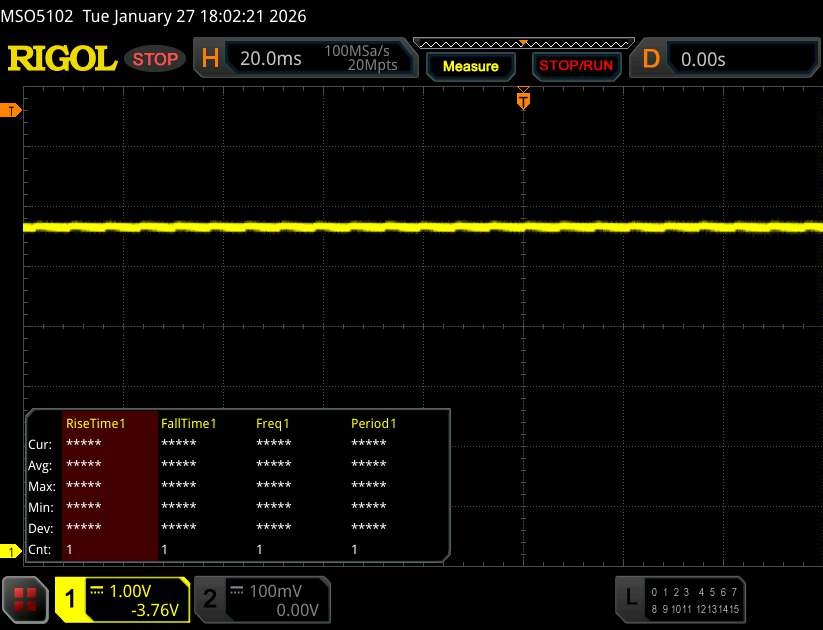
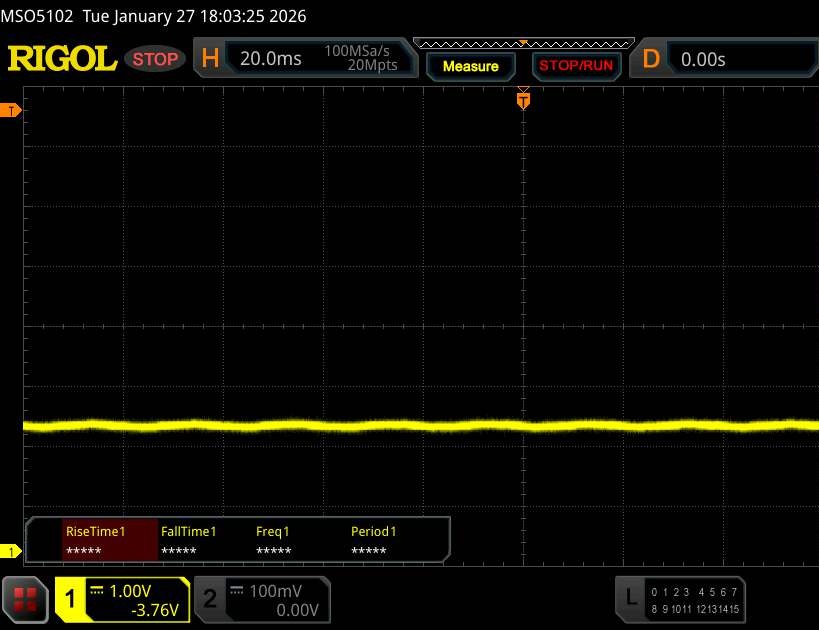
Scintillement / MLI (Modulation de largeur d'impulsion)
| Scintillement / MLI (Modulation de largeur d'impulsion) non décelé | 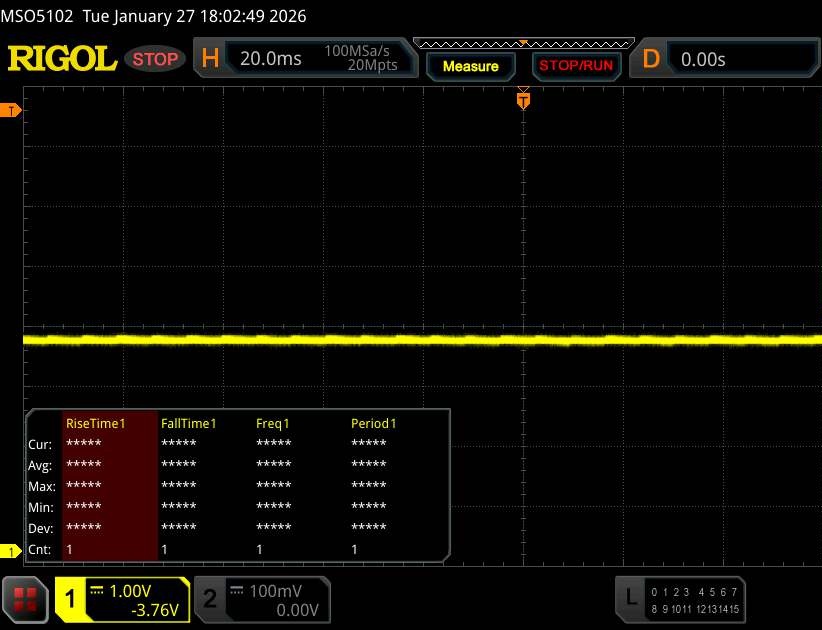 | ||
En comparaison, 53 % des appareils testés n'emploient pas MDI pour assombrir leur écran. Nous avons relevé une moyenne à 8039 (minimum : 5 - maximum : 343500) Hz dans le cas où une MDI était active. | |||
Performance
Les performances du Cyborg 15 se situent dans la moyenne. Si la mémoire vive ou la mémoire de masse venait à manquer, il est possible de les mettre à niveau grâce à deux banques SO-DIMM et à un emplacement M.2-2280.
Conditions d'essai
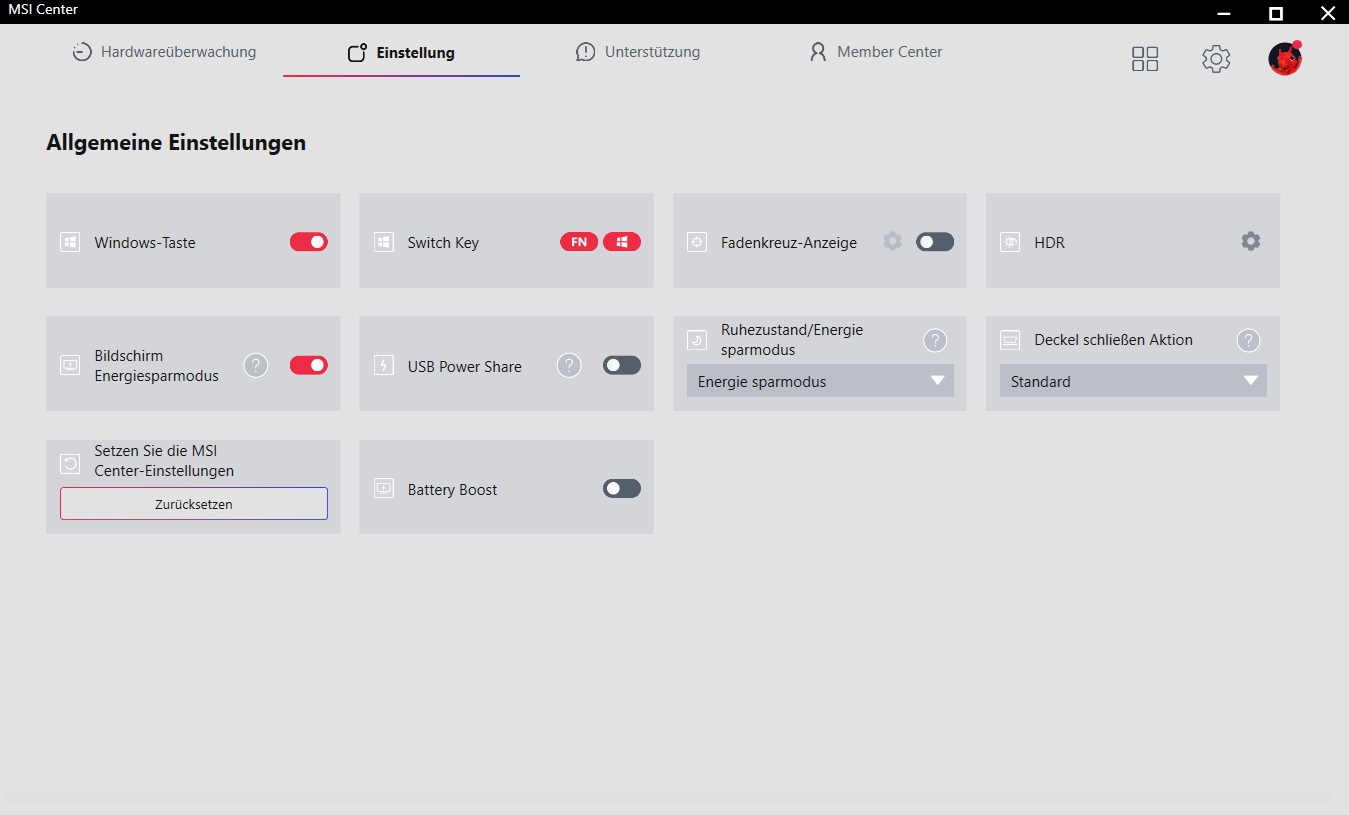
Le MSI Center préinstallé propose différents scénarios d'utilisation, allant de ECO Silent à Extreme Performance. Nos mesures ont été effectuées avec le mode AI Smart Auto (vous trouverez les différences entre les profils dans le tableau ci-dessous).
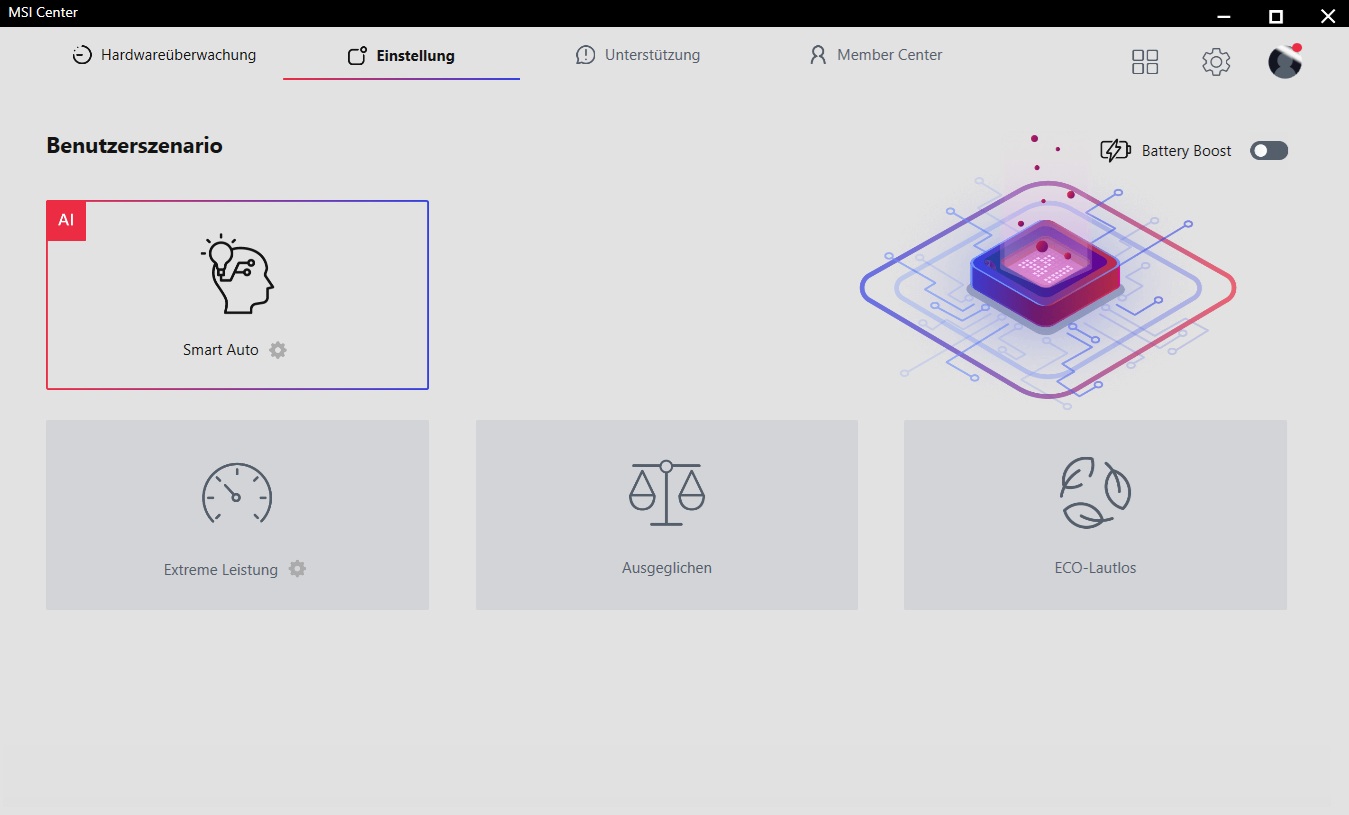
| Mode | Smart Auto | Extreme performance | Balanced | ECO Silent |
| Cyberpunk 2077 Bruit | 45 dB(A) | 48 dB(A) | 45 dB(A) | 37 dB(A) |
| Taux de rafraîchissement de Cyberpunk 2077 (FHD/Ultra) | 55,3 fps | 56,3 fps | 55,2 fps | 36,2 fps |
| Consommation du GPU | ~40 W | ~45 W | ~40 W | ~35 W |
| CPU PL1 | 45 W | 45 W | 35 W | 15 W |
| CPU PL2 | 45 W | 45 W | 35 W | 15 W |
| Cinebench R15 Multi Score | 1913 Points | 1931 Points | 1669 Points | 731 Points |
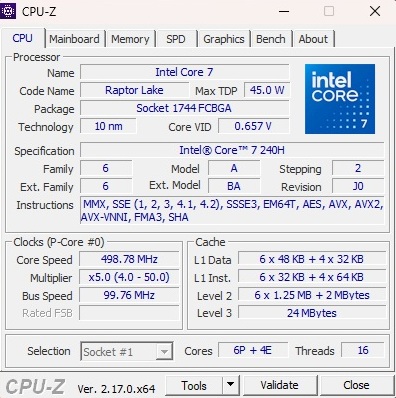
Processeur
Avec le Le Core 7 240H est un modèle 10 nm de la génération Raptor Lake, qui contient six cœurs de performance incluant l'Hyper-Threading et quatre cœurs d'efficacité sans HT, ce qui rend possible un total de 16 threads parallèles. Dans le parcours du processeur, la puce est positionnée entre le Core i5-13420H du Victus 15 ou de l'Acer Nitro V 15 et le Core i7-12650H de l'ancien Cyborg 15. La concurrence d'AMD prend de l'avance, du moins sous la forme du Ryzen 7 250 (Lenovo LOQ 15) ou Ryzen 7 260 (Lenovo Legion 5 15).
Test d'endurance multiple Cinebench R15
| CPU Performance rating - Percent | |
| Moyenne de la classe Gaming | |
| Lenovo Legion 5 15AHP G10 | |
| Lenovo LOQ 15AHP10 | |
| Moyenne Intel Core 7 240H | |
| MSI Cyborg 15 A12VF -2! | |
| MSI Cyborg 15 B2RWEKG | |
| HP Victus 15-fa2160ng | |
| Acer Nitro V 15 ANV15-52-50S2 | |
| Cinebench R23 | |
| Multi Core | |
| Moyenne de la classe Gaming (5668 - 40970, n=136, 2 dernières années) | |
| Lenovo Legion 5 15AHP G10 | |
| Lenovo LOQ 15AHP10 | |
| MSI Cyborg 15 A12VF | |
| Moyenne Intel Core 7 240H (10488 - 16588, n=3) | |
| Acer Nitro V 15 ANV15-52-50S2 | |
| HP Victus 15-fa2160ng | |
| MSI Cyborg 15 B2RWEKG | |
| Single Core | |
| Moyenne de la classe Gaming (1136 - 2267, n=136, 2 dernières années) | |
| Moyenne Intel Core 7 240H (1719 - 1905, n=3) | |
| Lenovo Legion 5 15AHP G10 | |
| MSI Cyborg 15 A12VF | |
| MSI Cyborg 15 B2RWEKG | |
| HP Victus 15-fa2160ng | |
| Lenovo LOQ 15AHP10 | |
| Acer Nitro V 15 ANV15-52-50S2 | |
| Cinebench R20 | |
| CPU (Multi Core) | |
| Moyenne de la classe Gaming (2179 - 16108, n=135, 2 dernières années) | |
| Lenovo Legion 5 15AHP G10 | |
| Lenovo LOQ 15AHP10 | |
| Moyenne Intel Core 7 240H (4535 - 6386, n=3) | |
| MSI Cyborg 15 A12VF | |
| MSI Cyborg 15 B2RWEKG | |
| Acer Nitro V 15 ANV15-52-50S2 | |
| HP Victus 15-fa2160ng | |
| CPU (Single Core) | |
| Moyenne de la classe Gaming (439 - 870, n=135, 2 dernières années) | |
| Moyenne Intel Core 7 240H (665 - 730, n=3) | |
| Lenovo Legion 5 15AHP G10 | |
| Lenovo LOQ 15AHP10 | |
| MSI Cyborg 15 A12VF | |
| MSI Cyborg 15 B2RWEKG | |
| HP Victus 15-fa2160ng | |
| Acer Nitro V 15 ANV15-52-50S2 | |
| Cinebench R15 | |
| CPU Multi 64Bit | |
| Moyenne de la classe Gaming (1537 - 6271, n=135, 2 dernières années) | |
| Lenovo Legion 5 15AHP G10 | |
| Lenovo LOQ 15AHP10 | |
| Moyenne Intel Core 7 240H (1800 - 2582, n=3) | |
| MSI Cyborg 15 A12VF | |
| MSI Cyborg 15 B2RWEKG | |
| Acer Nitro V 15 ANV15-52-50S2 | |
| HP Victus 15-fa2160ng | |
| CPU Single 64Bit | |
| Moyenne de la classe Gaming (188.8 - 343, n=134, 2 dernières années) | |
| Lenovo Legion 5 15AHP G10 | |
| Lenovo LOQ 15AHP10 | |
| Moyenne Intel Core 7 240H (249 - 276, n=3) | |
| MSI Cyborg 15 B2RWEKG | |
| MSI Cyborg 15 A12VF | |
| Acer Nitro V 15 ANV15-52-50S2 | |
| HP Victus 15-fa2160ng | |
| Blender - v2.79 BMW27 CPU | |
| HP Victus 15-fa2160ng | |
| Acer Nitro V 15 ANV15-52-50S2 | |
| MSI Cyborg 15 B2RWEKG | |
| MSI Cyborg 15 A12VF | |
| Moyenne Intel Core 7 240H (195 - 281, n=3) | |
| Lenovo LOQ 15AHP10 | |
| Lenovo Legion 5 15AHP G10 | |
| Moyenne de la classe Gaming (80 - 517, n=131, 2 dernières années) | |
| Geekbench 6.5 | |
| Multi-Core | |
| Moyenne de la classe Gaming (5340 - 22104, n=134, 2 dernières années) | |
| Lenovo Legion 5 15AHP G10 | |
| Moyenne Intel Core 7 240H (9713 - 13681, n=4) | |
| Lenovo LOQ 15AHP10 | |
| MSI Cyborg 15 B2RWEKG | |
| HP Victus 15-fa2160ng | |
| Acer Nitro V 15 ANV15-52-50S2 | |
| Single-Core | |
| Moyenne de la classe Gaming (1490 - 3259, n=134, 2 dernières années) | |
| Lenovo Legion 5 15AHP G10 | |
| Lenovo LOQ 15AHP10 | |
| Moyenne Intel Core 7 240H (2394 - 2648, n=4) | |
| MSI Cyborg 15 B2RWEKG | |
| HP Victus 15-fa2160ng | |
| Acer Nitro V 15 ANV15-52-50S2 | |
| Geekbench 5.5 | |
| Multi-Core | |
| Moyenne de la classe Gaming (4557 - 27010, n=133, 2 dernières années) | |
| Lenovo Legion 5 15AHP G10 | |
| MSI Cyborg 15 A12VF | |
| Moyenne Intel Core 7 240H (8072 - 12276, n=3) | |
| Lenovo LOQ 15AHP10 | |
| MSI Cyborg 15 B2RWEKG | |
| HP Victus 15-fa2160ng | |
| Acer Nitro V 15 ANV15-52-50S2 | |
| Single-Core | |
| Moyenne de la classe Gaming (986 - 2474, n=133, 2 dernières années) | |
| Lenovo Legion 5 15AHP G10 | |
| Lenovo LOQ 15AHP10 | |
| Moyenne Intel Core 7 240H (1695 - 1862, n=3) | |
| MSI Cyborg 15 A12VF | |
| MSI Cyborg 15 B2RWEKG | |
| HP Victus 15-fa2160ng | |
| Acer Nitro V 15 ANV15-52-50S2 | |
| HWBOT x265 Benchmark v2.2 - 4k Preset | |
| Moyenne de la classe Gaming (7.7 - 44.3, n=133, 2 dernières années) | |
| Lenovo Legion 5 15AHP G10 | |
| Lenovo LOQ 15AHP10 | |
| Moyenne Intel Core 7 240H (12.7 - 19, n=3) | |
| MSI Cyborg 15 A12VF | |
| MSI Cyborg 15 A12VF | |
| MSI Cyborg 15 B2RWEKG | |
| Acer Nitro V 15 ANV15-52-50S2 | |
| HP Victus 15-fa2160ng | |
| LibreOffice - 20 Documents To PDF | |
| Acer Nitro V 15 ANV15-52-50S2 | |
| MSI Cyborg 15 B2RWEKG | |
| HP Victus 15-fa2160ng | |
| Moyenne Intel Core 7 240H (51.2 - 72.4, n=3) | |
| Lenovo LOQ 15AHP10 | |
| Lenovo Legion 5 15AHP G10 | |
| Moyenne de la classe Gaming (19 - 88.8, n=133, 2 dernières années) | |
| MSI Cyborg 15 A12VF | |
| R Benchmark 2.5 - Overall mean | |
| HP Victus 15-fa2160ng | |
| Acer Nitro V 15 ANV15-52-50S2 | |
| MSI Cyborg 15 B2RWEKG | |
| MSI Cyborg 15 A12VF | |
| Moyenne Intel Core 7 240H (0.4329 - 0.4853, n=3) | |
| Lenovo LOQ 15AHP10 | |
| Lenovo Legion 5 15AHP G10 | |
| Moyenne de la classe Gaming (0.3439 - 0.759, n=134, 2 dernières années) | |
* ... Moindre est la valeur, meilleures sont les performances
AIDA64: FP32 Ray-Trace | FPU Julia | CPU SHA3 | CPU Queen | FPU SinJulia | FPU Mandel | CPU AES | CPU ZLib | FP64 Ray-Trace | CPU PhotoWorxx
| Performance rating | |
| Moyenne de la classe Gaming | |
| Lenovo Legion 5 15AHP G10 | |
| Lenovo LOQ 15AHP10 | |
| MSI Cyborg 15 A12VF | |
| Moyenne Intel Core 7 240H | |
| MSI Cyborg 15 B2RWEKG | |
| Acer Nitro V 15 ANV15-52-50S2 | |
| HP Victus 15-fa2160ng | |
| AIDA64 / FP32 Ray-Trace | |
| Lenovo Legion 5 15AHP G10 | |
| Moyenne de la classe Gaming (7192 - 85542, n=133, 2 dernières années) | |
| Lenovo LOQ 15AHP10 | |
| Moyenne Intel Core 7 240H (11867 - 14710, n=3) | |
| MSI Cyborg 15 A12VF | |
| Acer Nitro V 15 ANV15-52-50S2 | |
| MSI Cyborg 15 B2RWEKG | |
| HP Victus 15-fa2160ng | |
| AIDA64 / FPU Julia | |
| Moyenne de la classe Gaming (35040 - 238426, n=133, 2 dernières années) | |
| Lenovo Legion 5 15AHP G10 | |
| Lenovo LOQ 15AHP10 | |
| MSI Cyborg 15 A12VF | |
| Moyenne Intel Core 7 240H (59260 - 73294, n=3) | |
| Acer Nitro V 15 ANV15-52-50S2 | |
| MSI Cyborg 15 B2RWEKG | |
| HP Victus 15-fa2160ng | |
| AIDA64 / CPU SHA3 | |
| Moyenne de la classe Gaming (1728 - 9817, n=133, 2 dernières années) | |
| Lenovo Legion 5 15AHP G10 | |
| Lenovo LOQ 15AHP10 | |
| MSI Cyborg 15 A12VF | |
| Moyenne Intel Core 7 240H (2455 - 3036, n=3) | |
| Acer Nitro V 15 ANV15-52-50S2 | |
| HP Victus 15-fa2160ng | |
| MSI Cyborg 15 B2RWEKG | |
| AIDA64 / CPU Queen | |
| Lenovo Legion 5 15AHP G10 | |
| Moyenne de la classe Gaming (49785 - 173351, n=133, 2 dernières années) | |
| Lenovo LOQ 15AHP10 | |
| MSI Cyborg 15 A12VF | |
| Moyenne Intel Core 7 240H (75356 - 86602, n=3) | |
| MSI Cyborg 15 B2RWEKG | |
| Acer Nitro V 15 ANV15-52-50S2 | |
| HP Victus 15-fa2160ng | |
| AIDA64 / FPU SinJulia | |
| Lenovo Legion 5 15AHP G10 | |
| Lenovo LOQ 15AHP10 | |
| Moyenne de la classe Gaming (4424 - 33636, n=133, 2 dernières années) | |
| MSI Cyborg 15 A12VF | |
| Moyenne Intel Core 7 240H (7777 - 8803, n=3) | |
| MSI Cyborg 15 B2RWEKG | |
| Acer Nitro V 15 ANV15-52-50S2 | |
| HP Victus 15-fa2160ng | |
| AIDA64 / FPU Mandel | |
| Moyenne de la classe Gaming (17585 - 128721, n=133, 2 dernières années) | |
| Lenovo Legion 5 15AHP G10 | |
| Lenovo LOQ 15AHP10 | |
| Moyenne Intel Core 7 240H (29381 - 35982, n=3) | |
| MSI Cyborg 15 A12VF | |
| Acer Nitro V 15 ANV15-52-50S2 | |
| MSI Cyborg 15 B2RWEKG | |
| HP Victus 15-fa2160ng | |
| AIDA64 / CPU AES | |
| Moyenne de la classe Gaming (19065 - 247074, n=133, 2 dernières années) | |
| Lenovo Legion 5 15AHP G10 | |
| Lenovo LOQ 15AHP10 | |
| MSI Cyborg 15 A12VF | |
| Moyenne Intel Core 7 240H (50528 - 61850, n=3) | |
| MSI Cyborg 15 B2RWEKG | |
| Acer Nitro V 15 ANV15-52-50S2 | |
| HP Victus 15-fa2160ng | |
| AIDA64 / CPU ZLib | |
| Moyenne de la classe Gaming (373 - 2531, n=133, 2 dernières années) | |
| Lenovo Legion 5 15AHP G10 | |
| Lenovo LOQ 15AHP10 | |
| MSI Cyborg 15 A12VF | |
| Moyenne Intel Core 7 240H (725 - 895, n=3) | |
| Acer Nitro V 15 ANV15-52-50S2 | |
| HP Victus 15-fa2160ng | |
| MSI Cyborg 15 B2RWEKG | |
| AIDA64 / FP64 Ray-Trace | |
| Lenovo Legion 5 15AHP G10 | |
| Moyenne de la classe Gaming (3856 - 45446, n=133, 2 dernières années) | |
| Lenovo LOQ 15AHP10 | |
| Moyenne Intel Core 7 240H (6389 - 8056, n=3) | |
| MSI Cyborg 15 A12VF | |
| Acer Nitro V 15 ANV15-52-50S2 | |
| MSI Cyborg 15 B2RWEKG | |
| HP Victus 15-fa2160ng | |
| AIDA64 / CPU PhotoWorxx | |
| Moyenne de la classe Gaming (10805 - 62916, n=133, 2 dernières années) | |
| Lenovo Legion 5 15AHP G10 | |
| MSI Cyborg 15 B2RWEKG | |
| MSI Cyborg 15 A12VF | |
| Moyenne Intel Core 7 240H (21710 - 39806, n=3) | |
| Lenovo LOQ 15AHP10 | |
| HP Victus 15-fa2160ng | |
| Acer Nitro V 15 ANV15-52-50S2 | |
Performance du système
Le Cyborg 15 se situe également dans la moyenne en ce qui concerne les performances du système. L'ordinateur réagit agréablement et rapidement dans le cadre d'une utilisation quotidienne.
PCMark 10: Productivity | Digital Content Creation
CrossMark: Overall | Productivity | Creativity | Responsiveness
WebXPRT 3: Overall
WebXPRT 4: Overall
Mozilla Kraken 1.1: Total
| Performance rating | |
| Moyenne de la classe Gaming | |
| Lenovo Legion 5 15AHP G10 | |
| MSI Cyborg 15 A12VF | |
| Lenovo LOQ 15AHP10 -2! | |
| MSI Cyborg 15 B2RWEKG | |
| Moyenne Intel Core 7 240H, NVIDIA GeForce RTX 5050 Laptop | |
| Acer Nitro V 15 ANV15-52-50S2 | |
| HP Victus 15-fa2160ng | |
| PCMark 10 / Productivity | |
| MSI Cyborg 15 B2RWEKG | |
| Moyenne Intel Core 7 240H, NVIDIA GeForce RTX 5050 Laptop (n=1) | |
| Acer Nitro V 15 ANV15-52-50S2 | |
| Lenovo Legion 5 15AHP G10 | |
| Moyenne de la classe Gaming (6662 - 16716, n=114, 2 dernières années) | |
| MSI Cyborg 15 A12VF | |
| Lenovo LOQ 15AHP10 | |
| HP Victus 15-fa2160ng | |
| PCMark 10 / Digital Content Creation | |
| Lenovo Legion 5 15AHP G10 | |
| Moyenne de la classe Gaming (7440 - 19351, n=114, 2 dernières années) | |
| Lenovo LOQ 15AHP10 | |
| MSI Cyborg 15 A12VF | |
| HP Victus 15-fa2160ng | |
| Acer Nitro V 15 ANV15-52-50S2 | |
| MSI Cyborg 15 B2RWEKG | |
| Moyenne Intel Core 7 240H, NVIDIA GeForce RTX 5050 Laptop (n=1) | |
| CrossMark / Overall | |
| Moyenne de la classe Gaming (1247 - 2344, n=112, 2 dernières années) | |
| MSI Cyborg 15 A12VF | |
| Lenovo Legion 5 15AHP G10 | |
| Lenovo LOQ 15AHP10 | |
| MSI Cyborg 15 B2RWEKG | |
| Moyenne Intel Core 7 240H, NVIDIA GeForce RTX 5050 Laptop (n=1) | |
| Acer Nitro V 15 ANV15-52-50S2 | |
| HP Victus 15-fa2160ng | |
| CrossMark / Productivity | |
| Moyenne de la classe Gaming (1299 - 2211, n=112, 2 dernières années) | |
| Lenovo LOQ 15AHP10 | |
| MSI Cyborg 15 A12VF | |
| Lenovo Legion 5 15AHP G10 | |
| MSI Cyborg 15 B2RWEKG | |
| Moyenne Intel Core 7 240H, NVIDIA GeForce RTX 5050 Laptop (n=1) | |
| Acer Nitro V 15 ANV15-52-50S2 | |
| HP Victus 15-fa2160ng | |
| CrossMark / Creativity | |
| Moyenne de la classe Gaming (1275 - 2729, n=112, 2 dernières années) | |
| Lenovo Legion 5 15AHP G10 | |
| MSI Cyborg 15 A12VF | |
| MSI Cyborg 15 B2RWEKG | |
| Moyenne Intel Core 7 240H, NVIDIA GeForce RTX 5050 Laptop (n=1) | |
| Lenovo LOQ 15AHP10 | |
| HP Victus 15-fa2160ng | |
| Acer Nitro V 15 ANV15-52-50S2 | |
| CrossMark / Responsiveness | |
| Moyenne de la classe Gaming (1030 - 2330, n=112, 2 dernières années) | |
| Lenovo LOQ 15AHP10 | |
| MSI Cyborg 15 A12VF | |
| Lenovo Legion 5 15AHP G10 | |
| MSI Cyborg 15 B2RWEKG | |
| Moyenne Intel Core 7 240H, NVIDIA GeForce RTX 5050 Laptop (n=1) | |
| Acer Nitro V 15 ANV15-52-50S2 | |
| HP Victus 15-fa2160ng | |
| WebXPRT 3 / Overall | |
| Moyenne de la classe Gaming (237 - 532, n=115, 2 dernières années) | |
| Lenovo Legion 5 15AHP G10 | |
| MSI Cyborg 15 A12VF | |
| MSI Cyborg 15 B2RWEKG | |
| Moyenne Intel Core 7 240H, NVIDIA GeForce RTX 5050 Laptop (n=1) | |
| HP Victus 15-fa2160ng | |
| Acer Nitro V 15 ANV15-52-50S2 | |
| WebXPRT 4 / Overall | |
| Moyenne de la classe Gaming (176.4 - 345, n=112, 2 dernières années) | |
| Lenovo Legion 5 15AHP G10 | |
| MSI Cyborg 15 B2RWEKG | |
| Moyenne Intel Core 7 240H, NVIDIA GeForce RTX 5050 Laptop (n=1) | |
| MSI Cyborg 15 A12VF | |
| HP Victus 15-fa2160ng | |
| Acer Nitro V 15 ANV15-52-50S2 | |
| Mozilla Kraken 1.1 / Total | |
| Acer Nitro V 15 ANV15-52-50S2 | |
| HP Victus 15-fa2160ng | |
| MSI Cyborg 15 A12VF | |
| MSI Cyborg 15 B2RWEKG | |
| Moyenne Intel Core 7 240H, NVIDIA GeForce RTX 5050 Laptop (n=1) | |
| Lenovo LOQ 15AHP10 | |
| Lenovo Legion 5 15AHP G10 | |
| Moyenne de la classe Gaming (397 - 674, n=124, 2 dernières années) | |
* ... Moindre est la valeur, meilleures sont les performances
| AIDA64 / Memory Copy | |
| Moyenne de la classe Gaming (21750 - 108104, n=133, 2 dernières années) | |
| Lenovo Legion 5 15AHP G10 | |
| MSI Cyborg 15 B2RWEKG | |
| MSI Cyborg 15 A12VF | |
| Moyenne Intel Core 7 240H (34965 - 63992, n=3) | |
| Lenovo LOQ 15AHP10 | |
| HP Victus 15-fa2160ng | |
| Acer Nitro V 15 ANV15-52-50S2 | |
| AIDA64 / Memory Read | |
| Moyenne de la classe Gaming (22956 - 104349, n=133, 2 dernières années) | |
| MSI Cyborg 15 B2RWEKG | |
| MSI Cyborg 15 A12VF | |
| Lenovo Legion 5 15AHP G10 | |
| Moyenne Intel Core 7 240H (39706 - 71870, n=3) | |
| HP Victus 15-fa2160ng | |
| Lenovo LOQ 15AHP10 | |
| Acer Nitro V 15 ANV15-52-50S2 | |
| AIDA64 / Memory Write | |
| Lenovo Legion 5 15AHP G10 | |
| Moyenne de la classe Gaming (22297 - 133486, n=133, 2 dernières années) | |
| MSI Cyborg 15 B2RWEKG | |
| MSI Cyborg 15 A12VF | |
| Moyenne Intel Core 7 240H (33560 - 60252, n=3) | |
| Lenovo LOQ 15AHP10 | |
| HP Victus 15-fa2160ng | |
| Acer Nitro V 15 ANV15-52-50S2 | |
| AIDA64 / Memory Latency | |
| HP Victus 15-fa2160ng | |
| MSI Cyborg 15 B2RWEKG | |
| Moyenne de la classe Gaming (59.5 - 259, n=133, 2 dernières années) | |
| Moyenne Intel Core 7 240H (98.3 - 106.5, n=3) | |
| Acer Nitro V 15 ANV15-52-50S2 | |
| Lenovo LOQ 15AHP10 | |
| Lenovo Legion 5 15AHP G10 | |
| MSI Cyborg 15 A12VF | |
* ... Moindre est la valeur, meilleures sont les performances
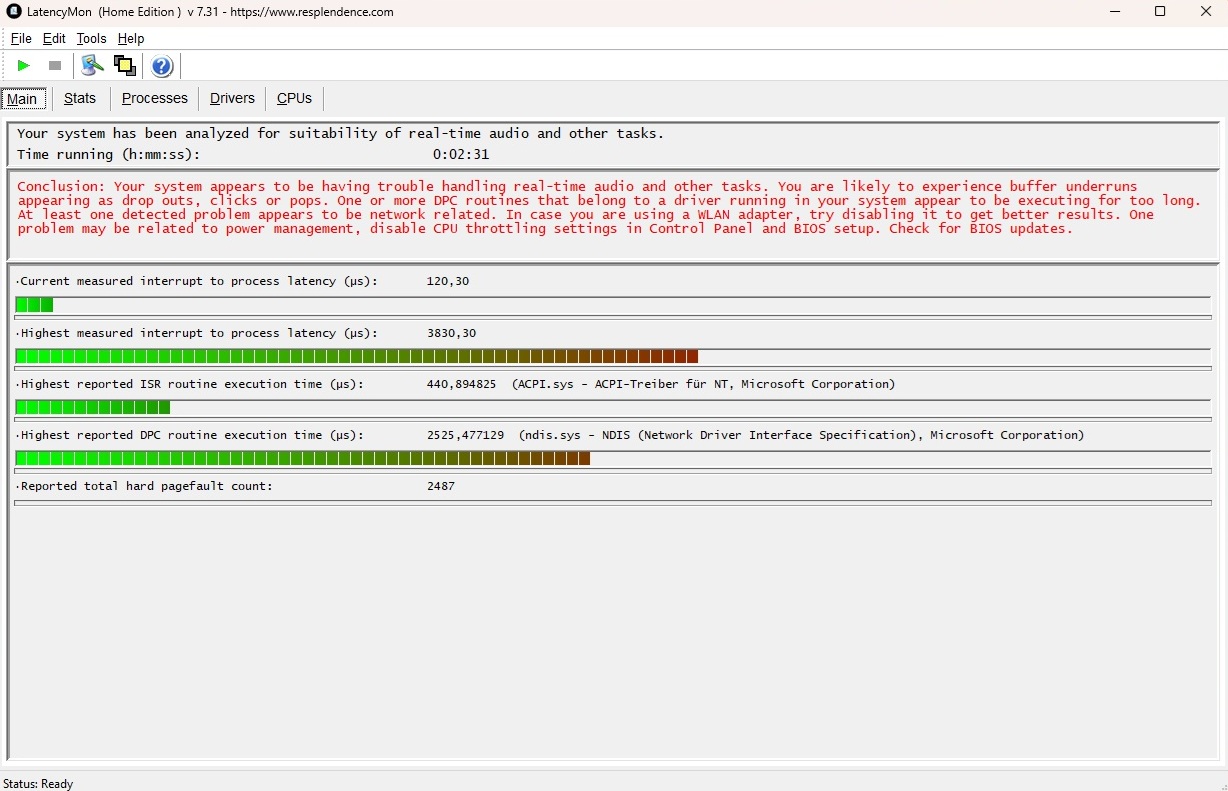
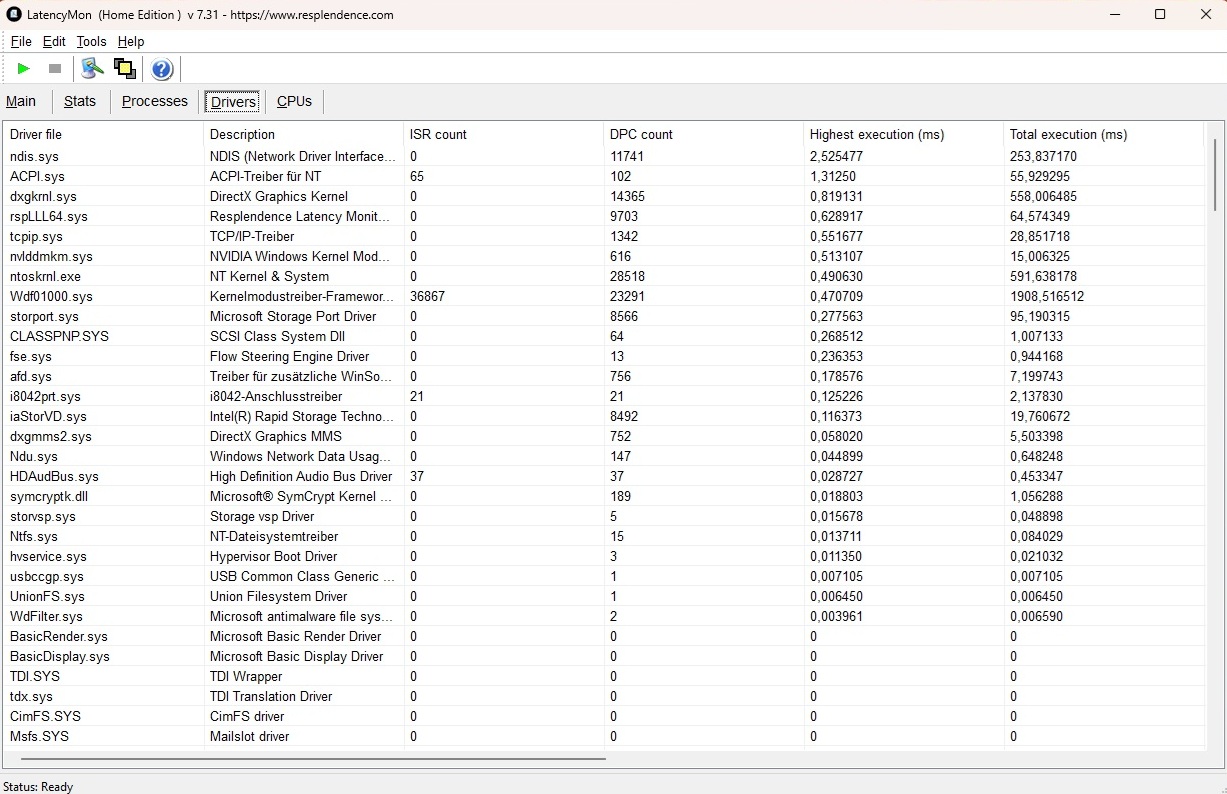
Latences DPC
Comme c'est souvent le cas, il y a du retard à rattraper en matière de latence. Toutefois, de nombreux ordinateurs portables ne sont pas à la hauteur, comme le montre le tableau.
| DPC Latencies / LatencyMon - interrupt to process latency (max), Web, Youtube, Prime95 | |
| MSI Cyborg 15 B2RWEKG | |
| Acer Nitro V 15 ANV15-52-50S2 | |
| HP Victus 15-fa2160ng | |
| Lenovo Legion 5 15AHP G10 | |
| Lenovo LOQ 15AHP10 | |
| MSI Cyborg 15 A12VF | |
* ... Moindre est la valeur, meilleures sont les performances
Mémoire de masse
512 Go de capacité de stockage, c'est un peu maigre en 2026. Néanmoins, le SSD NVMe intégré de Western Digital est relativement rapide et a également fourni une performance assez constante dans le test d'endurance, ce qui n'est pas le cas de tous les concurrents.

| Drive Performance rating - Percent | |
| Lenovo Legion 5 15AHP G10 | |
| Lenovo LOQ 15AHP10 | |
| Moyenne de la classe Gaming | |
| MSI Cyborg 15 A12VF | |
| Acer Nitro V 15 ANV15-52-50S2 | |
| Moyenne Western Digital PC SN5000S SDEPMSJ-512G | |
| MSI Cyborg 15 B2RWEKG | |
| HP Victus 15-fa2160ng | |
* ... Moindre est la valeur, meilleures sont les performances
Performances en lecture continue : Boucle de lecture DiskSpd, profondeur de la file d'attente 8
Performance du GPU
La GeForce RTX 5050 marque l'entrée de Nvidia dans le monde du jeu mobile. Alors que la puce Blackwell est spécifiée avec jusqu'à 100 watts TGP dans d'autres appareils, le Cyborg 15 n'atteint qu'un maximum de 45 watts - une valeur plutôt maigre. Il n'est donc pas surprenant que le modèle 15 pouces soit un peu moins de 20% derrière ses homologues RTX 5050 au niveau du GPU et même légèrement derrière son prédécesseur avec la RTX 4060.
| 3DMark Performance rating - Percent | |
| Moyenne de la classe Gaming | |
| Lenovo Legion 5 15AHP G10 | |
| Lenovo LOQ 15AHP10 | |
| HP Victus 15-fa2160ng | |
| Moyenne NVIDIA GeForce RTX 5050 Laptop | |
| Acer Nitro V 15 ANV15-52-50S2 | |
| MSI Cyborg 15 A12VF | |
| MSI Cyborg 15 B2RWEKG | |
| 3DMark 11 - 1280x720 Performance GPU | |
| Moyenne de la classe Gaming (16033 - 80022, n=128, 2 dernières années) | |
| Lenovo Legion 5 15AHP G10 | |
| Lenovo LOQ 15AHP10 | |
| HP Victus 15-fa2160ng | |
| Acer Nitro V 15 ANV15-52-50S2 | |
| Moyenne NVIDIA GeForce RTX 5050 Laptop (21841 - 33119, n=7) | |
| MSI Cyborg 15 A12VF | |
| MSI Cyborg 15 B2RWEKG | |
| 3DMark | |
| 1920x1080 Fire Strike Graphics | |
| Moyenne de la classe Gaming (12242 - 62849, n=140, 2 dernières années) | |
| Lenovo Legion 5 15AHP G10 | |
| Lenovo LOQ 15AHP10 | |
| HP Victus 15-fa2160ng | |
| Moyenne NVIDIA GeForce RTX 5050 Laptop (20726 - 28040, n=9) | |
| Acer Nitro V 15 ANV15-52-50S2 | |
| MSI Cyborg 15 A12VF | |
| MSI Cyborg 15 B2RWEKG | |
| 2560x1440 Time Spy Graphics | |
| Moyenne de la classe Gaming (4310 - 25984, n=137, 2 dernières années) | |
| Lenovo Legion 5 15AHP G10 | |
| Lenovo LOQ 15AHP10 | |
| HP Victus 15-fa2160ng | |
| Moyenne NVIDIA GeForce RTX 5050 Laptop (7166 - 9828, n=8) | |
| Acer Nitro V 15 ANV15-52-50S2 | |
| MSI Cyborg 15 A12VF | |
| MSI Cyborg 15 B2RWEKG | |
| 2560x1440 Port Royal Graphics | |
| Moyenne de la classe Gaming (984 - 16978, n=77, 2 dernières années) | |
| Lenovo Legion 5 15AHP G10 | |
| Lenovo LOQ 15AHP10 | |
| HP Victus 15-fa2160ng | |
| Acer Nitro V 15 ANV15-52-50S2 | |
| Moyenne NVIDIA GeForce RTX 5050 Laptop (4395 - 6027, n=7) | |
| MSI Cyborg 15 B2RWEKG | |
| MSI Cyborg 15 A12VF | |
| 3DMark 11 Performance | 20180 points | |
| 3DMark Cloud Gate Standard Score | 49085 points | |
| 3DMark Fire Strike Score | 18022 points | |
| 3DMark Time Spy Score | 7561 points | |
Aide | ||
| Blender | |
| v3.3 Classroom OPTIX/RTX | |
| Moyenne NVIDIA GeForce RTX 5050 Laptop (24 - 242, n=9) | |
| MSI Cyborg 15 B2RWEKG | |
| Acer Nitro V 15 ANV15-52-50S2 | |
| HP Victus 15-fa2160ng | |
| MSI Cyborg 15 A12VF | |
| Lenovo LOQ 15AHP10 | |
| Lenovo Legion 5 15AHP G10 | |
| Moyenne de la classe Gaming (9 - 95, n=130, 2 dernières années) | |
| v3.3 Classroom CUDA | |
| Moyenne NVIDIA GeForce RTX 5050 Laptop (49 - 214, n=10) | |
| MSI Cyborg 15 B2RWEKG | |
| MSI Cyborg 15 A12VF | |
| Acer Nitro V 15 ANV15-52-50S2 | |
| HP Victus 15-fa2160ng | |
| Lenovo LOQ 15AHP10 | |
| Lenovo Legion 5 15AHP G10 | |
| Moyenne de la classe Gaming (15 - 228, n=135, 2 dernières années) | |
* ... Moindre est la valeur, meilleures sont les performances
Performances des jeux
La situation est similaire dans les benchmarks de jeux, bien que l'Acer Nitro V 15 soit également plus faible dans ce domaine. Si vous vous limitez à la résolution native de 1.920 x 1.080 pixels, la plupart des jeux actuels fonctionnent au moins de manière fluide avec des détails moyens à élevés. Si vous souhaitez tirer davantage de FPS du système, vous pouvez utiliser des fonctions telles que l'upscaling comme d'habitude. Y compris DLSS équilibré Black Ops 7 tourne à 40 FPS au lieu de 24 FPS lorsque vous utilisez le préréglage Extrême, par exemple. La quadruple génération d'images catapulte même les performances jusqu'à un impressionnant 103 FPS, bien que la sensation subjective de vitesse puisse varier légèrement.
| Performance rating - Percent | |
| Moyenne de la classe Gaming | |
| Lenovo Legion 5 15AHP G10 | |
| MSI Cyborg 15 A12VF -2! | |
| Lenovo LOQ 15AHP10 | |
| Moyenne NVIDIA GeForce RTX 5050 Laptop | |
| HP Victus 15-fa2160ng | |
| MSI Cyborg 15 B2RWEKG | |
| Acer Nitro V 15 ANV15-52-50S2 -1! | |
| Cyberpunk 2077 - 1920x1080 Ultra Preset (FSR off) | |
| Moyenne de la classe Gaming (17.7 - 169.9, n=138, 2 dernières années) | |
| Lenovo Legion 5 15AHP G10 | |
| Lenovo LOQ 15AHP10 | |
| HP Victus 15-fa2160ng | |
| Moyenne NVIDIA GeForce RTX 5050 Laptop (55.3 - 76.9, n=8) | |
| Acer Nitro V 15 ANV15-52-50S2 | |
| MSI Cyborg 15 B2RWEKG | |
| Baldur's Gate 3 - 1920x1080 Ultra Preset AA:T | |
| Moyenne de la classe Gaming (37.2 - 246, n=114, 2 dernières années) | |
| Lenovo Legion 5 15AHP G10 | |
| Lenovo LOQ 15AHP10 | |
| HP Victus 15-fa2160ng | |
| Moyenne NVIDIA GeForce RTX 5050 Laptop (59.4 - 100.5, n=8) | |
| Acer Nitro V 15 ANV15-52-50S2 | |
| MSI Cyborg 15 B2RWEKG | |
| Dota 2 Reborn - 1920x1080 ultra (3/3) best looking | |
| Moyenne de la classe Gaming (65.1 - 248, n=133, 2 dernières années) | |
| MSI Cyborg 15 A12VF | |
| Lenovo Legion 5 15AHP G10 | |
| Lenovo LOQ 15AHP10 | |
| Moyenne NVIDIA GeForce RTX 5050 Laptop (84.8 - 144.6, n=8) | |
| HP Victus 15-fa2160ng | |
| Acer Nitro V 15 ANV15-52-50S2 | |
| MSI Cyborg 15 B2RWEKG | |
| X-Plane 11.11 - 1920x1080 high (fps_test=3) | |
| Moyenne de la classe Gaming (33.4 - 150.2, n=136, 2 dernières années) | |
| MSI Cyborg 15 A12VF | |
| Lenovo Legion 5 15AHP G10 | |
| Moyenne NVIDIA GeForce RTX 5050 Laptop (65.5 - 87.2, n=8) | |
| Lenovo LOQ 15AHP10 | |
| Acer Nitro V 15 ANV15-52-50S2 | |
| MSI Cyborg 15 B2RWEKG | |
| HP Victus 15-fa2160ng | |
| Bas | Moyen | Élevé | Ultra | |
|---|---|---|---|---|
| GTA V (2015) | 175.1 | 162 | 93.6 | |
| Dota 2 Reborn (2015) | 99.5 | 82.8 | 84.8 | |
| X-Plane 11.11 (2018) | 80.4 | 66.9 | ||
| Baldur's Gate 3 (2023) | 76.3 | 66.1 | 59.4 | |
| Cyberpunk 2077 (2023) | 76 | 62.6 | 55.3 | |
| Stalker 2 (2024) | 46.4 | 40.2 | 28.8 | |
| Indiana Jones and the Great Circle (2024) | 59.5 | 50.1 | 30.6 | |
| Monster Hunter Wilds (2025) | 45.5 | 41.4 | 32.1 | |
| The Outer Worlds 2 (2025) | 64.8 | 51.1 | 26.4 | |
| ARC Raiders (2025) | 81.7 | 64.5 | 43.5 | |
| Anno 117: Pax Romana (2025) | 56 | 40.7 | 20.2 | |
| Call of Duty Black Ops 7 (2025) | 87 | 70 | 24 |
| Call of Duty Black Ops 7 | |
| 1920x1080 Extreme Preset + Raytracing | |
| Moyenne de la classe Gaming (2 - 60, n=9, 2 dernières années) | |
| Tulpar T6 V3.5 | |
| Acer Nitro V14 AI ANV14-62-R9LT | |
| Moyenne NVIDIA GeForce RTX 5050 Laptop (24 - 27, n=2) | |
| MSI Cyborg 15 B2RWEKG | |
| 1920x1080 Ultra Preset | |
| Moyenne de la classe Gaming (53 - 151, n=9, 2 dernières années) | |
| Tulpar T6 V3.5 | |
| Acer Nitro V14 AI ANV14-62-R9LT | |
| Moyenne NVIDIA GeForce RTX 5050 Laptop (70 - 75, n=2) | |
| MSI Cyborg 15 B2RWEKG | |
| ARC Raiders | |
| 1920x1080 Epic Preset + Epic Raytracing AA:TSR | |
| Tulpar T6 V3.5 | |
| Moyenne de la classe Gaming (23.9 - 79.8, n=7, 2 dernières années) | |
| Acer Nitro V14 AI ANV14-62-R9LT | |
| Moyenne NVIDIA GeForce RTX 5050 Laptop (43.5 - 49.2, n=3) | |
| MSI Cyborg 15 B2RWEKG | |
| 1920x1080 High Preset AA:TSR | |
| Tulpar T6 V3.5 | |
| Moyenne de la classe Gaming (40.9 - 114.5, n=7, 2 dernières années) | |
| Acer Nitro V14 AI ANV14-62-R9LT | |
| Moyenne NVIDIA GeForce RTX 5050 Laptop (64.5 - 71.5, n=3) | |
| MSI Cyborg 15 B2RWEKG | |
Cyberpunk 2077 ultra FPS chart
Émissions
Émissions sonores
Comme le CPU et le GPU n'atteignent pas leurs valeurs maximales, le 15 pouces reste plus silencieux que la plupart de ses concurrents lorsqu'il est sollicité. 45 dB(A) dans Cyberpunk 2077 est clairement audible, mais pas dérangeant. En mode veille, le Cyborg 15 est relativement silencieux pendant de longues périodes, et le ventilateur est même parfois complètement éteint.
Degré de la nuisance sonore
| Au repos |
| 25 / 28 / 33 dB(A) |
| Fortement sollicité |
| 44 / 50 dB(A) |
 | ||
30 dB silencieux 40 dB(A) audible 50 dB(A) bruyant |
||
min: | ||
| MSI Cyborg 15 B2RWEKG Core 7 240H, GeForce RTX 5050 Laptop | MSI Cyborg 15 A12VF i7-12650H, GeForce RTX 4060 Laptop GPU | Acer Nitro V 15 ANV15-52-50S2 i5-13420H, GeForce RTX 5050 Laptop | HP Victus 15-fa2160ng i5-13420H, GeForce RTX 5050 Laptop | Lenovo LOQ 15AHP10 R7 250, GeForce RTX 5060 Laptop | Lenovo Legion 5 15AHP G10 R7 260, GeForce RTX 5060 Laptop | |
|---|---|---|---|---|---|---|
| Noise | -19% | -7% | 1% | -32% | 4% | |
| arrêt / environnement * (dB) | 24 | 27 -13% | 24 -0% | 24 -0% | 25 -4% | 25.5 -6% |
| Idle Minimum * (dB) | 25 | 27 -8% | 28 -12% | 28 -12% | 43 -72% | 25.5 -2% |
| Idle Average * (dB) | 28 | 37.5 -34% | 29 -4% | 29 -4% | 45 -61% | 25.5 9% |
| Idle Maximum * (dB) | 33 | 38 -15% | 33 -0% | 30 9% | 48 -45% | 26.9 18% |
| Load Average * (dB) | 44 | 56.3 -28% | 48 -9% | 40 9% | 53 -20% | 34.6 21% |
| Cyberpunk 2077 ultra * (dB) | 45 | 52 -16% | 46 -2% | 51 -13% | 50.1 -11% | |
| Load Maximum * (dB) | 50 | 56.3 -13% | 54 -8% | 48 4% | 53 -6% | 50.1 -0% |
* ... Moindre est la valeur, meilleures sont les performances
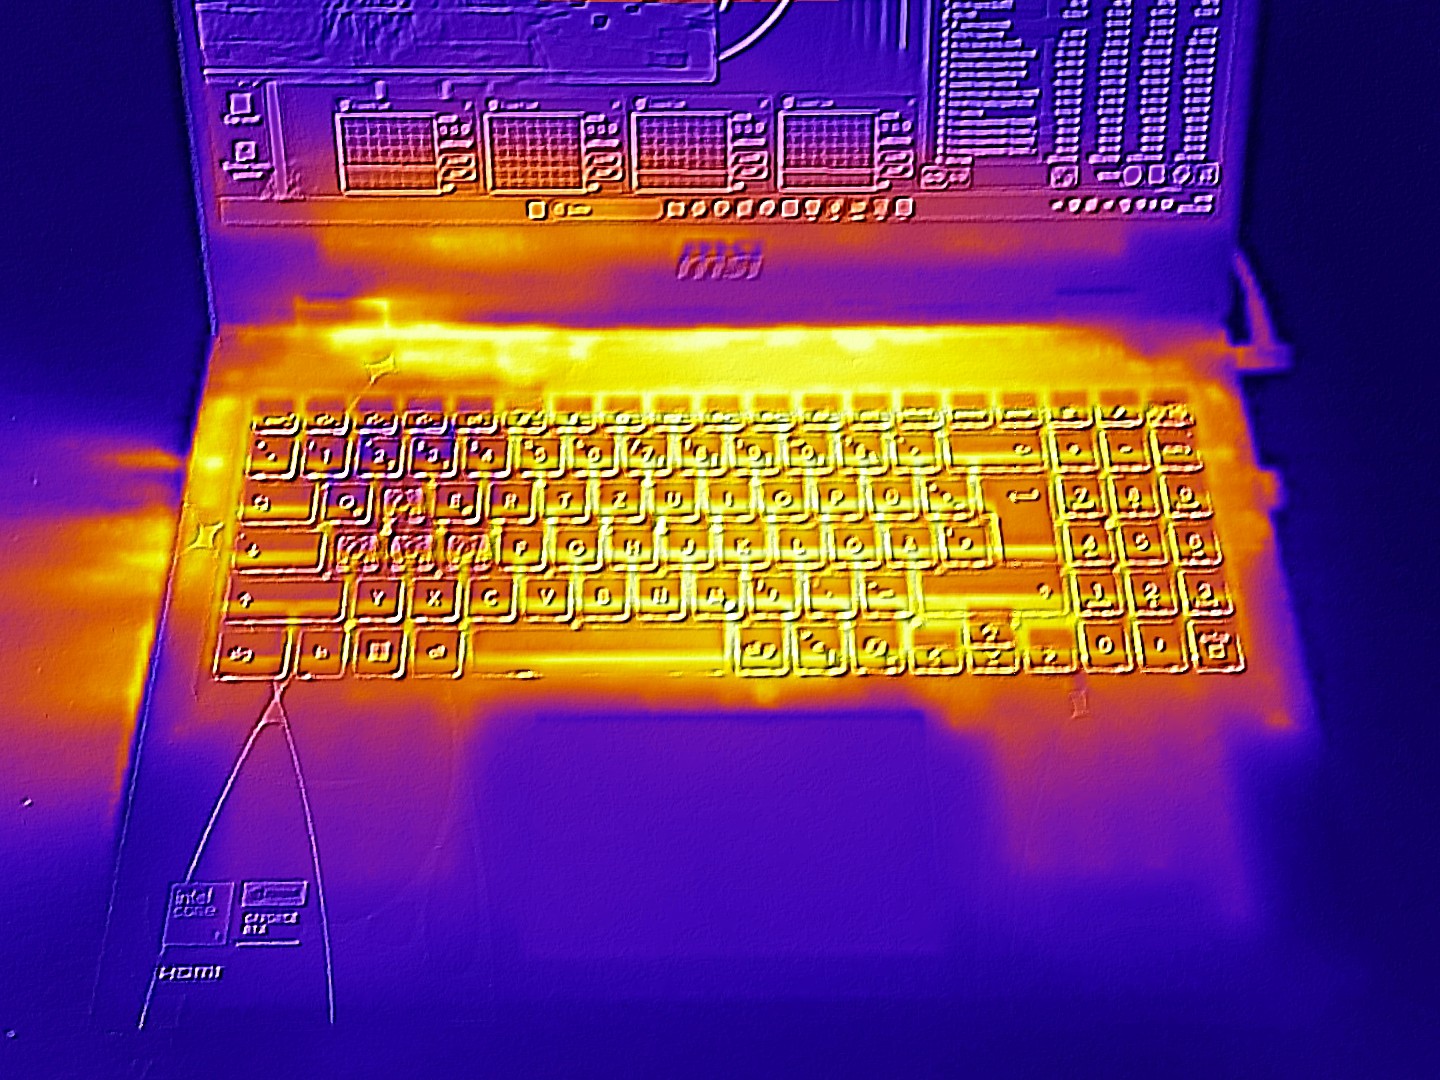
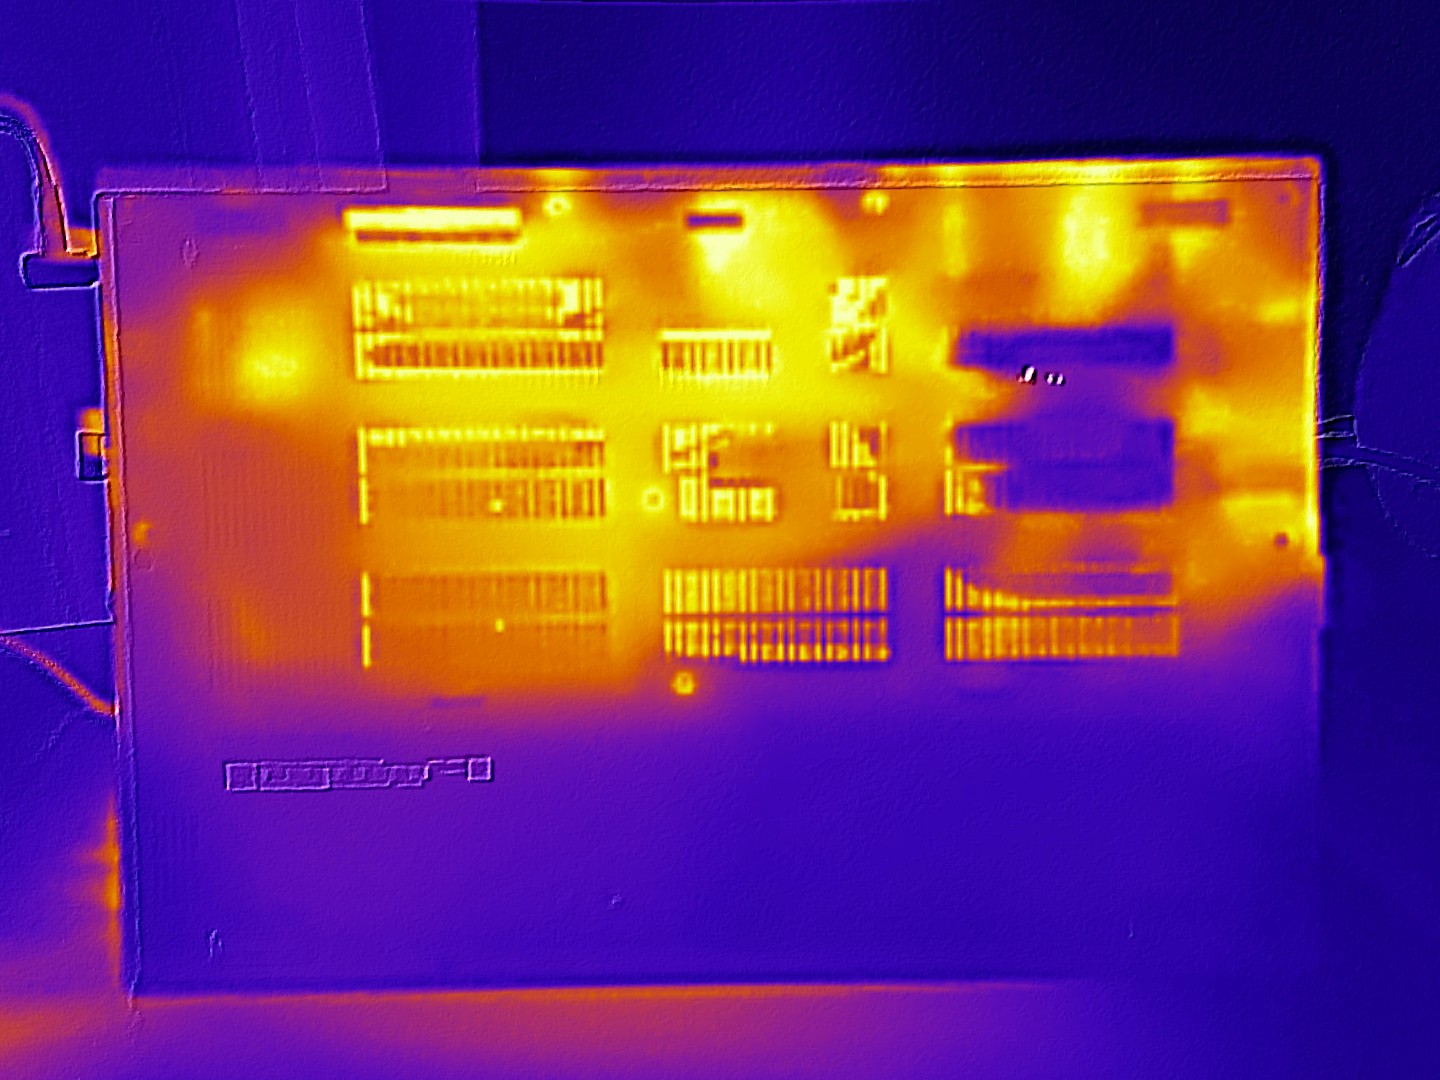
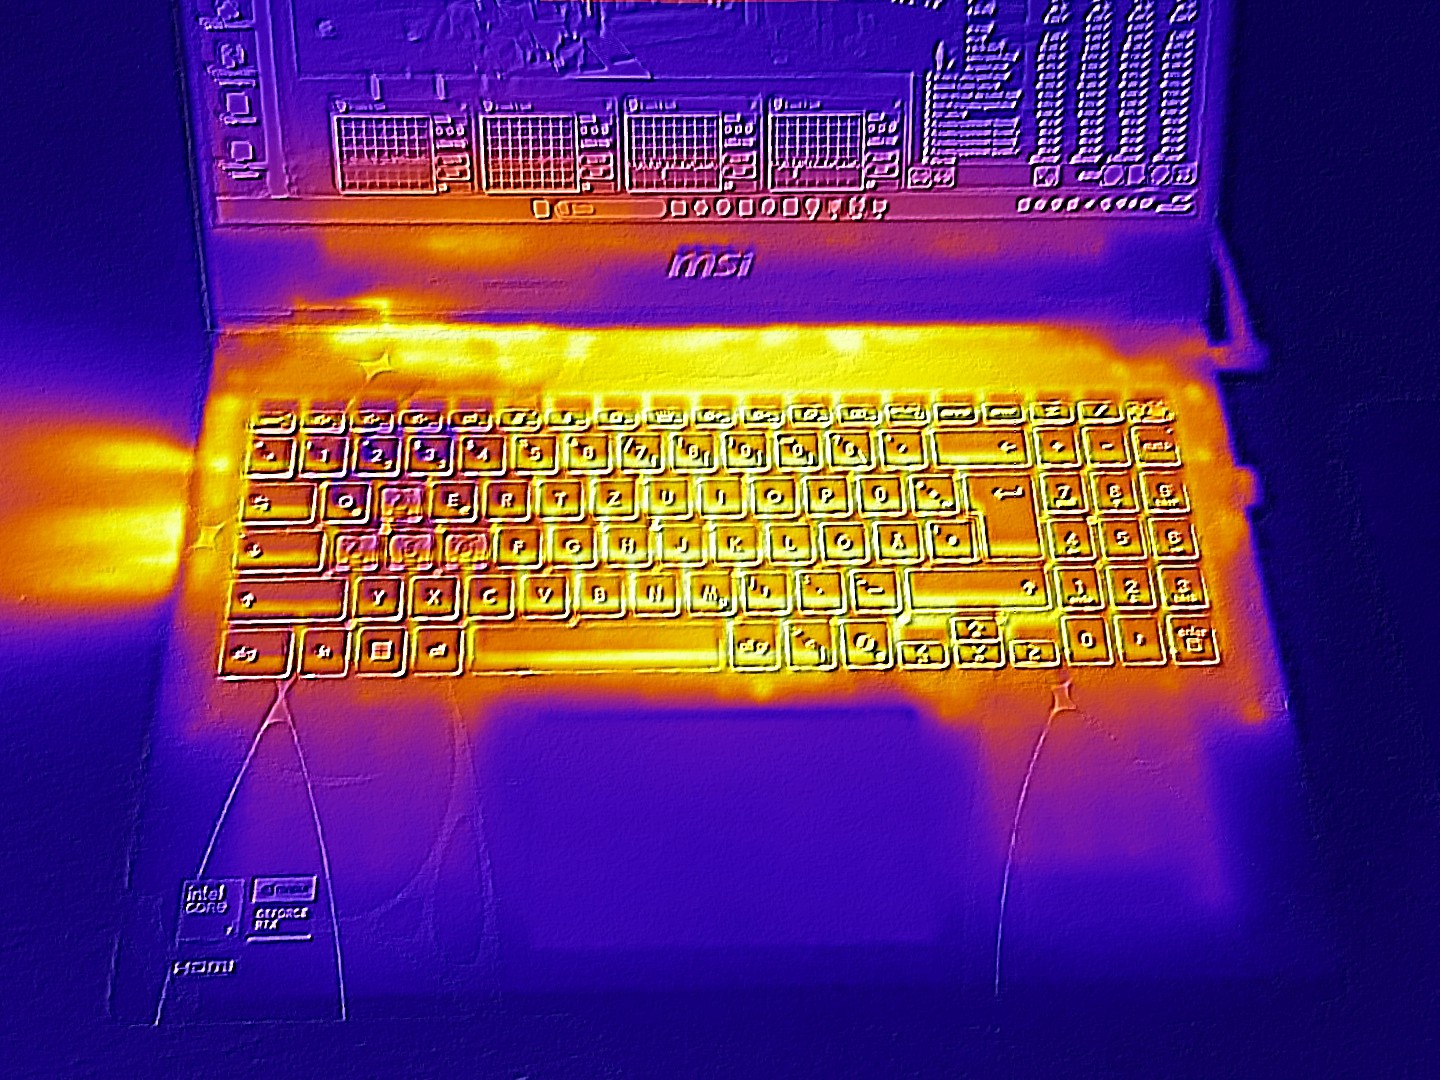
Température
Les températures sont également correctes. Le haut et le bas de l'écran chauffent jusqu'à un maximum de 46 et 45 °C respectivement sous forte charge. Certaines faiblesses sont évidentes en mode ralenti, où le Cyborg 15 a tendance à être plus chaud que ses concurrents.
(-) La température maximale du côté supérieur est de 46 °C / 115 F, par rapport à la moyenne de 40.4 °C / 105 F, allant de 21.2 à 68.8 °C pour la classe Gaming.
(±) Le fond chauffe jusqu'à un maximum de 45 °C / 113 F, contre une moyenne de 43.3 °C / 110 F
(±) En utilisation inactive, la température moyenne du côté supérieur est de 32.6 °C / 91 F, par rapport à la moyenne du dispositif de 33.9 °C / 93 F.
(-) 3: The average temperature for the upper side is 39 °C / 102 F, compared to the average of 33.9 °C / 93 F for the class Gaming.
(+) Les repose-poignets et le pavé tactile atteignent la température maximale de la peau (32 °C / 89.6 F) et ne sont donc pas chauds.
(-) La température moyenne de la zone de l'appui-paume de dispositifs similaires était de 28.8 °C / 83.8 F (-3.2 °C / #-5.8 F).
| MSI Cyborg 15 B2RWEKG Core 7 240H, GeForce RTX 5050 Laptop | MSI Cyborg 15 A12VF i7-12650H, GeForce RTX 4060 Laptop GPU | Acer Nitro V 15 ANV15-52-50S2 i5-13420H, GeForce RTX 5050 Laptop | HP Victus 15-fa2160ng i5-13420H, GeForce RTX 5050 Laptop | Lenovo LOQ 15AHP10 R7 250, GeForce RTX 5060 Laptop | Lenovo Legion 5 15AHP G10 R7 260, GeForce RTX 5060 Laptop | |
|---|---|---|---|---|---|---|
| Heat | 16% | 9% | 9% | -0% | 9% | |
| Maximum Upper Side * (°C) | 46 | 47.5 -3% | 46 -0% | 43 7% | 49 -7% | 42.2 8% |
| Maximum Bottom * (°C) | 45 | 35.5 21% | 49 -9% | 43 4% | 58 -29% | 51.7 -15% |
| Idle Upper Side * (°C) | 36 | 27.7 23% | 28 22% | 37 -3% | 32 11% | 28.5 21% |
| Idle Bottom * (°C) | 38 | 29.5 22% | 30 21% | 28 26% | 29 24% | 29.2 23% |
* ... Moindre est la valeur, meilleures sont les performances
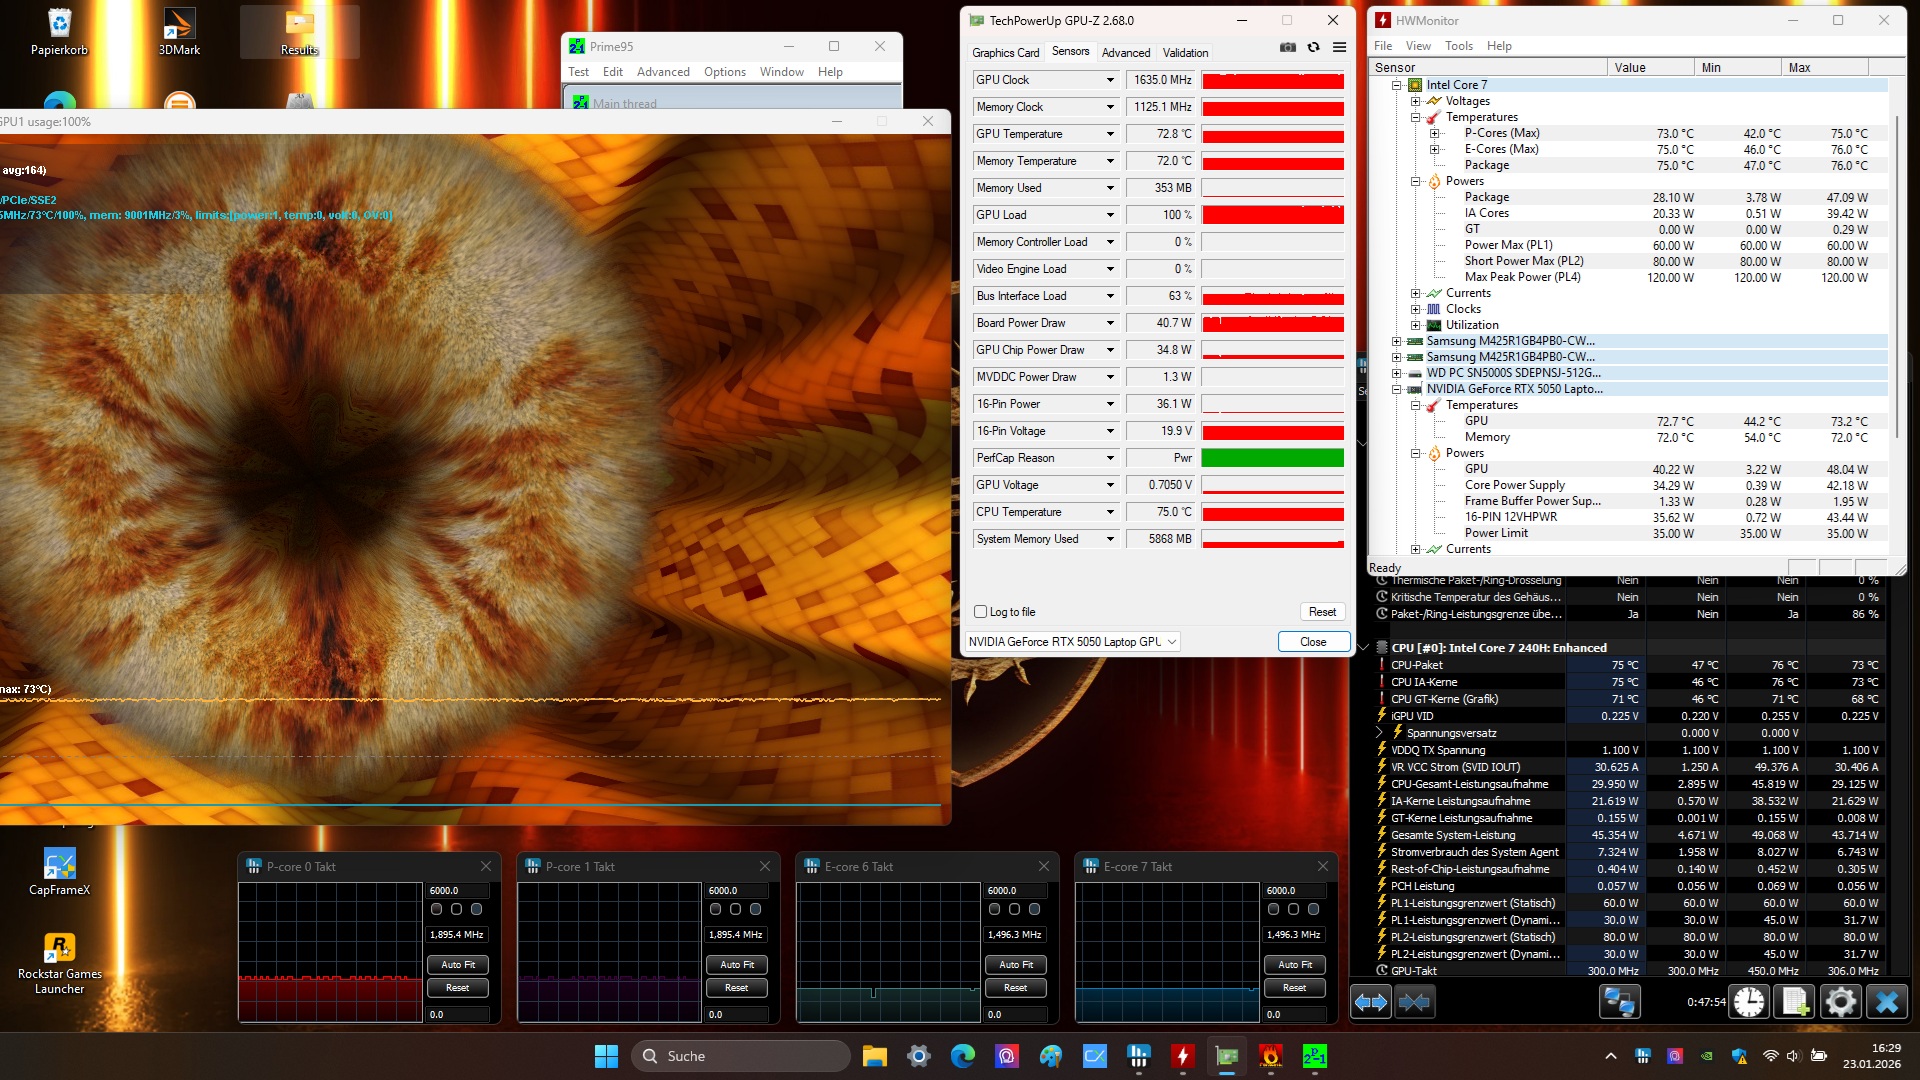
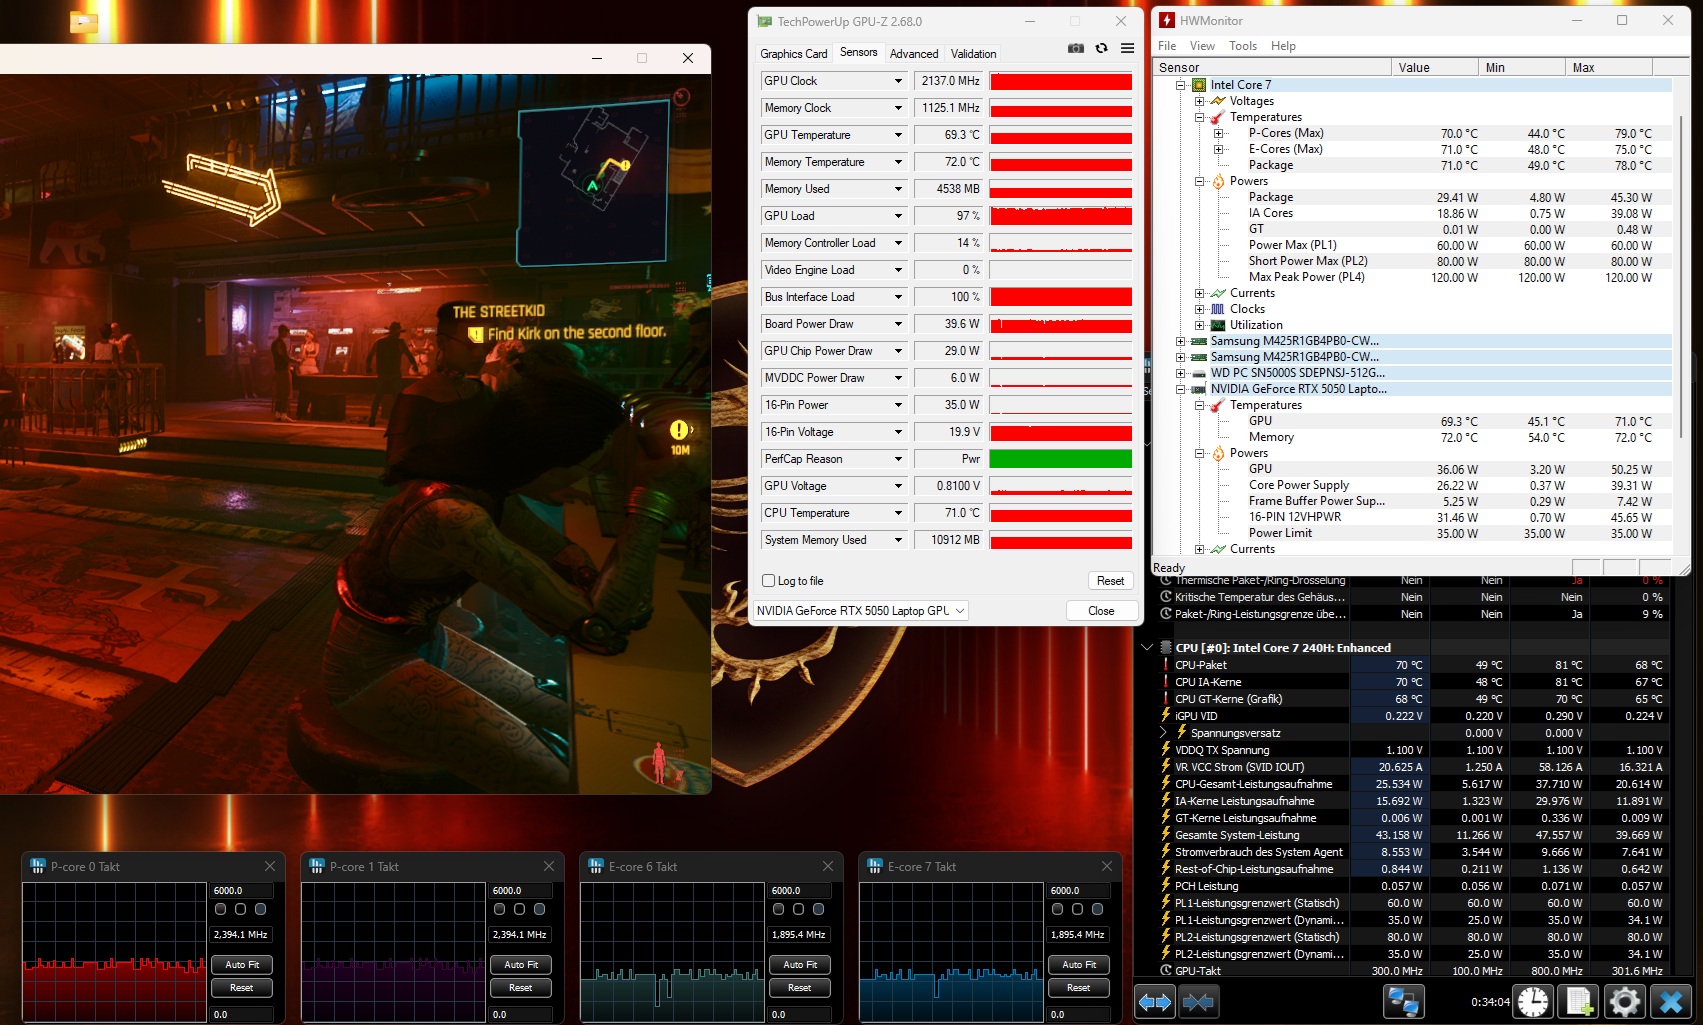
Épreuve d'effort
Lors du test de stress avec les outils FurMark et Prime95, le Core 7 240H et la GeForce RTX 5050 se sont stabilisés à une température modérée de 73 °C (163,4 °F).
Intervenants
Les haut-parleurs sont légèrement supérieurs à la moyenne des jeux, bien que le Cyborg 15 souffre également d'une faiblesse des basses.
MSI Cyborg 15 B2RWEKG analyse audio
(+) | les haut-parleurs peuvent jouer relativement fort (87# dB)
Basses 100 - 315 Hz
(-) | presque aucune basse - en moyenne 23.6% plus bas que la médiane
(±) | la linéarité des basses est moyenne (12.5% delta à la fréquence précédente)
Médiums 400 - 2000 Hz
(+) | médiane équilibrée - seulement 2.9% de la médiane
(+) | les médiums sont linéaires (5.3% delta à la fréquence précédente)
Aiguës 2 - 16 kHz
(+) | des sommets équilibrés - à seulement 3.8% de la médiane
(+) | les aigus sont linéaires (5.1% delta à la fréquence précédente)
Globalement 100 - 16 000 Hz
(+) | le son global est linéaire (14.1% différence à la médiane)
Par rapport à la même classe
» 24% de tous les appareils testés de cette catégorie étaient meilleurs, 8% similaires, 69% pires
» Le meilleur avait un delta de 6%, la moyenne était de 18%, le pire était de 132%.
Par rapport à tous les appareils testés
» 16% de tous les appareils testés étaient meilleurs, 4% similaires, 80% pires
» Le meilleur avait un delta de 4%, la moyenne était de 24%, le pire était de 134%.
Acer Nitro V 15 ANV15-52-50S2 analyse audio
(+) | les haut-parleurs peuvent jouer relativement fort (83# dB)
Basses 100 - 315 Hz
(-) | presque aucune basse - en moyenne 27.5% plus bas que la médiane
(-) | les basses ne sont pas linéaires (15% delta à la fréquence précédente)
Médiums 400 - 2000 Hz
(+) | médiane équilibrée - seulement 4.7% de la médiane
(+) | les médiums sont linéaires (4.4% delta à la fréquence précédente)
Aiguës 2 - 16 kHz
(+) | des sommets équilibrés - à seulement 2% de la médiane
(+) | les aigus sont linéaires (4.5% delta à la fréquence précédente)
Globalement 100 - 16 000 Hz
(±) | la linéarité du son global est moyenne (17.9% de différence avec la médiane)
Par rapport à la même classe
» 54% de tous les appareils testés de cette catégorie étaient meilleurs, 9% similaires, 37% pires
» Le meilleur avait un delta de 6%, la moyenne était de 18%, le pire était de 132%.
Par rapport à tous les appareils testés
» 36% de tous les appareils testés étaient meilleurs, 8% similaires, 56% pires
» Le meilleur avait un delta de 4%, la moyenne était de 24%, le pire était de 134%.
Gestion de l'énergie
Consommation d'énergie
Si la consommation en veille n'est pas aberrante, l'ordinateur portable de 15 pouces est relativement économe en charge par rapport aux autres ordinateurs portables RTX 5050.
| Éteint/en veille | |
| Au repos | |
| Fortement sollicité |
|
Légende:
min: | |
| MSI Cyborg 15 B2RWEKG Core 7 240H, GeForce RTX 5050 Laptop | MSI Cyborg 15 A12VF i7-12650H, GeForce RTX 4060 Laptop GPU | Acer Nitro V 15 ANV15-52-50S2 i5-13420H, GeForce RTX 5050 Laptop | HP Victus 15-fa2160ng i5-13420H, GeForce RTX 5050 Laptop | Lenovo LOQ 15AHP10 R7 250, GeForce RTX 5060 Laptop | Lenovo Legion 5 15AHP G10 R7 260, GeForce RTX 5060 Laptop | Moyenne de la classe Gaming | |
|---|---|---|---|---|---|---|---|
| Power Consumption | 29% | -6% | -3% | -35% | -18% | -41% | |
| Idle Minimum * (Watt) | 14.9 | 6 60% | 16.8 -13% | 7.9 47% | 20 -34% | 6.9 54% | 13.8 ? 7% |
| Idle Average * (Watt) | 16.3 | 8.8 46% | 17.6 -8% | 9.2 44% | 20.7 -27% | 10.7 34% | 19.6 ? -20% |
| Idle Maximum * (Watt) | 22.2 | 11.9 46% | 19.8 11% | 13.5 39% | 22.7 -2% | 11.3 49% | 25.8 ? -16% |
| Load Average * (Watt) | 72 | 89 -24% | 66 8% | 78 -8% | 71 1% | 69.7 3% | 110.5 ? -53% |
| Cyberpunk 2077 ultra * (Watt) | 90.3 | 106.5 -18% | 128.4 -42% | 153.1 -70% | 162.6 -80% | ||
| Cyberpunk 2077 ultra external monitor * (Watt) | 89.6 | 105 -17% | 126.7 -41% | 151.1 -69% | 165 -84% | ||
| Load Maximum * (Watt) | 117 | 99 15% | 119 -2% | 187 -60% | 172 -47% | 233.6 -100% | 258 ? -121% |
| Witcher 3 ultra * (Watt) | 90.3 |
* ... Moindre est la valeur, meilleures sont les performances
Consommation d'énergie Cyberpunk / Stress test
Consommation d'énergie avec moniteur externe
Durée de vie de la batterie
Malheureusement, la durée de vie de la batterie est inférieure à celle de son prédécesseur. Un peu moins de 5,5 heures lors de notre test Wi-Fi avec une luminosité réduite à 150 cd/m² est encore acceptable si l'on compare le HP Victus 15 et le Lenovo LOQ 15.
| MSI Cyborg 15 B2RWEKG Core 7 240H, GeForce RTX 5050 Laptop, 55.2 Wh | MSI Cyborg 15 A12VF i7-12650H, GeForce RTX 4060 Laptop GPU, 53.5 Wh | Acer Nitro V 15 ANV15-52-50S2 i5-13420H, GeForce RTX 5050 Laptop, 76 Wh | HP Victus 15-fa2160ng i5-13420H, GeForce RTX 5050 Laptop, 70 Wh | Lenovo LOQ 15AHP10 R7 250, GeForce RTX 5060 Laptop, 60 Wh | Lenovo Legion 5 15AHP G10 R7 260, GeForce RTX 5060 Laptop, 80 Wh | Moyenne de la classe Gaming | |
|---|---|---|---|---|---|---|---|
| Autonomie de la batterie | 39% | 2% | -20% | -17% | 80% | 24% | |
| WiFi v1.3 (h) | 5.4 | 7.5 39% | 5.5 2% | 4.3 -20% | 4.5 -17% | 9.7 80% | 6.71 ? 24% |
| Reader / Idle (h) | 13.6 | 6.9 | 9.23 ? | ||||
| H.264 (h) | 8 | 11.5 | 7.93 ? | ||||
| Load (h) | 2.3 | 1.3 | 1.2 | 1.472 ? | |||
| Cyberpunk 2077 ultra 150cd (h) | 0.9 |
Notebookcheck note globale
Le Cyborg 15 de MSI est un ordinateur de jeu de 15 pouces visuellement impressionnant qui offre des performances solides à un prix abordable, mais qui est quelque peu faible dans les domaines de l'affichage (espace colorimétrique) et de la puissance du GPU (maigre TGP).
MSI Cyborg 15 B2RWEKG
- 01/28/2026 v8
Florian Glaser
 Total Sustainability Score:
 Comparaison des alternatives possibles
Image | Modèle | Prix | Poids | Épaisseur | Écran |
|---|---|---|---|---|---|
1. 75.2%  | MSI Cyborg 15 B2RWEKG Intel Core 7 240H ⎘ NVIDIA GeForce RTX 5050 Laptop ⎘ 16 Go Mémoire, 512 Go SSD | Amazon: 1. msi Cyborg 15 B2RWEKG-257US ... 2. msi Cyborg 15 B2RW Cyborg 15... 3. MSI Cyborg 15 B2RWEKG-258US ... Prix de liste: 1099 EUR | 2.2 kg | 23.2 mm | 15.60" 1920x1080 141 PPI IPS |
2. 82.4% v7 (old)  | MSI Cyborg 15 A12VF Intel Core i7-12650H ⎘ NVIDIA GeForce RTX 4060 Laptop GPU ⎘ 16 Go Mémoire, 1024 Go SSD | Amazon: 1. msi CYBORG1512043 Cyborg 15 ... 2. 120W Adapter/AC Charger for ... 3. 120W AC Charger Compatible w... Prix de liste: 1799 Euro | 2 kg | 22.9 mm | 15.60" 1920x1080 141 PPI IPS |
3. 73.7%  | Acer Nitro V 15 ANV15-52-50S2 Intel Core i5-13420H ⎘ NVIDIA GeForce RTX 5050 Laptop ⎘ 16 Go Mémoire, 1024 Go SSD | Prix de liste: 1049 EUR | 2.1 kg | 23.5 mm | 15.60" 1920x1080 141 PPI IPS |
4. 75.8%  | HP Victus 15-fa2160ng Intel Core i5-13420H ⎘ NVIDIA GeForce RTX 5050 Laptop ⎘ 24 Go Mémoire, 512 Go SSD | Amazon: 1. HP Victus 15.6" 144Hz Full H... 2. HP Victus 15.6" FHD 144HZ Ga... 3. HP Victus 15.6 inch Laptop, ... Prix de liste: 1000 EUR | 2.4 kg | 23.5 mm | 15.60" 1920x1080 141 PPI IPS |
5. 77.5%  | Lenovo LOQ 15AHP10 AMD Ryzen 7 250 ⎘ NVIDIA GeForce RTX 5060 Laptop ⎘ 16 Go Mémoire, 1024 Go SSD | Amazon: 1. Lenovo LOQ 15 AI Gaming Lapt... 2. Lenovo LOQ RTX 5060 Gaming L... 3. Lenovo LOQ RTX 5060 Gaming L... | 2.4 kg | 24 mm | 15.60" 1920x1080 141 PPI IPS |
6. 87.2%  | Lenovo Legion 5 15AHP G10 AMD Ryzen 7 260 ⎘ NVIDIA GeForce RTX 5060 Laptop ⎘ 32 Go Mémoire, 1024 Go SSD | Amazon: 1. ASODI L19C4PC0 5B10W86196 60... 2. L20C4PC1 Laptop Battery Repl... 3. YFLAPFAN (1 Pair) New CPU GP... Prix de liste: 1449€ | 1.9 kg | 21.5 mm | 15.10" 2560x1600 200 PPI OLED |
Transparency
La sélection des appareils à examiner est effectuée par notre équipe éditoriale. L'échantillon de test a été prêté à l'auteur par le fabricant ou le détaillant pour les besoins de cet examen. Le prêteur n'a pas eu d'influence sur cette évaluation et le fabricant n'a pas reçu de copie de cette évaluation avant sa publication. Il n'y avait aucune obligation de publier cet article. En tant que média indépendant, Notebookcheck n'est pas soumis à l'autorité des fabricants, des détaillants ou des éditeurs.
Voici comment Notebookcheck teste
Chaque année, Notebookcheck examine de manière indépendante des centaines d'ordinateurs portables et de smartphones en utilisant des procédures standardisées afin de garantir que tous les résultats sont comparables. Nous avons continuellement développé nos méthodes de test depuis environ 20 ans et avons établi des normes industrielles dans le processus. Dans nos laboratoires de test, des équipements de mesure de haute qualité sont utilisés par des techniciens et des rédacteurs expérimentés. Ces tests impliquent un processus de validation en plusieurs étapes. Notre système d'évaluation complexe repose sur des centaines de mesures et de points de référence bien fondés, ce qui garantit l'objectivité.