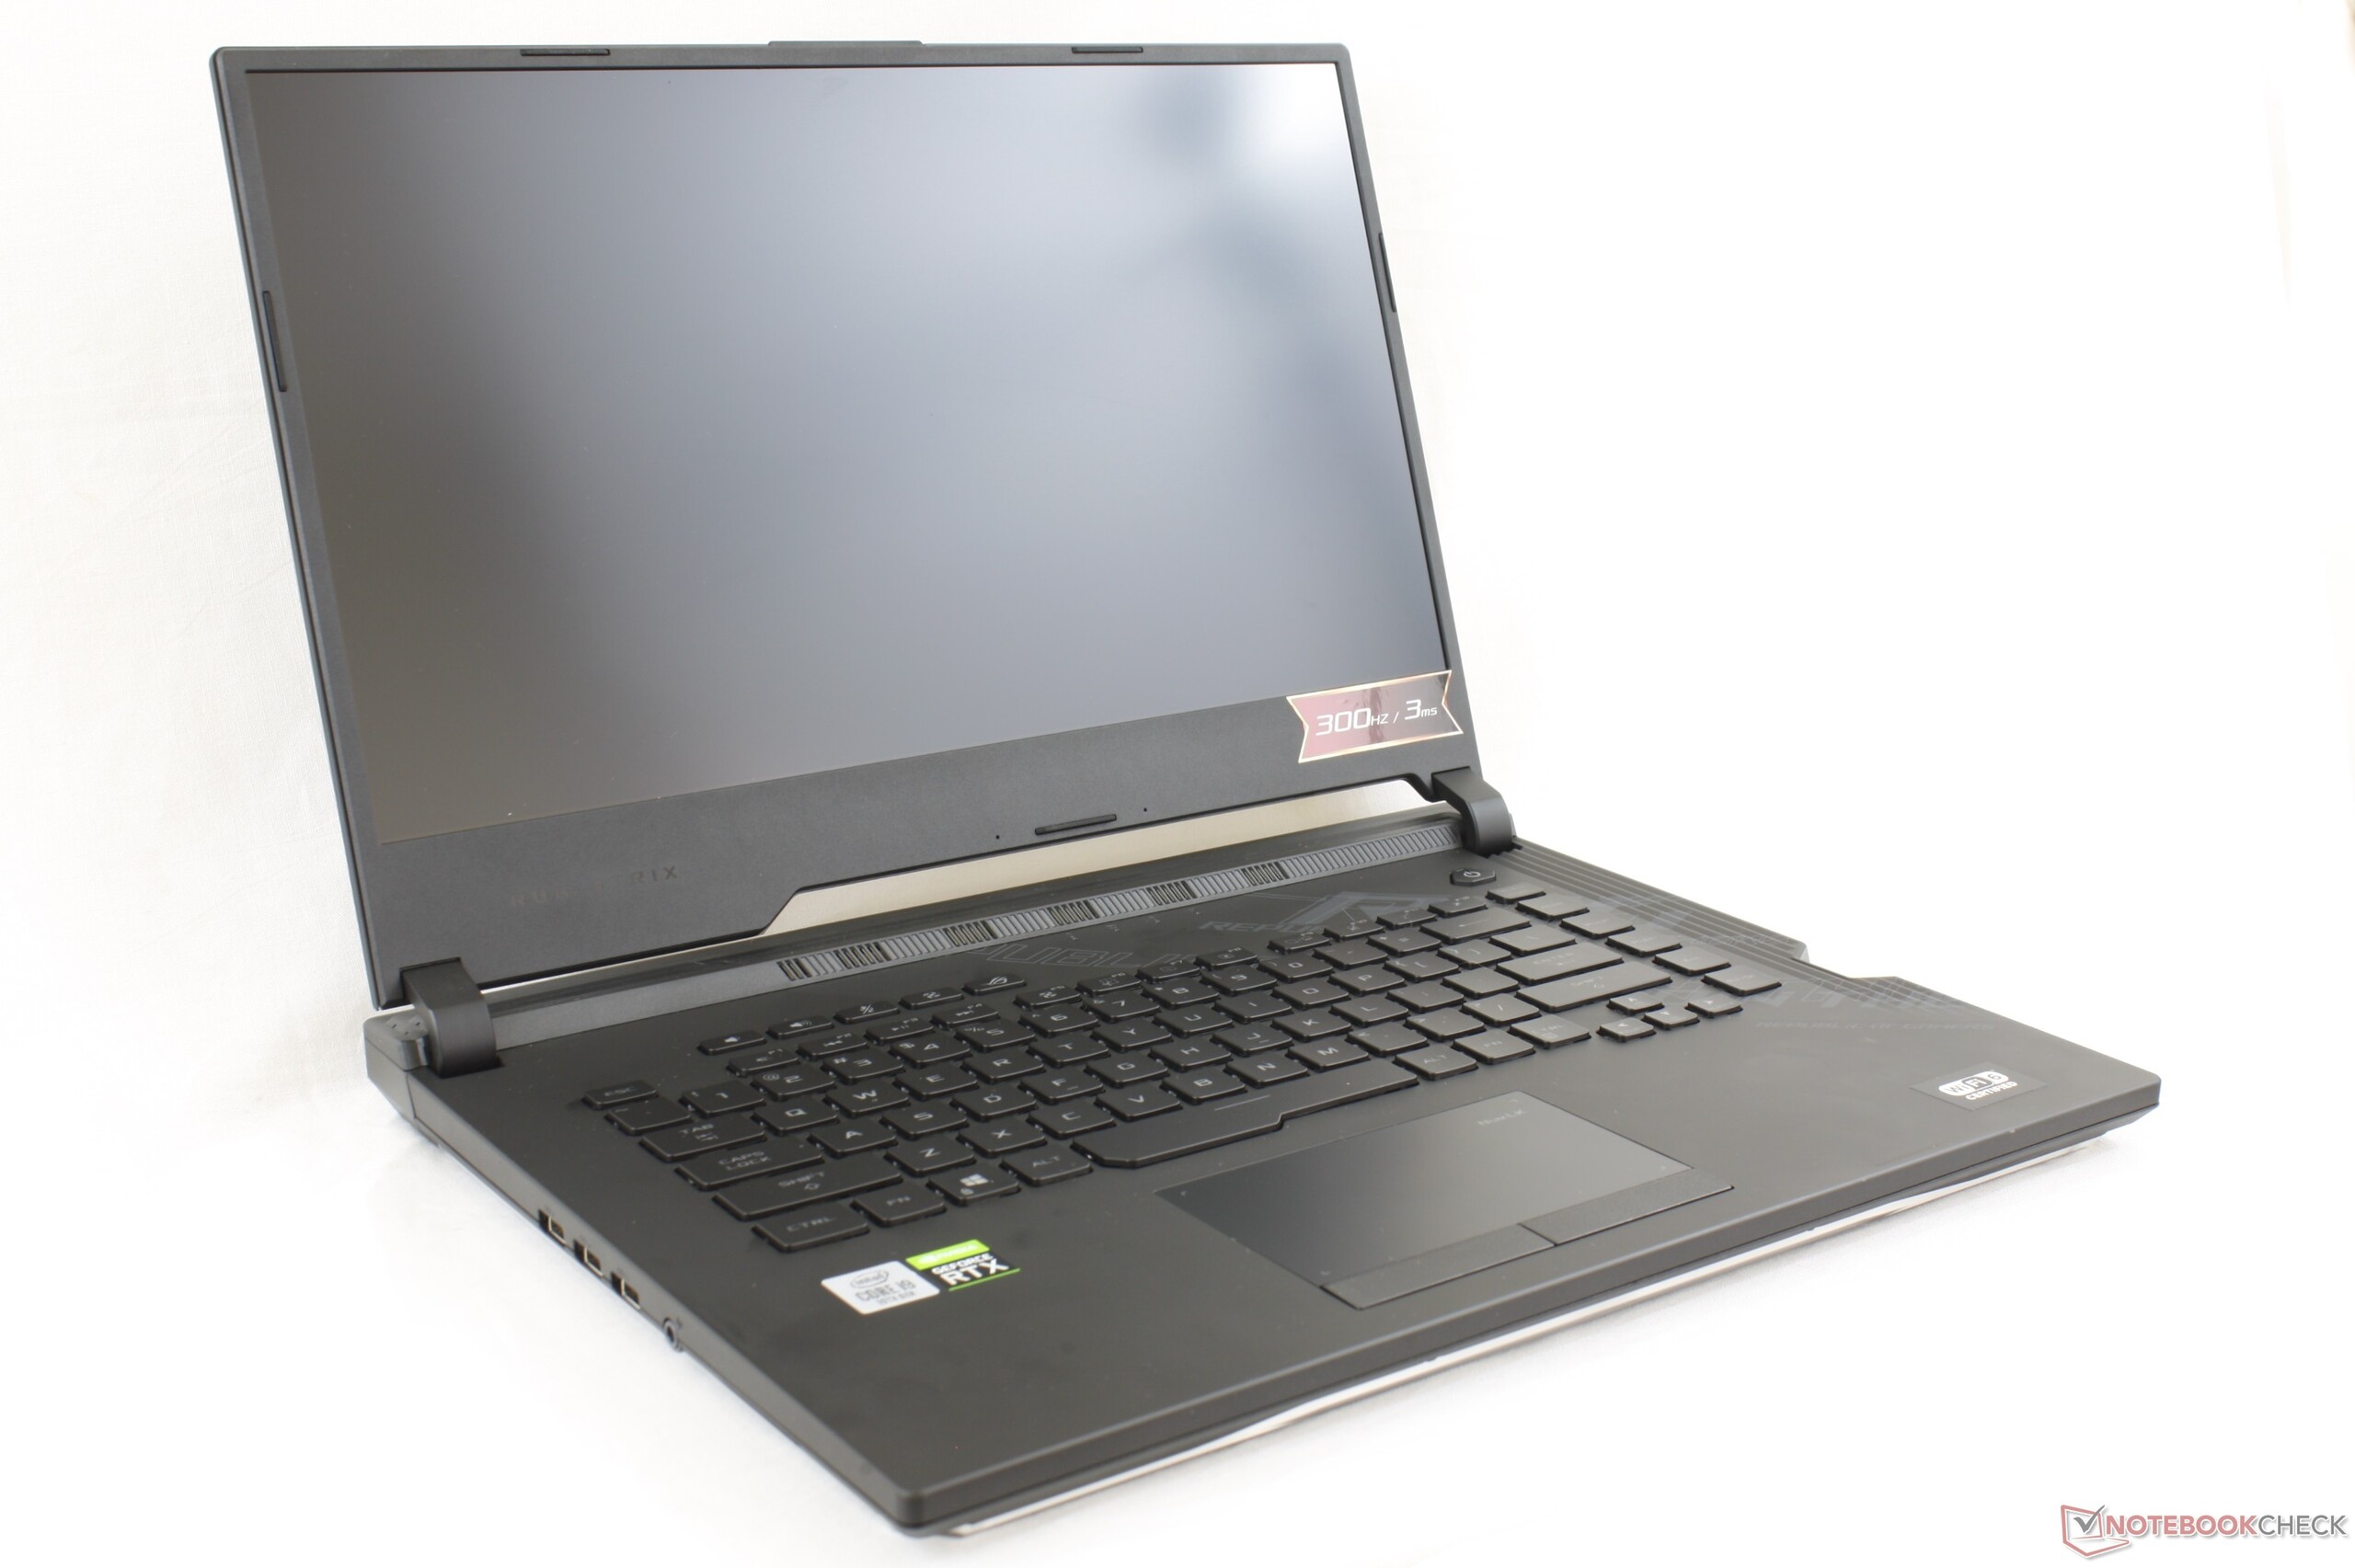
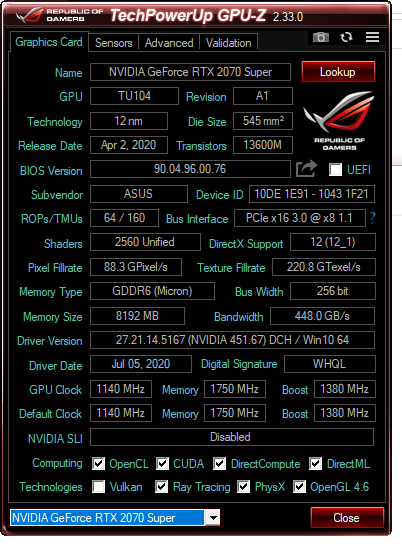
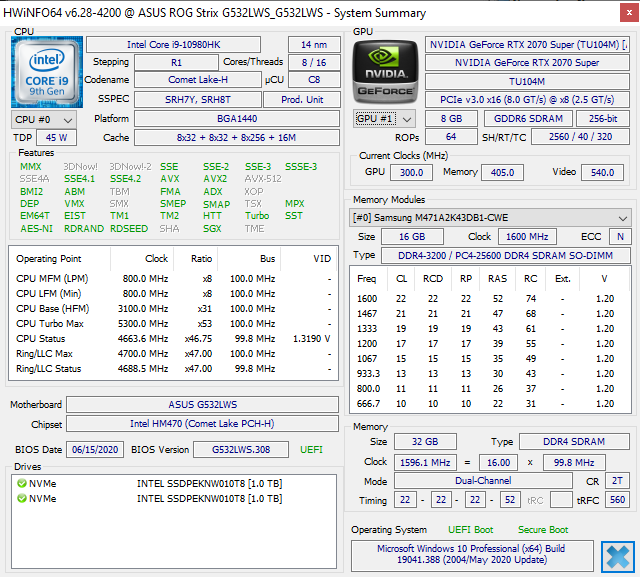
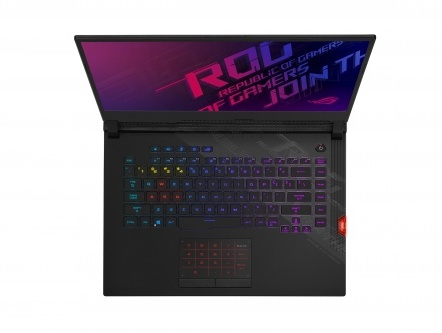
Test de l'Asus ROG Strix Scar 15 G532LWS (i9-10980HK, RTX 2070 Super, FHD, 300 Hz) : GeForce en puissance
Note | Date | Modèle | Poids | Épaisseur | Taille | Résolution | Prix |
|---|---|---|---|---|---|---|---|
| 84.4 % v7 (old) | 08/20 | Asus ROG Strix Scar 15 G532LWS i9-10980HK, GeForce RTX 2070 Super Mobile | 2.4 kg | 24.9 mm | 15.60" | 1920x1080 | |
| 84.6 % v7 (old) | 08/20 | MSI GE66 Raider 10SFS i9-10980HK, GeForce RTX 2070 Super Mobile | 2.4 kg | 23 mm | 15.60" | 1920x1080 | |
v (old) | 05/20 | Acer Predator Triton 500 PT515-52-70N3 i7-10750H, GeForce RTX 2080 Super Max-Q | 2.1 kg | 18 mm | 15.60" | 1920x1080 | |
| 86 % v7 (old) | 06/20 | Razer Blade 15 RZ09-0328 i7-10750H, GeForce RTX 2070 Max-Q | 2.1 kg | 19.9 mm | 15.60" | 3840x2160 | |
| 82.3 % v7 (old) | 09/19 | HP Omen X 2S 15-dg0075cl i7-9750H, GeForce RTX 2070 Max-Q | 2.4 kg | 19.8 mm | 15.60" | 1920x1080 | |
| 82.1 % v7 (old) | 10/19 | Asus Strix Scar III G531GW-AZ062T i7-9750H, GeForce RTX 2070 Mobile | 2.4 kg | 25 mm | 15.60" | 1920x1080 |
| |||||||||||||||||||||||||
Homogénéité de la luminosité: 91 %
Valeur mesurée au centre, sur batterie: 307.2 cd/m²
Contraste: 1463:1 (Valeurs des noirs: 0.21 cd/m²)
ΔE ColorChecker Calman: 1.85 | ∀{0.5-29.43 Ø4.73}
calibrated: 1.26
ΔE Greyscale Calman: 2 | ∀{0.09-98 Ø4.97}
99.7% sRGB (Argyll 1.6.3 3D)
65% AdobeRGB 1998 (Argyll 1.6.3 3D)
71.4% AdobeRGB 1998 (Argyll 3D)
99.6% sRGB (Argyll 3D)
69.9% Display P3 (Argyll 3D)
Gamma: 2.15
CCT: 6479 K
| Asus ROG Strix Scar 15 G532LWS AU Optronics B156HAN12.0, IPS, 15.6", 1920x1080 | MSI GE66 Raider 10SFS Sharp LQ156M1JW03 (SHP14C5), IPS-Level, 15.6", 1920x1080 | Acer Predator Triton 500 PT515-52-70N3 AUO B156HAN12.0 (AUO7A8C), IPS, 15.6", 1920x1080 | Razer Blade 15 RZ09-0328 Samsung SDCA029, AMOLED, 15.6", 3840x2160 | HP Omen X 2S 15-dg0075cl AU Optronics AUO82ED, IPS, 15.6", 1920x1080 | Asus Strix Scar III G531GW-AZ062T Sharp LQ156M1JW09 (SHP14D3), IPS, 15.6", 1920x1080 | |
|---|---|---|---|---|---|---|
| Display | -2% | 1% | 26% | -6% | -4% | |
| Display P3 Coverage (%) | 69.9 | 68 -3% | 70.3 1% | 99.9 43% | 66.2 -5% | 66.2 -5% |
| sRGB Coverage (%) | 99.6 | 99 -1% | 99.5 0% | 100 0% | 92.3 -7% | 97.1 -3% |
| AdobeRGB 1998 Coverage (%) | 71.4 | 69.8 -2% | 72.2 1% | 97.4 36% | 67.2 -6% | 67.6 -5% |
| Response Times | -14% | -7% | 77% | -12% | -1% | |
| Response Time Grey 50% / Grey 80% * (ms) | 14.4 ? | 16.4 ? -14% | 14.4 ? -0% | 2.7 ? 81% | 15.2 ? -6% | 15 ? -4% |
| Response Time Black / White * (ms) | 9.2 ? | 10.4 ? -13% | 10.4 ? -13% | 2.6 ? 72% | 10.8 ? -17% | 9 ? 2% |
| PWM Frequency (Hz) | 23580 ? | 59.5 ? | 250 ? | |||
| Screen | 1% | -38% | -26% | -59% | -50% | |
| Brightness middle (cd/m²) | 307.2 | 291 -5% | 320 4% | 366.7 19% | 324.8 6% | 309 1% |
| Brightness (cd/m²) | 301 | 278 -8% | 318 6% | 371 23% | 316 5% | 284 -6% |
| Brightness Distribution (%) | 91 | 91 0% | 88 -3% | 91 0% | 84 -8% | 88 -3% |
| Black Level * (cd/m²) | 0.21 | 0.25 -19% | 0.24 -14% | 0.26 -24% | 0.42 -100% | |
| Contrast (:1) | 1463 | 1164 -20% | 1333 -9% | 1249 -15% | 736 -50% | |
| Colorchecker dE 2000 * | 1.85 | 1.19 36% | 4.03 -118% | 5.21 -182% | 4.96 -168% | 3.99 -116% |
| Colorchecker dE 2000 max. * | 3.92 | 3.04 22% | 8.43 -115% | 7.92 -102% | 8.95 -128% | 8.3 -112% |
| Colorchecker dE 2000 calibrated * | 1.26 | 0.98 22% | 3.23 -156% | 1.12 11% | ||
| Greyscale dE 2000 * | 2 | 1.9 5% | 5.94 -197% | 2 -0% | 5 -150% | 5.43 -172% |
| Gamma | 2.15 102% | 2.216 99% | 2.42 91% | 2.17 101% | 2.21 100% | 2.57 86% |
| CCT | 6479 100% | 7018 93% | 6751 96% | 6514 100% | 7742 84% | 7767 84% |
| Color Space (Percent of AdobeRGB 1998) (%) | 65 | 70 8% | 66 2% | 86.6 33% | 59.8 -8% | 63 -3% |
| Color Space (Percent of sRGB) (%) | 99.7 | 92 -8% | 99 -1% | 100 0% | 91.8 -8% | 97 -3% |
| Moyenne finale (programmes/paramètres) | -5% /
-1% | -15% /
-27% | 26% /
2% | -26% /
-43% | -18% /
-36% |
* ... Moindre est la valeur, meilleures sont les performances
Temps de réponse de l'écran
| ↔ Temps de réponse noir à blanc | ||
|---|---|---|
| 9.2 ms ... hausse ↗ et chute ↘ combinées | ↗ 4.8 ms hausse | 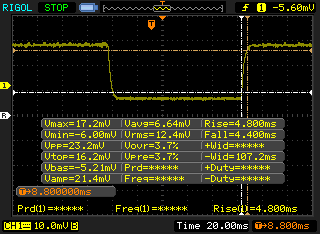 |
| ↘ 4.4 ms chute | ||
| L'écran montre de faibles temps de réponse, un bon écran pour jouer. En comparaison, tous les appareils testés affichent entre 0.1 (minimum) et 240 (maximum) ms. » 25 % des appareils testés affichent de meilleures performances. Cela signifie que les latences relevées sont meilleures que la moyenne (19.9 ms) de tous les appareils testés. | ||
| ↔ Temps de réponse gris 50% à gris 80% | ||
| 14.4 ms ... hausse ↗ et chute ↘ combinées | ↗ 6.8 ms hausse | 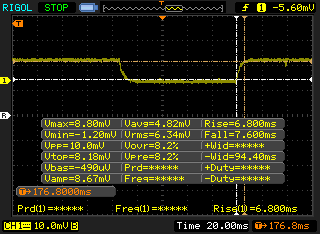 |
| ↘ 7.6 ms chute | ||
| L'écran montre de bons temps de réponse, mais insuffisant pour du jeu compétitif. En comparaison, tous les appareils testés affichent entre 0.165 (minimum) et 636 (maximum) ms. » 28 % des appareils testés affichent de meilleures performances. Cela signifie que les latences relevées sont meilleures que la moyenne (31.1 ms) de tous les appareils testés. | ||
Scintillement / MLI (Modulation de largeur d'impulsion)
| Scintillement / MLI (Modulation de largeur d'impulsion) non décelé | 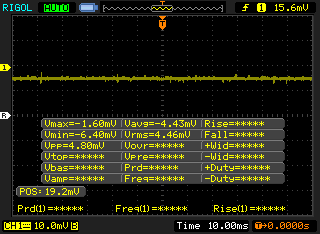 | ||
En comparaison, 52 % des appareils testés n'emploient pas MDI pour assombrir leur écran. Nous avons relevé une moyenne à 7798 (minimum : 5 - maximum : 343500) Hz dans le cas où une MDI était active. | |||
Cinebench R15: CPU Multi 64Bit | CPU Single 64Bit
Blender: v2.79 BMW27 CPU
7-Zip 18.03: 7z b 4 -mmt1 | 7z b 4
Geekbench 5.5: Single-Core | Multi-Core
HWBOT x265 Benchmark v2.2: 4k Preset
LibreOffice : 20 Documents To PDF
R Benchmark 2.5: Overall mean
| Cinebench R20 / CPU (Multi Core) | |
| Intel Core i9-10900K | |
| Eluktronics RP-15 | |
| Eurocom Sky X4C i9-9900KS | |
| Moyenne Intel Core i9-10980HK (3526 - 4487, n=13) | |
| Asus ROG Strix Scar 15 G532LWS | |
| Gigabyte Aero 15 OLED XB-8DE51B0SP | |
| MSI GE65 Raider 9SF-049US | |
| Acer Nitro 5 AN515-44-R5FT | |
| Asus ROG Strix G15 G512LI | |
| Asus Strix Scar III G531GW-AZ062T | |
| Lenovo Legion 5 15IMH05H | |
| Cinebench R20 / CPU (Single Core) | |
| Intel Core i9-10900K | |
| Gigabyte Aero 15 OLED XB-8DE51B0SP | |
| Eurocom Sky X4C i9-9900KS | |
| Asus ROG Strix Scar 15 G532LWS | |
| Eluktronics RP-15 | |
| Moyenne Intel Core i9-10980HK (465 - 507, n=13) | |
| MSI GE65 Raider 9SF-049US | |
| Lenovo Legion 5 15IMH05H | |
| Asus ROG Strix G15 G512LI | |
| Acer Nitro 5 AN515-44-R5FT | |
| Asus Strix Scar III G531GW-AZ062T | |
| Cinebench R15 / CPU Multi 64Bit | |
| Intel Core i9-10900K | |
| Eluktronics RP-15 | |
| Eurocom Sky X4C i9-9900KS | |
| Gigabyte Aero 15 OLED XB-8DE51B0SP | |
| Moyenne Intel Core i9-10980HK (1606 - 1862, n=15) | |
| Asus ROG Strix Scar 15 G532LWS | |
| MSI GE65 Raider 9SF-049US | |
| Acer Nitro 5 AN515-44-R5FT | |
| Asus ROG Strix G15 G512LI | |
| Asus Strix Scar III G531GW-AZ062T | |
| Lenovo Legion 5 15IMH05H | |
| Cinebench R15 / CPU Single 64Bit | |
| Intel Core i9-10900K | |
| Eurocom Sky X4C i9-9900KS | |
| Gigabyte Aero 15 OLED XB-8DE51B0SP | |
| Asus ROG Strix Scar 15 G532LWS | |
| Moyenne Intel Core i9-10980HK (198 - 219, n=15) | |
| MSI GE65 Raider 9SF-049US | |
| Asus ROG Strix G15 G512LI | |
| Eluktronics RP-15 | |
| Lenovo Legion 5 15IMH05H | |
| Asus Strix Scar III G531GW-AZ062T | |
| Acer Nitro 5 AN515-44-R5FT | |
| Blender / v2.79 BMW27 CPU | |
| Lenovo Legion 5 15IMH05H | |
| Asus Strix Scar III G531GW-AZ062T | |
| Asus ROG Strix G15 G512LI | |
| Acer Nitro 5 AN515-44-R5FT | |
| Gigabyte Aero 15 OLED XB-8DE51B0SP | |
| Asus ROG Strix Scar 15 G532LWS | |
| Moyenne Intel Core i9-10980HK (239 - 299, n=13) | |
| Eluktronics RP-15 | |
| Eurocom Sky X4C i9-9900KS | |
| Intel Core i9-10900K | |
| 7-Zip 18.03 / 7z b 4 -mmt1 | |
| Intel Core i9-10900K | |
| Eurocom Sky X4C i9-9900KS | |
| Asus ROG Strix Scar 15 G532LWS | |
| Gigabyte Aero 15 OLED XB-8DE51B0SP | |
| Moyenne Intel Core i9-10980HK (5081 - 5542, n=13) | |
| Asus Strix Scar III G531GW-AZ062T | |
| Asus ROG Strix G15 G512LI | |
| Lenovo Legion 5 15IMH05H | |
| Eluktronics RP-15 | |
| Acer Nitro 5 AN515-44-R5FT | |
| 7-Zip 18.03 / 7z b 4 | |
| Intel Core i9-10900K | |
| Eurocom Sky X4C i9-9900KS | |
| Eluktronics RP-15 | |
| Asus ROG Strix Scar 15 G532LWS | |
| Gigabyte Aero 15 OLED XB-8DE51B0SP | |
| Moyenne Intel Core i9-10980HK (43786 - 49275, n=13) | |
| Acer Nitro 5 AN515-44-R5FT | |
| Asus ROG Strix G15 G512LI | |
| Asus Strix Scar III G531GW-AZ062T | |
| Lenovo Legion 5 15IMH05H | |
| Geekbench 5.5 / Single-Core | |
| Intel Core i9-10900K | |
| Eurocom Sky X4C i9-9900KS | |
| Asus ROG Strix Scar 15 G532LWS | |
| Gigabyte Aero 15 OLED XB-8DE51B0SP | |
| Moyenne Intel Core i9-10980HK (1283 - 1401, n=12) | |
| Lenovo Legion 5 15IMH05H | |
| Eluktronics RP-15 | |
| Asus ROG Strix G15 G512LI | |
| Acer Nitro 5 AN515-44-R5FT | |
| Geekbench 5.5 / Multi-Core | |
| Intel Core i9-10900K | |
| Eurocom Sky X4C i9-9900KS | |
| Eluktronics RP-15 | |
| Asus ROG Strix Scar 15 G532LWS | |
| Moyenne Intel Core i9-10980HK (7634 - 8666, n=12) | |
| Gigabyte Aero 15 OLED XB-8DE51B0SP | |
| Asus ROG Strix G15 G512LI | |
| Acer Nitro 5 AN515-44-R5FT | |
| Lenovo Legion 5 15IMH05H | |
| HWBOT x265 Benchmark v2.2 / 4k Preset | |
| Intel Core i9-10900K | |
| Eurocom Sky X4C i9-9900KS | |
| Eluktronics RP-15 | |
| Gigabyte Aero 15 OLED XB-8DE51B0SP | |
| Asus ROG Strix Scar 15 G532LWS | |
| Moyenne Intel Core i9-10980HK (12 - 14.6, n=13) | |
| Asus ROG Strix G15 G512LI | |
| Acer Nitro 5 AN515-44-R5FT | |
| Asus Strix Scar III G531GW-AZ062T | |
| Lenovo Legion 5 15IMH05H | |
| LibreOffice / 20 Documents To PDF | |
| Intel Core i9-10900K | |
| Acer Nitro 5 AN515-44-R5FT | |
| Eluktronics RP-15 | |
| Moyenne Intel Core i9-10980HK (44 - 89, n=13) | |
| Lenovo Legion 5 15IMH05H | |
| Gigabyte Aero 15 OLED XB-8DE51B0SP | |
| Asus ROG Strix G15 G512LI | |
| Asus ROG Strix Scar 15 G532LWS | |
| R Benchmark 2.5 / Overall mean | |
| Lenovo Legion 5 15IMH05H | |
| Acer Nitro 5 AN515-44-R5FT | |
| Asus ROG Strix G15 G512LI | |
| Moyenne Intel Core i9-10980HK (0.561 - 0.596, n=13) | |
| Eluktronics RP-15 | |
| Asus ROG Strix Scar 15 G532LWS | |
| Gigabyte Aero 15 OLED XB-8DE51B0SP | |
| Intel Core i9-10900K | |
* ... Moindre est la valeur, meilleures sont les performances
| PCMark 8 Home Score Accelerated v2 | 5020 points | |
| PCMark 8 Work Score Accelerated v2 | 6456 points | |
| PCMark 10 Score | 6236 points | |
Aide | ||
| DPC Latencies / LatencyMon - interrupt to process latency (max), Web, Youtube, Prime95 | |
| Acer Predator Triton 500 PT515-52-70N3 | |
| Asus ROG Strix Scar 15 G532LWS | |
| MSI GE66 Raider 10SFS | |
| Razer Blade 15 RZ09-0328 | |
* ... Moindre est la valeur, meilleures sont les performances
| Asus ROG Strix Scar 15 G532LWS 2x Intel SSD 660p 1TB SSDPEKNW010T8 (RAID 0) | MSI GE66 Raider 10SFS WDC PC SN730 SDBPNTY-1T00 | Razer Blade 15 RZ09-0328 Lite-On CA5-8D512 | Asus Strix Scar III G531GW-AZ062T Intel SSD 660p SSDPEKNW512G8 | MSI Bravo 15 A4DCR Samsung PM981a MZVLB1T0HBLR | |
|---|---|---|---|---|---|
| AS SSD | 47% | -11% | -70% | 44% | |
| Seq Read (MB/s) | 1982 | 2979 50% | 2021 2% | 1163 -41% | 2730 38% |
| Seq Write (MB/s) | 1444 | 2581 79% | 2090 45% | 919 -36% | 2513 74% |
| 4K Read (MB/s) | 50.3 | 47.33 -6% | 47.71 -5% | 48.88 -3% | 61.4 22% |
| 4K Write (MB/s) | 120.1 | 140 17% | 101.1 -16% | 90.1 -25% | 156.1 30% |
| 4K-64 Read (MB/s) | 1016 | 1710 68% | 856 -16% | 323.8 -68% | 1780 75% |
| 4K-64 Write (MB/s) | 1351 | 2188 62% | 1041 -23% | 403.8 -70% | 1920 42% |
| Access Time Read * (ms) | 0.044 | 0.05 -14% | 0.052 -18% | 0.24 -445% | 0.063 -43% |
| Access Time Write * (ms) | 0.109 | 0.026 76% | 0.111 -2% | 0.046 58% | 0.025 77% |
| Score Read (Points) | 1264 | 2055 63% | 1105 -13% | 489 -61% | 2114 67% |
| Score Write (Points) | 1615 | 2586 60% | 1351 -16% | 586 -64% | 2327 44% |
| Score Total (Points) | 3510 | 5673 62% | 3037 -13% | 1332 -62% | 5518 57% |
| Copy ISO MB/s (MB/s) | 3474 | 2474 -29% | 1269 -63% | ||
| Copy Program MB/s (MB/s) | 751 | 679 -10% | 452.8 -40% | ||
| Copy Game MB/s (MB/s) | 1684 | 1037 -38% | 755 -55% | ||
| CrystalDiskMark 5.2 / 6 | 11% | 5% | -32% | 8% | |
| Write 4K (MB/s) | 128.4 | 158.2 23% | 118.7 -8% | 133.3 4% | 118.3 -8% |
| Read 4K (MB/s) | 53.7 | 50.7 -6% | 52.4 -2% | 55.3 3% | 43.73 -19% |
| Write Seq (MB/s) | 1875 | 1790 -5% | 2247 20% | 980 -48% | 2854 52% |
| Read Seq (MB/s) | 2315 | 2469 7% | 2234 -3% | 1406 -39% | 2302 -1% |
| Write 4K Q32T1 (MB/s) | 427.2 | 503 18% | 515 21% | 286.3 -33% | 418.5 -2% |
| Read 4K Q32T1 (MB/s) | 440.7 | 579 31% | 584 33% | 331.5 -25% | 517 17% |
| Write Seq Q32T1 (MB/s) | 2793 | 3102 11% | 2235 -20% | 976 -65% | 3008 8% |
| Read Seq Q32T1 (MB/s) | 3101 | 3413 10% | 3171 2% | 1520 -51% | 3568 15% |
| Write 4K Q8T8 (MB/s) | 748 | ||||
| Read 4K Q8T8 (MB/s) | 344.6 | ||||
| Moyenne finale (programmes/paramètres) | 29% /
32% | -3% /
-5% | -51% /
-56% | 26% /
29% |
* ... Moindre est la valeur, meilleures sont les performances

Disk Throttling: DiskSpd Read Loop, Queue Depth 8
| 3DMark 11 Performance | 25360 points | |
| 3DMark Cloud Gate Standard Score | 50766 points | |
| 3DMark Fire Strike Score | 19498 points | |
| 3DMark Time Spy Score | 8531 points | |
Aide | ||
| Bas | Moyen | Élevé | Ultra | |
|---|---|---|---|---|
| The Witcher 3 (2015) | 368.7 | 256.5 | 168 | 85.7 |
| Dota 2 Reborn (2015) | 156 | 145 | 135 | 129 |
| X-Plane 11.11 (2018) | 118 | 103 | 86.5 | |
| Shadow of the Tomb Raider (2018) | 153 | 120 | 115 | 104 |
| Asus ROG Strix Scar 15 G532LWS GeForce RTX 2070 Super Mobile, i9-10980HK, 2x Intel SSD 660p 1TB SSDPEKNW010T8 (RAID 0) | MSI GE66 Raider 10SFS GeForce RTX 2070 Super Mobile, i9-10980HK, WDC PC SN730 SDBPNTY-1T00 | Acer Predator Triton 500 PT515-52-70N3 GeForce RTX 2080 Super Max-Q, i7-10750H, Samsung SSD PM981a MZVLB512HBJQ | Razer Blade 15 RZ09-0328 GeForce RTX 2070 Max-Q, i7-10750H, Lite-On CA5-8D512 | HP Omen X 2S 15-dg0075cl GeForce RTX 2070 Max-Q, i7-9750H, WDC PC SN720 SDAPNTW-1T00 | Asus Strix Scar III G531GW-AZ062T GeForce RTX 2070 Mobile, i7-9750H, Intel SSD 660p SSDPEKNW512G8 | |
|---|---|---|---|---|---|---|
| Noise | -7% | 0% | 7% | 4% | 3% | |
| arrêt / environnement * (dB) | 26.5 | 30 -13% | 30 -13% | 28.4 -7% | 29 -9% | 30 -13% |
| Idle Minimum * (dB) | 27.1 | 30 -11% | 30 -11% | 28.4 -5% | 30.5 -13% | 30.6 -13% |
| Idle Average * (dB) | 32.2 | 35 -9% | 33 -2% | 28.4 12% | 31.5 2% | 30.6 5% |
| Idle Maximum * (dB) | 34 | 44 -29% | 36 -6% | 31.7 7% | 31.5 7% | 37.7 -11% |
| Load Average * (dB) | 52.4 | 53 -1% | 50 5% | 47.7 9% | 40.6 23% | 36.5 30% |
| Witcher 3 ultra * (dB) | 57.5 | 53 8% | 48 17% | 47.5 17% | 49.5 14% | 52.1 9% |
| Load Maximum * (dB) | 57.5 | 55 4% | 50 13% | 49.5 14% | 53.4 7% | 48.1 16% |
* ... Moindre est la valeur, meilleures sont les performances
Degré de la nuisance sonore
| Au repos |
| 27.1 / 32.2 / 34 dB(A) |
| Fortement sollicité |
| 52.4 / 57.5 dB(A) |
 | ||
30 dB silencieux 40 dB(A) audible 50 dB(A) bruyant |
||
min: | ||
(-) La température maximale du côté supérieur est de 46.2 °C / 115 F, par rapport à la moyenne de 40.4 °C / 105 F, allant de 21.2 à 68.8 °C pour la classe Gaming.
(-) Le fond chauffe jusqu'à un maximum de 55.2 °C / 131 F, contre une moyenne de 43.2 °C / 110 F
(+) En utilisation inactive, la température moyenne du côté supérieur est de 29.1 °C / 84 F, par rapport à la moyenne du dispositif de 33.9 °C / 93 F.
(±) En jouant à The Witcher 3, la température moyenne du côté supérieur est de 36.3 °C / 97 F, alors que la moyenne de l'appareil est de 33.9 °C / 93 F.
(+) Les repose-poignets et le pavé tactile sont plus froids que la température de la peau avec un maximum de 27.6 °C / 81.7 F et sont donc froids au toucher.
(±) La température moyenne de la zone de l'appui-paume de dispositifs similaires était de 28.8 °C / 83.8 F (+1.2 °C / #2.1 F).
Asus ROG Strix Scar 15 G532LWS analyse audio
(+) | les haut-parleurs peuvent jouer relativement fort (84.1# dB)
Basses 100 - 315 Hz
(±) | basse réduite - en moyenne 9.7% inférieure à la médiane
(±) | la linéarité des basses est moyenne (7.8% delta à la fréquence précédente)
Médiums 400 - 2000 Hz
(±) | médiane supérieure - en moyenne 6.4% supérieure à la médiane
(+) | les médiums sont linéaires (4.8% delta à la fréquence précédente)
Aiguës 2 - 16 kHz
(+) | des sommets équilibrés - à seulement 1.9% de la médiane
(+) | les aigus sont linéaires (5.5% delta à la fréquence précédente)
Globalement 100 - 16 000 Hz
(+) | le son global est linéaire (14.4% différence à la médiane)
Par rapport à la même classe
» 27% de tous les appareils testés de cette catégorie étaient meilleurs, 7% similaires, 66% pires
» Le meilleur avait un delta de 6%, la moyenne était de 18%, le pire était de 132%.
Par rapport à tous les appareils testés
» 18% de tous les appareils testés étaient meilleurs, 4% similaires, 78% pires
» Le meilleur avait un delta de 4%, la moyenne était de 24%, le pire était de 134%.
Apple MacBook 12 (Early 2016) 1.1 GHz analyse audio
(+) | les haut-parleurs peuvent jouer relativement fort (83.6# dB)
Basses 100 - 315 Hz
(±) | basse réduite - en moyenne 11.3% inférieure à la médiane
(±) | la linéarité des basses est moyenne (14.2% delta à la fréquence précédente)
Médiums 400 - 2000 Hz
(+) | médiane équilibrée - seulement 2.4% de la médiane
(+) | les médiums sont linéaires (5.5% delta à la fréquence précédente)
Aiguës 2 - 16 kHz
(+) | des sommets équilibrés - à seulement 2% de la médiane
(+) | les aigus sont linéaires (4.5% delta à la fréquence précédente)
Globalement 100 - 16 000 Hz
(+) | le son global est linéaire (10.2% différence à la médiane)
Par rapport à la même classe
» 7% de tous les appareils testés de cette catégorie étaient meilleurs, 2% similaires, 91% pires
» Le meilleur avait un delta de 5%, la moyenne était de 18%, le pire était de 53%.
Par rapport à tous les appareils testés
» 5% de tous les appareils testés étaient meilleurs, 1% similaires, 94% pires
» Le meilleur avait un delta de 4%, la moyenne était de 24%, le pire était de 134%.
| Éteint/en veille | |
| Au repos | |
| Fortement sollicité |
|
Légende:
min: | |
| Asus ROG Strix Scar 15 G532LWS i9-10980HK, GeForce RTX 2070 Super Mobile, 2x Intel SSD 660p 1TB SSDPEKNW010T8 (RAID 0), IPS, 1920x1080, 15.6" | MSI GE66 Raider 10SFS i9-10980HK, GeForce RTX 2070 Super Mobile, WDC PC SN730 SDBPNTY-1T00, IPS-Level, 1920x1080, 15.6" | Acer Predator Triton 500 PT515-52-70N3 i7-10750H, GeForce RTX 2080 Super Max-Q, Samsung SSD PM981a MZVLB512HBJQ, IPS, 1920x1080, 15.6" | Razer Blade 15 RZ09-0328 i7-10750H, GeForce RTX 2070 Max-Q, Lite-On CA5-8D512, AMOLED, 3840x2160, 15.6" | HP Omen X 2S 15-dg0075cl i7-9750H, GeForce RTX 2070 Max-Q, WDC PC SN720 SDAPNTW-1T00, IPS, 1920x1080, 15.6" | Asus Strix Scar III G531GW-AZ062T i7-9750H, GeForce RTX 2070 Mobile, Intel SSD 660p SSDPEKNW512G8, IPS, 1920x1080, 15.6" | |
|---|---|---|---|---|---|---|
| Power Consumption | 4% | 1% | -4% | -175% | 1% | |
| Idle Minimum * (Watt) | 8 | 6 25% | 11 -38% | 11.1 -39% | 46 -475% | 11.4 -43% |
| Idle Average * (Watt) | 9.8 | 14 -43% | 15 -53% | 13.7 -40% | 59 -502% | 13.5 -38% |
| Idle Maximum * (Watt) | 25.8 | 25 3% | 25 3% | 33.4 -29% | 65.5 -154% | 21.6 16% |
| Load Average * (Watt) | 169 | 108 36% | 95 44% | 104.4 38% | 99.8 41% | 106 37% |
| Witcher 3 ultra * (Watt) | 201 | 195 3% | 140 30% | 159.9 20% | 154.1 23% | 186 7% |
| Load Maximum * (Watt) | 271.6 | 280 -3% | 211 22% | 203.8 25% | 222.7 18% | 196 28% |
* ... Moindre est la valeur, meilleures sont les performances
| Asus ROG Strix Scar 15 G532LWS i9-10980HK, GeForce RTX 2070 Super Mobile, 66 Wh | MSI GE66 Raider 10SFS i9-10980HK, GeForce RTX 2070 Super Mobile, 99.99 Wh | Acer Predator Triton 500 PT515-52-70N3 i7-10750H, GeForce RTX 2080 Super Max-Q, 84 Wh | Razer Blade 15 RZ09-0328 i7-10750H, GeForce RTX 2070 Max-Q, 65 Wh | HP Omen X 2S 15-dg0075cl i7-9750H, GeForce RTX 2070 Max-Q, 72 Wh | Asus Strix Scar III G531GW-AZ062T i7-9750H, GeForce RTX 2070 Mobile, 66 Wh | |
|---|---|---|---|---|---|---|
| Autonomie de la batterie | 13% | 6% | -18% | -41% | 14% | |
| Reader / Idle (h) | 8.1 | 7.6 -6% | 8.3 2% | 3.7 -54% | ||
| WiFi v1.3 (h) | 4.9 | 6.1 24% | 6.3 29% | 4 -18% | 2.2 -55% | 5.6 14% |
| Load (h) | 1.5 | 1.8 20% | 1.3 -13% | 1.3 -13% |
Points positifs
Points négatifs
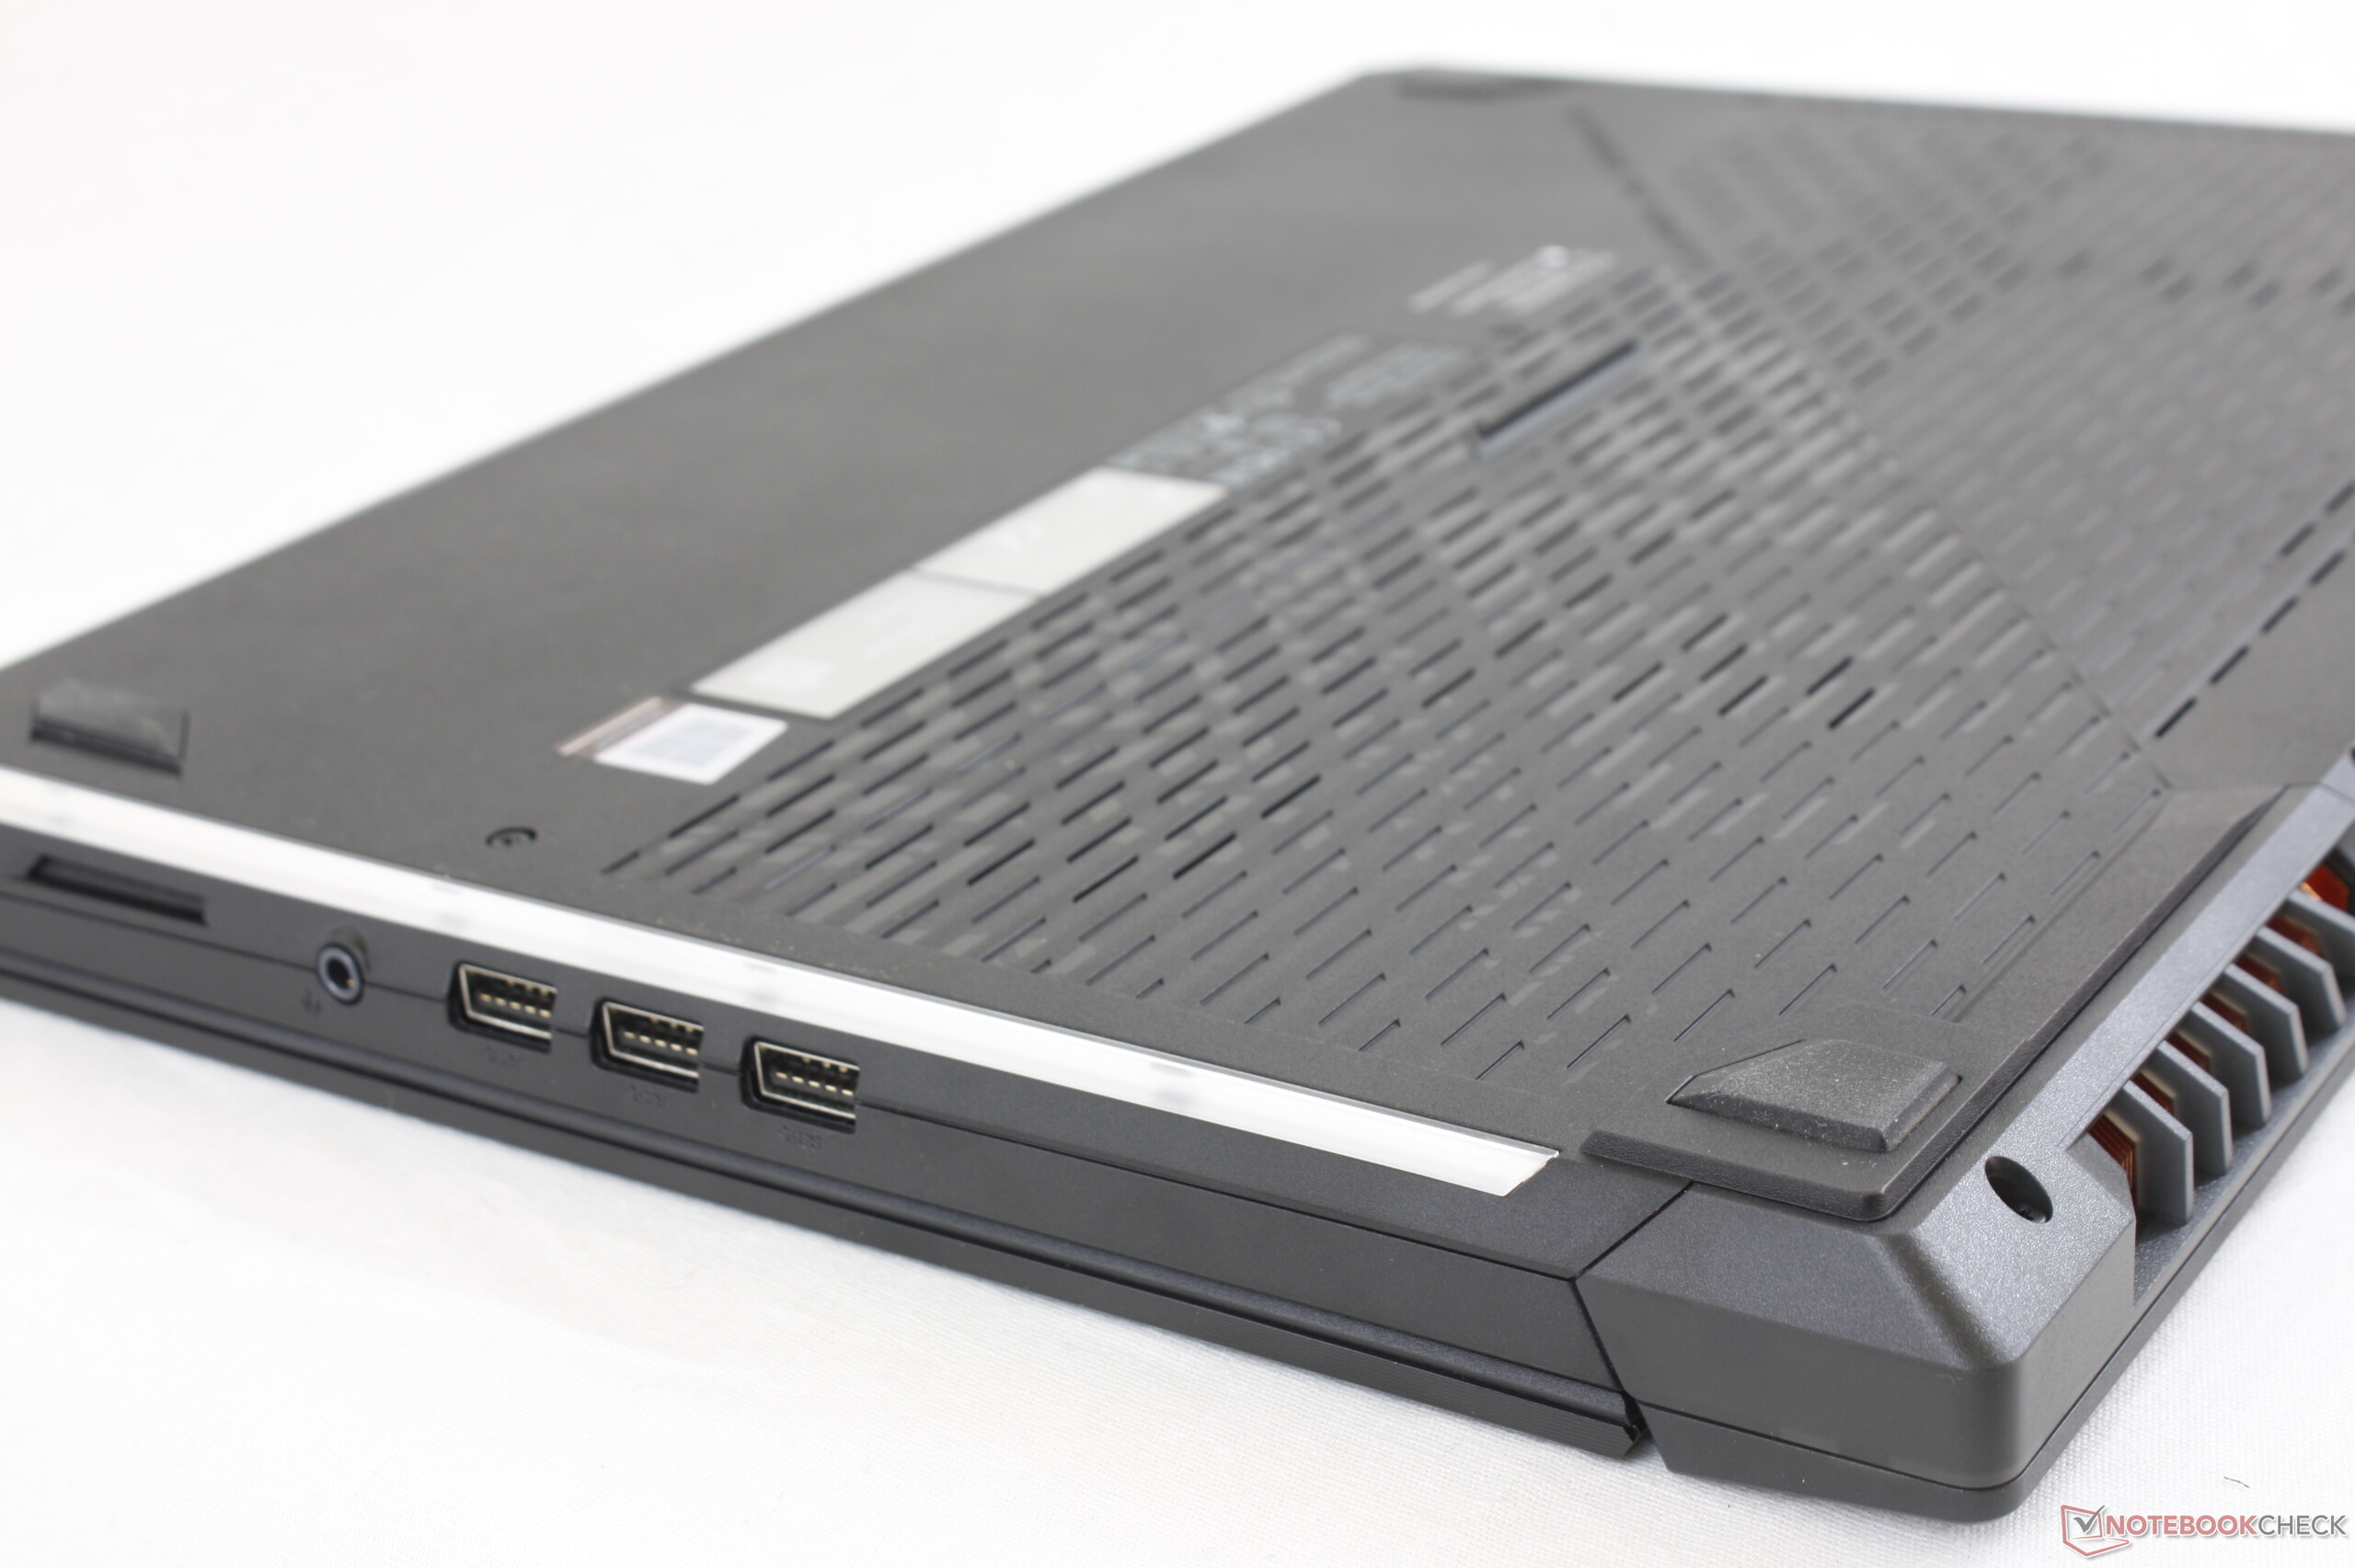
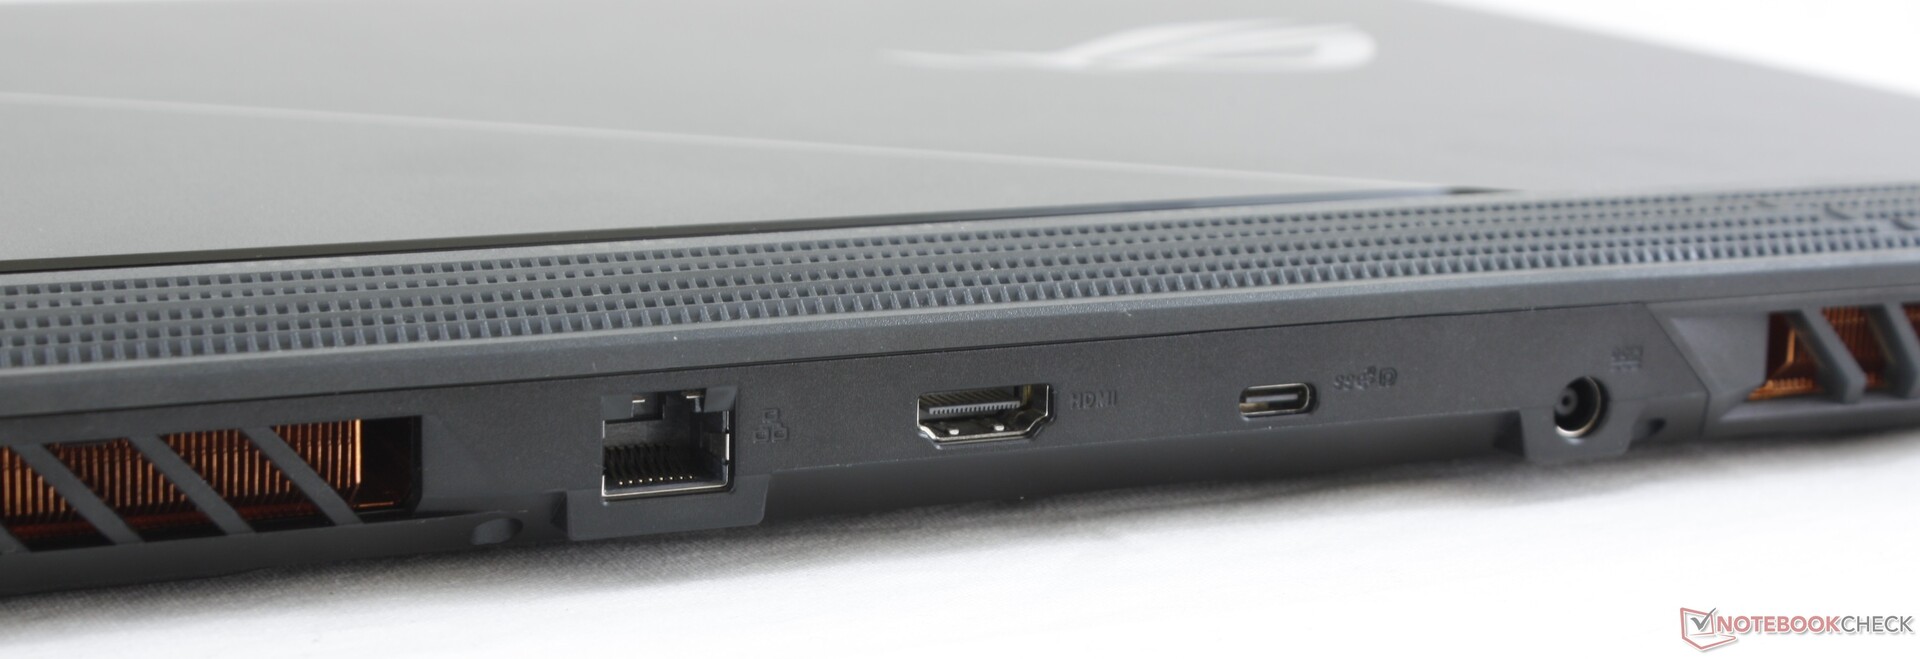
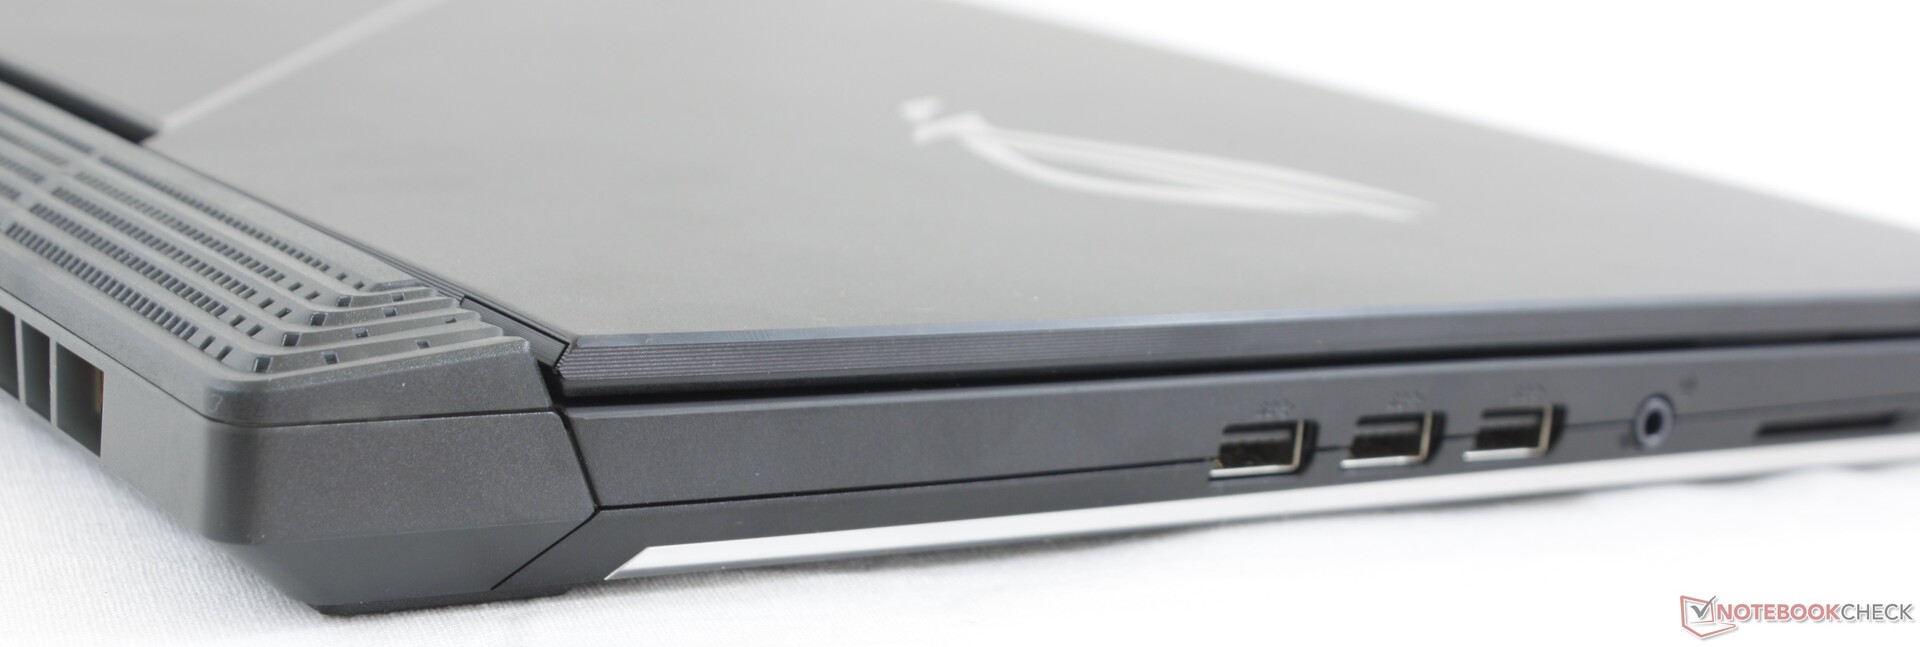
Ceux pour qui la possibilité d'avoir trois emplacements de stockage M.2 est importante, alors l'Asus ROG G532 est l'un des rares PC portable de jeu de 15,6 qui correspondra. Cependant la machine souffre toujours des mêmes défauts que le modèle de l'an dernier, le châssis demeurant inchangé. Le MSI GE66, lancé il y a quelques mois pour concurrencer le ROG G532, est plus compact et intègre à la fois une plus grosse batterie, et les mêmes Core i9, RTX 2070 Super et écran de 15,6 pouces de 300 Hz. Les performances de notre Asus ne doivent pas être sous-estimées, mais la puissance et la Keystone ne suffiront pas à faire face aux dernières trouvailles des concurrents.
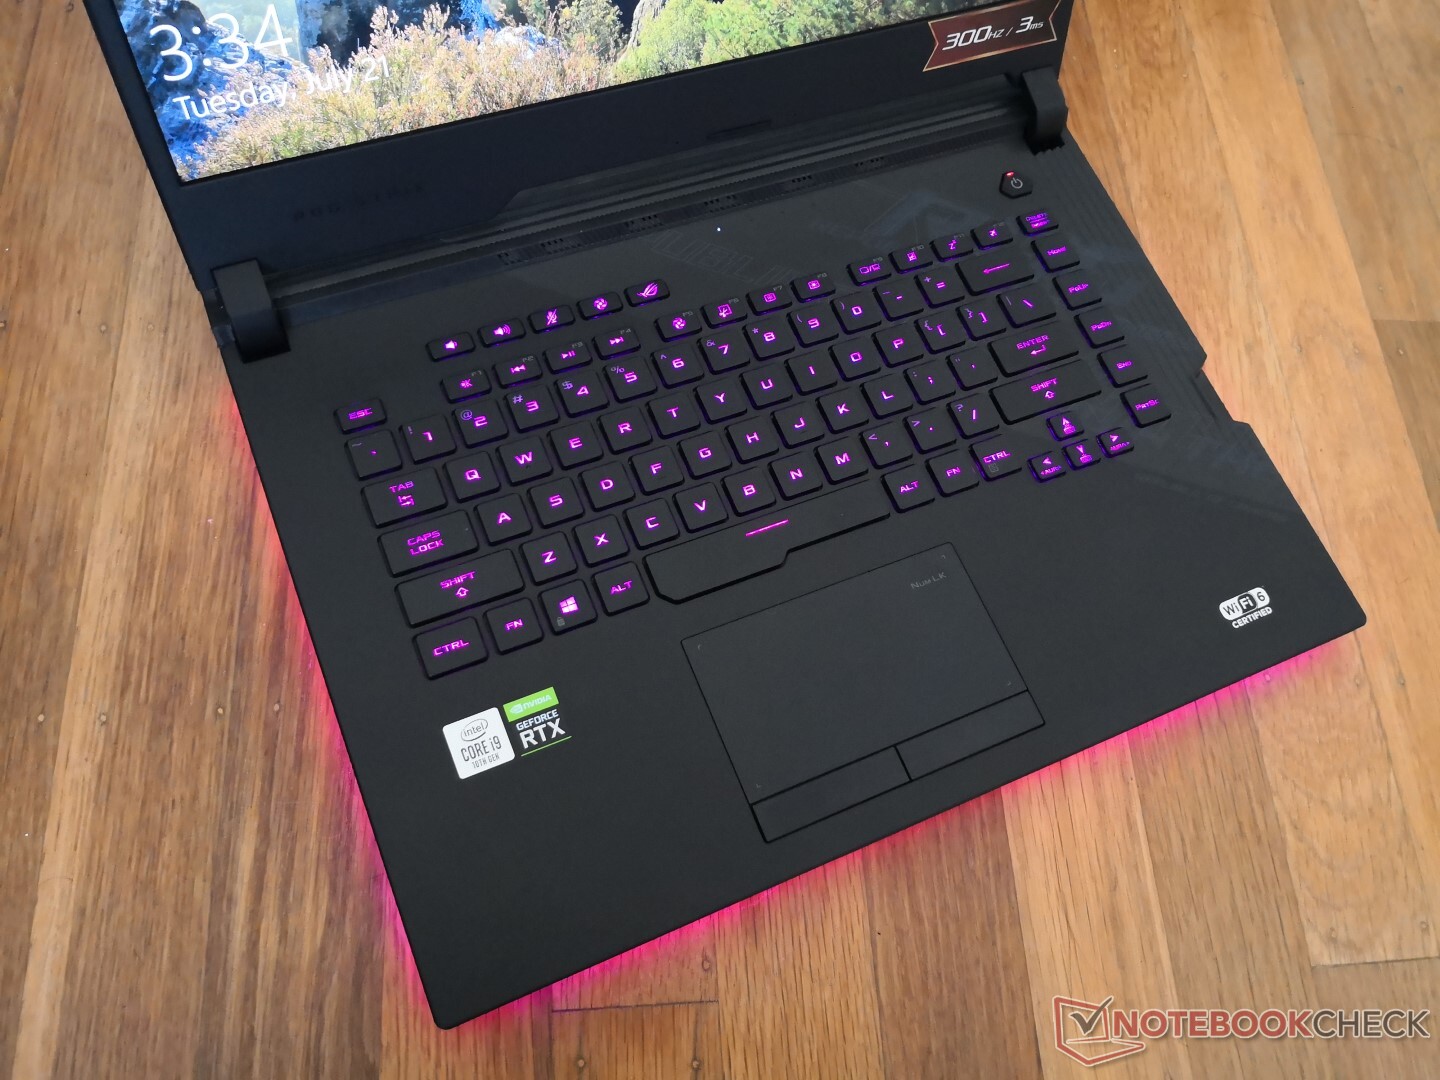
A l'intérieur, l'Asus ROG Strix Scar 15 G532LWS est équipé des derniers processeur et écran au taux de rafraîchissement impressionnant. Extérieurement cependant, la grosse bordure inférieure et la taille de l'appareil commencent à accuser son âge. Les versions futures devraient se concentrer sur la réduction du bruit en jeu pour sortir du lot, ou sur la taille du châssis pour s'aligner sur la concurrence.
L’intégralité de cette critique est disponible en anglais en suivant ce lien.
Asus ROG Strix Scar 15 G532LWS
- 07/23/2020 v7 (old)
Allen Ngo
Price comparison
