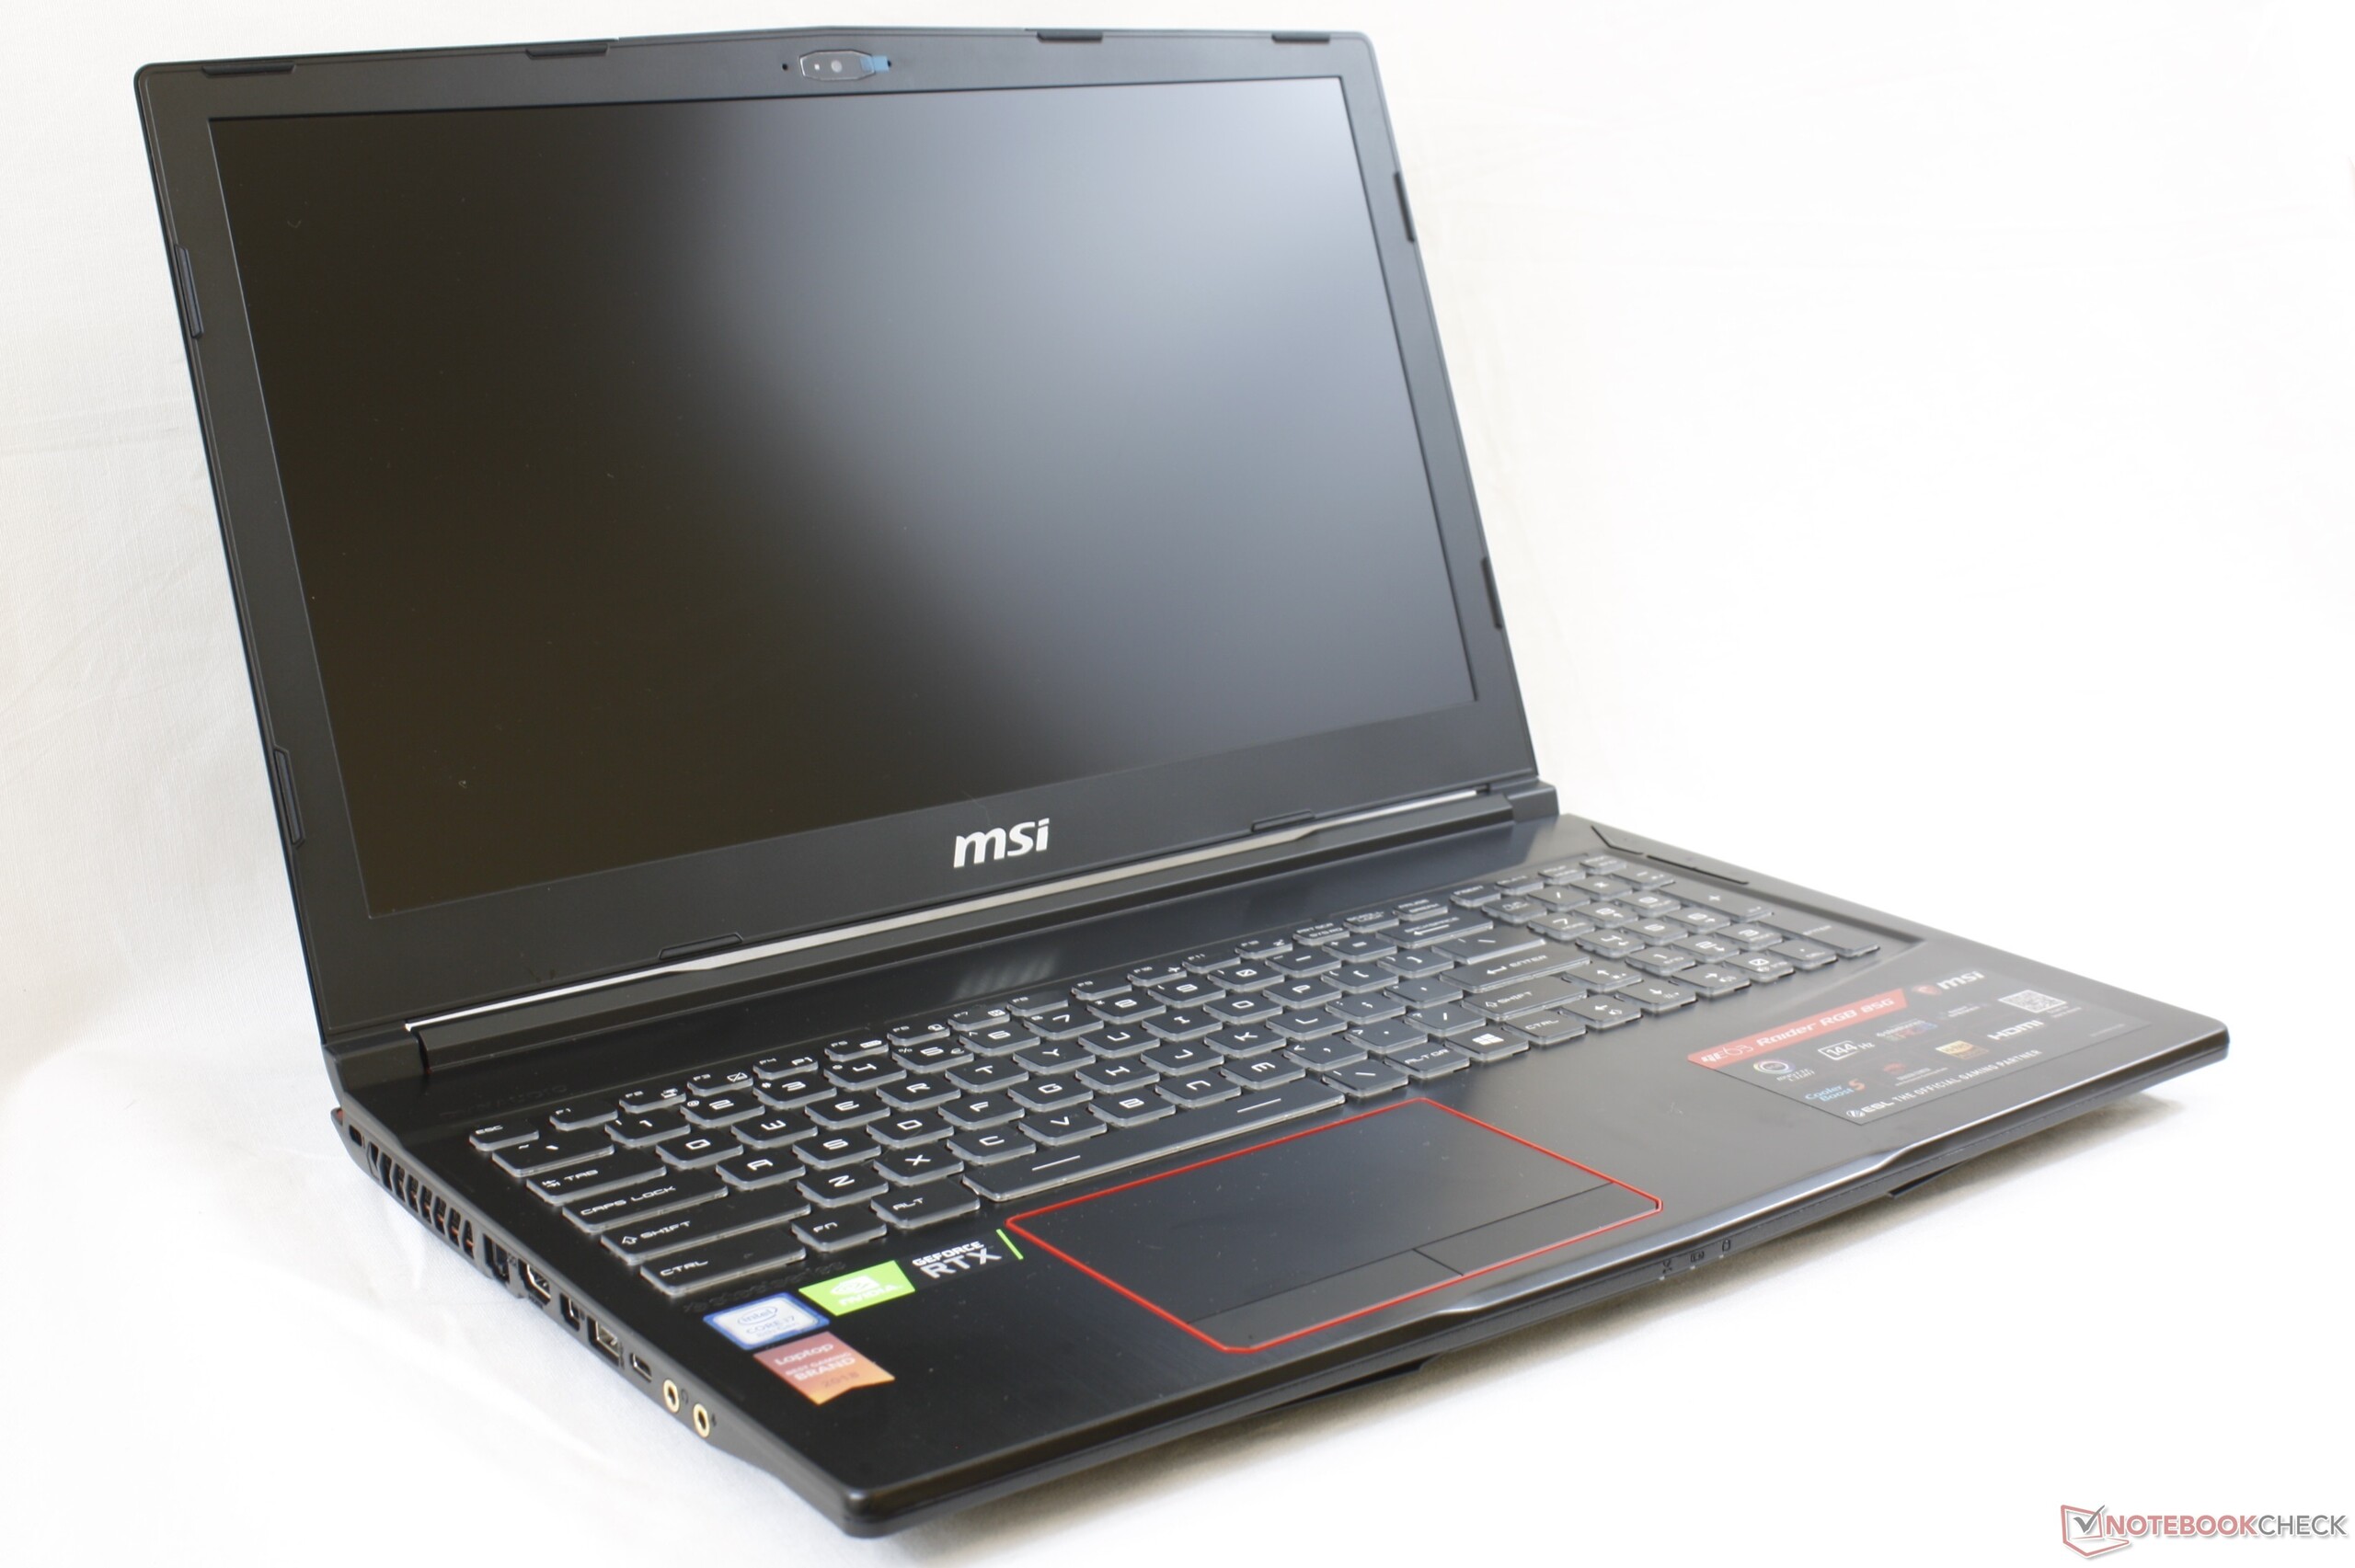
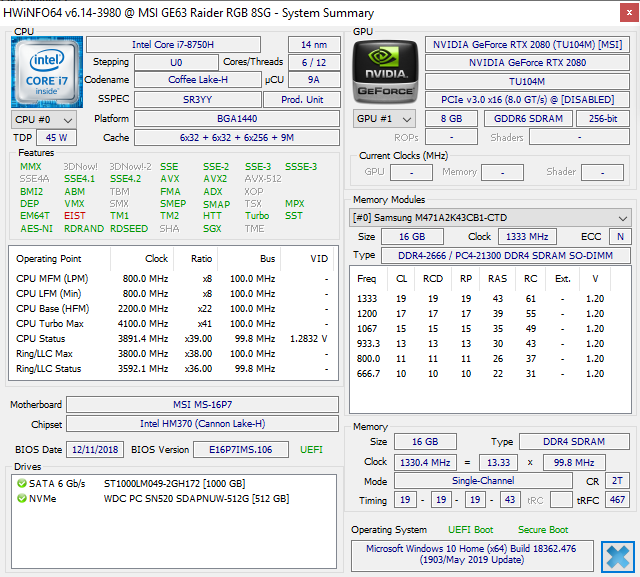
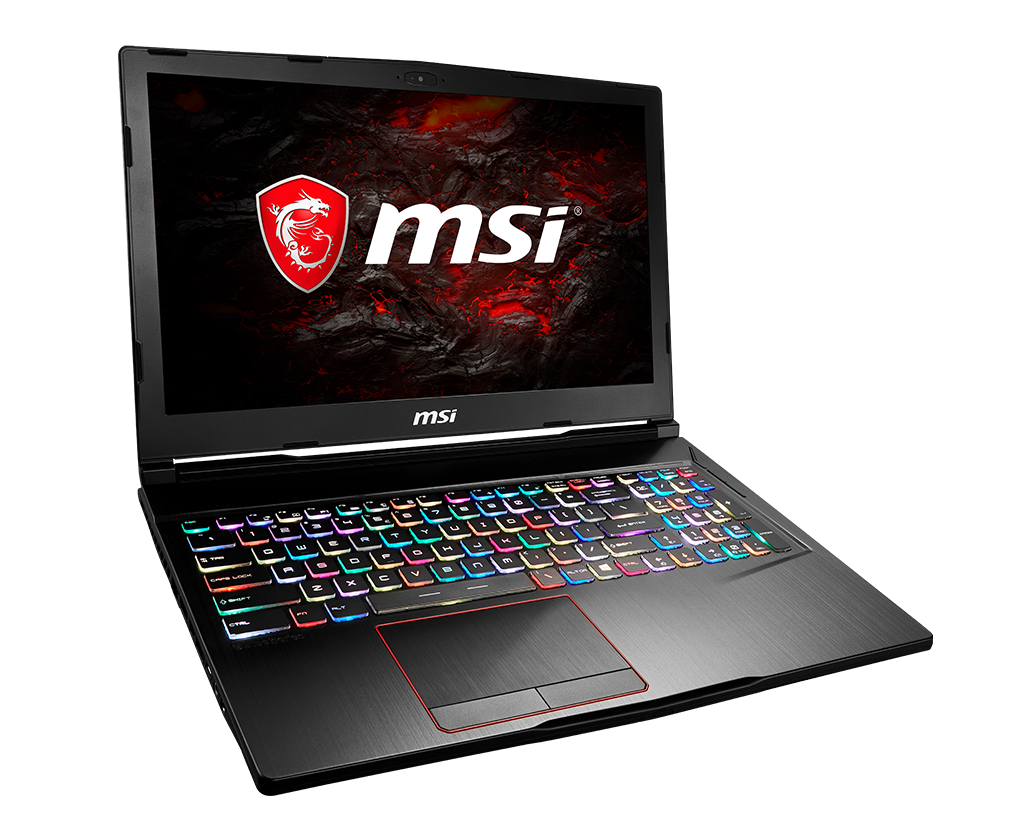
Test du MSI GE63 Raider 8SG (i7-8750H, RTX 2080, FHD) : GeForce RTX 2080 pour pas cher
Note | Date | Modèle | Poids | Épaisseur | Taille | Résolution | Prix |
|---|---|---|---|---|---|---|---|
| 83.4 % v7 (old) | 12/19 | MSI GE63 Raider 8SG i7-8750H, GeForce RTX 2080 Mobile | 2.6 kg | 29.5 mm | 15.60" | 1920x1080 | |
| 84.8 % v7 (old) | 10/19 | Lenovo Legion Y740-15ICHg i7-9750H, GeForce RTX 2070 Max-Q | 2.3 kg | 25 mm | 15.60" | 1920x1080 | |
| 82.3 % v7 (old) | 10/19 | Dell G7 7590 i7-9750H, GeForce RTX 2060 Mobile | 2.5 kg | 19.9 mm | 15.60" | 1920x1080 | |
| 82.1 % v7 (old) | 10/19 | Asus Strix Scar III G531GW-AZ062T i7-9750H, GeForce RTX 2070 Mobile | 2.4 kg | 25 mm | 15.60" | 1920x1080 | |
| 84.7 % v7 (old) | 03/19 | Razer Blade 15 RTX 2070 Max-Q i7-8750H, GeForce RTX 2070 Max-Q | 2.1 kg | 17.8 mm | 15.60" | 1920x1080 |
| SD Card Reader | |
| average JPG Copy Test (av. of 3 runs) | |
| MSI GT75 8RG-090 Titan (Toshiba Exceria Pro SDXC 64 GB UHS-II) | |
| MSI GE63 Raider 8SG (Toshiba Exceria Pro SDXC 64 GB UHS-II) | |
| MSI GL65 9SEK (Toshiba Exceria Pro SDXC 64 GB UHS-II) | |
| MSI GT63 Titan 8RG-046 (Toshiba Exceria Pro SDXC 64 GB UHS-II) | |
| maximum AS SSD Seq Read Test (1GB) | |
| MSI GT75 8RG-090 Titan (Toshiba Exceria Pro SDXC 64 GB UHS-II) | |
| MSI GE63 Raider 8SG (Toshiba Exceria Pro SDXC 64 GB UHS-II) | |
| MSI GL65 9SEK (Toshiba Exceria Pro SDXC 64 GB UHS-II) | |
| MSI GT63 Titan 8RG-046 (Toshiba Exceria Pro SDXC 64 GB UHS-II) | |
| Networking | |
| iperf3 transmit AX12 | |
| MSI Prestige 15 A10SC | |
| Lenovo Legion Y740-15ICHg | |
| MSI GT63 Titan 8RG-046 | |
| MSI GL65 9SEK | |
| iperf3 receive AX12 | |
| MSI Prestige 15 A10SC | |
| MSI GL65 9SEK | |
| MSI GT63 Titan 8RG-046 | |
| Lenovo Legion Y740-15ICHg | |
| |||||||||||||||||||||||||
Homogénéité de la luminosité: 84 %
Valeur mesurée au centre, sur batterie: 268.3 cd/m²
Contraste: 1342:1 (Valeurs des noirs: 0.2 cd/m²)
ΔE ColorChecker Calman: 2.65 | ∀{0.5-29.43 Ø4.71}
calibrated: 2.76
ΔE Greyscale Calman: 2.2 | ∀{0.09-98 Ø4.96}
93.3% sRGB (Argyll 1.6.3 3D)
59.3% AdobeRGB 1998 (Argyll 1.6.3 3D)
65.9% AdobeRGB 1998 (Argyll 3D)
91.7% sRGB (Argyll 3D)
65.1% Display P3 (Argyll 3D)
Gamma: 2.33
CCT: 6862 K
| MSI GE63 Raider 8SG AU Optronics B156HAN07.1, IPS, 15.6", 1920x1080 | MSI GL65 9SEK AU Optronics B156HAN13.0, IPS, 15.6", 1920x1080 | Lenovo Legion Y740-15ICHg BOE NV156FHM-N4J, IPS, 15.6", 1920x1080 | MSI GT63 Titan 8RG-046 N156HHE-GA1, TN, 15.6", 1920x1080 | Asus Strix Scar III G531GW-AZ062T Sharp LQ156M1JW09 (SHP14D3), IPS, 15.6", 1920x1080 | MSI GE63 Raider RGB 8RF-008 CMN N156HHE-GA1 (CMN15F4), TN, 15.6", 1920x1080 | |
|---|---|---|---|---|---|---|
| Display | -42% | 2% | 26% | 4% | 26% | |
| Display P3 Coverage (%) | 65.1 | 36.63 -44% | 67.7 4% | 91.3 40% | 66.2 2% | 90 38% |
| sRGB Coverage (%) | 91.7 | 55 -40% | 91.6 0% | 99.9 9% | 97.1 6% | 100 9% |
| AdobeRGB 1998 Coverage (%) | 65.9 | 37.85 -43% | 67.1 2% | 85.7 30% | 67.6 3% | 86 31% |
| Response Times | -184% | -53% | 27% | -25% | -109% | |
| Response Time Grey 50% / Grey 80% * (ms) | 8.8 ? | 26.4 ? -200% | 19 ? -116% | 8.4 ? 5% | 15 ? -70% | 24.4 ? -177% |
| Response Time Black / White * (ms) | 11.2 ? | 30 ? -168% | 10 ? 11% | 5.8 ? 48% | 9 ? 20% | 15.8 ? -41% |
| PWM Frequency (Hz) | 25510 ? | 250 ? | 25510 ? | |||
| Screen | -55% | 9% | -4% | -30% | -28% | |
| Brightness middle (cd/m²) | 268.3 | 277.3 3% | 477 78% | 307.1 14% | 309 15% | 292 9% |
| Brightness (cd/m²) | 261 | 256 -2% | 431 65% | 276 6% | 284 9% | 258 -1% |
| Brightness Distribution (%) | 84 | 86 2% | 84 0% | 80 -5% | 88 5% | 81 -4% |
| Black Level * (cd/m²) | 0.2 | 0.2 -0% | 0.175 13% | 0.37 -85% | 0.42 -110% | 0.23 -15% |
| Contrast (:1) | 1342 | 1387 3% | 2726 103% | 830 -38% | 736 -45% | 1270 -5% |
| Colorchecker dE 2000 * | 2.65 | 5.25 -98% | 4.17 -57% | 2.53 5% | 3.99 -51% | 5.82 -120% |
| Colorchecker dE 2000 max. * | 4.67 | 19.43 -316% | 6.97 -49% | 4.66 -0% | 8.3 -78% | 9.05 -94% |
| Colorchecker dE 2000 calibrated * | 2.76 | 4.39 -59% | 2.51 9% | 2.82 -2% | 1.12 59% | 2.82 -2% |
| Greyscale dE 2000 * | 2.2 | 3.5 -59% | 3.49 -59% | 1.7 23% | 5.43 -147% | 4.61 -110% |
| Gamma | 2.33 94% | 2.1 105% | 2.5 88% | 2.194 100% | 2.57 86% | 2.65 83% |
| CCT | 6862 95% | 6895 94% | 7076 92% | 6893 94% | 7767 84% | 6950 94% |
| Color Space (Percent of AdobeRGB 1998) (%) | 59.3 | 35 -41% | 60 1% | 76 28% | 63 6% | 76 28% |
| Color Space (Percent of sRGB) (%) | 93.3 | 55 -41% | 91 -2% | 100 7% | 97 4% | 100 7% |
| Moyenne finale (programmes/paramètres) | -94% /
-69% | -14% /
0% | 16% /
5% | -17% /
-23% | -37% /
-28% |
* ... Moindre est la valeur, meilleures sont les performances
Temps de réponse de l'écran
| ↔ Temps de réponse noir à blanc | ||
|---|---|---|
| 11.2 ms ... hausse ↗ et chute ↘ combinées | ↗ 5.2 ms hausse | 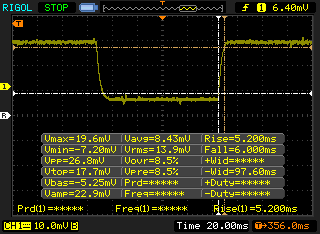 |
| ↘ 6 ms chute | ||
| L'écran montre de bons temps de réponse, mais insuffisant pour du jeu compétitif. En comparaison, tous les appareils testés affichent entre 0.1 (minimum) et 240 (maximum) ms. » 30 % des appareils testés affichent de meilleures performances. Cela signifie que les latences relevées sont meilleures que la moyenne (19.8 ms) de tous les appareils testés. | ||
| ↔ Temps de réponse gris 50% à gris 80% | ||
| 8.8 ms ... hausse ↗ et chute ↘ combinées | ↗ 4.4 ms hausse | 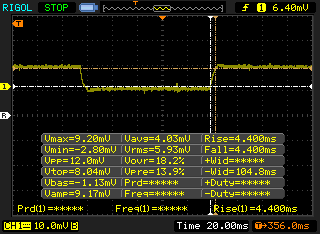 |
| ↘ 4.4 ms chute | ||
| L'écran montre de faibles temps de réponse, un bon écran pour jouer. En comparaison, tous les appareils testés affichent entre 0.165 (minimum) et 636 (maximum) ms. » 22 % des appareils testés affichent de meilleures performances. Cela signifie que les latences relevées sont meilleures que la moyenne (30.9 ms) de tous les appareils testés. | ||
Scintillement / MLI (Modulation de largeur d'impulsion)
| Scintillement / MLI (Modulation de largeur d'impulsion) non décelé |  | ||
En comparaison, 52 % des appareils testés n'emploient pas MDI pour assombrir leur écran. Nous avons relevé une moyenne à 7748 (minimum : 5 - maximum : 343500) Hz dans le cas où une MDI était active. | |||
| PCMark 8 Home Score Accelerated v2 | 4124 points | |
| PCMark 8 Work Score Accelerated v2 | 5577 points | |
| PCMark 10 Score | 5316 points | |
Aide | ||
| MSI GE63 Raider 8SG WDC PC SN520 SDAPNUW-512G | MSI GL65 9SEK WDC PC SN520 SDAPNUW-512G | Lenovo Legion Y740-15ICHg WDC PC SN520 SDAPMUW-128G | MSI GT63 Titan 8RG-046 CUK Cyclone 500GB M.2 NVMe | Asus Strix Scar III G531GW-AZ062T Intel SSD 660p SSDPEKNW512G8 | MSI GE63 Raider RGB 8RF-008 Samsung SSD PM871a MZNLN256HMHQ | |
|---|---|---|---|---|---|---|
| AS SSD | 14% | -19% | 53% | -16% | -27% | |
| Seq Read (MB/s) | 904 | 1315 45% | 1372 52% | 2399 165% | 1163 29% | 512 -43% |
| Seq Write (MB/s) | 1344 | 1378 3% | 746 -44% | 1665 24% | 919 -32% | 462.8 -66% |
| 4K Read (MB/s) | 24.99 | 25.31 1% | 35.42 42% | 49.17 97% | 48.88 96% | 32.36 29% |
| 4K Write (MB/s) | 107.4 | 118.2 10% | 99.9 -7% | 87.7 -18% | 90.1 -16% | 68.6 -36% |
| 4K-64 Read (MB/s) | 631 | 839 33% | 302.1 -52% | 1144 81% | 323.8 -49% | 348.6 -45% |
| 4K-64 Write (MB/s) | 731 | 720 -2% | 191.4 -74% | 648 -11% | 403.8 -45% | 294.3 -60% |
| Access Time Read * (ms) | 0.131 | 0.116 11% | 0.132 -1% | 0.05 62% | 0.24 -83% | 0.101 23% |
| Access Time Write * (ms) | 0.099 | 0.091 8% | 0.037 63% | 0.042 58% | 0.046 54% | 0.051 48% |
| Score Read (Points) | 746 | 996 34% | 475 -36% | 1433 92% | 489 -34% | 432 -42% |
| Score Write (Points) | 973 | 976 0% | 366 -62% | 902 -7% | 586 -40% | 409 -58% |
| Score Total (Points) | 2126 | 2485 17% | 1065 -50% | 3040 43% | 1332 -37% | 1071 -50% |
| Copy ISO MB/s (MB/s) | 1187 | 1279 8% | 1062 -11% | 1269 7% | ||
| Copy Program MB/s (MB/s) | 673 | 889 32% | 426 -37% | 452.8 -33% | ||
| Copy Game MB/s (MB/s) | 1295 | 1218 -6% | 650 -50% | 755 -42% |
* ... Moindre est la valeur, meilleures sont les performances

| 3DMark 11 Performance | 20224 points | |
| 3DMark Cloud Gate Standard Score | 27465 points | |
| 3DMark Fire Strike Score | 18985 points | |
| 3DMark Time Spy Score | 8501 points | |
Aide | ||
| Bas | Moyen | Élevé | Ultra | |
|---|---|---|---|---|
| BioShock Infinite (2013) | 240.2 | 208.3 | 202 | 148.6 |
| The Witcher 3 (2015) | 195.8 | 157.5 | 126.1 | 82.2 |
| Shadow of the Tomb Raider (2018) | 85 | 73 | 69 | 69 |
| MSI GE63 Raider 8SG GeForce RTX 2080 Mobile, i7-8750H, WDC PC SN520 SDAPNUW-512G | MSI GL65 9SEK GeForce RTX 2060 Mobile, i7-9750H, WDC PC SN520 SDAPNUW-512G | Lenovo Legion Y740-15ICHg GeForce RTX 2070 Max-Q, i7-9750H, WDC PC SN520 SDAPMUW-128G | Dell G7 7590 GeForce RTX 2060 Mobile, i7-9750H, Toshiba BG3 KBG30ZMS256G | MSI GT63 Titan 8RG-046 GeForce GTX 1080 Mobile, i7-8750H, CUK Cyclone 500GB M.2 NVMe | MSI GE63 Raider RGB 8RF-008 GeForce GTX 1070 Mobile, i7-8750H, Samsung SSD PM871a MZNLN256HMHQ | |
|---|---|---|---|---|---|---|
| Noise | 0% | 8% | 6% | 8% | -0% | |
| arrêt / environnement * (dB) | 28.5 | 28.1 1% | 30 -5% | 28.4 -0% | 28 2% | 30 -5% |
| Idle Minimum * (dB) | 33.9 | 31.4 7% | 31.3 8% | 29.5 13% | 31.4 7% | 30 12% |
| Idle Average * (dB) | 33.9 | 31.5 7% | 31.3 8% | 29.6 13% | 31.4 7% | 35 -3% |
| Idle Maximum * (dB) | 34.3 | 33.5 2% | 31.3 9% | 29.6 14% | 32.2 6% | 36 -5% |
| Load Average * (dB) | 39.5 | 49.3 -25% | 42 -6% | 45 -14% | 35.5 10% | 42 -6% |
| Witcher 3 ultra * (dB) | 56.2 | 51.3 9% | 42.1 25% | 51.5 8% | 47.6 15% | 54 4% |
| Load Maximum * (dB) | 57.2 | 58 -1% | 46.5 19% | 53 7% | 50.8 11% | 56 2% |
* ... Moindre est la valeur, meilleures sont les performances
Degré de la nuisance sonore
| Au repos |
| 33.9 / 33.9 / 34.3 dB(A) |
| Fortement sollicité |
| 39.5 / 57.2 dB(A) |
 | ||
30 dB silencieux 40 dB(A) audible 50 dB(A) bruyant |
||
min: | ||
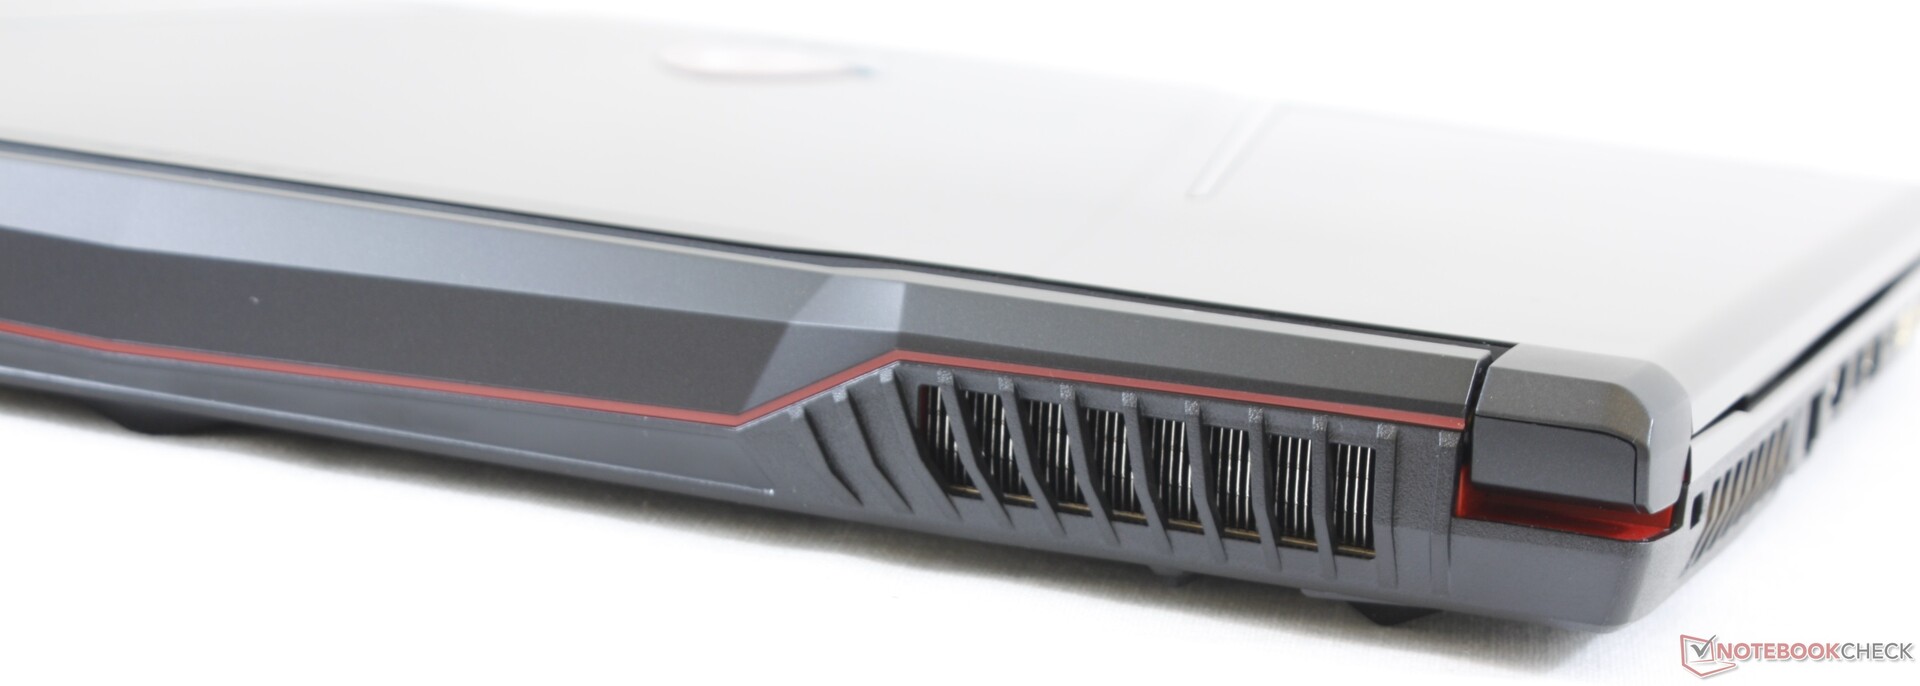
(+) La température maximale du côté supérieur est de 39.8 °C / 104 F, par rapport à la moyenne de 40.4 °C / 105 F, allant de 21.2 à 68.8 °C pour la classe Gaming.
(±) Le fond chauffe jusqu'à un maximum de 42.6 °C / 109 F, contre une moyenne de 43.2 °C / 110 F
(+) En utilisation inactive, la température moyenne du côté supérieur est de 20.5 °C / 69 F, par rapport à la moyenne du dispositif de 33.9 °C / 93 F.
(+) En jouant à The Witcher 3, la température moyenne du côté supérieur est de 30.2 °C / 86 F, alors que la moyenne de l'appareil est de 33.9 °C / 93 F.
(+) Les repose-poignets et le pavé tactile sont plus froids que la température de la peau avec un maximum de 27.4 °C / 81.3 F et sont donc froids au toucher.
(±) La température moyenne de la zone de l'appui-paume de dispositifs similaires était de 28.8 °C / 83.8 F (+1.4 °C / #2.5 F).
MSI GE63 Raider 8SG analyse audio
(+) | les haut-parleurs peuvent jouer relativement fort (93.1# dB)
Basses 100 - 315 Hz
(±) | basse réduite - en moyenne 8% inférieure à la médiane
(±) | la linéarité des basses est moyenne (7.4% delta à la fréquence précédente)
Médiums 400 - 2000 Hz
(+) | médiane équilibrée - seulement 2.4% de la médiane
(+) | les médiums sont linéaires (4.7% delta à la fréquence précédente)
Aiguës 2 - 16 kHz
(+) | des sommets équilibrés - à seulement 3.1% de la médiane
(+) | les aigus sont linéaires (5.5% delta à la fréquence précédente)
Globalement 100 - 16 000 Hz
(+) | le son global est linéaire (11.3% différence à la médiane)
Par rapport à la même classe
» 8% de tous les appareils testés de cette catégorie étaient meilleurs, 4% similaires, 88% pires
» Le meilleur avait un delta de 6%, la moyenne était de 18%, le pire était de 132%.
Par rapport à tous les appareils testés
» 7% de tous les appareils testés étaient meilleurs, 2% similaires, 91% pires
» Le meilleur avait un delta de 4%, la moyenne était de 23%, le pire était de 134%.
Apple MacBook 12 (Early 2016) 1.1 GHz analyse audio
(+) | les haut-parleurs peuvent jouer relativement fort (83.6# dB)
Basses 100 - 315 Hz
(±) | basse réduite - en moyenne 11.3% inférieure à la médiane
(±) | la linéarité des basses est moyenne (14.2% delta à la fréquence précédente)
Médiums 400 - 2000 Hz
(+) | médiane équilibrée - seulement 2.4% de la médiane
(+) | les médiums sont linéaires (5.5% delta à la fréquence précédente)
Aiguës 2 - 16 kHz
(+) | des sommets équilibrés - à seulement 2% de la médiane
(+) | les aigus sont linéaires (4.5% delta à la fréquence précédente)
Globalement 100 - 16 000 Hz
(+) | le son global est linéaire (10.2% différence à la médiane)
Par rapport à la même classe
» 7% de tous les appareils testés de cette catégorie étaient meilleurs, 2% similaires, 90% pires
» Le meilleur avait un delta de 5%, la moyenne était de 18%, le pire était de 53%.
Par rapport à tous les appareils testés
» 5% de tous les appareils testés étaient meilleurs, 1% similaires, 94% pires
» Le meilleur avait un delta de 4%, la moyenne était de 23%, le pire était de 134%.
| Éteint/en veille | |
| Au repos | |
| Fortement sollicité |
|
Légende:
min: | |
| MSI GE63 Raider 8SG i7-8750H, GeForce RTX 2080 Mobile, WDC PC SN520 SDAPNUW-512G, IPS, 1920x1080, 15.6" | MSI GL65 9SEK i7-9750H, GeForce RTX 2060 Mobile, WDC PC SN520 SDAPNUW-512G, IPS, 1920x1080, 15.6" | Lenovo Legion Y740-15ICHg i7-9750H, GeForce RTX 2070 Max-Q, WDC PC SN520 SDAPMUW-128G, IPS, 1920x1080, 15.6" | MSI GT63 Titan 8RG-046 i7-8750H, GeForce GTX 1080 Mobile, CUK Cyclone 500GB M.2 NVMe, TN, 1920x1080, 15.6" | Asus Strix Scar III G531GW-AZ062T i7-9750H, GeForce RTX 2070 Mobile, Intel SSD 660p SSDPEKNW512G8, IPS, 1920x1080, 15.6" | MSI GE63 Raider RGB 8RF-008 i7-8750H, GeForce GTX 1070 Mobile, Samsung SSD PM871a MZNLN256HMHQ, TN, 1920x1080, 15.6" | |
|---|---|---|---|---|---|---|
| Power Consumption | -26% | 14% | -3% | 31% | 34% | |
| Idle Minimum * (Watt) | 16 | 41 -156% | 22.2 -39% | 26.4 -65% | 11.4 29% | 9 44% |
| Idle Average * (Watt) | 22.8 | 45.3 -99% | 24.9 -9% | 30 -32% | 13.5 41% | 14 39% |
| Idle Maximum * (Watt) | 69.4 | 47.1 32% | 30.6 56% | 30.6 56% | 21.6 69% | 19 73% |
| Load Average * (Watt) | 107 | 94.9 11% | 101 6% | 90.4 16% | 106 1% | 91 15% |
| Witcher 3 ultra * (Watt) | 243.2 | 149.4 39% | 143 41% | 255.6 -5% | 186 24% | 182 25% |
| Load Maximum * (Watt) | 256.9 | 214.2 17% | 186 28% | 224.4 13% | 196 24% | 238 7% |
* ... Moindre est la valeur, meilleures sont les performances
| MSI GE63 Raider 8SG i7-8750H, GeForce RTX 2080 Mobile, 51 Wh | MSI GL65 9SEK i7-9750H, GeForce RTX 2060 Mobile, 51 Wh | Lenovo Legion Y740-15ICHg i7-9750H, GeForce RTX 2070 Max-Q, 57 Wh | MSI GT63 Titan 8RG-046 i7-8750H, GeForce GTX 1080 Mobile, 75.24 Wh | Asus Strix Scar III G531GW-AZ062T i7-9750H, GeForce RTX 2070 Mobile, 66 Wh | MSI GE63 Raider RGB 8RF-008 i7-8750H, GeForce GTX 1070 Mobile, 51 Wh | |
|---|---|---|---|---|---|---|
| Autonomie de la batterie | -3% | -25% | -20% | 40% | -3% | |
| Reader / Idle (h) | 6.2 | 4.4 -29% | 5.7 -8% | |||
| WiFi v1.3 (h) | 4 | 3.8 -5% | 3 -25% | 3.2 -20% | 5.6 40% | 4 0% |
| Load (h) | 0.8 | 1 25% | 0.8 0% |
Points positifs
Points négatifs

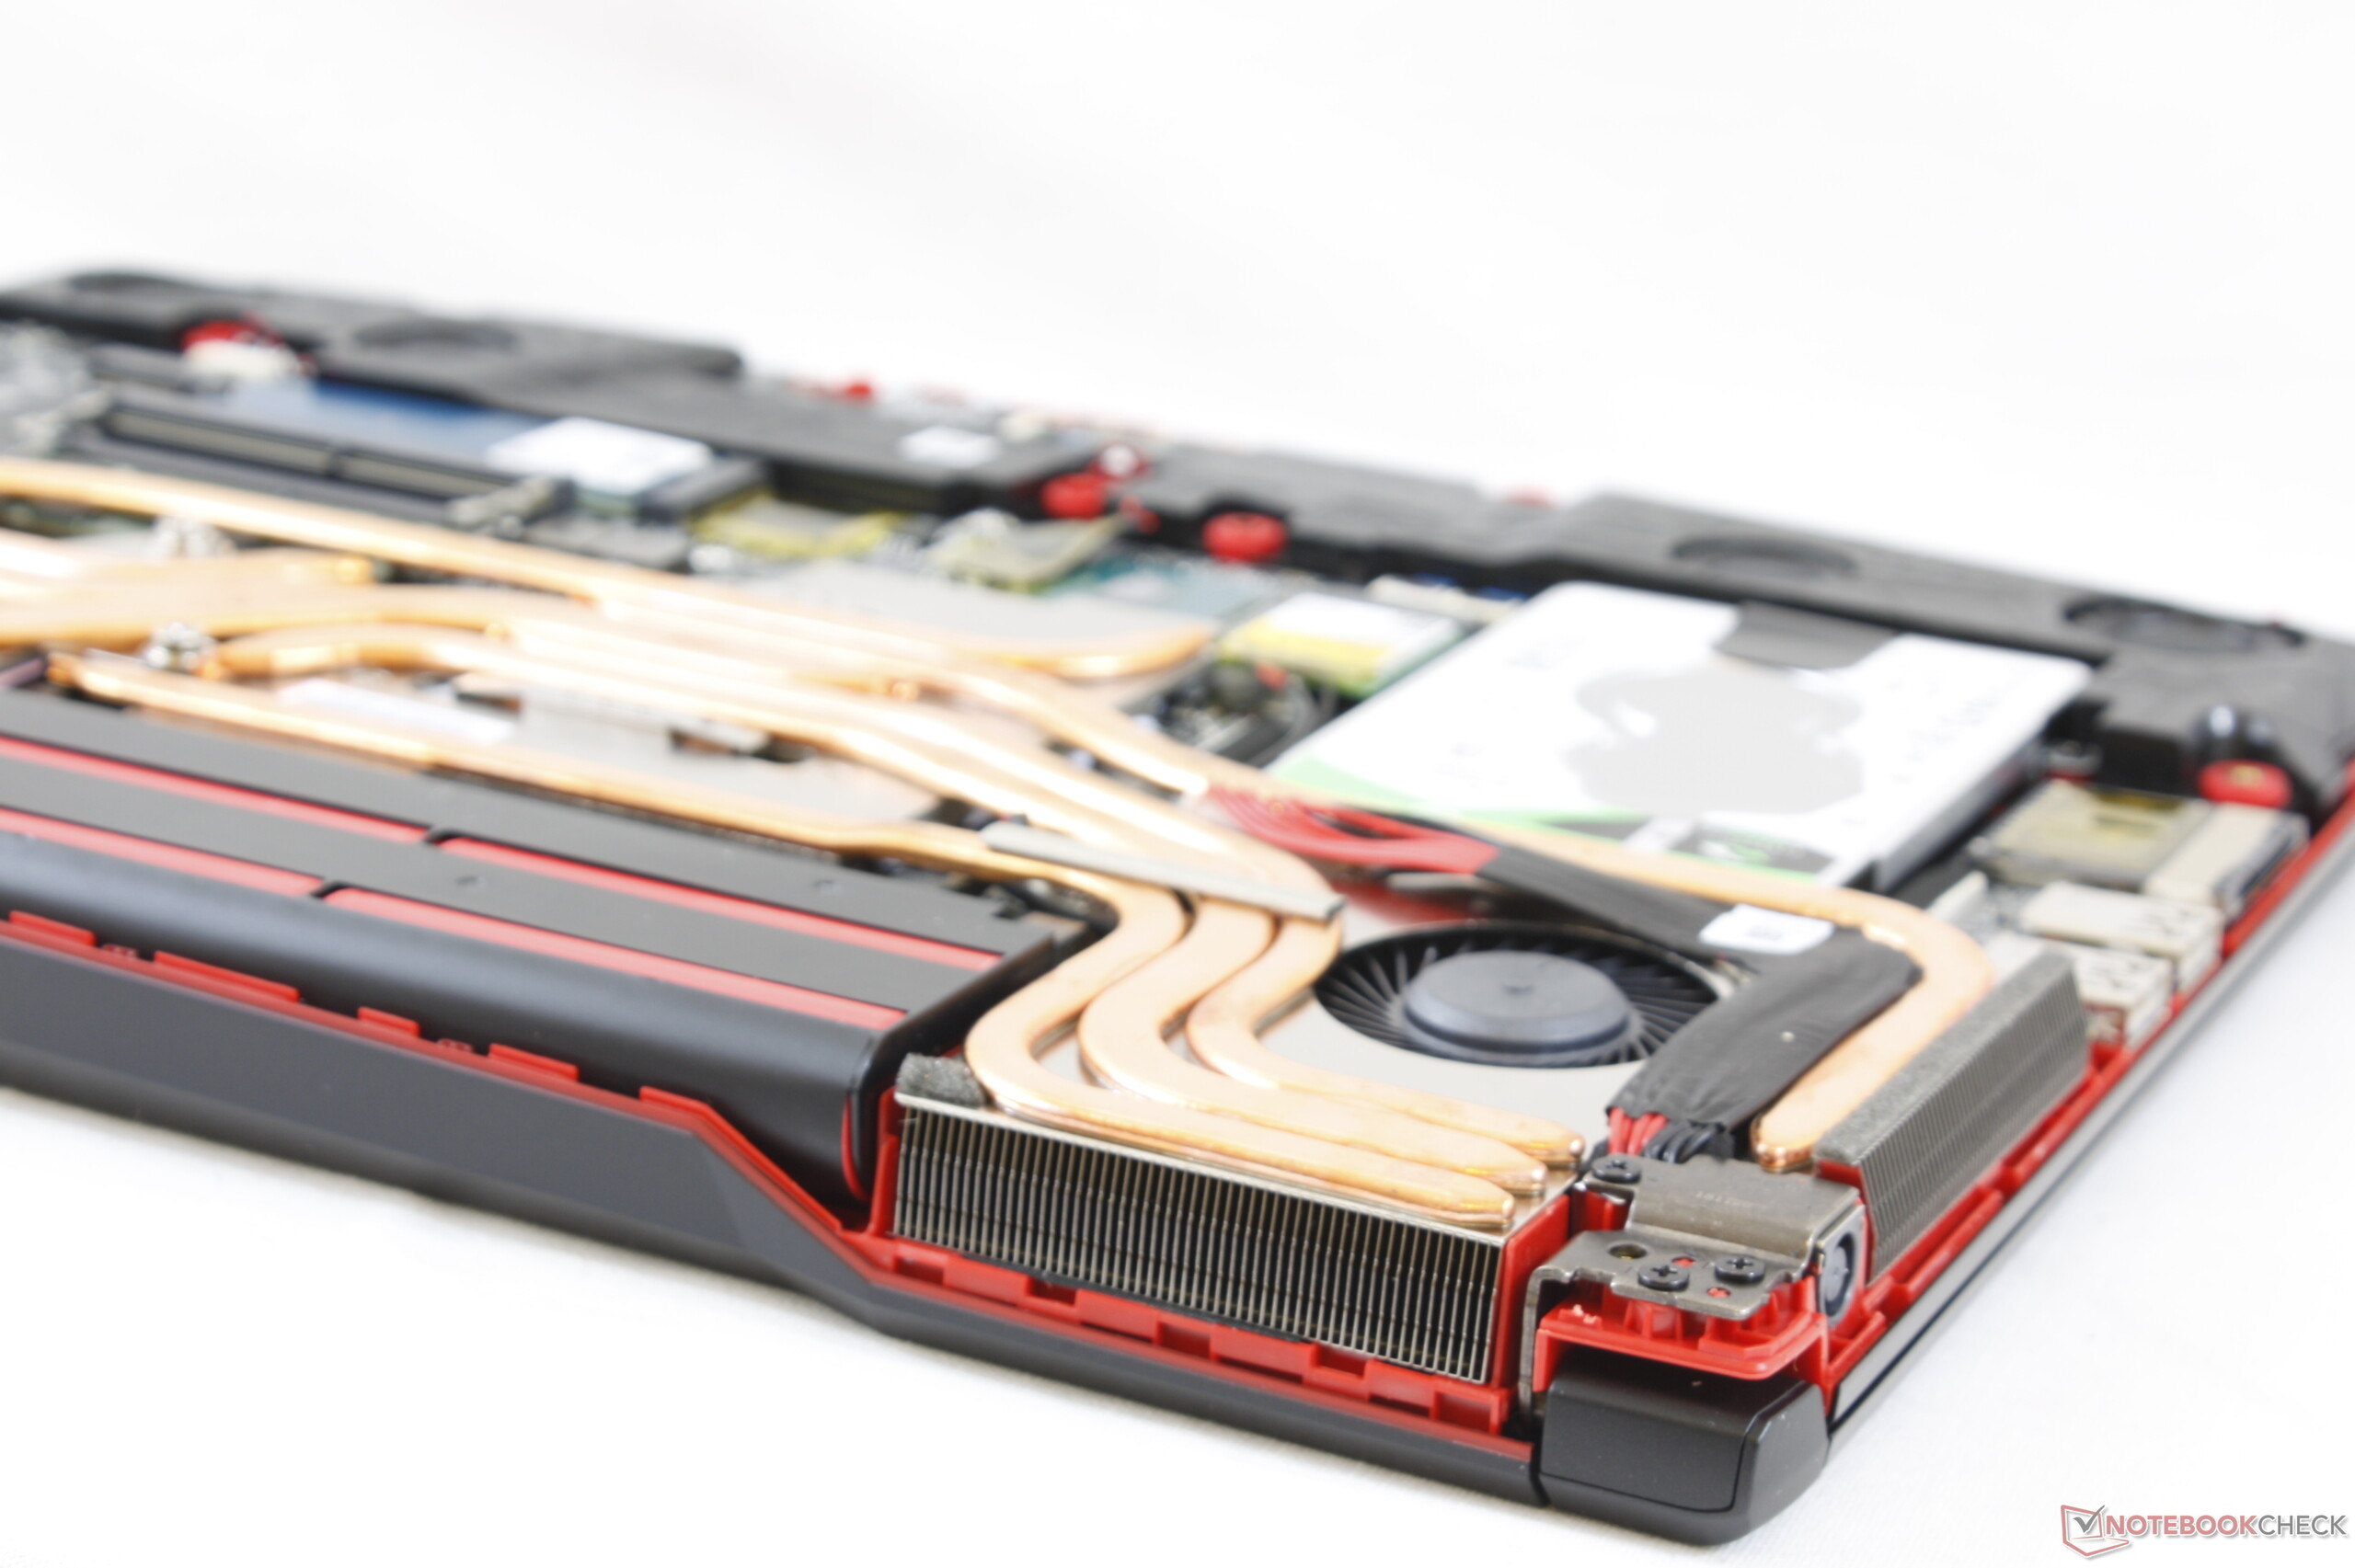
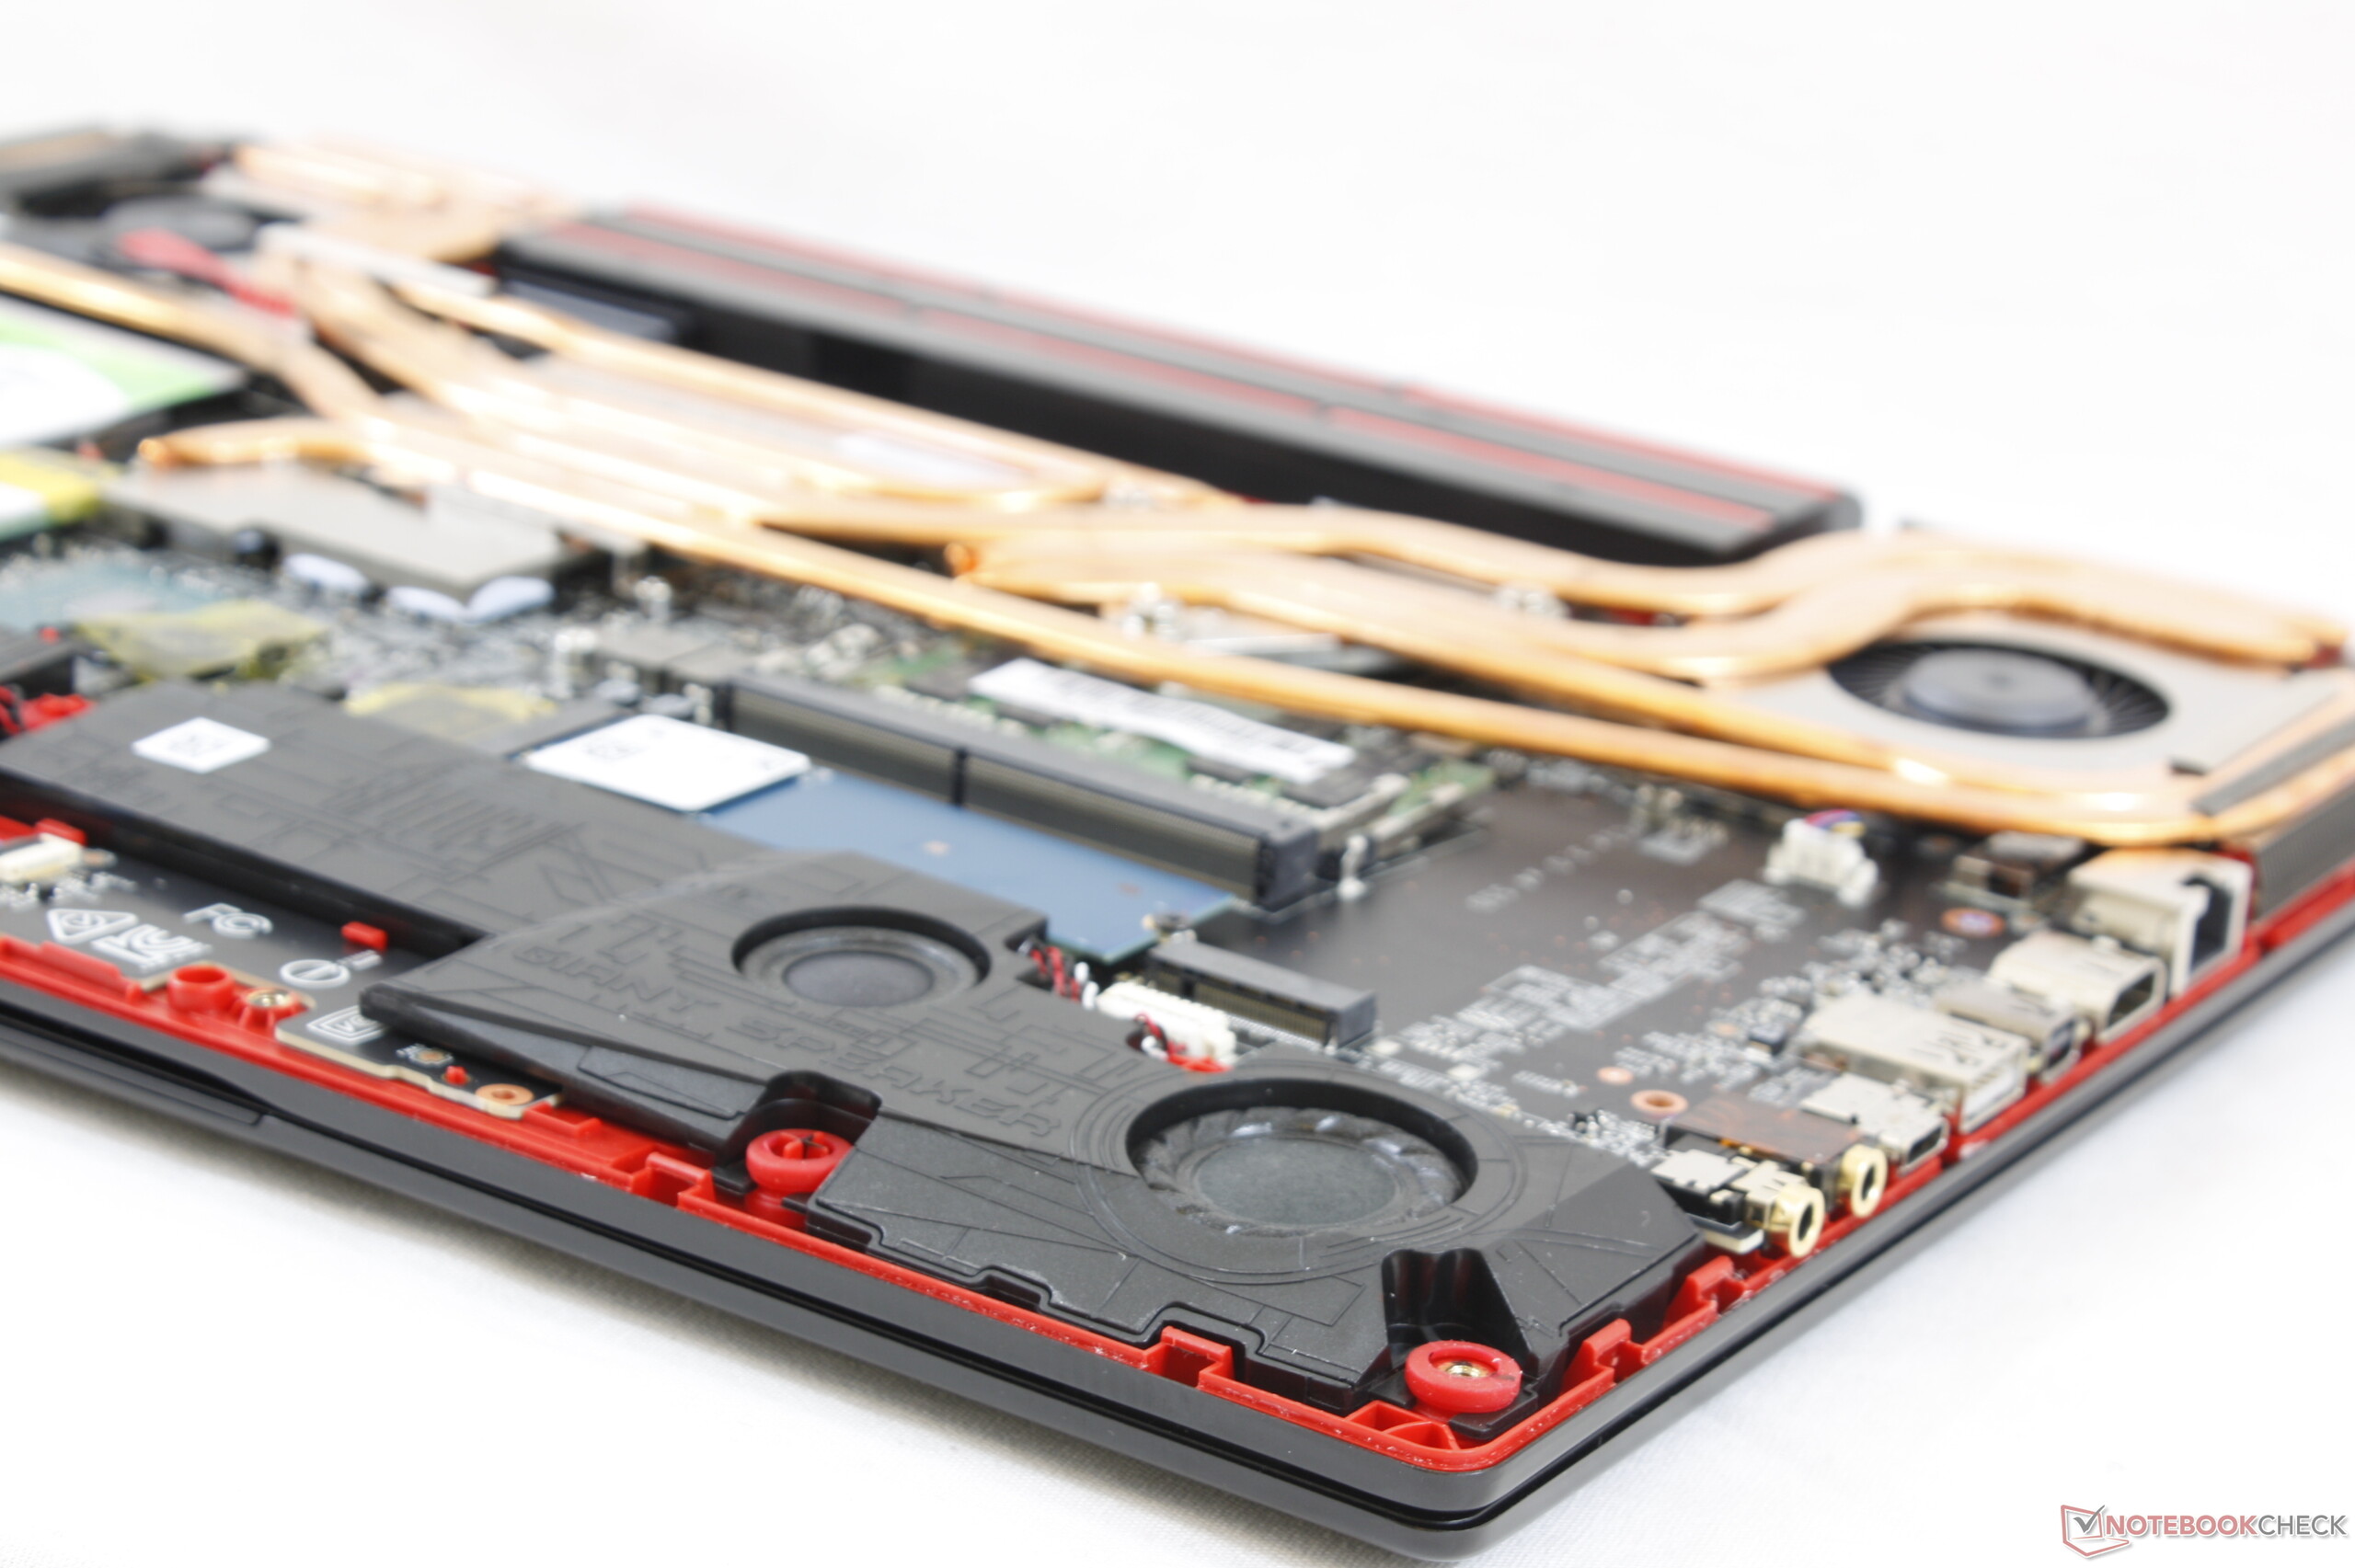
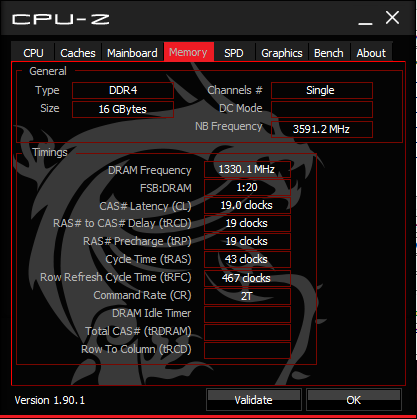
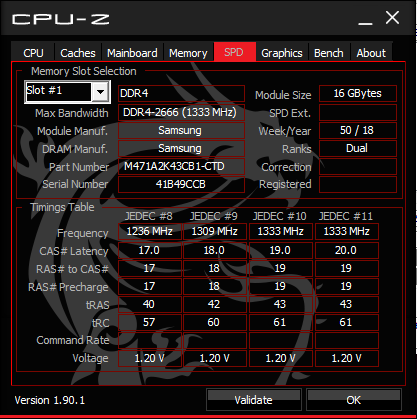
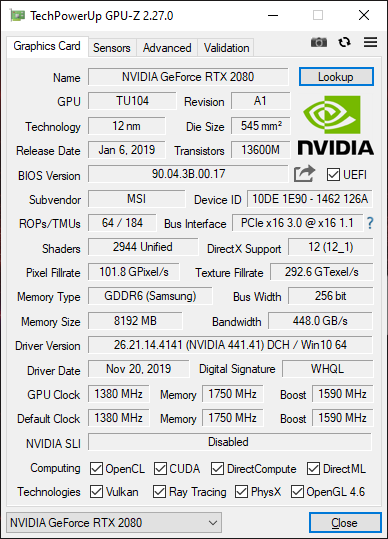
Notre configuration spécifique du GE63 obtient des résultats mitigés. Alors que les performances graphiques dans 3DMark sont excellentes, les performances inférieures à la moyenne du processeur et la RAM monocanale sont des freins à ce qui est par ailleurs un portable de jeu puissant. Les taux d’image en jeu sont inférieurs à ce que nous attendions, si bien que nous conseillons vivement de prendre une version avec RAM double canal. Essayer de mettre à jour la RAM ou le stockage nécessitera de retirer un sceau de garantie.
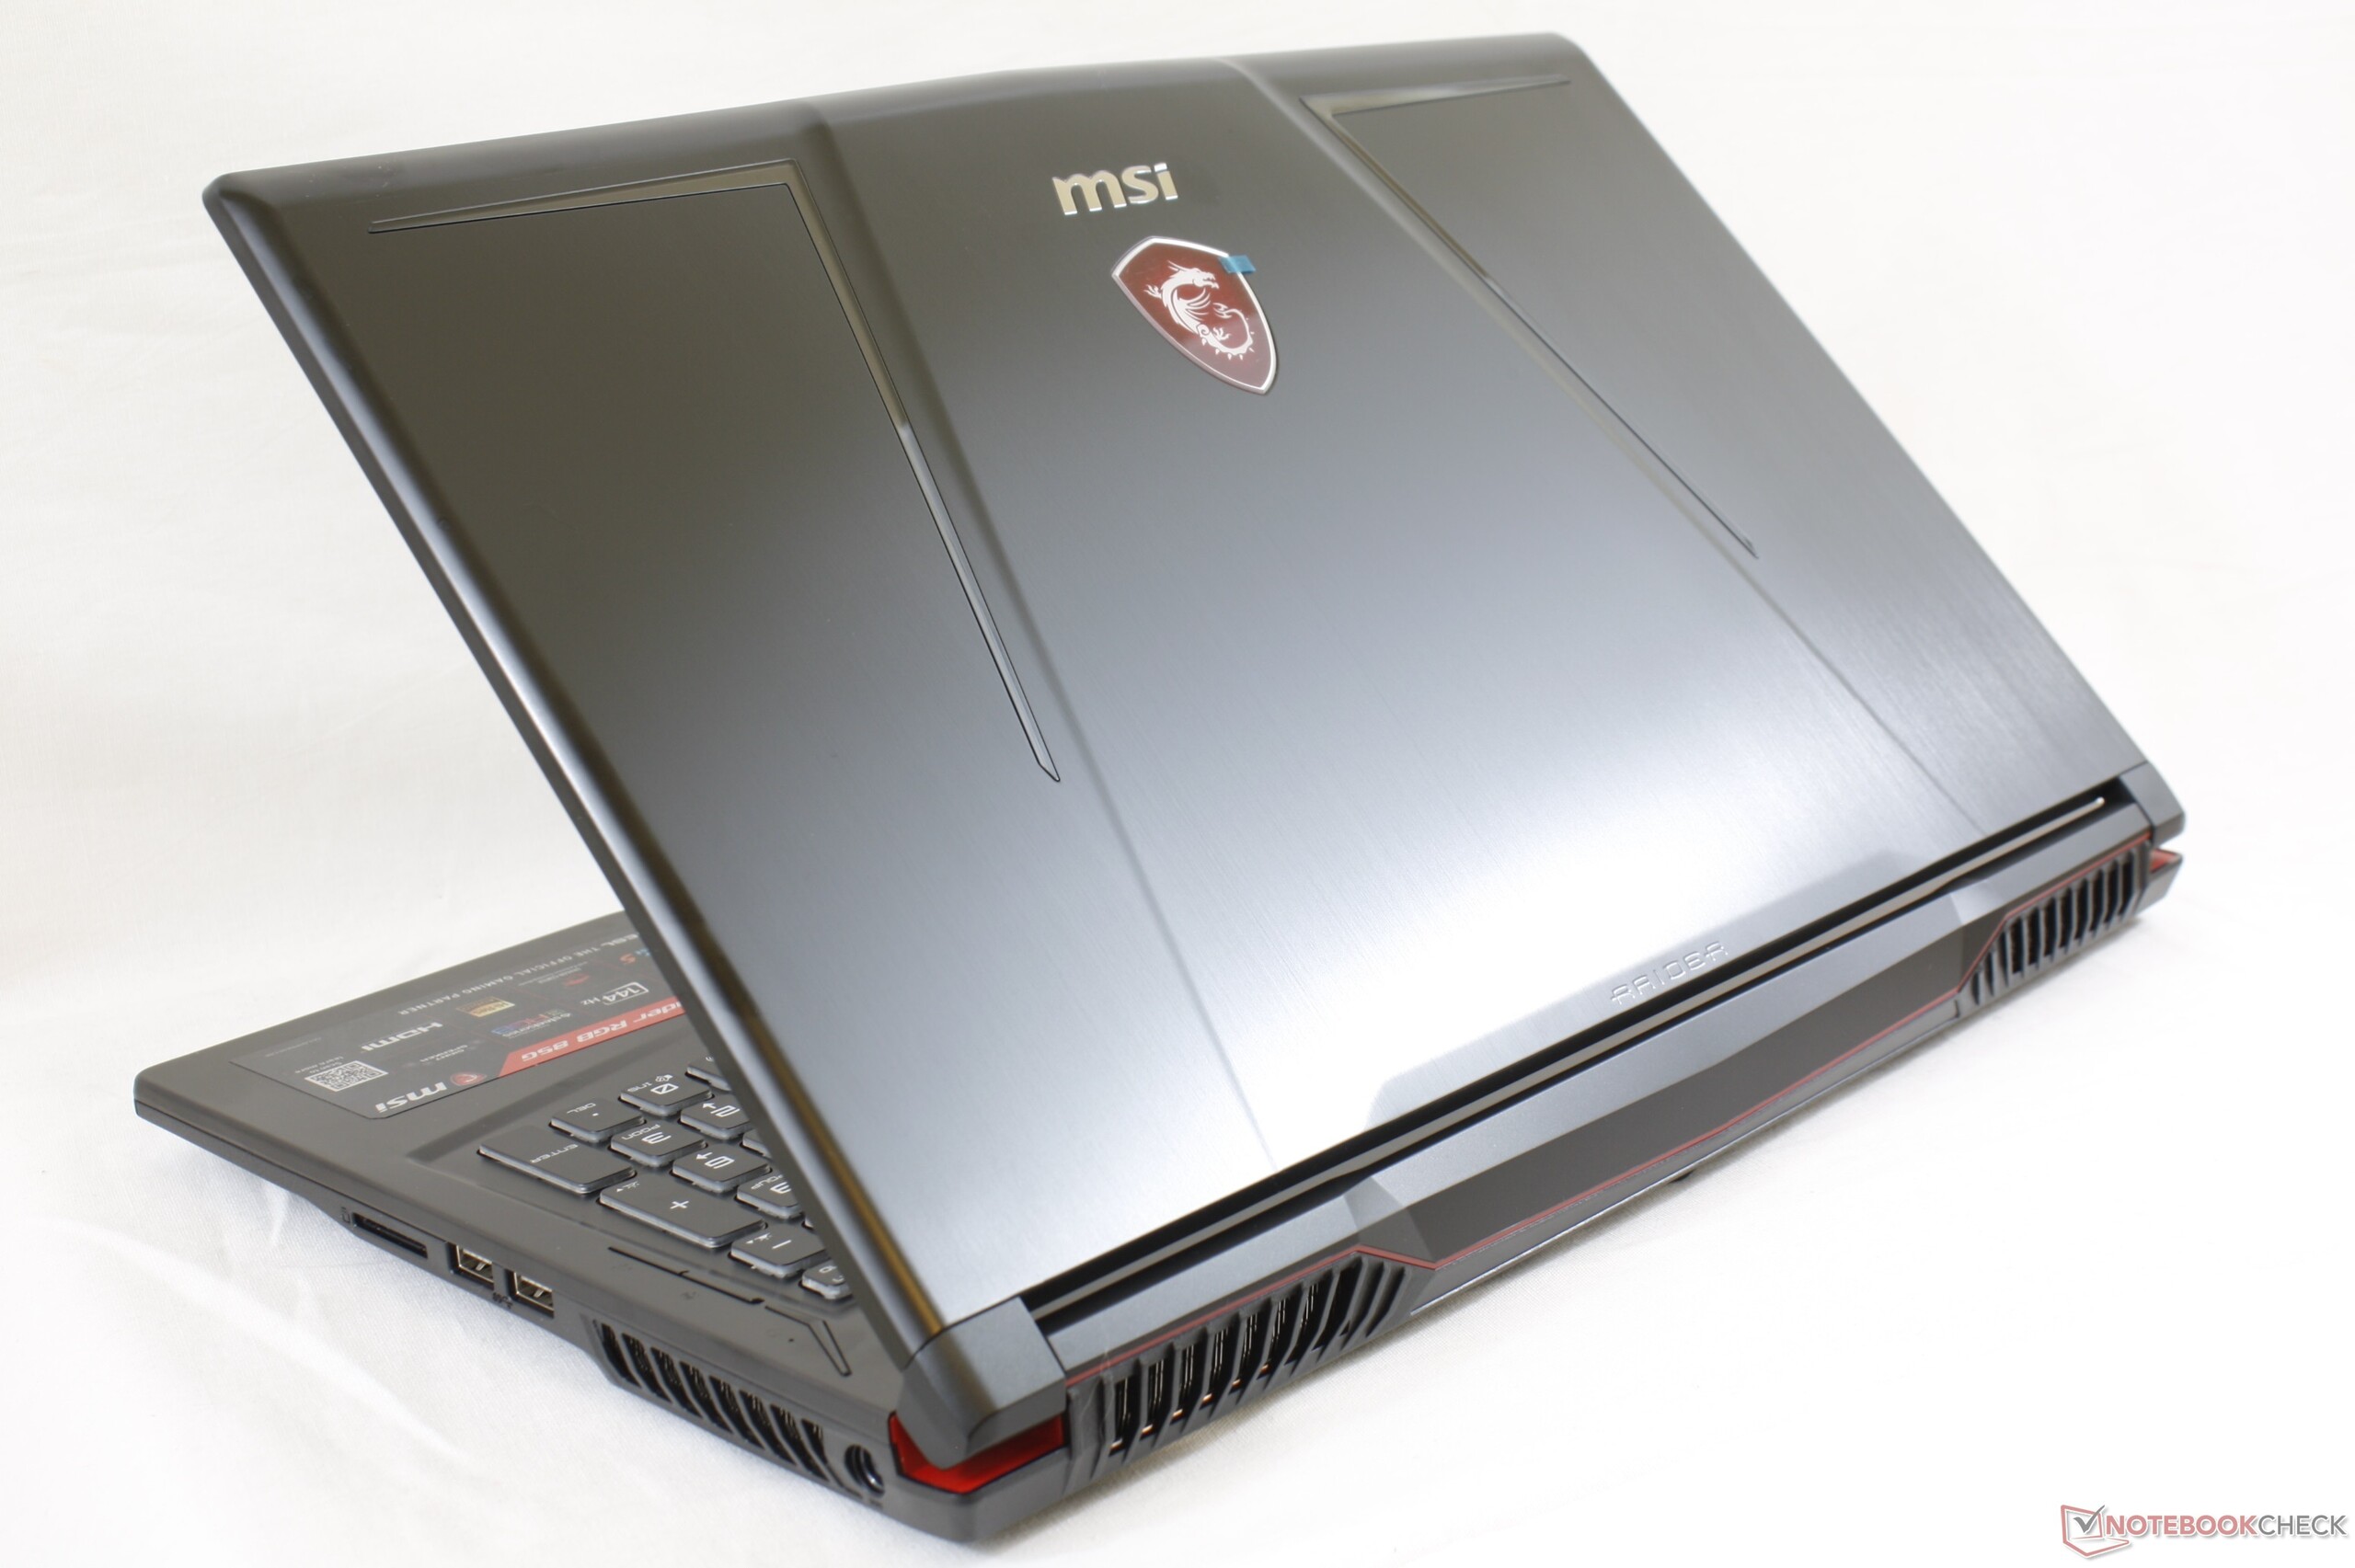
Mis à part les défauts mentionnés précédemment, le GE63 continuera certainement à être l’un des meilleurs portables que l’on pourra trouver avec la RTX 2080 puissante (non Max-Q). Ce châssis en particulier arrive en fin de vie, même si l’écran, le clavier RVB et la carte graphique sont bons voire meilleurs que sur la plupart des portables de jeu les plus récents. C’est également l’un des rares PC portables de jeu de 15,6 pouces, mis à part Clevo, à avoir trois emplacements de stockage interne.
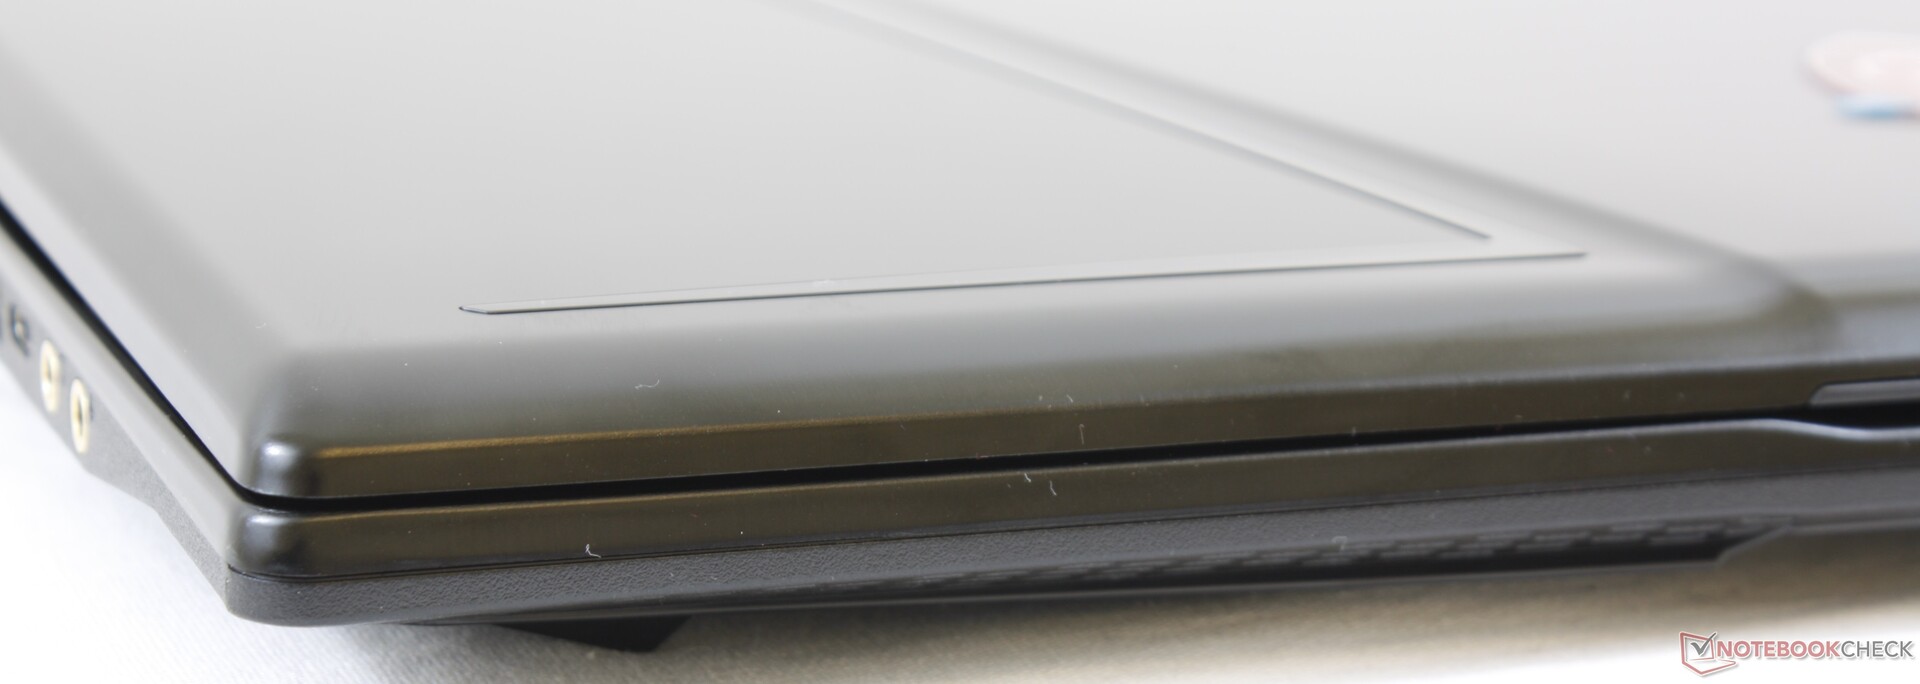
Si vous pouvez configurer l’appareil avec de la RAM double canal et composer avec les ventilateurs bruyants en jeu, alors le MSI GE63 sera un moyen comparativement pas trop coûteux d’avoir une GeForce RTX 2080. Il faudra se passer des bordures d’écran étroites et de la légèreté des derniers portables, mais le GE63 ne paraît à l’inverse jamais fragile à prendre ou à transporter.
L’intégralité de cette critique est disponible en anglais en suivant ce lien.
MSI GE63 Raider 8SG
- 12/03/2019 v7 (old)
Allen Ngo
Price comparison
